Low-luminosity Type II supernovae: spectroscopic and photometric evolution

arX
iv:0
811.
4424
v1 [
astr
o-ph
] 26
Nov
200
8Draft version November 26, 2008Preprint typeset using LATEX style emulateapj v. 10/09/06
SPECTROSCOPY OF HIGH-REDSHIFT SUPERNOVAE FROM THE ESSENCE PROJECT: THE FIRST FOURYEARS
R. J. Foley1,2,3, T. Matheson4, S. Blondin2,5, R. Chornock1, J. M. Silverman1, P. Challis2, A. Clocchiatti6,A. V. Filippenko1, R. P. Kirshner2, B. Leibundgut5, J. Sollerman7,8, J. Spyromilio5, J. L. Tonry9,
T. M. Davis10,7, P. M. Garnavich11, S. W. Jha12,1,13, K. Krisciunas14, W. Li1, G. Pignata15, A. Rest16,17,A. G. Riess18,19, B. P. Schmidt20, R. C. Smith17, C. W. Stubbs2,16, B. E. Tucker20, and W. M. Wood-Vasey2,21
Draft version November 26, 2008
ABSTRACT
We present the results of spectroscopic observations from the ESSENCE high-redshift supernova(SN) survey during its first four years of operation. This sample includes spectra of all SNe Iawhose light curves were presented by Miknaitis et al. (2007) and used in the cosmological analysesof Davis et al. (2007) and Wood-Vasey et al. (2007). The sample represents 273 hours of spectro-scopic observations with 6.5–10-m-class telescopes of objects detected and selected for spectroscopyby the ESSENCE team. We present 174 spectra of 156 objects. Combining this sample with that ofMatheson et al. (2005), we have a total sample of 329 spectra of 274 objects. From this, we are ableto spectroscopically classify 118 Type Ia SNe. As the survey has matured, the efficiency of classifyingSNe Ia has remained constant while we have observed both higher-redshift SNe Ia and SNe Ia fartherfrom maximum brightness. Examining the subsample of SNe Ia with host-galaxy redshifts shows thatredshifts derived from only the SN Ia spectra are consistent with redshifts found from host-galaxyspectra. Moreover, the phases derived from only the SN Ia spectra are consistent with those derivedfrom light-curve fits. By comparing our spectra to local templates, we find that the rate of objectssimilar to the overluminous SN 1991T and the underluminous SN 1991bg in our sample are consistentwith that of the local sample. We do note, however, that we detect no object spectroscopically orphotometrically similar to SN 1991bg. Although systematic effects could reduce the high-redshiftrate we expect based on the low-redshift surveys, it is possible that SN 1991bg-like SNe Ia are lessprevalent at high redshift.Subject headings: distance scale – galaxies: distances and redshifts – supernovae: general
Electronic address: [email protected] Department of Astronomy, University of California, Berkeley,
CA 94720-3411.2 Harvard-Smithsonian Center for Astrophysics, 60 Garden
Street, Cambridge, MA 02138.3 Clay Fellow.4 National Optical Astronomy Observatory, 950 North Cherry
Avenue, Tucson, AZ 85719-4933.5 European Southern Observatory, Karl-Schwarzschild-Strasse 2,
D-85748 Garching, Germany.6 Pontificia Universidad Catolica de Chile, Departamento de As-
tronomıa y Astrofısica, Casilla 306, Santiago 22, Chile.7 Dark Cosmology Centre, Niels Bohr Institute, University of
Copenhagen, Juliane Maries Vej 30, DK-2100 Copenhagen Ø, Den-mark.
8 Department of Astronomy, Stockholm University, AlbaNova,10691 Stockholm, Sweden.
9 Institute for Astronomy, University of Hawaii, 2680 WoodlawnDrive, Honolulu, HI 96822.
10 Department of Physics, University of Queensland, QLD, Aus-tralia 4072.
11 Department of Physics, University of Notre Dame, 225 Nieuw-land Science Hall, Notre Dame, IN 46556-5670.
12 Department of Physics and Astronomy, Rutgers, the StateUniversity of New Jersey, 136 Frelinghuysen Road, Piscataway, NJ08854.
13 Kavli Institute for Particle Astrophysics and Cosmology, Stan-ford Linear Accelerator Center, 2575 Sand Hill Road, MS 29, MenloPark, CA 94025.
14 Department of Physics, Texas A&M University, College Sta-tion, TX 77843-4242.
15 Departamento de Astronomia, Universidad de Chile, Casilla36-D, Santiago, Chile.
16 Department of Physics, Harvard University, 17 Oxford Street,Cambridge, MA 02138.
17 National Optical Astronomy Observatory / Cerro TololoInter-American Observatory, Casilla 603, La Serena, Chile.
1. INTRODUCTION
A decade after the observations of high-redshift TypeIa supernovae (SNe Ia) caused a sea change in cosmology,indicating that the expansion rate of the Universe is cur-rently accelerating (Riess et al. 1998; Perlmutter et al.1999) (see Filippenko 2005 for a review), we are stillfar from understanding the nature of the “dark energy”that causes this accelerated expansion. Recent high-redshift SN Ia surveys, using the large and normal-ized peak luminosities of SNe Ia, have focused on mea-suring the equation-of-state parameter of the dark en-ergy, w = P/(ρc2), currently constraining it to ∼10%(Astier et al. 2006; Riess et al. 2007; Wood-Vasey et al.2007; Kowalski et al. 2008).
The determination of the expansion history of the Uni-verse with SNe Ia is performed by measuring the lumi-nosity distance as a function of redshift. A relationshipbetween the light-curve shape of a SN Ia and its luminos-ity is used to obtain precise luminosity distances (e.g.,Phillips 1993; Jha et al. 2007; Guy et al. 2007). The
18 Space Telescope Science Institute, 3700 San Martin Drive,Baltimore, MD 21218.
19 Johns Hopkins University, 3400 North Charles Street, Balti-more, MD 21218.
20 The Research School of Astronomy and Astrophysics, TheAustralian National University, Mount Stromlo and Siding SpringObservatories, via Cotter Road, Weston Creek, PO 2611, Aus-tralia.
21 Department of Physics and Astronomy, University of Pitts-burgh, 100 Allen Hall, Pittsburgh, PA 15260.

2 Foley et al.
redshift of the object is typically found through spec-troscopy of the SN by cross-correlating with low-redshifttemplate spectra or its host galaxy. Although photom-etry alone can be powerful (e.g., Barris & Tonry 2004;Poznanski et al. 2007), only spectroscopy can currentlyprovide the accurate classification and redshifts neces-sary for estimating cosmological parameters.
Besides providing the redshift for each object, spec-troscopy allows detailed studies of the physics of high-redshift SNe Ia. A critical aspect of high-redshift SN Iasurveys is to only include SNe Ia, and not other tran-sient objects, in their final analysis. Since the opti-cal spectra of SNe Ia are distinct from most transientphenomena, spectroscopy provides a consistent and pre-cise method for determining the nature of each tran-sient (see Filippenko 1997, for a review of SN spec-troscopy). Furthermore, with high-redshift SN Ia spectraone can compare physical properties of the objects withtheir low-redshift counterparts (e.g., Blondin et al. 2006;Balland et al. 2007; Garavini et al. 2007; Bronder et al.2008; Ellis et al. 2008; Foley et al. 2008).
In order to measure w to . 10%, the Equation of State:SupErNovae trace Cosmic Expansion (ESSENCE) teamhas concluded a six-year NOAO survey project using theCTIO 4 m telescope and the MOSAIC II camera withthe intention of discovering and following ∼200 SNe Iaover the redshift range of 0.2 < z < 0.8 (Miknaitis et al.2007). During the first four years of the ESSENCE sur-vey, which observed approximately October through De-cember, several hundred transient objects were detected(Miknaitis et al. 2007). As most of these objects wererelatively faint (R > 21 mag), a large amount of tele-scope time at 6.5–10 m telescopes was required for spec-troscopic follow-up observations. Despite being awardedapproximately 100 nights at these facilities over the firstfour years of the survey, we were still not able to obtaina spectrum of every candidate object (Matheson et al.2005).
However, during the first 12 search months (ESSENCEsearched three months per year), we were able to classify121 SNe Ia. In this paper, we present the spectra of allspectroscopic targets observed during the first four yearsof the ESSENCE survey. This sample, which updatesand supersedes the analysis of Matheson et al. (2005) forthe spectroscopy of the first two years of the ESSENCEsurvey, includes all SNe Ia presented by Miknaitis et al.(2007) and used in the analysis of Wood-Vasey et al.(2007) and Davis et al. (2007). We discuss our ob-servations in § 2. The classification scheme presentedby Matheson et al. (2005), Miknaitis et al. (2007), andBlondin & Tonry (2007) is updated in § 3 (the methodis similar to that presented by Miknaitis et al. 2007). In§ 4, we discuss the properties of our sample, and we sum-marize our conclusions in § 5.
2. OBSERVATIONS
Over the first four years of the ESSENCE survey, wedetected several thousand transient objects. Since wedid not have adequate observing time at large telescopesto follow each transient spectroscopically, we prioritizedthe objects by a combination of likelihood to be a SN Ia,observational ease, and, occasionally, likely redshift andphase relative to maximum light. These criteria wereall determined from our search images, using features
such as color and offset from the host galaxy. In par-ticular, the likelihood of an object being a SN Ia isdeduced from an approximate photo-z of its host, itsR−I color (Tonry et al. 2003), and its rise time. Objectswhich had particularly blue colors were considered morelikely to be core-collapse SNe, while objects with a slowrise time were more likely to be active galactic nuclei(AGNs) or other transients. Further details about thetarget selection can be found in Matheson et al. (2005)and Miknaitis et al. (2007).
Spectroscopic observations of ESSENCE targets wereobtained at a wide variety of telescopes: the Keck I andII 10 m telescopes, the European Southern Observatory8.2 m Very Large Telescope (ESO VLT), the GeminiNorth and South 8 m telescopes, the Magellan Baade andClay 6.5 m telescopes, and the MMT 6.5 m telescope.The spectrographs used were LRIS (Oke et al. 1995)with Keck I, DEIMOS (Faber et al. 2003) with Keck II,FORS1 (Appenzeller et al. 1998) with the VLT, GMOS(Hook et al. 2004) with Gemini (North and South),IMACS (Dressler et al. 2006) with Baade, LDSS2(Allington-Smith et al. 1994) and LDSS31 with Clay, andthe Blue Channel (Schmidt et al. 1989) with MMT. Nod-and-shuffle techniques (Glazebrook & Bland-Hawthorn2001) were used with GMOS (North and South) andsome IMACS observations to improve sky subtraction inthe red portion of the spectrum. A single spectrum wasobtained with the FAST spectrograph (Fabricant et al.1998) mounted on the Tillinghast 1.5 m telescope at theF. L. Whipple Observatory.
Standard CCD processing and spectrum extractionwere accomplished with IRAF2. Most of the data wereextracted using the optimal algorithm of Horne (1986);for the ESO VLT data, an alternative extraction methodbased on Richardson-Lucy restoration (Blondin et al.2005) was employed. Low-order polynomial fits tocalibration-lamp spectra were used to establish the wave-length scale. Small adjustments derived from night-skylines in the object frames were applied. We employedour own IDL routines to flux calibrate the data and re-move telluric lines using the well-exposed continua ofthe spectrophotometric standards (Wade & Horne 1988;Foley et al. 2003).
The photometric data were obtained on the NOAOBlanco 4 m telescope with the MOSAIC II imaging cam-era. The light curves for the SNe Ia are available online3
(Miknaitis et al. 2007).In Table 3, we present a full list of our observations
(date of observation, telescope/instrument, and exposuretimes). We also include information about the natureof each object (object classification, redshift, and, if aSN Ia, phase and light-curve shape). We present thespectra from 2004 and 2005 in Figures 1–6 (All addi-tional spectra are available in the online edition). Foreach SN Ia, we plot both the spectrum of the SN as wellas the best-fit SNID (Blondin & Tonry 2007) template
1 http://www.lco.cl/telescopes-information/magellan/instruments-1/ldss-3-1/ .
2 IRAF: the Image Reduction and Analysis Facility is distributedby the National Optical Astronomy Observatory, which is operatedby the Association of Universities for Research in Astronomy, Inc.(AURA) under cooperative agreement with the National ScienceFoundation (NSF).
3 See http://www.ctio.noao.edu/essence/

ESSENCE Spectroscopy: The First 4 Years 3
3000 4000 5000 6000 7000Rest Wavelength (Å)
0.0
0.2
0.4
0.6
0.8
1.0
1.2
Sca
led
f λ (e
rgs
s−1 c
m−
2 Å−
1 )
g005sn98es + 1.8
4000 5000 6000 7000 8000 9000Observed Wavelength (Å)
Fig. 1.— Spectrum of g005 at z = 0.20 compared to SN 1998es,a SN 1991T-like SN Ia, at t = 1.8 d relative to B-band maxi-mum. Differences in the continuum shape are ignored by SNID,which removes a pseudo-continuum from the spectra before cross-correlation.
3000 4000 5000 6000 7000Rest Wavelength (Å)
0.0
0.2
0.4
0.6
0.8
1.0
1.2
Sca
led
f λ (e
rgs
s−1 c
m−
2 Å−
1 )
g043sn99em + 6.2
4000 5000 6000 7000 8000 9000Observed Wavelength (Å)
Fig. 2.— Spectrum of g043 at z = 0.187 compared to SN 1999em,a SN II-P. Differences in the continuum shape are ignored by SNID,which attempts to remove a pseudo-continuum by fitting a low-order polynomial to the spectra before cross-correlation.
4000 5000 6000 7000Rest Wavelength (Å)
0.0
0.2
0.4
0.6
0.8
1.0
1.2
Sca
led
f λ (e
rgs
s−1 c
m−
2 Å−
1 )
g046
5000 6000 7000 8000 9000Observed Wavelength (Å)
Fig. 3.— Spectrum of g046 at z = 0.184. The spectrum isdominated by galaxy light with no detectable amount of light froma transient object.
spectrum.
3000 4000 5000 6000Rest Wavelength (Å)
0.0
0.2
0.4
0.6
0.8
1.0
1.2
Sca
led
f λ (e
rgs
s−1 c
m−
2 Å−
1 )
g120sn99aw + 4.8
4000 5000 6000 7000 8000 9000Observed Wavelength (Å)
Fig. 4.— Spectrum of g120 at z = 0.51 compared to SN 1999aw,a SN Ia, at t = 4.8 d relative to B maximum. We were unableto determine a subtype for g120. Differences in the continuumshape are ignored by SNID, which attempts to remove a pseudo-continuum by fitting a low-order polynomial to the spectra beforecross-correlation.
4000 5000 6000 7000Rest Wavelength (Å)
0.0
0.2
0.4
0.6
0.8
1.0
1.2
Sca
led
f λ (e
rgs
s−1 c
m−
2 Å−
1 )m010sn96cb +36.8
5000 6000 7000 8000Observed Wavelength (Å)
Fig. 5.— Spectrum of m010 at z = 0.216 compared to SN 1996cb,a SN IIb. Differences in the continuum shape are ignored by SNID,which attempts to remove a pseudo-continuum by fitting a low-order polynomial to the spectra before cross-correlation.
3500 4000 4500 5000 5500 6000Rest Wavelength (Å)
0.0
0.2
0.4
0.6
0.8
1.0
1.2
Sca
led
f λ (e
rgs
s−1 c
m−
2 Å−
1 )
p534sn03du + 3.9
5000 6000 7000 8000 9000 10000Observed Wavelength (Å)
Fig. 6.— Spectrum of p534 at z = 0.621 after galaxy subtractionfrom the superfit routine compared to SN 2003du, a SN Ia. Differ-ences in the continuum shape are ignored by SNID, which removesa pseudo-continuum from the spectra before cross-correlation. Ad-ditional figures for all objects listed in Table 3 can be found in theonline edition.
4 Foley et al.
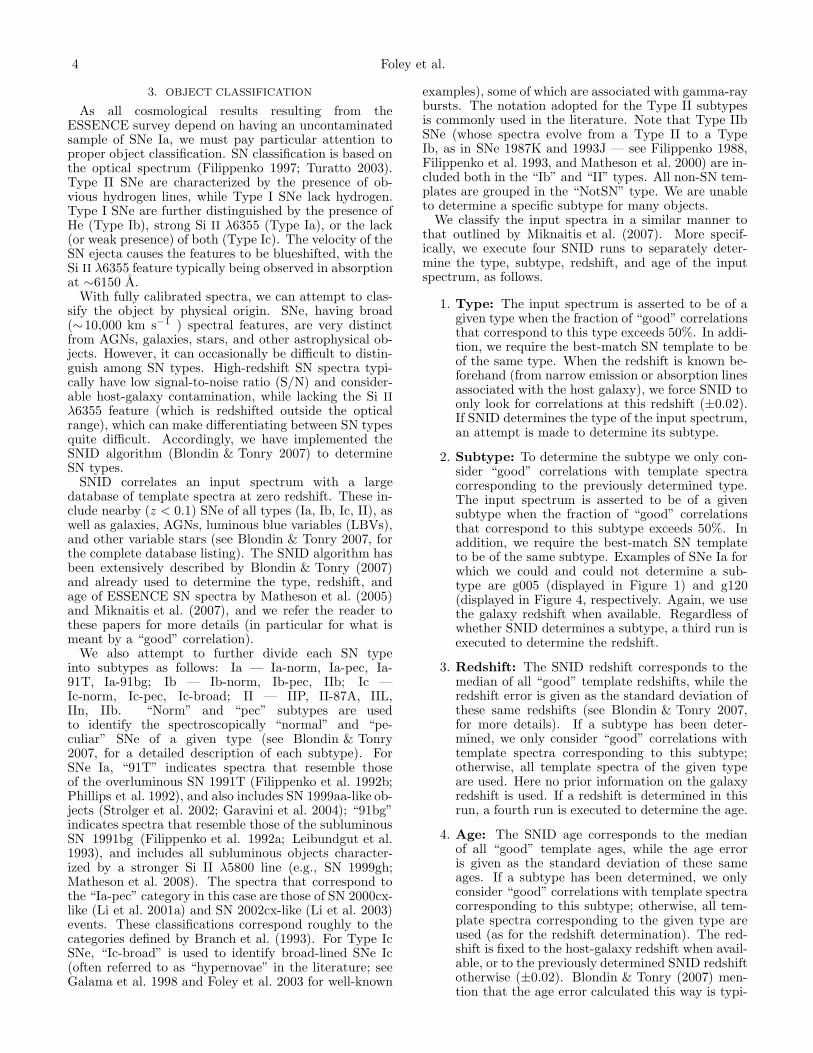
3. OBJECT CLASSIFICATION
As all cosmological results resulting from theESSENCE survey depend on having an uncontaminatedsample of SNe Ia, we must pay particular attention toproper object classification. SN classification is based onthe optical spectrum (Filippenko 1997; Turatto 2003).Type II SNe are characterized by the presence of ob-vious hydrogen lines, while Type I SNe lack hydrogen.Type I SNe are further distinguished by the presence ofHe (Type Ib), strong Si II λ6355 (Type Ia), or the lack(or weak presence) of both (Type Ic). The velocity of theSN ejecta causes the features to be blueshifted, with theSi II λ6355 feature typically being observed in absorptionat ∼6150 A.
With fully calibrated spectra, we can attempt to clas-sify the object by physical origin. SNe, having broad(∼10,000 km s−1 ) spectral features, are very distinctfrom AGNs, galaxies, stars, and other astrophysical ob-jects. However, it can occasionally be difficult to distin-guish among SN types. High-redshift SN spectra typi-cally have low signal-to-noise ratio (S/N) and consider-able host-galaxy contamination, while lacking the Si II
λ6355 feature (which is redshifted outside the opticalrange), which can make differentiating between SN typesquite difficult. Accordingly, we have implemented theSNID algorithm (Blondin & Tonry 2007) to determineSN types.
SNID correlates an input spectrum with a largedatabase of template spectra at zero redshift. These in-clude nearby (z < 0.1) SNe of all types (Ia, Ib, Ic, II), aswell as galaxies, AGNs, luminous blue variables (LBVs),and other variable stars (see Blondin & Tonry 2007, forthe complete database listing). The SNID algorithm hasbeen extensively described by Blondin & Tonry (2007)and already used to determine the type, redshift, andage of ESSENCE SN spectra by Matheson et al. (2005)and Miknaitis et al. (2007), and we refer the reader tothese papers for more details (in particular for what ismeant by a “good” correlation).
We also attempt to further divide each SN typeinto subtypes as follows: Ia — Ia-norm, Ia-pec, Ia-91T, Ia-91bg; Ib — Ib-norm, Ib-pec, IIb; Ic —Ic-norm, Ic-pec, Ic-broad; II — IIP, II-87A, IIL,IIn, IIb. “Norm” and “pec” subtypes are usedto identify the spectroscopically “normal” and “pe-culiar” SNe of a given type (see Blondin & Tonry2007, for a detailed description of each subtype). ForSNe Ia, “91T” indicates spectra that resemble thoseof the overluminous SN 1991T (Filippenko et al. 1992b;Phillips et al. 1992), and also includes SN 1999aa-like ob-jects (Strolger et al. 2002; Garavini et al. 2004); “91bg”indicates spectra that resemble those of the subluminousSN 1991bg (Filippenko et al. 1992a; Leibundgut et al.1993), and includes all subluminous objects character-ized by a stronger Si II λ5800 line (e.g., SN 1999gh;Matheson et al. 2008). The spectra that correspond tothe “Ia-pec” category in this case are those of SN 2000cx-like (Li et al. 2001a) and SN 2002cx-like (Li et al. 2003)events. These classifications correspond roughly to thecategories defined by Branch et al. (1993). For Type IcSNe, “Ic-broad” is used to identify broad-lined SNe Ic(often referred to as “hypernovae” in the literature; seeGalama et al. 1998 and Foley et al. 2003 for well-known
examples), some of which are associated with gamma-raybursts. The notation adopted for the Type II subtypesis commonly used in the literature. Note that Type IIbSNe (whose spectra evolve from a Type II to a TypeIb, as in SNe 1987K and 1993J — see Filippenko 1988,Filippenko et al. 1993, and Matheson et al. 2000) are in-cluded both in the “Ib” and “II” types. All non-SN tem-plates are grouped in the “NotSN” type. We are unableto determine a specific subtype for many objects.
We classify the input spectra in a similar manner tothat outlined by Miknaitis et al. (2007). More specif-ically, we execute four SNID runs to separately deter-mine the type, subtype, redshift, and age of the inputspectrum, as follows.
1. Type: The input spectrum is asserted to be of agiven type when the fraction of “good” correlationsthat correspond to this type exceeds 50%. In addi-tion, we require the best-match SN template to beof the same type. When the redshift is known be-forehand (from narrow emission or absorption linesassociated with the host galaxy), we force SNID toonly look for correlations at this redshift (±0.02).If SNID determines the type of the input spectrum,an attempt is made to determine its subtype.
2. Subtype: To determine the subtype we only con-sider “good” correlations with template spectracorresponding to the previously determined type.The input spectrum is asserted to be of a givensubtype when the fraction of “good” correlationsthat correspond to this subtype exceeds 50%. Inaddition, we require the best-match SN templateto be of the same subtype. Examples of SNe Ia forwhich we could and could not determine a sub-type are g005 (displayed in Figure 1) and g120(displayed in Figure 4, respectively. Again, we usethe galaxy redshift when available. Regardless ofwhether SNID determines a subtype, a third run isexecuted to determine the redshift.
3. Redshift: The SNID redshift corresponds to themedian of all “good” template redshifts, while theredshift error is given as the standard deviation ofthese same redshifts (see Blondin & Tonry 2007,for more details). If a subtype has been deter-mined, we only consider “good” correlations withtemplate spectra corresponding to this subtype;otherwise, all template spectra of the given typeare used. Here no prior information on the galaxyredshift is used. If a redshift is determined in thisrun, a fourth run is executed to determine the age.
4. Age: The SNID age corresponds to the medianof all “good” template ages, while the age erroris given as the standard deviation of these sameages. If a subtype has been determined, we onlyconsider “good” correlations with template spectracorresponding to this subtype; otherwise, all tem-plate spectra corresponding to the given type areused (as for the redshift determination). The red-shift is fixed to the host-galaxy redshift when avail-able, or to the previously determined SNID redshiftotherwise (±0.02). Blondin & Tonry (2007) men-tion that the age error calculated this way is typi-

ESSENCE Spectroscopy: The First 4 Years 5
cally overestimated, but here we make no attemptsto compute a more robust age error (as done byBlondin et al. 2008).
Note that we have run SNID on all ESSENCE spectra,but only report the SNID output for spectra classified asSNe (Table 3). For all other spectra, we rely on the visualclassification by spectroscopy experts within our team.In a few cases, a spectrum not classified as a SN Ia bySNID is found to be consistent with a SN Ia spectrumthrough visual inspection. For these cases we report a“Ia?” classification. In fact, SNID can sometimes failto correctly classify an input SN Ia spectrum, mainlybecause of low S/N or excessive galaxy contamination.Blondin & Tonry (2007) showed that the redshift andage determination with SNID is greatly affected for inputspectra that consist of more than 50% galaxy light.
In addition to using SNID, we have applied an alter-nate technique for SN classification that is based on a χ2
minimization of fitting a SN spectrum to template spec-tra with a variable extinction and galaxy contamination(Howell et al. 2005). This method is implemented in thesuperfit IDL package. The main advantage of the χ2
minimization technique is that it can classify SNe fromspectra that are highly contaminated by galaxy light.One of the main drawbacks of superfit is that it as-sumes that the continuum of a high-redshift SN Ia mustbe similar to that of a low-redshift SN Ia. Althoughusually this can be worked around by having a differentvalue for the extinction (which will change the continuumshape of the spectrum even if the value of the “extinc-tion” is not strictly physical) or a different galaxy tem-plate, there is the possibility that superfit will not clas-sify some objects that SNID does. This is demonstratedby n404 in Figure 7. For this object, SNID classifies itas a SN Ia at z = 0.211. For the same object, superfitclassifies it as a SN II, with 3 of the top 5 matches withlow-redshift template spectra being SNe II. The best-fitSN Ia template places n404 at z = 0.07. One has to go tothe eighth-best match to obtain a SN Ia at the same red-shift as SNID. Having performed a “brute-force,” wherewe did not carefully adjust various parameters to achievethe best results for each spectrum, classifcation for allspectra in our sample, we found other object in our sam-ple where SNID and superfit differ. However, a morecareful superfit analysis may have very few discrepan-cies with SNID. The other main drawback of superfit isthat although superfit produces a χ2-like goodness-of-fit parameter, there is no formal evaluation of the uncer-tainty of any of the derived values (cf, the redshift errorin SNID is related to the height of the correlation peak;see Blondin & Tonry 2007).
Applying the χ2 minimization technique to all spectrawhich were not originally classified by SNID, we obtainedseveral candidate SNe. The superfit package will out-put a galaxy-subtracted spectrum using a galaxy fraction(and galaxy type) that best matches a given SN templatespectrum. Since we have not modeled the robustness ofthe goodness-of-fit parameter from this technique, we at-tempted to classify the galaxy-subtracted spectra withSNID. We fit the top five galaxy-subtracted superfit
spectra with SNID, looking for a consensus result. For99 potential candidates, this process yielded one addi-tional SN Ia? (f123), as well as identifying a second-
Observed Wavelength (Å)
Sca
led
f λ (e
rgs
s−1 c
m−
2 Å−
1 )
5000 6000 7000 8000 90000
2
4
6
8
10 SNIDIa (06ax)z = 0.211
0
2
4
6
8
10 superfitIa (94D)z = 0.21
0
2
4
6
8
10 superfitIa (86G)z = 0.07
0
2
4
6
8
10 superfitII (79C)z = 0.09
Fig. 7.— Observed spectrum of ESSENCE SN n404. Thegreen lines are low-redshift comparison spectra. The top threepanels show the first (SN II 1979C at z = 0.09), fourth (firstSN Ia; SN 1986G at z = 0.07), and eighth (first SN Ia atz ≈ 0.21; SN 1994D) best-matched low-redshift template spectrafrom superfit in green. The bottom panel shows the best-matchedlow-redshift template spectrum from SNID in green. Differencesin the continuum shape are ignored by SNID, which removes apseudo-continuum from the spectra before cross-correlation; there-fore, the continuum of the SNID template may not exactly matchthat of n404.
epoch spectrum of a SN Ia (p534; as identified from theother spectrum by SNID) as a SN Ia.
There is some concern that extra degrees of freedom areintroduced into our SNID fitting as the superfit pack-ages changes the spectrum by applying an extinction es-timate and removing a galaxy spectrum from each inputspectrum. However, since SNID normalizes all spectrato have a flat continuum, it is relatively insensitive toreddening.
We have already shown the excellent agreement be-tween the SNID correlation redshift and the redshiftof the SN host galaxy (when known) in several pub-lications (Matheson et al. 2005; Miknaitis et al. 2007;Blondin & Tonry 2007; Blondin et al. 2008). Figure 8again shows that the SNID redshifts agree well with thehost-galaxy redshifts, with a dispersion about the one-to-one correspondence of only ∼0.006. This figure containsonly the SNe Ia where we have an independent measure-ment of the redshift from a galaxy spectrum.
The template spectra in the SNID database have agescorrected for the 1/(1 + z) time-dilation factor expectedin an expanding universe (e.g., Blondin et al. 2008), suchthat SNID determines ages in the SN rest frame. Nocorrection to the age for light-curve width has beenmade. We can then compare these age estimates (tSNID)

6 Foley et al.
Fig. 8.— Comparison of redshifts determined from cross-correlations with SN Ia spectral templates using SNID (zSNID)and from narrow lines in the host-galaxy spectrum (zGAL; upperpanel). We show the residuals vs. zGAL in the lower panel.
with those inferred from a well-sampled light curve (seeMiknaitis et al. 2007). We expect a one-to-one corre-spondence between the light-curve rest-frame age,
tLC =∆tobs
1 + z, (1)
and tSNID, where ∆tobs is the time difference (in the ob-server frame) between maximum light and the time thespectrum was obtained.
The result is shown in Figure 9. We use all objects witha good light-curve fit and a good SNID age, resulting ina total of 59 SN Ia spectra with rest-frame light-curveages in the range −11.0 ≤ tLC ≤ 19.4 d. The dispersionabout the tSNID = tLC line is σt ≈ 2.4 d, similar to whatwas found by Blondin & Tonry (2007). We show theresiduals versus tLC in the lower plot. The mean residualis approximately −0.7 d. Two points at tLC < −10 d are∼ 2σ off the null residual line; this is due to the lownumber of SN Ia templates at these early phases.
The fact that the SNID correlation redshift and agemeasurements agree so well with the galaxy redshiftsand light-curve ages, respectively, is a strong argu-ment in favor of the similarity of these SNe Ia with lo-cal counterparts. This further confirms the results ofMatheson et al. (2005), who found that our classificationtechniques were robust and saw no major indications ofSN Ia evolution in our sample. Foley et al. (2008) alsosee this for the overall sample.
4. HIGH-REDSHIFT SAMPLE
Over the four seasons, we obtained 329 spectra of 274objects for a total of 273 hours of integration. This hasyielded 118 SNe Ia, 9 SNe Ia?, 16 SNe II, 7 SNe Ib/c, 56galaxies (which may have some SN light in the spectrum,but at an undetectable level), 20 AGNs, 4 stars, and 44unidentified objects. We provide a detailed assessmentof our object classification in Table 1.
Objects with no definitive SNID classification or ob-vious “by-eye” classification are labeled as “Unk.” Ob-jects with no signal in their spectra are labeled as “N.S.”Together, objects with these classifications compose thesubsample of unidentified objects.
Fig. 9.— Comparison of SN spectral ages determined using SNID(tSNID) and rest-frame light-curve ages (tLC) of high-z SNe Ia (up-per panel). We show the residuals vs. tLC in the lower plot.
TABLE 1ESSENCE Spectroscopy Results: The First 4
Years
Type Year 1 Year 2 Year 3 Year 4 Total
Ia 15 35 30 38 118Ia? 0 3 2 4 9II 1 2 6 7 16Ib/c 1 2 2 2 7AGN 3 9 0 8 20Gal 8 11 20 17 56Star 2 2 0 0 4Unk/N.S. 6 17 13 8 44Total 36 81 73 83 274
Note. — Since there were no template observations ob-tained before Year 1 and no long baseline observations toeasily reject AGNs and variable stars, there were fewer high-quality SN Ia candidates in Year 1. As a result, Year 1 hadfewer SNe Ia confirmed compared to later years.
For several objects, we have changed our classificationfrom that published by Matheson et al. (2005). This ismostly the result of an improved version of SNID andadditional low-redshift templates for comparison. Addi-tionally, the superfit routine provided several classifi-cations that we were not previously able to determine. InTable 2, we list the objects with different classificationsbetween Matheson et al. (2005) and this work, as well asthe dominant reason for the reclassification.
4.1. Survey Efficiency
In order to meet our goal of ∼200 SNe Ia over six years,we tried to use our resources as efficiently as possibleto detect and classify SNe Ia. Although the ESSENCEsurvey has been completed, performing an analysis of theefficiency of ESSENCE will provide useful informationfor the planning of future surveys (e.g., Pan-STARRSand DES).
The process of detecting and classifying SNe Ia can beseparated into two tasks: pre-selecting potential candi-dates so SNe Ia represent a high percentage of spectro-scopic targets, and properly classifying the spectrum ofa SN Ia as a SN Ia. The first task is based solely on pa-rameters derived from imaging. The second task relies on

ESSENCE Spectroscopy: The First 4 Years 7
TABLE 2ESSENCE Object Reclassification
Matheson et al. (2005) The PaperESSENCE ID IAUC ID Classification Classification Notes
c016.wxm1 04 · · · AGN Galc022.wxu2 15 · · · II? Ib IIb subtyped009.waa6 16 · · · Gal Iad120.wcc1 2 · · · · · · AGN Not listed by Matheson et al. (2005)e141.wdd7 2 · · · II Ib IIb subtypee143.wdd7 3 · · · II Ibe149.wdd5 10 2003ks Ia? Iaf001.wbb7 1 2003kv Unk IIf044.wbb8 8 · · · Gal Iaf123.wcc1 7 · · · Gal Ia?f221.wcc4 14 2003lk Ia? Galf301.wdd6 1 · · · Ia? Iaf308.wdd6 10 · · · Ia? Ia
having a method of classifying events with high accuracy(such as the SNID algorithm) and having spectra of suffi-cient quality for that method to determine a classification(which depends on observing conditions, separation fromthe host galaxy, brightness of the target, exposure time,the spectrograph’s wavelength range, etc.).
To examine the synergy of our search with the large-aperture telescope time we used for spectroscopy, wepresent histograms of our redshift distribution and phaseof the first spectrum of each SN Ia in Figures 10 and 11,respectively. From these figures we see that as the surveymatured, we were able to detect higher-redshift objectswith greater efficiency. The SNe Ia detected during thefirst two years have an average redshift of 0.38 (and me-dian redshift of 0.41), while the SNe Ia detected duringyears 3 and 4 have an average redshift of 0.45 (and me-dian redshift of 0.42). We also detected 7 (21) SNe Iawith z > 0.7 (z > 0.6) in the second two years, while wehad detected none (4) in the first two years. Moreover,we were able to detect, observe, and classify SNe Ia atlater phases after maximum brightness, when the SNeare fainter.
Figure 12 shows that for objects with larger ∆4 (cor-responding to being less luminous), we only obtain spec-tra near maximum light, while for objects with smaller∆ (corresponding to being more luminous), we obtainspectra for a wide range of phases. Besides being lessluminous, high-∆ SNe Ia fade faster than low-∆ SNe Ia,making high-∆ SNe Ia become even fainter relative tolow-∆ SNe Ia the farther they are from maximum light.Both of these biases (faintness and faster declining) forhigh-∆ objects are expected for our sample. However,one may argue that since there are fewer total spectraobtained for older SNe we may be seeing a manifestationof small-number statistics as opposed to a selection effect.To test this hypothesis, we performed a Kolmogorov-Smirnov (K-S) test on the objects with |t| < 5 d com-pared to those with 5 < t < 20 d and t > 20 d; we find theprobability that the sets are chosen from different distri-butions to be 75.6% and 99.9%, respectively. The earlierdata are marginally consistent, while the later data aredifferent at a high significance. This is consistent withthe expected bias.
In Figure 12, we see that there are 5 SNe (d058,
4 MV (t = 0) = −19.504 mag + 0.736∆ + 0.182∆2 +5 log10(H0/65) (Jha et al. 2007).
0.0 0.2 0.4 0.6 0.8 1.0Redshift
5
10
15
20
25
30
Num
ber
of S
Ne
Ia
Ia?
Ia 2004−2005
Ia 2002−2003
Fig. 10.— Redshift distribution of spectroscopically identifiedSNe Ia from the first four years of the ESSENCE survey. TheSNe for which we have a high confidence of being of Type Ia (asdetermined by SNID) are plotted in the hashed region. The openregion represents SNe for which we have less confidence and havebeen classified “SNe Ia?.”
−20 −10 0 10 20 30Phase of First Spectrum (d)
2
4
6
8
10
Num
ber
of S
Ne
Ia
Ia 2004−2005
Ia 2002−2003
Fig. 11.— Phase (relative to maximum brightness) distributionof spectroscopically identified SNe Ia from the first four years ofthe ESSENCE survey and light curves fit by Wood-Vasey et al.(2007).
h311, m022, m043, and m057) with ∆ < −0.4, the fidu-cial ∆ limit for the multicolor light-curve shape method(MLCS; Riess et al. 1996; Jha et al. 2007) based on thebroadest local SN Ia light curves. There are two reasonsfor such a low value of ∆: the light curve is broaderthan any local template, or the light curve is of lowquality and the MLCS fit is not robust. Of the 5 SNe,three (h311, m022, m057) fail the χ2/dof < 3 cutoff setby Wood-Vasey et al. (2007). One (m043) has no light-curve points before maximum, so it is difficult to deter-mine if the light curve is truly broad. The final one (d058,with ∆ = −0.470) has a well-sampled light curve and is

8 Foley et al.
−20 −10 0 10 20 30 40Phase of Spectrum (d)
−0.5
0.0
0.5
∆
Fig. 12.— Distribution of measured ∆ of ESSENCE SNe Iavs. phase (relative to maximum brightness). Only objects thathad light curves fit by Wood-Vasey et al. (2007) have been plotted.The dashed line indicates the ∆ limit beyond which MLCS has toextrapolate to fit light curves. As such, objects with ∆ < −0.4should be discounted.
likely to be truly broad. Examining the spectrum, it doesnot appear that d058 is peculiar, however the small rest-frame wavelength range (∼3000 – 5000 A) prevents aninvestigation of important lines such as Si II λ6355. Thefirst four objects should be ignored since their ∆ valuesare likely to be incorrect. The final object, d058, shouldbe discounted. Although ∆ is a well-defined quantityfor ∆ < −0.4 (indicating the width of a light curve), forsuch values we must extrapolate beyond the local sample,leading to potentially incorrect distance and luminositymeasurements.
We further investigate if we are limited in our numberof classified SNe Ia by our search or by our usable timeon large-aperture telescopes. In Figure 13, we show ourefficiency (given by the ratio of SNe Ia classified to totalobjects we observed) as a function of search month. How-ever, there are many objects where, after a short expo-sure, we recognized that it was not a SN Ia. An exposure-time weighted efficiency will be higher than that shownin Figure 13. Throughout the first four years, we con-sistently classified ∼43% of all spectroscopic targets asSNe Ia, perhaps slightly increasing our efficiency withtime.
In Figure 14, we show that our efficiency does notchange with the amount of spectroscopic time in a givenmonth. This indicates that for a broad range of the num-ber of transients detected per month in our search or fora broad range of spectroscopic follow-up time in a givenmonth, we would obtain about the same ratio of SNe Iato total spectroscopic targets.
This result is perhaps a little counterintuitive. Thereare several factors involved. For example, with infinitepotential targets from the search, one expects to be ableto properly identify excellent candidate SNe Ia, resultingin a higher efficiency. Similarly, with infinite spectro-scopic follow-up time, one expects to be able to obtaina spectrum of every transient, resulting in a lower effi-ciency. But there are other factors. First, when there was
Oct 02Nov 02Dec 02Oct 03Nov 03Dec 03Oct 04Nov 04Dec 04Oct 05Nov 05Dec 05Search Month
0.0
0.2
0.4
0.6
0.8
1.0
SN
Ia E
ffici
ency
Fig. 13.— Efficiency of our spectroscopic follow-up observationsover the 12 search months in the first four years of ESSENCE. Theoverall efficiency is 43%.
0 10 20 30 40 50 60Spectroscopic Telescope Time/Month (hours)
0.0
0.2
0.4
0.6
0.8
1.0
SN
Ia E
ffici
ency
Fig. 14.— Efficiency of our spectroscopic follow-up observationsover the 12 search months in the first four years of ESSENCE as afunction of total spectroscopic exposure time in a given month.
a paucity of potential spectroscopic targets, we wouldobtain additional spectra of already confirmed SNe Iarather than observe candidates that had a small possibil-ity of being a SN Ia. Another aspect is the image qualityof the search. If a particular month had poor weatheror bad seeing at Cerro Tololo, we would typically detectbrighter, more isolated objects at lower redshifts. So evenif there were fewer objects from which to choose, the ob-jects were typically easier to observe. It is difficult todisentangle all of these effects, but we have shown fromour measured efficiencies that they naturally balancedover the first four years of the ESSENCE survey.
Howell et al. (2005) showed that the Supernova LegacySurvey (SNLS) was able to improve their efficiency from54% to 71% by utilizing multiple colors of the transientsand hosts to better predict whether a transient is a SN Ia.The ESSENCE survey, which searched in only R and I,was unable to perform such an analysis. Furthermore,ESSENCE only had R and I photometry for the hostgalaxies, reducing our ability to determine precise host-

ESSENCE Spectroscopy: The First 4 Years 9
18 19 20 21 22 23 24 25Rmax
0.0
0.2
0.4
0.6
0.8
1.0
SN
e Ia
Cla
ssifi
ed /
Pos
sibl
e S
Ne
Ia
Fig. 15.— Ratio of the number of SNe Ia classified to the numberof total objects which may be SNe Ia (those classified as SNe Ia,SNe Ia?, Gal, Unk, or N.S.) as a function of peak R magnitude.The bins are for objects with Rmax < 21, 21 ≤ Rmax < 22, 22 ≤
Rmax < 23, and Rmax > 23 mag, with the points plotted at themedian value for each bin.
galaxy photo-z values. Obviously, if spectroscopic effi-ciency is a priority, future surveys should have many-filter observations of transients and host galaxies. Ad-ditionally, having multiple colors of SNe Ia will greatlyimprove the measurement of SN colors and dust extinc-tion, which in turn should improve SN distances.
Although we have been able to reduce the numberof persistent transients (AGNs, variable stars) observedspectroscopically, we still observed 7 AGNs in year 4(compared to 3, 9, and 0 for years 1, 2, and 3). Theseobjects were selected for spectroscopic observation de-spite some indications that they were AGNs. This canbe attributed to a human error, and having more hu-mans vet the candidates would help prevent such futureobservations.
Finally, if we remove all transients which are definitelynot SNe Ia (i.e., those objects that have spectra whichidentify them as other types of transient objects), we candetermine how successful our spectroscopic classificationwould have been if we had fewer contaminants. Figure 15shows the ratio of the number of SNe Ia to the numberof total objects which may be SNe Ia (those classified asSNe Ia, SNe Ia?, Gal, Unk, or N.S.) as a function of peakR magnitude. This is a measurement that approximatesour efficiency if we had better photometric preselection.We do note that for a fixed amount of galaxy-light con-tamination it is easier to classify a bright SN Ia than arelatively faint SN Ib/c, indicating that the “Gal” cat-egory may contain a lower fraction of SNe Ia than thesurvey as a whole.
Although not all objects classified as Unk, for example,are SNe Ia, this ratio still yields a useful approximationof our spectroscopic efficiency as a function of bright-ness. Note that the ratio is a minimum efficiency sinceit will increase by either identifying objects as transientsother than SNe Ia (by decreasing the number of possibleSNe Ia) or by identifying objects as SNe Ia (by increasingthe number of SNe Ia).
Regardless of maximum brightness, we appear to iden-tify similar percentages of possible SNe Ia and definite
SNe Ia. Therefore, we appear to apply a consistent ap-proach to obtaining sufficient-quality spectra to identifySNe Ia for objects of all brightnesses.
4.2. Sample Demographics
In the local universe, there are many subtypes ofSNe Ia. The most common peculiar subtypes are thoseof SNe 1991T and 1991bg (described in Section 3), corre-sponding to more and less luminous events, respectively.Li et al. (2001b) found that 20% and 16% of nearbySNe Ia are similar to SNe 1991T and 1991bg, respec-tively. To determine if the ESSENCE sample of SNe Iais representative of the full SN Ia population and if thehigh-redshift population has different demographics fromthe low-redshift population, we examine the peculiarityrate in the ESSENCE sample.
4.2.1. Peculiar Type Ia Supernova Sample
SNID cross-correlates a SN spectrum with a library oftemplate SN spectra. The template spectra have beenclassified into subtypes (see Section 3). If > 50% of thebest-fit template spectra for a given SN are all part ofa particular subtype, then the SN is considered to be ofthat subtype.
Using SNID, we have determined that five of our SNe Ia(b004, d009, d083, d093, and p534) are SN 1991T-likeSNe Ia. Matheson et al. (2005) also claimed that b004and d083 are similar to SN 1991T. The light curves ofb004 and d009 were not fit by Wood-Vasey et al. (2007);however, d083, d093, and p534 were found to have ∆ =−0.273, −0.365, and −0.096, respectively. SN 1991Tand the SN 1991T-like SN 1999aa have ∆ = −0.220 and−0.271, respectively (Jha et al. 2007).
There are an additional 19 objects which do not passthe threshold necessary to be safely considered as aSN 1991T-like object, but have a best-fit template thatis of that subtype. For the sample of 24 SNe Ia thatare either classified as SN 1991T-like or have a best-fittemplate of that subtype, there are 16 objects with lightcurves fit by Wood-Vasey et al. (2007), having a mean∆ of −0.178. The entire ESSENCE sample with lightcurves fit by Wood-Vasey et al. (2007) has a mean ∆ of−0.121. The ∆ distributions of both the entire sampleand the subsample of SN 1991T-like objects are shownin Figure 16.
We have also identified a single object (m226) with abest-fit template similar to SN 1991bg, but it did not passthe threshold to be considered SN 1991bg-like. Since noSN 1991bg-like objects have been spectroscopically con-firmed at high redshift, we pay particular attention tothe classification of this object. There are several rea-sons why we do not believe m226 should be classifiedas a SN 1991bg-like object. First, the spectrum onlymatched three SNID template spectra, two of which wereSNe Ia-norm. Second, the best-match template spectrumis of SN 1999gh at 42 d past maximum light, while thelight-curve age is 24 d past maximum light. The best-match template with a spectral age near that of the light-curve age of m226 is SN 2002bo (at 29 d past maximumlight), which is a SN Ia-norm. Third, SN 1999gh is alow-luminosity SN Ia with a deep Si II λ5800 line; how-ever, it does not share many of the spectral features ofSN 1991bg (Matheson et al. 2008). Fourth, the spectrumof m226 has a relatively low S/N ratio, where proper

10 Foley et al.
−1.0 −0.5 0.0 0.5 1.0∆
5
10
15
20N
umbe
r of
SN
e Ia
All SNe Ia
SN 1991T−like?
SN 1991T−like
Fig. 16.— ∆ distribution of spectroscopically identified SNe Iafrom the first four years of the ESSENCE survey and light curvesfit by Wood-Vasey et al. (2007). Subsamples of objects identifiedby SNID as either being of the subtype consisting of SN 1991T-like objects or having a best-fit template of that subtype are alsoshown. Increasing ∆ corresponds to narrower light curves and lessluminous SNe Ia. The dotted line indicates the ∆ limit beyondwhich MLCS has to extrapolate to fit light curves. As such, objectswith ∆ < −0.4 should be discounted.
subtyping is dubious. Finally, the light-curve fit of m226yielded ∆ = −0.227, which is on the opposite end ofthe ∆ range from SN 1991bg-like objects. With all ofthese data, we are therefore unable to properly classifythe subtype of m226.
4.2.2. Peculiarity Rate
The spectral features that distinguish SNe 1991T and1991bg from SNe Ia-norm can be hidden by low-S/Nspectra, spectra with a restricted rest-frame wavelengthrange, and spectra obtained well after maximum bright-ness. Nevertheless, we still have observed very few pe-culiar SNe Ia in the ESSENCE survey. Of the 131SNe Ia and SNe Ia?, we have spectroscopically confirmed5 SNe Ia similar to SN 1991T (with 19 additional po-tential objects). Therefore, we have determined that4–19% of the SNe Ia from the ESSENCE survey aresimilar to SN 1991T, while no ESSENCE SN is simi-lar to SN 1991bg. Because of selection effects (discussedbelow), our upper limit of SN 1991T-like objects maybe lower than the real value; however, since the lowerlimit is determined by definitive detections, it cannotbe smaller. Bronder et al. (2008) spectroscopically con-firmed 2–3 high-redshift SNLS SNe Ia out of a sample of54 to be comparable to SN 1991T; this rate is similar tothat found in the ESSENCE survey.
Comparing to low-redshift SN searches, Li et al.(2001b) found that 20% and 16% of nearby SNe Ia aresimilar to SNe 1991T and 1991bg, respectively. Our rawrate of SN 1991bg-like objects appears to be very lowcompared to the low-redshift rates. However, with a typ-ical limiting magnitude of R = 24 mag, we would onlyexpect to be complete for SN 1991bg-like objects out toz ≈ 0.35. We have detected 46 SNe Ia (or SNe Ia?)with z ≤ 0.35. If the low-redshift rates are similar tothe rates at z ≈ 0.35, we would expect to have detected7 SN 1991bg-like SNe Ia in this subsample. If there areno SN 1991bg-like SNe Ia at high redshift, but the ra-tio of SN 1991T-like to SNe Ia-norm remains constant,then one would expect 24% of high-redshift SNe Ia tobe similar to SN 1991T. Considering the selection ef-fects involved, we believe that the rate of SN 1991T-like SNe Ia spectroscopically confirmed in the ESSENCEsurvey is consistent with the rate found at low redshift.
0 20 40 60 80 100Percent Galaxy
0
10
20
30
Sig
nal /
Noi
se
SN
199
1bg
Det
ectio
n Li
mit
SN
199
1T D
etec
tion
Lim
it
Fig. 17.— Contours representing the region of S/N-galaxy con-tamination parameter space that SNe Ia similar to SNe 1991T and1991bg at z = 0.35 will have a correct subtype classification fromSNID. We have made no assumption about the relative luminosi-ties of the SNe or host galaxies. If a spectrum is to the upper-left of the contour, then it is correctly classified into its subtype.The dashed line is the median S/N for our sample of SNe Ia withz ≤ 0.35. The detection efficiencies show that we should recovernearly every SN 1991T-like SN Ia to this redshift, while the detec-tion of SN 1991bg-like objects is heavily dependent on the amountof galaxy contamination.
Conversely, we find that the raw rate of SN 1991bg-likeSNe Ia found in the ESSENCE survey is low. A furtherindication of a low raw rate is that no survey has spec-troscopically confirmed a SN 1991bg-like SNe Ia at highredshift.
To determine a reasonable detection efficiency for SNesimilar to SN 1991bg, we performed a basic simula-tion. Starting with the maximum-light spectrum ofSN 1991bg, we added a varying amount of noise andgalaxy contamination (using the spectrum of an ellipti-cal galaxy). We then processed the spectra with SNID,removing SN 1991bg from our sample of template SNeand restricting our wavelength range to 3000–6600 A, anappropriate rest-frame wavelength for z = 0.35. Fromthis, we were able to determine what parameters of S/Nand galaxy contamination would yield a correct sub-type classification by SNID. We repeated this process forSN 1991T with an Sb galaxy. The results are shownin Figure 17. For this simulation, we did not makeany assumption about the SN or host galaxy luminosi-ties. SN 1991bg-like objects should be less luminous andhave more luminous host galaxies than SN 1991T-likeobjects. This would mean that the average spectrum ofa SN 1991bg-like object should have more galaxy con-tamination than that of a SN 1991T-like object.
From Figure 17, we see that for z ≤ 0.35, we shoulddetect essentially all SN 1991T-like objects. However,for SN 1991bg-like objects, the detection efficiency isstrongly dependent on galaxy contamination. We woulddetect most SN 1991bg-like objects with < 60% galaxycontamination.
If we assume that the low- and high-redshift peculiar-

ESSENCE Spectroscopy: The First 4 Years 11
ity rates are the same, then selection effects and clas-sification systematics must decrease the SN 1991T-likeclassification rate by a factor of 1–5. Considering thatSN 1991bg-like objects tend to be found in high surface-brightness galaxies, many of these objects will be fainterthan their galaxies at their position. We are able to re-move a significant amount of galaxy light during spec-tral reductions (particularly for elliptical galaxies wherethe radial light distribution is smooth), but it is stilllikely that a significant number of spectra of these ob-jects would be dominated by galaxy light, and thereforewould not be classified in this subtype by SNID.
If we assume that most spectra of SN 1991bg-like ob-jects will have galaxy contaminations of 25–75% and aS/N of 4–15 (similar to most of our spectra), we can de-termine the percentage of these spectra that SNID wouldclassify as SN 1991bg-like objects. Placing these con-straints in the parameter space shown in Figure 17, wesee that 54% of the remaining parameter space results ina positive detection.
If we assume that the selection effects and classifica-tion systematics are essentially equal to the detectionefficiency of SNID given our assumed parameters above,we require a bias factor of 1.86 for the SN 1991bg-likeobjects compared to the SN 1991T-like objects. Usingthis factor, we would expect the SN 1991bg-like pecu-liarity rate to be 2–8% for the ESSENCE sample. Thiscorresponds to 1–4 SNe in our z ≤ 0.35 sample, consis-tent with our non-detection of SN 1991bg-like events inour sample. Increasing the sample size and constrainingthe bias factors will greatly improve the constraints.
A secondary method to examine the rate of SN 1991bg-like objects is by measuring the light-curve shapes ofour SNe Ia. SN 1991bg-like objects have significantlydifferent light-curve shapes than normal SNe Ia, withcorresponding ∆ > 1. Our sample contains 31 SNe Iawith z ≤ 0.35 and ∆ information. If the local rate ofSN 1991bg-like objects is constant to z = 0.35, thenwe would expect to have 5 SN 1991bg-like objects inthis sample. None of the SNe Ia in this sample have∆ > 1. Assuming that all objects spectroscopically sim-ilar to SN 1991bg also have ∆ > 1, the nondetection ofany of these objects is 2.2σ from the expected value.
A significant bias against classifying SN 1991T-likeSNe Ia (particularly objects similar to SN 1999aa) athigh redshift is that their post-maximum spectra are verysimilar to those of SNe Ia-norm. For instance, there isessentially no difference between the spectra of the nor-mal SN 1994D and SN 1999aa one week after maximumbrightness (Garavini et al. 2004). Therefore, for a largepercentage of our SNe Ia, we have no real constraint onthe peculiarity of the individual object. More detailedmodeling is necessary to determine the classification suc-cess as a function of phase, S/N, and wavelength rangeof a particular spectrum.
5. CONCLUSIONS
We have presented optical spectra of targets selectedfor follow-up observations during the first four years ofthe ESSENCE survey. We have shown that as the surveymatured, we were able to detect more SNe Ia at higherredshifts and at later phases without reducing efficiencyfor a total of 127 SNe Ia and possible SNe Ia (“Ia?”).There were more SNe Ia observed in the second two years
than in the first two years, showing that we are on trackto reach the goal of the ESSENCE survey: constrainingthe equation-of-state parameter of dark energy to . 10%by observing ∼200 SNe Ia over the redshift range 0.2 .z . 0.8.
The spectra of the ESSENCE high-redshift SNe Ia arebroadly consistent with those of their low-redshift coun-terparts; see Foley et al. (2008) for a detailed compari-son of composite spectra made from this sample. If theESSENCE SNe Ia were drastically different from theirlocal counterparts, then the correlations of redshift andage found by SNID would have larger scatter. We areable to automatically classify the majority of our objectsusing SNID. However, human intervention, through vi-sual inspection or using a second fitting program, wasnecessary to properly classify several objects. SNID isable to accurately quantify the redshift and phase de-termination for our sample of SNe Ia. The peculiarityrate of the spectroscopically distinct SN 1991T-like andSN 1991bg-like objects are consistent with low-redshiftrates. None of the spectra from our sample or light curvesfit by Wood-Vasey et al. (2007) are similar to the spec-troscopically peculiar SN 1991bg. However, if we con-sider systematic effects, these non-detections are consis-tent with low-redshift rates.
This research is based in part on observations obtainedat the Cerro Tololo Inter-American Observatory, whichis operated by the Association of Universities for Re-search in Astronomy, Inc. (AURA) under cooperativeagreement with the National Science Foundation (NSF);the European Southern Observatory, Chile (ESO Pro-grammes 170.A-0519 and 176.A-0319); the Gemini Ob-servatory, which is operated by the Association of Uni-versities for Research in Astronomy, Inc., under a coop-erative agreement with the NSF on behalf of the Gem-ini partnership: the NSF (United States), the Scienceand Technology Facilities Council (United Kingdom),the National Research Council (Canada), CONICYT(Chile), the Australian Research Council (Australia),CNPq (Brazil), and CONICET (Argentina) (ProgramsGN-2002B-Q-14, GS-2003B-Q-11, GN-2003B-Q-14, GS-2004B-Q-4, GN-2004B-Q-6, GS-2005B-Q-31, GN-2005B-Q-35); the Magellan Telescopes at Las Campanas Ob-servatory; the MMT Observatory, a joint facility of theSmithsonian Institution and the University of Arizona;and the F. L. Whipple Observatory, which is operatedby the Smithsonian Astrophysical Observatory. Some ofthe data presented herein were obtained at the W. M.Keck Observatory, which is operated as a scientific part-nership among the California Institute of Technology, theUniversity of California, and the National Aeronauticsand Space Administration (NASA); the Observatory wasmade possible by the generous financial support of theW. M. Keck Foundation.
The ESSENCE survey team is very grateful to the sci-entific and technical staff at the observatories we havebeen privileged to use.
Facilities: Blanco (MOSAIC II), CTIO:0.9m(CFCCD), Gemini:South (GMOS), Gemini:North(GMOS), Keck:I (LRIS), Keck:II (DEIMOS, ESI),ESO VLT (FORS1), Magellan:Baade (IMACS), Magel-lan:Clay (LDSS2), Magellan:Clay (LDSS3).

12 Foley et al.
The ESSENCE survey is supported by the US NationalScience Foundation through grants AST–0443378 andAST–0507475. The Dark Cosmology Centre is fundedby the Danish National Research Foundation. A.C. ac-knowledges support from grants FONDECYT 1051061,FONDAP 15010003, and P06-045-F (Millennium Cen-ter for Supernova Science funded by programs Bicente-nario de Ciencia y Tecnologia de CONICYT and ICM deMIDEPLAN). A.V.F.’s supernova group at U.C. Berke-ley has been supported by many NSF grants over thepast two decades, most recently AST–0307894 and AST–0607485. P.M.G. is supported in part by NASA Long-
Term Astrophysics Grant NAG5-9364 and NASA/HSTGrant GO-09860. S.J. thanks the Stanford Linear Ac-celerator Center for support via a Panofsky Fellowship.R.P.K. enjoys support from AST–0606772 and PHY–9907949 to the Kavli Institute for Theoretical Physics.G.P. acknowledges support by the Proyecto FONDECYT3070034. A.R. thanks the NOAO Goldberg fellowshipprogram for its support.
Our project was made possible by the survey pro-gram administered by NOAO, and builds upon the data-reduction pipeline developed by the SuperMacho collab-oration.
REFERENCES
Allington-Smith, J., Breare, M., Ellis, R., Gellatly, D., Glazebrook,K., Jorden, P., Maclean, J., Oates, P., Shaw, G., Tanvir, N.,Taylor, K., Taylor, P., Webster, J., & Worswick, S. 1994, PASP,106, 983
Appenzeller, I., Fricke, K., Furtig, W., Gassler, W., Hafner, R.,Harke, R., Hess, H.-J., Hummel, W., Jurgens, P., Kudritzki,R.-P., Mantel, K.-H., Meisl, W., Muschielok, B., Nicklas, H.,Rupprecht, G., Seifert, W., Stahl, O., Szeifert, T., & Tarantik,K. 1998, The Messenger, 94, 1
Astier, P., Guy, J., Regnault, N., Pain, R., Aubourg, E., Balam, D.,Basa, S., Carlberg, R. G., Fabbro, S., Fouchez, D., Hook, I. M.,Howell, D. A., Lafoux, H., Neill, J. D., Palanque-Delabrouille,N., Perrett, K., Pritchet, C. J., Rich, J., Sullivan, M., Taillet,R., Aldering, G., Antilogus, P., Arsenijevic, V., Balland, C.,Baumont, S., Bronder, J., Courtois, H., Ellis, R. S., Filiol, M.,Goncalves, A. C., Goobar, A., Guide, D., Hardin, D., Lusset,V., Lidman, C., McMahon, R., Mouchet, M., Mourao, A.,Perlmutter, S., Ripoche, P., Tao, C., & Walton, N. 2006, A&A,447, 31
Balland, C., Mouchet, M., Amanullah, R., Astier, P., Fabbro, S.,Folatelli, G., Garavini, G., Goobar, A., Hardin, D., Irwin, M. J.,McMahon, R. G., Mourao, A.-M., Nobili, S., Pain, R., Pascoal,R., Raux, J., Sainton, G., Schahmaneche, K., & Walton, N. A.2007, A&A, 464, 827
Barris, B. J. & Tonry, J. L. 2004, ApJ, 613, L21Blondin, S., Davis, T. M., Krisciunas, K., Schmidt, B. P.,
Sollerman, J., Wood-Vasey, W. M., Becker, A. C., Challis, P.,Clocchiatti, A., Damke, G., Filippenko, A. V., Foley, R. J.,Garnavich, P. M., Jha, S. W., Kirshner, R. P., Leibundgut, B., Li,W., Matheson, T., Miknaitis, G., Narayan, G., Pignata, G., Rest,A., Riess, A. G., Silverman, J. M., Smith, R. C., Spyromilio, J.,Stritzinger, M., Stubbs, C. W., Suntzeff, N. B., Tonry, J. L.,Tucker, B. E., & Zenteno, A. 2008, ApJ, 682, 724
Blondin, S., Dessart, L., Leibundgut, B., Branch, D., Hoflich,P., Tonry, J. L., Matheson, T., Foley, R. J., Chornock, R.,Filippenko, A. V., Sollerman, J., Spyromilio, J., Kirshner, R. P.,Wood-Vasey, W. M., Clocchiatti, A., Aguilera, C., Barris, B.,Becker, A. C., Challis, P., Covarrubias, R., Davis, T. M.,Garnavich, P., Hicken, M., Jha, S., Krisciunas, K., Li, W., Miceli,A., Miknaitis, G., Pignata, G., Prieto, J. L., Rest, A., Riess,A. G., Salvo, M. E., Schmidt, B. P., Smith, R. C., Stubbs, C. W.,& Suntzeff, N. B. 2006, AJ, 131, 1648
Blondin, S. & Tonry, J. L. 2007, ApJ, 666, 1024Blondin, S., Walsh, J. R., Leibundgut, B., & Sainton, G. 2005,
A&A, 431, 757Branch, D., Fisher, A., & Nugent, P. 1993, AJ, 106, 2383Bronder, T. J., Hook, I. M., Astier, P., Balam, D., Balland, C.,
Basa, S., Carlberg, R. G., Conley, A., Fouchez, D., Guy, J.,Howell, D. A., Neill, J. D., Pain, R., Perrett, K., Pritchet, C. J.,Regnault, N., Sullivan, M., Baumont, S., Fabbro, S., Filliol, M.,Perlmutter, S., & Ripoche, P. 2008, A&A, 477, 717
Davis, T. M., Mortsell, E., Sollerman, J., Becker, A. C., Blondin,S., Challis, P., Clocchiatti, A., Filippenko, A. V., Foley, R. J.,Garnavich, P. M., Jha, S., Krisciunas, K., Kirshner, R. P.,Leibundgut, B., Li, W., Matheson, T., Miknaitis, G., Pignata,G., Rest, A., Riess, A. G., Schmidt, B. P., Smith, R. C.,Spyromilio, J., Stubbs, C. W., Suntzeff, N. B., Tonry, J. L.,Wood-Vasey, W. M., & Zenteno, A. 2007, ApJ, 666, 716
Dressler, A., Hare, T., Bigelow, B. C., & Osip, D. J. 2006,in Presented at the Society of Photo-Optical InstrumentationEngineers (SPIE) Conference, Vol. 6269, Ground-based andAirborne Instrumentation for Astronomy. Edited by McLean,Ian S.; Iye, Masanori. Proceedings of the SPIE, Volume 6269,pp. 62690F (2006).
Ellis, R. S., Sullivan, M., Nugent, P. E., Howell, D. A., Gal-Yam,A., Astier, P., Balam, D., Balland, C., Basa, S., Carlberg, R. G.,Conley, A., Fouchez, D., Guy, J., Hardin, D., Hook, I., Pain, R.,Perrett, K., Pritchet, C. J., & Regnault, N. 2008, ApJ, 674, 51
Faber, S. M., Phillips, A. C., Kibrick, R. I., Alcott, B., Allen, S. L.,Burrous, J., Cantrall, T., Clarke, D., Coil, A. L., Cowley, D. J.,Davis, M., Deich, W. T. S., Dietsch, K., Gilmore, D. K., Harper,C. A., Hilyard, D. F., Lewis, J. P., McVeigh, M., Newman, J.,Osborne, J., Schiavon, R., Stover, R. J., Tucker, D., Wallace, V.,Wei, M., Wirth, G., & Wright, C. A. 2003, in Instrument Designand Performance for Optical/Infrared Ground-based Telescopes.Edited by Iye, Masanori; Moorwood, Alan F. M. Proceedingsof the SPIE, Volume 4841, pp. 1657-1669 (2003)., ed. M. Iye &A. F. M. Moorwood, 1657–1669
Fabricant, D., Cheimets, P., Caldwell, N., & Geary, J. 1998, PASP,110, 79
Filippenko, A. V. 1988, AJ, 96, 1941—. 1997, ARA&A, 35, 309Filippenko, A. V. 2005, in Astrophysics and Space Science Library,
Vol. 332, White dwarfs: cosmological and galactic probes, ed.E. M. Sion, S. Vennes, & H. L. Shipman (Dordrecht: Springer),97–133
Filippenko, A. V., Matheson, T., & Ho, L. C. 1993, ApJ, 415,L103+
Filippenko, A. V., Richmond, M. W., Branch, D., Gaskell, M.,Herbst, W., Ford, C. H., Treffers, R. R., Matheson, T., Ho,L. C., Dey, A., Sargent, W. L. W., Small, T. A., & van Breugel,W. J. M. 1992a, AJ, 104, 1543
Filippenko, A. V., Richmond, M. W., Matheson, T., Shields, J. C.,Burbidge, E. M., Cohen, R. D., Dickinson, M., Malkan, M. A.,Nelson, B., Pietz, J., Schlegel, D., Schmeer, P., Spinrad, H.,Steidel, C. C., Tran, H. D., & Wren, W. 1992b, ApJ, 384, L15
Foley, R. J., Filippenko, A. V., Aguilera, C., Becker, A. C., Blondin,S., Challis, P., Clocchiatti, A., Covarrubias, R., Davis, T. M.,Garnavich, P. M., Jha, S. W., Kirshner, R. P., Krisciunas, K.,Leibundgut, B., Li, W., Matheson, T., Miceli, A., Miknaitis, G.,Pignata, G., Rest, A., Riess, A. G., Schmidt, B. P., Smith, R. C.,Sollerman, J., Spyromilio, J., Stubbs, C. W., Suntzeff, N. B.,Tonry, J. L., Wood-Vasey, W. M., & Zenteno, A. 2008, ApJ,684, 68
Foley, R. J., Papenkova, M. S., Swift, B. J., Filippenko, A. V., Li,W., Mazzali, P. A., Chornock, R., Leonard, D. C., & Van Dyk,S. D. 2003, PASP, 115, 1220
Galama, T. J., Vreeswijk, P. M., van Paradijs, J., Kouveliotou,C., Augusteijn, T., Bohnhardt, H., Brewer, J. P., Doublier, V.,Gonzalez, J.-F., Leibundgut, B., Lidman, C., Hainaut, O. R.,Patat, F., Heise, J., in’t Zand, J., Hurley, K., Groot, P. J.,Strom, R. G., Mazzali, P. A., Iwamoto, K., Nomoto, K., Umeda,H., Nakamura, T., Young, T. R., Suzuki, T., Shigeyama, T.,Koshut, T., Kippen, M., Robinson, C., de Wildt, P., Wijers,R. A. M. J., Tanvir, N., Greiner, J., Pian, E., Palazzi, E.,Frontera, F., Masetti, N., Nicastro, L., Feroci, M., Costa, E.,Piro, L., Peterson, B. A., Tinney, C., Boyle, B., Cannon, R.,Stathakis, R., Sadler, E., Begam, M. C., & Ianna, P. 1998,Nature, 395, 670

ESSENCE Spectroscopy: The First 4 Years 13
Garavini, G., Folatelli, G., Goobar, A., Nobili, S., Aldering, G.,Amadon, A., Amanullah, R., Astier, P., Balland, C., Blanc, G.,Burns, M. S., Conley, A., Dahlen, T., Deustua, S. E., Ellis,R., Fabbro, S., Fan, X., Frye, B., Gates, E. L., Gibbons, R.,Goldhaber, G., Goldman, B., Groom, D. E., Haissinski, J.,Hardin, D., Hook, I. M., Howell, D. A., Kasen, D., Kent, S., Kim,A. G., Knop, R. A., Lee, B. C., Lidman, C., Mendez, J., Miller,G. J., Moniez, M., Mourao, A., Newberg, H., Nugent, P. E.,Pain, R., Perdereau, O., Perlmutter, S., Prasad, V., Quimby, R.,Raux, J., Regnault, N., Rich, J., Richards, G. T., Ruiz-Lapuente,P., Sainton, G., Schaefer, B. E., Schahmaneche, K., Smith, E.,Spadafora, A. L., Stanishev, V., Walton, N. A., Wang, L., &Wood-Vasey, W. M. 2004, AJ, 128, 387
Garavini, G., Folatelli, G., Nobili, S., Aldering, G., Amanullah, R.,Antilogus, P., Astier, P., Blanc, G., Bronder, T., Burns, M. S.,Conley, A., Deustua, S. E., Doi, M., Fabbro, S., Fadeyev, V.,Gibbons, R., Goldhaber, G., Goobar, A., Groom, D. E., Hook,I., Howell, D. A., Kashikawa, N., Kim, A. G., Kowalski, M.,Kuznetsova, N., Lee, B. C., Lidman, C., Mendez, J., Morokuma,T., Motohara, K., Nugent, P. E., Pain, R., Perlmutter, S.,Quimby, R., Raux, J., Regnault, N., Ruiz-Lapuente, P., Sainton,G., Schahmaneche, K., Smith, E., Spadafora, A. L., Stanishev,V., Thomas, R. C., Walton, N. A., Wang, L., Wood-Vasey,W. M., & Yasuda, N. 2007, A&A, 470, 411
Glazebrook, K. & Bland-Hawthorn, J. 2001, PASP, 113, 197Guy, J., Astier, P., Baumont, S., Hardin, D., Pain, R., Regnault,
N., Basa, S., Carlberg, R. G., Conley, A., Fabbro, S., Fouchez, D.,Hook, I. M., Howell, D. A., Perrett, K., Pritchet, C. J., Rich, J.,Sullivan, M., Antilogus, P., Aubourg, E., Bazin, G., Bronder, J.,Filiol, M., Palanque-Delabrouille, N., Ripoche, P., & Ruhlmann-Kleider, V. 2007, A&A, 466, 11
Hook, I. M., Jørgensen, I., Allington-Smith, J. R., Davies, R. L.,Metcalfe, N., Murowinski, R. G., & Crampton, D. 2004, PASP,116, 425
Horne, K. 1986, PASP, 98, 609Howell, D. A., Sullivan, M., Perrett, K., Bronder, T. J., Hook,
I. M., Astier, P., Aubourg, E., Balam, D., Basa, S., Carlberg,R. G., Fabbro, S., Fouchez, D., Guy, J., Lafoux, H., Neill, J. D.,Pain, R., Palanque-Delabrouille, N., Pritchet, C. J., Regnault,N., Rich, J., Taillet, R., Knop, R., McMahon, R. G., Perlmutter,S., & Walton, N. A. 2005, ApJ, 634, 1190
Jha, S., Riess, A. G., & Kirshner, R. P. 2007, ApJ, 659, 122Kowalski, M., Rubin, D., Aldering, G., Agostinho, R. J., Amadon,
A., Amanullah, R., Balland, C., Barbary, K., Blanc, G., Challis,P. J., Conley, A., Connolly, N. V., Covarrubias, R., Dawson,K. S., Deustua, S. E., Ellis, R., Fabbro, S., Fadeyev, V., Fan,X., Farris, B., Folatelli, G., Frye, B. L., Garavini, G., Gates,E. L., Germany, L., Goldhaber, G., Goldman, B., Goobar, A.,Groom, D. E., Haissinski, J., Hardin, D., Hook, I., Kent, S.,Kim, A. G., Knop, R. A., Lidman, C., Linder, E. V., Mendez, J.,Meyers, J., Miller, G. J., Moniez, M., Mourao, A. M., Newberg,H., Nobili, S., Nugent, P. E., Pain, R., Perdereau, O., Perlmutter,S., Phillips, M. M., Prasad, V., Quimby, R., Regnault, N.,Rich, J., Rubenstein, E. P., Ruiz-Lapuente, P., Santos, F. D.,Schaefer, B. E., Schommer, R. A., Smith, R. C., Soderberg,A. M., Spadafora, A. L., Strolger, L.-G., Strovink, M., Suntzeff,N. B., Suzuki, N., Thomas, R. C., Walton, N. A., Wang, L.,Wood-Vasey, W. M., & Yun, J. L. 2008, ApJ, 686, 749
Leibundgut, B., Kirshner, R. P., Phillips, M. M., Wells, L. A.,Suntzeff, N. B., Hamuy, M., Schommer, R. A., Walker, A. R.,Gonzalez, L., Ugarte, P., Williams, R. E., Williger, G., Gomez,M., Marzke, R., Schmidt, B. P., Whitney, B., Coldwell, N.,Peters, J., Chaffee, F. H., Foltz, C. B., Rehner, D., Siciliano,L., Barnes, T. G., Cheng, K.-P., Hintzen, P. M. N., Kim, Y.-C., Maza, J., Parker, J. W., Porter, A. C., Schmidtke, P. C., &Sonneborn, G. 1993, AJ, 105, 301
Li, W., Filippenko, A. V., Chornock, R., Berger, E., Berlind, P.,Calkins, M. L., Challis, P., Fassnacht, C., Jha, S., Kirshner, R. P.,Matheson, T., Sargent, W. L. W., Simcoe, R. A., Smith, G. H.,& Squires, G. 2003, PASP, 115, 453
Li, W., Filippenko, A. V., Gates, E., Chornock, R., Gal-Yam, A.,Ofek, E. O., Leonard, D. C., Modjaz, M., Rich, R. M., Riess,A. G., & Treffers, R. R. 2001a, PASP, 113, 1178
Li, W., Filippenko, A. V., Treffers, R. R., Riess, A. G., Hu, J., &Qiu, Y. 2001b, ApJ, 546, 734
Matheson, T., Blondin, S., Foley, R. J., Chornock, R., Filippenko,A. V., Leibundgut, B., Smith, R. C., Sollerman, J., Spyromilio,J., Kirshner, R. P., Clocchiatti, A., Aguilera, C., Barris, B.,Becker, A. C., Challis, P., Covarrubias, R., Garnavich, P., Hicken,M., Jha, S., Krisciunas, K., Li, W., Miceli, A., Miknaitis, G.,Prieto, J. L., Rest, A., Riess, A. G., Salvo, M. E., Schmidt, B. P.,Stubbs, C. W., Suntzeff, N. B., & Tonry, J. L. 2005, AJ, 129,2352
Matheson, T., Filippenko, A. V., Ho, L. C., Barth, A. J., &Leonard, D. C. 2000, AJ, 120, 1499
Matheson, T., Kirshner, R. P., Challis, P., Jha, S., Garnavich,P. M., Berlind, P., Calkins, M. L., Blondin, S., Balog, Z.,Bragg, A. E., Caldwell, N., Dendy Concannon, K., Falco, E. E.,Graves, G. J. M., Huchra, J. P., Kuraszkiewicz, J., Mader, J. A.,Mahdavi, A., Phelps, M., Rines, K., Song, I., & Wilkes, B. J.2008, AJ, 135, 1598
Miknaitis, G., Pignata, G., Rest, A., Wood-Vasey, W. M., Blondin,S., Challis, P., Smith, R. C., Stubbs, C. W., Suntzeff, N. B.,Foley, R. J., Matheson, T., Tonry, J. L., Aguilera, C., Blackman,J. W., Becker, A. C., Clocchiatti, A., Covarrubias, R., Davis,T. M., Filippenko, A. V., Garg, A., Garnavich, P. M., Hicken,M., Jha, S., Krisciunas, K., Kirshner, R. P., Leibundgut, B., Li,W., Miceli, A., Narayan, G., Prieto, J. L., Riess, A. G., Salvo,M. E., Schmidt, B. P., Sollerman, J., Spyromilio, J., & Zenteno,A. 2007, ApJ, 666, 674
Oke, J. B., Cohen, J. G., Carr, M., Cromer, J., Dingizian, A.,Harris, F. H., Labrecque, S., Lucinio, R., Schaal, W., Epps, H.,& Miller, J. 1995, PASP, 107, 375
Perlmutter, S., Aldering, G., Goldhaber, G., Knop, R. A., Nugent,P., Castro, P. G., Deustua, S., Fabbro, S., Goobar, A., Groom,D. E., Hook, I. M., Kim, A. G., Kim, M. Y., Lee, J. C., Nunes,N. J., Pain, R., Pennypacker, C. R., Quimby, R., Lidman,C., Ellis, R. S., Irwin, M., McMahon, R. G., Ruiz-Lapuente,P., Walton, N., Schaefer, B., Boyle, B. J., Filippenko, A. V.,Matheson, T., Fruchter, A. S., Panagia, N., Newberg, H. J. M.,& Couch, W. J. 1999, ApJ, 517, 565
Phillips, M. M. 1993, ApJ, 413, L105Phillips, M. M., Wells, L. A., Suntzeff, N. B., Hamuy, M.,
Leibundgut, B., Kirshner, R. P., & Foltz, C. B. 1992, AJ, 103,1632
Poznanski, D., Maoz, D., Yasuda, N., Foley, R. J., Doi, M.,Filippenko, A. V., Fukugita, M., Gal-Yam, A., Jannuzi, B. T.,Morokuma, T., Oda, T., Schweiker, H., Sharon, K., Silverman,J. M., & Totani, T. 2007, MNRAS, 382, 1169
Riess, A. G., Filippenko, A. V., Challis, P., Clocchiatti, A., Diercks,A., Garnavich, P. M., Gilliland, R. L., Hogan, C. J., Jha, S.,Kirshner, R. P., Leibundgut, B., Phillips, M. M., Reiss, D.,Schmidt, B. P., Schommer, R. A., Smith, R. C., Spyromilio, J.,Stubbs, C., Suntzeff, N. B., & Tonry, J. 1998, AJ, 116, 1009
Riess, A. G., Press, W. H., & Kirshner, R. P. 1996, ApJ, 473, 88Riess, A. G., Strolger, L.-G., Casertano, S., Ferguson, H. C.,
Mobasher, B., Gold, B., Challis, P. J., Filippenko, A. V., Jha,S., Li, W., Tonry, J., Foley, R., Kirshner, R. P., Dickinson, M.,MacDonald, E., Eisenstein, D., Livio, M., Younger, J., Xu, C.,Dahlen, T., & Stern, D. 2007, ApJ, 659, 98
Schmidt, G. D., Weymann, R. J., & Foltz, C. B. 1989, PASP, 101,713
Strolger, L.-G., Smith, R. C., Suntzeff, N. B., Phillips, M. M.,Aldering, G., Nugent, P., Knop, R., Perlmutter, S., Schommer,R. A., Ho, L. C., Hamuy, M., Krisciunas, K., Germany, L. M.,Covarrubias, R., Candia, P., Athey, A., Blanc, G., Bonacic, A.,Bowers, T., Conley, A., Dahlen, T., Freedman, W., Galaz, G.,Gates, E., Goldhaber, G., Goobar, A., Groom, D., Hook, I. M.,Marzke, R., Mateo, M., McCarthy, P., Mendez, J., Muena, C.,Persson, S. E., Quimby, R., Roth, M., Ruiz-Lapuente, P., Seguel,J., Szentgyorgyi, A., von Braun, K., Wood-Vasey, W. M., &York, T. 2002, AJ, 124, 2905
Tonry, J. L., Schmidt, B. P., Barris, B., Candia, P., Challis, P.,Clocchiatti, A., Coil, A. L., Filippenko, A. V., Garnavich, P.,Hogan, C., Holland, S. T., Jha, S., Kirshner, R. P., Krisciunas,K., Leibundgut, B., Li, W., Matheson, T., Phillips, M. M., Riess,A. G., Schommer, R., Smith, R. C., Sollerman, J., Spyromilio,J., Stubbs, C. W., & Suntzeff, N. B. 2003, ApJ, 594, 1
Turatto, M. 2003, in Lecture Notes in Physics, Berlin SpringerVerlag, Vol. 598, Supernovae and Gamma-Ray Bursters, ed.K. Weiler, 21–36
Wade, R. A. & Horne, K. 1988, ApJ, 324, 411

14 Foley et al.
Wood-Vasey, W. M., Miknaitis, G., Stubbs, C. W., Jha, S., Riess,A. G., Garnavich, P. M., Kirshner, R. P., Aguilera, C., Becker,A. C., Blackman, J. W., Blondin, S., Challis, P., Clocchiatti, A.,Conley, A., Covarrubias, R., Davis, T. M., Filippenko, A. V.,Foley, R. J., Garg, A., Hicken, M., Krisciunas, K., Leibundgut,B., Li, W., Matheson, T., Miceli, A., Narayan, G., Pignata, G.,Prieto, J. L., Rest, A., Salvo, M. E., Schmidt, B. P., Smith, R. C.,Sollerman, J., Spyromilio, J., Tonry, J. L., Suntzeff, N. B., &Zenteno, A. 2007, ApJ, 666, 694

ESSE
NC
ESpectro
scopy:
The
First
4Yea
rs15
TABLE 2ESSENCE SPECTROSCOPIC TARGETS
ESSENCE IDa IAUC IDb UT Date Telescope Typec Subtype z z Template Phase Phase ∆ Disc. Exp.(Gal)d (SNID)e (SNID) (d) (LC) (d) Mag. (s)
a002.wxc1 04 · · · 2002-12-06.03 VLT Gal · · · 0.315 · · · · · · · · · · · · · · · · · · 900b001.wxc1 14 · · · 2002-11-03.23 MMT Unk · · · · · · · · · · · · · · · · · · · · · · · · 1800b001.wxc1 14 · · · 2002-11-06.27 KII/ESI Unk · · · · · · · · · · · · · · · · · · · · · · · · 1600b001.wxc1 14 · · · 2002-11-11.32 KI/LRIS Unk · · · · · · · · · · · · · · · · · · · · · · · · 1800b001.wxc1 14 · · · 2002-12-05.26 GMOS Unk · · · · · · · · · · · · · · · · · · · · · · · · 2x1800b002.wxh1 01 · · · 2002-11-01.44 KII/ESI Star · · · · · · · · · · · · · · · · · · · · · · · · 900b003.wxh1 14 2002iu 2002-11-01.43 KII/ESI Ia norm · · · 0.115 (0.005) 1999ee −3.8 (3.2) · · · · · · · · · 600b004.wxt2 06 2002iv 2002-11-02.45 KII/ESI Ia 91T 0.231 0.226 (0.006) 2005eq −4.9 (1.6) · · · · · · · · · 1200b005.wxd1 11 2002iw 2002-11-03.16 MMT Gal · · · 0.205 · · · · · · · · · · · · · · · · · · 3x1800b005.wxd1 11 2002iw 2002-11-06.32 KII/ESI Gal · · · 0.205 · · · · · · · · · · · · · · · · · · 1800b006.wxb1 16 2002ix 2002-11-03.10 MMT N.S. · · · · · · · · · · · · · · · · · · · · · 21.7 · · ·
b006.wxb1 16 2002ix 2002-11-06.24 KII/ESI II? · · · · · · · · · · · · · · · · · · · · · 21.7 1800b008.wxc1 05 2002jq 2002-11-06.29 KII/ESI Ia · · · · · · · · · · · · · · · · · · · · · · · · 1800b008.wxc1 05 2002jq 2002-12-04.27 GMOS Ia norm · · · 0.473 (0.003) 1990N 14.5 (2.4) · · · · · · · · · 4x1800b010.wxv2 07 2002iy 2002-11-06.39 KII/ESI Ia · · · · · · 0.587 (0.006) 2000cx −4.2 (1.6) −7.8 (1.7) −0.166 23.0 1800b010.wxv2 07 2002iy 2002-11-11.45 KI/LRIS Ia · · · · · · · · · · · · · · · −2.8 (1.7) −0.166 23.0 1800b010.wxv2 07 2002iy 2002-12-06.35 GMOS Ia norm · · · 0.587 (0.007) 1999ee 11.1 (5.4) 22.2 (1.7) −0.166 23.0 5x1800b010.wxv2 07 2002iy 2002-12-07.22 VLT Ia norm · · · 0.587 (0.007) 1999ee 11.1 (5.4) 23.2 (1.7) −0.166 23.0 2x1800b013.wxv2 10 2002iz 2002-11-06.45 KII/ESI Ia norm 0.427 0.425 (0.005) 1994D −2.0 (1.5) −1.3 (1.1) 0.034 22.2 1800b013.wxv2 10 2002iz 2002-12-06.07 VLT Ia norm 0.427 0.428 (0.004) 1995D 17.0 (1.8) 28.7 (1.1) 0.034 22.2 1800+71b014.wxv2 15 · · · 2002-11-06.41 KII/ESI Gal · · · 0.268 · · · · · · · · · · · · · · · 22.5 1800b015.wcx1 09 · · · 2002-11-06.34 KII/ESI Gal · · · 0.207 · · · · · · · · · · · · · · · · · · 1800b016.wxb1 15 2002ja 2002-11-09.33 KII/ESI Ia norm · · · 0.325 (0.002) 2005hj 2.5 (4.9) 0.2 (1.7) 0.190 22.2 1200b017.wxb1 06 2002jb 2002-11-09.31 KII/ESI Ia norm · · · 0.260 (0.006) 2002bo −2.5 (2.9) · · · · · · 21.4 1200b019.wxd1 04 · · · 2002-11-09.35 KII/ESI Gal · · · 0.213 · · · · · · · · · · · · · · · · · · 1200b020.wye2 01 2002jr 2002-11-09.42 KII/ESI Ia norm · · · 0.424 (0.004) 2004dt −4.6 (2.7) −11.9 (0.6) 0.059 22.2 1800b020.wye2 01 2002jr 2002-12-09.39 GMOS Ia · · · · · · 0.428 (0.004) 2001eh 8.9 (1.1) 18.1 (0.6) 0.059 22.2 2x1800b022.wyc3 03 2002jc 2002-11-09.45 KII/ESI Ia · · · · · · · · · · · · · · · · · · · · · 22.4 1800b022.wyc3 03 2002jc 2002-12-05.39 GMOS Ia norm · · · 0.528 (0.005) 1995E 6.9 (1.8) · · · · · · 22.4 4x1800b023.wxu2 09 2002js 2002-11-11.57 KI/LRIS Ia · · · · · · · · · · · · · · · · · · · · · · · · 2100b023.wxu2 09 2002js 2002-12-03.41 GMOS Ia norm · · · 0.541 (0.005) 2004eo 5.5 (2.2) · · · · · · · · · 4x1800b024.wxc1 16 · · · 2002-11-11.27 KI/LRIS Star · · · 0.000 · · · · · · · · · · · · · · · · · · 1800b025.wxa1 05 · · · 2002-11-11.29 KI/LRIS N.S. · · · · · · · · · · · · · · · · · · · · · · · · 1800b026.wxk1 05 · · · 2002-11-11 KI/LRIS N.S. · · · · · · · · · · · · · · · · · · · · · · · · · · ·
b027.wxm1 16 2002jd 2002-11-11.45 KI/LRIS Ia norm · · · 0.315 (0.007) 2006ax −3.5 (4.7) · · · · · · · · · 3600,1800k
b027.wxm1 16 2002jd 2002-12-08.07 VLT Ia · · · · · · · · · · · · · · · · · · · · · · · · 1091b027.wxm1 16 2002jd 2002-12-09.27 GMOS Ia · · · · · · · · · · · · · · · · · · · · · · · · 4x1800c002.wxp1 14 · · · 2002-12-01 Clay N.S. · · · · · · · · · · · · · · · · · · · · · · · · · · ·
c002.wxp1 14 · · · 2002-12-03 GMOS N.S. · · · · · · · · · · · · · · · · · · · · · · · · · · ·
c003.wxh1 15 2002jt 2002-12-02.13 Clay Ia · · · · · · 0.570 (0.007) 2001eh 1.0 (3.5) · · · · · · · · · 2x1800c003.wxh1 15 2002jt 2002-12-07.29 GMOS Ia · · · · · · · · · · · · · · · · · · · · · · · · 3x1800c005.wxb1 10 · · · 2002-12-06.05 VLT AGN · · · 0.249 · · · · · · · · · · · · · · · · · · 900c012.wxu2 16l 2002ju 2002-12-03.15 Clay Ia · · · 0.348 0.349 (0.005) 2000E −2.5 (2.7) · · · · · · · · · 2x1800c012.wxu2 16l 2002ju 2002-12-04.43 GMOS Ia · · · 0.348 0.349 (0.005) 2000E −2.5 (2.7) · · · · · · · · · 3x1200c012.wxu2 16 2002ju 2003-01-05.33 KII/ESI Ia · · · 0.348 · · · · · · · · · · · · · · · · · · 1800c013.wxm1 13 · · · 2002-12-05 GMOS N.S. · · · · · · · · · · · · · · · · · · · · · · · · · · ·
c014.wyb3 03 2002jv 2002-12-07.12 VLT Gal · · · 0.221 · · · · · · · · · · · · · · · 22.4 2x1800c014.wyb3 03 2002jv 2003-01-04.28 GMOS Gal · · · 0.221 · · · · · · · · · · · · · · · 22.4 4x1800c015.wxv2 02 2002jw 2002-12-07.18 VLT Ia norm 0.357 0.356 (0.007) 2003du −2.8 (2.8) · · · · · · 22.7 2x1800c015.wxv2 02 2002jw 2003-01-05.37 KII/ESI Ia · · · 0.357 · · · · · · · · · · · · · · · 22.7 2400c016.wxm1 04 · · · 2002-12-07.07 VLT Gal · · · 0.845 · · · · · · · · · · · · · · · · · · 2x1800c020.wxt2 15 · · · 2003-01-05.30 KII/ESI Unk · · · · · · · · · · · · · · · · · · · · · · · · 2x900c020.wxt2 15 · · · 2003-01-10.11 VLT Unk · · · · · · · · · · · · · · · · · · · · · · · · 2x1800

16
Foley
etal.
TABLE 2 — Continued
ESSENCE IDa IAUC IDb UT Date Telescope Typec Subtype z z Template Phase Phase ∆ Disc. Exp.(Gal)d (SNID)e (SNID) (d) (LC) (d) Mag. (s)
c022.wxu2 15 · · · 2003-01-04.09 Clay Ib IIb 0.213 0.211 (0.004) 1997dd 7.4 (13.8) · · · · · · · · · 2x1200c023.wxm1 15 · · · 2003-01-03.07 Clay Ia norm 0.399 0.412 (0.001) 1999ee · · · · · · · · · · · · 2x1200c024.wxv2 05 · · · 2003-01-03.12 Clay Gal · · · 0.317 · · · · · · · · · · · · · · · 22.8 1800c025.wxb1 14 · · · 2003-01-04.05 Clay AGN · · · 0.362 · · · · · · · · · · · · · · · 19.7 600c028.wxu2 16 · · · 2003-01-04.13 Clay AGN · · · 2.020 · · · · · · · · · · · · · · · · · · 1800d009.waa6 16m · · · 2003-10-29.11 VLT Ia 91T 0.354 0.351 (0.002) 1998ab 22.7 (14.5) · · · · · · · · · 1800d106.waa6 16m · · · 2003-10-31.01 VLT Ia · · · 0.353 · · · · · · · · · · · · · · · · · · 1800d010.waa6 16 2003jp 2003-10-30.03 VLT Ic norm 0.083 0.080 (0.001) 1991A · · · · · · · · · · · · 2x1800d029.waa6 13 · · · 2003-10-29.03 VLT AGN · · · 2.583 · · · · · · · · · · · · · · · · · · 2x1800d033.waa6 10 2003jo 2003-10-29.09 VLT Ia norm 0.526 0.530 (0.007) 2002er 2.0 (2.8) 7.7 (1.2) −0.322 23.1 2x1800d033.waa6 10 2003jo 2003-11-23.05 VLT Ia norm 0.526 0.530 (0.007) 2002er 2.0 (2.8) 32.7 (1.2) −0.322 23.1 1800+900d034.waa7 10 · · · 2003-10-28.29 GMOS AGN · · · 2.280 · · · · · · · · · · · · · · · · · · 2x1200d051.wcc8 2 · · · 2003-10-30.22 VLT Gal · · · 0.382 · · · · · · · · · · · · · · · · · · 1800d057.wbb6 3 2003jk 2003-10-30.15 VLT Unk · · · · · · · · · · · · · · · · · · · · · 22.2 2x1800d058.wbb6 3 2003jj 2003-10-31.07 VLT Ia norm 0.584 0.589 (0.009) 1981B −0.9 (2.3) 2.2 −0.470 22.8 2x1800d059.wcc5 3 · · · 2003-10-29.17 VLT Gal · · · 0.207 · · · · · · · · · · · · · · · 22.5 2x1800d060.wcc7 3 · · · 2003-10-30.35 VLT Star · · · · · · · · · · · · · · · · · · · · · · · · 1800d062.wcc9 3 · · · 2003-10-29.26 VLT AGN · · · 2.432 · · · · · · · · · · · · · · · · · · 1800+368d083.wdd9 12 2003jn 2003-10-29.29 VLT Ia 91T · · · 0.333 (0.001) 1998ab −6.4 (1.9) 5.3 (0.6) −0.273 20.7 1800d084.wdd9 11 2003jm 2003-10-30.19 VLT Ia norm 0.522 0.516 (0.006) 1996X 3.6 (2.8) 5.8 (1.2) −0.197 22.9 1800d085.waa5 16 2003jv 2003-10-28.37 GMOS Ia · · · 0.405 0.401 (0.008) 2005hj 1.0 (2.5) 0.5 (0.6) −0.228 22.0 3x1200d086.waa5 3 2003ju 2003-10-27.06 GMOS Ia norm · · · 0.211 (0.001) 1990N · · · −5.4 (0.3) −0.177 21.0 3x600d086.waa5 3 2003ju 2003-11-27.10 Baade Ia · · · · · · 0.203 (0.003) 1999aw 19.5 (4.3) 25.6 (0.3) −0.177 21.0 3x1800d087.wbb5 4 2003jr 2003-11-01.18 GMOS Ia norm 0.340 0.337 (0.004) 1994D 15.1 (2.4) 20.0 (1.7) −0.112 21.6 3x600d089.wdd6 8 2003jl 2003-10-31.34 VLT Ia norm · · · 0.425 (0.004) 1994ae 10.1 (1.0) 14.8 (1.5) −0.198 22.0 1800d091.wcc1 2 · · · 2003-10-29.22 VLT Unk · · · · · · · · · · · · · · · · · · · · · 23.6 2x1800d093.wdd5 3o 2003js 2003-10-29.96 VLT Ia 91T 0.363 0.359 (0.004) 1998es −5.1 (1.7) −4.3 (0.3) −0.365 21.6 923+600e142.wdd5 3o 2003js 2003-11-23.21 VLT Ia · · · 0.363 0.368 (0.005) 1995D +12 · · · · · · 21.6 3x1200d097.wdd5 10 2003jt 2003-10-29.32 VLT Ia · · · · · · 0.434 (0.007) 2001eh 3.1 (1.7) 6.6 −0.317 21.9 1800d099.wcc2 16 2003ji 2003-11-01.23 GMOS Ia norm · · · 0.210 (0.002) 2000fa 18.3 (1.8) 22.9 (1.6) −0.110 21.0 3x600d100.waa7 16 2003jq 2003-10-24.21 FLWO Ia norm · · · 0.158 (0.003) 1994D 24.7 (9.9) · · · · · · 19.6 2x1800d115.wbb6 11 · · · 2003-10-28.43 GMOS Unk · · · · · · · · · · · · · · · · · · · · · 21.8 1200d117.wdd8 16 2003jw 2003-10-30.32 VLT Ia norm 0.297 0.301 (0.005) 2002bo −4.5 (2.8) −5.9 (0.4) 0.298 22.1 1800d120.wcc1 2 · · · 2003-10-31.48 VLT AGN · · · 1.280 · · · · · · · · · · · · · · · · · · 1800d123.wcc9 16 · · · 2003-10-30.27 VLT Gal · · · 0.500 · · · · · · · · · · · · · · · · · · 2x1800d124.wcc9 15 · · · 2003-10-31.26 VLT AGN · · · 0.609 · · · · · · · · · · · · · · · · · · 1800+1341d149.wcc4 11 2003jy 2003-10-31.10 VLT Ia norm 0.339 0.338 (0.008) 1990O −7.0 (1.8) −10.5 (0.3) −0.214 21.9 1800d150.wcc1 12 · · · 2003-10-31.31 VLT Gal · · · 0.191 · · · · · · · · · · · · · · · · · · 1800d156.wcc2 4 2003jx 2003-10-31.15 VLT Unk · · · · · · · · · · · · · · · · · · · · · · · · 2x1800e018.wbb7 2 · · · 2003-11-19.05 Clay AGN · · · 0.181 · · · · · · · · · · · · · · · > 24 600e020.waa6 9 2003kk 2003-11-19.11 Clay Ia norm 0.164 0.159 (0.006) 2002er −2.5 (3.8) −2.3 (0.4) −0.034 24.0 3x300e022.wbb7 12 2003kj 2003-11-22.03 VLT II IIP 0.078 0.078 (0.004) 2005cs 4.0 (1.2) · · · · · · > 24 1800+900e025.wdd3 15 · · · 2003-11-19.21 Clay Gal · · · 0.180 · · · · · · · · · · · · · · · 22.6 3x1200e027.wcc7 16 · · · 2003-11-21.16 VLT Unk · · · · · · · · · · · · · · · · · · · · · 23.5 3x1200e029.wbb3 15p 2003kl 2003-11-19.14 Clay Ia norm 0.335 0.332 (0.007) 1990N −4.4 (4.6) −1.9 (0.7) 0.219 22.0 3x600e121.wbb3 15p 2003kl 2003-11-22.11 Clay Ia · · · 0.335 0.326 (0.006) 1981B −1 · · · · · · 22.0 3x1200e103.wbb9 2 · · · 2003-11-21.05 VLT Unk · · · · · · · · · · · · · · · · · · · · · > 24 2x1800e106.wbb6 11 · · · 2003-11-20.14 Clay Unk · · · 0.321 · · · · · · · · · · · · · · · 21.8 3x1200e108.wdd8 4 2003km 2003-11-21.21 VLT Ia norm · · · 0.472 (0.007) 1990O −6.7 (2.7) −14.6 (0.4) −0.280 22.2 2x1800e118.waa5 11 · · · 2003-11-22.03 VLT AGN · · · 0.557 · · · · · · · · · · · · · · · 21.7 2x1200e119.wbb1 7 · · · 2003-11-23.19 VLT Gal · · · 0.558 · · · · · · · · · · · · · · · 22.5 1800+600e120.waa5 9 · · · 2003-11-22.05 Clay Gal · · · 0.298 · · · · · · · · · · · · · · · 23.2 1200e132.wcc1 7 2003kn 2003-11-22.08 VLT Ia norm 0.244 0.234 (0.006) 2003du −6.4 (1.6) −6.6 (0.3) −0.128 21.4 2x1800e133.wcc1 7 · · · 2003-11-22.08 VLT Gal · · · 0.244 · · · · · · · · · · · · · · · 22.6 2x1800e136.wcc1 12 2003ko 2003-11-22.13 VLT Ia norm 0.361 0.346 (0.007) 2000cf 3.1 (4.1) −1.3 (0.5) 0.332 22.1 2x1800

ESSE
NC
ESpectro
scopy:
The
First
4Yea
rs17
TABLE 2 — Continued
ESSENCE IDa IAUC IDb UT Date Telescope Typec Subtype z z Template Phase Phase ∆ Disc. Exp.(Gal)d (SNID)e (SNID) (d) (LC) (d) Mag. (s)
e138.wdd4 1 2003kt 2003-11-23.10 VLT Ia norm · · · 0.611 (0.006) 1995D 5.3 (0.8) 10.8 (0.6) −0.284 23.2 3x1200e140.wdd5 15 2003kq 2003-11-22.29 VLT Ia norm 0.606 0.614 (0.006) 2006ax −3.2 (2.8) −2.1 −0.187 22.7 3x1200e141.wdd7 2 · · · 2003-11-22.16 Clay Ib IIb 0.099 0.084 (0.001) 1996cb 6.0 (5.4) · · · · · · 21.0 2x1200e143.wdd7 3 · · · 2003-11-23.15 VLT Unk · · · 0.110 · · · · · · · · · · · · · · · 22.0 2x1200e147.wdd5 9 2003kp 2003-11-22.18 VLT Ia norm · · · 0.641 (0.008) 2003du −1.1 (3.1) 2.0 (1.2) −0.174 22.7 2x1800e148.wdd5 10 2003kr 2003-11-22.23 VLT Ia norm · · · 0.429 (0.006) 1999ee −6.7 (1.7) −9.9 (0.4) −0.107 22.1 3x1200e149.wdd5 10 2003ks 2003-11-23.28 VLT Ia norm · · · 0.491 (0.006) 2006lf 11.5 (4.3) 16.2 (0.4) 0.016 22.5 3x1200e309.waa9 14 · · · 2003-11-23.32 GMOS Star · · · · · · · · · · · · · · · · · · · · · 22.6 3x1200e315.wbb9 3 2003ku 2003-11-24.31 GMOS Ia? · · · · · · 0.81 (0.01) · · · · · · · · · · · · > 24 3x1200e418.wcc2 8 · · · 2003-11-27 Baade N.S. · · · · · · · · · · · · · · · · · · · · · 23.0 · · ·
e501.waa1 1 · · · 2003-11-28 Baade N.S. · · · · · · · · · · · · · · · · · · · · · 23.2 · · ·
e504.waa3 4 · · · 2003-11-29.05 Baade AGN · · · 0.674 · · · · · · · · · · · · · · · 23.6 3x1800e510.waa1 13 · · · 2003-11-29.08 GMOS Unk · · · · · · · · · · · · · · · · · · · · · > 24 1800e528.wcc5 3 · · · 2003-11-28 Baade N.S. · · · · · · · · · · · · · · · · · · · · · > 24 · · ·
e529.wcc5 3 · · · 2003-11-29.10 Clay Unk · · · · · · · · · · · · · · · · · · · · · > 24 3x1800e531.wcc1 4 2003kv 2003-11-29.14 Baade Ia? · · · · · · 0.79 (0.01) · · · · · · · · · · · · 23.1 3x1800f001.wbb7 1 2003lg 2003-12-19.17 MMT II IIP · · · 0.173 (0.004) 2004et 24.0 (4.0) · · · · · · > 24 3x1800f011.wcc7 12 2003lh 2003-12-21.31 KI/LRIS Ia norm · · · 0.536 (0.006) 1990N 3.1 (1.8) 12.3 (1.8) −0.090 22.7 1500f017.wbb9 10 · · · 2003-12-20.33 GMOS AGN · · · 0.725 · · · · · · · · · · · · · · · 22.1 3x1200f041.wbb6 8 2003le 2003-12-20.23 KI/LRIS Ia norm · · · 0.558 (0.007) 1989B 1.9 (3.7) 7.8 (0.6) −0.301 · · · 2x1200f044.wbb8 8 · · · 2003-12-21.10 MMT Gal · · · 0.409 · · · · · · · · · · · · · · · > 24 3x1800f076.wbb9 01 2003lf 2003-12-21.29 KI/LRIS Ia norm · · · 0.411 (0.006) 1994D 1.2 (2.9) 4.6 (0.8) 0.175 · · · 900f076.wbb9 01 2003lf 2003-12-21.17 MMT Ia norm · · · 0.411 (0.006) 1994D 1.2 (2.9) 4.6 (0.8) 0.175 · · · 3x900f095.wcc2 8 · · · 2003-12-20.31 KI/LRIS Gal · · · 0.313 · · · · · · · · · · · · · · · 23.6 3x1200f096.waa3 3 2003lm 2003-12-21.28 KI/LRIS Ia · · · 0.408 0.413 (0.004) 2003du 2.0 (1.6) 5.4 (2.0) 0.171 · · · 1500f116.wbb1 7 · · · 2003-12-20 KI/LRIS N.S. · · · · · · · · · · · · · · · · · · · · · · · · · · ·
f123.wcc1 7 · · · 2003-12-21.34 KI/LRIS Ia? · · · 0.526 0.53 (0.01) · · · · · · · · · · · · 23.0 2x1200f213.wbb4 12 · · · 2003-12-19.34 GMOS Unk · · · · · · · · · · · · · · · · · · · · · 22.6 2x1200f216.wdd4 15 2003ll 2003-12-21.44 KI/LRIS Ia norm 0.596 0.595 (0.011) 2003cg 7.9 (4.7) 9.9 (0.8) −0.104 · · · 1800f221.wcc4 14 2003lk 2003-12-21.36 KI/LRIS Gal · · · 0.442 · · · · · · · · · · · · · · · · · · 1500f231.waa1 13 2003ln 2003-12-21.25 KI/LRIS Ia · · · · · · 0.620 (0.008) 2001eh 5.0 (2.5) 9.4 (0.4) −0.247 23.4 1500f235.wbb5 13 2003lj 2003-12-20.27 KI/LRIS Ia · · · 0.417 0.422 (0.006) 1994ae 3.3 (2.0) 5.1 (0.5) 0.165 21.6 2x1200f244.wdd3 8 2003li 2003-12-20.42 KI/LRIS Ia norm 0.544 0.546 (0.005) 2005el 5.4 (2.5) 8.4 (1.6) −0.020 22.7 2x1800f301.wdd6 1 · · · 2003-12-21.42 KI/LRIS Ia · · · · · · 0.514 (0.011) 2006le · · · · · · · · · · · · 1500f304.wdd6 2 · · · 2003-12-21.39 KI/LRIS Unk · · · · · · · · · · · · · · · · · · · · · · · · 1800f308.wdd6 10 · · · 2003-12-20.37 KI/LRIS Ia · · · · · · 0.388 (0.010) 1999aa · · · · · · · · · · · · 3x1800f441.wbb6 7 · · · 2003-12-23.25 GMOS Unk · · · · · · · · · · · · · · · · · · · · · · · · 3x1200g001.waa1 1 2004fi 2004-10-18.489 KI/LRIS Gal · · · 0.265 · · · · · · · · · · · · · · · · · · 900g004.wbb4 14 · · · 2004-11-11.176 Clay Ic norm · · · 0.143 (0.006) 2004aw · · · · · · · · · · · · 2x600g005.waa2 13 2004fh 2004-10-18.502 KI/LRIS Ia · · · · · · 0.218 (0.007) 1998es 1.8 (0.8) 2.9 (0.4) −0.253 · · · 900g009.wbb4 13 · · · 2004-10-21.272 GMOS Gal · · · 0.183 · · · · · · · · · · · · · · · · · · 3x1800g009.wbb4 13 · · · 2004-11-11.119 Clay Unk · · · 0.183 · · · · · · · · · · · · · · · · · · 600g014.wbb1 6 · · · 2004-11-11.075 Clay Unk · · · 0.195 · · · · · · · · · · · · · · · 22.5 2x600g043.wbb6 16 2004fj 2004-10-18.566 KI/LRIS II IIP 0.187 0.190 (0.002) 1999em 6.4 (2.3) · · · · · · 21.6 1800g046.wcc9 14 · · · 2004-12-17.177 Clay Gal · · · 0.184 · · · · · · · · · · · · · · · 20.6 3x600,2x600g050.waa7 10 2004fn 2004-10-21.158 GMOS Ia norm 0.605 0.616 (0.008) 2003du −4.4 (2.9) −1.6 (0.6) −0.318 23.5 3x1800g052.waa8 7 2004fm 2004-10-18.393 KI/LRIS Ia norm · · · 0.384 (0.006) 2002ha 2.8 (2.2) 0.5 (0.4) 0.382 22.5 1800g053.waa8 7 2004fl 2004-10-18.393 KI/LRIS Ia? · · · 0.632 · · · · · · · · · · · · · · · 22.8 1800g055.wbb7 7 2004fk 2004-10-17.373 GMOS Ia norm 0.296 0.302 (0.006) 2002er 5.3 (1.7) 6.8 (1.1) −0.294 22.3 4x1800g097.waa8 16 · · · 2004-11-03.055 Clay Ia norm 0.343 0.339 (0.004) 1994D 11.9 (1.7) 14.3 (0.4) −0.289 23.1 1200, 1800g108.wdd8 4 2004fp 2004-10-17.489 GMOS II IIP · · · 0.162 (0.004) 1992H 49.0 (36.7) · · · · · · 22.1 3x1800g120.wbb1 1 2004fo 2004-10-18.528 KI/LRIS Ia · · · · · · 0.506 (0.007) 1999aw −1.1 (4.7) −1.4 (0.7) −0.286 22.3 1800g128.waa2 5 · · · 2004-11-10.271 GMOS II? · · · 0.164 · · · · · · · · · · · · · · · 23.5 5x1800g133.wcc4 7 · · · 2004-11-09.428 GMOS Ia norm · · · 0.420 (0.002) 2006ac 37.9 (5.1) 27.8 (1.9) −0.351 21.8 5x1800g142.waa2 11 · · · 2004-11-06.028 Clay Ia · · · 0.404 0.398 (0.001) 1994Q · · · 19.7 (0.8) 0.210 22.9 2x1200

18
Foley
etal.
TABLE 2 — Continued
ESSENCE IDa IAUC IDb UT Date Telescope Typec Subtype z z Template Phase Phase ∆ Disc. Exp.(Gal)d (SNID)e (SNID) (d) (LC) (d) Mag. (s)
g151.waa2 14 2004fq 2004-10-18.443 KI/LRIS Gal · · · 0.146 · · · · · · · · · · · · · · · 21.3 1200g160.wdd8 15 2004fs 2004-10-19.535 GMOS Ia · · · · · · 0.507 (0.019) 1997br · · · 14.6 (0.6) −0.308 22.4 3x1800g166.wdd9 14 2004fr 2004-10-18.593 KI/LRIS Gal · · · 0.202 · · · · · · · · · · · · · · · 22.1 2000+1800g181.wdd9 2 · · · 2004-11-11.154 Clay Unk · · · 0.533 · · · · · · · · · · · · · · · 22.7 3x600g185.waa2 1 · · · 2004-10-18.448 KI/LRIS II IIP · · · 0.330 (0.005) 1999em 11.1 (12.8) · · · · · · 23.3 2400,2x1200g199.wdd4 7 2004ft 2004-10-18.621 KI/LRIS Gal · · · 0.766 · · · · · · · · · · · · · · · 23.0 2100g204.wcc2 13 · · · 2004-11-11.099 Clay Unk · · · 0.114 · · · · · · · · · · · · · · · > 24 3x600g213.wbb8 6 · · · 2004-11-11.197 GMOS Gal · · · 0.843 · · · · · · · · · · · · · · · 22.8 3x1800g219.wbb9 10 · · · 2004-11-19.090 GMOS II? · · · · · · · · · · · · · · · · · · · · · 22.4 5x1800g225.waa5 2 · · · 2004-11-08.282 GMOS Ia norm · · · 0.579 (0.009) 1994T · · · · · · · · · > 24 4x1800g230.wbb5 5 · · · 2004-11-14.313 KI/LRIS Ia · · · 0.392 0.394 (0.001) 1999aw 5.1 (3.7) · · · · · · 22.8 1200g240.waa1 14 · · · 2004-11-14.276 KI/LRIS Ia norm · · · 0.689 (0.005) 1994ae 10.1 (1.0) 16.3 (0.7) −0.163 24.0 1800g276.wcc1 7 · · · 2004-12-16.152 Clay Gal · · · 0.000 · · · · · · · · · · · · · · · 21.6 1200h280.wbb6 10 · · · 2004-11-14.296 KI/LRIS II IIL 0.262 0.252 (0.001) 1990K · · · · · · · · · 21.5 1200h283.wcc9 5 2004ha 2004-11-14.335 KI/LRIS Ia norm · · · 0.495 (0.007) 1993ac 4.9 (3.0) 2.2 (1.1) 0.090 22.5 1800h293.wcc9 2 · · · 2004-11-14.360 KI/LRIS Unk · · · 0.546 · · · · · · · · · · · · · · · 23.4 1800h296.wdd6 12 · · · 2004-11-11.057 Clay Gal · · · 0.059 · · · · · · · · · · · · · · · > 24 600h299.wcc8 15 2004hb 2004-11-11.366 GMOS Gal · · · 0.720 · · · · · · · · · · · · · · · 23.9 4x1800h300.wdd8 15 · · · 2004-11-14.532 KI/LRIS Ia norm · · · 0.656 (0.001) 1993ac · · · 14.4 (0.7) −0.279 23.2 1800h304.wcc1 2 · · · 2004-12-01.083 Baade Gal · · · · · · · · · · · · · · · · · · · · · 22.1 2x600h311.waa3 4 2004hc 2004-11-14.249 KI/LRIS Ia · · · · · · 0.760 (0.009) 1999ac 7.7 (4.1) 10.6 (0.7) −0.491 24.1 1800h317.wcc8 10 · · · 2005-10-07.192 Clay Gal · · · 0.638 · · · · · · · · · · · · · · · 23.4 3x1200h319.wcc5 11 2004hd 2004-11-18.233 GMOS Ia norm 0.490 0.478 (0.002) 2006ax −2.5 (3.2) −8.5 (0.5) −0.274 22.4 3x1800h323.wdd6 13 2004he 2004-11-17.199 GMOS Ia norm 0.598 0.603 (0.007) 2002bo −1.4 (3.1) −1.2 (0.6) −0.108 > 24 5x1800h342.wdd5 9 2004hf 2004-12-03.155 Baade Ia norm · · · 0.421 (0.005) 2006le 7.8 (1.5) 16.7 −0.356 > 24 4x600h345.wdd4 10 2004hg 2004-12-02.138 Baade Unk · · · · · · · · · · · · · · · · · · · · · 22.7 4x600h352.wcc4 13 · · · 2004-12-16.080 Clay Gal · · · 0.181 · · · · · · · · · · · · · · · 21.8 1200h353.waa2 15 · · · 2004-12-16.058 Clay Gal · · · 0.219 · · · · · · · · · · · · · · · 23.0 2x600h359.wcc8 10 2004hi 2004-12-17.092 Clay Ia norm · · · 0.348 (0.005) 2003du 8.9 (1.7) 15.3 (0.4) −0.182 23.9 2x1200h361.wcc7 13 · · · 2004-12-16 Clay Unk · · · · · · · · · · · · · · · · · · · · · 22.7 no spech363.wcc9 16 2004hh 2004-12-03.084 Baade Ia norm · · · 0.211 (0.005) 1994M 6.0 (1.8) 4.6 (0.3) 0.065 22.5 3x1000h364.wdd9 13 2004hj 2004-12-01.121 Baade Ia norm · · · 0.344 (0.004) 1994ae 2.3 (1.6) 7.6 (0.4) −0.006 22.7 2x600k374.wdd9 1 · · · 2004-12-09.143 Baade Unk · · · 0.143 · · · · · · · · · · · · · · · 22.1 540+450k374.wdd9 1 · · · 2005-01-09.111 Clay Gal · · · 0.143 · · · · · · · · · · · · · · · 22.1 3x1200k396.waa2 5 2004hk 2004-12-10.096 Baade Ia? · · · 0.262 · · · · · · · · · −6.0 (0.4) 0.843 22.3 2x450k397.wcc1 7 · · · 2004-12-16.115 Clay Ic norm · · · 0.051 (0.003) · · · · · · · · · · · · 23.4 3x1200k397.wcc1 7 · · · 2004-12-17.152 Clay Ic norm · · · 0.051 (0.003) · · · · · · · · · · · · 23.4 2x1200k402.wbb5 12 · · · 2004-12-15.334 KII/DEIMOS Unk · · · · · · · · · · · · · · · · · · · · · > 24 2400k411.waa3 10 · · · 2004-12-12.244 KI/LRIS Ia · · · · · · 0.565 (0.003) 1999cc 5.2 (2.2) · · · · · · 22.2 1500k420.wdd6 13 · · · · · · · · · · · · · · · · · · · · · · · · · · · 22.2k425.wbb7 3 2004hl 2004-12-09.087 Baade Ia norm 0.270 0.274 (0.003) 1998dm 10.8 (2.1) 14.1 (0.3) −0.021 21.5 3x600k429.wdd3 6 2004hm 2004-12-09.181 Baade Ia · · · 0.172 0.171 (0.006) 2003hu 0.8 (1.1) −1.2 (0.4) −0.094 20.2 2x450k430.wbb1 2 2004hn 2004-12-12.311 KI/LRIS Ia norm · · · 0.576 (0.007) 2002er 2.2 (2.6) 1.4 (1.2) −0.112 > 24 2x1800k432.waa2 3 · · · 2004-12-12.271 KI/LRIS Ia norm · · · 0.706 (0.010) 1999ee · · · · · · · · · 23.3 2400k437.wcc3 11 2004ho 2004-12-10.160 Baade Gal · · · 0.288 · · · · · · · · · · · · · · · > 24 3x600k440.wbb4 7 · · · 2004-12-12.365 KI/LRIS Unk · · · · · · · · · · · · · · · · · · · · · > 24 2x1800k441.wdd5 5 2004hq 2004-12-16.375 GMOS Ia · · · · · · 0.671 (0.007) 1999aw −1.1 (5.5) 4.0 (1.3) −0.203 24.4 4x1800k442.wcc3 10 · · · 2004-12-12.449 KI/LRIS Unk · · · · · · · · · · · · · · · · · · · · · > 24 1800k443.wcc1 4 2004hp 2004-12-12.417 KI/LRIS Unk · · · · · · · · · · · · · · · · · · · · · 23.2 1800+1400k444.wdd5 2 · · · 2005-01-09.149 Clay Gal · · · 0.193 · · · · · · · · · · · · · · · > 24 1200k448.wbb6 2 2004hr 2004-12-17.055 Clay Ia norm 0.409 0.405 (0.007) 2002er −2.5 (2.2) 1.5 (1.2) 0.003 22.5 2x1200+188k459.wcc7 10 · · · 2004-12-18.055 Clay Unk · · · · · · · · · · · · · · · · · · · · · > 24 3x1200k467.wdd2 13 · · · 2004-12-15.414 KII/DEIMOS Unk · · · · · · · · · · · · · · · · · · · · · > 24 2800k472.wcc3 15 · · · 2005-01-10.089 Clay Gal · · · 0.138 · · · · · · · · · · · · · · · 20.8 2x1200k485.wcc4 6 2004hs 2004-12-18.125 Clay Ia · · · · · · 0.422 (0.007) 1999ee 2.5 (1.6) 8.2 (1.1) −0.230 > 24 4x1200

ESSE
NC
ESpectro
scopy:
The
First
4Yea
rs19
TABLE 2 — Continued
ESSENCE IDa IAUC IDb UT Date Telescope Typec Subtype z z Template Phase Phase ∆ Disc. Exp.(Gal)d (SNID)e (SNID) (d) (LC) (d) Mag. (s)
k490.wdd2 4 · · · 2004-12-15.377 KII/DEIMOS Ia norm 0.716 0.709 (0.001) 1996X · · · · · · · · · 24.4 3000k505.wcc3 13 · · · 2005-01-09.061 Clay Gal · · · 0.241 · · · · · · · · · · · · · · · 22.0 3x1200k505.wcc3 13 · · · 2005-10-07.141 Clay Gal · · · 0.241 · · · · · · · · · · · · · · · 22.0 2x1200k509.waa5 10 · · · 2005-10-07.106 Clay Gal · · · 0.207 · · · · · · · · · · · · · · · 21.8 2x1200m001.wbb6 1 · · · 2005-10-05.131 Clay Ia norm · · · 0.287 (0.004) 2006lf 11.9 (2.1) · · · · · · · · · 2x1200m001.wbb6 1 · · · 2005-10-05.432 KII/DEIMOS Ia norm · · · 0.287 (0.004) 2006lf 11.9 (2.1) · · · · · · · · · 2x1800m002.waa6 15 · · · 2005-10-04.090 VLT Gal · · · 0.354 · · · · · · · · · · · · · · · · · · 2x1800m003.wcc9 15 · · · 2005-10-04.229 VLT II IIP 0.201 0.203 (0.005) 2004dj 17.0 (11.8) · · · · · · · · · 2x1200m004.wcc8 8 · · · 2005-10-06.147 VLT Gal · · · 0.384 · · · · · · · · · · · · · · · · · · 1800m006.wdd8 1 · · · 2005-10-04.382 VLT Ia · · · 0.057 · · · · · · · · · · · · · · · · · · 900m006.wdd8 1 · · · 2005-10-05.266 Clay Ic norm 0.057 0.050 (0.002) 2004gk 35.7 (27.7) · · · · · · · · · 3x900+300m006.wdd8 1 · · · 2005-10-06.603 KII/DEIMOS II IIn 0.057 0.050 (0.004) 1997cy · · · · · · · · · · · · 2x1200m006.wdd8 1 · · · 2005-10-07.564 KI/LRIS II IIn 0.057 0.050 (0.004) 1997cy · · · · · · · · · · · · 1500m010.wdd8 9 · · · 2005-10-05.320 VLT Ib IIb 0.216 0.217 (0.003) 1996cb 32.8 (5.7) · · · · · · 23.1 2x1800m011.wcc5 16 · · · 2005-10-04.215 VLT II · · · 0.205 · · · · · · · · · · · · · · · 20.2 1800m012.wdd3 16 · · · 2005-10-04.274 VLT Gal · · · 0.114 · · · · · · · · · · · · · · · 21.4 2x1200m014.wcc5 3 · · · 2005-10-05.212 VLT II IIP 0.199 0.200 (0.004) 2006bp 24.6 (12.7) · · · · · · 22.9 2x1800m022.waa1 14 · · · 2005-10-05.094 VLT Ia norm · · · 0.240 (0.003) 2003du 38.8 (8.8) 10.8 (1.8) −0.727 22.1 2x1800m025.waa6 11 · · · 2005-10-05.276 KII/DEIMOS Gal · · · 0.701 · · · · · · · · · · · · · · · 21.7 3x1800m026.waa5 12 · · · 2005-10-05.347 KII/DEIMOS Ia norm 0.655 0.656 (0.006) 1999ao 7.6 (3.8) 20.0 (1.8) −0.201 23.2 3x1800m026.waa5 12 · · · 2005-10-07.304 KI/LRIS Ia norm 0.655 0.656 (0.006) 1999ao 7.6 (3.8) 22.0 (1.8) −0.201 23.2 6x1800m027.wbb6 12 · · · 2005-10-04.146 VLT Ia norm 0.289 0.285 (0.004) 1999bk 6.4 (2.3) 8.8 (1.1) −0.134 21.9 1800+100m027.wbb6 12 · · · 2005-10-07.406 KI/LRIS Ia norm 0.289 0.286 (0.005) 1994ae 8.9 (1.7) 11.8 (1.1) −0.134 21.9 3x1800m028.wcc5 12 · · · 2005-10-06.509 KII/DEIMOS Gal · · · 0.606 · · · · · · · · · · · · · · · 21.5 1200,1180m032.waa7 2 · · · 2005-10-06.051 Clay Ia norm · · · 0.155 (0.003) 1995D 15.8 (2.3) 18.3 (1.8) −0.158 20.4 3x1200m034.wdd3 2 · · · 2005-10-04.384 VLT Ia norm 0.558 0.566 (0.007) 1992A · · · 14.6 (1.9) −0.087 22.8 2x1200m035.waa1 5 · · · 2005-10-05.366 VLT AGN · · · · · · · · · · · · · · · · · · · · · 22.7 3x1800m037.wdd3 10 · · · 2005-10-05.253 VLT Gal · · · 0.240 · · · · · · · · · · · · · · · 22.4 1800+1200m038.wcc9 6 · · · 2005-10-06.283 VLT II IIP 0.051 0.051 (0.003) 1992H 146.9 (46.0) · · · · · · 20.6 1200m039.wdd3 6 · · · 2005-10-05.377 VLT Ia · · · 0.248 0.247 (0.003) 1998eg 20.8 (2.8) 21.3 (1.9) −0.223 21.2 1800m039.wdd3 6 · · · 2005-10-05.562 KII/DEIMOS Ia · · · 0.248 0.247 (0.003) 1998eg 20.8 (2.8) 21.3 (1.9) −0.223 21.2 3x1800m040.wdd3 6 · · · 2005-10-05.562 KII/DEIMOS Ia norm · · · 0.480 (0.004) 1998dk 18.1 (2.0) 21.3 (1.9) · · · 21.2 3x1800m041.wcc7 7 · · · 2005-10-06.331 VLT II IIP · · · 0.220 (0.005) 2006bp 20.0 (15.1) · · · · · · 22.8 1800+998m042.waa6 3 · · · 2005-10-04.035 VLT Unk · · · 0.126 · · · · · · · · · · · · · · · 21.8 2x1200m042.waa6 3 · · · 2005-10-07.049 Clay Unk · · · 0.126 · · · · · · · · · · · · · · · 21.8 4x1200m043.waa1 1 · · · 2005-10-05.122 VLT Ia norm 0.265 0.266 (0.003) 1999X 25.9 (2.7) 14.9 (2.0) −0.466 21.9 1800m057.wcc4 11 · · · 2005-10-06.188 VLT Ia · · · 0.181 0.183 (0.004) 1999aa 45.3 (2.3) 17.0 (2.1) −0.601 21.7 1800m062.wbb3 10 · · · 2005-10-06.476 KII/DEIMOS Ia norm 0.314 0.316 (0.004) 2003cg 2.5 (0.8) 4.9 (1.1) 0.149 21.5 2x1200m070.wdd4 7 · · · 2005-10-05.613 KII/DEIMOS Ia norm 0.212 0.214 (0.003) 2003du 9.8 (0.9) · · · · · · 20.6 1200,1118m075.waa3 7 · · · 2005-10-04.179 VLT Ia norm 0.100 0.101 (0.003) 1998ec 27.0 (8.1) 2.4 (1.9) −0.387 19.0 1800+30m075.waa3 7 · · · 2005-10-05.069 Clay Ia norm 0.100 0.101 (0.003) 1998ec 27.0 (8.1) 3.4 (1.9) −0.387 19.0 3x900m078.wcc2 5 · · · 2005-10-05.169 VLT Gal · · · 0.395 · · · · · · · · · · · · · · · 22.1 1800m082.wcc2 4 · · · 2005-10-05.491 KII/DEIMOS Unk · · · · · · · · · · · · · · · · · · · · · 22.6 2x1800,786m087.wdd4 3 · · · 2005-10-05.395 VLT Ia · · · 0.287 0.289 (0.006) 1995E 7.1 (2.6) · · · · · · 21.5 1500m095.wdd2 3 · · · 2005-10-04.339 VLT AGN · · · 0.990 · · · · · · · · · · · · · · · 22.6 3x1200m111.wcc7 11 · · · 2005-10-06.547 KII/DEIMOS AGN · · · 1.000 · · · · · · · · · · · · · · · 21.9 1800,1400m135.waa1 2 · · · 2005-10-06.232 VLT Gal · · · 0.289 · · · · · · · · · · · · · · · 21.5 1800+774m135.waa1 2 · · · 2005-10-06.257 KII/DEIMOS Unk · · · 0.289 · · · · · · · · · · · · · · · 21.5 2x1800m138.wbb3 3 · · · 2005-10-06.256 VLT Ia norm 0.588 0.584 (0.007) 2002er −5.8 (2.0) −10.3 (1.3) −0.306 22.6 1800m138.wbb3 3 · · · 2005-10-06.372 KII/DEIMOS Ia norm 0.588 0.584 (0.007) 2002er −5.8 (2.0) −10.3 (1.3) −0.306 22.6 5x1800m138.wbb3 3 · · · 2005-10-07.495 KI/LRIS Ia norm 0.588 0.584 (0.007) 2002er −5.8 (2.0) −9.3 (1.3) −0.306 22.6 5x1800m139.waa3 7 · · · 2005-10-06.300 KII/DEIMOS II IIn 0.212 0.204 (0.001) 2000eo 18.5 (12.0) · · · · · · 22.7 1800,900m142.wbb1 12 · · · 2005-10-06.447 KII/DEIMOS N.S. · · · 0.597 · · · · · · · · · · · · · · · 20.8 2x900m158.waa6 3 · · · 2005-10-28.056 Clay Ia norm · · · 0.461 (0.007) 2004eo 21.7 (16.7) 15.5 (1.2) −0.334 22.6 2x1200m158.waa6 3 · · · 2005-10-29.087 Clay Ia norm · · · 0.461 (0.007) 2004eo 21.7 (16.7) 16.5 (1.2) −0.334 22.6 3x1200

20
Foley
etal.
TABLE 2 — Continued
ESSENCE IDa IAUC IDb UT Date Telescope Typec Subtype z z Template Phase Phase ∆ Disc. Exp.(Gal)d (SNID)e (SNID) (d) (LC) (d) Mag. (s)
m158.waa6 3 · · · 2005-10-30.167 GMOS Ia norm · · · 0.461 (0.007) 2004eo 21.7 (16.7) 17.5 (1.2) −0.334 22.6 5x1800m161.wdd9 4 · · · 2005-10-28.149 Clay Gal · · · 0.230 · · · · · · · · · · · · · · · 22.8 1200m166.waa1 5 · · · 2005-10-28.354 GMOS AGN · · · 0.303 · · · · · · · · · · · · · · · 23.0 5x1800m193.wdd3 14 · · · 2005-10-28.104 Clay Ia norm 0.330 0.336 (0.006) 1996X 6.4 (3.2) 9.2 (0.5) −0.124 21.8 2x1200m193.wdd3 14 · · · 2005-10-29.135 Clay Ia norm 0.330 0.336 (0.006) 1996X 6.4 (3.2) 10.2 (0.5) −0.124 21.8 3x1200m226.wcc9 16 · · · 2005-10-31.274 GMOS Ia · · · 0.675 0.674 (0.008) 2006X · · · 23.5 (1.2) −0.227 22.9 4x1800n244.wdd3 7 · · · 2005-12-05.341 KI/LRIS Unk · · · · · · · · · · · · · · · · · · · · · 22.1 2x1800n244.wdd3 7 · · · 2006-01-07.161 Baade Unk · · · · · · · · · · · · · · · · · · · · · 22.1 2x600n246.wbb7 11 · · · 2005-12-02.191 VLT Ia? · · · 0.705 0.71 (0.01) · · · · · · · · · · · · 22.8 3x1200n255.wcc7 5 · · · 2006-01-07.099 Baade Gal · · · · · · · · · · · · · · · · · · · · · 22.9 2x1200n256.wdd3 5 · · · 2005-12-02.277 VLT Ia norm · · · 0.630 (0.011) 2003du 2.0 (1.6) 10.2 (0.9) −0.339 22.6 2x1200n258.wcc5 4 · · · 2005-12-02.232 VLT Ia norm 0.519 0.525 (0.008) 1992A 8.5 (2.6) 9.3 (1.2) 0.032 22.4 900n260.wcc8 2 · · · 2005-12-02.131 GMOS AGN · · · 2.000 · · · · · · · · · · · · · · · 23.1 5x1800n261.wbb7 16 · · · 2005-11-30.326 GMOS AGN · · · 3.500 · · · · · · · · · · · · · · · 22.5 5x1800n263.wcc9 4 · · · 2005-12-02.211 VLT Ia · · · · · · 0.368 (0.007) 1999aw 4.8 (4.4) 4.0 (0.5) 0.054 21.5 900+286n268.wdd6 15 · · · 2005-12-04.252 VLT Unk · · · 0.279 · · · · · · · · · · · · · · · 22.6 2x1800n271.wbb5 16 · · · 2005-12-02.376 KII/DEIMOS II IIP · · · 0.242 (0.005) 1999em 17.1 (10.2) · · · · · · 22.0 4x900n278.waa5 11 · · · 2005-12-03.040 VLT Ia norm 0.303 0.308 (0.006) 1995E 2.6 (2.1) 7.8 (0.9) 0.033 21.5 2x900n284.waa1 8 · · · 2005-11-29.298 GMOS AGN · · · 1.980 · · · · · · · · · · · · · · · 22.3 4x1800n285.waa3 8 · · · 2005-12-04.098 VLT Ia norm 0.533 0.531 (0.009) 2004S 16.1 (4.5) 21.0 (1.3) −0.122 22.6 2x1800n295.waa3 3 · · · 2005-11-29.083 GMOS AGN · · · 1.240 · · · · · · · · · · · · · · · 22.5 2x1800n295.waa3 3 · · · 2005-11-30.084 GMOS AGN · · · 1.240 · · · · · · · · · · · · · · · 22.5 3x1800n296.wbb5 3 · · · 2006-01-07.074 Baade Unk · · · · · · · · · · · · · · · · · · · · · 21.7 2x900n312.wdd9 14 · · · 2005-12-02.432 KII/DEIMOS Gal · · · 0.286 · · · · · · · · · · · · · · · 22.0 4x900n322.wdd9 12 · · · 2005-12-04.397 KI/LRIS Ia norm · · · 0.770 (0.010) 1994S · · · · · · · · · 23.6 2x1600n326.waa1 10 · · · 2005-12-02.067 VLT Ia norm 0.264 0.267 (0.006) 2006lf −0.8 (3.6) −3.0 (0.4) 0.703 21.7 2x1200n346.waa1 3 · · · 2005-12-04.246 KI/LRIS Gal · · · 0.266 · · · · · · · · · · · · · · · 22.6 2x1200n368.waa7 9 · · · 2005-12-03.118 VLT Ia norm 0.342 0.342 (0.006) 2005am 2.4 (1.9) · · · · · · > 24 2x900n395.wcc8 7 · · · 2005-12-03.414 KII/DEIMOS Gal · · · 0.462 · · · · · · · · · · · · · · · 21.9 1500n400.wbb8 12 · · · 2005-12-04.319 KI/LRIS Ia norm 0.424 0.421 (0.007) 1999cl −3.4 (2.9) · · · · · · 23.6 2x1200n404.wdd8 14 · · · 2005-12-03.254 VLT Ia norm · · · 0.211 (0.005) 2006ax −7.8 (2.2) −5.0 (0.4) −0.069 21.8 860n406.wdd8 16 · · · 2005-12-04.205 VLT Ia? · · · · · · 0.770 (0.010) · · · · · · · · · · · · 23.4 2x1800n406.wdd8 16 · · · 2005-12-05.139 VLT Ia? · · · · · · 0.775 (0.010) · · · · · · · · · · · · 23.4 2x1800n408.wbb9 16 · · · 2005-12-05.221 KI/LRIS Unk · · · · · · · · · · · · · · · · · · · · · 24.0 1800p415.waa3 16 · · · 2005-12-04.052 VLT Gal · · · 0.343 · · · · · · · · · · · · · · · 21.8 900p425.waa1 14 · · · 2005-12-02.100 VLT Ia norm 0.458 0.461 (0.009) 2006le 5.5 (2.8) 12.5 (0.8) 0.183 22.8 2x1200p425.waa1 14 · · · 2005-12-03.273 KII/DEIMOS Ia norm 0.458 0.461 (0.009) 2006le 5.5 (2.8) 13.5 (0.8) 0.183 22.8 3x1200p429.waa3 13 · · · 2005-12-02.141 VLT Gal · · · 0.548 · · · · · · · · · · · · · · · 23.3 2x1200p429.waa3 13 · · · 2005-12-03.225 KII/DEIMOS Gal · · · 0.548 · · · · · · · · · · · · · · · 23.3 3x1200p434.wbb5 12 · · · 2005-12-04.158 VLT Ib/c · · · 0.338 · · · · · · · · · · · · · · · 23.4 2x1800p444.wcc2 5 · · · 2005-12-03.373 KII/DEIMOS Ia norm · · · 0.633 (0.004) 2004dt · · · · · · · · · 23.2 3x1200p445.wbb1 4 · · · 2005-12-03.323 KII/DEIMOS Ia norm 0.807 0.816 (0.002) 2002bo · · · · · · · · · 23.3 3x1200p454.wcc2 15 · · · 2005-12-03.167 VLT Ia · · · · · · 0.691 (0.009) 1999aw 3.1 (2.8) 3.8 (1.3) −0.276 22.9 2x1800p455.wcc4 15 · · · 2005-12-03.255 VLT Ia norm 0.297 0.285 (0.006) 1998dh −7.9 (1.1) −13.3 (0.4) −0.061 21.4 2x900p458.waa3 10 · · · 2005-12-05.197 KI/LRIS Unk · · · · · · · · · · · · · · · · · · · · · 23.1 1800p459.wcc4 10 · · · 2005-12-03.210 VLT Ia · · · · · · 0.702 (0.004) 1999dq −5.2 (2.1) · · · · · · 23.2 2x1800p461.waa5 6 · · · 2005-12-03.066 VLT Gal · · · 0.407 · · · · · · · · · · · · · · · 22.8 1800p520.wcc2 12 · · · 2005-12-27.147 Clay Ia? · · · 0.643 · · · · · · · · · · · · · · · 23.0 3x1200p520.wcc2 12 · · · 2005-12-28.094 Clay Ia? · · · 0.643 · · · · · · · · · · · · · · · 23.0 4x1200p521.wcc7 14 · · · 2005-12-27.085 Clay Gal · · · · · · · · · · · · · · · · · · · · · 21.5 2x1200p524.wdd8 6 · · · 2005-12-28.160 Clay Ia norm · · · 0.511 (0.003) 2004eo 5.3 (2.3) 14.2 (0.4) −0.229 22.6 4x1200p527.wcc2 15 · · · 2005-12-29.142 Clay Gal · · · 0.435 · · · · · · · · · · · · · · · 22.4 3x1200p527.wcc2 15 · · · 2006-01-01.371 KII/DEIMOS Ia? · · · 0.435 · · · · · · · · · · · · · · · 22.4 917p528.wcc2 8 · · · 2005-12-29.092 Clay Ia · · · 0.782 · · · · · · · · · 7.6 (0.9) −0.310 23.2 3x1200p528.wcc2 8 · · · 2006-01-01.348 KII/DEIMOS Ia · · · 0.782 0.780 (0.009) 2002ha 3.4 (1.8) 10.6 (0.9) −0.310 23.2 2x1800

ESSE
NC
ESpectro
scopy:
The
First
4Yea
rs21
TABLE 2 — Continued
ESSENCE IDa IAUC IDb UT Date Telescope Typec Subtype z z Template Phase Phase ∆ Disc. Exp.(Gal)d (SNID)e (SNID) (d) (LC) (d) Mag. (s)
p534.wcc3 4 · · · 2006-01-01.300 KII/DEIMOS Ia 91T 0.621 0.612 (0.007) 1998es 0.8 (1.8) −5.3 −0.096 22.7 2x2400p534.wcc3 4 · · · 2006-01-03.072 GMOS Ia 91T 0.621 0.612 (0.007) 1998es 0.8 (1.8) −3.3 −0.096 22.7 5x1800
aESSENCE internal identification. The first letter indicates the month in the observing season. This is followed by a sequential number as targets are discovered. The remaining letters and
numbers show the specific ESSENCE field where the object was located.b
Note that not all objects judged to be SNe have official International Astronomical Union names.c
Our best guess as to
classification of the object. Ia? indicates a lack of certainty in the identification as a SN Ia. Objects marked “Unk” are unknown. N.S. indicates that the telescope was pointed to the object, but
no exposure was taken or the exposure contained no signal.d
Redshift measured from narrow emission or absorption lines from the host galaxy. All galactic redshift errors are < 0.001.e
Redshift
measured from the SN spectrum by SNID.
Copyright © 2022 FDOKUMEN