Hubble Space Telescope and Ground‐based Observations of Type Ia Supernovae at Redshift 0.5:...
20
DRAFT VERSION JANUARY 12, 2014 Preprint typeset using L A T E X style emulateapj v. 11/10/09 HUBBLE SPACE TELESCOPE AND GROUND-BASED OBSERVATIONS OF THE TYPE Iax SUPERNOVAE SN 2005hk AND SN 2008A CURTIS MCCULLY 1 ,SAURABH W. J HA 1 ,RYAN J. FOLEY 2,3 ,RYAN CHORNOCK 4 ,J ON A. HOLTZMAN 5 ,DAVID D. BALAM 6 DAVID BRANCH 7 ,ALEXEI V. FILIPPENKO 8 ,J OSHUA FRIEMAN 9,10 ,J OHAN FYNBO 11 ,LLUIS GALBANY 12,13 , MOHAN GANESHALINGAM 8,14 ,PETER M. GARNAVICH 15 ,MELISSA L. GRAHAM 16,17,18 ,ERIC Y. HSIAO 18 ,GIORGOS LELOUDAS 11,19 , DOUGLAS C. LEONARD 20 ,WEIDONG LI 8,21 ,ADAM G. RIESS 22 ,MASAO SAKO 23 ,DONALD P. SCHNEIDER 24 , J EFFREY M. SILVERMAN 8,25,26 ,J ESPER SOLLERMAN 11,27 ,THEA N. STEELE 8 ,ROLLIN C. THOMAS 28 , J. CRAIG WHEELER 25 , AND CHEN ZHENG 29,30 Draft version January 12, 2014 ABSTRACT We present Hubble Space Telescope (HST) and ground-based optical and near-infrared observations of SN 2005hk and SN 2008A, typical members of the Type Iax class of supernovae (SNe). These objects are peculiar cousins of normal Type Ia SNe, with SN 2002cx as the prototype. Here we focus on late-time obser- vations, where these objects deviate most dramatically from normal SNe Ia. Instead of the dominant nebular emission lines that are observed in normal SNe Ia at late phases (and indeed, in SNe of all other types), spectra of SNe 2005hk and 2008A show lines of Fe II, Ca II, and Fe I more than a year past maximum light, along with narrow [Fe II] and [Ca II] emission. We use spectral features to constrain the temperature and density of the ejecta, and find high densities at late times, with n e & 10 9 cm -3 . Such high densities should yield enhanced cooling of the ejecta, making these objects good candidates to observe the expected “infrared catastrophe,” a generic feature of SN Ia models. However, our HST photometry of SN 2008A does not match the predictions of an infrared catastrophe. Moreover, our HST observations rule out a “pure deflagration” model for these peculiar SNe, showing no evidence for unburned material at late times. We derive an upper limit of 0.14 M of low-density oxygen in SN 2008A nearly 600 days after maximum light, at odds with the pure deflagration prediction. We argue that the observed late-time line velocities (shifts and widths), of order ∼ 500 km s -1 , imply the explosion did not fully disrupt the white dwarf. Failed deflagration explosion models, leaving behind a bound remnant, can match some of the observed properties of SNe Iax, but no published model is consistent with all of our observations of SNe 2005hk and 2008A. 1 Department of Physics and Astronomy, Rutgers, the State University of New Jersey, 136 Frelinghuysen Road, Piscataway, NJ 08854, USA. E-mail comments or inquiries to [email protected]. 2 Astronomy Department, University of Illinois at Urbana-Champaign, 1002 W. Green Street, Urbana, IL 61801 USA 3 Department of Physics, University of Illinois Urbana-Champaign, 1110 W. Green Street, Urbana, IL 61801 USA 4 Harvard-Smithsonian Center for Astrophysics, 60 Garden Street, Cambridge, MA 02138, USA 5 Department of Astronomy, MSC 4500, New Mexico State University, P.O. Box 30001, Las Cruces, NM 88003, USA 6 Dominion Astrophysical Observatory, Herzberg Institute of Astro- physics, 5071 West Saanich Road, Victoria, BC, V9E 2E7, Canada 7 Homer L. Dodge Department of Physics and Astronomy, University of Oklahoma, Norman, OK 73019, USA 8 Department of Astronomy, University of California, Berkeley, CA 94720-3411, USA 9 Kavli Institute for Cosmological Physics and Department of Astron- omy and Astrophysics, University of Chicago, 5640 South Ellis Avenue, Chicago, IL 60637, USA 10 Center for Particle Astrophysics, Fermi National Accelerator Labora- tory, P.O. Box 500, Batavia, IL 60510, USA 11 Dark Cosmology Centre, Niels Bohr Institute, University of Copen- hagen, Juliane Maries Vej 30, 2100 Copenhagen Ø, Denmark 12 Institut de Física d’Altes Energies, Universitat Autònoma de Barcelona, E-08193 Bellaterra (Barcelona), Spain 13 Centro Multidisciplinar de Astrofísica, Instituto Superior Técnico, Av. Rovisco Pais 1, 1049-001 Lisbon, Portugal 14 Lawrence Berkeley National Laboratory, Berkeley, CA 94720, USA 15 Department of Physics, University of Notre Dame, Notre Dame, IN 46556, USA 16 Las Cumbres Observatory Global Telescope Network, Goleta, CA 93117, USA 17 Department of Physics, University of California, Santa Barbara, CA 93106, USA 18 Carnegie Observatories, Las Campanas Observatory, Colina El Pino, Casilla 601, Chile 19 The Oskar Klein Centre, Department of Physics, Stockholm Univer- sity, AlbaNova, 10691 Stockholm, Sweden 20 Department of Astronomy, San Diego State University, San Diego, California 92182, USA 21 Deceased December 12, 2011 22 Department of Physics and Astronomy, Johns Hopkins University, Baltimore, MD 21218, USA 23 Department of Physics and Astronomy, University of Pennsylvania, 209 South 33rd Street, Philadelphia, PA 19104, USA 24 Department of Astronomy and Astrophysics, and Institute for Gravi- tation and the Cosmos, The Pennsylvania State University, University Park, PA 16802, USA 25 Department of Astronomy, University of Texas at Austin, Austin, TX 78712, USA 26 National Science Foundation Astronomy and Astrophysics Postdoc- toral Fellow 27 The Oskar Klein Centre, Department of Astronomy, Stockholm Uni- versity, AlbaNova, 10691 Stockholm, Sweden 28 Computational Cosmology Center, Lawrence Berkeley National Lab- oratory, 1 Cyclotron Road MS50B-4206, Berkeley, CA, 94720, USA 29 Kavli Institute for Particle Astrophysics and Cosmology, SLAC Na- tional Accelerator Laboratory, 2575 Sand Hill Road, Menlo Park, CA 94025, USA 30 Department of Physics, Stanford University, Stanford, CA 94305, USA arXiv:1309.4457v1 [astro-ph.SR] 17 Sep 2013
Transcript of Hubble Space Telescope and Ground‐based Observations of Type Ia Supernovae at Redshift 0.5:...
DRAFT VERSION JANUARY 12, 2014Preprint typeset using LATEX style emulateapj v. 11/10/09
HUBBLE SPACE TELESCOPE AND GROUND-BASED OBSERVATIONS OFTHE TYPE Iax SUPERNOVAE SN 2005hk AND SN 2008A
CURTIS MCCULLY1 , SAURABH W. JHA1 , RYAN J. FOLEY2,3 , RYAN CHORNOCK4 , JON A. HOLTZMAN5 , DAVID D. BALAM6
DAVID BRANCH7 , ALEXEI V. FILIPPENKO8 , JOSHUA FRIEMAN9,10 , JOHAN FYNBO11 , LLUIS GALBANY12,13 ,MOHAN GANESHALINGAM8,14 , PETER M. GARNAVICH15 , MELISSA L. GRAHAM16,17,18 , ERIC Y. HSIAO18 , GIORGOS LELOUDAS11,19 ,
DOUGLAS C. LEONARD20 , WEIDONG LI8,21 , ADAM G. RIESS22 , MASAO SAKO23 , DONALD P. SCHNEIDER24 ,JEFFREY M. SILVERMAN8,25,26 , JESPER SOLLERMAN11,27 , THEA N. STEELE8 , ROLLIN C. THOMAS28 , J. CRAIG WHEELER25 , AND
CHEN ZHENG29,30
Draft version January 12, 2014
ABSTRACTWe present Hubble Space Telescope (HST) and ground-based optical and near-infrared observations of
SN 2005hk and SN 2008A, typical members of the Type Iax class of supernovae (SNe). These objects arepeculiar cousins of normal Type Ia SNe, with SN 2002cx as the prototype. Here we focus on late-time obser-vations, where these objects deviate most dramatically from normal SNe Ia. Instead of the dominant nebularemission lines that are observed in normal SNe Ia at late phases (and indeed, in SNe of all other types), spectraof SNe 2005hk and 2008A show lines of Fe II, Ca II, and Fe I more than a year past maximum light, along withnarrow [Fe II] and [Ca II] emission. We use spectral features to constrain the temperature and density of theejecta, and find high densities at late times, with ne & 109 cm−3. Such high densities should yield enhancedcooling of the ejecta, making these objects good candidates to observe the expected “infrared catastrophe,” ageneric feature of SN Ia models. However, our HST photometry of SN 2008A does not match the predictionsof an infrared catastrophe. Moreover, our HST observations rule out a “pure deflagration” model for thesepeculiar SNe, showing no evidence for unburned material at late times. We derive an upper limit of 0.14 M�of low-density oxygen in SN 2008A nearly 600 days after maximum light, at odds with the pure deflagrationprediction. We argue that the observed late-time line velocities (shifts and widths), of order ∼500 km s−1,imply the explosion did not fully disrupt the white dwarf. Failed deflagration explosion models, leaving behinda bound remnant, can match some of the observed properties of SNe Iax, but no published model is consistentwith all of our observations of SNe 2005hk and 2008A.
1 Department of Physics and Astronomy, Rutgers, the State Universityof New Jersey, 136 Frelinghuysen Road, Piscataway, NJ 08854, USA.E-mail comments or inquiries to [email protected].
2 Astronomy Department, University of Illinois at Urbana-Champaign,1002 W. Green Street, Urbana, IL 61801 USA
3 Department of Physics, University of Illinois Urbana-Champaign,1110 W. Green Street, Urbana, IL 61801 USA
4 Harvard-Smithsonian Center for Astrophysics, 60 Garden Street,Cambridge, MA 02138, USA
5 Department of Astronomy, MSC 4500, New Mexico State University,P.O. Box 30001, Las Cruces, NM 88003, USA
6 Dominion Astrophysical Observatory, Herzberg Institute of Astro-physics, 5071 West Saanich Road, Victoria, BC, V9E 2E7, Canada
7 Homer L. Dodge Department of Physics and Astronomy, Universityof Oklahoma, Norman, OK 73019, USA
8 Department of Astronomy, University of California, Berkeley, CA94720-3411, USA
9 Kavli Institute for Cosmological Physics and Department of Astron-omy and Astrophysics, University of Chicago, 5640 South Ellis Avenue,Chicago, IL 60637, USA
10 Center for Particle Astrophysics, Fermi National Accelerator Labora-tory, P.O. Box 500, Batavia, IL 60510, USA
11 Dark Cosmology Centre, Niels Bohr Institute, University of Copen-hagen, Juliane Maries Vej 30, 2100 Copenhagen Ø, Denmark
12 Institut de Física d’Altes Energies, Universitat Autònoma deBarcelona, E-08193 Bellaterra (Barcelona), Spain
13 Centro Multidisciplinar de Astrofísica, Instituto Superior Técnico,Av. Rovisco Pais 1, 1049-001 Lisbon, Portugal
14 Lawrence Berkeley National Laboratory, Berkeley, CA 94720, USA15 Department of Physics, University of Notre Dame, Notre Dame, IN
46556, USA16 Las Cumbres Observatory Global Telescope Network, Goleta, CA
93117, USA17 Department of Physics, University of California, Santa Barbara, CA
93106, USA
18 Carnegie Observatories, Las Campanas Observatory, Colina El Pino,Casilla 601, Chile
19 The Oskar Klein Centre, Department of Physics, Stockholm Univer-sity, AlbaNova, 10691 Stockholm, Sweden
20 Department of Astronomy, San Diego State University, San Diego,California 92182, USA
21 Deceased December 12, 201122 Department of Physics and Astronomy, Johns Hopkins University,
Baltimore, MD 21218, USA23 Department of Physics and Astronomy, University of Pennsylvania,
209 South 33rd Street, Philadelphia, PA 19104, USA24 Department of Astronomy and Astrophysics, and Institute for Gravi-
tation and the Cosmos, The Pennsylvania State University, University Park,PA 16802, USA
25 Department of Astronomy, University of Texas at Austin, Austin, TX78712, USA
26 National Science Foundation Astronomy and Astrophysics Postdoc-toral Fellow
27 The Oskar Klein Centre, Department of Astronomy, Stockholm Uni-versity, AlbaNova, 10691 Stockholm, Sweden
28 Computational Cosmology Center, Lawrence Berkeley National Lab-oratory, 1 Cyclotron Road MS50B-4206, Berkeley, CA, 94720, USA
29 Kavli Institute for Particle Astrophysics and Cosmology, SLAC Na-tional Accelerator Laboratory, 2575 Sand Hill Road, Menlo Park, CA94025, USA
30 Department of Physics, Stanford University, Stanford, CA 94305,USA
arX
iv:1
309.
4457
v1 [
astr
o-ph
.SR
] 1
7 Se
p 20
13

2
1. INTRODUCTION
The use of Type Ia supernovae (SNe Ia) as distance indi-cators has revolutionized cosmology with the discovery thatthe expansion of the Universe is currently accelerating, prob-ably driven by dark energy (Riess et al. 1998; Perlmutter et al.1999). Sufficiently large samples have now been collectedsuch that systematic uncertainties are beginning to dominatethe statistical uncertainties in SN Ia distances (e.g., Wood-Vasey et al. 2007; Kessler et al. 2009; Conley et al. 2011).Perhaps one of the most fundamental systematic uncertain-ties stems from the lack of detailed understanding of SN Iaprogenitor systems and explosion mechanism. Though ex-ploding white dwarfs typically produce normal SNe Ia (bywhich we include all objects that fall on the one-parameterfamily correlating luminosity with light-curve width; Phillips1993), we are amassing growing evidence that other SNe arealso consistent with a white dwarf origin. Understanding whatmakes these thermonuclear explosions different can shed lighton both normal SNe Ia and more general outcomes of stellarevolution.
SN 2002cx was labeled “the most peculiar known SN Ia”by Li et al. (2003)31; see also Filippenko (2003). WhileSN 2002cx was peculiar, it is not unique. SN 2002cx isthe prototype for the largest class of peculiar SNe, which wehave dubbed “Type Iax” supernovae (for a full description ofthis class, see Foley et al. 2013). These are weak explosionswith luminosities that can fall more than a magnitude belowthe Phillips relation for normal SNe Ia with similar declinerate, and they have ejecta velocities roughly half those of nor-mal SNe Ia (Jha et al. 2006a). Still, near peak brightness,SNe Iax are similar to SNe Ia in the general characteristicsof their light curves and spectral features. However, the late-time properties of SNe Iax are unmatched by any other pre-viously discovered SN class. Instead of entering a nebularphase dominated by broad forbidden lines of iron-peak ele-ments, the spectrum of SN 2002cx at ∼250 days past max-imum brightness32 was dominated by permitted Fe II, withvery low expansion velocities ∼700 km s−1, much lower thanever observed in normal SNe Ia (Jha et al. 2006a). In addi-tion, the late-time spectrum of SN 2002cx showed hints oflow-velocity O I, also unprecedented in SNe Ia, and perhapsan indication of unburned material in the inner regions of thewhite dwarf.
A variety of models have been proposed to explain the ori-gins of SNe Iax. Branch et al. (2004) and Jha et al. (2006a)suggested that these objects might be explained by pure defla-gration models. These models do not explain normal SNe Iawell: a pure deflagration model typically produces much lessnickel than is required for the luminosity of a normal SN Ia(Gamezo et al. 2004). Moreover, the highly turbulent and con-voluted thermonuclear burning front in these models yieldsclumpy, well-mixed ejecta, with unburned material, partiallyburned material, and fully burned (to the iron peak) materialat all layers (Röpke 2008), and this mixing is not observedin normal SNe Ia (Gamezo et al. 2004). One of the strongestconstraints for a pure-deflagration model is the prediction ofunburned material (carbon and oxygen) in the innermost lay-ers, which should be easily detectable in late-time spectra andyet has never been observed in normal SNe Ia (Gamezo et al.
31 Probably SN 2000cx now deserves that moniker (Li et al. 2001b, andsee also Silverman et al. 2013b).
32 Throughout this paper, SN phases are given in rest-frame days past B-band maximum light.
2004).The problems with the pure deflagration model for nor-
mal SNe Ia may become strengths for SNe Iax (Jha et al.2006a). The low production of nickel and the low luminosityare key traits of SNe Iax. Large amounts of mixing of partiallyburned, fully burned, and possibly unburned material are ob-served in all layers of the ejecta. The clumpiness predicted bythe pure deflagration model could explain the high densitiesseen at late times (Jha et al. 2006a; Phillips et al. 2007). InSN 2002cx, there was a tentative detection of O I λ7774 (Jhaet al. 2006a) and a hint of the line in SN 2005hk, a prototyp-ical SN Iax (Phillips et al. 2007; Stanishev et al. 2007b; Sahuet al. 2008). However, pure deflagration models that unbindthe white dwarf do not predict the high densities at late timesseen in SNe Iax, and therefore suggest that oxygen in the in-ner layers should be revealed by [O I] λλ6300, 6363 emission(Kozma et al. 2005).
More recently, Jordan et al. (2012) find that if a detonationis not triggered, the explosion is often not powerful enough tounbind the star, leading to the low luminosities and ejecta ve-locities like those found in SNe Iax. Kromer et al. (2013) alsostudy the three-dimensional deflagration of a Chandrasekhar-mass white dwarf. Using radiative transfer models, they findthat they can reproduce the luminosity, the early-time lightcurve, and the early-time spectra of SN 2005hk. Similarly,one of the key features of their explosion simulation is abound remnant.
The discovery of SN 2008ha sparked controversy about thenature of these peculiar SNe. SN 2008ha was spectroscopi-cally a SN Iax, but it was the most extreme member to date(Foley et al. 2009; Valenti et al. 2009), with maximum-lightexpansion velocities of just ∼2000 km s−1, less than half thatof even typical SNe Iax. In addition, SN 2008ha was 3 magfainter than SN 2002cx, with a much more rapid light-curvedecline rate. Based on the energetics, and the spectral simi-larity of SN 2008ha to SN 1997D at late times, Valenti et al.(2009) argued that SN 2008ha was actually a core-collapseSN, rather than a thermonuclear one. Indeed, Moriya et al.(2010) were able to recreate the kinetic energy of SN 2008hain a core-collapse simulation with large amounts of fallbackonto a newly formed black hole (Foley et al. 2009; Valentiet al. 2009). If this model holds for SN 2008ha, Valenti et al.(2009) argued by extension that all SNe Iax might actually becore-collapse SNe. Further support for this idea comes fromthe fact that, like SN 2008ha, SNe Iax are found almost exclu-sively in late-type galaxies, similar to core-collapse SNe (Jhaet al. 2006a; Foley et al. 2009, 2013).
Foley et al. (2010a) published a new set of spectra fromearlier epochs of SN 2008ha showing strong evidence forboth Si II and S II at maximum light. While some core-collapse SNe do show weak Si II lines, the sulfur lines areusually considered hallmarks of thermonuclear burning in aC/O white dwarf (Foley et al. 2010a); these lines were alsoseen in SN 2007qd, another SN Iax very similar to SN 2008ha(McClelland et al. 2010). Foley et al. (2010a) proposed thatSN 2008ha is better explained by a failed deflagration than acore-collapse model. The host-galaxy distribution is also sim-ilar to that of some SNe Ia, specifically SN 1991T-like objects(Foley et al. 2009), and the SN Iax 2008ge exploded in anS0 galaxy with no sign of local star formation to deep limits,inconsistent with a massive star origin (Foley et al. 2010b).
Because these SNe deviate most dramatically from nor-mal SNe (both core-collapse and thermonuclear) at late times,

3
TABLE 1GROUND-BASED OPTICAL PHOTOMETRY OF SN 2005HK FROM THE SDSS-II SN SURVEY
Date MJD Phase u g r i z(UT) (days) (days) (mag) (mag) (mag) (mag) (mag)
2005 10 28 53671.34 −12 18.586(0.036) 18.733(0.012) 18.954(0.019) 19.284(0.027) 19.604(0.104)2005 10 31 53674.24 −9 17.018(0.031) 16.977(0.012) 17.097(0.006) 17.348(0.009) 17.570(0.018)2005 11 02 53676.33 −7 16.649(0.031) 16.511(0.004) 16.592(0.004) 16.807(0.005) 17.010(0.011)2005 11 05 53679.30 −4 16.409(0.031) 16.046(0.009) 16.148(0.009) 16.393(0.015) 16.570(0.014)2005 11 07 53681.29 −2 16.400(0.031) 15.903(0.004) 15.977(0.003) 16.214(0.005) 16.343(0.009)2005 11 11 53685.25 +1 16.524(0.031) 15.777(0.018) 15.743(0.015) 16.003(0.015) 16.120(0.010)2005 11 23 53697.25 +12 18.423(0.031) 16.778(0.015) 15.810(0.006) 15.820(0.006) 15.917(0.016)2005 11 26 53700.25 +15 18.991(0.038) 17.125(0.022) 15.988(0.013) 15.888(0.014) 15.967(0.018)2005 12 01 53705.23 +20 19.637(0.050) 17.625(0.013) 16.307(0.003) 16.170(0.008) 16.190(0.009)
2006 08 28 53975.32 +287 · · · 21.812(0.069) 20.840(0.042) 20.375(0.039) 20.327(0.149)2006 09 12 53990.34 +302 · · · 22.051(0.218) 21.194(0.097) 20.506(0.064) 20.826(0.270)2006 09 16 53994.35 +306 · · · 22.242(0.103) 21.121(0.062) 20.528(0.044) 20.666(0.192)2006 09 18 53996.33 +308 · · · 22.260(0.127) 21.205(0.064) 20.650(0.062) 20.900(0.301)2006 09 20 53998.30 +310 · · · 22.370(0.113) 21.206(0.051) 20.660(0.049) 20.873(0.211)2006 09 27 54005.33 +317 · · · 22.299(0.093) 21.251(0.049) 20.674(0.042) 20.695(0.162)2006 09 30 54008.29 +320 · · · 22.439(0.120) 21.198(0.066) 20.806(0.057) 20.856(0.220)2006 10 02 54010.28 +322 · · · 22.441(0.184) 21.225(0.065) 20.723(0.055) 20.615(0.151)2006 10 04 54012.28 +324 · · · 22.270(0.315) 21.321(0.157) 20.677(0.070) 20.680(0.207)2006 10 12 54020.28 +332 · · · 22.646(0.288) 21.371(0.100) 20.800(0.077) 20.974(0.318)2006 10 16 54024.36 +336 · · · · · · 21.360(0.098) 21.000(0.092) · · ·2006 10 22 54030.28 +342 · · · 22.533(0.112) 21.466(0.063) 21.017(0.057) 21.230(0.269)
NOTE. — 1σ photometric uncertainties are given in parentheses.
here we present late-time observations of SNe 2005hk and2008A (Foley et al. 2013), both typical SNe Iax very similarto SN 2002cx, to constrain the nature of this class of SNe.We look for evidence of the [O I] λ6300 line that is predictedfor a complete pure deflagration (and is usually seen in core-collapse SNe). We also use late-time spectra to infer the com-position, velocity structure, density, and temperature of theejecta.
Besides providing insight to the progenitor systems and ex-plosion mechanisms of white dwarf SNe, SNe 2005hk and2008A may be ideal candidates to observe the “infrared (IR)catastrophe” predicted by Axelrod (1980), a thermal instabil-ity that changes the dominant cooling mechanism from opticallines to far-IR fine-structure lines such as as [Fe I] 24 µm and[Fe II] 26 µm (Sollerman et al. 2004). This phenomenon hasnever been observed in normal SNe Ia even out to 700 dayspast maximum (Leloudas et al. 2009). Because SNe Iax re-main at high densities at late times, the objects in this classshould cool faster than normal SNe Ia and should undergothis instability sooner. Using two epochs of late-time HST ob-servations, we compare the color evolution of SN 2008A tothe predictions of IR-catastrophe models.
Throughout this paper we adopt H0 = 73 km s−1 Mpc−1
and correct redshifts (z) using the Virgo+GA infall model ofMould et al. (2000) via NED33 to estimate distances to the SNhost galaxies.
2. OBSERVATIONS AND DATA REDUCTION
2.1. Ground-Based Optical Photometry and SpectroscopyFor SN 2005hk, we supplement the ground-based optical
photometry of Phillips et al. (2007), Stanishev et al. (2007b),and Sahu et al. (2008) with observations of the equatorial“Stripe 82” from the SDSS-II SN survey (Frieman et al. 2008;Sako et al. 2008), following the reduction procedure detailed
33 http://ned.ipac.caltech.edu.
by Holtzman et al. (2008). The data comprise ugriz photom-etry (Fukugita et al. 1996) from the 2005 and 2006 SDSS-IIobserving seasons, and are presented in Table 1.
The ground-based early-time BVRI observations ofSN 2008A were obtained with the 0.76 m Katzman AutomaticImaging Telescope (KAIT; Filippenko et al. 2001) and 1 mNickel telescope at Lick Observatory (Ganeshalingam et al.2010). BVri observations of SN 2008A were also taken aspart of the CfA4 survey (Hicken et al. 2012).
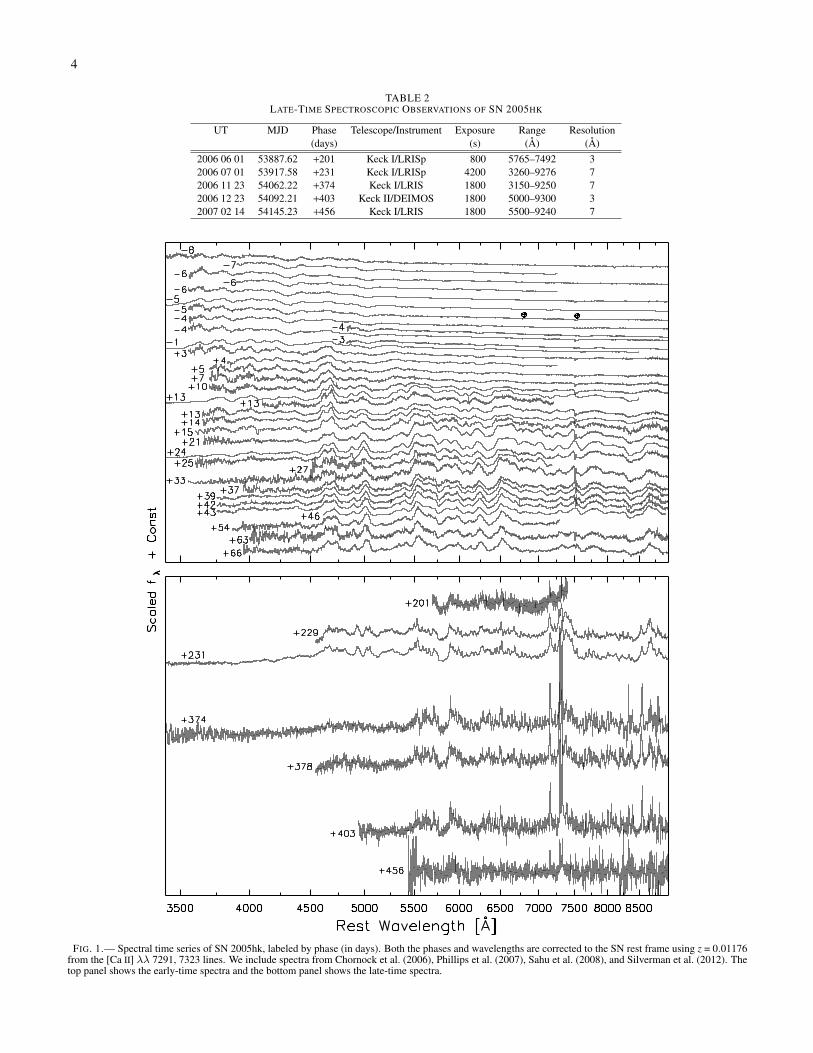
Optical spectra of SN 2005hk were obtained with the LowResolution Imaging Spectrometer (LRIS; Oke et al. 1995)(sometimes in polarimetry mode, LRISp) on the Keck I 10 mtelescope and the Deep Imaging Multi-Object Spectrograph(DEIMOS; Faber et al. 2003) on the Keck II 10 m telescope.Spectra of SN 2008A were obtained with the Kast doublespectrograph (Miller & Stone 1993) on the Lick 3 m Shanetelescope, Keck I (+ LRIS), and the Dominion AstrophysicalObservatory (DAO) Plaskett 1.8 m telescope. Data-reductionprocedures for the Lick and Keck spectra are presented by Sil-verman et al. (2012); the DAO spectroscopy was reduced withstandard techniques. Logs of the observations are provided inTables 2 and 3, and spectral time series are shown in Fig-ures 1 and 2. The former figure includes supplementary spec-troscopy of SN 2005hk from Chornock et al. (2006), Phillipset al. (2007), Sahu et al. (2008), and Maund et al. (2010). Thelisted phases are in the SN rest frame, referenced to B maxi-mum light, which occurred on MJD 53684.2 for SN 2005hkand MJD 54478.3 for SN 2008A.
2.2. Late-time HST ObservationsOur HST observations of SNe 2005hk and 2008A include
optical photometry from WFPC2 and ACS/WFC and near-IR photometry from NICMOS and WFC3/IR, which are pre-sented in Table 4. WFPC2 and NICMOS observations ofSN 2005hk were taken as part of HST program GO-11133(PI: Jha). Additional WFPC2 observations of SN 2005hkwere available from HST snapshot program GO-10877 (PI:
4
TABLE 2LATE-TIME SPECTROSCOPIC OBSERVATIONS OF SN 2005HK
UT MJD Phase Telescope/Instrument Exposure Range Resolution(days) (s) (Å) (Å)
2006 06 01 53887.62 +201 Keck I/LRISp 800 5765–7492 32006 07 01 53917.58 +231 Keck I/LRISp 4200 3260–9276 72006 11 23 54062.22 +374 Keck I/LRIS 1800 3150–9250 72006 12 23 54092.21 +403 Keck II/DEIMOS 1800 5000–9300 32007 02 14 54145.23 +456 Keck I/LRIS 1800 5500–9240 7
FIG. 1.— Spectral time series of SN 2005hk, labeled by phase (in days). Both the phases and wavelengths are corrected to the SN rest frame using z = 0.01176from the [Ca II] λλ 7291, 7323 lines. We include spectra from Chornock et al. (2006), Phillips et al. (2007), Sahu et al. (2008), and Silverman et al. (2012). Thetop panel shows the early-time spectra and the bottom panel shows the late-time spectra.

5
Li). SN 2008A was observed in the optical using WFPC2and ACS and in the near-IR using WFC3/IR as part of HSTprogram GO-11590 (PI: Jha).
The HST observations were combined (with cosmic-ray re-jection and subsampling) using MultiDrizzle (Fruchter et al.2009) with standard parameters. The resulting images ofSN 2005hk and SN 2008A are shown in Figures 3, 4, and5. We performed aperture photometry on all of the imagesusing the APPHOT task in IRAF34. We used aperture correc-tions based on encircled energies given by Holtzman et al.(1995) for WFPC2, Sirianni et al. (2005) for ACS/WFC,and the WFC3 Instrument handbook (Wong et al. 2010) forWFC3/IR. For NICMOS, we generated a point-spread func-tion (PSF) model using the TinyTim software (Krist 1993, butsee Hook & Stoehr 2008) and then directly measured encir-cled energies from the model. For the ACS and WFPC2 datawe also corrected for the charge-transfer inefficiency of thedetectors, using the models of Dolphin (2009) for WFPC2 andChiaberge et al. (2009) for ACS/WFC. To derive upper limitsin cases without a significant detection of the SN, we injectedfake stars with a range of magnitudes into the images. Theseartificial stars were photometered in the same way as the SNe,with the standard deviation of the recovered magnitudes usedto estimate the photometric uncertainty. We list our derivedphotometry and 3σ upper limits in Table 4.
Both SNe 2005hk and 2008A are typical members of theSN Iax class. These two SNe along with SN 2002cx arequite homogeneous in both their light curves and their spectra.Figure 6 shows the spectroscopic similarity of SNe 2002cx,2005hk, and 2008A. In Figure 7, we plot photometry forSNe 2002cx (Li et al. 2003; Jha et al. 2006a), 2005hk (Phillipset al. 2007; Sahu et al. 2008, and this work), and 2008A, com-pared to the normal SN Ia 1992A (Kirshner et al. 1993), allextending to late times.
3. RESULTS
3.1. Lack of Near-Infrared Secondary Maxima in SNe IaxAt early times, SN 2008A mimics the photometric behav-
ior shown by SN 2002cx and SN 2005hk, with broader lightcurves than SN 1992A, particularly in the redder bands, asshown in the insets of Figure 7. These SNe Iax do not show asecond maximum in the near-infrared (Li et al. 2003; Phillipset al. 2007). This is puzzling if the secondary maximum isascribed to a transition in the dominant ionization state (Fe IIIto Fe II; Kasen 2006), because SNe Iax have hot early-timespectra with prominent Fe III, similar to SN 1991T-like SNeIa that do show a strong secondary maximum. Low lumi-nosity SNe Ia like SN 1991bg lack secondary maxima (Filip-penko et al. 1992b; Leibundgut et al. 1993); in the ionizationmodel this is explained by an earlier transition onset in thecooler spectra, merging the primary and secondary maxima.Either SNe Iax must undergo much more rapid cooling nearmaximum light than normal SNe Ia (to explain the Fe III inthe spectrum and yet lack of a secondary maximum), or analternate model is needed.
3.2. Spectral Features and Velocity StructureOne of the defining characteristics of SNe Iax is the low
velocity of their spectral features. At early times, typical
34 IRAF is distributed by the National Optical Astronomy Observatories,which are operated by the Association of Universities for Research in As-tronomy, Inc., under cooperative agreement with the National Science Foun-dation.
SNe Iax have expansion velocities for features such as Si IIof . 5000 km s−1, roughly half those seen in normal SNe Ia(Foley et al. 2013), though the overall appearance of thespectra is otherwise similar to those of SN 1991T-like andSN 1999aa-like SNe Ia. SNe Iax at late times are dominatedby permitted lines from iron-group elements rather than en-tering a nebular phase like normal SNe Ia (Jha et al. 2006a;Foley et al. 2013). Nonetheless, a few forbidden lines arepresent, and the strongest features in late-time SN Iax spec-tra are the [Ca II] λλ7291,7323 doublet and [Fe II] λ7155(Jha et al. 2006a; Sahu et al. 2008; Foley et al. 2013). Usingthese features, we derived redshifts of SNe 2002cx, 2005hk,and 2008A to be z = 0.02323, 0.01176, and 0.01825, respec-tively. These features have unprecedentedly low velocities: inthe last observed epoch, SN 2005hk had velocities as small as500 km s−1, the lowest ever measured for any white-dwarf SN(SN Ia or SN Iax; Phillips et al. 2007).
Figure 8 compares the late-time spectra of SN 2002cx,SN 2005hk, and SN 2008A. While these spectra are quali-tatively similar, there are key differences (also analyzed indetail by Foley et al. 2013). At all epochs the velocities ofSN 2008A are higher than those of SN 2005hk. SN 2002cxshows a stronger Ca near-IR triplet than either SN 2005hk orSN 2008A. In the spectra of SN 2008A, [Fe II] λ7155 hasan asymmetric profile. This may be caused by contaminationfrom another line; there is a [Co I] feature at the wavelengthin question, but no other [Co I] lines are seen (including linesmore easily excited), making this option unlikely.
Sahu et al. (2008) identify [Fe II] λ7389 in their spectra ofSN 2005hk. However, there is another strong feature, [Ni II]λ7378, at almost the same wavelength. The feature near thesewavelengths is broader than the [Fe II] λ7155 line, so we ar-gue that it is likely a blend of these two lines. There is a strongline that is coincident with [Fe II] λ8617 in SN 2008A that isnot seen clearly in SNe 2002cx or 2005hk, but is observedin the normal SN Ia 2003hv and has been used to measureasymmetry in the inner layers of the the ejecta (Leloudas et al.2009).
We used Syn++ (Thomas et al. 2011a), based on theSYNOW code (Branch et al. 2005), to model the permittedlines in the late-time spectra. Our results are also shown inFigure 8. Because the signal-to-noise ratio was the highest inthe latest SN 2005hk spectrum, we fit the lines in this spec-tra and then matched them to the spectra of SNe 2002cx and2008A. We find that Fe II is necessary to fit many of the linesbetween 6000 and 6400 Å, as was found by Jha et al. (2006a)and confirmed by Sahu et al. (2008). While many lines are fitwell with Fe II, some had remained unidentified. We find thatFe I significantly improves the fit of the late-time SN 2002cxand SN 2005hk spectra. There are strong lines to the red ofthe P Cygni profile of Na I λ5891 that can be seen in all threeobjects (SNe 2002cx, 2005hk, and 2008A) that are well fitby Fe I with an excitation temperature near 5000 K. However,there are also [Fe I] lines that match these features, makingthe identification of these lines ambiguous.
The velocity structure of the forbidden lines is interesting.Figure 9 displays the [Ca II] λλ7291,7323 doublet and [Fe II]λ7155 line referenced to the host-galaxy (nucleus) rest frame.As the figure shows, the line velocities are largely consistentover time, though the line widths decrease as the SNe evolve.Foley et al. (2013) found that the [Ca II] and [Fe II] featureswere shifted in opposite directions relative to the host restframe for the majority of SNe Iax, but for these three objects

6
FIG. 2.— Spectral time series of SN 2008A, labeled by phase (in days). Both the phases and wavelengths are corrected to the SN rest frame using z = 0.01825determined from the [Ca II] λλ 7291, 7323 lines.
TABLE 3SPECTROSCOPIC OBSERVATIONS OF SN 2008A
UT MJD Phase Telescope/Instrument Exposure Range Resolution(days) (s) (Å) (Å)
2008 01 15 54480.28 +2 Lick/Kast 1800+1350 3320–10500 6–122008 01 25 54490.11 +12 Plaskett/Cassegrain 9600 3900–7025 62008 02 12 54508.27 +29 Keck I/LRIS 200 3075–9340 72008 02 16 54512.23 +33 Lick/Kast 1800 3300–10500 6–122008 08 03 54681.63 +200 Keck I/LRIS 600+300 3270–9196 72008 08 15 54693.18 +211 NOT/ALFOSC 3600 4000-9050 82008 08 28 54706.51 +224 Keck I/LRIS 1200 3270–9196 72008 10 27 54766.28 +283 Keck I/LRIS 1800 3100–9160 7
TABLE 4LATE-TIME HST OBSERVATIONS OF SN 2005HK AND SN 2008A
Object UT MJD Phase Instrument/Filter Exposure Magnitude(days) (s) (mag)
SN 2005hk 2007 05 31 54251.11 +560 WFPC2/F450W 1600 > 25.50SN 2005hk 2007 05 31 54251.12 +560 WFPC2/F675W 900 > 24.80SN 2005hk 2007 05 31 54251.91 +561 WFPC2/F555W 920 > 25.50SN 2005hk 2007 05 31 54251.92 +561 WFPC2/F814W 1400 24.91(0.22)SN 2005hk 2007 06 25 54276.09 +585 NIC2/F110W 5120 > 25.86SN 2005hk 2007 06 27 54278.68 +588 WFPC2/F555W 460 > 25.20SN 2005hk 2007 06 27 54278.69 +588 WFPC2/F814W 700 > 24.55SN 2005hk 2007 08 13 54325.45 +634 WFPC2/F606W 4800 26.35(0.15)SN 2005hk 2007 08 13 54325.91 +634 WFPC2/F814W 1600 > 25.10SN 2005hk 2007 08 15 54327.24 +636 NIC2/F160W 7680 > 25.08
SN 2008A 2009 02 19 54881.15 +396 WFPC2/F555W 1000 24.20(0.11)SN 2008A 2009 02 19 54881.17 +396 WFPC2/F791W 900 23.10(0.10)SN 2008A 2009 02 19 54881.21 +396 WFPC2/F622W 800 24.14(0.13)SN 2008A 2009 02 19 54881.24 +396 WFPC2/F850LP 1450 23.40(0.26)SN 2008A 2009 02 20 54882.88 +397 WFPC2/F439W 1500 > 24.35SN 2008A 2009 08 18 55061.34 +573 ACS/F625W 3530 26.15(0.06)SN 2008A 2009 08 18 55061.41 +573 ACS/F555W 3750 26.25(0.05)SN 2008A 2009 08 18 55061.54 +573 ACS/F775W 2484 26.25(0.11)SN 2008A 2009 08 18 55061.61 +573 WFC3IR/F110W 8335 26.00(0.21)
NOTE. — 1σ photometric uncertainties are given in parentheses. Upper limits are 3σ.

7
N
3”
846 pc
E
SN 2005hk in UGC 272HST WFPC2 F606W
+634 days UT 2007-08-13
282 pc1”
FIG. 3.— F606W observations of SN 2005hk in UGC 272 (z = 0.013) using the WFPC2 instrument on HST taken 634 days after B maximum. The SN ismarked in the inset, which has been rescaled to better show the SN.
(also part of the Foley et al. 2013 sample), we do not confirmthis pattern, and find consistent velocities from both [Ca II]and [Fe II].
In SN 2002cx, these lines were blueshifted by 220 ±52 km s−1 relative to the SN host galaxy. In SN 2005hk, thelines were also blueshifted by 370± 22 km s−1. Contrarily,in SN 2008A the lines were redshifted by 547± 10 km s−1.These velocity shifts are significantly in excess of the host-galaxy rotation speeds, which have maximum rotation veloci-ties of 128±14 km s−1 (CGCG 044-035, host of SN 2002cx),108± 4 km s−1 (UGC 272, host of SN 2005hk), and 225±7 km s−1 (NGC 634, host of SN 2008A), respectively (Paturelet al. 2003). This implies that the velocity shifts are intrinsicto the SN explosion. We discuss the interpretation of theseresults in §4.
3.3. Oxygen at Late TimesAs described in §1, pure deflagration models have been
raised as a possibility to explain SN Iax explosions. Thesemodels generically predict a turbulent burning front whichcauses strong mixing in all layers of the ejecta, implying thereshould be unburned material (presumably C and O) in the in-nermost layers of the ejecta (Gamezo et al. 2003). At lateepochs, one of the strongest spectral features should be [O I]λ6300 (Kozma et al. 2005).
There is no evidence of this line in the late-time nebularspectra of normal SNe Ia35. Instead, the nebular spectra of
35 Taubenberger et al. (2013) have recently shown the evidence for nebular[O I] λλ6300,6363 with a complex line provide in a late-time spectrum of
normal SNe Ia are dominated by forbidden transitions of iron-peak elements. The favored explanation for this is that theburning front transitioned from a subsonic deflagration to asupersonic detonation (Khokhlov 1991; Gamezo et al. 2005),which subsequently burns the central material uniformly tothe iron peak.
SNe Iax have strong carbon features before and at maxi-mum light, corresponding to unburned material in the outerlayers of the ejecta (Foley et al. 2013, and references therein).Some normal SNe Ia also show these lines at early times, butif present, they usually disappear by maximum light (Thomaset al. 2007, 2011b; Parrent et al. 2011; Folatelli et al. 2012;Silverman & Filippenko 2012). This may imply that unburnedmaterial is present at higher mass fractions deeper into theejecta in SNe Iax compared to normal SNe Ia. If SNe Iax areto be explained as pure deflagrations (no transition to super-sonic burning), we expect to see evidence of unburned ma-terial at all velocities, including the central regions that arerevealed at late times.
Jha et al. (2006a) tentatively identified permitted O I λ7774in SN 2002cx at 227 and 277 days after B maximum. As canbe seen in Figure 8, the same feature is present in SN 2008A,but even stronger. If the identification is correct, this matchesthe model predictions of a pure deflagration explosion thatnever transitioned to a detonation. However, this feature is apermitted transition, implying that the density of the ejecta isunexpectedly high out to ∼280 days past maximum. By thisphase, SNe Ia have transitioned to a nebular phase dominated
SN 2010lp, a subluminous SN 1991bg-like supernova.

8
FIG. 4.— HST observations of SN 2008A in NGC 634 (z = 0.016). The top image is combined from V ri (F555W, F625W, F775W) data taken with ACS, 573days after maximum light. SN 2008A is marked in the inset image, in the outskirts of its host. An unsharp mask filter has been applied to the color figure toemphasize faint sources for display purposes. The bottom panels show WFPC2 observations of SN 2008A taken 396 days after maximum light, in the F555W,F622W, F791W, and F850LP filters. Like SN 2005hk, SN 2008A is located in the outskirts of a spiral galaxy.
by forbidden transitions of iron-peak elements36. If the iden-tification of O I λ7774 is correct and there is unburned oxygenat low velocity, [O I] λ6300 should be a prominent feature inthe nebular spectra of these objects. We searched for evidenceof [O I] λ6300 in spectra of SN 2005hk taken ∼400 days af-ter maximum, but SN 2005hk did not enter a nebular phaseeven at these late epochs and there was no evidence for [O I]λ6300.
Spectroscopy is no longer feasible after these late epochsbecause the SN is too faint. Instead, we use photometry toconstrain the strength of the [O I] line at +573 days after max-imum. [O I] λ6300 is near the center of the r band (F625W)and is reasonably isolated from any other spectral features ex-pected to be present. Therefore, we use the r-band photo-metric flux as a proxy for the flux in the oxygen line. If the[O I] λ6300 line began to dominate other spectral features andthe nearby continuum, as is predicted by the pure deflagrationmodels (Kozma et al. 2005), we would expect a strong r− i andV − r color change as the SN transitions to a nebular phase.
To measure this color change, we examine two epochs ofHST photometry of SN 2008A: the first epoch is at +396 days,
36 Branch et al. (2008) argue that permitted lines dominate optical spectraof normal SNe Ia as late as a few months past maximum light, though byabout 160 days past maximum typical SNe Ia have nebular spectra (Silvermanet al. 2013a).
at which we expect no contribution from [O I] λ6300 based onour spectra of SN 2005hk at similar epochs. In our second ob-servation at +573 days, we do see a strong r − i color change,but V − r remains relatively unchanged (see the discussion in§3.5); this cannot be easily explained by just the appearanceof a strong line in the r band.
Our photometry of SN 2008A at +573 allows us to quan-titatively constrain the amount of oxygen in the ejecta belowthe critical density of 106.5 cm−3. The models of Kozma et al.(2005) give us a relationship between the oxygen mass andthe [O I] λ6300 line flux. If we unrealistically assume thatall of the observed flux in F625W is from an oxygen line, wewould derive a mass of 0.63 M� of oxygen at low density.In reality, the oxygen line flux is only part of the observedbroad-band F625W photometry. If we extrapolate just the r-band photometry from earlier times to day 573, the data allowfor only 0.40 M� of oxygen to contribute additional line flux.
However, we can derive much more stringent oxygen masslimits if we constrain the SN spectral energy distribution(SED) in this wavelength region. Based on the observedspectroscopy at earlier times, we see that SNe Iax remainpseudo-continuum dominated in broad-band photometry to∼400 days past maximum, and the subsequent photometrydoes not show dramatic changes in late-time behavior amongthe different passbands. This implies that we can use our mea-

9
E
10”3.13 kpc
03 6043 7265 8609 10090 12252 14980 19665 27345 36082 493
N
2”626 pc
SN 2008A in NGC 634HST WFC3 IR F110W
+573 days UT 2009-08-18
FIG. 5.— HST near-infrared observations of SN 2008A in NGC 634, taken with WFC3/IR in the F110W passband, 573 days after maximum light.
sured F555W and F775W flux to bracket and constrain the ex-pected continuum flux in F625W, with any new oxygen lineflux showing up as an excess.
To do this we model the SN SED as a linear continuum (inlogarithmic wavelength; fλ ∝ logλ) plus a Gaussian line pro-file at 6300 Å with a width of 500 km s−1, with a line fluxcalibrated to the oxygen mass as above (Kozma et al. 2005).We perform synthetic photometry on the resulting spectra tocompare to our HST/ACS observations in F555W, F625W,and F775W. Essentially, the F555W and F775W data deter-mine the continuum normalization and slope, and the F625Wphotometry then constrains the oxygen line flux. Our broad-band measurements are insensitive to the exact shape of theline profile, and using the three bands together, we marginal-ize over the nuisance parameters of the continuum slope andnormalization to derive the oxygen mass limit.
Our constraint is shown in Figure 10; we find that themass of oxygen below the critical density of [O I] λ6300 is< 0.14 M� at 95% confidence. Pure deflagration models pre-dict ∼0.4 M� of unburned oxygen. This is ruled out at highconfidence (> 5σ). Either a large amount of unburned ma-terial is not present in SNe Iax, or it remains at high densityto very late epochs. Even if the ejecta mass were as low as∼0.5 M�, we would expect ∼0.15 M� of unburned oxygenassuming a similar mass fraction — and this would still beruled out at > 95% confidence.
As discussed, our results depend on the assumed shape ofthe SN SED. However, if we enforce a smooth continuumover the observed wavelength range (so we can incorporatethe F555W and F775W data into our analysis), different pre-scriptions for the exact continuum shape lead to only smallchanges in the oxygen mass constraint of ∼0.02 M�.
3.4. Temperature and DensityOur constraints on the flux of [O I] λ6300 rule out typical
pure deflagration models, so alternative models are needed.Important constraints are provided by the physical propertiesof the ejecta, specifically the temperature and density at lateepochs. As discussed above, the late-time spectra of SNe Iaxare dominated by permitted iron transitions which would im-ply that the electron density has remained higher than in nor-mal SNe Ia. More quantitatively, the ratio of the [Ca II] dou-blet (λλ7291, 7323) to the permitted Ca II near-IR triplet canbe used to constrain the electron density and temperature (Fer-land & Persson 1989). As there is a degeneracy between tem-perature and density in this method, to infer the electron den-sity we need an independent method for constraining the al-lowed temperatures.
The presence of both Fe I and Fe II transitions in the spectraof SN 2005hk is only allowed for a narrow range of tempera-tures, if these lines arise from the same regions in the ejecta,as suggested by the similar line profiles and velocities. TheSaha equation predicts a transition between Fe II and Fe I tran-sitions at ∼4500 K, and in local thermodynamic equilibrium(LTE) calculations, Hatano et al. (1999) find optical depth ex-ceeding unity in both Fe II and Fe I for T . 7000 K. Althoughwe do not expect equilibrium conditions, and non-LTE effectsare likely to be important, we can still use these estimates asa reasonable range for the ejecta temperature, based on thepresence and strength of the Fe I features among numerouspermitted lines with similar P Cygni line profiles and veloc-ity structure. In Figure 11, we show the inferred densities inSN 2002cx, SN 2005hk, and SN 2008A derived from the Ca IIflux ratio for our allowed range of temperatures. We are as-suming that the iron and calcium are microscopically mixed;this is plausible given their overlapping velocity ranges, but

10
FIG. 6.— Spectra of SN 2008A (this work) and SN 2005hk (Phillips et al. 2007, and this work) compared to those of SN 2002cx (Li et al. 2003; Jha et al.2006a). These three SNe Iax have remarkably homogeneous spectra throughout their evolution, and diverge dramatically from normal SNe Ia at late times, asshown by comparison spectra of SN 1991T (Filippenko et al. 1992a) and SN 1998bu (Jha et al. 1999; Li et al. 2001a; Silverman et al. 2012).
we cannot definitively say they reside in the same physicalregion.
The spectra of all three of our objects are consistent withlittle or no density evolution, and all have electron densities∼109 cm−3. Free expansion would predict that the densityshould go as t−3, but this is in clear contradiction with the ob-servations. Our measurements of the density are marginallyconsistent with t−1, but only if the temperature decreasesslowly. If the temperature decreases more rapidly (as mightbe expected given the high densities, if radiative cooling dom-inates), the density is likely evolving even more slowly thant−1, remaining roughly constant, or perhaps even increasing.One possible explanation, given the decreasing line widths weobserve (Figure 9), is that we are continuing to see the “pho-tosphere” recede to ever lower velocities, and for some reasonthe emitting region has a roughly constant density as the ejectadilute.
Based on these measurements, the electron density mayhave been significantly higher than the critical density for[O I] λ6300 of 106.5 cm−3 during our latest HST measure-ment of SN 2008A, nearly 600 days past maximum bright-ness. But if the roughly constant observed density is some-how the result of a receding photosphere, this would imply asignificant amount of material at higher velocities and lowerdensities, and any oxygen mixed there should be detectable
in [O I] emission as probed by our photometry. Deflagrationmodels such as those of Kozma et al. (2005) predict strongmixing, so we disfavor the idea that all the oxygen is at lowvelocity, shielded by a photospheric “iron curtain” at highervelocity (Leonard 2007). Thus, the most likely explanationfor the observations is not that the oxygen emission is “hid-den” at high density, but that oxygen is not present in theseregions in large quantities; we discuss further implicationsof this finding in §4. This interpretation implies that eitherthe spectroscopic detection of permitted O I λ7774 at low ve-locity in SNe 2002cx and 2008A (as seen in Figure 8) is amisidentification, or, if not, a more complicated model mustbe developed to explain the apparent contradiction betweenthe permitted and forbidden lines.
3.5. IR CatastropheThe “infrared catastrophe” is a long-predicted, generically
expected phenomenon that has nonetheless never been ob-served in normal SNe Ia (Leloudas et al. 2009)37. Axelrod(1980) calculated that once the ejecta temperature droppedbelow a critical value∼1500 K, there would be a radical redis-tribution of energy from the optical to the far-IR, dominated
37 Taubenberger et al. (2011) suggest that the IR catastrophe could beat play in the rapid late-time decline of the light curve of the “super-Chandrasekhar” SN 2009dc.

11
FIG. 7.— Light curves of SN 2002cx (Li et al. 2003; Jha et al. 2006a), SN 2005hk (Phillips et al. 2007; Sahu et al. 2008, and this work), and SN 2008A(Ganeshalingam et al. 2010; Hicken et al. 2012, and this work), compared to those of the normal Type Ia SN 1992A (Kirshner et al. 1993). These include bothground-based and HST observations as noted. The light curves have been shifted to match the peak of SN 2008A in V , R, and I. In each of the optical bands thedecline rate is faster than the predicted 0.0098 mag day−1 for the decay of 56Co.

12
FIG. 8.— Late-time spectra of SN 2002cx (+277 days; top, green), SN 2008A (+283 days; top middle, blue), and SN 2005hk (+378 days; bottom middle,red; Sahu et al. 2008) compared to a synthetic model spectrum (black, bottom). The synthetic spectrum was created with Syn++ (Thomas et al. 2011a, similarto SYNOW (Branch et al. 2005)). The synthetic spectrum assumes Boltzmann excitation and only models the permitted lines. Non-LTE effects and forbiddenlines are important for the relative strengths of the lines, but Syn++ is useful for the identification of the lines. The signal-to-noise ratio is substantially better inSN 2005hk, so this was used for the primary fit and then compared to SN 2002cx and SN 2008A. Line identifications are included under the synthetic spectrum.
by fine-structure lines of iron like [Fe I] 24 µm and [Fe II]26 µm rather than the forbidden iron-peak lines seen in theoptical and near-IR that dominate the SN Ia bolometric lu-minosity a few hundred days past maximum light (Sollermanet al. 2004). This redistribution of energy has been used toexplain the line emission of SN 1987A (Kozma & Fransson1998), but it has never been observed in a normal SN Ia. Onepossible explanation is that the ejecta of SNe Ia stay abovethis critical temperature until after they are too faint to ob-serve. Leloudas et al. (2009) find that even 785 days afterB-band maximum brightness, SN 2003hv is not compatiblewith an IR catastrophe.
SNe Iax are unique testing grounds for this phenomenon.Because these objects remain at high density for so long, wemight expect them to have enhanced cooling compared tonormal SNe Ia. This could cause the IR catastrophe to hap-pen early enough that it would still be feasible to image theSN. Qualitatively, if we use the excitation temperature of theiron (and assume microscopic mixing), we can estimate whatthe temperature of the ejecta will be at the time of our finalHST measurement. Constructing a simple model that assumesthat the excitation temperature of iron is ∼10,000 K at max-imum brightness (giving rise to the dominant Fe III lines ob-
served) and ∼4000 K at 300 days after maximum brightness(see §3.4), it is plausible (though by no means required) thatthe temperature at the epoch of our final HST measurementcould approach the∼1500 K threshold for the IR catastrophe.Sollerman et al. (2004) model this transition and find that themost easily observable signature (i.e., not in the far-IR) forthe IR catastrophe is a dramatic color change in the near-IR,but we only have one near-IR measurement, (J:F110W), sowe cannot observe this color change directly.
Sollerman et al. (2004) also show that the optical colorsshould become significantly redder in all optical bands duringand after the IR catastrophe, with significant V − R and R − Icolor changes of ∼1 mag. We compare this model with theobservations of SN 2008A in Figure 12. Though there is somefreedom to shift to model predictions vertically in magnitudeand horizontally in time on the plot, we nonetheless see thatthe colors of SN 2008A change in the opposite way of thepredicted color changes. Rather than getting redder, V − I andR − I data are bluer at late times (with V − R remaining basi-cally unchanged). Thus, we find no evidence for an IR catas-trophe in SN 2008A, out to nearly 600 days past maximumlight, despite the high densities.
The late-time spectra of SNe Iax differ significantly from

13
FIG. 9.— Velocity structure of the forbidden lines [Ca II] λ7291, [Ca II] λ7323, and [Fe II] λ7155 in SN 2002cx (green; Jha et al. 2006a), SN 2005hk (red;Sahu et al. 2008, and this work), and SN 2008A (blue; this work). The top three panels show each line at ∼230 days past B maximum and the bottom three panelsshow the same lines at ∼300 days past B maximum. The velocities of features are shown relative to the host-galaxy rest frame (in contrast to other figures, whichare in the SN rest frame defined by these narrow lines). The host redshifts are z = 0.023963± 0.000087 for SN 2002cx in CGCG 044−035 (Meyer et al. 2004;Wong et al. 2006), z = 0.012993± 0.000041 for SN 2005hk in UGC 272 (Meyer et al. 2004; Wong et al. 2006), and z = 0.016428± 0.000027 for SN 2008A inNGC 634 (Theureau et al. 1998). The line features of SN 2002cx and SN 2005hk are blueshifted compared to their hosts, while the features from SN 2008A areredshifted, with all the objects showing offsets of ∼400 km s−1. The features also show a significant decrease in velocity width over time.

14
FIG. 10.— Constraints on low-density oxygen from HST/ACS photometry of SN 2008A at +573 days past maximum light. The gray region represents the 1σuncertainty in our measured photometry. The red line shows the predicted r-band magnitude (with flux from the [O I] λ6300 line) assuming different amountsof unburned oxygen based on the models from Kozma et al. (2005). To calculate the probability density function (PDF) shown in the inset, we model the SEDwith a linear continuum and a Gaussian line profile centered at 6300 Å. We calculate the likelihood of the measured optical photometry (in F555W, F625W, andF775W) and marginalize over the slope and normalization of the continuum to derive our final PDF. The PDF peaks at zero line flux, and puts a 95% confidenceupper limit of 0.14 M� of oxygen below the critical density for [O I] λ6300. The pure deflagration model of Kozma et al. (2005) predicts 0.42 M� of low-densityunburned oxygen, which is ruled out at > 5σ.
those of normal SNe Ia. Normal SNe Ia cool through forbid-den iron lines in the nebular phase. SNe Iax have not beenshown to ever become nebular, and the strongest forbiddenlines are from [Ca II]. There are iron features in the late-timespectra of SNe Iax, but a significant fraction of the emergentradiation is produced by permitted transitions. It is not evenclear that radiative cooling dominates over adiabatic expan-sion at late times in SNe Iax. Because of these differences, itis possible that the predictions of IR catastrophe models fornormal SNe Ia do not apply to SNe Iax. Ironically, it couldbe that the high densities that should enhance the cooling andlead to an earlier IR catastrophe are instead responsible forquenching the expected changes in forbidden-line emission.
3.6. Bolometric LuminosityWe use ground-based and HST photometry to estimate
the UV/optical/near-IR luminosity LUVOIR of SN 2002cx,SN 2005hk, SN 2008A, and the normal SN Ia 2003hv. Soller-man et al. (2004) and Leloudas et al. (2009) show that the fluxin the near-IR becomes a significant fraction of the bolometricluminosity of SNe Ia at late times, and we are able to repli-
cate the near-IR corrections of Leloudas et al. (2009) in ourcalculations for SN 2003hv.
For SNe 2002cx and 2008A, we do not have much infor-mation about the flux in the IR. Phillips et al. (2007) presentnear-IR light curves of SN 2005hk to a few months past maxi-mum light, showing significantly enhanced near-IR flux com-pared to normal SNe Ia. However, at these epochs the near-IRcontribution to the bolometric luminosity is only a few per-cent, and it is unclear whether the excess near-IR flux persiststo later epochs, or merely becomes more significant earlier inSNe Iax than in normal SNe Ia.
To correct the SNe Iax for the poorly constrained near-IR flux, we integrate our interpolated photometric SED from3000 Å to 10000 Å and add the IR contribution fraction mea-sured for SN 2003hv (Leloudas et al. 2009). This approachproduces results that are consistent with the late-time near-IR data we do have (a WFC3/IR F110W measurement forSN 2008A and NICMOS F110W and F160W upper limits forSN 2005hk; Table 4). For the final two HST observations ofSN 2005hk, we have a detection only in a single optical pho-

15
FIG. 11.— Density evolution of SN 2002cx (green), SN 2005hk (red), and SN 2008A (blue) using the measured forbidden to permitted line ratio of Ca II, basedon the results of Ferland & Persson (1989). The line ratio does not give a unique temperature and density, so the allowed temperature range was constrained bythe presence of both Fe I and Fe II features, yielding the bands of allowed electron densities. Each object has a electron density of ∼ 109 cm−3 at ∼230 days pastmaximum light. The electron density is changing very slowly in all three objects; the results are consistent with no change in the electron density producing theobserved emission. A density decrease proportional to t−3 that would be predicted by simple homologous expansion models is not consistent with the measureddensity evolution of these three SNe.
tometric band; to calculate the bolometric luminosity at theselate epochs, we use the SED of SN 2008A at a similar phaseand scale the flux to match the SN 2005hk observation.
As shown in Figure 13, we find that the bolometric lightcurves of SNe Iax are markedly different from that of a typi-cal core-collapse SN IIP, SN 2005cs (Pastorello et al. 2009),though of course core-collapse SNe show a wide range of be-havior. The SNe Iax are similar to each other, and signifi-cantly less luminous than the normal SN Ia 2003hv at maxi-mum light, but broadly similar to SN 2003hv starting ∼100days after maximum light.
The faster decline rate of SN 2003hv compared to SNe Iaxfor the first 200 days suggests that the escape fraction ofgamma-rays in normal SNe Ia increases more quickly thanin SNe Iax. This may result from a more rapid decrease inthe density of the ejecta in normal SNe Ia (also suggested byour inferred SNe Iax densities; Figure 11). The bolometricluminosity of SN 2005hk roughly follows the full gamma-raytrapping model of Kromer et al. (2013) for all but the latestepoch. SN 2008A is also consistent with the full gamma-raytrapping model at early times.
However, in the latest observations, more than ∼400 dayspast maximum, that trend reverses: SN 2003hv declines moreslowly than SN 2005hk or SN 2008A. At these epochs, the de-cline rate for SN 2003hv is close to the predicted 56Co to 56Fedecay rate of 0.0098 mag day−1. This may be an indication
of positron trapping in the ejecta of this normal SN Ia. About3% of the 56Co decay energy goes to positrons, compared to97% in gamma-rays (Milne et al. 1999). Even if the gamma-ray escape fraction is near unity, positrons may be trapped by(nonradial) magnetic fields, and can lead to a shallowing ofthe bolometric luminosity decline rate when the luminosityfalls to ∼3% of the full gamma-ray trapping prediction.
At the epochs of our last observations of both SNe 2005hkand 2008A, the bolometric luminosity drops below that ofthe Kromer et al. (2013) model. This could be a sign thatthe gamma-ray escape fraction is beginning to increase, at amuch later epoch than occurs for normal SNe Ia because ofthe much higher densities in the ejecta. We might then predictthat at even later times, again when the bolometric luminos-ity falls to ∼3% of the full gamma-ray trapping prediction,the bolometric light curves of SNe Iax may flatten because ofpositron trapping. Nonetheless, this remains speculative, aswe are not measuring the true bolometric luminosity. If ei-ther normal SNe Ia or SNe Iax undergo an IR catastrophe,the UVOIR luminosity will not trace the bolometric lumi-nosity, complicating efforts to constrain the positron trapping.Moreover, many normal SNe Ia show steeper decline rates atlate epochs, inconsistent with full positron trapping (e.g., Lairet al. 2006), and in some cases even when the near-IR fluxis included in the “bolometric” luminosity (Stanishev et al.2007a).

16
FIG. 12.— V − R (top) and R − I (bottom) color evolution of SN 2008A compared to IR-catastrophe models from Sollerman et al. (2004). The dashed lineincludes photodisintegration in the model while the solid line does not. The data have been standardized to V , R, and I as in Figure 7. The models have beenshifted vertically to match the data at ∼200 days.
4. DISCUSSION
As described in §3.2, the velocity shifts measured from late-time forbidden lines in SNe 2002cx, 2005hk, and 2008A arelarger than can be accounted for by galactic rotation alone.These offsets are measured from [Ca II] and [Fe II] lines; ifthe ejecta were optically thin in these lines as expected, thevelocity offsets could be caused by bulk velocity shifts of theejecta. This might correspond to the high-velocity remnantpredicted by the failed deflagration model of Jordan et al.(2012), although significant velocity kicks are not found insimilar models from Kromer et al. (2013) or Fink et al. (2013).
The velocity shifts could also be the result of an asymmet-ric explosion. However, Chornock et al. (2006) measuredless than 1% polarization for SN 2005hk, implying very littleasymmetry at early times (see also Maund et al. 2010). Forthe normal Type Ia SN 2003hv, Leloudas et al. (2009) mea-sured a velocity shift of ∼2600 km s−1 in the [Fe II] λ8617line. Maeda et al. (2010a) show that the large velocity shifts inthe inner regions of SN 2003hv could arise in the deflagrationphase of a delayed detonation model. Maeda et al. (2010b)use a model with asymmetry of the deflagration phase to ex-plain the variation of SN Ia velocity gradients, and show thatdifferent viewing angles can account for much of the diver-sity of SNe Ia (but see Wang et al. 2013, who find a host-galaxy dependence that cannot be explained by viewing anglealone). In this model, the deflagration stage is characterizedby turbulent burning underlying a convective, bipolar struc-ture which creates an asymmetry in the ejecta (Kuhlen et al.2006; Röpke et al. 2007). The velocity shifts for SNe 2005hk
and SN 2008A are much smaller than that for SN 2003hv,which might be caused by a lower kinetic energy during thedeflagration phase, and perhaps implying less total burning.The fact that the forbidden-line velocity offsets are the sameorder as the line widths in both SNe Iax and normal SNe Iamay point to a common physical origin.
The identification of S II and Si II lines in early-time spec-tra of SNe Iax point to a thermonuclear event (Foley et al.2010a, 2013). Our identification of late-time [Ni II] λ7378 inSN 2005hk and SN 2008A could thus have important conse-quences, as Maeda et al. (2010a,b) identify both [Fe II] λ7155and [Ni II] λ7378 as lines that correspond to deflagrationashes. They argue that these lines trace material subject tolong exposure to low heat, as opposed to [Fe III] λ4701 thattraces the detonation phase. This [Fe III] transition is not ob-vious in SN Iax spectra at late times, which may imply thatthere is no transition to a detonation.
What could suppress a transition to a detonation in SNe Iax?From simulations, Röpke et al. (2007) suggest that the num-ber and position of deflagration ignition points could be a sig-nificant factor. For example, they claim that a model withtwo overlapping ignition bubbles at the center of the whitedwarf was unlikely to produce a detonation; thus, such a sce-nario might produce a SN Iax. Nevertheless, even a pure de-flagration does not explain the incredibly low kinetic energyfor the most extreme members of the SN Iax class, such asSN 2008ha.
To explore low-energy pure deflagration scenarios for moretypical SNe Iax, we examined a homologous expansion model

17
FIG. 13.— Bolometric light curves of SN 2002cx (Li et al. 2003; Jha et al. 2006a), SN 2005hk (Phillips et al. 2007; Sahu et al. 2008, and data from SDSS-II),SN 2008A (Ganeshalingam et al. 2010; Hicken et al. 2012, and this work), the normal Type Ia SN 2003hv (Leloudas et al. 2009), and the Type IIP SN 2005cs(Pastorello et al. 2009). The bolometric luminosities of SNe Iax are similar to those of normal SNe Ia starting a few months after maximum, but differ significantlyfrom those of SNe IIP. SN 2003hv declines much faster than SN 2008A and its counterparts at ∼200 days past maximum. The magenta line shows the modelfrom Kromer et al. (2013) that assumes complete gamma-ray trapping. This model fits most of the data well, but it is not consistent with the latest measurementsof SN 2008A and the last measurement of SN 2005hk.
using the density profiles of Röpke (2005). We find that it ispossible to produce the high densities observed at late times,but the initial kinetic energy distribution must be several timeslower than in the model (also assuming the emitting regionmoves to lower velocities and roughly constant density, asFigure 11 requires). Scaling down the velocity of the densitydistribution, we find that the speed of material at the radiuswith 10% of the total enclosed mass (R0.1) must be as low as150 km s−1 to approach the observations. At first glance, thisresult seems like it could qualitatively explain the lack of the[O I] λ6300 flux by keeping a substantial amount of unburnedmaterial at high density. However, quantitatively, we find thateven for homologous expansion that is scaled to the lower ki-netic energies, at 600 days after maximum brightness, ∼55%of the oxygen should still be below the critical density. Thiscorresponds to ∼0.2 M� of low-density oxygen in the Röpke(2005) models, and is ruled out by our observations at highsignificance (Figure 10).
Generically, we find that even if there is a photosphere hid-ing the innermost regions, the models predict oxygen at highervelocities that should be visible, and yet is not seen. Observa-tionally, the decreasing widths of the forbidden lines of ironand calcium with time (see Figure 9) imply that these lines arenot being excited everywhere in the ejecta. If these lines areonly produced near the “photosphere” responsible for the nu-merous permitted Fe lines, there must be a large reservoir of
lower-density material at higher velocities that is not radiatingeither in these lines, nor is it seen in lower density tracers like[O I] λ6300.
In normal SNe Ia, the widths of nebular lines at late timesis of order 104 km s−1 (Mazzali et al. 1998; Silverman et al.2013a). If, as expected, we are “seeing through” all the ex-cited ejecta in these forbidden transitions, the line profilesdirectly reveal the velocity structure, and the observed linewidth is effectively the “final” velocity for the ejecta, v∞.Moreover, for an exploding white dwarf that is completelydisrupted, we expect v∞ & vesc, the escape velocity of thatmaterial in the white dwarf; otherwise the explosion wouldneed to be finely tuned to barely unbind the white dwarf andleave the ejecta expanding at low velocities.
The widths of forbidden lines of Ca II and Fe II in thelate-time spectra of SN 2005hk are unprecedentedly low —500 km s−1. If this is interpreted as the velocity at infinity forthe emitting ejecta, it is an order of magnitude below the es-cape velocity from the surface of the white dwarf, v∞� vesc.Using a simple model of a Chandrasekhar-mass white dwarfwith a polytropic equation of state, we calculated the escapevelocity as a function of the enclosed mass throughout thewhite dwarf. At vesc = 500 km s−1 the enclosed mass is just∼ 5× 10⁻⁶ of the total mass. It seems implausible that allof the late-time emission arises from just this innermost tinyfraction of the white dwarf.

18
FIG. 14.— Total ejected mass vs. radioactive nickel mass of white-dwarf SNe. Subclasses of objects are grouped by color as indicated in the plot. Circlesdenote typical members of the subclass, while squares show more extreme members. The dashed line denotes where the ejected mass equals the radioactivenickel mass. Objects to the right of the line (like SN 2002bj) require additional energy sources (beyond 56Ni radioactive power) to explain their luminosity.References: SN 1991T (Filippenko et al. 1992a; Phillips et al. 1992); SN 1998de, SN 2007al, SN 2007au, and PTF 2009dav (Sullivan et al. 2011); SN 1999aaand SN 1999dq (Jha et al. 2006b); SN 2002bj (Poznanski et al. 2010); SN 2002cx (Li et al. 2003; Jha et al. 2006a); SN 2003du (Hicken et al. 2009); SN 2003hv(Leloudas et al. 2009); SN 2005E (Perets et al. 2010); SN 2005M and SN 2005eq (Ganeshalingam et al. 2010); SN 2005hk (Phillips et al. 2007); SN 2007ax(Kasliwal et al. 2008); SN 2007if (Scalzo et al. 2010); SN 2007qd (McClelland et al. 2010); SN 2008A (this work); SN 2008ge (Foley et al. 2010b); SN 2008ha(Foley et al. 2009; Valenti et al. 2009); SN 2009dc (Taubenberger et al. 2011); SN 2009ku (Narayan et al. 2011); and SN 2010X (Kasliwal et al. 2010). Ancillarydata were used in the analysis, including ejecta velocities (Foley et al. 2011), rise times (Ganeshalingam et al. 2011), bolometric corrections (Contardo et al.2000), and distances and luminosities (Ganeshalingam et al. 2013).
More likely, we are witnessing a weak explosion, in whichthe explosion energy is close to or less than the binding en-ergy of the white dwarf. The material emitting in the for-bidden lines was barely unbound, and we observe it at lowv∞ � vesc. In that case, unless again the explosion energyis finely tuned, we would also expect a significant fraction ofthe original white dwarf to not reach escape velocity, and re-main bound, leaving behind a remnant. The high densitiesobserved might also be explained if the white dwarf was notfully disrupted, with the mixed composition of the unboundejecta arising from a deflagration. Livne et al. (2005) showthat a single ignition that is offset from the center of the whitedwarf could form a bubble that would convectively rise andbreak through the surface, without fusion outside of the bub-ble. Events like this could explain typical SNe Iax and theextreme SN 2008ha, yet still show the thermonuclear signa-ture of Si II and S II.
Kromer et al. (2013) and Jordan et al. (2012) find that afailed deflagration of a white dwarf can produce propertiessimilar to those observed for SNe 2005hk and 2008A. A keyprediction of these models is that the explosion leaves behinda bound remnant. This is consistent with our argument above
about the escape velocity of the white dwarf. Jordan et al.(2012) find that the remnant receives a kick of ∼500 km s−1,which is roughly consistent with our measurements of the ve-locity offsets from the host galaxies. This assumes that the ve-locities of the forbidden lines are measuring the bulk motionof the ejecta rather than an excitation effect. While Kromeret al. (2013) do not find such significant kick velocities, theirmodel matches the bolometric light curves of SN 2005hk andSN 2008A relatively well, except at the latest observed epochs(Figure 13).
While suggestive, the case for a bound remnant is not with-out problems. If we assume homologous expansion, materialat 300 km s−1, about half the width of the forbidden lines,would be at 100 AU about 600 days past explosion. Thiscannot be the radius of a true photosphere, because the bolo-metric luminosity at that epoch (∼1038 erg s−1) is much toolow given the estimated temperature. The bolometric lumi-nosity limits the photospheric radius to . 3.5 AU, making itdifficult to directly connect the high density expanding ma-terial with a potential bound remnant. Moreover, these mod-els still require an explanation for the lack of unburned mate-rial detected in ejecta that should be well mixed (including

19
intermediate-mass and iron-group elements) and reach lowdensity. Perhaps additional complexity is required, such asback-warming in which inwardly traveling gamma-rays de-posit their energy and heat lower-velocity regions, while out-wardly traveling gamma-rays escape.
Throughout this paper, we have assumed that radioactiveheating from 56Ni dominates the luminosity of these SNe Iax.It is instructive to put SNe Iax in context with other proba-ble thermonuclear explosions of white dwarfs. We compileda sample of such objects from the literature to infer their ra-dioactive nickel mass and ejecta mass; the results are shownin Figure 14. The 56Ni mass was calculated using the Arnett(1982) rule, and for this comparison we simply adopted a uni-form uncertainty of 15% for all bolometric luminosities anda 10% uncertainty for the SN rise times. These correspondto typical published uncertainties for the objects for whicherror bars were reported. We calculated the ejecta mass fol-lowing Foley et al. (2009), similarly assuming a uniform 5%uncertainty on the ejecta velocities. The relations are scaledsuch that normal SNe Ia produce 1.4 M� of ejecta, with ∼0.5M� of 56Ni. Normal SNe Ia form an approximate continuumfrom the subluminous SN 1991bg-like objects (Filippenkoet al. 1992b; Leibundgut et al. 1993) to the superluminousSN 1991T-like (Filippenko et al. 1992a; Phillips et al. 1992),and even to more extreme “super-Chandra” objects such asSN 2009dc (Howell et al. 2006; Scalzo et al. 2010; Tauben-berger et al. 2011; Silverman et al. 2011).
The three SNe Iax studied in detail in this work clusterbelow the SN 1991bg-like objects with ∼0.5 M� of ejectaand 0.15 M� of radioactive nickel. However, the SNe Iaxclass shows significant diversity in both axes: SN 2009kuis very close to having burned a large fraction of its ejectainto 56Ni, while SN 2008ge shows lower amounts of ra-dioactive nickel than normal SNe Ia, but a similar ejectamass. Two of the most extreme members of the SNe Iaxsubclass are SN 2008ha and SN 2007qd (McClelland et al.2010); both events produced low ejecta mass and 56Ni mass,similar to other low-luminosity transients like the “calcium-rich” SN 2005E (Perets et al. 2010) or the “SN .Ia” candi-date SN 2010X (Bildsten et al. 2007; Kasliwal et al. 2010).Taken together, the luminosities, rise times, and ejecta ve-locities of SNe Iax certainly do not contradict the hypothesisthat SNe Iax are thermonuclear explosions of white dwarfs inwhich radioactive nickel provides the UVOIR light, thoughthe observations do pose a significant challenge to models.
5. SUMMARY
We present ground-based and HST photometry and spec-troscopy of SNe 2005hk and 2008A, two typical SNe Iax.These objects remain at high density for∼2 years after explo-sion and are not observed to enter the typical nebular phaseup to 400 days after B-band maximum brightness. We findno evidence for unburned material at low velocities, either di-rectly through spectroscopy or indirectly with our HST pho-tometry. Based on emission-line diagnostics, we find that thedensity of the emitting region remains roughly constant overthe duration of the observations, though the widths of eventhe forbidden lines decrease. We do not see the signature ofthe IR catastrophe in optical colors. The bolometric luminos-ity of SN 2005hk and SN 2008A fades more slowly than thatof normal SNe Ia at 100–200 days after maximum brightness,but then declines faster than in normal SNe Ia at phases of400–600 days. Failed deflagration models that leave a bound
remnant (e.g., Jordan et al. 2012; Kromer et al. 2013) showpromise for explaining these explosions, but no single pro-posed model can explain all of our observations.
We dedicate this paper to the lasting memory of our dearfriend and cherished colleague, Weidong Li.
We thank Mark Phillips and Roger Romani for helpin acquiring the HST observations of SN 2005hk. Weacknowledge usage of the NASA Extragalactic Database(http://ned.ipac.caltech.edu) and the HyperLeda database(http://leda.univ-lyon1.fr).
This research at Rutgers University was supported throughNASA/HST grants GO-11133.01 and GO-11590.01, alongwith U.S. Department of Energy (DOE) grant DE-FG02-08ER41562, and National Science Foundation (NSF) CA-REER award AST-0847157 to S.W.J., and a GAANN Fel-lowship to C.M. J.M.S. is supported by an NSF Astronomyand Astrophysics Postdoctoral Fellowship under award AST-1302771. The research of J.C.W. is supported in part by NSFGrant AST-1109801. G.L. is supported by the Swedish Re-search Council through grant No. 623-2011-7117. A.V.F. andhis group at UC Berkeley are funded by Gary and CynthiaBengier, the Richard and Rhoda Goldman Fund, NSF grantAST-1211916, the TABASGO Foundation, and NASA/HSTgrants GO-10877 and AR-12623.
Support for HST programs GO-10877, GO-11133, GO-11590, and AR-12623 was provided by NASA through a grantfrom the Space Telescope Science Institute, which is operatedby the Association of Universities for Research in Astronomy,Incorporated, under NASA contract NAS5-26555.
Some of the data presented herein were obtained at the W.M. Keck Observatory, which is operated as a scientific part-nership among the University of California, the California In-stitute of Technology, and NASA, made possible by the gen-erous financial support of the W. M. Keck Foundation. Theauthors recognize and acknowledge the very significant cul-tural role and reverence that the summit of Mauna Kea hasalways had within the indigenous Hawaiian community, andwe are most privileged to have the opportunity to explore theUniverse from this mountain.
Funding for the SDSS and SDSS-II has been provided bythe Alfred P. Sloan Foundation, the Participating Institutions,the NSF, the U.S. Department of Energy, NASA, the JapaneseMonbukagakusho, the Max Planck Society, and the HigherEducation Funding Council for England. The SDSS WebSite is http://www.sdss.org/. The SDSS is managed by theAstrophysical Research Consortium for the Participating In-stitutions. The Participating Institutions are the AmericanMuseum of Natural History, Astrophysical Institute Potsdam,University of Basel, University of Cambridge, Case WesternReserve University, University of Chicago, Drexel University,Fermilab, the Institute for Advanced Study, the Japan Partic-ipation Group, Johns Hopkins University, the Joint Institutefor Nuclear Astrophysics, the Kavli Institute for Particle As-trophysics and Cosmology, the Korean Scientist Group, theChinese Academy of Sciences (LAMOST), Los Alamos Na-tional Laboratory, the Max-Planck-Institute for Astronomy(MPIA), the Max-Planck-Institute for Astrophysics (MPA),New Mexico State University, Ohio State University, Univer-sity of Pittsburgh, University of Portsmouth, Princeton Uni-versity, the United States Naval Observatory, and the Univer-sity of Washington.

20
REFERENCES
Arnett, W. D. 1982, ApJ, 253, 785Axelrod, T. S. 1980, PhD thesis, AA(California Univ., Santa Cruz.)Bildsten, L., Shen, K. J., Weinberg, N. N., & Nelemans, G. 2007, ApJ, 662,
L95Branch, D., Baron, E., Hall, N., Melakayil, M., & Parrent, J. 2005, PASP,
117, 545Branch, D., Baron, E., Thomas, R. C., et al. 2004, PASP, 116, 903Branch, D., Jeffery, D. J., Parrent, J., et al. 2008, PASP, 120, 135Chiaberge, M., Lim, P. L., Kozhurina-Platais, V., Sirianni, M., & Mack, J.
2009, Updated CTE photometric correction for WFC and HRC, Tech.rep., STSci
Chornock, R., Filippenko, A. V., Branch, D., et al. 2006, PASP, 118, 722Conley, A., Guy, J., Sullivan, M., et al. 2011, ApJS, 192, 1Contardo, G., Leibundgut, B., & Vacca, W. D. 2000, A&A, 359, 876Dolphin, A. E. 2009, PASP, 121, 655Faber, S. M., Phillips, A. C., Kibrick, R. I., et al. 2003, in Society of
Photo-Optical Instrumentation Engineers (SPIE) Conference Series, Vol.4841, Society of Photo-Optical Instrumentation Engineers (SPIE)Conference Series, ed. M. Iye & A. F. M. Moorwood, 1657–1669
Ferland, G. J., & Persson, S. E. 1989, ApJ, 347, 656Filippenko, A. V. 2003, in From Twilight to Highlight: The Physics of
Supernovae, ed. W. Hillebrandt & B. Leibundgut, 171Filippenko, A. V., Li, W. D., Treffers, R. R., & Modjaz, M. 2001, in
Astronomical Society of the Pacific Conference Series, Vol. 246, IAUColloq. 183: Small Telescope Astronomy on Global Scales, ed.B. Paczynski, W.-P. Chen, & C. Lemme, 121
Filippenko, A. V., Richmond, M. W., Matheson, T., et al. 1992a, ApJ, 384,L15
Filippenko, A. V., Richmond, M. W., Branch, D., et al. 1992b, AJ, 104, 1543Fink, M., Kromer, M., Seitenzahl, I. R., et al. 2013, ArXiv e-prints,
arXiv:1308.3257Folatelli, G., Phillips, M. M., Morrell, N., et al. 2012, ApJ, 745, 74Foley, R. J., Brown, P. J., Rest, A., et al. 2010a, ApJ, 708, L61Foley, R. J., Sanders, N. E., & Kirshner, R. P. 2011, ApJ, 742, 89Foley, R. J., Chornock, R., Filippenko, A. V., et al. 2009, AJ, 138, 376Foley, R. J., Rest, A., Stritzinger, M., et al. 2010b, AJ, 140, 1321Foley, R. J., Challis, P. J., Chornock, R., et al. 2013, ApJ, 767, 57Frieman, J. A., Bassett, B., Becker, A., et al. 2008, AJ, 135, 338Fruchter, A., Sosey, M., Hack, W., et al. 2009, HST MultiDrizzle HandbookFukugita, M., Ichikawa, T., Gunn, J. E., et al. 1996, AJ, 111, 1748Gamezo, V. N., Khokhlov, A. M., & Oran, E. S. 2004, Physical Review
Letters, 92, 211102—. 2005, ApJ, 623, 337Gamezo, V. N., Khokhlov, A. M., Oran, E. S., Chtchelkanova, A. Y., &
Rosenberg, R. O. 2003, Science, 299, 77Ganeshalingam, M., Li, W., & Filippenko, A. V. 2011, MNRAS, 416, 2607—. 2013, MNRAS, 433, 2240Ganeshalingam, M., Li, W., Filippenko, A. V., et al. 2010, ApJS, 190, 418Hatano, K., Branch, D., Fisher, A., Millard, J., & Baron, E. 1999, ApJS,
121, 233Hicken, M., Challis, P., Jha, S., et al. 2009, ApJ, 700, 331Hicken, M., Challis, P., Kirshner, R. P., et al. 2012, ApJS, 200, 12Holtzman, J. A., Hester, J. J., Casertano, S., et al. 1995, PASP, 107, 156Holtzman, J. A., Marriner, J., Kessler, R., et al. 2008, AJ, 136, 2306Hook, R., & Stoehr, F. 2008, WFC3 Support in Tiny Tim, Tech. rep.Howell, D. A., Sullivan, M., Nugent, P. E., et al. 2006, Nature, 443, 308Jha, S., Branch, D., Chornock, R., et al. 2006a, AJ, 132, 189Jha, S., Garnavich, P. M., Kirshner, R. P., et al. 1999, ApJS, 125, 73Jha, S., Kirshner, R. P., Challis, P., et al. 2006b, AJ, 131, 527Jordan, IV, G. C., Perets, H. B., Fisher, R. T., & van Rossum, D. R. 2012,
ApJ, 761, L23Kasen, D. 2006, ApJ, 649, 939Kasliwal, M. M., Ofek, E. O., Gal-Yam, A., et al. 2008, ApJ, 683, L29Kasliwal, M. M., Kulkarni, S. R., Gal-Yam, A., et al. 2010, ApJ, 723, L98Kessler, R., Becker, A. C., Cinabro, D., et al. 2009, ApJS, 185, 32Khokhlov, A. M. 1991, A&A, 245, 114Kirshner, R. P., Jeffery, D. J., Leibundgut, B., et al. 1993, ApJ, 415, 589Kozma, C., & Fransson, C. 1998, ApJ, 497, 431Kozma, C., Fransson, C., Hillebrandt, W., et al. 2005, A&A, 437, 983Krist, J. 1993, in Astronomical Society of the Pacific Conference Series,
Vol. 52, Astronomical Data Analysis Software and Systems II, ed.R. J. Hanisch, R. J. V. Brissenden, & J. Barnes, 536–+
Kromer, M., Fink, M., Stanishev, V., et al. 2013, MNRAS, 429, 2287Kuhlen, M., Woosley, S. E., & Glatzmaier, G. A. 2006, ApJ, 640, 407Lair, J. C., Leising, M. D., Milne, P. A., & Williams, G. G. 2006, AJ, 132,
2024
Leibundgut, B., Kirshner, R. P., Phillips, M. M., et al. 1993, AJ, 105, 301Leloudas, G., Stritzinger, M. D., Sollerman, J., et al. 2009, A&A, 505, 265Leonard, D. C. 2007, ApJ, 670, 1275Li, W., Filippenko, A. V., Treffers, R. R., et al. 2001a, ApJ, 546, 734Li, W., Filippenko, A. V., Gates, E., et al. 2001b, PASP, 113, 1178Li, W., Filippenko, A. V., Chornock, R., et al. 2003, PASP, 115, 453Livne, E., Asida, S. M., & Höflich, P. 2005, ApJ, 632, 443Maeda, K., Taubenberger, S., Sollerman, J., et al. 2010a, ApJ, 708, 1703Maeda, K., Benetti, S., Stritzinger, M., et al. 2010b, Nature, 466, 82Maund, J. R., Wheeler, J. C., Wang, L., et al. 2010, ApJ, 722, 1162Mazzali, P. A., Cappellaro, E., Danziger, I. J., Turatto, M., & Benetti, S.
1998, ApJ, 499, L49McClelland, C. M., Garnavich, P. M., Galbany, L., et al. 2010, ApJ, 720, 704Meyer, M. J., Zwaan, M. A., Webster, R. L., et al. 2004, MNRAS, 350, 1195Miller, J. S., & Stone, R. P. S. 1993, Lick Obs. Tech. Rep. 66 (Santa Cruz:
Lick Obs.)Milne, P. A., The, L.-S., & Leising, M. D. 1999, ApJS, 124, 503Moriya, T., Tominaga, N., Tanaka, M., et al. 2010, ArXiv e-prints,
arXiv:1006.5336Mould, J. R., Hughes, S. M. G., Stetson, P. B., et al. 2000, ApJ, 528, 655Narayan, G., Foley, R. J., Berger, E., et al. 2011, ApJ, 731, L11Oke, J. B., Cohen, J. G., Carr, M., et al. 1995, PASP, 107, 375Parrent, J. T., Thomas, R. C., Fesen, R. A., et al. 2011, ApJ, 732, 30Pastorello, A., Valenti, S., Zampieri, L., et al. 2009, MNRAS, 394, 2266Paturel, G., Petit, C., Prugniel, P., et al. 2003, A&A, 412, 45Perets, H. B., Gal-Yam, A., Mazzali, P. A., et al. 2010, Nature, 465, 322Perlmutter, S., Aldering, G., Goldhaber, G., et al. 1999, ApJ, 517, 565Phillips, M. M. 1993, ApJ, 413, L105Phillips, M. M., Wells, L. A., Suntzeff, N. B., et al. 1992, AJ, 103, 1632Phillips, M. M., Li, W., Frieman, J. A., et al. 2007, PASP, 119, 360Poznanski, D., Chornock, R., Nugent, P. E., et al. 2010, Science, 327, 58Riess, A. G., Filippenko, A. V., Challis, P., et al. 1998, AJ, 116, 1009Röpke, F. K. 2005, A&A, 432, 969Röpke, F. K. 2008, ArXiv e-prints, arXiv:0804.2147Röpke, F. K., Woosley, S. E., & Hillebrandt, W. 2007, ApJ, 660, 1344Sahu, D. K., Tanaka, M., Anupama, G. C., et al. 2008, ApJ, 680, 580Sako, M., Bassett, B., Becker, A., et al. 2008, AJ, 135, 348Scalzo, R. A., Aldering, G., Antilogus, P., et al. 2010, ApJ, 713, 1073Silverman, J. M., & Filippenko, A. V. 2012, MNRAS, 425, 1917Silverman, J. M., Ganeshalingam, M., & Filippenko, A. V. 2013a, MNRAS,
430, 1030Silverman, J. M., Ganeshalingam, M., Li, W., et al. 2011, MNRAS, 410, 585Silverman, J. M., Foley, R. J., Filippenko, A. V., et al. 2012, MNRAS, 425,
1789Silverman, J. M., Vinko, J., Kasliwal, M. M., et al. 2013b, ArXiv e-prints,
arXiv:1307.3555Sirianni, M., Jee, M. J., Benítez, N., et al. 2005, PASP, 117, 1049Sollerman, J., Lindahl, J., Kozma, C., et al. 2004, A&A, 428, 555Stanishev, V., Goobar, A., Benetti, S., et al. 2007a, A&A, 469, 645Stanishev, V., Taubenberger, S., Blanc, G., et al. 2007b, in American
Institute of Physics Conference Series, Vol. 924, The MulticoloredLandscape of Compact Objects and Their Explosive Origins, ed. T. diSalvo, G. L. Israel, L. Piersant, L. Burderi, G. Matt, A. Tornambe, &M. T. Menna, 336–341
Sullivan, M., Guy, J., Conley, A., et al. 2011, ApJ, 737, 102Taubenberger, S., Kromer, M., Pakmor, R., et al. 2013, ArXiv e-prints,
arXiv:1308.3145Taubenberger, S., Benetti, S., Childress, M., et al. 2011, MNRAS, 412, 2735Theureau, G., Bottinelli, L., Coudreau-Durand, N., et al. 1998, A&AS, 130,
333Thomas, R. C., Nugent, P. E., & Meza, J. C. 2011a, PASP, 123, 237Thomas, R. C., Aldering, G., Antilogus, P., et al. 2007, ApJ, 654, L53—. 2011b, ApJ, 743, 27Valenti, S., Pastorello, A., Cappellaro, E., et al. 2009, Nature, 459, 674Wang, X., Wang, L., Filippenko, A. V., Zhang, T., & Zhao, X. 2013,
Science, 340, 170Wong, M. H., Pavlovsky, C., Long, K., et al. 2010, Wide Field Camera 3
Instrument Handbook, Version 2.0 (Baltimore: STScI)Wong, O. I., Ryan-Weber, E. V., Garcia-Appadoo, D. A., et al. 2006,
MNRAS, 371, 1855Wood-Vasey, W. M., Miknaitis, G., Stubbs, C. W., et al. 2007, ApJ, 666, 694


![Phase transitions in the A 2 BX 4 -compound: Tetramethylammonium tetrachlorozincate tetrachlorocuprate, [(CH 3 ) 4 N] 2 Zn 0.5 Cu 0.5 Cl 4 , and room temperature crystal structure](https://static.fdokumen.com/doc/165x107/632340c4807dc363600ace49/phase-transitions-in-the-a-2-bx-4-compound-tetramethylammonium-tetrachlorozincate.jpg)