The Peculiar SN 2005hk: Do Some Type Ia Supernovae Explode as Deflagrations?
63
arXiv:astro-ph/0611295v2 26 Mar 2007 The Peculiar SN 2005hk: Do Some Type Ia Supernovae Explode as Deflagrations? 1,2,3 M. M. Phillips 4 , Weidong Li 5 , Joshua A. Frieman 6,7,8 , S. I. Blinnikov 9,10 , Darren DePoy 11 , Jos´ e L. Prieto 11 , P. Milne 12 , Carlos Contreras 4 ,Gast´onFolatelli 4 , Nidia Morrell 4 , Mario Hamuy 13 , Nicholas B. Suntzeff 14 , Miguel Roth 4 , Sergio Gonz´alez 4 , Wojtek Krzeminski 4 , Alexei V. Filippenko 5 , Wendy L. Freedman 15 , Ryan Chornock 5 , Saurabh Jha 5,16 , Barry F. Madore 15,17 , S. E. Persson 15 , Christopher R. Burns 15 , Pamela Wyatt 15 , David Murphy 15 , Ryan J. Foley 5 , Mohan Ganeshalingam 5 , Franklin J. D. Serduke 5 , Kevin Krisciunas, 18 , Bruce Bassett 19,20 , Andrew Becker 21 , Ben Dilday 7,22 , J. Eastman 11 , Peter M. Garnavich 18 , Jon Holtzman 23 , Richard Kessler 7,24 , Hubert Lampeitl 25 , John Marriner 8 , S. Frank 11 , J. L. Marshall 11 , Gajus Miknaitis 8 , Masao Sako 26 , Donald P. Schneider 27 , Kurt van der Heyden 19 , and Naoki Yasuda 28
-
Upload
independent -
Category
Documents
-
view
1 -
download
0
Transcript of The Peculiar SN 2005hk: Do Some Type Ia Supernovae Explode as Deflagrations?

arX
iv:a
stro
-ph/
0611
295v
2 2
6 M
ar 2
007
The Peculiar SN 2005hk: Do Some Type Ia Supernovae Explode
as Deflagrations?1,2,3
M. M. Phillips4, Weidong Li5, Joshua A. Frieman6,7,8, S. I. Blinnikov9,10, Darren DePoy11,
Jose L. Prieto11, P. Milne12, Carlos Contreras4, Gaston Folatelli4, Nidia Morrell4, Mario
Hamuy13, Nicholas B. Suntzeff14, Miguel Roth4, Sergio Gonzalez4, Wojtek Krzeminski4,
Alexei V. Filippenko5, Wendy L. Freedman15, Ryan Chornock5, Saurabh Jha5,16,
Barry F. Madore15,17, S. E. Persson15, Christopher R. Burns15, Pamela Wyatt15,
David Murphy15, Ryan J. Foley5, Mohan Ganeshalingam5, Franklin J. D. Serduke5,
Kevin Krisciunas,18, Bruce Bassett19,20, Andrew Becker21, Ben Dilday7,22, J. Eastman11,
Peter M. Garnavich18, Jon Holtzman23, Richard Kessler7,24, Hubert Lampeitl25,
John Marriner8, S. Frank11, J. L. Marshall11, Gajus Miknaitis8, Masao Sako26,
Donald P. Schneider27, Kurt van der Heyden19, and Naoki Yasuda28

– 2 –
1Based in part on observations taken at the Cerro Tololo Inter-American Observatory, National Optical
Astronomy Observatory, which is operated by the Association of Universities for Research in Astronomy,
Inc. (AURA) under cooperative agreement with the National Science Foundation.
2Based in part on observations obtained with the Apache Point Observatory 3.5-meter telescope, which
is owned and operated by the Astrophysical Research Consortium.
3Partly based on observations collected at the European Southern Observatory, Chile, in the course of
programme 076.A-0156
4Las Campanas Observatory, Carnegie Observatories, Casilla 601, La Serena, Chile.
5Department of Astronomy, University of California, Berkeley, CA 94720-3411.
6Department of Astronomy and Astrophysics, The University of Chicago, 5640 South Ellis Avenue,
Chicago, IL 60637.
7Kavli Institute for Cosmological Physics, The University of Chicago, 5640 South Ellis Avenue Chicago,
IL 60637.
8Fermi National Accelerator Laboratory, P.O. Box 500, Batavia, IL 60510.
9ITEP, 117218 Moscow, Russia.
10Max-Planck-Institut fur Astrophysik, Karl-Schwarzschild-Str. 1, 85741 Garching, Germany.
11Department of Astronomy, Ohio State University, 140 West 18th Avenue, Columbus, OH 43210-1173.
12Steward Observatory, 933 North Cherry Ave., Room N204, Tucson, AZ 85721.
13Universidad de Chile, Departamento de Astronomıa, Casilla 36-D, Santiago, Chile.
14Texas A&M University Physics Department, College Station, TX 77843-4242.
15Observatories of the Carnegie Institution of Washington, 813 Santa Barbara St., Pasadena, CA 91101.
16Kavli Institute for Particle Astrophysics and Cosmology, Stanford Linear Accelerator Center, 2575 Sand
Hill Rd. MS 29, Menlo Park, CA 94025.
17Infrared Processing and Analysis Center, Caltech/Jet Propulsion Laboratory, Pasadena, CA 91125.
18Department of Physics and Astronomy, University of Notre Dame, 225 Nieuwland Science, Notre Dame,
IN 46556-5670.
19South African Astronomical Observatory, Cape Town, South Africa.
20Applied Mathematics Department, University of Cape Town, Cape Town, South Africa.
21Department of Astronomy, University of Washington, Box 351580, Seattle, WA 98195.
22Department of Physics, The University of Chicago, 5640 South Ellis Avenue, Chicago, IL 60637.
23Department of Astronomy, New Mexico State University, Dept. 4500, Las Cruces, NM 88003.
24Center for Astrophysical Thermonuclear Flashes, University of Chicago, Chicago, IL 60637.
25Space Telescope Science Institute, 3700 San Martin Drive, Baltimore, MD 21218.

– 3 –
mmp, ccontreras, gfolatelli, nmorrell, miguel, sgonzalez, [email protected]
weidong, rfoley, chornock, mganesh, [email protected]
frieman, gm, [email protected]
depoy, prieto, frank, [email protected]
wendy, persson, david, cburns, jmarshall, [email protected]
kkrisciu, [email protected]
bruce, [email protected]
ABSTRACT
We present extensive u′g′r′i′BV RIY JHKs photometry and optical spec-
troscopy of the Type Ia supernova (SN) 2005hk. These data reveal that
SN 2005hk was nearly identical in its observed properties to SN 2002cx, which
has been called “the most peculiar known Type Ia supernova.” Both supernovae
exhibited high-ionization SN 1991T-like pre-maximum spectra, yet low peak lu-
minosities like SN 1991bg. The spectra reveal that SN 2005hk, like SN 2002cx,
exhibited expansion velocities that were roughly half those of typical Type Ia
26Department of Physics and Astronomy, University of Pennsylvania, Philadelphia, PA 19104.
27Department of Astronomy and Astrophysics, The Pennsylvania State University, 525 Davey Laboratory,
University Park, PA 16802.
28Institute for Cosmic Ray Research, University of Tokyo, Kashiwa, 277-8582, Japan.

– 4 –
supernovae. The R and I light curves of both supernovae were also peculiar in
not displaying the secondary maximum observed for normal Type Ia supernovae.
Our Y JH photometry of SN 2005hk reveals the same peculiarity in the near-
infrared. By combining our optical and near-infrared photometry of SN 2005hk
with published ultraviolet light curves obtained with the Swift satellite, we are
able to construct a bolometric light curve from ∼15 days before to ∼60 days
after B maximum. The shape and unusually low peak luminosity of this light
curve, plus the low expansion velocities and absence of a secondary maximum at
red and near-infrared wavelengths, are all in reasonable agreement with model
calculations of a three-dimensional deflagration that produces ∼0.25 M⊙ of 56Ni.
Subject headings: supernovae: individual (SN 2005hk) — supernovae: photome-
try — supernovae: spectroscopy
1. Introduction
More than 45 years ago, Hoyle & Fowler (1960) first recognized that Type Ia supernovae
(SNe Ia; for a review of supernova classification, see Filippenko 1997) were the observational
signature of the thermonuclear disruption of a degenerate star. Over the intervening years,
progress has been slow in identifying the progenitor systems of these objects and under-
standing the details of the explosion mechanism. At present, the most popular model for
the progenitors of typical SNe Ia is an accreting C/O white dwarf approaching the Chan-
drasekhar mass limit in a binary system. As to the explosion mechanism, there is general
consensus that pure deflagration models – ones where the nuclear burning front remains sub-
sonic throughout the entire explosion – do not produce sufficient 56Ni and kinetic energy, are
too mixed, and leave behind too much unburned carbon and oxygen to account for normal-
luminosity SNe Ia (Gamezo, Khokhlov, & Oran 2004; Blinnikov et al. 2006). Rather, the
explosion likely begins as a subsonic flame that at some point converts to a slightly su-
personic detonation (Gamezo, Khokhlov, & Oran 2004). Such “delayed detonation” models
have been shown to reproduce the general observational characteristics of typical SNe Ia
(e.g., see Hoflich et al. 2003), although these results await confirmation from detailed three-
dimensional (3D) modeling.
SNe Ia have been shown to be excellent cosmological standard candles that can be
observed at epochs when the Universe was a third or less of its present age (for a review,
see Filippenko 2005). After application of a luminosity correction based on the decline rate
from maximum brightness (or the light-curve width), distance measurements to a precision of
10% or better are possible using SNe Ia (Hamuy et al. 1995, 1996; Riess, Press, & Kirshner

– 5 –
1996; Phillips et al. 1999; Jha 2002; Guy et al. 2005; Prieto, Rest, & Suntzeff 2006). At near-
infrared wavelengths, SNe Ia are nearly perfect standard candles, yielding a distance precision
better than 10% without the need for any luminosity correction (Krisciunas, Phillips, & Suntzeff
2004). SNe Ia were responsible for the discovery that the Universe is presently accelerating
(Riess et al. 1998; Perlmutter et al. 1999), and arguably provide the most precise distances
needed to calculate the equation-of-state parameter of the dark energy responsible for this
acceleration.
The overwhelming majority of SNe Ia obey the peak luminosity vs. decline-rate rela-
tionship and display a remarkably uniform spectral evolution. Objects such as SN 1991T
and SN 1991bg, which were originally considered to be peculiar (Filippenko et al. 1992a,b;
Phillips et al. 1992; Leibundgut et al. 1993), may simply be examples of the high-luminosity
and low-luminosity extremes of the overall sequence of normal SNe Ia (Nugent et al. 1995).
However, a handful of SNe Ia truly stand out as peculiar. Among these is SN 2002cx, which
was labeled by Li et al. (2003, hereafter LFC) as “the most peculiar known Type Ia su-
pernova.” These authors presented optical photometry and spectroscopy of SN 2002cx that
revealed several strange properties including a high-ionization SN 1991T-like maximum-light
spectrum dominated by iron-group elements, expansion velocities approximately half those
of ordinary SNe Ia, and the absence of secondary maxima in the R and I bands. Despite
displaying a relatively normal initial decline rate of ∆m15(B)≈ 1.3 mag, SN 2002cx had a
peak luminosity more like that of the fast-declining (∆m15(B)≈ 1.9 mag) SN 1991bg, yet
faded only ∼3.5 mag in the R band over the next nine months compared to typical SNe Ia
which decline in brightness by ∼6 mag over the same period (Jha et al. 2006). Optical spec-
tra obtained ∼7–9 months after maximum were also peculiar in revealing permitted P-Cygni
emission lines of Fe II and intermediate-mass elements such as Na and Ca at a phase when
normal SN Ia spectra are dominated by forbidden emission lines of Fe (Jha et al. 2006).
Branch et al. (2004) and Jha et al. (2006) have speculated that the peculiar nature of
SN 2002cx may be consistent with the pure deflagration of a Chandrasekhar-mass white
dwarf. Alternatively, Kasen et al. (2004) suggested that SN 2002cx might be a subluminous
SN 1991bg-like explosion viewed through a hole in the ejecta. Recently, four additional
examples of the SN 2002cx phenomenon have been identified: SNe 2003gq (Jha et al. 2006),
2005P (Jha et al. 2006), 2005cc (Antilogus et al. 2005), and 2005hk (Jha et al. 2006). All
five appeared in spiral galaxies that exhibit clear signs of ongoing star formation, arguing
against the idea that they are SN 1991bg-like SNe viewed from a special angle since the
latter objects occur preferentially in E and S0 galaxies (Howell 2001; Gallagher et al. 2005).
Hence, the SN 2002cx-like events appear to represent a bona fide subclass of SNe Ia.
In this paper, we report extensive optical and near-infrared (NIR) observations of the

– 6 –
SN 2002cx-like event SN 2005hk. SN 2005hk was discovered (Burket & Li 2005) on the
rise by the Lick Observatory Supernova Search (LOSS) with the 0.76 m Katzman Auto-
matic Imaging Telescope (KAIT; Li et al. 2000; Filippenko et al. 2001) in images obtained
on 2005 Oct. 30.3 (UT dates are used throughout this paper). An independent discovery was
made by the SDSS II Supernova Survey (Frieman et al. 2007) on Oct. 28, with the SN not
being visible in images taken two days earlier (Barentine et al. 2005). The SN was located
17′′.2 east and 6′′.9 north of the nucleus of UCG 272, an SAB(s)d: galaxy with a heliocentric
recession velocity of 3,895 km s−1 according to the NASA/IPAC Extragalactic Database
(NED). An image showing the SN is reproduced in Figure 1.
An initial spectrum of SN 2005hk taken by Serduke et al. (2005) indicated that this
object was most likely a SN 1991T-like event caught 1–2 weeks before maximum light.
However, closer analysis of this spectrum revealed unusually low expansion velocities (6,000–
7,000 km s−1), suggesting that SN 2005hk was a SN 2002cx-like object. A spectrum obtained
by the Carnegie Supernova Project (CSP) three weeks later on Nov. 23.2 confirmed the close
resemblance to SN 2002cx; moreover, the CSP r′ and i′ light curves showed the same peculiar
absence of a secondary maximum that had distinguished SN 2002cx. Hence, the discovery of
SN 2005hk provided an excellent opportunity to study in detail the properties of this poorly
understood subclass of peculiar SNe Ia.
This paper is the result of the pooling of independent photometric and spectroscopic
observations carried out by the CSP, LOSS, and SDSS-II collaborations. In the sections
that follow, we present these different data sets and describe in detail the optical and NIR
properties of SN 2005hk. We also provide a definitive re-reduction of the LOSS BV RI
photometry of SN 2002cx, a preliminary version of which was published by LFC. Our NIR
photometry of SN 2005hk is the first such data to be obtained for a SN 2002cx-like event,
allowing us to re-construct the ultraviolet-optical-infrared (uvoir) bolometric light curve.
Finally, we compare our results for SN 2005hk with light curves and photospheric velocities
derived from 3D models to test the hypothesis that SN 2002cx events are the observational
signature of the pure deflagration of a Chandrasekhar-mass white dwarf.
2. SPECTROSCOPY
Seventeen spectra of SN 2005hk were obtained by our collaboration with various in-
struments and telescopes at several observatories, covering the supernova evolution from 8
days before the epoch of B maximum to 67 days after. A journal of these observations is
provided in Table 1 along with some information about the spectral characteristics. Details
of data acquisition and reduction procedures for the CSP spectra obtained with the duPont

– 7 –
2.5 m telescope are given by Hamuy et al. (2006); similar procedures were followed in the
acquisition and reduction of the spectra in Table 1 obtained with other telescopes. Note
that the Keck telescope spectrum obtained on 2005 Nov. 5 has been previously published
and discussed by Chornock et al. (2006).
Figure 2 shows a montage of all 17 spectra of SN 2005hk. The observations corre-
sponding to the contiguous nights of 2005 Dec. 23 and 24 (+43 and +44 days) have been
combined in order to avoid crowding in the figure and to improve the signal-to-noise ratio.
The positions of selected spectral features are indicated in this figure.
3. PHOTOMETRY
3.1. CSP
The CSP optical photometry of SN 2005hk was obtained with the Swope 1.0 m telescope
at the Las Campanas Observatory (LCO), using a SITe CCD and a set of SDSS u′g′r′i′ and
Johnson BV filters. A subraster of 1200×1200 pixels was employed which, at a scale of 0.′′435
pixel−1, yields a field of view of 8.′7 × 8.′7. Typical image quality ranged between 1′′ and
2′′ full-width at half-maximum intensity (FWHM). A photometric sequence of comparison
stars in the SN field was calibrated with the Swope telescope from observations of standard
stars (Smith et al. 2002; Landolt 1992) during five photometric nights. Figure 1 shows the
SN field and the selected comparison stars. Tables 2 and 3 list the average u′g′r′i′ and BV
magnitudes derived for these stars. SN magnitudes in the SDSS and Johnson systems were
obtained differentially relative to the comparison stars using point-spread-function (PSF)
photometry. On every image, a PSF within a radius of 3′′ was fitted to the SN and to
comparison stars. We refer readers to Hamuy et al. (2006) for further details about the
instrument and measurement techniques.
Although SN 2005hk was located reasonably far outside UGC 272 (see Figure 1), errors
in the SN photometry can arise from poor subtraction of the underlying host-galaxy light.
Normally this is dealt with by subtracting a template image taken when the SN was not
present. Such images of UGC 272 will eventually be obtained by the CSP when the SN has
faded from visibility (∼1 year after discovery). For the u′g′r′i′ bands, the lack of template
images is not a serious problem since we can use for this purpose images of UGC 272 obtained
by the SDSS II Supernova Survey before the appearance of SN 2005hk. Indeed, these images
produce excellent galaxy subtractions as illustrated in the top panel of Figure 3. Encouraged
by these results, we attempted to use the SDSS II images as provisional templates for the
CSP BV images. For the B band, we found that the g′ image worked best, whereas for V

– 8 –
an average of SDSS II g′ and r′ images produced the best results. This procedure resulted
in remarkably clean subtractions as illustrated in the bottom two panels of Figure 3.
Comparison of photometry carried out on the template-subtracted u′g′r′i′ images with
that measured without subtraction of the host galaxy shows that the u′ band is the most
affected by the background. At 40 days after maximum, the u′ magnitudes measured without
host-galaxy subtraction are systematically fainter by ∼ 0.15 mag. In the g′ and r′ bands, a
similar but considerably smaller (≤0.04 mag in g′ and ≤0.02 mag in r′) systematic error is
present at the late epochs in the photometry measured from the unsubtracted images. In i′,
there is no clear trend, with the measurements indicating that errors no greater than ∼ 0.02
mag are present in photometry measured from the unsubtracted images. Our provisional
template-subtracted BV photometry is fully consistent with these results in indicating that
the B-band data are affected more by the galaxy background (≤0.05 mag at 40 days after
maximum) than are the V -band data (≤0.02 mag at 40 days after maximum).
Excellent NIR photometric coverage of SN 2005hk was obtained by the CSP with the
Swope 1.0 m telescope using a new camera called “RetroCam.” This instrument was built
especially for the CSP and employs a HAWAII-1 HgCdTe detector and a single filter wheel
containing Y , J , and H filters. Because it has no re-imaging optics, RetroCam does not
operate in the Ks band. The scale of RetroCam is 0.537′′ pixel−1, which is adequate for
sampling the image quality delivered by the telescope; the field of view is 9.′1× 9.′1. Retro-
Cam and the CCD camera used for obtaining the CSP optical photometry are both mounted
on a mechanical “swivel,” such that they can be exchanged with each other in a matter of
minutes. In practice, however, the CSP has found it more effective to alternate between
u′g′r′i′BV and Y JH photometry every 2–3 nights on the Swope telescope.
A few additional epochs of Y JHKs imaging of SN 2005hk were obtained using the
Wide Field Infrared Camera (WIRC) (Persson et al. 2002) mounted on the duPont 2.5 m
telescope at LCO. This instrument, and the methodology employed for using it to observe
SNe, is described by Hamuy et al. (2006). The WIRC detectors are the same type as in
RetroCam.
Comparison stars in the SN field were calibrated in Y JHKs using observations of stan-
dard stars (Persson et al. 1998) obtained on five nights with RetroCam on the Swope tele-
scope and one night with WIRC on the duPont. Table 4 lists the final photometry for these
stars. SN magnitudes were computed differentially relative to the comparison stars with
an aperture of 2′′ and assuming no color terms (see Hamuy et al. 2006, for details). A z′-
band image of the host galaxy UGC 272 obtained by SDSS II before the SN appeared was
used as a provisional template for removing the background galaxy light from the Swope

– 9 –
observations, yielding surprisingly good subtractions1. Comparison of magnitudes measured
from these template-subtracted Y JH images with those measured without subtraction of
the host galaxy shows differences of ∼ 0.01 mag or less during the entire period that the SN
was observed, indicating that contamination from the background light of UGC 272 is not
significant in the NIR.
The final CSP u′g′r′i′BV photometry of SN 2005hk is given in Table 5 and the Y JHKs
photometry in Table 6. A minimum uncertainty of 0.015 mag in the optical bandpasses and
0.02 mag in the NIR is assumed for a single measurement based on the typical scatter in
the transformation from instrumental to standard magnitudes of bright stars (Hamuy et al.
2006). Figure 4 shows the corresponding light curves.
3.2. KAIT
Broad-band BV RI images of SN 2005hk were obtained using an Apogee AP7 CCD
camera with KAIT. The Apogee camera employs a 512× 512 pixel CCD with 24 µm pixels,
providing a field of view of 6.′7× 6.′7 at a scale of 0.′′8 pixel−1. The typical seeing at KAIT
is ∼ 3′′, so the CCD images are well-sampled.
Magnitudes for SN 2005hk in the Kron-Johnson BV RI system were measured from the
KAIT data using PSF-fitting photometry. As a general rule, the fitting radius of the PSF
was set to the FWHM of the image, and the PSF radius to four times the FWHM. Sky was
taken to be the mode of an annulus located 20–26 pixels away from the SN. Color terms
derived from many nights of standard-star observations were applied to these measurements.
Finally, zeropoints of the SN magnitudes were calculated in reference to the sequence of local
standards listed in Table 3 and displayed in Figure 1. The local standards were calibrated
via observations of Landolt (1992) standards on several photometric nights. The final SN
photometry is listed in Table 7 and plotted in the upper panel of Figure 5. As no template
images were available for the KAIT observations, the SN magnitudes are probably somewhat
affected by the background light as per the discussion in § 3.1.
The position of SN 2005hk was observed by KAIT on Julian Date (JD) 2453668.71 –
i.e., five days before its discovery by KAIT and three days before the independent discovery
by the SDSS II Supernova Survey. This image, which was obtained without a filter, yields a
1The superior sampling and seeing of the duPont WIRC images did not allow the SDSS II z′-band image
of UGC 272 to be used for template subtraction of these data. However, because of the better image quality,
the magnitudes measured from the WIRC data are less susceptible to host-galaxy contamination.

– 10 –
3σ upper limit of 18.91 mag for the SN as derived from artificial star experiments.
Figure 6 shows a comparison of the CSP and KAIT BV light curves of SN 2005hk. While
there is reasonably good agreement (≤4 %) in the measurements taken during the ∼20 day
period centered around the time of maximum light, at later epochs the CSP magnitudes in
both B and V are systematically fainter than the KAIT values by as much as ∼0.1 mag. As
illustrated in the lower two panels of Figure 6, the differences appear to be systematically
correlated with the magnitude of the SN. Comparison of the CSP and KAIT magnitudes of
the local photometric standards shows generally excellent agreement (see Table 3), and so this
discrepancy must have some other cause. The most likely explanations are contamination
of the KAIT measurements by host-galaxy light and/or differences in the response functions
(atmosphere + filter + detector) of the CSP and KAIT BV bandpasses.
The latter effect can be investigated through synthetic photometry of our spectra of
SN 2005hk (see § 2). Preliminary versions of the CSP response functions are given by
Hamuy et al. (2006). For KAIT, we have constructed response functions using measure-
ments of the filter throughputs, a typical detector quantum efficiency curve for the Apogee
camera, standard aluminum reflectivity values, and an assumed atmospheric extinction func-
tion. Magnitudes in B and V were then derived by convolving the response functions with
spectra of SN 2005hk which had sufficient wavelength coverage to allow such a calculation.
Finally, the synthetic magnitudes were corrected by the same color terms applied to the CSP
and KAIT SN photometry, and then subtracted one from the other (KAIT−CSP). These dif-
ferences, which are commonly referred to as “S-corrections” (Suntzeff 2000; Stritzinger et al.
2002), are plotted as solid circles joined by dashed lines in the middle two panels of Fig-
ure 6. As is seen, the S-corrections in B over the first month of observations of the SN are
reasonably small, and cannot explain the observed differences between the CSP and KAIT
photometry. In V , the S-corrections are somewhat larger, evolving from −0.04 mag to +0.03
mag from 8 days before B maximum to 24 days after. Nevertheless, they do not account
for the observed photometric differences in this band either. We conclude, therefore, that
the differences between the CSP and KAIT BV magnitudes are most likely due to errors in
the sky subtraction. This hypothesis will be checked once template images are available for
both sets of data.
3.3. CTIO
Images of SN 2005hk in UBV RI were obtained on two nights in Nov. 2005 with
the Cerro Tololo Inter-American 0.9 m telescope facility CCD camera. Magnitudes were
measured via aperture photometry carried out with a 4′′ radius. No template images were

– 11 –
available for subtracting the background light of the host galaxy; from our experience with
the CSP data, we can expect that the UBV bands will be somewhat affected by background
contamination, whereas it should be close to negligible in R and I. The zeropoints for
the CTIO SN magnitudes were calculated with respect to the set of local standards listed
in Table 3 and displayed in Figure 1. These were, in turn, calibrated via observations of
Landolt (1992) standards obtained on the same two nights. The final SN photometry is
listed in Table 7 and plotted in the upper panel of Figure 5.
3.4. SDSS II and MDM
SN 2005hk was independently discovered during the course of the SDSS II Supernova
Survey (Frieman et al. 2007), which is using the SDSS Camera and Telescope (Gunn et al.
1998, 2006) to image 300 square degrees centered on the celestial equator in the Southern
Galactic hemisphere. Ten epochs of ugriz photometry were obtained between 2005 Oct. 28–
Dec. 1 (U.T.). Details of the photometric system are given by Fukugita et al. (1996) and
Smith et al. (2002). Additional griz imaging of SN 2005hk was obtained with the MDM
Observatory 2.4 m telescope using a facility CCD imager (RETROCAM; see Morgan et al.
2005, for a complete description of the imager).
Photometry of SN 2005hk on the SDSS images was carried out using the scene modeling
code developed for SDSS II as described by Holtzman et al. (2007). A sequence of stars
around the supernova was taken from the list of Ivezic et al. (2007), who derived standard
SDSS magnitudes from multiple observations taken during the main SDSS survey under
photometric conditions. Using these stars, frame scalings and astrometric solutions were
derived for each of the supernova frames, as well as for seventeen pre-supernova frames
taken as part of either the main SDSS survey or the SN survey. Finally, the entire stack of
frames was simultaneously fit for a single supernova position, a fixed galaxy background in
each filter (characterized by a grid of galaxy intensities), and the supernova brightness in
each frame. SDSS photometry of SN 2005hk was also derived independently using an image-
subtraction algorithm; the results are consistent with those of the scene modeling approach
described above.
On JD 2453669.76 (one day after the KAIT non-detection), the SDSS observed the
location of SN 2005hk, and no significant detection was observed in any bandpass. Mean
fluxes and uncertainties were measured at the location of the supernova, and upper limits
were estimated by taking the magnitude corresponding to the observed flux plus 3σ. These
yield upper limits of 24.17, 22.70, 23.14, and 22.02 for griz using conventional (Pogson)
magnitudes; the corresponding upper limits using the asinh magnitudes adopted by SDSS

– 12 –
(Lupton, Gunn, & Szalay 1999) are 24.02, 22.68, 23.04, and 21.83.
Supernova brightnesses in the MDM frames were also determined using the scene mod-
eling code. For SN 2005hk, only a few reference stars were available in the field of view of
the MDM observations, so the astrometric solutions and frame scalings are somewhat more
uncertain. In addition, since the MDM observations had different response functions from
the standard SDSS bandpasses, the photometric frame solutions included color terms from
the SDSS standard magnitudes. To prevent uncertainties in the frame parameters and color
terms from possibly corrupting the galaxy model (hence affecting the SDSS photometry),
the MDM data were not included in the galaxy determination, but the galaxy model as de-
termined from the SDSS was used (with color terms) to subtract the galaxy from the MDM
frames. The resulting SN photometry from the MDM frames is reported on the native MDM
system, since the color terms derived from stars are likely not to apply to the spectrum of
the supernova.
The final SDSS II and MDM photometry for SN 2005hk is listed in Table 8 and plotted
in the lower panel of Figure 5.
Figure 7 displays a comparison of the CSP and SDSS II ugri photometry of SN 2005hk.
For each bandpass, the CSP data have been fitted by a smooth curve, which has then been
interpolated to the epoch of the SDSS II observations and subtracted. In the r and i bands,
the differences between the two data sets are small (≤0.05 mag), whereas in u and g, there
are significant systematic deviations which grow as large as ∼0.1 mag. These differences
between the CSP and SDSS II gri photometry are fully explained in terms of differences in
the response functions (atmosphere + filter + detector). This is illustrated in Figure 7, where
S-corrections calculated for the gri bands from our spectroscopic observations of SN 2005hk
are plotted. The solid circles joined by the dashed lines in the difference plots for these
bandpasses show the predicted ∆mag values (SDSS−CSP) for epochs with spectroscopic
coverage. In general, these are completely consistent with the observed differences, both in
magnitude and trend. Unfortunately, the limited ultraviolet coverage of our spectra does
not allow a similar comparison to be made in the u band, but the deviations observed here
are also likely to be due to differences in the bandpass response functions.
4. RESULTS
4.1. Spectra
Figure 2 shows that, before maximum brightness, the spectrum of SN 2005hk was dom-
inated by a blue continuum with only a few obvious absorption features, the strongest of

– 13 –
these being identified with Fe III. In the first spectrum obtained 8 days before B maximum,
there is no evidence for Si II λ6355 absorption, which is the identifying feature of typical
SNe Ia. In the spectra obtained over the next 11 days (−7 to +4 days), the Si II absorption
appears faintly and slowly intensifies, but never reaches a level consistent with that in normal
SNe Ia. By +13 days, the line is no longer distinguishable. These properties are consistent
with the early spectral evolution of SN 1991T-like events, which explains the initial report of
SN 2005hk as a likely member of this subgroup of SNe Ia (Serduke et al. 2005). Nevertheless,
closer examination of the early-time spectra reveals peculiarly low expansion velocities for
the Fe III and Si II lines (see below). Moreover, the spectra obtained after maximum display
unusually sharp emission and absorption features, unlike those of typical SNe Ia. These two
characteristics are what spectroscopically distinguish SN 2005hk as a SN 2002cx-like object
rather than an example of the SN 1991T subclass.
The remarkable spectroscopic similarity of SN 2005hk and SN 2002cx is illustrated in
Figure 8. Here spectra of SN 2005hk at four different epochs are compared with similar-epoch
spectra of SN 2002cx taken from LFC. The spectra are so similar that it is almost impossible
to distinguish them. Such a close resemblance implies that the expansion velocities of the
ejecta of these two objects were also very similar. This is confirmed in Figure 9, which
compares measurements of the expansion velocities of selected lines of Fe II, Fe III, Ca II,
Si II, and S II for both SNe. These values, which were derived by estimating the wavelength of
the minimum of each feature, are nearly indistinguishable between the two SNe. Moreover, as
discussed by LFC, they are remarkably low when compared to typical expansion velocities of
the same lines in either normal SNe Ia or the peculiar SN 1991T-like objects at similar epochs.
This is illustrated in Figure 9, where we have included expansion velocity measurements of
the normal SN Ia 1992A (∆m15(B)= 1.47 ± 0.05 mag).
Following Branch et al. (2004), we used the supernova synthethic spectrum code SYNOW
(Fisher 2000) to estimate the photospheric velocity as the SN evolved. Not surprisingly,
considering the impressive similarity between the spectra of SN 2005hk and SN 2002cx,
we found that the line identifications and SYNOW input parameters used by Branch et al.
(2004) to study SN 2002cx produced the best matches to the SN 2005hk spectra. In gen-
eral, between days −8 and +44, an approximately linear decline in the photospheric velocity
from ∼ 7000 km s−1 to ∼ 3000 km s−1 is implied. This trend is compared in Figure 9 with
the expansion velocities measured from the minimum of the Si II λ6355 absorption. The
disagreement between the SYNOW predictions and the velocities deduced from the minima
of the different lines included in Figure 9 illustrates the difficulty of precisely determining
the photospheric velocity from absorption minimum measurements alone (see Blondin et al.
2006).

– 14 –
SYNOW is also a useful tool for checking line identifications. Chornock et al. (2006)
used SYNOW to analyze the 2005 Nov. 5.4 (day −5) spectrum of SN 2005hk and found
evidence for not only Fe III lines, but also Ni II and Co II. This is intriguing since one of the
predictions of deflagration models is that material completely burned to the iron peak should
be mixed to the outer layers of the ejecta. Deflagration models also leave behind significant
amounts of unburned oxygen and carbon (e.g., see Travaglio et al. 2004). Chornock et al.
(2006) found reasonably convincing evidence for O I in the day −5 spectrum of SN 2005hk,
but in spite of the possible coincidence of features in the spectrum with the strongest lines
of C II and C III, they were unable to claim a positive detection of carbon.
We have used the SYNOW code to search for evidence of oxygen and carbon in the
post-maxima spectra of SN 2005hk. In general, we found that inclusion of lines of O I and
C II did not significantly improve the SYNOW fits. In particular, as previously found by
Branch et al. (2004), the strong absorption feature at ∼7600 A which is often attributed
to O I λ7773 can be accounted for by a blend of Fe II lines. It may be that line blocking
by Fe II lines forming at similar or higher velocities than any unburned carbon and oxygen
at low velocities may make the latter difficult to detect (Baron, Lentz, & Hauschildt 2003).
Detailed modeling of the spectrum based on the results of 3D deflagration models will be
required to determine if this lack of evidence for oxygen and carbon lines at post-maximum
epochs is significant.
4.2. Optical Light Curves and Colors
On the basis of the spectroscopic comparison alone, there can be little question that
SN 2005hk and SN 2002cx are closely related. This conclusion is reinforced by the pho-
tometric comparison shown in Figure 10. Here the KAIT BV RI light curves of the two
SNe have been normalized to the same brightness at peak and overplotted. Note that the
data plotted here for SN 2002cx are a re-reduction of the provisional photometry published
by LFC. The LFC magnitudes suffered from contamination by the underlying host-galaxy
light due to the lack of appropriate template images for subtracting the galaxy. Suitable
templates were eventually acquired in 2005 allowing final light curves of SN 2002cx to be
measured. These re-reduced data are given in Appendix A.
Figure 10 illustrates the remarkable similarity of the BV RI light curves of SN 2002cx
and SN 2005hk. Only at epochs later than 15 days after B maximum do there appear to be
any significant differences, with SN 2005hk appearing to decline somewhat more slowly in B
and V . K-corrections have not been applied to the photometry of either SN, although we can
use our spectra of SN 2005hk to estimate these. In the R and I bands, the difference in the

– 15 –
K-corrections for SN 2002cx and SN 2005hk is less than ∼0.03 mag over the entire range of
epochs from −8 to +67 days. In B and V , K(2005hk)−K(2002cx) varies from ∼ +0.01 mag
at −8 days to ∼ −0.05 mag at +24 days. Beyond this epoch, the difference in the V -band
K-corrections slowly evolves back to a value of ∼ −0.02 mag at +67 days. Our spectra do
not have sufficient wavelength coverage to derive the difference in the B-band K-corrections
beyond +24 days, but based on the observed color evolution, we expect that this should also
evolve back to values closer to 0.0 mag. Thus, K-corrections would produce slightly different
decline rates for SN 2002cx and SN 2005hk in the same sense as is observed, but this effect
is not sufficient to explain most of the difference. The photometry of SN 2005hk has not
been corrected for possible contamination from the background light of the host galaxy. As
discussed in § 3.2, there is some evidence that the KAIT photometry of SN 2005hk suffers
from such contamination, although this too does not appear to be sufficient to explain all of
the late-time discrepancy seen in Figure 10.
An average of the KAIT and CSP B light curves of SN 2005hk gives a decline-rate
measurement of ∆m15(B)= 1.56 ± 0.09 mag, with the uncertainty being dominated by the
systematic photometric differences between the two data sets. The decline rate of SN 2002cx
must be very close to this number rather than the value of 1.3 mag reported by LFC2.
Polynomial fits to the B light curve of SN 2002cx give imprecise results due to the lack of
points between −2 and +6 days. To circumvent this problem, we used the stretch technique
(Goldhaber et al. 2001) to fit the SN 2002cx data to the smooth versions of the CSP B and
V light curves of SN 2005hk shown in Figure 6. Averaging the results for B and V yields
an estimate of ∆m15(B)= 1.7 ± 0.1 mag for SN 2002cx.
The faint pre-discovery upper limits derived from the SDSS griz observations allow us
to fairly precisely estimate the time of explosion of SN 2005hk. As discussed by Riess et al.
(1999), during the very early rise time of a SN Ia, the luminosity should be approximately
proportional to the square of the time since explosion. We therefore fit the first two detections
of SN 2005hk (JD 2453671.84 and 2453674.74) in the griz bands, plus the 3σ upper limits
on JD 2453669.76, to a second-order polynomial to estimate the explosion date. All four
bands yielded values in the range of −14.8 to −15.4 days before the epoch of B maximum.
Hence, we conclude that the explosion which produced SN 2005hk most likely took place
15 ± 1 days before B maximum. This implies a sharper initial rise to maximum in the B
band than would be expected for a normal SN Ia with a decline rate of ∆m15(B)= 1.56 mag.
Figure 11 compares the B−V , V −R, and V −I color evolution of SN 2005hk with that of
2LFC actually suggested that the true value of ∆m15(B) for SN 2002cx might be ∼1.6 mag after correction
of the photometry for host-galaxy contamination

– 16 –
SN 2002cx. LFC estimated that the host-galaxy reddening of SN 2002cx was negligible, so the
data for this event have only been corrected for a Galactic extinction of E(B−V )Gal = 0.034
mag. The data for SN 2005hk are corrected for a Galactic reddening of E(B−V )Gal = 0.022
mag and a host-galaxy extinction of E(B − V )Host = 0.09 mag (see next paragraph). Shown
for reference is the color evolution of SN 1992A, a typical SN Ia with a decline rate of
∆m15(B)= 1.47 mag. In all three colors, the data for SN 2005hk and SN 2002cx track each
other extremely well until ∼20 days after maximum. Later than this epoch, there is some
evidence from the B − V and V − I colors that SN 2002cx was redder than SN 2005hk,
although the data for SN 2002cx are of relatively poor quality. Except at pre-maximum
epochs, the color evolution in V −R and V − I of these two SNe is considerably redder than
that of the normal SN 1992A. As commented by LFC, in B − V the color evolution is more
similar to that of normal SNe Ia.
For typical SNe Ia, the color evolution can be used to estimate the amount of host-
galaxy reddening (Phillips et al. 1999). In the case of SN 2005hk, such a procedure is highly
problematic due to the obvious spectroscopic and photometric peculiarities. Nevertheless,
the fact that the SN was quite blue in all three colors at pre-maximum epochs suggests
that the host-galaxy reddening is relatively small. As noted by Chornock et al. (2006), our
earliest spectra of SN 2005hk reveal weak interstellar absorption due to the Na I D lines,
both at zero redshift (i.e., produced by gas in our own Galaxy) and at the redshift of the
host galaxy of the SN, UGC 272. Dust reddening in our own Galaxy along the line of site
to SN 2005hk is estimated to be E(B − V )Gal = 0.022 mag (Schlegel, Finkbeiner, & Davis
1998), and so by analogy the extinction produced by UGC 272 is probably also low. From
spectropolarimetry of SN 2005hk, Chornock et al. (2006) estimated a value of 0.27% for
the interstellar polarization produced by UGC 272, which for standard dust polarization
efficiencies corresponds to E(B − V )Host = 0.09 mag. These authors also independently
estimated the host-galaxy reddening from the interstellar Na I D lines and found it consistent
with the estimate from the polarization. We shall assume this same value in this paper3.
Table 9 lists the observed peak magnitudes in the optical bandpasses as measured from
the merged CSP, SDSS-II, and KAIT photometry.
3If we were to assume that SN 2005hk and SN 2002cx had identical colors, then a relative reddening of
E(B − I) = 0.20 ± 0.05 mag is implied by the photometry at times less than 20 days after the epoch of B
maximum. This translates to E(B − V ) = 0.07 ± 0.02 mag, which is consistent with the estimate of the
host-galaxy reddening of SN 2005hk derived from the polarization and Na I D line measurements.

– 17 –
4.3. NIR Light Curves and Colors
The NIR light curves of SN 2005hk share the same peculiar morphology of the R and I
light curves in not showing a clear secondary maximum. Although this trait is exhibited by
the fastest declining SNe Ia, the shapes of the NIR light curves of such events are noticeably
distinct. This is illustrated in Figure 12 which compares the Y JH light curves of SN 2005hk
with those of two other SNe Ia observed by the CSP. The decline rates of the latter two
objects, SN 2005el and SN 2005ke, were ∆m15(B) = 1.47 and 1.82 mag, respectively. These
values bracket the observed decline rate of SN 2005hk of ∆m15(B) = 1.56 mag. As Figure 12
shows, the Y JH light curves of SN 2005el display two clear peaks, as is typical of normal
SNe Ia. In slower-declining SNe Ia, the second peak is more prominent and occurs later in
time than in faster-declining events. This results in the secondary maximum of the fastest-
declining objects like SN 2005ke being reduced to an inflection rather than a separate peak
(see Figure 12). The morphology of the NIR light curves of SN 2005hk is more like that of
a fast-declining SN Ia in that the secondary maximum appears as an inflection rather than
a separate peak. However, SN 2005hk is very peculiar in not showing a prominent primary
maximum – rather, both the primary and secondary maxima appear as inflections in the
light curves, with the second inflection corresponding to the actual peak of the light curve.
Kasen (2006) has recently emphasized that the strength of the secondary maximum
in the IJHK bands is an excellent diagnostic of the degree of 56Ni mixing in the ejecta of
SNe Ia. In particular, the double-peaked structure observed in the NIR light curves of typical
SNe Ia is a direct indication of the concentration of iron-peak elements in the central regions.
Blinnikov et al. (2006) pointed out that because 3D deflagration models are characterized
by strong mixing, they do not do a good job of reproducing the strong secondary maxima
of the R and I light curves of normal SNe Ia. The morphologies of the Y JH light curves
of SN 2005hk seen in Figure 12 are strikingly similar to those of the theoretical IJH light
curves illustrated in Figure 9 of Kasen (2006) for a fiducial SN Ia model containing 0.6 M⊙ of56Ni in a fully mixed compositional structure. Hence, the shapes of the NIR light curves of
SN 2005hk argue in a relatively model-independent way that the ejecta must be well-mixed.
Figure 13 compares the V − Y , V − J , and V − H color evolution of SN 2005hk
with that of SN 2005el and SN 2005ke. Although the colors of all three SNe have been
corrected only for Galactic reddening, the host-galaxy reddening is probably less than or
equal to E(B − V ) ≈ 0.1 mag in all three cases. The differences between SN 2005el and
SN 2005ke reflect their differing decline rates: SN 2005ke was a fast-declining SN Ia, and
therefore characterized by a lower “effective temperature” (Nugent et al. 1995) and redder
colors during the initial photospheric phase of the explosion than was the slower-declining
SN 2005el. At phases later than ∼30 days after the time of B maximum, when the spectrum
– 18 –
had grown to be dominated by emission due to iron-peak elements, the color evolution of
these two SNe was much more similar, as in the “Lira” effect in B−V (Phillips et al. 1999).
The V −NIR color evolution of SN 2005hk is consistent with its peculiar nature. Figure 13
shows that in all three colors, SN 2005hk started off with approximately the same blue colors
as SN 2005el, but by 25–30 days after B maximum had evolved to considerably redder colors
than either SN 2005el or SN 2005ke. This behavior is broadly consistent with the peculiar
properties of the evolution of the optical colors of SN 2005hk (see Figure 11).
Measurements of the apparent peak magnitudes of SN 2005hk in the NIR bandpasses are
given in Table 9. Remarkably, the date of maximum of the H band occurred ∼20 days after
u′ maximum. In typical SNe Ia, the maximum of the H-band light curve occurs 4–5 days
before B maximum, or 1–2 days before the epoch of maximum in U (e.g., see Suntzeff et al.
1999; Hernandez et al. 2000).
4.4. Absolute Magnitudes and UVOIR Bolometric Light Curve
To calculate the absolute magnitudes of SN 2005hk, we assume a distance modulus
(m−M) = 33.46±0.27 mag for the host galaxy UGC 272 which we derive from the observed
radial velocity in the cosmic microwave background frame, vCMB = 3548 km s−1, an assumed
Hubble constant of H0 = 72 km s−1 Mpc−1 (Freedman et al. 2001), and a possible peculiar
motion of UGC 272 of ±400 km s−1 with respect to the Hubble flow. Likewise, we adopt the
values of the Galactic and host-galaxy reddenings given in the previous section, and assume
a standard Galactic reddening law with RV = 3.1 (Cardelli, Clayton, & Mathis 1989) to
derive the extinction for any particular filter.
With these assumptions and the apparent magnitudes listed in Table 9, we derive the
absolute BV RIJHK magnitudes given in Table 10. Shown for comparison in the same
table are the absolute magnitudes of (1) SN 2002cx, (2) a normal SN Ia with the same
decline rate as SN 2005hk (∆m15(B) = 1.56 mag), and (3) the subluminous 1991bg-like
event SN 1999by (∆m15(B) = 1.90 mag). The absolute magnitudes of SN 2002cx were
calculated assuming no significant host-galaxy reddening as per the discussion in LFC. K-
corrections derived from our spectra of SN 2005hk were applied to the BV RI magnitudes of
both SN 2002cx and SN 2005hk. The optical magnitudes for a typical SN Ia are based on the
luminosity vs. decline-rate relations given in Prieto, Rest, & Suntzeff (2006) adjusted to a
Hubble constant of H0 = 72 km s−1 Mpc−1; the NIR values are taken from Krisciunas et al.
(2004). Finally, the absolute magnitudes of SN 1999by were calculated from the photometry
of Garnavich et al. (2004) and the Cepheid distance modulus of Macri et al. (2001).

– 19 –
The numbers in Table 10 suggest that SN 2005hk may have been ∼0.5 mag more
luminous than SN 2002cx. However, this difference falls nearly within the errors, which
are dominated by the uncertainties in the distances to both objects. Table 10 also indicates
that both SNe were significantly subluminous compared to typical SNe Ia. In the case of
SN 2005hk, the difference in absolute magnitude is ∼0.6–1.0 mag in each color except the H
band, where it decreases to ∼0.3 mag which is within the dispersion of normal SNe Ia. With
respect to the subluminous SN 1991bg-like event SN 1999by, both SN 2002cx and SN 2005hk
are seen to be bluer, but of comparable luminosity (especially in the red). Figure 14 provides
a graphical comparison of the absolute magnitudes of SN 2005hk with those of normal SNe Ia
in the BV IJH bands, and helps to emphasize the subluminous nature of SN 2005hk in all
bands except H . Remarkably, SNe Ia truly do appear to be essentially perfect standard
candles in the H band with few exceptions.
We have combined the CSP u′g′r′i′BV and Y JHKs photometry of SN 2005hk with
ultraviolet light curves obtained with the Swift (Milne et al. 2007) satellite to compute a
UVOIR bolometric light curve covering the wavelength range from λ = 1100-∞ A. The
broad-band magnitudes were corrected for Galactic and host-galaxy extinction assuming
a reddening law with RV = 3.1 as parameterized by Cardelli, Clayton, & Mathis (1989).
These were then converted to monochromatic fluxes at the effective wavelengths of each
filter, and the total flux between the Swift UVW2 band (λeff = 1880 A) and the H band
(λeff = 1.63µm) was integrated using the trapezoid approximation. Blueward of the blue
edge of the UVW2 band at ∼1100 A we have assumed that there is no additional flux. To
account for the missing flux redward of the H band, we have extrapolated to λ = ∞ using
a blackbody (BB) model obtained by fitting the g′r′i′BV and Y H fluxes with a Planck
function. (The u′ and J fluxes were not employed in the BB fits because they appear
depressed with respect to the other bandpasses, especially at later epochs.)
To examine the initial rise of the UVOIR bolometric light curve, we have incorporated
photometry from the discovery images of SN 2005hk taken by SDSS II on JD 2453671.84,
as well as the upper limits from the pre-discovery griz images obtained two days earlier. At
these early epochs when the SN was blue, the contribution of the NIR flux to the UVOIR
light curve can effectively be ignored, but not the UV flux. Since the Swift observations
did not begin until JD 2453678.3, we have calculated the relative contribution of the UV
flux observed by Swift compared to the total UVOIR flux during the rise to maximum, and
have extrapolated a fit to this ratio to the earlier epochs covered by the SDSS II observa-
tions. This procedure, while clearly approximate, implies corrections to the UVOIR flux on
JD 2453669.76 on JD 2453671.84 of 19% and 15%, respectively.
The FUVOIR values were transformed into luminosities assuming a distance modulus for

– 20 –
the host galaxy of SN 2005hk, UGC 272, of (m − M)0 = 33.46 mag (see above). Figure 15
shows the final UVOIR bolometric light curve. For comparison, the UVOIR light curve of a
typical SN Ia, 2001el (∆m15(B) = 1.13 mag) (Candia et al. 2003) is plotted. Also included
is the UVOIR light curve of the SN 1991bg-like event SN 1999by (∆m15(B) = 1.90 mag),
which we calculated from the data given by Garnavich et al. (2004). As discussed in § 4.2,
we have assumed for SN 2005hk that the explosion occurred 15 days before B maximum.
For SN 2001el and SN 1999by, we have taken this number to be 18.1 and 11.0 days before
B maximum, respectively, which we derived from the average B light-curve rise time given
by Conley et al. (2006) after application of stretch values appropriate for both SNe.
Figure 15 emphasizes the subluminous nature of SN 2005hk, but also shows that these
events are not as extreme as the SN 1991bg-like SNe Ia. Note the much slower decline
rate at later epochs of SN 2005hk. This behavior is the opposite of what normal SNe Ia
display in that the UVOIR bolometric light curves of lower-luminosity events decline more
rapidly at all epochs than do higher-luminosity events (Candia et al. 2003) (cf. SN 1999by
vs. SN 2001el). The decline rate of the bolometric light curve of SN 2005hk between 55–
70 days after explosion was 0.027 mag day−1, while that for SN 2001el during the same
period was 0.035 mag day−1. Both of these values are significantly larger than the decline
rate of 0.0098 mag day−1 predicted if all the energy from the decay of 56Co into 56Fe were
fully thermalized in the ejecta (Woosley 1988).
From the observed peak luminosity of SN 2005hk of 4.3×1049 erg s−1 and application of
Arnett’s rule (Arnett 1982; Arnett, Branch, & Wheeler 1985) as per the prescription given
by Stritzinger et al. (2006), we estimate that a 56Ni mass of ∼0.22 M⊙ was produced during
the explosion of SN 2005hk (see § 5). Among SNe Ia, such a low value is only observed
for the fast-declining SN 1991bg-like events. However, the latter objects are characterized
by lower-ionization spectra at maximum, reflecting a lower “effective temperature,” whereas
SN 2005hk displayed a high-ionization, SN 1991T-like spectrum at maximum. Moreover, the
UVOIR light curves of SN 1991bg-like events are much narrower than that of SN 2005hk,
dropping by ∼0.7–0.8 dex over the first 20 days from maximum compared to the ∼0.3 dex
drop displayed by SN 2005hk (see Figure 15).
5. Comparison with 3D Deflagration Models
Our extensive spectroscopic and photometric observations of SN 2005hk demonstrate
conclusively that this object was nearly an exact twin of the highly peculiar SN Ia 2002cx.
Jha et al. (2006) have identified three other SNe — 2003gq, 2005P, and 2005cc — which likely
also resembled SN 2002cx, and argued persuasively that SN 2002cx-like events represent a

– 21 –
new and distinct subclass of SNe Ia. The principal properties of these objects have been
summarized by Jha et al. (2006); we repeat and amplify on these below:
• A SN 1991T-like spectrum dominated by a blue continuum and weak Fe III absorption
features at pre-maximum epochs. This implies that the outermost layers of the ejecta
were characterized by a hotter “effective temperature” than is typical of SNe Ia of
similar decline rate (Nugent et al. 1995).
• Iron features in the spectra at all epochs, and absence of secondary maxima in the
light curves. Spectral features identified with iron were visible in SN 2002cx from pre-
maximum epochs to ∼9 months after maximum with expansion velocities ranging from
∼7000 km s−1 to ∼700 km s−1 (Jha et al. 2006). Secondary maxima were also notably
absent in the IY JH light curves of SN 2005hk. Both of these observations imply that
fully burned (i.e., to the iron peak) material was present at all layers in the ejecta.
• Features due to metals lighter than Fe at all epochs. Branch et al. (2004) identified
lines due to Si, S, Ca, and Na in spectra of SN 2002cx covering from pre-maximum to
∼2 months after maximum, and we have observed the same features in our spectra of
SN 2005hk. Jha et al. (2006) unambiguously identified lines of Ca and Na in spectra
of SN 2002cx obtained ∼9 months after maximum. Hence, partially burned material
is also clearly present at all layers of the ejecta.
• Possible presence of low-velocity (500–1000 km s−1) O I at late epochs. Jha et al. (2006)
tentatively identified several weak features in spectra of SN 2002cx at ∼9 months after
maximum with O I. If confirmed, this implies the presence of unburned material in the
inner layers.
• Low expansion velocities. Low expansion velocities were observed at all epochs for
SN 2002cx and SN 2005hk, implying low kinetic energy of the ejecta.
• Low peak luminosity. The low peak luminosities of SN 2002cx and SN 2005hk imply
productions of 56Ni masses of ∼0.25 M⊙ or less.
• Very slowly declining UVOIR bolometric light curve at late times. The simplest in-
terpretation of this property is that the ejected masses of this subclass of SNe Ia are
relatively large, thus providing a higher opacity to the γ-ray emission produced by
radioactivity.
• Permitted Fe II lines and continuum or pseudo-continuum flux at late times. Jha et al.
(2006) identified several permitted lines of Fe II with P-Cygni profiles in spectra of

– 22 –
SN 2002cx obtained ∼9 months after maximum, and also noted the presence of a
continuum or pseudo-continuum at this epoch. These observations, coupled with the
absence of strong forbidden-line emission other than [Ca II] λλ7291,7324, imply a
relatively high density and large mass at low velocity.
• Low level of continuum polarization. Chornock et al. (2006) obtained spectropolarime-
try of SN 2005hk at −5 days, and found a low level of continuum polarization (∼0.4 %)
after correction for the interstellar component. This value is typical of normal SNe Ia,
and implies that the peculiarities of SN 2002cx-like events cannot be explained by large
asymmetries.
Branch et al. (2004) and Jha et al. (2006) have suggested that the unusual properties of
SN 2002cx-like events may be consistent with 3D deflagration models. In general, the 3D de-
flagration models studied to date produce too little kinetic energy, too little and too mixed56Ni, and too much unburned carbon and oxygen at low velocity to account for normal-
luminosity SNe Ia (Gamezo, Khokhlov, & Oran 2004; Blinnikov et al. 2006). In addition,
Thomas et al. (2002) have argued that the composition structure of 3D deflagrations is too
clumpy to produce the uniformly deep Si II λ6355 absorption observed in typical SNe Ia.
Interestingly, these very same failings of 3D deflagrations in explaining normal SNe Ia corre-
spond closely to the observed peculiarities of SN 2002cx-like events. In order to pursue this
idea further, we have compared our observations of SN 2005hk with recent calculations of
synthetic bolometric and broad-band light curves of SNe Ia based on four 3D deflagration
models (Blinnikov et al. 2006).
First, we select the most appropriate model of the four studied by Blinnikov et al. (2006)
using the estimate of the 56Ni mass given in § 4.4. Here we discuss briefly the foundation
of this estimate. Arnett (1979, 1982) has shown theoretically that the mass of radioactive56Ni is proportional to the peak luminosity of an SN Ia. Arnett’s rule simply states that
at the epoch of maximum light the peak luminosity is equal to the rate of gamma-ray
deposition inside the ejecta. The derivation of this statement is based on many simplifying
assumptions, yet the relation found by Arnett is useful for quick estimates. A detailed
description of the 56Ni mass derivation using broad-band optical photometry is given by
Contardo et al. (2000). An empirical procedure for finding the 56Ni mass based on further
simplifications has been developed by Stritzinger & Leibundgut (2005). With a UVOIR light
curve and the simple relation Lmax = 2 × 1043MNi/M⊙ erg s−1 (and 10% correction taking
into account the difference of UVOIR and bolometric luminosity), they were able to make
estimates of the 56Ni mass for a large number of SNe Ia. The accuracy of this procedure
has been tested by Blinnikov et al. (2006) with their synthetic light curves. It was found
that for the deflagration models presented there, an accuracy of ∼ 20% may be expected.
– 23 –
New results by Stritzinger et al. (2007) confirm this level of accuracy by comparison of this
method with another one, based on nebular SN Ia spectra.
Taking Lmax ≈ 4.3 × 1042 erg s−1 for SN 2005hk (see Figure 15) and the relation
Lmax = 2×1043MNi/M⊙, we obtain the crude estimate of MNi ≈ 0.22M⊙ cited in § 4.4. We do
not add the 10% correction here since the procedure of calculating UVOIR luminosity in the
present work should produce numbers closer to the true Lbol. This estimate of MNi indicates
that the closest model from the set of synthetic light curves for deflagration models computed
by Blinnikov et al. (2006) is the one with the lowest 56Ni mass, namely 1 3 3. Details of the
construction and flame simulation for this model are described by Ropke et al. (2006)4. The
model 1 3 3 has M(56Ni) = 0.24M⊙ and rather low asymptotic kinetic energy Ekin = 0.365
foe5. The details of the radiation hydrodynamics code stella used for computation of
theoretical light curves and relevant references are given by Blinnikov et al. (2006).
Figure 15 presents the synthetic bolometric luminosity Lbol and Figure 16 illustrates
the u′BV g′r′i′Y JHK light curves computed from the multi-group fluxes of the model 1 3 3.
Zero time here is the moment of explosion. We give the results for this model without
fine-tuning it to the observations and with all numerical noise visible as bumps and wiggles
on the plots. However, note that the synthetic fluxes here are convolved with the set of
filter functions actually used for observations in this work. The only free parameter is the
explosion epoch, which we have assumed to be 15 days before B maximum, consistent with
the discussion in § 4.2. Figure 15 shows that this epoch provides an excellent fit to the rising
part of Lbol, as well as the first ∼20 days of the post-maximum decline. At later epochs, the
model declines somewhat more slowly than the observations. A better fit could be produced,
probably, by a model with a little less 56Ni.
Figure 16 illustrates that, without any tuning of the underlying hydrodynamic model,
the fluxes in the BV g′ filters resemble the observations reasonably well for the first 40 days,
except for the fact that the peaks of the light curves occur ∼2 days earlier than those of
the models. Without a detailed new hydrodynamic and nucleosynthetic model, we may
only speculate that a faster evolution in u′BV g′r′ and on the tail of the bolometric light
curve could be obtained by reducing the opacity in the iron-peak elements. Since diffusion
is determined not only by opacity, but also by density, this might be possible if the kinetic
energy of the explosion were the same, or a bit higher, than in the plotted model. If the
reduction of 56Ni were due to lower consumption of C/O in general, leading to a reduction
4Note that the model parameters for 1 3 3 were somewhat unorthodox: the metallicity was three times
solar, the carbon mass fraction was 62%, and the central density at ignition was lower than usual.
51 foe = 1051 erg.

– 24 –
of all products of burning (Fe, Si, S, etc.), then the kinetic energy would also be reduced,
the velocity would be lower, and at each moment of time the density would be higher in
each Lagrangean layer. This would likely lead to a slower, rather than a faster, evolution of
the light curves. However, if the reduction of 56Ni is accomplished by a burning mode which
produces, say, more Si at the expense of iron-peak elements, then the kinetic energy would
be almost the same (since the energy released per unit mass would be almost the same)
or even higher (if the amount of Si produced is greater than the corresponding reduction
of iron-peak elements because more total C/O is consumed). This would, in turn, lead to
a lower opacity at the same (or even lower) density – which is exactly what is required to
produce faster diffusion and faster light curves. To our knowledge, the feasibility of such
a model does not contradict any fundamental properties of deflagrations in Chandrasekhar
mass progenitors.
The deviations in BV g′ become appreciable two months after the explosion when the
observed light curves become flatter. There may be two reasons for this. At this epoch the
ejecta become almost transparent in visible light and the local thermodynamic equilibrium
(LTE) assumption employed by stella becomes less and less reliable. Another cause of the
flattening of the light curves may be stronger concentration of density in the ejecta (and of
initial 56Ni). Then the flattening may be obtained even in the LTE approximation as we
know from the experience of radiation modeling of hundreds of “toy” SN Ia models. See the
discussion of those models in the recent paper by Woosley et al. (2007).
The deviations in i′ and NIR bands are generally more appreciable. Only the general
trends – the flattening of the light curves after the maxima and the absence of secondary
maxima – are reproduced. As discussed by Woosley et al. (2007), when the results produced
by stella for the “toy” SN Ia models are compared with the quite independent radiative
transfer code sedona, the behavior in the red and near-infrared is very sensitive to the lists
of lines used for computation of the opacity. While stella employs ∼ 2 × 10⁵ lines which
are mostly in the ultraviolet, it is necessary to use millions of weak lines in cool ejecta. The
work of inclusion of extended line lists into the stella algorithm is in progress.
A plot of the expansion velocity of the “Rosseland” photosphere of model 1 3 3 is com-
pared with measurements of the Si II λ6355 line in Figure 9. If, alternatively, we were to
define the photosphere as the level with an optical depth of 2/3 in the BV bands, a some-
what flatter evolution of the expansion velocities would be predicted (see Blinnikov et al.
2006). However, over the range of epochs that the λ6355 line was visible in the spectrum of
SN 2005hk, both definitions give similar results. We note that within a fairly short time (≤2
weeks) after explosion, the rapidly expanding ejecta of a SN Ia become optically thin in the
continuum, making the concept of a photosphere rather ambiguous. Hence, the interpreta-

– 25 –
tion of such comparisons between models and observations is not completely straightforward.
Nevertheless, the agreement between model 1 3 3 and our SYNOW estimate of the evolu-
tion of the photospheric velocity of SN 2005hk is encouraging, and suggests that a model
with somewhat lower photospheric velocity than in 1 3 3 (e.g., again due to a stronger
concentration of initial 56Ni) would provide a better fit to SN 2005hk.
Finally, we comment on the peculiar high-ionization SN 1991T-like pre-maximum spec-
tra of this event. Although we have not yet tried to model the spectra, it is quite natural
to expect the early high ionization in the deflagration models since 56Ni lumps are predicted
to float in the outermost layers; see, e.g., the latest hydrodynamic simulations of SN Ia in
Ropke et al. (2007). The results of numerical experiments on 3D gamma-ray transport for
MPA deflagration models show the 56Ni-blobs are “visible” in gamma rays very early, hence
one should expect the high ionization.
6. DISCUSSION
From the results of the preceding section, it appears plausible that the subset of SN 2002cx-
like SNe Ia can be understood in terms of the pure deflagration of a Chandrasekhar-mass
white dwarf. Nevertheless, a potentially serious discrepancy remains in the large amount
of low-velocity unburned oxygen and carbon that is predicted by current 3D deflagration
models. Kozma et al. (2005) have shown that the late-time spectra of these models should
exhibit strong forbidden lines of O I and C I, yet these features were not observed in spectra
of SN 2002cx obtained 227 and 277 days after maximum (Jha et al. 2006). Kozma et al.
(2005) pointed out that the discrepancy is reduced somewhat by improved initial conditions
and higher resolution in the 3D models.
On the observational side, Jha et al. (2006) found evidence for an unexpectedly high
mass and density at low velocity based on the presence of P-Cygni profiles of Fe II, Ca II,
and Na I lines in the late-time spectra of SN 2002cx, as well as the absence of forbidden lines
other than [Ca II] λλ7291,7324 and a few possible [Fe II] lines. Such high densities would
rule out the presence of observable [O I] and [C I] lines, even if there were significant amounts
of unburned oxygen and carbon near the center. Hence, the real discrepancy may be that
the observations show a higher density at late epochs than the models predict. Until now,
deflagration modeling has focused on matching the properties of normal luminous SNe Ia.
It is essential that new models be built with the specific goal of exploring whether a pure
deflagration can produce light curves and spectra that match both the early- and late-epoch
properties of SN 2002cx-like events. Likewise, we encourage observers to obtain further
spectroscopy of these interesting objects, especially at late epochs and in the NIR.

– 26 –
Several authors (e.g., LFC, Branch et al. 2004; Chornock et al. 2006) have commented
on the similarity of the pre-maxima spectra of SN 2002cx-like and SN 1991T-like supernovae.
Indeed, both types of events appear to occur preferentially in spiral galaxies, and so it
is natural to ask if these two subclasses of SNe Ia share a similar origin. Branch et al.
(2006) classified both SN 2002cx and SN 1991T as “shallow silicon” SNe Ia, but they also
emphasized the differences between the two objects: SN 1991T had a slow-declining light
curve, whereas SN 2002cx was faster-declining and subluminous; the ejecta of SN 1991T had
typical expansion velocities, while the expansion velocities of SN 2002cx were nearly a factor
of two lower at maximum; SN 1991T possessed a normal late-time spectrum, whereas the
spectrum of SN 2002cx at late epochs was dominated by very low-velocity permitted lines
of Fe II and displayed a continuum or pseudo-continuum. To these we can add the fact that
the I-band light curve of SN 1991T displayed a typical secondary peak (Ford et al. 1993),
while that of SN 2002cx conspicuously did not. As previously mentioned, the presence of
a secondary peak at red and NIR wavelengths is indicative of the iron-peak elements being
concentrated in the central regions, whereas the lack of a secondary peak implies significant
mixing of the ejecta. This last difference seems crucial and, along with the luminosity
difference, argues against SN 1991T-like events also being produced by deflagrations. As
Branch et al. (2006) have speculated, it may be that these two subclasses of SNe Ia have
little in common except a high initial temperature.
The Lick Observatory Supernova Search has discovered (or recovered) four of the five
known SN 2002cx-like SNe (2003gq, 2005P, 2005cc, and 2005hk), and we can use this survey
to estimate the frequency of this subclass among the general SN Ia population. According
to Li, Filippenko, & Riess (2001), LOSS discovers essentially all of the SNe Ia, including the
subluminous SN 1991bg-like objects, that appear in galaxies in a distance-limited sample
where normal SNe Ia reach an apparent R-band magnitude at maximum of ∼16 or brighter.
If we take the absolute magnitude of a normal SN Ia in R to be −19.4 mag, this corresponds
to a distance of ∼120 Mpc. The average of the R-band absolute magnitudes of SN 2002cx
and SN 2005hk was −17.9, which is very similar to that of typical SN 1991bg-like events
(see Table 10). Thus, LOSS should also discover most of the SN 2002cx-like events within
∼120 Mpc. Since 2002, LOSS has discovered ∼90 SNe Ia out to this distance, of which 4
were confirmed SN 2002cx-like events. These objects therefore appear to account for ∼5%
of all SNe Ia in the local Universe, although there are at least three caveats associated with
this estimate. First, there are certain biases in the LOSS sample galaxies – e.g., there aren’t
many irregular/dwarf galaxies – so our statistics may be biased depending on the frequency
of SN 2002cx-like events in such galaxies. Second, we cannot say with complete certainty
that all of the SN 2002cx-like SNe in the LOSS discoveries since 2002 have been identified, so
this estimate is a lower limit. Finally, the frequency of SN 2002cx-like SNe would be larger

– 27 –
if there exists a significant population with absolute magnitudes considerably fainter than
M(R) = −17.9 mag.
The high degree of similarity of the spectra and light curves of SN 2002cx and SN 2005hk
is striking, and leads us to wonder how homogeneous this subclass of SNe Ia may actually be.
Is there something special about the conditions required for a C/O white dwarf to explode as
a pure deflagration that leads to such homogeneity, or is the twin-like resemblance of these
two SNe merely a coincidence? Due to the rarity of these events, answering this question
requires detailed spectroscopic and photometric observations of large samples of nearby SNe.
Such data do not yet exist, but will eventually become available due to the combined efforts
of groups such as the CSP, SDSS II, LOSS, the CfA Supernova Group6, and the Nearby
Supernova Factory (Aldering et al. 2002). These large surveys may also tell us more about
the possible progenitors of this peculiar subclass of SNe Ia. As mentioned, all five of the
SN 2002cx-like objects discovered to date occurred in spiral galaxies showing clear evidence
of ongoing star formation. Do SN 2002cx-like SNe also occur in elliptical or S0 galaxies?
If not, this may indicate that the conditions for pure deflagrations are produced only in a
younger or intermediate-aged stellar population. At present, however, such ideas are pure
speculation.
Finally, it is interesting to ask whether SN 2002cx-like events could be mistakenly in-
cluded in high-redshift samples of normal SNe Ia. Both SN 2002cx and SN 2005hk were more
than a magnitude fainter in absolute magnitude in the B and V bands than normal SNe Ia.
The Supernova Legacy Survey, which discovers SNe Ia in the redshift range z ≈ 0.3–1.0
and is representative of current ground-based high-redshift SN surveys, has detected SNe Ia
down to M(B) ≈ −19.0 mag (Astier et al. 2006). Hence, if SN 2002cx and SN 2005hk are
representative of the subclass of SN 2002cx-like events as a whole, it is unlikely that any
of these objects would be discovered in high-redshift surveys. In any case, if an adequate
spectrum is obtained near maximum, the low expansion velocities that typify this peculiar
subclass of SNe Ia should serve to identify them.
We are grateful for the assistance of the staffs at the many observatories (Lick, Keck,
LCO, MDM, APO, ESO) where data for this paper were obtained. We would like to thank
David Branch for allowing us to use SYNOW, and Jerod Parrent for providing us the code.
This paper is based upon CSP observations supported by the National Science Foundation
under Grant No. 0306969. S. Blinnikov is supported in Russia partly by grants RFBR 05-02-
17480, 04-02-16793, RFNS 540.2006.2, 10181.2006.2, and by grant IB7320-110996/1 of the
6http://www.cfa.harvard.edu/oir/Research/supernova/

– 28 –
Swiss National Science Foundation. M. Hamuy acknowledges support from the Centro de
Astrofısica FONDAP 15010003 and to Proyecto Fondecyt 1060808. The authors made use
of the NASA/IPAC Extragalactic Database (NED), which is operated by the Jet Propulsion
Laboratory, California Institute of Technology, under contract with the National Aeronautics
and Space Administration. A.V.F.’s group at U.C. Berkeley is supported by NSF grant AST-
0607485 and the TABASGO Foundation. KAIT was made possible by generous donations
from Sun Microsystems, Inc., the Hewlett-Packard Company, AutoScope Corporation, Lick
Observatory, the National Science Foundation, the University of California, and the Sylvia
& Jim Katzman Foundation.
Funding for the SDSS and SDSS II has been provided by the Alfred P. Sloan Foundation,
the Participating Institutions, the National Science Foundation, the U.S. Department of En-
ergy, the National Aeronautics and Space Administration, the Japanese Monbukagakusho,
the Max Planck Society, and the Higher Education Funding Council for England. The SDSS
is managed by the Astrophysical Research Consortium for the Participating Institutions.
The Participating Institutions are the American Museum of Natural History, Astrophysical
Institute Potsdam, University of Basel, Cambridge University, Case Western Reserve Univer-
sity, University of Chicago, Drexel University, Fermilab, the Institute for Advanced Study,
the Japan Participation Group, Johns Hopkins University, the Joint Institute for Nuclear
Astrophysics, the Kavli Institute for Particle Astrophysics and Cosmology, the Korean Scien-
tist Group, the Chinese Academy of Sciences (LAMOST), Los Alamos National Laboratory,
the Max-Planck-Institute for Astronomy (MPIA), the Max-Planck-Institute for Astrophysics
(MPA), New Mexico State University, Ohio State University, University of Pittsburgh, Uni-
versity of Portsmouth, Princeton University, the United States Naval Observatory, and the
University of Washington.
A. Re-reduction of BV RI Photometry of SN 2002cx
The BV RI photometry of SN 2002cx published by LFC suffered from contamination by
the underlying host-galaxy light due to the lack of appropriate template images for subtract-
ing the galaxy. In this Appendix, we present a re-reduction of these data using host-galaxy
template images obtained with both telescopes after the supernova had completely disap-
peared.
The LFC photometry of SN 2002cx was obtained with KAIT and 1.0 m Nickel tele-
scope at Lick Observatory. Template BV RI images of the host galaxy, CGCG 044-035,
were obtained with both telescopes and the same cameras and filters in March 2005. Galaxy
subtractions were performed on all images, and magnitudes for the SN were measured from
– 29 –
PSF-fitting photometry carried out differentially with respect to the comparison stars iden-
tified in Figure 1 of LFC. The BV RI magnitudes of the comparison stars were established
from observations of Landolt (1992) standards carried out with KAIT on 13 photometric
nights. Uncertainties for the SN magnitudes were estimated from measurements made on
20 artificial stars having the same magnitude as the SN that were randomly inserted in the
images and re-extracted (Ganeshalingam et al. 2007). The final uncertainty was taken to be
the magnitude scatter of the artificial stars added in quadrature with the uncertainty from
the PSF photometry.
Table 11 lists the final revised BV RI magnitudes for SN 2002cx.
REFERENCES
Aldering, G., et al. 2002, Proc. SPIE, 4836, 61
Antilogus, P., et al. 2005, The Astronomer’s Telegram, 502, 1
Arnett, W. D. 1979, ApJ, 230, L37
Arnett, W. D. 1982, ApJ, 253, 785
Arnett, W. D., Branch, D., & Wheeler, J. C. 1985, Nature, 314, 337
Astier, P., et al. 2006, A&A, 447, 31
Baron, E., Lentz, E. J., & Hauschildt, P. H. 2003, ApJ, 588, L29
Barentine, J., et al. 2005, CBET, 268
Blinnikov, S. I., et al. 2006, A&A, 453, 229
Blondin, S., et al. 2006, AJ, 131, 1648
Branch, D., Baron, E., Thomas, R. C., Kasen, D., Li, W., & Filippenko, A. V. 2004, PASP,
116, 903
Branch, D., Dang, L. C., Hall, N., Ketchum, W., Melakayil, M., Parrent, J., Troxel, M. A.,
Casebeer, D., Jeffery, D. J, & Baron, E. 2006, PASP, 118, 560
Burket, J., & Li, W. 2005, IAU Circ., 8625
Candia, P., et al. 2003, PASP, 115, 277

– 30 –
Cardelli, J. A., Clayton, G. C., & Mathis, J. S. 1989, ApJ, 345, 245
Chornock, R., Filippenko, A. V., Branch, D., Foley, R. J., Jha, S., & Li, W. 2006, PASP,
118, 722
Conley, A., et al. 2006, AJ, 132, 1707
Contardo, G., Leibundgut, B., & Vacca, W. D. 2000, A&A, 359, 876
Filippenko, A. V., 1997, ARAA, 35, 309
Filippenko, A. V., in White Dwarfs: Cosmological and Galactic Probes, ed. E. M. Sion, S.
Vennes, & H. L. Shipman (Dordrecht: Springer), 97
Filippenko, A. V., et al. 1992a, ApJ, 384, L15
Filippenko, A. V., et al. 1992b, AJ, 104, 1543
Filippenko, A. V., Li, W. D., Treffers, R. R., & Modjaz, M. 2001, in Small Telescope Astron-
omy on Global Scales, ed. W.-P. Chen, C. Lemme, & B. Paczynski (San Francisco:
ASP), 121
Fisher, A. 2000, Ph.D. thesis, Univ. Oklahoma
Ford, C. H., Herbst, W., Richmond, M. W., Baker, M. L., Filippenko, A. V., Treffers, R. R.,
Paik, Y., & Benson, P. J. 1993, AJ, 106, 1101
Freedman, W. L., et al. 2001, ApJ, 553, 47
Frieman, J., et al. 2007, in preparation
Fukugita, M., Ichikawa, T., Gunn, J. E., Doi, M., Shimasaku, K., & Schneider, D. P. 1996,
AJ, 111, 1748
Gallagher, J. S., Garnavich, P. M., Berlind, P., Challis, P., Jha, S., & Kirshner, R. P. 2005,
ApJ, 634, 210
Gamezo, V. N., Khokhlov, A. M., & Oran, E. S. 2004, Phys. Rev. Lett., 92, 211102
Ganeshalingam, M., et al. 2007, in preparation
Garnavich, P. M., et al. 2004, ApJ, 613, 1120
Goldhaber, G., et al. 2001, ApJ, 558, 359

– 31 –
Gunn, J. E., et al. 1998, AJ, 116, 3040
Gunn, J. E., et al. 2006, AJ, 131, 2332
Guy, J, Astier, P., Nobili, S., Regnault, N., & Pain, R. 2005, A&A, 443, 781
Hamuy, M., Phillips, M. M., Maza, J., Suntzeff, N. B., Schommer, R. A., & Aviles, R. 1995,
AJ, 109, 1
Hamuy, M., Phillips, M. M., Suntzeff, N. B., Schommer, R. A., Maza, J., & Aviles, R. 1996,
AJ, 112, 2398
Hamuy, M., et al. 2006, PASP, 118, 2
Hernandez, M., et al. 2000, MNRAS, 319, 223
Hoflich, P., Gerardy, C., Linder, E., & Marion, H. 2003, in Stellar Candles for the Extra-
galactic Distance Scale, ed. D. Alloin & W. Gieren (Berlin: Springer), 203
Holtzman, J., et al. 2007, in preparation
Howell, D. A., ApJ, 554, L193
Hoyle, F., & Fowler, W. A. 1960, ApJ, 132, 565
Ivezic, Z., et al. 2007, in preparation
Jha, S. 2002, Ph.D. thesis, Harvard Univ.
Jha, S., et al. 2006, AJ, 132, 189
Kasen, D. 2006, ApJ, 649, 939
Kasen, D., Nugent, P., Thomas, R. C., & Wang, L. 2004, ApJ, 610, 876
Kozma, C., et al. 2005, A&A, 437, 983
Krisciunas, K., Phillips, M. M., & Suntzeff, N. B. 2004, ApJ, 602, L81
Krisciunas, K., et al. 2004, AJ, 128, 3034
Landolt, A. U. 1992, AJ, 104, 340
Leibundgut, B., et al. 1993, AJ, 105, 301

– 32 –
Li, W., et al. 2000, in Cosmic Explosions, ed. S. S. Holt & W. W. Zhang (New York: AIP),
103
Li, W., Filippenko, A. V., & Riess, A. G. 2001, ApJ, 546, 719
Li, W., et al. 2003, PASP, 115, 453 (LFC)
Lupton, R. H., Gunn, J. E., & Szalay, A. S. 1999, AJ, 118, 1406
Macri, L. M., et al. 2001, ApJ, 559, 243
Milne, P., et al. 2007, in preparation
Morgan, C. W., Byard, P. L., DePoy, D. L., Derwent, M., Kochanek, C. S., Marshall, J. L.,
O’Brien, T. P., Pogge, R. W. 2005, AJ, 129, 2504
Nugent, P., Phillips, M., Baron, E., Branch, D., Hauschildt, P. 1995, ApJ, 455, 147
Perlmutter, S., et al. 1999, ApJ, 517, 565
Persson, S. E., Murphy, D. C., Krzeminski, W., Roth, M., & Rieke, M. J. 1998, AJ, 116,
2475
Persson, S. E., et al. 2002, AJ, 124, 619
Phillips, M. M. 1993, ApJ, 413, L105
Phillips, M. M., et al. 1992, 103, 1632
Phillips, M. M., Lira, P., Suntzeff, N. B., Schommer, R. A., Hamuy, M., & Maza, J. 1999,
AJ, 118, 1766
Prieto, J. L., Rest, A., & Suntzeff, N. B. 2006, ApJ, 647, 501
Riess, A. G., Press, W. H., & Kirshner, R. P. 1996, ApJ, 473, 88
Riess, A. G., et al. 1998, AJ, 116, 1009
Riess, A. G., et al. 1999, AJ, 118, 2675
Ropke, F. K., Gieseler, M., Reinecke, M., Travaglio, C., & Hillebrandt, W. 2006, A&A, 453,
203
Ropke, F. K., Woosley, S.E.,& Hillebrandt, W. 2007, ApJ, submitted, astro-ph/0609088
Schlegel, D. J., Finkbeiner, D. P., & Davis, M. 1998, ApJ, 500, 525

– 33 –
Serduke, F. J. D., Wong, D. S., & Filippenko, A. V. 2005, CBET, 269
Smith, J. A., et al. 2002, AJ, 123, 2121
Stritzinger, M., et al. 2002, AJ, 124, 2100
Stritzinger, M., & Leibundgut, B. 2005, A&A, 431, 423
Stritzinger, M., Leibundgut, B., Walch, S., & Contardo, G. 2006, A&A, 450, 241
Stritzinger, M., Mazzali, P., Sollerman, J. & Benetti, S. 2007, A&A, submitted,
astro-ph/0609232
Suntzeff, N. B., et al. 1999, AJ, 319, 1175
Suntzeff, N. B. 2000, in Cosmic Explosions, ed. S. S. Holt & W. W. Zhang (New York: AIP),
65
Thomas, R. C., et al. 2002, ApJ, 567, 1037
Travaglio, C., Hillebrandt, W., Reinecke, M., & Thielemann, F.-K. 2004, A&A, 425, 1029
Woosley, S. E. 1988, ApJ, 330, 218
Woosley, S. E., Kasen, D., Blinnikov, S., & Sorokina, E. 2007, ApJ, submitted,
astro-ph/0609562
York, D. G., et al. 2000, AJ, 120, 1579
This preprint was prepared with the AAS LATEX macros v5.2.

– 34 –
Fig. 1.— The field of SN 2005hk observed with the Swope 1 m telescope at LCO. This image
was created by combining optical and infrared images so that some of the stars used for the
NIR photometry would be clearer. North is up and east is to the left. The supernova is
marked to the NE of the host-galaxy nucleus. The comparison stars used to derive differential
photometry of the SN are labeled. The plate scale is shown near the bottom right.
Fig. 2.— Spectroscopic evolution of SN 2005hk. Each spectrum is plotted on a logarithmic
flux-density scale, shifted by an arbitrary constant. The wavelengths of the spectra were
shifted to the SN rest frame using a redshift of z = 0.012993 as given in NED. The labels to
the left of each spectrum indicate the epoch in rest-frame days since the date of B maximum
(JD = 2,453,685.1). The spectra for days +43 and +44 have been averaged. Identifications
for selected spectral features are indicated. For most (but not all) of the spectra, the telluric
absorption features have been eliminated; the positions of the strongest of these are indicated
by the ⊕ symbol.
Fig. 3.— Images of SN 2005hk in the g′, B, and V bands obtained on 2005 Nov. 08 by the
CSP. The images in the left half of the figure are as observed; those on the right-hand side
are shown after subtraction of a template image taken by SDSS II before the SN appeared.
Note the satellite trail in the V image, which serves as an indicator of the quality of the
galaxy subtraction. See text for more details.
Fig. 4.— Observed u′g′r′i′BV and Y JHK light curves of SN 2005hk obtained by the CSP.
For clarity, the magnitudes in each band have been shifted by an arbitrary constant which
is given in the legend. The uncertainties in the measurements are smaller than the plot
symbols except where indicated. Y JH photometry obtained with RetroCam is plotted with
black symbols; Y JHK measurements made with WIRC are shown in red.
Fig. 5.— (Top) Observed BV RI light curves of SN 2005hk obtained by KAIT and with
the CTIO 0.9 m telescope. The KAIT data are plotted with black symbols, and the CTIO
with red. Error bars are not shown as these are considerably smaller than the plot symbols.
No host-galaxy subtraction was performed on the images before measurement. (Bottom)
Observed ugriz light curves of SN 2005hk obtained by the SDSS II Supernova Survey. The
SDSS and MDM photometry is derived from the scene modeling algorithm of Holtzman et al.
(2007). Error bars are much smaller than the plot symbols.
Fig. 6.— Comparison of observed BV light curves of SN 2005hk obtained by the CSP and
KAIT. In the top panels, the square symbols correspond to the CSP measurements and the
crosses to KAIT. The solid line represents a fit to the CSP data. In the middle panels,
the difference between the KAIT magnitudes and the smooth fit to the CSP data is shown.
Also indicated by the solid circles joined by dashed lines are the expected S-corrections

– 35 –
calculated via synthetic photometry with the respective response functions of the CSP and
KAIT passbands (see text for more details). In the lower panels, the S-corrections have been
subtracted from the magnitude differences between the KAIT and CSP measurements and
then plotted vs. the CSP magnitude.
Fig. 7.— Comparison of observed ugri light curves of SN 2005hk obtained by the CSP
and SDSS II. In the top panels for each filter, the square symbols correspond to the CSP
measurements and the crosses to SDSS II. The solid line represents a fit to the CSP data.
In the lower panels, the differences between the SDSS II magnitudes and the smooth fit to
the CSP data are shown. These differences compare well with the S-corrections (indicated
by the solid circles joined by dashed lines) calculated via synthetic photometry from the
respective response functions of the CSP and SDSS II passbands.
Fig. 8.— Comparison of spectra of SN 2005hk at phases of −5, +13, +24, and +55 days
with similar-epoch spectra of SN 2002cx from LFC. The spectra are plotted on a logarithmic
flux scale and shifted by an arbitrary constant. The wavelengths of the spectra were shifted
to the SN rest frame using the heliocentric velocities of the host galaxies given in NED.
Fig. 9.— Expansion velocities for SN 2005hk (circles) and SN 2002cx (triangles) in selected
lines of Fe II, Fe III, Ca II, Si II, and S II. The measurements were estimated from the
wavelength of the minimum of each feature, correcting for the heliocentric velocities of the
host galaxies. For comparison, measurements in the Fe II, Ca II, Si II, and S II lines are shown
for SN 1992A, a typical SN Ia with a decline rate of ∆m15(B)= 1.47 mag. The evolution
of the photospheric velocity of SN 2005hk as estimated from SYNOW fits is compared with
the Si II λ6355 measurements. Finally, in the same plot, the velocity of the “Rosseland”
photosphere for the 3D deflagration model 1 3 3 is indicated.
Fig. 10.— Comparison of KAIT BV RI photometry of SN 2005hk (red plus symbols) and
SN 2002cx (black circles). The light curves have been normalized to the same peak magni-
tudes.
Fig. 11.— Comparison of the B−V , V −R, and V −I color evolution of SN 2005hk (red plus
symbols) and SN 2002cx (black circles) as derived from KAIT photometry. The colors have
been corrected for Galactic extinction assuming the Schlegel, Finkbeiner, & Davis (1998)
estimates of E(B − V )Gal = 0.022 mag for SN 2002hk and 0.034 mag for SN 2002cx. The
colors of SN 2005hk have also been corrected for a host galaxy extinction of E(B−V )Host =
0.09 mag. The color evolution of SN 1992A, a typical unreddened SN Ia with a decline rate
of ∆m15(B)= 1.47 mag, is indicated by the dashed line.
Fig. 12.— Comparison of the CSP JHK light curves of SN 2005hk with CSP observations

– 36 –
of SN 2005el (∆m15(B)= 1.47 mag) and SN 2005ke (∆m15(B)= 1.82 mag).
Fig. 13.— Comparison of the V − Y , V − J , and V − H color evolution of SN 2005hk
with CSP observations of SN 2005el (∆m15(B)= 1.47 mag) and SN 2005ke (∆m15(B)=
1.82 mag). The colors have been corrected for Galactic extinction using the estimates of
Schlegel, Finkbeiner, & Davis (1998).
Fig. 14.— The absolute magnitudes of SNe Ia at maximum light in the BV IJH bands
plotted versus the decline-rate parameter ∆m15(B). The black triangles are SNe in the
redshift range 0.01 < z < 0.1 whose distances were calculated from their host-galaxy radial
velocities in the cosmic microwave background frame assuming a Hubble constant of H0 = 72
km s−1 Mpc−1. The red circle in each panel corresponds to SN 2005hk.
Fig. 15.— UVOIR bolometric light curve of SN 2005hk plotted with respect to the epoch
of explosion. For reference, the UVOIR light curves of SN 2001el (∆m15(B) = 1.13 mag)
and SN 1999by (∆m15(B) = 1.90 mag) are also plotted as blue squares and green triangles,
respectively. For SN 2005hk, the explosion is assumed to have occurred 15 days before B
maximum, whereas for SN 2001el and SN 1999by this number is take to be 18.1 and 11.0 days
before B maximum, respectively. The data for SN 2005hk are compared with the UVOIR
light curve for the 3D deflagration model 1 3 3. See text for further details.
Fig. 16.— Comparison of calculations of the u′BV g′r′i′Y JHK light curves for 3D
deflagration model 1 3 3 with observations of SN 2005hk. The absolute magnitudes
for SN 2005hk were calculated assuming a Galactic E(B − V )Gal = 0.022 mag
(Schlegel, Finkbeiner, & Davis 1998), a host-galaxy reddening of E(B − V )Host = 0.09 mag,
and a Hubble constant of H0 = 72 km s−1 Mpc−1. The explosion is assumed to have occurred
15 days before B maximum.

– 37 –
Table 1. Spectroscopic Observations of SN 2005hk
UT Date JD Days since Wavelength Resolution
-2,453,000 Bmax Telescope/Instrument Range (A) (A)a
2005 Nov 2.2 676.7 -08 Lick 3.0 m/Kast 3334-10400 5/9
2005 Nov 3.2 677.7 -07 MDM 2.4 m/CCDS 3880-7340 15
2005 Nov 4.2 678.7 -06 APO 3.5 m/DIS 3600-9600 6
2005 Nov 4.2 678.7 -06 MDM 2.4 m/CCDS 3880-7340 15
2005 Nov 5.4 679.9 -05 Keck1/LRIS 3170-9240 6/9
2005 Nov 6.3 680.8 -04 APO 3.5 m/DIS 3600-9600 6
2005 Nov 6.3 680.8 -04 Keck2/DEIMOS 4883-9987 3
2005 Nov 7.2 681.7 -03 Keck2/DEIMOS 4883-10000 3
2005 Nov 14.2 688.7 +04 MDM 2.4 m/CCDS 3878-7335 15
2005 Nov 23.2 697.7 +13 LCO 2.5 m/ModSpec 3780-7290 7
2005 Nov 25.1 699.6 +15 SMARTS 1.5 m/RCSpec 3200-9560 14
2005 Dec 4.3 708.8 +24 Keck1/LRIS 3280-9320 6/12
2005 Dec 7.3 711.8 +27 MDM 2.4 m/CCDS 3810-7267 15
2005 Dec 18.1 722.6 +38 NTT/EMMI 4000-10200 8
2005 Dec 20.1 724.6 +40 LCO 2.5 m/WFCCD 3800-9235 6
2005 Dec 23.1 727.6 +43 LCO 2.5 m/WFCCD 3800-9235 6
2005 Dec 24.1 728.6 +44 LCO 2.5 m/WFCCD 3800-9235 6
2006 Jan 4.1 739.6 +55 MDM 2.4 m/CCDS 3915-7370 15
2006 Jan 16.0 751.5 +67 NTT/EMMI 4000-10200 8
aWhen two numbers are given for the wavelength resolution, they correspond to the blue and red
halves of a double spectrograph.

– 38 –
Table 2. CSP u′g′r′i′ Photometry of Comparison Stars in the Field of SN 2005hk
Stara u′ g′ r′ i′
s04 15.591(011) 14.453(011) 14.502(009) 14.580(009)
s05 16.701(013) 15.008(011) 14.411(015) 14.186(015)
s06 18.090(024) 16.436(007) 15.811(007) 15.575(007)
s07 19.818(069) 17.056(007) 15.845(007) 15.344(008)
s08 17.954(019) 16.496(007) 15.946(007) 15.719(007)
s09 18.723(039) 16.700(007) 15.908(007) 15.571(008)
s10 17.284(015) 16.247(007) 16.058(007) 16.026(009)
s11 17.746(014) 16.687(007) 16.317(007) 16.167(008)
s12 20.154(081) 17.573(010) 16.484(007) 16.047(008)
s13 18.675(040) 17.264(007) 16.679(007) 16.441(007)
s14 19.854(058) 17.660(008) 16.807(007) 16.490(008)
s15 20.057(067) 17.841(008) 17.000(007) 16.684(007)
s16 19.191(033) 17.628(009) 17.006(007) 16.741(007)
s17 18.486(019) 17.409(015) 17.046(007) 16.919(009)
s18 19.572(074) 17.841(008) 17.190(007) 16.950(010)
s19 21.189(293) 18.737(009) 17.381(012) 16.577(011)
s20 20.825(148) 18.546(008) 17.693(014) 17.330(015)
s21 21.864(547) 18.919(013) 17.544(007) 16.124(012)
s22 21.250(311) 19.145(025) 17.840(008) 17.235(010)
s23 19.455(065) 18.488(009) 18.176(012) 18.064(013)
s24 19.727(111) 18.900(009) 18.543(020) 18.365(012)
s25 20.093(169) 19.207(013) 18.867(013) 18.748(020)
s26 22.835(300) 20.028(029) 18.745(011) 17.896(018)
s27 22.503(851) 20.073(027) 18.800(011) 17.866(017)
s28 19.911(317) 20.447(046) 19.197(016) 18.218(016)
aThe identifications correspond to those in Figure 1.
Note. — Uncertainties given in parentheses in thousandths of a
magnitude correspond to the root-mean square (rms) of the magni-
tudes obtained on five photometric nights.

–39
–
Table 3. UBV RI Photometry of Comparison Stars in the Field of SN 2005hk
StaraU U B B B V V V R R I I
ID KAIT CTIO CSP KAIT CTIO CSP KAIT CTIO KAIT CTIO KAIT CTIO
s01 14.516(020) 14.508(043) · · · 14.447(020) 14.403(021) · · · 13.766(005) 13.740(016) 13.387(016) 13.351(018) 13.001(003) 12.983(025)
s02 · · · · · · · · · 15.758(020) · · · · · · 14.742(020) · · · 14.193(020) · · · 13.709(020) · · ·
s03 · · · 15.252(043) · · · · · · 14.969(021) · · · · · · 14.227(015) · · · 13.802(019) · · · 13.406(025)
s04 14.644(020) 14.628(043) 14.605(008) 14.635(016) 14.614(021) 14.448(007) 14.472(014) 14.461(015) 14.392(018) 14.350(018) 14.244(004) 14.216(025)
s05 15.875(020) 15.877(046) 15.454(008) 15.486(027) 15.459(021) 14.652(014) 14.668(016) 14.654(015) 14.228(028) 14.194(021) 13.815(019) 13.789(027)
s06 17.193(020) 17.201(046) 16.893(010) 16.916(026) 16.882(021) 16.062(006) 16.084(015) 16.069(015) 15.633(031) 15.593(019) 15.188(023) 15.156(025)
s07 19.108(020) 19.184(044) 17.709(017) 17.756(031) 17.725(023) 16.386(008) 16.403(014) 16.382(016) 15.613(035) 15.569(021) 14.900(009) 14.883(026)
s08 · · · · · · 16.907(008) · · · · · · 16.163(006) · · · · · · · · · · · · · · · · · ·
s09 · · · 17.796(086) 17.243(013) · · · 17.242(021) 16.221(006) · · · 16.232(015) · · · 15.672(019) · · · 15.132(025)
s10 16.479(020) 16.390(044) 16.491(007) 16.494(015) 16.481(022) 16.112(006) 16.118(012) 16.111(016) 15.887(030) 15.882(018) 15.619(058) 15.639(025)
s11 · · · · · · 17.000(007) · · · · · · 16.448(006) · · · · · · · · · · · · · · · · · ·
s12 · · · · · · 18.187(009) · · · · · · 16.974(010) · · · · · · · · · · · · · · · · · ·
s13 · · · · · · 17.693(009) · · · · · · 16.914(006) · · · · · · · · · · · · · · · · · ·
s14 18.955(020) 19.022(113) 18.196(009) 18.193(012) 18.224(025) 17.192(007) 17.167(019) 17.182(016) 16.538(016) 16.559(019) 16.007(043) 16.052(026)
s15 · · · · · · 18.348(015) · · · · · · 17.370(008) · · · · · · · · · · · · · · · · · ·
s16 18.415(020) 18.401(045) 18.065(009) 18.095(018) 18.062(021) 17.256(007) 17.277(010) 17.274(016) 16.808(003) 16.784(019) 16.314(012) 16.307(026)
s17 · · · · · · 17.763(009) · · · · · · 17.191(007) · · · · · · · · · · · · · · · · · ·
s18 18.659(020) 18.664(043) 18.289(014) 18.282(016) 18.298(026) 17.458(007) 17.420(030) 17.448(023) 16.948(017) 16.965(020) 16.493(035) 16.524(025)
s19 · · · · · · 19.462(021) · · · · · · 17.980(013) · · · · · · · · · · · · · · · · · ·
s20 · · · · · · 19.071(014) 19.031(041) 18.979(075) 18.072(010) 18.040(027) 18.065(015) 17.407(021) 17.434(023) 16.866(030) 16.904(026)
s21 · · · · · · 19.737(032) · · · · · · 18.129(018) · · · · · · · · · · · · · · · · · ·
s22 · · · · · · 19.787(026) · · · · · · 18.400(011) · · · · · · · · · · · · · · · · · ·
s23 · · · · · · 18.758(017) · · · · · · 18.284(009) · · · · · · · · · · · · · · · · · ·
s24 · · · · · · 19.201(016) · · · · · · 18.685(011) · · · · · · · · · · · · · · · · · ·
s25 · · · · · · 19.495(029) · · · · · · 19.004(015) · · · · · · · · · · · · · · · · · ·
s26 · · · · · · 20.650(108) · · · · · · 19.329(020) · · · · · · · · · · · · · · · · · ·
s27 · · · · · · 20.756(064) · · · · · · 19.370(021) · · · · · · · · · · · · · · · · · ·
s28 · · · · · · 21.362(120) · · · · · · 19.713(049) · · · · · · · · · · · · · · · · · ·
aThe identifications correspond to those in Figure 1.
Note. — Uncertainties given in parentheses in thousandths of a magnitude.

– 40 –
Table 4. Infrared Photometric Sequence near SN 2005hk
Stara Y Js H Ks
s01 12.716(006) 12.461(011) 12.131(006) · · ·
s02 13.291(008) 12.947(018) 12.487(008) · · ·
s03 13.101(006) 12.828(011) 12.470(006) · · ·
s04 14.102(008) 14.016(013) 13.917(007) · · ·
s05 13.491(008) 13.206(016) 12.827(008) · · ·
s06 14.837(009) 14.524(012) 14.089(006) · · ·
s07 14.363(007) 13.955(011) 13.361(006) · · ·
s10 15.514(011) 15.340(020) 15.160(017) · · ·
s11 15.578(012) 15.316(020) 15.008(013) · · ·
s12 15.089(017) 14.700(017) 14.104(009) · · ·
s13 15.741(012) 15.417(012) 15.003(011) · · ·
s14 15.660(014) 15.295(018) 14.794(010) 14.707(020)
s15 15.867(010) 15.530(020) 14.994(019) · · ·
s16 15.939(009) 15.620(016) 15.180(013) · · ·
s17 16.283(011) 16.046(019) 15.742(023) · · ·
s19 15.402(006) 14.960(014) 14.371(006) · · ·
s20 16.476(025) 16.121(028) 15.561(014) 15.572(039)
s27 16.626(015) 16.143(028) 15.621(025) · · ·
s29 16.495(019) 15.978(024) 15.443(019) 15.368(036)
s30 16.267(016) 15.890(016) 15.282(018) · · ·
s31 16.880(019) 16.522(034) 15.975(028) · · ·
s32 15.516(009) 15.019(019) 14.449(009) · · ·
s33 16.824(019) 16.353(022) 15.839(024) · · ·
s34 15.478(012) 15.048(033) 14.438(028) · · ·
s35 15.120(008) 14.691(019) 14.109(008) · · ·
s36 17.396(027) 16.944(027) 16.454(025) 16.435(070)
aThe identifications correspond to those in Fig. 1.
Note. — Uncertainties given in parentheses in thousandths of a
magnitude correspond the the rms of the magnitudes obtained on six
photometric nights.

– 41 –
Table 5. CSP u′g′r′i′BV Photometry for SN 2005hk
JD
−2, 453, 000 u′ g′ r′ i′ B V
675.60 16.841(019) 16.755(016) 16.895(016) 17.115(016) 16.815(016) 16.875(015)
677.65 16.516(019) 16.388(017) 16.447(017) 16.666(017) 16.417(016) 16.466(015)
682.59 16.356(019) 15.878(016) 15.945(016) 16.175(016) 15.971(016) 15.940(015)
683.59 16.371(021) 15.821(016) 15.878(016) 16.106(016) 15.917(016) 15.885(015)
684.62 16.412(021) 15.792(016) 15.832(016) 16.067(017) 15.921(016) 15.836(015)
687.60 16.624(021) 15.797(017) 15.729(016) 15.945(017) 15.974(016) 15.736(016)
689.66 16.850(023) 15.874(017) 15.704(017) 15.884(017) 16.129(016) 15.765(016)
690.61 16.992(023) 15.938(017) 15.684(016) 15.869(016) 16.210(016) 15.764(015)
694.66 17.719(026) 16.312(016) 15.705(016) 15.781(017) 16.715(016) 15.913(015)
695.64 17.955(028) 16.426(016) 15.727(016) 15.784(016) 16.864(016) 15.964(015)
698.59 18.488(041) 16.804(016) 15.864(016) 15.845(016) 17.327(016) 16.207(015)
699.62 18.836(057) 16.937(016) 15.917(016) 15.875(016) 17.480(016) 16.288(015)
702.63 19.230(066) 17.284(016) 16.098(016) 16.006(016) 17.851(016) 16.543(015)
706.67 19.738(071) 17.627(017) 16.364(017) 16.205(017) 18.233(016) 16.843(016)
712.57 20.060(128) 17.929(016) 16.659(016) 16.491(016) 18.488(018) 17.133(015)
720.56 20.242(262) 18.109(016) 16.960(016) 16.811(016) 18.712(032) 17.423(015)
725.59 20.492(126) 18.247(016) 17.122(016) 16.984(016) 18.818(020) 17.524(015)
728.61 20.301(121) 18.307(017) 17.194(017) 17.068(017) 18.901(021) 17.619(016)
730.63 20.598(127) 18.290(016) 17.262(016) 17.123(016) 18.848(021) 17.655(015)
736.55 20.656(072) 18.386(016) 17.391(016) 17.284(016) 18.925(016) 17.742(015)
739.55 20.592(091) 18.444(016) 17.469(016) 17.366(016) 18.993(017) 17.808(015)
745.54 · · · 18.486(017) 17.584(016) 17.498(016) 19.062(053) 17.903(019)
748.56 20.495(333) 18.498(017) 17.653(016) 17.562(016) 19.132(074) 17.950(024)
751.55 · · · 18.559(016) 17.727(016) 17.657(016) 19.154(031) 18.002(017)
761.53 · · · 18.662(020) 17.976(016) 17.843(015) 19.271(027) 18.140(015)
Note. — All measurements were made on host galaxy-subtracted images. Uncertainties are given in
parentheses in thousandths of a magnitude, with a minimum uncertainty of 0.015 mag for an individual
measurement.

– 42 –
Table 6. Near-Infrared Photometry for SN 2005hk
JD
−2, 453, 000 Y Js H Ks Instrument
676.56 16.792(020) 16.717(021) 16.852(047) · · · RetroCam
677.60 16.621(020) 16.469(020) 16.664(040) · · · RetroCam
678.57 16.497(020) 16.387(020) 16.495(048) · · · RetroCam
680.58 16.281(020) 16.140(020) 16.318(045) · · · RetroCam
681.59 16.253(020) 16.087(020) 16.294(020) 16.218(020) WIRC
685.65 16.009(020) 15.947(020) 16.019(031) · · · RetroCam
688.67 15.926(020) 15.878(020) 15.856(020) · · · RetroCam
691.64 15.766(020) 15.893(028) · · · · · · RetroCam
692.62 · · · · · · 15.737(020) · · · RetroCam
696.66 15.531(020) 15.847(020) 15.605(020) · · · RetroCam
697.60 15.475(020) 15.914(020) 15.532(020) · · · RetroCam
701.62 15.415(020) 15.871(020) 15.526(020) · · · RetroCam
705.58 15.540(020) 15.974(020) 15.590(020) · · · RetroCam
710.60 15.641(020) 16.060(020) 15.751(020) · · · RetroCam
717.61 15.887(020) 16.390(020) 16.015(031) · · · RetroCam
719.62 15.912(020) 16.524(024) 16.078(035) · · · RetroCam
722.54 16.007(020) 16.628(020) 16.210(020) 16.307(035) WIRC
723.55 16.036(020) 16.647(048) · · · · · · RetroCam
727.57 16.177(020) 16.909(035) 16.370(046) · · · RetroCam
731.57 16.316(020) 17.072(040) 16.509(049) · · · RetroCam
743.54 16.750(020) 17.478(020) 16.907(021) · · · WIRC
756.57 17.171(020) 17.826(032) · · · · · · WIRC
Note. — All RetroCam measurements were made on host galaxy-subtracted images;
no host galaxy subtraction was performed on the WIRC images. Uncertainties are given
in parentheses in thousandths of a magnitude, with a minimum uncertainty of 0.020 mag
for an individual measurement.

– 43 –
Table 7. KAIT and CTIO UBV RI Photometry for SN 2005hk
JD
−2, 453, 000 U B V R I Source
675.59 16.049(009) 16.813(006) 16.870(009) 16.762(011) 16.754(020) CTIO
675.73 · · · 16.766(016) 16.821(015) 16.654(015) 16.635(019) KAIT
677.73 · · · 16.355(016) 16.420(022) 16.246(020) 16.208(021) KAIT
679.78 · · · 16.129(015) 16.149(015) 15.997(015) 15.972(031) KAIT
680.70 · · · 16.054(016) 16.057(015) 15.925(015) 15.903(015) KAIT
684.75 · · · 15.926(016) 15.830(027) 15.627(022) · · · KAIT
689.70 · · · 16.089(032) 15.729(015) 15.525(015) 15.453(097) KAIT
690.75 · · · 16.202(016) 15.748(015) 15.555(015) 15.472(016) KAIT
691.71 · · · 16.308(016) 15.762(015) 15.538(015) 15.435(015) KAIT
692.70 · · · 16.443(015) 15.787(015) 15.542(015) 15.390(015) KAIT
693.67 · · · 16.561(015) 15.803(016) 15.527(015) 15.388(015) KAIT
694.72 · · · 16.710(015) 15.857(015) 15.544(015) 15.346(016) KAIT
695.74 · · · 16.877(015) 15.919(015) · · · · · · KAIT
696.66 · · · 16.982(015) 15.973(015) 15.602(015) 15.383(015) KAIT
697.65 · · · 17.125(017) 16.045(015) 15.616(015) 15.420(015) KAIT
698.68 · · · 17.292(015) 16.134(015) 15.691(015) 15.442(015) KAIT
701.55 18.298(060) 17.667(014) 16.405(006) 15.880(006) 15.583(008) CTIO
701.71 · · · 17.664(015) 16.385(015) 15.832(015) 15.527(015) KAIT
708.67 · · · 18.171(023) 16.841(015) 16.225(015) 15.833(017) KAIT
710.69 · · · 18.291(022) 16.992(016) 16.358(015) 15.948(015) KAIT
718.63 · · · 18.713(040) 17.285(017) 16.715(015) 16.471(063) KAIT
729.66 · · · 18.760(022) 17.548(017) 17.012(016) 16.645(015) KAIT
Note. — No host galaxy subtraction was performed on the images. Uncertainties are given in
parentheses in thousandths of a magnitude.
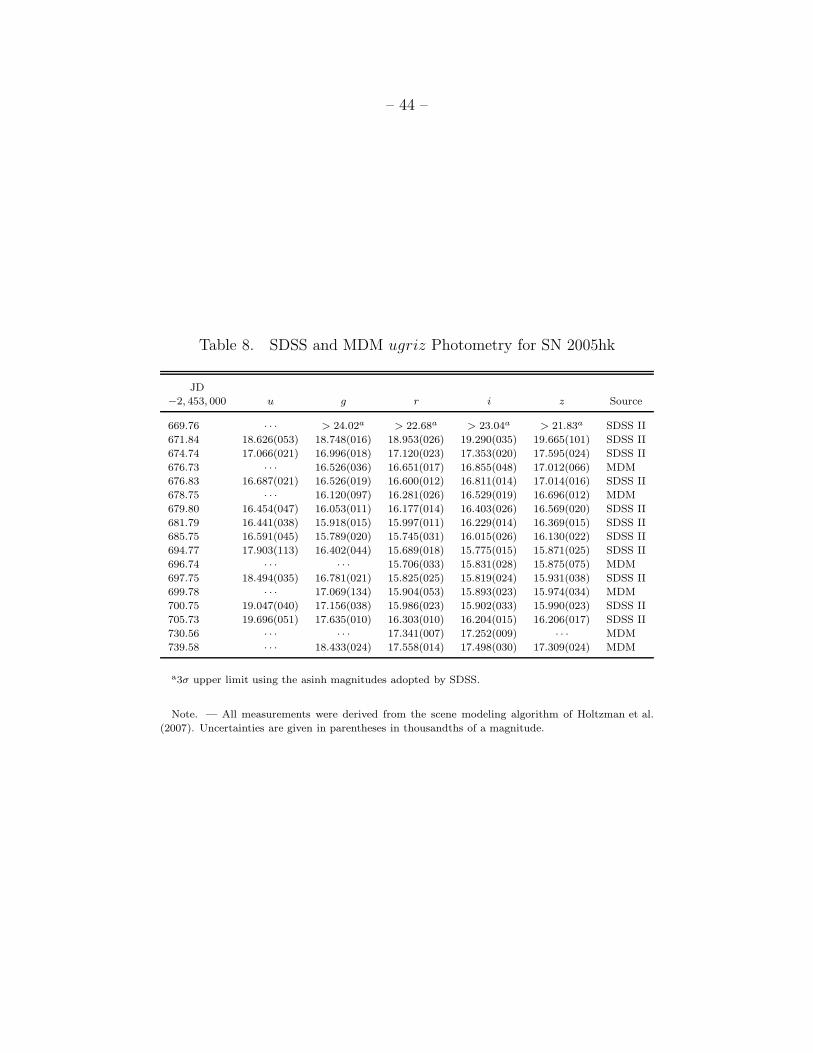
– 44 –
Table 8. SDSS and MDM ugriz Photometry for SN 2005hk
JD
−2, 453, 000 u g r i z Source
669.76 · · · > 24.02a > 22.68a > 23.04a > 21.83a SDSS II
671.84 18.626(053) 18.748(016) 18.953(026) 19.290(035) 19.665(101) SDSS II
674.74 17.066(021) 16.996(018) 17.120(023) 17.353(020) 17.595(024) SDSS II
676.73 · · · 16.526(036) 16.651(017) 16.855(048) 17.012(066) MDM
676.83 16.687(021) 16.526(019) 16.600(012) 16.811(014) 17.014(016) SDSS II
678.75 · · · 16.120(097) 16.281(026) 16.529(019) 16.696(012) MDM
679.80 16.454(047) 16.053(011) 16.177(014) 16.403(026) 16.569(020) SDSS II
681.79 16.441(038) 15.918(015) 15.997(011) 16.229(014) 16.369(015) SDSS II
685.75 16.591(045) 15.789(020) 15.745(031) 16.015(026) 16.130(022) SDSS II
694.77 17.903(113) 16.402(044) 15.689(018) 15.775(015) 15.871(025) SDSS II
696.74 · · · · · · 15.706(033) 15.831(028) 15.875(075) MDM
697.75 18.494(035) 16.781(021) 15.825(025) 15.819(024) 15.931(038) SDSS II
699.78 · · · 17.069(134) 15.904(053) 15.893(023) 15.974(034) MDM
700.75 19.047(040) 17.156(038) 15.986(023) 15.902(033) 15.990(023) SDSS II
705.73 19.696(051) 17.635(010) 16.303(010) 16.204(015) 16.206(017) SDSS II
730.56 · · · · · · 17.341(007) 17.252(009) · · · MDM
739.58 · · · 18.433(024) 17.558(014) 17.498(030) 17.309(024) MDM
a3σ upper limit using the asinh magnitudes adopted by SDSS.
Note. — All measurements were derived from the scene modeling algorithm of Holtzman et al.
(2007). Uncertainties are given in parentheses in thousandths of a magnitude.

– 45 –
Table 9. Apparent Peak Magnitudes for SN 2005hk
JD Maximum
Filter -2,453,000 Magnitude
u′ 681.5 ± 0.5 16.34 ± 0.02
g′ 686.0 ± 0.5 15.79 ± 0.01
r′ 691.9 ± 0.5 15.68 ± 0.01
i′ 695.0 ± 1.0 15.80 ± 0.02
B 685.1 ± 0.5 15.92 ± 0.01
V 688.7 ± 0.5 15.75 ± 0.01
R 691.4 ± 0.5 15.53 ± 0.02
I 695.1 ± 0.5 15.38 ± 0.02
Y 701.2 ± 1.0 15.41 ± 0.02
J 696.4 ± 8.0 15.88 ± 0.03
H 700.9 ± 1.5 15.52 ± 0.02
Note. — Uncertainties in the peak
magnitudes were estimated from the
rms of the photometric points about
a polynomial fit. Uncertainties in the
epochs of maximum are based on the
light-curve sampling for each filter and
the shape of the light curve.

– 46 –
Table 10. Absolute Peak Magnitudes
SN Mmax
BMmax
VMmax
RMmax
IMmax
JMmax
H
2002cx -17.53(26) -17.49(22) -17.60(20) -17.73(18) · · · · · ·
2005hk -18.02(32) -18.08(29) -18.20(27) -18.28(26) -17.70(25) -18.02(25)
Typical SN Iaa -19.12(04) -19.06(04) -19.09(03) -18.85(05) -18.61(13) -18.28(15)
1999byb -17.15(23) -17.64(23) -17.84(23) -17.86(23) · · · -17.87(15)
aThese absolute magnitudes correspond to a normal SN Ia with a decline rate of ∆m15(B) =
1.56 mag.
bSN 1999by was a low-luminosity SN 1991bg-like event.

– 47 –
Table 11. Revised Photometry of SN 2002cx
JD
−2, 452, 000 B V R I Telescope
411.78 17.920(035) 17.995(018) 17.868(017) 17.926(020) Nickel
412.78 17.755(021) 17.896(027) 17.886(032) 17.601(042) KAIT
419.81 · · · · · · 17.644(078) 17.377(070) KAIT
421.76 18.180(058) 17.764(043) 17.576(038) 17.381(055) KAIT
422.74 18.220(041) 17.757(025) 17.575(023) 17.424(048) KAIT
423.73 18.339(025) 17.861(025) 17.564(071) 17.492(034) KAIT
424.75 18.576(034) 17.916(028) 17.625(022) 17.501(052) KAIT
425.75 18.771(048) 17.958(030) 17.651(032) 17.539(054) KAIT
426.71 18.879(051) 17.989(039) 17.640(042) 17.506(048) KAIT
427.71 19.047(088) 18.095(044) 17.681(025) 17.510(063) KAIT
428.75 19.232(061) 18.190(037) 17.779(031) 17.563(056) KAIT
429.74 19.424(068) 18.248(042) 17.756(030) 17.552(043) KAIT
430.70 19.547(115) 18.368(039) 17.879(029) 17.638(047) KAIT
431.76 19.543(206) 18.440(059) 17.858(047) 17.509(062) KAIT
432.69 19.783(149) 18.477(040) 17.923(027) 17.584(044) KAIT
433.73 19.985(031) 18.691(025) 18.018(019) · · · Nickel
433.78 20.041(037) 18.670(023) · · · 17.632(015) Nickel
433.79 · · · 18.613(031) · · · · · · Nickel
434.70 19.975(176) 18.574(087) 17.974(030) 17.651(075) KAIT
435.69 19.974(146) 18.739(047) 18.064(035) 17.844(078) KAIT
435.71 20.142(035) 18.826(035) 18.124(015) 17.702(034) Nickel
435.71 · · · 18.840(035) · · · · · · Nickel
436.74 20.275(126) 18.789(083) 18.172(046) 17.777(065) KAIT
436.75 20.277(035) 18.933(024) 18.174(016) 17.916(024) Nickel
437.70 20.270(195) 18.922(072) 18.335(040) 17.867(056) KAIT
437.70 20.362(041) 18.944(032) 18.222(015) 17.920(032) Nickel
437.74 20.315(031) · · · · · · · · · KAIT
438.72 20.222(140) 18.952(055) 18.485(148) 17.843(075) KAIT
440.71 · · · 19.153(079) 18.381(047) 18.058(058) KAIT
442.71 · · · 19.155(081) 18.525(068) 18.088(081) KAIT
443.74 · · · 19.290(143) 18.675(091) 18.216(111) KAIT
447.71 · · · 19.396(144) 18.833(105) 18.261(087) KAIT
465.69 21.265(113) 19.821(046) 19.305(053) 18.820(163) Nickel
621.08 · · · 21.598(164) 21.546(229) 20.751(201) Nickel
Note. — All measurements were made on host galaxy-subtracted images. Uncertain-
ties are given in parentheses in thousandths of a magnitude.

– 48 –
Phillips et al. Fig. 1

– 49 –
Phillips et al. Fig. 2

– 50 –
Phillips et al. Fig. 3

– 51 –
670 680 690 700 710 720 730 740 750 760 770
JD (2453000+)
12
13
14
15
16
17
18
19
20
21
22
23
Mag
nit
ud
e
CSP
u’ + 1.5B + 1g’ + 0.5Vr’ - 0.5i’ - 1Y - 1.5J - 2.5H - 3K - 3.5
Phillips et al. Fig. 4

– 52 –
12
13
14
15
16
17
18
19
20
21
22
Mag
nit
ud
e
U + 2.5B + 1VR - 1I - 2
670 680 690 700 710 720 730 740JD (2453000+)
12
13
14
15
16
17
18
19
20
21
22
Mag
nit
ud
e
KAIT +
SDSS + MDM
CTIO
u’ + 1g’r’ - 1i’ - 2z’ - 3
Phillips et al. Fig. 5

– 53 –
16
17
18
19
Mag
nit
ud
e
B
CSPKAIT
V
680 700 720 740JD (2453000+)
-0.2
-0.1
0.0
∆mag
680 700 720 740
16 17 18 19CSP Magnitude
-0.2
-0.1
0.0
∆mag
- S
corr
16 17 18 19
Phillips et al. Fig. 6

– 54 –
15
16
17
18
19
20
21
Mag
nit
ud
e
u g
-0.2
-0.1
0.0
0.1
∆mag
15
16
17
18
19
20
21
Mag
nit
ud
e
r
SDSSCSP
i
680 700 720 740JD (2453000+)
-0.2
-0.1
0.0
0.1
∆mag
680 700 720 740
Phillips et al. Fig. 7

– 55 –
3000 4000 5000 6000 7000 8000 9000 10000Rest Wavelength (Ang)
-18
-17
-16
-15
-14
-13
-12
log
Fλ +
co
nst
ant
-5
+13
+24
+55
-4
+12
+25
+56
SN2002cxSN2005hk
Phillips et al. Fig. 8

– 56 –
-15000
-10000
-5000
Fe III 4404 Ca II H&K
2005hk2002cx1992ASYNOW1_3_3
-15000
-10000
-5000Vel
oci
ty (
km/s
) Fe III 5129 Si II 6355
0 20 40 60
Rest Days Since B maximum
-15000
-10000
-5000
Fe II 4555
0 20 40 60
S II 5454,5640
Phillips et al. Fig. 9

– 57 –
0
1
2
3
Mag
nit
ud
e b
elo
w p
eak
B V
-10 0 10 20 30 40 50
Rest Days Since B Maximum
0
1
2
3 R
2002cx2005hk
-10 0 10 20 30 40 50
I
Phillips et al. Fig. 10

– 58 –
0.0
0.5
1.0
1.5
B-V
-0.5
0.0
0.5
1.0
Co
lor
(mag
) V-R
2002cx2005hk1992A
-10 0 10 20 30 40 50Rest Days Since B Maximum
-0.5
0.0
0.5
1.0 V-I
Phillips et al. Fig. 11

– 59 –
0
1
2
3
4
Y
2005hk2005el (∆m
15(B) = 1.47)
2005ke (∆m15
(B) = 1.82)
0
1
2
3
4Mag
nit
ud
e b
elo
w p
eak
J
-10 0 10 20 30 40 50 60 70Rest Days Since B Maximum
0
1
2
3
4
H
Phillips et al. Fig. 12
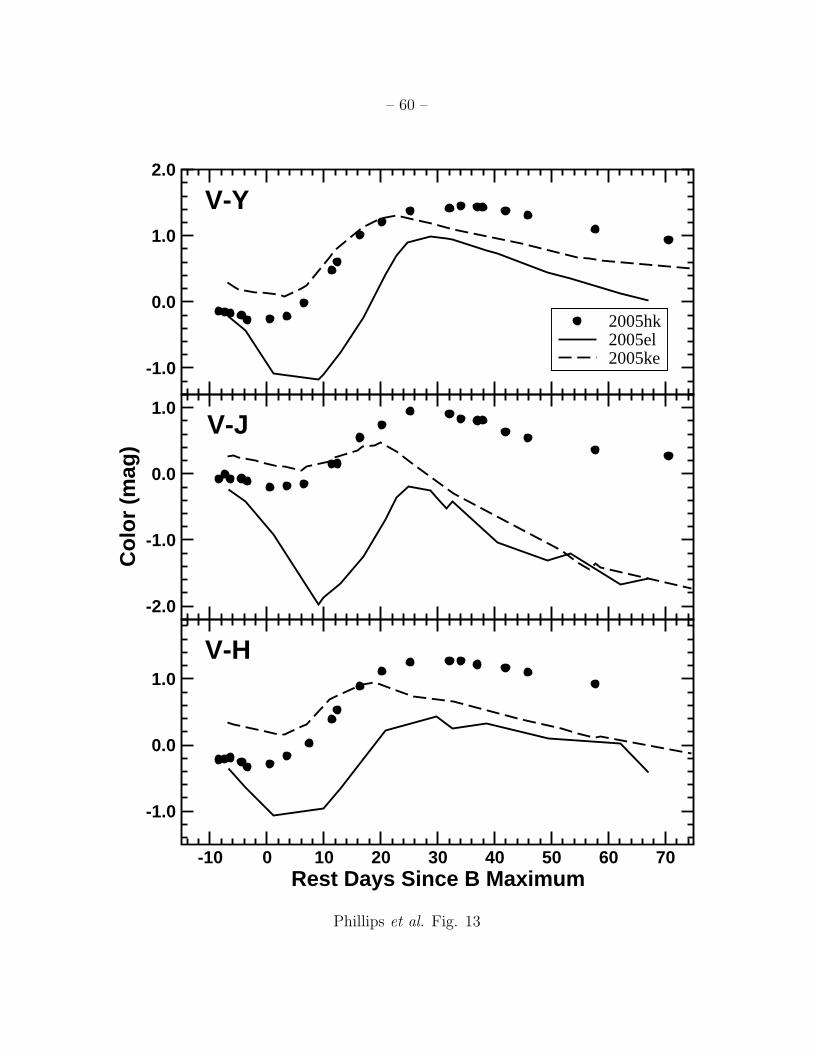
– 60 –
-1.0
0.0
1.0
2.0
V-Y
-2.0
-1.0
0.0
1.0
Co
lor
(mag
)
V-J
2005hk2005el2005ke
-10 0 10 20 30 40 50 60 70Rest Days Since B Maximum
-1.0
0.0
1.0
V-H
Phillips et al. Fig. 13

– 61 –
-20-19-18-17
B
2005hk
-20-19-18-17
V
-20-19-18-17
Mm
ax
I
-20-19-18-17
J
0.8 1 1.2 1.4 1.6 1.8 2∆m15(B)
-20-19-18-17
H
Phillips et al. Fig. 14

– 62 –
Phillips et al. Fig. 15

– 63 –
Phillips et al. Fig. 16