Optical and near infrared coverage of SN 2004et: physical parameters and comparison with other type...
25
arXiv:0912.3111v1 [astro-ph.SR] 16 Dec 2009 Mon. Not. R. Astron. Soc. 000, 000–000 (0000) Printed 16 December 2009 (MN L A T E X style file v2.2) Optical and near infrared coverage of SN 2004et: physical parameters and comparison with other type IIP supernovae K. Maguire, 1 ⋆ E. Di Carlo, 2 S. J. Smartt, 1 A. Pastorello, 1 D. Yu. Tsvetkov, 3 S. Benetti, 4 S. Spiro, 5,6 A. A. Arkharov, 7,8 G. Beccari, 9 M. T. Botticella, 1 E. Cappellaro, 4 S. Cristallo, 2,10 M. Dolci, 2 N. Elias-Rosa, 4,11 M. Fiaschi, 12 D. Gorshanov, 7 A. Harutyunyan, 4,13 V. M. Larionov, 7,8 H. Navasardyan, 4 A. Pietrinferni, 2 G. Raimondo, 2 G. Di Rico, 2 S. Valenti, 1 G. Valentini, 2 L. Zampieri 4 1 Astrophysics Research Centre, School of Maths and Physics, Queen’s University Belfast, Belfast BT7 1NN, UK 2 INAF Osservatorio Astronomico Collurania di Teramo, Via Mentore Maggini, I-64100, Teramo, Italy 3 Sternberg Astronomical Institute, University Ave. 13, 119992 Moscow, Russia 4 INAF Osservatorio Astronomico di Padova, Vicolo dell’ Osservatorio 5, I-35122 Padova, Italy 5 Dipartimento di Fisica, Universit´ a di Roma Tor Vergata, Via della Ricerca scientifica 1, 00133 Roma, Italy 6 INAF Osservatorio Astronomico di Roma, Via di Frascati 33, 00040 Monte Porzio Catone, Italy 7 Pulkovo Central Astronomical Observatory, Pulkovskoe shosse 65, 196140, St. Petersberg, Russia 8 Astronomical Institute of St Petersburg State University, Universitetskij Prospect 28, Petrodvorets, 198504 St. Petersburg, Russia 9 ESA/ESTEC, Keplerlaab 1, 2200 AG Noordwijk, Netherlands 10 Departamento de Fisica Teorica y del Cosmos, Universidad de Granada, Spain 11 Spitzer Science Center, California Institute of Technology, 1200 E. California Blvd., Pasadena, California 91125, USA 12 Dipartimento di Astronomia, Universit´ a di Padova, Vicolo dell Osservatorio 2, I-35122 Padova, Italy 13 Fundaci´ on Galileo Galilei - INAF, Apartado 565, E-38700 Santa Cruz de La Palma, Spain 16 December 2009 ABSTRACT We present new optical and near infrared (NIR) photometry and spectroscopy of the type IIP supernova (SN), SN 2004et. In combination with already published data, this provides one of the most complete studies of optical and NIR data for any type IIP SN from just after explo- sion to +500 days. The contribution of the NIR flux to the bolometric light curve is estimated to increase from 15 per cent at explosion to around 50 per cent at the end of the plateau and then declines to 40 per cent at 300 days. SN 2004et is one of the most luminous IIP SNe which has been well studied and characterised, and with a luminosity of log L = 42.3 erg s −1 and a 56 Ni mass of 0.06 ± 0.04 M ⊙ , it is 2 times brighter than SN 1999em. We provide parametrised bolometric corrections as a function of time since explosion for SN 2004et and three other IIP SNe that have extensive optical and NIR data. These can be used as templates for future events in optical and NIR surveys without full wavelength coverage. We compare the physi- cal parameters of SN 2004et with those of other well studied IIP SNe and find that the kinetic energies span a range of 10 50 –10 51 ergs. We compare the ejected masses calculated from hy- drodynamic models with the progenitor masses and limits derived from prediscovery images. Some of the ejected mass estimates are significantly higher than the progenitor mass esti- mates, with SN 2004et showing perhaps the most serious mass discrepancy. With the current models, it appears difficult to reconcile 100 day plateau lengths and high expansion velocities with the low ejected masses of 5–6 M ⊙ implied from 7–8 M ⊙ progenitors. The nebular phase is studied using very late time HST photometry, along with optical and NIR spectroscopy. The light curve shows a clear flattening at 600 days in the optical and the NIR, which is likely due to the ejecta impacting on circumstellar material. We further show that the [O i] 6300, 6364 Å line strengths in the nebular spectra of four type IIP SNe imply ejected oxygen masses of 0.5–1.5 M ⊙ . Key words: supernovae: general – supernovae: individual: 2004et – supernovae: individual: 2004A – supernovae: individual: 2006my
-
Upload
independent -
Category
Documents
-
view
2 -
download
0
Transcript of Optical and near infrared coverage of SN 2004et: physical parameters and comparison with other type...

arX
iv:0
912.
3111
v1 [
astr
o-ph
.SR
] 16
Dec
200
9
Mon. Not. R. Astron. Soc.000, 000–000 (0000) Printed 16 December 2009 (MN LATEX style file v2.2)
Optical and near infrared coverage of SN 2004et: physicalparameters and comparison with other type IIP supernovae
K. Maguire,1⋆ E. Di Carlo,2 S. J. Smartt,1 A. Pastorello,1 D. Yu. Tsvetkov,3 S. Benetti,4
S. Spiro,5,6 A. A. Arkharov,7,8 G. Beccari,9 M. T. Botticella,1 E. Cappellaro,4 S. Cristallo,2,10
M. Dolci,2 N. Elias-Rosa,4,11 M. Fiaschi,12 D. Gorshanov,7 A. Harutyunyan,4,13
V. M. Larionov,7,8 H. Navasardyan,4 A. Pietrinferni,2 G. Raimondo,2 G. Di Rico,2 S. Valenti,1
G. Valentini,2 L. Zampieri41Astrophysics Research Centre, School of Maths and Physics,Queen’s University Belfast, Belfast BT7 1NN, UK2INAF Osservatorio Astronomico Collurania di Teramo, Via Mentore Maggini, I-64100, Teramo, Italy3Sternberg Astronomical Institute, University Ave. 13, 119992 Moscow, Russia4INAF Osservatorio Astronomico di Padova, Vicolo dell’ Osservatorio 5, I-35122 Padova, Italy5Dipartimento di Fisica, Universita di Roma Tor Vergata, Via della Ricerca scientifica 1, 00133 Roma, Italy6INAF Osservatorio Astronomico di Roma, Via di Frascati 33, 00040 Monte Porzio Catone, Italy7Pulkovo Central Astronomical Observatory, Pulkovskoe shosse 65, 196140, St. Petersberg, Russia8Astronomical Institute of St Petersburg State University,Universitetskij Prospect 28, Petrodvorets, 198504 St. Petersburg, Russia9ESA/ESTEC, Keplerlaab 1, 2200 AG Noordwijk, Netherlands10Departamento de Fisica Teorica y del Cosmos, Universidad deGranada, Spain11Spitzer Science Center, California Institute of Technology, 1200 E. California Blvd., Pasadena, California 91125, USA12Dipartimento di Astronomia, Universita di Padova, Vicolodell Osservatorio 2, I-35122 Padova, Italy13Fundacion Galileo Galilei - INAF, Apartado 565, E-38700 Santa Cruz de La Palma, Spain
16 December 2009
ABSTRACTWe present new optical and near infrared (NIR) photometry and spectroscopy of the type IIPsupernova (SN), SN 2004et. In combination with already published data, this provides one ofthe most complete studies of optical and NIR data for any typeIIP SN from just after explo-sion to+500 days. The contribution of the NIR flux to the bolometric light curve is estimatedto increase from 15 per cent at explosion to around 50 per centat the end of the plateau andthen declines to 40 per cent at 300 days. SN 2004et is one of themost luminous IIP SNe whichhas been well studied and characterised, and with a luminosity of log L = 42.3 erg s−1 and a56Ni mass of 0.06± 0.04 M⊙, it is 2 times brighter than SN 1999em. We provide parametrisedbolometric corrections as a function of time since explosion for SN 2004et and three otherIIP SNe that have extensive optical and NIR data. These can beused as templates for futureevents in optical and NIR surveys without full wavelength coverage. We compare the physi-cal parameters of SN 2004et with those of other well studied IIP SNe and find that the kineticenergies span a range of 1050–1051 ergs. We compare the ejected masses calculated from hy-drodynamic models with the progenitor masses and limits derived from prediscovery images.Some of the ejected mass estimates are significantly higher than the progenitor mass esti-mates, with SN 2004et showing perhaps the most serious mass discrepancy. With the currentmodels, it appears difficult to reconcile 100 day plateau lengths and high expansionvelocitieswith the low ejected masses of 5–6 M⊙ implied from 7–8 M⊙ progenitors. The nebular phaseis studied using very late time HST photometry, along with optical and NIR spectroscopy. Thelight curve shows a clear flattening at 600 days in the opticaland the NIR, which is likely dueto the ejecta impacting on circumstellar material. We further show that the [Oi] 6300, 6364Å line strengths in the nebular spectra of four type IIP SNe imply ejected oxygen masses of0.5–1.5 M⊙.
Key words: supernovae: general – supernovae: individual: 2004et – supernovae: individual:2004A – supernovae: individual: 2006my
2 K. Maguire et al.
1 INTRODUCTION
Supernovae (SNe) are classified based on the elements present intheir spectra, with type II SNe being distinguished from Type I SNeby the presence of hydrogen (for review see Filippenko 1997). Thetype of explosion is directly determined by the evolutionary statusof the progenitor star, which is influenced by the initial mass, metal-licity, rotation rate and presence of a binary companion (Smartt2009). The progenitor stars of some type II SNe have been shown tobe red supergiants (Smartt et al. 2004; Li et al. 2005) and in somerare cases blue supergiants (Walborn et al. 1987; Pastorello et al.2005). Stellar evolutionary models predict that most single starswith masses in the range∼ 8–30 M⊙ should end their lives asred supergiants and produce type II SNe (Eldridge & Tout 2004;Heger et al. 2003; Hirschi et al. 2004; Limongi & Chieffi 2003).This is supported by the observational constraints on core-collapsesupernova progenitors, although the lack of the detection of highmass progenitors is concerning (Smartt 2009).
Type II SNe can be further subclassified based on the shape oftheir light curves. Those that display a linear decrease from peakmagnitude are called type IIL SNe, while those that display an ex-tended plateau of nearly constant luminosity are termed type IIPSNe. The plateau phase generally lasts∼ 80–120 days before en-tering the exponential decay phase and is caused by the diffusionof thermal energy deposited by the shock wave and by the releaseof internal energy when hydrogen starts to recombine. During re-combination, constant luminosity is achieved by the balance of theincrease in radius caused by expansion and the inward movement(in Lagrangian coordinates) of the recombination front. Itis obser-vationally established that the majority of IIP SN progenitors arered supergiants that initially have masses above 8 M⊙ and up toat least 17 M⊙. Smartt et al. (2009) summarised the observed pro-genitor properties of the nearest IIP SNe and found a lack of highmass red supergiants in this sample. If these estimates of progenitormasses are accurate, it means long plateau phases are produced byejected envelope masses as low as 6–7 M⊙, which are in some casesmuch lower values than those calculated from light curve modelling(Hamuy 2003; Nadezhin 2003).
Type IIP SNe have been proposed as cosmological standardcandles and their use as distance indicators has been demonstratedin Hamuy & Pinto (2002); Nugent et al. (2006); Poznanski et al.(2009). Therefore a detailed understanding of their pre-explosionparameters and explosion physics is of the utmost importance.Despite being the most common type of SN observed, there isa surprisingly small sample of IIP SNe to date with well mon-itored optical light curves and spectra from just after explosionthrough to the radioactive tail phase. In the past twenty years,there have been only four IIP SNe for which extended photo-metric and spectral monitoring observations have been published;SN 1990E (Schmidt et al. 1993; Benetti et al. 1994), SN 1999em(Elmhamdi et al. 2003; Leonard et al. 2002a; Hamuy et al. 2001),SN 1999gi (Leonard et al. 2002b) and SN 2005cs (Pastorello etal.2006; Tsvetkov et al. 2006; Brown et al. 2007; Dessart et al. 2008;Pastorello et al. 2009). Coverage at near infrared wavelengths iseven less common, with only one type IIP SN having been ob-served extensively both photometrically and spectroscopically atthese wavelengths in the last ten years, SN 1999em (Hamuy et al.2001; Elmhamdi et al. 2003; Krisciunas et al. 2009).
SN 2004et was discovered in the nearby starburstgalaxy, NGC 6946 by S. Moretti on 2004 September 27(Zwitter, Munari & Moretti 2004). At a distance of only 5.9±0.4 Mpc (Karachentsev, Sharina & Huchtmeier 2000), it was
an ideal candidate for intensive follow-up observations. Ahighresolution spectrum of SN 2004et was obtained with the Mt.Ekar 1.82-m telescope on 2004 September 28 that confirmed itwas a type II event with spectra showing prominent H Balmerlines with P-Cygni profiles (Zwitter, Munari & Moretti 2004). Atotal extinction ofE(B-V)= 0.41± 0.007 was also estimated byZwitter, Munari & Moretti (2004) from the equivalent width of theNa ID lines in the high resolution spectrum. SN 2004et (R.A.:20h
35m 25s.33, Decl.:+60◦ 07’ 17”.7 (J2000)) was located in one ofthe spiral arms of the galaxy, which are known to be regions ofhigh star formation. NGC 6946 is presently the galaxy with thehighest number of SNe discovered to date, 9 SNe since the firstinSN 1917A with the most recent being SN 2008S, which has beensuggested by Botticella et al. (2009) as a probable electron-captureevent, although its nature has been debated (Smith et al. 2009).
Sahu et al. (2006) reported optical photometric and spectro-scopic observations of SN 2004et from 8–541 days post explosion.They noted that SN 2004et was at the brighter end of SNe IIP lu-minosities and estimated the mass of56Ni synthesised during theexplosion to be 0.06± 0.02 M⊙. They also suggested that the steep-ening of the decline rates of the optical luminosity one yearafterexplosion along with a blueshift in the emission lines at a similarepoch was an indication of dust formation. Misra et al. (2007) pre-sented optical photometry of SN 2004et from∼ 14–470 days postexplosion and in agreement with Sahu et al. (2006), estimated anejected56Ni mass of 0.06± 0.03 M⊙.
SN 2004et was detected at radio frequencies just 14 days postexplosion (Stockdale et al. 2004) and this early detection suggeststhe presence of appreciable circumstellar material (CSM) aroundthe SN (Sahu et al. 2006). The SN was extensively monitored byStockdale et al. (2004) using the VLA at 22.4 and 8.4 GHz andby Beswick et al. (2004) using MERLIN at 4.9 GHz. SN 2004etwas also observed on 2005 January 02 using the GMRT at 1.4GHz (Misra et al. 2007) and an 8.4 GHz VLBI observation wasobtained by Martı-Vidal et al. (2007) on 2005 Feburary 20 show-ing a clear asymmetry in the emission structure that can be ex-plained if the SN ejecta expanded in a clumpy CSM. The radioluminosity of SN 2004et was found to be among the highest for IIPSNe (Chevalier, Fransson & Nymark 2006) with an estimated pre-supernova mass-loss rate of 1.5–3× 10⁻⁶ M⊙ yr−1 (using a windvelocity of 10 km s−1), which suggests a progenitor mass of∼ 20M⊙. X-ray data of SN 2004et were also obtained using the ChandraX-ray Observatory at 30, 45 and 72 days post explosion (Rho etal.2007; Misra et al. 2007). The unabsorbed X-ray luminosity sug-gests a wind density parameter value of 2.5, which is a factorof2 larger than the wind densities calculated for SN 1999em andSN2004dj (Chugai et al. 2007). This gives a pre-supernova mass-lossrate of 2–2.5× 10⁻⁶ M⊙ yr−1, which is consistent with estimatefrom the radio observations.
Kotak et al. (2009) presented mid infrared (MIR) observationsof SN 2004et obtained with the Spitzer Space Telescope rangingfrom 64–1240 days post explosion, along with three very late-timeoptical spectra. They reported spectroscopic evidence forsilicatedust formation in the ejecta of SN 2004et with a total mass forthedust of mass of a few times 10−4 M⊙, which would not make a ma-jor contribution to the total mass of cosmic dust. The most promi-nent spectral emission lines in the very late-time optical spectra areobserved to display boxy profiles, which was suggested to be asig-nature of ejecta-CSM interaction.
Li et al. (2005) reported that the progenitor of SN 2004et hadbeen identified in a pre-explosion optical image of NGC 6946 as ayellow supergiant. However, Crockett et al. (2009) have shown that

Optical and near infrared coverage of SN 2004et3
the source indicated as the progenitor by Li et al. (2005) is still vis-ible in images taken after SN 2004et has faded and so cannot betheprogenitor star. At the same time, Crockett et al. (2009) also identi-fied an alternative progenitor star in a pre-explosioni’ band imagetaken at the Isaac Newton Telescope with the Wide Field Camera.This star was not detected in pre-explosionV or R band imagessuggesting that the progenitor of SN 2004et is either intrinsicallyred or surrounded by dust. The luminosity of the progenitor wasestimated using theI band photometry andR–I colour limits. Us-ing the STARS stellar evolutionary model (Eldridge & Tout 2004),the progenitor star was found consistent with a late K to lateM-type supergiant with an initial mass of 8+5
−1 M⊙ (see Crockett et al.(2009) for more details).
In this paper, we present our own complete data set for SN2004et making one of the most comprehensive sets of optical andNIR photometry and spectroscopy for a type IIP SNe, with datacoverage from soon after explosion through to the radioactive tailphase. The information obtained from analysis of the light curveand spectra is compared to the progenitor information obtainedfrom the pre-explosion images to explore if the resulting progen-itor properties are consistent. Extensive NIR spectroscopy is rarefor type IIP SNe and so we investigate what further results can beobtained from analysis of NIR spectral features. SN 2004et is alsoincluded in a wider sample of nearby type IIP SNe to determinehow its properties fit in the overall picture for the core-collapse ofmassive, hydrogen-rich stars.
2 OBSERVATIONS AND DATA REDUCTION
2.1 Optical photometry
Optical photometric observations of SN 2004et were carriedout us-ing a range of telescopes, beginning soon after its discovery (2004September 27) until over three years post explosion (2008 January18). Observations at very early times were taken with a 0.41-m tele-scope equipped with an Apogee AP47p CCD inBVRI filters andthe 1.82-m Copernico telescope equipped with AFOSC, located atMt. Ekar-Asiago (Italy). Three epochs of data were taken with the3.58-m Telescopio Nazionale Galileo (TNG) using DOLORES, lo-cated at Roque de Los Muchachos Observatory, La Palma, CanaryIslands, along with data from the 0.72-m TNT at the Collurania Ob-servatory (Teramo, Italy). Photometric observations werealso ob-tained with the 0.7-m AZT2 telescope at the Sternberg Astronom-ical Institute, Moscow, the 0.6-m Z600 telescope at the CrimeanLaboratory of SAI, Nauchny, Crimea, the 0.38-m KGB telescopeat the Crimean Astrophysical Observatory, Nauchny, Crimeaandthe 1-m SAO Z1000 telescope at the Special Astrophysical Obser-vatory of the Russian Academy of Sciences, Zelenchuk. Two latetime observations were also taken with the 2.56-m Nordic Opti-cal Telescope (NOT) at Roque de Los Muchachos Observatory, LaPalma, Canary Islands using ALFOSC.
All the images were trimmed, bias subtracted and flat-fieldcorrected using the standardiraf1 tasks. A sequence of stars in thefield of view of SN 2004et were calibrated with respect to the se-quence star magnitudes given in Misra et al. (2007). The sequence
1iraf is distributed by the National Optical Astronomy Observatories,
which are operated by the Association of Universities for Research in As-tronomy, Inc., under the cooperative agreement with the National ScienceFoundation.
Figure 1. The field of SN 2004et with the supernova and comparison starsmarked. This image was taken with the 1.82m telescope at Mt. Ekar, Italy∼ 3 weeks post explosion in theV band.
star magnitudes of Misra et al. (2007) were also confirmed inde-pendently using standard star observations obtained on some of thenights. The errors on the reported magnitudes for SN 2004et weredetermined by adding in quadrature the errors on the instrumentalmagnitudes and the errors due to the magnitude calibration.Figure1 shows a finding chart for SN 2004et, with the secondary standardstars marked.
Additional late time Hubble Space Telescope (HST) WFPC2observations were obtained as part of the proprietary program GO-11229 (PI: Meixner) in July 2007 and January 2008, which havesince been made public. These images were downloaded from theSpace Telescope Science Institute (STScI) archive using the OTFRpipeline. Observations were obtained in two filtersF606W andF814W that are equivalent to the JohnsonV and I bands respec-tively. PSF-fitting photometry was performed on the data using theHSTphot package (Dolphin 2000). HSTphot corrects for chip-to-chip variations and aperture corrections. No colour corrections havebeen applied to convert toV andI filters because the colour trans-formations to the Johnson-Cousins magnitude system are notwellconstrained for late time SN spectra. The magnitude values quotedin Table 1 are for the HST filters in the Vegamag system. One epochof very late timeBVRIdata was also obtained with the William Her-schel Telescope (WHT) at Roque de Los Muchachos Observatory,La Palma, Canary Islands using the Auxiliary Port Imager (AUX).
2.2 Near infrared photometry
SN 2004et was observed in the NIRJHK bands with SWIRCAMmounted at the focal plane of the 1.08-m AZT-24 telescope, atCampo Imperatore Observatory (Italy) on 27 epochs between 2004September 30 and 2006 September 21. The AZT-24 telescope is op-erated jointly by the Pulkovo observatory (St. Petersburg,Russia)and INAF Observatorio Astronomico di Roma/Collurania (CampoImperatore, Italy). SWIRCAM is equipped with a Rockwell PIC-
4 K. Maguire et al.
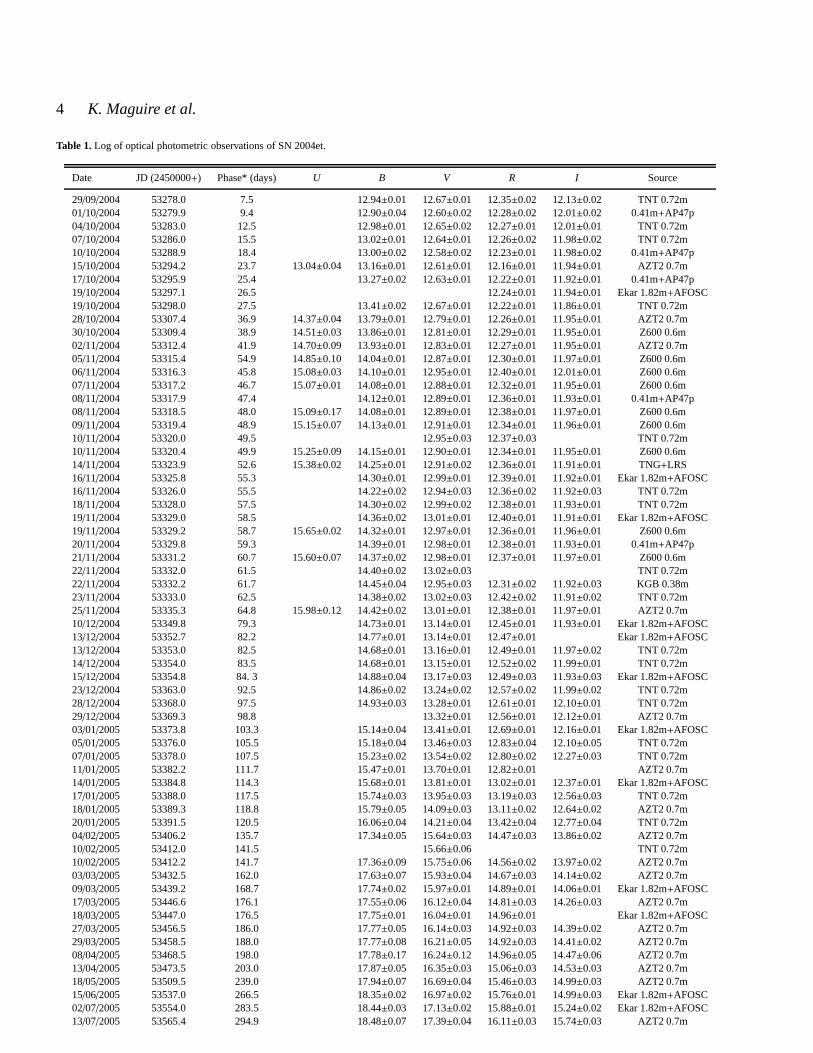
Table 1. Log of optical photometric observations of SN 2004et.
Date JD (2450000+) Phase* (days) U B V R I Source
29/09/2004 53278.0 7.5 12.94±0.01 12.67±0.01 12.35±0.02 12.13±0.02 TNT 0.72m01/10/2004 53279.9 9.4 12.90±0.04 12.60±0.02 12.28±0.02 12.01±0.02 0.41m+AP47p04/10/2004 53283.0 12.5 12.98±0.01 12.65±0.02 12.27±0.01 12.01±0.01 TNT 0.72m07/10/2004 53286.0 15.5 13.02±0.01 12.64±0.01 12.26±0.02 11.98±0.02 TNT 0.72m10/10/2004 53288.9 18.4 13.00±0.02 12.58±0.02 12.23±0.01 11.98±0.02 0.41m+AP47p15/10/2004 53294.2 23.7 13.04±0.04 13.16±0.01 12.61±0.01 12.16±0.01 11.94±0.01 AZT2 0.7m17/10/2004 53295.9 25.4 13.27±0.02 12.63±0.01 12.22±0.01 11.92±0.01 0.41m+AP47p19/10/2004 53297.1 26.5 12.24±0.01 11.94±0.01 Ekar 1.82m+AFOSC19/10/2004 53298.0 27.5 13.41±0.02 12.67±0.01 12.22±0.01 11.86±0.01 TNT 0.72m28/10/2004 53307.4 36.9 14.37±0.04 13.79±0.01 12.79±0.01 12.26±0.01 11.95±0.01 AZT2 0.7m30/10/2004 53309.4 38.9 14.51±0.03 13.86±0.01 12.81±0.01 12.29±0.01 11.95±0.01 Z600 0.6m02/11/2004 53312.4 41.9 14.70±0.09 13.93±0.01 12.83±0.01 12.27±0.01 11.95±0.01 AZT2 0.7m05/11/2004 53315.4 54.9 14.85±0.10 14.04±0.01 12.87±0.01 12.30±0.01 11.97±0.01 Z600 0.6m06/11/2004 53316.3 45.8 15.08±0.03 14.10±0.01 12.95±0.01 12.40±0.01 12.01±0.01 Z600 0.6m07/11/2004 53317.2 46.7 15.07±0.01 14.08±0.01 12.88±0.01 12.32±0.01 11.95±0.01 Z600 0.6m08/11/2004 53317.9 47.4 14.12±0.01 12.89±0.01 12.36±0.01 11.93±0.01 0.41m+AP47p08/11/2004 53318.5 48.0 15.09±0.17 14.08±0.01 12.89±0.01 12.38±0.01 11.97±0.01 Z600 0.6m09/11/2004 53319.4 48.9 15.15±0.07 14.13±0.01 12.91±0.01 12.34±0.01 11.96±0.01 Z600 0.6m10/11/2004 53320.0 49.5 12.95±0.03 12.37±0.03 TNT 0.72m10/11/2004 53320.4 49.9 15.25±0.09 14.15±0.01 12.90±0.01 12.34±0.01 11.95±0.01 Z600 0.6m14/11/2004 53323.9 52.6 15.38±0.02 14.25±0.01 12.91±0.02 12.36±0.01 11.91±0.01 TNG+LRS16/11/2004 53325.8 55.3 14.30±0.01 12.99±0.01 12.39±0.01 11.92±0.01 Ekar 1.82m+AFOSC16/11/2004 53326.0 55.5 14.22±0.02 12.94±0.03 12.36±0.02 11.92±0.03 TNT 0.72m18/11/2004 53328.0 57.5 14.30±0.02 12.99±0.02 12.38±0.01 11.93±0.01 TNT 0.72m19/11/2004 53329.0 58.5 14.36±0.02 13.01±0.01 12.40±0.01 11.91±0.01 Ekar 1.82m+AFOSC19/11/2004 53329.2 58.7 15.65±0.02 14.32±0.01 12.97±0.01 12.36±0.01 11.96±0.01 Z600 0.6m20/11/2004 53329.8 59.3 14.39±0.01 12.98±0.01 12.38±0.01 11.93±0.01 0.41m+AP47p21/11/2004 53331.2 60.7 15.60±0.07 14.37±0.02 12.98±0.01 12.37±0.01 11.97±0.01 Z600 0.6m22/11/2004 53332.0 61.5 14.40±0.02 13.02±0.03 TNT 0.72m22/11/2004 53332.2 61.7 14.45±0.04 12.95±0.03 12.31±0.02 11.92±0.03 KGB 0.38m23/11/2004 53333.0 62.5 14.38±0.02 13.02±0.03 12.42±0.02 11.91±0.02 TNT 0.72m25/11/2004 53335.3 64.8 15.98±0.12 14.42±0.02 13.01±0.01 12.38±0.01 11.97±0.01 AZT2 0.7m10/12/2004 53349.8 79.3 14.73±0.01 13.14±0.01 12.45±0.01 11.93±0.01 Ekar 1.82m+AFOSC13/12/2004 53352.7 82.2 14.77±0.01 13.14±0.01 12.47±0.01 Ekar 1.82m+AFOSC13/12/2004 53353.0 82.5 14.68±0.01 13.16±0.01 12.49±0.01 11.97±0.02 TNT 0.72m14/12/2004 53354.0 83.5 14.68±0.01 13.15±0.01 12.52±0.02 11.99±0.01 TNT 0.72m15/12/2004 53354.8 84. 3 14.88±0.04 13.17±0.03 12.49±0.03 11.93±0.03 Ekar 1.82m+AFOSC23/12/2004 53363.0 92.5 14.86±0.02 13.24±0.02 12.57±0.02 11.99±0.02 TNT 0.72m28/12/2004 53368.0 97.5 14.93±0.03 13.28±0.01 12.61±0.01 12.10±0.01 TNT 0.72m29/12/2004 53369.3 98.8 13.32±0.01 12.56±0.01 12.12±0.01 AZT2 0.7m03/01/2005 53373.8 103.3 15.14±0.04 13.41±0.01 12.69±0.01 12.16±0.01 Ekar 1.82m+AFOSC05/01/2005 53376.0 105.5 15.18±0.04 13.46±0.03 12.83±0.04 12.10±0.05 TNT 0.72m07/01/2005 53378.0 107.5 15.23±0.02 13.54±0.02 12.80±0.02 12.27±0.03 TNT 0.72m11/01/2005 53382.2 111.7 15.47±0.01 13.70±0.01 12.82±0.01 AZT2 0.7m14/01/2005 53384.8 114.3 15.68±0.01 13.81±0.01 13.02±0.01 12.37±0.01 Ekar 1.82m+AFOSC17/01/2005 53388.0 117.5 15.74±0.03 13.95±0.03 13.19±0.03 12.56±0.03 TNT 0.72m18/01/2005 53389.3 118.8 15.79±0.05 14.09±0.03 13.11±0.02 12.64±0.02 AZT2 0.7m20/01/2005 53391.5 120.5 16.06±0.04 14.21±0.04 13.42±0.04 12.77±0.04 TNT 0.72m04/02/2005 53406.2 135.7 17.34±0.05 15.64±0.03 14.47±0.03 13.86±0.02 AZT2 0.7m10/02/2005 53412.0 141.5 15.66±0.06 TNT 0.72m10/02/2005 53412.2 141.7 17.36±0.09 15.75±0.06 14.56±0.02 13.97±0.02 AZT2 0.7m03/03/2005 53432.5 162.0 17.63±0.07 15.93±0.04 14.67±0.03 14.14±0.02 AZT2 0.7m09/03/2005 53439.2 168.7 17.74±0.02 15.97±0.01 14.89±0.01 14.06±0.01 Ekar 1.82m+AFOSC17/03/2005 53446.6 176.1 17.55±0.06 16.12±0.04 14.81±0.03 14.26±0.03 AZT2 0.7m18/03/2005 53447.0 176.5 17.75±0.01 16.04±0.01 14.96±0.01 Ekar 1.82m+AFOSC27/03/2005 53456.5 186.0 17.77±0.05 16.14±0.03 14.92±0.03 14.39±0.02 AZT2 0.7m29/03/2005 53458.5 188.0 17.77±0.08 16.21±0.05 14.92±0.03 14.41±0.02 AZT2 0.7m08/04/2005 53468.5 198.0 17.78±0.17 16.24±0.12 14.96±0.05 14.47±0.06 AZT2 0.7m13/04/2005 53473.5 203.0 17.87±0.05 16.35±0.03 15.06±0.03 14.53±0.03 AZT2 0.7m18/05/2005 53509.5 239.0 17.94±0.07 16.69±0.04 15.46±0.03 14.99±0.03 AZT2 0.7m15/06/2005 53537.0 266.5 18.35±0.02 16.97±0.02 15.76±0.01 14.99±0.03 Ekar 1.82m+AFOSC02/07/2005 53554.0 283.5 18.44±0.03 17.13±0.02 15.88±0.01 15.24±0.02 Ekar 1.82m+AFOSC13/07/2005 53565.4 294.9 18.48±0.07 17.39±0.04 16.11±0.03 15.74±0.03 AZT2 0.7m

Optical and near infrared coverage of SN 2004et5
Table 1 – continued
Date JD (2450000+) Phase* (days) U B V R I Source
14/07/2005 53566.5 296.0 18.52±0.03 17.20±0.03 16.14±0.03 15.83±0.03 SAO Z1000 1m28/07/2005 53580.4 309.9 18.62±0.08 17.33±0.03 16.27±0.03 15.99±0.12 AZT2 0.7m04/08/2005 53587.4 316.9 18.70±0.06 17.53±0.04 16.34±0.03 16.08±0.03 AZT2 0.7m10/08/2005 53593.4 322.9 18.75±0.06 17.47±0.05 16.40±0.03 16.19±0.03 AZT2 0.7m16/08/2005 53599.4 328.9 18.86±0.07 17.59±0.10 16.49±0.03 16.23±0.04 AZT2 0.7m24/08/2005 53607.4 336.9 18.84±0.13 17.76±0.08 16.65±0.03 16.42±0.03 AZT2 0.7m28/08/2005 53611.2 340.7 20.17±0.03 18.91±0.02 17.78±0.02 16.71±0.01 16.12±0.01 TNG+LRS30/08/2005 53613.4 342.9 18.84±0.05 17.77±0.03 16.68±0.03 16.53±0.05 Z600 0.6m31/08/2005 53614.5 344.0 18.67±0.07 17.87±0.05 16.43±0.09 Z600 0.6m07/09/2005 53621.3 350.8 18.80±0.08 17.95±0.12 16.76±0.04 16.66±0.06 AZT2 0.7m14/09/2005 53628.1 357.6 19.08±0.03 17.97±0.02 17.03±0.02 16.39±0.02 NOT+ALFOSC14/09/2005 53628.4 357.9 18.95±0.06 17.84±0.06 16.81±0.04 16.61±0.05 AZT2 0.7m03/10/2005 53647.4 376.9 18.32±0.18 17.15±0.05 AZT2 0.7m10/10/2005 53654.0 383.5 19.25±0.02 18.24±0.01 17.39±0.02 16.71±0.09 Ekar 1.82m+AFOSC25/10/2005 53669.0 398.5 19.40±0.02 18.42±0.01 17.48±0.01 16.76±0.02 Ekar 1.82m+AFOSC01/11/2005 53676.4 405.9 19.44±0.06 18.54±0.04 17.54±0.03 17.32±0.13 Z600 0.6m03/11/2005 53677.8 407.3 19.47±0.03 18.56±0.01 17.56±0.01 16.86±0.04 Ekar 1.82m+AFOSC07/11/2005 53682.3 411.8 19.45±0.05 18.60±0.04 17.63±0.03 17.62±0.14 Z600 0.6m09/11/2005 53684.3 413.8 19.27±0.09 18.62±0.10 17.71±0.04 Z600 0.6m21/05/2006 53876.2 605.7 21.43±0.04 20.81±0.02 NOT+ALFOSC30/09/2006 54008.0 737.5 22.45±0.08 NOT+ALFOSC08/07/2007 54289.5 1019.0 23.01±0.01a 22.85±0.02a HST+WFPC212/08/2007 54324.5 1054.0 23.62±0.06 23.06±0.04 22.27±0.05 21.99±0.06 WHT+AUX18/01/2008 54484.8 1214.3 23.24±0.01a 22.13±0.02a HST+WFPC2
* relative to the epoch of date of explosion (JD= 2453270.5)aHST (F606W≃ V band, F814W≃ I band)
NIC array with 256× 256 pixels with a pixel size of 1.04”. Oneepoch ofJHK data was also obtained on 2005 July 24 at the 3.58-m Telescopio Nazionale Galileo (TNG), using NICS with a 1024×1024 pixel Rockwell array with a pixel size of 0.25”. At each epoch,multiple dithered images of the SN were acquired along with mul-tiple dithered sky images. The sky images were median combinedto eliminate stars. The resulting sky frames were subtracted fromthe SN frames for each band. The sky-subtracted SN images werethen aligned and co-added. The data were processed using standardtasks iniraf.
The photometric calibration was carried out using the magni-tudes of nearby stars taken from the Two Micron All Sky Survey(2MASS) photometric catalogue. Point spread function (PSF) fit-ting magnitude measurements were performed usingiraf’s daophotpackage. Differential photometry of the SN magnitude was thencarried out by comparison with the calibration of the 2MASS stan-dards. The 2MASS filters differ from those of SWIRCAM andNICS, particularly in theKs bands but the colour terms derivedfrom the reference stars were small, which implies only a negli-gible difference in photometric systems. The resulting SN magni-tudes and associated errors are given in Table 2.
Late time NIR data had been obtained with HST usingNICMOS in July 2007 and January 2008 as part of the propri-etary program GO-11229 (PI: Meixner). Multiple exposures weretaken in each of the filters,F110W, F160WandF205W, that hadbeen offset by sub-pixel amounts, which could then be ‘drizzled’(Fruchter & Hook 2002) to improve the spatial sampling of thePSF. PSF-fitting photometry was performed on the NIR ‘drizzled’data usingiraf’s daophot package. The filters used,F110W, F160WandF205Ware roughly equivalent to theJ, H andK filters respec-tively. However no conversion equations have been applied to con-vert to J, H andK filters since the colour transformations are not
well constrained for late time SN spectra (in fact no NIR spectraat this epoch exist for accurate S-correction). The values quoted inTable 2 are for the HST filters in the Vegamag system.
3 PHOTOMETRIC EVOLUTION
3.1 Light curve
Figure 2 shows the optical and NIR light curve (UBVRIJHK) of SN2004et from just after explosion to+414 days post explosion. Veryearly timeR band magnitudes were reported by Klotz and collab-orators in Yamaoka et al. (2004). Nothing was visible to a limitingmagnitude of 19.4± 1.2 at the SN position on 2004 September22.017 UT, when imaged by the robotic TAROT telescope. Pre-discovery detection of SN 2004et on September 22.983 UT exists,with the SN having a magnitude of 15.17± 0.16 (Yamaoka et al.2004). The explosion epoch of SN 2004et has therefore been well-constrained and the explosion epoch is taken as 2004 September22.0 (JD 2453270.5), the same as in Li et al. (2005).
The characteristic plateau of type IIP SNe is visible up to 110± 15 days, before showing a sharp decline onto the radioactivetail,whose luminosity is powered by the decay of56Co to56Fe. The ex-pected decline rate during the nebular phase is 0.98 mag per 100days for completeγ-ray trapping (Patat et al. 1994). The declinerates per 100 days for theBVRIbands were calculated using a leastsquares fit, during the early nebular phase (∼ 136–300 days) andfound to beγB = 0.66± 0.02,γV = 1.02± 0.01,γR = 0.92± 0.01andγI = 1.09± 0.01. These values are close to the expected de-cline rate and are consistent with the early nebular phase flux beingdominated by radioactive decay.
After 300 days, steeper decline rates were seen in theBVRbands and a comparison of the decline rates is shown in Figure3.

6 K. Maguire et al.
Table 2. Near infrared photometric observations of SN 2004et.
Date JD (2450000+) Phase* (days) J H Ks
30/09/2004 53278.8 8.3 11.89±0.04 11.58±0.05 11.33±0.0501/10/2004 53279.8 9.3 11.94±0.04 11.55±0.06 11.31±0.0502/10/2004 53280.9 10.4 11.93±0.05 11.54±0.0603/10/2004 53281.9 11.4 11.85±0.04 11.48±0.05 11.32±0.0505/10/2004 53283.9 13.4 11.79±0.04 11.46±0.05 11.27±0.0507/10/2004 53285.8 15.3 11.76±0.04 11.44±0.06 11.19±0.0608/10/2004 53286.8 16.3 11.74±0.04 11.40±0.06 11.16±0.0609/10/2004 53287.7 17.2 11.81±0.04 11.37±0.09 11.03±0.0818/10/2004 53296.9 26.4 11.64±0.04 11.36±0.08 10.92±0.0820/10/2004 53298.8 28.3 11.59±0.05 11.25±0.06 10.97±0.0722/10/2004 53300.8 30.3 11.60±0.04 11.18±0.08 10.96±0.0623/10/2004 53301.8 31.3 11.54±0.05 11.22±0.08 11.03±0.0627/10/2004 53305.8 35.3 11.55±0.03 11.18±0.05 10.96±0.0517/11/2004 53326.8 56.3 11.42±0.05 11.07±0.05 10.93±0.0518/11/2004 53327.9 57.4 11.44±0.04 11.08±0.05 10.88±0.0520/11/2004 53329.7 59.2 11.44±0.04 11.09±0.05 10.88±0.0521/11/2004 53330.7 60.2 11.43±0.04 11.07±0.05 10.84±0.0523/11/2004 53332.8 62.3 11.48±0.04 11.12±0.05 10.89±0.0525/11/2004 53334.8 64.3 11.45±0.04 11.06±0.04 10.87±0.0507/12/2004 53346.7 76.2 11.47±0.05 11.11±0.0813/12/2004 53352.9 82.4 11.43±0.04 11.08±0.05 10.86±0.0515/12/2004 53354.7 84.2 11.46±0.04 11.08±0.0504/01/2005 53374.7 104.2 11.64±0.04 11.30±0.05 11.08±0.0510/01/2005 53380.8 110.7 11.69±0.05 11.36±0.04 11.16±0.0503/02/2005 53404.7 134.2 13.21±0.04 12.83±0.0610/02/2005 53411.7 141.2 13.37±0.04 13.06±0.0724/07/2005 53576.6 306.1 15.36±0.14a 15.69±0.12a 15.50±0.16a
21/09/2006 54000.0 729.5 > 20.208/07/2007 54289.5 1019.0 22.08±0.02b 22.57±0.08b > 22.3b
19/01/2008 54485.6 1215.1 22.30±0.03b 22.70±0.10b 21.18±0.06b
*relative to the epoch of date of explosion (JD= 2453270.5)aTNG+NICSbHST (F110W≃ J band, F160W≃ H band, F205W≃ K band)
Figure 2. UBVRIJHK light curves of SN 2004et, from soon after core-collapse to+414 days post explosion. The light curves are constructed usingthe data in Table 1 and Table 2 and have not been corrected for reddening.
The decline rates based on data from∼ 136–296 days only, areshown as a solid line for each of the bands and are extrapolated outto 800 days. The decline rates using data from between∼ 296–414days areγB = 0.85± 0.02,γV = 1.17± 0.02,γR = 1.33± 0.01andγI = 0.93± 0.02 and are shown as the dashed lines in Figure3. Note that the late timeI band photometry shows a large scatterdue to the intrinsic differences in the instrumentalI band filters andthis could affect our estimates of the slope of theI band light curve.The points after 600 days shown in Figure 3 were not included inthe determination of the slopes of theV and R bands. TheBVRbands became steeper during this period while the slope of the Iband became slightly less steep. This steepening could imply eitherthe leakage ofγ rays because the SN had become transparent toγ
rays at this stage or dust formation in the SN ejecta. To determinethe cause of the steepening of theBVRbands, further analysis ofthe photometry and spectroscopy was carried out and is detailed inSection 5.
3.2 Colour Curves
The extinction to SN 2004et, E(B-V) was estimatedto be 0.41 ± 0.07 mag using Na ID equivalent widths(Zwitter, Munari & Moretti 2004). Reddening corrected colourcurves for SN 2004et using the optical and NIR data detailed aboveare shown in Figure 4 and Figure 5. The optical colour curves are

Optical and near infrared coverage of SN 2004et7
Figure 3. BVR light curves of SN 2004et during the tail phase. The solidlines indicate the decline rates calculated from∼ 136–300 days post explo-sion, while the dashed lines indicate the decline rates calculated using thedata from∼ 295–415 d. A steepening of theBVRlight curves is seen whilethe slope of theI band light curve becomes marginally less steep.
compared to those of other IIP SNe: SN 1999em (Leonard et al.2002a), SN 2003hn (Olivares 2008; Krisciunas et al. 2009), SN2005cs (Pastorello et al. 2009) and SN 1990E (Schmidt et al. 1993;Benetti et al. 1994). The explosion epoch, distance and extinctionfor each SN is detailed in Table 3. Few data are available in theNIR for type IIP SNe, particularly at late times so in this casefor comparison we can only use SN 1999em, SN 1987A, SN2005cs and SN 2002hh. SN 2002hh was a highly reddened SNand Pozzo et al. (2006) adopted a two component model for theextinction with total AV of 5 mag, which we use in Figure 5.
As is expected, SN 2004et became monotonically redder af-ter explosion for∼ 100 days as it cooled. This can be seen in boththe optical and NIR comparison colour curves. Later on when SN2004et enters the nebular phase, the colour curves become bluer.The colour evolution of SN 2004et is most similar to ‘normal’typeIIP SNe, SN 1999em and SN 1990E, while SN 2005cs showeda red peak at∼ 100 days, characteristic of low-luminosity SNe(Pastorello et al. 2004, 2009). TheV-H, V-K and J-K colours forSN 2004et are more blue at∼ 300 days than for SN 1987A and SN2002hh. TheV-J colour evolution appears to be similar to that ofSN 1987A and SN 2002hh, which suggests the difference lies in theH andK bands being more blue than for the other SNe. This couldbe due to weaker features of the Brackett series of H in the spec-tra of SN 2004et, but we do not possess spectra of a high enoughsignal-to-noise to quantitatively determine if this is thecause.
3.3 Bolometric light curve and 56Ni Mass
The bolometric light curve of SN 2004et was computed by cor-recting the observed magnitudes for reddening and converting toflux values before integrating the combined flux from theUBVRI-JHK bands excluding the overlapping regions of the filters (see alsoValenti et al. 2008). This integrated flux could then be converted toa luminosity using a distance of 5.9 Mpc (see Section 1) and the ex-tinction detailed in the previous section. OurUBVRIJHKdata are
Table 3. Table of properties of our sample of type IIP SNe.
SN Explosion epoch D (Mpc) E(B-V) References
1987A 2446850.5 49.9±1.2× 10⁻³ 0.19 11990E 2447932.0 18.2±2.4 0.48 2, 31999br 2451278 14.1±2.6 0.02 41999em 2451475.6 11.7±1.0 0.06 51999gi 2451518.3 10.0±0.8 0.21 62002hh 2452577.5 5.9±0.4 see text 7, 82003hn 2452857.0 17.8±1.0 0.19 9, 102004A 2453011.5 20.3±3.4 0.06 11, 122004et 2453270.5 5.9±0.4 0.41 132005cs 2453549.0 7.1±1.2 0.05 142006my 2453943 22.3±2.6 0.03 15
REFERENCES – (1) Ashoka et al. (1987); (2) Schmidt et al. (1993); (3)Hamuy (2003); (4) Pastorello et al. (2004); (5) Leonard et al. (2002a); (6)Leonard et al. (2003); (7) Pozzo et al. (2006); (8) Tsvetkov et al. (2007);(9) Olivares (2008); (10) Krisciunas et al. (2009); (11) Hendry et al.(2006); (12) Tsvetkov (2008); (13) this work; (14) Pastorello et al. (2009)(15) Smartt et al. (2009)
Figure 4. Optical colour evolution of SN 2004et compared with those ofother type IIP SNe; SN 1999em, SN 2003hn, SN 2005cs, SN 1990E andSN 1987A.
supplemented by optical data from Misra et al. (2007). The bolo-metric luminosity was only calculated for epochs where V banddata were obtained. If data were not obtained in the other bandsat the same epoch, the contribution was calculated by interpolatingthe data from adjacent nights.
Figure 6 shows a comparison with other type IIP SNe, someof which also include contributions from NIR data. Two pseudo-bolometric light curves of SN 2004et are shown, one that includesthe contribution from the NIR bands (filled squares) and one thatdoes not (open circles). When the NIR is included the luminositiesof the plateau and the tail phase are significantly increased. Thebolometric light curve of SN 2004et is one of few type IIP SNethat includes the contribution of NIR light, which is seen tomakea significant contribution (up to 50 per cent). The percentage flux

8 K. Maguire et al.
Figure 5. Near infrared colour evolution of SN 2004et compared with thoseof SN 1999em, SN 2005cs and the peculiar SN 1987A.
Figure 6. Comparison of bolometric light curve of SN 2004et with othertype IIP SNe.
contribution of theJHK bands compared to the total flux from theoptical to the NIR bands for SN 2004et and three other type IIPSNe, SN 1987A, SN 1999em and SN 2005cs is shown in Figure 7.The contribution of NIR flux to the total flux of SN 2004et is mostsimilar to the ‘normal’ type IIP, SN 1999em. It can be seen thatparticularly at early times the NIR flux contribution of SN 1987A issignificantly greater than that of other type IIP SNe due to the fastercooling of the ejecta of this SN. When no NIR data is availablefora type IIP SN, the NIR contribution of SN 1987A is sometimesused as a correction to the bolometric light curve of SNe due to itsexcellent coverage (e.g. Misra et al. 2007). Figure 7 demonstrateshowever that using a correction based on SN 1987A could lead
Figure 7. Flux contribution from NIR bands as a percentage of the totalfluxfrom optical and NIR bands for a selection of type IIP SNe withNIR data.
to an overestimate of the bolometric luminosity, especially at veryearly times.
Sahu et al. (2006) computed aUBVRI bolometric light curveof SN 2004et and found it to have one of the highest luminosi-ties among type IIP SNe. They did not apply any correction forthe NIR flux. Misra et al. (2007) constructed aUVOIRbolometriclight curve using a correction for the lack of NIR data, whichwasobtained by a comparison with the bolometric light curve of SN1987A. They used a smaller distance estimate to SN 2004et ( 5.5± 1.0 Mpc), which results in smaller luminosity values. Despitethe smaller distance used, their bolometric light curve displayedhigher luminosities at early times than the light curve of SN2004etshown in Figure 6. The peak luminosity of theUBVRIJHK bolo-metric light curve of SN 2004et given in Misra et al. (2007) waslog L ∼ 42.55 erg s−1 compared to 42.44 erg s−1 for our data inFigure 6. This difference at early times is most likely due to theiroverestimate of the NIR luminosity from the comparison withSN1987A.
Bersten & Hamuy (2009) calculated the bolometric correction(BC) to transform fromV band magnitudes of SN 1987A, SN1999em and SN 2003hn toUBVRIJHK bolometric luminositiesand provided parametrised corrections as a function of SN colourfor the average of these three SNe. Here we present the BC for fourtype IIP SNe with extensive optical and NIR coverage as a func-tion of time. These SNe are SN 1987A (a peculiar type IIP), SN2005cs (a low luminosity SN), and SN 1999em and SN 2004et,which both show a very similar bolometric light curve shape.Wehave rearranged equation 1 of Hamuy (2003) to produce this equa-tion for the BC at any given time t,
B(t) = −2.5 log10L(t) − V(t) + Atotal(V) + 5 log10D − 8.14 (1)
where L(t) is the bolometric luminosity in ergs s−1, V(t) is theV band magnitude, Atotal is the total V band extinction toward theSN, D is the distance to the SN in cm and the constant is to convertfrom Vega magnitudes to values of luminosity in cgs units. Usingthe bolometric light curve for each SN, which has been constructedusing the method detailed above, the BC as a function of time canbe parametrised by fitting a polynomial to the data. The polyno-

Optical and near infrared coverage of SN 2004et9
Figure 8. Bolometric correction from theV band (upper panel) andRband(lower panel) to theUBVRIJHK bolometric light curve as a function oftime for SN 1987A, SN 1999em, SN 2004et and SN 2005cs during thephotospheric phase. The bolometric correction of each SN isfitted with alower order polynomial (solid lines).
mial coefficients for theV andRbands during the plateau phase aregiven in Table A1 and Table A2 respectively.
The BC relative to theV andRbands during the photosphericphase are shown in Figure 8. For theV band, the scatter of the BCfor each SN is relatively large with SN 1987A showing a signifi-cantly different evolution during the plateau phase. For theR bandhowever, the evolution of the BC is much more homogeneous forthe SNe, particularly after∼ 50 days and we suggest that theRbandBC may be more suitable for computing the luminosities of a SNwhen there is ambiguity about the subtype of the type IIP SN beingstudied.
The coefficients ai of the polynomial for each SN and bandcan be used in Equation 2 for each epoch of data to give the BC asa function of time,
BC(t) =n∑
i=0
ai ti (2)
where n is the number of coefficients for the particular bandand SN being studied. Equation 3 can then be used to give the bolo-metric luminosity of a SN with only single band photometric data,
log10L(t) = −0.4 [V(t) − Atotal(V) + BC(t) − 5 log10D + 8.14] (3)
where the parameters have the same meaning as detailedabove. Equation 3 is independent of the choice of zero point forthe Vega magnitude system and is dependent only on the valuesofthe magnitude, distance, extinction and time since explosion.
Figure 9 shows the BC for theV and R bands to theUB-VRIJHK bolometric light curves of SN 1987A and SN 1999emduring the early nebular phase (∼ 120–200 days). SN 2004et andSN 2005cs did not have sufficient data at NIR wavelengths atthese epochs to be included in the plot. The BC is relativelysimilar for both SNe, which is consistent with the results ofHamuy et al. (2001) and Bersten & Hamuy (2009). By applyingthe parametrised BC given in Table A3 to data of other SNe withsparser photometric coverage during the early nebular phase, an es-
Figure 9. Bolometric correction fromV band (upper panel) andR band(lower panel) to theUBVRIJHK bolometric light curve as a function oftime for SN 1987A and SN 1999em during the early nebular phase. Thebolometric correction of each SNe is fitted with a linear fit (solid lines).
timate of theUBVRIJHK luminosity can be calculated and hencean estimate of the ejected56Ni mass of a less well studied type IIPSN can be determined. We find an average BC during early nebularphase of 0.33± 0.06 mag using SN 1987A and SN 1999em, whichis systematically larger than the value of 0.26± 0.06 mag obtainedby Hamuy et al. (2001). The probable cause of this discrepancy isthe different methods used to compute the bolometric light curve;we integrated the combined flux over theUBVRIJHKbands as de-tailed above, while Hamuy et al. (2001) fitted Planck functions ateach epoch to the reddening-correctedBVIJHK magnitudes.
Information on the bolometric light curve is useful for con-straining the amount of radioactive material ejected in theexplo-sion. We estimated the56Ni mass of SN 2004et using three meth-ods; a comparison with the luminosity of SN 1987A, the steepnessparameter method of Elmhamdi et al. (2003) and the tail luminositymethod of Hamuy (2003).
The56Ni mass can be estimated by a comparison of the bolo-metric luminosities of SN 2004et and SN 1987A during the earlynebular phase, before the possible formation of dust (∼ 120–250days post explosion). The56Ni mass of SN 1987A was 0.075±0.005 M⊙ (Arnett 1996) and based on a comparison of theirUB-VRIJHK luminosities, we find SN 2004et to have a mass of56Niof 0.057± 0.03 M⊙. Using this method Sahu et al. (2006) found a56Ni mass of 0.048± 0.01 M⊙. Given that for SN 2004et they didnot include the NIR contribution, their value is a lower limit for the56Ni mass.
Despite the lack of good data coverage at the transitionfrom the plateau to the tail phase, we used the equations ofElmhamdi, Chugai & Danziger (2003) that correlate the steepnessof the rate of the decline from plateau to tail phase of the bolomet-ric light curve and the mass of56Ni. The smaller the56Ni mass pro-duced in the explosion, the steeper the decline rate is. Using thismethod, we estimated the steepness parameter to have a valueof0.068, which gives a56Ni mass of 0.057± 0.02 M⊙. Sahu et al.(2006) found a56Ni mass of 0.062± 0.02 M⊙ and Misra et al.
10 K. Maguire et al.
(2007) a 56Ni mass of 0.056± 0.016 M⊙ using this steepnessmethod.
The 56Ni mass of SN 2004et can also be estimated using theassumption that the tail luminosity of SN 2004et is dominated bythe radioactive decay of56Ni to 56Co (Hamuy 2003) and is found tohave a value of 0.05± 0.02 M⊙ using the BC of Hamuy et al. (2001)of 0.26± 0.06 mag. When our BC, calculated during the early neb-ular phase of 0.33± 0.06 mag is used, we obtain a56Ni mass of0.06± 0.02 M⊙. The final assumed56Ni mass for SN 2004et usedin this paper is taken as the average of the three methods listedabove, which gives a value of 0.056± 0.04 M⊙.
4 SPECTROSCOPY
4.1 Optical spectroscopy
Optical spectroscopic observations of SN 2004et were carried outat the Mt. Ekar 1.82-m Copernico Telescope (Asiago, Italy) withAFOSC and at the TNG using DOLORES, as detailed in Table4. The data were trimmed, bias corrected, and a normalised flat-field was applied before the spectra were extracted using tasks iniraf’s ctioslit package. Wavelength calibration was performed us-ing arc lamp spectra. The instrumental response curves as a func-tion of wavelength were determined using spectrophotometric stan-dard stars. The spectra were then flux calibrated to the photometrytaken at the closest epoch. The resolution of each spectra was esti-mated by measuring the full width half maximum (FWHM) of thenight sky lines and the values are given in Table 4.
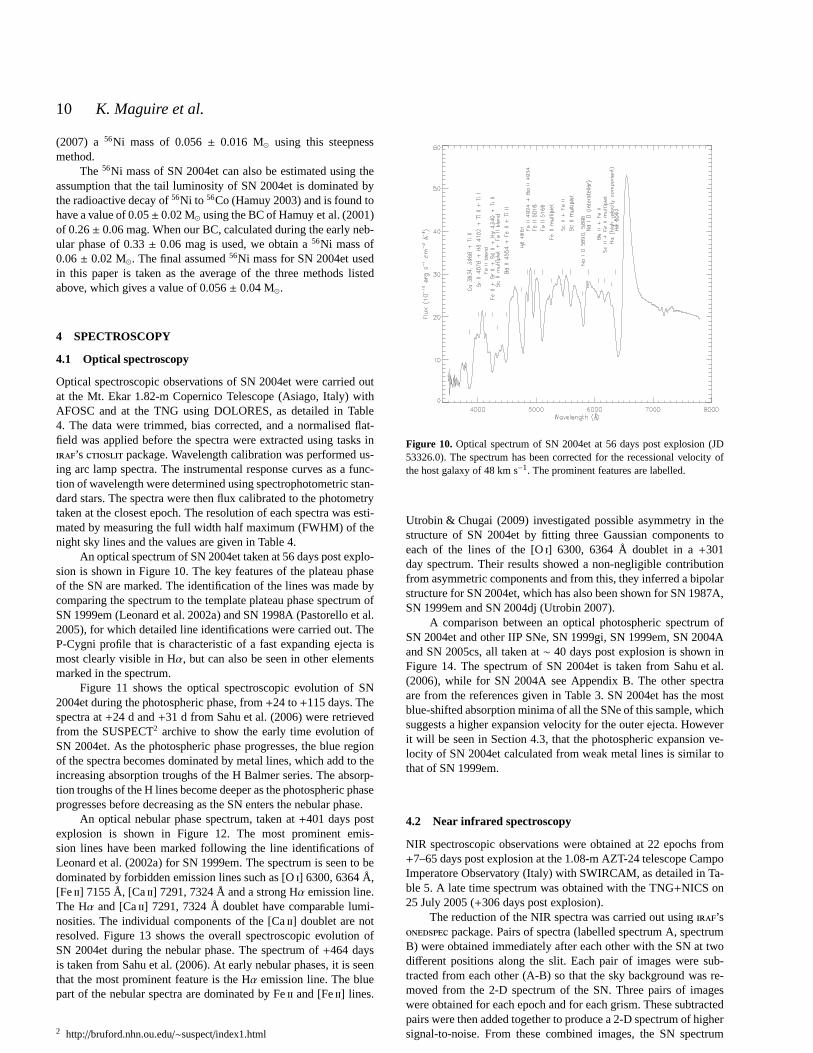
An optical spectrum of SN 2004et taken at 56 days post explo-sion is shown in Figure 10. The key features of the plateau phaseof the SN are marked. The identification of the lines was made bycomparing the spectrum to the template plateau phase spectrum ofSN 1999em (Leonard et al. 2002a) and SN 1998A (Pastorello et al.2005), for which detailed line identifications were carriedout. TheP-Cygni profile that is characteristic of a fast expanding ejecta ismost clearly visible in Hα, but can also be seen in other elementsmarked in the spectrum.
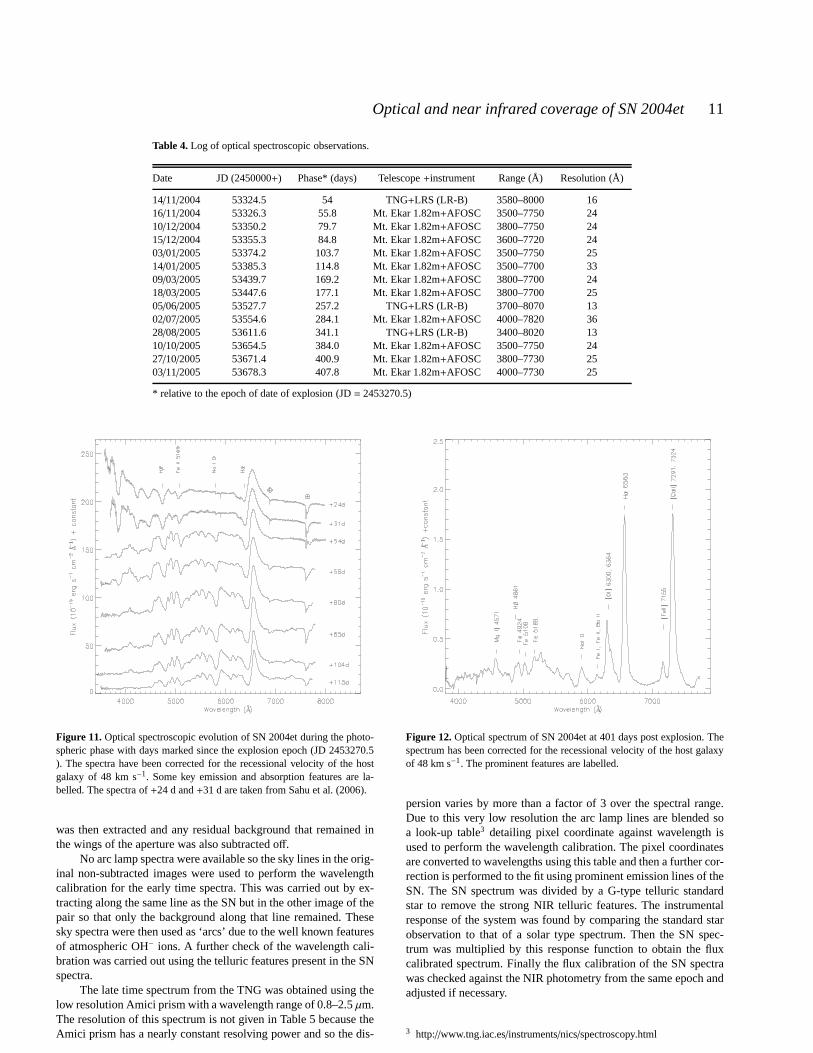
Figure 11 shows the optical spectroscopic evolution of SN2004et during the photospheric phase, from+24 to+115 days. Thespectra at+24 d and+31 d from Sahu et al. (2006) were retrievedfrom the SUSPECT2 archive to show the early time evolution ofSN 2004et. As the photospheric phase progresses, the blue regionof the spectra becomes dominated by metal lines, which add totheincreasing absorption troughs of the H Balmer series. The absorp-tion troughs of the H lines become deeper as the photosphericphaseprogresses before decreasing as the SN enters the nebular phase.
An optical nebular phase spectrum, taken at+401 days postexplosion is shown in Figure 12. The most prominent emis-sion lines have been marked following the line identifications ofLeonard et al. (2002a) for SN 1999em. The spectrum is seen to bedominated by forbidden emission lines such as [Oi] 6300, 6364 Å,[Feii] 7155 Å, [Caii] 7291, 7324 Å and a strong Hα emission line.The Hα and [Caii] 7291, 7324 Å doublet have comparable lumi-nosities. The individual components of the [Caii] doublet are notresolved. Figure 13 shows the overall spectroscopic evolution ofSN 2004et during the nebular phase. The spectrum of+464 daysis taken from Sahu et al. (2006). At early nebular phases, it is seenthat the most prominent feature is the Hα emission line. The bluepart of the nebular spectra are dominated by Feii and [Feii] lines.
2 http://bruford.nhn.ou.edu/∼suspect/index1.html
Figure 10. Optical spectrum of SN 2004et at 56 days post explosion (JD53326.0). The spectrum has been corrected for the recessional velocity ofthe host galaxy of 48 km s−1. The prominent features are labelled.
Utrobin & Chugai (2009) investigated possible asymmetry inthestructure of SN 2004et by fitting three Gaussian components toeach of the lines of the [Oi] 6300, 6364 Å doublet in a+301day spectrum. Their results showed a non-negligible contributionfrom asymmetric components and from this, they inferred a bipolarstructure for SN 2004et, which has also been shown for SN 1987A,SN 1999em and SN 2004dj (Utrobin 2007).
A comparison between an optical photospheric spectrum ofSN 2004et and other IIP SNe, SN 1999gi, SN 1999em, SN 2004Aand SN 2005cs, all taken at∼ 40 days post explosion is shown inFigure 14. The spectrum of SN 2004et is taken from Sahu et al.(2006), while for SN 2004A see Appendix B. The other spectraare from the references given in Table 3. SN 2004et has the mostblue-shifted absorption minima of all the SNe of this sample, whichsuggests a higher expansion velocity for the outer ejecta. Howeverit will be seen in Section 4.3, that the photospheric expansion ve-locity of SN 2004et calculated from weak metal lines is similar tothat of SN 1999em.
4.2 Near infrared spectroscopy
NIR spectroscopic observations were obtained at 22 epochs from+7–65 days post explosion at the 1.08-m AZT-24 telescope CampoImperatore Observatory (Italy) with SWIRCAM, as detailed in Ta-ble 5. A late time spectrum was obtained with the TNG+NICS on25 July 2005 (+306 days post explosion).
The reduction of the NIR spectra was carried out usingiraf’sonedspec package. Pairs of spectra (labelled spectrum A, spectrumB) were obtained immediately after each other with the SN at twodifferent positions along the slit. Each pair of images were sub-tracted from each other (A-B) so that the sky background was re-moved from the 2-D spectrum of the SN. Three pairs of imageswere obtained for each epoch and for each grism. These subtractedpairs were then added together to produce a 2-D spectrum of highersignal-to-noise. From these combined images, the SN spectrum
Optical and near infrared coverage of SN 2004et11
Table 4. Log of optical spectroscopic observations.
Date JD (2450000+) Phase* (days) Telescope+instrument Range (Å) Resolution (Å)
14/11/2004 53324.5 54 TNG+LRS (LR-B) 3580–8000 1616/11/2004 53326.3 55.8 Mt. Ekar 1.82m+AFOSC 3500–7750 2410/12/2004 53350.2 79.7 Mt. Ekar 1.82m+AFOSC 3800–7750 2415/12/2004 53355.3 84.8 Mt. Ekar 1.82m+AFOSC 3600–7720 2403/01/2005 53374.2 103.7 Mt. Ekar 1.82m+AFOSC 3500–7750 2514/01/2005 53385.3 114.8 Mt. Ekar 1.82m+AFOSC 3500–7700 3309/03/2005 53439.7 169.2 Mt. Ekar 1.82m+AFOSC 3800–7700 2418/03/2005 53447.6 177.1 Mt. Ekar 1.82m+AFOSC 3800–7700 2505/06/2005 53527.7 257.2 TNG+LRS (LR-B) 3700–8070 1302/07/2005 53554.6 284.1 Mt. Ekar 1.82m+AFOSC 4000–7820 3628/08/2005 53611.6 341.1 TNG+LRS (LR-B) 3400–8020 1310/10/2005 53654.5 384.0 Mt. Ekar 1.82m+AFOSC 3500–7750 2427/10/2005 53671.4 400.9 Mt. Ekar 1.82m+AFOSC 3800–7730 2503/11/2005 53678.3 407.8 Mt. Ekar 1.82m+AFOSC 4000–7730 25
* relative to the epoch of date of explosion (JD= 2453270.5)
Figure 11. Optical spectroscopic evolution of SN 2004et during the photo-spheric phase with days marked since the explosion epoch (JD2453270.5). The spectra have been corrected for the recessional velocity of the hostgalaxy of 48 km s−1. Some key emission and absorption features are la-belled. The spectra of+24 d and+31 d are taken from Sahu et al. (2006).
was then extracted and any residual background that remained inthe wings of the aperture was also subtracted off.
No arc lamp spectra were available so the sky lines in the orig-inal non-subtracted images were used to perform the wavelengthcalibration for the early time spectra. This was carried outby ex-tracting along the same line as the SN but in the other image ofthepair so that only the background along that line remained. Thesesky spectra were then used as ‘arcs’ due to the well known featuresof atmospheric OH− ions. A further check of the wavelength cali-bration was carried out using the telluric features presentin the SNspectra.
The late time spectrum from the TNG was obtained using thelow resolution Amici prism with a wavelength range of 0.8–2.5 µm.The resolution of this spectrum is not given in Table 5 because theAmici prism has a nearly constant resolving power and so the dis-
Figure 12. Optical spectrum of SN 2004et at 401 days post explosion. Thespectrum has been corrected for the recessional velocity ofthe host galaxyof 48 km s−1. The prominent features are labelled.
persion varies by more than a factor of 3 over the spectral range.Due to this very low resolution the arc lamp lines are blendedsoa look-up table3 detailing pixel coordinate against wavelength isused to perform the wavelength calibration. The pixel coordinatesare converted to wavelengths using this table and then a further cor-rection is performed to the fit using prominent emission lines of theSN. The SN spectrum was divided by a G-type telluric standardstar to remove the strong NIR telluric features. The instrumentalresponse of the system was found by comparing the standard starobservation to that of a solar type spectrum. Then the SN spec-trum was multiplied by this response function to obtain the fluxcalibrated spectrum. Finally the flux calibration of the SN spectrawas checked against the NIR photometry from the same epoch andadjusted if necessary.
3 http://www.tng.iac.es/instruments/nics/spectroscopy.html
12 K. Maguire et al.
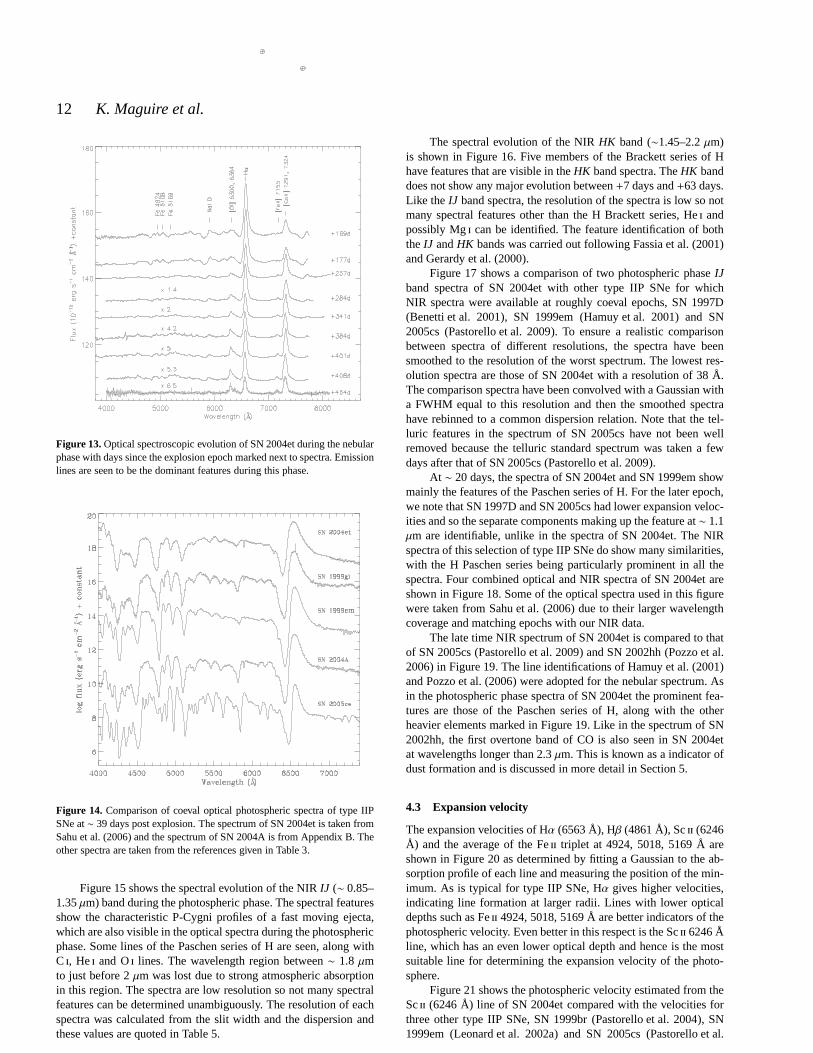
Figure 13. Optical spectroscopic evolution of SN 2004et during the nebularphase with days since the explosion epoch marked next to spectra. Emissionlines are seen to be the dominant features during this phase.
Figure 14. Comparison of coeval optical photospheric spectra of type IIPSNe at∼ 39 days post explosion. The spectrum of SN 2004et is taken fromSahu et al. (2006) and the spectrum of SN 2004A is from Appendix B. Theother spectra are taken from the references given in Table 3.
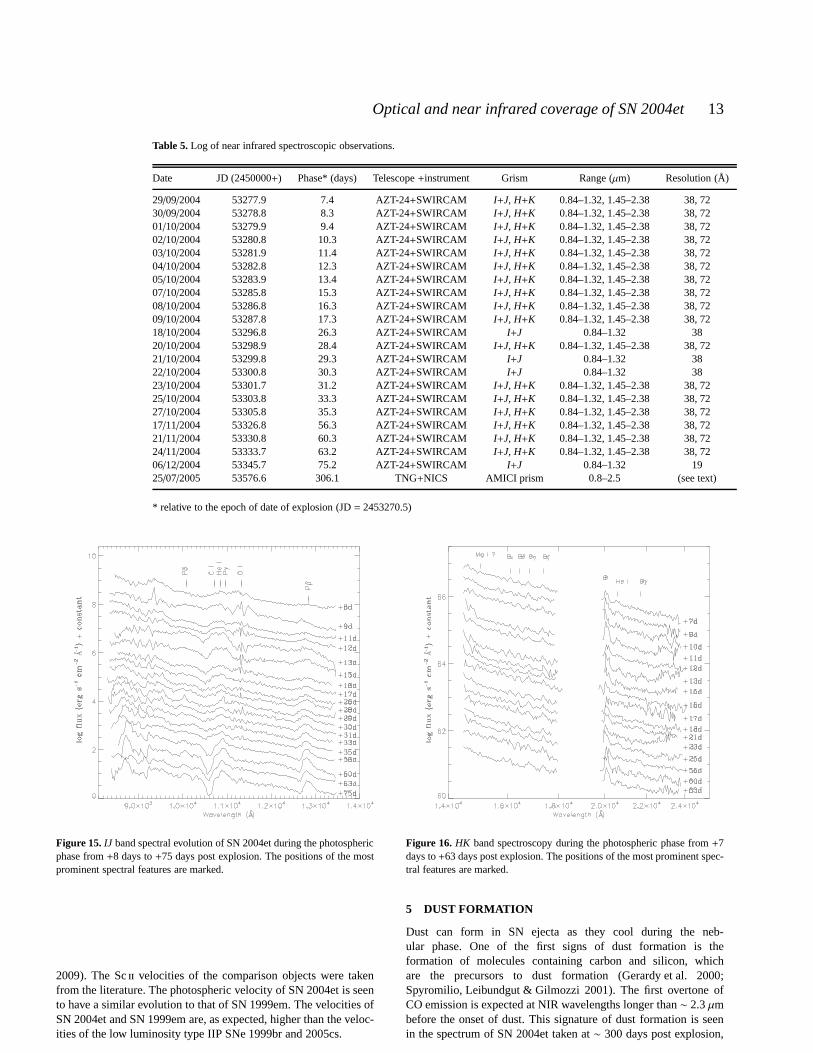
Figure 15 shows the spectral evolution of the NIRIJ (∼ 0.85–1.35µm) band during the photospheric phase. The spectral featuresshow the characteristic P-Cygni profiles of a fast moving ejecta,which are also visible in the optical spectra during the photosphericphase. Some lines of the Paschen series of H are seen, along withC i, Hei and Oi lines. The wavelength region between∼ 1.8 µmto just before 2µm was lost due to strong atmospheric absorptionin this region. The spectra are low resolution so not many spectralfeatures can be determined unambiguously. The resolution of eachspectra was calculated from the slit width and the dispersion andthese values are quoted in Table 5.
The spectral evolution of the NIRHK band (∼1.45–2.2µm)is shown in Figure 16. Five members of the Brackett series of Hhave features that are visible in theHK band spectra. TheHK banddoes not show any major evolution between+7 days and+63 days.Like the IJ band spectra, the resolution of the spectra is low so notmany spectral features other than the H Brackett series, Hei andpossibly Mgi can be identified. The feature identification of boththe IJ andHK bands was carried out following Fassia et al. (2001)and Gerardy et al. (2000).
Figure 17 shows a comparison of two photospheric phaseIJband spectra of SN 2004et with other type IIP SNe for whichNIR spectra were available at roughly coeval epochs, SN 1997D(Benetti et al. 2001), SN 1999em (Hamuy et al. 2001) and SN2005cs (Pastorello et al. 2009). To ensure a realistic comparisonbetween spectra of different resolutions, the spectra have beensmoothed to the resolution of the worst spectrum. The lowestres-olution spectra are those of SN 2004et with a resolution of 38Å.The comparison spectra have been convolved with a Gaussian witha FWHM equal to this resolution and then the smoothed spectrahave rebinned to a common dispersion relation. Note that thetel-luric features in the spectrum of SN 2005cs have not been wellremoved because the telluric standard spectrum was taken a fewdays after that of SN 2005cs (Pastorello et al. 2009).
At ∼ 20 days, the spectra of SN 2004et and SN 1999em showmainly the features of the Paschen series of H. For the later epoch,we note that SN 1997D and SN 2005cs had lower expansion veloc-ities and so the separate components making up the feature at∼ 1.1µm are identifiable, unlike in the spectra of SN 2004et. The NIRspectra of this selection of type IIP SNe do show many similarities,with the H Paschen series being particularly prominent in all thespectra. Four combined optical and NIR spectra of SN 2004et areshown in Figure 18. Some of the optical spectra used in this figurewere taken from Sahu et al. (2006) due to their larger wavelengthcoverage and matching epochs with our NIR data.
The late time NIR spectrum of SN 2004et is compared to thatof SN 2005cs (Pastorello et al. 2009) and SN 2002hh (Pozzo et al.2006) in Figure 19. The line identifications of Hamuy et al. (2001)and Pozzo et al. (2006) were adopted for the nebular spectrum. Asin the photospheric phase spectra of SN 2004et the prominentfea-tures are those of the Paschen series of H, along with the otherheavier elements marked in Figure 19. Like in the spectrum ofSN2002hh, the first overtone band of CO is also seen in SN 2004etat wavelengths longer than 2.3µm. This is known as a indicator ofdust formation and is discussed in more detail in Section 5.
4.3 Expansion velocity
The expansion velocities of Hα (6563 Å), Hβ (4861 Å), Scii (6246Å) and the average of the Feii triplet at 4924, 5018, 5169 Å areshown in Figure 20 as determined by fitting a Gaussian to the ab-sorption profile of each line and measuring the position of the min-imum. As is typical for type IIP SNe, Hα gives higher velocities,indicating line formation at larger radii. Lines with loweropticaldepths such as Feii 4924, 5018, 5169 Å are better indicators of thephotospheric velocity. Even better in this respect is the Scii 6246 Åline, which has an even lower optical depth and hence is the mostsuitable line for determining the expansion velocity of thephoto-sphere.
Figure 21 shows the photospheric velocity estimated from theScii (6246 Å) line of SN 2004et compared with the velocities forthree other type IIP SNe, SN 1999br (Pastorello et al. 2004),SN1999em (Leonard et al. 2002a) and SN 2005cs (Pastorello et al.
Optical and near infrared coverage of SN 2004et13
Table 5. Log of near infrared spectroscopic observations.
Date JD (2450000+) Phase* (days) Telescope+instrument Grism Range (µm) Resolution (Å)
29/09/2004 53277.9 7.4 AZT-24+SWIRCAM I+J, H+K 0.84–1.32, 1.45–2.38 38, 7230/09/2004 53278.8 8.3 AZT-24+SWIRCAM I+J, H+K 0.84–1.32, 1.45–2.38 38, 7201/10/2004 53279.9 9.4 AZT-24+SWIRCAM I+J, H+K 0.84–1.32, 1.45–2.38 38, 7202/10/2004 53280.8 10.3 AZT-24+SWIRCAM I+J, H+K 0.84–1.32, 1.45–2.38 38, 7203/10/2004 53281.9 11.4 AZT-24+SWIRCAM I+J, H+K 0.84–1.32, 1.45–2.38 38, 7204/10/2004 53282.8 12.3 AZT-24+SWIRCAM I+J, H+K 0.84–1.32, 1.45–2.38 38, 7205/10/2004 53283.9 13.4 AZT-24+SWIRCAM I+J, H+K 0.84–1.32, 1.45–2.38 38, 7207/10/2004 53285.8 15.3 AZT-24+SWIRCAM I+J, H+K 0.84–1.32, 1.45–2.38 38, 7208/10/2004 53286.8 16.3 AZT-24+SWIRCAM I+J, H+K 0.84–1.32, 1.45–2.38 38, 7209/10/2004 53287.8 17.3 AZT-24+SWIRCAM I+J, H+K 0.84–1.32, 1.45–2.38 38, 7218/10/2004 53296.8 26.3 AZT-24+SWIRCAM I+J 0.84–1.32 3820/10/2004 53298.9 28.4 AZT-24+SWIRCAM I+J, H+K 0.84–1.32, 1.45–2.38 38, 7221/10/2004 53299.8 29.3 AZT-24+SWIRCAM I+J 0.84–1.32 3822/10/2004 53300.8 30.3 AZT-24+SWIRCAM I+J 0.84–1.32 3823/10/2004 53301.7 31.2 AZT-24+SWIRCAM I+J, H+K 0.84–1.32, 1.45–2.38 38, 7225/10/2004 53303.8 33.3 AZT-24+SWIRCAM I+J, H+K 0.84–1.32, 1.45–2.38 38, 7227/10/2004 53305.8 35.3 AZT-24+SWIRCAM I+J, H+K 0.84–1.32, 1.45–2.38 38, 7217/11/2004 53326.8 56.3 AZT-24+SWIRCAM I+J, H+K 0.84–1.32, 1.45–2.38 38, 7221/11/2004 53330.8 60.3 AZT-24+SWIRCAM I+J, H+K 0.84–1.32, 1.45–2.38 38, 7224/11/2004 53333.7 63.2 AZT-24+SWIRCAM I+J, H+K 0.84–1.32, 1.45–2.38 38, 7206/12/2004 53345.7 75.2 AZT-24+SWIRCAM I+J 0.84–1.32 1925/07/2005 53576.6 306.1 TNG+NICS AMICI prism 0.8–2.5 (see text)
* relative to the epoch of date of explosion (JD= 2453270.5)
Figure 15. IJ band spectral evolution of SN 2004et during the photosphericphase from+8 days to+75 days post explosion. The positions of the mostprominent spectral features are marked.
2009). The Scii velocities of the comparison objects were takenfrom the literature. The photospheric velocity of SN 2004etis seento have a similar evolution to that of SN 1999em. The velocities ofSN 2004et and SN 1999em are, as expected, higher than the veloc-ities of the low luminosity type IIP SNe 1999br and 2005cs.
Figure 16. HK band spectroscopy during the photospheric phase from+7days to+63 days post explosion. The positions of the most prominent spec-tral features are marked.
5 DUST FORMATION
Dust can form in SN ejecta as they cool during the neb-ular phase. One of the first signs of dust formation is theformation of molecules containing carbon and silicon, whichare the precursors to dust formation (Gerardy et al. 2000;Spyromilio, Leibundgut & Gilmozzi 2001). The first overtoneofCO emission is expected at NIR wavelengths longer than∼ 2.3µmbefore the onset of dust. This signature of dust formation isseenin the spectrum of SN 2004et taken at∼ 300 days post explosion,

14 K. Maguire et al.
Figure 17. Comparison of theIJ band spectra of SN 1999em, SN 1997Dand SN 2005cs with two spectra of SN 2004et at epochs roughly matchingthe comparison SNe. The positions of the most prominent spectral featuresare marked.
Figure 18. Combined optical and NIR spectra of SN 2004et. For the epochsat +55 days and+30 days, the NIR spectra were obtained one day laterthan the optical observation. The NIR spectra were combinedwith opticalspectra taken from Sahu et al. (2006) and this paper.
which is shown in Figure 19. The SN 2002hh also shows a simi-lar CO emission at these wavelengths, unlike SN 2005cs wherenosignificant CO emission band is seen. No earlier NIR nebular spec-tra of SN 2004et are available to constrain the epoch of molecularformation and no attempt is made to estimate the quantity of COformed due to the low resolution of the spectrum. The presence ofthe CO molecular band has been seen in a good fraction of typeIIP SNe with observations at NIR wavelengths such as SN 1987A(Spyromilio et al. 1988), SN 1995ad (Spyromilio & Leibundgut1996), SN 1998dl (Spyromilio, Leibundgut & Gilmozzi 2001),SN
Figure 19. The late time nebular (∼ 300 days) NIR spectrum of SN 2004etis compared to that of SN 2005cs at∼ 281 days (Pastorello et al. 2009) andSN 2002hh at+ 266 days (Pozzo et al. 2006).
Figure 20. Velocity evolution of some prominent lines of SN 2004et, mea-sured from the minima of their absorption profiles.
1999em (Spyromilio, Leibundgut & Gilmozzi 2001), SN 2002hh(Pozzo et al. 2006) and now SN 2004et. This suggests that typeIIPSNe must cool significantly within a few hundred days of explosionto allow first molecular formation and then dust formation.
Other indicators of dust formation include a blueshift of thespectral emission lines of elements such as Hα and [Oii] 6300,6364 Å, an optical luminosity decrease, a NIR excess at late timesor thermal emission from newly formed dust grains at MIR wave-lengths.
A blueshift of the peaks of emission lines is caused by resid-ual opacity in the central part of the ejecta due to dust particlesand results in an attenuation of the red wing of the line profile.

Optical and near infrared coverage of SN 2004et15
Figure 21. Comparison of the expansion velocities of SN 2004et and threeother type IIP SNe: SN 1999br, SN 1999em and SN 2005cs, using the Scii(6246 Å) line. The Scii line was not visible in the three earliest spectra ofSN 2004et and so the expansion velocity for these epochs has been esti-mated from 0.95 times the velocity of the average of the Feii 4924, 5018,5169 Å lines.
Sahu et al. (2006) noted that this blueshift in the peaks of the Hαand [Oi] 6300, 6363 Å occurred after∼ 300 days. Using the spec-tra of Sahu et al. (2006) and the additional spectra published in thiswork, the blueshift of the emission lines was quantified. Thesize ofthe shift can be determined by measuring the wavelength positionof the centroid of the Hα emission line. For the spectra between163 days and 300 days post explosion, the peak of the Hα emissionline was found to be at+280± 50 km s−1. The spectrum at 313days and all subsequent spectra out to the last at 464 days show aconstant blueshift to -137 km s−1.
Figure 22 and Figure 23 show the temporal evolution of theHα and [Oi] 6300, 6364 Å line profiles in SN 2004et comparedwith those of SN 1999em. Elmhamdi et al. (2003) showed for SN1999em that there was an observable blueshift of the emission linesat∼ 500 days, which they suggest is caused by dust formation. Wemeasured the rest frame position of the Hα peak in SN 1999em tobe+182 km s−1 at 466 days shifting to -91 km s−1 at 642 days usingspectra taken from Elmhamdi et al. (2003). Danziger et al. (1991)showed that for SN 1987A, an observable blueshift was seen inthe emission peaks of the [Oi] doublet, beyond approximately 400days post explosion. This can again be measured from the Hα peakas+164 km s−1 at+440 days, -156 km s−1 at+501 days and thenincreasing to -320 km s−1 at +628 days. The larger blueshift inthe emission lines of SN 1987A compared to SN 1999em can beattributed to either a larger mass of dust forming in the ejecta or toa geometrical effect. The emission lines of SN 2004et experienced ablueshift at an earlier epoch than either SN 1987A and SN 1999em,and had intermediate values to those SN 1987A and SN 1999em.
A decrease in the luminosity of the optical bands at late timeisalso thought to be indicative of scattering of optical photons off dustparticles formed in the inner or outer envelope. Figure 3 showed asteepening in the slope of the opticalBVR bands, as detailed inSection 3.1 and suggests that the steepening of the slope occurs at∼ 300 days. This epoch of 300 days for SN 2004et is consistent
Figure 22. Evolution of the line profiles of Hα for SN 2004et (left panel)and for SN 1999em (right panel). The vertical line in the panels correspondsto the zero velocity of Hα at 6563 Å.
Figure 23. Evolution of the line profiles of [Oi] 6300, 6364 Å for SN 2004et(left panel) and for SN 1999em (right panel). The vertical lines in the pan-els correspond to the zero velocities of the [Oi] doublet at 6300, 6364 Årespectively.
with the dust formation range estimated from the blueshift of neb-ular emission lines. Finally, Kotak et al. (2009) observed thermalemission from newly formed dust grains at MIR wavelengths andpresented evidence for an IR echo from the interstellar dustof thehost galaxy that manifests itself as a cold component of the spectralenergy distribution of SN 2004et.
6 ESTIMATE OF O MASS
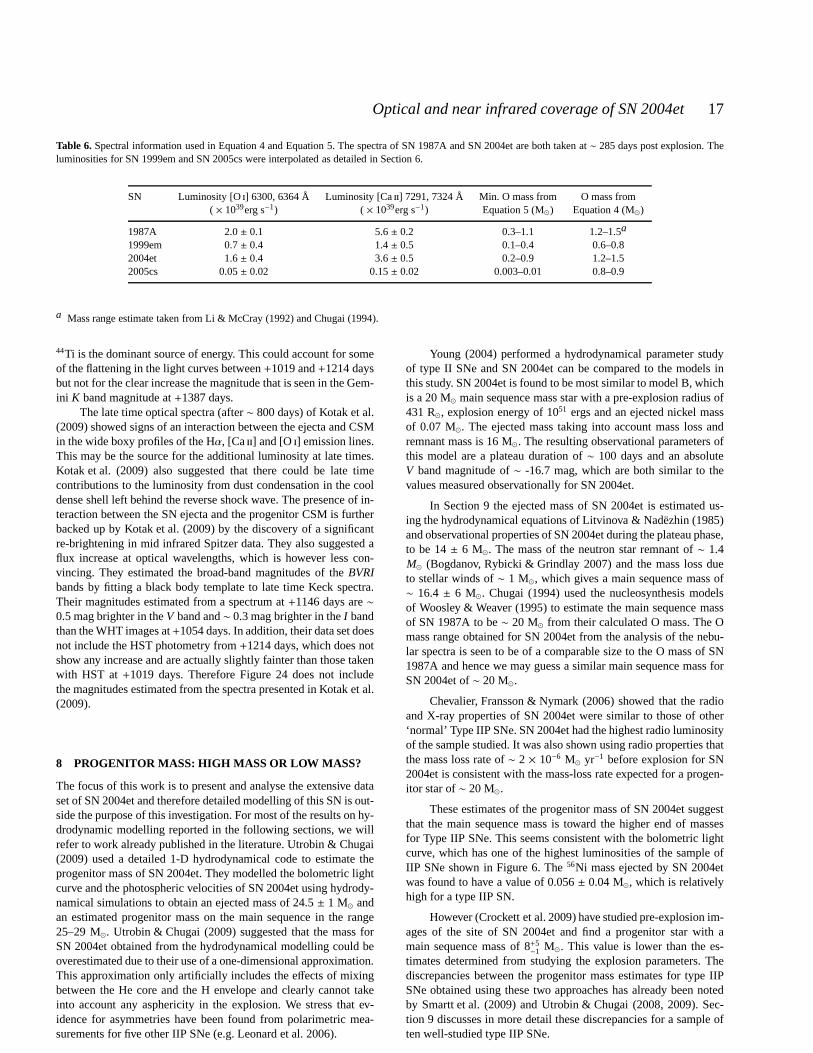
The mass of O in type IIP SNe can be estimated from an analy-sis of the [Oi] 6300, 6364 Å lines (Uomoto 1986; Chugai 1994;Li & McCray 1992; Elmhamdi et al. 2003). The luminosity of the[O i] doublet in SN 2004et can be compared to that of SN 1987Aduring the late nebular phase but before dust formation. Dust for-mation did not occur until at least 400 days post explosion for1987A (Danziger et al. 1991) but for SN 2004et dust formationap-peared to occur at∼ 300 days post explosion. To make a consistentcomparison, spectra from∼ 285 days post explosion were used.The luminosities of the [Oi] 6300, 6364 Å doublet along with theluminosities of what is thought to be the [Caii] 7291, 7324 Å dou-blet are given in Table 6 for a selection of type IIP SNe. The featureat 7300 Å could also have a contribution from the [Oii] 7319, 7330Å doublet, particularly as SN 2004et is likely to be an O-richSN(see below).
The spectrum of SN 1987A from 1987 December 09 wastaken from Terndrup et al. (1988). Spectra of SN 1999em and SN

16 K. Maguire et al.
2005cs were not available at the epoch of∼ 285 days post explosionso spectra before and after this epoch were used and an interpolatedvalue was derived. The spectra of SN 1999em were taken fromLeonard et al. (2002a) at+168 days and+313 days post explo-sion. The spectra of SN 2005cs were obtained from Pastorelloet al.(2009) at+281 days and+333 days post explosion. Flux calibrationof the spectra used has been carried out by comparing to photome-try at the same epoch.
The luminosity of the [Oi] doublet is lower for SN 2004etthan for SN 1987A. The [Oi] doublet luminosity at late epochsis powered byγ-rays being deposited in O-rich material and arelation between O mass and line luminosity can be written as(Elmhamdi et al. 2003):
L[O i] = ηMO
MexcLCo, (4)
where Mexc is the ‘excited’ mass in which theγ-ray depositiontakes place,η is the efficiency of the transformation of the energydeposited in the O mass into the luminosity of the [Oi] doublet,L [O i] is the O luminosity and LCo is the luminosity of56Co. Theratio of the mass of O in SN 2004et to SN 1987A can be estimated,making the assumptions thatη and the ‘excited’ mass are similarfor both SNe.
The LCo is directly related to the mass of56Ni, which was es-timated from the nebular phase bolometric light curve in Section3.3 to be 0.056± 0.04 M⊙. The O mass for SN 1987A was foundto be in the range, 1.2–1.5 M⊙ (Li & McCray 1992; Chugai 1994;Kozma & Fransson 1998). In SN 2004et, the [Oi] doublet luminos-ity is∼ 35 per cent lower than in SN 1987A and at the same time the56Ni mass is∼ 25 per cent lower. The two differences almost matchand following Equation 4 a similar O mass is derived. The valuesobtained for the O mass of SN 1999em and SN 2005cs are alsogiven in Table 6, where the56Ni mass of SN 1999em was estimatedto be 0.05 M⊙ from a comparison of its bolometric luminosity withthat of SN 1987A using the Cepheid distance of 11.7 Mpc takenfrom Leonard et al. (2003). The56Ni mass of SN 2005cs was takenas 0.003 M⊙ from Pastorello et al. (2009).
Uomoto (1986) estimated the minimum mass of O needed toproduce the [Oi] emission lines using the equation:
M[O i] = 108F[O i]D2e2.28/T4 (5)
where F[O i] is the [Oi] doublet flux in units of ergs s−1, D isthe distance to the SN in units of Mpc and T4 is the temperaturein units of 104 K. From Liu & Dalgarno (1995), the O temperatureof SN 1987A at 300 days was∼ 4200 K. Assuming a similar Otemperature for SN 2004et at a comparable epoch, the M[O i] of SN2004et was calculated for temperatures in the range 3500–4500 K.The minimum O masses determined using Equation 5 are given inTable 6. For SN 1999em and SN 2005cs the O temperature wasalso assumed to be similar to that of SN 1987A and the lower limitof the mass of O needed to produce the [Oi] emission lines are alsoestimated from Equation 5.
The lower limit of the O mass for SN 1987A is consistent withthe O mass range set by Li & McCray (1992) and Chugai (1994).Equation 5 is most sensitive to the O temperature and this is themain source of uncertainty in the calculation. The mass of O in SN2004et is very similar to that of SN 1987A, while the O massesof the ’normal’ type IIP, SN 1999em and the low luminosity SN2005cs are found using both methods to be lower. Despite the lowluminosity of the [Oi] doublet seen for SN 2005cs, Equation 4 isinversely proportional to the LCo, which is also low for SN 2005csand this results in similar O masses for SN 1999em and SN 2005cs.
Figure 24. Late time multi-band photometry of SN 2004et from+300 dayspost explosion to the latest Gemini North image taken on 2008July 10(+1387 days).
The similar O masses of SN 2004et and SN 1987A could suggestthat they have similar main sequence progenitor masses, while SN2005cs and SN 1999em have lower O masses and could be asso-ciated with lower mass progenitor stars. Woosley & Weaver (1995)suggested that a main sequence star of mass of 20 M⊙ would pro-duce an O mass of 1.5 M⊙ and so points toward relatively high massstars as the progenitors of type IIP SNe. The discrepancies betweendirect imaging of SN progenitors and other estimates of the masswill be discussed in Section 8 for SN 2004et and more generallyfor type IIP SNe in Section 9.
7 VERY LATE TIME PHOTOMETRY OF SN 2004et
The late time optical and NIR HST data described in Section 2 anddetailed in Table 1 and Table 2 are discussed here in more detail.The two epochs of HST data were obtained at+1019 and+1214days post explosion in five filters (two optical and three NIR).Crockett et al. (2009) also obtained observations of SN 2004et withthe WHT in four filters,BVRI on 2007 August 12 (+1054 days),along with a ground-based adaptive optics image with the GeminiNorth Telescope using Altair/NIRI on 2008 July 10 (+1387 days),which gave K≈ 20.0 mag.
The late time evolution of SN 2004et at optical and NIR wave-lengths is shown in Figure 24. The HST magnitudes have not beenconverted to standardVIJHK filters because of the uncertainties inthe transformation equations for SN spectra at such late phases. Inthis respect, the increase in the magnitude between the+1019 and+1054 days observations in theI band should not be regarded assignificant.
Ignoring this small increase, the trend between+1019 and+1214 days in all the bands is a levelling off of the magnitude de-crease. The light curves at early times are powered by the radioac-tive decay of56Co to56Fe but at around+1000 days other radioac-tive nuclides become important. In particular Fransson & Kozma(2002) showed for SN 1987A that the decay of57Co became dom-inant after∼ 1100 days, while at epochs greater than 2000 days,
Optical and near infrared coverage of SN 2004et17
Table 6. Spectral information used in Equation 4 and Equation 5. The spectra of SN 1987A and SN 2004et are both taken at∼ 285 days post explosion. Theluminosities for SN 1999em and SN 2005cs were interpolated as detailed in Section 6.
SN Luminosity [Oi] 6300, 6364 Å Luminosity [Caii] 7291, 7324 Å Min. O mass from O mass from( × 1039erg s−1) ( × 1039erg s−1) Equation 5 (M⊙) Equation 4 (M⊙)
1987A 2.0± 0.1 5.6± 0.2 0.3–1.1 1.2–1.5a
1999em 0.7± 0.4 1.4± 0.5 0.1–0.4 0.6–0.82004et 1.6± 0.4 3.6± 0.5 0.2–0.9 1.2–1.52005cs 0.05± 0.02 0.15± 0.02 0.003–0.01 0.8–0.9
a Mass range estimate taken from Li & McCray (1992) and Chugai (1994).
44Ti is the dominant source of energy. This could account for someof the flattening in the light curves between+1019 and+1214 daysbut not for the clear increase the magnitude that is seen in the Gem-ini K band magnitude at+1387 days.
The late time optical spectra (after∼ 800 days) of Kotak et al.(2009) showed signs of an interaction between the ejecta andCSMin the wide boxy profiles of the Hα, [Caii] and [Oi] emission lines.This may be the source for the additional luminosity at late times.Kotak et al. (2009) also suggested that there could be late timecontributions to the luminosity from dust condensation in the cooldense shell left behind the reverse shock wave. The presenceof in-teraction between the SN ejecta and the progenitor CSM is furtherbacked up by Kotak et al. (2009) by the discovery of a significantre-brightening in mid infrared Spitzer data. They also suggested aflux increase at optical wavelengths, which is however less con-vincing. They estimated the broad-band magnitudes of theBVRIbands by fitting a black body template to late time Keck spectra.Their magnitudes estimated from a spectrum at+1146 days are∼0.5 mag brighter in theV band and∼ 0.3 mag brighter in theI bandthan the WHT images at+1054 days. In addition, their data set doesnot include the HST photometry from+1214 days, which does notshow any increase and are actually slightly fainter than those takenwith HST at+1019 days. Therefore Figure 24 does not includethe magnitudes estimated from the spectra presented in Kotak et al.(2009).
8 PROGENITOR MASS: HIGH MASS OR LOW MASS?
The focus of this work is to present and analyse the extensivedataset of SN 2004et and therefore detailed modelling of this SN is out-side the purpose of this investigation. For most of the results on hy-drodynamic modelling reported in the following sections, we willrefer to work already published in the literature. Utrobin &Chugai(2009) used a detailed 1-D hydrodynamical code to estimate theprogenitor mass of SN 2004et. They modelled the bolometric lightcurve and the photospheric velocities of SN 2004et using hydrody-namical simulations to obtain an ejected mass of 24.5± 1 M⊙ andan estimated progenitor mass on the main sequence in the range25–29 M⊙. Utrobin & Chugai (2009) suggested that the mass forSN 2004et obtained from the hydrodynamical modelling couldbeoverestimated due to their use of a one-dimensional approximation.This approximation only artificially includes the effects of mixingbetween the He core and the H envelope and clearly cannot takeinto account any asphericity in the explosion. We stress that ev-idence for asymmetries have been found from polarimetric mea-surements for five other IIP SNe (e.g. Leonard et al. 2006).
Young (2004) performed a hydrodynamical parameter studyof type II SNe and SN 2004et can be compared to the models inthis study. SN 2004et is found to be most similar to model B, whichis a 20 M⊙ main sequence mass star with a pre-explosion radius of431 R⊙, explosion energy of 1051 ergs and an ejected nickel massof 0.07 M⊙. The ejected mass taking into account mass loss andremnant mass is 16 M⊙. The resulting observational parameters ofthis model are a plateau duration of∼ 100 days and an absoluteV band magnitude of∼ -16.7 mag, which are both similar to thevalues measured observationally for SN 2004et.
In Section 9 the ejected mass of SN 2004et is estimated us-ing the hydrodynamical equations of Litvinova & Nadezhin (1985)and observational properties of SN 2004et during the plateau phase,to be 14± 6 M⊙. The mass of the neutron star remnant of∼ 1.4M⊙ (Bogdanov, Rybicki & Grindlay 2007) and the mass loss dueto stellar winds of∼ 1 M⊙, which gives a main sequence mass of∼ 16.4± 6 M⊙. Chugai (1994) used the nucleosynthesis modelsof Woosley & Weaver (1995) to estimate the main sequence massof SN 1987A to be∼ 20 M⊙ from their calculated O mass. The Omass range obtained for SN 2004et from the analysis of the nebu-lar spectra is seen to be of a comparable size to the O mass of SN1987A and hence we may guess a similar main sequence mass forSN 2004et of∼ 20 M⊙.
Chevalier, Fransson & Nymark (2006) showed that the radioand X-ray properties of SN 2004et were similar to those of other‘normal’ Type IIP SNe. SN 2004et had the highest radio luminosityof the sample studied. It was also shown using radio properties thatthe mass loss rate of∼ 2 × 10⁻⁶ M⊙ yr−1 before explosion for SN2004et is consistent with the mass-loss rate expected for a progen-itor star of∼ 20 M⊙.
These estimates of the progenitor mass of SN 2004et suggestthat the main sequence mass is toward the higher end of massesfor Type IIP SNe. This seems consistent with the bolometric lightcurve, which has one of the highest luminosities of the sample ofIIP SNe shown in Figure 6. The56Ni mass ejected by SN 2004etwas found to have a value of 0.056± 0.04 M⊙, which is relativelyhigh for a type IIP SN.
However (Crockett et al. 2009) have studied pre-explosion im-ages of the site of SN 2004et and find a progenitor star with amain sequence mass of 8+5
−1 M⊙. This value is lower than the es-timates determined from studying the explosion parameters. Thediscrepancies between the progenitor mass estimates for type IIPSNe obtained using these two approaches has already been notedby Smartt et al. (2009) and Utrobin & Chugai (2008, 2009). Sec-tion 9 discusses in more detail these discrepancies for a sample often well-studied type IIP SNe.

18 K. Maguire et al.
9 EXPLOSION PARAMETERS OF TYPE IIP SNE
The progenitor and explosion properties of type IIP SNe can bestudied in a number of ways. The observational properties ofaSN such as the magnitude, expansion velocity and plateau lengthcan be measured and models can then be used to determine theexplosion parameters such as the ejected mass, explosion energyand pre-explosion radius of the star (e.g. Zampieri et al. 2003).Litvinova & Nadezhin (1983, 1985) used these observational prop-erties of SNe at mid-plateau as inputs to hydrodynamical equationsto estimate their explosion parameters. Hamuy (2003) determinedthe physical properties of 24 type IIP SNe, using the equationsof Litvinova & Nadezhin (1985) but obtained much higher val-ues than those obtained by pre-explosion imaging, particularly forthe ejected mass with values in the range of 14–56 M⊙. Nadezhin(2003) also derived the properties of a sample of type IIP SNe, us-ing a subset of the observational data presented by Hamuy (2003)and found values for the ejected mass of 10–30 M⊙, which aremore consistent with those obtained using direct imaging ofthepre-explosion stars.
More complex hydrodynamical models have also been devel-oped for the analysis of the explosion parameters of type IIPSNe.SNe with good photometric and spectroscopic coverage have beenstudied such as SN 1987A (Utrobin 1993; Blinnikov et al. 2000;Utrobin 2004), SN 1997D (Chugai & Utrobin 2000; Zampieri et al.2003), SN 1999br (Zampieri et al. 2003; Pastorello et al. 2004), SN1999em (Utrobin 2007), SN 2003Z (Utrobin, Chugai & Pastorello2007), SN 2004et (Utrobin & Chugai 2009) and SN 2005cs(Utrobin & Chugai 2008; Pastorello et al. 2009). They have usedmodels that include not only the explosion energy, pre-explosionradius and ejected mass as the input parameters but also the56Nimass. This leads to a different set of relations for determiningthe physical parameters of the explosion than those determined byLitvinova & Nadezhin (1985). Zampieri (2005, 2007) presented asystematic analysis of type IIP SNe using a 1-D, Lagrangian radia-tion hydrodynamics code and a semi-analytic code. The SN param-eters were estimated by performing a simultaneous comparison ofthe observed and simulated light curves, the evolution of line ve-locities and the continuum temperature. In some cases, these morecomplex models also find significantly higher masses than thoseobtained from direct imaging but for other SNe there is reasonablygood agreement (cf Table 7). SN 1987A shows excellent agreementbetween the mass of its progenitor and hydrodynamical modelling(e.g. Utrobin 1993; Blinnikov et al. 2000; Pastorello et al.2005).
Smartt et al. (2009) presented estimates of the masses (and up-per mass limits) of the progenitors of 20 of the nearest IIP SNe inthe last 10 years. These mass estimates came from deep high res-olution images of the SN field before explosion and gave an ini-tial mass from the progenitors in the range of 8–17 M⊙. If it isassumed that a typical red supergiant loses around 1 M⊙ due tostellar winds and a neutron star remnant is left behind with an av-erage mass of 1.4 M⊙ (Bogdanov, Rybicki & Grindlay 2007), thenthe ejected masses would be in the range of 6–15 M⊙, which are ingeneral lower than those obtained from hydrodynamical modelling.
Although the models of Litvinova & Nadezhin (1983, 1985)are based on simple hydrodynamics and use assumptions that donot completely describe the conditions of the explosion, they canbe used to compare the properties of sample of type IIP SNe ifthey are used in a consistent manner. In this paper, we use thesample of type IIP SNe from Smartt et al. (2009), which have ei-ther had their progenitor star identified or have had a detectionlimit for the mass determined, to further investigate the apparent
discrepancy between the low masses obtained from pre-explosionimaging with the high masses obtained with models. The mod-els of Litvinova & Nadezhin (1983, 1985) are used with the samehost galaxy distances and extinctions that were applied in the anal-ysis of Smartt et al. (2009). We have collected photometric andspectroscopic data for as many of these objects as possible andmeasured the relevant parameters to calculate the physicalprop-erties of the ejecta. Table 7 details the distances, extinctions, ob-servational and estimated explosion parameters from modellingalong with the direct mass estimates from pre-explosion imagesfor the sample of SNe. Misra et al. (2007) also carried out a sim-ilar analysis for a compilation of II-P SNe using the equations ofLitvinova & Nadezhin (1985) to estimate the explosion parametersof the SNe. The advantage of our compilation is that the masses de-termined should be directly comparable with the progenitormassesand limits now available.
As well as using the same distances and values of extinction ofSmartt et al. (2009), the input parameters (V band magnitude mid-plateau, photospheric velocity mid-plateau and the lengthof theplateau) for the ten SNe were reanalysed for consistency. The pho-tospheric velocities of the 10 SNe were recalculated using the Scii(6246 Å) line, since this line probes deep into the inner regionsof the SNe, and so is a good indicator of the photospheric veloc-ity. These photospheric velocities were when possible remeasuredfrom available spectra or the values were taken from the referenceslisted in Table 7. The plateau lengths were also measured againalong with theV band magnitudes mid-plateau.
For 2004A, the photospheric velocity could not be calculatedfrom the Scii (6246 Å) and so was taken from the weak iron lineswith a ratio of 0.95 to the Scii line. This ratio is the average ofthose obtained when the velocities of the Scii and weak iron linesare compared at epochs when both sets of lines are visible in thespectra. Both SN 2006my and SN 2006ov were only discovered atthe end of the plateau and so to estimate the observational param-eters, they were compared to other well constrained type IIPSNe.The light curve properties of SN 2006my were seen to be similarto those of normal type IIP SN, SN 1999em and so its parame-ters were estimated by a direct comparison. While SN 2006ov wasfound to be similar to the low-luminosity SN 2005cs.
It can be seen in Table 7 that the estimated explosion ener-gies vary by a factor of 10 between the low luminosity and ‘nor-mal’ SNe, with the less luminous SNe having lower explosion en-ergies. A comparison between the explosion energies calculated us-ing the equations of Litvinova & Nadezhin (1985), the more com-plex models and the simple relation that the internal energyis as-sumed to be converted into kinetic energy is shown in Table 8.Thekinetic energy (1/2mv2) is a rough approximation since it assumesthat all the material ejected is moving at the same velocity,v. Themass, m is the ejected mass obtained from the progenitor analy-sis of the pre-explosion images. Although the energies fromtheLitvinova & Nadezhin (1985) models are smaller than those ob-tained from the more complex models with references given inTable 8, they show a similar trend of energies with the low lumi-nous SNe having lower energies and the more luminous SNe hav-ing higher explosion energies. The inferred radii of the progenitors,apart from SN 1999br, span the range∼ 200–600 R⊙ in the majorityof cases, which is the range expected for extended red supergiantatmospheres.
Kasen & Woosley (2009) used numerical simulations to de-termine how the light curves and spectra of type IIP SNe varywith their mass, metallicity and explosion energy. They investi-gated the standard candle relationship of type IIP SNe proposed

Optical and near infrared coverage of SN 2004et19
Figure 25. The progenitor masses obtained from the hydrodynamical equa-tions of Litvinova & Nadezhin (1983, 1985) are plotted against the progen-itor masses obtained from the pre-explosion images. Upper mass limits areplotted where detection limits have been set (Smartt et al. 2009). The val-ues are given in Table 7, along with the associated errors. A one-to-onecorrespondence line is shown.
Table 8. Comparison of explosion energies of well-studied type IIP SNe.The kinetic energy is measured using an approximation of 1/2mv2, wherev is the photospheric velocity and m is the ejected mass obtained from theanalysis of pre-explosion images of the progenitor.
SN Explosion energy1 Explosion energy2 Kinetic energy Ref.(×1051 erg) (×1051 erg) (×1051 erg)
1999br 0.3 0.1± 0.09 < 0.3 12005cs 0.4–0.8 0.17± 0.08 0.05 – 0.16 1, 21999em 1.3± 0.3 0.84± 0.29 < 1.2 1, 32003gd 1.6± 0.2 1.04± 0.49 0.3 – 1 12004et 2.3± 0.3 0.88± 0.31 0.5 – 1.3 4
1Explosion energy from detailed hydrodynamical models (seereferencesfor more details).2Explosion energy from the equations of Litvinova & Nadezhin (1985).REFERENCES – (1) Zampieri (2007); (2) Utrobin & Chugai (2008); (3)Utrobin (2007); (4) Utrobin & Chugai (2009)
by Hamuy & Pinto (2002) and showed that the correlation betweenthe plateau luminosity and photospheric velocity holds fortheir setof model data. They also explored the relationship between theplateau length and the mid-plateau luminosity and found a linearrelationship where the brighter SNe have shorter plateau lengths.However this correlation is not seen for our sample of 10 SNe,where the plateau length range is 100–120 days and the absoluteV band magnitude at+50 days has values between -13 and -17 andno correlation between these parameters is seen. Kasen & Woosley(2009) suggested that a SN of plateau length of 110 days (the aver-age plateau length we found) should have an absoluteV band mag-nitude of at least -18, which is not even reached by the brightest SNin our sample, SN 2004et at -17.15 in theV band.
A plot of the progenitor masses of a selection of recent IIP SNeobtained with the equations from Litvinova & Nadezhin (1983,
1985) against the progenitor masses obtained from analysing pre-explosion images of the SN sites is shown in Figure 25. Thedata with upper mass limits were calculated using the detec-tion limits of the images and the stellar evolution codes, STARS(Eldridge & Tout 2004) and are detailed in Smartt et al. (2009). Tocalculate the pre-explosion mass from the ejected mass, 1.4M⊙ wasadded to account for the neutron star remnant along with 1 M⊙ toaccount for the mass lost from the star through stellar winds. It canbe seen clearly in Figure 25 that the hydrodynamical models giveconsistently higher main sequences masses that the masses/masslimits measured from pre-explosion imaging. Using the equationsof Litvinova & Nadezhin (1985), SN 2003gd shows a model massover three times greater than the value obtained from directimag-ing, which is thought to be due to the uncertainty in the plateaulength because of the late phase during the plateau at which thisSN was discovered. A shorter plateau for this object would give asmaller progenitor mass and would be closer to the progenitor massdetected by Smartt et al. (2004).
Heger et al. (2003) showed that a median progenitor massvalue of 13 M⊙ for type IIP SNe is obtained for a Salpeter ini-tial mass distribution in the mass range 9–25 M⊙. The masses ob-tained from direct imaging are in reasonable agreement withthismedian value, spanning a range of∼ 8–17 M⊙ (Smartt et al. 2009).It is predicted by theory that red supergiants between 17–30M⊙also produce type IIP SNe but no progenitor in this mass rangehasbeen detected to date. This apparent contradiction has beentermedthe “red supergiant problem” by Smartt et al. (2009) and was tenta-tively suggested that the higher mass stars could form blackholeswith no explosion. (Although Smartt (2009) gives alternative expla-nations for this issue.) The mass obtained from the hydrodynamicalmodels of Litvinova & Nadezhin (1983, 1985) are not consistentwith the median progenitor mass value, while the more complexmodels, in some cases such as SN 2004et with a mass of 25–29M⊙, are nearly at the theoretical mass limit for red supergiants thatproduced type IIP SNe.
Furthermore, the discovery of several progenitor stars withlow luminosities and hence fairly low initial masses (inferred fromstellar evolutionary tracks; (Smartt et al. 2004; Maund et al. 2005;Li et al. 2005; Mattila et al. 2008)) leads to a consistency ques-tion. Can a star with an initial mass of 8 M⊙ produce a progeni-tor with enough envelope mass to sustain a light curve plateau of100 day duration given the relatively high observed expansion ve-locities (see Hendry et al. (2005, 2006); Smartt et al. (2009))? Alsoif the higher luminosity SNe with even higher expansion veloci-ties are also produced by stars at the low end of the mass scale,what is happening during the explosion that cause the vastlyvary-ing events that are observed and how are the higher mass starsend-ing their lives? It appears that it is extremely difficult to reproduce along plateau phase and high expansion velocities with low progen-itor masses from any of the previously discussed hydrodynamicalmodels. This could either point to a systematic error in the directprogenitor masses perhaps due to circumstellar dust dimming theprogenitor luminosity (summarised in Smartt 2009) or deficienciesin the physics of the hydrodynamical calculations as discussed re-cently in Utrobin & Chugai (2009).
10 SUMMARY AND CONCLUSIONS
Extensive photometric and spectroscopic data of SN 2004et at bothoptical and NIR wavelengths have been presented to give one ofthe most comprehensive data sets of a normal type IIP SN to date.

20 K. Maguire et al.
Table 7. Type IIP SNe parameters, calculated using the equations of Litvinova & Nadezhin (1985).
SN D (Mpc) Av ∆t velph MV Energy Radius Masse j1 ZAMSmod
2 ZAMSimg3 Ref.
(km/s) (×1051 erg) (R⊙) (M⊙) (M⊙) (M⊙)
1999br 14.1± 2.6 0.06± 0.06 100± 15 1541± 150 -13.16± 0.45 0.20± 0.09 31± 19 20± 10 12± 2 < 15 1, 21999em 11.7± 1.0 0.31± 0.16 120± 10 3046± 150 -16.68± 0.27 0.84± 0.29 437± 173 18± 7 11, 21–29 < 15 2, 3, 4, 51999gi 10.0± 0.8 0.65± 0.16 115± 10 2717± 150 -15.67± 0.26 0.64± 0.25 183± 69 21± 9 – < 14 62003gd 9.3± 1.8 0.43± 0.19 113± 20 3210± 200 -16.06± 0.47 1.04± 0.49 179± 122 24± 13 10± 1 7+6
−2 2, 72004A 20.3± 3.4 0.19± 0.09 107± 20 3200± 200 -16.33± 0.39 0.68± 0.37 328± 197 15± 9 12± 2 7+6
−2 2, 8, 9, 102004dj 3.3± 0.3 0.53± 0.06 105± 20 2957± 150 -16.16± 0.23 0.65± 0.30 277± 107 16± 9 – 15± 3 11, 12, 132004et 5.9± 0.4 1.3± 0.2 110± 15 3462± 150 -17.15± 0.27 0.88± 0.31 631± 251 14± 6 25–29 8+5
−1 9, 14, 152005cs 7.1± 1.2 0.16± 0.1 118± 15 1500± 150 -14.66± 0.39 0.17± 0.08 208± 123 13± 6 11–18 8± 2 16,17,18,19,202006my 22.3± 2.6 0.08 120± 20 2953± 300 -16.26± 0.28 0.86± 0.44 274± 135 22± 12 – < 13 9, 152006ov 12.6± 2.4 0.07 118± 30 1410± 200 -15.12± 0.47 0.12± 0.09 465± 363 9± 7 – < 10 15, 21
1Ejected mass calculated from the equations of Litvinova & Nadezhin (1985).2Zero age main sequence mass from the hydrodynamical modelling, see references for further information.
3Zero age main sequence mass from direct imaging of the progenitor star.REFERENCES – (1) Pastorello et al. (2004); (2) Zampieri (2007) (3) Hamuy et al. (2001); (4) Leonard et al. (2002a); (5) Utrobin (2007); (6) Leonard et al.(2002b); (7) Hendry et al. (2005); (8) Hendry et al. (2006); (9) this paper; (10) Tsvetkov (2008); (11) Chugai (2006); (12) Tsvetkov, Goranskiy & Pavlyuk(2008); (13) Vinko et al. (2006); (14) Utrobin & Chugai (2009); (15) Crockett et al. (2009); (16) Pastorello et al. (2009); (17) Tsvetkov et al. (2006); (18)
Takats & Vinko (2006); (19) Li et al. (2006); (20)Utrobin &Chugai (2008); (21) Spiro et al. (in prep.)
Analysis of the bolometric light curve shows that SN 2004et hasone of the highest luminosities of type IIP SNe and consequently arelatively large ejected mass of56Ni of 0.056± 0.04 M⊙. The im-portance of including the flux from the NIR bands when calculatingthe bolometric light curve is demonstrated and shown to account forup to 50 per cent of the flux during the plateau phase. Parametrisedbolometric corrections including the NIR contributions were de-tailed and these can be used as templates for futures type IIPSNeif their spectral range coverage is incomplete.
Excellent spectral coverage of SN 2004et at optical and NIRduring the plateau and nebular phase are shown, with the opticalspectra extending to+464 days and the NIR spectra to+306 days.The final epoch NIR spectrum allowed a clear detection of the firstovertone band of CO at∼ 2.3µm, which is a signature of dust for-mation. Other signatures of dust formation were also observed suchas a significant blueshift in the Hα and [Oi] emission lines andan increase in the rate of decline of the optical bands. The epochof dust formation for SN 2004et (post 300 days) was significantlyearlier than for SN 1999em and SN 1987A, while the observedblueshift of the emission lines of SN 2004et had a intermediateshift between that of SN 1987A and SN 1999em. Very late timeHST and WHT observations (>1000 days) showed a levelling offin the decline rate of the optical and NIR bands, which is thoughtto be mainly caused by the interaction of the ejecta with the CSM.Signatures of this late time interaction were also seen in approxi-mately coeval optical spectra and MIR Spitzer data of Kotak et al.(2009). A contribution from the decay of57Co and44Ti could alsobe present at these epochs along with contributions from dust con-densation in a cool dense shell around the SN.
The physical parameters of SN 2004et were compared to thoseof other type IIP SNe. By studying the strengths of the nebularphase [Oii] 6300, 6364 Å lines, the ejected O mass of SN 2004etwas estimated to be∼ 0.5–1.5 M⊙, which is comparable to that ofSN 1987A. The kinetic energies of a sample of well studied typeIIP SNe were found to span a range of 1050–1051 ergs, with SN2004et having the highest kinetic energy of the sample. The ex-plosion parameters of SN 2004et were also calculated using thehydrodynamic models of Litvinova & Nadezhin (1985) and com-pared to other type IIP SNe, for which the progenitor star hadei-
ther been identified in pre-explosion images or an upper masslimithad been set. In some cases, the masses determined from the previ-ously discussed hydrodynamical modelling are seen to be consis-tently higher than those obtained from direct imaging of thepro-genitor. SN 2004et showed a particularly large discrepancywitha mass range determined from modelling of 16–29 M⊙, while themass obtained by Crockett et al. (2009) from direct imaging hada value of 8+5
−1 M⊙. With the current models, it appears difficult insome cases to reconcile these high luminosity and high velocityevents with the low progenitor masses of 7–8 M⊙ obtained frompre-explosion imaging.
Acknowledgements. This work, conducted as part of the award ‘Un-derstanding the lives of massive stars from birth to supernovae’ (S. J.Smartt) made under the European Heads of Research Councils and Euro-pean Science Foundation EURYI (European Young Investigator) Awardsscheme, was supported by funds from the Participating Organisations ofEURYI and the EC Sixth Framework Programme. SB and EC acknowl-edge some support from contract ASI/COFIS. We thank Nikolai Chugaiand Melina Bersten for helpful discussions on progenitor models.
This paper is based on observations made with the following facil-ities: the 1.82-m Copernico Telescope of the Asiago Observatory (Asi-ago), the 3.58-m Italian National Telescope Galileo operated by the Fun-dacin Galileo Galilei of the INAF (La Palma), the 0.72-m TNT telescope ofthe Teramo Astronomical Observatory (Teramo), the 2.6-m Nordic OpticalTelescope (La Palma), 0.7-m AZT2 telescope of the SternbergAstronom-ical Institute (Moscow), 0.6-m Z600 telescope of the Crimean Laboratoryof SAI (Crimea), the 0.38-m KGB telescope at the Crimean AstrophysicalObservatory (Crimea) and the 1-m SAO Z1000 telescope of the RussianAcademy of Sciences (Zelenchuk). Near infrared data were collected withAZT-24 telescope (Campo Imperatore, Italy), operated jointly by Pulkovoobservatory (St. Petersburg, Russia) and INAF Observatorio Astronomicodi Roma/Collurania. Observations were also used from NASA/ESA HST,obtained from the data archive at the Space Telescope Institute. STScI isoperated by the association of Universities for Research inAstronomy, Inc.under the NASA contract NAS 5-26555.

Optical and near infrared coverage of SN 2004et21
REFERENCES
Arnett D., 1996, Supernovae and Nucleosynthesis: An Investiga-tion of the History of Matter from the Big Bang to the Present,Princeton University Press, Princeton, NJ
Ashoka, B. N., Anupama J. C., Prabhu T. P., Giridhar S., Jain S.K., Pati A. K., Kameswara Rao N., 1987, JA&A, 8, 195
Benetti S., Cappellaro E., Turatto M., Della Valle M., Mazzali P.A., Gouiffes C., 1994, A&A, 285, 147
Benetti S., Turatto M., Balberg S. et al., 2001, MNRAS, 322, 361Bersten M., Hamuy M., 2009, ApJ, 701, 200Beswick R. J., Muxlow T. W. B., Argo M. K., Pedlar A., MarcaideJ. M., 2004, IAU Circ., 8435
Blinnkov S., Lundqvist P., Bartunov O., 2000, ApJ, 532, 1132Bogdanov S., Rybicki G. B., Grindlay J. E., 2007, ApJ, 670, 668Botticella M. T., Pastorello A., Smartt S. J. et al., 2009, MNRAS,398, 1041
Brown P., Dessart L., Holland S. T. et al., 2007, ApJ, 659, 1488Chevalier R. A., 1986, ApJ, 308, 225Chevalier, R. A., Fransson C., Nymark T. K., 2006, ApJ, 641,1029
Chugai N. N., 1994, ApJ, 428, L17Chugai N. N., 2006, Astron. Lett., 32, 739Chugai N. N., Utrobin V. P., 2000, A&A, 354, 557Chugai N. N., Chevalier R. A., Utrobin V. P., 2007, ApJ, 662, 1136Crockett R. M. et al., 2009, submittedDanziger I. J., Bouchet P., Gouiffes C., Lucy L. B., 1991, inHaynes R., Milne D., eds, Proc. IAU Symp., 148, The LargeMagellanic Clouds, Sydney, Australia, p315
Dessart L., Blondin S., Brown P. J. et al., 2008, ApJ, 675, 644Dolphin A. E., 2000, PASP, 112, 1383Eldridge J. J., Tout C. A., 2004, MNRAS, 353, 87Elmhamdi A., Chugai N. N., Danziger I. J., 2003a, A&A, 404,1077
Elmhamdi A., Danziger I. J., Chugai N. et al., 2003b, MNRAS,338, 939
Fassia A., Meikle W. P. S., Chugai N. et al., 2001, MNRAS, 325,907
Filippenko A. V., 1997, ARA&A, 35, 309Fransson C., Chevalier, R. A., 1987, ApJ, 322, 15Fransson C., Chevalier, R. A., 1989, ApJ, 343, 323Fransson C., Houck J., Kozma C. et al., 1996, in McCray R., WangZ., eds, Colloq. 145, Supernova and Supernova Remnants. Cam-bridge Univ. Press, Cambridge, p211
Fransson C., Kozma C., 2002, New AR, 46, 487Fruchter, A. S., Hook, R. N., 2002, PASP, 114, 144Gerardy C. L., Fesen R. A., Hoflich P., Wheeler J. C., 2000, AJ,119, 2968
Hamuy M., Pinto P. A., Maza J. et al., 2001, ApJ, 558, 615Hamuy M., Pinto P. A., 2002, ApJ, 566, L63Hamuy M., 2003, ApJ, 582, 905Heger A., Fryer C. L., Woosley S. E., Langer N., Hartmann D. H.,2003, ApJ, 591, 288
Hendry M. A., Smartt S. J., Maund J. R. et al., 2005, MNRAS,359, 906
Hendry M. A., Smartt S. J., Crockett R. M. et al., 2006, MNRAS,369, 1303
Hirschi R., Meynet G., Maeder A., 2004, A&A, 425, 649Krisciunas K., Hamuy M., Suntzeff N. B. et al., 2009, AJ, 137, 34Kasen D., Woosley S. E., 2009, ApJ, 703, 2205Karachentsev I. D., Sharina M. E., Huchtmeier W. K., 2000,A&A, 362, 544
Kotak R., Meikle W. P. S., Farrah D. et al., 2009, ApJ, 704, 306Kozma C., Fransson C.,1998, ApJ, 497, 431Leonard D. C., Filippenko A. V., Gate E. L. et al., 2002a, PASP,114, 35
Leonard D. C., Filippenko A. V., Li W. et al., 2002b, AJ, 124,2490
Leonard D. C., Kanbur S. M., Ngeow C. C., Tanvir N. R., 2003,ApJ, 594, 247
Leonard D. C., Filippenko A. V., Ganeshalingam M. et al., 2006,Nature, 440, 505
Li H., McCray R., 1992, ApJ, 387, 309LLi W., Van Dyk S. D., Filippenko A. V., Cuillandre J. -C., 2005,PASP, 117, 121
Li W., Van Dyk S. D., Filippenko A. V., Cuillandre J. -C., Jha S.,Bloom J. S., Riess A. G., Livio M., 2006, ApJ, 641, 1060
Limongi M., Chieffi A., 2003, ApJ, 592, 404Liu W., Dalgarno A., 1995, ApJ, 454, 472Litvinova I. Y., Nadezhin D. K., 1983, Ap&SS, 89, 89Litvinova I. Y., Nadezhin D. K., 1985, SvAL, 11, 145Martı-Vidal I. Marcaide J. M., Alberdi A. et al., 2007, A&A,470,1071
Mattila S., Smartt S. J., Eldridge J. J., Maund J. R., Crockett R.M., Danziger I. J., 2008, ApJ, 688, 91
Maund J. R., Smartt, S. J., Danziger, I. J., 2005, MNRAS, 364,33Meikle W. P. S., Allen D. A., Spyromilio J., Varani G. -F., 1989,MNRAS, 283, 193
Misra K., Pooley D., Chandra P., Bhattacharya D., Ray A. K.,Sagar R., Lewin W. H. G., 2007, MNRAS, 381, 280
Nadezhin D. K., 2003, 346, 97Nugent P., Sullivan M., Ellis R. et al., 2006, ApJ, 645, 841Oilvares F., 2008, MSc thesis, University of ChilePastorello A., Zampieri L., Turatto M. et al., 2004, MNRAS, 347,74
Pastorello A., Baron E., Branch D. et al., 2005, MNRAS, 360, 950Pastorello A., Sauer D., Taubenberger S. et al., 2006, MNRAS,370, 1752
Pastorello A., Valenti S., Zampieri L. et al., 2009, MNRAS, 394,2266
Patat F., Barbon R., Cappellaro E., Turatto M., 1994, A&A, 282,731
Patat F., 1996, PhD thesis, University of PadovaPoznanski D., Butler N., Filippenko A. V. et al., 2009, ApJ, 694,1067
Pozzo M., Meikle W. P. S., Rayner J. T. et al., 2006, MNRAS,368,1169
Pun C. S. J., 1995, ApJS, 99, 223Rho J., Jarrett T. H., Chugai N. N., Chevalier R. A., 2007, ApJ,666, 1108
Sahu D. K., Anupama G. C., Srividya S., Muneer S., 2006, MN-RAS, 372, 1315
Schmidt B. P., Kirshner R. P., Schild R. et al., 1993, AJ, 105,6Smartt S. J., Maund J. R., Hendry M. A., Tout C. A., Gilmore G.F., Mattila S., Benn C. R., 2004, Sci, 303, 499
Smartt S. J., 2009, ARA&A, 47, 63Smartt S. J., Eldridge J. J., Crockett R. M., Maund J. R., 2009,MNRAS, 395, 1409
Smith N., Ganeshalingam M., Chornock R. et al., 2009, ApJ, 697,L49
Spyromilio J., Meikle W. P. S., Learner R. C. M., Allen D. A.,1988, Nat, 334, 327
Spyromilio J., Leibundgut B., 1996, MNRAS, 283, L89Spyromilio J., Leibundgut B., Gilmozzi R., 2001, A&A, 376, 188
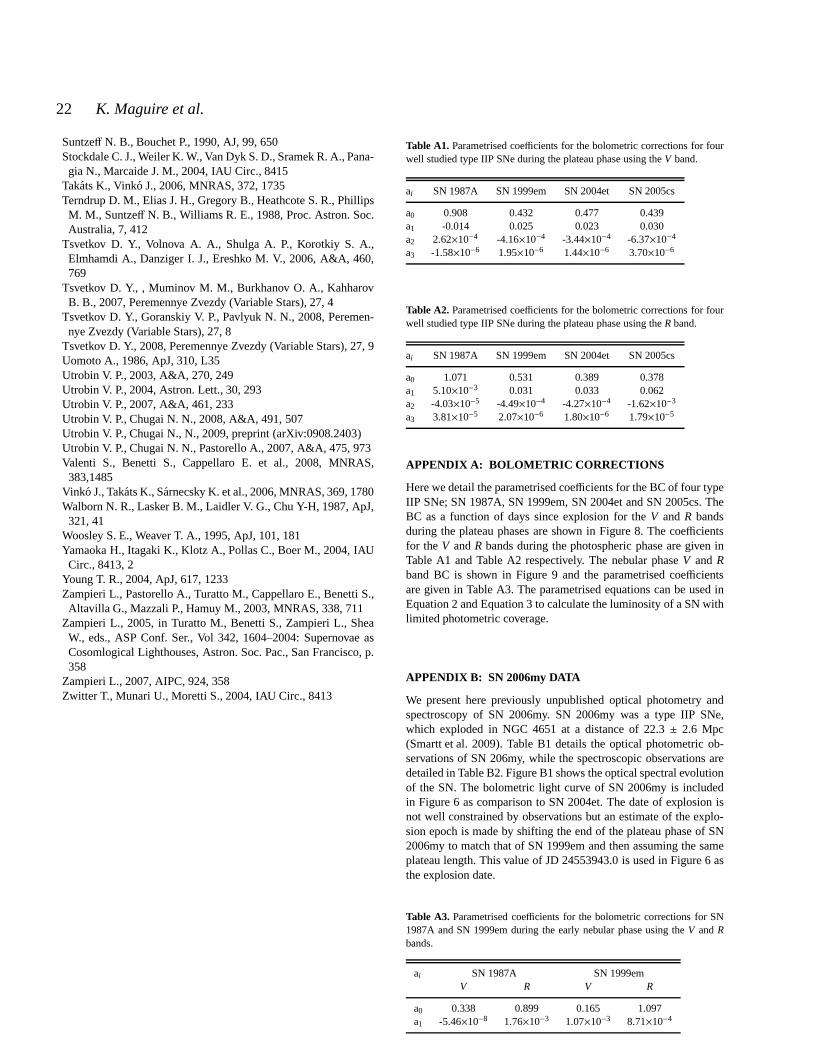
22 K. Maguire et al.
Suntzeff N. B., Bouchet P., 1990, AJ, 99, 650Stockdale C. J., Weiler K. W., Van Dyk S. D., Sramek R. A., Pana-gia N., Marcaide J. M., 2004, IAU Circ., 8415
Takats K., Vinko J., 2006, MNRAS, 372, 1735Terndrup D. M., Elias J. H., Gregory B., Heathcote S. R., PhillipsM. M., Suntzeff N. B., Williams R. E., 1988, Proc. Astron. Soc.Australia, 7, 412
Tsvetkov D. Y., Volnova A. A., Shulga A. P., Korotkiy S. A.,Elmhamdi A., Danziger I. J., Ereshko M. V., 2006, A&A, 460,769
Tsvetkov D. Y., , Muminov M. M., Burkhanov O. A., KahharovB. B., 2007, Peremennye Zvezdy (Variable Stars), 27, 4
Tsvetkov D. Y., Goranskiy V. P., Pavlyuk N. N., 2008, Peremen-nye Zvezdy (Variable Stars), 27, 8
Tsvetkov D. Y., 2008, Peremennye Zvezdy (Variable Stars), 27, 9Uomoto A., 1986, ApJ, 310, L35Utrobin V. P., 2003, A&A, 270, 249Utrobin V. P., 2004, Astron. Lett., 30, 293Utrobin V. P., 2007, A&A, 461, 233Utrobin V. P., Chugai N. N., 2008, A&A, 491, 507Utrobin V. P., Chugai N., N., 2009, preprint (arXiv:0908.2403)Utrobin V. P., Chugai N. N., Pastorello A., 2007, A&A, 475, 973Valenti S., Benetti S., Cappellaro E. et al., 2008, MNRAS,383,1485
Vinko J., Takats K., Sarnecsky K. et al., 2006, MNRAS, 369, 1780Walborn N. R., Lasker B. M., Laidler V. G., Chu Y-H, 1987, ApJ,321, 41
Woosley S. E., Weaver T. A., 1995, ApJ, 101, 181Yamaoka H., Itagaki K., Klotz A., Pollas C., Boer M., 2004, IAUCirc., 8413, 2
Young T. R., 2004, ApJ, 617, 1233Zampieri L., Pastorello A., Turatto M., Cappellaro E., Benetti S.,Altavilla G., Mazzali P., Hamuy M., 2003, MNRAS, 338, 711
Zampieri L., 2005, in Turatto M., Benetti S., Zampieri L., SheaW., eds., ASP Conf. Ser., Vol 342, 1604–2004: Supernovae asCosomlogical Lighthouses, Astron. Soc. Pac., San Francisco, p.358
Zampieri L., 2007, AIPC, 924, 358Zwitter T., Munari U., Moretti S., 2004, IAU Circ., 8413
Table A1. Parametrised coefficients for the bolometric corrections for fourwell studied type IIP SNe during the plateau phase using theV band.
ai SN 1987A SN 1999em SN 2004et SN 2005cs
a0 0.908 0.432 0.477 0.439a1 -0.014 0.025 0.023 0.030a2 2.62×10⁻⁴ -4.16×10⁻⁴ -3.44×10⁻⁴ -6.37×10⁻⁴
a3 -1.58×10⁻⁶ 1.95×10⁻⁶ 1.44×10⁻⁶ 3.70×10⁻⁶
Table A2. Parametrised coefficients for the bolometric corrections for fourwell studied type IIP SNe during the plateau phase using theRband.
ai SN 1987A SN 1999em SN 2004et SN 2005cs
a0 1.071 0.531 0.389 0.378a1 5.10×10⁻³ 0.031 0.033 0.062a2 -4.03×10⁻⁵ -4.49×10⁻⁴ -4.27×10⁻⁴ -1.62×10⁻³
a3 3.81×10⁻⁵ 2.07×10⁻⁶ 1.80×10⁻⁶ 1.79×10⁻⁵
APPENDIX A: BOLOMETRIC CORRECTIONS
Here we detail the parametrised coefficients for the BC of four typeIIP SNe; SN 1987A, SN 1999em, SN 2004et and SN 2005cs. TheBC as a function of days since explosion for theV andR bandsduring the plateau phases are shown in Figure 8. The coefficientsfor the V andR bands during the photospheric phase are given inTable A1 and Table A2 respectively. The nebular phaseV andRband BC is shown in Figure 9 and the parametrised coefficientsare given in Table A3. The parametrised equations can be usedinEquation 2 and Equation 3 to calculate the luminosity of a SN withlimited photometric coverage.
APPENDIX B: SN 2006my DATA
We present here previously unpublished optical photometryandspectroscopy of SN 2006my. SN 2006my was a type IIP SNe,which exploded in NGC 4651 at a distance of 22.3± 2.6 Mpc(Smartt et al. 2009). Table B1 details the optical photometric ob-servations of SN 206my, while the spectroscopic observations aredetailed in Table B2. Figure B1 shows the optical spectral evolutionof the SN. The bolometric light curve of SN 2006my is includedin Figure 6 as comparison to SN 2004et. The date of explosion isnot well constrained by observations but an estimate of the explo-sion epoch is made by shifting the end of the plateau phase of SN2006my to match that of SN 1999em and then assuming the sameplateau length. This value of JD 24553943.0 is used in Figure6 asthe explosion date.
Table A3. Parametrised coefficients for the bolometric corrections for SN1987A and SN 1999em during the early nebular phase using theV andRbands.
ai SN 1987A SN 1999emV R V R
a0 0.338 0.899 0.165 1.097a1 -5.46×10⁻⁸ 1.76×10⁻³ 1.07×10⁻³ 8.71×10⁻⁴

Optical and near infrared coverage of SN 2004et23
Table B1. Log of optical photometric observations of SN 2006my.
Date JD(2450000+) Phase* (days) B V R I Instrument
28/06/2006 53915 -28 19.00 (limit)a 608/11/2006 54048.3 105.3 15.30±0.20a 609/11/2006 54049.3 106.3 15.30±0.20a 622/11/2006 54062.6 119.6 17.50±0.02 15.89±0.01 15.41±0.01 15.20±0.01 227/11/2006 54066.7 123.7 17.51±0.02 16.01±0.01 15.52± 0.02 15.18±0.01 130/11/2006 54070.7 127.7 16.24±0.03 15.59±0.02 15.35±0.01 204/12/2006 54074.7 131.7 16.45±0.19 15.9±0.06 15.59±0.04 215/12/2006 54084.8 141.8 18.51±0.04 215/12/2006 54085.1 142.1 18.54±0.07 16.94±0.02 16.27±0.03 416/12/2006 54085.8 142.8 18.60±0.04 220/12/2006 54090.1 147.1 19.26±0.09 17.60±0.03 16.81±0.02 421/12/2006 54090.7 147.7 19.30±0.21 17.78±0.07 16.96±0.04 121/12/2006 54091.1 148.1 19.17±0.04 17.79±0.02 16.96±0.02 420/01/2007 54120.6 177.6 18.26±0.03 17.30±0.02 17.17±0.02 221/01/2007 54121.6 178.6 18.31±0.18 17.25±0.06 17.14±0.06 222/01/2007 54122.6 179.6 18.28±0.03 17.30±0.02 17.15±0.01 208/02/2007 54140.6 197.6 18.43±0.03 17.50±0.02 17.29±0.01 211/02/2007 54142.7 199.7 19.61±0.23 18.56±0.21 17.64±0.13 17.27±0.08 111/02/2007 54142.8 199.8 18.48±0.03 17.60±0.02 17.30±0.01 313/02/2007 54146.0 203.0 19.74±0.13 18.62±0.05 17.58±0.03 415/02/2007 54147.9 204.9 19.72±0.12 18.60±0.04 17.61±0.03 407/03/2007 54168.0 225.0 20.01±0.04 18.82±0.05 17.79±0.03 411/03/2007 54171.8 228.8 18.85±0.03 17.84±0.01 17.56±0.02 515/04/2007 54205.6 262.6 20.22±0.23 19.15±0.06 18.22±0.07 17.81±0.05 1
* since explosion (JD 2453943.0)a unfiltered1 = Ekar 1.82m+AFOSC2 = Liverpool Telescope+RATCam3 = NOT+ALFOSC4 = Faulkes Telescope North 2m+HawkCam15 =WHT+AUXPort6 = IAUC Circular No. 8773 by K. Itagaki (Teppo-cho, Yamagata, Japan, 0.60-m f/5.7 reflector)
Figure B1. Optical spectral evolution of SN 2006my.
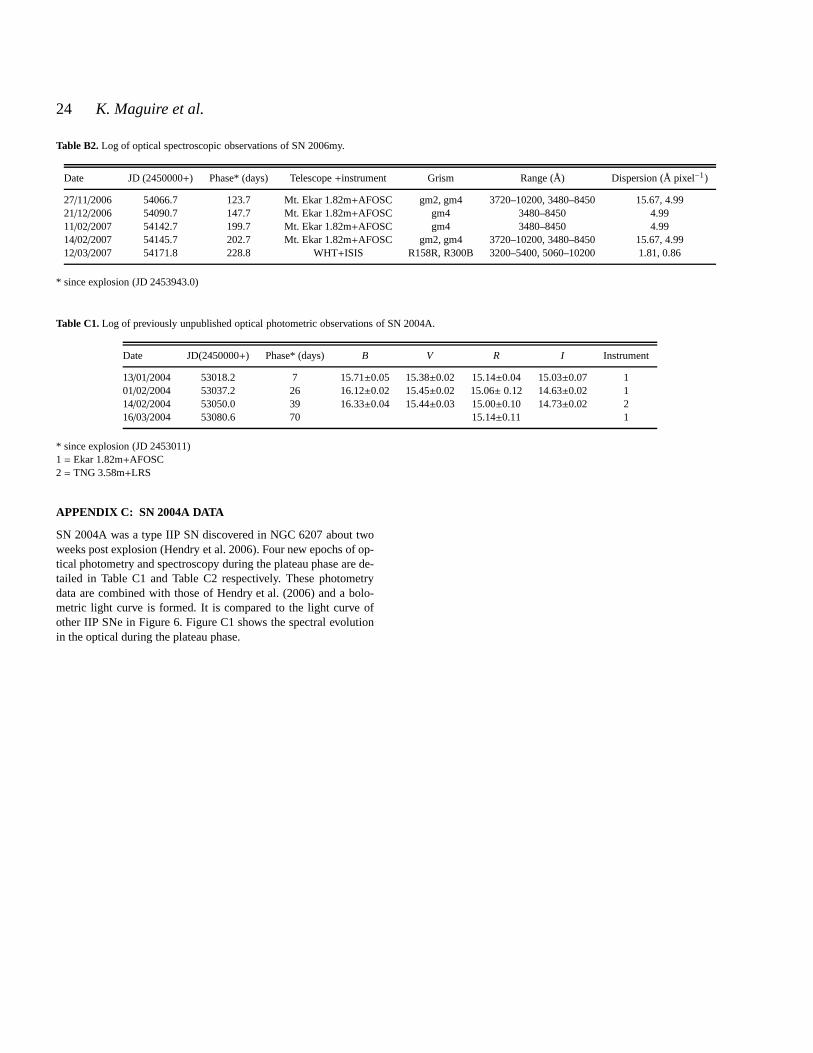
24 K. Maguire et al.
Table B2. Log of optical spectroscopic observations of SN 2006my.
Date JD (2450000+) Phase* (days) Telescope+instrument Grism Range (Å) Dispersion (Å pixel−1)
27/11/2006 54066.7 123.7 Mt. Ekar 1.82m+AFOSC gm2, gm4 3720–10200, 3480–8450 15.67, 4.9921/12/2006 54090.7 147.7 Mt. Ekar 1.82m+AFOSC gm4 3480–8450 4.9911/02/2007 54142.7 199.7 Mt. Ekar 1.82m+AFOSC gm4 3480–8450 4.9914/02/2007 54145.7 202.7 Mt. Ekar 1.82m+AFOSC gm2, gm4 3720–10200, 3480–8450 15.67, 4.9912/03/2007 54171.8 228.8 WHT+ISIS R158R, R300B 3200–5400, 5060–10200 1.81, 0.86
* since explosion (JD 2453943.0)
Table C1. Log of previously unpublished optical photometric observations of SN 2004A.
Date JD(2450000+) Phase* (days) B V R I Instrument
13/01/2004 53018.2 7 15.71±0.05 15.38±0.02 15.14±0.04 15.03±0.07 101/02/2004 53037.2 26 16.12±0.02 15.45±0.02 15.06± 0.12 14.63±0.02 114/02/2004 53050.0 39 16.33±0.04 15.44±0.03 15.00±0.10 14.73±0.02 216/03/2004 53080.6 70 15.14±0.11 1
* since explosion (JD 2453011)1 = Ekar 1.82m+AFOSC2 = TNG 3.58m+LRS
APPENDIX C: SN 2004A DATA
SN 2004A was a type IIP SN discovered in NGC 6207 about twoweeks post explosion (Hendry et al. 2006). Four new epochs ofop-tical photometry and spectroscopy during the plateau phaseare de-tailed in Table C1 and Table C2 respectively. These photometrydata are combined with those of Hendry et al. (2006) and a bolo-metric light curve is formed. It is compared to the light curve ofother IIP SNe in Figure 6. Figure C1 shows the spectral evolutionin the optical during the plateau phase.

Optical and near infrared coverage of SN 2004et25
Table C2. Log of optical spectroscopic observations of SN 2004A.
Date JD (2450000+) Phase* (days) Telescope+instrument Grism Range (Å) Dispersion (Å pixel−1)
13/01/2004 53018.4 7 Mt. Ekar 1.82m+AFOSC gm4 3480–8450 4.9901/02/2004 53037.4 26 Mt. Ekar 1.82m+AFOSC gm4 3480–8450 4.9915/02/2004 53051.7 41 TNG 3.58m+LRS LR-R, LR-B 4470–10073, 3000–8430 2.61, 2.521/03/2004 53080.6 70 Mt. Ekar 1.82m+AFOSC gm2, gm4 3720–10200, 3480–8450 15.67, 4.99
* since explosion (JD 2453011)
Figure C1. Optical spectral evolution of SN 2004A during the photospheric phase from+7 days to+70 days post explosion. The spectrum from+43 days istaken from Hendry et al. (2006).