VI. Normal Type Ia and 91bg-like supernovae in ellipticals
15
MNRAS 490, 718–732 (2019) doi:10.1093/mnras/stz2585 Advance Access publication 2019 September 16 Supernovae and their host galaxies – VI. Normal Type Ia and 91bg-like supernovae in ellipticals L. V. Barkhudaryan , 1‹ A. A. Hakobyan , 1 ‹ A. G. Karapetyan , 1 G. A. Mamon , 2 D. Kunth, 2 V. Adibekyan 3 and M. Turatto 4 1 Byurakan Astrophysical Observatory, 0213 Byurakan, Aragatsotn Province, Armenia 2 Institut d’Astrophysique de Paris, Sorbonne Universit´ es, UPMC Univ Paris 6 et CNRS, UMR 7095, 98 bis bd Arago, F-75014 Paris, France 3 Instituto de Astrof´ ısica e Ciˆ encia do Espac ¸o, Universidade do Porto, CAUP, Rua das Estrelas, P-4150-762 Porto, Portugal 4 INAF – Osservatorio Astronomico di Padova, Vicolo dell’Osservatorio 5, I-35122 Padova, Italy Accepted 2019 September 5. Received 2019 August 14; in original form 2019 June 13 ABSTRACT We present an analysis of the galactocentric distributions of the ‘normal’ and peculiar ‘91bg- like’ subclasses of 109 supernovae (SNe) Ia, and study the global parameters of their elliptical hosts. The galactocentric distributions of the SN subclasses are consistent with each other and with the radial light distribution of host stellar populations, when excluding bias against central SNe. Among the global parameters, only the distributions of u − r colours and ages are inconsistent significantly between the ellipticals of different SN Ia subclasses: the normal SN hosts are on average bluer/younger than those of 91bg-like SNe. In the colour–mass diagram, the tail of colour distribution of normal SN hosts stretches into the Green Valley – transitional state of galaxy evolution, while the same tail of 91bg-like SN hosts barely reaches that region. Therefore, the bluer/younger ellipticals might have more residual star formation that gives rise to younger ‘prompt’ progenitors, resulting in normal SNe Ia with shorter delay times. The redder and older ellipticals that already exhausted their gas for star formation may produce significantly less normal SNe with shorter delay times, outnumbered by ‘delayed’ 91bg-like events. The host ages (lower age limit of the delay times) of 91bg-like SNe does not extend down to the stellar ages that produce significant u-band fluxes – the 91bg-like events have no prompt progenitors. Our results favour SN Ia progenitor models such as He-ignited violent mergers that have the potential to explain the observed SN/host properties. Key words: supernovae: individual: Type Ia – galaxies: abundances – galaxies: elliptical and lenticular, cD – galaxies: evolution – galaxies: star formation – galaxies: stellar content. 1 INTRODUCTION The most energetic and relatively uniform class among supernovae (SNe) explosions are Type Ia SNe that were used to discover the accelerating expansion of the Universe (e.g. Riess et al. 1998; Perlmutter et al. 1999). It is widely accepted that Type Ia SN arises from a thermonuclear explosion of a carbon–oxygen (CO) white dwarf (WD) in an interacting binary stellar system. In short, the most favoured are single degenerate (SD; Nomoto, Iwamoto & Kishimoto 1997) and double degenerate (DD; Iben & Tutukov 1984) progenitor scenarios. In the SD scenario, a CO WD accretes material from a main-sequence/subgiant star, or a red giant star, or even a helium star, causing the WD mass to reach the Chandrasekhar mass limit (≈ 1.4M ) and explode. In the DD scenario, a double WD system loses orbital angular momentum due to gravitational wave emission, leading to coalescence/accretion and explosion. Recent E-mail: [email protected] (LVB); [email protected] (AAH) results suggest that both scenarios are possible (see e.g. Maeda & Terada 2016, for a review on various progenitor models). The fortune of SNe Ia in cosmology is due to the fact that despite their moderate inhomogeneity, they are the best standardizable candles in the Universe due to a correlation between their luminosity at maximum light and the shape of the light curve (LC), with faster declining objects being fainter (first proposed by Rust 1974 and Pskovskii 1977). This is known as the width–luminosity relation of SN LC (Phillips 1993). In addition, the LC decline rates m 15 , i.e. the difference in magnitudes between the maximum and 15 d after the maximum light, and colours of SNe Ia are related: the faster declining LCs correspond to the intrinsically redder events (e.g. Riess et al. 1998; Phillips et al. 1999). The luminosity of an SN Ia and the m 15 depend on the kinetic energy of the explosion, the mass of radioactive 56 Ni in the ejecta and opacity (e.g. Arnett 1982; Mazzali et al. 2007). Despite the relatively uniform maximum luminosities of Type Ia SNe, there is increasing evidence for photometric and spectroscopic C 2019 The Author(s) Published by Oxford University Press on behalf of the Royal Astronomical Society Downloaded from https://academic.oup.com/mnras/article/490/1/718/5570591 by guest on 29 June 2022
-
Upload
khangminh22 -
Category
Documents
-
view
1 -
download
0
Transcript of VI. Normal Type Ia and 91bg-like supernovae in ellipticals
MNRAS 490, 718–732 (2019) doi:10.1093/mnras/stz2585Advance Access publication 2019 September 16
Supernovae and their host galaxies – VI. Normal Type Ia and 91bg-likesupernovae in ellipticals
L. V. Barkhudaryan ,1‹ A. A. Hakobyan ,1‹ A. G. Karapetyan ,1 G. A. Mamon ,2
D. Kunth,2 V. Adibekyan3 and M. Turatto4
1Byurakan Astrophysical Observatory, 0213 Byurakan, Aragatsotn Province, Armenia2Institut d’Astrophysique de Paris, Sorbonne Universites, UPMC Univ Paris 6 et CNRS, UMR 7095, 98 bis bd Arago, F-75014 Paris, France3Instituto de Astrofısica e Ciencia do Espaco, Universidade do Porto, CAUP, Rua das Estrelas, P-4150-762 Porto, Portugal4INAF – Osservatorio Astronomico di Padova, Vicolo dell’Osservatorio 5, I-35122 Padova, Italy
Accepted 2019 September 5. Received 2019 August 14; in original form 2019 June 13
ABSTRACTWe present an analysis of the galactocentric distributions of the ‘normal’ and peculiar ‘91bg-like’ subclasses of 109 supernovae (SNe) Ia, and study the global parameters of their ellipticalhosts. The galactocentric distributions of the SN subclasses are consistent with each otherand with the radial light distribution of host stellar populations, when excluding bias againstcentral SNe. Among the global parameters, only the distributions of u − r colours and ages areinconsistent significantly between the ellipticals of different SN Ia subclasses: the normal SNhosts are on average bluer/younger than those of 91bg-like SNe. In the colour–mass diagram,the tail of colour distribution of normal SN hosts stretches into the Green Valley – transitionalstate of galaxy evolution, while the same tail of 91bg-like SN hosts barely reaches that region.Therefore, the bluer/younger ellipticals might have more residual star formation that gives riseto younger ‘prompt’ progenitors, resulting in normal SNe Ia with shorter delay times. Theredder and older ellipticals that already exhausted their gas for star formation may producesignificantly less normal SNe with shorter delay times, outnumbered by ‘delayed’ 91bg-likeevents. The host ages (lower age limit of the delay times) of 91bg-like SNe does not extenddown to the stellar ages that produce significant u-band fluxes – the 91bg-like events have noprompt progenitors. Our results favour SN Ia progenitor models such as He-ignited violentmergers that have the potential to explain the observed SN/host properties.
Key words: supernovae: individual: Type Ia – galaxies: abundances – galaxies: elliptical andlenticular, cD – galaxies: evolution – galaxies: star formation – galaxies: stellar content.
1 IN T RO D U C T I O N
The most energetic and relatively uniform class among supernovae(SNe) explosions are Type Ia SNe that were used to discover theaccelerating expansion of the Universe (e.g. Riess et al. 1998;Perlmutter et al. 1999). It is widely accepted that Type Ia SNarises from a thermonuclear explosion of a carbon–oxygen (CO)white dwarf (WD) in an interacting binary stellar system. In short,the most favoured are single degenerate (SD; Nomoto, Iwamoto &Kishimoto 1997) and double degenerate (DD; Iben & Tutukov 1984)progenitor scenarios. In the SD scenario, a CO WD accretes materialfrom a main-sequence/subgiant star, or a red giant star, or even ahelium star, causing the WD mass to reach the Chandrasekhar masslimit (≈ 1.4 M�) and explode. In the DD scenario, a double WDsystem loses orbital angular momentum due to gravitational waveemission, leading to coalescence/accretion and explosion. Recent
� E-mail: [email protected] (LVB); [email protected] (AAH)
results suggest that both scenarios are possible (see e.g. Maeda &Terada 2016, for a review on various progenitor models).
The fortune of SNe Ia in cosmology is due to the fact that despitetheir moderate inhomogeneity, they are the best standardizablecandles in the Universe due to a correlation between their luminosityat maximum light and the shape of the light curve (LC), with fasterdeclining objects being fainter (first proposed by Rust 1974 andPskovskii 1977). This is known as the width–luminosity relationof SN LC (Phillips 1993). In addition, the LC decline rates �m15,i.e. the difference in magnitudes between the maximum and 15 dafter the maximum light, and colours of SNe Ia are related: thefaster declining LCs correspond to the intrinsically redder events(e.g. Riess et al. 1998; Phillips et al. 1999). The luminosity of anSN Ia and the �m15 depend on the kinetic energy of the explosion,the mass of radioactive 56Ni in the ejecta and opacity (e.g. Arnett1982; Mazzali et al. 2007).
Despite the relatively uniform maximum luminosities of Type IaSNe, there is increasing evidence for photometric and spectroscopic
C© 2019 The Author(s)Published by Oxford University Press on behalf of the Royal Astronomical Society
Dow
nloaded from https://academ
ic.oup.com/m
nras/article/490/1/718/5570591 by guest on 29 June 2022

Supernovae and their host galaxies – VI. 719
diversities among them. In comparison with the observationalproperties of normal SNe Ia (Branch, Fisher & Nugent 1993),specialists in the field often refer to two ‘traditional’ and mostcommon subclasses of peculiar SNe Ia – overluminous ‘91T-like’events with slower declining LCs (Filippenko et al. 1992b; Phillipset al. 1992; Ruiz-Lapuente et al. 1992) and subluminous ‘91bg-like’SNe with faster declining LCs (Filippenko et al. 1992a; Leibundgutet al. 1993; Turatto et al. 1996). These peculiar SNe Ia make up aconsiderable fraction of local Type Ia SNe (e.g. Li et al. 2011a,∼30 per cent), and are of crucial importance for understandingSNe Ia events in general. A few per cent of other subclassesof peculiar SNe Ia include the faint but slowly declining ‘02es-like’ SNe, ‘02cx-like’ events with low luminosities (also calledSNe Iax), ‘Ca-rich’ transients, the extremely luminous so-called‘super-Chandrasekhar’ (also called ‘06gz-like’) SNe, and SNe Iashowing circumstellar medium interactions (see e.g. Taubenberger2017, for a recent review on most of the extremes of TypeIa SNe).
When considering only the most populated subclasses of SNe Ia,i.e. normal, 91T-, and 91bg-like events, the lower mass of thehost galaxy (the later morphological type or higher the specificstar formation rate, SFR), the brighter and slower the SNe Ia thatare exploded, on average (e.g. Hamuy et al. 1996; Howell 2001;Gallagher et al. 2005; Neill et al. 2009; Gonzalez-Gaitan et al.2011, 2014; Li et al. 2011a). 91T-like SNe occur in star-forming hostgalaxies, while such an object has never been discovered in ellipticalgalaxies (e.g. Howell 2001; Gallagher et al. 2005; Li et al. 2011a),where the stellar population almost always consists of old stars.91bg-like events prefer host galaxies with elliptical and lenticularmorphologies (E–S0), sometimes they explode also in early-typespirals (e.g. Howell 2001; Li et al. 2011a). Normal SNe Ia arediscovered in host galaxies with any morphologies from ellipticalsto late-type spirals (e.g. Li et al. 2011a).
In the literature, there are many efforts in studying the linksbetween the spectral as well as LC properties of SNe Ia and theglobal as well as local properties at SN explosion sites of theirhost galaxies, such as mass, colour, SFR, metallicity, and age ofthe stellar population (e.g. Hamuy et al. 2000; Ivanov, Hamuy &Pinto 2000; Gallagher et al. 2005, 2008; Howell et al. 2009; Neillet al. 2009; Sullivan et al. 2010; Gupta et al. 2011; Galbany et al.2012; Pan et al. 2014, 2015; Anderson et al. 2015; Moreno-Rayaet al. 2016; Kim et al. 2018; Rose, Garnavich & Berg 2019). In suchstudies, SNe Ia host galaxies with various morphological properties,e.g. old ellipticals with spherically distributed stellar content,lenticulars with an old stellar population in a huge spherical bulgeplus a prominent exponential disc, and spirals with old bulge andyoung star-forming disc components are simultaneously includedin the samples. In this case, it is difficult to precisely analyse thespatial distribution of SNe, and associate them with a concrete stellarcomponent (bulge or thick/thin discs, old, or intermediate/young)in the hosts due to different or unknown projection effects (e.g.Hakobyan et al. 2016, 2017). In addition, E–S0 and spiral hostgalaxies have had different evolutionary paths through major/minorgalaxy–galaxy interaction (e.g. Kaviraj et al. 2009; McIntosh et al.2014; Schawinski et al. 2014), and therefore this important aspectshould be clearly distinguished.
In this study, we morphologically select from the Sloan DigitalSky Survey (SDSS) only elliptical host galaxies of SNe Ia, which areknown to have the simplest structural properties of the compositionin comparison with lenticular and spiral galaxies (e.g. Kormendyet al. 2009). As already mentioned, in these galaxies no 91T-likeevents have been discovered, they mostly host normal and 91bg-like
SNe (e.g. Howell 2001). Therefore, these two subclasses of Type IaSNe are the subject of study in this paper.1
Recall that the 91bg-like SNe are unusually red and have peakluminosities that are 2 ± 0.5 mag lower than normal SNe Ia (thetypical peak magnitude of normal SNe Ia is MB � −19.1 mag, seeTaubenberger et al. 2008 and references therein). They have fasterdeclining LCs 1.8 � �m15 � 2.1, compared with �m15 � 1.7 fornormal events, and their ejecta velocities are small at any epochin comparison with normal SNe Ia (e.g. Benetti et al. 2005; Wanget al. 2013). In the post-maximum spectra, particularly notable is thepresence of unusually strong O I λ 7774 and Ti II absorption lines.Despite the recent detection of strong H α in the nebular spectrumof ASASSN-18tb (a 91bg-like event; Kollmeier et al. 2019), thereis no evidence that fast declining SNe are more likely to have latetime H α emission (Sand et al. 2019). For more details of the spectraand LC properties of 91bg-like events, the reader is referred to areview by Taubenberger (2017).
The explosion mechanism, which should explain the main charac-teristics of these events, including the low 56Ni masses, is still underdebate. The DD scenario, the helium layer detonation triggered sub-Chandrasekhar mass explosion, and the scenario of collision of twoWDs are competing (e.g. Hillebrandt & Niemeyer 2000; Mazzali &Hachinger 2012; Pakmor et al. 2013; Dong et al. 2015; Crockeret al. 2017).
In the earlier literature, several attempts have been done to studythe projected radial and surface density distributions of nearbySNe Ia in morphologically selected elliptical host galaxies (Gu-seinov, Kasumov & Kalinin 1980; Bartunov, Makarova & Tsvetkov1992; Tsvetkov, Pavlyuk & Bartunov 2004; Forster & Schawinski2008). These studies showed that, in general, the distribution ofType Ia SNe is consistent with the light (de Vaucouleurs) profileof their elliptical host galaxies, which are dominated by old andmetal-rich stellar populations (e.g. Gonzalez Delgado et al. 2015).However, mainly because of the lack of the spectral and LC data,these studies did not separate the normal and 91bg-like subclasses.For the first time, Pavlyuk & Tsvetkov (2016) attempted to comparethe surface density distributions of the subclasses of nearby SNe Ia,in particular for those of the normal and 91bg-like events. However,the morphological types of SN hosts were not limited to ellipticalgalaxies only, thus mixing different progenitor populations frombulges and discs (see also Gallagher et al. 2008; Panther et al. 2019).
On the other hand, Gallagher et al. (2008) studied opticalabsorption-line spectra of 29 early-type host galaxies of local SNe Iaand found a higher specific SN rate in E–S0 galaxies with agesbelow 3 Gyr than in older hosts. Recall that the rate of Type IaSNe can be represented as a linear combination of ‘prompt’ and‘delayed’ (tardy) components (e.g. Scannapieco & Bildsten 2005).The prompt component is more closely related with the recent SFR,and the delayed component with the total stellar mass of galaxy(e.g. Mannucci et al. 2005; Hakobyan et al. 2011; Li et al. 2011b).Therefore, according to Gallagher et al. (2008), the higher rate seenin the youngest E–S0 hosts may be a result of recent star formationand represents a tail of the prompt SN Ia progenitors.
Most recently, Panther et al. (2019) analysed the explosion sitesof 11 spectroscopically identified nearby 91bg-like SNe in hostswith different morphologies (including only six E–S0 galaxies)and found that the majority of the stellar populations that hostthese events are dominated by old stars with lack of recent
1The subclasses of Type Ia SNe, discovered in lenticular and spiral hostgalaxies, will be the subject of a forthcoming paper in this series.
MNRAS 490, 718–732 (2019)
Dow
nloaded from https://academ
ic.oup.com/m
nras/article/490/1/718/5570591 by guest on 29 June 2022

720 L. V. Barkhudaryan et al.
star formation evidence. These authors concluded that the 91bg-like SN progenitors are likely to have delay times, i.e. the timeintervals between the SN Ia progenitor formation and the subsequentthermonuclear explosion, much longer (>6 Gyr, see also Crockeret al. 2017) than the typical delay times of normal SNe Ia in star-forming environments, whose delay times peak between severalhundred Myr and ∼1 Gyr (e.g. Childress, Wolf & Zahid 2014; Maoz,Mannucci & Nelemans 2014).
The goal of this paper is to properly address these questionsthrough a comparative study of the galactocentric distributions ofnormal and 91bg-like SNe, as well as through an analysis of theglobal properties of SNe Ia hosts (e.g. stellar mass, metallicity,colour, and age of stellar population) in a well-defined and morpho-logically non-disturbed sample of more than 100 relatively nearbyelliptical galaxies.
This is the sixth paper of the series following Hakobyan et al.(2012), Hakobyan et al. (2014), Hakobyan et al. (2016), Aramyanet al. (2016), and Hakobyan et al. (2017) and the content is asfollows. The sample selection and reduction are presented in Sec-tion 2. All the results are presented in Section 3. Section 4 discussesthe results with comprehensive interpretations, and summarizes ourconclusions. To conform to values used in the series of our articles,Hubble constant H0 = 73 km s−1 Mpc−1 is adopted in this paper.
2 SA M P L E SE L E C T I O N A N D R E D U C T I O N
We used the updated versions of the Asiago Supernovae Catalogue2
(ASC; Barbon et al. 1999) and Open Supernova Catalog (OSC;Guillochon et al. 2017) to include all spectroscopically classifiedType Ia SNe with distances ≤ 200 Mpc (0.003 ≤ z ≤ 0.046),3
discovered before 2018 October 9. All SNe are required to haveequatorial coordinates and/or offsets (positions in arcsec) withrespect to host galactic nuclei. We cross-matched these coordinateswith the coverage of the SDSS Data Release Fifteen (DR15; Aguadoet al. 2019) to identify the host galaxies with elliptical morphology,using the techniques presented in Hakobyan et al. (2012). Many ofthe identified SNe Ia host galaxies are already listed in data base ofHakobyan et al. (2012), which is based on the SDSS DR8. However,because we added new SNe Ia, for homogeneity we redid the wholereduction for the sample of elliptical host galaxies of this studybased only on DR15.
Following the approach of Hakobyan et al. (2014), we checkedalso the levels of morphological disturbances of the host galaxiesusing the SDSS images. Because we are interested in studying thedistribution of SNe Ia in non-disturbed elliptical galaxies, the hostswith interacting, merging, and post-merging/remnant attributes areremoved from the sample.
For three SNe (1980I, 2008gy, and 2018ctv), the almost equalityof projected distances from the few nearest elliptical galaxies didnot allow to unambiguously assign them to certain hosts. Therefore,we simply excluded these objects from our sample.
For the remaining SNe Ia that satisfy the above mentioned criteria,we carried out an extensive literature search to collect their spec-troscopic subclasses (e.g. normal, 91T-like, 91bg-like, and otherpeculiar events), which are available at the moment of writing this
2The ASC was terminated as at 2017 December 31.3Following Hakobyan et al. (2012), to calculate the luminosity distances ofSNe/host galaxies, we used the recession velocities both corrected to thecentroid of the Local Group (Yahil, Tammann & Sandage 1977), and forinfall of the Local Group towards Virgo cluster (Theureau et al. 1998; Terry,Paturel & Ekholm 2002).
0 50 100 150 2000.0
0.2
0.4
0.6
0.8
1.0
D Mpc
Cumulativefraction
0 50 100 150 2000.00.20.40.60.81.0
D Mpc
Relativefraction
normal
91bg like
all
Figure 1. Cumulative and relative (inset) fractions of 109 Type Ia SNe (all– black solid, normal – green dashed, and 91bg-like – red dotted) in ellipticalgalaxies as a function of distance. The mean values of the distributions areshown by arrows.
paper. To accomplish this, we mainly used the Weizmann InteractiveSupernova data REPository (WISeREP; Yaron & Gal-Yam 2012),which is an interactive archive of SN spectra and photometry,including data of historical events and ongoing surveys/programs.The archive provides also the important references to the originalpublications, which we considered along with the Astronomer’sTelegram4 (ATEL), website of the Central Bureau for AstronomicalTelegrams5 (CBAT) and other supporting publications (e.g. Branchet al. 1993; Silverman et al. 2012; Tomasella et al. 2014). In total, wemanaged to collect the subclasses for 109 SNe in 104 host galaxies:66 SNe are normal, 41 SNe are 91bg-like, and two SNe are 06gz-like (super-Chandrasekhar) events. As expected (e.g. Howell 2001;Gallagher et al. 2005), 91T-like events have not been discovered inelliptical galaxies. On the other hand, less than a dozen of 06gz-like SNe have been discovered so far, and they have a tendencyto explode in low-mass (low-metallicity) late-type galaxies (e.g.Taubenberger et al. 2011). Therefore, they are not the subject of ourstudy, and because of only two such objects in our sample, furtherin the article we do not specifically discuss these events and theirhosts, instead we just present them for illustrative purpose.
It is important to note that in this sample of SNe Ia only seven nor-mal events (∼6 per cent of objects: 1939A, 1957B, 1970J, 1981G,1982W, 1993ae, and 1993C) were discovered photographically,while all the other 102 SNe were discovered by visual or mostlyCCD searches.
Fig. 1 shows the distributions of relative and cumulative fractionsof the subclasses of Type Ia SNe as a function of distances. Aswas mentioned, the 91bg-like SNe have peak luminosities that are∼2 mag lower than normal SNe Ia (see Taubenberger et al. 2008,and references therein), therefore the discoveries of 91bg-like eventsmight be complicated at greater distances. The mean distances of all,normal, and 91bg-like SNe are 105, 108, and 97 Mpc with standarddeviations of 43, 44, and 38 Mpc, respectively. Meanwhile, the two-sample Kolmogorov–Smirnov (KS) and Anderson–Darling (AD)tests6 showed that the distance distributions of normal and 91bg-likeevents are not significantly different (PKS = 0.404, PAD = 0.238) andcould thus be drawn from the same parent distribution. Therefore,
4See http://www.astronomerstelegram.org/.5See http://www.cbat.eps.harvard.edu/iau/cbat.html.6Traditionally, we adopted in this article the threshold of 5 per cent forsignificance levels (P-values) of the different tests. For more details of thestatistical tests, the reader is referred to Engmann & Cousineau (2011).
MNRAS 490, 718–732 (2019)
Dow
nloaded from https://academ
ic.oup.com/m
nras/article/490/1/718/5570591 by guest on 29 June 2022

Supernovae and their host galaxies – VI. 721
our subsamples of normal and 91bg-like SNe and their host galaxiesshould not be strongly affected by the redshift-dependent biasesagainst or in favour of one of the SN subclasses.
We measured the photometry and geometry of the 104 hostgalaxies according to the approaches presented in Hakobyan et al.(2012). For each host galaxy, we used the fitted 25 mag arcsec−2
elliptical aperture in the SDSS g-band to obtain the major axis (D25),elongation (a/b), and position angle (PA) of the major axis relativeto North in the anticlockwise direction. The classification of hostsincludes also the ratio 10(a − b)/a: for a projection of a galaxy witha equal to b, the ratio is 0 and the morphological type is E0. There areonly one E5 and 10 E4 host galaxies (∼10 per cent of the sample).The rest of the galaxies are almost evenly distributed in E0–E3 bins.The mean D25 of the hosts is 129 arcsec with the minimum valueof 21 arcsec. The corresponding u-, g-, r-, i-, and z-band fluxes (ap-parent magnitudes)7 are measured using the g-band fitted ellipticalaperture. During the measurements, we masked out bright projectedand/or saturated stars. The apparent/absolute magnitudes and D25
values are corrected for Galactic extinction using the Schlafly &Finkbeiner (2011) recalibration of the Schlegel, Finkbeiner & Davis(1998) infrared-based dust map. These values are not corrected forhost galaxy internal extinction because ellipticals have almost noglobal extinction, with mean AV = 0.01 ± 0.01 mag (GonzalezDelgado et al. 2015). Since the redshifts of host galaxies are low(z ≤ 0.046), the accounted K-corrections for the magnitudes aremostly negligible and do not exceed 0.2 mag in the g-band. The D25
values are also corrected for inclination/elongation effect accordingto Bottinelli et al. (1995).
In an elliptical galaxy the real galactocentric distance of SNcannot be calculated using the SN offset from the host galaxynucleus (�α and �δ). Instead, we can only calculate the projectedgalactocentric distance of an SN (RSN = √
�α2 + �δ2), which isthe lower limit of the real galactocentric distance.8 Following Ivanovet al. (2000), we used the relative projected galactocentric distances(RSN = RSN/R25), i.e. normalized to R25 = D25/2 in the g-band.
However, for the normalization, the effective radius (Re) couldbe more relevant being tighter correlated with the stellar surfacedensity distribution or surface brightness profile of the host galaxyin comparison with the R25 photometric radius (e.g. Kormendy et al.2009). For elliptical galaxies, the surface brightness (I) profiles aredescribed by the Sersic law (Sersic 1963)
I (R |Re) = I0 exp{
−bn
(RRe
) 1n}
, (1)
where Re is the radius of a circle that contains half of the light of thetotal galaxy (also known as half-light radius), I0 is the central surfacebrightness of the galaxy, n is the Sersic index, defining the shapeof the profile. An analytical expression that approximates the bn
parameter is bn � 1.9992 n − 0.3271 (e.g. Capaccioli 1989). Whenn = 4, the profile, which is called de Vaucouleurs profile, sufficientlydescribes the surface brightness distribution of elliptical galaxies(de Vaucouleurs 1948). Therefore, following Forster & Schawinski(2008), we also normalized RSN to the Re radii of host galaxies(RSN = RSN/Re).
7All magnitudes are in the AB system such that uAB = u − 0.04 magand zAB = z + 0.02 mag (g, r, and i are closer to AB system, see https://www.sdss.org/dr15/algorithms/fluxcal/).8In several cases when SNe offsets were not available in the above mentionedcatalogues, we calculated �α and �δ by �α ≈ (αSN − αg)cos δg and �δ ≈(δSN − δg), where αSN and δSN are SN coordinates and αg and δg are hostgalaxy coordinates in equatorial system.
Figure 2. Upper panel: comparison of the projected galactocentric dis-tances of SNe Ia and R25 of elliptical host galaxies in kpc. Green triangles,red circles, and blue crosses show normal, 91bg-like, and 06gz-like SNe,respectively. Black solid (all), green dashed (normal), and red dotted (91bg-like) lines are best fits to the samples. Bottom panel: same as in upper panelbut for RSN versus Re.
The g-band Re radii (in arcsec) of our host galaxies are extractedfrom the SDSS where a detailed photometric analysis of galaxies isperformed (Lupton et al. 2001). Their pipeline fitted galaxies with ade Vaucouleurs profile and an exponential profile,9 and asked for thelinear combination of the two that best fitted the image, providingthe Re and parameter fracDeV, which is the fraction of fluxescontributed from the de Vaucouleurs profile. An elliptical galaxywith a pure de Vaucouleurs profile should have fracDeV = 1, anda galaxy with pure exponential profile should have fracDeV =0. In our morphologically selected sample of hosts, most (about90 per cent) of the galaxies havefracDeV > 0.8, wherefracDeV =0.8 roughly corresponds to S0 galaxies (e.g. Bernardi et al. 2006).Only for 14 host galaxies (mostly with D25 > 200 arcsec), the SDSSlacks the mentioned model fits or provides unreliable parametersdue to the blending/defragmenting of galaxies with large angularsizes. For these 14 galaxies, we used our estimations of half-lightradii based on the SDSS g-band images.
The R25 and Re normalizations are crucial for studying theprojected radial distribution of SNe, because the distribution oflinear values of RSN is strongly biased by the greatly differentintrinsic sizes of elliptical hosts. Fig. 2 illustrates the dependencies
9The Sersic index of n = 1 represents the exponential profile of S0–Smgalactic discs (Freeman 1970).
MNRAS 490, 718–732 (2019)
Dow
nloaded from https://academ
ic.oup.com/m
nras/article/490/1/718/5570591 by guest on 29 June 2022

722 L. V. Barkhudaryan et al.
Table 1. The best fits from Fig. 2 with results of the Spearman’s rankcorrelation test.
log(RSN[kpc]) = a + b log(R25[kpc])SN subclass NSN a b rs P
all 109 0.16 ± 0.25 0.63 ± 0.17 0.457 6 × 10⁻⁷
normal 66 0.04 ± 0.32 0.70 ± 0.22 0.481 4 × 10⁻⁵
91bg-like 41 0.53 ± 0.44 0.39 ± 0.30 0.316 0.044
log(RSN[kpc]) = a + b log(Re[kpc])
all 109 0.59 ± 0.13 0.57 ± 0.14 0.364 10−4
normal 66 0.49 ± 0.17 0.65 ± 0.19 0.414 5 × 10⁻⁴
91bg-like 41 0.84 ± 0.23 0.30 ± 0.28 0.162 0.313
Note. Spearman’s coefficient rs is a non-parametric measure of rankcorrelation (rs ∈ [ − 1; 1]), it assesses how well the relationship betweentwo variables can be described using a monotonic function. The statisticallysignificant correlations (P-values ≤ 0.05) are highlighted in bold.
of the RSN on R25 and RSN on Re of host galaxies in kpc. The bestfits from Fig. 2 and results of the Spearman’s rank correlation testfor RSN versus R25 and for RSN versus Re (regardless of log orlinear scales) are presented in Table 1. The Spearman’s rank testindicates significant positive trends (rs > 0) between the RSN andR25 for all, normal, and 91bg-like SNe, as well as between theRSN and Re for all and normal SNe Ia. Only for 91bg-like SNein the latter case, the trend is positive again but not statisticallysignificant. In the remainder of this study, we use only normalizedprojected galactocentric radii of Type Ia SNe, i.e. RSN = RSN/R25
and RSN = RSN/Re.In addition, we measured the integrated g-band flux of the
concentric elliptical aperture, which crosses the position of an SN,with the same elongation and PA as the host galaxy aperture. We thennormalized this flux to the total flux contained within an ellipticalaperture, retaining the same elongation and PA, out to distanceswhere the host galaxy flux is consistent with the sky backgroundvalues. This fractional radial g-band flux is commonly referred asFrg and can have values between 0 and 1, where a value of 0 meansthat an SN explodes at the centre of its host, while a value of 1 meansthat the SN explodes at distances where no significant galaxy fluxis detected, i.e. at the edge of the galaxy. As will be presented inSection 3.3, the distribution of Frg values allows to compare theradial distribution of SNe Ia with respect to that of the g-bandlight of host galaxies, irrespective of their different elongations andSersic indices (elliptical galaxies can have n ≈ 2–6 in the g-band,see e.g. Nair & Abraham 2010; Vika et al. 2013). Note that 15 SNe,which are located far outside the elliptical apertures where fluxesare consistent with the sky background values, are removed fromthe Frg analysis in Section 3.3.10 For a complete description of theadopted methodology of Frg measurement, the reader is referred toJames & Anderson (2006) and Anderson & James (2009).
The full data base of 109 individual SNe Ia (SN designation,subclass, source of the subclass, offset from host galaxy nucleus, andfractional radial g-band flux) and their 104 elliptical hosts (galaxySDSS designation, distance, a/b, PA, Re, corrected D25 and u-, g-,r-, i-, z-band absolute magnitudes) is available in the online version(Supporting Information) of this article.
10Their inclusion would artificially increase the number of SNe Ia in thefractional radial flux distribution at Frg = 1 (see Section 3.3).
Table 2. Comparison of the projected and normalized distributions of thesubclasses of Type Ia SNe along major (U) and minor (V) axes of ellipticalhost galaxies.
SN subclass NSN Subsample 1 versus Subsample 2 PKS PAD
〈|U|/R25〉 〈|V|/R25〉all 109 0.31 ± 0.03 versus 0.26 ± 0.03 0.141 0.052normal 66 0.27 ± 0.03 versus 0.27 ± 0.05 0.438 0.25091bg-like 41 0.37 ± 0.06 versus 0.26 ± 0.05 0.279 0.143
〈|U|/Re〉 〈|V|/Re〉all 109 1.31 ± 0.13 versus 1.13 ± 0.15 0.331 0.099normal 66 1.09 ± 0.14 versus 1.10 ± 0.21 0.721 0.35291bg-like 41 1.68 ± 0.27 versus 1.21 ± 0.23 0.420 0.210
Note. The PKS and PAD are the probabilities from two-sample KS and ADtests, respectively, that the two distributions being compared (with respectivemean values) are drawn from the same parent distribution. To calculate thePKS and PAD, we used the calibrations by Massey (1951) and Pettitt (1976),respectively.
3 R ESULTS
With the aim of finding possible links between the properties of SNprogenitors and host stellar populations of elliptical galaxies, wenow study the distributions of projected and normalized galactocen-tric distances and fractional radial fluxes of the subclasses of TypeIa SNe (normal and 91bg-like events). In this section, we also studythe possible differences of global properties (absolute magnitudes,colour, R25, and Re) and estimates of the physical parameters (stellarmass, metallicity, and age) of the stellar population of ellipticalgalaxies in which the different subclasses of SNe Ia are discovered.
3.1 Directional (major versus minor axes) distributions ofSNe Ia in elliptical host galaxies
Because the elliptical host galaxies of Type Ia SNe have differentelongations (noted in Section 2), it is possible that the distributionsof projected galactocentric distances of SNe along major (U) andminor (V) axes, normalized to R25 or Re, would be different.Obviously, the projected U and V galactocentric distances (in arcsec)of an SN are
U = �α sin PA + �δ cos PA ,
V = �α cos PA − �δ sin PA .
Here, as already noted, �α and �δ are offsets of the SN in equatorialsystem, and PA is position angle of the major axis of the ellipticalhost galaxy.
In the mentioned context, using the two-sample KS and ADtests, we compare the distributions of |U|/R25 versus |V|/R25, aswell as the distributions of |U|/Re versus |V|/Re for all, normal,and 91bg-like SNe. Here, the absolute values of U and V are usedto increase the statistical power of the tests. The values of PKS
and PAD in Table 2 show that the distributions of projected andnormalized galactocentric distances of SNe along major and minoraxes are consistent between each other. Only the PAD values forthe entire sample of SNe Ia are close to the rejection threshold of0.05, however when we split the sample between normal and 91bg-like events, both the P-values of KS and AD tests become clearlyabove the threshold. Therefore, the different elongations of ellipticalhost galaxies in our sample have negligible impact, if any, on thesky plane projection of the spherical 3D distribution of SNe Ia.
MNRAS 490, 718–732 (2019)
Dow
nloaded from https://academ
ic.oup.com/m
nras/article/490/1/718/5570591 by guest on 29 June 2022

Supernovae and their host galaxies – VI. 723
Figure 3. Distributions of |U|/R25 (green solid) and |V|/R25 (green dashedand filled) values for normal SNe Ia. The inset presents the correspondingcumulative distributions.
For illustration, in Fig. 3 we show the histograms and cumulativedistributions of |U|/R25 and |V|/R25 for normal SNe Ia. Comparisonof the same distributions for 91bg-like SNe looks similar (alsofor the cases with Re normalization). Fig. 4 shows the projecteddistributions of the subclasses of Type Ia SNe with R25 and Re
normalizations.
3.2 The radial distributions of SNe Ia in ellipticals
As already mentioned above, the light profiles of elliptical galaxiesare characterized with a continuous distribution according to theSersic law with mean index n ≈ 4, when considering the familiesof ellipticals from dwarfs to giants (for the g-band see e.g. Nair &Abraham 2010; Vika et al. 2013). In addition, Forster & Schawinski(2008) have already shown that the projected surface densitydistribution of Type Ia SNe in morphologically selected early-typehost galaxies is consistent with the de Vaucouleurs profile (n = 4)in the 0.2 < RSN/Re < 4 radial range (see also Tsvetkov et al. 2004;Dilday et al. 2010). However, in the literature a comprehensiveanalysis of the surface density distributions of normal and 91bg-like SNe in well-defined elliptical host galaxies with differentradius normalizations has not yet been performed and, as alreadymentioned, is one of the main goals of this study.
Using maximum likelihood estimation (MLE) method, we fit thedistribution of projected and R25-normalized galactocentric radii ofType Ia SNe (RSN = RSN/R25) with the surface density model ofSersic profile with n = 4. If the surface density (�) of SNe Ia isdescribed by a Sersic function of RSN (see equation 1), then theprobability that an SN is observed at RSN radius, i.e. probabilitydensity function (PDF), is
p(RSN|RSNe ) = RSN �(RSN|RSN
e )∫ ∞0 RSN �(RSN|RSN
e ) dRSN
, (2)
where RSNe = RSN
e /R25 is normalized effective radius of SN distri-bution. The likelihood of the set of {RSN i} is
L(RSNe ) = ∏NSN
i=1 p(RSN i |RSNe ) , (3)
and thus maximizing ln(L) we get the effective radii of SNdistributions for the subclasses of Type Ia SNe.
At the same time, to check whether the distributions of SNe Iafollow the best-fitting de Vaucouleurs profiles, we perform one-
sample KS and AD tests on the cumulative distributions of theprojected and normalized galactocentric distances of SNe. Ingeneral, the cumulative distribution function (CDF) of Sersic modelcan be expressed as the integral of its PDF (see equation 2) asfollows:
E(RSN) =∫
˜RSN
−∞p(t |RSN
e ) dt
= 1 − �(
2n, bn
( RSN
RSNe
) 1n)/
�(
2n)
, (4)
where
�(z) = ∫ ∞0 t z−1e−tdt
and
�(a, z) = ∫ ∞z
ta−1e−tdt
are the complete and upper incomplete gamma functions, respec-tively.
For the Re normalization, in the above mentioned formulae (equa-tions 2–4) we simply replace RSN with RSN = RSN/Re and thereforeRSN
e with RSNe = RSN
e /Re. The estimated RSNe and RSN
e effectiveradii, and the PKS and PAD probabilities that the distributions ofSNe Ia are drawn from the best-fitting de Vaucouleurs surfacedensity profiles (Sersic model with n = 4) are listed in Table 3.
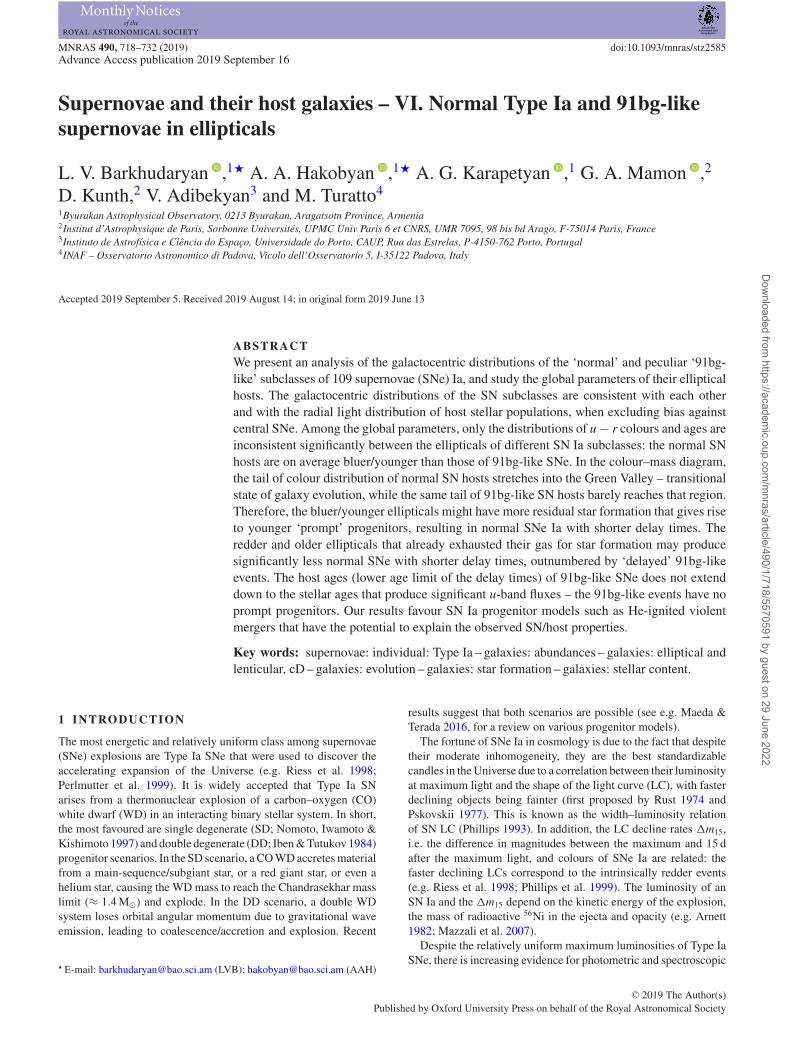
From the P-values in Table 3, we see that the global (RSN ≥ 0 andRSN ≥ 0) surface density distributions of Type Ia SNe in ellipticalhost galaxies are not consistent with the de Vaucouleurs profiles.When splitting the sample between the subclasses of SNe Ia, wesee that the significant inconsistency exists for the RSN distributionof 91bg-like events, and the marginal inconsistency takes place forthe RSN distribution of the same SNe (Table 3). The left-hand panelof Fig. 5 illustrates that the main inconsistency is likely attributedto the slower growth or decline (in case of 91bg-like events) of theSN surface density at the central region of hosts with the radius ofabout one tenth of the optical radius of galaxies (grey shaded regionin the figure). In our sample, the mean Re/R25 is about four, and asimilar behaviour of the Re-normalized surface density is seen atthe central 0.4Re region (grey shaded region in the right-hand panelof Fig. 5).
It is important to note that different SN surveys are biased againstthe discovery of SNe near the centres of host galaxies (e.g. Leamanet al. 2011). This happens because central SNe have lower contrastwith respect to the bright and often overexposed background ofelliptical hosts, increasing the difficulty of their detection in a scanof the survey figures (e.g. Hamuy & Pinto 1999). In addition, hostgalaxy internal extinction AV < 0.2 mag exists only within thecentral region, while AV is almost zero outside that region till tothe end of optical radius of an elliptical galaxy (Gonzalez Delgadoet al. 2015). Since 91bg-like events have peak luminosities that are∼2 mag lower than normal SNe Ia (e.g. Taubenberger et al. 2008and references therein), 91bg-like SNe are more strongly affectedby these effects than are normal Type Ia SNe (as seen in Fig. 5).
We now exclude SNe from the central regions of hosts (RSN ≥0.1, RSN ≥ 0.4) and compare the SN distributions with the best-fitting inner-truncated de Vaucouleurs profiles. From the P-valuesin Table 3, we see that all the inconsistencies vanish. In Fig. 5,we show the inner-truncated de Vaucouleurs profiles, extended to
MNRAS 490, 718–732 (2019)
Dow
nloaded from https://academ
ic.oup.com/m
nras/article/490/1/718/5570591 by guest on 29 June 2022

724 L. V. Barkhudaryan et al.
Figure 4. Upper panels: projected and R25-normalized distributions of the different subclasses of Type Ia SNe along major (U) and minor (V) axes of ellipticalhost galaxies. The green triangles, blue crosses, and red circles represent normal, 06gz-like, and 91bg-like SNe, respectively. The quarters of big black circlesare the host galaxy R25 sizes. Bottom panels: same as in upper panels but for Re normalization. The quarter circles now represent Re. In the insets, we showthe same distributions with log axes.
the central regions of host galaxies,11 and the global surface densitydistributions of SNe, enabling to roughly estimate the loss in SNe Iadiscoveries, most expressive for 91bg-like events, compared withtheir expected densities. The mean loss of SNe in the central regions
11For illustrative purpose, in the left-hand panel of Fig. 5 we also present thebest-fitting inner-truncated exponential profile (black thin line, i.e. n = 1 inequation 1). The one-sample KS and AD tests show that the surface densitydistribution of SNe Ia is strongly inconsistent with the global (PKS = 0.050,PAD = 0.005) and inner-truncated (PKS = 0.090 [barely inconsistency],PAD = 0.039) exponential models.
of elliptical galaxies is 22 ± 4 per cent of the expected total numberof Type Ia SNe. This value is in good agreement with the similarestimation of 23 ± 12 per cent in E–S0 galaxies by Cappellaro &Turatto (1997), though a different method and sample were used intheir study. In our sample, the mean central losses of normal and91bg-like SNe are 17 ± 5 and 27 ± 7 per cent, respectively.
In addition, we check the dependence of the described bias, i.e.the central loss of SNe, on the distances of their host galaxies(the Shaw effect; Shaw 1979), splitting the sample between near(≤100 Mpc) and far (>100 Mpc) objects. This separation is doneto have adequate numbers of objects in the subsamples. The
MNRAS 490, 718–732 (2019)
Dow
nloaded from https://academ
ic.oup.com/m
nras/article/490/1/718/5570591 by guest on 29 June 2022
Supernovae and their host galaxies – VI. 725
Table 3. Consistency of the distribution of projected and normalizedgalactocentric distances of SNe Ia with the surface density model of Sersicprofile with n = 4 (de Vaucouleurs profile) in elliptical host galaxies.
SN subclass ˜RSN ≥ NSN ˜RSNe PKS PAD
all 0 109 0.28 ± 0.03 0.008 0.014normal 0 66 0.26 ± 0.04 0.184 0.12991bg-like 0 41 0.31 ± 0.04 0.036 0.041all 0.1 94 0.18 ± 0.02 0.231 0.093normal 0.1 54 0.18 ± 0.02 0.369 0.22291bg-like 0.1 38 0.18 ± 0.04 0.263 0.185
RSN ≥ RSNe
all 0 109 1.15 ± 0.12 0.016 0.034normal 0 66 1.03 ± 0.09 0.176 0.21291bg-like 0 41 1.38 ± 0.15 0.059 0.068all 0.4 92 0.80 ± 0.12 0.132 0.093normal 0.4 52 0.78 ± 0.18 0.144 0.19691bg-like 0.4 38 0.87 ± 0.21 0.514 0.206
Note. The PKS and PAD are the probabilities from one-sample KS and ADtests, respectively, that the distributions of SNe Ia are drawn from the best-fitting de Vaucouleurs surface density profiles with the maximum likelihoodvalues of ˜RSN
e = RSNe /R25 and RSN
e = RSNe /Re (with bootstrapped errors,
repeated 103 times). The PKS and PAD are calculated using the calibrationsby Massey (1951) and D’Agostino & Stephens (1986), respectively. Thestatistically significant deviations from de Vaucouleurs profile (P-values ≤0.05) are highlighted in bold.
surface density distributions of SNe in these distance bins showthe equivalent central losses of SNe. In this sense, it is well knownthat the Shaw effect is important for photographic searches andnegligible for visual/CCD searches (e.g. Howell, Wang & Wheeler2000). Similarly, the Shaw effect is negligible in our sample, in
which ∼94 per cent of SNe Ia are discovered via visual and CCDsearches (see Section 2).
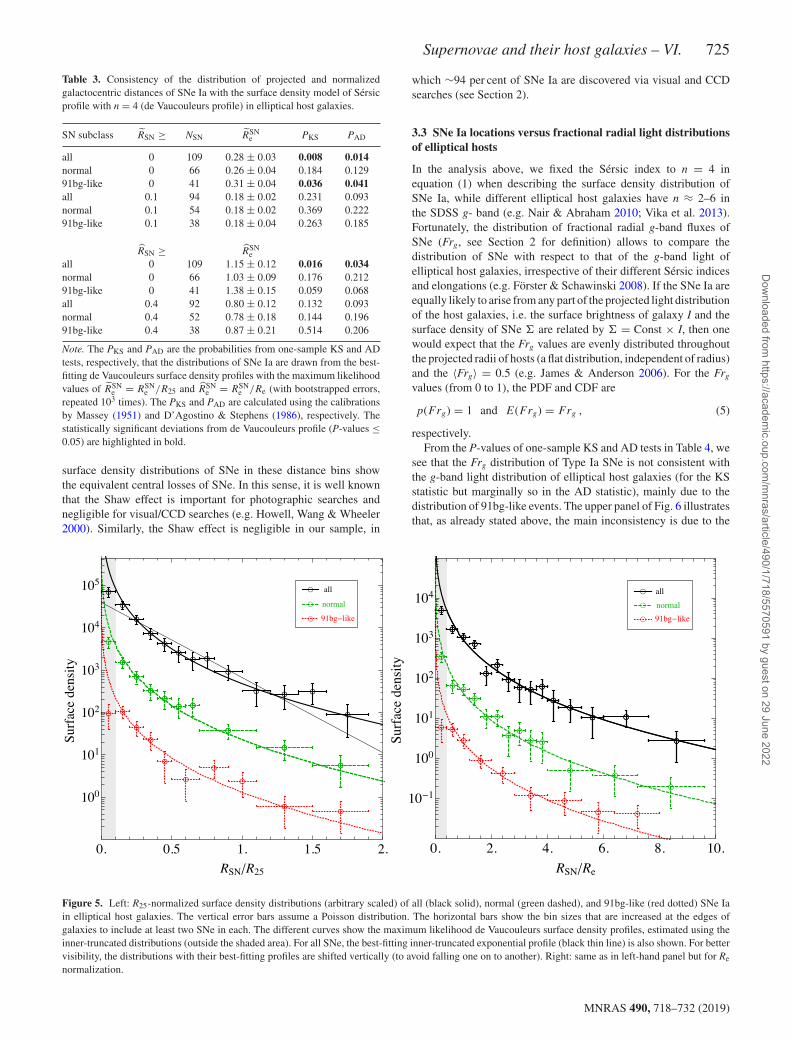
3.3 SNe Ia locations versus fractional radial light distributionsof elliptical hosts
In the analysis above, we fixed the Sersic index to n = 4 inequation (1) when describing the surface density distribution ofSNe Ia, while different elliptical host galaxies have n ≈ 2–6 inthe SDSS g- band (e.g. Nair & Abraham 2010; Vika et al. 2013).Fortunately, the distribution of fractional radial g-band fluxes ofSNe (Frg, see Section 2 for definition) allows to compare thedistribution of SNe with respect to that of the g-band light ofelliptical host galaxies, irrespective of their different Sersic indicesand elongations (e.g. Forster & Schawinski 2008). If the SNe Ia areequally likely to arise from any part of the projected light distributionof the host galaxies, i.e. the surface brightness of galaxy I and thesurface density of SNe � are related by � = Const × I, then onewould expect that the Frg values are evenly distributed throughoutthe projected radii of hosts (a flat distribution, independent of radius)and the 〈Frg〉 = 0.5 (e.g. James & Anderson 2006). For the Frg
values (from 0 to 1), the PDF and CDF are
p(Frg) = 1 and E(Frg) = Frg , (5)
respectively.From the P-values of one-sample KS and AD tests in Table 4, we
see that the Frg distribution of Type Ia SNe is not consistent withthe g-band light distribution of elliptical host galaxies (for the KSstatistic but marginally so in the AD statistic), mainly due to thedistribution of 91bg-like events. The upper panel of Fig. 6 illustratesthat, as already stated above, the main inconsistency is due to the
Figure 5. Left: R25-normalized surface density distributions (arbitrary scaled) of all (black solid), normal (green dashed), and 91bg-like (red dotted) SNe Iain elliptical host galaxies. The vertical error bars assume a Poisson distribution. The horizontal bars show the bin sizes that are increased at the edges ofgalaxies to include at least two SNe in each. The different curves show the maximum likelihood de Vaucouleurs surface density profiles, estimated using theinner-truncated distributions (outside the shaded area). For all SNe, the best-fitting inner-truncated exponential profile (black thin line) is also shown. For bettervisibility, the distributions with their best-fitting profiles are shifted vertically (to avoid falling one on to another). Right: same as in left-hand panel but for Re
normalization.
MNRAS 490, 718–732 (2019)
Dow
nloaded from https://academ
ic.oup.com/m
nras/article/490/1/718/5570591 by guest on 29 June 2022
726 L. V. Barkhudaryan et al.
Table 4. Consistency of the Frg (or inner-truncated F rg) distributions ofSNe Ia with the surface brightness distribution of elliptical host galaxies.
SN subclass (Frg or F rg) NSN PKS PAD
all (Frg) 94 0.021 0.054normal (Frg) 58 0.405 0.43691bg-like (Frg) 34 0.044 0.056all (F rg) 79 0.482 0.404normal (F rg) 46 0.758 0.71991bg-like (F rg) 31 0.286 0.257
Note. The PKS and PAD are the probabilities from one-sample KS and ADtests, respectively, that the distributions of Frg (or inner-truncated F rg)are drawn from the surface brightness distribution of host galaxies. Thestatistically significant deviations (P-values ≤ 0.05) are highlighted in bold.Recall that 15 SNe, which are located far outside the elliptical apertureswhere fluxes are consistent with the sky background values, are removedfrom the fractional radial flux analysis (see Section 2).
selection effect against the discovery of SNe Ia near the centreof the host galaxies (also seen in the right-hand panels of fig. 2in Forster & Schawinski 2008). Therefore, we also use the inner-truncated fractional radial g-band fluxes of SNe (F rg), excludingthe central region of galaxies with one tenth of the optical radius(0.1 R25)
F rg = Frg − f rg
1 − f rg
,
where frg is the fractional flux of 0.1 R25 region. A similar definitionof inner-truncated fractional flux for SNe in elliptical galaxies wasfirst used by Maza & van den Bergh (1976).
Simply replacing Frg with F rg in equations (5) and using one-sample KS and AD tests, we see that the F rg distributions of allsubclasses of Type Ia SNe are now consistent with the g-band lightdistribution of hosts, with mean values of F rg near 0.5 as predicted(see Table 4 and the bottom panel of Fig. 6).
We now compare, in Table 5, the distributions of RSN, RSN, Frg,and F rg values between the subsamples of normal and 91bg-likeSNe, using the two-sample KS and AD tests. The mean values of thedistributions are also listed. With the tests, we see no statisticallysignificant differences between the global radial distributions ofthe SN subclasses. Similar results hold true for the inner-truncateddistributions of SNe Ia.
3.4 The global properties of SNe Ia elliptical host galaxies
In the SDSS DR15, different estimates of the parameters ofgalaxies (e.g. stellar mass, metallicity, and age of stellar population)encompass calculations based on various stellar population models(e.g. Evolutionary Population Synthesis, Maraston 2005; PrincipalComponent Analysis-based model, Chen et al. 2012; FlexibleStellar Population Synthesis, Conroy, Gunn & White 2009), anddifferent assumptions about galaxy extinction and star formationhistories.12 However, from 109 SNe Ia elliptical hosts of our study,only 43 SNe (29 normal, 13 91bg-like, and one 06gz-like) haveavailable SDSS spectra of hosts, thus reliable estimates of mass,age, and metallicity. Therefore, instead of using them we prefer toestimate the stellar masses (M∗) of all our elliptical hosts, using theempirical relation of Taylor et al. (2011) between log (M∗/M�), g
12For more detailed information with corresponding references, the readeris referred to https://www.sdss.org/dr15/spectro/galaxy/.
Figure 6. Upper panel: cumulative Frg distributions of SNe Ia (all – blacksolid, normal – green dashed, and 91bg-like – red dotted) with respect tothe g-band surface brightness distribution of their elliptical host galaxies(black thin diagonal line). The mean values of the distributions are shownby arrows. Bottom panel: same as in upper panel but for the inner-truncatedF rg distributions.
− i colour, and i-band absolute magnitude (Mi) as determined frommore than 105 galaxies with redshifts z < 0.65
log( M∗
M�
)= 1.15 + 0.70(g − i) − 0.4Mi , (6)
where M∗ has solar mass units. According to Taylor et al., this re-lation provides an estimate of the stellar mass-to-light ratio (M∗/Li)to a 1σ accuracy of ∼0.1 dex. In addition, to estimate averagehost galaxy stellar metallicities, we use the Gallazzi et al. (2006)correlation between stellar mass of E–S0 galaxy and log (Z∗/Z�) asdetermined from about 26 000 SDSS galaxies (see also Scott et al.
MNRAS 490, 718–732 (2019)
Dow
nloaded from https://academ
ic.oup.com/m
nras/article/490/1/718/5570591 by guest on 29 June 2022

Supernovae and their host galaxies – VI. 727
Table 5. Comparison of the distributions of ˜RSN, RSN, Frg, and F rg valuesbetween the subsamples of normal and 91bg-like SNe.
Parameter normal versus 91bg-like PKS PAD
NSN 〈Parameter〉 NSN 〈Parameter〉˜RSN ≥ 0 66 0.43 ± 0.05 versus 41 0.50 ± 0.07 0.456 0.357˜RSN ≥ 0.1 54 0.52 ± 0.06 versus 38 0.53 ± 0.07 0.700 0.804RSN ≥ 0 66 1.77 ± 0.23 versus 41 2.25 ± 0.32 0.502 0.232RSN ≥ 0.4 52 2.18 ± 0.26 versus 38 2.41 ± 0.33 0.852 0.820Frg 58 0.52 ± 0.03 versus 34 0.57 ± 0.04 0.606 0.429F rg 46 0.49 ± 0.04 versus 31 0.48 ± 0.05 0.677 0.383
Note. The PKS and PAD are the probabilities from two-sample KS and ADtests, respectively, that the two distributions being compared (with respectivemean values) are drawn from the same parent distribution. For the globaldistribution of all 109 SNe Ia, the mean values of ˜RSN = 0.45 ± 0.04 andRSN = 1.94 ± 0.18. For 94 SNe Ia, the mean value of Frg = 0.54 ± 0.03.Recall that 15 SNe, which are located far outside the elliptical apertureswhere fluxes are consistent with the sky background values, are removedfrom the fractional radial flux analysis (see Section 2).
Figure 7. Photometric points (in the SDSS five bands, red asterisks) of SN2018zs host elliptical galaxy with the best SED, all in the rest frame. Theinset shows the curve of the dependence of the model rms deviations on agefor the galaxy, with the best age of 11 Gyr (minimum of the curve is shownby the vertical dashed line).
2017, for early-type/high-mass galaxies)
log(Z∗
Z�
)= −1.757 + 0.168 log
( M∗M�
), (7)
where Z∗ has solar metallicity units, with a scatter of ∼0.1 dex.It should be noted that we use mass measurements coupled to a(monotonic) formula to convert it to host metallicity, which adds nooriginal information to the statistical analysis, however, this givesa chance to qualitatively discuss our results in term of metallicitiesof SNe Ia hosts (see Section 4).
Finally, following the procedure outlined in Verkhodanov et al.(2000), we use the fixed redshifts of SN hosts to fit the PEGASE.2(Fioc & Rocca-Volmerange 1997, 1999) elliptical galaxy models toour u-, g-, r-, i-, and z-band photometry to determine the luminosity-weighted ages of hosts.13 In short, the measured five photometric
13The luminosity-weighted ages of our 104 elliptical host galaxies areavailable in the online version (Supporting Information) of this article.
Table 6. Comparison of the distributions of absolute magnitudes, colours,sizes, elongations, stellar masses, average metallicities, and luminosity-weighted ages between the subsamples of host galaxies of normal and 91bg-like SNe.
Parameter normal versus 91bg-like PKS PAD
〈Parameter〉 ± σ 〈Parameter〉 ± σ
˜RSN ≥ 0 (66 versus 41 hosts)
Mu (mag) − 19.6 ± 1.0 versus − 19.8 ± 0.9 0.218 0.276Mg (mag) − 21.2 ± 1.1 versus − 21.5 ± 0.9 0.112 0.137Mr (mag) − 22.0 ± 1.1 versus − 22.3 ± 0.9 0.113 0.134Mi (mag) − 22.4 ± 1.1 versus − 22.7 ± 0.9 0.188 0.153Mz (mag) − 22.6 ± 1.1 versus − 22.9 ± 0.9 0.260 0.156u − r (mag) 2.4 ± 0.1 versus 2.5 ± 0.1 0.013 0.007g − i (mag) 1.2 ± 0.1 versus 1.2 ± 0.1 0.101 0.255r − z (mag) 0.7 ± 0.05 versus 0.7 ± 0.04 0.107 0.179R25 (kpc) 23.0 ± 12.6 versus 25.6 ± 11.3 0.096 0.142Re (kpc) 6.0 ± 3.8 versus 6.0 ± 3.0 0.296 0.345a/b 1.3 ± 0.2 versus 1.3 ± 0.2 0.766 0.729log (M∗/M�) 11.1+0.3
−1.3 versus 11.2+0.2−0.6 0.107 0.175
log (Z∗/Z�) 0.09+0.07−0.08 versus 0.11+0.06
−0.07 0.107 0.175age (Gyr) 11.7+2.3
−2.8 versus 12.8+1.2−1.6 0.017 0.012
˜RSN ≥ 0.1 (54 versus 38 hosts)
Mu (mag) − 19.6 ± 1.0 versus − 19.8 ± 0.8 0.286 0.416Mg (mag) − 21.2 ± 1.1 versus − 21.4 ± 0.8 0.309 0.275Mr (mag) − 22.0 ± 1.1 versus − 22.2 ± 0.9 0.306 0.252Mi (mag) − 22.4 ± 1.1 versus − 22.6 ± 0.9 0.365 0.325Mz (mag) − 22.7 ± 1.1 versus − 22.9 ± 0.9 0.365 0.314u − r (mag) 2.4 ± 0.1 versus 2.5 ± 0.1 0.047 0.018g − i (mag) 1.2 ± 0.1 versus 1.2 ± 0.1 0.480 0.721r − z (mag) 0.7 ± 0.05 versus 0.7 ± 0.04 0.274 0.462R25 (kpc) 23.3 ± 12.7 versus 24.2 ± 9.9 0.389 0.399Re (kpc) 6.1 ± 4.0 versus 5.5 ± 2.3 0.450 0.390a/b 1.2 ± 0.2 versus 1.3 ± 0.2 0.706 0.559log (M∗/M�) 11.2+0.3
−1.2 versus 11.2+0.2−0.5 0.224 0.385
log (Z∗/Z�) 0.09+0.07−0.08 versus 0.10+0.06
−0.06 0.224 0.385age (Gyr) 11.9+2.1
−2.7 versus 12.7+1.3−1.7 0.025 0.032
Note. The PKS and PAD are the probabilities from two-sample KS andAD tests, respectively, that the two distributions being compared (withrespective mean values and standard deviations) are drawn from the sameparent distribution. The statistically significant differences (P-values ≤ 0.05)between the distributions are highlighted in bold.
points of a host galaxy in the SDSS bands with fixed redshiftare used to select the best location of the points on the spectralenergy distribution (SED) templates. Such a location can be foundby shifting the points lengthwise and transverse the SED templateat which the sum of the squares of the discrepancies is a minimum.From the PEGASE.2 model (Fioc & Rocca-Volmerange 1997, 1999),the procedure uses already computed collection of synthetic SEDtemplates for different ages (up to 19 Gyr) of elliptical galaxies.Fig. 7 presents an example of SN host galaxy photometric points(in the SDSS five bands) with the best SED, all in the rest frame.For more detailed information on the SED fitting procedure withfilter smoothing option, the reader is referred to http://sed.sao.ru/.
To reveal possible differences in global properties of SNe Iaelliptical hosts, in Table 6, using the two-sample KS and ADtests, we compare absolute magnitudes, colours, sizes, elongations,stellar masses, average metallicities, and luminosity-weighted agesbetween the subsamples of host galaxies of normal and 91bg-likeSNe. The table shows that the distributions of absolute magnitudes,g − i and r − z colours (red part of the SEDs), sizes, elongations,stellar masses, and average metallicities are not significantly
MNRAS 490, 718–732 (2019)
Dow
nloaded from https://academ
ic.oup.com/m
nras/article/490/1/718/5570591 by guest on 29 June 2022

728 L. V. Barkhudaryan et al.
Figure 8. The u − r colour–mass diagram for 109 SNe Ia elliptical host galaxies. Green triangles, red circles, and blue crosses show normal, 91bg-like, and06gz-like SNe hosts, respectively. The region between two solid lines indicates the Green Valley (see the text for more details). The vertical and horizontalerror bars, in the bottom right corner, show the characteristic errors in the colour and mass estimations, respectively. For normal (green dashed and filled) and91bg-like (red dotted) SNe hosts, the right and upper panels represent separately the histograms of the colours and masses, respectively. The mean values ofthe distributions are shown by arrows.
different between host galaxies of normal and 91bg-like SNe. Onthe other hand, the distributions of u − r colours (blue part of theSEDs) and luminosity-weighted ages of the hosts are significantlyinconsistent between the subclasses of SNe Ia. In the histograms ofFig. 8, we show the distributions of host galaxy stellar masses andu − r colours. The cumulative distributions of luminosity-weightedages of the elliptical hosts are presented in Fig. 9. It is clear that,despite their comparable stellar masses, the elliptical host galaxiesof normal SNe Ia are on average bluer and younger than those of91bg-like SNe.
In Table 6, we also check the impact of the described bias inSection 3.2, i.e. the stronger central loss of 91bg-like SNe, on thecomparison of the global properties of ellipticals by excludingthe host galaxies with RSN < 0.1. We obtain nearly identicalresults showing that the central bias has negligible impact on thecomparison of the elliptical host galaxies in Table 6.
4 D ISCUSSION AND SUMMARY
In this section, we discuss all the results obtained above and givesummary within an evolutionary (interacting) scenario of SNe Iaelliptical host galaxies that can explain the similarity of the spatialdistributions of normal and 91bg-like SNe in hosts and at the same
Figure 9. Cumulative distributions of luminosity-weighted ages of ellipti-cal host galaxies of normal (green dashed) and 91bg-like (red dotted) SNe.The mean values of the distributions are shown by arrows.
time the differences of some global properties of elliptical hostssuch as the u − r colours and the ages of the stellar population.
In Section 3.2, we have shown that the distributions of projectedgalactocentric radii (with different normalizations) of normal and
MNRAS 490, 718–732 (2019)
Dow
nloaded from https://academ
ic.oup.com/m
nras/article/490/1/718/5570591 by guest on 29 June 2022

Supernovae and their host galaxies – VI. 729
91bg-like SNe in elliptical galaxies follow the de Vaucouleursmodel, except in the central region of ellipticals where the differentSN surveys are biased against the discovery of the events (Table 3and Fig. 5). These results are in agreement with a more generalizedresult of Forster & Schawinski (2008), who showed that theprojected surface density distribution of Type Ia SNe (withoutseparating the subclasses) in morphologically selected early-typehost galaxies is consistent with the de Vaucouleurs profile (see alsoTsvetkov et al. 2004; Dilday et al. 2010). Even without specifyingthe profile shape and excluding the bias against central SNe, theradial distributions of SN Ia subclasses are consistent with the radiallight distribution of stellar populations of elliptical hosts in theSDSS g-band (Table 4 and Fig. 6). We have not seen any significantdifferences between the radial distributions of normal and 91bg-likeSNe (Table 5).
These results are in agreement with those of Gallagher et al.(2005), who studied the distribution of 57 local Type Ia SNe LCdecline rates (�m15) in the B-band versus projected distances (inkpc) from the centres of spiral and E–S0 host galaxies. Despite theirsmaller statistics of E–S0 galaxies, they found that the �m15 valuesare distributed evenly with projected galactocentric radii, showingno preference to the centre of host galaxies for slowly declining(normal SNe Ia) or faster declining (91bg-like) SNe (see also Ivanovet al. 2000, for projected and normalized galactocentric radii). Usinga larger SN Ia sample at redshifts below 0.25 and output parametersfrom two LC fitters, MLCS2k2 (Jha, Riess & Kirshner 2007) andSALT2 (Guy et al. 2007), Galbany et al. (2012) also studied the de-pendencies between SN properties and the projected galactocentricradii. For 64 SNe Ia in elliptical hosts, with determined morphologybased on the concentration indices and Sersic profiles, the authorsfound some indications that SNe tend to have faster decliningLCs if they explode at larger galactocentric radii. However, thistrend is visible when the LC parameters from MLCS2k2 wereused, in contrast to the homologous parameters from SALT2. Inaddition, Galbany et al. noted that their finding might be due tothe possible selection effects and explained by the difficulty indetecting faster declining/fainter SNe Ia near the galaxy centre,which we demonstrated in Section 3.2, based on the surface densitydistributions of normal and 91bg-like events in elliptical hosts.
In Section 3.4, we have shown that the distributions of abso-lute magnitudes, stellar masses, and average metallicities are notsignificantly different between host galaxies of normal and 91bg-like SNe (Table 6). Similar results were also obtained by Gallagheret al. (2005), who found no correlation between the LC declinerates of SNe Ia and absolute B-band magnitudes (a sufficient tracerof galactic mass) of their E–S0 hosts. Gallagher et al. (2008) alsostudied optical absorption-line spectra of 29 early-type (mostly E–S0) host galaxies of SNe Ia up to about 200 Mpc and found a mildcorrelation, if any, between host global metallicity and SN Ia peakluminosity.
Indeed, the variety of metallicities of the main-sequence stars thatbecome WDs could theoretically affect the mass of 56Ni synthesizedin SNe Ia (Timmes, Brown & Truran 2003), and cause a varietyin the properties of SNe Ia (e.g. in luminosities and/or declinerates). These authors hypothesized that less luminous SNe Ia arisefrom high-metallicity progenitors that produce less 56Ni. However,Howell et al. (2009) noted that the effect is dominant at metallicitiessignificantly above solar, whereas early-type hosts of SNe Ia haveonly moderately above solar metallicities (with no detectable starformation). In this respect, our elliptical host galaxies also spanmoderately above solar metallicities (see Table 6), mostly within 0� log (Z∗/Z�) � 0.2 range, and therefore the metallicity effect in
our sample might be sufficient to vary the optical peak brightness ofSN Ia by less than 0.2 mag (Timmes et al. 2003), but not enough forthe differences between peak magnitudes of normal and 91bg-likeSNe (as already mentioned, the latter have peak luminosities thatare 2 ± 0.5 mag lower in optical bands than do normal SNe, seeTaubenberger et al. 2008).
On the other hand, the radial metallicity gradient in ellipticalgalaxies (e.g. Henry & Worthey 1999) might be a useful tool to probethe differences between the properties of SN Ia subclasses. However,Gonzalez Delgado et al. (2015) recently studied nearby galaxies,including 41 ellipticals, with redshifts < 0.03, using the precisedata of integral field spectroscopy, and found that the average radialmetallicity profile of elliptical galaxies (with negative gradient)declines only moderately from 0.2 dex above solar to solar from thegalactic centre up to 3Re, respectively. Therefore, most probablythis small metallicity variation does not allow (according to Timmeset al. 2003) to see the differences between the distributions of normaland 91bg-like SNe along the radius of their elliptical hosts (Table 5).Our results confirm that the masses as well as global and radialmetallicity distributions of elliptical hosts are not decisive factorsof the nature of normal and 91bg-like SN populations (see alsodiscussions by Ivanov et al. 2000; Gallagher et al. 2005, 2008).
At the same time, in Section 3.4, we have shown that thedistributions of u − r colours and luminosity-weighted ages areinconsistent significantly between the elliptical host galaxies ofdifferent SN Ia subclasses (Table 6): the hosts of normal SNe Iaare on average bluer (the right histograms in Fig. 8) and younger(Fig. 9) than those of 91bg-like SNe. These results are in ex-cellent agreement with those of Gallagher et al. (2008), whofound a strong correlation between SN peak luminosities andthe luminosity-weighted ages of dominant population of E–S0hosts. They suggested that SNe Ia in galaxies with a characteristicage greater than several Gyr are on average ∼1 mag fainter atthe peak in V-band than those in early-type hosts with youngerpopulations (i.e. a fairly large number of subluminous/91bg-likeSNe are discovered in older hosts). In addition, Gallagher et al.(2008) noted about the difficulty to distinguish whether this effectis a smooth transition with age or the result of two distinct SN Iapopulations. Most recently, Panther et al. (2019) analysed integralfield observations of the apparent/underlying explosion sites of 11spectroscopically identified 91bg-like SNe (redshifts ≤ 0.04) inhosts with different morphologies (including six E–S0 galaxies)and found that the majority of the stellar populations that hostthese events are dominated by old stars with a lack of evidence forrecent star formation. Panther et al. concluded that the 91bg-likeSN progenitors are likely to have delay time distribution weightedtowards long delay times (>6 Gyr, see also Crocker et al. 2017),much longer than the typical delay times of normal SNe Ia in star-forming environments, whose delay times peak between severalhundred Myr and ∼1 Gyr (e.g. Childress et al. 2014; Maoz et al.2014). These results are in good agreement with our findings inTable 6 and Fig. 9.
It is important to note that the global ages of elliptical galaxies arenot significantly different, on average, from local ones at any radii,i.e. there is no clear age gradient in ellipticals, being only mildlynegative up to Re and flat beyond that radius (e.g. Gonzalez Delgadoet al. 2015). For this reason, we see no difference between the radialdistributions of the subclasses of SNe Ia (Table 5), meanwhile seeingthe clear differences of the global ages of normal and 91bg-like hosts(Table 6 and Fig. 9). Thus, our results support the earlier suggestions(e.g. Ivanov et al. 2000; Gallagher et al. 2005, 2008; Kang et al.2016) that the age of SN Ia progenitor populations is a more
MNRAS 490, 718–732 (2019)
Dow
nloaded from https://academ
ic.oup.com/m
nras/article/490/1/718/5570591 by guest on 29 June 2022

730 L. V. Barkhudaryan et al.
important factor than metallicity or mass of elliptical host galaxiesin determining the properties of normal and 91bg-like events.
We now interpret and summarize our results within an evolution-ary (interacting) scenario of SNe Ia elliptical host galaxies. In Fig. 8,we show u − r colour–mass diagram of elliptical host galaxies (theright-hand and upper panels represent separately the histograms ofthe colours and masses, respectively). In Fig. 8, the region betweentwo solid lines indicates the location of the Green Valley, i.e. theregion between blue star-forming galaxies and the red sequence ofquiescent E–S0 galaxies (e.g. Mendez et al. 2011; Schawinski et al.2014). For galaxies with elliptical morphology, this is a transitionalstate through which blue galaxies evolve into the red sequence viamajor merging processes with morphological transformation fromdisc to spheroidal shape (e.g. Schawinski et al. 2010; McIntosh et al.2014), and/or a state of galaxies demonstrating some residual starformation via minor merging processes with no global changes inspheroidal structure (e.g. Kaviraj et al. 2009).
It should be noted that we use the modification of the GreenValley defined by Schawinski et al. (2014). These authors used theSDSS modelMag values14 of about 9000 early- and about 17 000late-type galaxies with redshifts 0.02 < z < 0.05, while we use themagnitudes of host galaxies based on the g-band 25 mag arcsec−2
elliptical apertures (see Section 2). The comparison of SDSS DR15modelMag measurements of our elliptical host galaxies withthose obtained in Section 2, and the best fit of our u − r versuslog (M∗/M�) bring a negative shift and a small change in slope forthe modification of the Green Valley15 in comparison with that inSchawinski et al. (2014).
In Fig. 8, we see that the tail of the colour distribution of normalSN hosts stretches well into the Green Valley, while the same tailof 91bg-like SN hosts barely reaches the Green Valley border,and only at high stellar masses. To quantify this difference, wecompare the distributions of colour residuals of elliptical hosts ofthe SN subclasses relative to the upper border of our Green Valley(see Fig. 10). The two-sample KS and AD tests show that thedistributions are significantly different (PKS = 0.049, PAD = 0.026).Therefore, the bluer and younger elliptical hosts of normal SNe Iashould have more residual star formation (e.g. Kaviraj et al. 2009;Schawinski et al. 2014) that gives rise to younger SN Ia progenitors,resulting in normal SNe with shorter delay times (e.g. Childress,Wolf & Zahid 2014; Maoz, Mannucci & Nelemans 2014; Uddin,Mould & Wang 2017). Interestingly, the results of Gomes et al.(2016a,b) reveal that in such galaxies the residual star formation iswell mixed radially and distributed within entire stellar population.
As was recalled in the Introduction, the rate of SNe Ia canbe represented as a linear combination of prompt and delayedcomponents (e.g. Scannapieco & Bildsten 2005). The promptcomponent is dependent on the rate of recent star formation, andthe delayed component is dependent on the galaxy total stellar mass(e.g. Mannucci et al. 2005; Hakobyan et al. 2011; Li et al. 2011b). Inthis context, the normal SNe Ia with shorter delay times correspondto the prompt component. The bluer and younger ellipticals (withresidual star formation) can also produce 91bg-like events with
14ThemodelMag values are first calculated using the best-fitting parametersin the r-band, and then applied these parameters to all other SDSS bands,therefore, the light is measured consistently through the same aperture in allbands.15The best fit is u − r = 0.721 + 0.155 log(M∗/M�) for normal and 91bg-like SNe hosts. The upper and bottom borders of our Green Valley in Fig. 8are simply negative shifts of the best fit in 0.1 and 0.3 mag, respectively.
Figure 10. Distributions of colour residuals of elliptical hosts of normal(green dashed and filled) and 91bg-like (red dotted) SNe relative to the upperborder of our Green Valley. The mean values of the distributions are shownby arrows.
lower rate (e.g. Gallagher et al. 2008), because of long delay timesof these SNe (e.g. Panther et al. 2019), i.e. a delayed componentof SN Ia explosions (e.g. Scannapieco & Bildsten 2005; Gonzalez-Gaitan et al. 2011). However, the distribution of host ages (lowerage limit of the delay times) of 91bg-like SNe does not extenddown to the stellar ages that produce a significant excess of u −r colour (i.e. u-band flux, see Figs 8 and 9) – younger stars inelliptical hosts do not produce 91bg-like SNe, i.e. the 91bg-likeevents have no prompt component. The redder and older ellipticalhosts that already exhausted nearly all star formation budget duringthe evolution (e.g. Schawinski et al. 2014) may produce significantlyless normal SNe Ia with shorter delay times, outnumbered by 91bg-like SNe with long delay times.
Finally, we would like to note that our results favour SN Ia pro-genitor models such as helium-ignited violent mergers as a unifiedmodel for normal (CO WD primary with CO WD companion) and91bg-like (CO WD primary with He WD companion) SNe (e.g.Pakmor et al. 2013; Crocker et al. 2017) that have the potential toexplain the different luminosities, delay times, and relative ratesof the SN subclasses (see also Gilfanov & Bogdan 2010; Lipunov,Panchenko & Pruzhinskaya 2011, for discussions of binary WDsmergers in elliptical galaxies). In particular, the models predictshorter delay times for normal SNe Ia in agreement with our findingthat normal SNe occur in younger stellar population of ellipticalhosts. Moreover, the model prediction of very long delay timesfor 91bg-like SNe (� several Gyr, Crocker et al. 2017) is in goodqualitative agreement with our estimation of older ages of hostgalaxies of these events.
In the years of the surveys by robotic telescopes on differentsites on the globe (e.g. All Sky Automated Survey for SuperNovae;Kochanek et al. 2017) and of the forthcoming Large Synoptic SurveyTelescope (Tyson 2002), thousands of relatively nearby SNe Ia withspectroscopic confirmations are expected to be discovered that willprovide larger and better defined samples of these transient events.We will then be able to place tighter constraints on the evolutionaryscenarios of host galaxies and on the photometric and spectroscopicproperties of Type Ia SNe with different progenitor models.
AC K N OW L E D G E M E N T S
We would like to thank the referee, Michael Childress, for ex-cellent comments that improved the clarity of this paper. LVB,
MNRAS 490, 718–732 (2019)
Dow
nloaded from https://academ
ic.oup.com/m
nras/article/490/1/718/5570591 by guest on 29 June 2022

Supernovae and their host galaxies – VI. 731
AAH, and AGK acknowledge the hospitality of the Institutd’Astrophysique de Paris (France) during their stay as visitingscientists supported by the Programme Visiteurs Exterieurs (PVE).This work was supported by the RA MES State Committee ofScience, in the frames of the research project number 15T–1C129.This work was made possible in part by a research grant fromthe Armenian National Science and Education Fund (ANSEF)based in New York, USA. VA acknowledges the support fromFundacao para a Ciencia e Tecnologia (FCT) through Investi-gador FCT contract nr. IF/00650/2015/CP1273/CT0001 and thesupport from FCT/MCTES through national funds (PIDDAC) –UID/FIS/04434/2019. Funding for the SDSS-IV has been providedby the Alfred P. Sloan Foundation, the US Department of EnergyOffice of Science, and the Participating Institutions. SDSS-IVacknowledges support and resources from the Center for High-Performance Computing at the University of Utah. The SDSSweb site is www.sdss.org. SDSS-IV is managed by the Astro-physical Research Consortium for the Participating Institutionsof the SDSS Collaboration including the Brazilian ParticipationGroup, the Carnegie Institution for Science, Carnegie Mellon Uni-versity, the Chilean Participation Group, the French ParticipationGroup, Harvard-Smithsonian Center for Astrophysics, Institutode Astrofısica de Canarias, The Johns Hopkins University, KavliInstitute for the Physics and Mathematics of the Universe (IPMU) /University of Tokyo, the Korean Participation Group, LawrenceBerkeley National Laboratory, Leibniz Institut fur AstrophysikPotsdam (AIP), Max-Planck-Institut fur Astronomie (MPIA Hei-delberg), Max-Planck-Institut fur Astrophysik (MPA Garching),Max-Planck-Institut fur Extraterrestrische Physik (MPE), NationalAstronomical Observatories of China, New Mexico State Univer-sity, New York University, University of Notre Dame, ObservatarioNacional / MCTI, The Ohio State University, Pennsylvania StateUniversity, Shanghai Astronomical Observatory, United KingdomParticipation Group, Universidad Nacional Autonoma de Mexico,University of Arizona, University of Colorado Boulder, Universityof Oxford, University of Portsmouth, University of Utah, Universityof Virginia, University of Washington, University of Wisconsin,Vanderbilt University, and Yale University.
RE FERENCES
Aguado D. S. et al., 2019, ApJS, 240, 23Anderson J. P., James P. A., 2009, MNRAS, 399, 559Anderson J. P., James P. A., Forster F., Gonzalez-Gaitan S., Habergham S.
M., Hamuy M., Lyman J. D., 2015, MNRAS, 448, 732Aramyan L. S. et al., 2016, MNRAS, 459, 3130Arnett W. D., 1982, ApJ, 253, 785Barbon R., Buondı V., Cappellaro E., Turatto M., 1999, A&AS, 139, 531Bartunov O. S., Makarova I. N., Tsvetkov D. I., 1992, A&A, 264, 428Benetti S. et al., 2005, ApJ, 623, 1011Bernardi M., Nichol R. C., Sheth R. K., Miller C. J., Brinkmann J., 2006,
AJ, 131, 1288Bottinelli L., Gouguenheim L., Paturel G., Teerikorpi P., 1995, A&A, 296,
64Branch D., Fisher A., Nugent P., 1993, AJ, 106, 2383Capaccioli M., 1989, in Corwin H. G. Jr, Bottinelli L., eds, The World of
Galaxies. Springer-Verlag, New York, p. 208Cappellaro E., Turatto M., 1997, in Ruiz-Lapuente P., Canal R., Isern J.,
eds, NATO Adv. Sci. Inst. Ser. C, Vol. 486 , Thermonuclear Supernovae.Springer, Dordrecht, p. 77
Chen Y.-M. et al., 2012, MNRAS, 421, 314Childress M. J., Wolf C., Zahid H. J., 2014, MNRAS, 445, 1898Conroy C., Gunn J. E., White M., 2009, ApJ, 699, 486Crocker R. M. et al., 2017, Nat. Astron., 1, 0135
D’Agostino R. B., Stephens M. A., 1986, Statistics: Textbooks and Mono-graphs, Vol. 68. Marcel Dekker Inc., New York
de Vaucouleurs G., 1948, Ann. Astrophys., 11, 247Dilday B. et al., 2010, ApJ, 715, 1021Dong S., Katz B., Kushnir D., Prieto J. L., 2015, MNRAS, 454, L61Engmann S., Cousineau D., 2011, J. Appl. Quant. Methods, 6, 1Filippenko A. V. et al., 1992a, AJ, 104, 1543Filippenko A. V. et al., 1992b, ApJ, 384, L15Fioc M., Rocca-Volmerange B., 1997, A&A, 326, 950Fioc M., Rocca-Volmerange B., 1999, preprint (arXiv:astro-ph/9912179)Forster F., Schawinski K., 2008, MNRAS, 388, L74Freeman K. C., 1970, ApJ, 160, 811Galbany L. et al., 2012, ApJ, 755, 125Gallagher J. S., Garnavich P. M., Berlind P., Challis P., Jha S., Kirshner R.
P., 2005, ApJ, 634, 210Gallagher J. S., Garnavich P. M., Caldwell N., Kirshner R. P., Jha S.
W., Li W., Ganeshalingam M., Filippenko A. V., 2008, ApJ, 685,752
Gallazzi A., Charlot S., Brinchmann J., White S. D. M., 2006, MNRAS,370, 1106
Gilfanov M., Bogdan A., 2010, Nature, 463, 924Gomes J. M. et al., 2016a, A&A, 585, A92Gomes J. M. et al., 2016b, A&A, 588, A68Gonzalez Delgado R. M. et al., 2015, A&A, 581, A103Gonzalez-Gaitan S. et al., 2011, ApJ, 727, 107Gonzalez-Gaitan S. et al., 2014, ApJ, 795, 142Guillochon J., Parrent J., Kelley L. Z., Margutti R., 2017, ApJ, 835, 64Gupta R. R. et al., 2011, ApJ, 740, 92Guseinov O. H., Kasumov F. K., Kalinin E. V., 1980, Ap&SS, 68, 385Guy J. et al., 2007, A&A, 466, 11Hakobyan A. A. et al., 2011, Astrophysics, 54, 301Hakobyan A. A., Adibekyan V. Z., Aramyan L. S., Petrosian A. R., Gomes
J. M., Mamon G. A., Kunth D., Turatto M., 2012, A&A, 544, A81Hakobyan A. A. et al., 2014, MNRAS, 444, 2428Hakobyan A. A. et al., 2016, MNRAS, 456, 2848Hakobyan A. A. et al., 2017, MNRAS, 471, 1390Hamuy M., Pinto P. A., 1999, AJ, 117, 1185Hamuy M., Phillips M. M., Suntzeff N. B., Schommer R. A., Maza J., Aviles
R., 1996, AJ, 112, 2391Hamuy M., Trager S. C., Pinto P. A., Phillips M. M., Schommer R. A.,
Ivanov V., Suntzeff N. B., 2000, AJ, 120, 1479Henry R. B. C., Worthey G., 1999, PASP, 111, 919Hillebrandt W., Niemeyer J. C., 2000, ARA&A, 38, 191Howell D. A., 2001, ApJ, 554, L193Howell D. A., Wang L., Wheeler J. C., 2000, ApJ, 530, 166Howell D. A. et al., 2009, ApJ, 691, 661Iben I. Jr, Tutukov A. V., 1984, ApJS, 54, 335Ivanov V. D., Hamuy M., Pinto P. A., 2000, ApJ, 542, 588James P. A., Anderson J. P., 2006, A&A, 453, 57Jha S., Riess A. G., Kirshner R. P., 2007, ApJ, 659, 122Kang Y., Kim Y.-L., Lim D., Chung C., Lee Y.-W., 2016, ApJS, 223, 7Kaviraj S., Peirani S., Khochfar S., Silk J., Kay S., 2009, MNRAS, 394,
1713Kim Y.-L., Smith M., Sullivan M., Lee Y.-W., 2018, ApJ, 854, 24Kochanek C. S. et al., 2017, PASP, 129, 104502Kollmeier J. A. et al., 2019, MNRAS, 486, 3041Kormendy J., Fisher D. B., Cornell M. E., Bender R., 2009, ApJS, 182, 216Leaman J., Li W., Chornock R., Filippenko A. V., 2011, MNRAS, 412, 1419Leibundgut B. et al., 1993, AJ, 105, 301Li W. et al., 2011a, MNRAS, 412, 1441Li W., Chornock R., Leaman J., Filippenko A. V., Poznanski D., Wang X.,
Ganeshalingam M., Mannucci F., 2011b, MNRAS, 412, 1473Lipunov V. M., Panchenko I. E., Pruzhinskaya M. V., 2011, New A, 16, 250Lupton R., Gunn J. E., Ivezic Z., Knapp G. R., Kent S., 2001, in Harnden
F. R. Jr, Primini F. A., Payne H. E., eds, ASP Conf. Ser. Vol. 238,Astronomical Data Analysis Software and Systems X. Astron. Soc. Pac.,San Francisco, p. 269
Maeda K., Terada Y., 2016, Int. J. Mod. Phys. D, 25, 1630024
MNRAS 490, 718–732 (2019)
Dow
nloaded from https://academ
ic.oup.com/m
nras/article/490/1/718/5570591 by guest on 29 June 2022

732 L. V. Barkhudaryan et al.
Mannucci F., Della Valle M., Panagia N., Cappellaro E., Cresci G., MaiolinoR., Petrosian A., Turatto M., 2005, A&A, 433, 807
Maoz D., Mannucci F., Nelemans G., 2014, ARA&A, 52, 107Maraston C., 2005, MNRAS, 362, 799Massey F. J., 1951, J. Am. Stat. Assoc., 46, 68Maza J., van den Bergh S., 1976, ApJ, 204, 519Mazzali P. A., Hachinger S., 2012, MNRAS, 424, 2926Mazzali P. A., Ropke F. K., Benetti S., Hillebrandt W., 2007, Science, 315,
825McIntosh D. H. et al., 2014, MNRAS, 442, 533Mendez A. J., Coil A. L., Lotz J., Salim S., Moustakas J., Simard L., 2011,
ApJ, 736, 110Moreno-Raya M. E., Lopez-Sanchez A. R., Molla M., Galbany L., Vılchez
J. M., Carnero A., 2016, MNRAS, 462, 1281Nair P. B., Abraham R. G., 2010, ApJS, 186, 427Neill J. D. et al., 2009, ApJ, 707, 1449Nomoto K., Iwamoto K., Kishimoto N., 1997, Science, 276, 1378Pakmor R., Kromer M., Taubenberger S., Springel V., 2013, ApJ, 770, L8Pan Y.-C. et al., 2014, MNRAS, 438, 1391Pan Y.-C., Sullivan M., Maguire K., Gal-Yam A., Hook I. M., Howell D. A.,
Nugent P. E., Mazzali P. A., 2015, MNRAS, 446, 354Panther F. H., Seitenzahl I. R., Ruiter A. J., Crocker R. M., Lidman C., Wang
E. X., Tucker B. E., Groves B., 2019, Publ. Astron. Soc. Aust., 36, e031Pavlyuk N. N., Tsvetkov D. Y., 2016, Astron. Lett., 42, 495Perlmutter S. et al., 1999, ApJ, 517, 565Pettitt A. N., 1976, Biometrika, 63, 161Phillips M. M., 1993, ApJ, 413, L105Phillips M. M., Wells L. A., Suntzeff N. B., Hamuy M., Leibundgut B.,
Kirshner R. P., Foltz C. B., 1992, AJ, 103, 1632Phillips M. M., Lira P., Suntzeff N. B., Schommer R. A., Hamuy M., Maza
J., 1999, AJ, 118, 1766Pskovskii I. P., 1977, SvA, 21, 675Riess A. G. et al., 1998, AJ, 116, 1009Rose B. M., Garnavich P. M., Berg M. A., 2019, ApJ, 874, 32Ruiz-Lapuente P., Cappellaro E., Turatto M., Gouiffes C., Danziger I. J.,
della Valle M., Lucy L. B., 1992, ApJ, 387, L33Rust B. W., 1974, PhD thesis, Oak Ridge National LaboratorySand D. J. et al., 2019, ApJ, 877, L4Scannapieco E., Bildsten L., 2005, ApJ, 629, L85Schawinski K., Dowlin N., Thomas D., Urry C. M., Edmondson E., 2010,
ApJ, 714, L108Schawinski K. et al., 2014, MNRAS, 440, 889Schlafly E. F., Finkbeiner D. P., 2011, ApJ, 737, 103Schlegel D. J., Finkbeiner D. P., Davis M., 1998, ApJ, 500, 525Scott N. et al., 2017, MNRAS, 472, 2833
Sersic J. L., 1963, Bol. Asoc. Argent. Astron., 6, 41Shaw R. L., 1979, A&A, 76, 188Silverman J. M. et al., 2012, MNRAS, 425, 1789Sullivan M. et al., 2010, MNRAS, 406, 782Taubenberger S., 2017, in Alsabti A. W., Murdin P., eds, Handbook of
Supernovae. Springer, Cham, p. 317Taubenberger S. et al., 2008, MNRAS, 385, 75Taubenberger S. et al., 2011, MNRAS, 412, 2735Taylor E. N. et al., 2011, MNRAS, 418, 1587Terry J. N., Paturel G., Ekholm T., 2002, A&A, 393, 57Theureau G., Rauzy S., Bottinelli L., Gouguenheim L., 1998, A&A, 340,
21Timmes F. X., Brown E. F., Truran J. W., 2003, ApJ, 590, L83Tomasella L. et al., 2014, Astron. Nachr., 335, 841Tsvetkov D. Y., Pavlyuk N. N., Bartunov O. S., 2004, Astron. Lett., 30, 729Turatto M., Benetti S., Cappellaro E., Danziger I. J., Della Valle M., Gouiffes
C., Mazzali P. A., Patat F., 1996, MNRAS, 283, 1Tyson J. A., 2002, in Tyson J. A., Wolff S., eds, Proc. SPIE Conf. Ser. Vol.
4836, Survey and Other Telescope Technologies and Discoveries. SPIE,Bellingham, p. 10
Uddin S. A., Mould J., Wang L., 2017, ApJ, 850, 135Verkhodanov O. V., Kopylov A. I., Zhelenkova O. P., Verkhodanova N. V.,
Chernenkov V. N., Parijskij Y. N., Soboleva N. S., Temirova A. V., 2000,Astron. Astrophys. Trans., 19, 662
Vika M., Bamford S. P., Haußler B., Rojas A. L., Borch A., Nichol R. C.,2013, MNRAS, 435, 623
Wang X., Wang L., Filippenko A. V., Zhang T., Zhao X., 2013, Science,340, 170
Yahil A., Tammann G. A., Sandage A., 1977, ApJ, 217, 903Yaron O., Gal-Yam A., 2012, PASP, 124, 668
SUPPORTI NG INFORMATI ON
Supplementary data are available at MNRAS online.
PaperVIonlinedata.csv
Please note: Oxford University Press is not responsible for thecontent or functionality of any supporting materials supplied bythe authors. Any queries (other than missing material) should bedirected to the corresponding author for the article.
This paper has been typeset from a TEX/LATEX file prepared by the author.
MNRAS 490, 718–732 (2019)
Dow
nloaded from https://academ
ic.oup.com/m
nras/article/490/1/718/5570591 by guest on 29 June 2022