Inferring the photometric and size evolution of galaxies from ...
arX
iv:a
stro
-ph/
0309
264v
1 9
Sep
200
3
Mon. Not. R. Astron. Soc. 000, 000–000 (0000) Printed 2 February 2008 (MN LATEX style file v2.2)
Low Luminosity Type II Supernovae:
Spectroscopic and Photometric Evolution ⋆
A. Pastorello1,2,5, L. Zampieri2, M. Turatto2, E. Cappellaro3,
W. P. S. Meikle4, S. Benetti2, D. Branch5, E. Baron5,
F. Patat6, M. Armstrong7, G. Altavilla2,1, M. Salvo8, M. Riello2,1
1 Dipartimento di Astronomia, Universita di Padova, Vicolo dell’ Osservatorio 2, I-35122 Padova, Italy2 INAF - Osservatorio Astronomico di Padova, Vicolo dell’ Osservatorio 5, I-35122 Padova, Italy3 INAF - Osservatorio Astronomico di Capodimonte, Via Moiariello 16, I-80131 Napoli, Italy4 Astrophysics Group, Blackett Laboratory, Imperial College, Prince Consort Road, London SW7 2BZ, England, UK5 Department of Physics and Astronomy, University of Oklahoma, 440 W. Brooke St., Norman, OK 73019, USA6 European Southern Observatory, Karl-Schwarzschild-Strasse 2, D-85748, Garching bei Munchen, Germany7 Rolvenden, Kent, UK8 Australian National University, Mount Stromlo Observatory, Cotter Road, Weston ACT 2611, Australia
Accepted .....; Received ....; in original form ....
ABSTRACT
In this paper we present spectroscopic and photometric observations for four corecollapse supernovae (SNe), namely SNe 1994N, 1999br, 1999eu and 2001dc. Togetherwith SN 1997D, we show that they form a group of exceptionally low–luminosityevents. These SNe have narrow spectral lines (indicating low expansion velocities)and low luminosities at every phase (significantly lower than those of typical core–collapse supernovae). The very low luminosity during the 56Co radioactive decay tailindicates that the mass of 56Ni ejected during the explosion is much smaller (MNi ≈
2–8 × 10⁻³ M⊙) than the average (MNi ≈ 6–10 × 10−2 M⊙). Two supernovae ofthis group (SN 1999br and SN 2001dc) were discovered very close to the explosionepoch, allowing us to determine the lengths of their plateaux (≈ 100 days) as wellas establishing the explosion epochs of the other, less–completely observed SNe. Itis likely that this group of SNe represent the extreme low–luminosity tail of a singlecontinuous distribution of SN II–P events. Their kinetic energy is also exceptionallylow. Although an origin from low mass progenitors has also been proposed for low–luminosity core–collapse SNe, recent work provides evidence in favour of the high massprogenitor scenario. The incidence of these low–luminosity SNe could be as high as4–5% of all type II SNe.
Key words: supernovae: general - supernovae: individual: SN 1994N, SN 1997D,SN 1999br, SN 1999eu, SN 2001dc, SN 2000em, SN 2003Z, SN 1978A, SN 1994W -galaxies: individual: UGC 5695, NGC 4900, NGC 1097, NGC 5777
1 INTRODUCTION
It is widely known that the early spectro–photometric evolu-tion of core–collapse supernovae (CC–SNe) is very heteroge-
⋆ Based on observations collected at ESO - La Silla (Chile), ESOVLT - Cerro Paranal (Chile), CTIO (Chile), TNG, WHT andJKT (La Palma, Canary Islands, Spain) and Asiago (Italy)
neous (see e.g. Patat et al., 1994). The radius of the progen-itor is believed to play a key role in shaping the early lightcurve. H–rich red giant progenitors with large initial radiiare thought to produce type II plateau supernovae (SNe II–P). Their luminosity remains nearly constant for a relativelylong period (plateau phase, lasting ∼ 110–130 days), duringwhich the hydrogen envelope (in free expansion) starts to re-combine, releasing its internal energy. The observed length
2 Pastorello et al.
of the plateau phase depends on the mass of the hydrogenenvelope [Arnett (1980), Popov (1992)].On the other hand, the unusual early light curve ofSN 1987A with a broad maximum about 3 months afterthe explosion is largely attributable to its compact progen-itor [Woosley et al. (1987), Arnett (1987)]. The luminosityat early time is dimmer than expected for a “typical” SNII–P. Then, with expansion, most of trapped energy fromradioactive decay of Ni is released and the luminosity risesproducing a broad maximum in the light curve. After theplateau phase is finished, all SNe II–P (including SN 1987A)have a steep drop in luminosity, marking the passage fromthe photospheric phase to the nebular one.
The spectroscopic evolution of all SNe II–P is rather ho-mogeneous, showing hydrogen and metal lines with P–Cygniprofiles having typical widths ranging from about 15000 to3000 km s−1 during the photospheric phase.
A common feature of most light curves of type II SNeis the linear tail, produced by the radioactive decay of 56Cointo 56Fe (0.98 mag/100d). While in some cases condensa-tion of dust grains in the ejecta and ejecta–CSM interactionphenomena may affect the late–time evolution, there is nev-ertheless general agreement that the radioactive tail of a“typical” CC–SN is powered by ∼0.06–0.10 M⊙ of 56Ni [e.g.Turatto et al. (1990); Sollerman (2002)].
However, in recent years, systematic observations ofnon–interacting SNe in the nebular phase have shown thatCC–SNe are also heterogeneous at late stages and a morecomplex picture has emerged as follows:
• a few CC–SNe, sometimes called hypernovae
(Iwamoto et al., 1998), show evidence of exceptionallylarge Ni masses, 0.3–0.9 M⊙ [Sollerman et al. (2000), Patatet al. (2001); see however Hoflich er al. (1999) who find ∼
0.2M⊙ of ejected 56Ni assuming asymmetric explosions].In addition, some otherwise “normal” type II–P SNe haveproduced unusually bright radioactive tails, again implyinglarge amounts of 56Ni [e.g. SN 1992am (∼ 0.3 M⊙), Schmidtet al. (1994)].
• In most CC–SNe the late–time luminosity is producedby 0.06–0.10 M⊙ of 56Ni, e.g. SN 1987A [II pec; Menzies etal. (1987); Catchpole et al. (1987); Catchpole et al. (1988);Whitelock et al. (1988), Catchpole et al. (1989); Whitelocket al. (1989)], SN 1988A [II–P; Ruiz–Lapuente et al. (1990);Benetti et al. (1991); Turatto et al. (1993)], SN 1993J [IIb;see e.g. Barbon et al. (1995)], and SN 1994I [Ic; Young,Baron & Branch (1995); Richmond et al. (1996) and ref-erences therein].
• A few events exhibit a somewhat lower late–time lumi-nosity, such as SN 1991G (Blanton et al., 1995), SN 1992ba(Hamuy, 2003) and SN 1999gi [Leonard et al. (2002b);Hamuy (2003)]. This may be attributable to the ejectionof reduced amounts of 56Ni (0.015–0.04 M⊙). Conversely,it could be that the luminosity of these SNe is greater,but the distances and/or the effects of interstellar absorp-tion have been underestimated. This might be the case ofSN 1999em [Baron et al. (2000); Leonard et al. (2002a);Pooley et al. (2002); Hamuy et al. (2001); Elmhamdi etal. (2003)] for which recent Cepheid distance measurements(Leonard et al., 2003) suggest that the host galaxy dis-tance was previously underestimated and, consequently, theSN luminosity probably higher. The type II–P SN 1994W
(Sollerman et al., 1998), while having an exceptionally highluminosity during the photospheric era, was also particu-larly faint at late times with an ejected 56Ni mass below0.015 M⊙, depending inversely on the assumed contributionto the luminosity of an ejecta–CSM interaction.
• Finally, there is a small group of events having very lowlate–time luminosities. The prototype is SN 1997D (Turattoet al., 1998). As demonstrated in this paper, the SNe of thisgroup are also exceptionally faint at early–times. The otherSNe in this category which we study here are SN 1994N (Tu-ratto, 1994), SN 1999br (King, 1999), SN 1999eu (Nakano& Aoki, 1999) and SN 2001dc (Armstrong, 2001). As weshall see, the late–time light curves of this group requirevery small amounts of 56Ni, at least one order of magnitudesmaller than in SN 1987A.
In a companion paper (Zampieri et al., 2003) we performedan analysis of the data of SN 1997D and SN 1999br, derivinginformation about the nature of the progenitor stars andthe explosion energies. The early observations of SN 1999brallowed us to constrain the models discussed in previouspapers [Turatto et al. (1998); Chugai & Utrobin (2000)].We found that these explosions are under–energetic withrespect to a typical type II SN and that the inferred massof the ejecta is large (Mej ≥ 14–20 M⊙).
In this paper we present the spectroscopic and photo-metric observations of the very low luminosity SNe 1999br,1999eu, 1994N and 2001dc. Together with the SN 1997Ddata [Turatto et al. (1998); Benetti et al. (2001)] these makeup almost all that is available for this group of SNe. The planof the paper is as follows: in Sect. 2 we describe the SNe andtheir parent galaxies. In particular, we estimate distances,crucial for the derivation of the luminosity and, in turn, ofthe 56Ni mass. The observations are summarised in Sect. 3.In Sect. 4 we present photometric data and in Sect. 5 we an-alyze light and colour curves, focusing on the common prop-erties of this group of SNe and making comparisons with theprototype SN 1997D. In Sect. 6 spectroscopic observationsare presented. In Sect. 7 we discuss the data with particu-lar focus on the progenitors nature. Sect. 8 is devoted to anestimate of the frequency of these low–luminosity events. Ashort summary follows in Sect. 9.
Throughout this paper we adopt H0 = 65 km s−1
Mpc−1. In all the images, North is up, East is to the left andthe numbers label stars of the local calibration sequence.
2 THE SNE AND THEIR HOST GALAXIES.
In Tab. 1 we summarize the main observational data for oursample of SNe and their host galaxies. For completeness, weshow also the parameters for SN 1997D in this table.
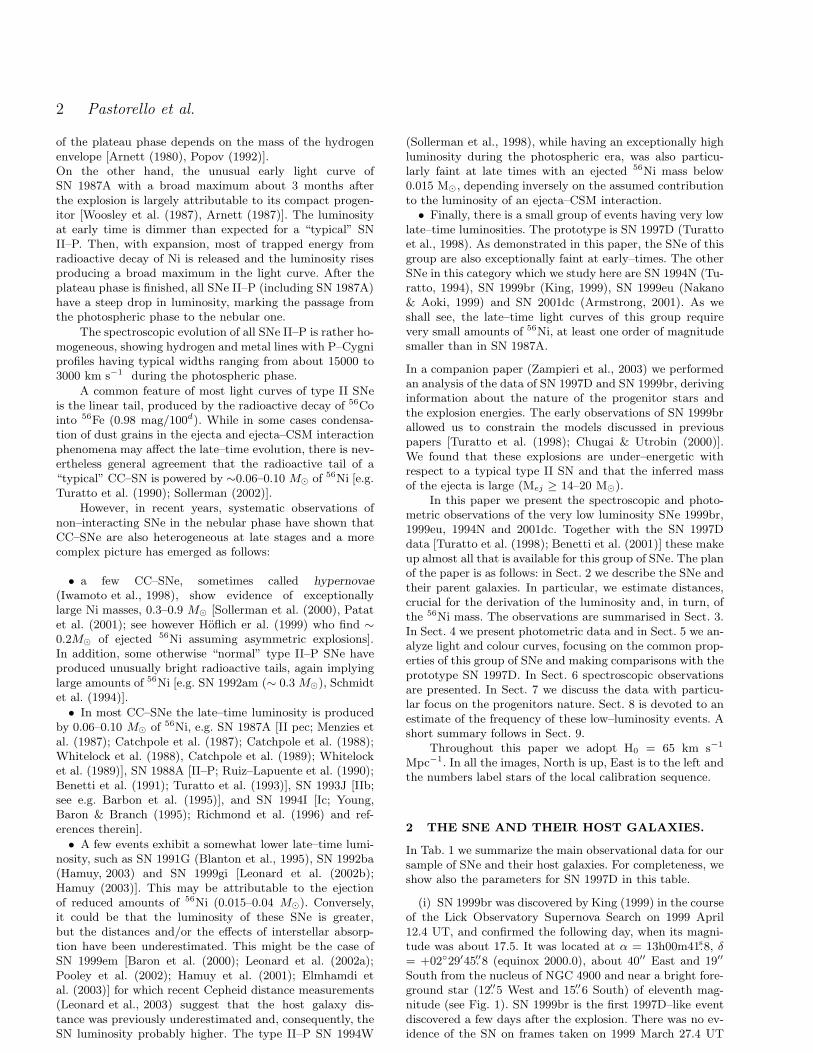
(i) SN 1999br was discovered by King (1999) in the courseof the Lick Observatory Supernova Search on 1999 April12.4 UT, and confirmed the following day, when its magni-tude was about 17.5. It was located at α = 13h00m41.s8, δ= +02◦29′45.′′8 (equinox 2000.0), about 40′′ East and 19′′
South from the nucleus of NGC 4900 and near a bright fore-ground star (12.′′5 West and 15.′′6 South) of eleventh mag-nitude (see Fig. 1). SN 1999br is the first 1997D–like eventdiscovered a few days after the explosion. There was no ev-idence of the SN on frames taken on 1999 March 27.4 UT
Low Luminosity Type II Supernovae 3
Table 1. Main observational data for the low–luminosity SNe II and their host galaxies.
SNe Data 1997D 1999br 1999eu 1994N 2001dc
α (J2000.0) 04h11m01.s00 • 13h00m41.s80 △ 02h46m20.s79 ⋄ 10h29m46.s8 ∇ 14h51m16.s15 ∗
δ (J2000.0) −56◦29′56.′′0 • +02◦29′45.′′8 △ −30◦19′06.′′1 ⋄ +13◦01′14′′ ∇ +58◦59′02.8 ∗
Offset SN-Gal.Nucleus 11′′E, 43′′S • 40′′E, 19′′S △ 23′′E, 157′′S ⋄ 1.′′8E, 9.′′8N ∇ 26′′W, 28′′N ∗
Discovery Date (UT) 1997 Jan 14.15 • 1999 Apr 12.4 △ 1999 Nov 5 ⋄ 1994 May 10.0 ∇ 2001 May 30.96 ∗
Discovery Julian Date 2450462.65 • 2451280.9 △ 2451487.5 ⋄ 2449482.5 ∇ 2452060.46 ∗
Explosion Epoch (JD) 2450361 × 2451278 × 2451394 × 2449451 × 2452047 ×
Discovery Magnitude 16.3 (Jan 15.05) • m=17.5 △ m=17.3 ⋄ R=17.5 ∇ m=18.5 ∗
V(max) ≤19.8 × ≤16.8 ♦ 17.5 × ≤17.3 × ≤18.5 ×
Total Extinction AB,tot 0.089 × 0.102 × 0.113 × 0.169 × 1.7 ×
Host Galaxies Data NGC 1536 NGC 4900 NGC 1097 UGC 5695 NGC 5777
α (J2000.0) 04h10m59.s86 † 13h00m39.s13 † 02h46m19.s06 † 10h29m46.s8 † 14h51m18.s55 †
δ (J2000.0) −56◦28′49.′′6 † +02◦30′05.′′3 † −30◦16′29.′′7 † +13◦01′05.′′5 † +58◦58′41.′′4 †
Morph. Type SB(s)c pec † SB(rs)c † SBbSy1 † S? † Sbc †
B Magnitude 13.15 † 11.90 † 10.23 † 14.66 † 14.11 †
Galactic Extinction AB 0.092 ⊗ 0.102 ⊗ 0.113 ⊗ 0.169 ⊗ 0.046 ⊗
Diameters 2’.0 x 1’.4 † 2’.2 x 2’.1 † 9’.3 x 6’.3 † 1’.3 x 0’.5 † 3’.38 x 0’.45 †
vhel (km s−1) 1461 ⋆ 968 ⋆ 1273 ⋆ 2940 ⋆ 2140 ⋆
µ (H0=65 km s−1 Mpc−1) 31.29 × 31.19 ◦ 31.08 × 33.34 × 32.85 ×
⋆ LEDA 1; † NED 2; △ (King, 1999); ⊗ (Schlegel et al., 1998); ⋄ (Nakano & Aoki, 1999); ∇ (Turatto et al., 1994);
∗ (Hurst et al., 2001); ◦ (Giuricin et al., 2000); • (de Mello & Benetti, 1997); ♦ (Benetti et al., 2001); × this paper.
(limiting magnitude 18.5) and on 1999 April 4.4 (limitingmagnitude 17; Li, IAUC 7143). The SN was classified as apeculiar, faint type II event [Garnavich et al. (1999a), Fil-ippenko et al. (1999)]. Patat et al. (1999) pointed out thesimilarity with SN 1994N at a comparable phase and sug-gested that SN 1999br had produced a very low amount of56Ni.The host galaxy (Fig. 1) of SN 1999br, NGC 4900, is awell studied SB(rs)c galaxy lying in the direction of theVirgo Cluster. Different estimates of the distance have beenpublished for this galaxy [Bottinelli et al. (1985), Kraan–Korteveg (1986), Fouque et al. (2000), Ekholm et al. (2000),Freedman et al. (2001)]. The recession velocity of NGC 4900corrected for the Local Group infall onto the Virgo Clus-ter (from the LEDA cataloue) is vvir = 1013 km s−1. Thisis close to the average value for the group, dominated byNGC 4517, to which NGC 4900 belongs [< vvir > = 1125 kms−1, Giuricin et al. (2000)], resulting in a distance modulusof µ = 31.19. This is the final value adopted for SN 1999br(see Tab. 1).For the galactic extinction we adopt AB = 0.102(Schlegel et al., 1998); no sign of internal extinction (e.g.lack of narrow interstellar Na ID lines) is present in thespectra of SN 1999br, which is not unexpected given the pe-ripheral location of the SN in NGC 4900.
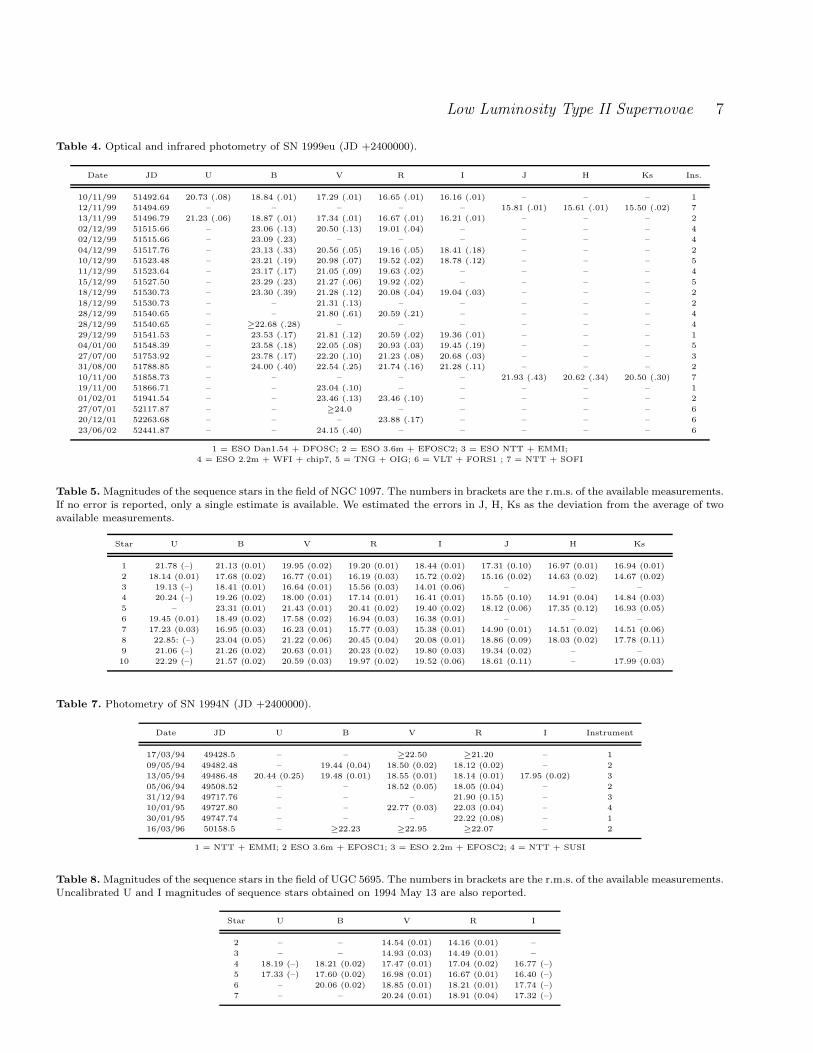
(ii) SN 1999eu was discovered by Nakano and Aoki (1999)with a 0.40m reflector on 1999 November 5 and confirmedthe following day. The SN was located at α = 02h46m20.s79,δ = −30◦19′06.′′1 (equinox 2000.0), 23′′ East, 157′′ Southfrom the nucleus of NGC 1097, lying on an arm with a rel-atively flat background structure (see Fig. 3). Garnavich etal. (1999b) classified SN 1999eu as a peculiar SN II, with aspectrum characterized by several narrow P–Cygni lines anda typical velocity of ∼ 1500 km s−1 (from the minimum ofBa II 6142 A). Garnavich et al. concluded that SN 1999eu
1 http://leda.univ-lyon1.fr/search.html2 http://nedwww.ipac.caltech.edu/index.html
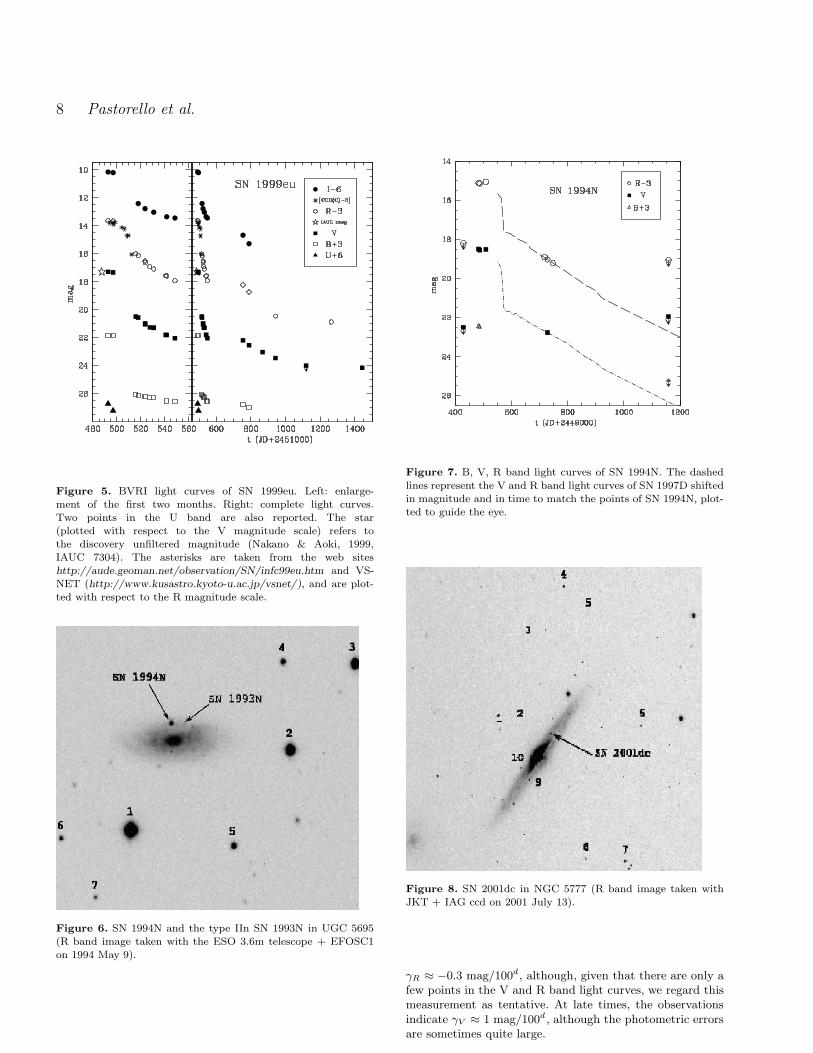
was an under–luminous type II event powered by the ejec-tion of an extremely small amount of 56Ni.The host galaxy, NGC 1097, is a peculiar barred spirallisted in Arp’s Catalogue (1966). Sersic (1973) noted thatthe galaxy nucleus was morphologically peculiar with a cen-tral condensation, surrounded by an annulus of hot spots,almost uniformly and symmetrically distributed (Fig. 4).Wolstencroft et al. (1984) found that this structure was com-posed of H II regions emitting at radio wavelengths. Theobservations suggest that a burst of star formation is takingplace in the ring. This is supported also by the discovery ofthe core–collapse SN 1992bd (Smith et al., 1992) in this re-gion (Fig. 4). The nucleus of the galaxy is a compact radiosource and shows the emission line spectrum of a Seyfert1 (Storchi–Bergmann et al., 1997). We also note that thetype II SN 2003B was discovered in a peripheral region ofthe galaxy, close to the nearby small elliptical companionNGC 1097A (Evans & Quirk, 2003).Contrary to what is sometimes claimed, NGC 1097 mem-bership of the Fornax cluster is uncertain (Giovanelli etal., 1997). The galaxy velocity is close to the averagevalue of the group NOG 179, to which NGC 1097 belongs(Giuricin et al., 2000). The recession velocity corrected forVirgo infall was derived from the LEDA catalogue, whichyields vvir = 1069 km s−1. The resulting distance modulusis µ = 31.08 (Tab. 1).For the galactic extinction, we adopt AB = 0.113(Schlegel et al., 1998). There is no spectroscopic evidencefor strong extinction in the host galaxy.
(iii) SN 1994N was serendipitously discovered by Turatto(1994) with the ESO 3.6m telescope during an observationof the type IIn SN 1993N, which exploded the year before inthe same galaxy (Mueller et al., 1993). The new SN was lo-cated at α = 10h29m46.s8, δ = +13◦01′14′′ (equinox 2000.0),1.′′8 East and 9.′′8 North from the nucleus of the spiral galaxyUGC 5695, not far (8.′′5 East) from SN 1993N (Fig. 6).Little information on UGC 5695 is available. It is a memberof a small group of galaxies, LGG 207, which has a meanheliocentric velocity of 2856 km s−1 (Garcia, 1993), slightlylarger than that of the galaxy itself. Taking LEDA’s helio-
4 Pastorello et al.
centric velocity of UGC 5695 corrected for Virgo infall andfor the peculiar motion inside the group (+48 km s−1), wederive a distance modulus µ = 33.34.Because evidence of strong internal extinction is missingfrom our spectra, we have applied only the galactic extinc-tion correction AB=0.169 (Schlegel et al., 1998).
(iv) M. Armstrong (2001) discovered SN 2001dc at α =14h51m16.s15 and δ = +58◦59′02.′′8 (equinox 2000.0), 26′′
West and 28′′ North of the center of NGC 5777 (see Fig.8). A prediscovery upper limit indicates that SN 2001dcwas discovered only a few days after explosion. From earlyphotometric monitoring, Meikle and Fassia (2001, IAUCirc. 7662) noted that this event could be classified asa SN II–P and concluded that the event was unusuallyunder–energetic, with an absolute magnitude very lowcompared with normal SNe II–P.The host galaxy NGC 5777 is an edge-on Sbcgalaxy, crossed by a spectacular equatorial dust lane(Bottinelli et al., 1990). From LEDA we derive a heliocen-tric velocity of 2140 km s−1 and, after correcting for Virgoinfall, vvir ≈ 2419 km s−1, µ = 32.85 (see Tab. 1).The galactic extinction is AB = 0.046 (Schlegel et al., 1998).The position of the SN, not far from the nucleus and pro-jected onto a background rich in gas and dust, leads us tosuspect the presence of some internal extinction. We shalldiscuss this point in Sect. 5.
3 SUMMARY OF THE OBSERVATIONS
Our observations of SNe 1999br, 1999eu, 1994N and 2001dcwere obtained with the ESO, CTIO, ING, TNG and Asi-ago telescopes. Images and spectra were reduced using stan-dard IRAF or FIGARO procedures. The photometric dataare presented in Sect. 4. The magnitudes of the SNe wereobtained using either PSF fitting and template subtractiontechniques, depending on the background complexity andthe availability of suitable template images.The journal of spectroscopic observations is reported in Tab.2. The spectra of SNe 1999eu, 1994N and 2001dc are pre-sented here for the first time. All the spectra were flux cal-ibrated using standard stars [selected from Hamuy et al.(1992), Hamuy et al. (1994), Stone (1977), Stone & Bald-win (1983), Baldwin & Stone (1984)] observed during thesame nights.
The photometric and spectroscopic observations ofSN 1999br provide good coverage of the plateau phase, butonly sparse data are available in the nebular phase. In par-ticular no post–plateau spectra are available. The discoveryepoch of SN 1999eu was probably long after the explosion,at the end of the plateau, although it was well observedboth photometrically and spectroscopically at late epochs.The data for SN 1994N are sparse, although they do spana period of about 22 months. The photometric coverage ofSN 2001dc began about one month after discovery. Becauseof its faintness, it was not possible to observe it long afterthe end of the plateau. Three spectra were also obtained,all during the plateau phase. Clearly, the temporal cover-age of individual low–luminosity SNe is incomplete and er-ratic. However, we shall argue that these events form a fairlyhomogeneous group and so, taken together, they provide a
Figure 1. V band image of SN 1999br and the host galaxy NGC4900 (image obtained on 1999 July 6 with ESO–Danish 1.54mtelescope + DFOSC.)
reasonably complete picture of the photometric and spec-troscopic evolution of this type of supernova.
4 LIGHT CURVES
4.1 SN 1999br
The Tololo Group performed an intensive follow–up ofSN 1999br during the plateau phase with the CTIO andESO telescopes (Hamuy, 2003; Hamuy et al., in prep.).This SN was also observed by us using the ESO telescopesand TNG. Our optical photometry in the UBVRI bands isshown in Tab. 3. The SN magnitudes were calibrated bymean of a local sequence (Hamuy et al., in prep.) after com-parison with Landolt standard stars (Landolt, 1992). Thephotometric measurements of SN 1999br were performedusing the template subtraction technique. The templateimages were obtained on 2000 April 2 (NTT + EMMI) and2001 February 1 (ESO 3.6m + EFOSC2). The errors werecomputed by placing some artificial stars (having the samemagnitude as the SN) at positions close to the SN, andhence estimated the deviations in the measured magnitudes.
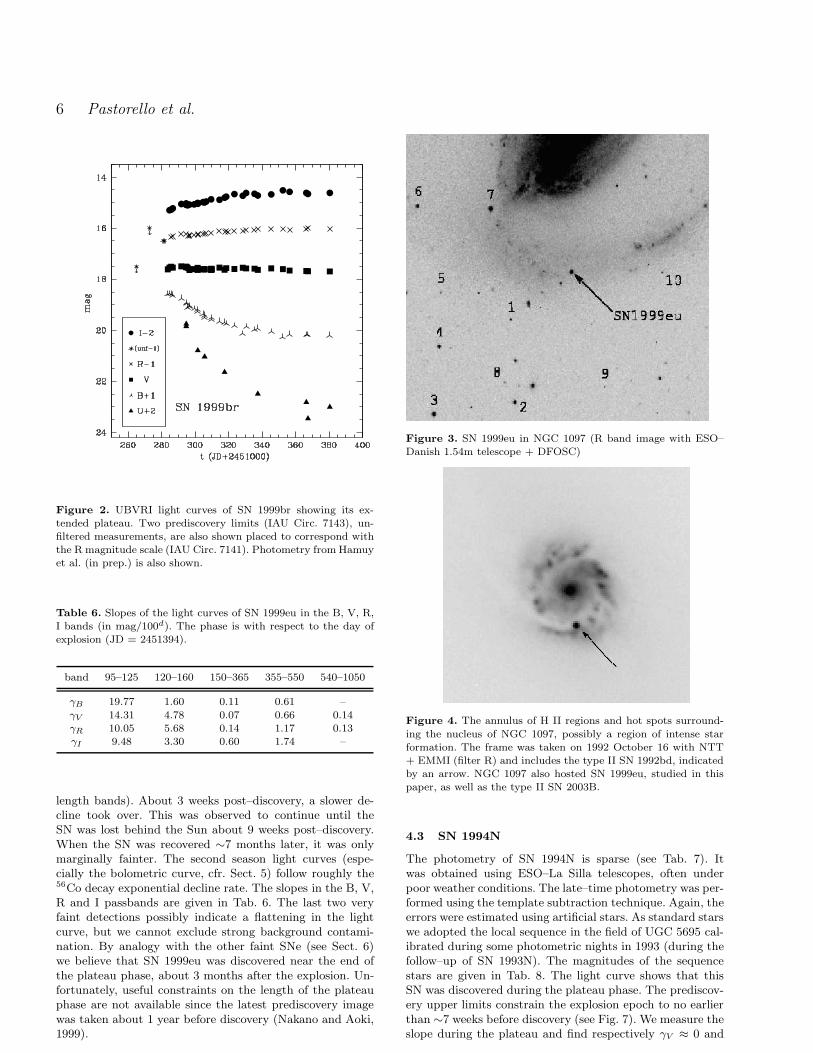
The first season UBVRI light curves are shown in Fig. 2,which also includes the data from Hamuy et al. (in prep.). Aprediscovery limit from IAU Circ. 7143 allows us to fix theexplosion epoch between JD = 2451264.9 and 2451280.9.Another limit obtained on JD = 2451272.9 is less stringent.Hereafter we adopt as the explosion epoch JD = 2451278 ±3,which is compatible with the assumptions of Zampieri et al.
3 Hamuy & Phillips, private communication
Low Luminosity Type II Supernovae 5
Table 2. Journal of spectroscopic observations (JD +2400000).
Date JD Phase Instrument Range (A) Res. (A)
SN 1994N
10/05/94 49482.54 31.5 3.6m+EFOSC1 3700–9850 13,17
14/05/94 49486.56 35.6 2.2m+EFOSC2 4500–7150 11
05/06/94 49508.53 57.5 3.6m+EFOSC1 3700–6900 18
30/01/95 49747.80 296.8 NTT+EMMI 3850–8950 9
SN 1999br
23/04/99 3 51291.73 13.7 LCO100 3700–9300 5
26/04/99 3 51294.64 16.6 1.54m+DFOSC 3500–9800 14,19
29/04/99 3 51297.68 19.7 NTT+EMMI 3350–10250 7,6
03/05/99 3 51301.64 23.6 NTT+EMMI 3300–10100 7,6
11/05/99 3 51309.69 31.7 1.54m+DFOSC 3700–10100 14,19
19/05/99 3 51317.68 39.7 NTT+EMMI 3400–10100 7,6
21/05/99 51320.02 42.0 3.6m+EFOSC2 3350–10250 14,17
20/07/99 51380.45 102.5 1.54m+DFOSC 3400–9050 12
SN 1999eu
10/11/99 51492.64 98.6 1.54m+DFOSC 3450–9050 11
14/11/99 51496.81 102.8 3.6m+EFOSC2 3400–7500 17
05/12/99 51517.74 123.7 3.6m+EFOSC2 3350–10250 14,17
18/12/99 51530.71 136.7 3.6m+EFOSC2 3400–7450 17
SN 2001dc
10/07/01 52101.48 54.5 INT+IDS 4850-9600 17
16/08/01 52138.44 91.4 TNG+DOLORES 3300-8000 15
24/08/01 52146.43 99.4 WHT+ISIS 3750-9950 14
Table 3. Photometry of SN 1999br (JD +2400000).
Date JD U B V R I Instrument
21/05/99 51319.65 – – – 17.14 (.04) – 1
07/06/99 51337.50 20.49 (0.29) 18.92 (0.01) 17.63 (0.01) 17.02 (0.01) 16.72 (0.01) 2
06/07/99 51366.47 20.82 (0.37) 19.17 (0.09) 17.68 (0.01) 17.04 (0.01) 16.62 (0.01) 3
07/07/99 51367.45 21.46 (0.55) 19.18 (0.03) 17.69 (0.04) 16.98 (0.02) 16.66 (0.01) 2
20/07/99 51380.48 21.01 (0.31) 19.20 (0.03) 17.69 (0.01) 17.04 (0.02) 16.62 (0.01) 3
02/04/00 51636.59 – – 22.60 (0.15) – 21.18 (0.24) 4 3
09/04/00 51643.69 – – 22.68 (0.08) – – 4 3
02/05/00 51666.67 – – – 21.98 (0.05) – 4 3
01/02/01 51941.87 – – ≥24.4 ≥24.6 – 1
26/07/01 52117.50 – – ≥25.2 ≥24.8 – 5
1 = ESO 3.6m + EFOSC2; 2 = TNG + OIG
3 = Danish 1.54m + DFOSC; 4 = NTT + EMMI; 5 = ESO VLT + FORS1
(2003). While the U and B band light curves decline mono-tonically after discovery (the slope of the B band light curveis 3.66 mag/100d during the first 40 days and 0.61 mag/100d
later), the V band light curve shows a plateau of duration atleast 100 days. Between about days 30 and 100, the slope isγV ≈ 0.20 mag/100d. The R and I band magnitudes increasewith time up to the last data point at ∼100 days. During theera 30–100 days, the slopes are respectively γR ≈ −0.18 andγI ≈ −0.25 mag/100d. This evolution is typical of a SN IIduring the plateau phase (Popov, 1992). Unfortunately, nomeasurements are available between 1999 July 20, and 2001February 1, and so the precise length of the plateau phaseis undetermined. Only a few measurements or upper limits(see e.g. Fig. 12) are available during the radioactive decayepoch, but they are of special interest due to their role inthe determination of the 56Ni mass.
4.2 SN 1999eu
Our photometry, covering a period of ∼ 950 days, is shown inTab. 4. Lacking a reference image, the SN magnitudes wereobtained using a PSF–fitting technique. The errors were es-timated using artificial stars, as described above. In Tab.5we give the magnitudes of the local sequence stars (see Fig.3). SN 1999eu was observed twice in the IR with NTT +SOFI. The JHKs magnitudes are also reported in Tab. 4.From these observations alone it is impossible to reach adefinitive conclusion on the evolution of the light curve inthe IR bands, but they can help in evaluating the bolomet-ric correction at selected epochs. Comparison with the IRlight curves of CC–SNe compiled by Mattila & Meikle (2001)places the earlier JHK photometry of SN 1999eu about 1.2magnitudes fainter than the average values for “ordinary”CC–SNe for this phase (∼100 days), and similar in magni-tude to SN 1982R. We stress that the last very faint detec-tion could also be due to IR background emission.
About 1 week after discovery, the light curves under-went an abrupt fall in brightness (especially at shorter wave-
6 Pastorello et al.
Figure 2. UBVRI light curves of SN 1999br showing its ex-tended plateau. Two prediscovery limits (IAU Circ. 7143), un-filtered measurements, are also shown placed to correspond withthe R magnitude scale (IAU Circ. 7141). Photometry from Hamuyet al. (in prep.) is also shown.
Table 6. Slopes of the light curves of SN 1999eu in the B, V, R,I bands (in mag/100d). The phase is with respect to the day ofexplosion (JD = 2451394).
band 95–125 120–160 150–365 355–550 540–1050
γB 19.77 1.60 0.11 0.61 –
γV 14.31 4.78 0.07 0.66 0.14γR 10.05 5.68 0.14 1.17 0.13γI 9.48 3.30 0.60 1.74 –
length bands). About 3 weeks post–discovery, a slower de-cline took over. This was observed to continue until theSN was lost behind the Sun about 9 weeks post–discovery.When the SN was recovered ∼7 months later, it was onlymarginally fainter. The second season light curves (espe-cially the bolometric curve, cfr. Sect. 5) follow roughly the56Co decay exponential decline rate. The slopes in the B, V,R and I passbands are given in Tab. 6. The last two veryfaint detections possibly indicate a flattening in the lightcurve, but we cannot exclude strong background contami-nation. By analogy with the other faint SNe (see Sect. 6)we believe that SN 1999eu was discovered near the end ofthe plateau phase, about 3 months after the explosion. Un-fortunately, useful constraints on the length of the plateauphase are not available since the latest prediscovery imagewas taken about 1 year before discovery (Nakano and Aoki,1999).
Figure 3. SN 1999eu in NGC 1097 (R band image with ESO–Danish 1.54m telescope + DFOSC)
Figure 4. The annulus of H II regions and hot spots surround-
ing the nucleus of NGC 1097, possibly a region of intense starformation. The frame was taken on 1992 October 16 with NTT+ EMMI (filter R) and includes the type II SN 1992bd, indicatedby an arrow. NGC 1097 also hosted SN 1999eu, studied in thispaper, as well as the type II SN 2003B.
4.3 SN 1994N
The photometry of SN 1994N is sparse (see Tab. 7). Itwas obtained using ESO–La Silla telescopes, often underpoor weather conditions. The late–time photometry was per-formed using the template subtraction technique. Again, theerrors were estimated using artificial stars. As standard starswe adopted the local sequence in the field of UGC 5695 cal-ibrated during some photometric nights in 1993 (during thefollow–up of SN 1993N). The magnitudes of the sequencestars are given in Tab. 8. The light curve shows that thisSN was discovered during the plateau phase. The prediscov-ery upper limits constrain the explosion epoch to no earlierthan ∼7 weeks before discovery (see Fig. 7). We measure theslope during the plateau and find respectively γV ≈ 0 and
Low Luminosity Type II Supernovae 7
Table 4. Optical and infrared photometry of SN 1999eu (JD +2400000).
Date JD U B V R I J H Ks Ins.
10/11/99 51492.64 20.73 (.08) 18.84 (.01) 17.29 (.01) 16.65 (.01) 16.16 (.01) – – – 1
12/11/99 51494.69 – – – – – 15.81 (.01) 15.61 (.01) 15.50 (.02) 7
13/11/99 51496.79 21.23 (.06) 18.87 (.01) 17.34 (.01) 16.67 (.01) 16.21 (.01) – – – 2
02/12/99 51515.66 – 23.06 (.13) 20.50 (.13) 19.01 (.04) – – – – 4
02/12/99 51515.66 – 23.09 (.23) – – – – – – 4
04/12/99 51517.76 – 23.13 (.33) 20.56 (.05) 19.16 (.05) 18.41 (.18) – – – 2
10/12/99 51523.48 – 23.21 (.19) 20.98 (.07) 19.52 (.02) 18.78 (.12) – – – 5
11/12/99 51523.64 – 23.17 (.17) 21.05 (.09) 19.63 (.02) – – – – 4
15/12/99 51527.50 – 23.29 (.23) 21.27 (.06) 19.92 (.02) – – – – 5
18/12/99 51530.73 – 23.30 (.39) 21.28 (.12) 20.08 (.04) 19.04 (.03) – – – 2
18/12/99 51530.73 – – 21.31 (.13) – – – – – 2
28/12/99 51540.65 – – 21.80 (.61) 20.59 (.21) – – – – 4
28/12/99 51540.65 – ≥22.68 (.28) – – – – – – 4
29/12/99 51541.53 – 23.53 (.17) 21.81 (.12) 20.59 (.02) 19.36 (.01) – – – 1
04/01/00 51548.39 – 23.58 (.18) 22.05 (.08) 20.93 (.03) 19.45 (.19) – – – 5
27/07/00 51753.92 – 23.78 (.17) 22.20 (.10) 21.23 (.08) 20.68 (.03) – – – 3
31/08/00 51788.85 – 24.00 (.40) 22.54 (.25) 21.74 (.16) 21.28 (.11) – – – 2
10/11/00 51858.73 – – – – – 21.93 (.43) 20.62 (.34) 20.50 (.30) 7
19/11/00 51866.71 – – 23.04 (.10) – – – – – 1
01/02/01 51941.54 – – 23.46 (.13) 23.46 (.10) – – – – 2
27/07/01 52117.87 – – ≥24.0 – – – – – 6
20/12/01 52263.68 – – – 23.88 (.17) – – – – 6
23/06/02 52441.87 – – 24.15 (.40) – – – – – 6
1 = ESO Dan1.54 + DFOSC; 2 = ESO 3.6m + EFOSC2; 3 = ESO NTT + EMMI;
4 = ESO 2.2m + WFI + chip7, 5 = TNG + OIG; 6 = VLT + FORS1 ; 7 = NTT + SOFI
Table 5. Magnitudes of the sequence stars in the field of NGC 1097. The numbers in brackets are the r.m.s. of the available measurements.If no error is reported, only a single estimate is available. We estimated the errors in J, H, Ks as the deviation from the average of twoavailable measurements.
Star U B V R I J H Ks
1 21.78 (–) 21.13 (0.01) 19.95 (0.02) 19.20 (0.01) 18.44 (0.01) 17.31 (0.10) 16.97 (0.01) 16.94 (0.01)
2 18.14 (0.01) 17.68 (0.02) 16.77 (0.01) 16.19 (0.03) 15.72 (0.02) 15.16 (0.02) 14.63 (0.02) 14.67 (0.02)
3 19.13 (–) 18.41 (0.01) 16.64 (0.01) 15.56 (0.03) 14.01 (0.06) – – –
4 20.24 (–) 19.26 (0.02) 18.00 (0.01) 17.14 (0.01) 16.41 (0.01) 15.55 (0.10) 14.91 (0.04) 14.84 (0.03)
5 – 23.31 (0.01) 21.43 (0.01) 20.41 (0.02) 19.40 (0.02) 18.12 (0.06) 17.35 (0.12) 16.93 (0.05)
6 19.45 (0.01) 18.49 (0.02) 17.58 (0.02) 16.94 (0.03) 16.38 (0.01) – – –
7 17.23 (0.03) 16.95 (0.03) 16.23 (0.01) 15.77 (0.03) 15.38 (0.01) 14.90 (0.01) 14.51 (0.02) 14.51 (0.06)
8 22.85: (–) 23.04 (0.05) 21.22 (0.06) 20.45 (0.04) 20.08 (0.01) 18.86 (0.09) 18.03 (0.02) 17.78 (0.11)
9 21.06 (–) 21.26 (0.02) 20.63 (0.01) 20.23 (0.02) 19.80 (0.03) 19.34 (0.02) – –
10 22.29 (–) 21.57 (0.02) 20.59 (0.03) 19.97 (0.02) 19.52 (0.06) 18.61 (0.11) – 17.99 (0.03)
Table 7. Photometry of SN 1994N (JD +2400000).
Date JD U B V R I Instrument
17/03/94 49428.5 – – ≥22.50 ≥21.20 – 1
09/05/94 49482.48 – 19.44 (0.04) 18.50 (0.02) 18.12 (0.02) – 2
13/05/94 49486.48 20.44 (0.25) 19.48 (0.01) 18.55 (0.01) 18.14 (0.01) 17.95 (0.02) 3
05/06/94 49508.52 – – 18.52 (0.05) 18.05 (0.04) – 2
31/12/94 49717.76 – – – 21.90 (0.15) – 3
10/01/95 49727.80 – – 22.77 (0.03) 22.03 (0.04) – 4
30/01/95 49747.74 – – – 22.22 (0.08) – 1
16/03/96 50158.5 – ≥22.23 ≥22.95 ≥22.07 – 2
1 = NTT + EMMI; 2 ESO 3.6m + EFOSC1; 3 = ESO 2.2m + EFOSC2; 4 = NTT + SUSI
Table 8. Magnitudes of the sequence stars in the field of UGC 5695. The numbers in brackets are the r.m.s. of the available measurements.Uncalibrated U and I magnitudes of sequence stars obtained on 1994 May 13 are also reported.
Star U B V R I
2 – – 14.54 (0.01) 14.16 (0.01) –
3 – – 14.93 (0.03) 14.49 (0.01) –
4 18.19 (–) 18.21 (0.02) 17.47 (0.01) 17.04 (0.02) 16.77 (–)
5 17.33 (–) 17.60 (0.02) 16.98 (0.01) 16.67 (0.01) 16.40 (–)
6 – 20.06 (0.02) 18.85 (0.01) 18.21 (0.01) 17.74 (–)
7 – – 20.24 (0.01) 18.91 (0.04) 17.32 (–)
8 Pastorello et al.
Figure 5. BVRI light curves of SN 1999eu. Left: enlarge-ment of the first two months. Right: complete light curves.Two points in the U band are also reported. The star(plotted with respect to the V magnitude scale) refers tothe discovery unfiltered magnitude (Nakano & Aoki, 1999,IAUC 7304). The asterisks are taken from the web siteshttp://aude.geoman.net/observation/SN/infc99eu.htm and VS-NET (http://www.kusastro.kyoto-u.ac.jp/vsnet/), and are plot-ted with respect to the R magnitude scale.
Figure 6. SN 1994N and the type IIn SN 1993N in UGC 5695(R band image taken with the ESO 3.6m telescope + EFOSC1on 1994 May 9).
Figure 7. B, V, R band light curves of SN 1994N. The dashed
lines represent the V and R band light curves of SN 1997D shiftedin magnitude and in time to match the points of SN 1994N, plot-ted to guide the eye.
Figure 8. SN 2001dc in NGC 5777 (R band image taken withJKT + IAG ccd on 2001 July 13).
γR ≈ −0.3 mag/100d, although, given that there are only afew points in the V and R band light curves, we regard thismeasurement as tentative. At late times, the observationsindicate γV ≈ 1 mag/100d , although the photometric errorsare sometimes quite large.
Low Luminosity Type II Supernovae 9
Table 9. Photometry of SN 2001dc (JD +2400000).
Date JD U B V R I Instrument
22/06/01 52083.43 – 21.27 (0.06) 19.84 (0.03) 19.08 (0.01) 18.49 (0.01) 1
04/07/01 52095.42 – 21.22 (0.09) 19.78 (0.03) 19.06 (0.02) 18.42 (0.02) 1
13/07/01 52104.46 – 21.61 (0.08) 19.78 (0.04) 19.00 (0.03) 18.37 (0.02) 1
20/07/01 52111.44 23.65 (0.44) 21.75 (0.04) 19.86 (0.04) 19.02 (0.02) 18.33 (0.02) 2
17/08/01 52139.42 – 22.20 (0.26) 20.00 (0.10) 19.20 (0.07) 18.52 (0.04) 3
18/08/01 52140.39 – – 20.08 (0.06) 19.20 (0.05) 18.49 (0.03) 4
19/08/01 52141.36 – 22.40 (0.34) – – – 4
27/08/01 52149.32 – – 20.38 (0.19) 19.44 (0.15) 18.72 (0.05) 4
13/09/01 52166.36 – ≥23.95 – – – 3
13/09/01 52166.36 – – 22.16 (0.30) 21.07 (0.13) 20.15 (0.08) 3
08/10/01 52191.26 – – – 21.24 (0.27) 21.23 (0.37) 4
09/10/01 52192.33 – – – – 20.20 (0.50) 4
12/10/01 52195.33 – – – 21.34 (0.30) 20.55 (0.30) 4
13/10/01 52196.26 – – – – 20.63 (0.15) 4
18/10/01 52201.33 – – 22.27 (0.65) 21.69 (0.30) 20.70 (0.27) 3
18/10/01 52201.35 – – – – 20.72 (0.27) 3
19/12/01 52262.76 – – 22.89 (0.30) 22.02 (0.32) – 3
1 = JKT + JAG; 2 = TNG + OIG; 3 = TNG + Dolores; 4 = Asi1.82m + AFOSC
Table 10. Magnitudes of the sequence stars in the field of NGC 5777. The numbers in brackets are the r.m.s. of the available measure-ments. Uncalibrated U magnitudes of sequence stars obtained on 2001 July 20 are also reported.
Star U B V R I
1 19.72 (–) 19.68 (0.01) 18.88 (0.01) 18.40 (0.01) 17.94 (0.02)
2 20.45 (–) 20.97 (0.02) 20.56 (0.01) 20.28 (0.01) 20.06 (0.01)
3 – 20.35 (0.01) 19.92 (0.01) 19.64 (0.01) 19.28 (0.01)
4 – 19.24 (0.01) 18.70 (0.01) 18.37 (0.01) 18.04 (0.01)
5 – 20.87 (0.02) 20.42 (0.02) 20.09 (0.01) 19.88 (0.02)
6 21.60 (–) 20.77 (0.01) 19.26 (0.01) 18.33 (0.01) 17.38 (0.01)
7 20.51 (–) 19.71 (0.03) 18.51 (0.01) 17.79 (0.01) 17.10 (0.02)
8 19.22 (–) 19.21 (0.01) 18.33 (0.02) 17.85 (0.01) 17.40 (0.01)
9 19.75 (–) 19.43 (0.01) 18.57 (0.01) 18.02 (0.01) 17.56 (0.02)
10 – 22.16 (0.02) 20.75 (0.02) 19.83 (0.03) 18.87 (0.04)
Figure 9. BVRI light curves of SN 2001dc. The unfiltered predis-covery limit and magnitudes (asterisks) are shown with respectto the R magnitude scale (Hurst et al., 2001). The magnitude atphases later than ∼ 100 days are affected by large errors.
4.4 SN 2001dc
Our photometry measurements of SN 2001dc, lackingtemplate images, were obtained using the PSF fittingtechnique. The magnitudes are reported in Tab. 9, whilethe light curves are shown in Fig. 9. The large errors atlate times (estimated with the artificial stars method) arecaused by the complex background upon which the SNis projected. Tab. 10 gives the magnitudes of the localsequence stars (Fig. 8). In the following, we adopt 2001May 17 (JD = 2452047 ±5) as the explosion epoch, thisbeing intermediate between the upper limit of May 12 andthe first (prediscovery) detection on May 21.98.The light curve shows a plateau persisting to 90–100 dayspost–explosion. The slope of the light curves for threerepresentative epochs are reported in Tab. 11. Despite thelarge errors due to the faintness of the SN and its position,the slopes in V and R during ∼115–220 days are ratherclose to the luminosity decline rate of 56Co.
5 COLOR EVOLUTION, ABSOLUTE
LUMINOSITY AND BOLOMETRIC LIGHT
CURVES
In order to establish the intrinsic luminosity of our sampleof supernovae, it is essential to establish their distances,phases and the extent to which they are subject to ex-tinction. We have already estimated the distance moduli
10 Pastorello et al.
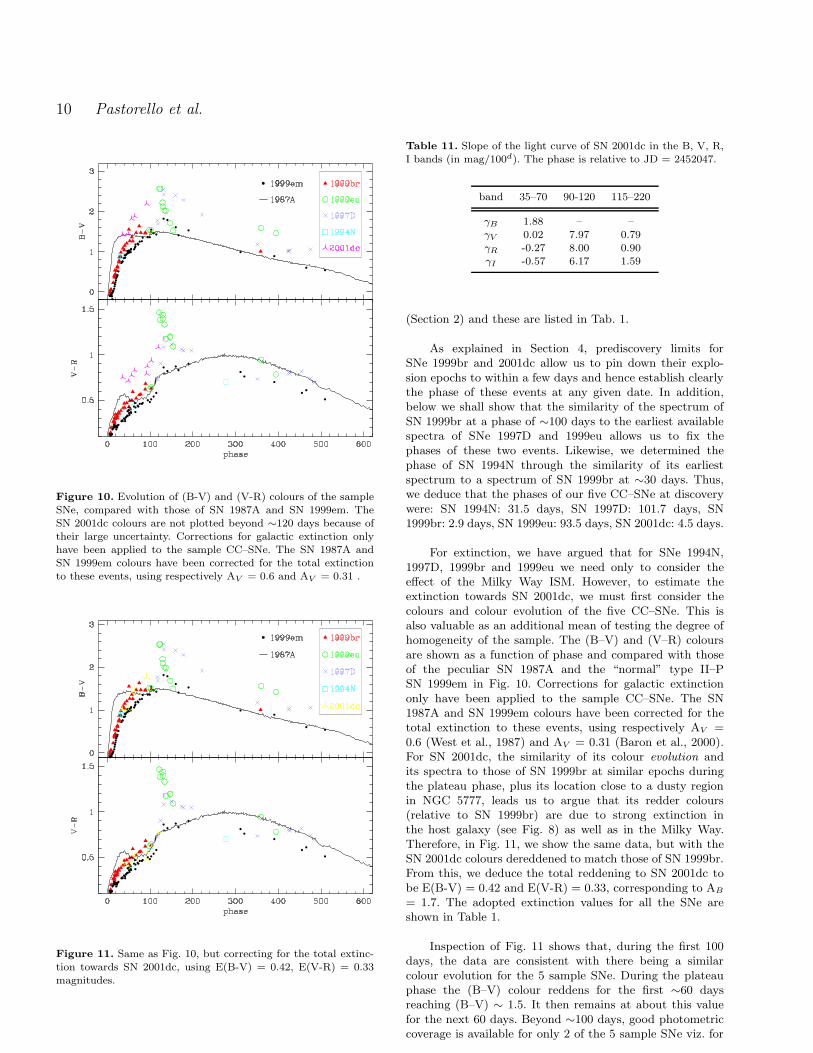
Figure 10. Evolution of (B-V) and (V-R) colours of the sampleSNe, compared with those of SN 1987A and SN 1999em. TheSN 2001dc colours are not plotted beyond ∼120 days because oftheir large uncertainty. Corrections for galactic extinction onlyhave been applied to the sample CC–SNe. The SN 1987A andSN 1999em colours have been corrected for the total extinctionto these events, using respectively AV = 0.6 and AV = 0.31 .
Figure 11. Same as Fig. 10, but correcting for the total extinc-tion towards SN 2001dc, using E(B-V) = 0.42, E(V-R) = 0.33magnitudes.
Table 11. Slope of the light curve of SN 2001dc in the B, V, R,I bands (in mag/100d). The phase is relative to JD = 2452047.
band 35–70 90-120 115–220
γB 1.88 – –γV 0.02 7.97 0.79γR -0.27 8.00 0.90γI -0.57 6.17 1.59
(Section 2) and these are listed in Tab. 1.
As explained in Section 4, prediscovery limits forSNe 1999br and 2001dc allow us to pin down their explo-sion epochs to within a few days and hence establish clearlythe phase of these events at any given date. In addition,below we shall show that the similarity of the spectrum ofSN 1999br at a phase of ∼100 days to the earliest availablespectra of SNe 1997D and 1999eu allows us to fix thephases of these two events. Likewise, we determined thephase of SN 1994N through the similarity of its earliestspectrum to a spectrum of SN 1999br at ∼30 days. Thus,we deduce that the phases of our five CC–SNe at discoverywere: SN 1994N: 31.5 days, SN 1997D: 101.7 days, SN1999br: 2.9 days, SN 1999eu: 93.5 days, SN 2001dc: 4.5 days.
For extinction, we have argued that for SNe 1994N,1997D, 1999br and 1999eu we need only to consider theeffect of the Milky Way ISM. However, to estimate theextinction towards SN 2001dc, we must first consider thecolours and colour evolution of the five CC–SNe. This isalso valuable as an additional mean of testing the degree ofhomogeneity of the sample. The (B–V) and (V–R) coloursare shown as a function of phase and compared with thoseof the peculiar SN 1987A and the “normal” type II–PSN 1999em in Fig. 10. Corrections for galactic extinctiononly have been applied to the sample CC–SNe. The SN1987A and SN 1999em colours have been corrected for thetotal extinction to these events, using respectively AV =0.6 (West et al., 1987) and AV = 0.31 (Baron et al., 2000).For SN 2001dc, the similarity of its colour evolution andits spectra to those of SN 1999br at similar epochs duringthe plateau phase, plus its location close to a dusty regionin NGC 5777, leads us to argue that its redder colours(relative to SN 1999br) are due to strong extinction inthe host galaxy (see Fig. 8) as well as in the Milky Way.Therefore, in Fig. 11, we show the same data, but with theSN 2001dc colours dereddened to match those of SN 1999br.From this, we deduce the total reddening to SN 2001dc tobe E(B-V) = 0.42 and E(V-R) = 0.33, corresponding to AB
= 1.7. The adopted extinction values for all the SNe areshown in Table 1.
Inspection of Fig. 11 shows that, during the first 100days, the data are consistent with there being a similarcolour evolution for the 5 sample SNe. During the plateauphase the (B–V) colour reddens for the first ∼60 daysreaching (B–V) ∼ 1.5. It then remains at about this valuefor the next 60 days. Beyond ∼100 days, good photometriccoverage is available for only 2 of the 5 sample SNe viz. for
Low Luminosity Type II Supernovae 11
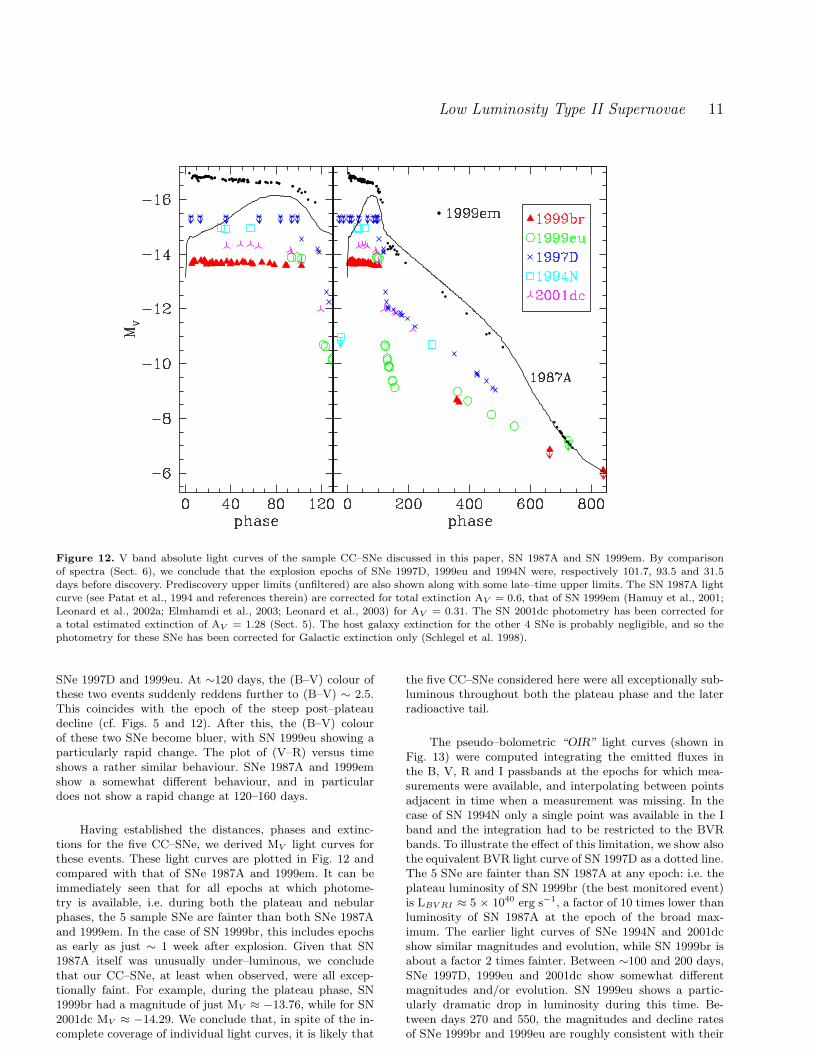
Figure 12. V band absolute light curves of the sample CC–SNe discussed in this paper, SN 1987A and SN 1999em. By comparisonof spectra (Sect. 6), we conclude that the explosion epochs of SNe 1997D, 1999eu and 1994N were, respectively 101.7, 93.5 and 31.5days before discovery. Prediscovery upper limits (unfiltered) are also shown along with some late–time upper limits. The SN 1987A lightcurve (see Patat et al., 1994 and references therein) are corrected for total extinction AV = 0.6, that of SN 1999em (Hamuy et al., 2001;Leonard et al., 2002a; Elmhamdi et al., 2003; Leonard et al., 2003) for AV = 0.31. The SN 2001dc photometry has been corrected fora total estimated extinction of AV = 1.28 (Sect. 5). The host galaxy extinction for the other 4 SNe is probably negligible, and so thephotometry for these SNe has been corrected for Galactic extinction only (Schlegel et al. 1998).
SNe 1997D and 1999eu. At ∼120 days, the (B–V) colour ofthese two events suddenly reddens further to (B–V) ∼ 2.5.This coincides with the epoch of the steep post–plateaudecline (cf. Figs. 5 and 12). After this, the (B–V) colourof these two SNe become bluer, with SN 1999eu showing aparticularly rapid change. The plot of (V–R) versus timeshows a rather similar behaviour. SNe 1987A and 1999emshow a somewhat different behaviour, and in particulardoes not show a rapid change at 120–160 days.
Having established the distances, phases and extinc-tions for the five CC–SNe, we derived MV light curves forthese events. These light curves are plotted in Fig. 12 andcompared with that of SNe 1987A and 1999em. It can beimmediately seen that for all epochs at which photome-try is available, i.e. during both the plateau and nebularphases, the 5 sample SNe are fainter than both SNe 1987Aand 1999em. In the case of SN 1999br, this includes epochsas early as just ∼ 1 week after explosion. Given that SN1987A itself was unusually under–luminous, we concludethat our CC–SNe, at least when observed, were all excep-tionally faint. For example, during the plateau phase, SN1999br had a magnitude of just MV ≈ −13.76, while for SN2001dc MV ≈ −14.29. We conclude that, in spite of the in-complete coverage of individual light curves, it is likely that
the five CC–SNe considered here were all exceptionally sub-luminous throughout both the plateau phase and the laterradioactive tail.
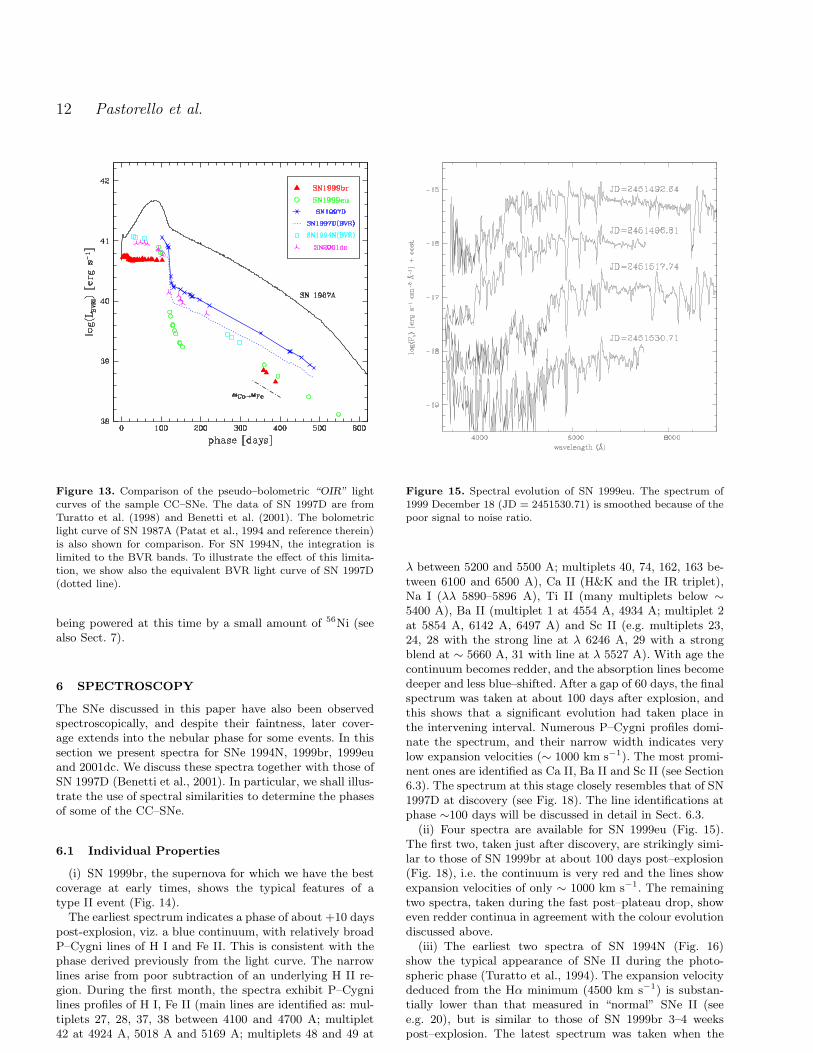
The pseudo–bolometric “OIR” light curves (shown inFig. 13) were computed integrating the emitted fluxes inthe B, V, R and I passbands at the epochs for which mea-surements were available, and interpolating between pointsadjacent in time when a measurement was missing. In thecase of SN 1994N only a single point was available in the Iband and the integration had to be restricted to the BVRbands. To illustrate the effect of this limitation, we show alsothe equivalent BVR light curve of SN 1997D as a dotted line.The 5 SNe are fainter than SN 1987A at any epoch: i.e. theplateau luminosity of SN 1999br (the best monitored event)is LBV RI ≈ 5 × 1040 erg s−1, a factor of 10 times lower thanluminosity of SN 1987A at the epoch of the broad max-imum. The earlier light curves of SNe 1994N and 2001dcshow similar magnitudes and evolution, while SN 1999br isabout a factor 2 times fainter. Between ∼100 and 200 days,SNe 1997D, 1999eu and 2001dc show somewhat differentmagnitudes and/or evolution. SN 1999eu shows a partic-ularly dramatic drop in luminosity during this time. Be-tween days 270 and 550, the magnitudes and decline ratesof SNe 1999br and 1999eu are roughly consistent with their
12 Pastorello et al.
Figure 13. Comparison of the pseudo–bolometric “OIR” lightcurves of the sample CC–SNe. The data of SN 1997D are fromTuratto et al. (1998) and Benetti et al. (2001). The bolometriclight curve of SN 1987A (Patat et al., 1994 and reference therein)is also shown for comparison. For SN 1994N, the integration islimited to the BVR bands. To illustrate the effect of this limita-tion, we show also the equivalent BVR light curve of SN 1997D(dotted line).
being powered at this time by a small amount of 56Ni (seealso Sect. 7).
6 SPECTROSCOPY
The SNe discussed in this paper have also been observedspectroscopically, and despite their faintness, later cover-age extends into the nebular phase for some events. In thissection we present spectra for SNe 1994N, 1999br, 1999euand 2001dc. We discuss these spectra together with those ofSN 1997D (Benetti et al., 2001). In particular, we shall illus-trate the use of spectral similarities to determine the phasesof some of the CC–SNe.
6.1 Individual Properties
(i) SN 1999br, the supernova for which we have the bestcoverage at early times, shows the typical features of atype II event (Fig. 14).
The earliest spectrum indicates a phase of about +10 dayspost-explosion, viz. a blue continuum, with relatively broadP–Cygni lines of H I and Fe II. This is consistent with thephase derived previously from the light curve. The narrowlines arise from poor subtraction of an underlying H II re-gion. During the first month, the spectra exhibit P–Cygnilines profiles of H I, Fe II (main lines are identified as: mul-tiplets 27, 28, 37, 38 between 4100 and 4700 A; multiplet42 at 4924 A, 5018 A and 5169 A; multiplets 48 and 49 at
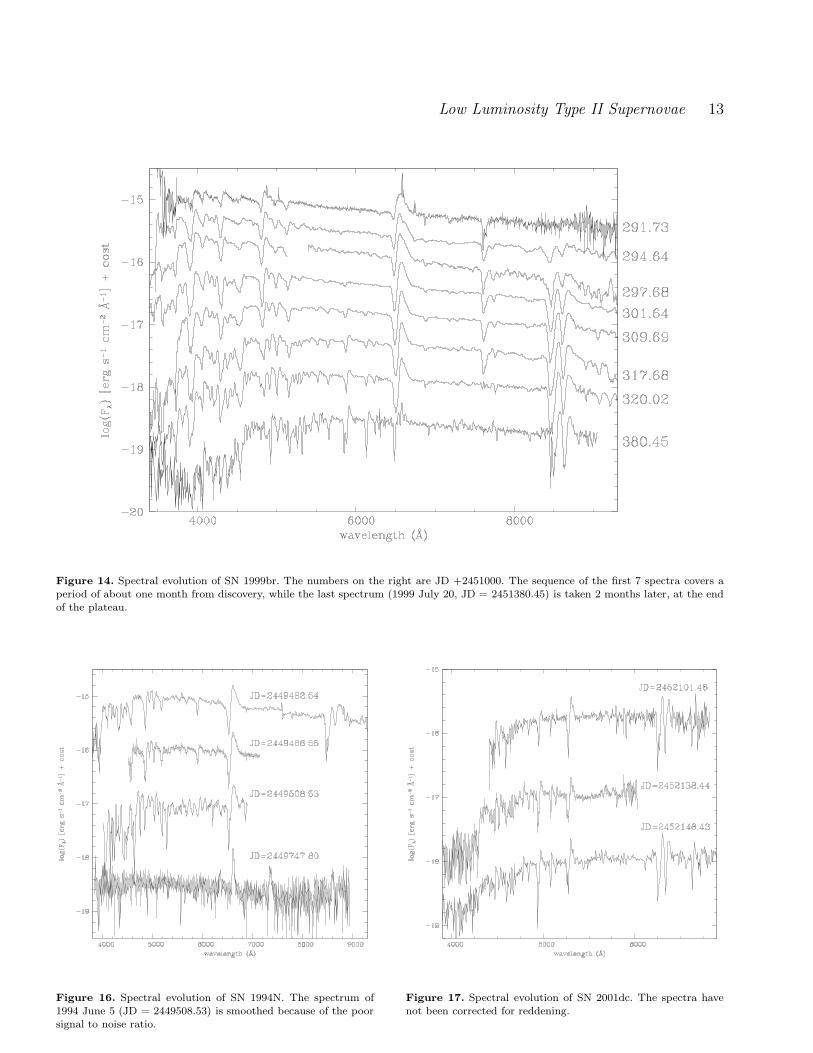
Figure 15. Spectral evolution of SN 1999eu. The spectrum of1999 December 18 (JD = 2451530.71) is smoothed because of thepoor signal to noise ratio.
λ between 5200 and 5500 A; multiplets 40, 74, 162, 163 be-tween 6100 and 6500 A), Ca II (H&K and the IR triplet),Na I (λλ 5890–5896 A), Ti II (many multiplets below ∼
5400 A), Ba II (multiplet 1 at 4554 A, 4934 A; multiplet 2at 5854 A, 6142 A, 6497 A) and Sc II (e.g. multiplets 23,24, 28 with the strong line at λ 6246 A, 29 with a strongblend at ∼ 5660 A, 31 with line at λ 5527 A). With age thecontinuum becomes redder, and the absorption lines becomedeeper and less blue–shifted. After a gap of 60 days, the finalspectrum was taken at about 100 days after explosion, andthis shows that a significant evolution had taken place inthe intervening interval. Numerous P–Cygni profiles domi-nate the spectrum, and their narrow width indicates verylow expansion velocities (∼ 1000 km s−1). The most promi-nent ones are identified as Ca II, Ba II and Sc II (see Section6.3). The spectrum at this stage closely resembles that of SN1997D at discovery (see Fig. 18). The line identifications atphase ∼100 days will be discussed in detail in Sect. 6.3.
(ii) Four spectra are available for SN 1999eu (Fig. 15).The first two, taken just after discovery, are strikingly simi-lar to those of SN 1999br at about 100 days post–explosion(Fig. 18), i.e. the continuum is very red and the lines showexpansion velocities of only ∼ 1000 km s−1. The remainingtwo spectra, taken during the fast post–plateau drop, showeven redder continua in agreement with the colour evolutiondiscussed above.
(iii) The earliest two spectra of SN 1994N (Fig. 16)show the typical appearance of SNe II during the photo-spheric phase (Turatto et al., 1994). The expansion velocitydeduced from the Hα minimum (4500 km s−1) is substan-tially lower than that measured in “normal” SNe II (seee.g. 20), but is similar to those of SN 1999br 3–4 weekspost–explosion. The latest spectrum was taken when the
Low Luminosity Type II Supernovae 13
Figure 14. Spectral evolution of SN 1999br. The numbers on the right are JD +2451000. The sequence of the first 7 spectra covers aperiod of about one month from discovery, while the last spectrum (1999 July 20, JD = 2451380.45) is taken 2 months later, at the endof the plateau.
Figure 16. Spectral evolution of SN 1994N. The spectrum of1994 June 5 (JD = 2449508.53) is smoothed because of the poorsignal to noise ratio.
Figure 17. Spectral evolution of SN 2001dc. The spectra havenot been corrected for reddening.
14 Pastorello et al.
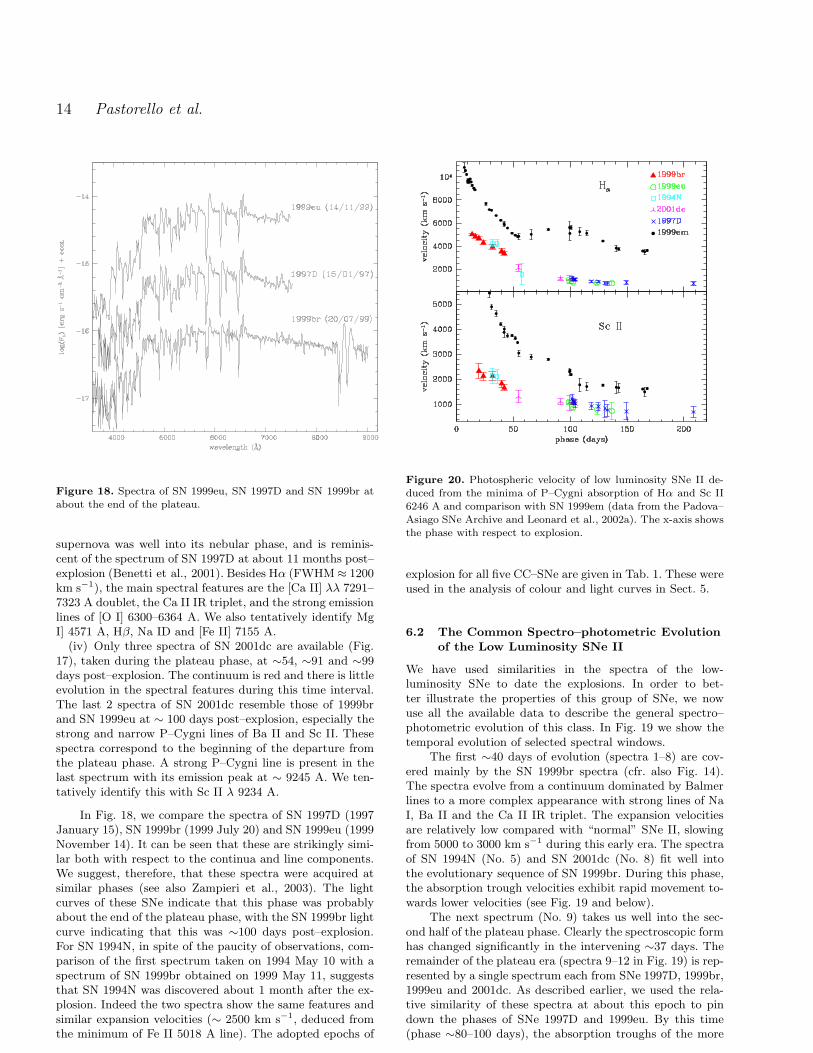
Figure 18. Spectra of SN 1999eu, SN 1997D and SN 1999br atabout the end of the plateau.
supernova was well into its nebular phase, and is reminis-cent of the spectrum of SN 1997D at about 11 months post–explosion (Benetti et al., 2001). Besides Hα (FWHM ≈ 1200km s−1), the main spectral features are the [Ca II] λλ 7291–7323 A doublet, the Ca II IR triplet, and the strong emissionlines of [O I] 6300–6364 A. We also tentatively identify MgI] 4571 A, Hβ, Na ID and [Fe II] 7155 A.
(iv) Only three spectra of SN 2001dc are available (Fig.17), taken during the plateau phase, at ∼54, ∼91 and ∼99days post–explosion. The continuum is red and there is littleevolution in the spectral features during this time interval.The last 2 spectra of SN 2001dc resemble those of 1999brand SN 1999eu at ∼ 100 days post–explosion, especially thestrong and narrow P–Cygni lines of Ba II and Sc II. Thesespectra correspond to the beginning of the departure fromthe plateau phase. A strong P–Cygni line is present in thelast spectrum with its emission peak at ∼ 9245 A. We ten-tatively identify this with Sc II λ 9234 A.
In Fig. 18, we compare the spectra of SN 1997D (1997January 15), SN 1999br (1999 July 20) and SN 1999eu (1999November 14). It can be seen that these are strikingly simi-lar both with respect to the continua and line components.We suggest, therefore, that these spectra were acquired atsimilar phases (see also Zampieri et al., 2003). The lightcurves of these SNe indicate that this phase was probablyabout the end of the plateau phase, with the SN 1999br lightcurve indicating that this was ∼100 days post–explosion.For SN 1994N, in spite of the paucity of observations, com-parison of the first spectrum taken on 1994 May 10 with aspectrum of SN 1999br obtained on 1999 May 11, suggeststhat SN 1994N was discovered about 1 month after the ex-plosion. Indeed the two spectra show the same features andsimilar expansion velocities (∼ 2500 km s−1, deduced fromthe minimum of Fe II 5018 A line). The adopted epochs of
Figure 20. Photospheric velocity of low luminosity SNe II de-duced from the minima of P–Cygni absorption of Hα and Sc II6246 A and comparison with SN 1999em (data from the Padova–Asiago SNe Archive and Leonard et al., 2002a). The x-axis showsthe phase with respect to explosion.
explosion for all five CC–SNe are given in Tab. 1. These wereused in the analysis of colour and light curves in Sect. 5.
6.2 The Common Spectro–photometric Evolution
of the Low Luminosity SNe II
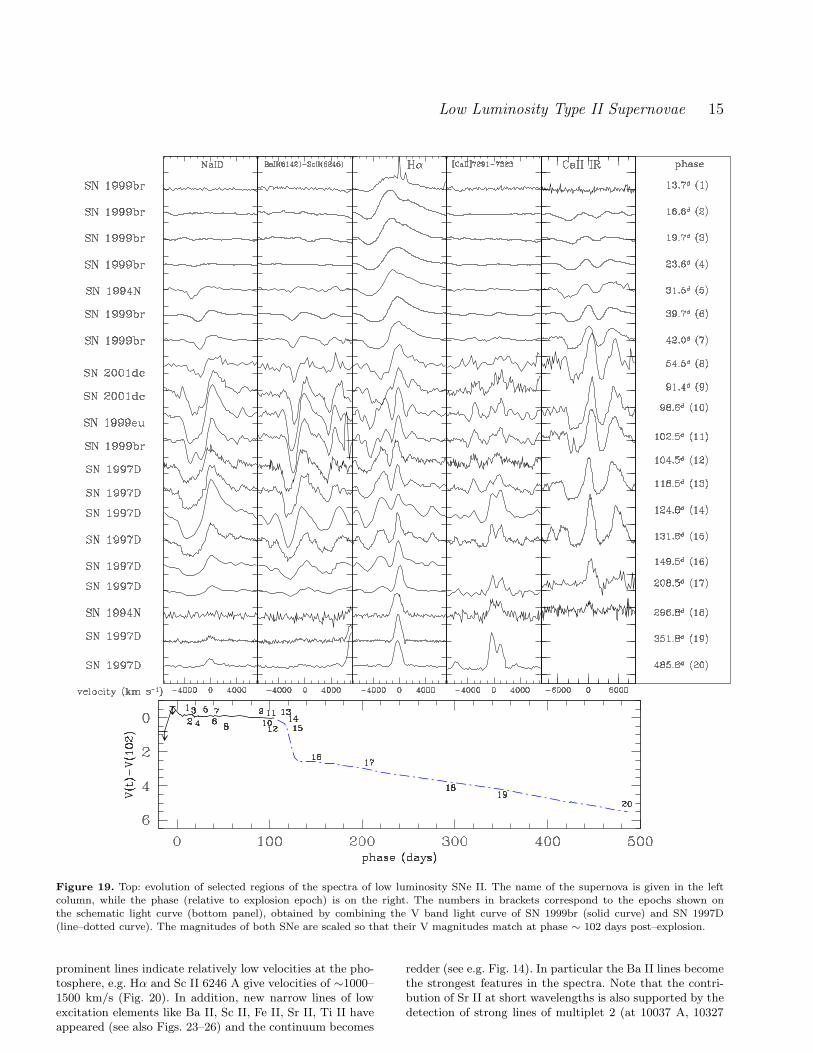
We have used similarities in the spectra of the low-luminosity SNe to date the explosions. In order to bet-ter illustrate the properties of this group of SNe, we nowuse all the available data to describe the general spectro–photometric evolution of this class. In Fig. 19 we show thetemporal evolution of selected spectral windows.
The first ∼40 days of evolution (spectra 1–8) are cov-ered mainly by the SN 1999br spectra (cfr. also Fig. 14).The spectra evolve from a continuum dominated by Balmerlines to a more complex appearance with strong lines of NaI, Ba II and the Ca II IR triplet. The expansion velocitiesare relatively low compared with “normal” SNe II, slowingfrom 5000 to 3000 km s−1 during this early era. The spectraof SN 1994N (No. 5) and SN 2001dc (No. 8) fit well intothe evolutionary sequence of SN 1999br. During this phase,the absorption trough velocities exhibit rapid movement to-wards lower velocities (see Fig. 19 and below).
The next spectrum (No. 9) takes us well into the sec-ond half of the plateau phase. Clearly the spectroscopic formhas changed significantly in the intervening ∼37 days. Theremainder of the plateau era (spectra 9–12 in Fig. 19) is rep-resented by a single spectrum each from SNe 1997D, 1999br,1999eu and 2001dc. As described earlier, we used the rela-tive similarity of these spectra at about this epoch to pindown the phases of SNe 1997D and 1999eu. By this time(phase ∼80–100 days), the absorption troughs of the more
Low Luminosity Type II Supernovae 15
Figure 19. Top: evolution of selected regions of the spectra of low luminosity SNe II. The name of the supernova is given in the leftcolumn, while the phase (relative to explosion epoch) is on the right. The numbers in brackets correspond to the epochs shown onthe schematic light curve (bottom panel), obtained by combining the V band light curve of SN 1999br (solid curve) and SN 1997D(line–dotted curve). The magnitudes of both SNe are scaled so that their V magnitudes match at phase ∼ 102 days post–explosion.
prominent lines indicate relatively low velocities at the pho-tosphere, e.g. Hα and Sc II 6246 A give velocities of ∼1000–1500 km/s (Fig. 20). In addition, new narrow lines of lowexcitation elements like Ba II, Sc II, Fe II, Sr II, Ti II haveappeared (see also Figs. 23–26) and the continuum becomes
redder (see e.g. Fig. 14). In particular the Ba II lines becomethe strongest features in the spectra. Note that the contri-bution of Sr II at short wavelengths is also supported by thedetection of strong lines of multiplet 2 (at 10037 A, 10327
16 Pastorello et al.
Figure 22. Comparison of the spectra of SN 1987A with those of faint SNe II at similar phases. The phases with respect to the explosionepoch are shown in the upper–left corner.
A and 10915 A) in the IR spectrum of SN 1997D presentedby Clocchiatti et al. (2001).
The evolution up to ∼1 month after the plateau(spectra from about 13 to 16) is characterized by thetransition to a nebular spectral form, with the gradualfading of permitted metallic lines and P–Cygni profiles. Inthis phase, narrow forbidden lines have steadily strength-ened (in particular [O I] λλ 6300–6364 A and [Ca II] λλ7291–7323 A, but also some multiplets of [Fe I], [Fe II]and Mg I]), as reported also in Fig. 5 of Benetti et al. (2001).
The spectra of the latest phase (Nos. 17–20) resem-ble those of normal SNe II, with the usual (though nar-rower) emission features attributed to forbidden transitions(Turatto et al., 1993). Nevertheless, the most prominent lineis Hα, and Na ID is still visible as a faint emission line afteralmost 1.5 years.
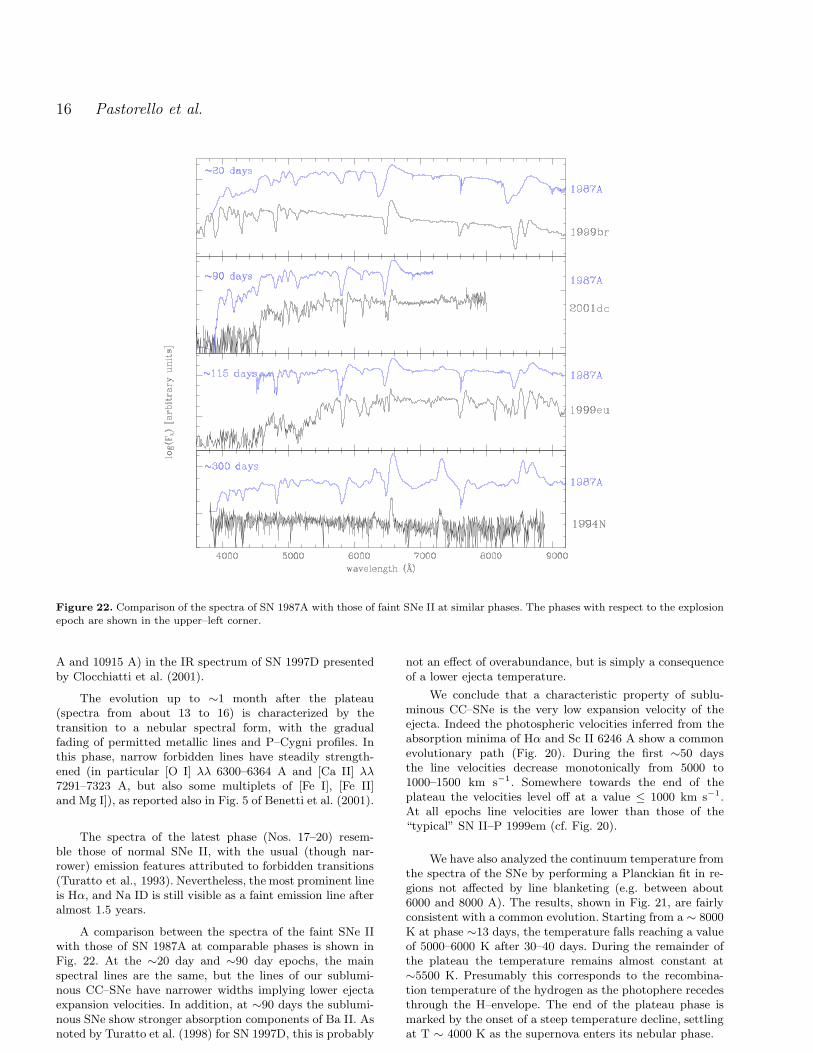
A comparison between the spectra of the faint SNe IIwith those of SN 1987A at comparable phases is shown inFig. 22. At the ∼20 day and ∼90 day epochs, the mainspectral lines are the same, but the lines of our sublumi-nous CC–SNe have narrower widths implying lower ejectaexpansion velocities. In addition, at ∼90 days the sublumi-nous SNe show stronger absorption components of Ba II. Asnoted by Turatto et al. (1998) for SN 1997D, this is probably
not an effect of overabundance, but is simply a consequenceof a lower ejecta temperature.
We conclude that a characteristic property of sublu-minous CC–SNe is the very low expansion velocity of theejecta. Indeed the photospheric velocities inferred from theabsorption minima of Hα and Sc II 6246 A show a commonevolutionary path (Fig. 20). During the first ∼50 daysthe line velocities decrease monotonically from 5000 to1000–1500 km s−1. Somewhere towards the end of theplateau the velocities level off at a value ≤ 1000 km s−1.At all epochs line velocities are lower than those of the“typical” SN II–P 1999em (cf. Fig. 20).
We have also analyzed the continuum temperature fromthe spectra of the SNe by performing a Planckian fit in re-gions not affected by line blanketing (e.g. between about6000 and 8000 A). The results, shown in Fig. 21, are fairlyconsistent with a common evolution. Starting from a ∼ 8000K at phase ∼13 days, the temperature falls reaching a valueof 5000–6000 K after 30–40 days. During the remainder ofthe plateau the temperature remains almost constant at∼5500 K. Presumably this corresponds to the recombina-tion temperature of the hydrogen as the photophere recedesthrough the H–envelope. The end of the plateau phase ismarked by the onset of a steep temperature decline, settlingat T ∼ 4000 K as the supernova enters its nebular phase.

Low
Lum
inosity
Type
IISupern
ova
e17
Fig
ure
23.C
om
pariso
nbetw
eenth
eobserv
edsp
ectrum
ofSN
1999br
at
phase
∼102
day
sand
the
SY
NO
Wsy
nth
eticsp
ectrum
.T
he
solid
curv
eis
the
observ
edsp
ectrum
,co
rrectedfo
rred
shift,
the
dotted
curv
eis
the
synth
eticone.
30003500
40004500
5000
Relative Flux
FeI,FeII,TiI,TiII,CrI,CrII,ScII,MnI,MnII
H,CaII,FeI,TiI,TiII,CrII
H,FeI,FeII,TiII,CrII,ScII,MgI,MnIH,CaII,ScI,FeI,FeII,TiII,BaII
H,CaII,FeI,TiITiI,TiII,FeI,ScI,ScII,SrII,MnI
HI,FeI,FeII,TiII,CrII,SrII,BaIICaI,FeI,FeII,TiII,ScII,CrII,SrII,CrI
H,FeI,FeII,TiII,CaI,ScII,SrII,TiIFeI,FeII,TiII,ScII
FeII,TiII
ScII,FeII,TiII
FeI,FeII,TiI,TiII.CrII,BaIIFeII,TiII,CrII
FeII,TiII,CrII
TiIITiII,MnIFeII,FeI,ScI
TiII,MnI,ScICrII,MnI
BaIIH,TiII,CrII
FeI,FeII,TiIIFeI
CaI,FeI,TiII,MgII
Fig
ure
24.Lin
eid
entifi
catio
nin
the
wav
elength
regio
n3000–5000
Afo
rth
esp
ectrash
own
inFig
.23.
18 Pastorello et al.
4900 5400 5900 6400 6900
Rel
ativ
e F
lux
FeI
,FeI
I,TiI,
TiII
,CrI
ScI
I,TiI
TiII
,FeI
,FeI
IF
eII,M
gI,T
iII
TiII
,FeI
,FeI
I,MnI
ScI
,TiI,
TiII
,FeI
FeI
,CrI
I,CrI
TiII
,CrI
I,FeI
,FeI
I,ScI
ScI
I,FeI
I,ScI
FeI
I,MnI
I,FeI
,OI
ScI
I,ScI
BaI
IN
aID
BaI
,FeI
I,TiII
MnI
ScI
I,FeI
I,TiII
,TiI,
FeI
BaI
I,CaI
ScI
I,FeI
IO
I,FeI
I,ScI
I,ScI
FeI
IO
IF
eII,C
aIB
aII,B
aI,T
iIIF
eII
H,T
iIIS
cII,T
iII,B
aI
TiII
FeI
BaI
,FeI
,FeI
I,MnI
I
Figure 25. Like Fig. 24, but in the wavelength range 4900–6900 A.
6900 7400 7900 8400 8900
Rel
ativ
e F
lux
TiII
BaI
FeI
IT
iII
TiII
TiII
MnI
I
OI
KI
CI
MgI
I
MgI
I
CaI
ICaI
I
CaI
I
FeI
FeI
,FeI
INaI
CI,B
aII
CaI
I
Figure 26. Like Fig. 24, but in the wavelength range 6900–9000 A.
6.3 Identification of the Spectral Lines
The multiplicity of narrow P–Cygni features in the late pho-tospheric spectra of the faint SNe II can help us to identifyunambiguously the species responsible. To exploit this op-
portunity we have modelled the spectra of SN 1999br atphase 102.5 days.
We used the parameterized code, SYNOW(Fisher, 2000), to construct synthetic photospheric spectrawhich were then compared with the observations. The

Low Luminosity Type II Supernovae 19
Figure 21. Evolution of continuum temperature derived from
Planckian fits to the SNe spectra. The continuum of SN 2001dcis corrected for reddening of AB,tot = 1.7, as discussed in Sect.5. The x-axis shows the phase with respect to explosion.
code works in the Sobolev approximation and includesa number of simplifying assumptions. The line–formingenvelope surrounding the continuum–emitting region ex-pands homologously and with spherical symmetry. Theline source function is taken to be that of resonancescattering. The optical depth τ of the strongest opticalline of each ion is a free parameter. For all the other linesof a given ion, τ is found assuming Boltzmann excitation(Jeffery & Branch, 1990). Other free parameters are thevelocity at the photosphere (vph), the continuum blackbodytemperature (Tbb), the excitation temperature (Texc) ofeach ion and the radial dependency of the optical depths.We adjusted these parameters to produce a plausiblespectral match to the ∼102 day spectrum of SN 1999br. Inthe final model we adopted a power–law radial dependencyof index n = 4 with Tbb = 5600 K and vph = 970 km s−1;Texc varies among the ions, but it is about 4000–5000 K forneutral ions and 8000–10000 K for ionized species.
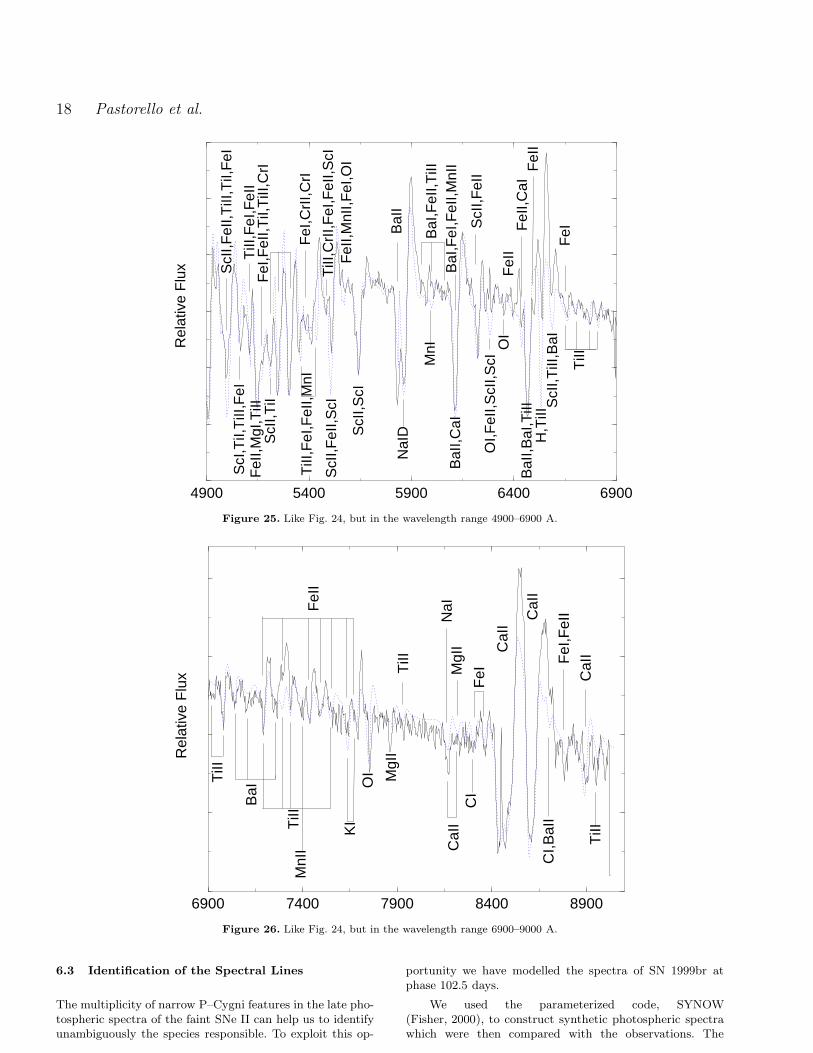
The resulting spectral model, obtained including22 different ions, is compared with the whole observedspectrum in Fig. 23, and with expanded sections shown inFigs. 24–26. The main spectral features are generally quitewell reproduced. In addition the strong line–blanketingbehaviour in the blue (λ ≤ 4600 A) is, at least qualitatively,also seen in the model (Fig. 24).The line–blanketing is due to the presence of many strongmetallic lines, including contributions from neutral andsingly–ionized ions of Fe, Ti, Cr, Sc, Mn, Ca and Sr. TheSr II lines are particularly deep, while the Balmer lines arefainter than is observed in normal SNe II.The region between 4600 and 6500 A (Fig. 25) is dominatedby lines of Fe II, Ti II, Sc II and Ba II, although contri-butions from lines of neutral ions cannot be excluded. At
this phase the absorption lines of Ba II are exceptionallystrong, exceeding in depth the Na ID and Hα lines. Thereproduction of the spectrum in the Hα region is poordue to the inadequacy of the pure resonance–scatteringassumption for the Hα line. Nevertheless, to reproduce thecomplex profile in this region, we require the simultaneouspresence of Ba II, Hα and Sc II.On the red tail of Hα up to ∼7700 A (Fig. 25 and Fig. 26)many narrow, faint Ti II and Fe II lines are superimposed ona strong continuum. However, also present may be growingcontributions from nebular emission lines, in particular [FeII] and [Ca II] λλ 7291, 7324 A. As we move still furtherto the red, the spectrum becomes dominated by the CaII IR features. Other tentatively identified lines include:K I, O I, Mg II, Na I, C I, Fe I, Fe II, Ba II and Ti II (Fig. 26).
7 DISCUSSION
Following our determination of the explosion epochs, wecan conclude that our observations are consistent withlow–luminosity SNe having plateaux of duration ∼100 days,similar to that seen in more normal SN II–P events. Thismay constitute evidence for the presence of massive en-velopes around low–luminosity SNe (Zampieri et al., 2003).We attribute a ∼100 day plateau to SN 1997D. This issignificantly longer than that estimated by Turatto et al.(1998) and Benetti et al. (2001). In general, the plateauluminosities of the faint CC–SNe are unusually low, andshow a range of values between the different events spanningmore than 1 magnitude (see Sect. 5, Fig. 12 and Fig. 13).Although spectroscopic coverage is incomplete for individ-ual events, the data are consistent with the low–luminositySNe having a similar spectroscopic evolution, characterisedby unusually narrow line widths.
At the end of the plateau the light curves show a steepdecline, typically 3 magnitudes in 30–50 days. This effecthas also been observed in other type II–P SNe [e.g. SN1994W, Sollerman et al. (1998); SN 1999em, Elmhamdiet al. (2003)]. Thereafter, for 3 of the 4 SNe for which wehave post–plateau light curves, the decline rate is consis-tent with the power source being the radioactive decayof 56Co. The exception is SN 1999eu, discussed below.Assuming complete trapping of the γ–rays, we comparethe “OIR” pseudo–bolometric luminosities (Fig. 13) withthose of SN 1987A at similar epochs and, using the relationMSN(Ni) = 0.075 ×
LSN
L87AM⊙, we obtain the following
useful lower limits for the ejected 56Ni masses: ∼ 0.008M⊙
for SN 1997D, ∼0.002 M⊙ for SN 1999br, ∼0.006 M⊙ forSN 1994N (using only the BVR bands), ∼0.006 M⊙ forSN 2001dc (with a large uncertainty due to the poor latetime photometry). We note that the value for SN 1997D isa factor 4 higher than the value estimated by Turatto etal., 1998, due to differences in estimated explosion epochand distance (see Tab. 1 for new estimates). By analogywith SN 1987A, we can deduce that no more than 50% ofthe luminosity was lost in unobserved bands. Consequentlywe may conclude that a common feature of these events isejection of a very low 56Ni mass.
20 Pastorello et al.
As mentioned above, SN 1999eu is noticeably differentfrom either SN 1997D or SN 2001dc in that it exhibits aparticularly large post–plateau decline of about 5 magni-tudes. The large decline refers to the entire duration ofthe observations prior to the disappearance of SN 1999eubehind the sun. It’s remarkable that a similar behaviourwas already observed in SN 1994W (Sollerman et al., 1998).Moreover, its luminosity drops to a level which is about 3times lower than would be expected from a simple backwardextrapolation of the later 56Co radioactively–driven tail.Two possible explanations present themselves. One is theearly condensation of dust in the ejecta, causing much ofthe luminosity to be shifted into the unobserved mid– andfar–infrared. Then as the ejecta expanded, the dust becameoptically transparent to the optical luminosity and so thelight curve increasingly followed the radioactive declinerate, with a luminosity corresponding to 0.003 M⊙ of 56Ni.A similar phenomenon was seen in SN 1987A but at a laterepoch. Difficulties with the dust hypothesis are: (a) therather early epoch of the condensation, while the tempera-ture is still rather high in at least some of the ejecta; (b) itsrather “convenient” coincidence with the decline at the endof the plateau. Unfortunately, nebular spectra of SN 1999euare not available and so we cannot check for the occurrenceof a red–wing truncation that dust condensation mightbe expected to produce (cf. SN 1987A and SN 1999em).The second possibility is that the late–time tail is, infact, powered mostly by ejecta–CSM interaction and notby radioactive decay. This would imply an extremely lowejected mass of 56Ni (<0.001 M⊙). A possible difficulty isthat if the light curve is being mostly driven by such aninteraction, then there is no obvious reason why it shouldbe close to the decay rate of 56Co between 350 and 550 days.
In summary, the group of five CC–SNe consideredhere are similar to more typical CC–SNe in that a clearplateau phase occurs lasting for ∼100 days, followed by alate–time decline driven by the decay of 56Co. A similartemperature behaviour is seen (Fig. 21), and the identitiesof the spectral lines at all phases are also typical. However,these SNe differ in that (a) during the plateau phase theluminosity is at least a factor 10 times less than found intypical CC–SNe, (b) the expansion velocity is unusuallyslow (Fig. 20), both during the photospheric and nebularphases, and (c) the mass of 56Co which drives the late–timetail is at least a factor ∼10 lower than normal.
A key issue to address is whether or not the fivelow–luminosity CC–SNe are members of a separate classof CC–SNe arising from a distinctly different progenitortype and/or explosion process, or are they simply samplesfrom the extreme low–luminosity tail of a continuous dis-tribution of otherwise normal explosions. We are currentlyinvestigating this problem through the study of SNe IIhaving luminosities intermediate between normal objects(like SN 1988A or SN 1969L) and the faint events discussedhere. Hamuy (2003) has already considered 24 type IIplateau SNe, deriving a wide range of plateau luminosities(∼5 magnitudes), expansion velocities (∼ ×5) and ejected56Ni masses (> ×150). His sample includes two of ourlow–luminosity events viz. SNe 1999br and 1997D. Hefound that both the mid–plateau MV and ejecta velocity
correlate with the mass of 56Ni ejected as deduced fromthe exponential tail. For a subset of 16 SNe II–P theexplosion energy and total ejected mass also correlatewith the observed properties of plateau luminosity andvelocity. Hamuy asserts that the physical properties of SNeII–P exhibit a continuous range of values, and concludesthat SNe II–P form a one–parameter family. We notethat the four low–luminosity SNe for which we have afair estimate of MV follow the trend of MV at 50 daysversus M(Ni56) shown in Hamuy’s Fig. 3. It therefore seemsreasonable to incline towards the single continuous distri-bution scenario. Given Hamuy’s correlation between ejectakinetic energy and mass of 56Ni ejected, this implies thatlow–luminosity CC–SNe are also low–energy events. Similarresults for a large sample of SNe II–P support Hamuy’sconclusion that a continuous trend of physical parame-ters in SNe II–P exists, also including extremely low andmoderately low luminosity events (Zampieri et al., in prep.).
To account for the low–luminosity CC–SNe, a naturalapproach is to examine the extreme ends of the massspectrum of progenitors from which SNe II–P are believedto arise. The high–mass scenario has been proposed byTuratto et al. (1998), Benetti et al. (2001) and Zampieriet al. (2003). Turatto et al. (1998) found that the observedbehaviour of SN 1997D could be reproduced by the explo-sion of a progenitor with M > 25M⊙, radius R ≤ 300R⊙
and explosion energy E ≈ 4× 1050 erg. They also suggestedthat the central remnant was a black hole (BH) and thatsignificant fallback of stellar material onto the collapsedremnant may have taken place. Zampieri et al. (2003)studied the behaviour of both SN 1997D and SN 1999br.They found that the light curves and the evolution of thecontinuum temperature and expansion velocity are wellreproduced by a comprehensive semi–analytical model inwhich the envelope is ≤ 1013 cm (140 R⊙), the ejectamasses are ∼ 14–20 M⊙ and explosion energy is E ≤ 1051
erg. They deduced somewhat lower progenitor masses thandid by Turatto et al., estimating a progenitor with mass ≥
19 M⊙ for SN 1997D and ≥ 16 M⊙ for SN 1999br. From thelarge ejected masses and low explosion energy, Zampieri etal. conclude that SN 1997D and SN 1999br are intermediatemass, BH–forming CC–SNe.
A contrary conclusion was reached by Chugai &Utrobin (2000). In their analysis of the early– and late–timespectra of SN 1997D, they found that model spectrafor a supernova resulting from a 24 M⊙ progenitor wereincompatible with the observed nebular spectra. Theyconsidered also a low–mass progenitor model in which theobserved behaviour of SN 1997D is reproduced by thelow energy explosion (E ≈ 1050 erg) of a low–metallicityprogenitor. The star has a radius R ≤ 85 R⊙ and atotal main sequence mass of M = 8–12 M⊙ (of which 6M⊙ becomes H rich ejecta). In this case, the remnant isexpected to be a neutron star. They found that this modelgave more successful reproduction of the spectra at bothearly and late times. However, in their analysis Chugai &Utrobin assumed a plateau duration of ∼60 days. The newobservational evidence provided here and in Zampieri et al.(2003) indicates that the plateau of low–luminosity SNe is>∼
100 days. Therefore, it is not clear if the low mass model
Low Luminosity Type II Supernovae 21
may still be able to reproduce the observations with such along plateau duration.
Incidentally, Cappellaro (in prep.) find that roughly50% of low–luminosity SNe II–P occur in late type (Sc)galaxies where recent star formation has occurred, whereasthe fraction for normal SNe II is only ∼ 15 %. This favoursa high–mass progenitor for the low–luminosity events.
Ultimately, it may be possible to devise new observa-tional tests for the high–mass scenarios. Woosley & Weaver(1995) have shown, for a low energy explosion occurring in amassive progenitor, a considerable fraction of 56Ni and otherheavy elements may indeed remain gravitationally bound tothe compact core and fall back onto it. If the fallback is toolarge it can lead to problems in reproducing the observedBarium and other r-process elements (Qian & Wasserburg,2001). However, hydrodynamic calculations show that 1 M⊙
of stellar material can easily remain bound and accrete ontothe core, forming a BH. In principle one might detect sucha BH via the late–time light curve when accretion luminos-ity induced by the fallback overcomes the radioactive decayluminosity (Zampieri, Shapiro & Colpi, 1998). For sphericalsymmetry, the accretion luminosity is predicted to decay ast−25/18 (Zampieri et al., 1998b), but it is also not expectedto dominate the radioactive luminosity until ∼ 3 years post–explosion (Balberg et al., 2000). Consequently this effect iscurrently at the sensitivity limit of the largest ground–basedtelescopes.
8 ARE LOW–LUMINOSITY SNE RARE?
A significant fraction of all types of SNe may be under-luminous, but their faintness may produce a statisticalbias against the discovery of such events (Schaefer, 1996).Richardson et al. (2002) found that for SNe in our Galaxyand in nearby galaxies (µ ≤ 30), possibly more than 20%have an intrinsic MB fainter than –15. The majority ofthese events are of type II–P (both 1997D–like and 1987A–like events). Chugai & Utrobin (2000) speculate that theGalactic supernovae of 1054 and 1181 might have been sub–luminous events similar to SN 1997D. They estimate thatsuch faint SNe make up ∼ 20% of all SNe II–P.
The analysis of archival data and published materialsuggests that several other 1997D–like events have been ob-served in the past. For example, SN 1973R (Ciatti & Rosino,1977) exhibited low plateau luminosity, relatively narrow P–Cygni lines and a light and colour curve behaviour simi-lar to that of SN 1997D, suggesting that it belongs to thisgroup of sub–luminous SNe. Other candidates might be SN1923A (Patat et al., 1994), SN 1978A (Elliott et al., 1978),SN 1999gn (VSNET data; Dimai & Li, 1999; Ayani & Ya-maoka, 1999), SN 2000em (Strolger et al., 2000), SN 2001R(Weisz et al., 2001; Matheson et al., 2001) and the recent SN2003Z (Qiu & Hu, 2003; Matheson et al. 2003). We note, inparticular, that the spectrum of SN 2000em4 taken by theNGSS Team shows many features that are reminiscent ofthose observed in SN 1997D. The Hα emission dominates
4 http://www.ctio.noao.edu/∼ngss/ngss4/ngss4.html
with respect to the Ba II 6497 A line, thus resembling e.g.spectra (8) and (9) in Fig. 19.
SN 1978A (Elliott et al., 1978) exhibited narrow P–Cygni spectral features resembling those of SN 1997D. Acomplex sequence of narrow absorption and emission linesare visible in a rather noisy spectrum (resolution ∼ 10A). SN 1978A is also peculiar in that while its late–timeluminosity was similar to that of 1997D–like events, atdiscovery its absolute magnitude was much higher: ∼ –18.6[Gilmore (1978); Zealey & Tritton (1978)]. A possibleexplanation could be an early interaction with a thincircumstellar shell ejected just before the SN explosion,powering the luminosity at very early phases. However,in this scenario it is difficult to explain the observed lowexpansion velocities at just 2–3 weeks post–explosion.SN 1994W (Sollerman et al., 1998) is also a case wherethe luminosity at maximum was high, but where a low(MNi ≤ 0.015 M⊙) or very low (MNi ≤ 0.0026 M⊙)mass of radioactive 56Ni was ejected, depending on thecontribution to the luminosity of an ejecta–CSM interaction.
The discovery in the past few years of a few SNe spec-troscopically classified as 1997D–like events, suggests thatthe rate of such events is significant. Among type II SNediscovered during 1992–2001 in a volume–limited sample(recession velocities ≤ 4000 km s−1) [Barbon et al., 1999,and recent updates], at least 5 are spectroscopically similarto SN 1997D. This suggests that the incidence of such verylow–luminosity events is about 4–5% of all type II SNe.
9 CONCLUSIONS
In this paper we have presented photometric and spec-troscopic observations of 4 new SNe II, viz. SNe 1999br,1999eu, 1994N and 2001dc. Together with SN 1997D, wehave shown that they form a group of exceptionally low–luminosity events. The discovery of these faint SNe is diffi-cult and their monitoring requires in general large telescopesand long integration times. Partly in consequence of this,the temporal coverage of individual supernovae was erraticand incomplete. However, taken together, they suggest afairly homogeneous set of properties, and provide a reason-ably complete picture of the photometric and spectroscopicevolution of this type of supernova. Establishment of thephase of these events was important, and the best–observedSN 1999br was particularly valuable in this regard (see alsoZampieri et al., 2003).
We find that the group of five CC–SNe considered hereare similar to more typical CC–SNe in that a clear plateauphase occurs lasting for ∼100 days, followed by a late–timedecline driven by the decay of 56Co. A similar temperaturebehaviour is also seen. The spectrum evolves from a rela-tively normal SN II photospheric spectrum to one charac-terized by narrow lines (v ≈ 1000 km s−1), a red continuumand strong Ba II lines. These SNe are unusual in that duringthe plateau phase the luminosity (both V–band and bolo-metric) is at least a factor 10 times less than found in typ-ical CC–SNe. In addition, the expansion velocity is unusu-ally slow both during the photospheric and nebular phases.At the earliest epochs, the photosphere is located at layersexpanding at ∼ 5000 km s−1, but within two months it re-
22 Pastorello et al.
cedes to v ∼ 1000 km s−1. The mass of 56Co which drivesthe late-time tail is at least a factor ∼10 lower than normal,indicating ejected masses of 56Ni in the range 2–8 × 10⁻³
M⊙.Comparison with a sequence of more normal SNe II
(Hamuy, 2003; Zampieri et al., in preparation) suggests thatthis group of SNe represent the extreme low–luminositytail of a single continuous distribution. This indicates thatthe low–luminosity CC–SNe are also low–energy events. Al-though evidence for a low–mass progenitor of low–luminosityCC–SNe may not be completely ruled out yet, recent workseems to support a high mass progenitor scenario (Zampieriet al., 2003).
Finally, we note that selection effects probably limit therate of discovery of low–luminosity SNe, and that their trueincidence may be as high as 4–5% of all type II SNe.
ACKNOWLEDGMENTS
We acknowledge support from the MIUR grant Cofin2001021149, and partial support from NSG grants AST–9986965 and AST–0204771, and NASA grant NAG5–12127.We are grateful to M. Hamuy & M. M. Phillips for provid-ing their data for SN 1999br before publication and to thereferee D. C. Leonard for helpful comments which have im-proved the paper. We thank D. Bramich, L. Contri, R. Cor-radi, S. Desidera, P. Erwin, B. Garcia, E. Giro, D. Lennon,L. Lessio, N. O’Mahoney, J. Rey and A. Zurita for technicalsupport and assistance in the observations of SN 2001dc. A.P. thanks the University of Oklahoma for generous hospital-ity.We are grateful to the VSNET observers, in particular forthe useful information about SN 1999eu.This research has made use of the LEDA database and of theNASA/IPAC Extragalactic Database (NED) which is oper-ated by the Jet Propulsion Laboratory, California Instituteof Technology, under contract with the National Aeronauticsand Space Administration.
REFERENCES
Arnett, W. D., ApJ, 1980, 237, 541
Arnett, W. D., ApJ, 1987, 319, 136Arp, H., 1966, ApJS, 14, 1Ayani, K., Yamaoka, H., 1999, IAU Circ, 7336Balberg, S., Zampieri, L., Shapiro, S. L., 2000, ApJ, 541, 860
Baldwin, J. A., Stone, R. P. S., 1984, MNRAS, 206, 241Barbon, R., Benetti, S., Cappellaro, E., Patat, F., Turatto, M.,
Iijima, T., 1995, A&AS, 110, 513Barbon, R., Buondı, V., Cappellaro, E., Turatto, M., 1999,
A&AS, 139, 531Baron, E. et al., 2000, ApJ, 545, 444
Benetti, S., Cappellaro, E., Turatto, M., 1991, A&A, 247, 410Benetti, S. et al., 2001, MNRAS, 322, 361Blanton, E. L., Schmidt, B. P., Kirshner, R. P., Ford, C. H.,
Chromey, F. R., Herbst, W., 1995, AJ, 110, 2868Boles, T., Beutler, B., Li, W., Qiu, Y. L., Hu, J, Y., IAU Circ.
8062
Bottinelli, L., Gouguenheim, L., Paturel, G., de Vaucouleurs, G.,1985, A&AS, 59, 43
Bottinelli, L., Gouguenheim, L., Fouque, P., Paturel, G., 1990,A&AS, 82, 391
Cappellaro, E., 2003, in preparation
Catchpole, R. M. et al., 1987, MNRAS, 229, P15
Catchpole, R. M. et al, 1988, MNRAS, 231, P75Catchpole, R. M. et al., 1989, MNRAS, 237, P55
Chugai, N. N., Utrobin, V. P., 2000, A&A, 354, 122Clocchiatti, A., Phillips, M. M., Spyromilio, J., Leibundgut, B.,
2001, in N. B. Suntzeff, M. M. Phillips eds., SN 1987A: Ten
Years After, Astron. Soc. Pac., San Francisco
Ciatti, F., Rosino, L., 1977, A&A, 56, 59de Mello, D., Benetti, S., 1997, IAU Circ., 6537
Dimai, A., Li, W., 1999, IAU Circ., 7335Ekholm, T., Lanoix, P., Teerikorpi, P., Fouque, P., Paturel, G.,
2000, A&A 355, 835.Elliott, K. H., Blades, J. C., Zealey, W. J., Tritton, S., 1978,
Nature, 275, 198
Elmhamdi, A. et al., 2003, MNRAS, 338, 939Evans, R., Quirk., S., 2003, IAU Circ., 8042
Filippenko, A. V., Stern, D., Reuland, M., 1999, IAU Circ., 7043Fisher, A., 2000, Ph.D. Thesis, Univ. of Oklahoma
Fouque, P., Solanes, J. P., Sanchis, T., Balkowski, C., 2000, A&A,375, 770
Freedman, W. L. et al., 2001, ApJ, 553, 47
Garcia, A., M., 1993, A&AS, 100, 47
Garnavich, P. et al., 1999, IAU Circ., 7143Garnavich, P., Jha, S., Kirshner, R., Challis, P., Schmidt, B.,
1999, IAU Circ., 7304
Gilmore, G., 1978, IAU Circ. 3221Giovanelli, R., Haynes, M. P., Herter, T., Vogt, N. P., Wegner,
G., Salzer, J. J., da Costa, L. N., Freudling, W., 1997, AJ,113, 22
Giuricin,G., Marinoni,C., Ceriani,L., Pisani,A., 2000, ApJ, 543,178
Hamuy, M., Walker, A. R., Suntzeff, N. B., Gigoux, P., Heathcote,S. R., Phillips, M. M., 1992, PASP, 104, 533
Hamuy, M., Suntzeff, N. B., Heathcote, S. R., Walker, A. R.,Gigoux, P., Phillips, M. M., 1994, PASP, 106, 566
Hamuy, M. et al., 2001, ApJ, 553, 886Hamuy, M., 2003, ApJ, 582, 905
Hamuy, M. et al., 2003b, in preparationHoflich, P., Wheeler J. C., Wang L., 1999, ApJ, 521, 179
Hurst, G. M. et al., 2001, IAU Circ. 7662Iwamoto, K, Mazzali, P. A., Nomoto, K. et al., 1998, Nature, 295,
672
Jeffery, D. J., Branch, D., 1990, in Jerusalem Winter School forTheoretical Physics, Vol. 6, Supernovae, ed. J. C. Wheeler, T.Piran & S. Weinberg (Singapore: World Scientific), 90
King, J. Y., 1999, IAU Circ., 7141
Kraan–Korteweg, R.C., 1986, A&AS, 66, 255
Landolt, A. U., 1992, AJ, 104, 340Leonard, D. C. et al., 2002, PASP, 114, 35
Leonard, D. C. et al., 2002, AJ, 124, 2490Leonard, D. C., Kanbur, S. M., Ngeow C. C., Tanvir, N. R., 2003,
ApJ, 594, 247
Matheson, T., Jha, S., Challis, P., Kirshner, R., Calkins, M., 2001,IAU Circ., 7583
Matheson, T., Challis, P., Kirshner, R., Calkins, M., 2003, IAUCirc., 8063
Mattila, S., Meikle, W.P.S., 2001, MNRAS, 324, 325.Menzies, J. W. et al., 1987, MNRAS, 227, 39
Mueller, J., Brewer, C., Cappellaro, E., della Valle, M., 1993, IAUCirc. 5784
Nakano, S., Aoki, M., 1999, IAU Circ., 7304Patat, F., Barbon, R., Cappellaro, E., Turatto, M., 1994, A&A,
282, 731
Patat, F., Benetti, S., Cappellaro, E., Rizzi, L., Turatto, M., 1999,IAU Circ., 7183
Patat et al., 2001, ApJ, 555, 900
Pooley, D. et al., 2002, ApJ, 572, 932

Low Luminosity Type II Supernovae 23
Popov, D. V., 1992, SvAL, 18, 59
Qian, Y.-Z., Wasserburg, G. J., 2002, ApJ, 123, 678Richardson, D., Branch, D., Cesebeer, D., Millard, J., Thomas,
R. C., Baron, E., 2002, AJ, 123, 745Richmond, M. W. et al., 1996, AJ, 111, 327Ruiz-Lapuente, P., Canal, R., Kidger, M., Lopez, R., 1990, AJ,
100, 782Schaefer, B. E., 1996, ApJ, 464, 404Schlegel, D. J., Finkbeiner, D. P., Davis, M., 1998, ApJ, 500, 525Schmidt, B. P. et al., 1994, AJ, 107, 1444Sersic, J. L., 1973 PASP, 85, 103Smith, R. C., Wells, L., della Valle, M., Bouchet, P., 1992, IAU
Circ., 5638Sollerman, J., Cumming, R. J., Lundqvist, P., 1998, ApJ, 493,
933Sollerman, J., Kozma, C., Fransson, C., Leibundgut, B.,
Lundqvist, P., Ryde, F., Woudt, P, 2000, ApJ, 537, 127Sollerman, J., 2002, NewAR, 46, 493Stone, R. P. S., 1977, ApJ, 218, 767Stone, R. P. S., Baldwin, J. A., 1983, MNRAS, 204, 237Storchi-Bergmann, T., Eracleous, M., Ruiz, M. T., Livio, M., Wil-
son, A. S., Filippenko, A. V., 1997, ApJ, 489, 87Strolger, L.-G., Seguel, J. C., Krick, J., Block, A., Candia, P.,
Smith, R. C., Suntzeff, N. B., Phillips, M. M., 2000, IAU Circ.,7524
Szabo, R., 1999, IAU Circ., 7193Turatto, M., Cappellaro, E., Barbon,R., Della Valle,M., Or-
tolani,S., Rosino,L., 1990, AJ 100, 771Turatto, M., Cappellaro, E., Benetti, S., Danziger, I. J., 1993,
MNRAS, 265, 471Turatto, M., Gouiffes, C., Leibundgut, B., 1994, IAU Circ., 5987Turatto, M. et al., 1998, ApJ, 498, 129Weisz, D., Modjaz, M., Li, W. D., 2001, IAU Circ., 7579West, R. M., Lauberts, A., Jorgensen, H. E., Schuster, H. E.,
1987, A&A, 177, 1Whitelock, P. A. et al., 1988, MNRAS, 234, 5Whitelock, P. A. et al., 1989, MNRAS, 230, 7Wolstencroft, R. D., Tully, R. B., Perley, R. A., 1984, MNRAS,
207, 889Woosley, S. E., Pinto, P. A., Martin, P. G., Weaver, T. A., 1987,
ApJ, 318, 664Woosley, S. E., Weaver, T. A., 1995, ApJS, 101, 181Young, T. R., Baron, E., Branch, D., 1995, ApJ, 449, 51Zampieri, L, Shapiro, S. L., Colpi, M., 1998, ApJ, 502, 149Zampieri, L, Colpi, M., Shapiro, S. L., Wasserman, I., 1998b, ApJ,
505, 876Zampieri, L., Pastorello, A., Turatto, M., Cappellaro, E., Benetti,
S., Altavilla, G., Mazzali, P., Hamuy, M., 2003, MNRAS, 338,711
Zampieri, L. et al., 2003b, in prep.Zealey, W., Tritton, S., 1978, IAU Circ., 3224
Copyright © 2022 FDOKUMEN