BBP photometric systems evaluation 1 Introduction - U.Munari
Upload
khangminh22Category
view
3download
0
MNRAS 470, 1593–1611 (2017) doi:10.1093/mnras/stx1237
An infrared photometric and spectroscopic study of post-AGB stars
V. Venkata Raman,1‹ B. G. Anandarao,1‹ P. Janardhan1 and R. Pandey2
1Physical Research Laboratory (PRL), Navrangpura, Ahmedabad 380009, India2Physics Department, M.L.S. University, Udaipur, India
Accepted 2017 May 18. Received 2017 May 17; in original form 2016 March 3
ABSTRACTWe present here Spitzer mid-infrared (IR) spectra and modelling of the spectral energy dis-tribution (SED) of a selection of post-asymptotic giant branch (PAGB) stars. The mid-IRspectra of the majority of these sources showed spectral features such as polycyclic aromatichydrocarbons (PAHs) and silicates in emission. Our results from SED modelling showedinteresting trends of dependence between the photospheric and circumstellar parameters. Atrend of dependence is also noticed between the ratios of equivalent widths (EWs) of variousvibrational modes of PAHs and the photospheric temperature T∗ and model-derived stellarparameters for the sample stars. The PAGB mass-loss rates derived from the SED models arefound to be higher than those for AGB stars. In a few objects, low- and high-excitation fine-structure emission lines were identified, indicating their advanced stage of evolution. Further,IR vibration modes of fullerene (C60) were detected for the first time in the PAGB star IRAS21546+4721.
Key words: techniques: spectroscopic – stars: AGB and post-AGB – circumstellar matter –stars: evolution – stars: mass-loss – dust, extinction.
1 IN T RO D U C T I O N
Post-asymptotic giant branch (PAGB) stars or protoplanetary neb-ulae (PPNe) represent a short-lived, rapidly varying and little-understood phase during the evolution of intermediate-mass starstowards the planetary nebula (PN) stage (van Winckel 2003; Kwok2007 and references therein). The evolutionary phases of PAGBand PPNe are nearly indistinguishable and from here onwards wetreat the two to be the same. These sources exhibit infrared excessand molecular line emission from dust and molecules in the cir-cumstellar envelopes formed by mass loss during the asymptoticgiant branch (AGB) phase. Circumstellar dust in PAGB stars causessignificant extinction in the visible region. The exact compositionof circumstellar dust grains is still a matter of debate (e.g. see Cer-rigone et al. 2009; Zhang, Kwok & Hrivnak 2010). The evolutionduring the PAGB phase can be identified by several spectroscopicsignatures – from molecular hydrogen emission to atomic hydrogenrecombination lines, as well as forbidden transitions from severalatoms and ions. Further, the onset of UV radiation can also beinferred from the detection of circumstellar polycyclic aromatic hy-drocarbons (PAHs), which are excited by absorption of soft UV ra-diation in carbon-rich PAGB stars (e.g. Kwok 2004; Tielens 2005).Investigation of circumstellar matter and chemical synthesis cantherefore help in probing and understanding the early stages of PNformation.
� E-mail: [email protected] (VVR); [email protected] (BGA)
Pioneering studies on the infrared spectra of PAGB stars weremade and reported by Kwok, Volk & Hrivnak (1999), Hrivnak,Volk & Kwok (2000) and references therein, with particular em-phasis on PAH features and other as yet unidentified features aswell as on molecular hydrogen lines (e.g. Kelly & Hrivnak 2005and references therein). In the present study, we model the SEDs fora fairly large sample of PAGB stars using the available archival datacovering the visible to far-infrared regions. We then endeavour tofind whether the model-derived circumstellar parameters indicate apossible dependence on evolution of the objects.
The sample selection of PAGB stars used in the present studyis described in Section 2. In Section 3 we present mid-IR spectraof the sample sources. In Section 4 we present modelling of SEDsand in Section 5 we discuss the possible correlation between thecircumstellar and photospheric parameters obtained from the SEDmodels and also between the various PAH modes of vibration withthe evolution of the central star. In Section 6 we identify a fewtransition objects in our sample through the detection of low- andhigh-excitation fine-structure lines in the mid-IR spectra. In Section7 we present the detection of fullerenes in one of the sample PAGBstars. In Section 8 we summarize the conclusions of the presentwork.
2 SA M P L E O F PAG B STA R S A N DP H OTO M E T R I C A R C H I VA L DATA
The sample of PAGB stars studied was selected from Szczerba et al.(2007). Based on their JHK-band magnitudes being brighter than13–14, a total of about 71 PAGB stars were identified for the present
C© 2017 The AuthorsPublished by Oxford University Press on behalf of the Royal Astronomical Society
Dow
nloaded from https://academ
ic.oup.com/m
nras/article/470/2/1593/3906740 by guest on 28 May 2022
1594 V. V. Raman et al.
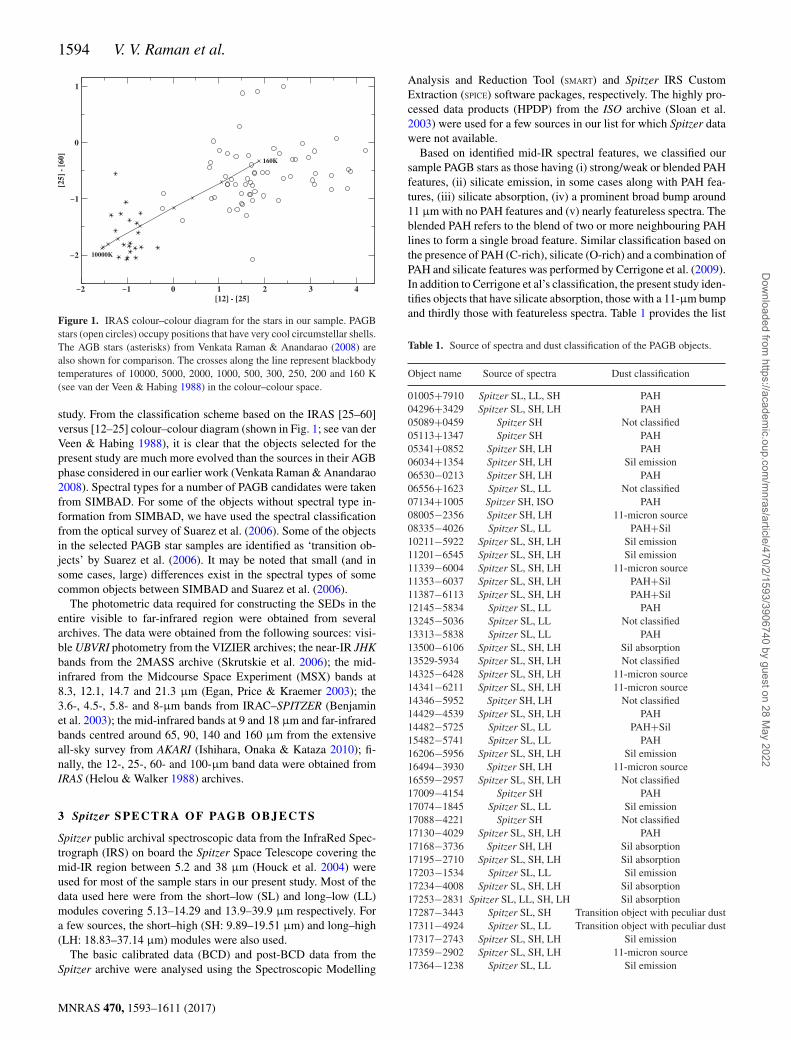
Figure 1. IRAS colour–colour diagram for the stars in our sample. PAGBstars (open circles) occupy positions that have very cool circumstellar shells.The AGB stars (asterisks) from Venkata Raman & Anandarao (2008) arealso shown for comparison. The crosses along the line represent blackbodytemperatures of 10000, 5000, 2000, 1000, 500, 300, 250, 200 and 160 K(see van der Veen & Habing 1988) in the colour–colour space.
study. From the classification scheme based on the IRAS [25–60]versus [12–25] colour–colour diagram (shown in Fig. 1; see van derVeen & Habing 1988), it is clear that the objects selected for thepresent study are much more evolved than the sources in their AGBphase considered in our earlier work (Venkata Raman & Anandarao2008). Spectral types for a number of PAGB candidates were takenfrom SIMBAD. For some of the objects without spectral type in-formation from SIMBAD, we have used the spectral classificationfrom the optical survey of Suarez et al. (2006). Some of the objectsin the selected PAGB star samples are identified as ‘transition ob-jects’ by Suarez et al. (2006). It may be noted that small (and insome cases, large) differences exist in the spectral types of somecommon objects between SIMBAD and Suarez et al. (2006).
The photometric data required for constructing the SEDs in theentire visible to far-infrared region were obtained from severalarchives. The data were obtained from the following sources: visi-ble UBVRI photometry from the VIZIER archives; the near-IR JHKbands from the 2MASS archive (Skrutskie et al. 2006); the mid-infrared from the Midcourse Space Experiment (MSX) bands at8.3, 12.1, 14.7 and 21.3 µm (Egan, Price & Kraemer 2003); the3.6-, 4.5-, 5.8- and 8-µm bands from IRAC–SPITZER (Benjaminet al. 2003); the mid-infrared bands at 9 and 18 µm and far-infraredbands centred around 65, 90, 140 and 160 µm from the extensiveall-sky survey from AKARI (Ishihara, Onaka & Kataza 2010); fi-nally, the 12-, 25-, 60- and 100-µm band data were obtained fromIRAS (Helou & Walker 1988) archives.
3 Spitzer SPECTRA O F PAG B O BJECTS
Spitzer public archival spectroscopic data from the InfraRed Spec-trograph (IRS) on board the Spitzer Space Telescope covering themid-IR region between 5.2 and 38 µm (Houck et al. 2004) wereused for most of the sample stars in our present study. Most of thedata used here were from the short–low (SL) and long–low (LL)modules covering 5.13–14.29 and 13.9–39.9 µm respectively. Fora few sources, the short–high (SH: 9.89–19.51 µm) and long–high(LH: 18.83–37.14 µm) modules were also used.
The basic calibrated data (BCD) and post-BCD data from theSpitzer archive were analysed using the Spectroscopic Modelling
Analysis and Reduction Tool (SMART) and Spitzer IRS CustomExtraction (SPICE) software packages, respectively. The highly pro-cessed data products (HPDP) from the ISO archive (Sloan et al.2003) were used for a few sources in our list for which Spitzer datawere not available.
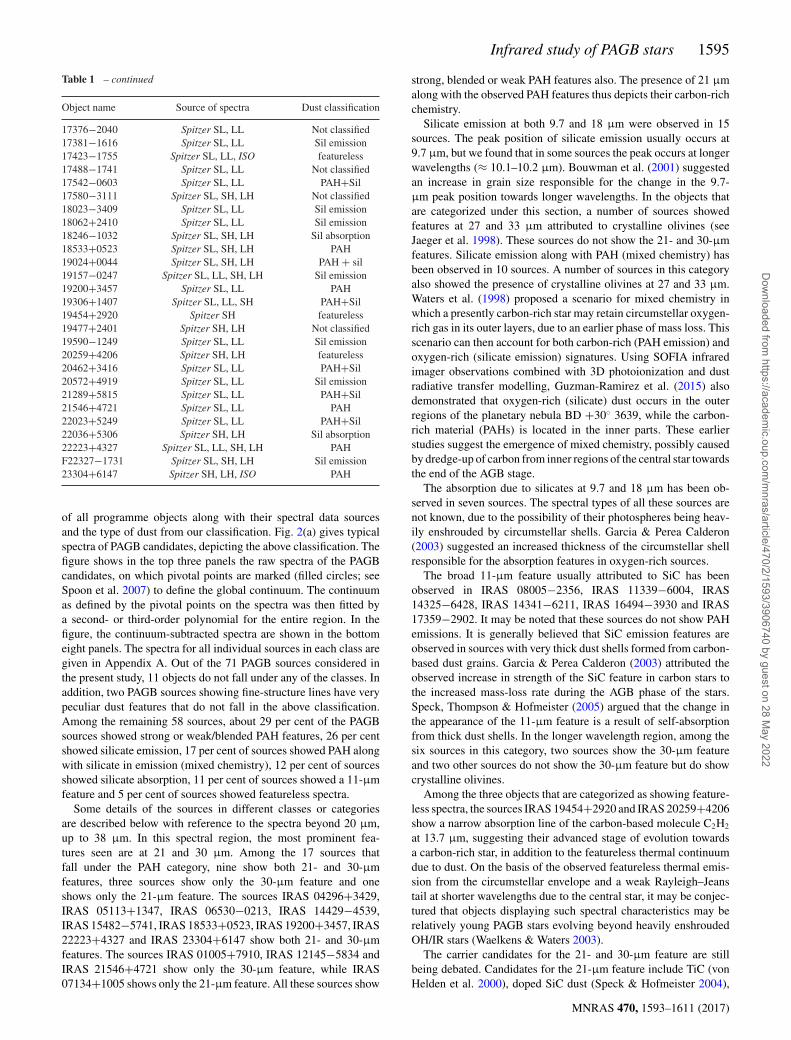
Based on identified mid-IR spectral features, we classified oursample PAGB stars as those having (i) strong/weak or blended PAHfeatures, (ii) silicate emission, in some cases along with PAH fea-tures, (iii) silicate absorption, (iv) a prominent broad bump around11 µm with no PAH features and (v) nearly featureless spectra. Theblended PAH refers to the blend of two or more neighbouring PAHlines to form a single broad feature. Similar classification based onthe presence of PAH (C-rich), silicate (O-rich) and a combination ofPAH and silicate features was performed by Cerrigone et al. (2009).In addition to Cerrigone et al’s classification, the present study iden-tifies objects that have silicate absorption, those with a 11-µm bumpand thirdly those with featureless spectra. Table 1 provides the list
Table 1. Source of spectra and dust classification of the PAGB objects.
Object name Source of spectra Dust classification
01005+7910 Spitzer SL, LL, SH PAH04296+3429 Spitzer SL, SH, LH PAH05089+0459 Spitzer SH Not classified05113+1347 Spitzer SH PAH05341+0852 Spitzer SH, LH PAH06034+1354 Spitzer SH, LH Sil emission06530−0213 Spitzer SH, LH PAH06556+1623 Spitzer SL, LL Not classified07134+1005 Spitzer SH, ISO PAH08005−2356 Spitzer SH, LH 11-micron source08335−4026 Spitzer SL, LL PAH+Sil10211−5922 Spitzer SL, SH, LH Sil emission11201−6545 Spitzer SL, SH, LH Sil emission11339−6004 Spitzer SL, SH, LH 11-micron source11353−6037 Spitzer SL, SH, LH PAH+Sil11387−6113 Spitzer SL, SH, LH PAH+Sil12145−5834 Spitzer SL, LL PAH13245−5036 Spitzer SL, LL Not classified13313−5838 Spitzer SL, LL PAH13500−6106 Spitzer SL, SH, LH Sil absorption13529-5934 Spitzer SL, SH, LH Not classified14325−6428 Spitzer SL, SH, LH 11-micron source14341−6211 Spitzer SL, SH, LH 11-micron source14346−5952 Spitzer SH, LH Not classified14429−4539 Spitzer SL, SH, LH PAH14482−5725 Spitzer SL, LL PAH+Sil15482−5741 Spitzer SL, LL PAH16206−5956 Spitzer SL, SH, LH Sil emission16494−3930 Spitzer SH, LH 11-micron source16559−2957 Spitzer SL, SH, LH Not classified17009−4154 Spitzer SH PAH17074−1845 Spitzer SL, LL Sil emission17088−4221 Spitzer SH Not classified17130−4029 Spitzer SL, SH, LH PAH17168−3736 Spitzer SH, LH Sil absorption17195−2710 Spitzer SL, SH, LH Sil absorption17203−1534 Spitzer SL, LL Sil emission17234−4008 Spitzer SL, SH, LH Sil absorption17253−2831 Spitzer SL, LL, SH, LH Sil absorption17287−3443 Spitzer SL, SH Transition object with peculiar dust17311−4924 Spitzer SL, LL Transition object with peculiar dust17317−2743 Spitzer SL, SH, LH Sil emission17359−2902 Spitzer SL, SH, LH 11-micron source17364−1238 Spitzer SL, LL Sil emission
MNRAS 470, 1593–1611 (2017)
Dow
nloaded from https://academ
ic.oup.com/m
nras/article/470/2/1593/3906740 by guest on 28 May 2022
Infrared study of PAGB stars 1595
Table 1 – continued
Object name Source of spectra Dust classification
17376−2040 Spitzer SL, LL Not classified17381−1616 Spitzer SL, LL Sil emission17423−1755 Spitzer SL, LL, ISO featureless17488−1741 Spitzer SL, LL Not classified17542−0603 Spitzer SL, LL PAH+Sil17580−3111 Spitzer SL, SH, LH Not classified18023−3409 Spitzer SL, LL Sil emission18062+2410 Spitzer SL, LL Sil emission18246−1032 Spitzer SL, SH, LH Sil absorption18533+0523 Spitzer SL, SH, LH PAH19024+0044 Spitzer SL, SH, LH PAH + sil19157−0247 Spitzer SL, LL, SH, LH Sil emission19200+3457 Spitzer SL, LL PAH19306+1407 Spitzer SL, LL, SH PAH+Sil19454+2920 Spitzer SH featureless19477+2401 Spitzer SH, LH Not classified19590−1249 Spitzer SL, LL Sil emission20259+4206 Spitzer SH, LH featureless20462+3416 Spitzer SL, LL PAH+Sil20572+4919 Spitzer SL, LL Sil emission21289+5815 Spitzer SL, LL PAH+Sil21546+4721 Spitzer SL, LL PAH22023+5249 Spitzer SL, LL PAH+Sil22036+5306 Spitzer SH, LH Sil absorption22223+4327 Spitzer SL, LL, SH, LH PAHF22327−1731 Spitzer SL, SH, LH Sil emission23304+6147 Spitzer SH, LH, ISO PAH
of all programme objects along with their spectral data sourcesand the type of dust from our classification. Fig. 2(a) gives typicalspectra of PAGB candidates, depicting the above classification. Thefigure shows in the top three panels the raw spectra of the PAGBcandidates, on which pivotal points are marked (filled circles; seeSpoon et al. 2007) to define the global continuum. The continuumas defined by the pivotal points on the spectra was then fitted bya second- or third-order polynomial for the entire region. In thefigure, the continuum-subtracted spectra are shown in the bottomeight panels. The spectra for all individual sources in each class aregiven in Appendix A. Out of the 71 PAGB sources considered inthe present study, 11 objects do not fall under any of the classes. Inaddition, two PAGB sources showing fine-structure lines have verypeculiar dust features that do not fall in the above classification.Among the remaining 58 sources, about 29 per cent of the PAGBsources showed strong or weak/blended PAH features, 26 per centshowed silicate emission, 17 per cent of sources showed PAH alongwith silicate in emission (mixed chemistry), 12 per cent of sourcesshowed silicate absorption, 11 per cent of sources showed a 11-µmfeature and 5 per cent of sources showed featureless spectra.
Some details of the sources in different classes or categoriesare described below with reference to the spectra beyond 20 µm,up to 38 µm. In this spectral region, the most prominent fea-tures seen are at 21 and 30 µm. Among the 17 sources thatfall under the PAH category, nine show both 21- and 30-µmfeatures, three sources show only the 30-µm feature and oneshows only the 21-µm feature. The sources IRAS 04296+3429,IRAS 05113+1347, IRAS 06530−0213, IRAS 14429−4539,IRAS 15482−5741, IRAS 18533+0523, IRAS 19200+3457, IRAS22223+4327 and IRAS 23304+6147 show both 21- and 30-µmfeatures. The sources IRAS 01005+7910, IRAS 12145−5834 andIRAS 21546+4721 show only the 30-µm feature, while IRAS07134+1005 shows only the 21-µm feature. All these sources show
strong, blended or weak PAH features also. The presence of 21 µmalong with the observed PAH features thus depicts their carbon-richchemistry.
Silicate emission at both 9.7 and 18 µm were observed in 15sources. The peak position of silicate emission usually occurs at9.7 µm, but we found that in some sources the peak occurs at longerwavelengths (≈ 10.1–10.2 µm). Bouwman et al. (2001) suggestedan increase in grain size responsible for the change in the 9.7-µm peak position towards longer wavelengths. In the objects thatare categorized under this section, a number of sources showedfeatures at 27 and 33 µm attributed to crystalline olivines (seeJaeger et al. 1998). These sources do not show the 21- and 30-µmfeatures. Silicate emission along with PAH (mixed chemistry) hasbeen observed in 10 sources. A number of sources in this categoryalso showed the presence of crystalline olivines at 27 and 33 µm.Waters et al. (1998) proposed a scenario for mixed chemistry inwhich a presently carbon-rich star may retain circumstellar oxygen-rich gas in its outer layers, due to an earlier phase of mass loss. Thisscenario can then account for both carbon-rich (PAH emission) andoxygen-rich (silicate emission) signatures. Using SOFIA infraredimager observations combined with 3D photoionization and dustradiative transfer modelling, Guzman-Ramirez et al. (2015) alsodemonstrated that oxygen-rich (silicate) dust occurs in the outerregions of the planetary nebula BD +30◦ 3639, while the carbon-rich material (PAHs) is located in the inner parts. These earlierstudies suggest the emergence of mixed chemistry, possibly causedby dredge-up of carbon from inner regions of the central star towardsthe end of the AGB stage.
The absorption due to silicates at 9.7 and 18 µm has been ob-served in seven sources. The spectral types of all these sources arenot known, due to the possibility of their photospheres being heav-ily enshrouded by circumstellar shells. Garcia & Perea Calderon(2003) suggested an increased thickness of the circumstellar shellresponsible for the absorption features in oxygen-rich sources.
The broad 11-µm feature usually attributed to SiC has beenobserved in IRAS 08005−2356, IRAS 11339−6004, IRAS14325−6428, IRAS 14341−6211, IRAS 16494−3930 and IRAS17359−2902. It may be noted that these sources do not show PAHemissions. It is generally believed that SiC emission features areobserved in sources with very thick dust shells formed from carbon-based dust grains. Garcia & Perea Calderon (2003) attributed theobserved increase in strength of the SiC feature in carbon stars tothe increased mass-loss rate during the AGB phase of the stars.Speck, Thompson & Hofmeister (2005) argued that the change inthe appearance of the 11-µm feature is a result of self-absorptionfrom thick dust shells. In the longer wavelength region, among thesix sources in this category, two sources show the 30-µm featureand two other sources do not show the 30-µm feature but do showcrystalline olivines.
Among the three objects that are categorized as showing feature-less spectra, the sources IRAS 19454+2920 and IRAS 20259+4206show a narrow absorption line of the carbon-based molecule C2H2
at 13.7 µm, suggesting their advanced stage of evolution towardsa carbon-rich star, in addition to the featureless thermal continuumdue to dust. On the basis of the observed featureless thermal emis-sion from the circumstellar envelope and a weak Rayleigh–Jeanstail at shorter wavelengths due to the central star, it may be conjec-tured that objects displaying such spectral characteristics may berelatively young PAGB stars evolving beyond heavily enshroudedOH/IR stars (Waelkens & Waters 2003).
The carrier candidates for the 21- and 30-µm feature are stillbeing debated. Candidates for the 21-µm feature include TiC (vonHelden et al. 2000), doped SiC dust (Speck & Hofmeister 2004),
MNRAS 470, 1593–1611 (2017)
Dow
nloaded from https://academ
ic.oup.com/m
nras/article/470/2/1593/3906740 by guest on 28 May 2022
1596 V. V. Raman et al.
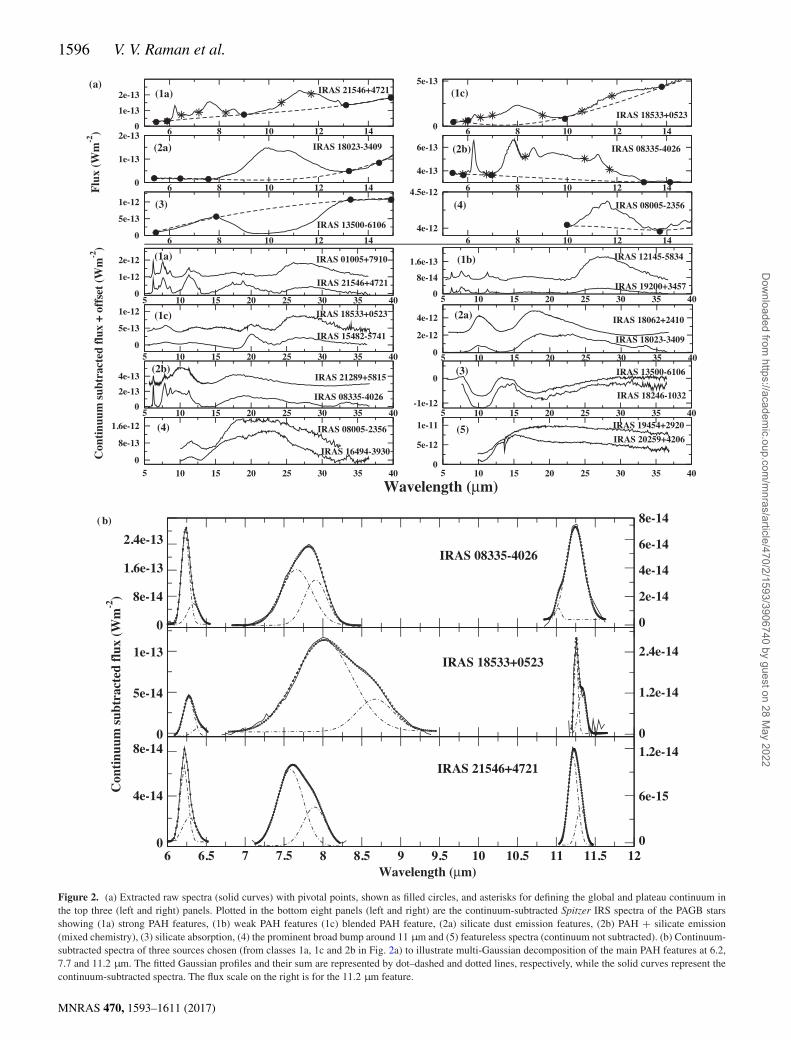
Figure 2. (a) Extracted raw spectra (solid curves) with pivotal points, shown as filled circles, and asterisks for defining the global and plateau continuum inthe top three (left and right) panels. Plotted in the bottom eight panels (left and right) are the continuum-subtracted Spitzer IRS spectra of the PAGB starsshowing (1a) strong PAH features, (1b) weak PAH features (1c) blended PAH feature, (2a) silicate dust emission features, (2b) PAH + silicate emission(mixed chemistry), (3) silicate absorption, (4) the prominent broad bump around 11 µm and (5) featureless spectra (continuum not subtracted). (b) Continuum-subtracted spectra of three sources chosen (from classes 1a, 1c and 2b in Fig. 2a) to illustrate multi-Gaussian decomposition of the main PAH features at 6.2,7.7 and 11.2 µm. The fitted Gaussian profiles and their sum are represented by dot–dashed and dotted lines, respectively, while the solid curves represent thecontinuum-subtracted spectra. The flux scale on the right is for the 11.2 µm feature.
MNRAS 470, 1593–1611 (2017)
Dow
nloaded from https://academ
ic.oup.com/m
nras/article/470/2/1593/3906740 by guest on 28 May 2022

Infrared study of PAGB stars 1597
Table 2. Equivalent widths (in µm) and peak wavelengths (in µm) of PAH features in the sample PAGB candidates.
Name Equivalent width Peak wavelength6.2 µm 7.7 µm 11.2 µm 6.2 µm 7.7 µm 11.2 µm
01005+7910 0.380 ± 0.034 0.379 ± 0.020 0.058 ± 0.005 6.225 ± 0.003 7.555 ± 0.006 11.241 ± 0.00304296+3429 0.158 ± 0.007 0.183 ± 0.025 0.092 ± 0.008 6.262 ± 0.002 7.829 ± 0.068 11.369 ± 0.01305113+1347 – – 0.040 ± 0.005 – – 11.355 ± 0.00405341+0852 – – 0.082 ± 0.006 – – 11.352 ± 0.00306530−0213 – – 0.132 ± 0.027 – – 11.357 ± 0.00707134+1005 – – 0.194 ± 0.017 – – 11.346 ± 0.00408335−4026 0.078 ± 0.006 0.108 ± 0.020 0.031 ± 0.006 6.239 ± 0.003 7.703 ± 0.030 11.243 ± 0.00211353−6037 0.503 ± 0.019 0.514 ± 0.028 0.074 ± 0.005 6.252 ± 0.009 7.773 ± 0.004 11.258 ± 0.00311387−6113 0.056 ± 0.006 0.050 ± 0.005 – 6.307 ± 0.003 7.893 ± 0.021 –12145−5834 0.438 ± 0.016 0.368 ± 0.029 0.112 ± 0.009 6.235 ± 0.002 7.597 ± 0.006 11.255 ± 0.00713313−5838 0.019 ± 0.006 – – 6.285 ± 0.006 – –14429−4539 0.216 ± 0.030 0.356 ± 0.023 0.100 ± 0.019 6.267 ± 0.006 7.938 ± 0.007 11.311 ± 0.00614482−5725 0.041 ± 0.008 0.105 ± 0.020 0.048 ± 0.006 6.298 ± 0.003 8.164 ± 0.012 11.238 ± 0.01115482−5741 0.114 ± 0.025 0.266 ± 0.022 0.048 ± 0.005 6.262 ± 0.010 7.968 ± 0.009 11.297 ± 0.00917009−4154 – – 0.049 ± 0.006 – – 11.253 ± 0.00317130−4029 0.051 ± 0.007 0.174 ± 0.014 – 6.275 ± 0.009 8.065 ± 0.013 –17542−0603 0.011 ± 0.007 0.013 ± 0.005 0.057 ± 0.006 6.312 ± 0.002 7.899 ± 0.002 11.305 ± 0.01118533+0523 0.072 ± 0.009 0.562 ± 0.007 0.011 ± 0.004 6.282 ± 0.002 7.991 ± 0.004 11.260 ± 0.01119024+0044 0.090 ± 0.004 0.021 ± 0.004 – 6.265 ± 0.002 7.740 ± 0.006 –19200+3457 0.441 ± 0.009 0.241 ± 0.041 0.212 ± 0.040 6.232 ± 0.002 7.590 ± 0.014 11.268 ± 0.00419306+1407 0.339 ± 0.005 0.251 ± 0.021 0.006 ± 0.003 6.239 ± 0.007 7.820 ± 0.008 11.242 ± 0.01120462+3416 0.215 ± 0.025 0.343 ± 0.007 0.012 ± 0.064 6.233 ± 0.007 7.692 ± 0.018 11.254 ± 0.01821289+5815 0.100 ± 0.029 0.069 ± 0.005 0.016 ± 0.005 6.241 ± 0.007 7.832 ± 0.017 11.238 ± 0.01421546+4721 0.170 ± 0.009 0.117 ± 0.034 0.007 ± 0.002 6.226 ± 0.002 7.592 ± 0.014 11.226 ± 0.00222023+5249 0.304 ± 0.038 0.373 ± 0.058 0.025 ± 0.005 6.220 ± 0.002 7.743 ± 0.009 11.218 ± 0.00622223+4327 0.025 ± 0.004 0.099 ± 0.009 0.032 ± 0.006 6.267 ± 0.004 7.880 ± 0.028 11.287 ± 0.00423304+6147 – – 0.089 ± 0.004 – – 11.360 ± 0.008
FeO (Posch, Mutschke & Andersen 2004) and PAH molecules(Justtanont et al. 1996). Goebel & Moseley (1985) suggested solidmagnesium sulphide (MgS) as the possible carrier for the 30-µmfeature, while Duley (2000) suggested carbon-based linearmolecules with specific side groups.
For the purpose of analysing the correlations, equivalent widths(EWs) of the most prominent mid-infrared PAH features, namelythose at 6.2, 7.7 and 11.2 µm, were derived using the SpectroscopicModelling Analysis and Reduction Tool (SMART). Table 2 lists theEWs for all objects that showed PAH features. The table also liststhe peak positions of the three features for each object. EWs ofthe three PAH features considered here were determined using theprocedures adopted by Hony et al. (2001), Peeters et al. (2002)and Peeters et al. (2017). In addition to the global continuum asshown in Fig. 2(a), the local continuum around the 5–12 µm regionis enhanced by broad plateaus around 5–7 µm, 7–8 µm (8-µmbump) and 10–12 µm (see Peeters et al. 2017, and the referencestherein). These plateaus are typically shown by asterisks in Fig. 2(a)(see class 1a, 1c, 2b in the top three panels). The pivotal pointsdefining the plateau continua were fitted by second- or third-orderpolynomials and subtracted from the raw spectra. The resultingcontinuum-subtracted spectra around 6.2, 7.7 and 11.2 µm werefitted suitably by single/multi Gaussian profiles (using the LINEFIT task in SMART) to account for the PAH emission features. In mostcases, spectral decomposition using two Gaussians was required toaccount for blended components of PAH emission in 7- and 11-µmregions, while the 6.2-µm feature required a single Gaussian in sixobjects, two in 12 and three Gaussians in three objects. Fig. 2(b)shows continuum-subtracted spectra of three objects (classes 1a,1c and 2b) for which Gaussian decomposition is illustrated. In theliterature, several methods have been used to extract the intensityor EWs of PAH features (e.g. Drude profiles (Smith et al. 2007),
Lorentzian (Galliano et al. 2008) and Gaussian (Uchida et al. 2000;Hony et al. 2001; Peeters et al. 2002, 2017; Blasberger et al. 2017)).In a recent study, Peeters et al. (2017) concluded that for a largesample of objects PAH correlations are independent of the methodadopted. The earlier studies suggested that the line fluxes were onlymarginally affected by the choice of profile, depending more on thechoice of continuum. Further, the line-centre determination does notdepend critically upon the choice of profile (e.g. Blasberger et al.2017). The errors in the EW of the PAH features (see Table 2) wereestimated using the relation
σ 2T (W ) = M.
(hλ
S/N
)2
.Fj
Fc+
[σ (Fc)
Fc.(�λ − W )
]2
(1)
from Chalabaev & Maillard (1983), where hλ is the spectral reso-lution per pixel, M the number of pixels, S/N the signal-to-noiseratio, Fj /Fc represents the ratio of measured flux over the con-tinuum summed over the number of pixels, σ (Fc) represents theuncertainty in the continuum, �λ=λ1 − λ2 is the wavelength rangecovered by the feature and W represents the EW.
4 MO D E L L I N G O F S E D S
The SEDs of the sample stars constructed from archival photometricdata were modelled using the software DUSTY (Ivezic, Nenkova &Elitzur 1999). The input parameters for each object consist of stellarphotospheric temperature (T∗), temperature of the inner region ofthe dust shell (Td), composition of the dust grains, density distri-bution and the optical depth at 0.55 µm (τ 0.55). The compositionof the dust considered here for the individual sources is based onthe observed spectral features in their Spitzer IRS spectra. The pa-rameters that are fixed are T∗, dust particle size limits, size distribu-tion index and density distribution. The variable parameters are Td,
MNRAS 470, 1593–1611 (2017)
Dow
nloaded from https://academ
ic.oup.com/m
nras/article/470/2/1593/3906740 by guest on 28 May 2022

1598 V. V. Raman et al.
composition of dust grains (for continuum we mainly used eithergraphite (Gr) or amorphous carbon (AmC)) and optical depth at0.55 µm (τ 0.55). The code solves the radiative transfer problem fora source embedded in a spherically symmetric dusty envelope. Theimportant output parameters of the code are the total flux as a func-tion of wavelength, the inner shell radius r1, the ratio of the innershell radius and the radius of the central source r1/rc, the terminalvelocity and the upper limit of the mass of the source. The model alsogives an estimate of the total mass-loss rate (dMgas+dust/dt = M)for envelope expansion caused by radiatively driven winds withan uncertainity of 30 per cent. Meixner et al. (1997) and Mishraet al. (2016) used axisymmetric models to infer mass-loss rates. Wefind a good agreement with these models for some sources that arecommon in our sample.
The model fluxes are compared with the observed values bynormalizing with the flux at either the 2-µm (K) or 9-µm band(of MSX or AKARI or IRAC) depending upon the distribution ofobserved data points in the infrared range. T∗ was taken from Allen(2000) and Lang (2006) for objects with spectral types that are iden-tified. For all the other objects (25 in number) for which spectraltypes are unavailable, we have estimated T∗ from model best fits.For the majority of programme objects, the best-fitting degener-acy is very minimal and can be gauged by the uncertainty in Td
(<5 per cent) and τ 0.55 (about 10 per cent), the grain compositionthat contributes for the continuum (< 10 per cent). The criterionfor the best fit was chosen as χ2 = �i[(FOi − FMi)2/FMi] ≤ 10−12,where �i indicates summing over all data points (i = 1 to n, nbeing the number of data points for a particular source) and FOi
and FMi are the observed and model fluxes at the ith data point,respectively. For each object, several models were generated bytweaking the variable parameters (Td, grain composition and τ 0.55)and we chose the best model as determined by the chi-square crite-rion as well as by visual inspection. Barring a few cases, for mostsources in our sample the limit on χ2 resulted in (visually) reason-ably good fits. It may be noted that the spectral class differencesin some of the objects that are common to SIMBAD and Suarezet al. (2006) did not alter the model-derived parameters by morethan 10 per cent.
In general, the double-humped SEDs of PAGB stars indicate de-tached dust shells, in contrast with AGB stars (Venkata Raman &Anandarao 2008). For the purpose of modelling, we have dividedour sample stars into two categories, based on their IRS spectra:(i) those that show clearly the PAH features in the 6–15 µm re-gion and (ii) those showing no PAH features at all. Strong andweak/blended PAHs were modelled using a double-shell geometry,because PAH alone could not account for the continuum emissionon either side of the 5–15 µm region, while the sources with silicatein emission/absorption and broad 11-µm feature were modelled us-ing single-shell geometry. A SED model using a single dust shellwith graphite, amorphous carbon, SiC and silicate dust grains or acombination of these, as the case may be, represented circumstellarsources without PAH emission better. SED models using two shellsbetter modelled strong, weak/blended PAH and mixed chemistrysources, with an inner shell of PAH and an outer shell containinggraphite or amorphous carbon or silicate dust grains. The opticalconstants for the PAH were provided externally into DUSTY, whilethe other dust grains used here are inbuilt with DUSTY. A modi-fied Mathis-Rumpl-Nordsieck (Mathis, Rumpl & Nordsieck 1977)dust-size distribution was assumed with an exponent of 3.5, withminimum and maximum dust grain sizes of 0.005 and 0.25 µm,respectively. A radiatively driven wind model was chosen for thedust shell, with density distribution of type 3 (see Ivezic & Elitzur
1995), in which the envelope expansion is owing to the radiationpressure on dust-grain particles (see Ivezic & Elitzur 1997). Table 3shows the list of single-shelled PAGB sources along with model-derived photospheric and circumstellar shell parameters, namely T∗,Td, M , τ 0.55, r1, r1/rc and the grain composition (Gr is for graphite,AmC for amorphous carbon and Sil for silicate grains, with theportion in 1 given in parentheses). Also listed in Table 3 are thedust mass-loss rates Md, using the following empirical relation byLagadec et al. (2008):
log(Md) = −9.58 + 0.26(Ks − [11]) + 0.05(Ks − [11])2
− 0.0053(Ks − [11])3, (2)
where Ks and [11] are the magnitudes of the sources in the 2MASSK band and VISIR PAH2 filter (λc= 11.25 µm, �λ=0.59 µm), re-spectively. The dust mass-loss rates obtained from infrared colourswere found to be in the range between 10−8 and 10−10 M� yr−1,agreeing well with the results of Lagadec et al. (2008). It is clearfrom the table that the grain composition for all sample starsis carbonaceous dust (either graphite or amorphous carbon or acombination of the two). This result, however, does not fall inline with the finding of Cerrigone et al. (2009), whose sampleshowed only 25 per cent having carbon-rich envelopes. Fig. 3shows typical model fits for PAGB stars with single shells. Pho-tometric observations as well as Spitzer IRS spectra are overplottedfor comparison.
For those sources (27 in number) in which the Spitzer IRS spectrashowed strong PAH emission, we have used two spherical shells(instead of one used before) for the SED modelling using DUSTY.The first or inner shell contains predominantly neutral or ionizedPAH and the second, outer shell contains any of the common dustgrains (amorphous carbon/silicate/graphite). The ratio of the 6.2- or7.6-µm PAH over 11.2-µm feature can be used as a measure of theionization fraction of PAHs, because the ionized PAHs emit morestrongly in the 6.2- and 7.6-µm bands, while the 11.2-µm band isstronger in neutral PAHs. This ratio may be estimated from Spitzermid-IR spectra and whether the PAHs are neutral or ionized maybe ascertained in a given source. The optical properties obtainedfrom Draine & Li (2001) for neutral and ionized PAHs with agrain size of 0.01 µm were used as external input to the DUSTY
software. A density distribution falling off as r−2 was used forboth dust shells. Fig. 4 shows typical model fits with double shellsfor the PAGB candidates. Table 4 show the list of these PAGBsources along with the derived photospheric and circumstellar shellparameters, T∗, Td, ionized state of PAH in the first sphere, r1, r1/rc
for both the shells and the grain composition in dust shell 2. It isassumed that PAH and dust exist in two separate shells, with theformer closer to the star than the latter. The PAH emission maybe from regions very close to the edge of the photodissociationregions.
We note here that it may be quite reasonable to assume that PAHmolecules exist in a separate shell closer to the star, because theyrequire soft UV radiation for excitation. Further, it is possible thatthe PAH shell could form close to the central star during the mostrecent PAGB mass-loss episode, where the outer layer of the centralstar is enriched with carbon-rich materials due to a thermal pulse.As mentioned earlier, Waters et al. (1998) used similar argumentsfor explaining the observed the oxygen- and carbon-rich signaturesin the binary system of the Red Rectangle. Also, Guzman-Ramirezet al. (2015) suggested that, in the planetary nebula BD +30◦ 3639,carbonaceous dust (PAH) exists in the inner regions while oxygen-rich dust (silicates) exists in the outer regions of the nebula.
MNRAS 470, 1593–1611 (2017)
Dow
nloaded from https://academ
ic.oup.com/m
nras/article/470/2/1593/3906740 by guest on 28 May 2022

Infrared study of PAGB stars 1599
Table 3. Parameters derived from SED modelling of PAGB candidates using DUSTY; the spectral types are from SIMBAD and Suarez et al. (2006) and boththe total and dust mass-loss rates are in units of M� yr−1.
Object Sp. type T∗ Td τ 0.55 Grain type r1 (m) r1/rc M Md
05089+0459 M3I 3500 200 6.0 AmC(1.0) 2.1E+14 1.1E+03 5.8E−05 4.4E−0906034+1354 – 5000 300 1.5 AmC(0.9)+Sil(0.1) 7.6E+13 8.2E+02 1.9E−05 2.2E−0906556+1623 Bpe 15000 240 0.3 AmC(0.6)+Gr(0.4) 2.1E+14 2.1E+04 1.5E−05 6.1E−1008005−2356 F5e 6650 440 5.0 Gr(0.9)+SiC(0.1) 5.4E+13 1.0E+03 3.1E−05 8.1E−1010211−5922 – 5000 250 0.3 Gr(0.9)+Sil(0.1) 1.1E+14 1.2E+03 7.5E−06 1.4E−1011201−6545 A3Ie 6000 150 5.0 Sil(0.5)+AmC(0.5) 3.5E+14 5.5E+03 8.7E−05 2.0E−0911339−6004 – 14000 190 8.0 AmC(0.9)+SiC(0.1) 4.0E+14 3.4E+04 1.0E−04 7.6E−0813245−5036 A7Ie 7650 200 7.0 AmC(1.0) 2.9E+14 7.5E+04 8.2E−05 1.5E−1013500−6106 – 11000 280 20.0 AmC(0.1)+Gr(0.1)+Sil(0.8) 8.2E+13 4.2E+03 1.0E−04 2.9E−0813529−5934 – 12000 200 13.0 AmC(0.2)+Gr(0.8) 3.6E+14 2.2E+04 1.2E−04 1.8E−0814325−6428 F5I 6640 160 2.5 AmC(0.9)+SiC(0.1) 5.0E+14 9.6E+03 6.6E−05 1.6E−0914341−6211 – 6000 195 10.0 AmC(0.9)+SiC(0.1) 2.9E+14 4.5E+03 9.5E−05 1.9E−0814346−5952 – 12000 500 10.0 Gr(0.9)+AmC(0.1) 5.0E+13 3.1E+03 4.0E−05 5.5E−1016206−5956 A3Iab:e 8000 105 0.7 AmC(0.3)+Sil(0.7) 7.6E+14 2.1E+04 5.1E−05 1.9E−1016494−3930 G2I 5160 200 8.0 AmC(0.8)+Gr(0.1)+SiC(0.1) 2.5E+14 2.9E+03 7.9E−05 8.2E−0816559−2957 F5Iab:e 6650 220 4.0 AmC(0.7)+Sil(0.3) 1.6E+14 3.1E+03 5.1E−05 1.0E−0817074−1845 B5Ibe 11000 140 3.0 Sil(1.0) 3.3E+14 1.7E+04 1.0E−04 2.1E−0917088−4221 – 14000 250 15.0 AmC(0.1)+Gr(0.9) 2.4E+14 2.1E+04 1.0E−04 6.1E−0817168−3736 – 14000 190 12.0 Gr(0.9)+Sil(0.1) 3.9E+14 3.3E+04 1.2E−04 9.4E−0817195−2710 – 8000 370 9.0 Gr(0.9)+Sil(0.1) 8.1E+13 2.2E+03 5.0E−05 2.6E−0917203−1534 B1IIIpe 10000 130 2.5 Gr(0.3)+Sil(0.7) 5.0E+14 2.1E+04 9.0E−05 1.4E−0917234−4008 – 14000 175 10.0 Gr(0.9)+Sil(0.1) 4.6E+14 3.9E+04 1.2E−04 1.7E−0817253−2831 – 5000 150 4.0 AmC(0.7)+Gr(0.2)+Sil(0.1) 4.5E+14 4.9E+03 7.6E−05 1.3E−0917287−3443 – 18000 150 20.0 AmC(0.3)+Gr(0.7) 7.4E+14 1.0E+05 2.0E−04 1.9E−0817311−4924 B1Iae 15000 200 3.0 Gr(0.4)+Sil(0.6) 2.3E+14 2.9E+04 6.7E−05 2.4E−1017317−2743 F5I 6640 140 7.5 Gr(0.9)+Sil(0.1) 5.2E+14 9.9E+03 1.1E−04 4.1E−1017359−2902 – 8000 230 15.0 Gr(0.9)+SiC(0.1) 2.4E+14 6.6E+03 1.0E−04 5.3E−0917364−1238 – 8000 130 1.0 AmC(0.1)+Sil(0.9) 3.2E+14 8.9E+03 4.6E−05 3.4E−1017376−2040 F6I 6460 280 4.0 AmC(0.5)+Gr(0.5) 1.2E+14 2.2E+03 4.1E−05 9.1E−1017381−1616 B1Ibe 20700 400 1.0 AmC(0.9)+Sil(0.1) 5.7E+13 1.0E+04 1.7E−05 5.1E−0917423−1755 Be 13000 170 5.0 Gr(0.8)+Sil(0.2) 4.0E+14 2.6E+04 8.6E−05 7.7E−1017488−1741 F7I 6280 260 6.5 Gr(1.0) 1.6E+14 2.8E+03 6.0E−05 1.6E−1017580−3111 – 5000 290 15.0 Gr(1.0) 1.1E+14 1.2E+03 7.3E−05 1.2E−0818023−3409 B2IIIe 10000 175 1.0 AmC(0.3)+Sil(0.7) 2.2E+14 9.6E+03 3.7E−05 3.0E−0918062+2410 B1IIIpe 18000 200 1.0 Sil(1.0) 1.9E+14 2.6E+04 4.5E−05 4.0E−0818246−1032 – 20000 130 20.0 Gr(0.8)+Sil(0.2) 8.5E+14 1.3E+05 2.2E−04 2.6E−0819157−0247 B1III 15000 800 2.0 Gr(0.8)+Sil(0.2) 1.5E+13 1.5E+03 1.2E−05 1.5E−0919454+2920 – 10000 180 7.0 AmC(1.0) 4.2E+14 1.8E+04 9.7E−05 4.1E−0819477+2401 F4I 6820 200 10.0 AmC(0.8)+Gr(0.2) 2.8E+14 5.7E+03 9.7E−05 2.7E−1019590−1249 B1Ibe 20000 125 0.1 Gr(0.3)+Sil(0.7) 7.1E+14 1.2E+05 1.8E−05 1.0E−0920259+4206 F3I 6990 200 8.0 AmC(1.0) 2.9E+14 6.1E+03 8.5E−05 2.3E−0820572+4919 F3Ie 7700 265 2.0 Gr(0.85)+Sil(0.15) 1.2E+14 2.9E+03 2.9E−05 8.3E−1022036+5306 – 8000 140 8.0 AmC(0.7)+Gr(0.2)+Sil(0.1) 6.7E+14 1.8E+04 1.3E−04 1.3E−09F22327−1731 A0III 7600 600 0.35 Gr(0.85)+Sil(0.15) 2.2E+13 5.5E+02 4.6E−06 7.5E−10
5 R ESULTS AND DISCUSSION
5.1 Dust-formation distance
The SED modelling reveals a few interesting, physically viablerelationships between various derived parameters. Fig. 5 shows aplot of the inner dust temperature and inner radius of the dust shellfor all the stars in our sample. In the case of objects showing PAHspectra, the inner radii of both the PAH and dust shells are shownin the figure. The plot shows that, as the dust temperature increases,the radius of the inner shell decreases. This simply implies thatthe dust gets cooler as it is located farther from the star. It maybe inferred from the figure that the inner radius of the dust shellcorresponding to a typical condensation temperature for (silicate)dust grains, Tc ∼ 1600 K, is ∼ 3.5 × 10¹² m. This indicates thatthe dust-formation distance from the stellar photosphere is typically
a few stellar radii. It was argued by Woitke, Goeres & Sedlmayr(1996) and Sedlmayr & Winters (2000) that, for pulsationally drivenmass loss to be most efficient, dust formation should occur at a fewstellar radii (R∗).
Fig. 6 shows a plot of T∗ as a function of ratio r1/rc. The plotindicates that the ratio increases with T∗. As the photospheric tem-perature increases, the star emits a copious amount of UV photonsthat destroy the dust and hence the dust can survive only at distancesfar from the star. This explains the positive correlation between thetwo parameters. This is in line with the above argument on theminimum distance of dust formation.
5.2 Trends in the mass-loss rates
The PAGB mass loss mechanisms are not well-understood and arestill being debated. Initially, a continued or extended superwind
MNRAS 470, 1593–1611 (2017)
Dow
nloaded from https://academ
ic.oup.com/m
nras/article/470/2/1593/3906740 by guest on 28 May 2022

1600 V. V. Raman et al.
Figure 3. Model SEDs with single spherical shells using DUSTY (solid line) for a few PAGB sources compared with observed data from the literature (opencircles). The Spitzer IRS spectra (dashed line) are shown for comparison. Being on a log scale, the error bars are of point size.
Figure 4. Model SEDs with two spherical shells using DUSTY (solid line) for a few PAGB sources that showed strong PAH emission compared with observeddata from the literature (open circles). The Spitzer IRS spectra (dashed line) are shown for comparison. Being on a log scale, the error bars are of point size.
phase until the central star attains a certain temperature was assumedin order to explain the PAGB mass-loss rates (Schoenberner 1983).However, very recently Hrivnak, Lu & Nault (2015) attributed thevariation in the PAGB light curve to pulsations that levitate thecircumstellar envelopes to sufficient heights, leading to dust for-mation. As the central stars evolve and the temperature increases,radiation-driven winds facilitate the mass-loss process (Vassiliadis& Wood 1994). The mass-loss rates obtained from the model forour sample of PAGB stars showed the expected trends with the othermodel-derived parameters. Despite considerable scatter, especiallyfor optically thin cases (τ 0.55 ≤ 1.0), one may infer from Fig. 7 an in-creasing trend in mass-loss rate with optical depth at 0.55 µm. Dur-ing the mass-loss process, the dust shell initially remains optically
thin, allowing radiation from the central star to escape. However, asthe mass loss increases, the optical depth increases, leading to theformation of a thick circumstellar shell resulting in the formation ofdust that completely blocks the radiation escaping the central star.These are physically expected results and hence the plots serve asa validation of circumstellar dust shell properties. Fig. 8 shows thetendency of decreasing mass-loss rate with increasing inner dusttemperature, in line with the above arguments. Since most of thedust grains (silicates and graphites) condense at approximately atthe same temperature around 1500 K (Salpeter 1977), a strong de-pendence on the effective temperature (T∗) is expected. An increasein the stellar temperature moves the dust nucleation region outwardand hence towards lower densities, which leads to an ineffective
MNRAS 470, 1593–1611 (2017)
Dow
nloaded from https://academ
ic.oup.com/m
nras/article/470/2/1593/3906740 by guest on 28 May 2022

Infrared study of PAGB stars 1601
Tabl
e4.
Para
met
ers
deri
ved
with
two
shel
lsin
the
SED
mod
ellin
gus
ing
DU
STY
for
the
PAG
Bca
ndid
ates
;the
spec
tral
type
sar
efr
omSI
MB
AD
and
the
tota
lmas
s-lo
ssra
tes
are
inun
itsof
M�
yr−1
.
Obj
ects
Sp.t
ype
T∗
Sphe
re1
Sphe
re2
M
PAH
type
Td
r 1(m
)r 1
/rc
Gra
inty
peT
dr 1
(m)
r 1/r
c
0100
5+79
10B
2Iab
:e15
000
ioni
zed
700
3.1E
+13
3.0E
+03
Gr(
1.0)
250
2.5E
+14
2.4E
+04
4.0E
−05
0429
6+34
29G
0Ia
5510
ioni
zed
600
1.9E
+13
2.5E
+02
Am
C(0
.9)+
Gr(
0.1)
200
2.6E
+14
3.4E
+03
6.6E
−05
0511
3+13
47G
8Ia
4900
neut
ral
250
1.5E
+14
1.6E
+03
Am
C(1
.0)
200
2.4E
+14
2.5E
+03
4.7E
−05
0534
1+08
52F4
Iab
6820
neut
ral
500
4.2E
+13
8.4E
+02
Gr(
1.0)
350
9.6E
+13
1.9E
+03
3.4E
−05
0653
0−02
13F0
Iab:
7300
neut
ral
250
2.4E
+14
5.6E
+03
Gr(
1.0)
100
1.2E
+15
2.8E
+04
5.0E
−05
0713
4+10
05F5
Iab:
6650
neut
ral
600
2.5E
+13
4.7E
+02
Am
C(1
.0)
150
6.1E
+14
1.1E
+04
3.4E
−05
0833
5−40
26B
8e11
500
ioni
zed
700
2.7E
+13
1.5E
+03
Gr(
0.95
)+Si
l(0.
05)
100
1.3E
+15
7.9E
+04
1.2E
−05
1135
3−60
37B
5Ie
1340
0io
nize
d50
07.
3E+1
35.
6E+ 0
3G
r(1.
0)22
03.
0E+1
42.
3E+0
46.
4E−0
511
387−
6113
A3I
8890
neut
ral
190
5.4E
+14
1.85
E+0
4G
r(0.
8)+S
il(0.
2)15
04.
7E+1
41.
6E+0
47.
2E−0
512
145−
5834
–10
000
ioni
zed
500
5.9E
+13
2.5E
+03
Gr(
1.0)
100
1.3E
+15
5.7E
+04
7.4E
−05
1331
3−58
38K
1III
4600
neut
ral
400
4.8E
+13
4.4E
+02
Gr(
0.2)
+Am
C(0
.8)
200
2.3E
+14
2.1E
+03
3.1E
−05
1442
9−45
39F4
I68
20io
nize
d40
07.
0E+1
31.
4E+0
3G
r(0.
6)+A
mC
(0.4
)32
09.
7E+1
31.
9E+0
34.
1E−0
514
482−
5725
A2I
9080
neut
ral
400
4.2E
+13
2.9E
+02
Gr(
1.0)
300
9.1E
+13
6.2E
+02
3.6E
−05
1548
2−57
41F7
I61
00io
nize
d40
06.
1E+1
39.
9E+0
2A
mC
(1.0
)15
05.
9E+1
49.
4E+0
38.
3E−0
517
009−
4154
–45
00ne
utra
l25
01.
4E+1
41.
2E+0
3G
r(1.
0)10
08.
9E+1
47.
8E+ 0
38.
7E−0
517
130−
4029
–14
000
ioni
zed
1300
5.7E
+12
4.8E
+02
Gr(
0.2)
+Am
C(0
.8)
120
1.2E
+15
1.0E
+05
6.5E
−05
1754
2−06
03G
e55
00io
nize
d10
005.
0E+1
26.
5E+0
1G
r(1.
0)50
03.
7E+1
34.
8E+0
21.
6E−0
518
533+
0523
–50
00io
nize
d40
05.
0E+1
35.
4E+0
2G
r(0.
7)+A
mC
(0.3
)10
01.
0E+1
51.
1E+0
49.
4E−0
519
024+
0044
–10
000
ioni
zed
1200
5.6E
+12
2.4E
+02
Am
C(0
.8)+
Sil(
0.2)
130
8.4E
+14
3.6E
+04
1.1E
−04
1920
0+34
57B
...12
000
ioni
zed
500
6.7E
+13
4.1E
+03
Gr(
1.0)
230
2.5E
+14
1.5E
+04
1.5E
−05
1930
6+14
07B
0:e
1540
0io
nize
d80
02.
2E+1
32.
3E+0
3G
r(1.
0)10
01.
6E+1
51.
6E+0
58.
9E−0
520
462+
3416
B1I
ae20
800
ioni
zed
150
1.5E
+15
2.9E
+05
Gr(
0.5)
+Am
C(0
.5)
100
1.7E
+15
3.3E
+05
1.7E
− 05
2128
9+58
15A
2Ie
7000
ioni
zed
700
1.7E
+13
3.5E
+02
Gr(
0.7)
+Sil(
0.3)
300
8.6E
+13
1.8E
+03
3.9E
−05
2154
6+47
21–
1000
0io
nize
d50
05.
9E+1
32.
5E+0
3G
r(1.
0)20
03.
4E+1
41.
4E+0
44.
3E−0
522
023+
5249
Be
1200
0io
nize
d20
06.
1E+1
43.
8E+0
4G
r(0.
2)+A
mC
(0.8
)16
05.
9E+1
43.
6E+0
48.
7E−0
522
223+
4327
F9Ia
6100
ioni
zed
700
1.4E
+13
2.3E
+02
Gr(
1.0)
180
3.2E
+14
5.2E
+03
3.7E
−05
2330
4+61
47G
2Ia
5200
neut
ral
400
5.5E
+13
6.4E
+02
Gr(
0.5)
+Am
C(0
.5)
170
3.6E
+14
4.1E
+03
4.3E
−05
MNRAS 470, 1593–1611 (2017)
Dow
nloaded from https://academ
ic.oup.com/m
nras/article/470/2/1593/3906740 by guest on 28 May 2022

1602 V. V. Raman et al.
Figure 5. Plot of dust temperature Td versus the inner dust shell radius r1
(in m) for PAGB stars (open circles) obtained from DUSTY SED models witha single shell irradiated by radiatively driven winds. The asterisk and plusesrepresent sphere 1 (PAH) and sphere 2 for PAGB candidates modelled witha double circumstellar shell geometry.
Figure 6. Plot of central source temperature T∗ versus the ratio of the innerdust shell radius r1 and the central source radius rc for PAGB stars (opencircles) obtained from DUSTY SED models with a single shell irradiated byradiatively driven winds. The asterisks and pluses represent sphere 1 (PAH)and sphere 2 for PAGB candidates modelled with a double shell geometry.
Figure 7. Plot of total mass-loss rate dM/dt versus optical depth at 0.55 µmτ 0.55 for PAGB stars.
Figure 8. Plot of total mass-loss rate dM/dt versus dust temperature Td forPAGB stars.
coupling between gas and dust, thereby decreasing the mass-lossrates (Lamers & Cassinelli 1999). Also, as Td increases the dustshells tend to be located closer to the central star where dust isdestroyed, leading to a low mass-loss rate.
The colour [K − 12] is often considered as an indicator of massloss in AGB/PAGB stars (Le Bertre & Winters 1998). Anandarao,Pottasch & Vaidya (1993) proposed that the colour index [25 − 2] isa better tool for representing the mass-loss rate in AGB stars. Fig. 9shows a plot of total mass-loss rates for all those PAGB stars thathave single dust shells with [25 − 2] and [K − 12]. Also includedin the figure are the sample of AGB stars from our previous work(Venkata Raman & Anandarao 2008). The figure indicates that themass-loss rate does not cease completely towards the end of theAGB phase, but extends beyond and towards the PAGB phase.The PAGB mass-loss rate was found to be much higher than thatduring the AGB phase. Fig. 9 also shows the mass-loss rates forsome PAGB stars (common with our sample) determined from theobserved CO rotational line profiles by several authors, namelyWoodsworth, Kwok & Chen (1990), Likkel et al. (1991), Omontet al. (1993), Hrivnak & Kwok (1999), Bujarrabal et al. (2001),Hoogzaad et al. (2002) and Hrivnak & Bieging (2005). One can seea good agreement between the model values and those determinedby observations. Fig. 10 shows a plot of dust mass-loss rates as afunction of the colours [25 − 2] and [K − 12], indicating a similartrend to the total mass-loss rate. Fig. 9 shows two distinct regions:an initial positive correlation of mass-loss rate with [K − 12] and[25 − 2] colours due to the initiation of a superwind towards theend of the AGB phase and continued constant high mass-loss ratesduring the PAGB stage, possibly due to pulsation and radiativelydriven winds from the central star. Recently, de Vries et al. (2014)suggested intense mass loss due to ‘hyperwinds’ that occur betweenthe superwind and the PPN phase to explain the high mass-loss ratesduring the PAGB phase. It is, however, not clear as to what causessuch a hyperwind, or for that matter the superwind itself. de Vrieset al. (2015) also suggested the presence of crystalline forsterite(Mg2SiO4) as a signature for massive AGB stars. Based on thevariation in the circumstellar nebular conditions and the observedvariations in the spectral features, Garcia & Perea Calderon (2003)had proposed an evolutionary scheme for both oxygen- and carbon-rich sources in transition from the AGB to the PN phase. About15 stars in our sample show the presence of crystalline forsteriteat the 33.6-µm feature, possibly suggesting their massive nature.These massive AGB stars cannot lose their entire envelope during
MNRAS 470, 1593–1611 (2017)
Dow
nloaded from https://academ
ic.oup.com/m
nras/article/470/2/1593/3906740 by guest on 28 May 2022

Infrared study of PAGB stars 1603
Figure 9. Plot of the total mass-loss rate obtained from DUSTY with mass-loss indexes [25 − 2] and [K − 12] for AGB (asterisks) and PAGB stars (opencircles). The mass-loss rates derived from the observed rotational transitions of CO at mm wavelengths for some of the AGB and PAGB stars in our sample(filled diamonds) are also shown for comparison.
Figure 10. Plot of the dust mass-loss rate obtained using the relation from Lagadec et al. (2008) with the mass-loss indexes [25 − 2] and [K − 12] for thesample PAGB stars (open circles).
the superwind phase alone, so intense mass loss should continuebeyond the superwind phase before the star becomes a PN, thusexplaining our SED model results. Hrivnak & Bieging (2005) hadsuggested intense mass loss during the PAGB phase, responsiblefor the steeper density law for fitting their observed CO rotationalline profiles.
5.3 Trends in PAH modes with evolution
Here we examine the trends in the strength of the PAH emis-sion modes with the stellar effective temperature T∗. T∗ is used to
represent the evolutionary stage of the sources considered in thepresent study; the higher the value, the more advanced the evolu-tion of the source. Interesting correlations were obtained betweenthe strengths of PAH spectral features with the physical and circum-stellar parameters of the PAGB candidates by Peeters et al. (2002),Sloan et al. (2005), Bernard-Salas et al. (2009) and Hony et al.(2001). In this section, we examine the present sample of PAGBobjects for such possible correlations with stellar temperature andother parameters that characterize the circumstellar envelope.
First, we examined the correlation between intensity ratiosI(7.7)/I(11.2) and I(6.2)/I(11.2). Each of these ratios is known to
MNRAS 470, 1593–1611 (2017)
Dow
nloaded from https://academ
ic.oup.com/m
nras/article/470/2/1593/3906740 by guest on 28 May 2022
1604 V. V. Raman et al.
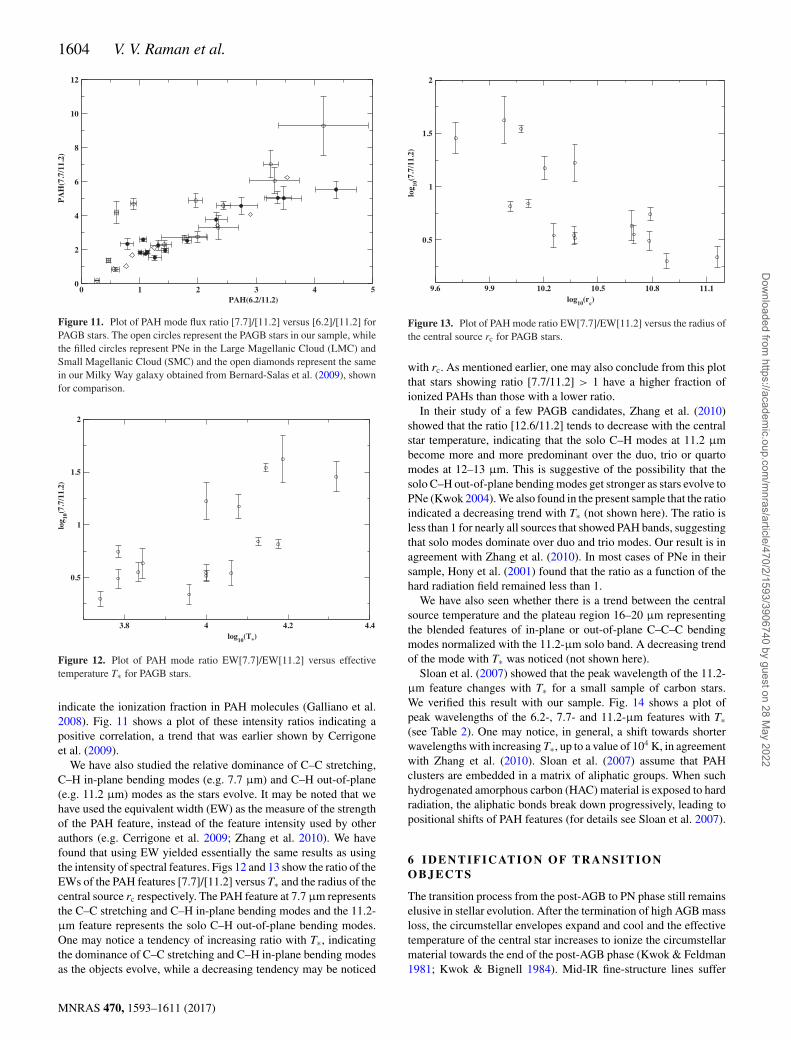
Figure 11. Plot of PAH mode flux ratio [7.7]/[11.2] versus [6.2]/[11.2] forPAGB stars. The open circles represent the PAGB stars in our sample, whilethe filled circles represent PNe in the Large Magellanic Cloud (LMC) andSmall Magellanic Cloud (SMC) and the open diamonds represent the samein our Milky Way galaxy obtained from Bernard-Salas et al. (2009), shownfor comparison.
Figure 12. Plot of PAH mode ratio EW[7.7]/EW[11.2] versus effectivetemperature T∗ for PAGB stars.
indicate the ionization fraction in PAH molecules (Galliano et al.2008). Fig. 11 shows a plot of these intensity ratios indicating apositive correlation, a trend that was earlier shown by Cerrigoneet al. (2009).
We have also studied the relative dominance of C–C stretching,C–H in-plane bending modes (e.g. 7.7 µm) and C–H out-of-plane(e.g. 11.2 µm) modes as the stars evolve. It may be noted that wehave used the equivalent width (EW) as the measure of the strengthof the PAH feature, instead of the feature intensity used by otherauthors (e.g. Cerrigone et al. 2009; Zhang et al. 2010). We havefound that using EW yielded essentially the same results as usingthe intensity of spectral features. Figs 12 and 13 show the ratio of theEWs of the PAH features [7.7]/[11.2] versus T∗ and the radius of thecentral source rc respectively. The PAH feature at 7.7 µm representsthe C–C stretching and C–H in-plane bending modes and the 11.2-µm feature represents the solo C–H out-of-plane bending modes.One may notice a tendency of increasing ratio with T∗, indicatingthe dominance of C–C stretching and C–H in-plane bending modesas the objects evolve, while a decreasing tendency may be noticed
Figure 13. Plot of PAH mode ratio EW[7.7]/EW[11.2] versus the radius ofthe central source rc for PAGB stars.
with rc. As mentioned earlier, one may also conclude from this plotthat stars showing ratio [7.7/11.2] > 1 have a higher fraction ofionized PAHs than those with a lower ratio.
In their study of a few PAGB candidates, Zhang et al. (2010)showed that the ratio [12.6/11.2] tends to decrease with the centralstar temperature, indicating that the solo C–H modes at 11.2 µmbecome more and more predominant over the duo, trio or quartomodes at 12–13 µm. This is suggestive of the possibility that thesolo C–H out-of-plane bending modes get stronger as stars evolve toPNe (Kwok 2004). We also found in the present sample that the ratioindicated a decreasing trend with T∗ (not shown here). The ratio isless than 1 for nearly all sources that showed PAH bands, suggestingthat solo modes dominate over duo and trio modes. Our result is inagreement with Zhang et al. (2010). In most cases of PNe in theirsample, Hony et al. (2001) found that the ratio as a function of thehard radiation field remained less than 1.
We have also seen whether there is a trend between the centralsource temperature and the plateau region 16–20 µm representingthe blended features of in-plane or out-of-plane C–C–C bendingmodes normalized with the 11.2-µm solo band. A decreasing trendof the mode with T∗ was noticed (not shown here).
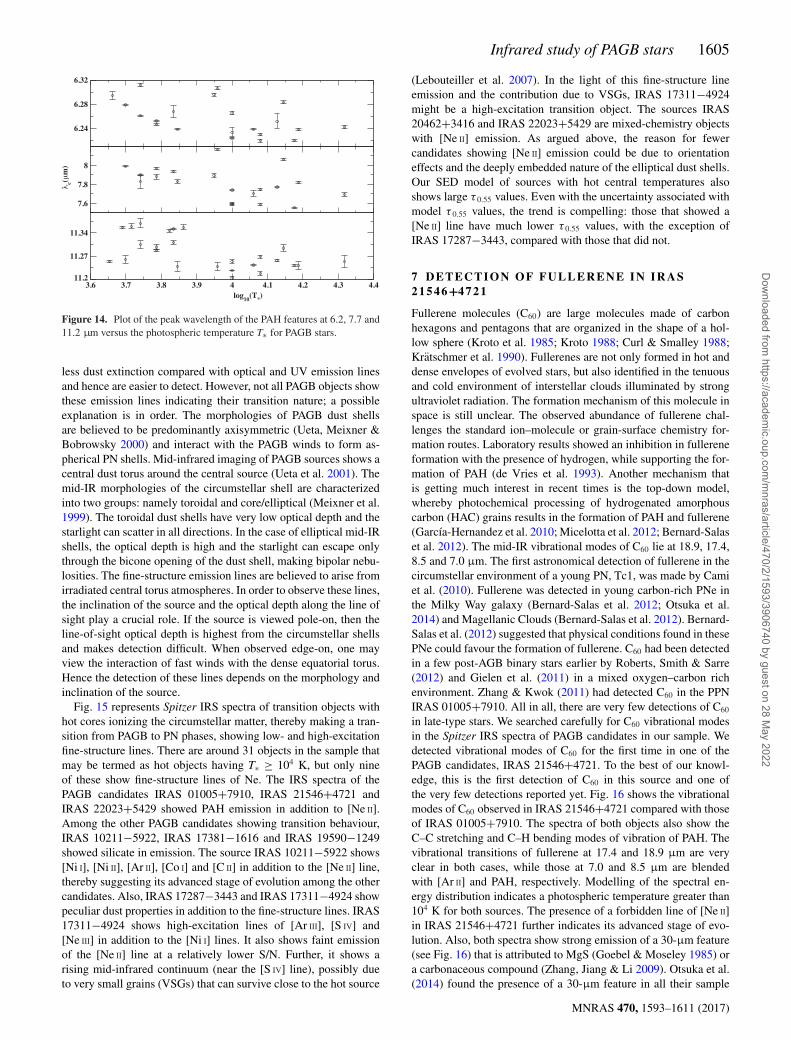
Sloan et al. (2007) showed that the peak wavelength of the 11.2-µm feature changes with T∗ for a small sample of carbon stars.We verified this result with our sample. Fig. 14 shows a plot ofpeak wavelengths of the 6.2-, 7.7- and 11.2-µm features with T∗(see Table 2). One may notice, in general, a shift towards shorterwavelengths with increasing T∗, up to a value of 104 K, in agreementwith Zhang et al. (2010). Sloan et al. (2007) assume that PAHclusters are embedded in a matrix of aliphatic groups. When suchhydrogenated amorphous carbon (HAC) material is exposed to hardradiation, the aliphatic bonds break down progressively, leading topositional shifts of PAH features (for details see Sloan et al. 2007).
6 ID E N T I F I C AT I O N O F T R A N S I T I O NO B J E C T S
The transition process from the post-AGB to PN phase still remainselusive in stellar evolution. After the termination of high AGB massloss, the circumstellar envelopes expand and cool and the effectivetemperature of the central star increases to ionize the circumstellarmaterial towards the end of the post-AGB phase (Kwok & Feldman1981; Kwok & Bignell 1984). Mid-IR fine-structure lines suffer
MNRAS 470, 1593–1611 (2017)
Dow
nloaded from https://academ
ic.oup.com/m
nras/article/470/2/1593/3906740 by guest on 28 May 2022
Infrared study of PAGB stars 1605
Figure 14. Plot of the peak wavelength of the PAH features at 6.2, 7.7 and11.2 µm versus the photospheric temperature T∗ for PAGB stars.
less dust extinction compared with optical and UV emission linesand hence are easier to detect. However, not all PAGB objects showthese emission lines indicating their transition nature; a possibleexplanation is in order. The morphologies of PAGB dust shellsare believed to be predominantly axisymmetric (Ueta, Meixner &Bobrowsky 2000) and interact with the PAGB winds to form as-pherical PN shells. Mid-infrared imaging of PAGB sources shows acentral dust torus around the central source (Ueta et al. 2001). Themid-IR morphologies of the circumstellar shell are characterizedinto two groups: namely toroidal and core/elliptical (Meixner et al.1999). The toroidal dust shells have very low optical depth and thestarlight can scatter in all directions. In the case of elliptical mid-IRshells, the optical depth is high and the starlight can escape onlythrough the bicone opening of the dust shell, making bipolar nebu-losities. The fine-structure emission lines are believed to arise fromirradiated central torus atmospheres. In order to observe these lines,the inclination of the source and the optical depth along the line ofsight play a crucial role. If the source is viewed pole-on, then theline-of-sight optical depth is highest from the circumstellar shellsand makes detection difficult. When observed edge-on, one mayview the interaction of fast winds with the dense equatorial torus.Hence the detection of these lines depends on the morphology andinclination of the source.
Fig. 15 represents Spitzer IRS spectra of transition objects withhot cores ionizing the circumstellar matter, thereby making a tran-sition from PAGB to PN phases, showing low- and high-excitationfine-structure lines. There are around 31 objects in the sample thatmay be termed as hot objects having T∗ ≥ 104 K, but only nineof these show fine-structure lines of Ne. The IRS spectra of thePAGB candidates IRAS 01005+7910, IRAS 21546+4721 andIRAS 22023+5429 showed PAH emission in addition to [Ne II].Among the other PAGB candidates showing transition behaviour,IRAS 10211−5922, IRAS 17381−1616 and IRAS 19590−1249showed silicate in emission. The source IRAS 10211−5922 shows[Ni I], [Ni II], [Ar II], [Co I] and [C II] in addition to the [Ne II] line,thereby suggesting its advanced stage of evolution among the othercandidates. Also, IRAS 17287−3443 and IRAS 17311−4924 showpeculiar dust properties in addition to the fine-structure lines. IRAS17311−4924 shows high-excitation lines of [Ar III], [S IV] and[Ne III] in addition to the [Ni I] lines. It also shows faint emissionof the [Ne II] line at a relatively lower S/N. Further, it shows arising mid-infrared continuum (near the [S IV] line), possibly dueto very small grains (VSGs) that can survive close to the hot source
(Lebouteiller et al. 2007). In the light of this fine-structure lineemission and the contribution due to VSGs, IRAS 17311−4924might be a high-excitation transition object. The sources IRAS20462+3416 and IRAS 22023+5429 are mixed-chemistry objectswith [Ne II] emission. As argued above, the reason for fewercandidates showing [Ne II] emission could be due to orientationeffects and the deeply embedded nature of the elliptical dust shells.Our SED model of sources with hot central temperatures alsoshows large τ 0.55 values. Even with the uncertainty associated withmodel τ 0.55 values, the trend is compelling: those that showed a[Ne II] line have much lower τ 0.55 values, with the exception ofIRAS 17287−3443, compared with those that did not.
7 D E T E C T I O N O F F U L L E R E N E IN IR A S2 1 5 4 6+4 7 2 1
Fullerene molecules (C60) are large molecules made of carbonhexagons and pentagons that are organized in the shape of a hol-low sphere (Kroto et al. 1985; Kroto 1988; Curl & Smalley 1988;Kratschmer et al. 1990). Fullerenes are not only formed in hot anddense envelopes of evolved stars, but also identified in the tenuousand cold environment of interstellar clouds illuminated by strongultraviolet radiation. The formation mechanism of this molecule inspace is still unclear. The observed abundance of fullerene chal-lenges the standard ion–molecule or grain-surface chemistry for-mation routes. Laboratory results showed an inhibition in fullereneformation with the presence of hydrogen, while supporting the for-mation of PAH (de Vries et al. 1993). Another mechanism thatis getting much interest in recent times is the top-down model,whereby photochemical processing of hydrogenated amorphouscarbon (HAC) grains results in the formation of PAH and fullerene(Garcıa-Hernandez et al. 2010; Micelotta et al. 2012; Bernard-Salaset al. 2012). The mid-IR vibrational modes of C60 lie at 18.9, 17.4,8.5 and 7.0 µm. The first astronomical detection of fullerene in thecircumstellar environment of a young PN, Tc1, was made by Camiet al. (2010). Fullerene was detected in young carbon-rich PNe inthe Milky Way galaxy (Bernard-Salas et al. 2012; Otsuka et al.2014) and Magellanic Clouds (Bernard-Salas et al. 2012). Bernard-Salas et al. (2012) suggested that physical conditions found in thesePNe could favour the formation of fullerene. C60 had been detectedin a few post-AGB binary stars earlier by Roberts, Smith & Sarre(2012) and Gielen et al. (2011) in a mixed oxygen–carbon richenvironment. Zhang & Kwok (2011) had detected C60 in the PPNIRAS 01005+7910. All in all, there are very few detections of C60
in late-type stars. We searched carefully for C60 vibrational modesin the Spitzer IRS spectra of PAGB candidates in our sample. Wedetected vibrational modes of C60 for the first time in one of thePAGB candidates, IRAS 21546+4721. To the best of our knowl-edge, this is the first detection of C60 in this source and one ofthe very few detections reported yet. Fig. 16 shows the vibrationalmodes of C60 observed in IRAS 21546+4721 compared with thoseof IRAS 01005+7910. The spectra of both objects also show theC–C stretching and C–H bending modes of vibration of PAH. Thevibrational transitions of fullerene at 17.4 and 18.9 µm are veryclear in both cases, while those at 7.0 and 8.5 µm are blendedwith [Ar II] and PAH, respectively. Modelling of the spectral en-ergy distribution indicates a photospheric temperature greater than104 K for both sources. The presence of a forbidden line of [Ne II]in IRAS 21546+4721 further indicates its advanced stage of evo-lution. Also, both spectra show strong emission of a 30-µm feature(see Fig. 16) that is attributed to MgS (Goebel & Moseley 1985) ora carbonaceous compound (Zhang, Jiang & Li 2009). Otsuka et al.(2014) found the presence of a 30-µm feature in all their sample
MNRAS 470, 1593–1611 (2017)
Dow
nloaded from https://academ
ic.oup.com/m
nras/article/470/2/1593/3906740 by guest on 28 May 2022

1606 V. V. Raman et al.
Figure 15. Transition objects from our sample showing prominent low- and high-excitation fine-structure lines.
Figure 16. Spitzer IRS spectra of PAGB candidates IRAS 21546+4721 and IRAS 01005+7910, showing vibrational modes of C60 fullerene.
Galactic PNe that have fullerene. Further, the absence of a 21-µm feature in the mid-IR spectra of IRAS 21546+4721 and IRAS01005+7910 rules out the possibility of fullerene as a carrier forthis feature, as suggested by Justtanont et al. (1996) and Garcia et al.(1999).
8 C O N C L U S I O N S
(i) Based on our analysis of Spitzer mid-infrared spectra of afairly large sample of PAGB stars, we have broadly classified themin to those having
(a) strong/weak or blended PAH,(b) silicate emission, in some cases along with PAH features,(c) silicate absorption,(d) a prominent broad bump around 11 µm and(e) nearly featureless spectra.
(ii) The SED modelling of the PAGB objects shows that thetemperature of the inner dust shell decreases with increasing innerradius r1, while the ratio r1/rc shows an increasing tendency withstellar photospheric temperature; the total mass-loss rate correlatesnegatively with dust temperature and shows an increasing tendencywith τ 0.55.
MNRAS 470, 1593–1611 (2017)
Dow
nloaded from https://academ
ic.oup.com/m
nras/article/470/2/1593/3906740 by guest on 28 May 2022

Infrared study of PAGB stars 1607
(iii) The post-AGB mass-loss rates obtained from the SED mod-els are higher than those of the AGB and show a correlation withthe mass-loss indices [K − 12] and [25 − 2]. Dust mass-loss ratesobtained independently from the IR colours and Spitzer spectra alsofollowed a similar trend.
(iv) The PAGB objects that show PAH emission features in therange 5–20 µm indicate the onset of UV radiation from the centralstar and hence represent an advanced stage of evolution. The ratioof the observed strength of the 7.7- and 11.2-µm PAH featuresshowed an increasing trend with T∗, while decreasing with rc. Thepeak wavelengths of the 6.2-, 7.7- and 11.2-µm features seem toshift towards shorter wavelengths with increasing T∗.
(v) Nine objects in our sample showed a fine-structure line ofNe, indicating their transition nature from PAGB to PNe with theonset of ionization.
(vi) Fullerene was detected for the first time in the PAGB starIRAS 21546+4721.
AC K N OW L E D G E M E N T S
This research was supported by the Department of Space, Gov-ernment of India. The research has made use of the SIMBAD database operated at CDS, Strasbourg, France; the NASA/IPAC InfraredScience Archive, which is operated by the Jet Propulsion Labora-tory, California Institute of Technology, under contract with theNational Aeronautics and Space Administration, USA; and thedata products from the Two Micron All Sky Survey, which is ajoint project of the University of Massachusetts and the InfraredProcessing and Analysis Center/California Institute of Technology,funded by the National Aeronautics and Space Administration andthe National Science Foundation. We acknowledge the DUSTY teamfor making their codes available for the astronomy community. Wesincerely thank the anonymous referee for very useful comments,which improved the quality of the article.
R E F E R E N C E S
Allen C. W., 2000, in Cox A. N., ed., Astrophysical Quantities. Springer-Verlag, Heidelberg
Anandarao B. G., Pottasch S. R., Vaidya D. B., 1993, A&A, 273, 570Benjamin R. A. et al., 2003, PASP, 115, 953Bernard-Salas J., Peeters E., Sloan G. C., Gutenkunst S., Matsuura M.,
Tielens A. G. G. M., Zijlstra A. A., Houck J. R., 2009, ApJ, 699, 1541Bernard-Salas J., Cami J., Peeters E., Jones A. P., Micelotta E. R., Groe-
newegen M. A. T., 2012, ApJ, 757, 41Blasberger A., Behar E., Perets H. B., Brosch N., Tielens A. G. G. M., 2017,
ApJ, 836, 173Bouwman J., Meeus G., de Koter A., Hony S., Dominik C., Waters
L. B. F. M., 2001, A&A, 375, 950Bujarrabal V., Castro-Carrizo A., Alcolea J., Sanchez Contreras C., 2001,
A&A, 377, 868Cami J., Bernard-Salas J., Peeters E., Malek S. E., 2010, Science, 329, 1180Cerrigone L., Hora J. L., Umana G., Trigilio C., 2009, ApJ, 703, 585Chalabaev A., Maillard J. P., 1983, A&A, 127, 279Curl R. F., Smalley R. E., 1988, Science, 242, 1017de Vries M. S., Reihs K., Wendt H. R., Golden W. G., Hunziker H. E.,
Fleming R., Peterson E., Chang S., 1993, Geochim. Cosmochim. Acta,57, 933
de Vries B. L., Blommaert J. A. D. L., Waters L. B. F. M., Waelkens C., MinM., Lombaert R., Van Winckel H., 2014, A&A, 561, A75
de Vries B. L., Maaskant K. M., Min M., Lombaert R., Waters L. B. F. M.,Blommaert J. A. D. L., 2015, A&A, 576, A98
Duley W. W., 2000, ApJ, 528, 841Egan M. P., Price S. D., Kraemer K. E., 2003, BAAS, 35, 1301
Galliano F., Madden S. C., Tielens A. G. G. M., Peeters E., Jones A. P.,2008, ApJ, 679, 310
Garcıa-Lario P., Perea Calderon J. V., 2003, in Gry C., Peschke S., MatagneJ., Garcia-Lario P., Lovente R., Salama A., eds, Exploiting the ISO DataArchive: Infrared Astronomy in the Internet Age, ESA SP-511. ESA,Noordwijk, p. 97
Garcia-Lario P., Manchado A., Ulla A., Manteiga M., 1999, ApJ, 513,941
Garcıa-Hernandez D. A., Manchado A., Garcıa-Lario P., Stanghellini L.,Villaver E., Shaw R. A., Szczerba R., Perea-Calderon J. V., 2010, ApJ,724, L39
Gielen C., Cami J., Bouwman J., Peeters E., Min M., 2011, A&A, 536, A54Goebel J. H., Moseley S. H., 1985, ApJ, 290, L35Guzman-Ramirez L. et al., 2015, MNRAS, 451, L1Helou G., Walker D. W., 1988, Infrared astronomical satellite (IRAS) cata-
logs and atlases, 7, 1Hony S., Van Kerckhoven C., Peeters E., Tielens A. G. G. M., Hudgins
D. M., Allamandola L. J., 2001, A&A, 370, 1030Hoogzaad S. N., Molster F. J., Dominik C., Waters L. B. F. M., Barlow M. J.,
de Koter A., 2002, A&A, 389, 547Houck J. R. et al., 2004, in Mather J. C., ed., Proc. SPIE Conf. Ser. Vol. 5487,
Optical, Infrared, and Millimeter Space Telescopes. SPIE, Bellingham,p. 62
Hrivnak B. J., Bieging J. H., 2005, ApJ, 624, 331Hrivnak B. J., Kwok S., 1999, ApJ, 513, 869Hrivnak B. J., Volk K., Kwok S., 2000, ApJ, 535, 275Hrivnak B. J., Lu W., Nault K. A., 2015, AJ, 149, 184Ishihara D., Onaka T., Kataza H., 2010, A&A, 514, 14Ivezic Z., Elitzur M., 1995, ApJ, 445, 415Ivezic Z., Elitzur M., 1997, MNRAS, 287, 799Ivezic Z., Nenkova M., Elitzur M., 1999, User Manual for
dusty, University of Kentucky Internal Report, accessible athttp://www.pa.uky.edu/moshe/dusty
Jaeger C., Molster F. J., Dorschner J., Henning T., Mutschke H., WatersL. B. F. M., 1998, A&A, 339, 904
Justtanont K., Barlow M. J., Skinner C. J., Roche P. F., Aitken D. K., SmithC. H., 1996, A&A, 309, 612
Kelly D. M., Hrivnak B. J., 2005, ApJ, 629, 1040Kratschmer W., Lamb L. D., Fostiropoulos K., Huffman D. R., 1990, Nature,
347, 354Kroto H., 1988, Science, 242, 1139Kroto H. W., Heath J. R., Obrien S. C., Curl R. F., Smalley R. E., 1985,
Nature, 318, 162Kwok S., 2004, Nature, 430, 985Kwok S., 2007, The Origin and Evolution of Planetary Nebulae. Cambridge
University Press, Cambridge, UKKwok S., Bignell R. C., 1984, ApJ, 276, 544Kwok S., Feldman P. A., 1981, ApJ, 247, L67Kwok S., Volk K., Hrivnak B. J., 1999, A&A, 350, L35Lagadec E., Zijlstra A. A., Matsuura M., Menzies J. W., van Loon J. T.,
Whitelock P. A., 2008, MNRAS, 383, 399Lamers H. J. G. L. M., Cassinelli J. P., 1999, Introduction to Stellar Winds.
Cambridge Univ. Press, Cambridge, UKLang K. R., 2006, Astrophysical Formulae. Springer-Verlag, HeidelbergLe Bertre T., Winters J. M., 1998, A&A, 334, 173Lebouteiller V., Brandl B., Bernard-Salas J., Devost D., Houck J. R., 2007,
ApJ, 665, 390Li A., Draine B. T., 2001, ApJ, 554, 778Likkel L., Forveille T., Omont A., Morris M., 1991, A&A, 246, 153Mathis J. S., Rumpl W., Nordsieck K. H., 1977, ApJ, 217, 425Meixner M., Skinner C. J., Graham J. R., Keto E., Jernigan J. G., Arens J. F.,
1997, ApJ, 482, 897Meixner M. et al., 1999, ApJS, 122, 221Micelotta E. R., Jones A. P., Cami J., Peeters E., Bernard-Salas J., Fanchini
G., 2012, ApJ, 761, 35Mishra A., Li A., Jiang B. W., 2016, ApJ, 825, 68Omont A., Loup C., Forveille T., te Lintel Hekkert P., Habing H.,
Sivagnanam P., 1993, A&A, 267, 515
MNRAS 470, 1593–1611 (2017)
Dow
nloaded from https://academ
ic.oup.com/m
nras/article/470/2/1593/3906740 by guest on 28 May 2022
1608 V. V. Raman et al.
Otsuka M., Kemper F., Cami J., Peeters E., Bernard-Salas J., 2014, MNRAS,437, 2577
Peeters E., Hony S., Van Kerckhoven C., Tielens A. G. G. M., AllamandolaL. J., Hudgins D. M., Bauschlicher C. W., 2002, A&A, 390, 1089
Peeters E., Bauschlicher C. W., Jr, Allamandola L. J., Tielens A. G. G. M.,Ricca A., Wolfire M. G., 2017, ApJ, 836, 198
Posch T., Mutschke H., Andersen A., 2004, ApJ, 616, 1167Roberts K. R. G., Smith K. T., Sarre P. J., 2012, MNRAS, 421, 3277Salpeter E. E., 1977, Annu. Rev. Astron. Astrophys., 15, 267Schoenberner D., 1983, ApJ, 272, 708Sedlmayr E., Winters J. M., 2000, in Wing R. F., ed., Proc. IAU Symp. 177,
The Carbon Star Phenomenon. Kluwer, Dordrecht, p. 337Skrutskie M. F. et al., 2006, AJ, 131, 1163Sloan G. C., Kraemer K. E., Price S. D., Shipman R. F., 2003, ApJS, 147,
379Sloan G. C. et al., 2005, ApJ, 632, 956Sloan G. C. et al., 2007, ApJ, 664, 1144Smith J. D. T. et al., 2007, ApJ, 656, 770Speck A. K., Hofmeister A. M., 2004, ApJ, 600, 986Speck A. K., Thompson G. D., Hofmeister A. M., 2005, ApJ, 634, 426Spoon H. W. W., Marshall J. A., Houck J. R., Elitzur M., Hao L., Armus L.,
Brandl B. R., Charmandaris V., 2007, ApJ, 654, L49Suarez O., Garcia-Lario P., Manchado A., Monteiga M., Ulla A., Pottasch
S. R., 2006, A&A, 458, 173Szczerba R., Siodmiak N., Stasinska G., Borkowski J., 2007, A&A, 469,
799Tielens A. G. G. M., 2005, The Physics and Chemistry of the Interstellar
Medium. Cambridge Univ. Press, Cambridge, p. 173
Uchida K. I., Sellgren K., Werner M. W., Houdashelt M. L., 2000, ApJ, 530,817
Ueta T., Meixner M., Bobrowsky M., 2000, ApJ, 528, 861Ueta T. et al., 2001, ApJ, 557, 831van der Veen W. E. C. J., Habing H. J., 1988, A&A, 194, 125van Winckel H., 2003, ARAA, 41, 391Vassiliadis E., Wood P. R., 1994, ApJS, 92, 125Venkata Raman V., Anandarao B. G., 2008, MNRAS, 385, 1076von Helden G., Tielens A. G. G. M., van Heijnsbergen D., Duncan M. A.,
Hony S., Waters L. B. F. M., Meijer G., 2000, Science, 288, 313Waelkens C., Waters R. B. F. M., 2003, in Habing H. J., Olofsson H.,
eds, Asymptotic giant branch stars, Astronomy and astrophysics library,Springer-Verlag, New York, p. 519
Waters L. B. F. M. et al., 1998, Nature, 391, 868Woitke P., Goeres A., Sedlmayr E., 1996, A&A, 313, 217Woodsworth A. W., Kwok S., Chen S. J., 1990, A&A, 228, 503Zhang Y., Kwok S., 2011, ApJ, 730, 126Zhang K., Jiang B. W., Li A., 2009, ApJ, 702, 680Zhang Y., Kwok S., Hrivnak B. J., 2010, ApJ, 725, 990
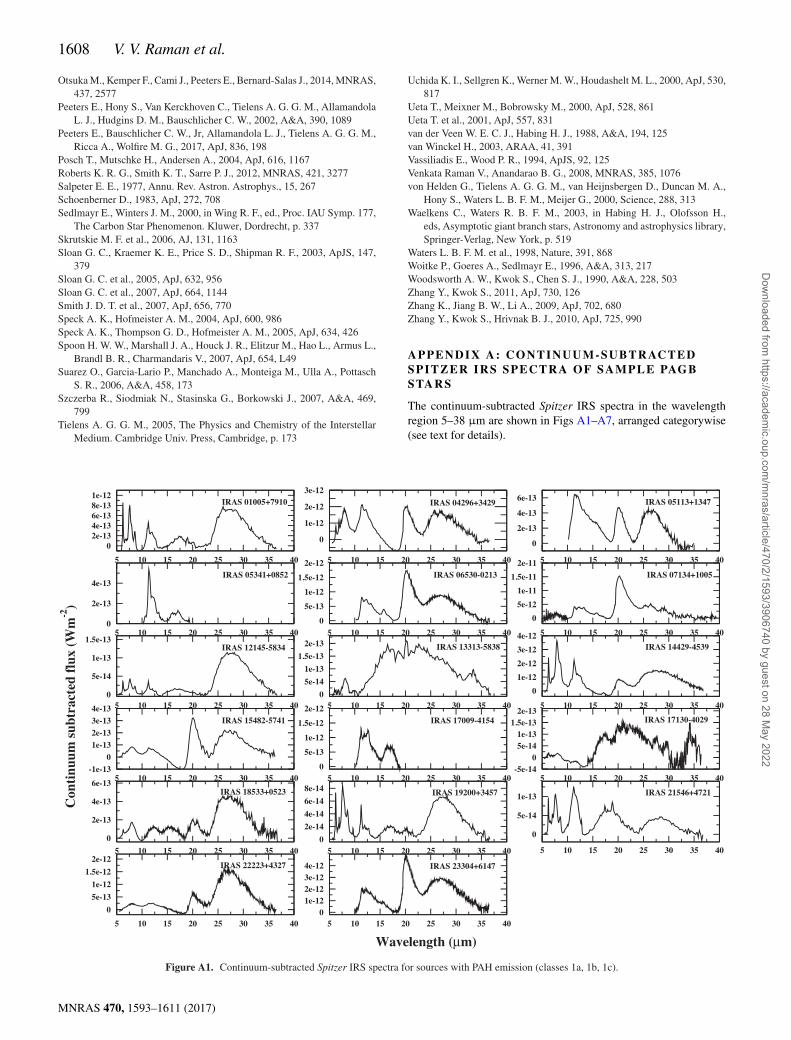
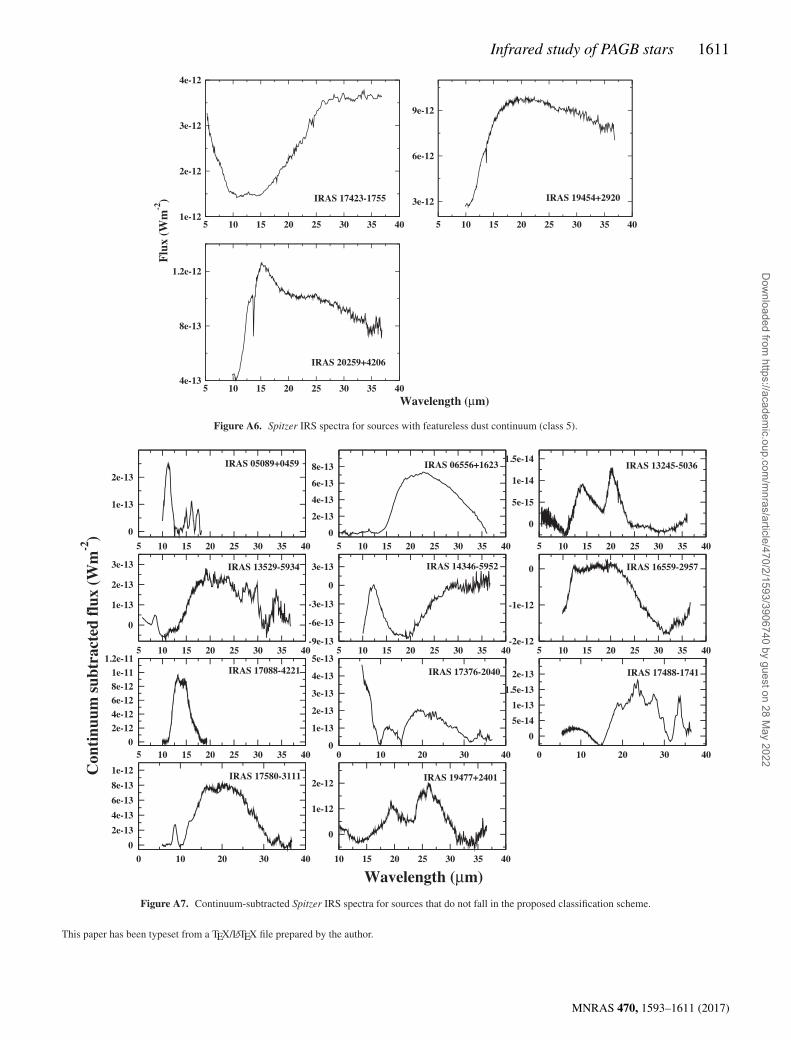
APPENDI X A : C ONTI NUUM-SUBTRAC TE DSPI TZER I RS SPECTRA OF SAMPLE PAG BSTARS
The continuum-subtracted Spitzer IRS spectra in the wavelengthregion 5–38 µm are shown in Figs A1–A7, arranged categorywise(see text for details).
Figure A1. Continuum-subtracted Spitzer IRS spectra for sources with PAH emission (classes 1a, 1b, 1c).
MNRAS 470, 1593–1611 (2017)
Dow
nloaded from https://academ
ic.oup.com/m
nras/article/470/2/1593/3906740 by guest on 28 May 2022

Infrared study of PAGB stars 1609
Figure A2. Continuum-subtracted Spitzer IRS spectra for sources with silicate emission (class 2a).
Figure A3. Continuum-subtracted Spitzer IRS spectra for sources with PAH and silicate emission (class 2b).
MNRAS 470, 1593–1611 (2017)
Dow
nloaded from https://academ
ic.oup.com/m
nras/article/470/2/1593/3906740 by guest on 28 May 2022

1610 V. V. Raman et al.
Figure A4. Continuum-subtracted Spitzer IRS spectra for sources with silicate absorption (class 3).
Figure A5. Continuum-subtracted Spitzer IRS spectra for sources with broad 11-µm emission (class 4).
MNRAS 470, 1593–1611 (2017)
Dow
nloaded from https://academ
ic.oup.com/m
nras/article/470/2/1593/3906740 by guest on 28 May 2022
Infrared study of PAGB stars 1611
Figure A6. Spitzer IRS spectra for sources with featureless dust continuum (class 5).
Figure A7. Continuum-subtracted Spitzer IRS spectra for sources that do not fall in the proposed classification scheme.
This paper has been typeset from a TEX/LATEX file prepared by the author.
MNRAS 470, 1593–1611 (2017)
Dow
nloaded from https://academ
ic.oup.com/m
nras/article/470/2/1593/3906740 by guest on 28 May 2022
Copyright © 2022 FDOKUMEN