Photometric Observations and Apsidal Motion Study of V1143 Cyg
13
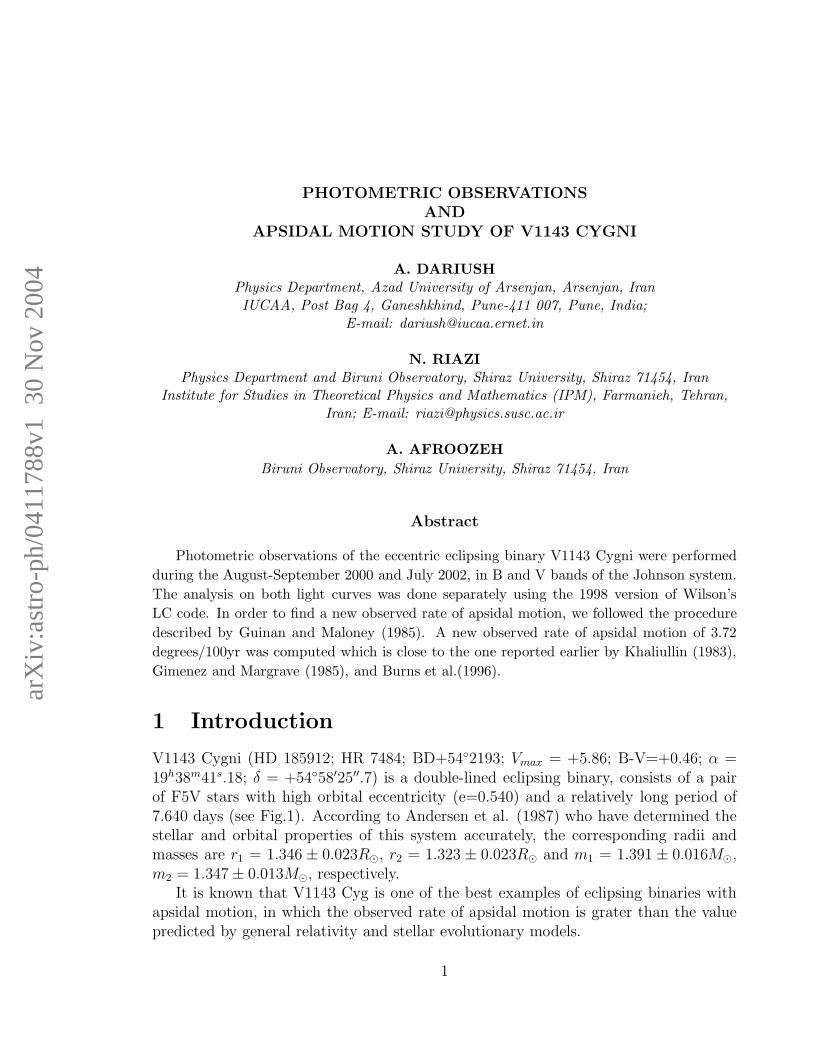
arXiv:astro-ph/0411788v1 30 Nov 2004 PHOTOMETRIC OBSERVATIONS AND APSIDAL MOTION STUDY OF V1143 CYGNI A. DARIUSH Physics Department, Azad University of Arsenjan, Arsenjan, Iran IUCAA, Post Bag 4, Ganeshkhind, Pune-411 007, Pune, India; E-mail: [email protected] N. RIAZI Physics Department and Biruni Observatory, Shiraz University, Shiraz 71454, Iran Institute for Studies in Theoretical Physics and Mathematics (IPM), Farmanieh, Tehran, Iran; E-mail: [email protected] A. AFROOZEH Biruni Observatory, Shiraz University, Shiraz 71454, Iran Abstract Photometric observations of the eccentric eclipsing binary V1143 Cygni were performed during the August-September 2000 and July 2002, in B and V bands of the Johnson system. The analysis on both light curves was done separately using the 1998 version of Wilson’s LC code. In order to find a new observed rate of apsidal motion, we followed the procedure described by Guinan and Maloney (1985). A new observed rate of apsidal motion of 3.72 degrees/100yr was computed which is close to the one reported earlier by Khaliullin (1983), Gimenez and Margrave (1985), and Burns et al.(1996). 1 Introduction V1143 Cygni (HD 185912; HR 7484; BD+54 ◦ 2193; V max = +5.86; B-V=+0.46; α = 19 h 38 m 41 s .18; δ = +54 ◦ 58 ′ 25 ′′ .7) is a double-lined eclipsing binary, consists of a pair of F5V stars with high orbital eccentricity (e=0.540) and a relatively long period of 7.640 days (see Fig.1). According to Andersen et al. (1987) who have determined the stellar and orbital properties of this system accurately, the corresponding radii and masses are r 1 =1.346 ± 0.023R ⊙ , r 2 =1.323 ± 0.023R ⊙ and m 1 =1.391 ± 0.016M ⊙ , m 2 =1.347 ± 0.013M ⊙ , respectively. It is known that V1143 Cyg is one of the best examples of eclipsing binaries with apsidal motion, in which the observed rate of apsidal motion is grater than the value predicted by general relativity and stellar evolutionary models. 1
Transcript of Photometric Observations and Apsidal Motion Study of V1143 Cyg
arX
iv:a
stro
-ph/
0411
788v
1 3
0 N
ov 2
004
PHOTOMETRIC OBSERVATIONSAND
APSIDAL MOTION STUDY OF V1143 CYGNI
A. DARIUSH
Physics Department, Azad University of Arsenjan, Arsenjan, IranIUCAA, Post Bag 4, Ganeshkhind, Pune-411 007, Pune, India;
E-mail: [email protected]
N. RIAZI
Physics Department and Biruni Observatory, Shiraz University, Shiraz 71454, IranInstitute for Studies in Theoretical Physics and Mathematics (IPM), Farmanieh, Tehran,
Iran; E-mail: [email protected]
A. AFROOZEH
Biruni Observatory, Shiraz University, Shiraz 71454, Iran
Abstract
Photometric observations of the eccentric eclipsing binary V1143 Cygni were performed
during the August-September 2000 and July 2002, in B and V bands of the Johnson system.
The analysis on both light curves was done separately using the 1998 version of Wilson’s
LC code. In order to find a new observed rate of apsidal motion, we followed the procedure
described by Guinan and Maloney (1985). A new observed rate of apsidal motion of 3.72
degrees/100yr was computed which is close to the one reported earlier by Khaliullin (1983),
Gimenez and Margrave (1985), and Burns et al.(1996).
1 Introduction
V1143 Cygni (HD 185912; HR 7484; BD+542193; Vmax = +5.86; B-V=+0.46; α =19h38m41s.18; δ = +5458′25′′.7) is a double-lined eclipsing binary, consists of a pairof F5V stars with high orbital eccentricity (e=0.540) and a relatively long period of7.640 days (see Fig.1). According to Andersen et al. (1987) who have determined thestellar and orbital properties of this system accurately, the corresponding radii andmasses are r1 = 1.346 ± 0.023R⊙, r2 = 1.323 ± 0.023R⊙ and m1 = 1.391 ± 0.016M⊙,m2 = 1.347 ± 0.013M⊙, respectively.
It is known that V1143 Cyg is one of the best examples of eclipsing binaries withapsidal motion, in which the observed rate of apsidal motion is grater than the valuepredicted by general relativity and stellar evolutionary models.
1

Figure 1: Relative orbit of V1143 Cygni drawn in scale.
The observed rate of apsidal motion is due to the contribution of two terms; aclassical term as well as the general-relativistic term. In this sence, the observationalapsidal motion rate is
ωobs = ωcl + ωGR, (1)
where ωcl denotes the classical or Newtonian term and ωGR is the relativistic contribu-tion which can be determined using the formulas given by Gimenez (1985). In the caseof V1143 Cyg, the observed rate of apsidal motion is ωobs = 3.52/100yr
± 0.72/100yr
(Burns at al. 1996) while Andersen at al. (1987) calculated a faster theoretical ap-sidal motion of ωtheo = 4.25/100yr
± 0.72/100yr in which the expected relativisticand classical (Newtonian) contributions to apsidal motion are ωcl = 2.39/100yr andωGR = 1.86/100yr, respectively. It is seen that the classical and relativistic contribu-tions are of the same order in this system.
2 Observations
V1143 Cygni was observed during 24 nights from July to September 2000 at BiruniObservatory of Shiraz University (Longitude: 5231′ E, Latitude: 2936′ N). Obser-vations were made with a 51cm cassegrainian telescope equipped with an uncooledRCA4509 multiplier phototube. Two stars HD 184240 (Vmax = +6.30) and HD 186239(Vmax = +7.10) were selected as comparison and check stars respectively. The integra-
2
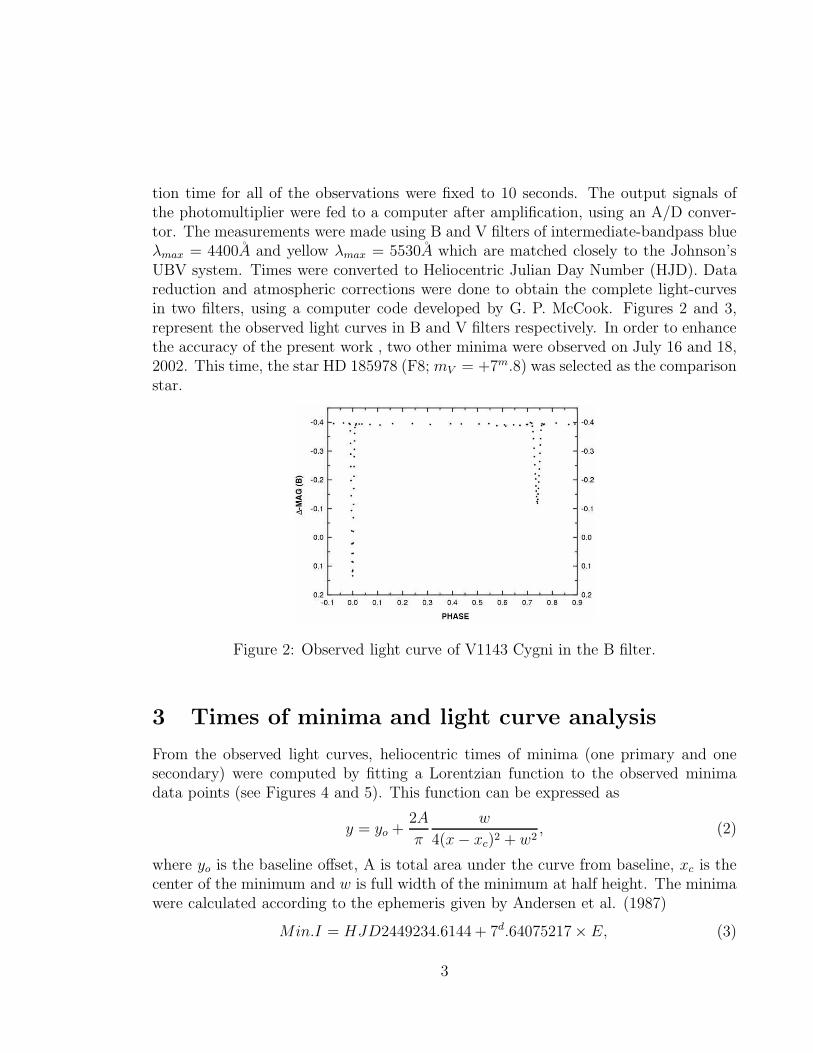
tion time for all of the observations were fixed to 10 seconds. The output signals ofthe photomultiplier were fed to a computer after amplification, using an A/D conver-tor. The measurements were made using B and V filters of intermediate-bandpass blueλmax = 4400A and yellow λmax = 5530A which are matched closely to the Johnson’sUBV system. Times were converted to Heliocentric Julian Day Number (HJD). Datareduction and atmospheric corrections were done to obtain the complete light-curvesin two filters, using a computer code developed by G. P. McCook. Figures 2 and 3,represent the observed light curves in B and V filters respectively. In order to enhancethe accuracy of the present work , two other minima were observed on July 16 and 18,2002. This time, the star HD 185978 (F8; mV = +7m.8) was selected as the comparisonstar.
Figure 2: Observed light curve of V1143 Cygni in the B filter.
3 Times of minima and light curve analysis
From the observed light curves, heliocentric times of minima (one primary and onesecondary) were computed by fitting a Lorentzian function to the observed minimadata points (see Figures 4 and 5). This function can be expressed as
y = yo +2A
π
w
4(x − xc)2 + w2, (2)
where yo is the baseline offset, A is total area under the curve from baseline, xc is thecenter of the minimum and w is full width of the minimum at half height. The minimawere calculated according to the ephemeris given by Andersen et al. (1987)
Min.I = HJD2449234.6144 + 7d.64075217× E, (3)
3

Figure 3: Observed light curve of V1143 Cygni in the V filter.
and are given in Tables 2 and 3. The corresponding errors in primary and secondaryminima are: ±0.00066 and ±0.00220, respectively. Meanwhile, in each filter, the depthsof minima are as follows:
Filter B: Min.I: 0m.53 ± 0.02, Min.II: 0m.25 ± 0.02
Filter V: Min.I: 0m.48 ± 0.02, Min.II: 0m.23 ± 0.02
Figure 4: A sample Lorentzian fit to the primary minimum.
The B and V light curves of V1143 Cyg have been analyzed separately by usingthe Wilson code in order to derive photometric elements of this system. The program
4
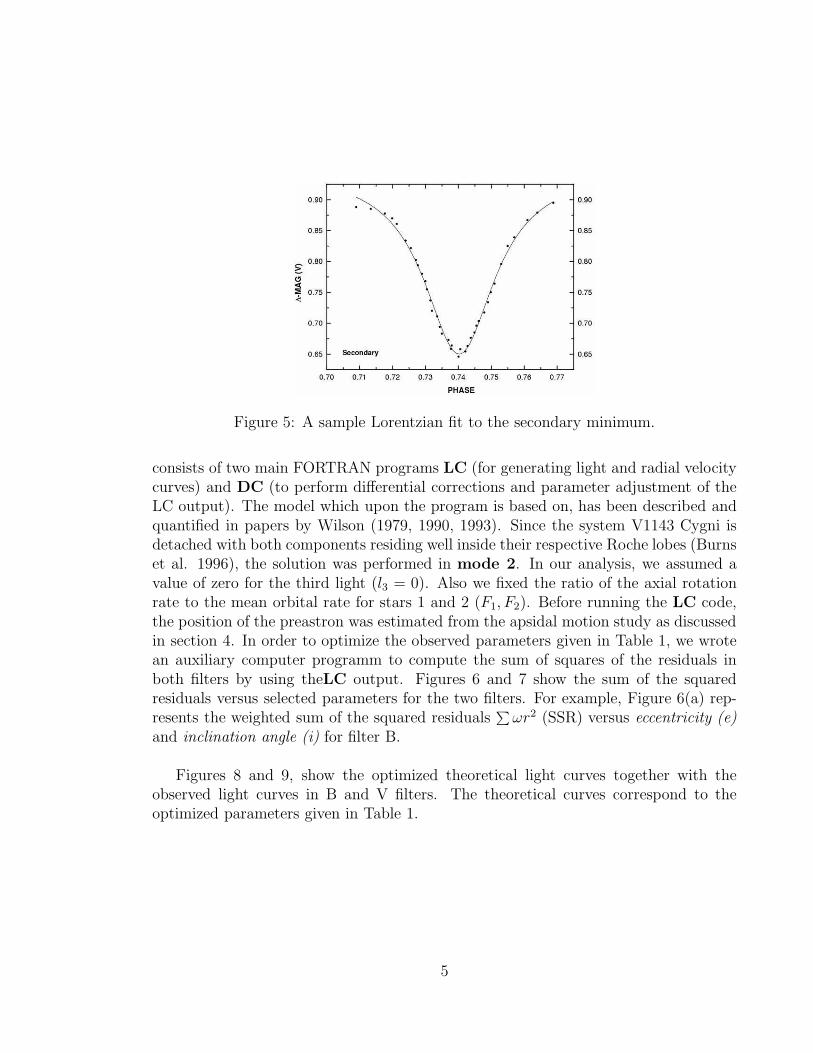
Figure 5: A sample Lorentzian fit to the secondary minimum.
consists of two main FORTRAN programs LC (for generating light and radial velocitycurves) and DC (to perform differential corrections and parameter adjustment of theLC output). The model which upon the program is based on, has been described andquantified in papers by Wilson (1979, 1990, 1993). Since the system V1143 Cygni isdetached with both components residing well inside their respective Roche lobes (Burnset al. 1996), the solution was performed in mode 2. In our analysis, we assumed avalue of zero for the third light (l3 = 0). Also we fixed the ratio of the axial rotationrate to the mean orbital rate for stars 1 and 2 (F1, F2). Before running the LC code,the position of the preastron was estimated from the apsidal motion study as discussedin section 4. In order to optimize the observed parameters given in Table 1, we wrotean auxiliary computer programm to compute the sum of squares of the residuals inboth filters by using theLC output. Figures 6 and 7 show the sum of the squaredresiduals versus selected parameters for the two filters. For example, Figure 6(a) rep-resents the weighted sum of the squared residuals
∑ωr2 (SSR) versus eccentricity (e)
and inclination angle (i) for filter B.
Figures 8 and 9, show the optimized theoretical light curves together with theobserved light curves in B and V filters. The theoretical curves correspond to theoptimized parameters given in Table 1.
5

Figure 6: The weighted sum of squared residuals∑
ωr2 (SSR) versus parameters usingWilson’s LC code in B filter.
Table 1.Optimized parameters of V1143 Cygni.
Parameter Filter B Filter Vi 87.3 ± 0.1 87.1 ± 0.1e 0.536 ± 0.005 0.539 ± 0.005ω 0.855 ± 0.004 0.855 ± 0.004q(M2
M1
) 0.99 ± 0.01 0.98 ± 0.01
Ω1 17.4 ± 0.5 18.0 ± 0.5Ω2 19.6 ± 0.5 20.0 ± 0.5L2
L1
0.89 ± 0.05 0.82 ± 0.05
Finally, the observed times of minima on July 16 and 18, 2002 are calculated ac-cording to the ephemeris
6
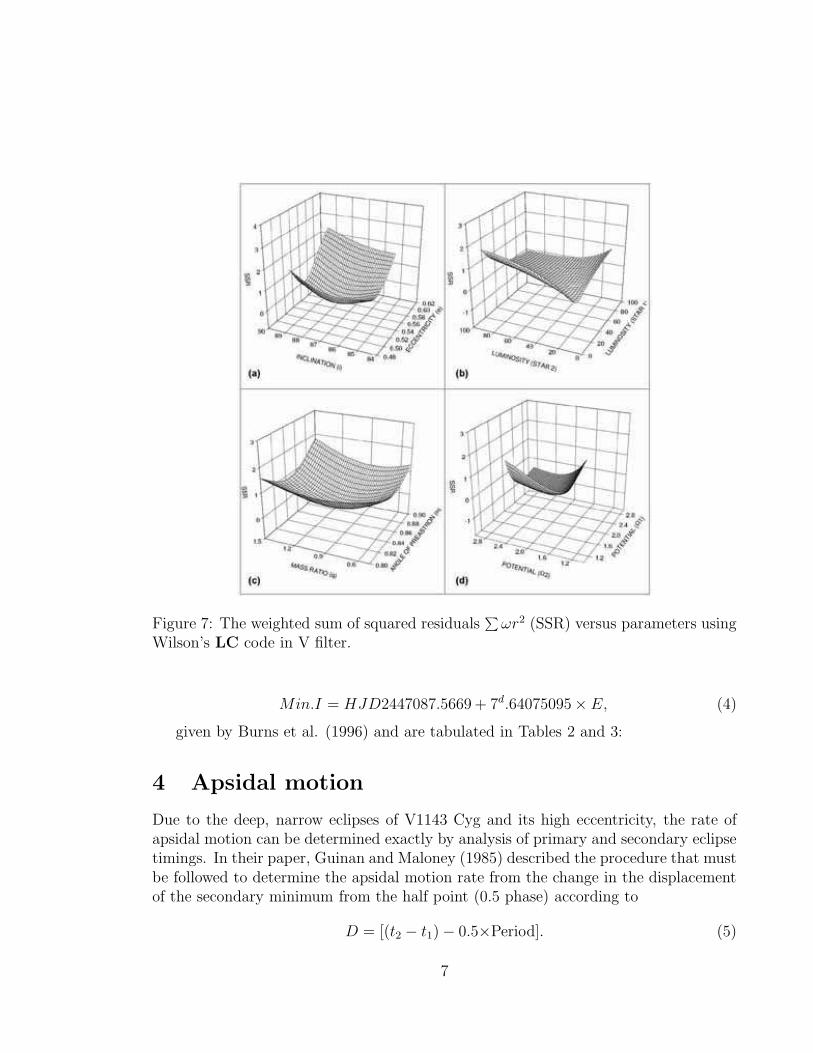
Figure 7: The weighted sum of squared residuals∑
ωr2 (SSR) versus parameters usingWilson’s LC code in V filter.
Min.I = HJD2447087.5669 + 7d.64075095× E, (4)
given by Burns et al. (1996) and are tabulated in Tables 2 and 3:
4 Apsidal motion
Due to the deep, narrow eclipses of V1143 Cyg and its high eccentricity, the rate ofapsidal motion can be determined exactly by analysis of primary and secondary eclipsetimings. In their paper, Guinan and Maloney (1985) described the procedure that mustbe followed to determine the apsidal motion rate from the change in the displacementof the secondary minimum from the half point (0.5 phase) according to
D = [(t2 − t1) − 0.5×Period]. (5)
7

Figure 8: Theoretical light curve (LC output) in filter B. Points are the observationaldata.
D in turn, is related to ω the longitude of preastron by the formula given by Sterne(1939):
D =P
π[tan−1(
e cos(ω)
(1 − e2)1/2) +
e cos(ω)
1 − e2sin2(ω)(1 − e2)
1/2
], (6)
where P is the period and e is eccentricity. The observed photoelectric times of primaryand secondary minima from 1969 to 2002 are collected in Tables 2 and 3. As youcan see from Table 4, the slow decrease in D is due to the advance of the line ofapsides of the orbit. By computing the slope of a line fitted to all of the secondaryminima given in Table 3, we determined an observed rate of apsidal motion of ωobs =3.72/100yr
± 0.37/100yr (see Figure 10).
8
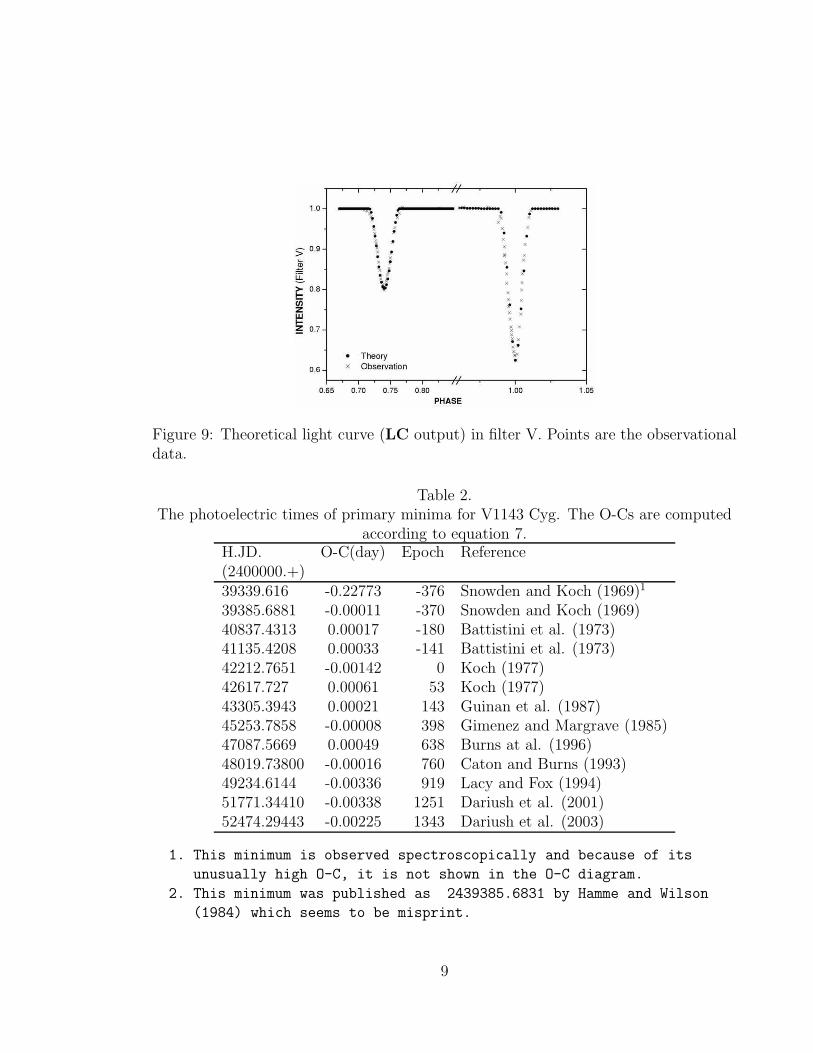
Figure 9: Theoretical light curve (LC output) in filter V. Points are the observationaldata.
Table 2.The photoelectric times of primary minima for V1143 Cyg. The O-Cs are computed
according to equation 7.H.JD. O-C(day) Epoch Reference(2400000.+)39339.616 -0.22773 -376 Snowden and Koch (1969)1
39385.6881 -0.00011 -370 Snowden and Koch (1969)40837.4313 0.00017 -180 Battistini et al. (1973)41135.4208 0.00033 -141 Battistini et al. (1973)42212.7651 -0.00142 0 Koch (1977)42617.727 0.00061 53 Koch (1977)43305.3943 0.00021 143 Guinan et al. (1987)45253.7858 -0.00008 398 Gimenez and Margrave (1985)47087.5669 0.00049 638 Burns at al. (1996)48019.73800 -0.00016 760 Caton and Burns (1993)49234.6144 -0.00336 919 Lacy and Fox (1994)51771.34410 -0.00338 1251 Dariush et al. (2001)52474.29443 -0.00225 1343 Dariush et al. (2003)
1. This minimum is observed spectroscopically and because of its
unusually high O-C, it is not shown in the O-C diagram.
2. This minimum was published as 2439385.6831 by Hamme and Wilson
(1984) which seems to be misprint.
9

Table 3.The photoelectric times of secondary minima for V1143 Cyg, together withthe computed values of D and ω, using equation 6. The O-Cs are computed
according to equation 8.H.JD. O-C(day) Epoch D ω Reference(2400000.+)38932.932 -0.00431 -430 1.8685 47.97 Snowden and Koch (1969)38978.7807 0.00000 -424 1.8727 47.83 Snowden and Koch (1969)42615.75 -0.01896 52 1.8439 48.82 Koch (1977)1
43066.575 0.00286 111 1.8646 48.11 Koch (1977)44487.7482 -0.00002 297 1.8579 48.34 Gimenez and Margrave (1985)47085.5910 -0.00598 637 1.8449 48.78 Burns at al. (1996)51792.28645 -0.00122 1253 1.8370 49.05 Dariush et al. (2001)52472.30445 -0.00834 1342 1.8281 49.35 Dariush et al. (2003)
1.Due to its unusually high O-C, it is not included in determination of
the observed rate of apsidal motion.
Figure 10: The displacement of the secondary minima given in Table 3, from the 0.5phase versus epoch. The observed rate of apsidal motion (ωobs) can be calculated forthe slope of this curve.
The residuals given in Tables 2 and 3 are calculated for each of the minima accordingto the ephemeris given by Gimenez and Margrave (1985)
Min.I = HJD2442212.76652 + 7d.64075217 × E, (7)
10
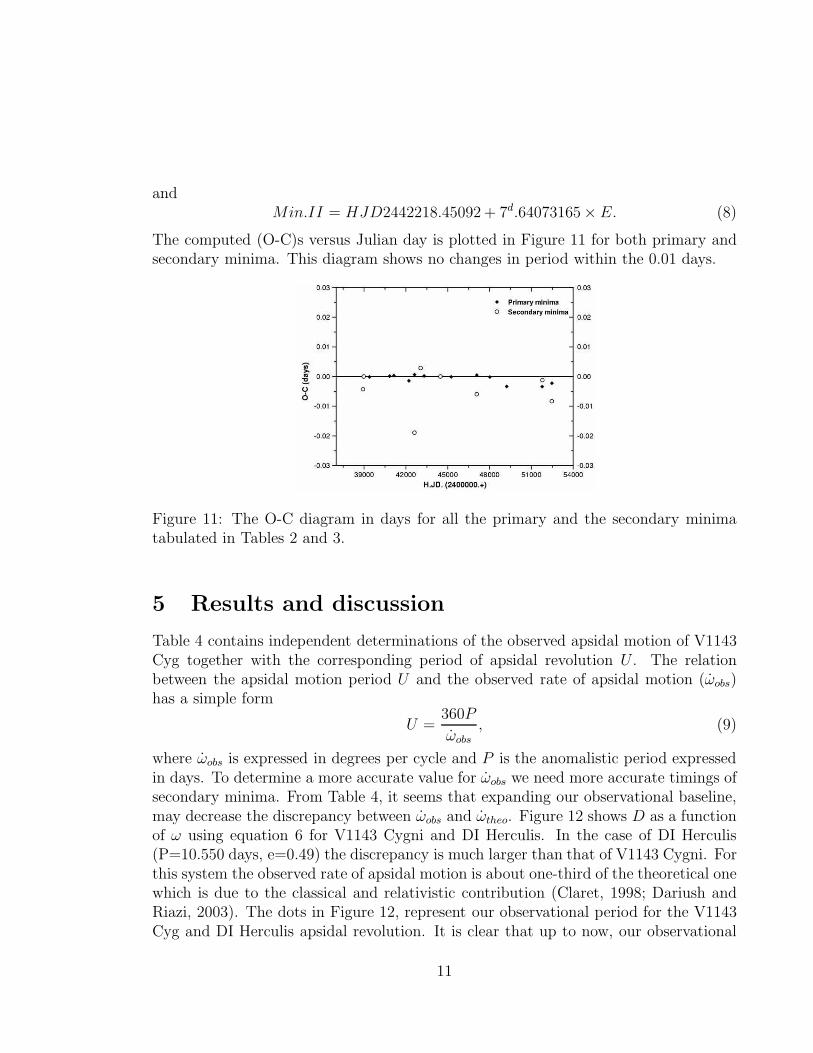
andMin.II = HJD2442218.45092 + 7d.64073165× E. (8)
The computed (O-C)s versus Julian day is plotted in Figure 11 for both primary andsecondary minima. This diagram shows no changes in period within the 0.01 days.
Figure 11: The O-C diagram in days for all the primary and the secondary minimatabulated in Tables 2 and 3.
5 Results and discussion
Table 4 contains independent determinations of the observed apsidal motion of V1143Cyg together with the corresponding period of apsidal revolution U . The relationbetween the apsidal motion period U and the observed rate of apsidal motion (ωobs)has a simple form
U =360P
ωobs
, (9)
where ωobs is expressed in degrees per cycle and P is the anomalistic period expressedin days. To determine a more accurate value for ωobs we need more accurate timings ofsecondary minima. From Table 4, it seems that expanding our observational baseline,may decrease the discrepancy between ωobs and ωtheo. Figure 12 shows D as a functionof ω using equation 6 for V1143 Cygni and DI Herculis. In the case of DI Herculis(P=10.550 days, e=0.49) the discrepancy is much larger than that of V1143 Cygni. Forthis system the observed rate of apsidal motion is about one-third of the theoretical onewhich is due to the classical and relativistic contribution (Claret, 1998; Dariush andRiazi, 2003). The dots in Figure 12, represent our observational period for the V1143Cyg and DI Herculis apsidal revolution. It is clear that up to now, our observational
11

baseline covers only a very small fraction of the period of apsidal revolution U . Inthe case of DI Herculis, the presence of a third body is a plausible explanation forthe discrepancy between ωobs and ωtheo, but until no further observational evidence hasbeen reported this possibility. Our results for V1143 Cyg supporting 3.72±0.37/100yris slightly closer to the theoretical apsidal motion rate (4.25± 0.72/100yr), computedwith previous studies of this system
Figure 12: D as a function of ω using equation 6 for V1143 Cygni and DI Herculis.
Table 4.Determined rate of apsidal motion for V1143 Cygni
ω
obs/100yr±Error Uyr Source
3.49 ±0.38 10320 Khaliullin (1983)3.36 ±0.19 10710 Gimenez and Margrave (1985)3.52 ±0.72 10230 Burns et al. (1996)3.72 ±0.37 9680 Present study1
1.This value is computed from all the secondary minima presented
in Table 4 except 2442615.75 of Koch (1977). Including this
minimum, it is changed to 3.45 degree/100yr +/- 0.65 degree/100yr.
Acknowledgments
We would like to thanks Mr. Mehdi Nazem for his help during the observations.
12

References:
Andersen, J., Garcia, J. M., Gimenez, A., and Nordstrom, B., 1987, Astron.Astrophys.,174, 107.Battistini, P., Bonifazi, A., and Guarnieri, A., 1973, IBVS 817.Burns, J. F., Guinan, E. F., and Marshall, J. J., 1996, IBVS 4363.Caton, D. B., and Burns, W. C., 1993, IBVS 3900.Claret, A. 1998, Astron.Astrophys., 330, 533.Claret, A., and Willems, B., 2002, Astron.Astrophys., 388, 518.Dariush, A., Afroozeh, A., Riazi, N., 2001, IBVS 5136.Dariush, A., and Riazi, N., 2003, Astrophys.Space.Sci., 283, 253.Dariush, A., Zabihinpoor, S. M., Bagheri, M. R., Jafarzadeh, Sh., Mosleh, M., andRiazi, N., 2003, IBVS 5456.Gimenez, A., 1985, Astrophys.J., 297, 405.Gimenez, A., and Margrave, T. E., 1985, Astron.J., 90(2), 358.Guinan, E.F. and Maloney, F.P., 1985,Astron.J., 90, 1519.Guinan, E. F., Najafi, I., Zamani-Noor, F., and Boyd, P. T., 1987, IBVS 3070.Hamme, W. V., and Wilson, R. E., 1984, Astron.Astrophys., 141, 1.Khaliullin, Kh. F., 1983, Astron.Trisk, No 1262.Koch, R. H., 1977, Astron.J.,82, 653.Lacy, C.H. and Fox, G.W., 1994, IBVS 4009.Semeniuk, I., 1968, Acta.Astron., 18, 1.Snowden, M. S., and Koch, R. H., 1969, Astrophys.J.,156.Sterne, T.E., 1939(a), Mon.Not.R.Astron.Soc., 99, 451.Sterne, T.E., 1939(b), Mon.Not.R.Astron.Soc., 99, 662.Wilson, R.E., 1979, Astrophys.J., 234, 1054.Wilson, R.E., 1990, Astrophys.J., 356, 613.Wilson, R.E., 1993, in New Frontiers in Binary Star Research, ed. K. C. Leung andNha, I.S., A.S.P. Conf. Ser., 38, 91.
13