Specularities Reduce Ambiguity of Uncalibrated Photometric Stereo
Upload
khangminh22Category
view
4download
0
MNRAS 494, 789–803 (2020) doi:10.1093/mnras/staa544Advance Access publication 2020 March 13
The near and mid-infrared photometric properties of known redshiftz ≥ 5 quasars
Nicholas P. Ross ‹ and Nicholas J. G. Cross‹
Institute for Astronomy, University of Edinburgh, Royal Observatory, Edinburgh EH9 3HJ, UK
Accepted 2020 February 21. Received 2020 February 21; in original form 2019 June 15
ABSTRACTWe assemble a catalogue of 488 spectroscopically confirmed very high (z ≥ 5.00) redshiftquasars (VHzQ) and report their near- (ZYJHKs/K) and mid- (WISE W1234) infraredproperties. 97 per cent of the VHzQ sample is detected in one or more near-infrared (NIR)band, with lack of coverage rather than lack of depth being the reason for the non-detections.389 (80 per cent) of the very high redshift quasars are detected at 3.4μm in the W1 bandfrom the unWISE catalogue and all of the z ≥ 7 quasars are detected in both unWISE W1and W2. Using archival Wide Field Camera (WFCAM)/United Kingdom Infrared Telescope(UKIRT) and VISTA Infrared Camera (VIRCAM)/Visible and Infrared Survey Telescopefor Astronomy (VISTA) data we check for photometric variability that might be expectedfrom super-Eddington accretion. We find 28 of the quasars have sufficient NIR measurementsand signal-to-noise ratio to look for variability. Weak variability was detected in multiplebands of Sloan Digital Sky Survey (SDSS) J0959+0227, and very marginally in the Y-bandof MMT J0215-0529. Only one quasar, SDSS J0349+0034, shows significant differencesbetween WFCAM and VISTA magnitudes in one band. With supermassive black hole accretionlikely to be redshift invariant up to very high redshift, further monitoring of these sources iswarranted. All the data, analysis codes and plots used and generated here can be found at:github.com/d80b2t/VHzQ.
Key words: galaxies: evolution – quasars: general – infrared: galaxies – galaxies: high-redshift.
1 IN T RO D U C T I O N
Very high redshift quasars (VHzQ; defined here to have redshiftsz ≥ 5.00) are excellent probes of the early Universe. This includesstudies of the Epoch of Reionization for hydrogen (see e.g. Fan,Carilli & Keating 2006a; Mortlock 2016, for reviews), the formationand build-up of supermassive black holes (e.g. Rees 1984; Wyithe &Loeb 2003; Volonteri 2010; Agarwal et al. 2016; Latif, Volonteri &Wise 2018; Valiante et al. 2018; Wise et al. 2019) and early metalenrichment (see e.g. Simcoe et al. 2012; Bosman et al. 2017; Chenet al. 2017)
Supercritical accretion, where M > MEdd, is a viable mechanismto explain the high, potentially super-Eddington, luminosity andrapid growth of supermassive black holes in the early universe(e.g. Alexander & Natarajan 2014; Madau, Haardt & Dotti 2014;Volonteri, Silk & Dubus 2015; Lupi et al. 2016; Pezzulli, Valiante &Schneider 2016; Pezzulli et al. 2017; Takeo et al. 2018). Thus,one could expect VHzQs to potentially vary in luminosity as theygo through phases of supercritical accretion. These signatures of
� E-mail: [email protected] (NPR); [email protected] (NJGC)
photometric variability should be looked for, noting the rest-frameoptical emission is redshifted into the observed near-infrared (NIR)at redshifts z> 5, and relativistic time dilation also stretches the pho-tometric variability of the accretion disc as observed. Fortunately,data are now in place from deep, wide-field NIR instruments andsurveys such as the Wide Field Camera (WFCAM) instrument onthe United Kingdom Infra-Red Telescope (UKIRT) in the NorthernHemisphere and the VISTA InfraRed CAMera (VIRCAM) on theVisible and Infrared Survey Telescope for Astronomy (VISTA) inthe Southern Hemisphere, that are necessary for identifying VHzQs.
Quasars are known to be prodigious emitters of infrared emission,thought to be from the thermal emission of dust grains heated bycontinuum emission from the accretion disc (e.g. Richards et al.2006; Hill et al. 2014; Leipski et al. 2014; Hickox et al. 2017).Observations in the mid-infrared (MIR), e.g. ∼3–30μm allowdiscrimination between active galactic nucleus (AGN)1 and passivegalaxies due to the 1.6μm ‘bump’ entering the MIR at z ≈ 0.8–0.9
1Historically, ‘quasars’ and ‘AGNs’ have described different luminos-ity/classes of objects. In recognition of the fact that both terms describeaccreting supermassive black holes, we use these terms interchangeably,
C© 2020 The Author(s)Published by Oxford University Press on behalf of the Royal Astronomical Society
Dow
nloaded from https://academ
ic.oup.com/m
nras/article/494/1/789/5804786 by guest on 31 July 2022

790 N. P. Ross and N. J. G. Cross
(e.g. Wright, Eisenhardt & Fazio 1994; Sawicki 2002; Lacy et al.2004; Stern et al. 2005; Richards et al. 2006; Timlin, Ross et al.2016) as well as between AGN and star-forming galaxies due to thepresence of polycyclic aromatic hydrocarbon at λ > 3μm (e.g. Yanet al. 2007; Tielens 2008).
Jiang et al. (2006) and Jiang et al. (2010) report on the discoveryof a quasar without hot-dust emission in a sample of 21 z ≈ 6quasars. Such apparently hot-dust-free quasars have no counterpartsat low redshift. Moreover, those authors demonstrate that the hot-dust abundance in the 21 quasars builds up in tandem with thegrowth of the central black hole. But understanding how dust firstforms and appears in the central engine remains an open question(Wang et al. 2008, 2011).
WISE mapped the sky in four passbands, in bands centered atwavelengths of 3.4, 4.6, 12, and 23μm. The all sky ‘AllWISE’catalogue release, contains nearly 750 million detections at high-significance,2 of which over 4.5 M AGN candidates have beenidentified with 90 per cent reliability (Assef et al. 2018). Blain et al.(2013) presented WISE MIR detections of 17 (55 per cent) of thethen known 31 quasars at z > 6. However, Blain et al. (2013) wascompiled with the WISE ‘All-Sky’ data release, as opposed to thesuperior AllWISE catalogues. That sample only examined the 31known z > 6 quasars; our sample has 174 objects with redshift z
≥ 6.00 (with 117 detected in WISE). Banados et al. (2016) reportsWISE W1, W2, W3, and W4 magnitudes for the Panoramic SurveyTelescope and Rapid Response System 1 (Pan-STARRS1, PS1;Kaiser et al. 2002, 2010), but with no further investigation into thereddest WISE waveband for the VHzQs.
Critically, we now have available to us new W1 and W2 pho-tometry from the ‘unWISE Source Catalogue’ (Schlafly, Meis-ner & Green 2019), a WISE-selected catalogue that is based onsignificantly deeper imaging and has a more extensive modeling ofcrowded regions than the AllWISE release. For the first time in acatalogue, unWISE takes advantage of the ongoing MIR Near-EarthObject Wide-Field Infrared Survey Explorer Reactivation mission(NEOWISE-R; Mainzer et al. 2014), and achieves depths ∼0.7mag deeper than AllWISE (in W1/2). This additional depth is asignificant advantage in the detection and study of VHzQs in the3–5 micron regime.
Here, we present for the first time the combined NIR properties(from UKIRT and VIRCAM) and the new MIR unWISE for allthe spectroscopically known z ≥ 5.00 quasars. Our motivations arenumerous and include: (i) establishing the first complete catalogueof z > 5.00 quasars since the pioneering work from SDSS; (ii)utilizing all the WFCAM and VISTA NIR photometry available forthe quasars; (iii) making the first study of NIR and MIR variabilityof the VHzQ population and (iv) establishing the photometricproperties for upcoming surveys and telescopes including the LargeSynoptic Survey Telescope (LSST),3 ESA Euclid4 and the JamesWebb Space Telescope (JWST)5,6,7,8. We chose redshift z = 5.00 asour lower redshift limit due to a combination of garnishing a largesample, adequately spanning physical properties (e.g. luminosity,
with a preference for quasar, since we are generally in the higher-L regime(e.g. Haardt et al. 2016).2wise2.ipac.caltech.edu/docs/release/allwise/expsup/sec2 1.html3lsst.org;4sci.esa.int/euclid;5jwst.nasa.gov;6sci.esa.int/jwst;7www.asc-csa.gc.ca/eng/satellites/jwst;8jwst.stsci.edu.
age of the Universe) and to highlight the parts of L − z parameterspace where z > 5 quasars still wait to be discovered.
This paper is organized as follows. In Section 2, we present theassembled list of the 488 z ≥ 5.00 VHzQs that we have compiled.We then give a high-level overview of the photometric surveysand datasets we use and present the photometry of the VHzQs. InSection 3, we investigate the variability properties of the VHzQs,looking for evidence of supercritical accretion. In Section 4, wecalculate how many z > 5 quasars we should expect to find incurrent data sets. We conclude in Section 5 and present all thenecessary details to obtain our data set in the Appendices.
We present all our photometry and magnitudes on the AB system.For NIR, we use the Oke & Gunn (1983) and Fukugita et al. (1996)system which has a zero-point of −48.60. For WISE, the AB-Vega offsets are calculated using the Tokunaga & Vacca (2005) ABsystem, which has a zero-point of −48.574. So to remain on the−48.60 system, and assuming a flux density Fν ∝ ν0, one needs tosubtract 0.026 mag from the zero-points: (�W1, �W2, and �W3)= (2.673, 3.313, and 5.148). For W4, we use the calibration ofBrown, Jarrett & Cluver (2014), �W4 = 6.66. These magnitudesare not Galactic extinction corrected.
We use a flat Lambda cold dark matter cosmology with H0 =67.7 km s−1 Mpc−1, �M = 0.307, and �� = 0.693 PlanckCollaboration (2016) to be consistent with Banados et al. (2016)and all logarithms are to the base 10.
2 ME T H O D A N D DATA
Quasars are generally identified by photometric selection followedby spectroscopic confirmation. Here, we reverse this method obtain-ing first a list of spectroscopic quasars and then obtain photometricinformation.
We have compiled a list of 488 quasars with redshifts z ≥5.00. We use all the z ≥ 5.00 quasars that have been discovered,spectroscopically confirmed and published as of 2018 December 31(MJD 58483). We then obtain optical, NIR and MIR photometryfor the spectral data set. The NIR data comes from two sources:first, the WFCAM (Casali et al. 2007) on the UKIRT, primarily, butnot exclusively, as part of the UKIRT Infrared Deep Sky Survey(UKIDSS; Lawrence et al. 2007). And second, data from theVIRCAM on the VISTA (Dalton et al. 2006; Emerson, McPher-son & Sutherland 2006). The MIR, λ = 3−30μm wavelengthdata is from the Wide-Field Infrared Survey Explorer (WISE;Wright et al. 2010; Cutri 2013) mission. For reference, Fig. 1displays the wavelength and normalized transmission of the filters inquestion.
2.1 Spectroscopy
We compile the list of all known, spectroscopically confirmedquasars from the literature. This list was complied from a range ofsurveys and papers. Specifically, we use data from: Banados et al.(2014), Banados et al. (2016), Banados et al. (2018a), Banados et al.(2018b), Becker, Bolton & Lidz (2015), Calura et al. (2014), Carilliet al. (2007), Carilli et al. (2010), Carnall et al. (2015), Cool et al.(2006), Douglas et al. (2007), De Rosa et al. (2011), Fan et al.(2000), Fan et al. (2001), Fan et al. (2003), Fan et al. (2004), Fanet al. (2006b), Fan et al. (2019b), Goto (2006), Ikeda et al. (2017),Jiang et al. (2008), Jiang et al. (2009), Jiang et al. (2015), Jianget al. (2016), Kashikawa et al. (2015), Khorunzhev et al. (2017),Koptelova et al. (2017), Kozłowski et al. (2019), Kim et al. (2015),Kim et al. (2019), Kurk et al. (2007), Kurk et al. (2009), Leipski et al.
MNRAS 494, 789–803 (2020)
Dow
nloaded from https://academ
ic.oup.com/m
nras/article/494/1/789/5804786 by guest on 31 July 2022
Infrared properties of very high-z quasars 791
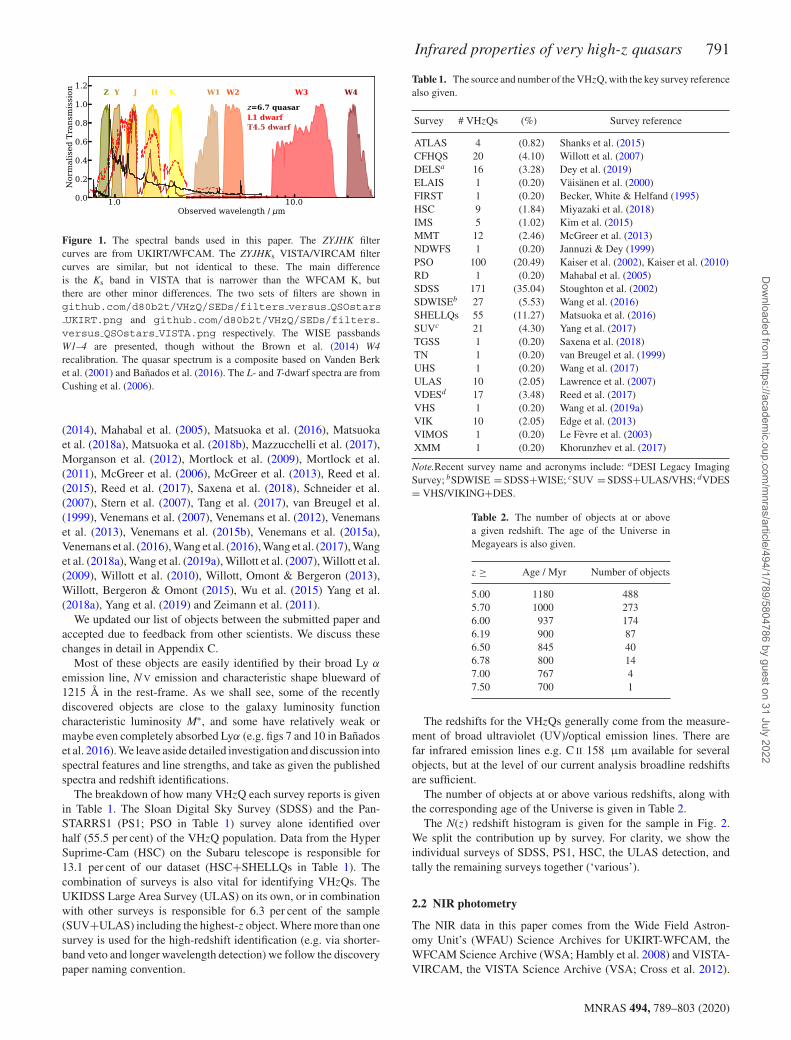
Figure 1. The spectral bands used in this paper. The ZYJHK filtercurves are from UKIRT/WFCAM. The ZYJHKs VISTA/VIRCAM filtercurves are similar, but not identical to these. The main differenceis the Ks band in VISTA that is narrower than the WFCAM K, butthere are other minor differences. The two sets of filters are shown ingithub.com/d80b2t/VHzQ/SEDs/filters versus QSOstarsUKIRT.png and github.com/d80b2t/VHzQ/SEDs/filtersversus QSOstars VISTA.png respectively. The WISE passbandsW1–4 are presented, though without the Brown et al. (2014) W4recalibration. The quasar spectrum is a composite based on Vanden Berket al. (2001) and Banados et al. (2016). The L- and T-dwarf spectra are fromCushing et al. (2006).
(2014), Mahabal et al. (2005), Matsuoka et al. (2016), Matsuokaet al. (2018a), Matsuoka et al. (2018b), Mazzucchelli et al. (2017),Morganson et al. (2012), Mortlock et al. (2009), Mortlock et al.(2011), McGreer et al. (2006), McGreer et al. (2013), Reed et al.(2015), Reed et al. (2017), Saxena et al. (2018), Schneider et al.(2007), Stern et al. (2007), Tang et al. (2017), van Breugel et al.(1999), Venemans et al. (2007), Venemans et al. (2012), Venemanset al. (2013), Venemans et al. (2015b), Venemans et al. (2015a),Venemans et al. (2016), Wang et al. (2016), Wang et al. (2017), Wanget al. (2018a), Wang et al. (2019a), Willott et al. (2007), Willott et al.(2009), Willott et al. (2010), Willott, Omont & Bergeron (2013),Willott, Bergeron & Omont (2015), Wu et al. (2015) Yang et al.(2018a), Yang et al. (2019) and Zeimann et al. (2011).
We updated our list of objects between the submitted paper andaccepted due to feedback from other scientists. We discuss thesechanges in detail in Appendix C.
Most of these objects are easily identified by their broad Ly α
emission line, N V emission and characteristic shape blueward of1215 Å in the rest-frame. As we shall see, some of the recentlydiscovered objects are close to the galaxy luminosity functioncharacteristic luminosity M∗, and some have relatively weak ormaybe even completely absorbed Lyα (e.g. figs 7 and 10 in Banadoset al. 2016). We leave aside detailed investigation and discussion intospectral features and line strengths, and take as given the publishedspectra and redshift identifications.
The breakdown of how many VHzQ each survey reports is givenin Table 1. The Sloan Digital Sky Survey (SDSS) and the Pan-STARRS1 (PS1; PSO in Table 1) survey alone identified overhalf (55.5 per cent) of the VHzQ population. Data from the HyperSuprime-Cam (HSC) on the Subaru telescope is responsible for13.1 per cent of our dataset (HSC+SHELLQs in Table 1). Thecombination of surveys is also vital for identifying VHzQs. TheUKIDSS Large Area Survey (ULAS) on its own, or in combinationwith other surveys is responsible for 6.3 per cent of the sample(SUV+ULAS) including the highest-z object. Where more than onesurvey is used for the high-redshift identification (e.g. via shorter-band veto and longer wavelength detection) we follow the discoverypaper naming convention.
Table 1. The source and number of the VHzQ, with the key survey referencealso given.
Survey # VHzQs (%) Survey reference
ATLAS 4 (0.82) Shanks et al. (2015)CFHQS 20 (4.10) Willott et al. (2007)DELSa 16 (3.28) Dey et al. (2019)ELAIS 1 (0.20) Vaisanen et al. (2000)FIRST 1 (0.20) Becker, White & Helfand (1995)HSC 9 (1.84) Miyazaki et al. (2018)IMS 5 (1.02) Kim et al. (2015)MMT 12 (2.46) McGreer et al. (2013)NDWFS 1 (0.20) Jannuzi & Dey (1999)PSO 100 (20.49) Kaiser et al. (2002), Kaiser et al. (2010)RD 1 (0.20) Mahabal et al. (2005)SDSS 171 (35.04) Stoughton et al. (2002)SDWISEb 27 (5.53) Wang et al. (2016)SHELLQs 55 (11.27) Matsuoka et al. (2016)SUVc 21 (4.30) Yang et al. (2017)TGSS 1 (0.20) Saxena et al. (2018)TN 1 (0.20) van Breugel et al. (1999)UHS 1 (0.20) Wang et al. (2017)ULAS 10 (2.05) Lawrence et al. (2007)VDESd 17 (3.48) Reed et al. (2017)VHS 1 (0.20) Wang et al. (2019a)VIK 10 (2.05) Edge et al. (2013)VIMOS 1 (0.20) Le Fevre et al. (2003)XMM 1 (0.20) Khorunzhev et al. (2017)
Note.Recent survey name and acronyms include: aDESI Legacy ImagingSurvey; bSDWISE = SDSS+WISE; cSUV = SDSS+ULAS/VHS; dVDES= VHS/VIKING+DES.
Table 2. The number of objects at or abovea given redshift. The age of the Universe inMegayears is also given.
z ≥ Age / Myr Number of objects
5.00 1180 4885.70 1000 2736.00 937 1746.19 900 876.50 845 406.78 800 147.00 767 47.50 700 1
The redshifts for the VHzQs generally come from the measure-ment of broad ultraviolet (UV)/optical emission lines. There arefar infrared emission lines e.g. C II 158 μm available for severalobjects, but at the level of our current analysis broadline redshiftsare sufficient.
The number of objects at or above various redshifts, along withthe corresponding age of the Universe is given in Table 2.
The N(z) redshift histogram is given for the sample in Fig. 2.We split the contribution up by survey. For clarity, we show theindividual surveys of SDSS, PS1, HSC, the ULAS detection, andtally the remaining surveys together (‘various’).
2.2 NIR photometry
The NIR data in this paper comes from the Wide Field Astron-omy Unit’s (WFAU) Science Archives for UKIRT-WFCAM, theWFCAM Science Archive (WSA; Hambly et al. 2008) and VISTA-VIRCAM, the VISTA Science Archive (VSA; Cross et al. 2012).
MNRAS 494, 789–803 (2020)
Dow
nloaded from https://academ
ic.oup.com/m
nras/article/494/1/789/5804786 by guest on 31 July 2022

792 N. P. Ross and N. J. G. Cross
Figure 2. The redshift distribution N(z) of the VHzQ sample. The bins areδz = 0.075 in width and have the data stacked on top of each other.
These archives were developed for the VISTA Data Flow System(VDFS; Emerson et al. 2004).
We access both the WSA and the VSA and include all non-proprietary WFCAM data, which covers all public surveys and PIprojects from Semester 05A (2005 May 01) to 2017 January 01, andall non-proprietary VISTA data, which covers all public surveys andPI projects from science verification on 2009 October 15 to 2017January 01.
Here, we are not just querying the WSA or VSA data tables.We are taking a list of objects (positions) are performing matchedaperture (‘forced’) photometry on the NIR imaging data. As such,we generate a set of tables that are different in subtle ways tothe regular ‘Detection’ tables. The two most important tables forour needs are the [w/v]serv1000MapRemeasurement and[w/v]serv1000MapRemeasAver.
We produce and provide two new databases with all the necessaryquantities and measurements to fully reproduce our tables, figuresand results herein. Moreover, these databases contain considerablymore information than we report here. Full documentation canbe found at the WSA Schema Browser and the VSA SchemaBrowser.
Fig. 3 shows the areal coverage of the ULAS, UHS, VHS, andVIKING. UHS DR1 is 12 600 deg2 (J-band); ULAS DR1 3700 deg2
VHS DR6 16 000 deg2 and VIKING DR5 is 1300 deg2. The overlapbetween UHS DR1 and VHS DR6 is 28 deg. These four surveystogether cover 33 000 deg2. VHS, ULAS, and UHS do not observein the Z-band.
2.2.1 Averaging matched photometry
The data was processed using a matched-aperture photometrymethod where flux is measured at the spectroscopic position of thequasar, without necessarily knowing if there is a formal detectionin the NIR photometry beforehand. The matched-aperture pipelineis discussed in Cross et al. (2013) and with fuller details to appearin a forthcoming paper (Cross et al., in preparation).
We query the WSA and VSA performing matched-aperturephotometry at the positions of our 488 VHzQs. This databaseis world-readable and we give the full recipe and relevant SQLqueries for accessing both databases in Appendix A as well asonline.
The photometry in a single epoch image often has a low signal-to-noise (SNR) ratio. The advantage of matched aperture photometryon quasars is that co-adding is relatively simple if each epochis taken in the same aperture and the aperture photometry has
Figure 3. The coverage maps for VHS (DR6; orange), UHS (DR1; skyblue), VIKING (DR5; grey), and ULAS (DR11; red), the most recentpublic releases of the four main surveys. The VHzQs are given by blackdots.
been corrected to total. Indeed, the standard aperture correctionswork well for point sources. Coadding using the matched-aperturephotometry can give better results for the photometry, where theindividual epochs are taken from multiple projects with differentfield-centres and orientations and point-spread functions sincethe individual epoch scattered light, pixel distortion and aperturecorrections can be applied with the correct weighting.
We average the aperture corrected calibrated fluxes (e.g. aper-Jky3), and then convert to magnitudes.
F =∑N
i (wi Fi)∑N
i wi
(1)
where Fi is the ith epoch measurement of a parameter to be averagedsuch as the aperture corrected calibrated flux in a 1
′′aperture
(aperJky3) and F is the weighted mean average of this parameter.The weight for each epoch wi = 1/(σ F)2 if the epoch is includedand wi = 0 if an epoch is excluded for quality control purposes. Theweights of each epoch in each averaged catalogue are tabulated inthe [w]serv1000MapAverageWeights.
We calculate a set of averaged catalogues, for each pointing andfilter, based on the requirements in RequiredMapAverages, inthese cases over time spans of 7, 14, 30, 91, 183, 365, and 730 d,over 10 epochs and over all epochs. The averaging process starts atthe first epoch and works onwards from there. Again, we presentthese measurements in the new SQL tables.
We detect 367 unique quasars in the WFCAM WSA database,237 quasars are detected in the VISTA VSA database with 131objects in common with both WFCAM and VISTA data. We givethe necessary SQL queries syntax at d80b2t/VHzQ.
2.3 MIR data
The MIR data for this study comes from the Wide-field InfraredSurvey Explorer (WISE) mission, and we utlize data from the WISEcryogenic, the NEOWISE (Mainzer et al. 2011) post-cryogenicand NEOWISE Reactivation Mission (NEOWISE-R; Mainzer et al.2014) survey phases.
We use data from the beginning of the WISE mission (2010January; Wright et al. 2010) through the fifth-year of NEOWISE-Roperations (2018 December; Mainzer et al. 2011). There are severalmajor data releases and catalogues based on the WISE mission.Here, we use two: the WISE AllWISE Data release and the recentlyreleased ‘unWISE Catalogue’ (Schlafly et al. 2019). The AllWISEprogram combines the W1 and W2 Single-exposure data from all the
MNRAS 494, 789–803 (2020)
Dow
nloaded from https://academ
ic.oup.com/m
nras/article/494/1/789/5804786 by guest on 31 July 2022

Infrared properties of very high-z quasars 793
WISE survey phases (4-Band Cryo, 3-Band Cryo and Post-Cryo;2010 January 07 thru 2011 February 01) survey phases, and theW3 and W4 from the 4-Band Cryo phase. The unWISE effort9 isthe unblurred coadds of the WISE imaging using the AllWISE andNEOWISE-R stacked data (Lang 2014; Meisner, Lang & Schlegel2018a,b).
For the two shorter WISE bands, λeff3.37μm W1 and λeff4.62μmW2 we generally report the deeper, unblurred unWISE coadd data.For the two longer WISE bands, λeff12.1μm and λeff22.8μm we usethe AllWISE Data Release. Most objects in the AllWISE SourceCatalogue are unresolved, so the best photometric measurementsto use are the deep detection profile-fit photometry measures,wxmpro, wxsigmpro, and wxsnr. The unWISE Catalogueabsolute photometric calibration derives from the photometriccalibration of the unWISE coadds (Meisner, Lang & Schlegel 2017),which is tied to the original WISE zero points through aperturefluxes in a 27.5arcsec radius.
Previous works (e.g. Krawczyk et al. 2013; Ross et al. 2015;Bilicki et al. 2016) found that cross-matches performed with aradius of 2–3 arcsec between the user catalogue and WISE was agood compromise between completeness and contamination (seee.g. fig. 4 of Krawczyk et al. 2013). We thus use a cross-matchradius of 2.75 arcsec. When querying the AllWISE catalogues,‘Cone Search Radius’ in the AllWISE table search was set to 2.75arcsec for the Spatial Constraints. The ‘One to One Match’ was‘not’ checked; although possible, we consider it highly unlikelythere would be more than one MIR source contributing to the fluxof a single UV/optically bright rest-frame quasar. As a check, weutilize data from the Spitzer Space Telescope in IRAC Channel2 4.5μm, IRAC Channel4 8μm, and MIPS 24μm, and numbercounts and luminosity density measurements from Driver et al.(2016, see their figs 8.11, 8.12, and 8.13). The redshift distributionof the sampled 8–24 μm foreground objects is narrow enough andtheir K-corrections advantageous enough, that the objects countssharply turnover for AB(W3, W4) � 20 mag, and the normalizeddifferential counts – especially in e.g. WISE W4 – have most oftheir extragalactic background light energy emerging at AB∼18–20mag. As a consequence, the relative number or probability ofcontaminating objects at AB > 20 mag inside our apertures should besmall.
Knowing we have secure detections in the NIR bands, and want-ing to boost the number of WISE W3/W4 detections, we allow our-selves to be less conservative in querying the AllWISE cataloguesand also query the AllWISE Reject Table. However, with the ex-ception of one object (SHELLQs J1208-0200), the AllWISE RejectTable does not contain any further W3/W4 detection information.
All fluxes in the unWISE catalog are reported there are in‘Vega nanoMaggies’, with the Vega magnitude of a source isgiven by
mVega = 22.5 − 2.5 log(f ), (2)
where f is the source flux. The absolute calibration for unWISEis ultimately inherited from AllWISE through the calibration ofMeisner et al. (2017). This inheritance depends on details of thePSF normalization at large radii, which is uncertain. Subtracting4 millimag from the unWISE W1, and 32 millimag from unWISEW2 fluxes improves the agreement between unWISE and AllWISEfluxes.
9http://unwise.me
Thus to convert unWISE Vega magnitudes on to the AB system,we have
W1AB,unWISE = 22.5 − 2.5 log(fW1) − 0.004 + 2.673
W2AB,unWISE = 22.5 − 2.5 log(fW2) − 0.032 + 3.313
using the Tokunaga & Vacca (2005) AB system, and is slightlydifferent to the transformations presented in Schlafly et al. (2019).
For the our MIR variability investigations, we use the NEOWISE-R 2019 Data Release. NEOWISE 2019 makes available the 3.4 and4.6 μm (W1 and W2) single-exposure images and extracted sourceinformation that was acquired up until 2018 December 13 (MJD58465) including the fifth year of survey operations of NEOWISE.These fifth year NEOWISE data products are concatenated withthose from the first 4 yr into a single archive from 2013 December13 (MJD 56639). The WISE scan pattern leads to coverage ofthe full-sky approximately once every 6 months (a‘sky pass’), butthe satellite was placed in hibernation in 2011 February and thenreactivated in 2013 October. Hence, our light curves have a cadenceof 6 months with a 32 month sampling gap.
3 R ESULTS
Having collated the sample of 488 VHzQs, and obtained theirnear- and MIR photometry we report here the various photometricproperties of the quasars. Table 3 represents the culmination of thiseffort, is the main data product of this paper and we now examinethe assembly of its contents in more detail.
First, we will concentrate on detection rates in the infrared, goon to report on the colour-redshift and colour–colour properties ofour sample. We also investigate the photometric variability.
3.1 Detection rates in the NIR
Table 4 gives the detection rates for the VHzQs in the NIR YJHK/Ks-bands. The first thing to note is that the coverage of the NIR surveysfor example from the UKIDSS LAS and VISTA VHS, does notoverlap the full area for where the VHzQs are detected.
There are 15 objects that have no NIR detections. Three of these(PSO J053.9605–15.7956, PSO J056.7168–16.4769, and DELSJ0411–0907) have been observed (by VHS) but are out of ourqueried time range (for which the data is publicly available). Sixobjects are at declination δ < 0 deg and have not been observed (orat least the data is not in the VSA archive yet). Six objects are at adeclination δ ≥ +60 deg are too far north for UKIRT and cannot beobserved.
We note that although we are often working close to the magni-tude limits of the surveys, Eddington bias does not a significanteffect on our measurements, since we are not discovering newsources, but measuring properties of already known quasars. Indeedin the NIR WFCAM/VISTA data, using forced photometry reducesthe Eddington bias to negligible levels since a flux will be measuredregardless of whether the source is just bright enough (or too faint)to be detected above the background noise.
3.1.1 Comparing WFCAM and VISTA
There are 131 quasars observed in the overlapping area betweenWFCAM and VISTA. We used the VegaToAB values to put theseobjects on the same AB system, and for each object comparedthe two measurements. First, we calculated the weighted average
MNRAS 494, 789–803 (2020)
Dow
nloaded from https://academ
ic.oup.com/m
nras/article/494/1/789/5804786 by guest on 31 July 2022

794 N. P. Ross and N. J. G. Cross
Tabl
e3.
The
first
24(i
.e.5
%)
of48
8ve
ryhi
gh-z
quas
ars
inR
ight
Asc
ensi
onor
der
with
near
and
MIR
phot
omet
ry.T
hefu
llta
ble
can
befo
und
here
.The
AB
mag
nitu
desy
stem
isus
edw
ithth
eW
ISE
Veg
ato
AB
offs
ets
bein
g(�
W1,
�W
2,�
W3,
and
�W
4)=
(2.6
69,3
.281
,5.1
48,a
nd6.
66)
Sinc
eno
neof
the
first
24ob
ject
sha
veZ
-ban
dde
tect
ions
,we
don’
trep
ortt
hatc
olum
nhe
re(b
utis
repo
rted
inth
em
ain
tabl
e).W
ISE
AllW
ISE
W3
and
W4
valu
esw
ithou
tfo
rmal
erro
rsar
elo
w-S
NR
dete
ctio
ns.W
hile
the
num
ber
ofsi
gnifi
cant
figur
esh
own
isla
rger
than
abso
lute
lyne
cess
sary
,it
isus
eful
tove
rify
the
WFC
AM
toV
ISTA
glob
alof
fset
s,se
eTa
ble
5.
Surv
eyQ
uasa
r(Q
SO)
R.A
./deg
Dec
./deg
Red
shif
tY
JH
Kun
WIS
EA
llWIS
Ena
me
(J20
00)
(J20
00)
W1
W2
W3
W4
PSO
J000
.340
1+26
.835
80.
3401
126
.835
885.
75–
19.3
2±
0.04
8–
–18
.949
±0.
026
18.8
0±
0.05
017
.74
±0.
49>
15.4
2SD
SSJ0
002+
2550
0.66
412
25.8
4304
5.82
–19
.37
±0.
087
––
18.9
19±
0.02
618
.70
±0.
047
17.5
6±
0.42
>15
.34
SDSS
J000
5–00
061.
4680
8–0
.115
55.
8520
.70
±0.
211
20.7
3±
0.17
720
.05
±0.
082
20.4
9±
0.14
020
.162
±0.
079
19.9
8±
0.15
3>
17.5
9>
15.6
7PS
OJ0
02.1
073–
06.4
345
2.10
739
–6.4
3456
5.93
–20
.26
±0.
040
–19
.74
±0.
082
19.4
71±
0.04
419
.24
±0.
078
>17
.04
>15
.42
SDW
ISE
J000
8+36
162.
2142
936
.270
415.
17–
19.3
3±
0.07
9–
–18
.687
±0.
021
18.7
1±
0.04
4>
17.1
9>
15.4
5PS
OJ0
02.3
786+
32.8
702
2.37
8732
.870
266.
1–
22.1
7±
0.85
5–
–20
.620
±0.
106
––
–SD
SSJ0
012+
3632
3.13
736
.537
815.
44–
19.0
1±
0.06
1–
–18
.490
±0.
017
18.5
1±
0.03
617
.15
±0.
2315
.35
±0.
3SD
SSJ0
017–
1000
4.31
117
–10.
0154
5.01
19.2
4±
0.03
219
.26
±0.
045
–18
.78
±0.
065
18.6
45±
0.02
218
.60
±0.
045
17.1
7±
0.33
>15
.18
PSO
J004
.393
6+17
.086
24.
3936
117
.086
35.
8–
20.7
4±
0.07
5–
20.2
8±
0.11
420
.503
±0.
103
19.9
8±
0.14
5–
–PS
OJ0
04.8
140-
24.2
991
4.81
408
–24.
2991
65.
6819
.54
±0.
048
19.1
9±
0.04
9–
19.0
7±
0.09
018
.989
±0.
028
18.9
6±
0.06
117
.27
±0.
34>
15.4
8V
DE
SJ0
020–
3653
5.13
112
–36.
8949
56.
9–
20.4
2±
0.10
0–
19.3
2±
0.09
619
.536
±0.
041
19.6
9±
0.10
2>
17.8
3>
15.0
0SD
SSJ0
023–
0018
5.87
779
–0.3
1011
5.06
20.6
2±
0.14
820
.50
±0.
083
20.2
5±
0.11
820
.27
±0.
102
19.5
18±
0.04
619
.41
±0.
092
>17
.02
>15
.15
PSO
J006
.124
0+39
.221
96.
1240
439
.221
936.
62–
21.2
8±
0.48
3–
–20
.033
±0.
064
––
–SD
WIS
EJ0
025–
0145
6.36
183
–1.7
5903
5.07
18.0
3±
0.02
017
.95
±0.
020
17.7
4±
0.00
417
.59
±0.
022
17.5
20±
0.00
917
.51
±0.
018
16.5
4±
0.22
>15
.17
PSO
J007
.027
3+04
.957
17.
0273
34.
9571
26.
020
.22
±0.
088
20.0
4±
0.10
820
.40
±0.
196
20.2
7±
0.18
819
.847
±0.
060
19.8
9±
0.13
5>
17.4
0>
14.9
8SD
WIS
EJ0
031+
0710
7.85
775
7.17
692
5.33
20.0
3±
0.09
920
.20
±0.
206
19.4
9±
0.14
119
.61
±0.
157
19.3
27±
0.03
918
.96
±0.
063
>17
.34
>15
.06
CFH
QS
J003
3–01
258.
2975
–1.4
2358
6.13
–21
.41
±0.
264
21.3
2±
0.33
520
.79
±0.
206
20.8
74±
0.14
2–
––
SDSS
J003
4+37
598.
5597
937
.998
335.
63–
19.7
0±
0.11
3–
–19
.149
±0.
029
19.0
1±
0.05
6>
17.1
8>
15.7
6PS
OJ0
09.3
573–
08.1
190
9.35
733
–8.1
1902
5.72
20.1
3±
0.05
019
.88
±0.
063
–19
.80
±0.
138
19.4
89±
0.04
219
.48
±0.
095
>17
.34
>15
.02
DE
LS
J003
8–15
279.
6504
2–1
5.45
656
7.02
––
––
19.4
10±
0.04
119
.59
±0.
104
>17
.45
>15
.36
PSO
J009
.735
5–10
.431
69.
7355
1–1
0.43
164
6.0
––
––
19.1
60±
0.03
219
.00
±0.
061
>17
.35
>15
.07
PSO
J011
.389
9+09
.032
511
.389
879.
0324
96.
4221
.04
±0.
304
–20
.64
±0.
244
20.7
6±
0.33
620
.442
±0.
104
–>
17.1
3>
15.4
4PS
OJ0
046–
2837
11.5
9854
–28.
6298
25.
9921
.25
±0.
125
20.8
9±
0.07
920
.61
±0.
112
20.2
2±
0.11
119
.732
±0.
050
19.6
8±
0.10
4>
17.4
6>
15.3
5C
FHQ
SJ0
050+
3445
12.5
2777
34.7
5601
6.25
–19
.97
±0.
151
––
19.2
50±
0.03
318
.99
±0.
055
>18
.08
>15
.96
MNRAS 494, 789–803 (2020)
Dow
nloaded from https://academ
ic.oup.com/m
nras/article/494/1/789/5804786 by guest on 31 July 2022

Infrared properties of very high-z quasars 795
Table 4. Detection rate of VHzQs in the NIR. For the15 objects that have no NIR detections, 3 have beenobserved but are not in our queried time range, 6 havenot been observed yet and 6 objects are too far northto be visible by UKIRT.
Selection Number detected (%)
Any band (ZYJHK/Ks) 473 (96.9)Z-band 81 (16.6)Y-band 289 (59.2)J-band 471 (96.5)H-band 277 (56.8)K or Ks-band 343 (70.3)
Table 5. Comparing the magnitudes in different WF-CAM/UKIRT and VIRCAM/VISTA NIR bands.
abs(VIRCAM mmags Number of- WFCAM) objects
Z 13.1 3Y 59.3 63J 0.9 125H 14.9 108Ks/K 1.1 114
(calibrated flux) in each filter of both and calculated the ratio anddifference between each measurement and the average. Then foreach filter we calculated the weighted average of the differences(in mag) for each instrument to see if there were significant offsets.The results are given in Table 5. The only filter with a significantoffset is the Y-band. All of the VISTA averages are negative and allof the WFCAM ones are positive, except for J where the differenceis negligable. The Ks versus K band comparison may be affectedthe different shapes of the filters, with K being significantly widerthan Ks, able to detect light at longer wavelengths.
We have also checked for quasars with large differences inmagnitude between the WSA and VSA. Objects were selectedwhere the average flux was >0. and >5 average flux error. Inorder to account for large errors in either the WFCAM or VISTAphotometry, objects with δmag < 2 × σδmag in either WSA or VSAwere removed. This selects one quasar with large, δmag > 0.2 magdifferences between the WSA and VSA. This is SDSS J0349+0034which has a WSA K-band magnitude of 21.03 ± 0.35 mag AB(observed at MJD = 54062.4), while for the VSA Ks-band this is20.20 ± 0.14 mag AB (observed 3 times between MJD = 55537and 55542), meaning that the WFCAM and VISTA observationsare ∼4 yr apart.
3.2 Detection rates in the MIR
Unlike the NIR coverage, the WISE satellite and mission performedan all-sky survey, so the location of every VHzQ in our data set iscovered. However, the depth of the WISE survey depends heavilyon sky location, with locations near the Ecliptic Poles having thehighest number of exposures.
Before reporting on the detection rates, we investigate this effectusing the AllWISE Source Catalogue. Fig. 4 shows the WISEAllWISE magnitude versus SNR, colour-coded by wxcov themean coverage depth, in each corresponding band. The w123covvalues are the mean pixel coverage in W1/2/3 from the W1/2/3Atlas Tile Coverage Map within an aperture of circular area with
Figure 4. WISE W1/2/3/4 wxmpro Vega magnitude against SNR, colourcoded by wxcov the mean coverage depth, in each corresponding band.
Table 6. Detection rates in the MIR bands from WISE as a functionof redshift. A SNR cut of wxsnr>3.0 has been used for each band.
z ≥ unWISE AllWISEW1 W2 W3 W4
5.00 389 (79.7%) 334 (68.4%) 59 (12.1%) 10 (2.0%)5.70 194 (71.1%) 157 (57.5%) 16 (5.9%) 6 (2.2%)6.00 115 (66.1%) 96 (55.2%) 9 (5.2%) 2 (1.1%)6.19 65 (74.7%) 48 (55.2%) 3 (3.4%) 2 (2.3%)6.50 35 (87.5%) 26 (65.0%) 1 (2.5%) 2 (5.0%)6.78 12 (85.7%) 9 (64.3%) 0 (0.0%) 0 (0.0%)7.00 4 (100.0%) 4 (100.0%) 0 (0.0%) 0 (0.0%)7.50 1 (100.0%) 1 (100.0%) 0 (0.0%) 0 (0.0%)
a radius of 8.25 arcsec centered on the position of this source. Forw4cov this radius is 16.5 arcsec (the AllWISE Source Cataloguecolumn descriptions has further details). The wxcov value takesinto account e.g. individual pixels in the measurement area thatmay be masked or otherwise unusable (reducing the effective pixelcount and thus the mean coverage value) as well as pixels that areaffected by distortions across the across the focal plane in single-exposure images (where this distortion is corrected when coaddingto generate the Atlas Images).
In the two shorter bands W1/2 we see the clear and expectedtrend for brighter objects to have larger SNR, and also for thehigher SNR for objects with more exposures at a given magnitude.The behaviour for the W3/4 bands is different, with two populationsclearly evident in W3 and although a bit more mixed, also in W4.With the suggested split at SNR>2, and no obvious R.A./Dec.dependence seen, this behaviour is explained by the fact that thereare non-detections in W3/4 for objects (with high W1/2 SNR) thatare reported in the AllWISE catalogue.
Table 6 gives the detection rates for the VHzQs in the MIRWISE W1–4 bands. The unWISE depths are impressive with nearly80 per cent of all the VHzQs being detected in unWISE W1. A totalof 12 out of 14 (86 per cent) in unWISE W1 (9 our of 14; 64 per centin unWISE W2) of the z ≥ 6.78 quasars are detected and moreover
MNRAS 494, 789–803 (2020)
Dow
nloaded from https://academ
ic.oup.com/m
nras/article/494/1/789/5804786 by guest on 31 July 2022

796 N. P. Ross and N. J. G. Cross
all of the z ≥ 7 quasars are detected in both unWISE W1 and W2.This bodes very well for future, small mirror infrared missions (e.g.Ross et al. 2019).
Secrest et al. (2015) present an all-sky sample of ≈1.35 millionAGN meeting a two-colour, (W1–W2) versus (W2–W3), photo-metric selection as applied to sources from AllWISE. This colourselection is motivated by Mateos et al. (2012). We investigate if thiscatalogue, which is tuned for, and noted to be highly completeat, lower, z � 2 redshifts, contain the VHzQs. We find onlyfive VHzQs from our sample match the Secrest catalogue, butgiven a W3 detection is required, this is not surprising. Further,in addition to the relative lack of sensitivity in W3, the MIR colorsare moving out of the Mateos et al. (2012) colour criterion at highredshift. This was shown using an AGN spectral energy distributionwhere AGNs above a redshift of about ∼2 fall out of the colourcriterion, see e.g. fig. 5 of Mateos et al. (2012) and fig. 9 of Secrestet al. (2015). Assef et al. (2018) released two large cataloguesof AGN candidates identified across 30 000 deg2 of extragalacticsky from the WISE AllWISE Data Release. The ‘R90’ catalogue,contains 4.5 M AGN candidates at 90 per cent reliability (≈150AGN candidates per deg2) while the ‘C75’ catalogue consists of20.9 M AGN candidates at 75 per cent completeness (≈700 AGNcandidates per deg2). Crossmatching our catalogue of 488 VHzQswith these catalogues, produces 49 matches with the R90 sampleand 129 matches with the C75 sample. Both catalogues unsur-prisingly match to the ultraluminous quasar SDSS J0100+2802(Wu et al. 2015) while the C75, but not the R90 cataloguematches to the first redshift z > 7 quasar ULAS J1120+0641(Mortlock et al. 2011). Neither the R90 or C75 catalogue matchesto the current highest redshift object J1342+0928 (Banados et al.2018a).
3.3 MIR colours
Due to the depth and all-sky coverage of the WISE [and NEOWISE-(R)] mission, several investigations have looked at how WISEdetects AGN (e.g Assef et al. 2012; Stern et al. 2012; Secrestet al. 2015; LaMassa et al. 2017; Assef et al. 2018; Glikman 2018;Hviding et al. 2018; LaMassa et al. 2019)
Fig. 5 shows the (W1–W2) versus (W2–W3) colour–colourdiagram for the 330 VHzQs that have reportedw3mpro values (blueto red coloured points), though we note that only 51 (18 per cent) ofthese objects have w3snr> 3.0. Approximately 400 000 quasars atredshift z� 3.0 from the SDSS Quasar Catalog using the Fourteenthdata release (DR14Q; Paris et al. 2018) are also shown (grey colourscale).
The VHzQ with the bluest colour in (W1–W2) isSDSS J0927+2001, with (W1–W2) = –0.283 (i.e. 0.328 in Vega),and the WISE W1W2W3 colour image is shown in Fig. 6 (a). Thereddest object in (W1–W2) is PSO J135.3860+16.2518 with (W1–W2) = 0.721 (1.33 Vega).
The set of VHzQ detected in WISE W3 and W4 contains 59objects that are detected in the broad W3 filter and 10 objectsthat are formally detected in W4 (w4snr≥3.0). Three of the W3/4objects are presented in Fig. 6. UHS J0439+1634 (Fig. 6(b)) withW4 = 7.165 ± 0.12 was discovered by Fan et al. (2019b) andis a strongly lensed quasar at z =6.51. This high luminosity ismostly not intrinsic, but is boosted by an intervening redshift z ∼0.7galaxy. Other high-redshift quasars that are bright W3/4 objects e.g.SDWISE J0306+1853 (Fig. 6 (c)) may well also so be lensed (e.g.Glikman et al. 2018; Pacucci & Loeb 2019; Fan et al. 2019b), but
Figure 5. The (W2–W3) versus (W1–W2) colour–colour diagram showingthe WISE colours for the 330 VHzQ that have reported w3mpro values(blue to red coloured points). 400 000 quasars at redshift z � 3.0 from theSDSS DR14 quasar catalogue (Paris et al. 2018) are also shown (grey colourscale).
high-resolution follow-up is needed to confirm. SDSS J0100+2802(redshift z = 6.33; Fig. 6 (d)) does not have a formal W4 detection(w4snr= 2.4), but as reported by Wu et al. (2015), has a detectionin the 2MASS J, H, and Ks bands and is also the bluest object inboth (W1–W3) and (W2–W3).
3.4 Variability
VHzQs, if accreting at, or above the Eddington limit, might wellhave changing mass accretion rates, i.e. maccr. A consequence ofthis would be that these quasars exhibit signs of variability, mostlikely showing up in their UV/optical rest-frame emission. We lookfor evidence of this variability signature in the NIR and MIR light-curves of the VHzQs.
Quasars are known to have dramatically changing Balmer lines,especially Hβ (e.g. LaMassa et al. 2015; MacLeod et al. 2016;Ruan et al. 2016; Runco et al. 2016; Runnoe et al. 2016; Gezariet al. 2017; Assef et al. 2018; Ross et al. 2018; Stern et al. 2018;Yang et al. 2018b; Graham et al. 2020; MacLeod et al. 2019). Asa guide, we note that Hα is redshifted to 3.94μm (i.e. W1) at z =5.00 and 5.57μm, which is between the W2 and W3-bands at z =7.50. Hβ is redshifted to 2.92μm, which is the blue edge of W1,at z = 5.00 and 4.13μm at z = 7.50. Less well understood is thetemporal behaviour of the metal lines, in particular C IV and Mg II
. C IV enters the Y-band at redshift z = 5.32 and exits at z = 5.99,and enters the J-band at redshift z = 6.55 and exits at z = 7.57.Mg II enters the H-band at redshift z = 4.33 and exits at z = 5.37and enters the K-band at redshift z = 6.25 and exits at 7.50.
One key point to note is that the NEOWISE-AllWISE matchradius is 3.00 arcsec and the AllWISE (and 2MASS) source infor-mation included in the NEOWISE Source Database are associationsnot identifications.
Fig. 7 gives the number of NEOWISE-R epochs and detectionsfor each VHzQ. There are 74 quasars with over 100 NEOWISE-Repochs, nine with over 200 epochs and four with over 300. Fig. 8
MNRAS 494, 789–803 (2020)
Dow
nloaded from https://academ
ic.oup.com/m
nras/article/494/1/789/5804786 by guest on 31 July 2022
Infrared properties of very high-z quasars 797
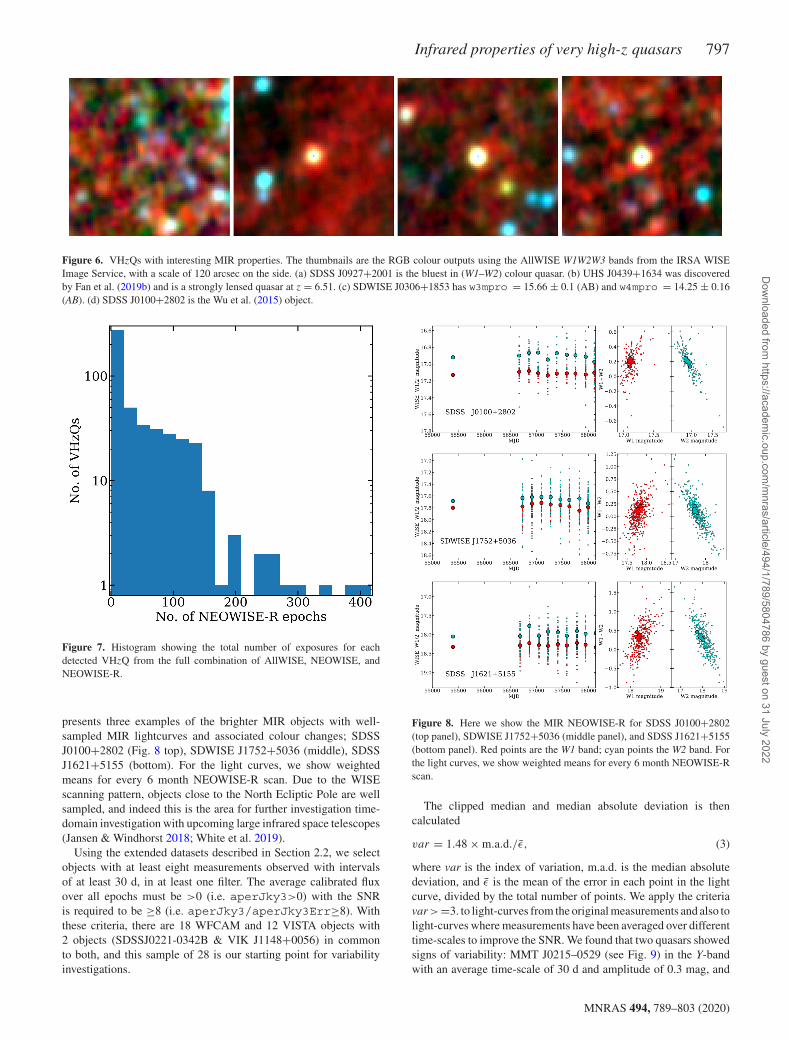
Figure 6. VHzQs with interesting MIR properties. The thumbnails are the RGB colour outputs using the AllWISE W1W2W3 bands from the IRSA WISEImage Service, with a scale of 120 arcsec on the side. (a) SDSS J0927+2001 is the bluest in (W1–W2) colour quasar. (b) UHS J0439+1634 was discoveredby Fan et al. (2019b) and is a strongly lensed quasar at z = 6.51. (c) SDWISE J0306+1853 has w3mpro = 15.66 ± 0.1 (AB) and w4mpro = 14.25 ± 0.16(AB). (d) SDSS J0100+2802 is the Wu et al. (2015) object.
Figure 7. Histogram showing the total number of exposures for eachdetected VHzQ from the full combination of AllWISE, NEOWISE, andNEOWISE-R.
presents three examples of the brighter MIR objects with well-sampled MIR lightcurves and associated colour changes; SDSSJ0100+2802 (Fig. 8 top), SDWISE J1752+5036 (middle), SDSSJ1621+5155 (bottom). For the light curves, we show weightedmeans for every 6 month NEOWISE-R scan. Due to the WISEscanning pattern, objects close to the North Ecliptic Pole are wellsampled, and indeed this is the area for further investigation time-domain investigation with upcoming large infrared space telescopes(Jansen & Windhorst 2018; White et al. 2019).
Using the extended datasets described in Section 2.2, we selectobjects with at least eight measurements observed with intervalsof at least 30 d, in at least one filter. The average calibrated fluxover all epochs must be >0 (i.e. aperJky3>0) with the SNRis required to be ≥8 (i.e. aperJky3/aperJky3Err≥8). Withthese criteria, there are 18 WFCAM and 12 VISTA objects with2 objects (SDSSJ0221-0342B & VIK J1148+0056) in commonto both, and this sample of 28 is our starting point for variabilityinvestigations.
Figure 8. Here we show the MIR NEOWISE-R for SDSS J0100+2802(top panel), SDWISE J1752+5036 (middle panel), and SDSS J1621+5155(bottom panel). Red points are the W1 band; cyan points the W2 band. Forthe light curves, we show weighted means for every 6 month NEOWISE-Rscan.
The clipped median and median absolute deviation is thencalculated
var = 1.48 × m.a.d./ε, (3)
where var is the index of variation, m.a.d. is the median absolutedeviation, and ε is the mean of the error in each point in the lightcurve, divided by the total number of points. We apply the criteriavar >=3. to light-curves from the original measurements and also tolight-curves where measurements have been averaged over differenttime-scales to improve the SNR. We found that two quasars showedsigns of variability: MMT J0215–0529 (see Fig. 9) in the Y-bandwith an average time-scale of 30 d and amplitude of 0.3 mag, and
MNRAS 494, 789–803 (2020)
Dow
nloaded from https://academ
ic.oup.com/m
nras/article/494/1/789/5804786 by guest on 31 July 2022
798 N. P. Ross and N. J. G. Cross
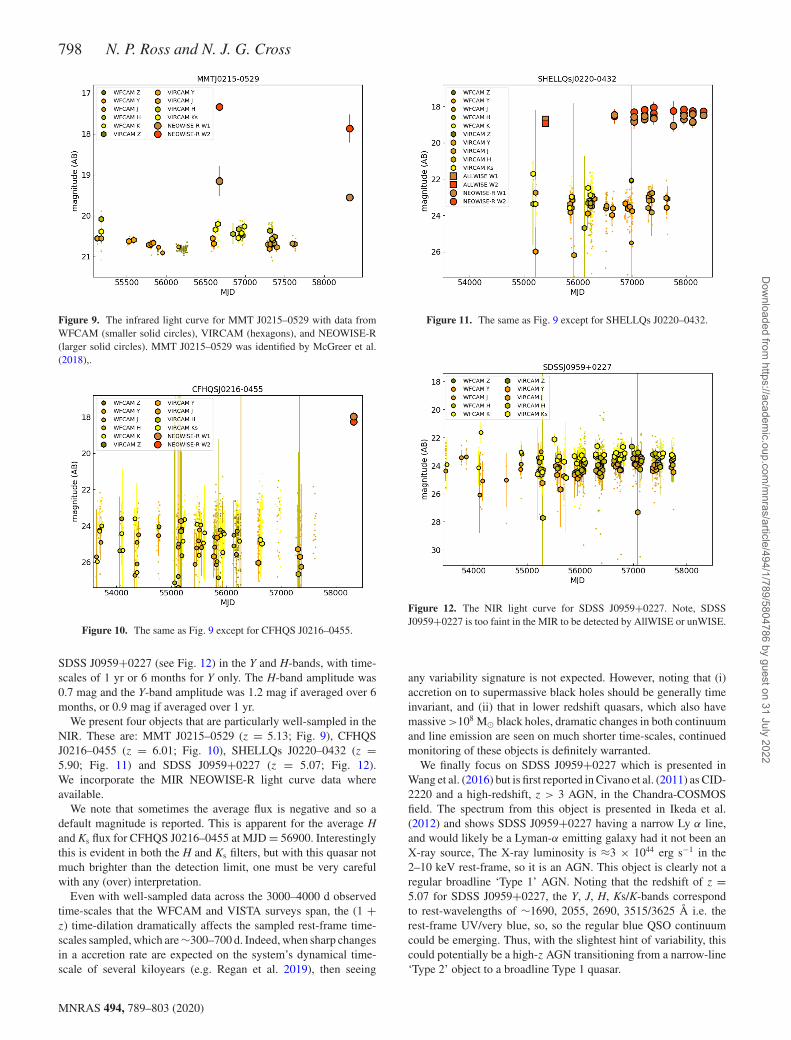
Figure 9. The infrared light curve for MMT J0215–0529 with data fromWFCAM (smaller solid circles), VIRCAM (hexagons), and NEOWISE-R(larger solid circles). MMT J0215–0529 was identified by McGreer et al.(2018),.
Figure 10. The same as Fig. 9 except for CFHQS J0216–0455.
SDSS J0959+0227 (see Fig. 12) in the Y and H-bands, with time-scales of 1 yr or 6 months for Y only. The H-band amplitude was0.7 mag and the Y-band amplitude was 1.2 mag if averaged over 6months, or 0.9 mag if averaged over 1 yr.
We present four objects that are particularly well-sampled in theNIR. These are: MMT J0215–0529 (z = 5.13; Fig. 9), CFHQSJ0216–0455 (z = 6.01; Fig. 10), SHELLQs J0220–0432 (z =5.90; Fig. 11) and SDSS J0959+0227 (z = 5.07; Fig. 12).We incorporate the MIR NEOWISE-R light curve data whereavailable.
We note that sometimes the average flux is negative and so adefault magnitude is reported. This is apparent for the average Hand Ks flux for CFHQS J0216–0455 at MJD = 56900. Interestinglythis is evident in both the H and Ks filters, but with this quasar notmuch brighter than the detection limit, one must be very carefulwith any (over) interpretation.
Even with well-sampled data across the 3000–4000 d observedtime-scales that the WFCAM and VISTA surveys span, the (1 +z) time-dilation dramatically affects the sampled rest-frame time-scales sampled, which are ∼300–700 d. Indeed, when sharp changesin a accretion rate are expected on the system’s dynamical time-scale of several kiloyears (e.g. Regan et al. 2019), then seeing
Figure 11. The same as Fig. 9 except for SHELLQs J0220–0432.
Figure 12. The NIR light curve for SDSS J0959+0227. Note, SDSSJ0959+0227 is too faint in the MIR to be detected by AllWISE or unWISE.
any variability signature is not expected. However, noting that (i)accretion on to supermassive black holes should be generally timeinvariant, and (ii) that in lower redshift quasars, which also havemassive >108 M black holes, dramatic changes in both continuumand line emission are seen on much shorter time-scales, continuedmonitoring of these objects is definitely warranted.
We finally focus on SDSS J0959+0227 which is presented inWang et al. (2016) but is first reported in Civano et al. (2011) as CID-2220 and a high-redshift, z > 3 AGN, in the Chandra-COSMOSfield. The spectrum from this object is presented in Ikeda et al.(2012) and shows SDSS J0959+0227 having a narrow Ly α line,and would likely be a Lyman-α emitting galaxy had it not been anX-ray source, The X-ray luminosity is ≈3 × 1044 erg s−1 in the2–10 keV rest-frame, so it is an AGN. This object is clearly not aregular broadline ‘Type 1’ AGN. Noting that the redshift of z =5.07 for SDSS J0959+0227, the Y, J, H, Ks/K-bands correspondto rest-wavelengths of ∼1690, 2055, 2690, 3515/3625 Å i.e. therest-frame UV/very blue, so, so the regular blue QSO continuumcould be emerging. Thus, with the slightest hint of variability, thiscould potentially be a high-z AGN transitioning from a narrow-line‘Type 2’ object to a broadline Type 1 quasar.
MNRAS 494, 789–803 (2020)
Dow
nloaded from https://academ
ic.oup.com/m
nras/article/494/1/789/5804786 by guest on 31 July 2022
Infrared properties of very high-z quasars 799
4 C O N C L U S I O N S
In this study, we have, for the first time, compiled the list of all z
> 5 spectroscopically confirmed quasars. We have assembled theNIR (Z, Y, J, H, K/Ks) and MIR (WISE W1/2/3/4) photometry forthese objects and given their detection rates. We find that:
(i) SDSS and Pan-STARRS1 together identified over half of theVHzQ sample;
(ii) there remains a quasar ‘redshift desert’ at z ≈ 5.3−5.7,though efforts are being made to address this (e.g. Yang et al.2018a);
(iii) 96.9 per cent of the VHzQ sample is detected in one or moreNIR (ZYJHK/Ks) band;
(iv) the 15 objects that are not detected in the NIR are due to lackof coverage rather than lack of depth;
(v) 389 (79.7 per cent) VHzQs are detected by WISE, e.g. in thedeeper unWISE W1 catalogue.
(vi) All of the z ≥ 7 quasars are detected in both unWISE W1and W2.
(vii) 28 of the quasars had enough NIR measurements andsufficient NIR measurements and SNR to look for variability. Weakvariability was detected in multiple bands of SDSS J0959+0227,and very marginally in the Y-band of MMT J0215–0529. Only onequasar, SDSS J0349+0034 had significant differences between theirWFCAM and VISTA magnitudes in one band, indicating variability.
The science reach of z > 5 quasars will continue to be importantwell into the next decade (Becker et al. 2019; Wang et al. 2019b;Fan et al. 2019a) and will provide key insights into direct-collapseblack holes, hydrogen reionization and the physics of accretion inthe first �700 million years of the Universe.
4.1 Author Contributions
NPR initiated the project, compiled the list of z > 5.00 quasars,wrote most of the analysis code, developed the plotting scripts,and developed and wrote the initial and subsequent drafts of themanuscript.
NJGC supplied the critical NIR expertise and data base for whichthe bulk of the project relies. NJGC also contributed directly to thewriting of the manuscript.
4.2 Availability of Data and computer analysis codes
All materials, databases, data tables and code are fully available at:https://github.com/d80b2t/VHzQ
AC K N OW L E D G E M E N T S
NPR acknowledges support from the STFC and the Ernest Ruther-ford Fellowship scheme. NJGC was supported by STFC grants to theWide Field Astronomy Unit (ST/N005813/1 and ST/T000023/1).
We thank:
(i) Mike Read at the ROE WFAU for help with the WFCAMScience Archive (WSA) and the VISTA Science Archive (VSA).
(ii) Aaron Meisner and Eddie Schlafly for facilitating early accessto the unWISE Catalogue.
(iii) Krisztina Perger for key discussions about missing objectsafter the pre-print appeared.
(iv) Tim Brooke at the IRSA Help Desk;(v) Bernie Shiao at STScI for help with the Pan-STARRS1 DR1
CasJobs interface.
(vi) Michael Cushing for supplying the Late Type stellar spectraand Beth Biller for useful discussion.
(vii) Nathan Secrest for useful discussions on the MIR AGNcatalogues.
This paper heavily used TOPCAT (v4.4) (Taylor 2005, 2011).This research made use of Astropy, a community-developed corePYTHON package for Astronomy (Astropy Collaboration et al. 2013;The Astropy Collaboration et al. 2018).
The VISTA Data Flow System pipeline processing and sciencearchive were used for the WFCAM and VISTA NIR data aredescribed in Irwin et al. (2004), Hambly et al. (2008) and Crosset al. (2012).
The Pan-STARRS1 Surveys (PS1) and the PS1 public sciencearchive have been made possible through contributions by theInstitute for Astronomy, the University of Hawaii, the Pan-STARRSProject Office, the Max-Planck Society and its participating in-stitutes, the Max Planck Institute for Astronomy, Heidelberg andthe Max Planck Institute for Extraterrestrial Physics, Garching,The Johns Hopkins University, Durham University, the Univer-sity of Edinburgh, the Queen’s University Belfast, the Harvard-Smithsonian Center for Astrophysics, the Las Cumbres ObservatoryGlobal Telescope Network Incorporated, the National CentralUniversity of Taiwan, the Space Telescope Science Institute, theNational Aeronautics and Space Administration under Grant No.NNX08AR22G issued through the Planetary Science Division ofthe NASA Science Mission Directorate, the National Science Foun-dation Grant No. AST-1238877, the University of Maryland, EotvosLorand University (ELTE), the Los Alamos National Laboratory,and the Gordon and Betty Moore Foundation.
This project used data obtained with the Dark Energy Camera(DECam) and the NOAO Data Lab, The Data Lab is operated bythe National Optical Astronomy Observatory, the national center forground-based nighttime astronomy in the United States operated bythe Association of Universities for Research in Astronomy (AURA)under cooperative agreement with the National Science Foundation.
This publication makes use of data products from the WISE,which is a joint project of the University of California, LosAngeles, and the Jet Propulsion Laboratory/California Instituteof Technology, and NEOWISE, which is a project of the JetPropulsion Laboratory/California Institute of Technology. WISEand NEOWISE are funded by the National Aeronautics and SpaceAdministration.
CasJobs was originally developed by the Johns Hopkins Uni-versity/ Sloan Digital Sky Survey (JHU/SDSS) team. With theirpermission, MAST used version 3.5.16 to construct CasJobs-basedtools for GALEX, Kepler, the Hubble Source Catalogue, andPanSTARRS.
This research has made use of the SVO Filter Profile Service (http://svo2.cab.inta-csic.es/theory/fps/) supported from the SpanishMINECO through grant AyA2014-55216 The SVO Filter ProfileService10 describes the Spanish VO Filter Profile Service. The FilterProfile Service Access Protocol. Rodrigo, C., Solano, E. http://ivoa.net/documents/Notes/SVOFPSDAL/index.html
REFERENCES
Agarwal B., Smith B., Glover S., Natarajan P., Khochfar S., 2016, MNRAS,459, 4209
10Rodrigo, C., Solano, E., Bayo, A. http://ivoa.net/documents/Notes/SVOFPS/index.html
MNRAS 494, 789–803 (2020)
Dow
nloaded from https://academ
ic.oup.com/m
nras/article/494/1/789/5804786 by guest on 31 July 2022

800 N. P. Ross and N. J. G. Cross
Alexander T., Natarajan P., 2014, Science, 345, 1330Assef R. J. et al., 2012, ApJL, 753, L2Assef R. J., Stern D., Noirot G., Jun H. D., Cutri R. M., Eisenhardt P. R. M.,
2018, ApJS, 234, 23Astropy Collaboration et al., 2013, A&A, 558, A33Banados E. et al., 2014, AJ, 148, 14Banados E. et al., 2016, ApJS, 227, 11Banados E. et al., 2018a, Nature, 553, 473Banados E., Carilli C., Walter F., Momjian E., Decarli R., Farina E. P.,
Mazzucchelli C., Venemans B. P., 2018b, ApJ, 861, L14Becker R. H., White R. L., Helfand D. J., 1995, ApJ, 450, 559Becker G. D., Bolton J. S., Lidz A., 2015, Publ. Astron. Soc. Aust., 32, e045Becker G., D’Aloisio A., Davies F. B., Hennawi J. F., Simcoe R. A., 2019,
in BAAS. p. 440, preprint (arXiv:1903.05199)Belladitta S., Moretti A., Caccianiga A., Cicone C., Ghisellini G., Sbarrato
T., Severgnini P., Della Ceca R., 2018, in AGN13: Beauty and the Beast.The 13th Italian meeting on Active Galactic Nuclei. p. 29
Bilicki R. et al., 2016, ApJS, 225, 5Blain A. W. et al., 2013, ApJ, 778, 113Bosman S. E. I., Becker G. D., Haehnelt M. G., Hewett P. C., McMahon R.
G., Mortlock D. J., Simpson C., Venemans B. P., 2017, MNRAS, 470,1919
Brown M. J. I., Jarrett T. H., Cluver M. E., 2014, Publ. Astron. Soc. Aust.,31, e049
Calura F., Gilli R., Vignali C., Pozzi F., Pipino A., Matteucci F., 2014,MNRAS, 438, 2765
Carilli C. L. et al., 2007, ApJ, 666, L9Carilli C. L. et al., 2010, ApJ, 714, 834Carnall A. C. et al., 2015, MNRAS, 451, L16Casali M. et al., 2007, A&A, 467, 777Chen S.-F. S. et al., 2017, ApJ, 850, 188Civano F. et al., 2011, ApJ, 741, 91Cool R. J. et al., 2006, AJ, 132, 823Cross N. J. G. et al., 2012, A&A, 548, A119Cross N., Hambly N., Collins R., Sutorius E., Read M., Blake R., 2013,
in Adamson A., Davies J., Robson I., eds, Astrophysics and SpaceScience Proceedings Vol. 37, Thirty Years of Astronomical Discoverywith UKIRT. p. 193
Cushing M. C. et al., 2006, ApJ, 648, 614Cutri R. M., 2013, Technical report, Explanatory Supplement to the
AllWISE Data Release Products. IPAC/CaltechDalton G. B. et al., 2006, in Proc. SPIE Conf. Ser., vol. 6269, SPIE,
Bellingham, p. 62690XDe Rosa G., Decarli R., Walter F., Fan X., Jiang L., Kurk J., Pasquali A.,
Rix H. W., 2011, ApJ, 739, 56Dey A. et al., 2019, AJ, 157, 168Douglas L. S., Bremer M. N., Stanway E. R., Lehnert M. D., 2007, MNRAS,
376, 1393Driver S. P. et al., 2016, ApJ, 827, 108Edge A., Sutherland W., Kuijken K., Driver S., McMahon R., Eales S.,
Emerson J. P., 2013, The Messenger, 154, 32Emerson J. P. et al., 2004, in Quinn P. J., Bridger A., eds, Proc. SPIE Conf.
Ser. Vol. 5493, SPIE, Bellingham, p. 401Emerson J., McPherson A., Sutherland W., 2006, The Messenger, 126,
41Fan X. et al., 2000, AJ, 119, 1Fan X. et al., 2001, AJ, 122, 2833Fan X. et al., 2003, AJ, 125, 1649Fan X. et al., 2004, AJ, 128, 515Fan X., Carilli C. L., Keating B., 2006a, ARA&A, 44, 415Fan X. et al., 2006b, AJ, 132, 117Fan X. et al., 2019a, in BAAS. p. 121, preprint (arXiv:1903.04078)Fan X. et al., 2019b, ApJ, 870, L11Flesch E. W., 2015, Publ. Astron. Soc. Aust., 32, e010Fukugita M., Ichikawa T., Gunn J. E., Doi M., Shimasaku K., Schneider D.
P., 1996, AJ, 111, 1748Gezari S. et al., 2017, ApJ, 835, 144Glikman E. et al., 2018, ApJ, 861, 37
Glikman E., Rusu C. E., Djorgovski S. G., Graham M. J., Stern D., UrrutiaT., Lacy M., O’Meara J. M., 2018, preprint (arXiv:1807.05434)
Goto T., 2006, MNRAS, 371, 769Graham M. J. et al., 2020, MNRAS, 491, 4925Haardt F., Gorini V., Moschella U., Treves A., Colpi M., 2016, Astrophysical
Black Holes Lecture Notes in Physics, Vol. 905, Springer-Verlag, BerlinHambly N. C. et al., 2008, MNRAS, 384, 637Hickox R. C., Myers A. D., Greene J. E., Hainline K. N., Zakamska N. L.,
DiPompeo M. A., 2017, ApJ, 849, 53Hill A. R., Gallagher S. C., Deo R. P., Peeters E., Richards G. T., 2014,
MNRAS, 438, 2317Hviding R. E., Hickox R. C., Hainline K. N., Carroll C. M., DiPompeo M.
A., Yan W., Jones M. L., 2018, MNRAS, 474, 1955Ikeda H. et al., 2012, ApJ, 756, 160Ikeda H., Nagao T., Matsuoka K., Kawakatu N., Kajisawa M., Akiyama M.,
Miyaji T., Morokuma T., 2017, ApJ, 846, 57Jannuzi B. T., Dey A., 1999, in Weymann R. et al., eds, ASP Conf. Ser. Vol.
191, Photometric Redshifts and the Detection of High Redshift Galaxies.Astron. Soc. Pac., San Francisco, p. 111
Jansen R. A., Windhorst R. A., 2018, PASP, 130, 124001Jiang L. et al., 2006, AJ, 132, 2127Jiang L. et al., 2008, AJ, 135, 1057Jiang L. et al., 2009, AJ, 138, 305Jiang L. et al., 2010, Nature, 464, 380Jiang L., McGreer I. D., Fan X., Bian F., Cai Z., Clement B., Wang R., Fan
Z., 2015, AJ, 149, 188Jiang L. et al., 2016, ApJ, 833, 222Kaiser N. et al., 2002, in Tyson J. A., Wolff S., eds, Proc. SPIE Conf. Ser.
Vol. 4836, Survey and Other Telescope Technologies and Discoveries.SPIE, Bellingham, p. 154
Kaiser N. et al., 2010, in Stepp L. M., Gilmozzi R., Hall H. J., eds, Proc.SPIE Conf. Ser., p. 77330E
Kashikawa N. et al., 2015, ApJ, 798, 28Khorunzhev G. A., Burenin R. A., Sazonov S. Y., Amvrosov A. L., Eselevich
M. V., 2017, Astron. Lett., 43, 135Kim Y. et al., 2015, ApJ, 813, L35Kim Y. et al., 2019, ApJ , 870, 86Koptelova E., Hwang C.-Y., Yu P.-C., Chen W.-P., Guo J.-K., 2017, Sci.
Rep., 7, 41617Kozłowski S. et al., 2019, ApJ, 878, 115Krawczyk C. M., Richards G. T., Mehta S. S., Vogeley M. S., Gallagher S.
C., Leighly K. M., Ross N. P., Schneider D. P., 2013, ApJS, 206, 4Kurk J. D. et al., 2007, ApJ, 669, 32Kurk J. D., Walter F., Fan X., Jiang L., Jester S., Rix H.-W., Riechers D. A.,
2009, ApJ, 702, 833Lacy M. et al., 2004, ApJS, 154, 166LaMassa S. M. et al., 2015, ApJ, 800, 144LaMassa S. M. et al., 2017, ApJ, 847, 100LaMassa S. M., Georgakakis A., Vivek M., Salvato M., Ananna T. T., Urry
C. M., MacLeod C., Ross N., 2019, ApJ, 876, 50Lang D., 2014, AJ, 147, 108Latif M. A., Volonteri M., Wise J. H., 2018, MNRAS, 476, 5016Lawrence A. et al., 2007, MNRAS, 379, 1599Le Fevre O. et al., 2003, in Iye M., Moorwood A. F. M., eds, Proc. SPIE Conf.
Ser. Vol. 4841, Instrument Design and Performance for Optical/InfraredGround-based Telescopes. SPIE, Bellingham, p. 1670
Leipski C. et al., 2014, ApJ, 785, 154Lupi A., Haardt F., Dotti M., Fiacconi D., Mayer L., Madau P., 2016,
MNRAS, 456, 2993MacLeod C. L. et al., 2016, MNRAS, 457, 389MacLeod C. L. et al., 2019, ApJ, 874, 8Madau P., Haardt F., Dotti M., 2014, ApJ, 784, L38Mahabal A., Stern D., Bogosavljevic M., Djorgovski S. G., Thompson D.,
2005, ApJ, 634, L9Mainzer A. et al., 2011, ApJ, 731, 53Mainzer A. et al., 2014, ApJ, 792, 30Mateos S. et al., 2012, MNRAS, 426, 3271Matsuoka Y. et al., 2016, ApJ, 828, 26
MNRAS 494, 789–803 (2020)
Dow
nloaded from https://academ
ic.oup.com/m
nras/article/494/1/789/5804786 by guest on 31 July 2022

Infrared properties of very high-z quasars 801
Matsuoka Y. et al., 2018a, PASJ, 70, S35Matsuoka Y. et al., 2018b, ApJS, 237, 5Mazzucchelli C. et al., 2017, ApJ, 849, 91McGreer I. D., Becker R. H., Helfand D. J., White R. L., 2006, ApJ, 652,
157McGreer I. D. et al., 2013, ApJ, 768, 105McGreer I. D., Fan X., Jiang L., Cai Z., 2018, AJ, 155, 131Meisner A. M., Lang D., Schlegel D. J., 2017, AJ, 153, 38Meisner A. M., Lang D., Schlegel D. J., 2018a, Res. Notes Am. Astron.
Soc., 2, 1Meisner A. M., Lang D. A., Schlegel D. J., 2018b, Res. Notes Am. Astron.
Soc., 2, 202Miyazaki S. et al., 2018, PASJ, 70, S1Morganson E. et al., 2012, AJ, 143, 142Mortlock D., 2016, in Mesinger A., ed., Astrophysics and Space Science
Library Vol. 423, Understanding the Epoch of Cosmic Reionization:Challenges and Progress, Springer International Publishing, Switzer-land, p. 187
Mortlock D. J. et al., 2009, A&A, 505, 97Mortlock D. J. et al., 2011, Nature, 474, 616Oke J. B., Gunn J. E., 1983, ApJ, 266, 713Pacucci F., Loeb A., 2019, ApJ, 870, L12Paris I. et al., 2018, A&A, 613, A51Pezzulli E., Valiante R., Schneider R., 2016, MNRAS, 458, 3047Pezzulli E., Volonteri M., Schneider R., Valiante R., 2017, MNRAS, 471,
589Planck Collaboration, 2016, A&A, 594, A13Reed S. L. et al., 2015, MNRAS, 454, 3952Reed S. L. et al., 2017, MNRAS, 468, 4702Rees M. J., 1984, ARA&A, 22, 471Regan J. A. et al., 2019, MNRAS, 486, 3892Richards G. T. et al., 2006, ApJS, 166, 470Ross N. P. et al., 2015, MNRAS, 453, 3932Ross N. P. et al., 2018, MNRAS, 480, 4468Ross N., Assef R. J., Kirkpatrick J. D., Graham M. J., 2019, in BAAS. p.
321, preprint (arXiv:1904.06160)Ruan J. J. et al., 2016, ApJ, 826, 188Runco J. N. et al., 2016, ApJ, 821, 33Runnoe J. C. et al., 2016, MNRAS, 455, 1691Sawicki M., 2002, AJ, 124, 3050Saxena A. et al., 2018, MNRAS, 480, 2733Schlafly E. F., Meisner A. M., Green G. M., 2019, ApJS, 240, 30Schneider D. P. et al., 2007, AJ, 134, 102Secrest N. J., Dudik R. P., Dorland B. N., Zacharias N., Makarov V., Fey A.,
Frouard J., Finch C., 2015, ApJS, 221, 12Shanks T. et al., 2015, MNRAS, 451, 4238Simcoe R. A., Sullivan P. W., Cooksey K. L., Kao M. M., Matejek M. S.,
Burgasser A. J., 2012, Nature, 492, 79Stern D. et al., 2005, ApJ, 631, 163Stern D. et al., 2007, ApJ, 663, 677Stern D. et al., 2012, ApJ, 753, 30Stern D. et al., 2018, ApJ, 864, 27Stoughton C. et al., 2002, AJ, 123, 485Takeo E., Inayoshi K., Ohsuga K., Takahashi H. R., Mineshige S., 2018,
MNRAS, 476, 673Tang J.-J. et al., 2017, MNRAS, 466, 4568Taylor M. B., 2005, in Shopbell P., Britton M., Ebert R., eds, ASP Conf.
Ser. Vol. 347, Astronomical Data Analysis Software and Systems XIV.Astron. Soc. Pac., San Francisco, p. 29
Taylor M., 2011, TOPCAT: Tool for OPerations on Catalogues And Tables,Astrophysics Source Code Library, ascl:1101.010
The Astropy Collaboration et al., 2018, preprint (arXiv:1801.02634v2)Tielens A. G. G. M., 2008, ARA&A, 46, 289Timlin J. D. et al., 2016, ApJS, 225, 1Tokunaga A. T., Vacca W. D., 2005, PASP, 117, 421Vaisanen P., Tollestrup E. V., Willner S. P., Cohen M., 2000, ApJ, 540, 593Valiante R., Schneider R., Graziani L., Zappacosta L., 2018, MNRAS, 474,
3825
van Breugel W., De Breuck C., Stanford S. A., Stern D., Rottgering H.,Miley G., 1999, ApJ, 518, L61
Vanden Berk D. E. et al., 2001, AJ, 122, 549Venemans B. P., McMahon R. G., Warren S. J., Gonzalez-Solares E. A.,
Hewett P. C., Mortlock D. J., Dye S., Sharp R. G., 2007, MNRAS, 376,L76
Venemans B. P. et al., 2012, ApJ, 751, L25Venemans B. P. et al., 2013, ApJ, 779, 24Venemans B. P. et al., 2015a, MNRAS, 453, 2259Venemans B. P. et al., 2015b, ApJ, 801, L11Venemans B. P., Walter F., Zschaechner L., Decarli R., De Rosa G., Findlay
J. R., McMahon R. G., Sutherland W. J., 2016, ApJ, 816, 37Volonteri M., 2010, A&AR, 18, 279Volonteri M., Silk J., Dubus G., 2015, ApJ, 804, 148Wang R. et al., 2008, ApJ, 687, 848Wang R. et al., 2011, ApJ, 739, L34Wang F. et al., 2016, ApJ, 819, 24Wang F. et al., 2017, ApJ, 839, 27Wang F. et al., 2018a, AJ, 869, L9Wang F. et al., 2019a, ApJ, 884, 30Wang L. et al., 2019b, BAAS, 51, 399White C. W., Jones V., Jansen R. A., Windhorst R., Cohen S., Willmer
C., Hasinger G., 2019, in American Astronomical Society MeetingAbstracts #233. p. 243.06
Willott C. J. et al., 2007, AJ, 134, 2435Willott C. J. et al., 2009, AJ, 137, 3541Willott C. J. et al., 2010, AJ, 139, 906Willott C. J., Omont A., Bergeron J., 2013, ApJ, 770, 13Willott C. J., Bergeron J., Omont A., 2015, ApJ, 801, 123Wise J. H., Regan J. A., O’Shea B. W., Norman M. L., Downes T. P., Xu H.,
2019, Nature, 566, 85Wright E. L., Eisenhardt P. E., Fazio G. G., 1994, preprint (astro-ph/94070
55v2)Wright E. L. et al., 2010, AJ, 140, 1868Wu X.-B. et al., 2015, Nature, 518, 512Wyithe J. S. B., Loeb A., 2003, ApJ, 586, 693Yan L. et al., 2007, ApJ, 658, 778Yang J. et al., 2017, AJ, 153, 184Yang J. et al., 2018a, preprint (arXiv:1810.11927v1)Yang Q. et al., 2018b, ApJ, 862, 109Yang J. et al., 2019, AJ, 157, 236Zeimann G. R., White R. L., Becker R. H., Hodge J. A., Stanford S. A.,
Richards G. T., 2011, ApJ, 736, 57Irwin M. J. et al., 2004, in Quinn P. J., Bridger A., eds, Proc. SPIE, Optimiz-
ing Scientific Return for Astronomy through Information Technologies.SPIE, p. 411
SUPPORTI NG INFORMATI ON
Supplementary data are available at MNRAS online.
Table 3. The first 24 (i.e. 5%) of 488 very high-z quasars in RightAscension order with near and MIR photometry.
Please note: Oxford University Press is not responsible for thecontent or functionality of any supporting materials supplied bythe authors. Any queries (other than missing material) should bedirected to the corresponding author for the article.
APPENDI X A : N I R WFCAM SCI ENCEA R C H I V E SQ L QU E R I E S
Here, we give the recipe and SQL that returned the NIR photometryfor the VHzQs from the WFCAM Science Archive.
The data are on the WFCAM Science Archive:wsa.roe.ac.uk. Access the User Login formwsa.roe.ac.uk/login.html with these credentials::
MNRAS 494, 789–803 (2020)
Dow
nloaded from https://academ
ic.oup.com/m
nras/article/494/1/789/5804786 by guest on 31 July 2022

802 N. P. Ross and N. J. G. Cross
(i) Username: WSERV1000(ii) password: highzqso(iii) community: nonsurvey
Then going to the Free Form SQL Query page the Databaserelease WSERV1000v20200113 can be accessed which containsall the data we use here.
We nota bene a few things. First, the quantity aperJky3 andaperJky3Err are found in the wserv1000MapRemeasAverand wserv1000MapRemeasurement, so care has to be takento return unique column names (otherwise e.g. astropy.io.fits willcrash). As such, we alias aver.aperJky3 to aperJky3Averand likewise for the error quantity. Aliases will be necessary insome cases anyway, because some queries can be done sensiblyon multiple instances of the same table. Other times, one may jointables on quantities such as catalogueID or apertureID,where you are meaning the same thing, but aliases are then necessaryfor SQLServer to correctly comprehend the query.
Second, the RA and DEC values returned by the WSA are inradians, if used directly. To return values in degrees, use a selectionwith an alias, e.g. RA as RADeg and DEC as DECDeg. Otherrelevant query examples can be found in the GitHub repository, un-der WSA VSA/SAMPLE SQL QUERIES, or the SQLCookbookin the WSA or VSA.
A1 The following SQL will return the best magnitude in eachband for each QSO
1 SELECT2 qso. qsoName , qso .ra as raJ2000 ,
qso .dec as decJ2000 ,3 aver . apertureID , aver . aper-
Jky3 as aperJky3Aver ,4 aver . aperJky3Err as aper-
Jky3AverErr , aver . sumWeight ,5 aver . ppErrBits as ppErrBit-
sAver , m. mjdObs ,6 m. filterID , remeas . aperJky3 ,7 remeas . aperJky3Err ,8 w.weight , remeas . ppErrBits ,9 m. project1011 FROM12 finalQsoCatalogue as qso ,13 MapApertureIDshighzQsoMap as ma ,14 wserv1000MapRemeasAver as aver ,15 wserv1000MapRemeasurement as remeas ,16 MapProvenance as v,17 wserv1000MapAverageWeights as w,18 MapFrameStatus as mfs ,19 Multiframe as m2021 WHERE22 qso . qsoID = ma. objectID and
23 ma. apertureID = aver . aper-tureID and24 aver . apertureID = remeas . aper-
tureID and25 aver . catalogueID = v. combicatID and26 v. avSetupID = 0 and27 v. catalogueID = remeas . cata-
logueID and28 w. combicatID = v. combicatID and29 w. catalogueID = v. catalogueID and30 w. apertureID = aver . apertureID and31 mfs . catalogueID = remeas . cata-
logueID and32 m. multiframeID = mfs. multi-
frameID and33 mfs . programmeID = 10999 and34 mfs . mapID = 135 order by v. combicatID , m. mjdObs
APPENDI X B: N I R VI STA SCI ENCE ARCH IVESQL QUERI ES
In a very similar manner to the WSA, we give here the details onhow to access the VISTA Science Archive (VSA)
At the VSA Login, enter with these credentials::
(i) Username: VSERV1000(ii) password: highzqso(iii) community: proprietary
Then the Freeform SQL Query page is where the data base releaseto use is VSERV1000v20200113. The queries are the same asthose used in the WSA, see Appendix A, but the names of the tablesstarting with wserv1000 should be replaced with vserv1000.
APPENDIX C : U PDATED VH zQ SA MPLE
Between the journal submitted version of this paper (which wasalso the arXiv v1) we updated the sample of VHzQs from atotal of 463 objects to 488 objects. Total 16 of these objectswere from Yang et al. (2018a) and 9 objects were added afterdiscussions with Krisztina Perger, with the relevant catalogue foundat astro.elte.hu/∼perger/catalog.html. We do not include the objectDES0141-54 (Belladitta et al. 2018), since we were unable toobtain arcsecond level coordinates to perform our matched-aperturephotometry. We also update the positions of five objects, seeTable C1.
One object in the Perger catalogue, VA-13492 we could notimmediately cross-match. In this case the coordinates looked similarto SDSSJ1040–1155, and the stated redshift was identical, z = 5.44.Additionally the i-band magnitude was equivalent to SDSS J1040–1155 (i = 25.9 mag). SDSS J1040–1155 is first reported in Douglaset al. (2007) and a transcription error seems to have occurred inFlesch (2015).
MNRAS 494, 789–803 (2020)
Dow
nloaded from https://academ
ic.oup.com/m
nras/article/494/1/789/5804786 by guest on 31 July 2022

Infrared properties of very high-z quasars 803
Table C1. Five quasars with updated coordinates.
Object name R.A. Dec. Redshift Difference/ deg / deg arcsec
DELS J1048-0109 +162.0795417 − 1.1611694 6.678 12.1SHELLQs J1429-0002 +217.3342500 − 0.0353889 6.04 150.0DELS J1559+2212 +239.7878750 +22.2040083 6.07 3.0ATLAS J332.8017-32.1036 +332.8017500 − 32.1035556 6.3394 3.2VIK J2318-3113 +349.5764625 − 31.2295417 6.4435 239.9
This paper has been typeset from a TEX/LATEX file prepared by the author.
MNRAS 494, 789–803 (2020)
Dow
nloaded from https://academ
ic.oup.com/m
nras/article/494/1/789/5804786 by guest on 31 July 2022
Copyright © 2022 FDOKUMEN