THE ALHAMBRA PHOTOMETRIC SYSTEM
35
arXiv:1001.3383v1 [astro-ph.IM] 19 Jan 2010 The ALHAMBRA photometric system T. Aparicio Villegas 1 , E. J. Alfaro 1 , J. Cabrera-Ca˜ no 2,1 , M. Moles 1,3 , N. Ben´ ıtez 1 , J. Perea 1 , A. del Olmo 1 , A. Fern´ andez-Soto 4 , D. Crist´ obal-Hornillos 1,3 , C. Husillos 1 , J. A. L. Aguerri 5 , T. Broadhurst 6 , F. J. Castander 7 , J. Cepa 5,8 , M. Cervi˜ no 1 , R. M. Gonz´alez Delgado 1 , L. Infante 9 ,I.M´arquez 1 , J. Masegosa 1 , V. J. Mart´ ınez 10,11 , F. Prada 1 , J. M. Quintana 1 , S. F. S´anchez 3,12 1 Instituto de Astrof´ ısica de Andaluc´ ıa (CSIC) , E-18080, Granada, Spain; [email protected], [email protected], [email protected], [email protected], [email protected], [email protected], [email protected], [email protected], [email protected], [email protected], [email protected], [email protected] 2 Facultad de F´ ısica. Departamento de F´ ısica At´ omica, Molecular y Nuclear. Universidad de Sevilla, Sevilla, Spain; [email protected] 3 Centro de Estudios de F´ ısica del Cosmos de Arag´ on (CEFCA), C/ General Pizarro, 1, 44001 Teruel, Spain; [email protected], [email protected], [email protected] 4 Instituto de F´ ısica de Cantabria (CSIC-UC), 39005, Santander, Spain; [email protected] 5 Instituto de Astrof´ ısica de Canarias, La Laguna, Tenerife, Spain; [email protected] 6 School of Physics and Astronomy, Tel Aviv University, Israel; [email protected] 7 Institut de Ci` encies de l’Espai, IEEC-CSIC, Barcelona, Spain; [email protected] 8 Departamento de Astrof´ ısica, Facultad de F´ ısica, Universidad de la Laguna, Spain; [email protected] 9 Departamento de Astronom´ ıa, Pontificia Universidad Cat´ olica, Santiago, Chile; [email protected] 10 Departament d’Astronom´ ıa i Astrof´ ısica, Universitat de Val` encia, Valencia, Spain; [email protected] 11 Observatori Astron` omic de la Universitat de Val` encia, Valencia, Spain 12 Centro Astron´ omico Hispano-Alem´ an, Almer´ ıa, Spain ABSTRACT
-
Upload
independent -
Category
Documents
-
view
1 -
download
0
Transcript of THE ALHAMBRA PHOTOMETRIC SYSTEM

arX
iv:1
001.
3383
v1 [
astr
o-ph
.IM
] 1
9 Ja
n 20
10
The ALHAMBRA photometric system
T. Aparicio Villegas1, E. J. Alfaro1, J. Cabrera-Cano2,1, M. Moles1,3, N. Benıtez1, J.
Perea1, A. del Olmo1, A. Fernandez-Soto4, D. Cristobal-Hornillos1,3, C. Husillos1, J. A. L.
Aguerri5, T. Broadhurst6, F. J. Castander7, J. Cepa5,8, M. Cervino1, R. M. Gonzalez
Delgado1, L. Infante9, I. Marquez1, J. Masegosa1, V. J. Martınez10,11, F. Prada1, J. M.
Quintana1, S. F. Sanchez3,12
1 Instituto de Astrofısica de Andalucıa (CSIC) , E-18080, Granada, Spain; [email protected],
[email protected], [email protected], [email protected], [email protected], [email protected], [email protected],
[email protected], [email protected], [email protected], [email protected], [email protected]
2 Facultad de Fısica. Departamento de Fısica Atomica, Molecular y Nuclear. Universidad
de Sevilla, Sevilla, Spain; [email protected]
3 Centro de Estudios de Fısica del Cosmos de Aragon (CEFCA), C/ General Pizarro, 1,
44001 Teruel, Spain; [email protected], [email protected], [email protected]
4 Instituto de Fısica de Cantabria (CSIC-UC), 39005, Santander, Spain;
5 Instituto de Astrofısica de Canarias, La Laguna, Tenerife, Spain; [email protected]
6 School of Physics and Astronomy, Tel Aviv University, Israel; [email protected]
7 Institut de Ciencies de l’Espai, IEEC-CSIC, Barcelona, Spain; [email protected]
8 Departamento de Astrofısica, Facultad de Fısica, Universidad de la Laguna, Spain;
9 Departamento de Astronomıa, Pontificia Universidad Catolica, Santiago, Chile;
10 Departament d’Astronomıa i Astrofısica, Universitat de Valencia, Valencia, Spain;
11 Observatori Astronomic de la Universitat de Valencia, Valencia, Spain
12 Centro Astronomico Hispano-Aleman, Almerıa, Spain
ABSTRACT

– 2 –
This paper presents the characterization of the optical range of the ALHAM-
BRA photometric system, a 20 contiguous, equal-width, medium-band CCD sys-
tem with wavelength coverage from 3500A to 9700A. The photometric description
of the system is done by presenting the full response curve as a product of the fil-
ters, CCD and atmospheric transmission curves, and using some first and second
order moments of this response function. We also introduce the set of standard
stars that defines the system, formed by 31 classic spectrophotometric standard
stars which have been used in the calibration of other known photometric sys-
tems, and 288 stars, flux calibrated homogeneously, from the Next Generation
Spectral Library (NGSL). Based on the NGSL, we determine the transforma-
tion equations between Sloan Digital Sky Survey (SDSS) ugriz photometry and
the ALHAMBRA photometric system, in order to establish some relations bet-
ween both systems. Finally we develop and discuss a strategy to calculate the
photometric zero points of the different pointings in the ALHAMBRA project.
Subject headings: instrumentation: photometers; techniques: photometric; stan-
dards; cosmology: observations; galaxies: distances and redshifts; stars: funda-
mental parameters.
1. Introduction
The ALHAMBRA (Advanced Large, Homogeneous Area Medium Band Redshift Astro-
nomical) survey is a project aimed at getting a photometric data super-cube, which samples
a cosmological fraction of the universe with enough precision to draw an evolutionary track
of its content and properties (see Moles et al. 2008, for a more detailed description of the
scientific objectives of the project). The global strategy to achieve this aim is to identify a
large number of objects, families or structures at different redshifts (z), and compare their
properties as a function of z, once the physical dispersion of those properties at every z-
value has been taken into account. Thus, it is possible to identify epochs (measured by z)
of development of some families of objects or structures, or their disappearance, or even
the progressive change in the proportion of a family of objects and the degree of structu-
ring of the universe. Such a survey requires a combination of large area, depth, photometric
accuracy and spectral coverage. The number, width and position of the filters composing
an optimal filter set to accomplish these objectives have been discussed and evaluated by
Benıtez et al. (2009), yielding a filter set formed by a uniform system of 20 constant-width,
non-overlapping, medium-band filters in the optical range plus the three standard JHKs
near infrared (NIR) bands.

– 3 –
The ALHAMBRA project aims at covering a minimum of 4 square degrees in 8 dis-
continuous regions of the sky. This implies the need for a wide-field instrument, associated
to a 3-4m telescope that allows to cover the selected area with the required signal-to-noise
ratio, within a reasonable observing time period. The ALHAMBRA optical system was then
incorporated to the wide-field camara LAICA1 (Large Area Imager for Calar Alto) placed at
the prime focus of the 3.5m telescope at Calar Alto Observatory, while the NIR range was
observed with the camera OMEGA-20002 attached to the same telescope.
The main purpose of this paper is to present the characterization of the 20 ALHAMBRA
filters in the optical range, that covers from 3500A to 9700A at intervals of approximately
310A, to select the best set of standard stars that determine the observational system, to
establish the first transformation equations between ALHAMBRA and other photometric
systems already defined, and to check the strategies for the determination of the zero points
in the automatic reduction of the ALHAMBRA data set. Some of these issues have been
briefly presented in a previous paper introducing the ALHAMBRA project (Moles et al.
2008).
In section 2 we present the definition of the photometric system. The set of ALHAMBRA
photometric standard stars is analyzed in detail in section 3. In section 4.1, transformation
equations between Sloan Digital Sky Survey (SDSS) and ALHAMBRA photometric system
are established from the comparison between the synthetic magnitudes of 288 stars from the
Next Generation Spectral Library (NGSL) in both systems. We present color data for three
galaxy templates as a function of redshift using the ALHAMBRA photometric system in
section 4.2, and, in section 4.3, we discuss the validity of the transformation equations for
galaxies.
Finally, in section 5 we develop a strategy to determine the photometric zero points of
the system with uncertainties below a few hundredths of magnitude, to be applied in the
calibration of the eight ALHAMBRA fields.
2. Characterization of the ALHAMBRA photometric system
The ALHAMBRA photometric system has been defined according to what is specified in
Benıtez et al. (2009), as a system of 20 constant-width, non-overlapping, medium-band filters
in the optical range (with wavelength coverage from 3500A to 9700A). The definition of the
1http://www.caha.es/CAHA/Instruments/LAICA/index.html
2http://www.caha.es/CAHA/Instruments/O2000/index.html

– 4 –
system is given by the response curve defined by the product of three different transmission
curves: the filter set, detector and atmospheric extinction at 1.2 airmasses, based on the
CAHA monochromatic extinction tables (Sanchez et al. 2007). The graphic representation
of the optical ALHAMBRA photometric system is shown in Fig.1. Numerical values of these
response curves can be found at the web page http://alhambra.iaa.es:8080.
First and second order moments of the transmission functions of the different 20 filters
are also of interest. We will characterize the system filters using their isophotal wavelengths,
full width half maxima, and other derived quantities as follows.
Let Eλ be the spectral energy distribution (SED) of an astronomical source and Sλ the
response curve of a filter in the photometric system defined as:
Sλ = Tt(λ)Tf (λ)Ta(λ), (1)
where Tt is the product of the throughput of the telescope, instrument and quantum efficiency
of the detector, Tf is the filter transmission and Ta is the atmospheric transmission. Following
the definition in Golay (1974), assuming that the function Eλ is continuous and that Sλ does
not change sign in a wavelength interval λa − λb, the mean value theorem states that there
is at least one λi inside the interval λa − λb such that:
Eλi
∫ λb
λa
Sλdλ =
∫ λb
λa
EλSλdλ (2)
implying,
Eλi= 〈Eλ〉 =
∫ λb
λaEλSλdλ
∫ λb
λaSλdλ
, (3)
where λi is the isophotal wavelength and 〈Eλ〉 denotes the mean value of the intrinsic flux
above the atmosphere over the wavelength interval (see also Tokunaga & Vacca 2005). Table
1 shows the isophotal wavelengths of the ALHAMBRA filters using the spectrum of Vega
as reference. The absolute calibrated spectrum has been taken from the STScI Observatory
Support Group webpage3, as the file alpha lyr stis 004.f its. This spectrum is a combination
of modeled and observed fluxes consisting of STIS CCD fluxes from 3500A-5300A, and a
Kurucz model with Teff = 9400K (Kurucz 2005) from 5300A to the end of the spectral
range. The isophotal wavelengths were calculated using formula 3.
The determination of the isophotal wavelengths of a star in a photometric system can
be complex, specially for the filters that contain conspicuous stellar absorption lines (see
3http://www.stsci.edu/hst/observatory/cdbs/calspec.html

– 5 –
Figure 1.a). For example, filter A394M is extremely sensitive to the Balmer jump and filter
A425M encompasses the two prominent Hγ and Hδ lines, at 4340A and 4101A respectively.
At 4861A, Hβ is in filter A491M, and at 6563A Hα falls on filter A646M. The Paschen series,
from 8208A at filter A829M, appears associated to the four reddest ALHAMBRA filters
(A861M, A892M, A921M, A948M).
However, this quantity depends on the spectral energy distribution of the emitter, thus,
for the same filter it will be different for each kind of source. The isophotal wavelength can be
approximated by other central parameters that only depend on the photometric system, such
as the wavelength-weighted average or the frequency-weighted average (written as cν−1):
λmed =
∫
λSλdλ∫
Sλdλ(4)
νmed =
∫
νSνd(ln ν)∫
Sνd(ln ν), (5)
or by the effective wavelength as defined by Schneider et al.(1983):
λeff = exp[
∫
d(ln ν)Sν lnλ∫
d(ln ν)Sν
] (6)
which is halfway between the wavelength-weighted average and the frequency-weighted ave-
rage (Fukugita et al. 1996). The differences between the isophotal wavelength concept and
these three central approaches can be seen in Golay (1974).
The root mean square (rms) fractional widths of the filters, σ, defined as:
σ =
√
∫
d(ln ν)Sν [ln(λ
λeff)]2
∫
d(ln ν)Sν
(7)
is useful in calculating the sensitivity of the effective wavelength to spectral slope changes:
δλeff = λeffσ2δn, (8)
where n is the local power-law index of the SED (fν νn), and the effective band width, δ, is
given by:
δ = 2(2 ln 2)1/2σλeff . (9)
We also calculate the flux sensitivity quantity Q, defined as
Q =
∫
d(ln ν)Sν , (10)

– 6 –
which allows a quick approximation to the response of the system to a source of known flux
in the following way:
Ne = AtQfνeffh−1, (11)
where Ne is the number of photoelectrons collected with a system of effective area A inte-
grating for a time t on a source of flux fν , and h is the Planck constant. As an example,
the number of photoelectrons collected using the ALHAMBRA photometric system, in 1
arcsec2, integrating for a time of 5000 seconds on a source of AB=23 mag·arcsec−2 in filter
A491M is 1.54×10⁴ photoelectrons.
Table 1 shows the values of these parameters calculated for each of the filters in the
ALHAMBRA photometric system.
3. Standard stars system
To calibrate the ALHAMBRA photometric system we have chosen two different sets
of primary standard stars. The first one is a set of 31 classic spectrophotometric standard
stars from several libraries such as Oke & Gunn (1983), Oke (1990), Massey & Gronwall
(1990) and Stone (1996), together with the main standard stars adopted by the Hubble
Space Telescope (Bohlin, 2007), and the SDSS standard BD + 174708 (Tucker et al. 2001).
This set was chosen in order to anchor the ALHAMBRA photometric system with some
standards that have been used on important photometric systems such as the SDSS, with
which we have established some transformation equations, as explained in the following
sections. These objects are stars with no detected variability within a few millimagnitudes
scale, available high-resolution spectra (≤ 5 A), and flux calibrated with errors lower than
5%. These standard stars are spread out all over the sky and are bright, but they do not
cover all the spectral types, being mostly white dwarfs and main sequence A-type stars.
The second set of primary standard stars is formed by 288 stars from a new spectral li-
brary, with good spectral resolution, all of them obtained and flux calibrated homogeneously,
and covering a wide range of spectral types, gravities and metallicities (3440K ≤ Teff ≤
44500K, 0.45 ≤ lg g ≤ 4.87 and −2 ≤ [Fe/H ] ≤ 0.5). This spectral library has been deve-
loped at the Space Telescope Science Institute; it consists of 378 high signal-to-noise stellar
spectra, and is known as HST/STIS Next Generation Spectral Library (NGSL), (Gregg et al.
2004 4). The wavelength range of these spectra covers from 2000A to 10.200A. These stars
represent a potential set of spectrophotometric standards, being valuable in the study of
4http://lifshitz.ucdavis.edu/~mgregg/gregg/ngsl/ngsl.html

– 7 –
atmosphere parameters using model atmosphere fluxes. Coordinates and physical properties
of these stars can be found at http://archive.stsci.edu/prepds/stisngsl/.
These 288 stars together with the 31 classic spectrophotometric standards define the
set of primary standards of the ALHAMBRA photometric system. AB magnitudes in the
ALHAMBRA system of these stars are presented in two electronic tables, Table 2 and Table
3. Nine stars (AGK81D266, BD17D4708, BD28D4211, BD75D325, FEIGE 110, FEIGE 34,
G191B2B, HZ 44, P041C) are common to both sets. Magnitudes in the ALHAMBRA pho-
tometric system for these nine stars derived from the two different sources show differences
lower than a few millimagnitudes over the whole filter set, indicating that both groups of
standard stars are anchored to the same physical system. However, once we have established
the similitude and stability of the photometric zero points for both set of standards we will
base the further analysis on the NGSL catalogue, which shows a higher degree of internal
homogeneity, both in wavelength and flux calibrations.
Magnitudes in the ALHAMBRA photometric system are set on the AB magnitude
system (Oke & Gunn 1983),
ABν = −2,5 lg fν − 48. 60, (12)
where the constant comes from the expression
48. 6 = −2. 5 lgF0, (13)
and F0 = 3. 63×10−20erg/cm2/s/Hz is the flux of Vega at λ = 5500A used by those authors.
The parameter fν is the flux per unit frequency of an object in erg/cm2/s/Hz.
The AB magnitudes will be estimated as follows:
ABν = −2. 5 lg
∫
fνSν d( lg ν)∫
Sν d( lg ν)− 48. 6 (14)
where Sν is the response function of the system corresponding to the atmosphere-telescope-
filter-detector combination.
Regarding the observational part of the ALHAMBRA project, the adequate definition
of the photometric system must fit both the LAICA camera and its geometry. LAICA’s
focal plane is made up of four CCDs that partly cover a total field of 44.36’ x 44.36’, and
it needs four filter sets, each one univocally associated to each of the CCDs. The standard
ALHAMBRA photometric system is chosen as the one at position number 3 of the LAICA
camera, and three replicas have been built to complete the observational setting. Compari-
son of the three instrumental replicas and the ALHAMBRA photometric system, has been

– 8 –
performed using the Vega spectrum above. We calculated the absolute differences between
the AB magnitudes of the star in each one of the three replicas and the standard ALHAM-
BRA value, detecting that filter A366M shows the maximum absolute difference (up to 0.05
magnitudes). In the case of filter A394M there is a maximum of 0.02 magnitudes offset, filter
A425M has a 0.01 magnitudes offset, and the rest of the filters have smaller differences.
Filter CCD1 CCD2 CCD3 CCD4 ∆max
A366M 0.97 0.97 0.96 0.92 0.05
A394M 0.03 0.02 0.02 0.01 0.02
A425M -0.14 -0.13 -0.13 -0.13 0.01
We have developed a statistical analysis on the distribution of differences, using synthetic
AB magnitudes of the 288 standard stars from the NGSL. Table 4 shows the result of this
analysis. Once again filter A366M presents the largest difference in magnitude, reaching up
to 0.0689 magnitudes for some stars in the sample. For the whole sample, the median of
the differences in absolute value between filter A366M AB magnitudes in the ALHAMBRA
photometric system and those determined from the three replicas, is 0.0174 magnitudes, with
a rms (calculated through MAD, median absolute deviation) of 0.0088. In the other filters
the median of the absolute differences is less than 0.01 magnitudes, becoming smaller as we
move to redder wavelengths.
4. ALHAMBRA-SDSS transformation equations
4.1. Based on the Standard Stars
The Sloan Digital Sky Survey is a well-known astronomical project which has obtained
deep multi-color images covering more than a quarter of the sky. Its photometric system is
formed by five non-overlapping color bands (ugriz ) that cover the complete optical range
from 3000A to 11.000A (Fukugita et al. 1996; Smith et al. 2002). Given that the SDSS
and the ALHAMBRA photometric systems lay on the same reference standard stars, a set
of transformation equations can be determined between both systems based on the NGSL
stars.
Based on the proximity of their effective wavelengths (Table 1) , we select the ALHAM-
BRA filters which better correspond to the 5 SDSS bands as:

– 9 –
u 354.0 nm A366M 366.1 nm
g 477.0 nm A491M 491.3 nm
r 622.2 nm A613M 613.4 nm
i 763.2 nm A770M 769.9 nm
z 904.9 nm A921M 920.7 nm
In this way, a zero-order approximation to the SDSS photometric system could be given
by the ALHAMBRA colors A366M-A491M (corresponding to the u-g SDSS color), A491M-
A613M (g-r color), A613M-A770M, (r-i color) and A770M-A921M (i-z color).
However, one has to take into account the different widths of the filters in the two
systems (see Figure 1.b for a graphic comparison). The ALHAMBRA photometric system
uses medium-band filters (≈ 31 nm wide), so they are more sensitive to discontinuities
in the spectral energy distribution. On the contrary, the SDSS wide-band filters transmit
more energy, permitting the detection of fainter objects, but showing more difficulties in the
interpretation and analysis of the information derived from their photometric measurements.
The transformation equations from SDSS magnitudes to the ALHAMBRA photometric
system (and vice versa) have been calculated using synthetic AB magnitudes for the NGSL
subset of the ALHAMBRA primary standards. The ugriz synthetic magnitudes were obtai-
ned from the filters and detector set, following the SDSS standard system given by Smith et
al. (2002, USNO), located in the US Naval Observatory 1m telescope.
The elaboration of the lineal model used to obtain the magnitudes in the ALHAMBRA
photometric system from SDSS photometry has been developed using the statistical software
R 5, in particular the statistical task called “Backward Stepwise Regression” that uses the
Bayesian Information Criterion (BIC), a tool for model selection defined as:
BIC = −2 ln L+ k ln(n) (15)
where L is the maximized value of the likelihood function for the estimated model, k the
number of free parameters to be estimated, and n is the sample size (number of observations).
The transformation equations are, in general, valid for the range of stellar parameters
covered by the selected 288 NGSL stars. Table 5 shows the coefficients of the transforma-
tion from SDSS magnitudes to ALHAMBRA photometry. First column are the dependent
variables of the linear regression which are composed of a color formed with an ALHAM-
BRA band minus a SDSS band; the independent variables are correlative SDSS colors. We
5http://www.r-project.org

– 10 –
calculate this type of transformations, instead of using as dependent variables the AB AL-
HAMBRA magnitudes and as the independent variables the SDSS magnitudes directly, in
order to force the sum of the linear model coefficients to be 1, a necessary condition when
we are comparing magnitudes and not colors. From a model such as,
Alhi =∑
j
aij · Sloanj + bi (16)
follows that the same star observed (using any photometric system) at different distances
would have the same magnitudes plus a single constant equal for all filters, µ, so the equations
should verifyAlhi + µ =
∑
j aij · (Sloanj + µ) + bi =
=∑
j aij · Sloanj + bi + (∑
j aij) · µ(17)
which implies that the coefficients in the transformation equations should satisfy that the
sum of all the coefficients is equal to 1. With this in mind, the equations can be posed as:
Alhi − Sloank =
4∑
j=1
cij · (Sloanj − Sloanj+1) + di (18)
where Sloank is any of the five SDSS bands.
Table 6 shows the coefficients of the inverse transformation equations, from ALHAM-
BRA photometry to SDSS magnitudes, obtained with the same procedure.
4.2. Redshift Galaxy templates
Color transformations for stars, in general, would not offer accurate results for galaxies,
especially when the effects of redshift and intergalactic absorption are taken into account. It
is therefore desirable to describe the colors of observed galaxies at different redshifts in the
system, as accurately as possible. To do so, we use the empirically calibrated library of Benıtez
et al. (2004). We generate estimated colors for the galaxies in the library in redshift intervals
of 0.05, using the SDSS filter r as reference for all the ALHAMBRA medium-band filters.
All colors correspond to the AB system, and were calculated using the functions included
in the module bpz tools from the BPZ package (Benıtez 2000) which offers an accuracy
similar to that of SYNPHOT (Baggett et al. 1997). We present here the tables for the E/S0,
Sbc, Im, SB2, SB3 and Scd templates for the ALHAMBRA photometric system (Tables
7 to 12). These values allow us to determine in an easy way the k-correction which arises
from estimating spectral indices at observing frequencies other than the rest frequency. As an
example, Figure 2 and Figure 3 present the variation of the k-correction for two ALHAMBRA

– 11 –
colors, A491M-A613M and A770M-A921M respectively, versus different values of z for these
three galaxy templates.
These tables must be used with caution, since it is obvious that a few templates cannot
represent all the possible variations of real galaxy spectra. Nevertheless, they also serve as a
guide to transform galaxy colors between different photometric systems for a given spectral
type and redshift. To this end, we need to find the closest possible match in redshift and
spectral type in the electronic tables, using as many colors as possible. Then we look up
the corresponding color in the table corresponding to the spectral type and filter of interest,
using interpolation between spectral types and redshifts if needed.
4.3. Validity of the transformation equations on galaxies
Although the transformation equations presented in section 4.1 are calculated to be
applied to stellar objects, we have carried out a quick test to see how they work for galaxy
templates at z=0. Using tables 7, 8 and 9, we have obtained ALHAMBRA colors of the
three galaxy templates: E/S0, Sbc and Im. Applying the transformation equations to their
ALHAMBRA colors, we obtained SDSS colors, and these were compared with two different
results presented by Fukugita et al.(1995), where they obtained synthetic colors from the
convolution of Kennicutt’s (1992) spectrophotometric atlas with the response functions of
the SDSS photometric system, and Shimasaku et al.(2001), where SDSS colors of a sample of
observed galaxies are presented. As Fig. 4 shows, the values obtained by the ALHAMBRA-
SDSS transformation equations are within the observed range of SDSS galaxy colors, taking
into account the typical uncertainty in the colors that define a class of morphological type.
The validity of these transformation equations for galaxies depends on the proximity
of their spectral energy distributions to the SED of the stars used in the elaboration of the
equations, in our case, the 288 stars from the NGSL. Thus, in a color-color diagram, the
smaller the distance of the galaxy to the distribution of the stars, the higher the confidence
level will be when applying the transformation equations to this galaxy. Figure 5 shows
two ALHAMBRA color-color diagrams where the same previous three galaxy templates
are presented at different redshift values. E/S0 and Sbc galaxies at z=0 are quite close to
the stellar distribution, while Im galaxies at z=0 are too blue, and slightly offset from the
distribution of the stellar colors.

– 12 –
5. Zero point determination
The zero point calibration of the observed fields in the ALHAMBRA survey has been
carefully considered until we found a strategy which is robust and general enough to be
applied to the whole survey and to all kind of astronomical objects. We tackled the issue
in different ways, reaching a strategy with which zero points of ALHAMBRA fields are
determined to an error below a few hundredths of a magnitude for the whole range of
spectral types in the sample. This method entails the following steps:
1. The first task is to perform an exhaustive selection of field stars found in the ALHAM-
BRA source catalogue for each field, selecting stellar objects with low photometric error
(less than 0.15 magnitudes), morphologically classified by SExtractor (Bertin & Ar-
nouts 1996) as stellar object at the three reddest filters, A892M, A921M, and A948M.
It is possible that the pipeline may recognize the nucleus of a distant galaxy as a star
in the bluest filters, so we focus primarily on classification in the reddest fitlers. As we
show in Fig. 6, the great majority of these stars are main sequence stars of late spectral
types.
2. Using this set of stars we look for the ones that have SDSS photometry. For this task,
the SDSS DR7 was used. We utilize the SkyServer Tools from its web page6. Amongst
the different types of search requests we choose the more complete SQL Search, where
one can search for the needed objects directly from the DR7 database.
3. Then, for each stellar object, we find the star (within the 288 NGSL objects) that best
fits its SDSS photometry. To do it we select the NGSL star that minimizes the variance
of the differences between the SDSS (model) magnitudes of the NGSL star and the
SDSS (observed) magnitudes of the field star. We only allow for a constant term, equal
for every magnitude, related to the distance module of both stars (δv = 5 log(r2r1)).
Once we have the NGSL objects that best fit with each field star, we assign to it
the expected ALHAMBRA AB magnitudes that correspond, using the already known
system responses. In Fig. 7 we show, as an example, the spectrum of the star HD160346
in AB magnitudes, together with the instrumental magnitudes plus the zero points of
a field star fitted with this NGSL star in the algorithm, and also its SDSS photometry.
4. Finally, the data are refined from outliers with a Chebyshev filter:
|xi − x| < k ∗ σ (19)
6http://cas.sdss.org/dr7/en/tools/search/radial.asp

– 13 –
where x is the central value of the differences, k is a constant, in particular we take
k = 3, and σ is the MAD of the data. The zero point is determined as the central value
of the distribution of differences between instrumental magnitudes and synthetic AB
magnitudes.
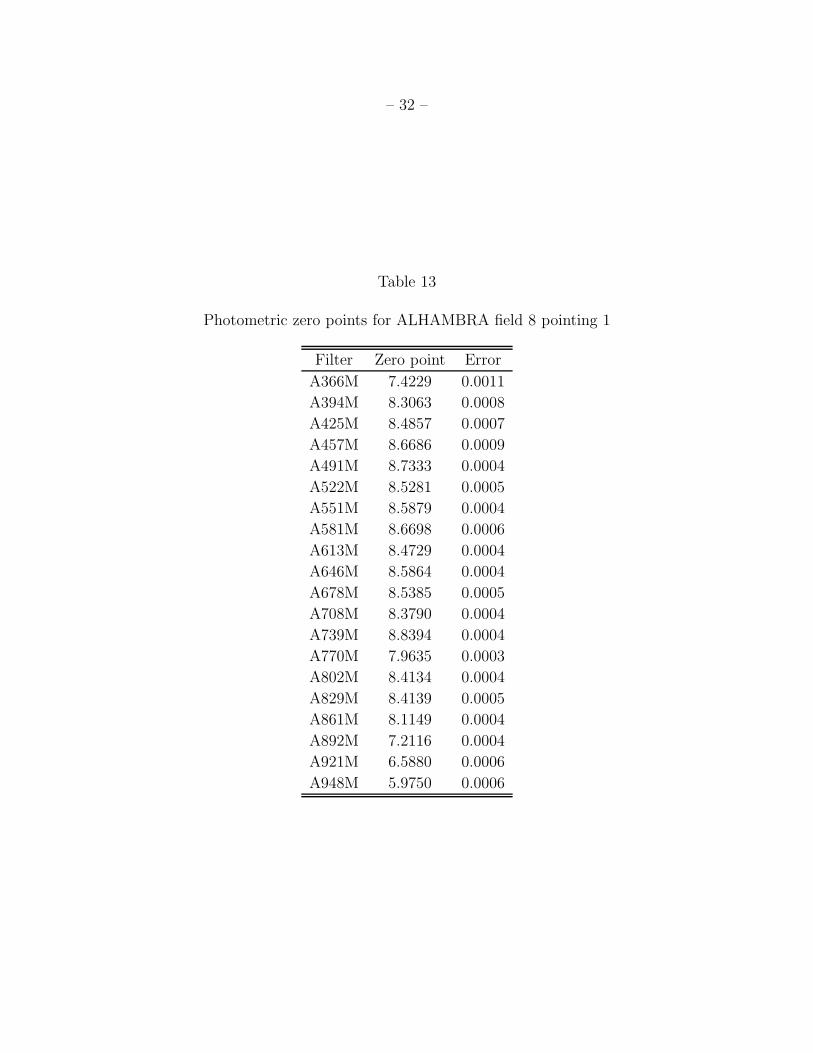
Table 13 shows the main characteristics of the photometric zero points of the ALHAM-
BRA field 8, pointing 1, as an example of the results obtained when applying this strategy.
In principle, the transformation equations between SDSS and ALHAMBRA photome-
try and the subsequent comparison between the instrumental values and the ALHAMBRA
standard values for the stars with photometry in both systems, should yield the same results.
However, we noticed some systematic structure in the distribution of differences (in the sense
of instrumental minus transformed AB magnitude), which depends on the magnitude of the
stars. The differences of the brighter stars are higher than the weaker ones, up to one magni-
tude ahead in some filters. In Fig. 8 we plot the magnitude differences for filter A394M versus
the SDSS magnitude u, for the same sample of field stars (ALHAMBRA field 8, pointing
1) used with the method presented above. We can see that the zero point estimated with
the comparison of spectra and SEDs (see Table 13) is a good fit to the point distribution
in general, although also some of the stars with brighter u magnitude move systematically
away from the central value. This anomalous result appears also when other photometric
systems (e.g. UBVRI) are compared to the SDSS system, and these transformations are
then used to determine the zero point in the UBVRI system from data of the SDSS survey
(as shown in Chonis & Gaskell 2008). Those authors proposed some possible explanations
to account for the observed systematic difference. We consider that a detailed discussion on
the precision and accuracy of the brighter star photometry in the SDSS catalogue is out of
the scope of this paper. Hence we only notice that our chosen methodology overcomes the
troubles derived from a direct comparison between instrumental and standard ALHAMBRA
values, obtained from SDSS-to-ALHAMBRA transformations.
6. Conclusions and Summary
The ALHAMBRA survey is a new extragalactic survey developed with a clear scientific
objective: looking for the optimization of some variables to perform a kind of cosmic tomo-
graphy of a portion of the universe. It is based on a new photometric system, consisting of
20 filters covering all the optical spectral range, and the three classical JHKs near infrared
bands. The survey camera for the optical range is LAICA, installed on the prime focus of
the 3.5m telescope of the Calar Alto Astronomical Observatory. The geometry of this instru-
ment, with four different CCDs, is important to understand the ALHAMBRA observational

– 14 –
strategy.
We present the characterization of the ALHAMBRA photometric system as defined by
the product of three different response functions: detector, filters and atmosphere.
The set of primary standard stars which defines the ALHAMBRA photometric system
is formed by 31 classic spectrophotometric standard stars from several libraries together with
288 stars from the Next Generation Spectral Library, which cover a wide range of spectral
types and metallicities. Since the ALHAMBRA photometric system observes with four sets
of filter+detector combinations (associated to each of the LAICA detectors), we have chosen
one of the sets as the definition of the system, and developed a statistical analysis of the
differences between the AB magnitudes in each one of the others. This analysis shows that
the maximum difference between magnitudes, takes place in the bluest filter, A366M, with
a median difference of 0.0174 magnitudes, being much smaller in the others 19 filters.
Transformation equations from SDSS photometry to the ALHAMBRA photometric sys-
tem (and vice versa) have been elaborated using synthetic magnitudes of the 288 standard
stars from the NGSL, making use of “Backward Stepwise Regression”, and the “Bayesian
Information Criterion” as tool for model selection. We have also shown some examples of
galaxy colors and their redshift evolution in our system. In particular, we show the AL-
HAMBRA colors for three galaxy templates (E/S0, Sbc and Im) at different redshifts, from
z=0.00 to z=2.50, with a step of 0.05 in z.
The strategy of the observational determination of the photometric zero point has been
worked out in detail, with special attention to the problems that appear when these zero
points are calculated based on the SDSS transformation equations. These problems are al-
so present on other photometric systems different to our own (e.g. UBVRI). The method
shown in this paper overcomes these trouble, allowing us to determine the zero point of any
ALHAMBRA field with an error below few hundredths of magnitude.
We thank Jesus Maız Apellaniz for providing data and advice.
This publication makes use of data from the SDSS.Funding for the SDSS and SDSS-II
has been provided by the Alfred P. Sloan Foundation, the Participating Institutions, the
National Science Foundation, the U.S. Department of Energy, the National Aeronautics and
Space Administration, the Japanese Monbukagakusho, the Max Planck Society, and the Hig-
her Education Funding Council for England. The SDSS Web Site is http://www.sdss.org/.
The SDSS is managed by the Astrophysical Research Consortium for the Participating Ins-
titutions. The Participating Institutions are the American Museum of Natural History, As-
trophysical Institute Potsdam, University of Basel, University of Cambridge, Case Western

– 15 –
Reserve University, University of Chicago, Drexel University, Fermilab, the Institute for Ad-
vanced Study, the Japan Participation Group, Johns Hopkins University, the Joint Institute
for Nuclear Astrophysics, the Kavli Institute for Particle Astrophysics and Cosmology, the
Korean Scientist Group, the Chinese Academy of Sciences (LAMOST), Los Alamos Natio-
nal Laboratory, the Max-Planck-Institute for Astronomy (MPIA), the Max-Planck-Institute
for Astrophysics (MPA), New Mexico State University, Ohio State University, University of
Pittsburgh, University of Portsmouth, Princeton University, the United States Naval Obser-
vatory, and the University of Washington.
Some/all of the data presented in this paper were obtained from the Multimission Archi-
ve at the Space Telescope Science Institute (MAST). STScI is operated by the Association
of Universities for Research in Astronomy, Inc., under NASA contract NAS5-26555. Support
for MAST for non-HST data is provided by the NASA Office of Space Science via grant
NAG5-7584 and by other grants and contracts.
We acknowledge support from the Spanish Ministerio de Educacion y Ciencia through
grant AYA2006-14056 BES-2007-14764. E. J. Alfaro acknowledges the financial support from
the Spanish MICINN under the Consolider-Ingenio 2010 Program grant CSD2006-00070:
First Science with the GTC.

– 16 –
3000 4000 5000 6000 7000 8000 9000 100000
0.1
0.2
0.3
0.4
0.5
0.6
0.7
0.8T
rans
mis
sion
3000 4000 5000 6000 7000 8000 9000 100000
0.1
0.2
0.3
0.4
0.5
0.6
0.7
0.8
λ (Angstroms)
Tra
nsm
issi
on
b
a
Fig. 1.— Response functions of the ALHAMBRA photometric system filters including at-
mospheric transmission at 1.2 airmasses at the altitude of Calar Alto Observatory. Figure
1.a also represents the spectrum of Vega superimposed on the transmission curves. The flux
of Vega has been normalized and scaled properly to make the graphic possible. Figure 1.b
shows the response curves of the SDSS standard system (USNO) and the ALHAMBRA
photometric system.

– 17 –
Table 1
Representative parameters of the ALHAMBRA photometric system filters
λiso1 Fλ Vega AB λm
2 cν−1m
3 λeff4 FWHM
Filter (nm) (erg/s/cm2/A) Magnitude (nm) (nm) (nm) σ Q (nm) δ
A366M 373.8 3.354e-09 0.96 366.4 366.0 366.1 0.0216 0.0211 27.9 186.2
A394M 398.5 6.851e-09 0.02 394.4 393.9 394.1 0.0239 0.0414 33.0 222.2
A425M 430.9 6.782e-09 -0.13 425.3 424.9 424.9 0.0229 0.0419 34.2 229.8
A457M 456.8 6.117e-09 -0.18 457.8 457.4 457.5 0.0209 0.0412 33.2 224.9
A491M 500.8 4.726e-09 -0.05 491.7 491.2 491.3 0.0208 0.0426 35.6 241.2
A522M 522.4 4.145e-09 -0.04 522.6 522.3 522.4 0.0178 0.0395 32.6 218.9
A551M 551.0 3.547e-09 0.01 551.2 550.9 551.0 0.0156 0.0385 29.7 202.1
A581M 581.1 3.031e-09 0.07 581.2 580.9 580.9 0.0161 0.0407 32.4 221.1
A613M 613.4 2.573e-09 0.13 613.6 613.4 613.4 0.0149 0.0364 32.0 216.2
A646M 650.8 2.119e-09 0.23 646.4 646.0 646.1 0.0159 0.0419 35.7 241.5
A678M 678.1 1.896e-09 0.24 678.2 678.0 678.1 0.0133 0.0355 31.4 211.9
A708M 707.9 1.661e-09 0.29 707.9 707.7 707.8 0.0135 0.0347 33.2 225.3
A739M 739.1 1.453e-09 0.34 739.3 739.1 739.2 0.0117 0.0302 30.4 203.3
A770M 770.1 1.277e-09 0.39 770.2 769.9 769.9 0.0132 0.0329 35.4 239.2
A802M 802.4 1.123e-09 0.44 802.2 801.9 802.0 0.0111 0.0263 31.2 210.5
A829M 830.2 1.012e-09 0.48 829.5 829.3 829.4 0.0103 0.0226 29.6 202.1
A861M 861.5 8.943e-10 0.54 861.6 861.3 861.4 0.0121 0.0233 36.9 246.4
A892M 884.3 8.703e-10 0.50 891.9 891.7 891.8 0.0095 0.0162 30.3 200.2
A921M 936.2 8.197e-10 0.48 920.9 920.7 920.8 0.0096 0.0143 30.8 207.8
A948M 950.4 7.502e-10 0.52 948.3 948.2 948.2 0.0093 0.0109 31.9 208.1
1. Isophotal wavelength defined in equation (3)
2. Wavelength-weighted average
3. Inverse of frequency-weighted average
4. Effective wavelength defined in equation (6)
Note. — Columns 2 to 4 represent the isophotal wavelengths, flux densities and AB magnitudes of Vega
in the ALHAMBRA photometric system.

– 18 –
Table 2. ALHAMBRA AB magnitudes of the 31 spectrophotometric primary standard
stars
Star A366M A491M A613M A770M A921M
g191b2b mod 004 11.04 11.57 11.99 12.45 12.82
bd 75d325 stis 001 8.77 9.32 9.75 10.21 10.58
feige34 stis 001 10.40 10.97 11.38 11.80 12.11
p041c stis 001 13.40 12.13 11.84 11.73 11.72
alpha lyr stis 004 0.96 -0.05 0.13 0.39 0.48
Note. — Table 2 is published in its entirety in the electronic edition of the Astronomical
Journal. A small portion of columns and rows are shown here for guidance regarding its form
and content.
Table 3. ALHAMBRA AB magnitudes of the 288 primary standard stars from the NGSL
Star A366M A491M A613M A770M A921M
BD17d4708 10.45 9.57 9.34 9.25 9.24
Feige110 11.15 11.62 12.05 12.47 12.82
G188-22 11.11 10.24 9.98 9.83 9.87
HD086986 9.13 7.94 8.02 8.14 8.16
HD204543 10.23 8.56 7.99 7.63 7.52
Note. — Table 3 is published in its entirety in the electronic edition of the Astronomical
Journal. A small portion of columns and rows are shown here for guidance regarding its form
and content.

– 19 –
Table 4
Analysis of the four instances of the ALHAMBRA system used with the LAICA camera
Filter ∆Max Median RMS
A366M 0.0689 0.0174 0.0088
A394M 0.0236 0.0064 0.0053
A425M 0.0592 0.0058 0.0073
A457M 0.0148 0.0028 0.0025
A491M 0.0133 0.0011 0.0013
A522M 0.0325 0.0022 0.0021
A551M 0.0092 0.0008 0.0009
A581M 0.0110 0.0024 0.0019
A613M 0.0052 0.0003 0.0003
A646M 0.0085 0.0012 0.0007
A678M 0.0247 0.0009 0.0007
A708M 0.0031 0.0002 0.0001
A739M 0.0228 0.0009 0.0006
A770M 0.0042 0.0003 0.0003
A802M 0.0134 0.0006 0.0006
A829M 0.0016 0.0003 0.0003
A861M 0.0133 0.0009 0.0007
A892M 0.0034 0.0002 0.0003
A921M 0.0013 0.0003 0.0001
A948M 0.0028 0.0005 0.0003
Note. — First column is the list of ALHAMBRA filters; second is the maximum absolute difference between
ALHAMBRA AB magnitudes and the magnitudes obtained from the three filter-detector replicas at each
ALHAMBRA filter; third represents the median of the former absolute differences; fourth is the median
absolute deviation of the distribution.

– 20 –
Table 5
Coefficients of the transformation equations from SDSS to ALHAMBRA photometry
Synthetic
∅ u-g g-r r-i i-z Error
A366M - i -0.0209 0.9813 0.7946 1.0889 0.038
A394M - i -0.1997 0.4183 1.9673 0.8166 -0.8552 0.097
A425M - i -0.0639 0.1475 1.4885 0.8921 0.058
A457M - i -0.0094 1.0195 1.0358 0.1799 0.037
A491M- i 0.0240 0.6274 1.2114 0.1969 0.024
A522M - i -0.0239 0.6204 1.0030 0.028
A551M - g -0.0093 -0.0108 -0.6518 0.1231 -0.0975 0.010
A581M - g -0.0029 -0.0018 -0.9166 0.2327 -0.0547 0.007
A613M - g -0.0009 0.0129 -1.0759 0.1896 0.009
A646M - g -0.0023 0.0159 -1.0349 -0.2544 0.011
A678M - g 0.0131 0.0077 -1.2133 -0.1184 0.1035 0.022
A708M - g -0.0155 0.0218 -1.1169 -0.4915 0.014
A739M - g -0.0096 -0.0104 -0.9076 -1.1087 0.0677 0.006
A770M - g 0.0165 -0.0068 -1.0636 -0.9769 0.007
A802M - g -0.0005 0.0139 -1.0063 -1.2263 -0.1022 0.006
A829M - g 0.0036 0.0199 -1.0274 -1.2496 -0.2488 0.006
A861M - g 0.0159 0.0211 -1.0723 -1.0679 -0.6102 0.011
A892M - g 0.0171 -0.0192 -1.0259 -1.0268 -0.8638 0.015
A921M - g 0.0055 -0.0163 -0.9414 -1.0725 -1.1318 0.019
A948M - g 0.0221 -0.9802 -0.9667 -1.4006 0.021
Note. — Last column represents the residual standard error of each fit.

– 21 –
Table 6
Coefficients of the transformation equations from ALHAMBRA to SDSS photometry
Synthetic
u - A522M g - A613M r - A522M i - A522M z - A613M
∅ -0.0247 0.0197 -0.0006 -0.0002 -0.0116
A366M - A394M 1.0741
A394M - A425M 1.2574 0.0467 -0.0142 -0.0337
A425M - A457M 0.9768 0.2250 0.0177
A457M - A491M 1.4529 0.2282 -0.0535 -0.0336
A491M - A522M 0.8850 0.4580
A522M - A551M 0.6206 -1.0334 -1.0117
A551M - A581M 1.4129 -0.8928 -0.9767
A581M - A613M 1.3538 -0.5793 -0.9498
A613M - A646M -0.3299 -0.9424 -0.9459
A646M - A678M -0.2832 -0.1895 -0.9525 -0.9399
A678M - A708M 1.9317 -1.0060 -1.0696
A708M - A739M -1.6333 -0.4194 -0.2017 -0.8624 -1.0935
A739M - A770M -1.7633 -0.1224 -0.5364 -0.7336
A770M - A802M 0.6199 -0.2679 -1.0201
A802M - A829M 2.5577 1.2026 0.3267 -0.5209
A829M - A861M -0.2826 -1.0507
A861M - A892M -0.5793
A892M - A921M -1.2739 -0.2896 -0.0429
A921M - A948M -0.7648
Error 0.0253 0.0121 0.0035 0.0024 0.0102
Note. — For each SDSS filter minus one of the ALHAMBRA filters, the column below shows the coefficients
of each one of the 19 ALHAMBRA colors, plus the independent term. Last row gives the residual standard
error of each fit.

– 22 –
Table 7. Multi-instrument colors of the E/S0 galaxy template from Benitez et al. (2004)
in the ALHAMBRA system (AB mag) and SDSS r (AB mag)
z A366M-r A491M-r A613M-r A770M-r A921M-r
0.00 2.26 0.55 -0.01 -0.41 -0.66
0.25 3.00 1.32 -0.01 -0.58 -0.94
1.00 3.47 2.26 0.12 -0.88 -2.38
1.50 1.69 1.06 0.21 -1.98 -3.01
2.25 1.17 0.47 0.09 -0.83 -2.48
Note. — Table 7 is published in its entirety in the electronic edition of the Astronomical
Journal. A small portion of columns and rows are shown here for guidance regarding its form
and content.
Table 8. Multi-instrument colors of the Sbc galaxy template from Benitez et al. (2004) in
the ALHAMBRA system (AB mag) and SDSS r (AB mag)
z A366M-r A491M-r A613M-r A770M-r A921M-r
0.00 1.64 0.45 0.01 -0.33 -0.55
0.25 2.28 0.76 0.00 -0.44 -0.73
1.00 1.03 0.56 0.07 -1.17 -1.94
1.50 1.22 0.34 0.01 -0.49 -1.46
2.25 1.92 0.69 -0.01 -0.34 -0.67
Note. — Table 8 is published in its entirety in the electronic edition of the Astronomical
Journal. A small portion of columns and rows are shown here for guidance regarding its form
and content.

– 23 –
Table 9. Multi-instrument colors of the Im galaxy template from Benitez et al. (2004) in
the ALHAMBRA system (AB mag) and SDSS r (AB mag)
z A366M-r A491M-r A613M-r A770M-r A921M-r
0.00 0.75 -0.00 -0.00 -0.19 -0.30
0.25 1.20 0.43 -0.17 -0.13 -0.28
1.00 0.27 0.15 0.02 -0.63 -1.00
1.50 0.42 0.07 0.00 -0.13 -0.76
2.25 0.95 0.27 -0.01 -0.09 -0.16
Note. — Table 9 is published in its entirety in the electronic edition of the Astronomical
Journal. A small portion of columns and rows are shown here for guidance regarding its form
and content.
Table 10. Multi-instrument colors of the SB2 galaxy template from Benitez et al. (2004)
in the ALHAMBRA system (AB mag) and SDSS r (AB mag)
z A366M-r A491M-r A613M-r A770M-r A921M-r
0.00 0.54 -0.34 0.24 -0.02 -0.25
0.25 1.00 0.44 -0.51 0.21 0.01
1.00 0.13 0.08 0.08 -0.45 -0.62
1.50 0.06 0.12 -0.06 -0.02 -0.71
2.25 0.56 0.01 -0.00 -0.03 -0.06
Note. — Table 10 is published in its entirety in the electronic edition of the Astronomical
Journal. A small portion of columns and rows are shown here for guidance regarding its form
and content.

– 24 –
Table 11. Multi-instrument colors of the SB3 galaxy template from Benitez et al. (2004)
in the ALHAMBRA system (AB mag) and SDSS r (AB mag)
z A366M-r A491M-r A613M-r A770M-r A921M-r
0.00 1.15 0.32 0.09 -0.11 -0.45
0.25 1.05 0.49 -0.04 -0.27 -0.40
1.00 0.36 0.21 -0.02 -0.42 -0.96
1.50 0.31 0.20 -0.02 -0.24 -0.50
2.25 0.74 0.22 -0.00 -0.11 -0.26
Note. — Table 11 is published in its entirety in the electronic edition of the Astronomical
Journal. A small portion of columns and rows are shown here for guidance regarding its form
and content.
Table 12. Multi-instrument colors of the Scd galaxy template from Benitez et al. (2004)
in the ALHAMBRA system (AB mag) and SDSS r (AB mag)
z A366M-r A491M-r A613M-r A770M-r A921M-r
0.00 1.31 0.30 0.00 -0.22 -0.27
0.25 1.60 0.62 -0.05 -0.34 -0.53
1.00 0.61 0.40 0.01 -0.73 -1.35
1.50 0.74 0.13 0.01 -0.39 -0.94
2.25 1.41 0.48 -0.01 -0.15 -0.38
Note. — Table 12 is published in its entirety in the electronic edition of the Astronomical
Journal. A small portion of columns and rows are shown here for guidance regarding its form
and content.

– 25 –

– 26 –
0 0.5 1 1.5 2 2.5−0.5
0
0.5
1
1.5
2
z
k (A
491M
− A
613M
)
E/S0
Sbc
Im
Fig. 2.— k-correction for different values of redshift (z) for ALHAMBRA color A491M-A613M and three
galaxy templates.

– 27 –
0 0.5 1 1.5 2 2.5−0.5
0
0.5
1
1.5
2
z
k (A
770M
− A
921M
)
E/S0
Sbc
Im
Fig. 3.— k-correction for different values of redshift (z) for ALHAMBRA color A770M-A921M and three
galaxy templates.

– 28 –
0
0.5
1
1.5
2
0
0.5
1
1.5
u−g g−r r−i i−z−0.5
0
0.5
1
1.5
E galaxy (Shimasaku et al. 2001)S0 galaxy (Shimasaku et al. 2001)E galaxy (Fukugita et al. 1995)S0 galaxy (Fukugita et al. 1995)E/S0 galaxy
Sb galaxy (Shimasaku et al. 2001)Sc galaxy (Shimasaku et al. 2001)Sbc galaxy (Fukugita et al. 1995)Sbc galaxy
Im galaxy (Shimasaku et al. 2001)Im galaxy (Fukugita et al. 1995)Im galaxy
Fig. 4.— SDSS colors for three galaxies of different spectromorphological types. Black symbols are colors
obtained from Shimasaku et al. (2001) with a rms error bar, blue ones are obtained from Fukugita et al.
(1995), and red points are the colors obtained by applying the transformation equations of section 4.1 to the
ALHAMBRA photometry of these three galaxy templates (Benıtez et al. 2004).

– 29 –
−1 −0.5 0 0.5 1 1.5 2 2.5
−0.5
0
0.5
1
1.5
2
2.5
3
3.5
A457M − A613M
A36
6M −
A45
7M
−0.5 0 0.5 1 1.5 2
−0.5
0
0.5
1
1.5
2
2.5
A770M − A921M
A61
3M−
A77
0M
NGSL data
E/S0, z=0
E/S0, z=0.5
E/S0, z=1
E/S0, z=1.5
E/S0, z=2
Sbc, z=0
Sbc, z=0.5
Sbc, z=1
Sbc, z=1.5
Sbc, z=2
Im, z=0
Im, z=0.5
Im, z=1
Im, z=1.5
Im, z=2
Fig. 5.— ALHAMBRA color-color diagrams. Black points are the set of primary standard stars from the
NGSL. Circles represent E/S0 galaxy templates, crosses are Sbc galaxy templates and squares represent Im
galaxy templates, all of them from Benıtez et al. (2004). Different colors show different values of z.

– 30 –
−1 −0.5 0 0.5 1 1.5 2
−0.5
0
0.5
1
1.5
2
2.5
3
3.5
A457M − A613M
A36
6M −
A45
7M
Field 8 pointing 1
Fig. 6.— ALHAMBRA color-color diagram. Black points represent the 288 stars from the Next Generation
Spectral Library, and red crosses represent the field stars in field 8 pointing 1 of the ALHAMBRA survey.

– 31 –
3000 4000 5000 6000 7000 8000 9000 1000010000
17
18
19
20
21
22
23
24
25
λ (Angstroms)
Mag
nitu
de
ALHAMBRA photometry of the field star
SDSS photometry of the field star
HD160346
Fig. 7.— Spectrum in AB magnitudes of the star HD160346, belonging to the set of NGSL standard stars.
The spectrum is scaled so that this object is the best fit for the zero point determination to the star at RA
= 356.3323 and DEC = 15.5486. Red circles are the instrumental magnitudes of the field star plus the zero
points determined with our final strategy, and green squares are its SDSS photometry.
– 32 –
Table 13
Photometric zero points for ALHAMBRA field 8 pointing 1
Filter Zero point Error
A366M 7.4229 0.0011
A394M 8.3063 0.0008
A425M 8.4857 0.0007
A457M 8.6686 0.0009
A491M 8.7333 0.0004
A522M 8.5281 0.0005
A551M 8.5879 0.0004
A581M 8.6698 0.0006
A613M 8.4729 0.0004
A646M 8.5864 0.0004
A678M 8.5385 0.0005
A708M 8.3790 0.0004
A739M 8.8394 0.0004
A770M 7.9635 0.0003
A802M 8.4134 0.0004
A829M 8.4139 0.0005
A861M 8.1149 0.0004
A892M 7.2116 0.0004
A921M 6.5880 0.0006
A948M 5.9750 0.0006

– 33 –
12 14 16 18 20 22 24 267.2
7.4
7.6
7.8
8
8.2
8.4
8.6
8.8
9
9.2
u
Mag
nitu
de d
iffer
ence
A39
4M
Fig. 8.— Magnitude differences in filter A394M versus SDSS magnitude u, for the field stars in the AL-
HAMBRA field 8 pointing 1. They show the difference between the instrumental magnitude of the stars
and the magnitude obtained from the ALHAMBRA-SDSS transformation equations. The horizontal line
represents the zero-point solution determined with our chosen methodology.

– 34 –
REFERENCES
Baggett, S., Casertano, S., Gonzaga, S., & Ritchie, C. 1997, Instrument Science Report
(WFCP2 97-10; Baltimore: STScI)
Benıtez, N. 2000, ApJ, 536, 571
Benıtez, N., et al. 2004, ApJS, 150, 1
Benıtez, N., et al. 2009, ApJ, 692, L5
Bertin, E., & Arnouts, S. 1996, A&AS, 117, 393
Bohlin, R. C., Harris, A. W., Holm, A. V., & Gry, C. 1990, ApJS, 73, 413
Bohlin, R. C. 2007, The Future of Photometric, Spectrophotometric and Polarimetric Stan-
dardization, 364, 315
Chonis, T. S., & Gaskell, C. M. 2008, AJ, 135, 264
Fukugita, M., Shimasaku, K., & Ichikawa, T. 1995, PASP, 107, 945
Fukugita, M., Ichikawa, T., Gunn, J. E., Doi, M., Shimasaku, K., & Schneider, D. P. 1996,
AJ, 111, 1748
Golay, M. 1974, Astrophysics and Space Science Library, 41,
Gregg, M. D., et al. 2004, Bulletin of the American Astronomical Society, 36, 1496
Gunn, J. E., et al. 1998, AJ, 116, 3040
Kennicutt, R. C., Jr. 1992, ApJS, 79, 255
Kurucz, R. L. 2003, Modelling of Stellar Atmospheres, 210, 45
Kurucz, R. L. 2005, Memorie della Societa Astronomica Italiana Supplement, 8, 14
Maız-Apellaniz, J. 2005, PASP, 117, 615
Maız Apellaniz, J. 2006, AJ, 131, 1184
Massey, P., & Gronwall, C. 1990, ApJ, 358, 344
Moles, M., et al. 2008, AJ, 136, 1325
Oke, J. B. 1990, AJ, 99, 1621

– 35 –
Oke, J. B., & Gunn, J. E. 1983, ApJ, 266, 713
Sanchez, S. F., Aceituno, J., Thiele, U., Perez-Ramırez, D., & Alves, J. 2007, PASP, 119,
1186
Schneider, D. P., Gunn, J. E., & Hoessel, J. G. 1983, ApJ, 264, 337
Shimasaku, K., et al. 2001, AJ, 122, 1238
Smith, J. A., et al. 2002, AJ, 123, 2121
Stone, R. P. S. 1996, ApJS, 107, 423
Tucker, D. L., Smith, J. A., & Brinkmann, J. 2001, The New Era of Wide Field Astronomy,
232, 13
Tokunaga, A. T., & Vacca, W. D. 2005, PASP, 117, 1459
This preprint was prepared with the AAS LATEX macros v5.2.