A Fast Method for Localization of Local Illumination Variations and Photometric Normalization in...
10
J.F. Martínez-Trinidad et al. (Eds.): CIARP 2006, LNCS 4225, pp. 48 – 57, 2006. © Springer-Verlag Berlin Heidelberg 2006 A Fast Method for Localization of Local Illumination Variations and Photometric Normalization in Face Images Estela María Álvarez Morales 1 , Francisco Silva Mata 1 , Eduardo Garea Llano 1 , Heydi Mendez Vazquez 1 , and Moisés Herrera 2 1 Advanced Technology Application Center. 7ma, No. 21812, Siboney, Playa, Cuba, 12200 {egarea, hmendez}@cenatav.co.cu 2 Empresa de Automatización Integral (CEDAI), Villa Clara, Cuba [email protected] Abstract. In this paper we present a method for the automatic localization of local light variations and its photometric normalization in face images affected by different angles of illumination causing the appearance of specular light. The proposed approach is faster and more efficient that if the same one was carried out on the whole image through the traditional photometric normalization methods (homomorphic filtering, anisotropic smoothing, etc.). The process con- sists in using of the Adaboosting algorithms for the fast detection of regions af- fected by specular reflection combined with a normalization method based on the local normalization that standardizes the local mean and variance into the located region. A set of measures are proposed to evaluate the effectiveness of detectors. Finally, results are compared through two experimental schemes to measure how the similarity is affected by illumination changes and how the proposed approach improves the effect caused by these changes. 1 Introduction Face recognition algorithms consist in three major parts: Face detection, normaliza- tion and face identification [1]. Face recognition starts with the detection of face pat- terns in sometimes cluttered scenes, continues normalizing the face images to attenu- ate or eliminate geometrical and illumination problems, then these faces are identified using appropriated classification algorithms, and finally results are post-processed us- ing model-based schemes and logistic feedback [2]. One illumination effect that might cause particular problems in the recognition process is the local reflection of light in the face. Recently many appearance-based algorithms have been proposed to deal with the problem [3-6]. These algorithms work well, but are computationally expensive. To find a method to efficiently and quickly solve these mentionated problems that obtains face images without the specular illumination effect and maintaining the fea- tures necessary for identification is a challenge. In this paper we present a new approach to perform a fast detection of regions af- fected by the specular illumination effect by means of a boosted cascade detector
-
Upload
independent -
Category
Documents
-
view
1 -
download
0
Transcript of A Fast Method for Localization of Local Illumination Variations and Photometric Normalization in...
J.F. Martínez-Trinidad et al. (Eds.): CIARP 2006, LNCS 4225, pp. 48 – 57, 2006. © Springer-Verlag Berlin Heidelberg 2006
A Fast Method for Localization of Local Illumination Variations and Photometric Normalization in Face
Images
Estela María Álvarez Morales1, Francisco Silva Mata1, Eduardo Garea Llano1, Heydi Mendez Vazquez1, and Moisés Herrera2
1 Advanced Technology Application Center. 7ma, No. 21812, Siboney, Playa, Cuba, 12200 {egarea, hmendez}@cenatav.co.cu
2 Empresa de Automatización Integral (CEDAI), Villa Clara, Cuba [email protected]
Abstract. In this paper we present a method for the automatic localization of local light variations and its photometric normalization in face images affected by different angles of illumination causing the appearance of specular light. The proposed approach is faster and more efficient that if the same one was carried out on the whole image through the traditional photometric normalization methods (homomorphic filtering, anisotropic smoothing, etc.). The process con-sists in using of the Adaboosting algorithms for the fast detection of regions af-fected by specular reflection combined with a normalization method based on the local normalization that standardizes the local mean and variance into the located region. A set of measures are proposed to evaluate the effectiveness of detectors. Finally, results are compared through two experimental schemes to measure how the similarity is affected by illumination changes and how the proposed approach improves the effect caused by these changes.
1 Introduction
Face recognition algorithms consist in three major parts: Face detection, normaliza-tion and face identification [1]. Face recognition starts with the detection of face pat-terns in sometimes cluttered scenes, continues normalizing the face images to attenu-ate or eliminate geometrical and illumination problems, then these faces are identified using appropriated classification algorithms, and finally results are post-processed us-ing model-based schemes and logistic feedback [2].
One illumination effect that might cause particular problems in the recognition process is the local reflection of light in the face. Recently many appearance-based algorithms have been proposed to deal with the problem [3-6]. These algorithms work well, but are computationally expensive.
To find a method to efficiently and quickly solve these mentionated problems that obtains face images without the specular illumination effect and maintaining the fea-tures necessary for identification is a challenge.
In this paper we present a new approach to perform a fast detection of regions af-fected by the specular illumination effect by means of a boosted cascade detector
A Fast Method for Localization of Local Illumination Variations 49
which is based on works of P.Viola and M. Jones [7] and an algorithm proposed by us to attenuate the local specular light through the filtering of the detected regions by mean value of pixels in the four corners of the localized square.
The first contribution of this paper is the fact that we use the Viola and Jones method for region detection instead of object detection. And if in addition we con-sider that already the integral image has been calculated and that the detection turns into a region previously located by the face detector, the detection process will be ex-tremely fast.
The second contribution of this paper is the fact that this process of photometric normalization is done only in the automatic detected regions and not on the whole im-age and only in those images where the illumination problem is present; this clearly reports an important saving of time and calculation
The third contribution of this paper is the proposed method for the local normaliza-tion that standardizes the local mean and variance of an image region by means of a very fast processing implemented through a lookup table.
The effectiveness of the proposed method was evaluated in several experiments using images from the Yale B database, taken a variety of illumination conditions. Detectors were evaluated using five proposed measures, and obtained results demon-strate that the variations in the image similarity caused by illumination are success-fully eliminated or attenuated.
2 Fast Detection of Faces and Their Corresponding Regions Affected by Illumination
Face detection and their corresponding regions affected by illumination is achieved trough the Viola and John’s algorithm [7], and are implemented at the OpenCV li-brary [8]. There are several advantages offer by this method: The image representa-tion called integral image, allows a very quickly computation of the features used by the detectors. The learning algorithm based on Adaboost, allows to select a small number of features from the initial set, and to obtain a cascade of simple classifiers to discriminate them [7].
Two cascade detectors were used, the first one was devoted to detect the faces, and the other one devoted to detect the regions affected by specular ligth.
2.1 Training Process
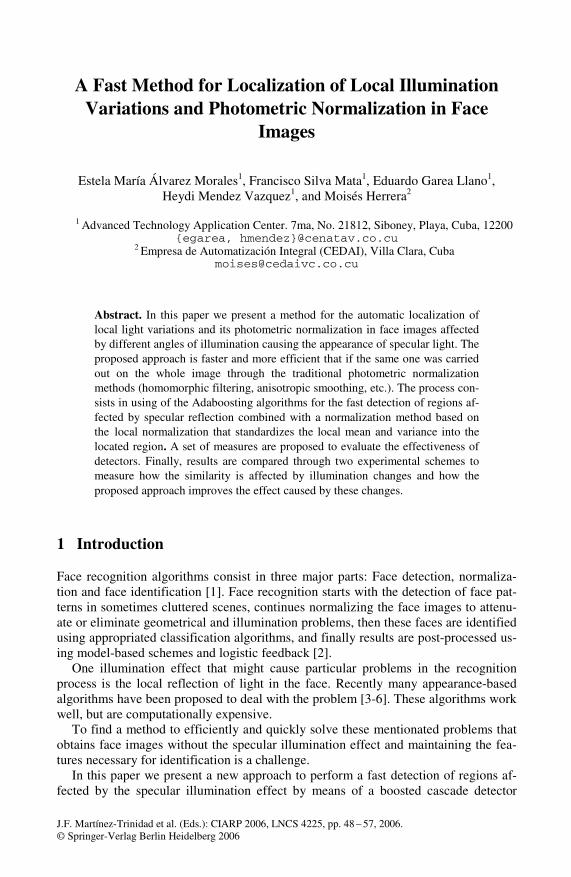
The face training is composed by automatic labeled faces detected by the Stump-based 24x24 Gentle Adaboost frontal face detector, applied on the Yale B Face Data-base. A region training set was manually prepared by means of selection of the square regions, assigning a positive label (+1) to the samples with local affectations of illu-mination, and negative labels (-1) to the samples without great affectations of illumi-nation. Then these samples are saved and rescaled to a size of 24 x 24 pixels (Fig. 1). In training phase, the classifier was exhaustively trained using these sets of regions taken from the previously detected faces by the first cascade detector in a wide variety of training images.
50 E.M. Álvarez Morales et al.
Fig. 1. Region selection for training samples, positive (left) and negatives (right)
2.2 Description of the Detection Process
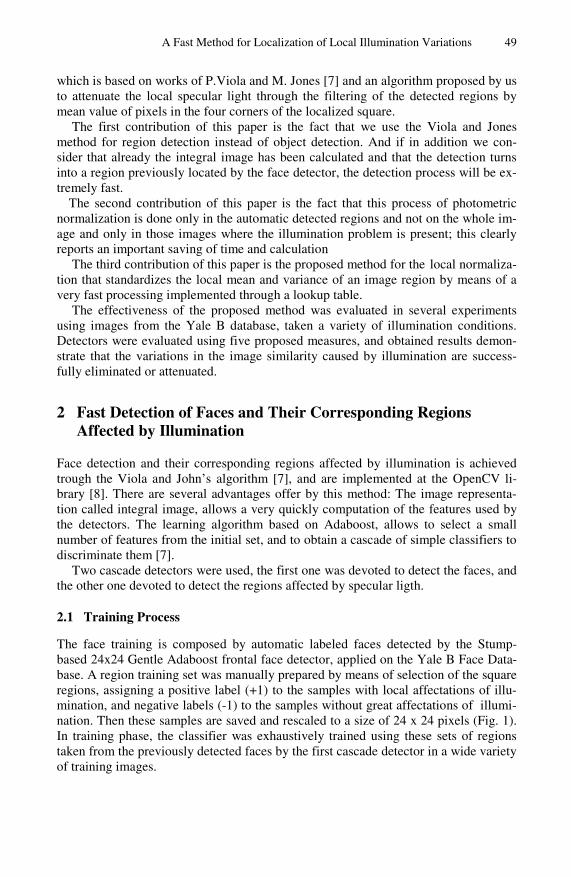
Detection process begins with the face detection by means of a cascade specialized detector (1). As result, the coordinates of the square which contains the face are ob-tained. A second cascade detector is triggered to look for the regions affected by specular light but only in the region contained within squares that were detected be-fore (2). The third step is the normalization process, which is made only in the zone detected by the second detector (3). If the face images are going to be used in face recognition the process will continue with the recognition algorithm. If the final ob-jective is to improve the images quality of the processed squares then the normalized regions will be restored to their original position (4). Fig 2 shows the general scheme of the proposed method.
Fig. 2. Basic steps in fast normalization sequence
3 A Fast Local Photometric Normalization Method
The following proposed method is based on the local normalization algorithm that standardizes the local mean and variance of an image [9], [10]. In our approach we make a filtering by the mean value of the pixels of local regions located at the four corners of the automatically localized square window which contains the image parts affected by low frequency illumination effect (specular light) calculated by the expression:
0),(),(),(
.
jijifji I
pXII −= (1)
Where, I(i,j)0, is the original value of a pixel located at the position i,j of the square window containing the part of image affected by illumination.
A Fast Method for Localization of Local Illumination Variations 51
I(i,j)f is the normalized value of a pixel affected by illumination at the position i,j of the rectangular window.
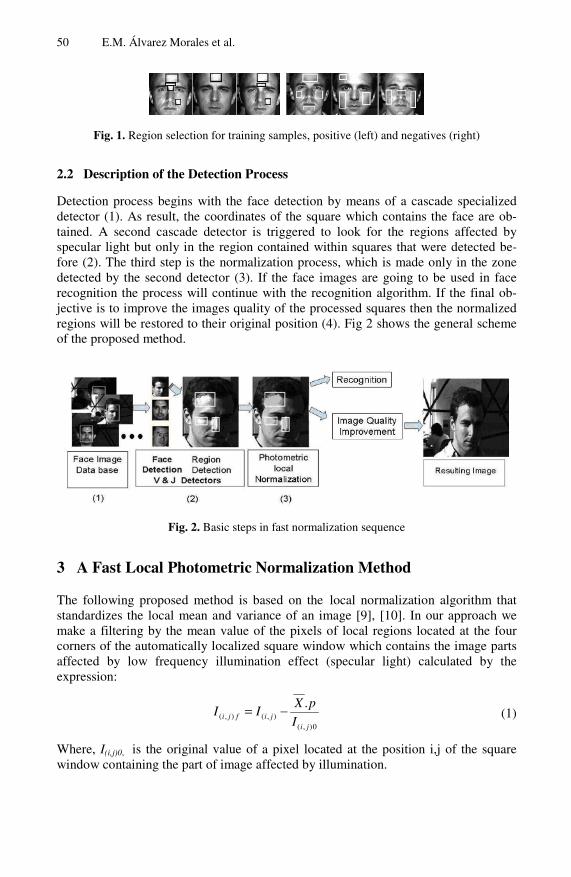
X . is the mean value of vector formed by four maximum pixel values contained in the windows located at the four corners of the automatic located square that contains the part of the image affected by low frequency illumination effect (specular light). See Fig 3.
p. is the coefficient that depends of the Euclidean distance between the mean value and each value of the image inside the located square window, the values of p are in-creased on a fixed quantity together with the distance interval, Table 1 shows the dis-tance intervals and their corresponding coefficients used by us.
4
)]4max()3max()2max()1[max( CCCCX
+++= (2)
Fig. 3. Distribution of four pixel windows situated in the corners of the automatic localized square window that contains the part of the image affected by low frequency illumination effect (specular light)
Table 1. Distance intervals and its corresponding coefficients p
No. of interval Distance Interval Coefficient p 1 1.2 - 1.5 10 2 1.5 - 1.8 40 … … … 20 6.9 - 7.2 760
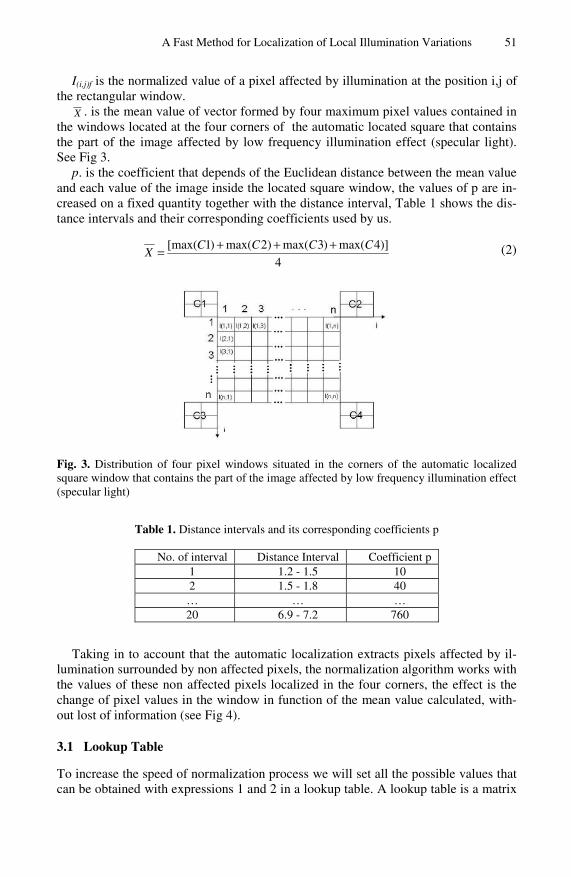
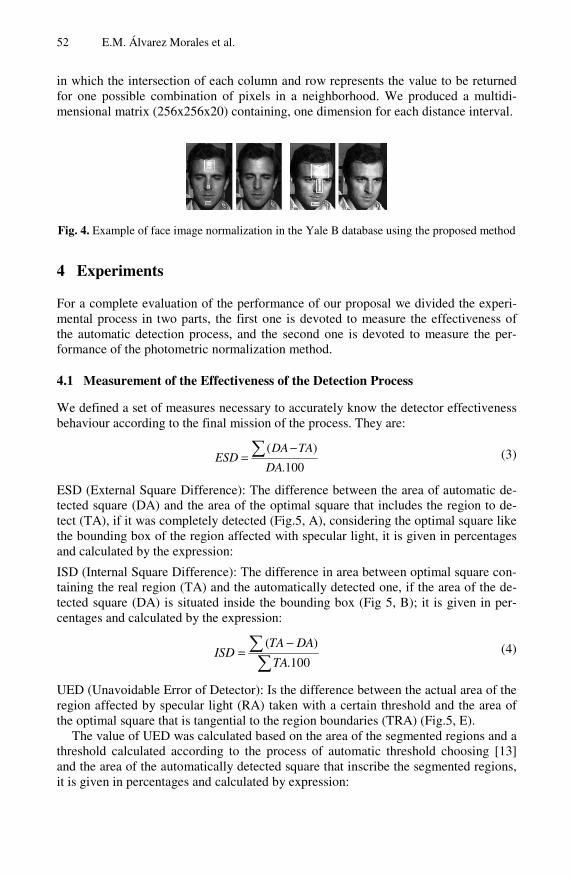
Taking in to account that the automatic localization extracts pixels affected by il-lumination surrounded by non affected pixels, the normalization algorithm works with the values of these non affected pixels localized in the four corners, the effect is the change of pixel values in the window in function of the mean value calculated, with-out lost of information (see Fig 4).
3.1 Lookup Table
To increase the speed of normalization process we will set all the possible values that can be obtained with expressions 1 and 2 in a lookup table. A lookup table is a matrix
52 E.M. Álvarez Morales et al.
in which the intersection of each column and row represents the value to be returned for one possible combination of pixels in a neighborhood. We produced a multidi-mensional matrix (256x256x20) containing, one dimension for each distance interval.
Fig. 4. Example of face image normalization in the Yale B database using the proposed method
4 Experiments
For a complete evaluation of the performance of our proposal we divided the experi-mental process in two parts, the first one is devoted to measure the effectiveness of the automatic detection process, and the second one is devoted to measure the per-formance of the photometric normalization method.
4.1 Measurement of the Effectiveness of the Detection Process
We defined a set of measures necessary to accurately know the detector effectiveness behaviour according to the final mission of the process. They are:
100.
)(
DA
TADAESD ∑ −
= (3)
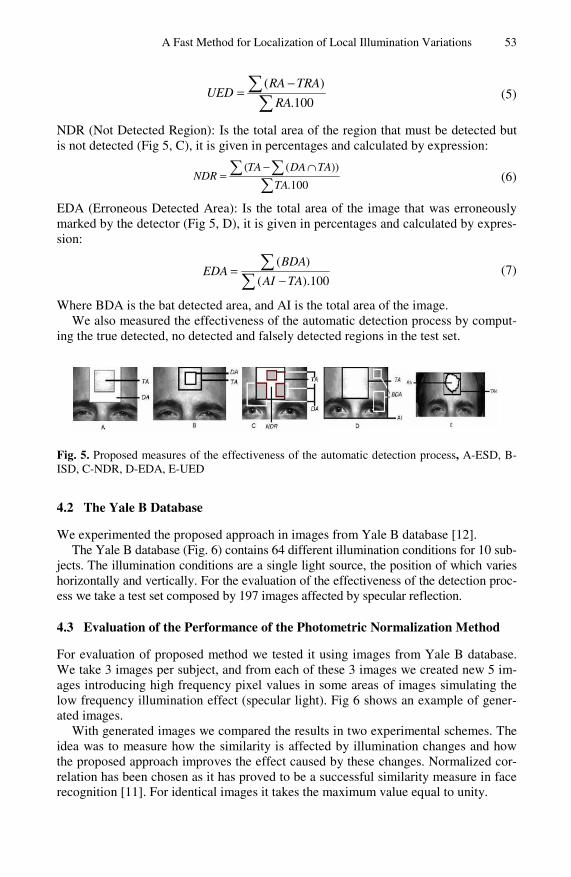
ESD (External Square Difference): The difference between the area of automatic de-tected square (DA) and the area of the optimal square that includes the region to de-tect (TA), if it was completely detected (Fig.5, A), considering the optimal square like the bounding box of the region affected with specular light, it is given in percentages and calculated by the expression:
ISD (Internal Square Difference): The difference in area between optimal square con-taining the real region (TA) and the automatically detected one, if the area of the de-tected square (DA) is situated inside the bounding box (Fig 5, B); it is given in per-centages and calculated by the expression:
∑∑ −
=100.
)(
TA
DATAISD (4)
UED (Unavoidable Error of Detector): Is the difference between the actual area of the region affected by specular light (RA) taken with a certain threshold and the area of the optimal square that is tangential to the region boundaries (TRA) (Fig.5, E).
The value of UED was calculated based on the area of the segmented regions and a threshold calculated according to the process of automatic threshold choosing [13] and the area of the automatically detected square that inscribe the segmented regions, it is given in percentages and calculated by expression:
A Fast Method for Localization of Local Illumination Variations 53
∑∑ −
=100.
)(
RA
TRARAUED (5)
NDR (Not Detected Region): Is the total area of the region that must be detected but is not detected (Fig 5, C), it is given in percentages and calculated by expression:
∑∑ ∑ ∩−
=100.
))((
TA
TADATANDR (6)
EDA (Erroneous Detected Area): Is the total area of the image that was erroneously marked by the detector (Fig 5, D), it is given in percentages and calculated by expres-sion:
∑∑
−=
100).(
)(
TAAI
BDAEDA (7)
Where BDA is the bat detected area, and AI is the total area of the image. We also measured the effectiveness of the automatic detection process by comput-
ing the true detected, no detected and falsely detected regions in the test set.
Fig. 5. Proposed measures of the effectiveness of the automatic detection process, A-ESD, B-ISD, C-NDR, D-EDA, E-UED
4.2 The Yale B Database
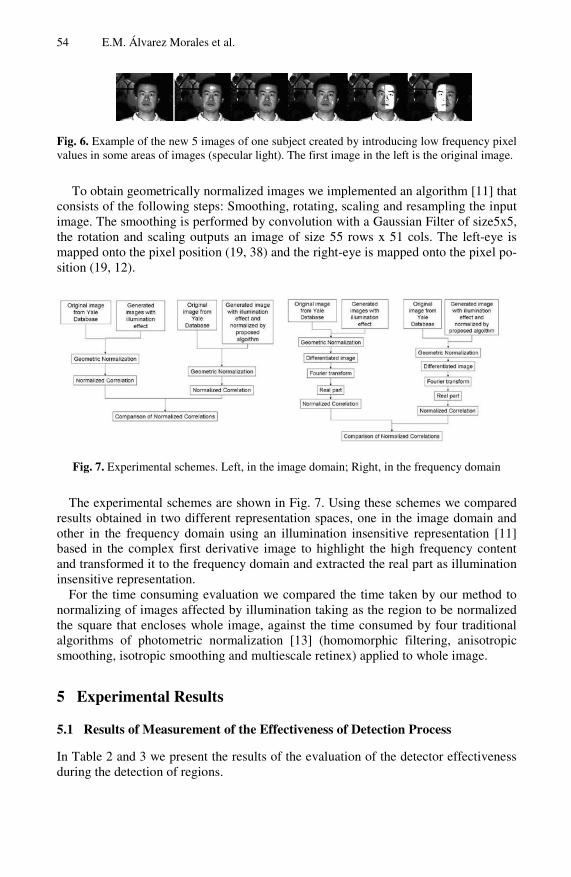
We experimented the proposed approach in images from Yale B database [12]. The Yale B database (Fig. 6) contains 64 different illumination conditions for 10 sub-
jects. The illumination conditions are a single light source, the position of which varies horizontally and vertically. For the evaluation of the effectiveness of the detection proc-ess we take a test set composed by 197 images affected by specular reflection.
4.3 Evaluation of the Performance of the Photometric Normalization Method
For evaluation of proposed method we tested it using images from Yale B database. We take 3 images per subject, and from each of these 3 images we created new 5 im-ages introducing high frequency pixel values in some areas of images simulating the low frequency illumination effect (specular light). Fig 6 shows an example of gener-ated images.
With generated images we compared the results in two experimental schemes. The idea was to measure how the similarity is affected by illumination changes and how the proposed approach improves the effect caused by these changes. Normalized cor-relation has been chosen as it has proved to be a successful similarity measure in face recognition [11]. For identical images it takes the maximum value equal to unity.
54 E.M. Álvarez Morales et al.
Fig. 6. Example of the new 5 images of one subject created by introducing low frequency pixel values in some areas of images (specular light). The first image in the left is the original image.
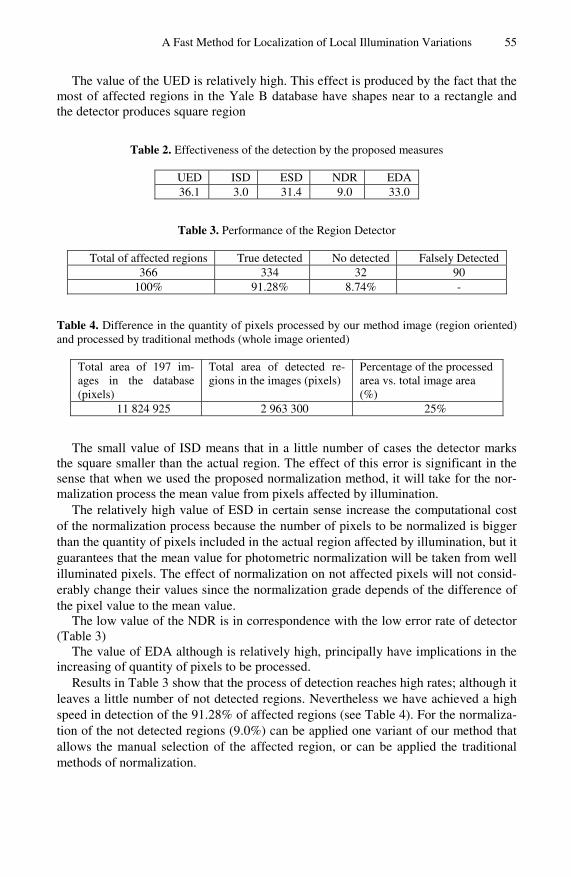
To obtain geometrically normalized images we implemented an algorithm [11] that consists of the following steps: Smoothing, rotating, scaling and resampling the input image. The smoothing is performed by convolution with a Gaussian Filter of size5x5, the rotation and scaling outputs an image of size 55 rows x 51 cols. The left-eye is mapped onto the pixel position (19, 38) and the right-eye is mapped onto the pixel po-sition (19, 12).
Fig. 7. Experimental schemes. Left, in the image domain; Right, in the frequency domain
The experimental schemes are shown in Fig. 7. Using these schemes we compared results obtained in two different representation spaces, one in the image domain and other in the frequency domain using an illumination insensitive representation [11] based in the complex first derivative image to highlight the high frequency content and transformed it to the frequency domain and extracted the real part as illumination insensitive representation.
For the time consuming evaluation we compared the time taken by our method to normalizing of images affected by illumination taking as the region to be normalized the square that encloses whole image, against the time consumed by four traditional algorithms of photometric normalization [13] (homomorphic filtering, anisotropic smoothing, isotropic smoothing and multiescale retinex) applied to whole image.
5 Experimental Results
5.1 Results of Measurement of the Effectiveness of Detection Process
In Table 2 and 3 we present the results of the evaluation of the detector effectiveness during the detection of regions.
A Fast Method for Localization of Local Illumination Variations 55
The value of the UED is relatively high. This effect is produced by the fact that the most of affected regions in the Yale B database have shapes near to a rectangle and the detector produces square region
Table 2. Effectiveness of the detection by the proposed measures
UED ISD ESD NDR EDA 36.1 3.0 31.4 9.0 33.0
Table 3. Performance of the Region Detector
Total of affected regions True detected No detected Falsely Detected 366 334 32 90
100% 91.28% 8.74% -
Table 4. Difference in the quantity of pixels processed by our method image (region oriented) and processed by traditional methods (whole image oriented)
Total area of 197 im-ages in the database (pixels)
Total area of detected re-gions in the images (pixels)
Percentage of the processed area vs. total image area (%)
11 824 925 2 963 300 25%
The small value of ISD means that in a little number of cases the detector marks the square smaller than the actual region. The effect of this error is significant in the sense that when we used the proposed normalization method, it will take for the nor-malization process the mean value from pixels affected by illumination.
The relatively high value of ESD in certain sense increase the computational cost of the normalization process because the number of pixels to be normalized is bigger than the quantity of pixels included in the actual region affected by illumination, but it guarantees that the mean value for photometric normalization will be taken from well illuminated pixels. The effect of normalization on not affected pixels will not consid-erably change their values since the normalization grade depends of the difference of the pixel value to the mean value.
The low value of the NDR is in correspondence with the low error rate of detector (Table 3)
The value of EDA although is relatively high, principally have implications in the increasing of quantity of pixels to be processed.
Results in Table 3 show that the process of detection reaches high rates; although it leaves a little number of not detected regions. Nevertheless we have achieved a high speed in detection of the 91.28% of affected regions (see Table 4). For the normaliza-tion of the not detected regions (9.0%) can be applied one variant of our method that allows the manual selection of the affected region, or can be applied the traditional methods of normalization.
56 E.M. Álvarez Morales et al.
5.2 Results in the Evaluation of the Performance of the Photometric Normalization Method
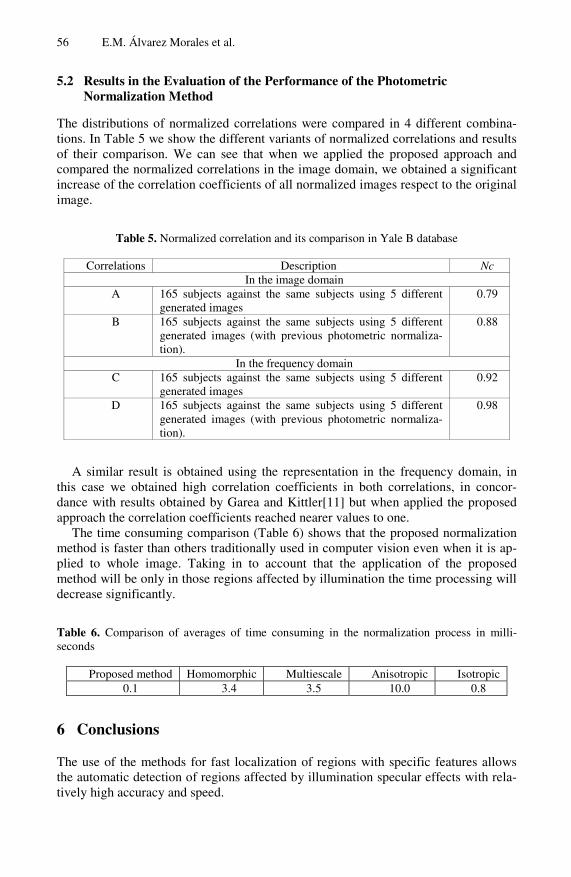
The distributions of normalized correlations were compared in 4 different combina-tions. In Table 5 we show the different variants of normalized correlations and results of their comparison. We can see that when we applied the proposed approach and compared the normalized correlations in the image domain, we obtained a significant increase of the correlation coefficients of all normalized images respect to the original image.
Table 5. Normalized correlation and its comparison in Yale B database
Correlations Description Nc In the image domain
A 165 subjects against the same subjects using 5 different generated images
0.79
B 165 subjects against the same subjects using 5 different generated images (with previous photometric normaliza-tion).
0.88
In the frequency domain C 165 subjects against the same subjects using 5 different
generated images 0.92
D 165 subjects against the same subjects using 5 different generated images (with previous photometric normaliza-tion).
0.98
A similar result is obtained using the representation in the frequency domain, in this case we obtained high correlation coefficients in both correlations, in concor-dance with results obtained by Garea and Kittler[11] but when applied the proposed approach the correlation coefficients reached nearer values to one.
The time consuming comparison (Table 6) shows that the proposed normalization method is faster than others traditionally used in computer vision even when it is ap-plied to whole image. Taking in to account that the application of the proposed method will be only in those regions affected by illumination the time processing will decrease significantly.
Table 6. Comparison of averages of time consuming in the normalization process in milli-seconds
Proposed method Homomorphic Multiescale Anisotropic Isotropic 0.1 3.4 3.5 10.0 0.8
6 Conclusions
The use of the methods for fast localization of regions with specific features allows the automatic detection of regions affected by illumination specular effects with rela-tively high accuracy and speed.
A Fast Method for Localization of Local Illumination Variations 57
The proposed method for photometric normalization offers a set of advantages, the process is carried out only on images affected by illumination and more specifically in those affected regions, and as a result we obtain a good save of time with a low com-putational cost. The use of a Lookup Table is another factor that influences in the high speed of the proposed method. The total save of computational cost might be measure not only in the quantity of pixels that it avoids to process and also in the fact of hav-ing avoided the use of operations with high computational cost like the logarithms and the transformations to the frequency domain.
The proposed experimental scheme for evaluation of the detection effectiveness and the proposed measures allowed proving the high performance of the process.
The proposed method for fast localization and normalization might be used as a previous step in the general face recognition process and also as an independent proc-ess for the improvement of the visual effect of face images.
References
1. A. S. Tolba, A.H. El-Baz, and A.A. El-Harby. Face Recognition: A Literature Review. In-ternational Journal of Signal Processing Volume 2, N.2-2005.
2. R. Chellappa, C.L. Wilson and C. Sirohey, ”Human and machine recognition of faces: A survey,” Proc. IEEE, vol. 83, no. 5, pp. 705- 740, may 1995.
3. Belhumeur, P., D. Kriegman,: What is the set of images of an object under all possible lighting conditions. Int. J. of Computer Vision 28, 245-260(1998)
4. Georghiades, A., Kriegman, D., Belhumeur, P.: From few to many: Generative models for recognition under variable pose and illumination. IEEE PAMI (2001)
5. Riklin-Raviv, T.,., Shashua, A.: The Quotient image: class-based re-rendering and recogni-tion with varying illumination conditions. In: IEEE PAMI. (2001)
6. Lee, K., Ho, J., Kriegman, D.: 9 Points of Light: Aquiring Subspaces for Face Recognition Under Variable Lighting IEEE Proc. Conf. Computer Vision and Pattern Recognition, (2001).
7. Viola P. and Jones M. Rapid Object Detection Using a Boosted Cascade of Simple Fea-tures. Mitsubishi Electric Research Laboratories, Inc., 2004.
8. Lienhart Rainer. Haarcascade_frontalface_default.xml. Intel License Agreement For Open Source Computer Vision Library. 2000.
9. Xiong G, A local normalization algorithm that uniformizes the local mean and variance of an image, URL:http://www.mathworks.com/matlabcentral/fileexchange/loadFile.do? ob-jectId= 8303.
10. Biomedical Imaging Group. Local normalization algorithm, http://bigwww.epfl.ch/demo/ j 11. Garea E., Kittler J.,Messer K., Mendez H., An Illumination Insensitive Representation for
Face Verification in the Frequency Domain. Proc.of ICPR 2006, IEEE, in press. 12. The Yale Face Database, URL: http://cvc.yale.edu/projects/yalefaces/yalefaces.html. 13. Gonzales R., Woods, R. and Eddins S., Digital Image Processing using Matlab.pp 404-405
Ed Pearson, 2004.