THE ALHAMBRA SURVEY: A LARGE AREA MULTIMEDIUM-BAND OPTICAL AND NEAR-INFRARED PHOTOMETRIC SURVEY
43
arXiv:0806.3021v1 [astro-ph] 18 Jun 2008 Submitted to The Astronomical Journal The ALHAMBRA Project: A large area multi medium-band optical and NIR photometric survey 1 M. Moles 1 , N. Ben´ ıtez 1,2 , J. A. L. Aguerri 3 , E. J. Alfaro 1 , T. Broadhurst 4 , J. Cabrera-Ca˜ no 5 , F. J. Castander 6 , J. Cepa 3,7 , M. Cervi˜ no 1 , D. Crist´obal-Hornillos 1 , A.Fern´andez-Soto 8 , R. M. Gonz´alezDelgado 1 , L. Infante 9 ,I.M´arquez 1 , V. J. Mart´ ınez 8,10 , J. Masegosa 1 , A. del Olmo 1 , J. Perea 1 , F. Prada 1 , J. M. Quintana 1 , and S. F. S´anchez 11 [email protected],[email protected],[email protected],[email protected], [email protected],[email protected],[email protected],[email protected],[email protected], [email protected],[email protected],[email protected],[email protected], [email protected],[email protected],[email protected],[email protected],[email protected], [email protected],[email protected],[email protected] ABSTRACT Here we describe the first results of the ALHAMBRA survey which provides cosmic tomography of the evolution of the contents of the Universe over most of Cosmic history. Our novel approach employs 20 contiguous, equal-width, medium-band filters covering from 3500 ˚ A to 9700 ˚ A, plus the standard JHK s near-infrared bands, to observe a total area of 4 square degrees on the sky. The 1 Instituto de Astrof´ ısica de Andaluc´ ıa, CSIC, Apdo. 3044, E-18080 Granada 2 Instituto de Matem´ aticas y F´ ısica Fundamental, CSIC, Serrano 113-bis, Madrid 28006 3 Instituto de Astrof´ ısica de Canarias, La Laguna, Spain 4 School of Physics and Astronomy, Tel Aviv University, Israel 5 Departamento de F´ ısica At´ omica, Molecular y Nuclear, Facultad de F´ ısica, Universidad de Sevilla, Spain 6 Institut de Ci` encies de l’Espai, IEEC-CSIC, Barcelona, Spain 7 Departamento de Astrof´ ısica, Facultad de F´ ısica, Universidad de la Laguna, Spain 8 Departament d’Astronom´ ıa i Astrof´ ısica, Universitat de Val` encia, Val` encia, Spain 9 Departamento de Astronom´ ıa, Pontificia Universidad Cat´olica, Santiago, Chile 10 Observatori Astron`omic de la Universitat de Val` encia, Val` encia, Spain 11 CentroAstron´omicoHispano-Alem´an,Almer´ ıa, Spain
-
Upload
independent -
Category
Documents
-
view
0 -
download
0
Transcript of THE ALHAMBRA SURVEY: A LARGE AREA MULTIMEDIUM-BAND OPTICAL AND NEAR-INFRARED PHOTOMETRIC SURVEY

arX
iv:0
806.
3021
v1 [
astr
o-ph
] 1
8 Ju
n 20
08
Submitted to The Astronomical Journal
The ALHAMBRA Project: A large area multi medium-band
optical and NIR photometric survey1
M. Moles1, N. Benıtez1,2, J. A. L. Aguerri3, E. J. Alfaro1, T. Broadhurst4,
J. Cabrera-Cano5, F. J. Castander6, J. Cepa3,7, M. Cervino1, D. Cristobal-Hornillos1,
A. Fernandez-Soto8, R. M. Gonzalez Delgado1, L. Infante 9, I. Marquez1, V. J. Martınez8,10,
J. Masegosa1, A. del Olmo1, J. Perea1, F. Prada1, J. M. Quintana1, and S. F. Sanchez11
[email protected],[email protected],[email protected],[email protected],
[email protected],[email protected],[email protected],[email protected],[email protected],
[email protected],[email protected],[email protected],[email protected],
[email protected],[email protected],[email protected],[email protected],[email protected],
[email protected],[email protected],[email protected]
ABSTRACT
Here we describe the first results of the ALHAMBRA survey which provides
cosmic tomography of the evolution of the contents of the Universe over most
of Cosmic history. Our novel approach employs 20 contiguous, equal-width,
medium-band filters covering from 3500 A to 9700 A, plus the standard JHKs
near-infrared bands, to observe a total area of 4 square degrees on the sky. The
1Instituto de Astrofısica de Andalucıa, CSIC, Apdo. 3044, E-18080 Granada
2Instituto de Matematicas y Fısica Fundamental, CSIC, Serrano 113-bis, Madrid 28006
3Instituto de Astrofısica de Canarias, La Laguna, Spain
4School of Physics and Astronomy, Tel Aviv University, Israel
5Departamento de Fısica Atomica, Molecular y Nuclear, Facultad de Fısica, Universidad de Sevilla, Spain
6Institut de Ciencies de l’Espai, IEEC-CSIC, Barcelona, Spain
7Departamento de Astrofısica, Facultad de Fısica, Universidad de la Laguna, Spain
8Departament d’Astronomıa i Astrofısica, Universitat de Valencia, Valencia, Spain
9Departamento de Astronomıa, Pontificia Universidad Catolica, Santiago, Chile
10Observatori Astronomic de la Universitat de Valencia, Valencia, Spain
11Centro Astronomico Hispano-Aleman, Almerıa, Spain

– 2 –
optical photometric system has been designed to maximize the number of objects
with accurate classification by Spectral Energy Distribution type and redshift,
and to be sensitive to relatively faint emission features in the spectrum. The
observations are being carried out with the Calar Alto 3.5m telescope using the
wide field cameras in the optical, LAICA, and in the NIR, Omega-2000. The first
data confirm that we are reaching the expected magnitude limits (for a total of
100 ksec integration time per pointing) of AB ≤ 25 mag (for an unresolved object,
S/N = 5) in the optical filters from the blue to 8300 A, and from AB = 24.7 to
23.4 for the redder ones. The limit in the NIR, for a total of 15 ks exposure time
per pointing, is (in the Vega system) Ks ≈ 20 mag, H ≈ 21 mag, J≈ 22 mag.
Some preliminary results are presented here to illustrate the capabilities of the
ongoing survey. We expect to obtain accurate redshift values, ∆z/(1 + z) ≤ 0.03
for about 5 ×10⁵ galaxies with I≤ 25 (60% completeness level), and zmed =
0.74. This accuracy, together with the homogeneity of the selection function,
will allow for the study of the redshift evolution of the large scale structure, the
galaxy population and its evolution with redshift, the identification of clusters
of galaxies, and many other studies, without the need for any further follow-
up. It will also provide targets for detailed studies with 10m-class telescopes.
Given its area, spectral coverage and its depth, apart from those main goals, the
ALHAMBRA-Survey will also produce valuable data for galactic studies.
Subject headings: photometric surveys – photometric redshifts – cosmic evolution
– cosmology
1. Introduction: Global scientific aim and opportunity
Only over the last few years it has become possible for Observational Cosmology to
gather enough data on the distant universe to feed our comprehension of the evolution of the
different objects that populate it. It has become almost commonplace to study protogalaxies
at redshifts z > 5, and to observe particular objects at redshifts as high as z ≈ 6.5 (Becker
et al. 2001, Kashikawa et al. 2006, Kawai et al. 2006) or even z ≈ 7.5 (Bradley et al. 2008). At
the same time, samples of objects have been collected through different techniques at smaller
1Based on observations collected at the German-Spanish Astronomical Center, Calar Alto, jointly oper-
ated by the Max-Planck-Institut fur Astronomie Heidelberg and the Instituto de Astrofısica de Andalucıa
(CSIC).

– 3 –
distances (and shorter evolutionary times) from us, and the different properties of objects
in separate redshift ranges have been measured and compared. However, it remains true
that to this day, no homogeneous sample of objects has been collected covering a significant
range of the age of the universe, even if some remarkable efforts have been devoted to the
production of wide-field, shallow surveys, that cover the low-redshift end (like 2dFGRS,
Colless et al. 2001, SDSS, York et al. 2000, VVDS, Le Fevre et al. 2005 or DEEP-2, Davis
et al. 2003) while other groups have directed their efforts towards the most distant end,
through very deep, small-area surveys like the HST Deep Fields or other legacy programs
(Ferguson et al. 2000, Beckwith et al. 2006).
The Cosmological Principle implies the existence of maximally symmetric subspaces
and the existence of a one-to-one relation between redshift and time. The corresponding
evolutionary nature of the depicted Universe is a model-independent prediction, prior to any
consideration about the value of the cosmological parameters. A direct way to tackle many
of the problems posed by modern cosmology is hence to materialize a foliation of the space-
time, producing narrow slices in the z-direction whereas the spatial sections are large enough
to be cosmologically representative, obtaining as output a kind of Cosmic Tomography.
From the observational point of view, to trace Cosmic Evolution, which is a central
topic in Cosmology, the genuine evolutionary effects have to be disentangled from both the
physical variance at a given redshift and the details of the metric as measured in — or,
depending on the point of view, induced by — the cosmological model. In other words,
to approach the question of evolution meaningfully it is necessary to sample large volumes
even at low redshift, to capture not only representative average properties but also their
variance. This will necessarily imply a survey featuring a combination of wide area and
depth, and a continuous spectral coverage to avoid complex selection functions that depend
on the redshift and on the nature of the objects under analysis. Moreover, the quest for the
necessary precision implies high enough spectral resolution and photometric accuracy.
Up to now, the largest surveys ensuring complete spectral coverage for large samples
have been photometric, and done with broad-band filters. The resulting redshift precision
obtained with these techniques (∼ 0.03 in ∆z/(1 + z), at best, see Cucciati et al. 2006 and
Ilbert et al. 2006) and in Spectral Energy Distribution (SED) determination are correspond-
ingly rough. Moreover, large area photometric surveys like SDSS are necessarily shallow,
whereas deeper surveys have sampled the distant and/or faint Universe in rather small ar-
eas. At the other extreme in spectral resolution, spectroscopic surveys can neither go as
deep as the photometric ones nor cover large enough areas. Moreover, they are defined in
order to observe a restricted spectral region, producing a selection effect that is a function of
the object type and redshift that can be very intricate due to the selection effects inherent

– 4 –
to spectroscopy (Fernandez-Soto et al. 2001).
For those scientific purposes where the detailed properties of individual objects are
not the goal, the aim from an observational stand is therefore that of finding the optimal
filter combination to produce the most homogeneous, deepest, and most accurate possible
photometric survey. Such a survey would produce precise enough values for the redshift and
SED for large numbers of objects. We present here the Advanced Large Homogeneous Area
Medium Band Redshift Astronomical, ALHAMBRA-Survey, that intends to produce such
an optimum survey for the study of cosmic evolution. It has been designed to achieve (with
the facilities at hand) the best compromise between large area and depth, good spectral
resolution and coverage, in order to produce an optimum output in terms of redshift and
SED accuracy. The ALHAMBRA-Survey is a deep photometric survey using 20 contiguous,
equal-width, medium-band optical filters from 3500 A to 9700 A, plus the three standard
broad band (JHKs) NIR filters. The total area surveyed by ALHAMBRA will be 4 square
degrees, being therefore placed halfway in between traditional imaging and spectroscopic
surveys.
By design, the ALHAMBRA-Survey will provide precise (∆z < 0.03(1 + z)) photo-
metric redshifts and SED classification for several hundred thousand galaxies and AGNs,
allowing for different kinds of analysis regarding populations and structures, and their
evolution in time. The details of the project, including simulations and expected results,
and all the related aspects are described in the ALHAMBRA-Book that can be found at
http://www.iaa.es/alhambra. Thanks to the unbiased nature of this survey (i.e. neither
designed to detect a given class of objects nor to be precise only in some fixed spectral
window), important problems other than cosmic evolution can be addressed. These include
the study of stellar populations in the galactic halo, the search for peculiar stellar objects,
ranging from very cold stars to blue stragglers, and the possible detection of debris from
galactic satellites in the Milky Way halo. Moreover, the large surveyed volume and the
ability to finely discriminate between different spectral energy distributions will permit the
serendipitous detection of objects that could be classified as exotic or rare. This broad cate-
gory includes very high redshift galaxies (≈ 2500 objects at z > 5, with ∆z < 0.01, expected
from scaled HDF observations) and QSOs.
The observations are being carried out with the 3.5m telescope of the Centro As-
tronomico Hispano-Aleman, CAHA, Calar Alto Observatory (Almerıa, Spain) and the wide-
field imagers in the optical (LAICA) and in the NIR (Omega-2000). The collected data
render possible the study of many different astronomical problems in a self-contained way
and will provide with very interesting targets for individual studies with large size telescopes.
A separate article (Benıtez et al. 2008) deals with the selection of the optical filters and

– 5 –
the optimization of their characteristics to maximize the spectral information, while in this
work we present the main characteristics that specifically define the ALHAMBRA-Survey,
including some preliminary results from the data we have already accumulated.
This paper is organized as follows: in Section 2 we present the project implementation
and its present status, and in Section 3 the first, preliminary results. We compare the
ALHAMBRA survey with other surveys in Section 4, whereas our conclusions are presented
in Section 5.
2. Survey design, implementation and status
2.1. Description of the filter system
The idea to use photometric information to determine the redshift of faint sources
was first proposed by Baum (1962), and later re-launched by Loh & Spillar (1986), Koo
(1986) and Connolly et al. (1995) as a poor person redshift machine. Its importance and
adequacy to produce relevant data to different cosmological analysis was recognized after,
among others, the works by Lanzetta et al. (1996), Connolly et al. (1997), or Fernandez-Soto
et al. (1999), on the Hubble Deep Field. Nowadays, many if not most of the surveys which
have already been completed or are under development, include the use of broad-band filters
and photometric redshift techniques.
Hickson et al. (1994) were the first to discuss the possibility of using a set of medium-
band filters to continuously cover a large spectral range, and produce photometric data
that could be considered equivalent to a very-low resolution spectrum for each detected
object. No discussion was done however in that work on the number and kind of filters
that would be needed in order to optimize the output in terms of z and SED accuracy
for a given instrumental setup and observing time. Later the surveys CADIS (Meisen-
heimer et al. 1998) and COMBO-17 (Wolf et al. 2001a, Wolf et al. 2001b, Wolf et al. 2004,
Bell et al. 2004) used a combination of broad- and medium-band filters with similar pur-
poses. In particular, COMBO-17 employs the standard broad band filters (UBV RI) plus 12
narrow- or medium-band filters sampling several spectral domains between 4000 and 9200 A.
At the end, in this and similar surveys the full spectral coverage is obtained via broad band
filters. COMBO-17 has reached very good quality in getting photometric redshifts with an
accuracy of 1% in ∆z/(1 + z) at R < 21. It covers an area of 1 square degree. The degrada-
tion in quality at fainter magnitudes is planned to be compensated with the use of 4 redder
filters (Y, J1, J2 and H) in the MANOS-deep survey (or COMBO-17+4) covering a field of
0.77 square degrees.

– 6 –
The ALHAMBRA-Survey was designed to cover all the visible spectral domain with
equally wide, contiguous medium-band filters to optimize its scientific output in terms of
accuracy of the z and SED determinations. By design, it is possible to detect, other than the
overall SED, relatively faint emission lines. As already pointed out, the details are explained
in a separated paper by Benıtez et al. (2008), where different implementations were devised
and analyzed to get the best solution for a given fixed total amount of observing time. The
resulting optical filter system includes a total of 20 contiguous, medium-band, FWHM =
310 A, top-hat filters, that cover the complete optical range from 3500 to 9700 A. The
optical coverage is supplemented with the standard NIR JHKs filters.
The filter set was designed having in mind a series of restrictive requirements about
their spectral shape, homogeneity, and transmission. In particular, all filters should have
very steep side slopes, close to zero overlap in λ, a flat top, and transmissions in excess of
70%. Given the particular disposition of the four detectors in the LAICA focal plane, four
sets of filters had to be produced, in such a way that all of them were equivalent within strict
limits. The complete set of 20×4 filters was manufactured by BARR Associates. They were
confirmed to be within specifications at the laboratory of the Instituto de Astrofısica de
Andalucıa. The transmission curves are shown in Figure 1.
2.2. Expected redshift precision and the NIR filters
For a survey with the characteristics of ALHAMBRA the quality of the final results
depends critically on the photometric errors and the adequacy of the templates used to
compute photometric redshifts. To test the first aspect we have created a grid of galaxy
spectra using the templates presented in Benıtez (2000), with redshifts between 0 and 5.0,
and absolute Ks-band magnitudes ranging from -23 to -16. All these galaxies have been
”observed” through the full ALHAMBRA photometric system, with noise added to the ob-
served fluxes according to the properties of our data. Each galaxy had then its ALHAMBRA
photometric redshift measured via the same code used by Fernandez-Soto et al. (1999), and
the offset between the original and the calculated values of the redshift was obtained. We
have then binned the objects according to their photometric I-band magnitude uncertainty,
and estimated the dispersion around the correct redshift value for each bin. The results are
presented in Figure 2, where it can be seen that we obtain an excellent redshift accuracy
(∆z/(1+ z) < 0.03) even for objects with magnitude errors as large as ∆AB(I) ≈ 0.15—the
error we measure for typical objects at AB(I)≈ 24.5. Moreover, the percentage of all those
objects that actually have redshift residuals smaller than that is larger than 50%–recall that
the redshift error distribution is strongly non-Gaussian, with long tails and second peaks due

– 7 –
Fig. 1.— Transmission curves for one of the optical filter sets for the ALHAMBRA-Survey as
measured in the laboratory. We also show the effective total transmission (lower curve), after
taking into account the quantum efficiency of the CCD detector, the atmosphere transmission
(at Air Mass = 1.3) and the reflectivity of the primary mirror of the Calar Alto 3.5m telescope

– 8 –
to the so-called ”catastrophic errors”. This analysis, of course, does not include the possible
systematic effects induced by the choice of the template set.
Inclusion of the NIR information can significantly improve the determination of the
redshift in some cases. In particular, as pointed out by many authors using photometric
redshift techniques in deep surveys (e.g.Coe et al. 2006), the use of NIR filters can help to
break the degeneracy between low-redshift (z ≈ 0.5) and high-redshift (z ≈ 3) galaxies.
The reason behind this degeneracy is the possible confusion between the Balmer and Lyman
breaks, which are the most salient features of the respective spectral energy distributions. In
absence of any infrared information, it is not possible to determine the slope of the rest-frame
red end of the spectrum, the range that can in fact tell the difference between both families.
Each one of the left-side panels in Figure 3 explicitly shows the degeneracies between the
different spectral types and redshifts. For each of the six galaxy types used in the exercise
(rows and cells) and every redshift (from z = 0 to z = 8 in both axes in every box), the
points mark the types that degenerate with it in color space—for this particular figure, a
magnitude “thickness” ∆m = 0.2 has been chosen, so that any two galaxy spectra that differ
in less that ∆m in all the ALHAMBRA filters considered have been taken as degenerate,
and hence indistinguishable.
It can be seen in the right-side panels how (for the ∆m = 0.2 case) the presence of
NIR data eliminates most of the degeneracies between low and high redshift, and sharply
separates the elliptical, Sab, and Scd galaxies from the rest and from each other, leaving only
some residual degeneracy between the three bluest types. Of course, the infrared information
also adds greatly to the scientific content of the survey, via the more direct relation existing
between the galactic mass and the infrared luminosity.
Our preliminary results (see next section) show us that the simulations above should not
be far off the mark; our I-band photometric errors are < 10% up to I ≈ 24, with expected
redshift errors δz/(1 + z) ≤1.5%. We also expect that most of the objects up to I≤25 will
have photometric redshift errors < 3% .
2.3. The Survey area
It is well known that astronomical objects cluster on the sky on different scales. The
clustering signature contains a wealth of information about the structure formation process.
A survey designed to cope with the cosmic variance and to describe and understand the
clustering needs to probe as many scales as possible, up to the homogeneity scale. So, on one
hand, searching contiguous areas is important in order to cover smoothly the smallest scales

– 9 –
Fig. 2.— Estimates of the photometric redshift dispersion as a function of the photometric
uncertainty in the I band. The black dots and continous line show the velocity uncertainty,
while the red dotted (green dashed) line shows the percentage of objects with a given I-band
uncertainty that have redshift residuals smaller than ∆z/(1 + z) = 0.015 (0.030).

– 10 –
Fig. 3.— Theoretical degeneracies in type and redshift expected for galaxies in the ALHAM-
BRA survey measured to an accuracy of 0.2 magnitudes in all filters. The upper panel shows
the case where no infrared information is available, and the lower panel corresponds to the
case where the NIR information is included. Each of the 6 × 6 sub-panels corresponds to a
z1 (photometric redshifts) vs z2 (actual values) diagram with redshifts ranging from 0 to 8.

– 11 –
Table 1: The ALHAMBRA-Survey Fields. We include together with the name a reference
to overlaps with other surveys of interest.Field name RA(J2000) DEC(J2000) 100 µm E(B-V) l b
ALHAMBRA-1 00 29 46.0 +05 25 28 0.83 0.017 113 -57
ALHAMBRA-2/DEEP2 02 28 32.0 +00 47 00 1.48 0.031 166 -53
ALHAMBRA-3/SDSS 09 16 20.0 +46 02 20 0.67 0.015 174 +44
ALHAMBRA-4/COSMOS 10 00 28.6 +02 12 21 0.91 0.018 236 +42
ALHAMBRA-5/HDF-N 12 35 00.0 +61 57 00 0.63 0.011 125 +55
ALHAMBRA-6/GROTH 14 16 38.0 +52 25 05 0.49 0.007 95 +60
ALHAMBRA-7/ELAIS-N1 16 12 10.0 +54 30 00 0.45 0.005 84 +45
ALHAMBRA-8/SDSS 23 45 50.0 +15 34 50 1.18 0.027 99 -44
where the signal is stronger and to obtain an optimally-shaped window function. But, on
the other hand, measuring a population of a certain volume density is a Poissonian process
with an associated variance and, in principle, one would obtain different densities of the
same population when measuring at different places. The variance in those measurements is
dictated by the volume density of the population under study, the volume searched and the
clustering of the population. In order to beat down this cosmic (or, technically, sampling)
variance one needs to survey independent volumes. So, all in all, a balance must exist
between probing contiguous and independent areas.
For a survey aiming at resolving a number Nst of SED-types, the sampling errors in any
counting statistical measure will go as
σs = K
√
Nst
Nf ∆z
where Nf is the number of fields of a given area and ∆z the redshift interval to be resolved.
To get a quantitative evaluation of this statistical noise, we have used the SDSS local lu-
minosity function, that yields, with a plausible parameterization of the evolution, a redshift
distribution similar to that obtained from the HDF at our magnitude limit. Expressing
Nf as the number of 1 square degree fields, we find K in the range 0.01 - 0.02 for redshift
between 0.3 and 2. Therefore, if we intend to have relative sampling errors no larger than a
few percent at any redshift, with a redshift resolution better than ∆z = 0.05, Nf should be
similar to Nst, which results in a total field of a few square degrees.
On the technical side we had to consider the geometry of the imager LAICA, with
four 4k×4k CCDs, arranged in a 2 × 2 mosaic with the gap between two adjacent (vertical

– 12 –
and horizontal) CCDs being almost the same size of the CCD itself. Thus, one pointing
corresponds to 4 patches of 15.4’ × 15.4’ over a total field of 44.4’ × 44.4’, such that with
four pointings a total, contiguous area of 1 degree squared is covered2. This geometry imposes
a minimum contiguous area patch of 1 degree × 0.25 degrees and produces 2 such strips in
two pointings. The Omega-2000 camera used for NIR observations3 covers a field of view
equivalent to one of the LAICA CCDs.
Considering the sampling constrains together with the technical characteristics of the
detectors, the expected efficiency of the atmosphere-telescope-imager, and the amount of
available time for the project, we finally decided to cover 2 such strips in each of the 8
selected fields, a total of 4 square degrees to ensure a large enough area coverage and good
sampling.
The fields were selected taking as first and basic criterion their low extinction, as mea-
sured in Schlegel et al. (1998). Then, within the lowest extinction patches, we tried to identify
those containing neither bright sources nor conspicuous structures. We decided that a sig-
nificant overlap with other surveys would be an asset, to ensure the possible cross-checking
of our results and maximum complementarity, in particular regarding the largest coverage in
wavelength. The selected fields are listed in Table 1. The 100 µm emission and E(B-V) val-
ues quoted in the table are the median for the whole 1� field centered at the given position.
Only ALHAMBRA-1 is new in the sense of having no overlap with other surveys.
At the moment of writing this article (Feb 2008) we have already obtained about 64%
of the near infrared data and about 35% of the visible data. The NIR observations with
Omega-2000 were started in August 2004, whereas we could start taking visible data with
LAICA only in September 2005. We expect to complete our observations by 2010.
We will discuss in Section 3 below some preliminary results obtained with our first
complete 15′ × 15′ pointing, including observations with all the ALHAMBRA filters.
2.4. The calibration strategy
As mentioned above, we have already completed the first LAICA pointing in all the
filters. In the quoted ALHAMBRA-book we have presented the simulations we performed
to design the survey and to find the expected depth of the data for the strategy chosen.
2http://www.caha.es/CAHA/Instruments/LAICA/index.html
3http://www.mpia-hd.mpg.de/IRCAM/O2000/index.html

– 13 –
We are now in the position of checking the quality of the data delivered by the survey, the
validity of our simulations and the adequateness of our observational strategy
Indeed, a crucial aspect to do that analysis is the photometric calibration of the data.
This is a particularly demanding aspect of the project. Apart from other considerations,
it has been shown that the reliability of the photometric redshifts depends critically on the
photometric accuracy (Coe et al. 2006). This aspect is particularly acute in our case since
we are in fact introducing a new photometric system in the optical domain. Thus, special
care is needed to anchor it to existing photometric systems and to primary calibrators.
To define the reference fluxes and magnitudes of the ALHAMBRA photometric system
we have chosen a set of primary stars from the lists by Oke & Gunn (1983), Oke (1990),
Massey & Gronwall (1990) and Stone (1996), together with the 4 fundamental calibrators
adopted by the HST. The list includes the standard star BD+17o4708, the primary calibrator
of the SDSS system.
We give here a short account of calibration procedure, whereas the details will be pre-
sented in a forthcoming article. The devised procedure starts with the selection of stars in
our frames that have SDSS photometry. These will play the role of secondary standards.
We plan to obtain spectrophotometric observations of all these stars, calibrated with re-
spect to those primary standards. The spectra will then be fitted by stellar models and the
ALHAMBRA-system colors will be obtained from the fitted models by integration over the
filters. We will also compare the synthetic u’g’r’i’z’ colors with the SDSS values to check the
consistency between the systems. In this way we expect to have a calibration accurate to
the 2% level or better. The comparison between photometric and spectroscopic redshifts for
the galaxies with spectroscopic observations will also be used as a check of the calibration
of the ALHAMBRA data (Coe et al. 2006).
We will set the ALHAMBRA magnitudes on the AB system (Oke & Gunn 1983),
ABν = −2.5 log fν − 48.60
where fν is the flux per unit frequency from an object in erg s−1 cm−2 Hz−1.
The magnitudes will be defined with reference to their spectrophotometric data by
adopting
m = −2.5log
∫
Ff(ν)SF(ν)d(logν)
∫
FSF(ν)d(logν)
+ Cte
where SF (ν) is the transmission curve corresponding to the atmosphere-telescope-filter-
detector combination.
This is in fact the usual way to calibrate narrow-band images when the photometric

– 14 –
system is not previously defined (see for example, Marquez & Moles 1996). The SDSS
Consortium has also adopted this strategy to define their own photometric system (Fukugita
et al. 1996; Smith et al. 2002).
At the moment of writing the present paper we have not yet completed the observations
of secondary stars to get the final calibration. In order to get a preliminary calibration that
would be robust and accurate enough to allow the analysis of the main aspects of the survey
in terms of depth and reliability, we have implemented a different procedure. Briefly, what we
have done is to select 228 flux calibrated stellar spectra from the Hubble’s Next Generation
Spectral Library (NGSL; Gregg et al. 2004) covering a wide range of physical properties.
From these spectra synthetic colors were obtained in both, SDSS and ALHAMBRA systems
and the first set of transformation equations between the two systems were obtained. The
results are given in Table 2.
Then we have applied these equations to a set of stars with accurate SDSS and AL-
HAMBRA instrumental magnitudes to obtain the zero point of the photometric calibration.
The zero points found in this way are accurate at the level between 5 and 10%.
The NIR data have been calibrated through the 2MASS catalog stars present in our
frames. The rms of the calibration is always below 0.04 mag in all 3 bands.
2.5. Observing Strategy
As was mentioned in Section 2.1, the ALHAMBRA filter set was devised following
detailed simulations in order to optimise the quality and number of photometric redshifts
for galaxies in our fields. Similarly, the exposure times per filter were defined in such a
way that the expected magnitude limits in each one would be as homogeneous as practically
possible. This driving principle, combined with a minimum exposure time of 2.5 ksec per
filter (due to the observing logistics), and the known fact that our system is less efficient in
the red end of the spectrum, propped us to divide the total LAICA time per pointing (100
ksec) in the way presented in Figure 4. Thus, the target AB = 25 limit would be reached or
even exceeded for all filters bluewards of ≈ 8500 A, and redwards from there the decreasing
efficiency makes the limit magnitude drop until AB≈ 23 at ≈ 9500 A. In the near infrared,
previous experience with Omega-2000 decided us to divide the available 15ksec per pointing
equally into the J, H, Ks filters, aiming to reach J = 22, H = 21, Ks = 20 (in the Vega-based
system). These expectations will be compared with the real data in Section 3.
Our image quality limit to consider the data as ”scientifically valid” is, in real time
at the telescope dome, a value of the seeing which should be < 1.4”. However, the seeing,

– 15 –
Table 2: The calibration relations. The numbers are the coefficients of the relation between
any given ALHAMBRA magnitude and the SDSS values (blanks for null coefficients)
Filter Orig. u g r i z
01 -0.0208 0.9314 0.0690
02 0.0257 0.3626 1.3321 -0.7066
03 -0.0467 0.1442 1.3099 -0.4560
04 -0.0391 1.0607 -0.0587
05 0.0147 0.6488 0.5480 -0.1961
06 -0.0336 0.6341 0.3667
07 -0.0192 0.3199 0.7865 -0.1056
08 -0.0057 0.0604 1.1792 -0.2391
09 -0.0050 1.1009 -0.1008
10 0.0067 0.7279 0.2720
11 0.0188 -0.2000 1.1309 0.0682
12 0.0156 -0.0876 0.6046 0.4811
13 -0.0284 0.0839 -0.1523 1.0693
14 0.0208 -0.0178 1.0177
15 0.0247 -0.2473 1.2463
16 0.0372 -0.3725 1.3717
17 0.0161 0.1777 0.8207
18 -0.0528 -0.0383 1.0413
19 -0.0199 -0.1200 1.1207
20 0.0186 -0.2436 1.2433

– 16 –
Fig. 4.— Expected limit magnitudes for the ALHAMBRA filters, at S/N = 5, estimated for
our survey. The exposure time per filter (in ksec) is given for every filter.

– 17 –
as well as the transparency, is measured a posteriori during the pipeline reduction, and the
individual images are kept or eliminated from the final combination based on a more complex
quality assessment, that will be presented elsewhere.
2.6. Data reduction
For the reduction of the images two different pipelines have been used. In the case of
the LAICA data, the preliminary standard steps of overscan correction and flat-fielding are
performed. After that, the illumination correction using smooth superflats is applied. In
the optical filters redder that 7000 A the images suffer from a substantial fringing pattern
that is removed using the procedure described in Alcala et al. (2002). This fringing pattern
contributes less than 2% to the flat-fields, so we have not corrected the flat-fields at this
stage.
In the case of the NIR filters we first removed the dark current frames and divided by a
normalized superflat constructed combining the science images. An additive pupil ghost is
present in the superflat images, that is more prominent in the J band (∼ 5% contribution).
The pupil ghost is fitted in the normalized flat-field images using the mscpupil task in the
IRAF MSCRED package (Valdes 2002). The adjusted pupil pattern (pij) is removed from
the flat-field dividing it by (1+pij), and is subtracted from the individual images after scaling
it by the median background level. After having flat-fielded the images, the sky structure
of each individual image is removed with the XDIMSUM package (Stanford, Eisenhardt &
Dickinson 1995) using the sky image constructed with the median of the 6 closest images, that
in case of the J, H, Ks filters correspond to timescales of 480,360,276 seconds respectively.
Before removing the background, the sky image is median filtered using 5 × 5 window in
order to reduce its noise. During this process also masks for each individual image with the
location of the cosmic rays are created. The cosmic rays and bad pixels are fixed to proceed
with the next steps.
At this stage, the sky level is measured, and SExtractor (Bertin & Arnouts 1996) is used
to obtain an initial estimate of the FWHM of each image, and the number of sources above a
given S/N. The relative transparency of each image is measured using high S/N stars. These
numbers are used to remove bad images or images out of the survey requirements. After that,
the astrometry of a reference image is calibrated using the USNO-B1.0 (Monet et al. 2003)
catalog. The external astrometric rms is ∼ 0.12 arcsecs in each axis. The remaining images
are calibrated internally, in a first iteration using the reference image in the filter. After
completing an ALHAMBRA pointing a deep image constructed using images with good
FWHM and transparency in several selected filters will be created and used afterwards to

– 18 –
calibrate the internal astrometric solution. For this purpose we have used our own algorithm
to match the image sources with those in the external catalog, and the IRAF ccmap task to
obtain an order 3 polynomial solution. The internal astrometric solution rms is ∼ 0.03 arcsec
in each axis for the Laica images and ∼ 0.05 arcsecs in the Omega-2000 ones. Finally, the
astrometry of each individual image is re-calibrated internally with the reference image using
Scamp4 obtaining similar results. For image combination Swarp5 is used. This software takes
into account the distortion pattern present in the wcs headers, and allows the user to obtain
resampled images with a different pixel size, in the desired sky projection. Also the previously
computed relative transparency is used to uniform the zero points of the individual images.
In our process, before performing the final combination using Swarp, the resampled images
are used to apply a pixel rejection algorithm in other to improve the cosmic ray rejection and
bad pixel masks. In the case of the Omega-2000 images, with a roughly double pixel size, we
also require a final image with the Laica pixel scale. The final images for each ALHAMBRA
pointing in the 23 filters are registered within the internal astrometric solution rms.
3. Survey performance: preliminary results
The ALHAMBRA survey and filter system design was preceded by realistic, thorough
simulations presented in Benıtez et al. 2008 and in the ALHAMBRA-book. Recently we
completed the observations of the first pointing in the 20+3 filters, comprising 4 times a
15’4x15’4 field, and we are thus able to compare the performace of the survey with our
expectations.
We show in Figure 5 a color image corresponding to one of the CCDs of the first
complete pointing in the ALHAMBRA-8 field (see Table 1). An enlargement of this image
of approximately 1.5 arc-minutes side, where a small group of spiral galaxies can be seen, is
shown as an insert in the same figure.
These data allow us to go from simulations to actual measurements, and describe several
key characteristics of the survey; others will have to be complemented with simulations until
we carry out follow-up observations, primarily due to the paucity of available spectroscopic
redshifts in this particular field.
4http://terapix.iap.fr
5http://terapix.iap.fr

– 19 –
Fig. 5.— The first complete pointing of the ALHAMBRA-8 field in a square region of 15
arc-minutes side. This color image has been created making use of data from 14 out of the
23 filters. In the insert, corresponding to a region of about 1.5 arc-minutes, a small group
of galaxies can be seen

– 20 –
3.1. Photometric depth
The data reduction procedure involves the standard steps, including accurate flatfielding
and defringing (for the red filters) and precise astrometry. SExtractor, with just standard
settings for the different parameters, was used to get the photometry of the detected objects
that we discuss here. The pipelines and procedures will be described in a separate paper,
and will be made publicly available. Then the data were photometrically calibrated following
the procedure sketched in the previous section.
The ALHAMBRA filter system was primarily designed to obtain the best determination
of z and SED for a fixed amount of observing time per pointing (100 ksec). We estimated
the expected limit magnitudes taking into account the average extinction in Calar Alto, the
performance of the 3.5m telescope-LAICA system for airmass = 1.3, a final image quality
of FWHM ≈ 1′′.2 and the measured filter+CCDs transmission curves. The goal was to get
homogeneous magnitude limits for as many filters as possible, with the restriction that the
minimum exposure time per filter should not be less than 2.5 ksec. We expected to reach AB
≤ 25 (S/N = 5, point-like source) for 16 filters ranging from 3500 A to 8500 A. In the case
of the four reddest filters (close in wavelength to the z band) we could obtain decreasingly
lower limit magnitudes, down to AB = 23.4 in the last filter centered at 9550 A (see the
quoted ALHAMBRA-book and Moles et al. 2005).
To ascertain in a quantitative way the actual depth we reach in each of the filters we
have defined the limiting magnitude as that corresponding to the rms within a 1 square
arc-second aperture, at the S/N =5 level. The values we find are plotted in Figure 6. As can
be seen, we are actually reaching the expected limits in all the filters, including the reddest
ones. We also show in the same figure the magnitude limit values for a 2×FWHM aperture,
which may represent a more realistic integration area for typical flux measurements.
A complementary way to illustrate the depth of the data is to consider the number
counts in each band. In Figure 7 we show the preliminary number count histograms in the
20 ALHAMBRA optical filters. The counts have been normalized to unit magnitude and
unit area (square degree). No corrections due to completeness or spurious detection have
been applied. The histograms indicate that we are detecting sources at AB ≤ 25 in all the
filters from the bluest to about 8000A. The limiting magnitude then becomes brighter, and
we end up with AB∼23 at 9500A.
Moreover, to be able to compare with broad-band and spectroscopic surveys (see later),
we have synthesized broad-band filters from our medium-band ALHAMBRA filters. In
Figure 8 we present the results for the I∗ (synthetic I) band. It can be seen that the survey
is complete to I∗ ≈ 25 with errors ≈ 20% in the worst cases.

– 21 –
Fig. 6.— The limit magnitude, at S/N = 5 in each filter, for 1” square aperture and for
an aperture of 2×FWHM diameter. The total observing time per pointing was fixed to 100
ksec for the 20 optical filters, and to 15 ksec for the NIR bands

– 22 –
Fig. 7.— Histograms of number of sources to S/N=5 per square degree per magnitude for
the 20 ALHAMBRA optical filters.

– 23 –
Fig. 8.— Counts as a function of isophotal magnitude in the synthetic I-band image. The
completeness limit is close to I(AB) = 25. In the inserted panel the photometric errors as a
function of the isophotal I magnitude are shown.

– 24 –
In the NIR, based on existing experience with Omega-2000, we fixed the total exposure
time to 5 ksec per filter, in order to reach Ks ≈ 20, H ≈ 21, J ≈ 22 in the Vega system (S/N
= 5, point like source). The limit magnitudes presented in Figure 6 and the histograms
presented in Figure 9 show that these limits have been reached, and even exceeded6. A
more detailed analysis of the NIR galaxy counts will be presented in Cristobal-Hornillos
et al. (2008, in preparation).
3.2. Photometric redshift depth and accuracy
The central goal of the ALHAMBRA-survey is to measure with precision the observed
photometry of as many objects as possible; this enables us to estimate accurate redshifts and
spectral types. The use of a large number of filters, contiguous and with minimal overlap
among themselves provides a clear, inequivocal representation of the galaxy SED. This is
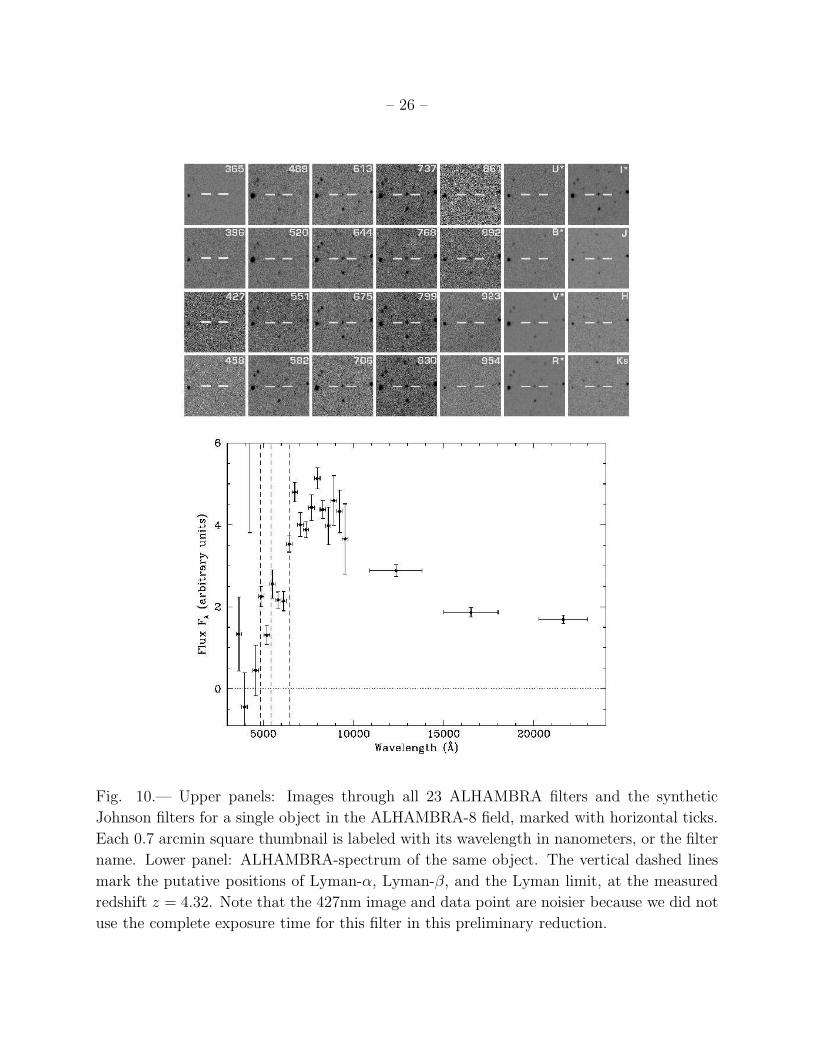
well illustrated by Figure 10 which shows a small (0.7 × 0.7 arc-minutes) thumbnail image
of a AB(I) ≈ 23 object in the ALHAMBRA-8 field in all 23 ALHAMBRA images and the
synthetic U∗B∗V ∗R∗I∗ filters, together with a calibrated ALHAMBRA “spectrum” of the
object, a starburst with z = 4.23.
The customary way of determining the photo-z accuracy of a survey is comparing es-
timates with a large sample of spectroscopic redshifts; unfortunately, the first field which
we have completed only has SDSS spectroscopy available, too shallow and sparse for that
purpose, and we plan to carry out spectroscopic follow-up observations for this and other
fields.
The NASA Extragalactic Database contains nine galaxies with spectroscopic redshifts
within the limits of our 15′ × 15′ pointing, all of them SDSS galaxies (Adelman-McCarthy
et al. 2007), with redshifts in the range z . 0.2. Despite the inadequacy of this sample for
statistical purposes it allows us to give the reader a taste of the redshift accuracy of the
ALHAMBRA survey (see Figures 11 and 12).
We are presently using three different codes to measure photometric redshifts, based on
different methods, in order to eventually choose the most robust and accurate strategy.
a) One is the code developed by Fernandez-Soto et al. (1999), based on galaxy template
fitting with an extended Coleman, Wu and Weedman (1980) library comprising six templates.
6Recall that the magnitude difference (AB-Vega) for the J , H , and Ks filters is ≈ 0.9, 1.5, and 2.0
respectively.

– 25 –
Fig. 9.— Histograms of number of sources to S/N=5 per square degree per magnitude in
the three NIR filters.
– 26 –
Fig. 10.— Upper panels: Images through all 23 ALHAMBRA filters and the synthetic
Johnson filters for a single object in the ALHAMBRA-8 field, marked with horizontal ticks.
Each 0.7 arcmin square thumbnail is labeled with its wavelength in nanometers, or the filter
name. Lower panel: ALHAMBRA-spectrum of the same object. The vertical dashed lines
mark the putative positions of Lyman-α, Lyman-β, and the Lyman limit, at the measured
redshift z = 4.32. Note that the 427nm image and data point are noisier because we did not
use the complete exposure time for this filter in this preliminary reduction.

– 27 –
b) The second one is the BPZ program, as described in Benıtez (2000), which uses a
Bayesian magnitude-type prior and the empirically calibrated template library described in
Benıtez et al. (2004) and complemented with two very blue starburt types (Coe et al. 2006),
eight galaxy templates in total.
c) The third method has been recently implemented by Sanchez (2008, in preparation),
and uses a synthetic library which also includes stellar spectra, AGN types and dust red-
dening. The use of a synthetic library provides information about the metallicity, the star
formation history, and other characteristics of the object.
The empirically calibrated library of Benıtez et al. (2004) has been shown to be precise
enough to detect and calibrate photometric zero points errors within 2 − 3% as the ones
in the NIC3 observations of the Hubble Ultra Deep Field (see Coe et al. 2006). Using this
calibration technique to correct the COMBO-17 photometry presented in Hildebrant, Wolf
and Benıtez (2008) reduces the photometric redshift error from δz/(1+z) from 0.038±0.035
to 0.001 ± 0.023. We therefore carry out a similar zero point recalibration using the 9
galaxies with spectroscopic redshifts. This recalibrated photometry is then fed to the three
codes mentioned above. As expected, the agreement among them is good for bright objects,
but somewhat breaks down at fainter magnitudes.
It is noteworthy that code c) predicts extremely well the redshifts of the spectroscopic
sample: its photometric error is δz ≈ 0.000 ± 0.010 close to the theoretical accuracy (see
Figure ). The BPZ software yields δz ≈ 0.002 ± 0.014, but it mistakes the reddening of an
edge-on spiral at z = 0.09 for a higher redshift, producing an outlier.
We will further test and refine our photometric redshift techniques, and the final strategy
will probably include a combination of them, in order to make our measurements as robust as
possible. As a token of the quality of the spectral information, we present the ALHAMBRA-
spectrum of one of the SDSS galaxies in Figure 12 (SDSS coordinates 356.331030,+15.479499,
redshift zsp = 0.113525). Our best-fit redshift for this object is zph = 0.12. The magnitude
offset between the SDSS spectrum and our photometry is present in the original data, and it
must be due to the smaller flux falling within the SDSS spectrograph fiber. Our data, even
with the preliminary calibration we are using at the moment, perfectly reproduce even some
of the minor details in the spectrum.
In Figure 13 we present a mosaic of 3-color galaxy images sorted according to redshift
(lines) and luminosity (columns). They span a large range in absolute magnitude (as mea-
sured in the band centered at 7370A), from brighter than M(AB) = −24, to M(AB) ≈ −16.7.
The figure illustrates the depth of this preliminary catalogue and the redshift values that
can be obtained.

– 28 –
Fig. 11.— Comparison of spectroscopic and photometric redshifts for the available sample.
This plot makes use of the results obtained with the Sanchez (2008, in preparation) code
described in the text. The statistics refer exclusively to the nine points represented in the
plot.

– 29 –
Fig. 12.— ALHAMBRA-spectrum (points with error bars), best-fit model (smooth line);
and SDSS photometry (diamonds) and spectrum (lower, noisy line) for one of the galaxies
with spectroscopic redshift in the ALHAMBRA-8 field. The vertical ticks mark the expected
position of the Hα+NII complex at the best-fit redshift. Notice the apparent excess in the
ALHAMBRA photometry at the expected wavelength, even though the total equivalent
width measured for the complex in the SDSS spectrum is only 15 A.

– 30 –
Fig. 13.— Postage stamp images of a set of galaxies extracted from the catalog of the field
presented in this work. Each postage stamp has been generated using the λ3960A (blue),
λ6750A (green) and Ks-band (red) frames to create a three-color image. The galaxies are
ordered by increasing redshift in the X-axis and decreasing λ7370A absolute magnitude
along the Y-axis, with each plotted galaxy being the most luminous of its corresponding
redshift-luminosity box. The luminosity ranges from M7370 < − 24 to M7370 ≈ − 16.67,
and the redshift ranges from z < 0.20 to z = 0.90. Redshift and magnitude values for each
column and line are given in the figure.

– 31 –
One of the defining characteristics of any photometric redshift survey is its effective
depth, i.e. the magnitude limit at which it is still possible to measure precise photometric
redshifts. If the photometric redshifts are estimated using a Bayesian formalism, it is possible
to define a quantity called “odds” which serves as powerful quality indicator of the reliability
and accuracy of a photometric redshift estimation (Benıtez 2000, Benıtez et al. 2004). The
value of the odds represents the fraction of the probability p(z) concentrated around the
maximum zph. At fainter magnitudes the photometric noise degrades the redshift information
and often p(z) is multimodal or presents a single peak of large width, making unfeasible an
unambiguous estimate of the redshift. Therefore by imposing cuts on the value of the odds
we can select galaxy subsamples for which the redshift estimates are reliable and accurate;
in fact it can be shown that the redshift accuracy depends on the severity of the threshold
cut.
4. Comparison with other surveys
Several large, deep photometric and spectroscopic surveys, have been completed in the
last years or are currently being conducted. Comparison between different surveys, each
of them designed for specific purposes and with different strategies, is not straightforward.
To put the ALHAMBRA-Survey in the context of other similar efforts we have plotted in
Figure 16 their positions in an area-depth plane7. Only photometric surveys with 5 or more
filters, i.e., those that can provide general redshift information, and area covered ≥ 0.5
square degree (with the exception of CADIS) were included. As we can see in this plot,
the ALHAMBRA-Survey occupies a position in between the first generation of wide field
photometric surveys–amongst which clearly COMBO-17 has played the leading role up to
now–and the ongoing projects which try to map much larger areas with comparable depth
like Pan-Starrs, DES, PAU, and LSST. COMBO-17 covers an area slightly larger than 1
square degree in five fields observed with the Wide-Field Imager at the MPG/ESO 2.2m
telescope in La Silla (Chile). The large number of bands (five broad band filters UBV RI
and 12 medium-band filters from 3500 A to 9300 A) has provided accurate measurements
of photometric redshifts (Wolf et al. 2001a) to undertake ambitious scientific projects, being
two of the last scientific achievements the measurement of galaxy clustering at moderate
redshifts (〈z〉 = 0.6) (Phleps et al. 2006) and the analysis of 3D weak lensing (Kitching
et al. 2007).
7Notice that the magnitude limits correspond in general to different spectral bands. In the particular
case of IRAS/PSCz a typical B magnitude has been taken as indicative of the population, selected in the
60µ band.

– 32 –
Fig. 14.— The total number of galaxies we expect to detect in the ALHAMBRA-Survey
(thick continuous), where we use the F7374 band as a proxy for the I band. The dashed
and dotted line give the total number of galaxies with different odds thresholds (see text).
These results are based on our first complete 15′ × 15′ arc min2 pointing. Our simulations
predict the galaxies with odds > 0.99 and odds > 0.95 will have photometric redshift errors
of δ . 0.015(1 + z) and δ . 0.03(1 + z) respectively.

– 33 –
Fig. 15.— The expected completeness level for the ALHAMBRA-Survey as a function of
magnitude; here we use the F7374 band as a proxy for the I band. The dashed and dotted
line correspond to different odds thresholds (see text). These results are based on our first
complete 15′ × 15′ arcmin2 pointing. Our simulations predict the galaxies with odds > 0.99
and odds > 0.95 will have photometric redshift errors of δ . 0.015(1+z) and δ . 0.03(1+z)
respectively.

– 34 –
As we have already indicated, the ALHAMBRA survey has been designed to provide
a deeper photometric survey in the Northern hemisphere making use of 20 optical medium-
band filters designed and optimised for the accurate determination of photometric redshifts
(Benıtez et al. 2008), covering four times the area covered by COMBO-17, and including
from its design the standard NIR filters J, H and K. We are using in ALHAMBRA the 3.5
m telescope at Calar Alto, and therefore the gain in aperture and the use of infrared filters
will make the ALHAMBRA survey deeper than COMBO-17. It is worth to say that also the
COMBO-17 team has planned a NIR extension of its survey that will allow to reach z ∼ 2
within its covered area (Meisenheimer et al. , MPI technical report, 2005).
The ALHAMBRA-Survey compares favourably with other deep, large photometric sur-
veys, even though it uses medium-band filters. It is only second in limit magnitude to a
few broad band photometric surveys. Indeed, comparing the ALHAMBRA survey (not to
mention spectroscopic surveys) with broad band ones in those terms is unfair, since the re-
sulting accuracy in redshift and SED determination precision is significantly different. Thus,
whereas typical redshift accuracies from those broad band surveys is ∼ 0.1 in ∆z/(1 + z) at
best, we expect to reach 0.015 with ALHAMBRA for several hundred thousand galaxies.
A recent effort quantitatively similar to some degree to ALHAMBRA is the one pre-
sented by Mobasher et al. (2007), who have measured photometric redshifts in the COSMOS
survey covering an area of 1.4◦ × 1.4◦ containing 367000 galaxies down to i ∼ 25 using 16
filters and providing accurate redshifts for faint galaxies up to z ∼ 1.2. The reliability of
their measurement has been tested comparing with the spectroscopy subsample zCOSMOS
containing 868 normal galaxies with z < 1.2 (Lilly et al. 2007).
Spectroscopic surveys do of course achieve the highest redshift and SED precision but
they cannot go as deep as photometric surveys, and not always have a complete spectral
coverage, resulting in complex selection functions. Besides, the detection limit is not ho-
mogeneous along the spectrum, resulting in a lack of completeness which can prove very
difficult to control. In some cases, for example when there is only one line in the spectrum,
the photometric data can be used to reduce the ambiguity present in the spectroscopic mea-
surements (Lilly et al. 2007). Given that our survey, in spite of its photometric nature, is
closer in spirit to spectroscopic surveys, we discuss in the next paragraphs how it compares
with them.
Indeed, the spectroscopic surveys can provide much more detailed information about
individual objects than any medium-band photometric survey. However, for all those pur-
poses where that detailed information is not needed, a survey like ALHAMBRA will prove
advantageous due to the homogeneity of the detection in the different filters and the ability
to produce accurate results even near the detection limit. Thus, as we wrote before, we

– 35 –
Fig. 16.— The position of different surveys in the area-depth plane. Only photometric
surveys with a minimum of 5 filters and covering 0.5 square degree at least (with the exception
of CADIS) are shown. Circles correspond to broad band photometric surveys, stars to
spectroscopic surveys, and squares to CADIS, COMBO-17 and ALHAMBRA. Empty circles
correspond to NIR imaging surveys.

– 36 –
expect to be 60% complete down to I = 24.7 mag with accurate z-determination, with a
median redshift of 0.74. In Figure 17, we have plotted the expected global performance of
different spectroscopic surveys in terms of surveyed volume and number of objects with good
SED and redshift determinations. The ALHAMBRA-Survey appears close to the SDSS in
terms of number of detected objects, and close to the deepest surveys in terms of its median
redshift.
Another important advantage for the ALHAMBRA-survey is the spectral range covered.
It is in fact the only survey covering the whole optical domain, from 3500 A to 9700 A,
plus the 3 standard NIR bands. This implies that we are sensitive, within the detection
limits, to any kind of object at any redshift. This not only avoids the presence of selection
functions, but, more important, will straightforwardly allow the comparative analysis of data
at different redshift values.
We have compiled in Table 2 the relevant data for the spectroscopic surveys plotted
in Figure 17 (the number of objects in the ALHAMBRA survey is given for ∆z/(1 + z) ≤
0.03 and, in parenthesis, ≤ 0.015). For surveys with a similar (even if smaller) spectral
coverage, like SDSS or 2dFGRS, the ALHAMBRA-Survey will be 7.8 and 6.7 magnitudes
deeper, respectively, what will allow, in particular, for a detailed analysis of the distant/faint
Universe. At the other extreme, surveys like VVDS or DEEP2 that are not too far from the
ALHAMBRA-Survey in terms of limit magnitude (even if they are shallower by 1.2 and 2.7
magnitudes, respectively), have significantly shorter spectral coverage than ALHAMBRA in
the optical domain, and do not include near-IR information.
Hickson & Mulrooney (1998) presented the first results of the medium band photometric
survey proposed by Hickson et al. (1994). We notice that the survey used more filters than
ALHAMBRA, thus giving a finer spectral sampling, but their spectral coverage is shorter,
from 4450 to 9480A. The observing conditions were such that the survey could only reach m
≈20.4, at the 50% completeness limit. Thus, even if similar in many aspects to our survey,
a real comparison cannot be made given the bright detection limit they achieved.
In relation with other medium band photometric surveys, covering the whole spectral
range, we have mentioned COMBO-17 and CADIS—which has also has made use of one of
the Calar Alto telescopes—that comprise a mixed set of broad and narrow band filters. The
complete spectral coverage is assured only by the broad band filters. Their specificity relies
on the use of narrow filters located at some given fixed positions. The total area that they
cover (1 and 0.2 square degrees respectively), the photometric depth, and the lack of near-IR
information, are also important differences with the ALHAMBRA-Survey.
Yet another project making use of photometric redshifts and covering very large areas of

– 37 –
Fig. 17.— Number of detected objects with accurate redshift versus the surveyed volume for
spectroscopic surveys covering 0.5 square degrees at least, and the ALHAMBRA-Survey. We
have considered a median redshift of 0.02 for CfA2 and IRAS/PSCz, 0.08 for LCRS, 0.1 for
SDSS/DR6 and 2dF, 0.7 for VVDS, 1.0 for DEEP2, and 0.63 and 0.74 for ALHAMBRA-90
(complete at the 90% level) and ALHAMBRA-60 (complete at the 60% level) respectively.
The plotted ALHAMBRA data are for ∆z/(1 + z) ≤ 0.03.

– 38 –
the sky, but with depth less than z ∼ 0.7, is MegaZ-LRG (Collister et al. 2007), containing
about a million SDSS luminous red galaxies, lying in a region of 5915 square degrees, with
limiting magnitude i < 20. This catalog, with a surveyed volume of about 2.5 h−3 Gpc3, has
been recently used to measure cosmological parameters from the large scale structure in a
way competitive with the shallow wide-angle spectroscopic surveys (Blake et al. 2007). We
must remark that an M⋆ galaxy lying at redshift z ∼ 1.4 will be included in ALHAMBRA,
since its visual magnitude should be about 24. At this redshift, the whole ALHAMBRA
survey covering 4 square degrees will produce a volume of about 3 × 10⁷ h−3Mpc3.
Other ongoing projects are the ESO/VST KIDS that will cover 1400 square degrees
making use of images in 4 broad bands. Its major goal will be the study of weak lensing,
although it should also be a good sample to study baryonic acoustic oscillations (Peacock
et al. 2006), and the Dark Energy Survey, that makes use of a new camera on the CTIO
4m telescope. This survey will cover 5000 square degrees, but no near-IR observations are
planned. Farther into the future, the LSST plans to map about half of the sky in the
standard broad bands ugrizy to obtain about 3 × 10⁹ photometric redshifts. The first light
of this project is scheduled for 2012, and as Peacock et al. (2006) have pointed out, the lack
of near-IR information may be an issue.
Different research projects devoted to the study of the evolution of galaxies across the
Hubble time will get great advantage from the ALHAMBRA survey, when the complete
catalog is released as publicly available. For example, this survey will increase the reliability
of the present studies of the growth of the population of red galaxies since z ∼ 1 (Ford
et al. 2006) or the evolution with redshift of the color-density relation (Cucciati et al. 2006,
Cooper et al. 2007). Other field where a deep and wide catalog like ALHAMBRA will be
very useful is the analysis of the assembly history of red galaxies (Brown et al. 2008) or field
spheroidals (Treu et al. 2005). Similarly, the ALHAMBRA survey covers enough area and is
deep enough to trace accurately the evolution of the luminosity function for different spec-
tral types (Poli et al. 2003, Treu et al. 2005, Wolf et al. 2003, Zucca et al. 2006, Marchesini
et al. 2007) and the growth of stellar mass with cosmic time (Borch et al. 2006).
All in all, we can say that even if ALHAMBRA is a photometric survey, it shares impor-
tant aspects with the spectroscopic surveys, with which it compares well in many respects.
Its advantages, depending on the proposed goals, are the complete spectral coverage, the
homogeneity in the detection level along the spectrum, and the depth.

– 39 –
5. Final Considerations
The ALHAMBRA-Survey places itself halfway between relatively shallow, limited spec-
tral coverage, wide-area spectroscopic surveys, and deep, large area, broad band photometric
surveys. Trying to optimally combine the advantages of each kind of survey, we intend to
observe a large area (4 �) using a specially designed set of 20 medium band, minimally
overlapping filters covering the whole visible range from 3500 A to 9700 A, plus the standard
JHKs near infrared filters. It will provide homogeneous data down to AB ≈ 25 for all the
filters from 3500A to 8500A, with a magnitude limit of AB = 23.2 at 9550 A. The filter
characteristics where decided to allow us to detect even relatively faint emission features
(observed EW ≥ 30A).
Together with the NIR information to Ks ≈ 20, H ≈ 21, J ≈ 22 (in the Vega system),
this will allow the measurement of the redshift and SED for several hundred thousand objects.
Indeed, the survey was designed having in mind the use of photometric redshift techniques
as the basic analysis tool. We have carried out detailed simulations based on available deep
catalogs. We expect that the ALHAMBRA-Survey will be able to produce high-quality
redshifts and accurate spectral types for more than 600,000 galaxies down to IAB ≈ 24.7,
with redshift accuracy ∆z/(1+z) ≈ 0.015. The first data and preliminary results we present
here confirm that these expectations are realistic.
With its volume surveyed, median redshift and number of objects with accurate redshift
and SED determination, the ALHAMBRA-Survey will provide a unique set of data for many
different studies in different astrophysical and cosmological domains.
The main objective of our survey is the study of cosmological evolution, under the many
facets it can offer. We will study the evolution of the large scale structure, the number and
content of clusters at different redshifts, the evolution of the populations of different cosmic
Table 3: Main characteristics of wide field (≥ 0.5 square degrees) spectroscopic surveys
Survey Area � Spectral range (A) z (median) Nobjects
CfA/SRSS 18000 4300-6900 0.02 1.8 × 10⁴
SDSS/DR6 6860 3800-9200 0.1 7.9 × 10⁵
LCRS 700 3350-6750 0.1 2.6 × 10⁴
2dFGRS 2000 3700-8000 0.11 2.2 × 10⁵
VVDS 16 5500-9500 0.7 1.0 × 10⁵
DEEP2 3.5 6500-9100 1.0 5.5 × 10³
ALHAMBRA-60 4 3500-9700 (+JHK) 0.74 6.6 (3.0) × 105
ALHAMBRA-90 4 3500-9700 (+JHK) 0.63 3.5 (1.0) × 105

– 40 –
objects, and the processes leading to galaxy formation, evolution, and differentiation. The
unbiased nature of the survey will also allow for the study of many different kinds of objects,
ranging from emission-line galaxies to the diverse types of AGNs, and stars in our own
Galaxy.
We acknowledge the decisive support given by the ALHAMBRA Extended Team to the
project (see http://www.iaa.es/alhambra for the details regarding the project implementa-
tion and organization). We also wish to acknowledge the Calar Alto staff for their warm assis-
tance for a fruitful start of the observations. We acknowledge the work of C. Cardenas to mea-
sure the filter characteristics and of V. Peris for his work to produce the combined pictures
out of the ALHAMBRA images. We thank our anonymous referee, whose comments helped
to improve the clarity and quality of our manuscript. The authors acknowledge support from
the Spanish Ministerio de Educacion y Ciencia through grants AYA2002-12685-E, AYA2003-
08729-C02-01, AYA2003-0128, AYA2004-08260-C03-01, AYA2004-20014-E, AYA2004-02703,
AYA2004-05395, AYA2005-06816, AYA2005-07789, AYA2006-14056, and from the Junta de
Andalucıa, TIC114, TIC101 and Proyecto de Excelencia FQM-1392. NB, JALA, MC, and
AFS acknowledge support from the MEC Ramon y Cajal Programme. NB acknowledges sup-
port from the EU IRG-017288. This work has made use of software designed at TERAPIX
and the Canadian Astronomy Data Centre.
REFERENCES
Adelman-McCarthy, J. K., et al. 2007, ApJS, 172, 634
Alcala, J. M., et al. , 2002, Proc. SPIE, 4836, 406
Baum, W.A., 1962, IAU Symp. 15, 390
Becker, R. H., et al. , 2001, AJ, 122, 2850
Beckwith, S. V. W., et al. 2006, AJ, 132, 1729
Bell, E.F., et al. 2004, ApJ 608, 752
Benıtez, N., 2000, ApJ, 536, 571
Benıtez, N. et al, 2004, ApJS, 150, 1
Benıtez, N. et al, 2008, A&A, submitted

– 41 –
Bertin, E., & Arnouts, S. 1996, A&AS, 117, 393
Blake, C.A., Collister, A.A., Bridle, S.L., Lahav, O., 2007, MNRAS, 374, 1527
Borch, A., et al. , 2006, A&A, 453, 869
Bradley, L. D., et al. 2008, ApJ, 678, 647
Brown, M., et al. , 2008, ApJ, in press (astro-ph:0804.2293)
Coe, D. et al. , 2006, AJ, 132, 926
Coleman, G. D., Wu, C.-C., Weedman, D. W., 1980, ApJS, 43, 393
Colless, M., et al. , 2001, MNRAS, 328, 1039
Collister, A., et al. , 2007, MNRAS, 375, 68
Connolly, A. J., Csabai, I., Szalay, A. S., Koo, D. C., Kron, R. G., & Munn, J. A. 1995, AJ,
110, 2655
Connolly, A. J., Szalay, A. S., Dickinson, M., Subbarao, M. U., & Brunner, R. J. 1997, ApJL,
486, 11
Cooper, M.C., et al. , 2007, MNRAS, 376, 1445
Cucciati, O. et al., 2006, A&A, 458, 39
Davis, M. et al, 2003, SPIE, 4834, 161
Ferguson, H. C., Dickinson, M., & Williams, R. 2000, ARA&A, 38, 667
Fernandez-Soto, A., Lanzetta, K.M., & Yahil, A., 1999, ApJ, 513, 34
Fernandez-Soto, A., Lanzetta, K.M., Chen, H.-W., Pascarelle, S.M., & Yahata, N., 2001,
ApJS, 135, 1, 41
Ford, H., et al. , 2006, IAU Symposium 235, in press
Fukugita, M., Ichikawa, T., Gunn, J.E., Doi, M., Shimasaku, K., & Schneider, D.P., 1996,
AJ, 111, 1748
Gregg, M. D., et al. , 2004, Bulletin of the American Astronomical Society, 36, 1496;
http://lifshitz.ucdavis.edu/∼mgregg/gregg/ngsl/ngsl.html
Hickson, P., Gibson, B.K., Callaghan, K.A S., 1994, MNRAS, 267, 911

– 42 –
Hickson, P., Mulrooney, M. K., 1998, ApJS, 115, 35
Hildebrandt,, H., Wolf, C., Benıtez, N., 2008, A&A, 480, 703
Ilbert, O. et al., 2006, A&A, 457, 841
Kashikawa, N., et al. , 2006, ApJ, 648, 7
Kawai, N., et al. , 2006, Nature, 440, 184
Kitching et al. , 2007, MNRAS 376, 771
Koo, D.C., 1986, ASSL, 122, 419
Lanzetta, K.M., Yahil, A., & Fernandez-Soto, 1996, Nature, 381, 751
Le Fevre, O. et al, 2005, A&A, 439, 845
Lilly et al. , 2007, APJS, 172, 70
Loh, E.D., Spillar, E.J., 1986, ApJ, 303, 154
Marchesini, D., et al. , 2007, ApJ, 656, 42
Marquez, I., & Moles, M., 1996, A&ASS, 119, 1
Massey, P., &Gronwall, C., 1990, ApJ, 358, 344
Meisenheimer, K., et al. , 1998, in The Young Universe: Galaxy Formation and Evolution
at Intermediate and High Redshift. Edited by S. D’Odorico, A. Fontana, and E.
Giallongo. ASP Conference Series; Vol. 146; 1998, p.134
Mobasher et al. , 2007, APJS, 172, 117
Moles, M., et al. , 2005, ArXiv Astrophysics e-prints (astro-ph/0504545)
Monet, D. G., et al. , 2003, AJ, 125, 984
Oke, J.B., 1990, AJ, 99, 1621
Oke, J.B., Gunn, J.E., 1983, ApJ, 266, 713
Peacock, J. et al. , 2006, Report by the ESA-ESO on Fundamental Cosmology
(astro-ph/0610906)
Phleps et al. , 2006, A&A 457, 145

– 43 –
Poli, F., et al. , 2003, ApJL, 593, 1
Schlegel, D.J., Finkbeiner, D.P., Davis, M., 1998, ApJ, 500 525
Smith, J.A. et al. , 2002, AJ, 123, 2121
Stanford, S. A., Eisenhardt, P. R. M., & Dickinson, M. 1995, ApJ, 450, 512
Stone, R.P.S., 1996, ApJS, 107, 423
Treu, T., et al. , 2005, ApJ, 633, 174
Valdes, F. G. 2002, Automated Data Analysis in Astronomy, 309
Wolf, C., Maisenheimer, K,, Roser, H.-J., 2001a, A&A, 365, 660
Wolf, C. et al. , 2001b, A&A, 365, 861
Wolf, C. et al. , 2003, A&A, 401, 73
Wolf, C. et al. , 2004, A&A, 421, 913
York, D.G. et al. , 2000, AJ, 120, 1579
Zucca, E. et al. , 2006, A&A, 455, 879
This preprint was prepared with the AAS LATEX macros v5.0.