THE SPECTROSCOPIC ANALYSIS OF 2,4 - DergiPark
26
Anadolu Üniversitesi Bilim ve Teknoloji Dergisi A- Uygulamalı Bilimler ve Mühendislik Anadolu University Journal of Science and Technology A- Applied Sciences and Engineering 2016 - Volume: 17 Number: 4 Page:677-702 DOI: 10.18038/aubtda.267115 Received: 30 June 2016 Revised: 27 October 2016 Accepted: 04 November 2016 THE SPECTROSCOPIC ANALYSIS OF 2,4'-DIBROMOACETOPHENONE MOLECULE BY USING QUANTUM CHEMICAL CALCULATIONS Etem KÖSE * Department of Physics, Manisa Celal Bayar University, Manisa, Turkey ABSTRACT A spectroscopic investigation, used quantum chemical calculations, of 2,4'-dibromoacetophenone (2,4'-DBrA) molecule have been obtained in this paper. The calculations were supported the experimental results by IR, 1 H and 13 C NMR techniques. Geometrical parameters and optimized energies of 2,4'-DBrA molecule were performed by density functional theory (DFT) B3LYP method 6-311++G(d,p) basis sets. After the geometry optimization of 2,4'-DBrA the vibrational spectra were obtained for this structure. The fundamental vibrations were assigned to base on potential energy distribution (PED) of the vibrational modes by using VEDA 4 (Vibrational Energy Distribution Analysis) program. Density of states for total (TDOS), partial (PDOS) and also overlap population (OPDOS) analysis were obtained. 1 H and 13 C NMR chemical shifts were recorded by using the gauge-invariant atomic orbital (GIAO) method. Besides, electronic properties, such as HOMO and LUMO energies, were performed by time-dependent density functional theory (TD-DFT). Also, molecular electrostatic potential surface (MEPs) and thermodynamic properties were calculated for title molecule. The results are showed consistent with the obtained experimental results. Keywords: 2,4'-dibromoacetophenone; DFT; FT-IR; NMR; MEPs 1. INTRODUCTION Acetophenone and its derivatives have interesting biological, physicochemical and photochemical properties [1–3], also have very important pharmaceutical applications [4–10]. Acetophenone were exist in nature [11,12] and can be also acquired through the medium of various synthesis procedure [13,14]. The crystal structure of α-bromoacetophenone [15], 2'amino-5'-bromoacetophenone [16], ortho-hydroxy acetophenones derivatives [17], 4-hydroxy-3-(3-methyl-2-butenyl) acetophenone [18] were identified. There is seen in literature DFT studies of acetophenone and its derivatives such as; conformational analysis of acetophenone and α-substituted acetophenones were studied [19], the photodissociations of acetophenone was investigated [20], conformational stability of 4-hydroxy-3- methylacetophenone and 4-hydroxy-3-methoxyacetophenone and their vibrational spectra were analyzed [21], growth and characterization papers of 2-bromo-4-chloroacetophenone was published [22], structural and vibrational investigations of 5-fluro-2-hydroxyacetophenone was prepared [23], molecular properties and vibrational studies, and HOMO-LUMO energies of 3-bromoacetophenone were obtained by quantum chemical calculations [24], the detailed theoretical and experimental investigation (FT-IR and FT-Raman) of 3-aminoacetophenone [25], vibrational spectral investigation and, optimized parameters were computed for 4-chloro-2-bromoacetophenone [26], and 2,4- difluoroacetophenone molecule has a detailed spectroscopic studies [27,28]. *Corresponding Author: [email protected]
-
Upload
khangminh22 -
Category
Documents
-
view
3 -
download
0
Transcript of THE SPECTROSCOPIC ANALYSIS OF 2,4 - DergiPark

Anadolu Üniversitesi Bilim ve Teknoloji Dergisi A- Uygulamalı Bilimler ve Mühendislik
Anadolu University Journal of Science and Technology A- Applied Sciences and Engineering
2016 - Volume: 17 Number: 4 Page:677-702
DOI: 10.18038/aubtda.267115
Received: 30 June 2016 Revised: 27 October 2016 Accepted: 04 November 2016
THE SPECTROSCOPIC ANALYSIS OF 2,4'-DIBROMOACETOPHENONE MOLECULE BY
USING QUANTUM CHEMICAL CALCULATIONS
Etem KÖSE*
Department of Physics, Manisa Celal Bayar University, Manisa, Turkey
ABSTRACT
A spectroscopic investigation, used quantum chemical calculations, of 2,4'-dibromoacetophenone (2,4'-DBrA) molecule have
been obtained in this paper. The calculations were supported the experimental results by IR, 1H and 13C NMR techniques.
Geometrical parameters and optimized energies of 2,4'-DBrA molecule were performed by density functional theory (DFT)
B3LYP method 6-311++G(d,p) basis sets. After the geometry optimization of 2,4'-DBrA the vibrational spectra were
obtained for this structure. The fundamental vibrations were assigned to base on potential energy distribution (PED) of the
vibrational modes by using VEDA 4 (Vibrational Energy Distribution Analysis) program. Density of states for total (TDOS),
partial (PDOS) and also overlap population (OPDOS) analysis were obtained. 1H and 13C NMR chemical shifts were
recorded by using the gauge-invariant atomic orbital (GIAO) method. Besides, electronic properties, such as HOMO and
LUMO energies, were performed by time-dependent density functional theory (TD-DFT). Also, molecular electrostatic
potential surface (MEPs) and thermodynamic properties were calculated for title molecule. The results are showed consistent
with the obtained experimental results.
Keywords: 2,4'-dibromoacetophenone; DFT; FT-IR; NMR; MEPs
1. INTRODUCTION
Acetophenone and its derivatives have interesting biological, physicochemical and photochemical
properties [1–3], also have very important pharmaceutical applications [4–10]. Acetophenone were
exist in nature [11,12] and can be also acquired through the medium of various synthesis procedure
[13,14]. The crystal structure of α-bromoacetophenone [15], 2'amino-5'-bromoacetophenone [16],
ortho-hydroxy acetophenones derivatives [17], 4-hydroxy-3-(3-methyl-2-butenyl) acetophenone [18]
were identified. There is seen in literature DFT studies of acetophenone and its derivatives such as;
conformational analysis of acetophenone and α-substituted acetophenones were studied [19], the
photodissociations of acetophenone was investigated [20], conformational stability of 4-hydroxy-3-
methylacetophenone and 4-hydroxy-3-methoxyacetophenone and their vibrational spectra were
analyzed [21], growth and characterization papers of 2-bromo-4-chloroacetophenone was published
[22], structural and vibrational investigations of 5-fluro-2-hydroxyacetophenone was prepared [23],
molecular properties and vibrational studies, and HOMO-LUMO energies of 3-bromoacetophenone
were obtained by quantum chemical calculations [24], the detailed theoretical and experimental
investigation (FT-IR and FT-Raman) of 3-aminoacetophenone [25], vibrational spectral investigation
and, optimized parameters were computed for 4-chloro-2-bromoacetophenone [26], and 2,4-
difluoroacetophenone molecule has a detailed spectroscopic studies [27,28].
*Corresponding Author: [email protected]

Köse / Anadolu Univ. J. of Sci. and Technology – A – Appl. Sci. and Eng. 17 (4) - 2016
678
There is no similar studies about the 2,4'-DBrA molecule in the literature by utilized DFT calculations
until now. So, an effort has been made about the geometrical, vibrational spectral evaluations, TDOS,
PDOS, OPDOS analysis, 13C and 1H NMR chemical shifts calculations, electronic properties,
molecular electrostatic potential surface (MEPs) and thermodynamic properties of 2,4'-DBrA were
performed. The results are showed consistent with the obtained experimental results. This paper there
will be important and considerable information before the synthesis new molecule and drug design and
pharmaceutical applications.
2. THEORETICAL AND EXPERIMENTAL DETAILS
The infrared and (1H and 13C) NMR spectra of 2,4'-DBrA molecule were received from Spectral
Database for Organic Compounds, SDBS as experimentally [29]. Theoretical calculations were done
by utilized the Gaussian 09 program codes [30]. Geometric, vibration, and magnetic resonance
analysis, atomic charges, dipole moment, thermodynamic properties, etc. were presented herein. The
DFT [31] with the Becke’s three-parameter hybrid functional (B3) [32,33] for the exchange part and
the Lee–Yang–Parr (LYP) correlation function [34] was preferred, due to the a cost-effective approach
its great accuracy in experimental values. The assignments of fundamental vibrational frequencies
were made by VEDA program [35] according to their PEDs, and by Gauss view program [36] used
visual animation. The time-dependent DFT (TD-DFT) method [37,38] with same basis set is utilized
to calculate some electronic properties (UV–Vis spectra, excitation energies…). GIAO method [39,40]
is one of the most common approach for nuclear magnetic shielding properties. Therefore, 1H and 13C
NMR isotropic chemical calculations were obtained with the GIAO method based on optimized
structure. The density of states (DOS) graphs; such as TDOS, PDOS and OPDOS of the studied
molecule were prepared by using GaussSum 2.2 program [41]. The Mulliken atomic charges, MEPs,
thermodynamic and NLO properties of 2,4'-DBrA molecule were given herein for the detailed
physical and chemical information.
3. RESULTS AND DISCUSSION
Studied molecule has two substituent the first one COCH2Br group and second Br (bromine) atom at
para position. There is no seen an imaginary frequency at the Cs point group symmetry. Thence, the
calculations were done based on the Cs symmetry group (see Table 1).
Table 1. The calculated energy and some thermodynamical parameters of 2,4'-DBrA at 298.15 K in
ground state at the B3LYP/6-311++G(d,p) level
Parameters Cs symmetry
Energy (Hartree) -5532.079123290
Energy (kcal/mol) -3471432.205
Zero point vib. energy (kcal mol-1) 73.83045
Rotational constants (GHz) 3.16722
0.14254
0.13652
Specific heat, Cv (cal mol-1 K-1) 37.064
Entropy, S (cal mol-1 K-1) 108.338
Dipole moment (Debye) 3.3054
Imaginary frequencies no

Köse / Anadolu Univ. J. of Sci. and Technology – A – Appl. Sci. and Eng. 17 (4) - 2016
679
3.1. Potential Energy Surface (PES) Scan
The conformational analysis was done to see the most stable structure of the 2,4'-DBrA molecule. The
torsion angles, between phenyl ring and COCH2Br group, τ(C14–C13–C3–C4), changed every 100 (from
00 to 3600) by DFT/B3LYP method and 6-311++G(d,p) basis set. The obtained results indicate that
there are three local minima near 00, 1800, and 3600 as seen Figure 1. The molecule was more stable
for near these local (predicted as a global minima) minima. The optimized structures are controlled
result of scan. The dihedral angles, τ(C3–C4–C13–C14), τ(C3-C4-C13-O12), τ(Br11-C1-C6-C5), and τ(C4-
C13-C14-Br17) etc. (predicted at 00, and 1800, respectively) showed that the molecule has the Cs
symmetry. All predictions of molecule for molecular structure, vibrational, NMR and electronic
properties were obtained the most stable structure, chosen Cs point group symmetry.
Figure 1. PES scan of selected degree T(H12–N10– C1–C2) of 2,4'-DBrA
3.2. Geometrical structures
The thermodynamical properties and energies of the headline molecule were given in Table 1 for CS
point group symmetry. The crystal structure of the 2,4'-DBrA has been not reached in the literature.
For this reason, optimized geometric structural parameters were compared with the similar structure
[15]. The optimized structure of the 2,4'-DBrA molecule was given as Figure 2 showing with the
names and numbers of atoms. The results of optimized parameters of the studied molecule were listed
in Table 2, based on the names and numbers of Figure 2.
The C–C bonds were predicted from 1.388 to 1.401 Å theoretically for present molecule. The
experimental values were recorded from 1.373 to 1.429 Å, for -bromoacetophenone (-BA)
molecule [15]. The C–C bonds were recorded from 1.375 to 1.398 Å for HF, from 1.389 to 1.412 Å
for B3LYP and 1.384 to 1.403 Å for LSDA [28]. For 2,4-difluoroacetophenone, these bonds were
predicted from 1.375 to 1.398 Å by using B3LYP method 6-311++G(d,p) basis set [27]. There are
seen little differences angles slightly out of perfect hexagonal structure in the phenyl ring. It is due to
the substitutions of the bromine atom, oxygen atom and CH2Br groups in the place of H atoms (see
Table 2). The results of C–C bonds lengths are very good correlated with the literature
[6,7,15,18,21,25–28] for the structurally similar molecules.

Köse / Anadolu Univ. J. of Sci. and Technology – A – Appl. Sci. and Eng. 17 (4) - 2016
680
The halogens F, Cl, Br… have a role in the molecule as substituent in place of hydrogen atom these
bond lengths (C-X) show a remarkable increment. The C–Br bond lengths were predicted 1.912 Å (for
C–Br11) and 1.951 Å (for C–Br17), by using DFT/B3LYP method with 6-311++G(d,p) basis set. The
bond C–Br17 were observed at 1.929 Å for -bromoacetophenone molecule [15]. The C–Br bond
lengths show small differences in literature [15] according to location of halogen Br atoms in present
molecule. The C–Br bond were predicted 1.917 Å for 5-bromosalicylic acid [42] 1.921 Å for 3-
bromophenylboronic acid [43] 1.922 Å and 1.920 Å 2/6-bromonicotinic acid molecules [44]. These
bonds (at the para position) are very closely in literature (above), due to the similar structures.
There are seen some deviation both endohedral and exohedral angles; such as the angles of C-C-C and
C-C-H bonds were differed from normal value of ring angle 120.0º. These deviations can be caused by
the substitutions, Br atoms and COCH2Br group. The dihedral angles were predicted (C3-C4-C13-C14)
as 0.0º, (C3-C4-C13-O12) as 180.0º, and (Br11-C1-C6-C5) as 180.0º for studied molecule. These state
show that stable structure must be planer and Cs symmetry group symmetry. Reminding as; the
theoretical results belong to vapor phase, there have been some acceptable differences from the
experimental results.
Table 2. The experimental for -bromoacetophenone (-BA) and optimized bond lengths (Å) and
angles (º) molecule for 2,4'-DBrA molecule by using B3LYP/6-311++G(d,p) method
Parameters Exp.a 2,4'-DBrA
Parameters Exp.a 2,4'-DBrA
Bond Lengths (Å) -BA Bond Angles (º) -BA
C1-C2 1.373 1.392 C3-C4-C13 119.2 123.5
C1-C6 1.397 1.394 C5-C4-C13 125.6 117.7
C1-Br11
1.912 C4-C5-C6 122.7 121.0
C2-C3 1.401 1.392 C4-C5-H9 - 118.5
C2-H7 - 1.082 C6-C5-H9 - 120.5
C3-C4 1.429 1.401 C1-C6-C5 116.4 119.1
C3-H8 - 1.083 C1-C6-H10 - 120.3
C4-C5 1.391 1.402 C5-C6-H10 - 120.6
C4-C13 1.486 1.502 C4-C13-O12 122.5 121.2
C5-C6 1.393 1.388 C4-C13-C14 119.5 116.4
C5-H9 - 1.083 O12-C13-C14 117.5 122.4
C6-H10 - 1.082 C13-C14-H15 - 110.4
O12-C13 1.258 1.209 C13-C14-H16 - 110.4
C13-C14 1.552 1.529 C13-C14-Br17 111.5 113.6
C14-H15 - 1.090 H15-C14-H16 - 108.7
C14-H16 - 1.090 H15-C14-Br17 - 106.8
C14-Br17 1.929 1.951 H16-C14-Br17 - 106.8
Bond Angles (º) Selected Dihedral Angles (º)
C2-C1-C6 122.8 121.3 C3-C4-C13-O12 - 180.0
C2-C1-Br11 - 119.3 C3-C4-C13-C14 - 0.0
C6-C1-Br11 - 119.4 Br11-C1-C6-C5 - 180.0
C1-C2-C3 118.0 119.1 Br11-C1-C2-C3 - 180.0
C1-C2-H7 - 120.4 C4-C13-C14-H15 - -60.1
C3-C2-H7 - 120.5 C4-C13-C14-H16 - 60.1
C2-C3-C4 120.7 120.9 C4-C13-C14-Br17 - 180.0
C2-C3-H8 - 118.2 O12-C13-C14-H15 - 119.9
C4-C3-H8 - 121.0 O12-C13-C14-H16 - -119.9
C3-C4-C5 120.2 118.8 O12-C13-C14-Br17 - 0.0
aThe X-Ray data from ref. [15]
Köse / Anadolu Univ. J. of Sci. and Technology – A – Appl. Sci. and Eng. 17 (4) - 2016
681
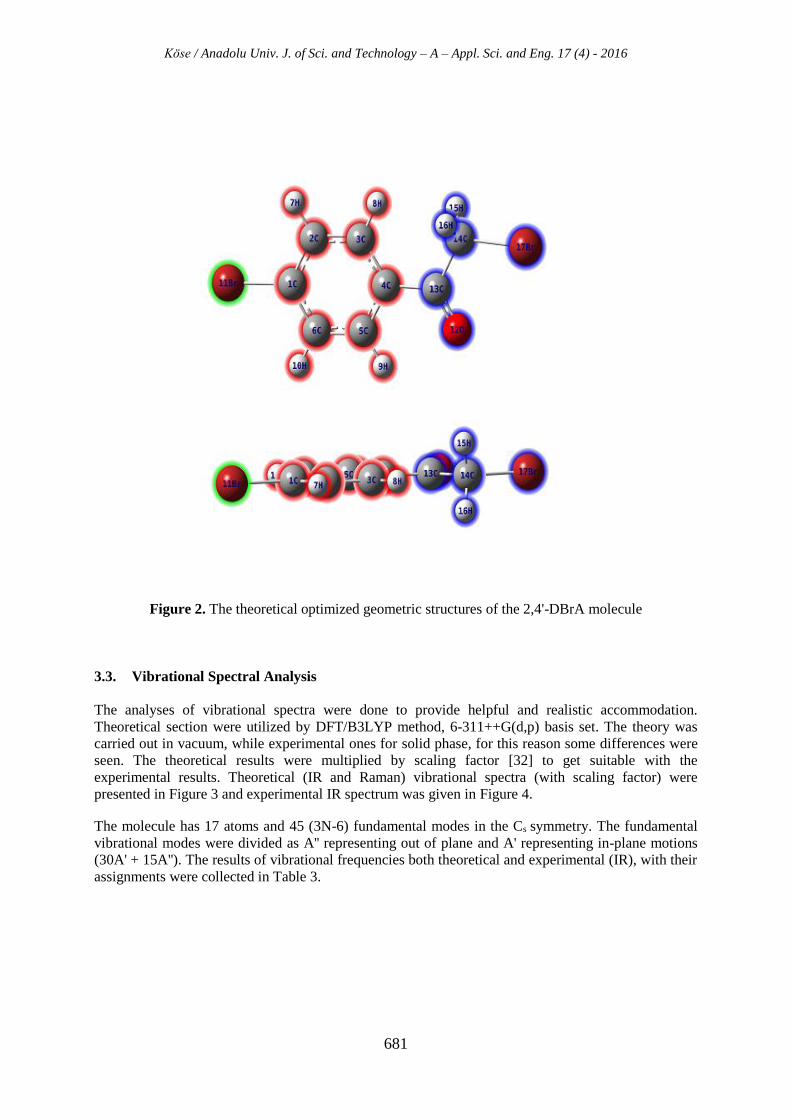
Figure 2. The theoretical optimized geometric structures of the 2,4'-DBrA molecule
3.3. Vibrational Spectral Analysis
The analyses of vibrational spectra were done to provide helpful and realistic accommodation.
Theoretical section were utilized by DFT/B3LYP method, 6-311++G(d,p) basis set. The theory was
carried out in vacuum, while experimental ones for solid phase, for this reason some differences were
seen. The theoretical results were multiplied by scaling factor [32] to get suitable with the
experimental results. Theoretical (IR and Raman) vibrational spectra (with scaling factor) were
presented in Figure 3 and experimental IR spectrum was given in Figure 4.
The molecule has 17 atoms and 45 (3N-6) fundamental modes in the Cs symmetry. The fundamental
vibrational modes were divided as A'' representing out of plane and A' representing in-plane motions
(30A' + 15A''). The results of vibrational frequencies both theoretical and experimental (IR), with their
assignments were collected in Table 3.

Köse / Anadolu Univ. J. of Sci. and Technology – A – Appl. Sci. and Eng. 17 (4) - 2016
682
Figure 3. The calculated FT-IR and FT-Raman spectra of (with the scale factor) 2,4'-DBrA
Figure 4. The experimental IR spectra of 2,4'-DBrA

Köse / Anadolu Univ. J. of Sci. and Technology – A – Appl. Sci. and Eng. 17 (4) - 2016
683
Table 3. Comparison of the calculated harmonic frequencies and experimental (IR) wavenumbers
(cm-1) using by B3LYP method 6-311++G(d,p) basis set of 2,4'-DBrA molecule
Mod
e
No
Sym.
Specie
s
Theoretical Exp. Assignments
Unscaled
freq.
Scaled
freq.a FT-IR PEDb (10%)
ν1 A' 3208 3073 3084 CHringsym. (100)
ν2 A' 3206 3071 3059 CHringsym. (100)
ν3 A' 3195 3061
CHringasym (99)
ν4 A' 3187 3053
CHringasym (100)
ν5 A" 3136 3004 3000 CH2asym (100)
ν6 A' 3080 2951 2951 CH2sym (100)
ν7 A' 1767 1693 1692 C=O (90)
ν8 A' 1621 1594 1588 CC (62), i.p. CH[CCH (19), CCC (18)]
ν9 A' 1600 1572 1567 CC (61), i.p. CH[CCH (26), CCC (10)]
ν10 A' 1513 1487 1484 i.p. CH [CCH (63), CCC (19)], CC (15)
ν11 A' 1441 1416
CH2 (88)
ν12 A' 1423 1399 1397 CC (42), i.p. CH[CCH (41), CCC (11)]
ν13 A' 1332 1309 1309 i.p. CH[CCH (62)], CC (27)
ν14 A' 1321 1298 1292 ring def. [CC (70)], i.p. CH [CCH (24)]
ν15 A' 1294 1272 1272 CH [CCCH (53), CC (25)]
ν16 A' 1211 1190 1198 i.p. CH [CCH (43), CC (35)]
ν17 A' 1197 1177 1177 i.p. CH + CH2 [CCH (45), CCC (11)], CC (29)
ν18 A" 1157 1138 1161 CH2[CCBr (80), CCCH (11)]
ν19 A' 1133 1114 1114 i.p. CH [CCH (54)], CC (35)
ν20 A' 1083 1065 1072 CC (67), CCH (15), CBr (12)
ν21 A' 1027 1010 1005 ring def. [CCC (78), CC (11)]
ν22 A" 1004 987 991 CH [CCCH (85), CCCC (14)]
ν23 A' 992 975 973 CC (48), CH2 [CCC (25), CCO (16)]
ν24 A" 971 954
CH [CCCH (78), CCCC (15)]
ν25 A" 908 892
CH [CCCH (57)], CH2 [CCCO (24), CCCC (10)]
ν26 A" 850 835 823 CH [CCCH (94)]
ν27 A" 822 808 808 CH [CCCH (76), CCCC (13)]
ν28 A' 785 771 781 ring breath. CC (47), CCC (30)
ν29 A' 722 710 717 CBr (27), CCC (30), CCO (15), CCBr (14)
ν30 A" 719 707
CH [CCCC (72), CCCH (16)]
ν31 A' 651 640 649 CBr (45), CCO(12), ring breath. CCC (28), CC (10)]
ν32 A' 640 629
ring def.[ CCC (75), CC (12)]
ν33 A" 561 552 546 CH2[CCCO(28), CCCBr (21)], CCCH (17), CCCC
(27)
ν34 A' 493 485 497 CC (38), CCC (26), CBr (17), CCO (14)
ν35 A" 457 450
CH2[CCCBr (31) CCCO (17)], CCCC (26), CCCH
(23)
ν36 A" 412 405
CH [CCCC (86), CCCH (14)]
ν37 A' 367 361
CCC (40),CBr (32), CCBr (12)
ν38 A' 284 279
CCC (37),CBr (24), CCBr (27)
ν39 A" 241 237
CCCC (49), CCCBr (35), CCCO (12)
ν40 A' 216 212
horse riding [CBr (61), CCC (17), CCO (11)]
ν41 A' 158 155
CC (22), CCC (18), CBr (25), CCBr (34)
ν42 A' 87 85
CCC (62), CCBr (28)
ν43 A" 85 84
CH2 [CCCC (48), CCCBr (34)], CCCH (11)
ν44 A" 60 59
CH2 [CCCC(74), CCCBr (17)]
ν45 A" 27 27
CCCC (61) CCCBr (36) aWavenumbers in the ranges from 4000 to 1700 cm-1 and lower than 1700 cm-1 are scaled with 0.958 and
0.983 for B3LYP/6-311++G(d,p) basis set, respectively. bPED: Potential Energy Distribution ; stretching, ; out-of plane bending,; in-plane-bending, ; torsion, ;
scissoring, ; wagging, ; twisting, ; rocking.
Köse / Anadolu Univ. J. of Sci. and Technology – A – Appl. Sci. and Eng. 17 (4) - 2016
684
3.3.1. Stretching modes
C–H stretching vibrations were come in view characteristic region between 3000 and 3100 cm–1.
Similar molecules, having the C–H stretching in literature [21–27], modes, show multiple peaks in
range of ca. 3000–3100 cm−1 for aromatic ring. The C–H stretching modes were also seen the methyl
group (CH3) was shaped as methylene (CH2) since one of the H atom replaced by Br atom. These
modes were normally falling that in the region 2840–3000 cm−1 [26,45,46], for the molecules include
aromatic methyl compounds. Both phenyl ring and methylene (CH2) group have symmetric and
asymmetric modes of C–H stretching vibrations. The symmetric C–H modes appeared higher
frequencies than asymmetric ones in the phenyl ring, however there is seen opposite situation in the
methylene group. In this study, the C–H stretching modes were predicted in the region 3053–3073
cm−1 (3059–3084 cm−1 IR) for phenyl ring and 2951–3003 cm−1 (2951–3003 cm−1 IR) for methylene
group. According to PED this vibrations are a pure mode as evident from the contribution of ~ 100%.
One of the most popular, very important and characteristic, modes are C–C stretching vibrations in
aromatic rings. Especially, Varsányi's study [47] is given as a reference for this mode, seen at 1625–
1590, 1590–1575, 1540–1470, 1465–1430 and 1380–1280 cm−1 from the frequency ranges for the five
bands. The stretching vibrations were predicted in the region of 1594–1487, 1399–1177, 1114-1010,
975, 771, 640, 629, 485, and 155 cm–1 in this study. The highest contributions come from modes 14,
20, as percentages 70% and 67%, respectively. The other important contributions were seen modes of
8, 9, contributed over sixty percent. The C–C modes were combined with C-H in-plane bending and
assigned ring deformation modes. The theory falls in to their experimental results, showing good
agreement. There is also seen concordance with the similar structure in the literature [21–27].
C–Br stretching modes were seen at the region of 200–480 cm−1 in bromine compounds by Varsányi
[47]. According to PED and GaussView results, the C–Br modes are no pure vibrations, mixed other
vibrations. These modes were predicted at 155, 212, 279, 361, 485, 640, 710, 1065 cm−1, respectively.
The mode C–Br stretching (para position) occurred by Mooney [48], the mode of the C–Br were
recorded at 308 cm−1 in FT-Raman and theoretically calculated at 292 cm−1 [43], 358 cm−1 in FT-
Raman spectrum and calculated theoretically 396 and 233 cm−1 by using B3LYP/6-311G(d,p) basis set
[49]. These vibrations were observed as a medium FT-IR band at 532 cm−1, predicted at 573 cm−1 for
p-bromophenoxyacetic acid [50], and calculated at 547 and 389 cm−1 for 4-bromophenylboronic acid
[51]. So, there is no big difference between these studies.
The C=O stretching modes are also showing a characteristic properties in the vibrations modes of
carbonyl groups. The stretching modes of carbonyl in ketones are expected in the region nearly 1700
cm−1 [46,52,53]. In this study, theoretically strong and medium bands were occurred for IR and Raman
spectra and predicted at 1693 cm−1. The experimental IR spectrum has also strong band at 1692 cm−1.
In literature, the C=O stretching modes were observed, very strong band at 1690 cm−1 in FT-IR and
FT-Raman spectra [26], very strong band, at 1668 cm−1 in FT-IR and at 1665 cm−1 in FT-Raman,
predicted 1746 cm−1 [25], very strong band at 1692 cm−1 in FT-Raman and calculated at 1685, 1690
and 1649 cm−1 at HF/6-31G, B3LYP/ 6-31G and LSDA/6-31G levels of theory, respectively [28]. The
modes of C=O stretching vibrations were showed very good agree terms of intensity and frequency.
3.3.2. Bending and deformation modes
The bending modes are separated generally as in plane bending (i.p.) and out-of-plane (o.o.p.) bending
C–H vibrations modes appear in the range of 1000–1300 cm−1 and at 750–1000 cm−1 , respectively
[53,54]. The i.p. C–H bending modes were calculated at 1487-1594, 1298-1399, 1177-1190, and 1114
cm–1 and observed 1484-1588, 1292-1397, 1177-1198, and 1114 cm–1 in FT-IR, in this paper.
Generally these modes are mixed or combined the other ring modes, especially CCC modes. The
o.o.p. C–H bending modes are (assigned 15, 22, 24-27, 30, and 36) predicted at 1272, 987, 954-808, 707,
and 405 cm–1, respectively. The experimental values were seen at 1272, 991, and 823-808 cm–1,
respectively. Both i.p. and o.o.p. C–H bending modes were determined simulation of GaussView
program. These results and their PED showed that highly pure modes. In literature, similar structure
molecules were supported [21–27] and good agree for obtained data.

Köse / Anadolu Univ. J. of Sci. and Technology – A – Appl. Sci. and Eng. 17 (4) - 2016
685
For the group –CH2–CO–, the methylene scissoring vibration occurs in the range 1435–1405 cm–1
[55]. Also, in the present work, the scissoring modes of CH2 was obtained 1416 cm–1 showing good
agree. The CH2 twisting and wagging vibrations were recorded at 450, 552, 1138 cm–1 and at 975 cm–
1, respectively. The C–Br bending modes both i.p. and o.o.p. appear in variable region based on the
state of the bromine substituent of structure. The i.p. C–Br modes were calculated at 85, 155, 279, 361
and 710 cm−1 which assigned to only at 717 cm−1 in FT-IR. The o.o.p. C–Br bending modes were
calculated at 27, 237 cm−1 and (450 and 552, cm−1, assigned CH2 with CCCO torsion mode),
observed 546 cm−1 in the FT-IR. The other bending and torsion modes of the related bromine atom
accounted in Table 3. The CCC i.p. bending modes were contaminated the other modes, and seen in
the large region. The largest one i.p. bending modes of CCC were calculated at 1010 and 629 cm−1,
assigned as ring deformation modes and observed (FT-IR) at 1005 cm−1.
There is only FT-IR experimental data in this paper. Between the calculated and experimental
wavenumbers has very good correlation. To see the correlation clearly Figure 5 graphic were plotted.
The description of this correlation was given as equation as linear following;
exp (cm-1) = 1.0039 cal - 6.0428 (R2 = 0.9999) for IR spectra
Figure 5. The correlation graphic of theoretical and experimental FT-IR spectra of 2,4'-DBrA
3.4. NMR Spectrum Analysis
1H and 13C NMR spectra were obtained [29] and predicted due to providing detailed information.
Firstly, full geometry optimization were done and, using the gauge-including atomic orbital (GIAO)
[39,40] approach with the DFT/B3LYP method, and 6-311++G(d,p) basis set for chemical shifts
predictions. NMR spectra are important to obtain chemical, physical, and structural information about
the molecules. NMR spectra and its computer simulation methods give an efficient way to predict and
interpret structure of molecules [56]. So, the experimental and theoretical 1H and 13C NMR
investigations were investigated, in this section. The experimental (in CDCl3) 1H and 13C NMR spectra
were presented in Figure 6a-6b, respectively. The results of experimental and calculated NMR spectra
were gathered in Table 4 according to atom positions of Figure 2.
There is a seen two type hydrogen atom of the studied molecule as in CH2 groups and phenyl ring. The
chemical shifts of protons (ring) generally are seen in the range of 7.00–8.00 ppm for organic
molecules. The chemical shifts of ring for this study were predicted at 7.70–8.47 ppm (CDCl3), 7.55–
8.48 ppm (gas), and 7.76–8.44 ppm (DMSO). The experimental results were recorded at 7.64–7.84
ppm (CDCl3). The CH2 groups’ protons were resonance at 4.39 and 4.96 ppm (CDCl3) and 4.70 ppm

Köse / Anadolu Univ. J. of Sci. and Technology – A – Appl. Sci. and Eng. 17 (4) - 2016
686
(gas), 5.09 ppm (DMSO). The electronic environments are very important for the variation of
chemical shifts. The electron-withdrawing and -donating in the atoms or atom groups, (attached or
nearby of hydrogen), can reduced the shielding and move the resonance of their protons to a higher
frequency and lower frequency, respectively [57]. The CH2 protons have electron-withdrawing
environments, so the shielding and resonance decreased. The protons generally can be more
susceptible to intermolecular interactions than the other heavier atoms [58]. So, the solvent effect to
these proton signals. The theoretical values were parallel nearly same region, showed well agree.
Figure 6. (a) 1H NMR (b) 13C NMR spectra of 2,4'-DBrA molecule in CDCl3 solution
Köse / Anadolu Univ. J. of Sci. and Technology – A – Appl. Sci. and Eng. 17 (4) - 2016
687
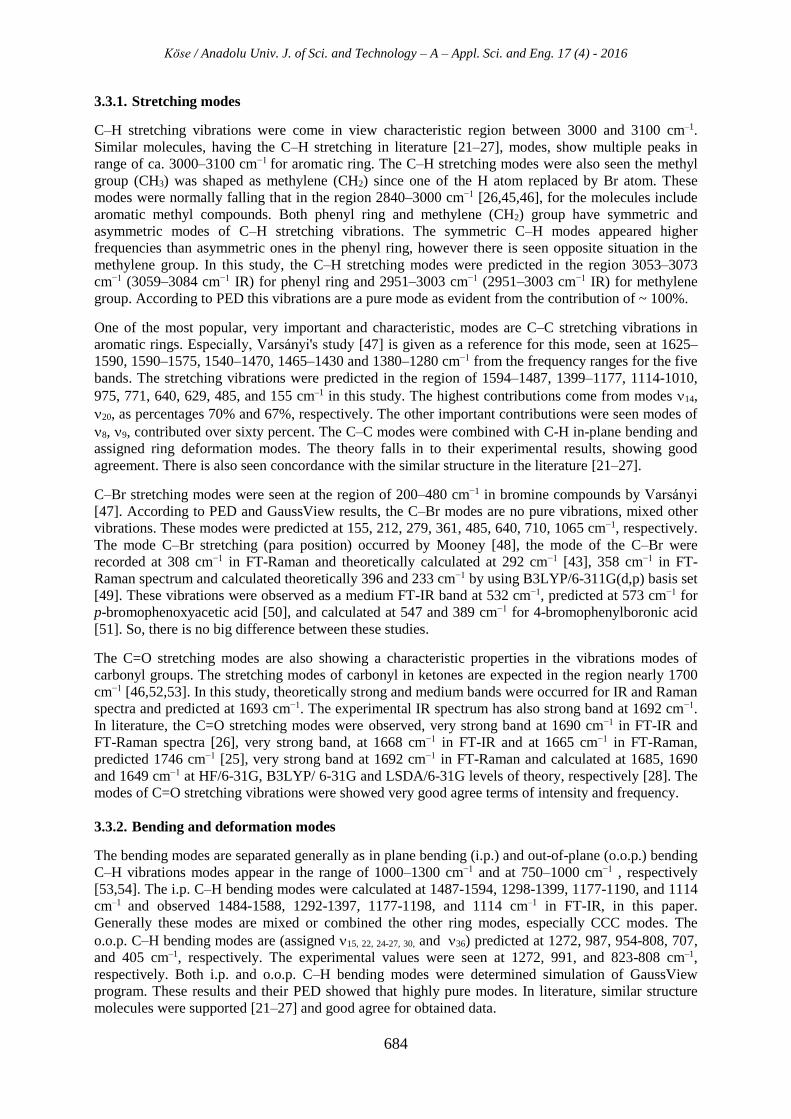
Table 4. The experimental and theoretical, 1H and 13C NMR isotropic chemical shifts (with
respect to TMS) of 2,4'-DBrA molecule with DFT (B3LYP 6-311++G(d,p)) method
The carbons’ chemical shifts can be evaluated two-stage as ring and others for this paper. Generally,
the chemical shifts of carbons (ring) are recorded and overlapped region between 100 to 150 ppm
[59,60]. Both aldehydes and ketones have a characteristic carbon of carbonyl group (C=O) at 190–215
ppm and methyl groups at nearly 30 ppm [61]. The present case, ring carbon chemical shifts predicted
at 134.22–155.10 (CDCl3) in theoretically and observed 129.30–132.70 in experimentally. There are
seen important differences between the theory and experiment for the C(1) and C(14) atoms. It can be
that the theoretical calculations taken into account very sensitive the bromine atoms effects. The
chemical shifts of carbon [C(2), C(6)] and [C(3), C(5)] atoms nearly the same due to the similar
environments. The carbon atom of carbonyl group, C(13), of this study were resonance at 190.40 ppm
(experiment) 194.57 ppm (theory) in the CDCl3 solvent. The C(1) atom shifts were also predicted at
155.10 ppm bigger than other ring carbons, due to the highly electronegative properties of bromine
atom. There is seen similar state in literature [27], supported our experimental and theoretical results.
Between the experimental and theoretical results of NMR chemical shifts are showing good
correlations. The graphic in Figure 7 and following equation were presented very clearly this
correlation.
cal. (ppm) = 1.0331 exp. + 3.1894 (R2 = 0.9876)
As results, the theoretical 1H and 13C chemical shifts data show well agree the experiment. However,
very small differences can be solvent effects, and local magnetic field effect.
Atoms Exp. Theoretical
CDCl3 CDCl3 Gas
C(1) 129.30 155.10 155.08
C(6) 132.20
137.61 137.67
C(2) 136.68 135.94
C(3) 130.40
134.22 132.54
C(5) 135.21 135.59
C(4) 132.70 137.87 137.83
C(13) 190.40 194.57 191.71
C(14) 30.40 53.94 52.38
H(8) 7.84
7.83 7.60
H(9) 8.47 8.48
H(7) 7.64
7.70 7.55
H(10) 7.78 7.69
H(15) 4.39 4.96 4.70
H(16)

Köse / Anadolu Univ. J. of Sci. and Technology – A – Appl. Sci. and Eng. 17 (4) - 2016
688
Figure 7. Correlation graphic of NMR spectra of the 2,4'-DBrA molecule in CDCl3 solution
3.5. Electronic Characteristics Details
3.5.1. UV-Vis spectrum and molecular orbital investigations
Electronic properties and molecular orbital investigations were investigated by TD–DFT method. It
present a fairly good reasonable results for medium size molecules [37,38]. In the absence of
experimental results to shed light on literature and to support future studies, The theoretical UV-Vis
(electronic absorption) spectra and molecular orbital analysis were prepared by using TD–DFT
method B3LYP/6-311++G(d,p) basis set (n=12 state and root=40). The obtained theoretical UV-Vis
(electronic absorption) spectra of title molecule were given for gas phase, ethanol, and water solvent in
Figure 8. For the gas phase, ethanol and water solvent; the calculated absorption (), excitation
energies (E), oscillator strength (f), and counterparts with major contributions by GaussSum 2.2 [41]
program, were gathered in Table 5. The maximum wavelengths were recorded at about 272-275 nm
for all solvents.
Figure 8. The theoretical UV-Vis spectra of 2,4'-DBrA molecule gas phase, in ethanol and water
Köse / Anadolu Univ. J. of Sci. and Technology – A – Appl. Sci. and Eng. 17 (4) - 2016
689
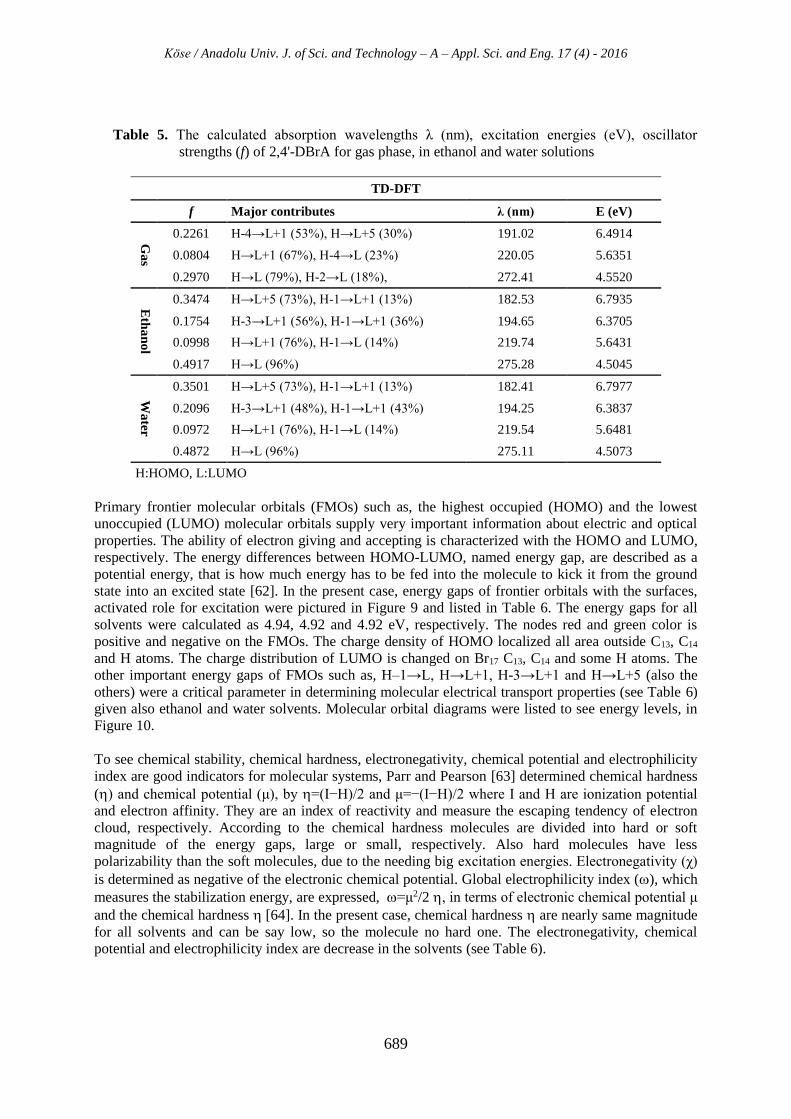
Table 5. The calculated absorption wavelengths λ (nm), excitation energies (eV), oscillator
strengths (f) of 2,4'-DBrA for gas phase, in ethanol and water solutions
TD-DFT
f Major contributes λ (nm) E (eV)
Ga
s
0.2261 H-4→L+1 (53%), H→L+5 (30%) 191.02 6.4914
0.0804 H→L+1 (67%), H-4→L (23%) 220.05 5.6351
0.2970 H→L (79%), H-2→L (18%), 272.41 4.5520
Eth
an
ol
0.3474 H→L+5 (73%), H-1→L+1 (13%) 182.53 6.7935
0.1754 H-3→L+1 (56%), H-1→L+1 (36%) 194.65 6.3705
0.0998 H→L+1 (76%), H-1→L (14%) 219.74 5.6431
0.4917 H→L (96%) 275.28 4.5045
Wa
ter
0.3501 H→L+5 (73%), H-1→L+1 (13%) 182.41 6.7977
0.2096 H-3→L+1 (48%), H-1→L+1 (43%) 194.25 6.3837
0.0972 H→L+1 (76%), H-1→L (14%) 219.54 5.6481
0.4872 H→L (96%) 275.11 4.5073
H:HOMO, L:LUMO
Primary frontier molecular orbitals (FMOs) such as, the highest occupied (HOMO) and the lowest
unoccupied (LUMO) molecular orbitals supply very important information about electric and optical
properties. The ability of electron giving and accepting is characterized with the HOMO and LUMO,
respectively. The energy differences between HOMO-LUMO, named energy gap, are described as a
potential energy, that is how much energy has to be fed into the molecule to kick it from the ground
state into an excited state [62]. In the present case, energy gaps of frontier orbitals with the surfaces,
activated role for excitation were pictured in Figure 9 and listed in Table 6. The energy gaps for all
solvents were calculated as 4.94, 4.92 and 4.92 eV, respectively. The nodes red and green color is
positive and negative on the FMOs. The charge density of HOMO localized all area outside C13, C14
and H atoms. The charge distribution of LUMO is changed on Br17 C13, C14 and some H atoms. The
other important energy gaps of FMOs such as, H–1→L, H→L+1, H-3→L+1 and H→L+5 (also the
others) were a critical parameter in determining molecular electrical transport properties (see Table 6)
given also ethanol and water solvents. Molecular orbital diagrams were listed to see energy levels, in
Figure 10.
To see chemical stability, chemical hardness, electronegativity, chemical potential and electrophilicity
index are good indicators for molecular systems, Parr and Pearson [63] determined chemical hardness
() and chemical potential (μ), by =(I−H)/2 and μ=−(I−H)/2 where I and H are ionization potential
and electron affinity. They are an index of reactivity and measure the escaping tendency of electron
cloud, respectively. According to the chemical hardness molecules are divided into hard or soft
magnitude of the energy gaps, large or small, respectively. Also hard molecules have less
polarizability than the soft molecules, due to the needing big excitation energies. Electronegativity (χ)
is determined as negative of the electronic chemical potential. Global electrophilicity index (), which
measures the stabilization energy, are expressed, =μ2/2, in terms of electronic chemical potential μ
and the chemical hardness [64]. In the present case, chemical hardness are nearly same magnitude
for all solvents and can be say low, so the molecule no hard one. The electronegativity, chemical
potential and electrophilicity index are decrease in the solvents (see Table 6).

Köse / Anadolu Univ. J. of Sci. and Technology – A – Appl. Sci. and Eng. 17 (4) - 2016
690
Figure 9. The selected frontier molecular orbitals of 2,4'-DBrA molecule with energy gaps
Table 6. The calculated energies values of 2,4'-DBrA molecule using B3LYP 6-311++G(d,p) basis set
TD-DFT/B3LYP/6-311++G(d,p) Gas Ethanol Water
Etotal (Hartree)
EHOMO-4 (eV) -8.04 -8.05 -8.06
EHOMO-3 (eV) -7.87 -8.02 -8.03
EHOMO-2 (eV) -7.86 -7.82 -7.82
EHOMO-1 (eV) -7.74 -7.78 -7.77
EHOMO (eV) -7.41 -7.27 -7.27
ELUMO (eV) -2.47 -2.35 -2.35
ELUMO+1 (eV) -1.36 -1.10 -1.10
ELUMO+5 (eV) -8.48 -8.36 -8.36
EHOMO-4–LUMO+1 gap (eV) 6.68 6.95 6.96
EHOMO-3–LUMO+1 gap (eV) 6.51 6.92 6.93
EHOMO-4–LUMO gap (eV) 5.57 5.70 5.71
EHOMO-2–LUMO gap (eV) 5.39 5.47 5.47
EHOMO-1–LUMO+1 gap (eV) 6.38 6.68 6.67
EHOMO-1–LUMO gap (eV) 5.27 5.43 5.42
EHOMO–LUMO gap (eV) 4.94 4.92 4.92
EHOMO–LUMO+1 gap (eV) 6.05 6.17 6.17
EHOMO–LUMO+5 gap (eV) -1.07 -1.09 -1.09
Chemical hardness () 2.47 2.46 2.46
Electronegativity (χ) 4.94 4.81 4.81
Chemical potential (μ) -4.94 -4.81 -4.81
Electrophilicity index (ω) 4.94 4.70 4.70

Köse / Anadolu Univ. J. of Sci. and Technology – A – Appl. Sci. and Eng. 17 (4) - 2016
691
Figure 10. The molecular orbital orient of the 2,4'-DBrA molecule with energy levels
3.5.2. Total, partial, and overlap population density-of-states
The TDOS, PDOS, and OPDOS or COOP (Crystal Orbital Overlap Population)) graphics [65–67],
were utilized by GaussSum 2.2 program [41] (convoluting the molecular orbital information with
Gaussian curves of unit height) and full width at half maximum (FWHM) of 0.3 eV. The DOS figures
specify the number of states in unit energy interval, and the concept of DOS is somewhat questionable
in isolated systems. When the separated energy levels are broadened to curves artificially, DOS
becomes a valuable tool for visually characterizing orbital compositions [68–70]. The interaction of
HOMO and LUMO (not yield a realistic description) orbitals, in the atoms or groups described as
bonding, anti-bonding and nonbonding according to OPDOS (COOP) diagrams, defined in that the
positive, negative and zero values [71]. Additionally, OPDOS (COOP) diagrams used to determined
and compared of the donor–acceptor properties of the molecules.
The DOS graphics are given in Figures 11–13, named TDOS, PDOS and OPDOS, respectively. To
show fragment contributing to the molecular orbitals, PDOS graphic were plotted according to the
fragment a phenyl ring, para bromine atom, and COCH2Br group. The contribution of all fragment
spread nearly 100 %, as phenyl ring (55%), para bromine atom (35%), COCH2Br group (10%), in
HOMO orbital. There is seen a different contribution in LUMO orbital as phenyl ring (54%), para
bromine atom (3%), COCH2Br group (43%), respectively. Easily showed in the OPDOS diagram that
there is interaction or no interaction between separated groups (fragments) based on energy values of
its orbitals. Such as phenyl ring ↔ COCH2Br group, para-Br atom, (black, and blue line) system are
negative (bonding interaction) in HOMO orbital of molecule. The COCH2Br group ↔ para-Br atom is
nearly zero (nonbonding interaction) in HOMO, While all of them are negative (bonding interaction)
in LUMO.

Köse / Anadolu Univ. J. of Sci. and Technology – A – Appl. Sci. and Eng. 17 (4) - 2016
692
Figure 11. The total electronic density of states (TDOS) diagram of 2,4'-DBrA molecule
Figure 12. The partial electronic density of states (PDOS) diagram of 2,4'-DBrA molecule

Köse / Anadolu Univ. J. of Sci. and Technology – A – Appl. Sci. and Eng. 17 (4) - 2016
693
Figure 13. The overlap population electronic density of states OPDOS diagram of 2,4'-DBrA
molecule
3.5.3. Molecular electrostatic potential surface
The molecular electrostatic potential surfaces (MEPs) were related to electron density, and mainly
allowed to know the reactive behavior of the molecules. The positive and negative indicated that
nucleophilic areas whereas, electrophilic areas, colored as blue and red, respectively [62,72,73]. Two
and three dimensional (2D and 3D) MEPs diagrams were represented in Figure 14. The potential
values on surfaces decrease from blue to red color and line up between −5.083e-2 to 5.083e-2 (a.u.).
The surface of MEP indicated that while regions having the negative potential are over the
electronegative Br atoms and O atom, positive ones are over the hydrogen atoms especially near the
CH2 group (see Figure 14). The maximum values negative (near the O atom) and positive potential (H
atoms of CH2 group) corresponding to the electron rich and electron deficient surfaces, respectively.
The MEPs enable to show the charge distributions, related properties of the title molecule.

Köse / Anadolu Univ. J. of Sci. and Technology – A – Appl. Sci. and Eng. 17 (4) - 2016
694
Figure 14. The molecular electrostatic potential (MEPs) surface graph for 2,4'-DBrA molecule
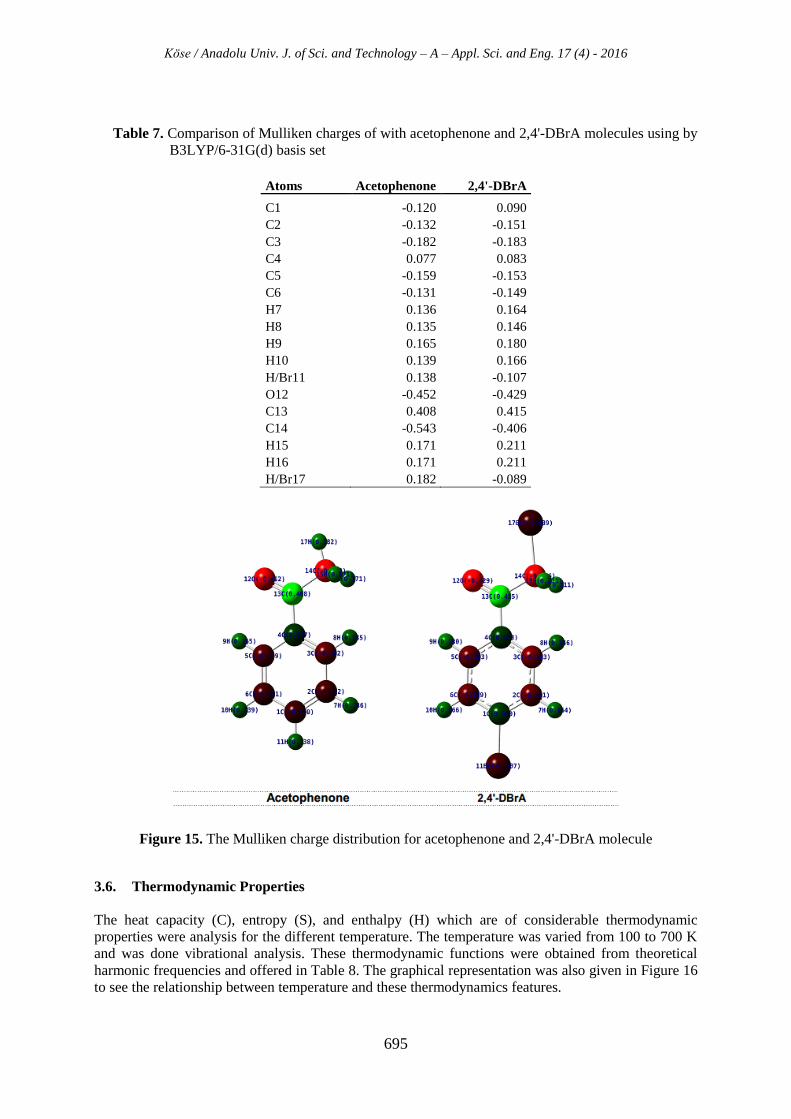
3.5.4. Mulliken atomic charges
Atomic charges have substantial role in application of quantum mechanical calculations of the
molecular system. So, to have Mulliken atomic charges and provide a means of estimating partial
atomic charges Mulliken population analysis [74] were presented for this section. The Mulliken
atomic charges of acetophenone and 2,4'-DBrA molecules were obtained DFT/B3LYP method 6-
31G(d) basis set, due to have the more reliable results than 6-311++G(d,p) basis set. The (6-
311++G(d,p) basis set are not preferred for these reason. The atomic charges results collected Table 7
and showed in Figure 15.
To see the effect of the halogen Br atom, the acetophenone molecule was chosen for compare. The
charges of the atoms were not change without carbon atom, attached Br atom in para position in the
present molecule according to acetophenone molecule. So, Br atom leads to a redistribution of electron
density of the aromatic carbon atom. The C14 atom has same sign charges but the magnitude of charges
are changed the effect of the Br17 atom. (see Figure 15). The all hydrogen atoms have a positive
charge, which is an acceptor, while two ones replacing the atom Br atoms have negative charges. As a
results the halogen Br atom were effected the atomic charges.
Köse / Anadolu Univ. J. of Sci. and Technology – A – Appl. Sci. and Eng. 17 (4) - 2016
695
Table 7. Comparison of Mulliken charges of with acetophenone and 2,4'-DBrA molecules using by
B3LYP/6-31G(d) basis set
Atoms Acetophenone 2,4'-DBrA
C1 -0.120 0.090
C2 -0.132 -0.151
C3 -0.182 -0.183
C4 0.077 0.083
C5 -0.159 -0.153
C6 -0.131 -0.149
H7 0.136 0.164
H8 0.135 0.146
H9 0.165 0.180
H10 0.139 0.166
H/Br11 0.138 -0.107
O12 -0.452 -0.429
C13 0.408 0.415
C14 -0.543 -0.406
H15 0.171 0.211
H16 0.171 0.211
H/Br17 0.182 -0.089
Figure 15. The Mulliken charge distribution for acetophenone and 2,4'-DBrA molecule
3.6. Thermodynamic Properties
The heat capacity (C), entropy (S), and enthalpy (H) which are of considerable thermodynamic
properties were analysis for the different temperature. The temperature was varied from 100 to 700 K
and was done vibrational analysis. These thermodynamic functions were obtained from theoretical
harmonic frequencies and offered in Table 8. The graphical representation was also given in Figure 16
to see the relationship between temperature and these thermodynamics features.

Köse / Anadolu Univ. J. of Sci. and Technology – A – Appl. Sci. and Eng. 17 (4) - 2016
696
The following quadratic formulas with their fitting factors (R2) were also showing the relationships,
respectively.
C = 4.87610 + 0.12540T – 5.4795x10⁻⁵ T2 (R2= 0.9992)
S = 62.79641 + 0.16917T – 5.6808x10⁻⁵ T2 (R2= 0.9997)
ΔH = –0.53318 + 0.01388T + 4.1611x10⁻⁵ T2 (R2= 0.9998)
The thermodynamic results ensure useful and more information about the chemical and physical
condition of the molecule.
Table 8. Thermodynamic properties at different temperatures at the B3LYP/6-311++G(d,p) level
for 2,4'-DBrA molecule
T (K) C (cal mol-1 K-1) S (cal mol-1 K-1) H (kcal mol-1)
100 17.700 78.328 1.414
150 22.387 87.197 2.516
200 27.215 94.865 3.854
250 32.227 101.918 5.439
298.15 37.064 108.359 7.204
300 37.248 108.601 7.276
350 42.074 115.015 9.359
400 46.562 121.196 11.677
450 50.643 127.154 14.207
500 54.305 132.892 16.933
550 57.573 138.414 19.831
600 60.485 143.724 22.883
650 63.087 148.829 26.072
700 65.418 153.738 29.386
Figure 16. The correlation graphic of heat capacity, entropy, enthalpy and temperature for 2,4'-DBrA
molecule
3.7. Nonlinear Optical Properties and Dipole Moment
Polarizability, anisotropy of polarizability and molecular first hyperpolarizability, which showed
tensors (polarizability and hyperpolarizability) as αxx, αxy, αyy, αxz, αyz, αzz and βxxx, βxxy, βxyy, βyyy, βxxz,

Köse / Anadolu Univ. J. of Sci. and Technology – A – Appl. Sci. and Eng. 17 (4) - 2016
697
βxyz, βyyz, βxzz, βyzz, βzzz, respectively. The aforementioned NLO functions were obtained by Gaussian
output job file of frequency. The units of polarizability and hyperpolarizability (α and β) were
converted into from in atomic units (a.u.) to electronic units (esu) [reminding; α; 1 a.u. = 0.1482×10⁻²⁴
esu, β; 1 a.u. = 8.6393×10⁻³³ esu]. The all calculations were tabulated, and listed in Table 9. The
following equations expressed that the mean polarizability (α0), anisotropy of polarizability (Δα) and
the average value of the first hyperpolarizability , and total dipole moment of studied molecule,
0 , respectively;
zzyyxx0 ααα
3
1α (1)
21
2yz
2xy
2xz
2
xxzz
2
zzyy
2
yyxx 6662
1 (2)
2
12
zyyzxxzzz
2
yxxyzzyyy
2
xzzxyyxxx (3)
2
12z
2y
2x0 (4)
If the molecules have relatively homogeneous charge distributions, their dipole moment are small. For
NLO properties, the magnitudes of NLO functions above were important and well known for more
active to be higher values. 0 is calculated as 3.30536 Debye (D). The components; µx is smallest
while µy is highest one, and µz is zero. So, polarizability of the title molecule can be considered high
as 14.7910 x10⁻²⁴ esu. The anisotropy of polarizability (Δα), is also given end of Table 9. The first
hyperpolarizability , was predicted as obtained 9722.2965x10−33 esu. These value is 12.5 times
bigger than urea value (780.323956 x10⁻³³), α value is 2.9 times larger than urea (5.047709315), Δα
value is 6.5 times larger than urea data (9.868773467), and 0 value is 2.2 times larger than those of
urea (1.525686),, known experimental value polar molecule urea.
Table 9. The dipole moments μ (D), the polarizability (a.u.), the average polarizability 0 (x10-24
esu), the anisotropy of the polarizability (x10-24 esu), and the first hyperpolarizability β
(x10-33 esu) of 2,4'-DBrA
Parameters
Parameters
μx -0.7302 βxxx -10188.1185
μy -3.2237 βxxy -1116.0096
μz 0 βxyy 312.2709
μ0 3.30536 βyyy 788.2583
xx 32.8182 βxxz 0.0000
xy 0.9752 βxyz 0.0000
yy 18.0429 βyyz 0.0000
xz 0.0000 βxzz 154.2856
yz 0.0000 βyzz 208.2466
zz 11.5549 βzzz 0.0000
0 14.7910 βx -9721.5621
63.7373 βy -119.5048
βz 0.0000
β 9722.2965
Köse / Anadolu Univ. J. of Sci. and Technology – A – Appl. Sci. and Eng. 17 (4) - 2016
698
4. CONCLUSIONS
The study contained an experimental (FT-IR, NMR) and theoretical (DFT) calculations on the 2,4'-
DBrA molecule. The title molecule was fully optimized to determine stable structure and have
geometric parameters, by using B3LYP/6-311++G(d,p) level of theory. The obtained optimize results
were compared X-ray results of architecture of -bromoacetophenone and similar structures. There is
a not seen big difference in theory from the experimental values. Apparent differences were evaluated
in the text. Next, vibrational frequencies analyses were prepared by obtained experimental (IR) and
theoretical method. The fundamental vibrational modes were assigned, based on their PED, and
compared in literature values for the similar structures. The 1H and 13C NMR spectra were obtained
theoretically and compared with their experimental results. Theoretical results were agreeing well
correlations with their tentative NMR data. The UV-Vis calculations were prepared for gas phase and
ethanol, water solvent. The FMOs, density of states (DOS), MEPs and Mulliken charges were also
carried out. The Br atom play active role for the charges and electron density. Thermodynamic
properties were showed that increasing with temperature, changing 50 K temperature from 100 K to
700 K. NLO properties were calculated and compared with urea results. The molecule showed that
polarity and NLO active according to urea. Eventually, the obtained results were evaluated and were
showing very well correlations and agreement in obtained experimental results and in the literature.
REFERENCES
[1] Griffin, R.N., Phosphorescence of Aromatic Ketones in Low-Temperature Glasses,
Photochemistry and Photobiology. (1968) 7 159–173.
[2] Lutz, H., Duval, M.C., Breheret, E., Lindqvist, L., Solvent effects on acetophenone photoreduction
studied by laser photolysis, The Journal of Physical Chemistry. (1972) 76 821–822.
[3] Scharf, G., Winefordner, J.D., Phosphorescence characteristics of acetophenone, benzophenone, p-
aminobenzophenone and michlercs ketone in various environments, Talanta. (1986) 33 17–25.
[4] Proksch, P., Rodriguez, E., Chromenes and benzofurans of the asteraceae, their chemistry and
biological significance, Phytochemistry. (1983) 22 2335–2348.
[5] Tomás-Barberán, F., Iniesta-Sanmartín, E., Tomás-Lorente, F., Rumbero, A., Antimicrobial
phenolic compounds from three Spanish Helichrysum species, Phytochemistry. (1990) 29 1093–1095.
[6] Buckle, D.R., Smith, H., Cantello, B.C.C., Substituted ω-nitroacetophenones, (1976).
[7] Buckle, D.R., Smith, H., Cantello, B.C.C., Acetophenone derivatives, (1976).
[8] Sivakumar, P.M., Sheshayan, G., Doble, M., Experimental and QSAR of Acetophenones as
Antibacterial Agents, Chemical Biology & Drug Design. (2008) 72 303–313.
[9] Sittig, M., Pharmaceutical manufacturing encyclopedia, Noyes publ., 1988.
[10] Amin, S.I., Walker, J.A., Process for preparing arylalkanoic acid derivatives, 1979.
[11] Zhang, X., Shan, L., Huang, H., Yang, X., Liang, X., Xing, A., et al., Rapid identification of
acetophenones in two Cynanchum species using liquid chromatography-electrospray ionization
tandem mass spectrometry., Journal of Pharmaceutical and Biomedical Analysis. (2009) 49 715–725.
[12] Liu, Z., Sun, Y., Wang, J., Zhu, H., Zhou, H., Hu, J., et al., Preparative isolation and purification
of acetophenones from the Chinese medicinal plant Cynanchum bungei Decne. by high-speed counter-
current chromatography, Separation and Purification Technology. (2008) 64 247–252.

Köse / Anadolu Univ. J. of Sci. and Technology – A – Appl. Sci. and Eng. 17 (4) - 2016
699
[13] Cacchi, S., Fabrizi, G., Gavazza, F., Goggiamani, A., Palladium-Catalyzed Reaction of Aryl
Iodides with Acetic Anhydride. A Carbon Monoxide-Free Synthesis of Acetophenones, Organic
Letters. (2003) 5 289–291.
[14] Prasad, Y.R., Rao, a S., Rambabu, R., Synthesis of Some 4 ’-Amino Chalcones and their
Antiinflammatory and Antimicrobial Activity, Asian Journal of Chemistry. (2009) 21 907–914.
[15] Gupta, M.P., Prasad, S.M., The crystal structure of [alpha]-bromoacetophenone, Acta
Crystallographica Section B. (1971) 27 1649–1653.
[16] Baker, L.-J., Copp, B.R., and Rickard, C.E.F., 2’-Amino-5’-bromoacetophenone, Acta
Crystallographica Section E Structure Reports Online. (2001) 57 o996–o998.
[17] Seth, S.K., Hazra, D.K., Mukherjee, M., Kar, T., Synthesis, structural elucidation and DFT
studies of ortho-hydroxy acetophenones, Journal of Molecular Structure. (2009) 936 277–282.
[18] Piro, O.E., Echeverría, G.A., Lizarraga, E., Romano, E., Catalán, C.A.N., Brandán, S.A.,
Molecular structure of 4-hidroxy-3-(3-methyl-2-butenyl) acetophenone, a plant antifungal, by X-ray
diffraction, DFT calculation, and NMR and FTIR spectroscopy., Spectrochimica Acta. Part A,
Molecular and Biomolecular Spectroscopy. (2013) 101 196–203.
[19] Rodrı́guez, A.M., Giannini, F.A., Baldoni, H.A., Santagata, L.N., Zamora, M.A., Zacchino, S., et
al., Conformational potential energy curves of acetophenone and α-substituted acetophenones, Journal
of Molecular Structure: THEOCHEM. (1999) 463 271–281.
[20] Xiao, H.-Y., Liu, Y.-J., Fang, W.-H., Density functional theory investigation of the
photodissociation channels of acetophenone, Journal of Molecular Structure: THEOCHEM. (2007)
802 99–103.
[21] Krishnakumar, V., Balachandran, V., DFT studies, vibrational spectra and conformational
stability of 4-hydroxy-3-methylacetophenone and 4-hydroxy-3-methoxyacetophenone.,
Spectrochimica Acta. Part A, Molecular and Biomolecular Spectroscopy. (2005) 61 2510–2525.
[22] Anbusrinivasan, P., Kavitha, S., Growth and characterization studies of 2-bromo-4-
chloroacetophenone crystals, Asian Journal of Chemistry. (2008) 20 979–982.
[23] Anbarasu, P., Arivazhaganb, M., Scaled quantum chemical study of structure and vibrational
spectra of 5-fluro-2-hydroxyacetophenone, Indian Journal of Pure and Applied Physics. (2011) 49
227–233.
[24] Udhayakala, P., Rajendiran, T. V, Seshadri, S., Gunasekaran, S., Quantum chemical vibrational
study, molecular property and HOMO-LUMO energies of 3-bromoacetophenone for Pharmaceutical
application, Journal of Chemical and Pharmaceutical Research. (2011) 3 610–625.
[25] Subramanian, M.K., Anbarasan, P.M., Ilangovan, V., Babu, S.M., FT-IR, NIR-FT-Raman and gas
phase infrared spectra of 3-aminoacetophenone by density functional theory and ab initio Hartree-
Fock calculations, Spectrochimica Acta - Part A: Molecular and Biomolecular Spectroscopy. (2008)
71 59–67.
[26] Ramalingam, S., Anbusrinivasan, P., Periandy, S., FT-IR and FT-Raman spectral investigation,
computed IR intensity and Raman activity analysis and frequency estimation analysis on 4-chloro-2-
bromoacetophenone using HF and DFT calculations., Spectrochimica Acta. Part A, Molecular and
Biomolecular Spectroscopy. (2011) 78 826–834.
Köse / Anadolu Univ. J. of Sci. and Technology – A – Appl. Sci. and Eng. 17 (4) - 2016
700
[27] Jeyavijayan, S., Molecular structure, spectroscopic (FTIR, FT-Raman, 13C and 1H NMR, UV),
polarizability and first-order hyperpolarizability, HOMO-LUMO analysis of 2,4-
difluoroacetophenone., Spectrochimica Acta. Part A, Molecular and Biomolecular Spectroscopy.
(2015) 136 B 553–566.
[28] Parimala, K., Balachandran, V., Structural study, NCA, FT-IR, FT-Raman spectral investigations,
NBO analysis and thermodynamic properties of 2’,4’-difluoroacetophenone by HF and DFT
calculations., Spectrochimica Acta. Part A, Molecular and Biomolecular Spectroscopy. (2013) 110
269–284.
[29] SDBS Web: http://sdbs.riodb.aist.go.jp (National Institute of Advanced Industrial Science and
Technology), SDBS Web: http://sdbs.riodb.aist.go.jp (National Institute of Advanced Industrial
Science and Technology), (2016).
[30] Frisch, Mj., Trucks, G.W., Schlegel, H.B., Scuseria, G.E., Robb, M.A., Cheeseman, J.R., et al.,
Gaussian 09, Gaussian, Inc., Wallingford, CT. (2009).
[31] Hohenberg, P., Kohn, W., Inhomogeneous Electron Gas, Physical Review. (1964) 136 B864–
B871.
[32] Becke, A.D., Density-functional thermochemistry. III. The role of exact exchange, The Journal of
Chemical Physics. (1993) 98 5648–5652.
[33] Becke, A.D., Density-functional exchange-energy approximation with correct asymptotic
behavior, Physical Review A. (1988) 38 3098–3100.
[34] Lee, C., Yang, W., Parr, R.G., Development of the Colle-Salvetti correlation-energy formula into
a functional of the electron density, Physical Review B. (1988) 37 785–789.
[35] Jamróz, M.H., Vibrational energy distribution analysis (VEDA): scopes and limitations.,
Spectrochimica Acta Part A: Molecular and Biomolecular Spectroscopy. (2013) 114 220–230.
[36] Dennington, R., Keith, T., Millam, J., GaussView, version 5, 2009.
[37] Guillaumont, D., Nakamura, S., Calculation of the absorption wavelength of dyes using time-
dependent density-functional theory (TD-DFT), Dyes and Pigments. (2000) 46 85–92.
[38] Fabian, J., TDDFT-calculations of Vis/NIR absorbing compounds, Dyes and Pigments. (2010) 84
36–53.
[39] Ditchfield, R., Molecular Orbital Theory of Magnetic Shielding and Magnetic Susceptibility, The
Journal of Chemical Physics. (1972) 56 5688–5691.
[40] Wolinski, K., Hinton, J.F., Pulay, P., Efficient implementation of the gauge-independent atomic
orbital method for NMR chemical shift calculations, Journal of the American Chemical Society.
(1990) 112 8251–8260.
[41] O’boyle, N.M., Tenderholt, A.L., Langner, K.M., Software News and Updates cclib : A Library
for Package-Independent Computational Chemistry Algorithms, Journal of Computational Chemistry.
(2008) 29 839–845.
[42] Karabacak, M., Kurt, M., The spectroscopic (FT-IR and FT-Raman) and theoretical studies of 5-
bromo-salicylic acid, Journal of Molecular Structure. (2009) 919 215–222.

Köse / Anadolu Univ. J. of Sci. and Technology – A – Appl. Sci. and Eng. 17 (4) - 2016
701
[43] Karabacak, M., Kose, E., Atac, A., Sas, E.B., Asiri, A.M., Kurt, M., Experimental (FT-IR, FT-
Raman, UV–Vis, 1H and 13CNMR) and computational (density functional theory) studies on 3-
bromophenylboronic acid, Journal of Molecular Structure. (2014) 1076 358–372.
[44] Karabacak, M., Cinar, M., Ermec, S., Kurt, M., Experimental vibrational spectra (Raman,
infrared) and DFT calculations on monomeric and dimeric structures of 2- and 6-bromonicotinic acid,
Journal of Raman Spectroscopy. (2010) 41 98–105.
[45] Dollish, F.R., Fateley, W.G., Bentley, F.F., Characteristic Raman frequencies of organic
compounds, Wiley, 1974.
[46] Colthup, N.B., Daly, L.H., Wiberley, S.E., Introduction to Infrared and Raman Spectroscopy,
Academic Press, 1990.
[47] Varsányi, G., Assignments for vibrational spectra of seven hundred benzene derivatives, Halsted
Press, 1974.
[48] Mooney, E.F., The infrared spectra of chloro- and bromobenzene derivatives—I, Spectrochimica
Acta. (1963) 19 877–887.
[49] Sas, E.B., Kose, E., Kurt, M., Karabacak, M., FT-IR, FT-Raman, NMR and UV-Vis spectra and
DFT calculations of 5-bromo-2-ethoxyphenylboronic acid (monomer and dimer structures),
Spectrochimica Acta Part A: Molecular and Biomolecular Spectroscopy. (2015) 137C 1315–1333.
[50] Sundaraganesan, N., Meganathan, C., Anand, B., Lapouge, C., FT-IR, FT-Raman spectra and ab
initio DFT vibrational analysis of p-bromophenoxyacetic acid., Spectrochimica Acta Part A:
Molecular and Biomolecular Spectroscopy. (2007) 66 773–780.
[51] Kurt, M., DFT simulations and Vibrational spectra of 4-chloro and 4-bromophenylboronic acid
molecules, Journal of Raman Spectroscopy. (2009) 40 67–75.
[52] Smith, B., Infrared spectral interpretation: a systematic approach, 1998. (accessed June 6, 2014).
[53] Socrates, G., Infrared and Raman Characteristic Group Frequencies: Tables and Charts, John
Wiley & Sons Ltd., West Sussex, England, 2001.
[54] Silverstein, R.M., Webster, F.X., Kiemle, D.J., Spectrometric identification of organic
compounds, John Wiley & Sons, 2005.
[55] Gianturco, M.A., Pitcher, R.G., New Spectra-Structure Correlations of Aliphatic Ketones,
Applied Spectroscopy. (1965) 19 109–110.
[56] Schlick, T., Molecular Modeling and Simulation: An Interdisciplinary Guide: An
Interdisciplinary Guide, 2nd ed., Springer, Newyork, USA, 2010.
[57] Subramanian, N., Sundaraganesan, N., Jayabharathi, J., Molecular structure, spectroscopic (FT-
IR, FT-Raman, NMR, UV) studies and first-order molecular hyperpolarizabilities of 1,2-bis(3-
methoxy-4-hydroxybenzylidene)hydrazine by density functional method., Spectrochimica Acta Part
A: Molecular and Biomolecular Spectroscopy. (2010) 76 259–269.
[58] Karabacak, M., Karaca, C., Atac, A., Eskici, M., Karanfil, A., Kose, E., Synthesis, analysis of
spectroscopic and nonlinear optical properties of the novel compound: (S)-N-benzyl-1-phenyl-5-
(thiophen-3-yl)-4-pentyn-2-amine., Spectrochimica Acta Part A: Molecular and Biomolecular
Spectroscopy. (2012) 97 556–567.

Köse / Anadolu Univ. J. of Sci. and Technology – A – Appl. Sci. and Eng. 17 (4) - 2016
702
[59] Kalinowski, H.O., Berger, S., Braun, S., Carbon-13 NMR spectroscopy, 1988.
[60] Pihlaja, K., Kleinpeter, E., Carbon-13 NMR Chemical Shifts in Structural and Stereochemical
Analysis, VCH, 1994.
[61] Breitmaier, E., Voelter, W., Carbon-13 NMR spectroscopy, Carbon 13 NMR Spectroscopy.
(1987).
[62] Arivazhagan, M., Anitha Rexalin, D., FT-IR, FT-Raman, NMR studies and ab initio-HF, DFT-
B3LYP vibrational analysis of 4-chloro-2-fluoroaniline., Spectrochimica Acta Part A: Molecular and
Biomolecular Spectroscopy. (2012) 96 668–676.
[63] Parr, R.G., Pearson, R.G., Absolute hardness: companion parameter to absolute electronegativity,
Journal of the American Chemical Society. (1983) 105 7512–7516.
[64] Parr, R.G., Yang, W., Density-Functional Theory of Atoms and Molecules, Oxford University
Press, USA, 1989.
[65] Hoffman, R., Solids and surfaces: a chemist’s view of bonding in extended structures, 1988.
[66] Hughbanks, T., Hoffmann, R., Chains of trans-edge-sharing molybdenum octahedra: metal-metal
bonding in extended systems, Journal of the American Chemical Society. (1983) 105 3528–3537.
[67] Małecki, J.G., Synthesis, crystal, molecular and electronic structures of thiocyanate ruthenium
complexes with pyridine and its derivatives as ligands, Polyhedron. (2010) 29 1973–1979.
[68] Gorelsky, S.I., Ghosh, S., Solomon, E.I., Mechanism of N2O Reduction by the μ4-S Tetranuclear
CuZ Cluster of Nitrous Oxide Reductase, Journal of the American Chemical Society. (2005) 128 278–
290.
[69] Ghosh, S., Gorelsky, S.I., Chen, P., Cabrito, I., Moura, J.J.G., Moura, I., et al., Activation of N2O
reduction by the fully reduced micro4-sulfide bridged tetranuclear Cu Z cluster in nitrous oxide
reductase., Journal of the American Chemical Society. (2003) 125 15708–15709.
[70] Platas-Iglesias, C., Esteban-Gómez, D., Enríquez-Pérez, T., Avecilla, F., de Blas, A., Rodríguez-
Blas, T., Lead(II) Thiocyanate Complexes with Bibracchial Lariat Ethers: An X-ray and DFT Study,
Inorganic Chemistry. (2005) 44 2224–2233.
[71] Chen, M., Waghmare, U. V., Friend, C.M., Kaxiras, E., A density functional study of clean and
hydrogen-covered α-MoO3(010): Electronic structure and surface relaxation, The Journal of Chemical
Physics. (1998) 109 6854–6860.
[72] Okulik, N., Jubert, A.H., Theoretical analysis of the reactive sites of non-steroidal anti-
inflammatory drugs, Internet Electronic Journal of Molecular Design. (2005) 4 17–30.
[73] Luque, F.J., López, J.M., Orozco, M., Perspective on “Electrostatic interactions of a solute with a
continuum. A direct utilization of ab initio molecular potentials for the prevision of solvent effects,”
Theoretical Chemistry Accounts: Theory, Computation, and Modeling (Theoretica Chimica Acta).
(2000) 103 343–345.
[74] Mulliken, R.S., Electronic Population Analysis on LCAO-MO Molecular Wave Functions. I, The
Journal of Chemical Physics. (1955) 23 1833–1840.