Copyright © IOJPE - DergiPark
257
Copyright © IOJPE - www.iojpe.org
-
Upload
khangminh22 -
Category
Documents
-
view
2 -
download
0
Transcript of Copyright © IOJPE - DergiPark

Copyright © IOJPE - www.iojpe.org

Copyright © IOJPE - www.iojpe.org
International
Online Journal of
Primary Education ISSN: 1300-915X
JUNE 2021
Volume 10 – Issue 1
Prof. Dr. Sinan OLKUN Editors in Chief
Prof.Dr. Mehmet Engin DENİZ
Prof. Dr. Şule AYCAN PhD. Arzu GÜNGÖR LEUSHUIS
Editors

Copyright © IOJPE - www.iojpe.org
Copyright © 2021 INTERNATIONAL ONLINE JOURNAL OF PRIMARY EDUCATION
All articles published in International Online Journal of Primary Education (IOJPE) are licensed under
a Creative Commons Attribution-NonCommercial 4.0 International License (CC BY).
IOJPE allows readers to read, download, copy, distribute, print, search, or link to the full texts of its
articles and allow readers to use them for any other lawful purpose.
IOJPE does not charge authors an article processing fee (APF).
Published in TURKEY
Contact Address:
Prof. Dr. Sinan OLKUN
IOJPE Editor in Chief, İzmir-Turkey

Copyright © IOJPE - www.iojpe.org
Message from the Editor,
I am very pleased to inform you that we have published the first issue in 2021. As an editor of
International Online Journal of Primary Education (IOJPE), this issue is the success of our authors,
very valuable reviewers who undertook the rigorous peer review of the manuscripts, and those of the
editorial board who devoted their valuable time through the review process. In this respect, I would
like to thank to all reviewers, researchers and the editorial board members. The articles should be
original, unpublished, and not in consideration for publication elsewhere at the time of submission to
International Online Journal of Primary Education (IOJPE). For any suggestions and comments on
IOJPE, please do not hesitate to send me e-mail. The countries of the authors contributed to this issue
(in alphabetical order): Australia, Ghana, Kenya, Nigeria, Sweden, Turkey, United States, and United
Kingdom.
Prof. Dr. Sinan OLKUN
Editor in Chief

Copyright © IOJPE - www.iojpe.org
Editor in Chief
PhD. Sinan Olkun, (Final International University, North Cyprus)
Editors
PhD. Arzu Güngör Leushuis, (Florida State University, United States)
PhD. Mehmet Engin Deniz, (Yıldız Teknik University, Turkey)
PhD. Şule Aycan, (Muğla University, Turkey)
Linguistic Editors
PhD. Mehmet Ali Yavuz, (Cyprus International University, North Cyprus)
PhD. Uğur Altunay, (Dokuz Eylül University, Turkey)
Classroom Management
PhD. Hasan Şimşek, (Eastern Mediterranean University, North Cyprus)
PhD. Fahriye Altınay, (Near East University, North Cyprus)
Curriculum Development in Primary Education
PhD. Ali Ahmad Al-Barakat, (University of Sharjah, United Arab Emirates)
PhD. Arzu Güngör Leushuis, (Florida State University, United States)
PhD. Asuman Seda Saracaloğlu, (Adnan Menderes University, Turkey)
Computer Education and Instructional Technologies
PhD. Aytekin İşman, (Sakarya University, Turkey)
Ph.D. Ersun İşçioğlu, (Eastern Mediterranean University, North Cyprus)
PhD. Halil İbrahim Yalın, (Cyprus International University, North Cyprus)
Ms Umut Tekgüç, (Bahçeşehir Cyprus University, North Cyprus)
PhD. Zehra Altınay, (Near East University, North Cyprus)
Educational Drama
PhD. Alev Önder, (Bahçeşehir University, Turkey)
Educational Psychology
PhD. Muhammad Sabil Farooq, (Nankai University Tianjin, P.R. China)
PhD. Rengin Karaca, (Dokuz Eylül University, Turkey)
PhD. Thanos Touloupis, (Aristotle University of Thessaloniki, Greece)
PhD. Yuan Tong KAI, (Nankai University Tianjin, P.R China)
Fine Arts Education
PhD. Ayfer Kocabaş, (Dokuz Eylül University, Turkey)
PhD. Bedri Karayağmurlar, (Dokuz Eylül University, Turkey)
Foreign Language Teaching
PhD. Nazife Aydınoğlu, (Final International University, North Cyprus)
PhD. İzzettin Kök, (Girne American University, North Cyprus)
PhD. Perihan Savaş, (Middle East Technical University Turkey)
Guidance and Counselling
PhD. Ferda Aysan, (Dokuz Eylül University, Turkey)
PhD. Mehmet Engin Deniz, (Yıldız Teknik University, Turkey)
PhD. Nergüz Bulut Serin, (European University of Lefke, North Cyprus)
Mathematics Education
PhD. Elizabeth Jakubowski, (Florida State University, United States)
PhD. Kakoma Luneta, (University of Johannesburg, South Africa)
PhD. Melih Turgut, (Norwegian University of Science and Technology (NTNU), Norway)
PhD. Moritz Herzog, (University of Wuppertal, Germany)
PhD. Nazan Sezen Yüksel, (Hacettepe University, Turkey)
PhD. Osman Cankoy, (Atatürk Teachers Academy, North Cyprus)
PhD. Stefan Haesen, (Thomas More University, Belgium)

Copyright © IOJPE - www.iojpe.org
Measurement and Evaluation
PhD. Bayram Bıçak, (Akdeniz University, Turkey)
PhD. Emre Çetin, (Cyprus Social Sciences University, North Cyprus)
PhD. Gökhan İskifoğlu, (European University of Lefke, North Cyprus)
PhD. Selahattin Gelbal, (Hacettepe University, Turkey)
Music Education
PhD. Gulsen G. Erdal, (Kocaeli University, Turkey)
PhD. Sezen Özeke, (Uludağ University, Turkey)
PhD. Şirin Akbulut Demirci, (Uludağ University, Turkey)
Pre-School Education
PhD. Alev Önder, (Bahçeşehir University, Turkey)
PhD. Ilfa Zhulamanova, (University of Soutnern Indiana, United States)
PhD. Ithel Jones, (Florida State University, United States)
PhD. Rengin Zembat, (Marmara University, Turkey)
PhD. Şafak Öztürk Aynal, (Celal Bayar University, Turkey)
Science Education
PhD. Oguz Serin, (European University of Lefke, North Cyprus)
PhD. Salih Çepni, (Uludağ University, Turkey)
PhD. Şule Aycan, (Muğla University, Turkey)
PhD. Woldie Belachew Balea, (Addis Ababa University, Ethiopia)
Social Sciences Education
PhD. Erdal Aslan, (Dokuz Eylül University, Turkey)
PhD. Z. Nurdan Baysal, (Marmara University, Turkey)
Sports Education
PhD. Erkut Konter, (Dokuz Eylül University, Turkey)
PhD. Rana Varol, (Ege University, Turkey)
Special Education
PhD. Hakan Sarı, (Necmettin Erbakan University, Turkey)
PhD. Hasan Avcıoğlu, (Cyprus International University, North Cyprus)
PhD. Muhammad Zaheer Asghar, (Universitat Oberta de Catalunya, Barcelona, Spain)
PhD. Tevhide Kargın, (Hasan Kalyoncu University, Turkey)
Turkish Language Teaching
PhD. Ahmet Pehlivan, (Eastern Mediterranean University, North Cyprus)
PhD. Hülya Yeşil, (Cyprus International University, North Cyprus)
PhD. Yüksel Girgin (Adnan Menderes University, Turkey)
Journal Cover Designer
Eser Yıldızlar, (University of Sunderland, England)
ISSN: 1300-915X

Copyright © IOJPE - www.iojpe.org
Volume 10, Issue 1 (2021)
Table of Contents
Research Articles A LONGITUDINAL STUDY: EMERGENT BILINGUALS’ HERITAGE LANGUAGE USE AND
LEARNING OVER TIME
Chaehyun LEE
SPECIALISED CONTENT KNOWLEDGE: THE CONVENTION FOR NAMING ARRAYS AND
DESCRIBING EQUAL GROUPS’ PROBLEMS
Chris HURST, Derek HURRELL
AN EXPLORATION OF PRIMARY SCHOOL TEACHERS’ MATHS ANXIETY USING
INTERPRETATIVE PHENOMENOLOGICAL ANALYSIS
Jane DOVE, Jane MONTAGUE, Thomas E. HUNT
THE EFFECT OF PROBLEM-BASED LEARNING ON PRE-SERVICE PRIMARY SCHOOL TEACHERS'
CONCEPTUAL UNDERSTANDING AND MISCONCEPTIONS
Çiğdem ŞENYİĞİT
TEACHERS’ EXPERIENCES WITH OVERCROWDED CLASSROOMS IN A BASIC SCHOOL IN GHANA
Joycelyn Adwoa OSAI, Kwaku Darko AMPONSAH, Ernest AMPADU, Priscilla COMMEY-MINTAH
THE CONCEPT OF ANGLE IN TURKISH AND SINGAPOREAN PRIMARY SCHOOL MATHEMATICS
TEXTBOOKS: DYNAMIC OR STATIC?
Suphi Önder BÜTÜNER
SCIENCING ACTIVITIES AND SCIENTIFIC SKILLS OF CHILDREN AT PRE-PRIMARY LEVEL IN
NIGERIA
Eileen Oluwakemi AKINTEMI, Esther Abiola ODUOLOWU
PLAYFULNESS OF PRESCHOOL CHILDREN IN TURKEY
Dondu Neslihan BAY
EFFECTS OF PERFORMANCE RANKING ON STUDENTS’ VOICE AND AGENCY IN THE
MATHEMATICS CLASSROOM
Samson Murithi NJIRU, Simon KARUKU
EFFECTS OF PRIMARY SCHOOL TEACHER PERSONALITY AND NETWORK INTENTIONS ON
CHANGE: MEDIATING ROLE OF PROFESSIONAL LEARNING
Emre ER
A RASCH MODEL ANALYSIS OF PRIMARY SCHOOL STUDENTS’ CONCEPTUAL UNDERSTANDING
LEVELS OF THE CONCEPT OF LIGHT
Hüseyin Cihan BOZDAĞ, Suat TÜRKOĞUZ
CLASSROOM TEACHERS’ VIEWS ON THE PHYSICAL LEARNING ENVIRONMENTS OF PRIMARY
SCHOOLS IN TURKEY
Mehmet GÜLTEKİN, Gözde ÖZENÇ İRA
INVESTIGATION OF THE VIEWS OF PRE-SERVICE TURKISH TEACHERS IN TERMS OF SPEED
READING
Hulusi GEÇGEL, Fatih KANA, İlknur YALÇIN AKKAŞ
EXAMINATION OF THE EFFECTIVENESS OF NATURALISTIC TEACHING EDUCATION PROGRAM
DEVELOPED FOR PRE-SCHOOL TEACHERS IN TURKEY
Seçil ÇELIK, İbrahim Halil DIKEN, Hasan GÜRGÜR
INVESTIGATION OF VERBS USED BY PRE-SERVICE PRIMARY SCHOOL TEACHERS IN THE
CONTEXT OF HIERARCHY OF NEEDS WITH THE SOM-WARD METHOD
İlyas YAZAR, Dilek HAZAR, Cenk KEŞAN, Mehmet ÖZER
ISSN: 1300-915X

IOJPE
ISSN: 1300 – 915X
www.iojpe.org
International Online Journal of Primary Education 2021, volume 10, issue 1
Copyright © International Online Journal of Primary Education 1
A LONGITUDINAL STUDY: EMERGENT BILINGUALS’ HERITAGE
LANGUAGE USE AND LEARNING OVER TIME
Chaehyun LEE
Ph.D., Assistant Professor, Southeastern Oklahoma State University
Department of Educational Instruction and Leadership, United States
ORCID: https://orcid.org/0000-0002-4670-4519
Received: March 02, 2021 Accepted: April 15, 2021 Published: June 30, 2021
Suggested Citation:
Lee, C. (2021). A longitudinal study: Emergent bilinguals’ heritage language use and learning over time. International
Online Journal of Primary Education (IOJPE), 10(1), 1-18.
This is an open access article under the CC BY 4.0 license.
Abstract
This article discusses a comparison of the two focal primary school third-grade Korean bilingual students’ language use with
their previous language use when they were first-graders by examining their heritage language (HL) use at a Korean
language school. For children of immigrant families in the U.S., there has been a pervasive hypothesis that their heritage
language (HL) might be jeopardized due to their minimum exposure to it and its reduced status in the U.S., which can easily
lead them to experience HL shift or loss (Montrul, 2018; Valdes, 2014). However, the present study shows that the focal
third graders who were attending all-English schools during the week did not appear to lose their HL. Instead, the
comparison of findings indicated that they had developed a certain degree of oral proficiency in their HL, including
vocabulary knowledge, thanks to the parents’ involvement and practices towards their children’s HL learning as well as
other socio-cultural influences on the students’ HL language use and development over the years.
Keywords: Heritage language, Korean students, immigrant family, bilingualism, biliteracy.
INTRODUCTION
Since the Immigration Act of 1965, the number of immigrants to the United States has proliferated.
Throughout the 1980s, approximately 18 million immigrants resided in the U.S., and the number has
continued to increase (U.S. Census Bureau, 2018). Today, among approximately 44 million
immigrants in the U.S., the second-generation U.S.-born children of immigrants represent 38 million,
consisting of almost 15 percent of the population. The influx of immigrant children in the U.S. brings
scholars’ and researchers’ attention to heritage language (HL) maintenance and development.
However, research to date has paid more attention to immigrant children’s English development than
their HL learning (August & Shanahan, 2010; Goldenberg, 2011). For example, a number of
researchers investigated how immigrant children developed their English language proficiency and
literacy skills (e.g., Golberg, Paradis, & Crago, 2008; Rodriguez-Mojica, 2017; Yang, Fox, &
Jacewicz, 2015).
Yet, comparatively, little attention has been given to immigrant children’s language and literacy
development in their HL (Goldenberg, 2011; Seals & Peyton, 2017; Szilagyi & Szecsi, 2020).
Furthermore, the majority of HL studies have focused on adolescent or adult HL learners by
emphasizing the HL shift or loss phenomenon (Elabbas, Montrul, & Polinsky, 2013; Scontras, Fuchs,
& Polinsky, 2015; Valdes, 2014). Limited studies are devoted to the issue of HL maintenance and
development in early childhood; thus, we know less about second-generation immigrant children’s
HL learning trajectory. As Montrul (2018) suggested, investigating bilingual children’s longitudinal
language use and development can explain what is happening to their HL learning and bilingualism
during their school years.
Since HLs are regarded as minority and under-representative languages in the host country (U.S.),
they are less recognized, unacknowledged, or even unappreciated by the society of origin (Polinsky &
Kagan, 2007). Thus, HL maintenance is often endangered and threatened as the use of the dominant

IOJPE
ISSN: 1300 – 915X
www.iojpe.org
International Online Journal of Primary Education 2021, volume 10, issue 1
Copyright © International Online Journal of Primary Education 2
language (English) is favored in mainstream society (Valdes, 2014). Several researchers reported that
when emergent bilingual children attended U.S. classrooms taught only in English, they often lost or
did not continue developing their HL (Montrul, 2018; Ro & Cheatham, 2009; Shin, 2005; Polinsky,
2011, 2018). Researchers in HL studies reported that HL shift or loss had largely occurred not only
with Latinx students (Beaudrie, Ducar, & Potowski, 2014; Gandara & Hopkins, 2010; Potowski,
2016) but also with Korean children in the U.S. (Lee & Wright, 2014; Shin & Lee, 2013).
In terms of Korean immigrant families in the U.S., Korean immigrant parents often decline bilingual
education services (Lee & Jeong, 2013; Shin, 2005) because many of them believe that their
children’s Korean literacy skills have little direct relevance to their U.S. school performance, while
the mastery of English directly impacts their children’s success in school (Shin, 2014). The parents’
desire for their children to have educational success and prestigious careers in the future leads them to
immerse their children in English-only instruction (Kim & Pyun, 2014; McCabe, 2016). Although
Korean parents may not support their children’s enrollment in bilingual education, they often hold
positive attitudes toward their children’s HL development and consider the role of HL schools to be
critical for their children’s HL learning (Lee & Jeong, 2013; Shin, 2005). Hence, many Korean
parents financially support Korean HL schools and send their child(ren) to the Korean HL, which
their children attend on weekends (Lee & Wright, 2014; Shin & Lee, 2013).
Despite the support by parents and community for Korean children’s HL learning, previous studies
reported that among Asian ethnic groups in the U.S., Korean children were less likely to maintain
their HL at home than other Asian ethnic groups (Kondo-Brown, 2011; Lopez, 1996). Murphy (2014)
correspondingly reported that Korean children’s HL loss is a natural process among Korean
immigrants in the U.S. because of the exposure to the English language in American schools and the
mainstream culture. Other studies further discovered that Korean immigrant children became more
resistant to acquiring their HLs and are more likely to experience the challenge of preserving their HL
as they get older because they were more likely to expose to the societal language (i.e., English) than
their HL (Cho, 2015; Shin, 2014).
Given the HL attrition phenomenon among Korean children of immigrants in the U.S., the current
study investigates two third-grade Korean emergent bilingual students’ longitudinal language use. By
comparing the focal students’ current language use to their previous language use when they were
younger, the study explores whether and to what extent the Korean bilingual learners experience any
HL attrition, or they were able to develop their HL as they become older. To further identify the
elements for the students’ HL shift or maintenance, the study also examines the parents’ practices and
involvement in their children’s HL learning and the role of socio-cultural influences on the students’
bilingual language use over the years.
Theoretical Framework
Sociocultural perspective on language use and learning Many literacy scholars’ work reflects sociocultural perspectives (Gee, 2012; Halliday, 1985; Street,
2001). By emphasizing the social environment, Halliday (1985) claimed that language is not
independent of the social world. According to him, language occurs within a cultural context; thus,
culture is generated through language. Halliday viewed children’s language development as a function
of their participation in a social world because language could not be separated from the culture.
Hence, Halliday considered language and communication to be social semiotics and multiple-meaning
systems that involved varied modes of representation or multimodality, such as oral and written
language, gestures, drawings, signs, and symbols. Researchers who studied Halliday’s systemic
functional linguistics reported that he was interested in the functions or purposes of humans’ use of
semiotic resources to interact with each other and create oral and written texts (Moro, Mortimer, &
Tiberghien, 2019). Similarly, Gee’s (2012) Discourses (with the capital “D”) as an “identity kit” also
illustrated how language is connected with social and cultural contexts. According to Gee’s notion of

IOJPE
ISSN: 1300 – 915X
www.iojpe.org
International Online Journal of Primary Education 2021, volume 10, issue 1
Copyright © International Online Journal of Primary Education 3
language, language instantiates culture because the speaker’s language use varies according to social
and cultural contexts.
Street (2001) pointed out that to understand literacy practices, researchers need “detailed, in-depth
accounts of actual practice in different cultural settings” (p. 430). According to him, a sociocultural
view of literacy emphasizes literacies that are situated in and created by participants. Street argued
that literacy emerges from social and cultural practices because it involves “thinking about, doing, and
reading in cultural contexts” (p. 11). Street (1984, p. 1) employed the phrase “literacy practices” by
focusing on “the social practices and conceptions of reading and writing” to emphasize the social
models of literacy in which participants negotiate and make meanings when they read and write in
specific cultural contexts. Street (1984) distinguished between an autonomous model and an
ideological model of literacy. The autonomous model of literacy is a traditional psychological
approach, which views literacy as a mental or cognitive phenomenon; thus, reading and writing are
treated as things people do inside their heads as technical skills. In opposition to the autonomous
model of literacy, Street proposed an ideological model. The ideological model of literacy challenges
the traditional model since it offers a more culturally sensitive view of literacy practices by insisting
that people engage in literacy practices in society, not just inside their heads.
Since the present study is conducted in classroom settings, where the participants negotiate and make
meanings during their literacy practices in certain cultural contexts, the study is consistent with
Street’s social view of literacies. Considering Street’s argument that literacy should be studied in an
integrated way by looking at social, cultural, and historical aspects beyond cognitive facets, I
considered the cultural contexts and social practices when investigating the participating students’
language use, performance, and development.
Literature Review
Understanding the phenomenon of HL attrition in the U.S.
According to Montrul (2010), HL loss occurs when an individual’s primary language shifts to a new
language or second language (L2) when the individual lives in an L2 environment as a result of
immigration (Tse, 2001). Schmid (2010) pointed out that immigrant children are susceptible to losing
their HLs if they have not fully mastered their HLs before being exposed to a new language. Most
young immigrant children in the U.S. are identified as potential linguistic emigrants (Veltman, 1983)
who could lose their HLs when surrounded by the English language rather than their HLs. Several
researchers pointed out that when immigrant children want to be accepted into the mainstream culture
(Murphy, 2014), they are more likely to engage in English practices, which consequently leads them
to experience a language shift from HL to English and/or language loss in their HLs (Polinsky &
Kagan, 2007; Valdes, 2014).
It is important to note that language shift and loss are related to power relations between languages.
When people immigrate to a new country, the language used in the country is regarded as a dominant
language, which has privilege and supremacy, and the immigrants' HLs are often regarded as minority
or less privileged languages (Schmid, 2010; Veltman, 1983). For this reason, some immigrants want
to assimilate into the majority culture by actively participating in the majority language group using
the majority language only (Shin, 2005). Veltman (1983) explained this phenomenon as linguistic
emigration. It applies to language minority groups who immigrate to a country where the majority
language is considered a high prestige language since they are more likely to assimilate to the
majority culture by losing their HLs and ceasing to participate in the communities of origin.
Veltman (1983) considered language minority children in the U.S. as potential linguistic emigrants
who have the potential to lose their HLs. Many of them are not only massively expose to and
frequently use the societal language (English in the U.S.) but also want to be accepted into the
mainstream culture to avoid alienation (Murphy, 2014; Tse, 2001). These practices are likely to lead
them to shift their dominant language from HL to English and eventually experience HL attrition or
loss (Polinsky, 2011; Valdes, 2014). Researchers reported that language minority students in the U.S.

IOJPE
ISSN: 1300 – 915X
www.iojpe.org
International Online Journal of Primary Education 2021, volume 10, issue 1
Copyright © International Online Journal of Primary Education 4
often undergo a language shift by mainly interacting with interlocutors of the majority language
(English), which results in them failing to gain native-like proficiency in their HLs (Carreira &
Kagan, 2017; Seals & Peyton, 2017).
Immigrant parents’ practices and involvement in their children’s HL development
Since HL education is given less attention and support than the societal language (English in the U.S.)
outside the home, immigrant parents’ role prominently plays a pivotal role in their children’s HL
learning and development in the home context. A number of researchers reported that immigrant
parents’ practices and involvement were the most significant factor in sustaining their children’s HL
and that parents’ support was a critical element in the children’s HL development (Guardado, 2010;
Liang, 2018; Lü & Koda, 2011; McCabe, 2016). For example, in their quantitative literacy assessment
studies with 37 first- and second-grade Chinese-English bilingual children, Lü and Koda (2011)
showed that Chinese immigrant parents’ HL use and literacy support at home influenced their
children’s language and literacy skills in Chinese (i.e., oral vocabulary knowledge, phonological
awareness, and decoding skill). Similarly, in his case study involving Hispanic families in Canada,
Guardado (2010) revealed the importance of parental involvement in their children’s HL development
by showing that the children who advanced their HL had received positive support of learning HL
from their parents. The studies discovered that the parents’ home literacy practices facilitated their
children’s HL development in the long term.
Multiple studies showed how “family language policy (FLP)” that forces the use of HL exclusively at
home (Spolsky, 2012) played an instrumental role in children’s HL learning and development in
immigrant households (e.g., Fogle & King, 2013; Guardado & Becker, 2015; Yazan & Ali, 2018). For
example, in a study with an Arabic-speaking Muslim family, Yazan and Ali (2018) showed that the
parents’ language ideologies and policy regarding their daughter's maintenance of Arabic in the U.S.
influenced the emergence and enactment of the daughter's Arabic HL development. The major
findings in the FLP studies indicate that the exclusive and consistent use of HLs by immigrant
families encouraged the children to not only practice their HLs but also construct their cultural
identity since heritage language-only rules at home are “tied to the families’ and individuals’ sense of
belonging” (Hua & Wei, 2016: 65).
A considerable number of studies explored HL maintenance or loss among immigrant families from
different ethnic origins. The previous studies suggested that family context, including parents’
attitudes, perceptions, and home practices, played an instrumental role in their children’s HL
maintenance and fundamentally influenced their children’s HL outcomes (Liang, 2018). The findings
indicate that immigrant parents should provide adequate support for their children to develop their HL
in the home setting to raise them as bilingual. The following research questions guided the inquiry:
How did the two focal third-grade emergent bilingual students’ oral language use differ from
their earlier use as first graders?
What was the role of parents’ practices and sociocultural influences on the two emergent
bilingual students’ longitudinal language use?
METHOD
I employed qualitative discourse analysis (Gee, 2012) methodology to document, analyze, and
interpret what the selected Korean American students used languages within specific events (Bloome,
Carter, Christian, Otto, & Shuart-Faris, 2004) by analyzing their ways of thinking, interacting, and
speaking in the HL classroom. The study aims to examine two focal HL learners’ bilingual language
use over the years by comparing their current language performance to when they were in first grade.
Thus, I employed a constant comparative analysis method (Strauss & Corbin, 1998) to identify
patterns and functions of consistencies and differences in the focal students’ language use and
performance.

IOJPE
ISSN: 1300 – 915X
www.iojpe.org
International Online Journal of Primary Education 2021, volume 10, issue 1
Copyright © International Online Journal of Primary Education 5
Research Context This study primarily took place in a Korean HL school in a university town in the Midwest where
200,000 people reside. Approximately, 63% of the town population identified as non-Latinx white,
13% as Asian, and 15% as foreign-born. There were no Korean-English bilingual education programs
in the local school districts. Korean parents who wanted to develop their children’s HL in the town
funded the Korean HL school. Thus, the school was private and designed for Korean students in the
town to help their HL learning by providing formal instruction in Korean at each grade level. Most of
the enrolled students were second-generation Korean Americans who were born in the U.S. after their
parents had immigrated to the U.S. The school provided classes for Korean students in preschool-
grade 5. The classes at all grade levels met three hours per week on Saturdays, from 10:20 a.m. to
1:20 p.m. The data collection for this article occurred during the spring semester in first-grade class in
2014 and third-grade class in 2016 at the Korean HL school.
Participants
This paper focused on two focal third graders who attended the third-grade HL class at the Korean HL
school. The two students (Toni and Suji – pseudonyms are used) were purposely selected as the focal
participants for this article since they were former participants as first graders in the pilot study
conducted in the first-grade classroom in the same Korean HL school in Spring 2014. Both Toni and
Suji were born in the U.S. and attended all-English schools during the school week and the Korean
HL school on Saturdays. They had attended the Korean HL school since kindergarten. The students
reported that they used English during the school week and Korean with their parents at home. Both
Toni and Julie spent one month each year visiting relatives in Korea with their families.
The parents of the students participated in this study. They were first-generation Korean immigrants
who came to the U.S. during their twenties. The two mothers of students agreed to participate in
interviews with me and to keep journals about their children’s language use at home. The third-grade
teacher (Mrs. Joen) participated in the study. Mrs. Joen was a female native Korean speaker. She
came to the U.S. three years before the data collection of this study with her husband. It was her
second year as a third-grade teacher at the HL school. I was the first-grade teacher in the same Korean
HL school during the data collection of the pilot study when Toni and Julie enrolled as first graders in
2014, and it was my fourth year of teaching as a first-grade teacher. I referred to myself Ms. Lee in
this paper when I analyzed the findings.
Data Collection Sources and Procedures
Instruction and language use in the first- and third-grade classrooms
Instruction in both the first- and third-grade classrooms was divided into three parts. For the first 50
minutes, the teachers (Mrs. Joen and me) in each grade focused on teaching speaking and listening
comprehension of the Korean language using a government-designated Korean textbook, entitled
Kuk-uh [the Korean language]. Then, the students in each class participated in Korean book reading
and in-class writing for 50 minutes each. During the reading sessions each week, both teachers
brought a Korean picture book (e.g., folktale, fables). The teachers did a picture walk by showing and
discussing book illustrations before reading a book, had the class take turns reading the book aloud,
and then held a book discussion as a whole group. The primary language of instruction was Korean in
both first- and third-grade classrooms. Although the teachers mainly spoke Korean in their
classrooms, the students in both grades were allowed to use English when they raised questions or
communicated with their peers.
Audio-recording of students’ talk
The audio recordings of Toni and Julies’ spoken language use when they were in the first-grade
classroom had previously been collected for the pilot study. I had audio-recorded the students’ talk
when they participated in class discussions based on the books that the class had read together.
Similarly, the audio-recordings of Toni’s and Julies’ current oral language use in Mrs. Joen’s class
occurred during Korean book reading time for 30-40 minutes each week for 14 weeks, resulting in

IOJPE
ISSN: 1300 – 915X
www.iojpe.org
International Online Journal of Primary Education 2021, volume 10, issue 1
Copyright © International Online Journal of Primary Education 6
about 500 minutes of audio-recording from each classroom. Then, I purposefully selected Toni’s and
Julie’s oral language use when they provided their responses and engaged in the book discussions.
Student interviews
The interviews with the two students took place twice after school at the beginning and end of the
Spring semester. For the first interview, I asked approximately ten interview questions about their
language use at home (with parents, siblings, peers, etc.), language preferences in different contexts
(e.g., at home, school, other public places), and different language domains (e.g., reading, speaking,
writing). For the second interview, both Toni and Julie received interview questions based on his/her
language use from the audio recordings in a retrospective way. In other words, I used a preliminary
analysis of their classroom language use data to discuss their language use and choice at that time of
speaking. During the interviews, the students were allowed to provide their responses either in
English or Korean based on their preference.
Mothers’ interviews and journals
The mothers of Toni and Julie participated in a semi-structured and open-ended interview with me.
The interview with each mother was conducted after I completed analyzing the students’ first- and
third-grade language use data. For the interviews with the mothers, I brought the analysis of their
children’s first-grade oral language use. I then shared with them their children’s third-grade language
use data to show any shift in their language use over the years and to discuss their HL learning
trajectory. By sharing the longitudinal data during the interviews, I was able to further learn about the
mothers’ perspectives and philosophies on their children’s Korean language and literacy learning
while living in the U.S. The mothers kept their journals on two to three different days per week to
record their child’s language use at home when s/he participated in activities with his/her family
members. I gave the mothers several examples of events/activities that could capture the child’s
Korean language use (e.g., when their child talked with their grandparents in Korea via Skype, when
they watched Korean TV programs or movies with their child, or when their child invited their
Korean friends to their house). I collected the mothers’ journals at the end of the semester and had 30
journal entries from each mother.
Data Analysis The transcripts of audio recordings were the main resources for this qualitative study to examine the
students’ oral language use over the years. The transcripts of the mothers’ interviews and their
journals were analyzed to corroborate the students’ language use findings and to further learn about
the parents’ practices and attitudes toward their children’s HL learning.
To seek the answer for Research Question 1 – the comparison of the two focal third-graders’ oral
language use to their earlier use as first graders – the transcripts of their oral discourses during book
discussions both from first- and third-grade class were analyzed. The students’ oral language use was
examined based on whether they used Korean, English, or “translanguaging,” which describes
bilingual learners’ strategy to utilize their integrated and entire language repertoires (García, 2009).
Then, their language data when they were in my first-grade class was analyzed and compared to their
current language use as third graders to document the pattern of their HL use over time. Comparing
their language use in the past to their current language use as a longitudinal study helped me explore
any observed different language use patterns over time.
For Research Question 2 – the parents’ practices and sociocultural influences on the students’
longitudinal language use – the mothers’ interviews and their journals were analyzed to identify any
regular practices that the parents performed at home with their children. The interview results
provided additional information about the families’ home language use and relevant language and
literacy practices that could influence their children’s longitudinal language use.

IOJPE
ISSN: 1300 – 915X
www.iojpe.org
International Online Journal of Primary Education 2021, volume 10, issue 1
Copyright © International Online Journal of Primary Education 7
RESULTS
Comparison of Focal Students’ Oral Language Use between First and Third Grade
Table 1 compares Toni and Julie’s language use during classroom interactions when they were first
and third graders. The table displays how often Toni and Julie used Korean, English, and
translanguaging when they spoke in both grades.
Table 1. Comparison of Toni and Julie’s oral language use between first and third grade
Only
Korean
Only
English
Word-level
translanguaging a
(English words in
Korean speech)
Word-level
translanguaging b
(Korean words in
English speech)
Frequency of TL at
sentence-level c
(Korean to English and vice
versa)
1st grade
(Spring 2014)
Toni 36
(12%)
122
(41%)
138
(46%)
4
(1%)
91 times
Julie 41
(13%)
98
(32%)
163
(53%)
6
(2%)
87 times
3rd grade
(Spring 2016)
Toni 182
(51%)
32
(9%)
138
(38%)
8
(2%)
30 times
Julie 196
(49%)
38
(8%)
170
(41%)
9
(2%)
26 times
Note. a Intra-sentential switching within a single utterance when the students inserted English words as they spoke in Korean. b Intra-sentential switching within a single utterance when the students inserted Korean words as they spoke in English.
c Inter-sentential switching between the utterances (Korean to English and vice versa).
Increased use of Korean when speaking in third grade
As shown in Table 1, when Toni and Julie were in first grade, they both spoke more in English than in
Korean (41% in English vs. 12% in Korean for Toni; 32% in English vs. 13% in Korean for Julie).
Conversely, their third-grade language use revealed that they spoke more in Korean than in English
(51% in Korean vs. 9% in English for Toni; 49% in Korean vs. 8% in English for Julie). Both Toni
and Julie still engaged in word-level translanguaging when they were in third grade, but the frequency
of inserting English words when they spoke in Korean decreased (from 46% to 38% for Toni; from
53% to 41% for Julie). The frequency of their sentence-level switching (from Korean to English and
vice-versa) was also less observed in their third-grade classroom (from 91 to 30 times for Toni; from
87 to 26 times for Julie). In other words, there was increased use of Korean and a decrease in their use
of English when they were in third grade compared to when they were in first grade.
Development of vocabulary knowledge in Korean
The focal students’ increased vocabulary knowledge in Korean appeared to play a role in their
increased use of Korean as third graders. Comparing Toni’s language use in Figure 1 (in first grade)
and Figure 2 (in third grade) shows evidence of his vocabulary gain in Korean. As shown in Figure 1,
Toni (first grader) translanguaged into English for the words “favorite part” (turn 2) when he
responded to my question about the book that the class read. When Toni was asked how to say the
words in Korean, he stated that he knew how to say “like” but did not know the word “favorite” in
Korean. In other words, Toni (as a first grader) translanguaged into English for unknown words to
complete his response, which performed as a communicative purpose. (English translations are
provided within the brackets. Translanguaged words are underlined in the English translation.)
1. Ms. Lee: 너네 은혜 반 친구들이 이름이 담긴 병 만든 거 기억해?
[Do you all remember the part when the classmates created the name jar for Unhei?]
2. Toni: 네, 그거 내 favorite part 에요.
[Yes, that was my favorite part.]
Figure 1. Toni’s (first grade) translanguaging for unknown Korean words
IOJPE
ISSN: 1300 – 915X
www.iojpe.org
International Online Journal of Primary Education 2021, volume 10, issue 1
Copyright © International Online Journal of Primary Education 8
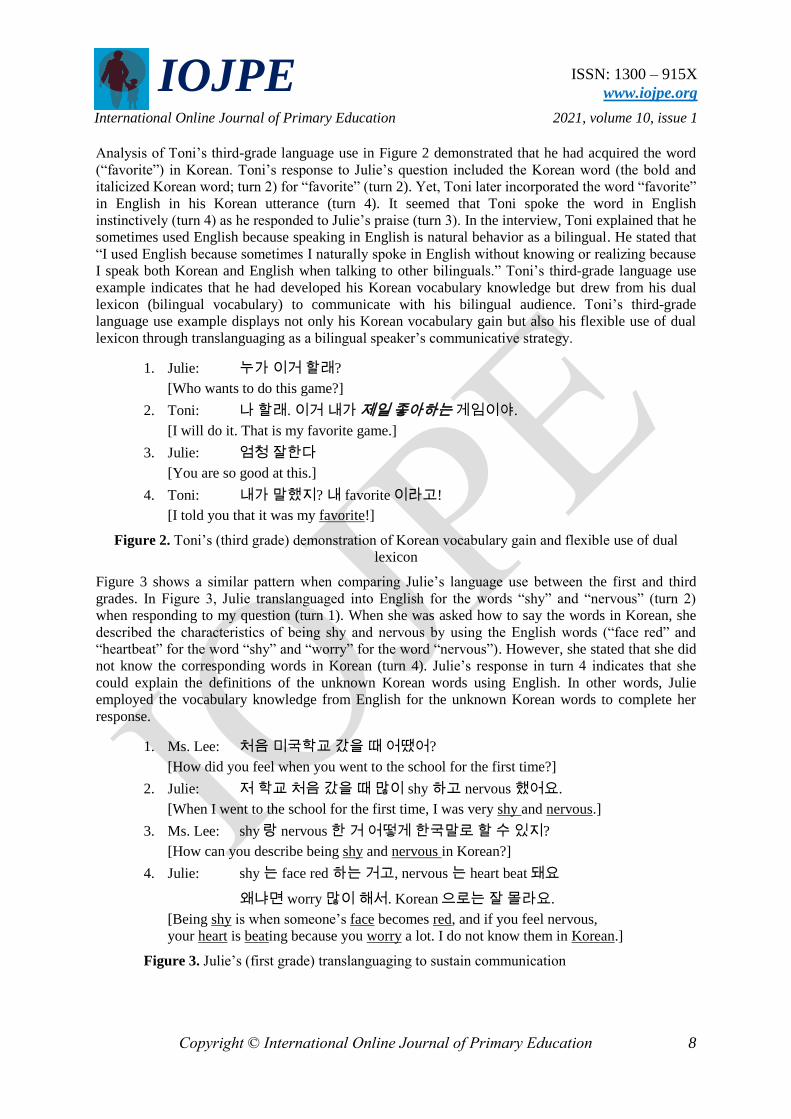
Analysis of Toni’s third-grade language use in Figure 2 demonstrated that he had acquired the word
(“favorite”) in Korean. Toni’s response to Julie’s question included the Korean word (the bold and
italicized Korean word; turn 2) for “favorite” (turn 2). Yet, Toni later incorporated the word “favorite”
in English in his Korean utterance (turn 4). It seemed that Toni spoke the word in English
instinctively (turn 4) as he responded to Julie’s praise (turn 3). In the interview, Toni explained that he
sometimes used English because speaking in English is natural behavior as a bilingual. He stated that
“I used English because sometimes I naturally spoke in English without knowing or realizing because
I speak both Korean and English when talking to other bilinguals.” Toni’s third-grade language use
example indicates that he had developed his Korean vocabulary knowledge but drew from his dual
lexicon (bilingual vocabulary) to communicate with his bilingual audience. Toni’s third-grade
language use example displays not only his Korean vocabulary gain but also his flexible use of dual
lexicon through translanguaging as a bilingual speaker’s communicative strategy.
1. Julie: 누가 이거 할래?
[Who wants to do this game?]
2. Toni: 나 할래. 이거 내가 제일 좋아하는 게임이야.
[I will do it. That is my favorite game.]
3. Julie: 엄청 잘한다
[You are so good at this.]
4. Toni: 내가 말했지? 내 favorite이라고!
[I told you that it was my favorite!]
Figure 2. Toni’s (third grade) demonstration of Korean vocabulary gain and flexible use of dual
lexicon
Figure 3 shows a similar pattern when comparing Julie’s language use between the first and third
grades. In Figure 3, Julie translanguaged into English for the words “shy” and “nervous” (turn 2)
when responding to my question (turn 1). When she was asked how to say the words in Korean, she
described the characteristics of being shy and nervous by using the English words (“face red” and
“heartbeat” for the word “shy” and “worry” for the word “nervous”). However, she stated that she did
not know the corresponding words in Korean (turn 4). Julie’s response in turn 4 indicates that she
could explain the definitions of the unknown Korean words using English. In other words, Julie
employed the vocabulary knowledge from English for the unknown Korean words to complete her
response.
1. Ms. Lee: 처음 미국학교 갔을 때 어땠어?
[How did you feel when you went to the school for the first time?]
2. Julie: 저 학교 처음 갔을 때 많이 shy 하고 nervous 했어요.
[When I went to the school for the first time, I was very shy and nervous.]
3. Ms. Lee: shy랑 nervous 한 거 어떻게 한국말로 할 수 있지?
[How can you describe being shy and nervous in Korean?]
4. Julie: shy 는 face red 하는 거고, nervous 는 heart beat돼요
왜냐면 worry 많이 해서. Korean으로는 잘 몰라요.
[Being shy is when someone’s face becomes red, and if you feel nervous,
your heart is beating because you worry a lot. I do not know them in Korean.]
Figure 3. Julie’s (first grade) translanguaging to sustain communication

IOJPE
ISSN: 1300 – 915X
www.iojpe.org
International Online Journal of Primary Education 2021, volume 10, issue 1
Copyright © International Online Journal of Primary Education 9
Contrariwise, Julie’s third-grade language use in Figure 4 demonstrated that she had acquired the
Korean words that she had not known in first grade. Julie’s answer to Mrs. Joen’s question included
the Korean words for “shy” and “nervous” (the bold and italicized Korean words; turn 2). However,
although Julie demonstrated her vocabulary gain in Korean, she still incorporated the English word
“nervous” in her Korean discourse (turn 4). Close analysis revealed that she uttered the word in
Korean first and then translanguaged to repeat the word in English. In the interview, Julie explained
that she repeated the word in English to emphasize its meaning in her response. Julie stated, “I said
the word “nervous” again in English because I wanted to emphasize how much Erevan (the character
in the book) was nervous.” Her translanguaging in this example was to emphasize her intended
meaning by repeating the word in English. Julie’s translanguaging is similar to the concept of
bilingual re-voicing. Similar to what Toni did in the earlier excerpt, Julie as a bilingual speaker was
able to move across the languages flexibly by selecting her dual lexicon from her bilingual resources.
1. Julie: 에르반이 부끄러워서 귀가 빨개졌어요. 떨리고 겁이 났어요 실수할까봐
[Erevan’s ears became red because he was shy. And he felt nervous and anxious.]
2. Julie: 왜냐면 수학문제 푸는데 실수할까봐 떨렸어요 nervous 했어요.
[Erevan was nervous nervous (repeated the word); he was afraid of making mistakes
when he solved the mathematics problem.]
Figure 4. Julie’s (third grade) employment of translanguaging to emphasize
Parents’ Practices and Socio-cultural Influences on the Focal Students’ HL Development
Home language policy in the family
When Toni and Julie were first graders, they stated that they were more likely to use English than
Korean at home, even when interacting with their parents. Although their parents asked them
questions in Korean, Toni and Julie mostly replied in English. In other words, when Toni and Julie
were first graders, their primary language at home was English, according to their first-grade
interview results.
Nevertheless, it was interesting to find that their language use at home in third grade had shifted.
Toni, as a third grader, stated that he was required to speak in Korean at home upon his father’s
request, explaining:
I have to speak in Korean with my parents. My dad gets mad when I reply in English during
our conversation. He really wants me to use Korean all the time at home. When my dad is not
at home, I can use English for my mom. But when there is my dad, I always have to use
Korean.
Toni’s mother provided a more concrete answer to explain why her husband became strict about
Toni’s language use. The mother indicated that they (her and her husband) were generous about
Toni’s English use at home when he was in first grade. However, when they observed that Toni
exclusively used English with them, the father began to force Toni to use Korean when speaking to
them:
When Toni was in the first grade, we did not push him to use Korean at home because we
believed that it was a transition time for him from using more Korean to more English. But,
after a certain period, we witnessed that Toni used English predominantly even with us at
home. Thus, my husband strictly told Toni that he had to speak in Korean whenever he says
something to us.
Similarly, Julie stated that it was acceptable for her to use English at home when she was a first
grader, but by the time she became a third grader, her parents made a Korean-speaking only rule at
home. She shared:

IOJPE
ISSN: 1300 – 915X
www.iojpe.org
International Online Journal of Primary Education 2021, volume 10, issue 1
Copyright © International Online Journal of Primary Education 10
Korean is the language that my family has to use at home. It was okay to use English when I
was younger, and I used English all the time. But nowadays my parents keep asking me to
speak Korean only at home. We have a Korean-speaking only rule at home.
Julie’s mother shared that Julie used to be outgoing and talkative when she interacted with others in
Korean, which had led her to learn Korean quickly. Yet, once Julie entered kindergarten, she had
difficulty interacting with peers in her American school because of her limited English proficiency.
Therefore, her parents considered learning English to be an essential issue for Julie at that time. Her
mother explained:
When we saw that Julie often felt depressed, we thought that teaching English should be the
first step for Julie so that she would feel confident in her American school. That is why there
had been a time when we provided educational resources more in English than in Korean. For
instance, we provided English songs, videos, and books at home.
As Julie became proficient enough in English, the parents observed that she tended to speak only in
English and rarely used Korean. The mother explained that this was the reason why they initiated a
Korean-only rule at home, stating, “We were concerned about Julie not using Korean, so we decided
to make a Korean-language-only rule at home.”
Parents’ instructional focus on reading in Koran
Both the mothers’ interview results and journal reports showed that they spent Korean book reading
time with their children on a regular basis at home. The mothers indicated that they were concerned
about their children’s literacy development in Korean because of the limited opportunities and
resources for HL literacy learning. Thus, both Toni and Julie’s parents had engaged in their children’s
literacy learning regularly by providing instruction for Korean reading at home.
Julie’s mother pointed out that she felt Julie was a slow reader when she read Korean books,
compared to when she read English books in first grade. Once the mother noticed that Julie was a
slower reader in Korean than in English, she had held a Korean book reading time with Julie every
day until now. She asked Julie to read a Korean picture book aloud every night, and the mother helped
her with difficult Korean words or phrases, along with their pronunciations and meanings. According
to the mother, although Julie sometimes asked her mother for help when she found unknown Korean
words, she became an independent reader when reading Korean books by the time she became a third
grader.
In Toni’s case, his mother stated that Toni was an avid reader in the fantasy fiction genre. According
to the mother, Toni began to read the Harry Potter series in English in second grade. When Toni’s
grandparents from Korea visited his home during the summer break between second and third grade,
they brought the Harry Potter series written in Korean. Toni began to read the Korean version of the
books independently in third grade. Toni often told his mother that there were many unknown Korean
words, which she usually explained by providing synonyms or example sentences. The mother
believed that this practice (his independent reading with her assistance) had helped Toni improve his
oral and reading fluency in Korean and develop his Korean vocabulary.
Both mothers acknowledged that they had focused on their children’s Korean reading comprehension
beyond their decoding skills in Korean. Toni’s mother stated that although Toni read Korean books
relatively fast, he sometimes did not understand the books he read. The mother reported that she
usually checked Toni’s reading comprehension by asking Toni to retell the stories when he finished
reading Korean books, explaining:
Whenever Toni told me he was done reading Korean books, I asked him to retell the story of
the books, but he often did not remember the plot or story of the book in detail; thus, I usually
provided a few guiding questions about the character or scene so that he could tell me about
the story.
IOJPE
ISSN: 1300 – 915X
www.iojpe.org
International Online Journal of Primary Education 2021, volume 10, issue 1
Copyright © International Online Journal of Primary Education 11
Similarly, Julie’s mother mentioned that she often asked Julie to retell the story of Korean books that
she had finished reading. According to the mother, Julie sometimes provided the retelling of Korean
storybooks using English, but her English retelling indicated that she comprehended the stories
accurately. The mother shared that she usually asked Julie to retell the story in Korean again, which
might have helped Julie improve her oral speech in Korean by making up her own sentences using
Korean. She explained:
Julie sometimes told me her retelling story in English although she read the book in Korean.
But I was able to see that she understood the story from the book. After she told the story in
English, I encouraged her to retell the story in Korean again.
The influence of relatives
The focal mothers’ journals showed that their relatives also had influenced their children’s Korean
language learning. In Toni’s case, his grandparents from Korea visited Toni’s home in the U.S. and
stayed with them for a month during the data collection. Because Toni’s grandparents did not speak
any English, Toni had to use Korean, which eventually resulted in Toni practicing more Korean. One
of the mother’s journal reports indicated that Toni had learned how to play a Korean traditional game
“Yutnori” from his grandparents. The mother believed that learning a traditional game from the
grandparents had not only provided a good opportunity for Toni to learn about the Korean culture
from the traditional game but also helped him improve his listening and speaking in Korean because
Korean is the only language that Toni could use with his grandparents. The mother observed that Toni
always paid close attention to his grandparents to understand what they said, explaining:
When we explained something to Toni in Korean, but he did not get it, he often asked us to
repeat it in English because he knew that we could speak in English. However, during the
conversation with his grandparents, Toni tried to understand their Korean without asking
them to restate what they said because he knew that his grandparents spoke Korean only.
Thus, we believe that the grandparents’ visits had played a significant role in Toni’s Korean
language use and learning.
Toni’s mother further stated that having a regular conversation with his grandparents during phone
calls or via Skype had helped Toni acquire Korean words and expressions. She stated:
When Toni heard Korean words or expressions that he did not know from his grandparents
over the phone or via Skype, he often asked me the equivalent words in English or the
meaning of those unfamiliar expressions. I believe that the regular practice of communicating
with his grandparents helped Toni acquire many Korean words and expressions that are not
commonly used in the U.S. context.
Similarly, the journal entries by Julie’s mother also showed the influence of Korean relatives on
Julie’s language use and learning. During the data collection of the study, Julie’s aunt, who lived in
Korea and barely understood English, visited Julie’s house. Julie’s mother observed that Julie spoke
Korean exclusively when she talked to her aunt. The mother once recorded Julie’s language use when
the family played the board game “monopoly.” Julie was familiar with instructions of the game in
English but tried to explain to her aunt how to play it using Korean only as she knew that her aunt
would not understand if the rules were explained in English. Julie’s mother believed that the presence
of Julie’s aunt provided a good opportunity for Julie to be immersed in Korean as she tried to use
Korean all the time with her aunt, who only spoke Korean:
I noticed that when Julie explained the instructions to her aunt, her speech was a little bit
clumsy and awkward since she explained everything in Korean. I know that she could have
explained more fluently if she used English, but I saw that she stayed in Korean because Julie
knew that her aunt would not understand if she used English. Also, since her aunt knew
Julie’s imperfect Korean language proficiency as a Korean American child, her aunt did not

IOJPE
ISSN: 1300 – 915X
www.iojpe.org
International Online Journal of Primary Education 2021, volume 10, issue 1
Copyright © International Online Journal of Primary Education 12
concern or criticize Julie’s somewhat limited Korean expressions or awkward pronunciations.
I think this led Julie to freely use her Korean without hesitation or reluctance.
The mothers’ interviews and journal reports showed that both Toni and Julie’s language use with their
relatives promoted their Korean language use and learning. Toni’s and Julie’s language use examples
illustrate that they flexibly chose their languages according to their interlocutors’ language use and
proficiencies.
The influence of media
Korean media also seemed to play a pivotal role in Toni and Julie’s Korean language learning. The
journal entries kept by Toni’s mother reported that Toni watched one of his favorite Korean television
programs, “Running Man,” on every Sunday evening with his father. In this program, there were
many Korean entertainers, and they were engaged in diverse activities that included funny episodes.
According to the mother’s journal, Toni knew the entertainers’ names, the nicknames they used in the
program, and their hilarious characteristics. However, because many of the conversations among the
entertainers were not always straightforward (e.g., using exaggerated expressions to make jokes,
adding humorous language with jargon), it was difficult for Toni to understand the conversation
completely. His mother observed that Toni sometimes asked his father about words or expressions
that the characters used in certain situations. Although Toni did not know the meanings of every
word, the mother believed that he mostly appeared to grasp the intended messages in certain situations
because he knew the overall context and circumstances. Toni’s mother stated:
Although Toni could not get all the dialogues among the entertainers, he seemed to
understand what was going on in certain situations. I think Toni’s incomplete Korean
communicative skills did not hinder him from understanding or enjoying watching the
program; rather, the exposure to the Korean program accelerated Toni’s Korean
communicative skills.
The journal entries by Julie’s mother also showed how Korean media positively influenced Julie’s
Korean learning. According to the mother’s journal, Julie watched a Korean program in which many
famous Korean singers appeared in a competition to select a top singer. The mother often recorded
when Julie repeated the Korean songs as she listened to them. During the mother’s interview, it was
revealed that Julie knew many Korean singers and memorized their songs by listening to them
repeatedly. The mother shared that Julie occasionally asked her mother to print out the lyrics of her
favorite Korean songs so that she could sing them by looking at the lyrics. This eventually led her to
memorize the lyrics although sometimes she did not know all the meanings of the phrases. The
mother believed that listening to Korean songs and reading the Korean lyrics had assisted Julie to gain
Korean vocabulary and to improve her Korean pronunciation:
I have seen Julie singing Korean songs many times at home. I think singing Korean songs
helped Julie learn Korean easily since it provided Julie a good opportunity to learn about
Korean vocabulary in context and acquire more native-like pronunciation.
Developed courtesy manners appropriate for their heritage culture During the data collection of this study, Toni’s and Julie’s nonverbal performances along with their
verbal communication were observed, which demonstrated their understanding of Korean courtesy
and manners. The comparison of their spoken and behavioral performances between first and third
grades showed that they had developed how to use polite speech patterns in Korean (i.e., honorifics)
and learned the required body gesture when greeting (i.e., bowing) to older Korean people.
Appropriate use of Korean honorifics
A comparison of Toni and Julie’s oral language use between first and third grade showed that their
use of honorifics (a polite form of speaking) has been firmly established. It is important to note that
using honorifics is a required practice in the Korean language, which is a formal and humble form of
speaking in Korean. This indicates that hierarchical social status of speakers plays an essential role in

IOJPE
ISSN: 1300 – 915X
www.iojpe.org
International Online Journal of Primary Education 2021, volume 10, issue 1
Copyright © International Online Journal of Primary Education 13
social interaction as it conveys esteem, courtesy, or respect when addressing or referring to a person
(Brown, 2011). Although young Korean children seldom use it with their parents in the home setting
to express intimacy and affection, most Korean parents teach their children how to properly conjugate
Korean honorifics when communicating with others in the polite form.
When Toni and Julie were in first-grade, Julie was the student who did not use honorifics when
communicating with me (her first-grade teacher). On the other hand, analysis of the students’ oral
language use in third grade showed that Julie used honorifics appropriately whenever she responded
to Mrs. Joen. In addition, Julie also appropriately used honorifics during the interviews with me
during the data collection of this study as well as when she met other Korean teachers in the school
building. According to Julie’s mother, her parents had not asked her to use honorifics when speaking
to them. However, when Julie was in second grade, there was an occasion when her mother saw Julie
not using honorifics when she met a Korean adult neighbor. Since then, the mother had tried to teach
Julie how to use honorifics to other Korean adults in a proper manner.
For Toni’s case, although he was more likely to use Korean honorifics to address me in his first-grade
class, he did not always use them properly. There are different levels of Korean honorifics depending
on the level of politeness. For instance, to make honorifics, Korean speakers not only have to add a
suffix to the end of verbs but also switch the verbs to suppletive forms to connote being humble. In
first grade, Toni often correctly added suffixes to the end of verbs but rarely used the polite form of
verbs. However, his third-grade speech displayed that he had learned how to use appropriate
honorifics during the conversation with Mrs. Joen and me. According to Toni’s mother, when he
became a second grader, his father constantly asked him to use honorifics to address his parents. The
mother also said that Toni had a lot of opportunities to practice Korean honorifics when his family
visited Korea every summer. Thanks to the parents’ lesson on the humble and polite form of using
honorifics, both Toni and Julie appeared to use Korean honorifics appropriately throughout their
third-grade language use data.
Bowing when greeting
When Koreans greet older people, they use not only honorifics (Brown, 2011) but also a specified
body gesture (i.e., bowing). Bowing is the act of lowering the torso and head as a social gesture
towards older people (Brown & Winter, 2018). Since I was not the teacher for Toni and Julie when
they were third graders, the students did not regularly see me in the classroom. However, I met them
occasionally in the hallway in the school building during the semester of data collection. Whenever
the students greeted me, they bowed to me while using honorifics (the formal form of “hi” in Korean).
Their actions indicated that they had learned how to bow when greeting an adult.
During the interview with Toni’s mother, the mother revealed that she and her husband had taught
Toni how to greet his grandparents politely by bowing. The mother stated that since Toni regularly
saw his grandparents, he often practiced bowing when greeting them, which led him to use the body
gesture when he met other Korean adults. In Julie’s case, her mother shared that when Julie visited
Korea once a year, she and her husband showed Julie how others bowed when they greeted adults and
taught her the proper way to greet older people. After that, the mother observed that Julie began to
bow when she greeted older Korean people.
DISCUSSION and CONCLUSION
This article presented two focal third-grade Korean bilingual students’ language use over time by
examining different patterns between their first- and third-grade spoken language use. For the Korean
students in the U.S., like Toni and Julie, there has been a pervasive hypothesis that their Korean might
be jeopardized due to their minimum exposure to Korean and its reduced status in the U.S. as well as
their rapid increase in English usage (Carreira & Kagan, 2017; Murphy, 2014; Polinsky, 2018).
Indeed, previous literature revealed that when emergent bilinguals attended all-English schools taught
only in English, the students tended to experience HL shift or loss because they did not have much

IOJPE
ISSN: 1300 – 915X
www.iojpe.org
International Online Journal of Primary Education 2021, volume 10, issue 1
Copyright © International Online Journal of Primary Education 14
exposure and opportunity to develop their HL (Montrul, 2018; Shin, 2014). However, the present
study showed that the focal third graders who were attending all-English schools during the week did
not lose their HL since they continued to use their HL at home and improved Korean proficiency by
interacting with other Korean speakers at the Korean HL school.
The comparison of findings indicated an increase in Korean and a decrease in English in the students’
oral language use over the two years. It was further revealed that the patterns and functions of their
translanguaging when speaking in the two grades were different. As first graders, Toni and Julie
frequently employed oral translanguaging into English because they did not know the corresponding
words in Korean. That is, their translanguaging in first grade was often found when they borrowed
their language repertoires from English for the unknown or unsure Korean words, which consequently
helped them complete their talk.
In third grade, however, it displays that the students had learned about most of the Korean words that
they had not known in first grade. In other words, Toni’s and Julie’s translanguaging in third grade
occurred not because they did not know the correspondences in Korean but because they were flexibly
employing their bilingual resources from both languages. Their translanguaging in third grade implies
that they were sociolinguistic competent in both languages. In other words, although Toni and Julie
engaged in translanguaging as a bilingual’s natural practice in both first and third grades, their
translanguaging practices in third grade appeared to be more strategic and purposeful (e.g., to
highlight) than in first grade. In the same sense, analysis of their language use in third grade displayed
that they decisively and intuitively translanguaged (e.g., bilingual re-voicing; Gort & Sembiante,
2015), which suggests that their translanguaging practices in third grade met a metalinguistic function.
The parents’ Korean-language-only rule at home appears to play a pivotal role in the students’
longitudinal language use between first and third grades. It was discovered that the parents focused on
their children’s literacy learning in Korean at home by providing Korean book reading time, which
assisted their children to improve their Korean communicative skills. Frequent communication with
their Korean relatives helped Toni and Julie practice Korean as much as possible by considering their
interlocutors’ different language preferences/proficiencies. In addition, exposure to Korean media
(television programs and songs) also seemed to influence their increased Korean language use over
the years. Overall, the findings showed that the focal third graders did not experience HL shift or loss;
rather, they were able to improve their communicative skills gradually and becoming competent
Korean speakers both sociolinguistically and socioculturally as they have developed Korean courtesy
manners in their heritage culture, such as appropriate use of formal Korean (i.e., honorifics) and
required body gestures (e.g., bowing). Accordingly, their third-grade Korean language use further
demonstrates their understanding and knowledge of cultural values and manners beyond their
sociolinguistic competence in their HL.
Implications and directions for future research When researchers pay close attention to bilingual children’s complex and rich linguistic experiences
and resources at home as well as immigrant families’ efforts to support their children’s HL
development, they can advocate and empower bilingual families’ and their children’s linguistic and
cultural resources as valuable assets (Cummins & Persad, 2014; Shin & Viruru, 2021). By focusing
on how bilingual children participate in the home- and community-based discourses, researchers can
contribute to constructing the practices and pedagogies to expand emergent bilingual children’s
language and literacy repertoires for their HL development. These directions for future research will
help us understand how to support HL bilingual children’s overall language learning and
development.
Given the socio-political contexts surrounding HL and bilingual education (Leija & Franquiz, 2021;
Melo-Pfeifer, 2015), teachers of bilingual learners of HL need to realize that pedagogies based on
language separation could easily marginalize students’ HLs. As shown in this study, although the
language of instruction was primarily in Korean both in the first and third-grade classrooms, the

IOJPE
ISSN: 1300 – 915X
www.iojpe.org
International Online Journal of Primary Education 2021, volume 10, issue 1
Copyright © International Online Journal of Primary Education 15
students utilized their entire language resources through translanguaging when needed to engage in
class discussions. This finding suggests that HL teachers should allow bilingual learners of HL to
engage in translanguaging practices by utilizing their entire language repertoires flexibly when they
verbally communicate. By doing so, teachers of HL learners can motivate their students to actively
learn and participate in the classroom, and the classroom can become a vibrant bilingual space where
the students and teachers can display dynamic bilingualism while developing their HLs.
Immigrant parents whose children are emergent bilinguals of HL learners should acknowledge that
they play a vital role in their children’s HL maintenance and development (Lee, 2021; Liang, 2018;
Yazan & Ali, 2018). This study showed that parental involvement and practices at home helped their
children’s HL use and learning over the years. Hence, parents of emergent bilingual children should
encourage the use of HL at home and provide diverse opportunities for their children to make use of
it. As shown from the findings, immigrant parents should understand that communicating with other
family relatives can provide an opportunity for their children to learn and practice their HL. Parents
can also promote their children’s literacy skills in HL by providing various reading materials and
spending reading time with their children together. In addition, as the study exhibited the positive
impact of media in HL learning, parents can provide songs, television programs, or video resources in
HL so that their children are more likely to be motivated in developing HL from their positive
learning experiences.
The limitations of the research
This study had a number of limitations. First of all, although it was a longitudinal study, the focal
student sample size (n=2) was still small. Secondly, since I was the teacher in the first-grade
classroom but was not the teacher for the third-grade students, it was difficult to capture data on their
inner speech from the audio-recordings of their class interactions. Thus, there was a limited number of
third-graders’ translanguaging findings that served as their sociolinguistic and metalinguistic
functions in their oral language use. Although I asked Mrs. Joen (the third-grade teacher) to audio-
record the student talk in the third-grade classroom, I (as a researcher) was not present in the research
setting; thus, I might not be familiar with the classroom context in detail, and I might not have
understood some of the data accurately. For instance, I was able to hear the students’ voices but could
not see their non-verbal language (e.g., body gestures, facial expressions), which might have led to a
more precise analysis. Thirdly, I hold positions as an insider (the classroom teacher) and an outsider
(the researcher in this study). My dual role and positionality in this study might impact the study’s
credibility. For example, the mothers might have considered me as their child’s teacher rather than a
researcher during the interviews; thus, their answers might have been overly influenced by my own
stance and viewpoint (i.e., valuing HL learning and supporting bilingualism rather than favoring of
English-only education and monolingualism).
REFERENCES
August, D., & Shanahan, T. (2010). Response to a review and update on “Developing literacy in second-language learners:
Report of the national literacy panel on language minority children and youth.” Journal of Literacy Research,
42(3), 341-348.
Beaudrie, S., Ducar, C., & Potowski, K. (2014). Heritage language teaching: Research and practices. McGraw-Hill
Education Create.
Bloome, D., Carter, S. P., Christian, B. M., Otto, S., & Shuart-Faris, N. (2004). Discourse analysis and the study of
classroom language and literacy events: A microethnographic perspective. New York, NY: Routledge.
Brown, L. (2011). Korean honorifics and politeness in second language learning. Amsterdam: John Benjamins.
Brown, L., & Winter, B. (2018). Multimodal indexicality in Korean: “doing deference” and “performing intimacy” through
nonverbal behavior. Journal of Politeness Research, 15(1), 25–54
Carreira, M., & Kagan, O. (2017). Heritage language education: A proposal for the next 50 years. Foreign Language
Annals, 51(1), 152-168.
IOJPE
ISSN: 1300 – 915X
www.iojpe.org
International Online Journal of Primary Education 2021, volume 10, issue 1
Copyright © International Online Journal of Primary Education 16
Cho, G. (2015). Perspectives vs. reality of heritage language development: Voices from second-generation Korean-
American high school students. Multicultural Education, 22(2), 30-38.
Cummins, J., & Persad, R. (2014). Teaching through a Multilingual Lens: The Evolution of EAL Policy and Practice in
Canada. Education Matters, 2, 3-40.
Elabbas, B., Montrul, S., & Polinsky, M. (2013). Heritage languages and their speakers: opportunities and challenges for
linguistics. Theoretical Linguistics, 39(3-4) 129– 181.
Fogle, L., & King, K. (2013). Child agency and language policy in transnational families. Issues in Applied Linguistics, 19,
1-25.
García, O. (2009). Bilingual education in the 21st century: A global perspective. West Sussex, UK: Wiley-Blackwell.
Gandara, P., & Hopkin, M. (2010). Forbidden language: English learners and restrictive language policies. New York,
NY: Teachers College Press.
Gee, J. P. (2012). Social linguistics and literacies: Ideology in discourses (4th ed.). New York, NY: Routledge.
Golberg, H., Paradis, J., & Crago, M. (2008). Lexical acquisition over time in minority L1 children learning English as a
L2. Applied Psycholinguistics, 29, 1–25.
Goldenberg, C. (2011). Reading instruction for English language learners. In M. Kamil, P. D. Pearson, E. B. Moje, & P.
Afflerbach (Eds.), The handbook of reading research (Vol. 4, pp. 684–710). New York, NY: Routledge.
Gort, M., & Sembiante, S. (2015). Navigating hybridized language learning spaces through translanguaging pedagogy:
Dual language preschool teachers’ languaging practices in support of emergent bilingual children’s performance of
academic discourse. International Multilingual Research Journal, 9, 7–25.
Guardado, M. (2010). Heritage language development: Preserving a mythic past or envisioning the future of Canadian
identity? Journal of Language, Identity & Education, 9(5), 329-346.
Guardado, M. & Becker, A. (2015). ‘Glued to the family’ the role of familism in heritage language development.
Language, Culture and Curriculum, 27(2), 163-181.
Halliday, M. A. K. (1985). An Introduction to Functional Grammar (1st ed.). London: Edward Arnold.
Hua, Z., & Wei, L. (2016). “Where are you really from?”: Nationality and Ethnicity Talk (NET) in everyday interactions.
In Z. Hua & C. Kramsch (Eds.), Symbolic power and conversational inequality in intercultural communication,
Applied Linguistics Review, 7(4), 449-470.
Kim, C., & Pyun, D. (2014). Heritage language literacy maintenance: A study of Korean-American heritage learners.
Language, Culture, and Curriculum, 27(3), 294-315.
Kondo-Brown, K. (2011). Maintaining heritage language perspectives of Korean parents, Multicultural Education, 19(1),
31-37.
Lee, C. (2021). Role of immigrant parents’ attitudes and practices in emergent bilingual students’ language use and
translanguaging. In G., Onchwari, & J, Keengwe (Eds.), Bridging Family – Teacher Relationship for ELL and
Immigrant Students (pp. 182–206). Hershey, PA: IGI Global.
Lee, J. S., & Jeong, E. (2013). Korean-English dual language immersion: Perspectives of students, parents, and teachers.
Language, Culture and Curriculum, 26(1), 89-107.
Lee, J. S., & Wright, W. (2014). The rediscovery of heritage and community language education in the United States.
Review of Research in Education, 38(1), 137-165.
Leija, M., & Franquiz, M. (2021). Building bridges between school and home: Teacher, parents, and students examining
Latinx immigrant experiences, In G., Onchwari, & J, Keengwe (Eds.), Bridging Family – Teacher Relationship for
ELL and Immigrant Students (pp. 100–121). Hershey, PA: IGI Global.
Liang, F. (2018). Parental perceptions toward and practices of heritage language maintenance: Focusing on the United
States and Canada. International Journal of Language Studies, 12(2), 65-86.
Lopez, D. (1996). Language: Diversity and assimilation. In R. Waldinger & M. Bozorgmehr (Eds.), Ethnic Los Angeles
(pp. 139-163). New York: Russell Sage Foundation.
Lü, C., & Koda, K. (2011). The impact of home language and literacy support on English-Chinese biliteracy acquisition
among Chinese heritage language learners. Heritage Language Journal, 8, 119-231.
McCabe, M. (2016). Transnationalism and language maintenance: Czech and Slovak as heritage languages in the
Southeastern United States. International Journal of the Sociology of Language, 238, 169-191.

IOJPE
ISSN: 1300 – 915X
www.iojpe.org
International Online Journal of Primary Education 2021, volume 10, issue 1
Copyright © International Online Journal of Primary Education 17
Melo-Pfeifer, S. (2015). The role of the family in heritage language use and learning: Impact on heritage language policies,
International Journal of Bilingual Education and Bilingualism, 18(1), 26-44.
Montrul, S. (2010). Current issues in heritage language acquisition. Annual Review of Applied Linguistics, 30, 3-23.
Montrul, S. A. (2018). Heritage language development: Connecting the dots, International Journal of Bilingualism, 22(5),
530-546.
Moro, L., Mortimer, E., & Tiberghien, A. (2019). The use of social semiotics multimodality and joint action theory to
describe teaching practices: two cases studies with experienced teachers. Classroom Discourse. 1-23.
Murphy, V. (2014). Second language learning in the early school years: Trends and contexts. Oxford, UK: Oxford
University Press.
Polinsky, M. (2011). Reanalysis in adult heritage language. Studies in Second Language Acquisition, 33(2), 305-328.
Polinsky, M., (2018). Bilingual children and adult heritage speakers: The range of comparison. International Journal of
Bilingualism, 22(5) 547-563.
Polinsky, M., & Kagan, O. (2007). Heritage languages: In the 'wild' and in the classroom. Language and Linguistics
Compass, 1(5), 368-395.
Potowski, K. (2016). Bilingual youth: Spanish-speakers at the beginning of the 21st century. Language and Linguistics
Compass, 10(6), 272-283.
Ro, Y. E., & Cheatham, G. A. (2009). Biliteracy and bilingual development in a second-generation Korean child: A case
study, Journal of Research in Childhood Education, 23, 290-308.
Rodriguez-Mojica, C. (2017). From test scores to language use: Emergent bilinguals using English to accomplish academic
tasks. International Multilingual Research Journal, 12(1), 31-61.
Schmid, M. S. (2010). Languages at play: The relevance of L1 attrition to the study of bilingualism.
Bilingualism: Language and Cognition, 13, 1-7
Scontras, G., Fuchs, Z., & Polinsky, M. (2015). Heritage language and linguistic theory. Frontiers in Psychology, 6,
1545-1564.
Seals, C., & Peyton, J. K. (2017). Heritage language education: Valuing the languages, literacies and cultural competencies
of immigrant youth. Current Issues of Language Planning, 18(1), 87-101.
Shin, S. J. (2005). Developing in two languages: Korean children in America. Clevedon, UK: Multilingual Matters.
Shin, S. J. (2014). Language learning as culture keeping: Family language policies of transnational adoptive parents.
International Multilingual Research Journal, 8(3), 189-207.
Shin, S. J. & Lee, J. S. (2013). Expanding capacity, opportunity, and desire to learn Korean as a heritage language.
Heritage Language Journal, 10(3), 64-73.
Shin, J., & Viruru, R. (2021). A qualitative study of home-school literacy connections between Korean ELL families and
their children’s early childhood teachers, In G., Onchwari, & J, Keengwe (Eds.), Bridging Family – Teacher
Relationship for ELL and Immigrant Students (pp. 238-264). Hershey, PA: IGI Global.
Spolsky, B. (2012). Family language policy – the critical domain. Journal of Multilingual and Multicultural Development,
33(1), 3-11.
Strauss, A., & Corbin, J. (1998). Basics of qualitative research: Techniques and procedures for developing grounded
theory (2nd ed.). Thousand Oaks, CA: Sage.
Street, B. V. (1984). Literacy in theory and practice CUP: Cambridge.
Street, B. V. (2001). The new literacy studies. In E. Cushman, G.R. Kintgen, B.M. Kroll, & M. Rose (Eds.), Literacy: A
critical sourcebook (pp. 430-442). Boston: St. Martin’s Press.
Szilagyi, J., & Szecsi, T. (2020). Why and how to maintain the Hungarian language: Hungarian-American families’ views
on heritage language practices, Heritage Language Journal, 17(1), 114-139.
Tse, L. (2001). Why don't they learn English? Separating fact from fallacy in the U.S. language debate. New York:
Teachers College Press.
Valdes, G. (2014). Expanding definitions of giftedness: The case of young interpreters from immigrant communities. New
York, NY: Routledge
Veltman, C. (1983). Language shift in the United States. The Hague: Mouton.

IOJPE
ISSN: 1300 – 915X
www.iojpe.org
International Online Journal of Primary Education 2021, volume 10, issue 1
Copyright © International Online Journal of Primary Education 18
Yang, J., Fox, R., & Jacewicz, E. (2015). Vowel development in an emergent Mandarin-English bilingual child: A
longitudinal study. Journal of Child Language, 42, 1125-1145.
Yazan, B., & Ali, I. (2018). Family language policies in a Libyan immigrant family in the U.S.: Language and religious
identity. Heritage Language Journal, 15(3), 369-388.

IOJPE
ISSN: 1300 – 915X
www.iojpe.org
International Online Journal of Primary Education 2021, volume 10, issue 1
Copyright © International Online Journal of Primary Education 19
SPECIALISED CONTENT KNOWLEDGE: THE CONVENTION FOR
NAMING ARRAYS AND DESCRIBING EQUAL GROUPS’ PROBLEMS
Chris HURST
Dr., Curtin University, Perth, Australia
ORCID: https://orcid.org/0000-0002-8797-8508
Derek HURRELL
Dr., University of Notre Dame Australia, Fremantle, Australia
ORCID: https://orcid.org/0000-0003-2904-8473
Received: March 10, 2021 Accepted: April 17, 2021 Published: June 30, 2021
Suggested Citation:
Hurst, C., & Hurrell, D. (2021). Specialised content knowledge: The convention for naming arrays and describing equal
groups’ problems. International Online Journal of Primary Education (IOJPE), 10(1), 19-31.
This is an open access article under the CC BY 4.0 license.
Abstract
Specialised Content Knowledge (SCK) is defined by Ball, Hoover-Thames, and Phelps (2008) as mathematical knowledge
essential for effective teaching. It is knowledge of mathematics that is beyond knowledge which would be required outside
of teaching; for instance, the capacity to determine what misconception(s) may lie behind an error in calculation. Such
knowledge should be core business of teachers of mathematics, and any perceived shortfall in SCK viewed as problematic.
The research reported on here is part of a large study about multiplicative thinking involving approximately two thousand
children between nine and twelve years of age and their teachers. Data were generated from semi-structured interviews and a
written diagnostic assessment quiz. As part of that large project, forty-four Australian and New Zealand primary and middle
school teachers were asked to respond to student work related to multiplicative thinking, particularly to concepts of numbers
of equal groups and commutativity. Participants’ responses reflected confusion about a pivotal piece of SCK, the convention
for naming arrays. As well, questionable assumptions about the children’s work samples were made. Given that there is not
unanimous agreement amongst mathematics educators about naming conventions, these observations may not be surprising.
Due to the sample size, broad generalisations cannot be made, but the results suggest that many teachers may have limited
SCK with regards to the important mathematical area of Multiplicative Thinking (MT).
Keywords: Conventions, arrays, multiplicative, teacher content knowledge.
INTRODUCTION
Background
Since the publication of Shulman’s seminal work on Pedagogical Content Knowledge (PCK) in the
1980s, much has been written about PCK, as well as the variations of it. The attempt by Shulman to
codify the elements which can be identified in effective teachers, has provided a platform from which
the idea of Mathematical Knowledge for Teaching (MKT) (Ball, Hoover-Thames & Phelps, 2008) has
evolved. This paper posits the question “To what extent can a sample of primary and middle school
teachers articulate the Specialised Content Knowledge needed for teaching aspects of multiplicative
thinking, in particular, with regard to equal groups’ problems?” Further, it will make a case for the
development of teachers’ Multiplicative Thinking (MT), an essential ‘big idea’ (Siemon, Beswick,
Brady, Clark, Faragher, & Warren, 2015) of mathematics which spans the domains of Common
Content Knowledge (CCK) and Specialised Content Knowledge (SCK). It will assert that many of the
teachers involved in this study did not display sufficient levels of SCK, and therefore Subject Matter
Knowledge (SMK) regarding MT, that are necessary to effectively teach this vital concept. Further it
will investigate a pedagogical tool, the multiplicative array, for the teaching and learning of MT, a
tool which can be used to promote a conceptual understanding of this important mathematics.

IOJPE
ISSN: 1300 – 915X
www.iojpe.org
International Online Journal of Primary Education 2021, volume 10, issue 1
Copyright © International Online Journal of Primary Education 20
Literature review
Pedagogical Content Knowledge (PCK) and Mathematical Knowledge for Teaching (MKT)
Shulman (1986) argued the presence of Pedagogical Content Knowledge (PCK), a form of knowledge
which could be described as the nexus between the content and pedagogy, and a third essential
domain, context (Figure 1). PCK can be described as a practical knowledge of teaching and learning,
through a contextualised lens of knowledge of a particular classroom setting (Shulman, 1986).
Figure 1. Shulman’s (1986) domains of pedagogical content knowledge
Since the 1980s, Shulman’s ideas and schema regarding PCK has been widely accepted and has been
adapted by a number of authors. In elaborating on Shulman’s construct of PCK, several teams of
researchers (e.g. Hill, Ball & Schilling, 2008; Ball, Hoover-Thames & Phelps, 2008; Delaney, Ball,
Hill, Schilling & Zopf, 2008) have used a construct (Figure 2) which aligns their stated domains of
content knowledge for teaching onto two of Shulman’s (1986) categories for PCK, Subject Matter
Knowledge (SMK) and Pedagogical Content Knowledge. This construct by Hill et al. (2008) to
illustrate Mathematical Knowledge for Teaching (MKT) was described by Depaepe, Verschaffel and
Kelchtermans in 2013, as being mathematics education’s most influential reconceptualisation of
teachers’ Pedagogical Content Knowledge.
Figure 2. Mathematical knowledge for teaching (Hill, Ball, & Schilling, 2008, p. 377)
Hill, Ball and Schilling (2008) assert that Pedagogical Content Knowledge can be broken into three
domains: Knowledge of Content and Students (KCS); Knowledge of Content and Teaching (KCT);
and Knowledge of Content and Curriculum (KCC). Subject Matter Knowledge (SMK) also contains
three domains: Common Content Knowledge (CCK); Specialised Content Knowledge (SCK); and
Knowledge at the mathematical horizon. This paper will primarily concern itself with only two of the
domains CCK and SCK, while acknowledging that all domains are interrelated.
Common Content Knowledge (CCK) is mathematical knowledge and skill used in settings not
necessarily unique to teaching (for example the ability to: calculate an answer correctly or recognise
incorrect answers). Effective teaching requires more than CCK, it also requires Specialised Content
Knowledge (SCK) which is the basis of quality instruction, instruction which is focussed and where

IOJPE
ISSN: 1300 – 915X
www.iojpe.org
International Online Journal of Primary Education 2021, volume 10, issue 1
Copyright © International Online Journal of Primary Education 21
decisions regarding both content and pedagogy are made (Delaney et al., 2008). SCK is the
understanding of the mathematical knowledge and skills which are particular to teaching (for example
the ability to respond to students’ “why” questions or recognise what is involved by using a particular
representation).
SCK of pedagogical concerns (for example, in recognising what is involved in using a particular
representation or linking representations to underlying ideas and to other representations) is necessary
to develop conceptual and/or procedural knowledge (Rittle-Johnson & Schneider, 2015). Bruner
(1966) asserted that concepts are progressively developed, first in the ‘enactive’ stage through
engagement with concrete experiences, then the ‘iconic’ stage, when pictorial and other graphic
representations are used, and finally, the symbolic stage. Bruner’s work underpins the contemporary
practice of CRA (Concrete-Representational-Abstract), a graduated sequence of instruction proven to
be an effective strategy for teaching mathematics concepts and skills (Agrawal & Morin, 2016;
Goonen & Pittman-Shetler, 2012). An example of CRA is presented in Figure 3.
3 2
3 + 2 = 5
5 Enactive Concrete
Iconic Representational
Pictorial
Symbolic Abstract
Figure 3. Example of CRA Model
CRA purports that it is developmentally advantageous for students to be afforded opportunities to
move from the concrete, to the representational, and then to the abstract (Goonen & Pittman-Shetler,
2012), in order to be facilitated in gaining a deeper and lasting understandings of mathematical
concepts (Mutodi & Ngirande, 2014). Research indicates that for learning benefits to occur, concrete
material is appropriate to the topic (Askew, 2018; Swan & Marshall, 2010), in order to stimulate
students’ thinking. Merely providing students with materials to manipulate, will not provide the
benefits of thoughtful selection and employment – that must be associated with particular SCK that is
linked to the use of manipulatives. (Askew, 2018; Swan & Marshall, 2010).
More recently, various researchers and mathematics educators have indicated the need for
teachers to hold a strong and connected knowledge of mathematical structure. Siemon,
Warren, Beswick, Faragher, Miller, Horne, Jazby, Breed, Clark, and Brady (2021) noted its
importance if teachers were to make learning meaningful for children. Similarly, Waller and
Marzocchi (2020), Parker (2019), and McKenna (2019) all provided examples of how string
teacher content knowledge could enhance teaching and learning of mathematics at a
conceptual level. Also, Clements and Sarama (2019) clearly allude to the importance of
strong teacher knowledge in understanding children’s developmental learning paths.
Multiplicative Thinking (MT)
Multiplicative thinking is fundamental to the development of important mathematical concepts and
understandings such as algebraic reasoning (Brown & Quinn, 2006), place value, proportional
reasoning, rates and ratios, measurement, and statistical sampling (Mulligan & Watson, 1998;
Siemon, Izard, Breed & Virgona, 2006). According to Siemon, Breed, Dole, Izard, and Virgona
(2006), students who are not proficient with multiplicative thinking lack the foundational skills and
knowledge to participate effectively in further school mathematics, or to avail themselves of some
post-compulsory school opportunities. Further, Siegler, Duncan , Davis-Kean, Duckworth, Claessens,
Enge, Susperreguy, & Chen (2012) advocate that knowledge of division and of fractions (another part
of mathematics very much reliant on multiplicative thinking) are unique predictors of later
mathematical achievement.

IOJPE
ISSN: 1300 – 915X
www.iojpe.org
International Online Journal of Primary Education 2021, volume 10, issue 1
Copyright © International Online Journal of Primary Education 22
Multiplicative thinking is significantly more complex than addition so is consequently not easy to
teach or to learn (Barmby, Harries, Higgins & Suggate, 2009). Although most students will enter
school with an informal knowledge that underpins counting and initial additive thinking (Sophian &
Madrid, 2003) re-conceptualisation of understanding about number is necessary to understand
multiplicative relationships (Wright, 2011). Multiplicative thinking is markedly different from
additive thinking (Jacob & Willis, 2001) and needs to be understood as being much more than the
capacity to remember and use multiplication facts. What is needed is a developing ability to apply
these facts to the many and varied situations which are built on multiplication. Jacob and Willis
(2003) outlined five broad phases for the development of multiplicative thinking: One-to-One
Counting; Additive Composition; Many-to-One Counting; Multiplicative Relations; and Operating on
the Operator. It is at the third phase, the development of many-to-one counting when students can
simultaneously hold two numbers in their head; the number of groups and the total in each group.
Traditionally the approach has been to use links with repeated addition to facilitate students’
multiplicative thinking (Confrey & Smith, 1995), an approach which may not be helpful in addressing
the variety of situations to which multiplication needs to be applied (Wright, 2011). Behr, Harel, Post
and Lesh (1994) posit that students often have the inappropriate additive model presented to them by
teachers, who themselves use an additive model. It may be useful for teachers to be given the
opportunity to ‘see’ multiplication as standard and non-standard multiplicative partitioning and to
create situations where they are mindful of the way in which questions and tasks are phrased and are
aware of the power of particular representations. A multiplicative array is a powerful representation
which may allow this to occur and teachers require a strong level of SCK to facilitate that.
Multiplicative Arrays as a powerful mediating artefact for MT
Research (Barmby et al., 2009; Young-Loveridge & Mills, 2009) suggests that the array is a potent
way in which to represent multiplication. Multiplicative arrays have the potential to allow students to
visualise commutativity, associativity and distributivity, (Nunes & Bryant, 1996; Young-Loveridge,
2005) and that if employed alongside other representations, can serve to “allow students to develop a
deeper and more flexible understanding of multiplication/division” (Young-Loveridge, 2005, p. 38-
39). Indeed, they enable students to understand commutativity through rotating the array, and, by
seeing that although the multiplicand and multiplier can be exchanged without effecting the product,
the two situations (e.g., 4 × 3 and 3 × 4) are different. Further, multiplicative arrays exemplify the
dualistic character of multiplication (Barmby et al., 2009), and have value in as a representation, that
they also connect to the mathematical ideas of area and volume and Cartesian products (Wright,
2011).
The representation of multiplicative thinking using the array is not a trivial decision, and one which
allows students to develop from being solely additive thinkers (Askew, 2018; Downton, 2008). While
representations such as ten-frames are adept at helping children to develop additive reasoning, arrays
have been the preferred representation in the development of multiplicative thinking (Siemon et al.,
2015; Vale, & Davies, 2007; Young-Loveridge, 2005). According to Askew, (2018) additive
problems and additive thinking (AT) are essentially problems involving three numbers, where all
three numbers relate to the same referent. For example, there are five sheep in a pen, three more sheep
are placed in the pen, so there are now eight sheep in the pen. Multiplicative Thinking (MT) problems
have numbers that do not all share the same referents; there are 4 pens, there are three sheep in each
pen, there is a total of 12 sheep. The four tells of how many iterations, or the number of pens, and the
three tells of how many sheep in each pen. This mental manipulation of the multiplier and the
multiplicand can be facilitated through the use of arrays which allows students the opportunity to both
visualise and manipulate the concrete representation, before moving to pictorial and then an abstract
representation (Askew, 2018; Lesh, Cramer, Doerr, Post, & Zawojewski, 2003; Sriraman, 2006). A
further advantage of the array is that it allows for collinearity (Jacob & Mulligan, 2014), the capacity
to focus students’ attention on the three quantities, the coordination of; the number of rows, the
number in each row (both factors), and the whole amount (the multiple), simultaneously (Jacob &

IOJPE
ISSN: 1300 – 915X
www.iojpe.org
International Online Journal of Primary Education 2021, volume 10, issue 1
Copyright © International Online Journal of Primary Education 23
Mulligan, 2014; Siemon et al., 2015). Importantly the multiplicative array also has agency in allowing
the opportunity to see multiplication as a structure rather than a procedure (Askew, 2018). Again,
teachers need to hold a strong level of SCK for this to occur.
Conventions for naming arrays and equal groups
There is an accepted convention for naming arrays and for describing numbers of equal groups, and
this is an essential component of teachers’ SCK. In a multiplication fact, the first number indicates the
number of groups and the second number indicates the number in each group. In an array, the first
number indicates the number of rows and the second number indicates the number in each row (Jacob
& Mulligan, 2014). Hurst and Hurrell (2018, p. 25) noted that it must be understood that “four groups
of seven (4 × 7) is conceptually different to seven groups of four (7 × 4) but that the order of factors
can be changed and the product will remain the same”. Hurst (2018) also pointed out the importance
of a conceptual understanding of ideas like the commutative property and how it underpins the later
use of mathematical algorithms and procedures. Indeed, Hurst (2017, p. 3) stated that, “being able to
understand and articulate that four groups of seven is quite a different multiplicative situation to seven
groups of four, demonstrates more powerful knowledge”.
To ascertain the extent to which this convention is accepted, a content analysis of 24 reputable sources
was conducted. Sources included research articles, conference papers, teacher education textbooks,
and publisher websites. Twenty of those sources, a selection of which is provided here, (e.g., Benson,
Wall, & Malm, 2013; Stott, 2016; Tipps, Johnson, & Kennedy, 2011; Van de Walle, Karp, & Bay-
Williams, 2013; Way, 2011) clearly adhered to the convention. For example, Tipps et al. (2011, p.
236) stated that, “The first factor is called the multiplication operator or multiplier because it acts on
the second factor, the multiplicand, which names the number of objects in each set”. In four other
sources, there was some confusion and/or contradiction about the convention (Barmby, Harries, &
Higgins, 2010; Cotton, 2016; Haylock, 2010; Reys et al., 2020). As an example of this contradiction,
Cotton (2016) discussed how 4 × 3 could be shown and promptly showed an array with three rows of
four. Later, he showed a three by eight array of postage stamps and correctly described it as a 3 × 8
array. While over 80% of the analysed sources adhere to the convention, it would be preferable if they
all did in order that teachers in all jurisdictions received the same message that the convention is
important.
The problem here is that not all of the sources used the convention for naming arrays. In the context
of the overall research described earlier, a sub-problem emerges – To what extent do teachers adhere
to the convention when naming and describing arrays?
METHOD
Theoretical Framework
Figure 4. Theoretical framework

IOJPE
ISSN: 1300 – 915X
www.iojpe.org
International Online Journal of Primary Education 2021, volume 10, issue 1
Copyright © International Online Journal of Primary Education 24
Research Design
The study utilised a qualitative method of investigation that follows a constructivist research paradigm
and an interpretivist theoretical perspective, as outlined in Figure 4, which seeks to understand the
primary importance of the meaning people attach to the world around them (Creswell, 2007). The
qualitative methodology used content analysis of reflection sheets compiled by teacher participants.
Participants and Data Collection
Data were collected from 44 primary and middle school teachers from both Australian and New
Zealand schools, and this was done through working with small focus groups. The participants were
supplied with authentic work samples which had been collected through work with primary school
aged students and were asked to make some determinations about those samples.
Participant teachers were presented with printed student work samples and asked to individually
respond to two questions for each scenario:
a. What does each work sample tell you about the student’s understanding of the
mathematics involved?
b. What teaching strategies would you employ to help each student?
The first question to which teachers were asked to respond, and which is the focus of this paper, is
shown in Figure 5.
Figure 5. Question 1 from scenarios given to teachers
Fundamentally, the researchers were interested to determine which aspects of the identified SCK were
evident in the participants’ responses. Thus, there were two ways in which participants could
demonstrate SCK – appropriately identifying the students’ responses in terms of SCK, and identifying
an appropriate intervention in terms of SCK.
After multiple readings of the scripts, the responses were categorised by one of the interviewers
according to the aspects of SCK in the framework presented below. The responses were considered to
be either:
A valid or appropriate response indicating the presence of the specific SCK
A vague or inappropriate response indicating partial presence of SCK, or lack of it
These categorisations were then given to the second interviewer and challenged until a final set of
categories was established through consensus. This process required both researchers to agree on the
intent of the written materials, both in what was written and what that writing was trying to convey.
The process, although quite time consuming, proved to be instructive and challenging but remained
systematic and thorough.
Framework for Data Analysis
The framework for this study is based on the premise of Specialised Content Knowledge (SCK) and
the following five phases of development of multiplicative thinking proposed by Jacob & Willis
(2003).
1. One-to-one counting – can count by one, but do not trust the count and do not count on
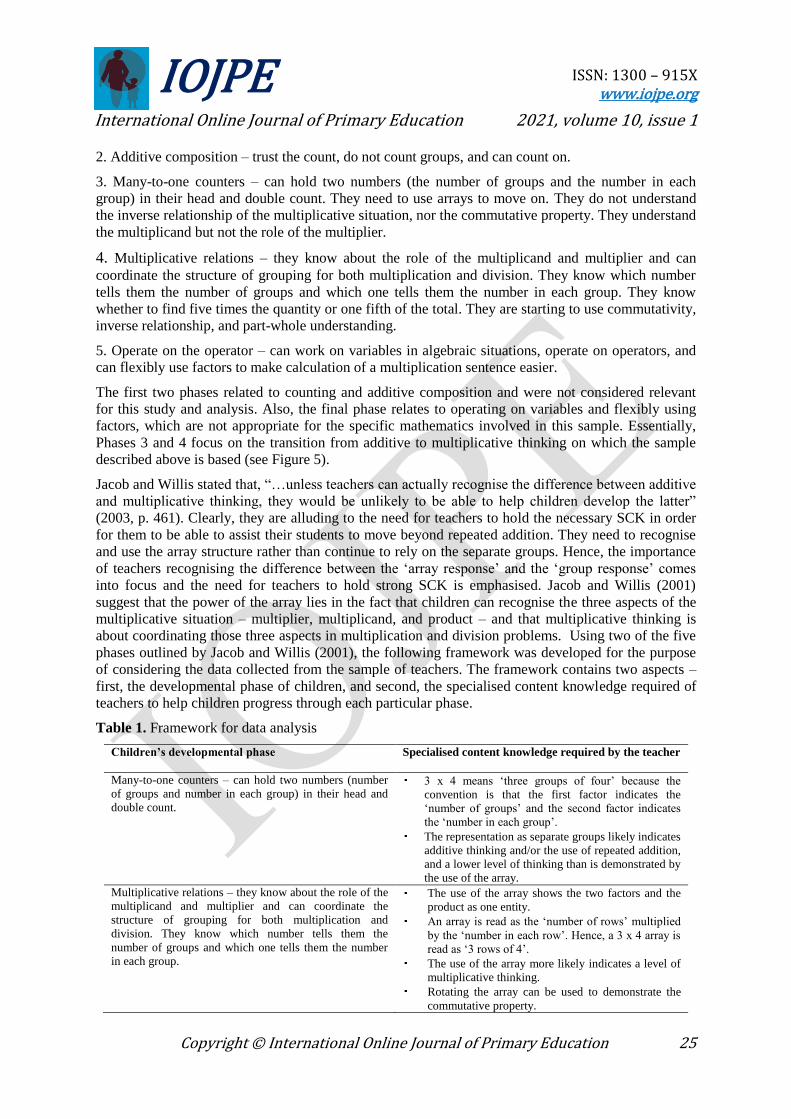
IOJPE
ISSN: 1300 – 915X
www.iojpe.org
International Online Journal of Primary Education 2021, volume 10, issue 1
Copyright © International Online Journal of Primary Education 25
2. Additive composition – trust the count, do not count groups, and can count on.
3. Many-to-one counters – can hold two numbers (the number of groups and the number in each
group) in their head and double count. They need to use arrays to move on. They do not understand
the inverse relationship of the multiplicative situation, nor the commutative property. They understand
the multiplicand but not the role of the multiplier.
4. Multiplicative relations – they know about the role of the multiplicand and multiplier and can
coordinate the structure of grouping for both multiplication and division. They know which number
tells them the number of groups and which one tells them the number in each group. They know
whether to find five times the quantity or one fifth of the total. They are starting to use commutativity,
inverse relationship, and part-whole understanding.
5. Operate on the operator – can work on variables in algebraic situations, operate on operators, and
can flexibly use factors to make calculation of a multiplication sentence easier.
The first two phases related to counting and additive composition and were not considered relevant
for this study and analysis. Also, the final phase relates to operating on variables and flexibly using
factors, which are not appropriate for the specific mathematics involved in this sample. Essentially,
Phases 3 and 4 focus on the transition from additive to multiplicative thinking on which the sample
described above is based (see Figure 5).
Jacob and Willis stated that, “…unless teachers can actually recognise the difference between additive
and multiplicative thinking, they would be unlikely to be able to help children develop the latter”
(2003, p. 461). Clearly, they are alluding to the need for teachers to hold the necessary SCK in order
for them to be able to assist their students to move beyond repeated addition. They need to recognise
and use the array structure rather than continue to rely on the separate groups. Hence, the importance
of teachers recognising the difference between the ‘array response’ and the ‘group response’ comes
into focus and the need for teachers to hold strong SCK is emphasised. Jacob and Willis (2001)
suggest that the power of the array lies in the fact that children can recognise the three aspects of the
multiplicative situation – multiplier, multiplicand, and product – and that multiplicative thinking is
about coordinating those three aspects in multiplication and division problems. Using two of the five
phases outlined by Jacob and Willis (2001), the following framework was developed for the purpose
of considering the data collected from the sample of teachers. The framework contains two aspects –
first, the developmental phase of children, and second, the specialised content knowledge required of
teachers to help children progress through each particular phase.
Table 1. Framework for data analysis
Children’s developmental phase
Specialised content knowledge required by the teacher
Many-to-one counters – can hold two numbers (number
of groups and number in each group) in their head and
double count.
3 x 4 means ‘three groups of four’ because the
convention is that the first factor indicates the
‘number of groups’ and the second factor indicates
the ‘number in each group’.
The representation as separate groups likely indicates
additive thinking and/or the use of repeated addition,
and a lower level of thinking than is demonstrated by
the use of the array.
Multiplicative relations – they know about the role of the
multiplicand and multiplier and can coordinate the
structure of grouping for both multiplication and
division. They know which number tells them the
number of groups and which one tells them the number
in each group.
The use of the array shows the two factors and the
product as one entity.
An array is read as the ‘number of rows’ multiplied
by the ‘number in each row’. Hence, a 3 x 4 array is
read as ‘3 rows of 4’.
The use of the array more likely indicates a level of
multiplicative thinking.
Rotating the array can be used to demonstrate the
commutative property.

IOJPE
ISSN: 1300 – 915X
www.iojpe.org
International Online Journal of Primary Education 2021, volume 10, issue 1
Copyright © International Online Journal of Primary Education 26
Developing Categories for Responses
The process of developing categories for participant responses took some time. Initially, it was
thought important to identify what constituted a ‘full response’ to the questions about Tommy and
Jamie and to see which participants were able to provide such a response. A ‘full response’ about
Jamie’s sample was considered to include the following points:
Jamie should be asked to explain his thinking.
Jamie needs to explain what 3 × 4 and 4 × 3 mean.
Jamie needs to understand that 3 × 4 and 4 × 3 are different.
Jamie needs to be exposed to arrays and the convention for naming them.
Jamie needs to demonstrate an understanding of the convention for writing multiplication
facts.
Jamie needs assistance to understand the commutative property.
It soon became apparent that no participant gave such a complete response. It was then decided to
classify responses as ‘appropriate’ or ‘inappropriate‘, ‘vague’, or ‘unclear/incoherent’. As the analysis
continued, it was evident that participants frequently made assumptions about the work samples in
terms of what they thought the samples showed about the knowledge of the two students. Even when
challenged in conversation about whether their observations were assumptions or ‘truths’, few seemed
to be able to concede that making the assumption could be erroneous. Through extensive interviews
with children the researchers were abundantly aware that when such assumptions were made, they
were almost always incorrect. For example, when students were questioned about the orientation of
the array it was evident that it had been drawn with no understanding of the multiplicative situation or
commutative property. Hence, responses where such assumptions could not be totally justified, were
deemed to be inappropriate. Ultimately, it was decided that it would be better to focus on the
percentage of appropriate responses based on the framework criteria (Table 1) and to include
examples of inappropriate responses in the discussion.
RESULTS
The following results are presented in terms of the two phases of the framework – Table 1 shows
results for identification of SCK about many to one counters and Table 2 shows results for
identification of SCK about multiplicative relations. To provide some clarity about how the responses
were categorised, sample responses which are typically appropriate, or inappropriate, are provided
after Tables 2 and 3. Teacher respondents are identified with pseudonyms – R1to R44.
Table 2. Data summary relating to ‘many to one counters’
Many-to-one counters
(1) 3 x 4 means ‘three groups of four’ because the convention is that the first factor indicates the ‘number of groups’
and the second factor indicates the ‘number in each group’.
Part (a)
Appropriate Identification
40.9%
Part (b)
Appropriate Intervention
22.7%
(2) The representation as separate groups likely indicates additive thinking and/or the use of repeated addition, and a
lower level of thinking than is demonstrated by the use of the array.
Part (a)
Appropriate Identification
11.4%
Part (b)
Appropriate Intervention
2.3%
Typical appropriate responses about the SCK in Table 2 Criterion (1) included that ‘Jamie has shown
4 x 3 and not 3 x 4 which he was asked to do’ (R1) or that ‘Jamie has made three, four times’ (R2).
Another participant responded with ‘Tommy is linking to arrays but doesn’t understand correct
placement. He should have three rows and four in each’ (R3). Inappropriate responses included that

IOJPE
ISSN: 1300 – 915X
www.iojpe.org
International Online Journal of Primary Education 2021, volume 10, issue 1
Copyright © International Online Journal of Primary Education 27
‘They have both created three groups of four’ (R4) as well as making unjustified assumptions such as
‘Tommy has shown the relationship between 3 × 4 and 4 × 3’ (R5). Other inappropriate responses for
Criterion (1) included ‘They both understand grouping’ (R6), or ‘They both have an understanding of
what 3 x 4 means’ (R4). With regard to a possible intervention for Criterion (1), appropriate responses
included ‘I would get blocks and do hands on. [They need] visual representation of each one whilst
writing the number sentences’ (R7). Another response was ‘Jamie needs careful reading of the
question to adjust the groups of tiles. The first number is the number of groups and the second number
is the number in each group’ (R8). As well, another said that ‘I would want to interview Tommy to
find out why he arranged it that way’ (R1). Finally, another said that ‘Jamie needs to see 3 × 4 with
tiles and 4 × 3 with tiles to see if he can see the difference’ (R9). For Criterion (2), typical appropriate
responses included that ‘Jamie had laid the times out in a repeated addition format’ (R10) or that
‘Jamie is still thinking additively and possibly skip counting’ (R11). Good suggested interventions
included that Jamie needed to be introduced to arrays (R12) and that Tommy would benefit from
using strips of three and four to show groups and overlaying them to form the arrays (R13).
Table 3. Results identifying aspects of multiplicative relations
Multiplicative relations
(1) The use of the array shows the two factors and the product as one entity.
Part (a)
Appropriate Identification
0%
Part (b)
Appropriate Intervention
0%
(2) An array is read as the ‘number of rows’ multiplied by the ‘number in each row’. Hence, a 3 x 4 array is read
as ‘3 rows of 4’.
Part (a)
Appropriate Identification
6.8%
Part (b)
Appropriate Intervention
9.1%
(3) The use of the array more likely indicates a level of multiplicative thinking.
Part (a)
Appropriate Identification
6.8%
Part (b)
Appropriate Intervention
2.3%
(4) Rotating the array can be used to demonstrate the commutative property.
Part (a)
Appropriate Identification
2.3%
Part (b)
Appropriate Intervention
9.1%
There were few responses related to Table 3 Criterion (1) apart from ‘Tommy has shown the total or
product as one entity’ (R14) (appropriate) and ‘Tommy represents the answer, not the question’ (R15)
(inappropriate). For Table 3 Criterion (2), appropriate responses included ‘Tommy has shown as an
array but unsure if it shows 4 x 3 or 3 x 4’ (R9) and ‘Tommy is linking to arrays but doesn’t
understand correct placement’ (R3). Inappropriate responses included that ‘Tommy has laid out the
tiles in a 3 x 4 pattern’ (R10). With regard to a possible intervention, an appropriate response was
‘Ask children to share what they have made. Discuss how many groups they have created. Discuss
what 3 x 4 means’ (R16), and ‘Ask Tommy – ‘You have the right amount but how many groups are
there in 3 x 4?’ (R15) For Table 3 Criterion 3, an appropriate response was that ‘Tommy is thinking in
a multiplicative way and has used an array’ (R18), while an appropriate response for an intervention
would be ‘Ask Jamie if he can show it as an array’ (R15).
Table 3 Criterion 4 produced by far the highest number of inappropriate responses. Only one
appropriate response was recorded – ‘It would be easy to assume that Tommy perhaps sees the
relationship to 4 x 3 in his array, however, my experience of making this assumption in the past has
shown that this is often not a connection necessarily made’ (R16). Inappropriate responses generally
assumed that the commutative property was understood because Tommy had not shown the array as a
3 x 4 but in showing it as a 4 x 3, it indicated that he understood commutativity. For example,
‘Tommy shows perhaps greater awareness of commutative property of multiplication’ (R17).
However, there were a number of appropriate suggestions for interventions including, ‘Is this (3 x 4)

IOJPE
ISSN: 1300 – 915X
www.iojpe.org
International Online Journal of Primary Education 2021, volume 10, issue 1
Copyright © International Online Journal of Primary Education 28
the same as 4 x 3 (i.e., 3 groups of 4 and 4 groups of 3)?’ (R19), and, ‘See if Tommy understands
commutativity and is able to show as [rotated array drawn]’ (R5).
Inappropriate responses for Table 3 included that ‘Tommy has only put the total in and he needs
separation to show groups’ (R20) and ‘Further investigation may be needed to see if they can be
represented in other ways. If not, further teaching may be needed’ (R21). The latter comment is not
related to any of the specific SCK criteria and is therefore considered vague or inappropriate.
It is worth considering the range of individual results across the sample of 44 participant teachers as
there was a great variation in the responses from person to person. The framework shown in Tables 1,
2, and 3 indicates six aspects of SCK that teachers could identify and about which they could respond.
With regard to identifying the SCK contained in each criterion (i.e., the question asking ‘What does
each work sample tell you about the student’s understanding of the mathematics involved?’), many
participants gave appropriate responses alongside inappropriate, vague or unclear/incoherent
responses. However, a large proportion (43.1%) provided no appropriate responses and 45.5%
provided only one appropriate response to the six criteria. No participant recorded a majority of
appropriate responses and 11.4% provided two appropriate responses. A total of 30 appropriate
identifications/responses were given across the whole sample.
With regard to using the SCK for each criterion to suggest an appropriate intervention (i.e., the
question asking ‘What teaching strategies would you employ to help each student?’), there was a total
of 20 appropriate interventions across the whole sample. Ten (10) of these related to the first of the
‘many-to-one counters’ criteria shown in Table 2, and there were four (4) appropriate interventions
suggested for each of Criteria 2 and 4 about ‘multiplicative relations’ in Table 3. In all, 65.9% of
participants were unable to suggest an appropriate intervention for any criteria, and 25.0% suggested
one (1) appropriate intervention. A further 6.8% suggested two (2) appropriate interventions while
2.3% (one participant suggested three (3) appropriate interventions.
DISCUSSION and CONCLUSION
Numerous educators have continued to write about the importance of deep teacher knowledge of
mathematical structure. In discussing pedagogical content knowledge, Siemon, Warren, Beswick,
Faragher, Miller, Horne, Jazby, Breed, Clark, and Brady (2021), noted the importance of teachers
having a strong understanding of structure in order for them to identify the best way/s of explaining a
concept so that their students find it meaningful. Clements and Sarama (2019, p. 44) alluded to the
importance of teacher knowledge, especially of mathematical connections, in discussing teacher
awareness of appropriate learning trajectories, stating that, “As teachers come to understand children’s
probable developmental paths and become adept at anticipating children’s strategies and
misconceptions, their teaching practices may become more grounded and solidified”. McKenna
(2019) discussed children learning about factors through exploring, rather than simply being ‘taught’.
Clearly, if such an approach is to be successful, teachers need a deep and broad understanding of the
structure about factors and multiples, a vital aspect of multiplicative thinking.
This is echoed by Waller & Marzocchi (2020) who assert that if children are to develop as deep and
flexible thinkers, then the mathematical content knowledge held by their teachers needs to be strong
and connected. Parker (2019) makes a similar point when discussing how children need to learn
multiplication facts with conceptual understanding. For that to occur, teachers need a strong
knowledge of multiplication and division. Hurst, Hurrell, & Huntley (2021) discussed children’s
fragmented understanding of factors and multiples. Their observations suggest that such fragmented
knowledge is possibly due to the way in which factors are taught which is likely to have its origins in
incomplete or unconnected teacher content knowledge.
The study clearly has limitations and it would not be appropriate, given the sample size (n = 44), to
attempt to generalise widely from the results of this study. Nonetheless, it appears that there needs to
be further research into teachers’ SCK about aspects of multiplicative thinking. Even when given that
IOJPE
ISSN: 1300 – 915X
www.iojpe.org
International Online Journal of Primary Education 2021, volume 10, issue 1
Copyright © International Online Journal of Primary Education 29
the sample is small, some worrying indicators have emerged. First, the high proportion of participants
who were unable to identify the specific mathematics nor suggest an appropriate intervention is of
concern. Second, a number of participants made inappropriate assumptions about what the samples
demonstrated. This was particularly evident in responses to the ‘multiplicative relations’ criterion
about the commutative property where participants said that Tommy’s sample indicated that he
understood the property. It is just as likely that he does not understand commutativity nor the
convention for writing number facts, as in ‘many-to-one counters’ criterion 1. Third, the high number
of inappropriate responses that reflect a confused understanding of the mathematics needs further
investigation. Finally, there seems to be no ‘down-side’ to adopting a consistent convention for
naming arrays and describing equal group problems. In fact, research such as this would suggest that
consistency is advisable and desirable.
Even considering the limitations in terms of the sample size and the relatively narrow focus of the
study, there are some implications that are evident. First, the results suggest that further research
should be undertaken with a larger sample and a broader content focus about multiplicative thinking.
Second, with regard to teacher professional learning and pre-service teacher education, the results
suggest that closer attention may need to be paid to Specialised Content Knowledge (SCK),
specifically the fine points of mathematical structure about multiplicative thinking. In particular, the
convention of describing number facts in terms of numbers of groups and the number in each group is
important and forms the basis for understanding commutativity rather than considering it in a
procedural way in terms of ‘swaps and switches’ (Anthony & Walshaw, 2002). Teachers need to
better understand the structure if they are going to be in a position to assist their students to do so.
REFERENCES
Anthony, G., & Walshaw, M. (2002). Swaps and switches: Students’ understandings of commutativity. In B. Barton, K. C.
Irwin, M. Pfannkuch, & M. O. J. Thomas (Eds.). Mathematics Education in the South Pacific (Proceedings of the
25th annual conference of the Mathematics Education Research Group of Australasia, Auckland, (pp. 91-99).
Sydney: MERGA.
Askew, M. (2018). Multiplicative reasoning: teaching primary pupils in ways that focus on functional relations. The
Curriculum Journal, 29(3), 406-423.
Ball, D. L., Hoover-Thames, M., & Phelps, G. (2008). Content knowledge for teaching: What makes it special? Journal of
Teacher Education, 59(5), 389-407.
Barmby, P., Harries, T., Higgins, S., & Suggate, J. (2009). The array representation and primary children’s understanding
and reasoning in multiplication. Educational Studies in Mathematics, 70, 217-241.
Barmby, P., Harries, T., & Higgins, S. (2010). Teaching for understanding/understanding for teaching. In I. Thompson
(Ed.), Issues in teaching numeracy in primary schools, (2nd. ed.). Maidenhead, U.K.: Open University Press.
Benson, C. C., Wall, J. T., & Malm, C. (2013). The distributive property in Grade 3? Teaching Children Mathematics,
19(8), 498-506.
Behr, M., Harel, G., Post, T., & Lesh, R. (1994). Units of quantity: A conceptual basis common to additive and
multiplicative structures. In G. Harel & J. Confrey (Eds.). The development of multiplicative reasoning in the
learning of mathematics (pp. 121-176). Albany, NY: State University of New York Press.
Boaler, J., Chen, L., Williams, C., & Cordero, M. V. (2016). Seeing as understanding: The Importance of visual
mathematics for our brain and learning. Journal of Applied and Computational Mathematics, 5, 1-6.
Brown, G., & Quinn, R. J. (2006). Algebra students’ difficulty with fractions: An error analysis. Australian Mathematics
Teacher, 62, 28-40.
Bruner, J. S. (1966). Toward a theory of instruction. Cambridge, MA: Belkapp Press.
Clements, D., & Sarama, J. (2019) From Children’s Thinking to Curriculum to Professional Development to Scale:
Research Impacting Early Maths Practice. In G. Hine, S. Blackley, & A. Cooke (Eds.). Mathematics Education
Research: Impacting Practice (Proceedings of the 42nd annual conference of the Mathematics Education Research
Group of Australasia) pp. 36-48. Perth: MERGA. Retrieved from:
https://merga.net.au/Public/Publications/Annual_Conference_Proceedings/2019-MERGA-conference-
proceedings.aspx

IOJPE
ISSN: 1300 – 915X
www.iojpe.org
International Online Journal of Primary Education 2021, volume 10, issue 1
Copyright © International Online Journal of Primary Education 30
Confrey, J., & Smith, E. (1995). Splitting, covariation, and their role in the development of exponential functions. Journal
for Research in Mathematics Education, 26(1), 66-86.
Cotton, T. (2016). Understanding and teaching primary mathematics. (3rd. ed.). Abingdon, U.K.: Routledge.
Creswell, J. W. (2007). Qualitative inquiry and research design: Choosing among five approaches (2nd ed.). Thousand
Oaks: Sage publications.
Delaney, S., Ball, D. L., Hill, H. C., Schilling, S. G., & Zopf, D. (2008). Mathematical knowledge for teaching: Adapting
U.S. measures for use in Ireland. Journal of Mathematics Teacher Education, 11(3), 171-197.
http://dx.doi.org/10.1007/s10857- 008-9072-1
Depaepe, F., Verschaffel, L., & Kelchtermans, G. (2013). Pedagogical content knowledge: A systematic review of the way
in which the concept has pervaded mathematics educational research. Teaching and Teacher Education 34, 12-25
Downton, A. (2008). Links between children’s understanding of multiplication and solution strategies for division. In M.
Goos, R. Brown & K. Makar (Eds), Navigating currents and charting directions (Proceedings of the 31st annual
conference of the Mathematics Education Research Group of Australasia, pp 171-178). Brisbane: MERGA Inc.
Goonen, B., & Pittman-Shetler, S. (2012). The struggling math student: From mindless manipulation of numbers to mastery
of mathematical concepts and principles. Focus on Basics, 4(5), 24-27.
Haylock, D. (2010). Mathematics explained for primary teachers. (4th. Ed.). London: Sage.
Hill, H. C., Ball, D. L., & Schilling, S. (2008). Unpacking pedagogical content knowledge: Conceptualizing and measuring
teachers' topic-specific knowledge of students. Journal for Research in Mathematics Education, 39(4), 372-400.
Hurst, C. (2017). Children have the capacity to think multiplicatively, as long as …. European Journal of STEM Education,
2(3), 1-14.
Hurst, C. (2018). A tale of two kiddies: A Dickensian slant on multiplicative thinking. Australian Primary Mathematics
Classroom, 23(1), 31-36.
Hurst, C., Hurrell, D., & Huntley, R. (in press). Factors and multiples: Important and misunderstood. International Journal
on Teaching and Learning Mathematics.
Hurst, C. & Hurrell, D. (2018). Algorithms are great: What about the mathematics that underpins them? Australian Primary
Mathematics Classroom, 23(3), 22-26.
Jacob, L., & Mulligan, J. (2014). Using arrays to build towards multiplicative thinking in the early years. Australian
Primary Mathematics Classroom, 19(1), 35-40.
Jacob, L., & Willis, S. (2001). Recognising the difference between additive and multiplicative thinking in young children.
In J. Bobis, B. Perry & M. Mitchelmore. (Eds.), Numeracy and beyond (Proceedings of the 24th Annual
Conference of the Mathematics Education Research Group of Australasia, Sydney pp. 306-313). Sydney: MERGA.
Jacob, L., & Willis, S. (2003). The development of multiplicative thinking in young children. In: L. Bragg, C. Campbell, G.
Herbert, & J. Mousley (Eds.), Mathematics education research: Innovation, networking, opportunity. Proceedings
of the 26th Annual Conference of the Mathematics Education Research Group of Australasia, 6 - 10 July 2003,
Deakin University, Geelong.
Lesh, R., Cramer, K., Doerr, H. M., Post, T., & Zawojewski, J. S. (2003). Model development sequences. In R. Lesh, & H.
M. Doerr (Eds.), Beyond constructivism: Models and modeling perspectives on mathematics problem solving,
learning, and teaching (pp. 3-33). Mahwah, NJ: Lawrence Erlbaum
McKenna, S. (2019). Discussion, conjectures, noticing. Mathematics Teaching, 267, 38-39.
Mulligan, J., & Watson, J. (1998). A developmental multimodal model for multiplication and division. Mathematics
Education Research Journal, 10(2), 61-86.
Mutodi, P., & Ngirande, H. (2014). The nature of misconceptions and cognitive obstacles faced by secondary school
mathematics students in understanding probability: A case study of selected Polokwane Secondary Schools.
Mediterranean Journal of Social Sciences, 5(8), 446-455.
Nunes, T. & Bryant, P. (1996). Children doing mathematics. Oxford, UK: Blackwell.
McKenna, S. (2019). Discussion, conjectures, noticing. Mathematics Teaching, 267, 38-39.
Reys, R. E., Rogers, A., Bennett, S., Cooke, A., Robson, K., Ewing, B., & West, J. (2020). Helping children learn
mathematics, (3rd. Aust. Ed.). Milton, Qld: Wiley.

IOJPE
ISSN: 1300 – 915X
www.iojpe.org
International Online Journal of Primary Education 2021, volume 10, issue 1
Copyright © International Online Journal of Primary Education 31
Rittle-Johnson, B., & Schneider, M. (2015). Developing conceptual and procedural knowledge in mathematics. In R.
Cohen Kadosh & A. Dowker (Eds.), Oxford handbook of numerical cognition (pp. 1102-1118). Oxford, UK:
Oxford University Press.
Schneider, M., Grabner, R. H., & Paetsch, J. (2009). Mental number line, number line estimation, and mathematical
achievement: Their interrelations in grades 5 and 6. Journal of Educational Psychology, 101(2), 359.
Shulman, L. S. (1986). Those who understand, knowledge growth in teaching. Educational Researcher 15(2), 4-14.
Siegler R. S., Duncan G. J., Davis-Kean P. E., Duckworth K., Claessens A., Engel M., Susperreguy M. I., & Chen M.
(2012). Early predictors of high school mathematics achievement. Psychological Science, 23(7), 691-697.
Siemon, D., Warren, E., Beswick, K., Faragher, R., Miller, J., Horne, M., Jazby, D., Breed, M., Clark, J., & Brady, K. M.
(2021). Teaching mathematics: Foundations to middle years – 3rd ed. Melbourne: Oxford University Press.
Siemon, D., Beswick, K., Brady, K. M., Clark, J., Faragher, R., & Warren, E. (2015). Teaching mathematics: Foundations
to middle years – 2nd ed. Melbourne: Oxford University Press.
Siemon, D., Breed, M., Dole, S., Izard, J., & Virgona, J. (2006). Scaffolding Numeracy in the Middle Years – Project
Findings, Materials, and Resources, Final Report submitted to Victorian Department of Education and Training
and the Tasmanian Department of Education, Retrieved from:
http://www.eduweb.vic.gov.au/edulibrary/public/teachlearn/student/snmy.ppt
Sophian, C., & Madrid, S. (2003). Young childrens' reasoning about many-to-one correspondences. Child Development,
74(5), 1418-1432.
Sriraman, B. (2006). Conceptualizing the model-eliciting perspective of mathematical problem solving. In M. Bosch (Ed.),
Proceedings of the Fourth Congress of the European Society for Research in Mathematics Education (CERME 4)
(pp. 1686-1695).
Stott, D. (2016). Using arrays for multiplication in the Intermediate Phase. Learning and teaching mathematics, 21(6-10).
Swan, P., & Marshall, L. (2010). Revisiting mathematics manipulative materials. Australian Primary Mathematics
Classroom, 15(2), 13-19.
Tipps, S., Johnson, A., & Kennedy, L. M. (2011). Guiding children’s learning of mathematics. (2nd ed.). Belmont,
California: Wadsworth. (p. 203; p. 237)
Vale, C., & Davies, A. (2007). Dean’s great discovery: Multiplication, division and fractions. Australian Primary
Mathematics Classroom. 12(3), 18–22.
Van de Walle, J. A., Karp, K. S., & Bay-Williams, J. M. (2013). Elementary and middle school mathematics: Teaching
developmentally (8th. Ed.). Boston: Pearson.
Way, J. (2011). Multiplication series: Number arrays. Retrieved from https://nrich.maths.org/2466
Waller, P. P., & Marzocchi, A. S. (2020). From rules that expire to language that inspires. The Mathematics Teacher,
113(7), 544-550.
Wright, V. J. (2011). The development of multiplicative thinking and proportional reasoning: Models of conceptual
learning and transfer. (Doctoral dissertation). University of Waikato, Waikato. Retrieved from
http://researchcommons.waikato.ac.nz/.
Young-Loveridge, J. (2005). Fostering multiplicative thinking using array-based strategies. The Australian Mathematics
Teacher, 61(3), 34-40.
Young-Loveridge, J., & Mills, J. (2009). Teaching multi-digit multiplication using array-based materials. In R. Hunter, B.
Bicknell, &T.Burgess (Eds.), Crossing divides (Proceedings of the 32nd annual conference of the Mathematics
Education Research Group of Australasia pp. 635-643). Palmerston North, NZ: MERGA

IOJPE
ISSN: 1300 – 915X
www.iojpe.org
International Online Journal of Primary Education 2021, volume 10, issue 1
Copyright © International Online Journal of Primary Education 32
AN EXPLORATION OF PRIMARY SCHOOL TEACHERS’
MATHS ANXIETY USING INTERPRETATIVE
PHENOMENOLOGICAL ANALYSIS
Jane DOVE
MRes Psychology student, University of Derby, School of Human Sciences, Derby, UK
ORCID: https://orcid.org/0000-0003-2045-6550
Jane MONTAGUE
Dr., Head of Psychology, University of Derby, School of Human Sciences, Derby, UK
ORCID: https://orcid.org/0000-0002-9282-5565
Thomas E. HUNT
Dr., University of Derby, School of Human Sciences, Derby, UK
ORCID: https://orcid.org/0000-0001-5769-1154
Received: March 31, 2021 Accepted: May 14, 2021 Published: June 30, 2021
Suggested Citation:
Dove, J., Montague, J., & Hunt, T. E. (2021). An exploration of primary school teachers’ maths anxiety using interpretative
phenomenological analysis. International Online Journal of Primary Education (IOJPE), 10(1), 32-49.
This is an open access article under the CC BY 4.0 license.
Abstract
Primary school teachers are important in children’s learning of mathematics, and maths anxiety development has been partly
attributed to children’s classroom experiences (Das & Das, 2013). Maths anxiety was explored in UK primary school
teachers, with a view to understanding its development and impact. Data from four semi-structured individual interviews
were analysed using Interpretative Phenomenological Analysis (IPA), which facilitates a deeper knowledge of individuals’
personal experience. Three key themes emerged: “experiencing the psychological consequences of maths anxiety”, “social
influences” and “the consequences of experiencing maths anxiety as a teaching professional”. The findings contribute to our
understanding of the influence of maths anxiety on teachers and teaching practices.
Keywords: Maths anxiety, qualitative research, primary school teachers, experience of teaching.
INTRODUCTION
Maths anxiety is a negative emotional response to situations involving mathematics (henceforth
maths); it is not simply a proxy for poor maths ability but rather the fear that arises in individuals
undertaking a mathematical task, which impedes performance (Beilock, Gunderson, Ramirez, &
Levine, 2010). Indeed, there is much evidence that maths anxiety is negatively related to maths
performance (Hembree, 1990; Namkung, Peng, & Lin, 2019; Zhang, Zhao, & Kong, 2019; Barroso,
Ganley, McGraw, Geer, Hart, & Daucourt, 2021). It is associated with avoidance of effort-based
decision making (Choe, Jenifer, Rozek, Berman, & Beilock, 2019) and maths related education or
career paths (Hembree, 1990; Ahmed, 2018). It can also have serious implications within the
workplace such as inaccurate calculations of drug dosages by medical staff (Ahmed, Minnaert,
Kuyper, & van der Werf, 2012) or impaired financial planning (Beilock & Willingham, 2014). People
with maths anxiety may experience negative feelings when asked to divide up a restaurant bill or
answer a mathematical problem in front of others. Fear of being judged or looking incompetent in
front of others are the consequences of failure and can lead to unpleasant physiological reactions such
as feelings of tension, nervousness or nausea (Dowker, Sarkar, & Looi, 2016).
It is difficult to determine the causes of maths anxiety. One argument is that some people have a
genetic predisposition to develop maths anxiety. This has been seen in maths anxiety studies involving

IOJPE
ISSN: 1300 – 915X
www.iojpe.org
International Online Journal of Primary Education 2021, volume 10, issue 1
Copyright © International Online Journal of Primary Education 33
twins. For example, Wang, Hart, Kovas, Lukowski, Soden, Thompson, Plomin, McLoughlin,
Bartlett, Lyons, and Petrill (2014) studied 514 twelve-year-old twin pairs who were given a test to
assess their maths anxiety levels, a general test of anxiety, a maths problem solving test and a reading
comprehension test. A multivariate analysis revealed 40% of the variance in maths anxiety of the twin
pairs was accounted for by behavioural genetic factors and the remaining variance explained by non-
shared child-specific environmental factors. This suggests that maths anxiety may result from a
combination of negative experiences with maths and predisposing genetic risk factors associated with
maths cognition and general anxiety (Wang et al., 2014). Other work has suggested that brain activity
is associated with maths anxiety, e.g. neuroimaging studies indicate individuals with high maths
anxiety show reduced response in the posterior parietal and dorsolateral pre-frontal cortex brain
regions (which are involved in mathematical cognition) and increased responses in the right amygdala
– the brain region involved in affective fearfulness and threat detection (Young, Wu, & Menon, 2012).
Psychological theories have emphasised the role of cognitive processes, e.g. that working memory of
individuals with high maths anxiety is impaired by intrusive, worrisome thoughts (Ashcraft & Krause,
2007). In particular, it is thought that high maths anxious individuals use up limited attentional
resources of the central executive component of working memory, rather than allocating their
attentional resources to the task at hand (Suárez-Pellicioni, Núñez-Peña, & Colomé, 2016). This
debilitating effects model, however, has been discussed against a deficit model whereby an early
deficit in mathematical understanding and knowledge is thought to lead to the later development of
maths anxiety (Ma & Xu, 2004). As Carey, Hill, Devine and Szucs (2016) note, it is likely that a
reciprocal model is more likely. It also seems that maths anxiety is strongly related to the way a person
rates themselves in relation to maths (Dowker, Sarkar, & Looi, 2016).
It is likely that negative or positive reactions and experiences associated with maths will influence an
individual’s self-concept. Self-concept is a global composite view of oneself: how an individual
perceives their skills and abilities they possess (Bong & Skaalvik, 2003). Self-efficacy, on the other
hand, is concerned with what individuals believe they can do with the skills and abilities they possess
(Bong & Skaalvik, 2003) and constitutes an individual’s innate belief in their ability to succeed at a
task or in a situation (Bandura, 1982). Emotional and psychological states contribute to an individual’s
self-efficacy towards their maths capabilities. Self-efficacy is influenced by an individual’s past
experience and their perceived ability to master, or not, a particular task. It is also influenced by seeing
others who they determine to be similar to themselves either succeed or fail. Social encouragement
from others also influences self-efficacy; however, positive encouragement is more difficult to impart
and therefore to influence positive self-efficacy compared with the ease it takes to undermine an
individual. Reducing the stress response and an individual’s negative tendencies that they associate
with a task or situation will also modify self-efficacy (Bandura, 1994): how an individual perceives
themselves and their abilities influences their thoughts and behaviours towards a task or situation. A
high self-concept in maths for example may lead an individual to have a positive outlook on maths and
based on their feelings towards it and their past positive experiences may lead them to consider that
they have good maths abilities. For these individuals any maths difficulties may be seen as challenges,
thus prompting a positive approach towards solving problems. On the other hand, a low maths self-
concept can lead to a focus on negative maths experiences and a low perception of one’s maths ability,
giving a negative overall view of maths and possibly prompting anxiety around it.
One of the most clearly investigated factors on maths anxiety is the relationship between gender
and maths. Although research indicates that males and females provided equal education in maths
show little or no difference in mathematical performance, females do tend to rate themselves
lower in maths ability and to express more anxiety (Dowker, Sarkar, & Looi, 2016). This increased
anxiety expression in females is posited to come from several sources such as exposure to gender
stereotypes and the influence of and social transmission of anxiety by female teachers who are
maths anxious (Beilock et al., 2010). Stereotypically the common assumption in the maths domain
is that males are better at maths than females. When a relevant negative stereotype is made salient in a

IOJPE
ISSN: 1300 – 915X
www.iojpe.org
International Online Journal of Primary Education 2021, volume 10, issue 1
Copyright © International Online Journal of Primary Education 34
performance situation an individual may perform more negatively than perhaps their ability would
suggest, resulting in stereotype threat (Maloney, Schaeffer & Beilock, 2013); this can impact both
maths anxious males who feel they are required to uphold the positive image of male maths
superiority, and females who feel they confirm the negative stereotype.
Some researchers have suggested anxiety as resulting from a combination of factors: if a child has
cognitive issues with numerical and spatial competencies and lacks confidence, they may have a
greater predisposition to pick up the negative cues from their maths anxious teacher, leading to the
development of maths anxiety (Maloney & Beilock, 2012). Additionally, negative classroom
experiences are considered by some researchers as key factors in the development of maths anxiety.
This includes maths being taught in a rigid, non-participatory or rote fashion without full
explanation of the concepts and procedures behind the methods (Das & Das, 2013) or an
overreliance on using tests to assess maths learning as well as teacher attitudes (Hamza & Helal,
2013). Schofield (1981) found that teacher attitudes were linked to students’ performance and
attitudes towards maths. Teachers who were classified with low or middle levels of achievement
and attitude in their own maths ability maintained the lowest student performance scores with
students holding the least favourable attitudes towards maths. This was compared to teachers with
high maths achievement and a positive maths attitude whose teaching produced high achieving
students even though the students had initially had an unfavourable attitude towards maths.
Jackson and Leffingwell (1999) also researched teachers’ own attitudes towards maths as a subject
and how their attitude towards teaching affected student performance. They found that many had
negative early school years experiences, describing negative teacher behaviours, including
hostility if they asked for help or highlighting student errors in front of the class, causing
embarrassment and humiliation. Overall, their study suggested that just 7% of their sample reported
having had only positive experiences with maths during their school years.
It is important to understand, therefore, how for some teachers a negative maths attitude might
evolve. Teachers who are anxious about their own maths ability may unwittingly impart these
negative beliefs to some of their students and therefore contribute to the development of the cycle
of maths anxiety. A negative attitude towards maths may also lead teachers to reduce their effort,
affecting their instructional behaviour, which in turn influences student attitudes. Relich, Way and
Martin (1994) suggested that a positive teacher attitude towards maths is beneficial as it helps
develop positive student attitudes; this then increases the likelihood of students investing more
time and energy in improving their own competence.
A teacher’s professional identity is a combination of their past experiences around maths, social
influences such as maths gender stereotypes as well as their knowledge, maths self-efficacy and
maths self-concept (Bennison & Goos, 2013). Research has shown that even teachers with high
levels of maths anxiety hold high efficacious beliefs about their ability to teach maths and express
confidence in their ability to be effective maths teachers (Swars, Daane, & Giesen, 2006). This
may be due to the availability of professional learning and improved pedagogical maths content
support for teachers that helps bolster their confidence in their ability to teach maths effectively.
Much of the research into maths anxiety seems to rely on questionnaires, beginning with the
Mathematics Anxiety Rating Scale (Richardson & Suinn, 1972), and its subsequent versions (Plake
& Parker, 1982; Alexander & Martray, 1989; Suinn & Winston, 2003). More recent scales have
been developed or modified to measure maths anxiety in populations outside of the U.S.A. (e.g.
Hunt, Clark-Carter, & Sheffield, 2011; Nunez-Pena, Suarez-Pellicioni, Guilera, &
Mercade-Carranza, 2013). Questionnaires provide useful data about maths anxiety; however,
such a measurement technique may not capture the full range of individuals’ attitudes, feelings and
experiences of maths.
To date, relatively few studies have adopted a qualitative methodology to investigate maths
anxiety. Those that have, have tended to focus on pre-service teachers. Trujillo and Hadfield

IOJPE
ISSN: 1300 – 915X
www.iojpe.org
International Online Journal of Primary Education 2021, volume 10, issue 1
Copyright © International Online Journal of Primary Education 35
(1999), via a series of interviews, identified commonalities between pre-service teachers in
relation to their negative emotions relating to maths, including early school and home
experiences and how they planned to overcome their maths anxiety. More recently, Uusimaki and
Nason (2004) conducted mixed-methods research to investigate pre-service teachers’ negative
beliefs and anxiety around maths. Applying thematic analysis (Braun & Clarke, 2006) to interview
data, they generated three ‘school experiences’ themes: ‘origins of negative beliefs and anxiety
about mathematics’, ‘situations causing most maths anxiety’ and ‘types of maths causing maths
anxiety’. They demonstrated that most of the pre-service teachers’ maths anxiety could be
attributed to their own primary school experiences in learning maths, such as within test situations,
having to give verbal explanations, dealing with poor teacher attitudes and difficult mathematical
content. In their quantitative element, Uusimaki and Nason (2004) ascertained the number of
participants per theme and converted the totals to percentage scores. These findings suggested that
72% of their participants attributed their negative school maths experiences to their teachers,
rather than to specific mathematical content or social factors such as family or peers. These
findings have been supported more recently within work from Bekdemir (2010), who found pre-
service teachers’ maths anxiety to be related to their own remembered negative classroom
experiences, in particular the perceived hostility and inadequacy of their teachers.
It seems, then, that teachers’ own early negative experiences in learning maths might contribute to
the development of anxiety towards maths in others. However, research has suggested that even if
teachers experience maths anxiety and have a low aptitude for maths themselves, this does not
preclude them from continuing their career as a teacher and successfully teaching maths nor does it
negatively impact their confidence in their ability to teach maths (Beilock et al., 2010: Bennison &
Goos, 2013). A qualitative approach, aimed at giving a deeper understanding of what it is like to
experience maths anxiety, can be used to develop more applicable interventions and training as well
as to help raise awareness of the impact of experiencing its potentially debilitating effects. Maths
teachers in secondary education elect to specialise in maths and therefore, we suggest, may not
exhibit as much maths anxiety as teachers in the primary education sector who are obliged to
teach mathematics as part of the curriculum. To facilitate a more in-depth understanding, the
present research utilizes the qualitative approach of Interpretative Phenomenological Analysis to
explore primary school teachers’ experiences and understanding of their own maths anxiety.
METHOD
Analytic Approach
Teachers’ personal accounts, gained via semi-structured interviews, are analysed using
Interpretative Phenomenological Analysis (IPA, Smith, Flowers, & Larkin, 2009). IPA has been
developed through integrating ideas from philosophers such as Husserl, Heidegger,
Merleau-Ponty, and Sartre (Smith, Flowers, & Larkin, 2009). Drawing on philosophical areas of
phenomenology, hermeneutics and ideography, IPA goes beyond pure description of events
exploring how individuals make sense of their experiences, such as maths anxiety, and what
meanings they attach to them. For example, IPA can give a deeper understanding of the feelings,
behavior and consequences of how a participant felt about being singled out when they were a
child to answer a maths problem in front of a class.
IPA is fundamentally ideographic – researchers are committed to a detailed analysis of the
phenomenon under investigation, analysing each individual’s lived experience before moving to a
cross-case analysis illuminating convergence and divergence between individuals (Tuffour,
2017). Teachers are the experts on their own maths anxiety experiences offering an ‘insider’s’
perspective through accounts of their childhood maths encounters and the impact of those
encounters on their professional lives as primary school teachers.
The data generated are embedded in the specific contextual and socio-cultural background that
participants and researcher share (Reid, Flowers, & Larkin, 2005) and the analytic process of IPA

IOJPE
ISSN: 1300 – 915X
www.iojpe.org
International Online Journal of Primary Education 2021, volume 10, issue 1
Copyright © International Online Journal of Primary Education 36
is a subjective and reflective process of interpretation by the researcher of the participants’
experiences (Smith, Flowers, & Larkin, 2009). The researcher actively works with these data,
balancing shared commonalities across each account and highlighting participants’ experiences
(Reid et al., 2005). It has been argued that IPA might become more descriptive than interpretative
(Truffour, 2017) therefore it is important to acknowledge the double hermeneutic of the
researcher interpreting the participants’ interpretations of their experiences.
With its focus on lived experience IPA was deemed appropriate for an exploration of the
experience of maths anxiety. This is a topic that individuals express their feelings towards – it is
socially acceptable to ‘admit’ to not liking/not being good at maths (Kindermann & Skinner,
2009) – therefore participants are likely to share rich and detailed information about its impact on
their lives. As discussed previously much of the research in this area has used quantitative
approaches such as surveys and questionnaires whereas insights into the experience of anxiety
about encounters with maths are limited. Taking this novel approach our overall aim was to
explore the maths anxiety experiences of primary school teachers, offering a specific focus on
increasing understanding of the psychological impact of maths anxiety on primary school teachers
and their perception of its impact upon them.
Research Design
Data were generated using semi-structured interviews and then analysed using Interpretative
Phenomenological Analysis (IPA). Rather than predicting what might prevent maths anxiety, IPA
enables insight into how primary school teachers make sense of their own maths anxiety
experiences thus informing recommendations for future developments of support in the area
(Cooper, Fleischer, & Cotton, 2012).
Recruitment Strategy
Participants were recruited from a state-run mixed primary school (ages 7-11) based in a large
town in the U.K. Permission was granted to advertise in the staff room for participants who
believed they suffered with maths anxiety; thus the participant group all self-reported their maths
anxiety. All participants consented to the study and were fully debriefed. Anonymity was
guaranteed through the use of pseudonyms in all transcripts and reporting. Ethical clearance was
granted by the university research ethics board following guidelines from the British
Psychological Society (BPS) Code of Human Research Ethics (2010).
Participants
As guided within the methodological framework of IPA a small, purposive sample of primary
school teachers (Table 1, four participants) was selected for inclusion. Their homogeneity
(sharing similarities such as occupation and working environment) ensured that detailed accounts
generated during the interview yielded sufficient relevant and idiographic information (Cooper,
Fleischer, & Cotton, 2012). No age range or gender was specified.
Table 1. Participant details
Participant pseudonym Tania Maria John Kate
Participant age (years)
29 28 38 21
Number of years teaching
10 7 2 <1
Ages of children they teach 7-8 8-9 7-8 6-7
Being taught maths at school and additional maths education
Tania remembers learning multiplication tables by rote, being selected to answer a maths
problem in front of the class and being sat at a desk with the teacher in the front of the class as
well as a lot of writing in exercise books rather than practical maths work. She took extra tuition
in high school to obtain a maths qualification in order to get to university and study a post-

IOJPE
ISSN: 1300 – 915X
www.iojpe.org
International Online Journal of Primary Education 2021, volume 10, issue 1
Copyright © International Online Journal of Primary Education 37
graduate certificate in education (PGCE). John remembers standing in front of a chalkboard at
school working out an equation in front of the class. He also remembers desks in a row and
copying from the blackboard and writing in exercise books. John hired a tutor and re-took his
maths qualification twice before he could study for his PGCE. Maria remembers working through
text books, learning multiplication tables sitting at desks and learning in a rote fashion. Maria had
no further maths education after gaining the required grade on her first attempt in order to attend
university. Kate remembers teachers standing at the front of the class with her then writing
answers in an exercise book. She also remembers being asked to answer maths problems in front
of class and its damage to her confidence. At the time of interview Kate was having extra maths
tuition as part of her newly qualified teacher (NQT) training in order to help her complete the
maths requirement of the training.
Data generation and materials
Individual face-to-face semi- structured interviews were conducted using a schedule asking 12
open-ended questions plus prompts (see Appendix). Questions were designed to address a number
of considerations. They built rapport with participants, enabling them to contemplate the topic
under discussion and elaborate on aspects that held importance for them in relation to the overall
focus of the research question. As the research question’s aim is to uncover participants’
experiences of maths anxiety the questions were open ended and framed to encourage
participants to reflect on their childhood maths experiences, their adult and professional
experiences and the type of maths support they may have received. The questions also enabled
the interviewer to maintain control of the interview without leading the participant in particular
directions (Willig, 2013). Each interview was held in a private room on school premises lasting
35 to 45 minutes and recorded using a Dictaphone. The material gathered from participants was
transcribed verbatim.
Analytic procedure
Following the recommendations by Smith and colleagues (2003; 2009), IPA processes were applied
to each transcript on a case-by-case basis. This was then followed by comparison across all the
case transcripts.
Stage one
The interviews were read repeatedly to facilitate close interaction with the data followed by initial
noting of exploratory comments. The exploratory comments consisted of descriptive, linguistic
and interpretative comments. Descriptive comments involved identifying explanations and
descriptions of events, emotional comments or key experiences described by the participants.
Linguistic comments focused on the specific use of language that participants used to describe
events and feelings. Linguistic features such as the use of metaphors, repetition, pauses, sighs or
laughter were also noted. The third stage was interpretative and involved making conceptual
comments about what the researcher believed was the participant’s overarching understanding of
what they were saying (Smith, Flowers, & Larkin, 2009). Table 2 outlines examples of the types
of comments with the analysis found in the transcripts.
Table 2. Exploratory comments
Type of Comment Analysis of comments Original Transcript
Descriptive Remembers the panic which
heightened awareness of how
children may feel when asked on
the spot questions
“I just remember the panic part so
it definitely makes me more aware
of my kids”
Linguistic Use of ‘freak’ expresses strength
of reaction, use of ‘definitely’
reinforces action
“I would definitely have a bit of a
freak out because I would have to
go over things before I taught
them”

IOJPE
ISSN: 1300 – 915X
www.iojpe.org
International Online Journal of Primary Education 2021, volume 10, issue 1
Copyright © International Online Journal of Primary Education 38
Conceptual Feels the advantage of having
maths anxiety makes her a more
effective teacher of maths
“I do think it has an advantage
being aware I wasn’t good at
maths…..I almost find it easier to
teach maths because I feel I have a
very simple way of doing it”
Stage 2
Initial themes that emerged from the exploratory analysis were identified by taking note of the
transcript and the exploratory comments (Smith, Flowers, & Larkin, 2009). Themes were
produced using a concise statement or phrase that captured and reflected the participant’s original
words that alluded to their cognitive states, thoughts and feelings as well as the researcher’s
interpretations (Table 3).
Table 3. Developing emergent themes
Exploratory Comments Transcript Emergent themes
Remembers the panic which
heightened awareness of how
children may feel when asked on
the spot questions
‘‘I just remember the panic part so
it definitely makes me more aware
of my kids’’
Heightened awareness
Feels the advantage of having
maths anxiety makes her a more
effective teacher of maths
“I do think it has an advantage
being aware I wasn’t good at math
because when I explain maths to
kids now, I almost find it easier to
teach maths because I feel I have a
very simple way of looking at it”
Empathy
Recognises panic in children “If now if I have a kid that panics I
can see and know they are going to
panic”
Recognition of fear in others
Stage 3
Superordinate themes were then developed by identifying connections between the emergent
themes. Emerging themes were entered onto a list, printed and cut into separate pieces. The
themes were moved around on a piece of card (670mm x940mm) into clusters that represented
parallel or similar understandings and given a superordinate theme title that reflected the essence
of the cluster (Box 1).
Box 1. Developing a superordinate theme
Stage 4
Once stages 1- 3 had been carried out on all transcripts, the final stage looked for patterns across all
the cases to produce a master table of themes for the group. This involved laying out the
individual themes for each participant typed in a different colour to ensure an even consideration
of each participant. Each theme was cut into single items, placed on the card to facilitate
identification of connections between the themes. As clusters of themes for the group were
emerging the passages from each transcript were reread to ensure a close reflection of the data
leading to the creation of new superordinate themes and sub themes along with extracts from the
data to illustrate them. The superordinate themes were developed based on their perceived
importance of the participant’s maths anxiety experiences. On completion, the final master table of
Heightened awareness
Empathy
Recognition of fear in others

IOJPE
ISSN: 1300 – 915X
www.iojpe.org
International Online Journal of Primary Education 2021, volume 10, issue 1
Copyright © International Online Journal of Primary Education 39
themes for the group emerged (Table 4). The quotes that it was felt most effectively reflected
participants’ thoughts and feelings about their maths anxiety were then analysed and are presented
in the analysis section of this article.
FINDINGS
The three master themes and their subthemes (Table 4) that emerged from the analysis are presented
with quotes from the participants and the researcher’s interpretation of the analysis.
Table 4. Master themes for the group and their related sub-themes
Superordinate Themes Subordinate themes
Experiencing the psychological consequences of
maths anxiety
Effects on learning and maths performance
Effect on self-efficacy
Social influences Parents and Teachers
Peer relationships
The consequences of experiencing maths anxiety as
a teaching professional
Recognition and understanding maths anxiety in
pupils
Benefits of experiencing maths anxiety
Each superordinate theme and its related subordinate themes are presented and discussed
individually.
Experiencing the psychological consequences of maths anxiety
Throughout their accounts, participants’ experiences of maths were discussed as making them feel
anxious and affecting their learning, maths performance and mathematical self-beliefs.
Effects on learning and maths performance Participants reflected how their childhood classroom experiences contributed to their feelings of
anxiety and how they made sense of the development of their maths anxiety.
‘I hated maths, I really hated maths and being put on the spot I absolutely hated it (sigh,
pause) You know when you are sat there and the teacher is going ‘what is 5 x 7?’ even if I
knew it, I didn’t know it when they asked me (pause) I remember just being so ‘please
don’t ask me please don’t ask me’. I just hated having to do something really quickly in
front of people.’ (Tania).
Tania’s emphatic response, in which her strength of feeling was emphasised, reflected her tension,
apprehension and worry at being singled out to answer a maths question in front of others. She
focused on the apprehension of being selected to provide an answer rather than being able to
think about the answer to the problem itself. Her constant fear of being singled out and being
unable to answer questions appeared to reinforce her negative thoughts and feelings towards
maths, thus setting up a situation of anxiety even around fairly straightforward numerical problems.
Maria recalled how her anxiety arose from the feelings of confusion she felt when attempting to
learn new mathematical concepts but was unable to grasp the theories:
I do remember really hating it (pause) because it was just hard and fractions in
particular. I didn’t get it, they were just numbers and lines. People were giving me food
and trying to talk to me about pizzas and cakes, way over my head and it stressed me out.
As with Tania, Maria emphasised her negative emotional response with reference to a specific issue
– in her case ‘fractions’. Even when people tried to illustrate them in everyday ways, such as with
food, she became stressed as she struggled to understand these attempts at clarifying new concepts,
thus linking to self-efficacy (Bandura, 1986).

IOJPE
ISSN: 1300 – 915X
www.iojpe.org
International Online Journal of Primary Education 2021, volume 10, issue 1
Copyright © International Online Journal of Primary Education 40
Effect on self-efficacy
Self-efficacy is concerned with the extent to which an individual believes they are able to
perform an activity (Bandura, 1986) and for these participants a shared negative self-belief in their
maths ability was evident. For some, this judgment arose from a comparison of how good they
believed they were at other subjects and the emotional attachment they attributed to them. Tania
said:
I got an A in English because I loved it so much I think I would have been much more
disappointed if I’d got low scores in anything like that I’m just really bad with numbers
like I said before I don’t remember numbers, no we’re not friends.
Tania’s emphasis that maths was not an area she was comfortable with, alongside her perception of
her poor ability, was based on the comparison she made on her past performances in English. Her
positive self-efficacy towards English, which she ‘loved’ was contrasted with her negative
self-efficacy towards maths, which she ‘hated’. Her rejection and dismissal of anything positive
being linked to numbers appeared to reinforce her negative self-belief and led to her conclusion she
was ‘really bad’ at maths.
Other participants demonstrated similar feelings of negative self-efficacy towards their maths
ability, a stress that was perceived to have wider implications in terms of career choices. Maria said:
Before gaining newly qualified teaching status you have to do a maths multiple - choice.
That was a bit stressful cause I’m like ‘(gasp) oh my gosh I don’t know if I can even do it,
how can I teach it?’.
Maria’s inward expression of doubt over her performance ability became apparent in her discussion
of training to become a teacher. Her worry about having to complete the maths test influenced her
perception of her ability to teach it. Similarly, Kate was concerned about the effects of her
perceived lack of ability:
I just get worried that one day someone is going to ask me a question like subtract
something and I’m going to be like ‘umm ermm ‘ and just not be able to answer it which
as a teacher you’re expected to be like ‘yep yep that’s right’. Sometimes I feel like I’m not
quick enough (pause) it’s always been my weakest subject (pause) but I have actually not
found that in the 7 weeks that I have been here.
Kate’s internal conversation, suggesting the type of response she believed teachers are expected to
give and what she believed would be her own response, again indicates negative self-efficacy
towards maths ability. Her negative expectation suggested a belief that she was not good enough to
teach maths even though that does not seem to have been found in practice.
Bandalos, Yates and Thorndike-Christ (1995) suggest that cues from past performance
experiences can be factors that contribute to self-efficacy judgments. Some of the participants
seemed to doubt their ability to teach maths based on previous negative experiences
(McCulloch-Vinson, 2001). The lack of confidence is suggested by Klinger (2006) to be linked to
negative mathematics self-efficacy beliefs that prevailed during school years. These are then carried
on into adulthood and are supported by registering and recalling events that support this belief.
In addition to the psychological consequences of maths anxiety that were discussed in relation to
their learning, maths performance and mathematical self- beliefs, participants also referred to the
social influence of parents, teacher and peers.
Social influences
The second theme focuses on how the attitudes and behaviours of parents, teachers and peers
affected participants’ maths anxiety.

IOJPE
ISSN: 1300 – 915X
www.iojpe.org
International Online Journal of Primary Education 2021, volume 10, issue 1
Copyright © International Online Journal of Primary Education 41
Parents and teachers
As a child, maths homework was a key activity for all the participants but, as Tania explained, this
could become a problem:
I can remember taking maths homework home and obviously because my dad’s a teacher
and my mums a teacher I remember them trying to help me do it and I remember I’d get
so frustrated I’d say ‘no you don’t understand that’s not how we’re doing it’ (pause) it
probably was how we were doing it but because I didn’t understand it I remember having
right strops about it.
Although Tania’s parents were supportive in their attempts to help her with her homework, their
problem-solving approaches were described as clashing with her teacher’s instructions. This
difference in approach appeared to leave her experiencing frustration and confusion which, in her
own words, led to an angry reaction. In linking her frustration and anger to her lack of
understanding of her maths homework, its difficulty became more apparent. Categorising her
parents in terms of their occupation adds emphasis to her self- perception as someone who does not
understand. Not all participants felt the same level of frustration, however. Maria, in contrast, felt
encouraged and motivated by her mother’s involvement:
My mum went and bought me books and I’d be like ‘I don’t get it’ so yeah she’d buy me
loads of stuff and be like ‘this is how you do it’. It was good ‘cause I liked working
through books and getting stars and I liked the well done I liked that I remember my
mum always saying ‘ask someone if you don’t know ask, ask what can you do, don’t just
sit there’ I remember the stern talking to so I’m assuming that I asked.
Maria’s memory of having the resources she needed and the pleasure she derived from being
rewarded suggests she associated these positive events with her maths learning experience. The
clear description of the memory of her mother demonstrating how to solve maths problems, and of
the repetition and directive tone of her words of encouragement to Maria to actively ask questions
suggests she was aware of the level of her mother’s involvement and influence on her maths
experience.
Participants also described clear memories of the pivotal part played by their teachers’ attitudes and
approaches in their maths anxiety experiences. Tania described how a teacher helped her reach a
key goal in maths:
In fact, it was when I started not to hate it so much because I had a lot of tuition from my
maths teacher at the time and erm (pause) I guess in a way it affected me in a good way, in
the beginning your scared of it, because I had to work really hard and I ended up getting a
B and was so so chuffed (pause) because I was trying to just trying to get the C and I just
worked hard.
Tania suggests that as her fear subsided, she began to feel less negative towards maths; although she
still verbalised her negative feelings the teacher’s support may have increased her motivation. Her
hesitation as she speaks suggests her careful consideration of the effort required. Similarly, her
recognition of the support she received suggests an understanding that the efforts of her teacher
helped her reach her goal.
John experienced both positive and negative teacher attitudes and his contrasting accounts suggest
this had an important influence on his approach to maths:
My middle school maths teacher, I had the same teacher all the way through I loved the
guy he was fantastic and I remember, I don’t remember many teachers names but I
remember his (pause) he would actually talk to us like a proper human and he was a very
very interesting guy and I think that maybe that made him more human.
John’s use of emotive language alongside repetition alluded to the impact of his positive

IOJPE
ISSN: 1300 – 915X
www.iojpe.org
International Online Journal of Primary Education 2021, volume 10, issue 1
Copyright © International Online Journal of Primary Education 42
experience with this particular teacher. The teacher’s open and encouraging approach appeared to
engage John’s interest and he began to feel comfortable in the maths learning environment. He
contrasted this experience with a different maths teacher whose attitude had a negative impact:
The teacher was very, erm (pause) she wasn’t (pause) actually she wasn’t very patient,
she was very impatient (pause) you couldn’t ask a question. I felt I couldn’t ask a question
without being shouted at.
John’s hesitation in discussing how this teacher made him feel suggests his discomfort at
remembering the teacher’s impatient and aggressive approach that seemed to discourage student
questions and created an intimidating environment. The negative cues John picked up from this
teacher’s behaviour may have highlighted maths in negative terms and possibly discouraged him
from engaging in the learning experience for fear of being reprimanded.
Parental encouragement and expressing belief in a child’s ability to learn may ensure they continue
to try even when they find things difficult, something which is likely to lead to less maths anxious
behaviour (Gunderson, Ramirez, Levine, & Beilock, 2012) and could increase mathematical
resilience (Johnston-Wilder & Lee, 2010). Schofield (1981) concluded that teacher attitudes were
directly linked to student attitude and performance in maths. In addition, as Das and Das (2013)
suggested, teachers provided a guiding and leading role in the learning environment and were
therefore highly influential in determining what happened in classrooms. Different experiences
ensued from this complexity of interaction, though teachers who cultivated a positive learning
environment encouraged children to learn and gain confidence. The opposite was true of negative
teacher behaviour and attitudes, which discouraged children and created anxiety in them (Plaisance,
2009).
As well as the impact of their teachers the participants highlighted how their interactions with their
peers also affected their maths anxiety.
Peer relationships
Peer relationships were important indicators to participants of how they compared themselves with
their colleagues with regards to their concerns around maths.
‘Once the Head gave us (a group of teachers) a SATS mental maths test cause she wanted us
to see the pressure the kids were under. My first instinct was to see what the person next to
me has written, you know like oh I’m right.’ (Tania).
John describes his experience:
When I was doing my PGSE I realised I wasn’t alone in my class of 30 people. There were
guys who were phenomenal they were real mathematicians and it’s when you start
talking to your peers you realise ‘you are actually in the same boat you’re not so confident
with it’ and I could probably get to the same answer as they guy who got there in 30
seconds it might take me 2 minutes but I will get there.
John’s personal attachment to his class suggests his feeling of connection to his peer group. His
expression of admiration of colleagues whom he considered to be mathematicians indicates an
acceptance of a range of maths skills. The ‘same boat’ metaphor suggests John’s feelings of
connection with others who experienced anxiety and reduced his feeling of isolation. Identifying
with peers seemed to help John acknowledge his strengths rather than focusing on feeling less
adequate. Being able to share experiences appeared to make him feel more comfortable in
expressing his maths anxiety.
How individuals believed they were perceived by their peers appeared to be of concern throughout
the interviews. For example, Maria said:
Sometimes when we are talking, when I’m with Tash and Gina, they are really

IOJPE
ISSN: 1300 – 915X
www.iojpe.org
International Online Journal of Primary Education 2021, volume 10, issue 1
Copyright © International Online Journal of Primary Education 43
mathematicians, when I talk to them it all goes a bit over my head and I wouldn’t ask
(pause) I’d just be like ‘yeah aha’ . It’s all about your relationship, (pause) Tash I’m a bit
closer to and I would be like’ I didn’t get it’ whereas in front of Gina ‘oh ok that’s great’
but have no idea.
Maria discussed how she modified her behaviour in front of her peers when discussing maths so
that they did not perceive her to have less knowledge than them. This was particularly apparent in
her description of her behaviour with different people and its link to how well she knew them. She
seemed to gain some confidence from presenting an outwardly knowledgeable image when
discussing maths, achieved by observing her colleagues’ interactions and maintained her equal
standing in that interaction by expressing agreement. In other cases, within the data, peer interaction
was discussed as enhancing the ways in which participants viewed themselves. Kate said:
Coming straight from Uni your shown strategies for maths like multiplication grids (pause)
they didn’t know about that and I showed them the box method I was like ‘who’s seen
that?’ a few people had but some were like’ oh we’ve not seen that’ so I was like ‘yes one
point to me’.
Kate outlined a maths discussion with peers where she introduced new mathematical tools that she
had been introduced to while at university. This seemingly more knowledgeable status from
someone who was lacking in experience seemed to give Kate a boost in confidence, enhancing
her self-esteem. Her use of descriptive point scoring suggests that being able to demonstrate this
greater knowledge made her feel as if she had an advantage over her peers, thus enhancing her
self- image.
The awareness of the influence key people had on participants’ maths anxiety was a common thread
in their accounts. Research suggests that it is socially acceptable to express dislike for maths and to
have anxiety around it without it affecting social perceptions of an individual’s normal contribution
to society or feeling socially compromised (Kindermann & Skinner, 2008), and this was certainly
demonstrated by some participants. Others described comparisons with peers. Those who described
more successful peers seemed to suffer from increased anxiety and stress, an effect seen in research
where comparison to others may negatively affect self-esteem if an individual feels less able
(Klinger, 2006). In other cases, however, successful comparisons can aid in self-evaluation
(Wood, 1989), something demonstrated by participants in some circumstances. In addition to these
comparisons, participants also discussed how experiencing maths anxiety was sometimes
considered of benefit to them.
The consequences of experiencing maths anxiety as a teaching professional
In some of their discussions participants highlighted advantages of having a level of personal maths
anxiety. In this theme we explore how experiencing maths anxiety was described as enabling
participants to recognise similar feelings in their own pupils and how they believed it improved
their maths teaching ability.
Recognition and understanding maths anxiety in pupils
Kate recognised behaviour in her pupils that she had exhibited as a child in maths lessons:
There are the ones that don’t put their hands up probably like I used to do, that’s when you
get picked on because you’ve not put your hand up and then you get it wrong which
knocks your confidence.
Kate related particular classroom behaviour to her own experience, interpreting not raising hands
to answer questions as maths anxious behaviour: she reasoned that the children’s fear of being
selected made them anxious. Her use of ‘picked on’ suggests she felt empathy towards pupils
exhibiting this behaviour. Recognition of anxiety and understanding its consequences enabled
participants to employ teaching strategies that encouraged children to be less maths anxious. As
Tania explained:

IOJPE
ISSN: 1300 – 915X
www.iojpe.org
International Online Journal of Primary Education 2021, volume 10, issue 1
Copyright © International Online Journal of Primary Education 44
You can just tell straight away, I’ve got a little boy who just sits there and if there’s a test
or you are doing something or ask him something he doesn’t know the answer, you can
tell he is just going ‘oh my God’ and he just says numbers, random numbers and you think
‘oh’ and move onto someone else and then every time he does put his hand up I’ll ask him
because he knows and I’ll give him a chance to say.
Tania’s description of what she perceived the child may be thinking suggests she felt empathy for
him within the classroom situation, which in turn enabled her to modify her own behaviour in order
to reduce his anxiety levels. Awareness and recognition of maths anxious behaviour and
understanding its impact on a child’s learning meant participants were implementing positive
teaching practices. Maria’s example of positive teaching practice appeared also to be as a result of
her awareness of her own maths anxiety experiences:
Now as a teacher I say ‘when I was your age I didn’t get this either so it’s alright if you
don’t get it’. So I generate that sort of culture in the classroom.
Maria’s expression of understanding demonstrates her expectation that some pupils would not
understand some areas of maths. Her reflection on her own childhood experience seems to indicate
why she was motivated to cultivate an inclusive classroom environment where it was socially
acceptable to not understand maths immediately.
It has been suggested that teachers who fail to implement positive practices may actually cause
students to learn maths anxious behaviours (McCulloch-Vinson, 2001). Subtle messages may
unintentionally be given to children that can validate their opinion of being poor at maths; this, in
turn may lower motivation and performance expectation. The participants’ heightened awareness
of maths anxiety and empathy, which they all perceived as a benefit, can help build confidence and
encourage pupils to work harder to overcome maths difficulties (Beilock & Willingham, 2014).
Benefits of experiencing maths anxiety
Experiencing maths anxiety and having difficulties with it appeared to enhance Tania’s teaching
ability:
I do think it has an advantage being kind of aware that I wasn’t good at maths or that I
didn’t really get maths because when I explain maths to kids now I almost find it easier
to teach maths than I do English because I feel like I have a very simple way of looking at
it.
Tania’s observation that she found maths almost easier to teach than English suggests she
understood the advantage of a simpler, more straightforward teaching approach, recognising the
importance of being clear when delivering maths as a subject. Her own maths learning experience
enhanced her awareness of the consequences of adopting a more flexible teaching approach
towards. The participants also recognised, from their own experiences, that as teachers their
attitudes were an important influence on children potentially developing maths anxiety. John
highlighted:
I’m much more patient with them and er ok you don’t understand it this way let’s think
of it another way so there’s two, three or four ways that we try and get or I try and get the
message across and er (slight pause) hand on heart I can honestly say if someone doesn’t
understand something I won’t shout, you’re not going to shout at a child because they
don’t understand and I think that is my biggest learn from my experience of maths being
at school. You know I think, I think its criminal to be impatient with a child with maths
only from my point of view you know knowing how how I felt its em my job to then to try
and think of different ways to make them understand.
John’s use of affirmative language and his commitment to avoiding expressing irritation or
impatience with children when they are learning suggests an awareness of his importance on the
pupils’ learning. His expression that this behaviour is “criminal’ alludes to the strength of his belief
IOJPE
ISSN: 1300 – 915X
www.iojpe.org
International Online Journal of Primary Education 2021, volume 10, issue 1
Copyright © International Online Journal of Primary Education 45
that intimidating behaviour is unacceptable and counterproductive.
Participants’ approaches to teaching, based on their own experience, indicates the advantages that
experiencing maths anxiety can bring to a maths teaching context. The role of the teacher in
developing effective teaching methods breaks the cycle of maths anxiety that might otherwise
continue (Beilock & Willingham, 2014). Being more attuned to recognising maths anxiety in their
pupils, they felt they were better equipped to make adjustments to their teaching approach and
instructional delivery.
DISCUSSION and CONCLUSION
The aim of this study was to explore the personal accounts of maths anxiety of primary school
teachers using IPA, with the specific objectives of increasing understanding of its psychological
impact by personal interaction with teachers and listening to their maths anxiety stories, their own
reflections, perceptions and interpretations of their experiences. The key findings emerging from
this study lend support to previous maths anxiety research whilst also contributing new aspects for
future investigation.
This study helped uncover possible psychological consequences of maths anxiety with the use of
IPA by highlighting details of participants’ specific childhood maths situations. These were
organised into three key themes: ‘experiencing the psychological consequences of maths anxiety’,
‘social influences’ and ‘the consequences of experiencing maths anxiety as a teaching professional.
Situations such as feelings of worry over being singled out and being ‘picked on’ to answer
questions in front of others in class and being judged caused participants high levels of anxiety.
Also, their anxiety interfered with their learning, particularly those aspects of maths perceived to
be more difficult, such as fractions. The detailed information about past experiences and
comparisons with performances in other areas also appeared to influence their self-efficacy
judgement about not only their maths ability but also ability to teach it.
The detailed accounts connected to participants’ social relationships and the impact these had on
their maths anxiety mirrored other research findings that found positive support and
encouragement from parents and teachers resulted in maths progression and increased confidence
(Gunderson et al., 2012). However, if the social cues and observed behaviour particularly from
teachers was deemed to be critical, aggressive and unsupportive this highlighted maths negatively,
discouraged learning and resulted in increased anxiety (Schofield, 1981). Peer relationships helped
participants feel less isolated and influenced aspects of their behaviour by either modifying it to
‘fit in’ socially or resulted in enhanced levels of self – esteem; social comparisons with peers
influenced how participants viewed themselves in relation to how they interpreted their maths
anxiety and ability within a social context (Klinger, 2006; Wood, 1989).
Finally, this study uncovered some potential consequences of experiencing maths anxiety as a
teaching professional and offers some new insights. Previous research suggests in order to prevent
maths anxiety developing, teachers need to adopt a variety of strategies: flexible teaching and
testing methods, creating positive environments to help encourage positive self- concepts,
encourage original thinking rather than learning by rote as well as being aware of teacher
behaviours and the influence they can have on pupils (Plaisance, 2009). These recommendations
mostly are based on findings from questionnaires with fixed choice responses whereas findings from
this IPA study add further contributions to the literature by giving specific information direct from
the participants’ own experiences. In addition, the findings showed that teachers who have
experienced maths anxiety believe it may be helpful in their teaching, echoing Trujillo and Hadfield’s
(1999) finding that maths anxious teacher wanted to be more understanding and progressive in their
teaching. In our study teachers believed that their ability to identify and respond appropriately to maths
anxious pupils was advantageous as it enabled them to further understand how their maths anxious
pupils feel, readily recognise maths anxious behaviour, develop new teaching strategies to help

IOJPE
ISSN: 1300 – 915X
www.iojpe.org
International Online Journal of Primary Education 2021, volume 10, issue 1
Copyright © International Online Journal of Primary Education 46
their pupils cope with maths anxiety and be more aware of the consequences of their own
behaviour. Indeed, such a positive view of experiencing maths anxiety is associated with the
concept of mathematical resilience, e.g. perseverance despite setbacks in maths (Johnston-Wilder
& Lee, 2010); the findings presented here suggest mathematical resilience may be relevant to
teachers as well as pupils, which can be further explored in future research. Future research could
also investigate if these positive maths anxiety consequences are supported by use of measures of
teacher effectiveness. This would have a huge impact on how and why we study maths anxiety in
preservice and in-service teaching populations.
Limitations
The research reported here is one of only a few studies of maths anxiety taking a qualitative
approach and is the first to use IPA to investigate maths anxiety amongst primary school teachers.
The analysis of the data gives specific detail and a deeper understanding of primary school
teachers’ personal maths anxiety. However, some limitations should be considered. Participant
teaching experience ranged from seven weeks to 10 years; more experienced participants may be
more likely to have developed strategies for observing maths anxious behavior, not only due to
their own maths anxiety experiences but also due to overall teaching experience of recognising
children in difficulty. Heterogeneity of time spent teaching raises issues concerning disentangling
attitudes and approaches based on teaching experience from those related to experiences
pertaining to maths anxiety. This is particularly important given that length of teaching experience
has been shown to be inversely related to maths teaching anxiety (Gresham, 2018; Hunt & Sari,
2019). Although gender differences in maths anxiety were not explored in this study, previous
research into maths anxiety suggests females exhibit higher levels of maths anxiety than males
(Devine, Fawcett, Szucs, & Dowker, 2012) therefore suggesting it is worth exploring this further
across primary school teachers. Finally, the present study is confined to the specific context of
UK culture; it is important to bear in mind the context-specific challenges faced by teachers
globally, particularly in developing nations (Hunt, Simms, Cahoon, & Muwonge, 2021).
Conclusion
The findings from this study hold useful implications for understanding the influence of maths
anxiety on teachers and teaching practices. Participants in this study perceived their own maths as
beneficial, feeling it has helped them be more effective teachers. Highlighting the positive aspects
of a phenomenon like maths anxiety, such as effective recognition of anxiety in pupils and using
flexible teaching strategies to accommodate anxious pupils whilst still delivering the curriculum
effectively, may help encourage a more mainstream approach to dealing with maths anxiety in the
UK education system. This study also highlights the fact that teachers themselves experience maths
anxiety and complements recent work on maths teaching anxiety (Hunt & Sari, 2019). Such
awareness and recognition of the influence of teacher maths anxiety on its development in children
could contribute to teacher training in the delivery of maths, as well as improved personal support
to alleviate maths anxiety in teachers. Future research into teacher maths anxiety and whether it
impacts teacher effectiveness may also provide new information that could highlight the benefits
of experiencing maths anxiety rather than it being seen in a wholly negative light; indeed, such
experiences may be associated with greater mathematics resilience. IPA is useful for exploring
the self- reflective processes through which individuals interpret and understand their experiences
(Brocki & Wearden, 2006). Therefore, continued use of IPA analysis in future studies may help
with understanding the developmental trajectory of maths anxiety and its negative and positive
impact on maths education. Overall, increasing awareness of the existence of maths anxiety in
teachers is important for informing further research, interventions and training for student teachers
as well as improving support and training for maths anxious qualified teachers, which may in turn
impact the development of maths anxiety in the next generation of children.

IOJPE
ISSN: 1300 – 915X
www.iojpe.org
International Online Journal of Primary Education 2021, volume 10, issue 1
Copyright © International Online Journal of Primary Education 47
REFERENCES
Ahmed, W. (2018). Developmental trajectories of math anxiety during adolescence: Associations with STEM career
choice. Journal of Adolescence, 67, 158-166. https://doi.org/10.1016/j.adolescence. 2018.06.01
Ahmed, W., Minnaert, A., Kuyper H., & van der Werf, G. (2012). Reciprocal relationships between math self-concept and
math anxiety. Learning and Individual Differences, 22, 385-389. https://doi.org/10.1016/j.lindif.2011.12.004
Alexander, L., & Martray, C. (1989). The development of an abbreviated version of the mathematics anxiety rating
scale. Measurement and Evaluation in Counseling and Development, 38, 485-490.
Ashcraft, M. H., & Krause, J. A. (2007). Working memory, math performance, and math anxiety. Psychonomic Bulletin
& Review, 14, 243-248.
Bandalos, D. L., Yates, K., & Thorndike–Christ, T. (1995). Effects of math self-concept, perceived self-efficacy and
attributions for failure and success on test anxiety. Journal of Educational Psychology, 87, 611-623.
https://psycnet.apa.org/doi/10.1037/0022-0663.87.4.611
Bandura, A. (1982). The assessment and predictive generality of self-percepts of efficacy. Journal of behavior therapy
and experimental psychiatry, 13, 195-199.
Bandura, A. (1986). Fearful expectations and avoidant actions as co-effects of perceived self- inefficacy. American
Psychologist, 41, 1389-1391.
Bandura, A. (1994). Self-efficacy. In V. S. Ramachaudran (Ed.), Encyclopedia of human behavior (Vol. 4, pp. 71-81).
New York: Academic Press.
Barroso, C., Ganley, C. M., McGraw, A. L., Geer, E. A., Hart, S. A., & Daucourt, M. C. (2021). A meta-analysis of the
relation between math anxiety and math achievement. Psychological Bulletin, 147, 134–168.
https://doi.org/10.1037/bul0000307
Beilock, S. L. & Willingham, D. T. (2014). Math anxiety: Can teachers help students reduce it? American Educator,
summer, 28, 32-43.
Beilock, S. L., Gunderson, E. A., Ramirez, G., & Levine, S. C. (2010). Female teachers’ math anxiety affects girls’ math
achievement. PNAS, 107, 1860-1863. https://doi.org/10.1073/pnas.0910967107
Bekdemir, M. (2010). The pre-service teachers' mathematics anxiety related to depth of negative experiences in
mathematics classroom while they were students. Educational Studies in Mathematics, 75, 311-328.
https://doi.org/10.1007/s10649-010-9260-7
Bennison, A., & Goos, M. (2013). Teacher identity and numeracy: Developing an analytic lens for understanding
numeracy teacher identity. In V. Steinle, L. Ball & C. Bardini (Eds.), Mathematics education: Yesterday, today
and tomorrow (Proceedings of the 36th annual conference of the Mathematics Education Research Group of
Australasia, Vol. 1, pp. 90-97). MERGA.
Bong, M., & Skaalvik, E. M. (2003). Academic self-concept and self-efficacy: How different are they really?
Educational Psychology Review, 15, 1-40. https://doi.org/10.1023/A:1021302408382
Braun, V., & Clarke, V. (2006). Using thematic analysis in psychology. Qualitative Research in Psychology, 3, 77-101.
http://dx.doi.org/10.1191/1478088706qp063oa
British Psychological Society (2010). Code of human research ethics. British Psychological Society. Retrieved March 31,
2021, from INF180 2014 (bps.org.uk)
Brocki, J. M. & Wearden, A. J. (2006). A critical evaluation of the use of interpretative phenomenological analysis
(IPA) in health psychology. Psychology and Health, 21, 87- 108. https://doi.org/10.1080/14768320500230185
Carey, E., Hill, F., Devine, A., & Szücs, D. (2016). The chicken or the egg? The direction of the relationship between
mathematics anxiety and mathematics performance. Frontiers in psychology, 6, 1987.
https://doi.org/10.3389/fpsyg.2015.01987
Choe, K. W., Jenifer, J. B., Rozek, C. S., Berman, M. G., & Beilock, S. L. (2019). Calculated avoidance: Math anxiety
predicts math avoidance in effort-based decision-making. Science Advances, 5(11), 1-9, eaay1062.
https://doi.org/10.1126/sciadv.aay1062
Cooper, R., Fleischer, A., & Cotton, F. A. (2012). Building connections: An interpretative phenomenological analysis of
qualitative research: Students’ learning experiences. Qualitative Report, 17(1), 1-16.
http://www.nova.ed/ssss/QR/QR17/cooper.pdf
Das, R., & Das, G. C. (2013). Math anxiety: The poor problem-solving factor in school mathematics. International
Journal of Scientific and Research Publications, 3, 1-5.

IOJPE
ISSN: 1300 – 915X
www.iojpe.org
International Online Journal of Primary Education 2021, volume 10, issue 1
Copyright © International Online Journal of Primary Education 48
Devine, A., Fawcett, K., Szűcs, D. & Dowker., A. (2012). Gender differences in mathematics anxiety and the relation to
mathematics performance while controlling for test anxiety. Behavioural and Brain Functions, 8.
https://doi.org/10.1186/1744-9081-8-33
Dowker, A., Sarkar, A., & Looi, C. (2016). Mathematics anxiety: What have we learned in 60years? Frontiers in
Psychology, 7, 1-16. https://doi.org/10.3389/fpsyg.2016.00508
Gresham, G. (2018). Preservice to inservice: Does mathematics anxiety change with teaching experience? Journal of
Teacher Education, 69, 90-107. https://doi.org/10.1177%2F0022487117702580
Gunderson, E. A., Ramirez, G., Levine, S. C., & Beilock, S. L. (2012). The role of parents and teachers in the
development of gender-related math attitudes. Sex Roles, 66, 153-166. https://doi.org/10.1007/s11199-011-9996-2
Hamza, E. G. A., & Helal, A. M. (2013). Maths anxiety in college students across majors: A cross-cultural study. British
Education Studies Association, Educational futures, 5, 58-61.
Hembree, R. (1990). The nature, effects, and relief of mathematics anxiety. Journal of Research for Mathematics
Education, 21, 33-46. https://doi.org/10.2307/749455
Hunt, T. E., Clark-Carter, D., & Sheffield, D. (2011). The development and part validation of a UK scale for
mathematics anxiety. Journal of Psychoeducational Assessment, 29, 455-466.
https://doi.org/10.1177%2F0734282910392892
Hunt, T. E., & Sari, M. (2019). An English version of the Mathematics Teaching Anxiety Scale. International Journal
of Assessment Tools in Education, 6, 436-443. https://doi.org/10.21449/ijate.615640
Hunt, T. E., Simms, V., Cahoon, A., & Muwonge, C. M. (2021). Socio-cognitive-affective barriers to mathematics
education in developing nations. In W. Leal Filho., P. Gökçin Özuyar., A. Lange Salvia., A. Marisa Azul., L.
Londero Brandli., & T. Wall (Eds), Encyclopaedia of the UN Sustainable Development Goals: Quality
Education. Springer.
Jackson, C. D., & Leffingwell, R. J. (1999). The role of instructors in creating math anxiety in students from kindergarten
through college. Mathematics Teacher, 92, 583-586. Retrieved March 31, 2021, from
https://www.jstor.org/stable/27971118
Johnson-Wilder, S., & Lee, C. (2010). Mathematical resilience. Mathematics Teaching. 218, 38-41
Kindermann, T. A., & Skinner, E. A. (2009). How do naturally existing peer groups shape children’s academic
development during sixth grade? European Journal of Psychological Science, 3, 31-43.
Klinger, C. M. (2006). Challenging negative attitudes, low self-efficacy beliefs, and math- anxiety in pre-tertiary adult
learners. In M. Horne, & B. Marr (Ed.), Connecting voices in adult mathematics and numeracy: practitioners,
researchers and learners. Proceedings of the Adults Learning Mathematics (ALM) 12th Annual International
Conference, Melbourne, July, 2005 (pp. 164-171).
Ma, X., & Xu, J. (2004). The causal ordering of mathematics anxiety and mathematics achievement: A longitudinal
panel analysis. Journal of Adolescence, 27, 165-179. https://doi.org/10.1016/j.adolescence.2003.11.003
Maloney, E., & Beilock, S. L. (2012). Math anxiety: Who has it, why it develops and how to guard against it. Trends in
Cognitive Science, 16, 404-405. https://doi.org/10.1016/j.tics.2012.06.008
Maloney, E. M., Schaeffer, M. W., & Beilock, S. L. (2013). Mathematics anxiety and stereotype threat: Shared
mechanisms, negative consequences and promising interventions. Research in Mathematics Education, 15, 115-
128. https://doi.org/10.1080/14794802.2013.797744
McCulloch-Vinson, B. (2001). A comparison of pre-service teachers’ mathematics anxiety before and after a methods
class emphasizing manipulatives. Early Childhood Education Journal, 29(2), 89-94.
https://doi.org/10.1023/A:1012568711257
Namkung, J. M., Peng, P., & Lin, X. (2019). The relation between mathematics anxiety and mathematics performance
among school-aged students: A meta-analysis. Review of Educational Research, 89, 459-496.
https://doi.org/10.3102%2F0034654319843494
Nunez-Pena, M. I., Suarez-Pellicioni, M., Guilera, G., & Mercade-Carranza, C. (2013). A Spanish version of the short
Mathematics Anxiety Rating Scale (sMARD). Learning and Individual Differences, 24, 204-210.
https://doi.org/10.1016/j.lindif.2012.12.009
Plaisance, D. V. (2009). A teacher’s quick guide to understanding mathematics anxiety. Louisiana Association of
Teachers of Mathematics Journal, 6 (1), 1-8.

IOJPE
ISSN: 1300 – 915X
www.iojpe.org
International Online Journal of Primary Education 2021, volume 10, issue 1
Copyright © International Online Journal of Primary Education 49
Plake, B. S., & Parker, C. S. (1982). The development and validation of a revised version of the mathematics anxiety rating
scale. Educational and Psychological Measurement, 42, 551-557.
https://doi.org/10.1177%2F001316448204200218
Reid, K., Flowers, P., & Larkin, M. (2005). Interpretative phenomenological analysis: An overview and methodo-
logical review. The Psychologist, 18, 20-23.
Relich, J., Way, J., & Martin, A. (1994). Attitudes to teaching mathematics: Further development of a measurement
instrument. Mathematics Research Journal, 6 (1), 56-69. https://doi.org/10.1007/BF03217262
Richardson, F. C., & Suinn, R. M. (1972). The Mathematics Anxiety Rating Scale. Journal of Counselling Psychology, 19,
551-554.
Schofield, H. L. (1981). Teacher effects on cognitive and affective pupil outcomes in elementary school mathematics.
Journal of Educational Psychology, 73, 462-571.
Smith, J., Flowers, P., & Larkin, M. (2009). Interpretative phenomenological analysis. Sage Publications Inc.
https://doi.org/10.1080/14780880903340091
Smith, J. A., & Osborn, M. (2003) Interpretative phenomenological analysis. In J.A. Smith (Ed.), Qualitative
Psychology: A Practical Guide to Research Methods. London: Sage Publications Inc.
Suárez-Pellicioni, M., Núñez-Peña, M. I., & Colomé, À. (2016). Math anxiety: A review of its cognitive consequences,
psychophysiological correlates, and brain bases. Cognitive, Affective, & Behavioral Neuroscience, 16(1), 3-22.
http://doi.org/10.3758/s13415-015-0370-7
Suinn, R. M., & Winston, E. H. (2003). The mathematics anxiety rating scale, a brief version: Psychometric data.
Psychological Reports, 92, 167-173. https://doi.org/10.2466%2Fpr0.2003.92.1.167
Swars, S., Daane, C., & Giesen, J. (2006). Mathematics anxiety and mathematics teacher efficacy: What is the
relationship in elementary preservice teachers? School Science and Mathematics, 106(7), 306-315.
https://doi.org/10.1111/j.1949-8594.2006.tb17921.x
Trujillo, K. M., & Hadfield, O. D. (1999). Tracing the roots of mathematics anxiety through in-depth interviews with
preservice elementary teachers. College Student Journal, 33(2), 219-232.
Tuffour, I. (2017). A critical overview of interpretative phenomenological analysis: a contemporary qualitative research
approach. Journal of Healthcare Communications, 2(4), 52. https://doi.org/10.4172/2472-1654.100093
Uusimaki, L., & Nason, R. (2004). Causes underlying pre-service teachers’ negative beliefs and anxieties about
mathematics. Group for the Psychology of Mathematics, 4, 369-376.
Wang, Z., Hart, S., Kovas, Y., Lukowski, S., Soden, B., & Thompson, L., Plomin, R., McLoughlin, G., Bartlett, C. W.,
Lyons, I. M., & Petrill, S. A. (2014). Who is afraid of math? Two sources of genetic variance for mathematical
anxiety. Journal of Child Psychology and Psychiatry, 55, 1056-1064. https://doi.org/10.1111/jcpp.12224
Willig, C. (2013). Introducing qualitative research in psychology (3rd ed.). Maidenhead, England: Open University Press.
Wood, J. V. (1989). Theory and research concerning social comparisons of personal attributes. Psychological Bulletin,
106, 231-248.
Young, C., Wu, S., & Menon, V. (2012). The neurodevelopmental basis of math anxiety. Psychological Science, 23,
492-501. https://doi.org/10.1177%2F0956797611429134
Zhang, J., Zhao, N., & Kong, Q. P. (2019). The relationship between math anxiety and math performance: A meta-
analytic investigation. Frontiers in Psychology, 10, 1613. https://doi.org/10.3389/fpsyg.2019.01613

IOJPE
ISSN: 1300 – 915X
www.iojpe.org
International Online Journal of Primary Education 2021, volume 10, issue 1
Copyright © International Online Journal of Primary Education 50
THE EFFECT OF PROBLEM-BASED LEARNING ON PRE-SERVICE
PRIMARY SCHOOL TEACHERS' CONCEPTUAL UNDERSTANDING
AND MISCONCEPTIONS
Çiğdem ŞENYİĞİT
Dr., Van Yüzüncü Yıl University, Faculty of Education,
Department of Basic Education, Van, Turkey
ORCID: https://orcid.org/0000-0003-4549-6989
Received: November 04, 2020 Accepted: March 20, 2021 Published: June 30, 2021
Suggested Citation:
Şenyiğit, Ç. (2021). The effect of problem-based learning on pre-service primary school teachers' conceptual understanding
and misconceptions. International Online Journal of Primary Education (IOJPE), 10(1), 50-72.
This is an open access article under the CC BY 4.0 license.
Abstract
The aim of this research is to investigate the effect of problem-based learning on misconceptions and conceptual
understanding regarding simple electric circuits. Participants are 54 pre-service primary school teachers enrolled on the Basic
Science in Elementary School course at a state university. The research employs a nonequivalent control group model. The
activity sheets containing problem-based scenarios prepared by the researcher were used in the experimental group. In the
control group, the lecture-based learning supported by problem solving, question-answer, discussion activities and
demonstration experiments was used. Data were gathered by three-tier Simple Electric Circuit Diagnostic Test consisting of
12 questions developed by Peşman (2005). The research revealed that problem-based learning is more effective in improving
conceptual understanding and overcoming misconceptions than lecture-based learning.
Keywords: Problem-based learning, conceptual understanding, misconceptions, simple electric circuit, pre-service primary
school teachers.
INTRODUCTION
In modern education systems, it is aimed to train individuals who can acquire scientific knowledge and
concepts, and integrate these into the solutions of problem situations. Learning environments are of
great importance in raising individuals with these qualities. This requires learning environments that
allow learners to construct and internalize scientific knowledge based on their own prior knowledge.
Learners develop some knowledge and explanations about the natural world from formal or informal
learning environments based on their experiences (Soeharto, Csapó, Sarimanah, Dewi, & Sabri, 2019).
However, these pre-knowledge and concepts do not always correspond to accurate scientific
explanations (Duit & Treagust, 2003). The literature shows that the learners have some non-scientific
concepts and explanations in various subject fields of science, such as electric circuits (Engelhardt &
Beichner, 2004; Küçüközer & Kocakülah, 2007; Peşman & Eryılmaz, 2010; Tahir, Nasri, & Halim,
2020), force and motion (Anggoro, Widodo, Suhandi, & Treagust, 2019; Fadaei & Mora, 2015;
Narjaikaew, 2013; Nie, Xiao, Fritchman, Liu, Han, Xiong, & Bao, 2019), chemical bonding (Fadillah
& Salirawati, 2018; Fahmi & Irhasyuarna, 2017), acids and bases (Mubarokah, Mulyani, & Indriyanti,
2018), photosynthesis (Haslam & Treagust, 1987; Kırılmazkaya & Kırbağ Zengin, 2016), heat and
temperature (Alwan, 2011; Suliyanah, Putri, & Rohmawati, 2018). These non-scientific concepts and
explanations pose great obstacles to the conceptual understanding, and it is important to reduce their
effect to achieve the determined learning goals. However, scientifically reconstructing these concepts
is not always an easy process. The required conceptual change is expressed as the process of repairing
the misconceptions to allow a deeper conceptual understanding (Chi & Roscoe, 2002). When
considered from this point of view, identifying and correcting the misconceptions is the basis for
learners to construct scientific knowledge and concepts. The lecture method is ineffective for this task
(Desstya, Prasetyo, Suyanta, Susila, & Irwanto, 2019), and it is necessary to apply appropriate
teaching strategies (Widarti, Permanasari, & Mulyani, 2017). For this, learning environments and
approaches that give opportunities conceptual change to the learners are needed. It can be said that

IOJPE
ISSN: 1300 – 915X
www.iojpe.org
International Online Journal of Primary Education 2021, volume 10, issue 1
Copyright © International Online Journal of Primary Education 51
problem-based learning (PBL) will allow learners to understand if their concepts are correct, and to
correct them if not. At the same time, it is thought that the PBL will help the learners to provide
conceptual understanding by constructing the conceptual structure of the knowledge in the subject
field within the scope of scientific methods. In the following sections, there is a discussion on why and
how PBL has these effects.
Theoretical Background
A conceptual understanding becomes meaningful when conceptual knowledge is used in the process
of discovering and explaining new situations, beyond knowing the facts and conceptual labels (Roth,
1990). For this reason, there is a need for educational approaches that allow the concepts to be
structured beyond memorization and to be interpreted by transferring them to different situations.
Considered in a theoretical context, it can be said that cognitive theories are among the leading
theories that play a role in concept formation and conceptual understanding. Cognitive theories place
great emphasis on learners processing information (Schunk, 2012). Cognitive psychologists who
research the mental processes in the learning process argue that prior knowledge has a critical role in
the learning process (Roth, 1990). In addition, constructivism, which emphasizes that knowledge is
not independent of the human mind, cannot be transferred among individuals, must be structured by
individuals based on their prior knowledge and experience (Hendry, Frommer, & Walker, 1999), is a
leading approach in the process of concept formation and conceptual understanding. Constructivism
emphasizes that the learning process should take place in meaningful contexts, and what has been
learned will be meaningless unless put into practice (Marra, Jonassen, Palmer, & Luft, 2014). Piaget,
who has one of the biggest influences on the rise of constructivism (Schunk, 2012), has defined a
learning process in which individuals create meaning with the dynamic cognitive schemas they have
created as a result of their experiences (Scott, Asoko, & Leach, 2007). These schemas are sets of
information that define the concepts that exist in individuals' minds and the relationships among
concepts (Roth, 1990). Individuals create various conceptual structures in their mental schemas based
on experiences in their own lives. When the new concepts that individuals encounter are compatible
with their existing schemas, they include them in their existing schemas; this is assimilation (Scott et
al., 2007). However, a cognitive imbalance occurs when the concepts that individuals encounter are
incompatible with their existing schemas (Abraham, 2005). In this case, individuals enter into the
process of organizing their existing schema or creating a new schema; i.e. accommodation (Zhiqing,
2015). Cognitive development can only occur when there is a cognitive imbalance or cognitive
conflict (Schunk, 2012). Learners need to change their current non-scientific concepts with correct
concepts by experiencing cognitive conflict in order to form the correct conceptual understanding. In
this context, PBL comes across.
PBL is basically based on the constructivist assumption (Loyens, Rikers & Schmidt, 2006; Marra et
al., 2014). Promoting experiential active learning, PBL focuses on supporting the formation of
knowledge (Torp & Sage, 2002). Conceptual understanding refers to the ability to integrate the
theoretical knowledge existing in the mind of the individual into practice in different events and
situations (Darmofal, Soderholm, & Brodeur, 2002). PBL uses real world problems to help learners
identify concepts and information they want to know and integrate them into practice (Duch, Groh, &
Allen, 2001). This shows that PBL can be effective in forming a conceptual understanding. In PBL,
while students determine the concepts they need to know in order to solve the problem, they actually
enter the conceptual change process required for conceptual understanding. Trying to create meaning
between what we know and what we want to know about the problems in the PBL includes
incompatibility, and trying to solve this incompatibility is the essence of knowledge construction
(Marra et al., 2014). Learners conduct a pre-discussion in small groups about the problem situations in
order to activate their own prior knowledge in PBL (Wood, 2003). These pre-discussions support to
create new cognitive structures by enabling learners to encounter different views (Dolmans,
Wolfhagen, Van Der Vleuten, & Wijnen, 2001). The opportunity for learners to question their own
concepts when confronted with different views may cause renewal and change in the cognitive
structures of the learners. This situation may foresee that different views may create cognitive conflict.

IOJPE
ISSN: 1300 – 915X
www.iojpe.org
International Online Journal of Primary Education 2021, volume 10, issue 1
Copyright © International Online Journal of Primary Education 52
In this case, PBL aims to provide a cognitive conflict that will initiate the conceptual change process
required for a correct and valid conceptual understanding (De Grave, Boshuizen, & Schmidt, 1996).
Cognitive conflict is an important factor in the basis of the conceptual change required for correct
conceptual understanding (Hadjiachilleos, Valanides, & Angeli, 2013; Lee, Kwon, Park, Kim, Kwon,
& Park, 2003).
In addition, small group discussions support the formation of explanatory statements beyond
activating learners' prior knowledge and concepts during the problem analysis process (Schmidt et al.,
1989). Learners form a hypothesis for the solution of the problem situation based on these explanatory
statements. At this stage, learners experience a discussion within the learning groups by giving reasons
to validate or reject views to support own conceptual understanding. Throughout this discussion,
learners try to convince each other about the validity of their arguments beyond developing arguments
made up of claims, evidence, and reason (Aydeniz & Dogan, 2016). Discussion can make connections
between isolated facts and concepts (Venville & Dawson, 2010). In this sense, these processes in PBL
are an important tool in structuring correct conceptual understanding on the basis of valid scientific
realities. Learners who identify learning subjects that include the concepts they do not know and need
to learn, evaluate hypotheses in the light of their new knowledge after going through the self-direction
learning process (Hmelo-Silver, 2004). These stages offer learners the opportunity to integrate their
concepts into a new situation. Since learners discuss the relationships between concepts and principles,
transmit their knowledge and concepts into problem situations, integrate different literature sources as
a result of their self-direction learnings, it is assumed that the PBL encourages deep and
comprehensive learning process (Dolmans, Loyens, Marcq, & Gijbels, 2016). In this learning process,
learners have the opportunity to notice their current concepts and change their wrong concepts in order
to reach the correct conceptual understanding. This situation reflects the conceptual change process.
Problem situations that PBL uses as a focus and the process of finding solutions to them triggers the
conceptual change process required to reach conceptual understanding. Within all this capacity, there
is a strong structure in which the PBL supports conceptual understanding.
Problem-Based Learning
Constructivism theory, which aims to understand how individuals construct information in their mind,
views meaning not as independent from the individual, but structured by the individual (Uden &
Beaumont, 2006). In PBL, individuals build new knowledge based on their existing knowledge
(Awang & Ramly, 2008). In this sense, it can be said that PBL is related to constructivism. PBL based
on the educational principles and practices of the constructivist approach theoretically (Savery &
Duffy, 1995), emerged in Case Western Reverse University in the United States in the 1950s and in
Medical schools at McMaster University in Canada in the 1960s (Uden & Beaumont, 2006). Since
then, PBL approach has been applied in many disciplines (Savery, 2006). There are many definitions
in the literature. Savery (2006) defines PBL as a didactic approach that requires research, questioning,
putting theoretical knowledge into practice, and using knowledge and skills to find solutions. Barrows
and Tamblyn's (1980) PBL definition is learning that occurs through the process of understanding and
problem-solving.
PBL is a teaching method that uses problems as a focus provider and encouraging (Boud & Feletti,
1997), and involves cognitive and interrogator processes in which problems are the starting point in
learning, and actively facilitates the construction of knowledge (Reynolds & Hancock, 2010). PBL is
experiential learning organized around researching and solving real-world problem situations (Torp &
Sage, 2002). In traditional learning approaches that present information ready, the problems are given
after necessary concepts and information, while in the PBL approach, the problem is the starting point
of the learning process (Chin & Chia, 2006). The learning subject in PBL is integrated into real-world
problem situations (Hmelo-Silver, 2004), and the presentation of problem situations at the beginning
of the learning cycle allows creation of content for the learning process (Prince, 2004). These problem
situations, presented by fusing them into learning scenarios in PBL, have been created in a complex
structure regarding real life and the concepts and principles in the learning process (Dahlgren &

IOJPE
ISSN: 1300 – 915X
www.iojpe.org
International Online Journal of Primary Education 2021, volume 10, issue 1
Copyright © International Online Journal of Primary Education 53
Öberg, 2001). These problem situations are classified by Jonassen and Kwon (2001) as well-structured
and ill-structured. Well-structured problems are those in which elements related to the problem are
presented, and whose real-life transferability is very low, the problems are not too complex, and
require a limited number of principles and rules to find the possible solution (Jonassen, 1997). On the
other hand, ill-structured problems have many features and multiple solution methods (Chin & Chia,
2006). Ill-structured problems require use of metacognitive skills and knowledge related to various
fields, beyond what is known about the subject represented in the problem situation (Chen &
Bradshaw, 2007). Ill-structured problems are frequently encountered in daily life, usually require the
integration of information about more than one discipline, and include more than one option for the
solution (Jonassen, 1997). PBL consists of ill-structured problems that usually deal with real life
problems, require connection between concepts and facts, and have multiple and complex solution
processes (Lohman & Finkelstein, 2000).
The learning content aimed to be acquired by students in PBL is organized as problem scenarios
shaped within the problem framework, and presented as modules consisting of several sessions
(Cantürk-Günhan, 2006). In PBL, learners need to determine the background information about the
problem and further information needed, working in small collaborative groups on a problem scenario
related to the real world (Hmelo-Silver, 2004). In this process, learners set out to define other required
information after systematically organizing their own relevant knowledge regarding the solution of the
problem situation which acts as a trigger for learning (Hendry et al., 1999). This promotes
understanding of how to organize the conceptual framework, and brings insight into the kind of
knowledge needed and ways to structure it (Duch et al., 2001). Later, a hypothesis for the solution is
created and is evaluated in the light of new knowledge obtained by working on various scenarios
(Hmelo-Silver, 2004). Then the hypotheses are tested. In the last stage, the results are made available
and the process is evaluated (Wood, 2003).
Misconceptions and Conceptual Change in the Conceptual Understanding Process
Learners have many pre-concepts and knowledge before the teaching (Duit & Treagust, 2003).
Although these pre-concepts and knowledge brought to science lessons are well structured in the
learners’ minds, they may inconsistent with scientific thought (Treagust, 1988). Such unscientific
concepts can be variously expressed by terms such as misconception (Fisher, 1985; Helm, 1980),
alternative concepts (Klammer, 1998; Schoon & Boone, 1998), common sense belief (Halloun &
Hestenes, 1985), children’s science (Gilbert, Osborne & Fensham, 1982) and alternative framework
(Driver, 1981). In this research, however, the term misconception is used.
All individuals have misconceptions, as a result of misunderstandings personally created to make
sense of the world (Gooding & Metz, 2011). Considering that science education is aimed at
developing learners’ conceptual understanding (Gavalcante, Newton & Newton, 1997; Smith,
Blakeslee & Anderson, 1993), it is important to identify their misconceptions and replace these using a
conceptual change process. The conceptual change model of Posner, Strike, Hewson and Gertzog
(1982) can be considered as a conceptual change framework structure. According to this model, for
change to occur, the new concept must meet the conditions of intelligibility, plausibility, and
fruitfulness, bringing dissatisfaction with the currently-held concept (Posner et al., 1982). The first
condition for conceptual change is intelligibility (Hewson & Thorley, 1989), referring to
understanding what the new concept means (Hewson & Hewson, 1983) and how to construct it
(Posner et al., 1982). Plausible condition implies the belief that the new concept can be integrated with
the learner’s existing concepts (Hewson & Hewson, 1983). Dissatisfaction refers to the situation
experienced when the currently-held concept is insufficient to solve the problem (Posner et al., 1982),
and fruitfulness represents the functionality of the new concept in solving problems (Hewson &
Hewson, 1983).
Hewson and Hewson (1984) state that disagreement between the existing and new concepts causes
difficulty in the learning process, and in order to prevent this, the existing concept should be
reconstructed or replaced. Therefore, conceptual change is necessary and important for the learning

IOJPE
ISSN: 1300 – 915X
www.iojpe.org
International Online Journal of Primary Education 2021, volume 10, issue 1
Copyright © International Online Journal of Primary Education 54
process to reach its goal. Learners who realize the inaccuracy of their own concepts and their
inadequacy in problem-solving will be guided to the correct concepts through conceptual change. It
can be said that realizing their misconceptions is an important step in this process. Traditional learning
processes, involving passive listening does not actively engage the learners' minds or provide much
opportunity for them to become aware of their misconceptions (Darmofal et al., 2002). Similarly,
Fisher (1985) also states that traditional learning methods are insufficient to eliminate misconceptions.
It can thus be understood that the structure of traditional learning does not direct learners to conceptual
change. In this sense, it is important to adopt learning approaches that allow learners to realize their
own misconceptions, and to see if their concepts are sufficient in understanding the content of learning
and solving problem situations, i.e., PBL.
Problem-Based Learning in Providing Conceptual Understanding and Eliminating
Misconceptions
PBL, which enables learners to access information content by engaging with real-life problem
situations, provide learners to gain experience as active learners with a guide (Hmelo-Silver, 2004). In
the PBL process, teachers have a facilitating role as well as a guide (Barrows, 1996). Students are at
the center of the learning process. Learners involved with various disciplines have the opportunity for
preliminary experience in solving real-life problems by transferring the knowledge acquired via self-
directed learning to new problem situations (Stepien & Gallagher, 1993). When learners discover new
methods for solving the problem, they are able to integrate their conceptual knowledge into the
implementation in the solution phase (Roh, 2003). This allows students to test the accuracy and
effectiveness of their current concepts. In PBL, students construct hypotheses based on their solution
suggestions by using their preliminary concepts for the problems in the scenario. When testing their
hypotheses with the information obtained in the later parts of the scenario, they begin to question
existing concepts. They then come to doubt about the reliability of these concepts and gain awareness
through experience about these concepts’ functionality and validity. In this way, learners area able to
assess their existing conceptual structures, and their misconceptions, beyond generalized discourses
through personal experience. Such a process is an important step for conceptual change. It is important
to identify misconceptions in order to reach the correct conceptual understandings. Posner et al. (1982)
state that one of the conditions for the realization of conceptual change is that learners should first
experience dissatisfaction, and realize that their current concepts are inadequate. PBL provides such a
process, promoting conceptual change.
In terms of PBL structure, it involves learners working in small groups to obtain information, discuss
and integrate information regarding problem situations (Goodman, 2010). In PBL, learners reflect on
their knowledge, by listening to the ideas of others, while engaged in finding various possible
solutions (Erickson, 1999). Therefore, each student involved in the PBL process becomes aware of
their own pre-concepts during these discussions. This situation may cause students to encounter with
different opinions, question their current concepts and realize their misconceptions, if any. PBL
process thus appears as an opportunity to initiate the conceptual change process in order to reach a
valid conceptual understanding. In this context, it can be said that PBL is an effective method for
replacing incorrect concepts with scientifically correct ones. From this point of view, PBL can help
learners in structuring their knowledge, as based on scientific explanations, as basic concepts are
perceived in more complex and abstract ways in science.
The concrete foundations of the concept of electricity, one of the most fundamental concepts of
science, are generally imparted via simple electric circuits at primary level. Learning the concepts
related to simple electric circuit, which is the basis of the study of electricity, helps students to learn
related subjects and concepts. Considering that the knowledge structuring starts from the early ages
(Wild, Hilson & Hobson, 2013), basic education is a key stage in education. In this context, primary
school teachers have great roles and responsibilities. For this reason, it is very important for educators
to be able to clearly articulate the concepts in related subject field and to eliminate their
misconceptions. Pre-service primary school teachers should therefore be trained in an environment

IOJPE
ISSN: 1300 – 915X
www.iojpe.org
International Online Journal of Primary Education 2021, volume 10, issue 1
Copyright © International Online Journal of Primary Education 55
that promotes these qualities. In this research, it is assumed that PBL will overcome pre-service
primary school teachers’ misconceptions regarding simple electric circuits, and improve their
conceptual understanding. There are many studies that investigate conceptual understandings and
misconceptions at various levels of education, using different methods and models, regarding simple
electric circuits and related concepts (Afra, Osta & Zoubeir, 2009; Aykutlu & Şen, 2012; Bostan
Sarıoğlan & Abacı, 2017; Cohen, Eylon, & Ganiel, 1983; Demirezen & Yağbasan, 2013; Dupin &
Johsua, 1987; Farrokhnia & Esmailpour, 2010; Fredette & Lochhead, 1980; Jaakkola, Nurmi, &
Veermans, 2011; Kalaya, Nopparatjamjomras, Chitaree, & Nopparatjamjomras, 2019; Manunure,
Delserieys, & Castéra, 2019; Millar & King, 1993; Picciarelli, Di Gennaro, Stella, & Conte, 1991;
Setyani, Suparmi, Sarwanto, & Handhika, 2017; Shepardson & Moje, 1994; Shipstone, 1988;
Suciatmoko, Suparmi, & Sukarmin, 2018; Suryadi, Kusairi, & Husna, 2020; Şenyiğit, 2020; Türkoğuz
& Cin, 2013; Villarino, 2018; Widodo, Rosdiana, Fauziah, & Suryanti, 2018; Zacharia & de Jong,
2014). However, no study was found that specifically examines the effect of PBL on conceptual
understanding and misconceptions of pre-service primary school teachers regarding simple electric
circuits. This research aims to fill this gap in the literature by examining the effect of PBL on
elimination of misconceptions about simple electric circuits and improving conceptual understanding.
The main aim of this research is to investigate PBL’s effects on conceptual understanding and
misconceptions, with the following research questions:
Research Questions
Does PBL improve pre-service primary school teachers’ conceptual understanding of simple
electric circuits at a significant level?
Does PBL decrease pre-service primary school teachers’ misconceptions about simple electric
circuits at a significant level?
METHOD
Research Model
The pre-test and post-test nonequivalent control group model design was used in the research. This
design, one of the most common experimental designs includes an experiment and a control group; the
subjects are not randomly assigned, but efforts were made to ensure the similarity of the groups
(Campbell & Stanley, 1963). In the nonequivalent control group model, both the experimental and
control groups are subjected to a measurement before and after the implementation (West, Biesanz, &
Pitts, 2000).
Research Design and Implementation
This research includes an experimental and a control group; PBL was used in the experimental group,
and lecture-based learning supported by problem solving, question-answer, discussion activities and
demonstration experiments in the control group. A pre-test was applied to both groups to determine
their conceptual understanding and misconceptions regarding simple electric circuits, and after the
implementation, the same test was applied as a posttest, in order to determine any changes in these.
Materials
Experiment materials required for participants in experimental group to design experimental setups
and the activity sheets containing scenarios regarding PBL and are among the main materials used in
the research.
Problem-based Scenarios
In the experimental group, in which PBL was applied, the lessons involved activity sheets containing
problem-based scenarios prepared by the researcher. While preparing the scenarios, firstly the
literature on simple electric circuits was scanned to identify the common misconceptions. The next
step was to identify targeted learning outcomes for teaching within the framework of the concepts of
closed circuit, open circuit, short circuit, internal resistance, equivalent resistance, ohm law, lamp
brightness (electrical power) on subject of simple electric circuits. Then, researcher prepared scenarios

IOJPE
ISSN: 1300 – 915X
www.iojpe.org
International Online Journal of Primary Education 2021, volume 10, issue 1
Copyright © International Online Journal of Primary Education 56
for achieving these learning outcomes. The scenarios contain ill-structured problems that involve more
than one solution, and reflect real life. Later, two science education experts who worked in the subject
of PBL were consulted, and the scenarios were adjusted accordingly. Necessary corrections were
made after expert opinions. One correction was the revision and restructuring of scenarios so that they
provided more than one solution option. Another important correction was the revision of language
and narration, to reflect more realistic daily life situations, with a more detailed narrative. After the
corrections made, the final version of the activity sheets was obtained. In the activity sheets containing
problem scenarios, empty boxes were provided under each question for participants to write their
answers.
Experiment Materials
In the research, the researcher provided the experimental group with materials for the experimental
setup, including batteries, lamps, lamp holders, conductive wires, switches, ammeters, voltmeters.
Care was taken to ensure that the sufficient materials were available to allow the implementation to be
carried out flexibly. These materials were checked before the implementation and those that were not
intact were removed.
Experimental Process
The implementations in the experimental and control groups were carried out over 4 weeks by the
researcher during the face-to-face training process. Before the experimental procedure, the
experimental group participants were divided into groups of 4-5, in a way that ensured heterogeneity
within groups and homogeneity between groups. Participants in the experimental group were informed
about the PBL process and its principles before the implementation with a sample scenario before they
received activity sheets containing scenarios regarding complex problem situations. The concepts
regarding target learning outcomes in the experimental process were presented to the participants
within a problem scenario. Care was taken to present the relevant concepts in a specific order in
problem situations; for example, the concept of closed circuit was presented before the concept of
open circuit and short circuit. Scenarios in the research were handled in sessions. The experimental
process was carried out over a total of 4 weeks, 3 lesson hours (135 minute) per week. Three course
hours were allocated for each scenario in the experimental process. This research was carried out in 12
sessions, in total including 4 scenario consisting of 3 sessions. These were conducted on the basis of
the session steps for the scenarios, consisting of 3 sessions each, as explained by Musal, Akalın, Kılıç,
Esen, and Alıcı (2002). Accordingly, after reading the scenarios in the first session, the participants
examined the problem situation presented, and summarize the information. Then, the participants
determined the problem situation based on their prior knowledge. Later, the participants formed a
hypothesis by brainstorming the problem situation. Subsequently, the participants determined what
they need to know in order to test their hypotheses. Then, the learning goals were determined and the
feedback process was carried out. In the second session, the participants summarized and shared the
data they obtained as a result of their individual studies in the previous session. At these stages, the
participants were able to benefit from various internet databases and printed resources in the learning
environment. Later, in the previous session, the questions about what the participants needed to know
were answered. Then, after reading the next part of the scenario, they narrowed down the hypotheses
using the newly obtained information. Later, new learning topics were determined and the feedback
process was carried out. In the third session, after reading the next part of the scenario, the participants
summarized and shared the data they obtained as a result of their individual work in the previous
session, and then they reviewed hypothesis in the light of all the data. Then, the participants were
asked to design an experiment in which they could test their hypotheses. Finally, it was ensured that
the result obtained for the solution was determined by associating the hypotheses with the result of the
experiment. The next aim was for the group leaders to present the obtained results to the class in a
report and to exchange ideas on the results. Then the feedback process was carried out by
summarizing the learning topics.

IOJPE
ISSN: 1300 – 915X
www.iojpe.org
International Online Journal of Primary Education 2021, volume 10, issue 1
Copyright © International Online Journal of Primary Education 57
In the control group with the lecture-based learning, problems on subjects in the activity sheets were
handled with traditional question-answer, and problem solving activities. During the course of a
lesson, the teacher presented the necessary information and concepts at the beginning of the lesson.
Then, the teacher solved problems on simple electrical circuits related to the learned subjects and
concepts through mathematical operations on the board. These mathematical operations include basic
calculation (addition, subtraction, multiplication and division) and equations on the subject used to
solve problems on simple electrical circuits. Later, similar problems were solved individually by the
participants. Thus, an improvement was made in the control group by trying to limit the participants'
being passive in the learning process. At the same time, lesson-based learning in the control group was
supported by demonstration experiments. The aim was to limit the possible biased research results in
favor of the experimental group in which experimental implementations were made. After each
teaching input, a demonstration experiment was carried out. Control group' participants answered
questions about the variables manipulated and their possible effects, especially during demonstration
experiments, and they discussed their predictions, ensuring the active involvement. This situation is
another improvement made in the control group. Attention was paid to the simultaneous processing of
related topics and concepts in both groups.
Study Group
Participants of the research consist of 54 pre-service primary school teachers enrolled in the Basic
Science in Elementary School course in the 2019 spring semester at the state university. The
participants were easily accessible, therefore convenience sampling was used; sampling that is
continued until the required sampling size is reached (Cohen, Manion, & Morrison, 2018; Gravetter &
Forzano, 2018). All participants were pre-service primary school teachers studying in the first grade.
Participants were divided into two groups, so as to ensure homogeneity between groups and
heterogeneity within groups, according to their grade point averages of the previous term. The two
groups were assigned as the experimental and control groups, with 27 in each. 16 of the participants in
the experimental group were female and 11 were male, and in the control group, 17 female and 10
male. The average age of the participants was 18.9.
Data Collection Tool
Simple Electric Circuit Diagnostic Test (SECDT) developed by Peşman (2005) was used as a data
collection tool in the research.
Simple Electric Circuit Diagnostic Test (SECDT)
The SECDT, developed by Peşman (2005) was used to determine the misconceptions and conceptual
understanding of pre-service primary school teachers in this research. This test is a three-tier test
consisting of 12 questions. The first stage is in a traditional multiple-choice test structure (Peşman,
2005). The second stage consists of options that indicate the possible rationale for the answer given in
the first stage (Caleon & Subramaniam, 2010). In the third stage, the focus is on the respondent’s
certainty of the answers given in the first two stages (Peşman, 2005). This test represents a sufficient
tool to measure the learning outcomes of the participants. The maximum score that can be taken from
the test is 12, and the minimum score is 0. Many analyzes were performed in the test development
phase by Peşman (2005) regarding the SECDT used for this research. As result of these, relationship
between Score-2 and the confidence score was found significantly positive (r = .51, p <.01), which is
evidence for the construct validity; in addition, Cronbach’s Alpha reliability coefficient was determine
as .69 (Peşman, 2005). Later, point biserial correlation coefficient, false negative, and false positive
values were examined, and acceptable values were determined for content validity (Peşman, 2005).
SECDT is a test developed for a high school level target audience. Participants of the current study
group of this research last took courses related to the research topic in the high school. In addition,
SECDT's validity and reliability analyzes were conducted in order to determine the applicability for
pre-service primary school teachers of the test in this research. For this, SECDT was applied to 232
pre-service primary school teachers outside the study group of this research. The answers based on the
score-3, which are considered as correct information, were taken into consideration in performing item

IOJPE
ISSN: 1300 – 915X
www.iojpe.org
International Online Journal of Primary Education 2021, volume 10, issue 1
Copyright © International Online Journal of Primary Education 58
and reliability analyzes. The arithmetic mean value for the SECDT was 5.73, the standard deviation
value was 3.32, and the coefficient of skewness was .362, the coefficient of kurtosis -.697. The
difficulty indices of the items in the test were between .35 and .47; the discrimination indices varied
between .52 and .78, and the point biserial correlation coefficient values were determined to be .20 and
above for each item. In this case, point biserial correlation coefficient values (Crocker & Algina,
1986), item difficulty (Crocker & Algina, 1986), and item discrimination (Ebel & Frisbie, 1986) index
values are acceptable. As a result of the reliability analysis of the SECDT performed on 232
participants, the Cronbach’s Alpha reliability coefficient was calculated as .81. Hestenes and Halloun
(1995) state that the false positive and false negative rates should be below 10% in order to ensure the
structure and content validity of the test. In this research, SECDT’s second type misconception score
(false positive) and third type misconception score (false negative) were used to determine the false
positive and false negative rates, respectively. For this research, the false positive rate was 7.65% and
the false negative rate was 3.27%. In this case, the false negative and false positive rates were below
10%, evidence that the SECDT provided content and structure validity for this research. Cataloglu
(2002) states that the positive correlation between score-2 type and confidence score is evidence of the
test’s construct validity. The relationship between score-2 and confidence score type for this research
was positive and significant (r = .45, p <.00). This result is another indicator of the SECDT’s construct
validity. These results reveal that the SECDT is a valid and reliable test for pre-service primary school
teachers. In addition, there are different studies in which SECDT is used on pre-service teachers as a
data collection tool (Altun, 2009; Arı, Peşman, & Baykara, 2017).
Data Scoring
The data related to the research were obtained from the SECDT applied to both groups before and
after the experimental process. Şen and Yılmaz’s (2017) scoring system is thought to be the most up-
to-date and comprehensive scoring system for the three-tier tests in the literature, and was used in
scoring of the data obtained. According to this scoring system, nine different types of scores can be
obtained. This wide-ranging scoring system prevents from evaluating every wrong answer as a
misconception, and highlights that that they may also be caused by the lack of information (Şen &
Yılmaz, 2017). Using such a detailed scoring system in the research is important factor in the accurate
identification of misconceptions.
Şen and Yılmaz (2017) propose three types of scores representing misconceptions: misconception,
false positive and false negative. These score types were evaluated under the name of first, second and
third type misconception score for this research. Dealing with misconceptions under three sub-
headings leads to more detailed results regarding misconceptions. In this research, the score type
coded to determine conceptual understanding was evaluated under the name of conceptual
understanding score. In this case, the results obtained were the conceptual understanding score for
conceptual understanding, and three different types misconception scores. Although nine different
types of scores can be obtained from Şen and Yılmaz’s (2017) system, the focus was on the conceptual
understanding scores, and the misconception scores, since the conceptual understanding and
misconceptions of the participants were examined in this research. Score-4 and Score-5 are used to
determine lack of information and lack of confidence/lucky guess, respectively (Şen & Yılmaz, 2017).
Since the aim of the research is to determine conceptual understanding and misconceptions, these
score types (Score-4 and Score-5) were not used. Detailed information about score types, and how to
code them for the data analysis process is provided below.
Score-1: This type of score calculated by examining the answers given only in the first stage is
obtained by scoring of the condition that the participants gave correct answer in the first stage, as 1,
and the incorrect answer as 0 (Şen & Yılmaz, 2017).
Score-2: This type of score calculated by examining the answers given in both the first and the second
stages is obtained by scoring of the condition that the participants gave correct answers in the first and
second stages, as 1, and all other situations as 0 (Şen & Yılmaz, 2017).

IOJPE
ISSN: 1300 – 915X
www.iojpe.org
International Online Journal of Primary Education 2021, volume 10, issue 1
Copyright © International Online Journal of Primary Education 59
Score-3 (Conceptual understanding score): This scoring type represents the scientifically correct
answers given by the participants. This type of score is obtained by scoring of the condition that the
participants gave correct answers in the first and second stages and were sure of their answers, as 1,
and all other situations as 0 (Şen & Yılmaz, 2017). This type of score, coded as Score-3 by Şen and
Yılmaz (2017) was explained as the conceptual understanding score in this research.
Score-6 (First type misconception score (misconception)): This type of score is obtained by scoring of
the condition that the participants gave incorrect answers in the first and second stages, and were sure
of their answers, as 1, and all other situations as 0 (Şen & Yılmaz, 2017). This type of score, coded as
Score-6 by Şen and Yılmaz (2017) was explained as the first type misconception score in this research.
Score-7 (Second type misconception score (misconception, false positive)): This type of score is
obtained by scoring of the condition that the participants gave correct answers in the first stage,
incorrect answers in the second stage, and were sure of their answers, as 1, and all other situations are
scored as 0 (Şen & Yılmaz, 2017). This scoring is a misconception type, it indicates that the
respondents give the correct answer with a wrong justification, and are sure of their answers (Şen &
Yılmaz, 2017). This type of score, coded as Score-7 by Şen and Yılmaz (2017) was explained as the
second type misconception score in this research.
Score-8 (Third type misconception score (misconception, false negative)): This type of score is
obtained by scoring of the condition that the participants gave incorrect answers in the first stage,
correct answers in the second stage, and were sure of their answers, as 1, and all other situations are
scored as 0 (Şen & Yılmaz, 2017). This scoring is a misconception type, it indicates that the
respondents give the wrong answer with a correct justification and are sure of their answers (Şen &
Yılmaz, 2017). This type of score, coded as Score-8 by Şen and Yılmaz (2017) was explained as the
third type misconception score in this research.
Score-9 (Confidence score): In this score type, only the answers to the third stage are taken into
account (Şen & Yılmaz, 2017). The answers given are coded as 1 if "I am sure" and 0 if "I am not
sure". This type of score, coded as Score-9 by Şen and Yılmaz (2017) was explained as the confidence
score in this research.
Data Analysis
SPSS Statistics 23 program was used for data analysis. In data analysis, the level of significance was
evaluated as .05. Analysis was conducted using arithmetic mean, standard deviation, percentage value,
independent samples t-test, paired samples t-test, One-way MANOVA, and One-way repeated
measures MANOVA. The purpose of using the independent samples t-test is to determine the
significance of the difference between the arithmetic means of data values obtained from two
independent or unrelated groups (Morgan, Leech, Gloeckner & Barrett, 2011). Independent samples t-
test was used to compare the mean score of the groups regarding conceptual understanding before and
after the implementation. Before the test, the assumptions were checked. The independent samples t-
test assumption is that the data are suitable for normal distribution and the variances are equal (Cronk,
2020). Tabachnick and Fidell (2019), and Ntoumanis (2001) state that the normality assumption can
be evaluated with the coefficients of skewness and kurtosis. George and Mallery (2020) state that the
coefficients of skewness and kurtosis between ± 2.0 are acceptable. The results of the analysis showed
that the experimental group pretest (Skewness= .374; Kurtosis= .769), the control group pretest
(Skewness= -.400; Kurtosis= -.20), the experimental group posttest (Skewness= .100; Kurtosis=
-1.226), and the control group posttest (Skewness= -.805; Kurtosis= .417) data for the conceptual
understanding were suitable for normal distribution. Levene’s test results for equality of variances
regarding the pretest mean scores (p= .585, p>.05) and the posttest mean scores (p= .70, p>.05) of the
experimental and control groups revealed no significant difference between the variances of the
groups. The paired samples t-test is performed to determine the significance of the difference between
the arithmetic mean values of the data obtained as a result of successive measurements over the same
data source (George & Mallery, 2020). Paired samples t-test was conducted to determine whether the

IOJPE
ISSN: 1300 – 915X
www.iojpe.org
International Online Journal of Primary Education 2021, volume 10, issue 1
Copyright © International Online Journal of Primary Education 60
conceptual understanding of the groups improved significantly compared to the pre-implementation.
The paired samples-t test assumes that the data shows a normal distribution and are measured with the
same scale (Cronk, 2020). Before the test, the normality condition was checked by calculating the
values of skewness and kurtosis coefficient. Accordingly, the skewness and kurtosis coefficient values
were obtained from the averages of the experimental group's the posttest pretest difference score and
the control group's posttest pretest difference score. The results of the analysis showed that the
experimental group's posttest pretest difference score (Skewness= .389; Kurtosis= -1.089), control
group's posttest pretest difference score (Skewness= .012; Kurtosis= .059) data were suitable for
normal distribution. These results revealed that the necessary conditions for independent samples t-test
and paired samples t-test were met.
One-way MANOVA was used to determine the significance of the difference between misconceptions
pretest and posttest mean scores of the two groups. Before the test, normality condition was checked
by the coefficients of skewness and kurtosis and multivariate normality condition was checked by
calculating Mahalanobis distance values. The analysis results showed that the pre-test and post-test
mean scores of the experimental group were suitable for normal distribution regarding the first
(Skewness (pretest; posttest) = .504; 1.007, Kurtosis (pretest; posttest) = .230; .670), second (Skewness (pretest; posttest)
= 1.634; .237, Kurtosis (pretest; posttest) =1.396; -1.106), and third (Skewness (pretest; posttest) = 1.691; 1.099,
Kurtosis (pretest; posttest) = 1.683; 1.594) type misconception. In addition, the analysis revealed that the
pre-test and post-test mean scores of the control group were suitable for normal distribution regarding
the first (Skewness (pretest; posttest) = .671; .262, Kurtosis (pretest; posttest) = .075; -.668), second (Skewness
(pretest; posttest) = 1.567; .422, Kurtosis (pretest; posttest) =1.651; -.650), and third (Skewness (pretest; posttest) =
1.452; 1.416, Kurtosis (pretest; posttest) = 1.379; .649) type misconception. Mahalanobis distance values
revealed that there is no multivariate outlier that breaks multivariate normality. Analysis results
showed that the data were distributed normally in both cases. Box’s M test showed that there is no
significant difference between the covariance matrices (Box’s M= 6.092, F= .952, p= .457, p>.05).
Levene’s test showed that error variances for scores of the first type misconception (p= .277, p>.05),
the second type misconception (p= .216, p>.05), and the third type misconception (p= .168, p>.05) can
be considered equal. One-way repeated measures MANOVA was conducted to determine the
significance of the difference between experimental group' the posttest pretest mean scores and control
group' the posttest pretest mean scores for each type of misconception. The assumptions required for
the validity of the results obtained from the One-way repeated measures MANOVA analysis were
examined. Before the test, normality condition was checked by the coefficients of skewness and
kurtosis. The analysis results showed that the post-test pre-test difference scores of the experimental
and control groups were suitable for normal distribution regarding the first (Skewness (experimental; control) =
.662; -.236, Kurtosis (experimental; control) = .355; .248), second (Skewness (experimental; control) = -1.264; -.664,
Kurtosis (experimental; control) = 1.661; .510), and third (Skewness (experimental; control) = -.997; -1.108, Kurtosis
(experimental; control) = .852; 1.298) type misconception. Mauchly’s test of Sphericity results showed that
there was no significant difference between the variances of the difference scores (p=.065, p> .05).
These results revealed that the necessary conditions for One-way MANOVA and One-way repeated
measures MANOVA were met.
RESULTS
Conceptual understanding score was used to determine the effect of the method applied on the
participants' conceptual understanding of basic electric circuits. First type misconception score
(misconception), second type misconception score (false positive) and third type misconception score
(false negative) were used to determine the applied method’s effect on the change of misconceptions.
High conceptual understanding mean scores as a result of the scores obtained from the data collection
tool are considered as a benefit for participant groups, and the high mean score for misconception
types, a drawback.

IOJPE
ISSN: 1300 – 915X
www.iojpe.org
International Online Journal of Primary Education 2021, volume 10, issue 1
Copyright © International Online Journal of Primary Education 61
This section includes, in parallel with the research questions, the results of the analysis of the effect of
the method applied on misconceptions and conceptual understanding.
Results Regarding the Change in the Conceptual Understanding
The aim of the first research question is to determine whether there was significant improvement in the
conceptual understanding in the experimental and control groups after the implementation. As a result
of the analysis of SECDT’s conceptual understanding scores, the pretest mean scores of the
experimental and control groups were determined as 2.30 and 2.74 respectively. To determine whether
this difference was significant, the groups' the pretest mean scores were compared with independent
samples t-test (Table 1).
Table 1. Independent samples t-test results regarding conceptual understanding
Group Pretest Posttest
n M SD df t p n M SD df t p
Experimental 27 2.30 1.07 52 1.463 .150
27 7.26 2.18 52 7.814 .000*
Control 27 2.74 1.16 27 3.33 1.44
*p<.05, M: Mean, SD: Standard Deviation
In the Table 1, the research showed no significant difference between the SECDT's pretest mean
scores of the experimental and control groups (t(52)=1.463, p>.05). In order to determine the
significance of the difference between the SECDT's posttest mean scores of the experimental and
control groups in Table 1, independent samples t-test was conducted. Table 1 shows a significant
difference between the SECDT's posttest mean scores of the experimental and control groups
(t(52)=7.814, p<.05).
Then, in order to determine whether there was significant improvement in participants’ conceptual
understanding in the experimental and control groups after the implementation compared to before the
implementation, paired samples t-test was conducted related to conceptual understanding mean scores
(Table 2).
Table 2. Paired samples t-test results regarding conceptual understanding
Group Experimental Control
n M SD df t p n M SD df t p
Pretest 27 2.30 1.07 26 11.579 .000*
27 2.74 1.16 26 1.728 .096
Posttest 27 7.26 2.18 27 3.33 1.44
*p< .05, M: Mean, SD: Standard Deviation
In the Table 2, the research showed a significant difference between SECDT’s pretest and posttest
mean scores of the experimental group (t(26)=11.579, p<.05). In addition, Table 2 indicates no
significant difference between SECDT’s pretest and posttest mean scores of the control group
(t(26)=1.728; p>.05). Table 3 shows the conceptual understanding percentages in the experimental and
control groups.
Table 3. Percentages of conceptual understanding regarding experimental and control groups
Group Conceptual understanding
(%)
Experimental pretest 19.12
Experimental posttest 60.49
Control pretest 22.82
Control posttest 27.76
Table 3 reveals that the experimental group’s conceptual understanding was 32.73% higher than the
control group’s after the implementation compared to before the implementation.
Results Regarding the Change in the Misconceptions
The aim of the second research question was to determine whether there was a significant decrease in
misconceptions in the experimental and control groups after the implementation. In order to determine

IOJPE
ISSN: 1300 – 915X
www.iojpe.org
International Online Journal of Primary Education 2021, volume 10, issue 1
Copyright © International Online Journal of Primary Education 62
the significance of the difference between the pretest and posttest mean scores of the two groups
regarding SECDT’s misconception score types in Table 4, One-way MANOVA analysis was
conducted (Table 4).
Table 4. One-way MANOVA test results regarding misconception score types
Misconception
score types Group
Pretest Posttest
n M SD F p n M SD F p
First type
misconception
Experimental group 27 3.30 1.49 1.076 .304
27 1.63 1.39 7.929 .007*
Control group 27 2.89 1.40 27 2.82 1.69
Second type
misconception
Experimental group 27 .48 .89 .024 .877
27 .44 .51 2.579 .114
Control group 27 .52 .85 27 .70 .67
Third type
misconception
Experimental group 27 .48 .85 .103 .750
27 .15 .36 .477 .493
Control group 27 .56 .85 27 .22 .42
*p< .05, M: Mean, SD: Standard Deviation
Table 4 reveals no significant difference between groups’ pretest mean scores regarding the first type
misconception (F=1.076, p>.05), the second type misconception (F=.024, p>.05), and the third type
misconception (F=.103, p>.05). Wilks' Lambda analysis results showed a significant difference
between the experimental and control group regarding SECDT’s posttest misconception mean scores
(F(3-50)=3.624, p=.019, p<.05, Wilks' ⋀=.821, partial η2=.179). Table 4 indicates significant difference
between groups’ posttest mean scores regarding the first type misconception (F=7.929, p<.05), but no
significant difference between the posttest mean scores regarding the second (F=2.579, p>.05) and the
third type misconception (F =.477, p>.05).
One-way repeated measures MANOVA analysis was conducted to determine whether there was
significant decrease in misconceptions in the experimental and control group after the implementation
compared to before the implementation (Table 5).
Table 5. One-way repeated measures MANOVA results regarding misconception score types
*p< .05, M: Mean, SD: Standard Deviation
Table 5 shows significant difference between experimental group’ posttest and pretest mean scores
regarding the first type misconception (F=15.476, p<.05), but no significant difference between the
posttest and pretest mean scores for the second type misconception (F=.031, p>.05) and the third type
misconception (F=3.000, p>.05). Table 5 indicates no significant difference between control group’
posttest and pretest mean scores regarding the first type misconception (F=.047, p>.05), the second
type misconception (F=.632, p>.05), and the third type misconception (F=3.900, p>.05). Table 6
shows the misconception percentages of the participants in the experimental and control groups.
Table 6. Percentages of misconception regarding experimental and control groups
Group First type misconception
(%)
Second type misconception
(%)
Third type misconception
(%)
Experimental pretest 27.45 4.32 4.01
Experimental posttest 13.57 3.7 1.23
Control pretest 24.05 4.32 4.63
Control posttest 21.89 5.86 1.85
Misconception
score types Test
Experimental group Control group
n M SD F p 2 n M SD F p 2
First type
misconception
Pretest 27 3.30 1.49 15.476 .001* .373
27 2.89 1.40 .047 .830 .002
Posttest 27 1.63 1.39 27 2.82 1.69
Second type
misconception
Pretest 27 .48 .89 .031 .861 .001
27 .52 .85 .632 .434 .024
Posttest 27 .44 .51 27 .70 .67
Third type
misconception
Pretest 27 .48 .85 3.000 .095 .103
27 .56 .85 3.900 .059 .130
Posttest 27 .15 .36 27 .22 .42

IOJPE
ISSN: 1300 – 915X
www.iojpe.org
International Online Journal of Primary Education 2021, volume 10, issue 1
Copyright © International Online Journal of Primary Education 63
Table 6 reveals that the first type (8.32%), the second type (2.16%), and the third type (.62%)
misconception percentage was lower in the experimental group compared to the control group after the
implementation.
DISCUSSION and CONCLUSION
This research focused on comparing the effect of PBL and lecture-based learning in improving
conceptual understanding of simple electric circuits, and eliminating misconceptions. The results
support the assumption that PBL stated at the beginning of the research will be more effective in
improving conceptual understanding and in decreasing misconceptions when compared to the lecture-
based learning. diSessa (2014) states that for some difficult subjects, conventional teaching methods
are often unsuccessful. The teaching of concepts, such as closed circuit, open circuit, short circuit,
internal resistance, equivalent resistance, ohm law, electrical power in the subject field of simple
electrical circuits is generally limited to the mathematical operations for problem solving in lecture-
based learning. Explanations for these concepts in lecture-based learning, however, are likely to
remain abstract in the minds of learners. The abstract structure of the subjects and concepts, in
particular, may make it difficult for learners to structure these concepts correctly, and gain conceptual
understanding. Gavalcante et al. (1997) states that the conceptual understanding cannot simply be
transferred to the learners; they should construct it themselves. For this reason, learners should be
given the opportunity to construct these concepts in real-life learning situations, rather than listening to
verbal explanations, for correct interpretation. Thus, learners may be more likely to realize the
inaccuracy of their own abstract explanations, and embrace scientific explanations that will provide
correct conceptual understanding. Bilgin, Şenocak, and Sözbilir (2009) state that PBL is among the
various learning approaches developed by researchers to improve conceptual learning skills, as an
alternative to moving away from memorization. PBL includes problem situations that are used to
increase knowledge and understanding (Awang & Ramly, 2008). Iglesias (2002) states that PBL,
which is characterized by posing real-life problems, enables learners to acquire basic concepts for
certain content fields. In this research, in the experimental group, concepts in the subject field of
simple electric circuits were studied through scenarios involving real-life problem situations. In this
way, learners have the opportunity to transform their abstract explanations and misconceptions into
correct scientific explanations through concrete implementation. Research results support these
explanations. The maximum score that can be obtained from the SECDT for conceptual understanding
is 12. However, before the implementation, this score was found to be 2.30 in the experimental group
and 2.74 in the control group. This highlights the low conceptual understanding, of the pre-service
primary school teachers in the participant group before the implementation. These scores for
conceptual understanding were found to be 7.26 in the experimental group and 3.33 in the control
group at the end of the implementation. In the light of the findings obtained, the research showed that
PBL is significantly more effective in improving conceptual understanding regarding simple electric
circuit compared to lecture-based learning. PBL made a 32.73% greater contribution in improving
conceptual understanding compared to lecture-based learning. In the literature, existing studies support
this result, and show that PBL has positive effects on conceptual understanding and concept learning.
Sahin (2010) concluded that PBL has a more positive effect on university students' conceptual
understanding of Newtonian Mechanics compared to traditional instruction. Günter, Akkuzu, and
Alpat (2017) determined that PBL has more positive effects on the understanding of green chemistry
and sustainability compared to traditional expository learning. Wardani, Nurhayati, and Hardiyanti
(2017) found that PBL model more positive effect the conceptual understanding of students compared
to the lecture-based learning. Eren and Akınoğlu (2012) determined that PBL has a significantly
greater positive effect on concept teaching compared to the lecture-based learning. Nangku and
Rohaeti (2019) found that PBL model positively affected students' conceptual understanding. Ahied
and Ekapti (2020) concluded that learning using PBL can improve students' conceptual understanding
of pressure concept. In addition, there are studies regarding the positive effects of PBL supported by
various methods and techniques on conceptual understanding. Pratiwi, Cari, Aminah, and Affandy

IOJPE
ISSN: 1300 – 915X
www.iojpe.org
International Online Journal of Primary Education 2021, volume 10, issue 1
Copyright © International Online Journal of Primary Education 64
(2019) determined that PBL applying argumentation skills improves learners' conceptual
understanding regarding relationship between buoyant and sinking volume. Zahro, Jumadi, Wilujeng,
and Kuswanto (2019) determined that web-assisted PBL model resulted in a higher conceptual
understanding compared to the traditional learning model. Rohmah, Pramono, and Yusuf (2020) stated
that PBL supported by mobile learning media can improve primary students’ conceptual
understanding, and Ula, Supardi, and Sulhadi (2018) concluded that the implementation of PBL with
mind mapping improves understanding of concepts.
In this research, the participants with misconceptions in general were more likely to give wrong
answer with the wrong reason, rather than reaching the wrong answer with the correct reason, or the
correct answer with the wrong reason. Thus, of the three sub-score of misconception examined, the
mean scores for the first type misconception are higher than for the others. The research showed that
PBL provided a decrease in all misconception types at the end of the implementation, but this decrease
was significant only for the first type. Consistent with this result, the research revealed that PBL
provided a 13.88% decrease for the first type misconception at the end of the implementation
compared to before the implementation. The fact that the research was limited to 4 weeks can be
shown as the reason why the decrease in other misconception types was not significant. The results
revealed that the lecture-based learning after the implementation provided a non-significant decrease
in the first and third types of misconception, and a non-significant increase in the second type. Based
on this result, in the control group, after the implementation, there was an increase in the numbers
giving the correct answer based on the wrong reason, and being sure of the answers. Percentage
changes in misconception score types are consistent with this result. The research showed that lecture-
based learning increased the second type misconception (false positive) by 1.54% at the end of the
implementation. This increase in the second type misconception, as opposed to a decrease or no
change, was an unexpected result. However, this increase was not significant. The lack of a significant
increase may be a reason for optimism about the effect of this result. The cause may be that
participants are likely to reach correct answers in their predictions results, even without the correct
justification. Hestenes and Halloun (1995) states that it is difficult to reduce the rate of false positives,
and that even random choices are effective in increasing the rate of false positives. This explanation
supports the result obtained.
The research revealed that PBL was effective 13.88% and lecture-based learning was 2.16% effective
in decreasing the first type misconception after the implementation. It was previously stated that some
improvements were made in the control group in order to limit the results of the biased research in
favor of the experimental group in which the experimental implementations were made. Accordingly,
in order to ensure the activeness of the participants in the control group, question-answer and problem
solving activities were carried out. In addition, during the demonstration experiments used in the
control group, a discussion environment was provided on the predictions of the control group
participants. However, unlike lecture-based learning, PBL provides an opportunity for learners to
think about the solution of a problem situation, to form a hypothesis and test it. In PBL, learners make
pre-discussions based on their pre-knowledge to determine the problem and its solution. These
discussions cause learners to encounter different ideas and question their own concepts. In addition,
the process of creating and testing hypotheses provides an opportunity for learners involved in the
learning process with their pre-concepts to question their existing concepts and realize that they are
wrong. Thus, learners enter a process that will replace their misconceptions with scientific
explanations. The inability of lecture-based learning to have a significant effect on overcoming
misconceptions in this research can be attributed to these reasons. Widarti et al. (2017) states that
lecture-based learning will be insufficient in overcoming misconceptions related to conceptual change.
PBL was significantly effective in overcoming misconceptions, but did not completely eliminate
misconceptions. This is probably because the participants had a lot of misconceptions before the
implementation. Perhaps the success of PBL could be seen more clearly if it had been studied with a
group of participants who had less misconceptions before the implementation. But still the research
revealed that PBL is more effective at overcoming misconceptions of all types than lecture-based

IOJPE
ISSN: 1300 – 915X
www.iojpe.org
International Online Journal of Primary Education 2021, volume 10, issue 1
Copyright © International Online Journal of Primary Education 65
learning. The research showed that PBL is more effective by 8.32% at decreasing misconception
compared to lecture-based learning. This shows the success of PBL in overcoming misconceptions.
These results confirmed the assumption that PBL presented in the research is effective in decreasing
misconceptions. In the literature, there are studies that support the effectiveness of PBL in decreasing
misconceptions. Akınoğlu and Tandoğan (2007) determined that the PBL model not only positively
affected the conceptual development, but also kept misconceptions at a low level. Tarhan and Acar
(2007) found that PBL compensates for misconception in students, and Bayram (2010) found that PBL
is more successful in eliminating misconceptions compared to traditional learning methods. The PBL
method applied in this research was more effective in decreasing the participants' misconceptions
about simple electric circuits compared to the lecture-based learning and had a more positive effect on
enabling participants to make scientific explanations about simple electric circuits, and improve their
conceptual understanding.
Suggestions
The research results reveal the positive effects of PBL in eliminating pre-service primary school
teachers' misconceptions and supporting conceptual understanding, compared to lecture-based
learning. This suggests that PBL should be employed more frequently in the education system. This
research was carried out on simple electrical circuit issues and concepts, but future studies can be
expanded to include other science subjects and concepts. Longer-term research will enable the effect
of PBL on variables to be determined more clearly. The current research focused on the elimination of
misconceptions within the scope of the general results obtained from the test, but the misconceptions
surrounding each concept were not examined individually before and after the implementation. For
this reason, it is not known which misconceptions were more resistant to elimination at the end of the
implementation. Therefore, in subsequent studies, the results obtained may be supported with
qualitative data in order to determine the change of pre-and post-implementation misconceptions for
each concept.
Limitations
There are some limitations of the present research. The first limitation of this research was that the
research period was limited to four weeks in order to minimize disrupt the education program. This
limitation can be overcome by carrying out the research with a longer implementation period to reveal
the change in conceptual understanding and misconceptions more clearly. In this research, concepts
regarding basic electric circuits were limited to closed circuit, open circuit, short circuit, internal
resistance, equivalent resistance, ohm law, lamp brightness (electrical power). In future studies, these
concepts can be further expanded taking a holistic approach. The last limitation is that the research
data was obtained using three-tier SECDT. In the third stage of the three-tier tests, the participants
were asked to confirm whether they were sure of their answers in both stages (Şen & Yılmaz, 2017).
Similar research can use a four-tier test to be developed on simple electrical circuits in the literature.
Thus, this limitation of the three-tier tests can be eliminated by asking the participants about the
certainty of their responses separately for both stages.
REFERENCES
Abraham, M. R. (2005). Inquiry and the learning cycle approach. In N. J. Pienta, M. M. Cooper, & T. J. Greenbowe (Eds.),
Chemists’ guide to effective teaching (pp. 41–52). Upper Saddle River, NJ: Pearson Prentice Hall.
Afra, N. C., Osta, I., & Zoubeir, W. (2009). Students’ alternative conceptions about electricity and effect of inquiry-based
teaching strategies. International Journal of Science and Mathematics Education, 7(1), 103-132.
https://doi.org/10.1007/s10763-007-9106-7
Ahied, M., & Ekapti, R. F. (2020). Conceptual understanding of pressure concept through problem based learning in junior
high school grade 8th. Journal of Physics: Conference Series, 1521. https://doi.org/10.1088/1742-
6596/1521/4/042120
Akınoğlu, O., & Tandoğan, R. Ö. (2007). The effects of problem-based active learning in science education on students’
academic achievement, attitude and concept learning. Eurasia Journal of Mathematics, Science and Technology
Education, 3(1), 71-81. https://doi.org/10.12973/ejmste/75375

IOJPE
ISSN: 1300 – 915X
www.iojpe.org
International Online Journal of Primary Education 2021, volume 10, issue 1
Copyright © International Online Journal of Primary Education 66
Altun, S. (2009). Üç aşamalı bir testle fen bilgisi öğretmen adaylarının basit elektrik devreleri konusundaki kavram
yanılgılarının tespiti [Determination of prospective science teachers’ misconceptions of simple electric circuits issue
with three-stage test]. Bayburt University Journal of Education Faculty, 4(1), 72-79.
Alwan, A. A. (2011). Misconception of heat and temperature among physics students. Procedia-Social and Behavioral
Sciences, 12, 600-614. https://doi.org/10.1016/j.sbspro.2011.02.074
Anggoro, S., Widodo, A., Suhandi, A., & Treagust, D. F. (2019). Using a discrepant event to facilitate preservice elementary
teachers’ conceptual change about force and motion. Eurasia Journal of Mathematics, Science and Technology
Education, 15(8), 1-21. https://doi.org/10.29333/ejmste/105275
Arı, Ü., Peşman, H., & Baykara, O. (2017). Sorgulamaya dayalı öğretimde rehberlik düzeyinin fen bilimleri öğretmen
adaylarının kavram yanılgılarını iyileştirmedeki etkisinin bilimsel süreç becerileriyle etkileşimi [Interaction of effect
upon remediating prospective science teachers’ misconceptions by guidance level in inquiry teaching with science
process skills]. Bartın University Journal of Faculty of Education, 6(1), 304-321.
Awang, H., & Ramly, I. (2008). Creative thinking skill approach through problem-based learning: Pedagogy and practice in
the engineering classroom. World Academy of Science, Engineering and Technology, International Journal of
Educational and Pedagogical Sciences, 2(4), 334-339. Retrieved from https://publications.waset.org/15369/pdf
Aydeniz, M., & Dogan, A. (2016). Exploring the impact of argumentation on pre-service science teachers' conceptual
understanding of chemical equilibrium. Chemistry Education Research and Practice, 17(1), 111-119.
https://doi.org/10.1039/C5RP00170F
Aykutlu, I., & Şen, A. İ. (2012). Üç aşamalı test, kavram haritası ve analoji kullanılarak lise öğrencilerinin elektrik akımı
konusundaki kavram yanılgılarının belirlenmesi [Determination of secondary school students’ misconceptions about
the electric current using a three tier test, concept maps and analogies]. Education and Science, 37(166), 275-288.
Barrows, H. S. (1996). Problem‐based learning in medicine and beyond: A brief overview. New Directions for Teaching and
Learning, 68, 3-12. https://doi.org/10.1002/tl.37219966804
Barrows, H. S., & Tamblyn, R. M. (1980). Problem-based learning: An approach to medical education (Vol. 1). Broadway
New York: Springer Publishing Company, Inc.
Bayram, A. (2010). Probleme dayalı öğrenme yönteminin ilköğretim 5. sınıf öğrencilerinin fen ve teknoloji dersi “ısı ve
sıcaklık” konusunda sahip oldukları kavram yanılgılarını gidermede etkisi [The effect of problem based learning on
overcoming 5th grade students’ misconceptions about “heat and temperature”]. (Unpublished Master Thesis), Selçuk
University, Konya.
Bilgin, I., Şenocak, E., & Sözbilir, M. (2009). The effects of problem-based learning instruction on university students’
performance of conceptual and quantitative problems in gas concepts. Eurasia Journal of Mathematics, Science and
Technology Education, 5(2), 153-164. https://doi.org/10.12973/ejmste/75267
Bostan Sarıoğlan, A., & Abacı, B. (2017). Sorgulamaya dayalı öğretimin “lamba parlaklığı” kavramının ortaokul 5. sınıf
öğrencilerinin başarısına etkisi [The effect of inquiry based learning approach about "light bright" concept on 5th
grade middle school students]. Journal of Balıkesir University Institute of Science and Technology, 19(3), 164-171.
Boud, D., & Feletti, G. (1997). Changing problem-based learning. Introduction to the second edition. In D. Boud, & G.
Feletti, (Eds.), The challenge of problem based learning (2nd edition) (pp. 1-14). New York: St. Martin’s Press.
Caleon, I. S., & Subramaniam, R. (2010). Do students know what they know and what they don’t know? Using a four-tier
diagnostic test to assess the nature of students’ alternative conceptions. Research in Science Education, 40(3), 313-
337. https://doi.org/10.1007/s11165-009-9122-4
Campbell, D. T., & Stanley, J. C. (1963). Experimental and quasi-experimental designs for research on teaching. In N. L.
Gage (Ed.), Handbook of research on teaching. A Project of the American Educational Research Association (pp.
171-246). Chicago: Rand McNally & Company.
Cantürk-Günhan, B. (2006). İlköğretim II. kademede matematik dersinde probleme dayalı öğrenmenin uygulanabilirliği
üzerine bir araştırma [An investigation on applicability of problem based learning in the mathematics lesson at the
second stage in the elementary education] (Unpublished Doctoral Dissertation), Dokuz Eylül University, İzmir.
Cataloglu, E. (2002). Development and validation of an achievement test in introductory quantum mechanics: The quantum
mechanics visualization instrument (QMVI) (Unpublished Doctoral Dissertation). The Pennsylvania State University,
Pennsylvania.
Chen, C. H., & Bradshaw, A. C. (2007). The effect of web-based question prompts on scaffolding knowledge integration and
ill-structured problem solving. Journal of Research on Technology in Education, 39(4), 359-375.
https://doi.org/10.1080/15391523.2007.10782487

IOJPE
ISSN: 1300 – 915X
www.iojpe.org
International Online Journal of Primary Education 2021, volume 10, issue 1
Copyright © International Online Journal of Primary Education 67
Chi, M. T. H., & Roscoe, R. D. (2002). The process and challenges of conceptual change. In M. Limon and L. Mason (Eds.),
Reconsidering conceptual change: Issues in theory and practice. Dordrecht: Kluwer.
Chin, C., & Chia, L. G. (2006). Problem‐based learning: Using ill‐structured problems in biology project work. Science
Education, 90(1), 44-67. https://doi.org/10.1002/sce.20097
Cohen, L., Manion, L., & Morrison, K. (2018). Research methods in education (8th edition). London: Routledge/Taylor &
Francis.
Cohen, R., Eylon, B., & Ganiel, U. (1983). Potential difference and current in simple electric circuits: A study of students’
concepts. American Journal of Physics, 51(5), 407-412. https://doi.org/10.1119/1.13226
Crocker, L., & Algina, J. (1986). Introduction to classical and modern test theory. Orlando, Florida: Holt, Rinehart, and
Winston, Inc.
Cronk, B. C. (2020). How to use SPSS: A step-by-step guide to analysis and interpretation (11th edition). London:
Routledge/Taylor & Francis.
Dahlgren, M. A., & Öberg, G. (2001). Questioning to learn and learning to question: Structure and function of problem-based
learning scenarios in environmental science education. Higher Education, 41(3), 263-282.
https://doi.org/10.1023/A:1004138810465
Darmofal, D. L., Soderholm, D. H., & Brodeur. D. R. (2002, November). Using concept maps and concept questions to
enhance conceptual understanding. 32nd Annual ASEE/IEEE Frontiers in Education Conference, Vol. 3, pp. T3A-1-
T3A-6, 6-9 November 2002, Boston, MA.
De Grave, W. S., Boshuizen, H. P. A., & Schmidt, H. G. (1996). Problem based learning: Cognitive and metacognitive
processes during problem analysis. Instructional Science, 24(5), 321-341.
Demirezen, S., & Yağbasan, R. (2013). 7E modelinin basit elektrik devreleri konusundaki kavram yanılgıları üzerine etkisi
[The effect of 7E model on misconceptions about simple electrical circuits]. Hacettepe University Journal of
Education, 28(2), 132-151.
Desstya, A., Prasetyo, Z. K., Suyanta, Susila, I., & Irwanto (2019). Developing an instrument to detect science misconception
of an elementary school teacher. International Journal of Instruction, 12(3), 201-218.
diSessa, A. A. (2014). A history of conceptual change research: Threads and fault lines. In R. K. Sawyer (Ed.), The
Cambridge handbook of the learning sciences (2nd edition) (pp. 88–108). New York: Cambridge University Press.
Dolmans, D. H. J. M., Loyens, S. M. M., Marcq, H., & Gijbels, D. (2016). Deep and surface learning in problem-based
learning: a review of the literature. Advances in Health Sciences Education, 21(5), 1087-1112.
https://doi.org/10.1007/s10459-015-9645-6
Dolmans, D. H. J. M., Wolfhagen, I. H. A. P., Van Der Vleuten, C. P. M., & Wijnen, W. H. F. W. (2001). Solving problems
with group work in problem‐based learning: Hold on to the philosophy. Medical Education, 35(9), 884-889.
Driver, R. (1981). Pupils’ alternative frameworks in science. European Journal of Science Education, 3(1), 93-101.
https://doi.org/10.1080/0140528810030109
Duch, B. J., Groh, S. E., & Allen, D. E. (2001). Why problem-based learning? A case study of institutional change in
undergraduate education. In B. J. Duch, S. E. Groh, & D. E. Allen (Eds.), The power of problem-based learning (pp.
3-11). Sterling, VA: Stylus Publishing.
Duit, R., & Treagust, D. F. (2003). Conceptual change: A powerful framework for improving science teaching and learning.
International Journal of Science Education, 25(6), 671-688. https://doi.org/10.1080/09500690305016
Dupin, J. J., & Johsua, S. (1987). Conceptions of French pupils concerning electric circuits: Structure and evolution. Journal
of Research in Science Teaching, 24(9), 791-806. https://doi.org/10.1002/tea.3660240903
Ebel, R. L., & Frisbie, D. A. (1986). Essentials of educational measurement (4th edition). Englewood Cliffs, New Jersey:
Prentice-Hall Inc.
Engelhardt, P. V., & Beichner, R. J. (2004). Students' understanding of direct current resistive electrical circuits. American
Journal of Physics, 72(1), 98-115. https://doi.org/10.1119/1.1614813
Eren, C. D., & Akınoğlu, O. (2012). Fen eğitiminde probleme dayalı öğrenmenin kavram öğrenmeye etkisi [The effect of
problem based learning on concept learning in science education]. Journal of Research in Education and Teaching,
1(3), 19-32.
Erickson, D. K. (1999). A problem-based approach to mathematics instruction. The Mathematics Teacher, 92(6), 516-521.

IOJPE
ISSN: 1300 – 915X
www.iojpe.org
International Online Journal of Primary Education 2021, volume 10, issue 1
Copyright © International Online Journal of Primary Education 68
Fadaei, S. S., & Mora, C. (2015). An investigation about misconceptions in force and motion in high school. US-China
Education Review A, 5(1), 38-45. https://doi.org/10.17265/2161-623X/2015.01.004
Fadillah, A., & Salirawati, D. (2018). Analysis of misconceptions of chemical bonding among tenth grade senior high school
students using a two-tier test. AIP Conference Proceedings, 2021, 080002-1-080002-7.
https://doi.org/10.1063/1.5062821
Fahmi, F., & Irhasyuarna, Y. (2017). The misconceptions of senior high school students in Banjarmasin on chemical
bonding. Journal of Education and Practice, 8(17), 32-39.
Farrokhnia, M. R., & Esmailpour, A. (2010). A study on the impact of real, virtual and comprehensive experimenting on
students’ conceptual understanding of DC electric circuits and their skills in undergraduate electricity laboratory.
Procedia-Social and Behavioral Sciences, 2(2), 5474-5482.
Fisher, K. M. (1985). A misconception in biology: Amino acids and translation. Journal of Research in Science Teaching,
22(1), 53-62. https://doi.org/10.1002/tea.3660220105
Fredette, N., & Lochhead, J. (1980). Student conceptions of simple circuits. Physics Teacher, 18(3), 194-198.
https://doi.org/10.1119/1.2340470
Gavalcante, P. S., Newton, D. P., & Newton, L. D. (1997). The effect of various kinds of lesson on conceptual understanding
in science. Research in Science & Technological Education, 15(2), 185-193.
https://doi.org/10.1080/0263514970150205
George, D., & Mallery, M. (2020). IBM SPSS statistics 26 step by step: A simple guide and reference (16th edition). London:
Routledge/Taylor & Francis.
Gilbert, J. K., Osborne, R. J., & Fensham, P. J. (1982). Children's science and its consequences for teaching. Science
Education, 66(4), 623-633. https://doi.org/10.1002/sce.3730660412
Gooding, J., & Metz, B. (2011). From misconceptions to conceptual change: Tips for identifying and overcoming students'
misconceptions. The Science Teacher, 78(4), 34-37.
Goodman, R. J. B. (2010). Problem-based learning: Merging of economics and mathematics. Journal of Economics and
Finance, 34(4), 477-483. https://doi.org/10.1007/s12197-010-9154-7
Gravetter, F. J., & Forzano, L. A. B. (2018). Research methods for the behavioral sciences (6th edition). Boston: Cangage
Learning.
Günter, T., Akkuzu, N., & Alpat, Ş. (2017). Understanding ‘green chemistry’ and ‘sustainability’: An example of problem-
based learning (PBL). Research in Science & Technological Education, 35(4), 500-520.
https://doi.org/10.1080/02635143.2017.1353964
Hadjiachilleos, S., Valanides, N., & Angeli, C. (2013). The impact of cognitive and affective aspects of cognitive conflict on
learners’ conceptual change about floating and sinking. Research in Science & Technological Education, 31(2),
133-152. https://doi.org/10.1080/02635143.2013.811074
Halloun, I. A., & Hestenes, D. (1985). Common sense concepts about motion. American Journal of Physics, 53(11),
1056-1065. https://doi.org/10.1119/1.14031
Haslam, F., & Treagust, D. F. (1987). Diagnosing secondary students' misconceptions of photosynthesis and respiration in
plants using a two-tier multiple choice instrument. Journal of Biological Education, 21(3), 203-211.
https://doi.org/10.1080/00219266.1987.9654897
Helm, H. (1980). Misconceptions in physics amongst South African students. Physics Education, 15(2), 92-105.
https://doi.org/10.1088/0031-9120/15/2/308
Hendry, G. D., Frommer, M., & Walker, R. A. (1999). Constructivism and problem‐based learning. Journal of Further and
Higher Education, 23(3), 359-371. https://doi.org/10.1080/0309877990230306
Hestenes, D., & Halloun, I. (1995). Interpreting the force concept inventory: A response to March 1995 critique by Huffman
and Heller. The Physics Teacher, 33(8), 502-506. https://doi.org/10.1119/1.2344278
Hewson, M. G., & Hewson, P. W. (1983). Effect of instruction using students' prior knowledge and conceptual change
strategies on science learning. Journal of Research in Science Teaching, 20(8), 731-743.
https://doi.org/10.1002/tea.3660200804
Hewson, P. W., & Hewson, M. G. B. (1984). The role of conceptual conflict in conceptual change and the design of science
instruction. Instructional Science, 13(1), 1-13. https://doi.org/10.1007/BF00051837
Hewson, P. W., & Thorley, N. R. (1989). The conditions of conceptual change in the classroom. International Journal of
Science Education, 11(5), 541-553. https://doi.org/10.1080/0950069890110506

IOJPE
ISSN: 1300 – 915X
www.iojpe.org
International Online Journal of Primary Education 2021, volume 10, issue 1
Copyright © International Online Journal of Primary Education 69
Hmelo-Silver, C. E. (2004). Problem-based learning: What and how do students learn?. Educational Psychology Review,
16(3), 235-266. https://doi.org/10.1023/B:EDPR.0000034022.16470.f3
Iglesias, J. L. (2002). Problem-based learning in initial teacher education. Prospects, 32(3), 319-332.
https://doi.org/10.1023/A:1022133529435
Jaakkola, T., Nurmi, S., & Veermans, K. (2011). A comparison of students' conceptual understanding of electric circuits in
simulation only and simulation‐laboratory contexts. Journal of Research in Science Teaching, 48(1), 71-93.
Jonassen, D. H. (1997). Instructional design models for well-structured and ill-structured problem-solving learning outcomes.
Educational Technology Research and Development, 45(1), 65-94. https://doi.org/10.1007/BF02299613
Jonassen, D. H., & Kwon, H. (2001). Communication patterns in computer mediated versus face-to-face group problem
solving. Educational Technology Research and Development, 49(1), 35-51. https://doi.org/10.1007/BF02504505
Kalaya, T., Nopparatjamjomras, S., Chitaree, R., & Nopparatjamjomras, T. R. (2019). Worksheet analysis for revealing
students’ understanding of simple DC circuits. Journal of Physics: Conference Series, 1380.
https://doi.org/10.1088/1742-6596/1380/1/012164
Kırılmazkaya, G., & Kırbağ Zengin, F. (2016). Öğretmen adaylarının fotosentez konusu hakkında kavram yanılgılarının vee
diyagramı aracılığıyla belirlenmesi ve bu araca yönelik görüşlerinin tespiti [Determination of photosynthesis
misconceptions’ through vee diyagrams and preservice teachers’ views towards these tools]. Erzincan University
Journal of Education Faculty, 18(2), 1537-1563.
Klammer, J. (1998). An overview of techniques for identifying, acknowledging and overcoming alternate conceptions in
physics education. Klingenstein Project Paper, Teachers College, Columbia University (ERIC Document
Reproduction Service No. ED423121).
Küçüközer, H., & Kocakülah, S. (2007). Secondary school students’ misconceptions about simple electric circuits. Journal of
Turkish Science Education, 4(1), 101-115.
Lee, G., Kwon, J., Park, S. S., Kim, J. W., Kwon, H. G., & Park, H. K. (2003). Development of an instrument for measuring
cognitive conflict in secondary‐level science classes. Journal of Research in Science Teaching, 40(6), 585-603.
https://doi.org/10.1002/tea.10099
Lohman, M. C., & Finkelstein, M. (2000). Designing groups in problem-based learning to promote problem-solving skill and
self-directedness. Instructional Science, 28(4), 291-307. https://doi.org/10.1023/A:1003927228005
Loyens, S. M. M., Rikers, R. M. J. P., & Schmidt, H. G. (2006). Students' conceptions of constructivist learning: A
comparison between a traditional and a problem-based learning curriculum. Advances in Health Sciences
Education, 11(4), 365-379. https://doi.org/10.1007/s10459-006-9015-5
Manunure, K., Delserieys, A., & Castéra, J. (2019). The effects of combining simulations and laboratory experiments on
Zimbabwean students’ conceptual understanding of electric circuits. Research in Science & Technological
Education, 38(3), 289-307. https://doi.org/10.1080/02635143.2019.1629407
Marra, R. M., Jonassen, D. H., Palmer, B., & Luft, S. (2014). Why problem-based learning works: Theoretical foundations.
Journal on Excellence in College Teaching, 25(3&4), 221-238.
Millar, R., & King, T. (1993). Students’ understanding of voltage in simple series electric circuits. International Journal of
Science Education, 15(3), 339-349. https://doi.org/10.1080/0950069930150310
Morgan, G. A., Leech, N. L., Gloeckner, G. W., & Barrett, K. C. (2011). SPSS for introductory statistics: Use and
interpretation (2nd edition). London: Routledge.
Mubarokah, F. D., Mulyani, S., & Indriyanti, N. Y. (2018). Identifying students’ misconceptions of acid-base concepts using
a three-tier diagnostic test: A case of Indonesia and Thailand. Journal of Turkish Science Education, 15(Special),
51-58. https://doi.org/10.12973/tused.10256a
Musal, B., Akalın, E., Kılıç, O., Esen, A, & Alıcı, E. (2002). Dokuz Eylül Üniversitesi Tıp Fakültesi probleme dayalı öğretim
programı, süreçleri ve eğitim yönlendiricilerinin rolü [PBL program, process and the roles of tutors in Dokuz Eylül
University School of Medicine]. The World of Medical Education, 9(9), 39-49.
Nangku, M. S., & Rohaeti, E. (2019). The effect of problem-based learning model toward students’ conceptual understanding
and verbal communication skills in reaction rate learning. Journal of Physics: Conference Series, 1397.
https://doi.org/10.1088/1742-6596/1397/1/012037
Narjaikaew, P. (2013). Alternative conceptions of primary school teachers of science about force and motion. Procedia-
Social and Behavioral Sciences, 88, 250-257. https://doi.org/10.1016/j.sbspro.2013.08.503

IOJPE
ISSN: 1300 – 915X
www.iojpe.org
International Online Journal of Primary Education 2021, volume 10, issue 1
Copyright © International Online Journal of Primary Education 70
Nie, Y., Xiao, Y., Fritchman, J. C., Liu, Q., Han, J., Xiong, J., & Bao, L. (2019). Teaching towards knowledge integration in
learning force and motion. International Journal of Science Education, 41(16), 2271-2295.
https://doi.org/10.1080/09500693.2019.1672905
Ntoumanis, N. (2001). A step-by-step guide to SPSS for sport and exercise studies. London: Routledge.
Peşman, H. (2005). Development of a three-tier to assess ninth grade students' misconceptions about simple electric circuits
(Unpublished Master Thesis). Orta Doğu Teknik University, Ankara.
Peşman, H., & Eryılmaz, A. (2010). Development of a three-tier test to assess misconceptions about simple electric circuits.
The Journal of Educational Research, 103(3), 208-222. https://doi.org/10.1080/00220670903383002
Picciarelli, V., Di Gennaro, M., Stella, R., & Conte, E. (1991). A study of university students' understanding of simple
electric circuits part 1: Current in d.c. circuits. European Journal of Engineering Education, 16(1), 41-56.
https://doi.org/10.1080/03043799108939503
Posner, G. J., Strike, K. A., Hewson, P. W., & Gertzog, W. A. (1982). Accommodation of a scientific conception: Toward a
theory of conceptual change. Science Education, 66(2), 211-227. https://doi.org/10.1002/sce.3730660207
Pratiwi, S. N., Cari, C., Aminah, N. S., & Affandy, H. (2019). Problem-based learning with argumentation skills to improve
students’ concept understanding. Journal of Physics: Conference Series, 1155. https://doi.org/10.1088/1742-
6596/1155/1/012065
Prince, M. (2004). Does active learning work? A review of the research. Journal of Engineering Education, 93(3), 223-231.
https://doi.org/10.1002/j.2168-9830.2004.tb00809.x
Reynolds, J. M., & Hancock, D. R. (2010). Problem‐based learning in a higher education environmental biotechnology
course. Innovations in Education and Teaching International, 47(2), 175-186.
https://doi.org/10.1080/14703291003718919
Roh, K. H. (2003). Problem-based learning in mathematics. ERIC Clearinghouse for Science Mathematics and
Environmental Education, Columbus, OH. EDO-SE-03-07. (ERIC Document Reproduction Service No. ED482725).
Rohmah, F., Pramono, S. E., & Yusuf, A. (2020). Problem based learning assisted by mobile learning to improve conceptual
understanding of primary school students. Educational Management, 9(1), 51-58.
Roth, K. J. (1990). Developing meaningful conceptual understanding in science. In B. F. Jones, & L. Idol, (Eds.), Dimensions
of thinking and cognitive instruction (pp. 139- 175). Broadway Hillsdale, NJ: Lawrence Erlbaum Associates.
Sahin, M. (2010). Effects of problem-based learning on university students’ epistemological beliefs about physics and
physics learning and conceptual understanding of Newtonian mechanics. Journal of Science Education and
Technology, 19(3), 266-275. https://doi.org/10.1007/s10956-009-9198-7
Savery, J. R. (2006). Overview of problem-based learning: Definitions and distinctions. Interdisciplinary Journal of
Problem-Based Learning, 1(1), 9-20. https://doi.org/10.7771/1541-5015.1002
Savery, J. R., & Duffy, T. M. (1995). Problem based learning: An instructional model and its constructivist framework.
Educational Technology, 35(5), 31-38.
Schmidt, H. G., De Volder, M. L., De Grave, W. S., Moust, J. H. C., & Patel, V. L. (1989). Explanatory models in the
processing of science text: The role of prior knowledge activation through small-group discussion. Journal of
Educational Psychology, 81(4), 610- 619.
Schoon, K. J., & Boone, W. J. (1998). Self‐efficacy and alternative conceptions of science of preservice elementary teachers.
Science Education, 82(5), 553-568. https://doi.org/10.1002/(SICI)1098-237X(199809)82:5<553::AID-
SCE2>3.0.CO;2-8
Schunk, D. H. (2012). Learning theories: An educational perspective (6th edition). Boston, MA: Pearson.
Scott, P., Asoko, H., & Leach, J. (2007). Student conceptions and conceptual learning in science. In S. K. Abell, & N. G.
Lederman (Eds.), Handbook of research on science education (pp. 31-56). New York, NY: Routledge.
Setyani, N. D., Suparmi, Sarwanto, & Handhika, J. (2017). Students conception and perception of simple electrical circuit.
Journal of Physics: Conference Series, 909. https://doi.org/10.1088/1742-6596/909/1/012051
Shepardson, D. P., & Moje, E. B. (1994). The nature of fourth graders' understandings of electric circuits. Science Education,
78(5), 489-514. https://doi.org/10.1002/sce.3730780505
Shipstone, D. (1988). Pupils' understanding of simple electrical circuits. Some implications for instruction. Physics
Education, 23(2), 92-96. https://doi.org/10.1088/0031-9120/23/2/004

IOJPE
ISSN: 1300 – 915X
www.iojpe.org
International Online Journal of Primary Education 2021, volume 10, issue 1
Copyright © International Online Journal of Primary Education 71
Smith, E. L., Blakeslee, T. D., & Anderson, C. W. (1993). Teaching strategies associated with conceptual change learning in
science. Journal of Research in Science Teaching, 30(2), 111-126. https://doi.org/10.1002/tea.3660300202
Soeharto, S., Csapó, B., Sarimanah, E., Dewi, F. I., & Sabri, T. (2019). A review of students’ common misconceptions in
science and their diagnostic assessment tools. Jurnal Pendidikan IPA Indonesia, 8(2), 247-266.
https://doi.org/10.15294/jpii.v8i2.18649
Stepien, W., & Gallagher, S. (1993). Problem-based learning: As authentic as it gets. Educational Leadership, 50(7), 25-28.
Suciatmoko, P. M., Suparmi, A., & Sukarmin, S. (2018). An analysis of students’ conceptual understanding: How do students
understand some electricity concepts?. AIP Conference Proceedings, 2014(1), 20154-1-20154-6.
https://doi.org/10.1063/1.5054558
Suliyanah, Putri, H. N. P. A., & Rohmawati, L. (2018). Identification student’s misconception of heat and temperature using
three-tier diagnostic test. Journal of Physics: Conference Series, 997. https://doi.org/10.1088/1742-
6596/997/1/012035
Suryadi, A., Kusairi, S., & Husna, D. A. (2020). Comparative study of secondary school students' and pre-service teachers'
misconception about simple electric circuit. Jurnal Pendidikan Fisika Indonesia, 16(2), 111-121.
https://doi.org/10.15294/jpfi.v16i2.21909
Şen, Ş., & Yılmaz, A. (2017). The development of a three-tier chemical bonding concept test. Journal of Turkish Science
Education, 14(1), 110-126.
Şenyiğit, Ç. (2020). Sorgulama temelli öğrenmenin sınıf öğretmeni adaylarının bilimsel süreç becerilerine ve kavramsal
anlamalarına etkisi [The effect of inquiry-based learning on elementary school teacher candidates' scientific process
skills and conceptual understanding] (Unpublished Doctoral Dissertation), Dokuz Eylül University, İzmir.
Tabachnick, B. G., & Fidell, L. S. (2019). Using multivariate statistics (7th edition). NY: Pearson.
Tahir, F. M., Nasri, N. M., & Halim, L. (2020). The effectiveness of predict-observe-explain-animation (poe-a) strategy to
overcome students’ misconceptions about electric circuits concepts. Learning Science and Mathematics Journal, 15,
1-15.
Tarhan, L., & Acar, B. (2007). Problem‐based learning in an eleventh grade chemistry class: ‘Factors affecting cell potential’.
Research in Science & Technological Education, 25(3), 351-369. https://doi.org/10.1080/02635140701535299
Torp, L., & Sage, S. (2002). Problems as possibilities: Problem-based learning for K–16 education (2nd edition). Alexandria,
Virginia USA: Association for Supervision and Curriculum Development.
Treagust, D. F. (1988). Development and use of diagnostic tests to evaluate students’ misconceptions in science.
International Journal of Science Education, 10(2), 159-169. https://doi.org/10.1080/0950069880100204
Türkoğuz, S., & Cin, M. (2013). Argümantasyona dayalı kavram karikatürü etkinliklerinin öğrencilerin kavramsal anlama
düzeylerine etkisi [Effects of argumentation based concept cartoon activities on students' conceptual understanding
levels]. Dokuz Eylül University the Journal of Buca Faculty of Education, 35, 155-173.
Uden, L., & Beaumont, C. (2006). Technology and problem-based learning. Hershey, PA: Information Science Publishing.
Ula, W. R. R., Supardi, K. I., & Sulhadi, S. (2018). The implementation of problem based learning with mind mapping to
improve the student’s understanding of concept. Journal of Primary Education, 7(2), 163-171.
https://doi.org/10.15294/JPE.V7I2.23089
Venville, G. J., & Dawson, V. M. (2010). The impact of a classroom intervention on grade 10 students' argumentation skills,
informal reasoning, and conceptual understanding of science. Journal of Research in Science Teaching, 47(8), 952-
977. https://doi.org/10.1002/tea.20358
Villarino, G. N. B. (2018). Students’ alternative conceptions and patterns of understanding on electric circuits. International
Journal of Innovation in Science and Mathematics Education, 26(4), 49-70.
Wardani, S., Nurhayati, S., & Hardiyanti, P. C. (2017). The effectiveness of problem based learning model to improve
conceptual understanding and intrapersonal skill. International Journal of Science and Research, 6(5), 1576-1580.
West, S. G., Biesanz, J. C., & Pitts, S. C. (2000). Casual inference and generalization in field settings: Experimental and
quasi-experimental designs. In H. T. Reis, & C. M. Judd (Eds.), Handbook of research methods in social and
personality psychology (2nd edition) (pp. 40-84). Cambridge, UK: Cambridge University Press.
Widarti, H. R., Permanasari, A., & Mulyani, S. (2017). Undergraduate students’ misconception on acid-base and
argentometric titrations: A challenge to implement multiple representation learning model with cognitive dissonance
strategy. International Journal of Education (IJE), 9(2), 105-112. https://doi.org/10.17509/ije.v9i2.5464

IOJPE
ISSN: 1300 – 915X
www.iojpe.org
International Online Journal of Primary Education 2021, volume 10, issue 1
Copyright © International Online Journal of Primary Education 72
Widodo, W., Rosdiana, L., Fauziah, A. M., & Suryanti (2018). Revealing student’s multiple-misconception on electric
circuits. Journal of Physics: Conference Series, 1108. https://doi.org/10.1088/1742-6596/1108/1/012088
Wild, T. A., Hilson, M. P., & Hobson, S. M. (2013). The conceptual understanding of sound by students with visual
impairments. Journal of Visual Impairment & Blindness, 107(2), 107-116.
https://doi.org/10.1177/0145482X1310700204
Wood, D. F. (2003). ABC of learning and teaching in medicine-Problem based learning. BMJ, 328-330.
https://doi.org/10.1136/bmj.326.7384.328
Zacharia, Z. C., & de Jong, T. (2014). The effects on students’ conceptual understanding of electric circuits of introducing
virtual manipulatives within a physical manipulatives-oriented curriculum. Cognition and Instruction, 32(2), 101-
158. https://doi.org/10.1080/07370008.2014.887083
Zahro, R., Jumadi, Wilujeng, I., & Kuswanto, H. (2019). The effect of web-assisted problem based learning model on physics
conceptual understanding of 10th grade students. Journal of Physics: Conference Series, 1233.
https://doi.org/10.1088/1742-6596/1233/1/012058
Zhiqing, Z. (2015). Assimilation, accommodation, and equilibration: A schema-based perspective on translation as process
and as product. International Forum of Teaching and Studies, 11(1-2), 84-89.

IOJPE
ISSN: 1300 – 915X
www.iojpe.org
International Online Journal of Primary Education 2021, volume 10, issue 1
Copyright © International Online Journal of Primary Education 73
TEACHERS’ EXPERIENCES WITH OVERCROWDED CLASSROOMS
IN A BASIC SCHOOL IN GHANA
Joycelyn Adwoa OSAI
Mallam MA 2 Basic School, Mallam, Accra, Ghana
ORCID: https://orcid.org/0000-0003-0523-2102
Kwaku Darko AMPONSAH
PhD., Department of Teacher Education, University of Ghana, Legon, Accra, Ghana
ORCID: https://orcid.org/0000-0002-7824-6516
Ernest AMPADU
Associate Professor, KTH Royal Institute of Technology, Stockholm, Sweden
ORCID: https://orcid.org/0000-0001-8165-4126
Priscilla COMMEY-MINTAH
PhD., Department of Teacher Education, University of Ghana, Legon, Accra, Ghana
ORCID: https://orcid.org/0000-0002-6575-4335
Received: February 15, 2021 Accepted: April 11, 2021 Published: June 30, 2021
Suggested Citation:
Osai, J. A., Amponsah, K. D., Ampadu, E., & Commey-Mintah, P. (2021). Teachers’ experiences with overcrowded
classrooms in a basic school in Ghana. International Online Journal of Primary Education (IOJPE), 10(1), 73-88.
This is an open access article under the CC BY 4.0 license.
Abstract
This research sought to investigate teachers’ experiences with overcrowded classrooms: the case of new Gbawe
experimental 1 basic school in Ghana's Greater Accra region. The study explicitly followed a qualitative approach to
research specifically a case study design. Unstructured questionnaires and Teacher observations were utilised in the process
of generating the data. This investigation’s general results indicate that educators’ perceptions with overcrowded classrooms
are ‘stressful’. Similarly, teachers described some situations in an overcrowded classroom which they defined as stressful.
Some of the descriptions given by educators include insufficient learning environments, safety and health concerns, limited
contact between pupils and educators, disruptive behaviour, emotional and mental challenges for educators, increased
workload and insufficient time in the classroom. In addition, the factors contributing to traumatic experiences include lack of
administrative support, lack of policy enforcement, insufficient teacher preparation and professional development and lack of
teaching material for learning. Educators, however, suggested that they still had recourse to improvisation to allow them to
handle overcrowded classrooms. Working on teacher best practices in overcrowded classrooms was suggested to be helpful
in helping teachers who find themselves in such circumstances.
Keywords: Class size, classroom discipline, classroom management techniques, overcrowded classroom, public basic school
teachers’ experiences.
INTRODUCTION
Globally, all countries both developed and developing, including Ghana, experience a fundamental
challenge in education and training institutions when it comes to providing all school-going children
with a satisfactory basic education. This is as a result of the unprecedented increase in enrolment in
schools worldwide (Hachem & Mayor, 2019). Despite the significant steps accomplished especially in
access to basic education, momentous difficulties remain, particularly in developing countries. Some
of the difficulties include the issue of improving quality and expanding learning accomplishment.
Accordingly, Ahmed and Arends-Kuenning (2003) posited that essentially, education is a foundation
for monetary development and advancement attributable to the colossal extension in the number of

IOJPE
ISSN: 1300 – 915X
www.iojpe.org
International Online Journal of Primary Education 2021, volume 10, issue 1
Copyright © International Online Journal of Primary Education 74
applications for its products and services around the world. Subsequently, student enrolment is on the
increase thereby driving the global community, governments, and administrators of the education
system to deal with the huge enrolment numbers without trading off quality. "Education is the wise,
hopeful and respectful cultivation of learning undertaken in the belief that all should have the chance
to share in life" (Smith, 2020: p.1). This implies that education requires a conviction that everybody
holds in life and a vision of what will make people happy and prosperous.
This is in accordance with the desire or disposition of others (fear of respect, knowledge, and
prudence) and collaboration (relationship with others in establishing relations and learning
environments) with others. In conclusion, it is the issue of customary practice or behaviour that leads
to a committed and responsible action (Carr & Kemmis, 1986; Grundy, 1987). The classroom as a
unit of the school executes its role as part of the learning process. Correspondingly, a classroom, a
room where children, as well as adults, learn (Moreno, Cavazotte, & Dutra, 2020), is also a study
area. Classrooms can take place in all kinds of educational establishments, from preschools to
universities or elsewhere, such as in religious and humanitarian institutions, for example.
Overcrowding in classrooms is an international issue that hinders an efficient teaching and learning
process (Hachem & Mayor, 2019). One of the most pressing issues facing educators in the United
States today is overcrowding (Hachem & Mayor, 2019). The question is a combination of population
growth, the lack of educators, and a reduction in grants or support that has increased class size
(Hachem & Mayor, 2019). There are about 17,400 schools that are overcrowded in the USA (Hachem
& Mayor, 2019). Class sizes would be set in an ideal world for 15-20 students. Sadly, many
classrooms now surpass 30 students on a daily basis, and even in some cases, schools have more than
40 learners in one class. Likewise, the only EU nation with overcrowded primary classes is the United
Kingdom. In Ireland, two out of three primary pupils are also in above-average classes of 25 or more,
second only to the UK in Europe (Donnelly, 2019). There were also more than 30 pupils per class in
China. Among primary school and lower secondary education, the number of students per class
appears to increase. A 2015 provincial survey found that in Shandong, more than 40 percent of classes
in primary and middle schools were over-sized. Ten per cent had a class size of more than 666 per
cent (China Xinhua, 2016). The average class size is more than 100 at a middle school in Zhoukou
District, in China's most populated Henan province (China Xinhua, 2016). In China, education
officials describe classes of "normal" size as those with up to 45 learners. Classes with more than 55
pupils are called "large" and "super-large" are those with more than 65. But in 15 Chinese provinces,
the average for junior high schools reaches 45, and in two provinces, it is more than 55 (China
Leiyang, 2018).
The problem of overcrowded classrooms in most African countries is no different. Overcrowded
classrooms have been reported in some countries in Africa. Nigeria, Kenya, South Africa have all
admitted congestions that are overly above the UN acceptable ratio (Motshekga, 2012; Mutisya, 2020;
Onwu & Stoffels, 2005). The learner teacher ratio (LTR) (Motshekga, 2012; UNESCO Institute of
Statistics, 2008) for primary education is 40:1. Pupil teacher ratio (PTR) is, however, troubling in the
majority of developed countries. It was calculated by UNESCO (2008) that more than 84% of the
classrooms had more than 40 learners. However, Sub-Saharan Africa and Asia, form the majority of
countries with PTR over 40:1. Although Ghana was at 27.25 pupil-teacher ratio in primary schools in
2018 (UNESCO Institute of Statistics, 2020), Ghana has many more schools that are associated with a
large number of pupils at the same age. Nevertheless, there have been major regional variations in
national pupil-classroom ratio (PCR). According to the Ministry for Education, Ghana (2018), the
PCR of public elementary schools is 55:1 for kindergarten, 38:1 for primary school, and 35:1 for
junior high school (JHS).
Therefore, overcrowded classrooms disrupt teaching effectively as most teachers experience teaching
difficulties, discipline, physical, and appraisal problems (Iqbal &, Khan 2012). Regrettably, teachers
in public schools are still facing severe problems with congested classrooms (Amarat, 2011).
Consequently, Oliver (2006) argues that overcrowded classrooms lead to frustration when learners

IOJPE
ISSN: 1300 – 915X
www.iojpe.org
International Online Journal of Primary Education 2021, volume 10, issue 1
Copyright © International Online Journal of Primary Education 75
withdraw, become frustrated, and exhibit negative attitudes. Consequently, overcrowded schools have
negatively affected the self-confidence of teachers and their professional satisfaction, creating a
situation in the classroom whereby educators encounter countless difficulties (Fin, 2003). Learners
learn at different levels and, because of a learning barrier, some learners might need individual
attention. In Ghana, the School Feeding Scheme, the provision of free school uniforms and
workbooks, and the “FREE, Compulsory Universal Basic Education” (FCUBE), are some recent
policies introduced in the education sector (Kweitsu, 2019). From 1996-2005, the FCUBE presented
an action plan to close the gender gap in primary schools, to strengthen education and the living
situation of teachers (Thompson & Casely-Hayford 2014). Ghana thus scored 1 for both elementary
school and high school levels in 2013 on the UNESCO Gender Parity Index (GPI) (World Bank,
2013). These policies have led to an increase in the number of students in classrooms, given the lack
of appropriate school facilities (Kweitsu, 2019).
Given the strides that Ghana has made in enhancing access for all to education, obstacles remain that
prevent the acquisition of knowledge in quality learning by thousands of children (Kweitsu, 2019).
Normally, since schools are overpopulated, the school environment is not ideal for learning. In
consequence, the low standard of education is reflected in the academic performance of the students
(Shah & InamuIlah, 2012). Due in part to numerous initiatives aimed at enrolling more students, some
schools in the Accra Metropolis, including New Gbawe Experimental 1 Basic School, has been
overcrowded during the course of time.
When the researcher examined and witnessed students studying, and teaching at New Gbawe
Experimental 1 Basic School, the researcher confirmed the condition of overly crowded classrooms.
The investigator noted that students sat in threes or fours on benches supposed to be occupied by two
students, obstructing the movement of teachers and students alike, in the classroom, causing
discomfort among students, and requiring exceptional tactics. Correspondingly, in the New Gbawe
Experimental 1 Basic School, the average pupil-teacher ratio is 72. It is almost twice as much as the
Ghana Education Service’s standard pupil-teacher ratio of 38 (Ministry of Education, MOE, 2018).
According to Freiberg (2013), classroom management plays a significant role in student success in a
chaotic and badly controlled classroom. The classes are usually crowded and students have little space
to navigate. Accordingly, Marzano and Marzano (2003) described aspects of the management of
classrooms, including the creation of a place for successful class management (Saifi, Hussain,
Salamat, & Bakht, 2018). Marzano and Marzano noted that the management of the classroom will
involve a teacher, who will ensure that the students will have a sense of what they need to do within a
given time span. A second approach would be to reorganise the seats to allow all students to
participate equally in their learning experience.
Behaviourism is used in many class management investigations, where the teachers manage the
atmosphere in the classroom for the students to understudy them (Edwards & Watts, 2010; Freiberg,
2013; Saifi, Hussain, Salamat, & Bakht, 2018). Particularly, the use of desks, lamps, ventilation, and
the proper use of blackboard, as techniques for the management of classrooms, is continuously
defined by teachers. In huge classrooms, educators often use various approaches such as the
establishment of positive relationships with students; the arrangement of their instruction to improve
access to learning for students; and the promotion of students' participation in academic activities
using social management techniques. The rest are promotion of learners' communal abilities and
trying to control one's actions, feelings and thinking in the pursuit of long-term objectives; and usage
of suitable interdisciplinary approaches to support learners experiencing reactions to the social
stimulation difficulties.
Nevertheless, the organisation of large and smaller classrooms is differentiated (Asodike & Onyeike,
2016). Consequently, stratagems in smaller classrooms cannot easily be translated into those with
large classes. For starters, the consideration of seating arrangements because of space is useless in a
large classroom. Also, the standard of the teacher and his connection with students is a fundamental

IOJPE
ISSN: 1300 – 915X
www.iojpe.org
International Online Journal of Primary Education 2021, volume 10, issue 1
Copyright © International Online Journal of Primary Education 76
element of all other class management aspects in large classrooms. Adeyemi (2008) opined that the
average number of learners in a class is reported in class size or in the number of students taught by a
teacher in a single classroom. Kedney (2013), however, found that class size is a method for
evaluating the educational system’s success as the bigger the class size the less efficient is the
instruction. An alternative opinion is held by Stepaniuk (1997) that educators’ organisation could
define the triumph or the non-fulfilment in instruction and learning and not the quality utilisation of
the classroom even though that may depend upon class space and size. It is significant in instruction
and learning, not because of the size of the class, but rather how the teacher handles their classes in
terms of the classroom's size and capacity (Stepaniuk, 1997). Educators and learners alike would have
trouble moving about during learning, especially when there is a lack of space. Likewise, pupil-
teacher ratios (PTRs) and class size are dissimilar or inconsistent as opined by some investigators
(Harfitt, 2015; O’sullivan, 2006). Unlike PTR that is the overall student enrolment at one school
divided by administrators, counsellors, professional teachers, and other people supporting the school
and not just the number of teachers, class size is the average number of children for which the Teacher
is responsible. This thesis, therefore, examines the experiences of educators at the New Gbawe
Experimental 1 Basic School as a case study of overcrowded classrooms.
Statement of the Problem
Challenges with overcrowded classrooms have been reported all over the world. For instance,
overcrowding is one of the most significant concerns facing schools and teachers in the United States
today (Hachem & Mayor, 2019), the UK and Ireland (Donnelly, 2019), and China (China Xinhua,
2016: China Leiyang, 2018). Additionally, overcrowded classrooms are also found in some countries
in Africa such as Nigeria, Kenya, South Africa (Motshekga, 2012; Mutisya, 2020; Onwu & Stoffels,
2005). Ghana is also experiencing unprecedented levels of overcrowding as a result of the FCUBE
and school feeding programme (Kweitsu, 2019; Ministry for Education, Ghana, 2018). Teachers
around the world, like Ghana, have trouble managing overcrowded classrooms (UNESCO Institute
for Statistics, 2018). Although measures are put in place to reduce the overcrowding issue in schools,
they are not enforced and cause teachers a variety of problems. Teachers are faced with overcrowded
tasks, as they are responsible for instructing, learning and managing the classroom simultaneously.
There are schools in Ghana with many more learners in one classroom despite the fact that the
officially prescribed LTR for primary schools is 40:1 (Motshekga, 2012; UNESCO, Statistics
Institute, 2008). Relatively, this accounts for an overcrowded classroom, and that of New Gbawe
Experimental 1 Basic School with an LTR of 72 cannot be overemphasised.
LTR is directly related to the standard of schooling according to Lannoy and Hall (2010). Such
challenges have an immense effect on teachers as teaching and learning quality in overcrowded
setting decreases. Similarly, teachers find it very easy to get upset when they face challenges that
hinder them from producing educational results. In addition, there is a variety in every classroom
because the learners have specific needs and aspirations. Therefore, learners learn at various rates and
due to learning challenges they may meet, some learners may need individual attention. As part of its
pledge to Free and Compulsory Basic Education (Ghana Education Service, GES, 2014), Ghana's new
education programme provides two years of Kindergarten (KG) which brings it ahead of the curve
relative to other countries in sub-Saharan Africa. Ghana's education is “divided into three phases:
basic education (nursery, elementary, lower secondary), secondary education (high school, technical
and vocational education), and higher education (universities, polytechnics, and colleges)” (GES,
2014: p.2). Acknowledging the gains of the last two decades, Ghana has significantly higher efforts of
the government through the Ministry of Education and the Ghana Education Service, GES (2014) to
extend KG services equitably, particularly for its most marginalised and vulnerable children
(UNESCO, 2018). The Ministry of Education and Ghana Education Service have been steadily
working for universal access to basic education (UNESCO, 2018). The Inclusive Education Policy
Framework delivers opportunities for the students to obtain a quality education. Ghana's Inclusive
Education (IE) programme supersedes the concept of geographic location (UNESCO, 2020).

IOJPE
ISSN: 1300 – 915X
www.iojpe.org
International Online Journal of Primary Education 2021, volume 10, issue 1
Copyright © International Online Journal of Primary Education 77
However, the strategy acknowledges the varying learning needs of the students. Teachers cannot
enforce this in an overcrowded classroom.
There is no comprehensive literature regarding the disparity between the scholastic achievement of
the learners and the number of learners enrolled. Although some genuinely think that large classes are
detrimental to student accomplishment, (Cooper, Lindsay, & Nye, 2000), think alternatively.
UNESCO (2020) has expressed the view that although the number of classrooms built in different
parts of the country has not increased correspondingly, enrolment in all primary schools, especially
public schools, has doubled. Yelkpieri, Namale, Esia-Dankoh, and Ofosu-Dwamena (2012)
researched on overcrowded classrooms at University of Education, Winneba campus. Similarly,
Akoto-Baako (2018) also reported overcrowding in senior high school (SHS) in Cape Coast
Metropolis, Ghana. From the above it is realised that research on overcrowded classrooms have been
performed in some parts of Ghana and at certain levels of education but not in the current study area.
It is against this backdrop that the research is conducted to interrogate issues regarding overcrowding
in Gbawe Experimental 1 Basic School. Again, it will analyse the procedures that teachers utilise to
handle overcrowded classrooms, and recognise the obstacles that educators experience as they handle
overcrowded classrooms.
Theoretical Framework
School Improvement programme theory
Van Velzen, Miles, Elholm, Hameyer, and Robin (1985) described school improvement as "a
comprehensive, concerted initiative targeted at enhancing learning environment as well as other
relevant internal circumstances in one or more schools, with the overarching goals of attaining more
efficiently academic objectives." Consequently, Jansen (2001) observed that school improvements are
important for a school and an emphasis on results. With respect to congested schools, it's a concern
for many educators worldwide and the sooner the condition is addressed the faster. In fact, school
development plans are important to mitigate the issue for teachers and they help to reduce the
repetitive tension that teachers face in congested classrooms on a regular basis. As a consequence,
Creemers (2008) argues that a climate convenient for enhanced efficacy is perceived as important for
institutions trying to implement action since this would enable them to increase productivity. While
all factors relating to education are taken into account in the school improvement context, the study
may concentrate on how this idea and the others mentioned earlier may be connected to the
perceptions of educators to establish an initiative such that they will provide meaningful instructional
interactions in the classroom. Educators are seen as an integral lever of transformation, according to
Creemers (2008), so progress is visible in their classrooms and everyday activities. Furthermore,
Creemers (2008) discusses that proposals for school change should often concentrate on educators
who might want to enhance facets of their instruction and help to develop teaching skills. Teachers
will still need preparation and encouragement to empower them with the ability to cope with the
occurring challenges relative to consequences of the overcrowded classroom.
Figure 1. Efficient institutional amelioration related to congested classrooms (Creemers, 2008, p. 7).

IOJPE
ISSN: 1300 – 915X
www.iojpe.org
International Online Journal of Primary Education 2021, volume 10, issue 1
Copyright © International Online Journal of Primary Education 78
Creemers (2008) further suggests that attempts to change would not just change the perceptions of
teachers but also the teaching standard. In overcrowded classrooms, a study has demonstrated that
often teachers feel stressed and are not prepared with the expertise to cope with overcrowded
classrooms. There is a correlation between school reform and the perceptions of teachers as their
perspectives will contribute to initiatives and encourage schools to reconsider methods and adopt
initiatives to strengthen schools that help teachers in coping with overcrowded classrooms. Teachers
often manage overcrowded classes and are struggling with them. 'Institution Reform' is the only way
to make sense of how teachers treat overcrowded classes and work with them. This often causes less
tension for teachers as schools are changed, as they will manage more in the classroom. Congested
classes are not only a challenge but a means to build space for change and to reconsider strategies.
This model indicates that productive progress contributes to better performance in achieving
educational targets, according to Creemers (2008). It outlines the philosophy of school improvement
and shows the theoretical basis for the essential structures of school improvement. If we strengthen
the ability of teachers, it enhances learning and teaching and in essence, contributes to achieving the
objectives of education. The model for the efficient institutional reduction of stress in overcrowded
classrooms is shown in Figure 1.
The philosophy of school enhancement, which subsumes the constructivist theory, class management
theory, conventional classroom management theory, and child-centred classroom model, supports this
research. In this analysis, this theory will help to explain the data produced. The researcher considered
the school improvement theoretical concept as central to the study because it indicates that
instructional objectives are met through improvement and interaction.
Review of Related Literature
Empirical Review
The school atmosphere may have a beneficial effect on the wellbeing of the learning community or
can be a huge obstacle to learning. The school atmosphere inside the schools will impact multiple
places and individuals. A healthy school environment for example has been correlated with decreased
mental and emotional concerns for pupils. It is also assumed that constructive organisational
interactions and optional learning experiences will improve achievement behaviour for students in all
educational settings. The strong student-teacher partnership provides students with a positive and
welcoming school atmosphere to operate learning activities smoothly, resulting in successful
academic results.
The school climate and educational attainment of standard six students were investigated by Arul and
Vimala (2012). The input from 400 respondents in the study was used to assess the association
between the school atmosphere and educational attainment. The outcome of this analysis showed that
there is no substantial variation in gender and teaching methodology in the standard six learners’
school setting. But there is a major variation in the standard six pupils' education setting in terms of
the school's locality. There is a better school climate for urban learners than for rural pupils. In their
everyday lives, urban learners have a traumatic or stressful world quite mostly because they live in a
technological and fast-paced life. Thus, with their research, they found that the school atmosphere was
not quite comfortable.
Chepkonga (2017) indicated that the consistency of school amenities tends to have an indirect impact
on learning and instruction. This suggests that educational outcomes are dependent on, class size,
instructional methods, Teacher competence and abilities, instructional and learning atmosphere, and
subject matter, all affecting educational outcomes in both of these respects (Finn, Walton, & Elliott-
White, 2000). As stated by Shamaki (2015), the content of the learning atmosphere is closely
associated with the performance of the students in different subjects, so that literature surveyed from
different developing countries in Africa, notably from Mozambique, Uganda, Zimbabwe, and Nigeria,
revealed the connection between class size and learner success (Motshekga, 2012; Mutisya, 2020;
Onwu & Stoffels, 2005).

IOJPE
ISSN: 1300 – 915X
www.iojpe.org
International Online Journal of Primary Education 2021, volume 10, issue 1
Copyright © International Online Journal of Primary Education 79
According to Siperto (2017) in Mwanza, the overpopulated classrooms have been identified as
increasing and sustaining problems that obstruct successful teaching and learning operation.
According to Siperto, the proportion of learners she researched in the classes was too high for the
small space of the classroom to be accessible. Siperto found that in all the schools studied, the
teacher-student ratio ranged from 1:80-90. In such a scenario, educators were finding it impossible to
implement successful teaching methodology. The investigator also noticed that educators were
overwhelmed in such a way as not to be able to walk around a classroom.
Similarly, Mutisya (2020) published research in Kenya with the same experience as Siperto’s in
Mwanza. Free primary education in Kenya culminated in dangerously overpopulated classes in which
the learner-centred method was quite challenging for the educators to introduce. Mutisya complained
that although most of the classes were built to fit 45 students, the classrooms had between 80 and 90
students, beyond the number prescribed by the Ministry of Education. The consequence of this is that
during classroom interaction, it continues to hinder teacher-student and student-student engagement,
with detrimental effects on their academic success. Although Jason (2006) mentioned that large
classrooms are major pitfalls, including stressed interpersonal relationships between learners and
educators with a small variety of instructional techniques, teachers teaching a large class are
uncomfortable.
In addition, he noted that amid a contradictory definition among investigators about class size and
learners’ success, small class size retains an advantage on the level of results. It was noted that large-
scale instructional techniques have an influence on the efficacy of instructional practices. Similarly,
she observed that in a typical classroom where the teacher-centred approach is used, marked by a high
percentage of pupils with instructional practices, pupil innovation, and interest are therefore reduced.
Research Questions
This research aims to answer the following questions, in line with the objectives:
i. What experiences do teachers have with overcrowded classrooms?
ii. What challenges do teachers encounter as they manage classrooms that are overcrowded?
iii. What strategies do teachers use to manage overcrowded classrooms?
METHOD
Research Design
The appropriate research design that was employed for this study is the case study. It is the framework
that was created to seek answers to the research questions. The case study design subsequently
supported the investigator to gain detailed information from educators concerning their experiences in
congested classrooms (Burns & Grove, 2010) in New Gbawe Experimental 1 Basic School. As
previously mentioned, this investigation took the form of a case study. The purpose of the case study
is to understand the case in depth and in its natural environment, to understand its sophistication and
meaning (Punch, 2009). In addition, Neale, Thapa, and Boyce (2006) postulated that a case study
offers the story behind the result by documenting what happened to bring about a scenario. Neale et
al. (2006) propose that case studies are necessary when there are special or interesting stories to be
told. Case studies offer even more comprehensive information (Neale et al., 2006).This is also
confirmed by Lee and Brennenstuhl (2010), who argue that an in-depth overview, discovery, or
interpretation of a study is given by a case study.
In addition, the main principle of a case study is that it is necessary to discuss the 'how' and 'why'
questions with the respondents (Lincoln, 2010). Consequently, the case study design supported the
investigator to collect in-depth educator knowledge and how the public school faced
congested classrooms. The data generation tools used enables the investigator to raise and explore
questions about how and why. This was significant because it offered educators with a chance to
offer in-depth information about their overpopulated classroom encounters. Additionally, Creswell

IOJPE
ISSN: 1300 – 915X
www.iojpe.org
International Online Journal of Primary Education 2021, volume 10, issue 1
Copyright © International Online Journal of Primary Education 80
(2013) argued that a case study is related to offering a detailed overview of the circumstances
involving persons, incidents and how their relationship with their setting is influenced in the research
project. Cohen, Manion, and Morrison (2011) postulate in the same vein that case studies are very
descriptive. The investigator selected a case study for this study to investigate a particular community
of educators within a specific school to investigate their perceptions of overcrowded classrooms.
Population
The population for the study was centred on the teaching staff of New Gbawe Experimental 1 Basic
School. It is located in the Weija Gbawe District of the Greater Accra Region. The school has 11
classrooms with staff strength of 14. New Gbawe Experimental 1 Basic School was preferred due to
the surge in enrolment in every classroom in the school, which exceeds the pupil to teacher ratio of
35:1 as indicated by Ghana Education Service (MOE, 2018).
Sample and Sampling Techniques
Five participants were selected for the study based on the highest-class enrolment. The class teachers
for the following classes, 2, 3, 4, 5, and 6, were used in this study. The study adopted both purposive
sampling and convenience sampling for the investigation.
Purposive Sampling
Purposeful sampling means that respondents with certain features or characteristics are tested by the
investigator (Koerber & McMichael, 2008). In this research, only those educators who work in a
school with congested classrooms were chosen. Intentional sampling is synonymous with qualitative
inquiry, Palys (2008) suggests. In order to obtain in-depth data on their encounters in these
classrooms, educators who have overpopulated classrooms were selected. Creswell (2013) has
suggested that the investigator must acknowledge the objectives of the study when choosing a
sampling procedure.
Based on the objective of this study, the respondents were selected to participate in the
research. Palys (2008) states that what exactly they want to achieve is the main question any
investigator requires to ask themselves. The investigator decided to illustrate and identify the
experiences educators have in a congested classroom in this report. The purposive sampling
methodology was suitable as it matched the purpose of this study's investigative goals.
Convenience Sampling
The convenience sampling is described by Farrokhi and Mahmoudi-Hamidabad (2012) as comprising
respondents who are easily accessible to contact. While this concept stresses easily accessible, certain
convenience samples are more widely available than others, as per Koerber and McMichael (2008),
but although a study is convenient, certain work would definitely be required in accessing respondents
from that study. This sampling approach was used because respondents from the Municipality of the
Investigator were chosen and were readily available and easy to collect information from.
The Sample
Three classrooms with the largest number of learners were used for observation although there were
five respondents in this research. The following is included in the sample: educators with the largest
number of students were selected for the research investigation; schoolrooms with the largest
admission in the whole school were selected; and although three classes were observed, all five
educators took part responding to the questions. The sample is presented in Table 1.
Table 1. Profile of educators who participated in the investigation
Teachers’
Name
Gender Age Class Class
Size
Highest
Qualification
Teaching
Experience
Years spent in the
research school
Teacher A Female 44 2 68 B.Ed. 20 9
Teacher B Female 34 3 62 B.Ed. 12 4
Teacher C Female 38 4 80 B.Ed. 14 3
Teacher D Female 47 5 74 B.Ed. 17 10
Teacher E Female 36 6 68 B.Ed. 10 4

IOJPE
ISSN: 1300 – 915X
www.iojpe.org
International Online Journal of Primary Education 2021, volume 10, issue 1
Copyright © International Online Journal of Primary Education 81
These educators in the New Gbawe Experimental 1 Basic School assisted the investigator with
invaluable data about their perceptions of overpopulated classrooms at the public school.
Methods of Data Generation
In view of the qualitative aspect of this investigation, the investigator selected unstructured
questionnaire and observation as data generation approaches. According to Adejimi, Oyediran and
Ogunsanmi (2010), data generation is a very critical step in any investigative process, and
investigation includes the identification of relevant data. According to Kothari (2004), all
investigation involves the generation of suitable information. This information is invaluable since the
outcomes of the research are decided by the knowledge that is produced. The investigator is
responsible for choosing data collection methods that they believe can provide them with rich and
suitable data to answer the research questions. The investigator selected unstructured questionnaire
and observation as approaches of data generation for this qualitative study.
Unstructured Questionnaire
An unstructured questionnaire was utilised in this investigation as the main instrument for generating
data. Fife Schwa (2001) noted that a questionnaire is the single most common research tool used
owing to its simplicity and usability. Adejimi et al. (2010) argue that by adding more open-ended
questions, it is possible to structure a questionnaire to add further value.
An unstructured questionnaire poses open-ended questions, according to Cohen et al. (2011).
Wilkinson and Birmingham (2003) argue that open-ended questionnaires do not place any constraints
and encourage the participant to answer any question. This form of a questionnaire was chosen
because, without any limitations, the investigator wanted participants to openly share their encounters.
It also gave participants enough time to think about their answers and complete their questionnaire
and submit it on completion to the investigator. This questionnaire was structured with several
questions as this would allow one to extract rich insightful details about the perspectives of educators
in overpopulated classrooms with various how and why. It is also very easy to utilise investigation
tool and encourages you to ask as many questions as you can. Personal views, opinions, feelings, and
experiences were created by the questionnaire.
Observations
According to Crossman (2019), and Simpson and Tuson (2005), observation takes note of behaviours,
actions, situations, artefacts, and habits of people. Cohen et al. (2011) noted that it allows the
researcher the opportunity to collect 'live' information from naturally occurring social contexts. The
method of observation was chosen as one of the data collection methods because it allowed the
researcher to observe educators teaching in overcrowded classrooms. Simpson and Tuson suggest that
what should be looked at and is grouped into categories is defined by an observation plan. There was
the highest degree of enrolment in the school in the classrooms chosen to observe. The study assumed
that it was important to observe and integrate these classrooms so that the researchers could also have
first-hand knowledge of what is happening.
The researcher was a non-participatory observer and tried to remain as inconspicuous as possible. A
colleague helped with the recording of the observation in order to compare notes. As what was
happening in a natural environment was registered, this allowed the researcher to gather rich
information. Cohen et al. (2011) argue that observations are powerful methods to gain insight into
conditions. This data collection technique was ideal because it allowed the researcher to examine first-
hand what was going on in overcrowded classrooms.
Data Analysis
The analysis of the data was carried out using a thematic analysis approach. The thematic analysis is a
tool for defining, analysing, and reporting trends (themes) within the data, according to Braun and
Clarke (2006). A theme captures something meaningful about the research questions' information and
expresses some degree of patterned response or context inside the data (Braun & Clarke, 2006). Braun
and Clarke (2006: p.79) also note that there are "six thematic analytical phases that include:
IOJPE
ISSN: 1300 – 915X
www.iojpe.org
International Online Journal of Primary Education 2021, volume 10, issue 1
Copyright © International Online Journal of Primary Education 82
Data familiarisation: This includes transcribing the content, reading, and re-reading the data
and noting initial ideas. The researcher transcribed the content by reading and re-reading the
data and taking note of the initial concepts.
Generating initial codes: This refers to the quest for interesting patterns or features in the data
collected. The investigator looked for interesting patterns in the data collected.
Checking for themes: the compilation of codes into potential themes and the compilation of
all relevant details for each potential theme. The researcher checked by creating codes into
potential themes and compiling all the significant details for each potential theme.
Reviewing themes: Check if the themes work on the coded extracts and the whole data
collected. In reviewing the themes, the researcher compared the coded extracts with the
themes by considering all the data collected.
Defining and naming the themes: For each theme, simple meanings and names. The
researcher provided simple and names for each theme to refine the data.
Producing the report: making the investigation a scholarly document by writing up.” Finally,
the investigator wrote up the report based on the information generated through the thematic
process.
The material was read carefully and extensively for this study and then transcribed and analysed. The
investigator searched for trends in the data as the data was coded and put them into various categories.
The investigator then grouped similar categories and placed them under three specified themes. In
order to ensure a rich explanation of the data, the thematic analysis was selected as it offers a rich
thematic explanation of the entire data collection so that the reader gets a sense of the prevalent and
significant theme (Braun & Clarke, 2006).
RESULTS
RQ1: Educators encounter “stress” in congested classrooms
Research question one investigated the experiences teachers have with overcrowded classrooms. The
findings from this research suggest that teachers' encounters with congested classrooms are
overwhelming. Teachers themselves have described such situations in an overcrowded classroom
which are stressful (Mutisya, 2020; Muthusamy, 2015; Shah, & Inamullah, 2012; Yelkpieri, Namale,
Esia-Dankoh, & Ofosu-Dwamena, 2012). Such conditions were insufficient classroom space, safety
and health issues, limited contact between learners and teachers, destructive conduct, mental and
psychological challenges encountered by educators, elevated responsibilities, and limited time
(Asadullah, 2005; Muthusamy, 2015; Shah, & Inamullah, 2012). Some of the opinions expressed by
the teachers are as follows:
"One classroom has too many kids. The classroom is inadequate for student numbers in the
classroom. It minimises movement." "There's little room for students to sit down, 4 learners
are required to share, instead of 2 per seat.” "Sixty-four students in a summer class are a
nightmare. Fans don't work. Learners are nervous, very restless, and not centred." "Because
the classrooms lack space, they become extremely hot and uncomfortable to become impatient
learners.” "I do most of the talk, essentially. Sometimes the learners do not answer questions.
It's hard to pay attention individually.” "To involve the learners in the lesson is hard. It's
loud, and you can't pay attention individually.” "Personally, I have issues with the discipline.
The learners are particularly too noisy when there's a feature that kids get into a frenzy." “Learners suffer a lot over trivial issues such as fighting one another for losing their
possessions as their belongings have no location to be kept. And I do settle inconsequential
issues that can trigger severe disciplinary concerns. That takes time away from teaching.” "I
can't deal with it at all. I am constantly nervous. I am still depressed and I sob.” “I am really
angry, and the despondent learners are behaving poorly, and they don't matter. I am also

IOJPE
ISSN: 1300 – 915X
www.iojpe.org
International Online Journal of Primary Education 2021, volume 10, issue 1
Copyright © International Online Journal of Primary Education 83
depressed because my Headteacher does not support me." "Since it is difficult to mark at
school, I take marking at home. This removes me since personal time. My daughter laments I
ignore her. Often I disregard her need to get my job done and that creates trouble." "I find
myself solving minor discipline problems and that takes time off teaching. I always take the
marking at home as there is not enough time to mark the work of the learners.”
From the sampled opinions of the teachers, it is realised that in the school, teachers do not have
adequate room so the tables and chairs are cramped and the students become very irritated (Asadullah,
2005). There is no wandering around the classroom for students as the mobility is very minimal.
Health and safety problems have been reported as a result of room limitations. Interacting with
learners is very difficult for the Teacher since these circumstances limit contact. As a consequence of
the limited student-Teacher involvement that led them to indulge in destructive actions, pupils felt
inferior. Educators also feel very nervous and stressed in a congested classroom, causing them to
develop social and emotional difficulties (Mutisya, 2020; Shah, & Inamullah, 2012). Similarly,
because of the increasing number of students in the school, the teachers' workload tends to be quite
high. Educators' responses suggested that they did most of their school work, such as teaching and
teaching-learning materials (TLMs) preparation and marking at home. They stated that such patterns
have an effect on their personal and family lives, depriving their families of quality time. The
educators argued that the process of teaching and learning is often disrupted constantly while they
waste time settling disputes instead of teaching. From the above, the enumerated situations
encountered by educators indicate that the interactions of teachers in congested classrooms are
'stressful' and can impair their classroom effectiveness.
RQ2: Various and nuanced factors leading to stressful interactions for educators
Research question two interrogated issues regarding the challenges teachers encounter as they manage
classrooms that are overcrowded. Sampled comments made by the teachers are as follows:
"Sometimes I'm not inspired and I don't know how to manage those problems and no-one
wants to help. And I just find out what to do on my own.” "The number of learners exceeds
that prescribed by the Ghana education service." "The number of learners at the school is
more than 50 learners in a single classroom.” "The lessons cannot be thrilling because the
classrooms are so overcrowded and the facilities are not enough that you completely lose
hope." "We share what we have with the learners. There are inadequate resources and
insufficient funds to provide services because school fees are a major issue.” "Practical
sessions are too complex to carry out. There are inadequate resources for making lessons
interesting and exciting. I don't have enough teaching-learning materials. It's hard but I'm
improvising.”
Teacher comments and our observation suggest that stressful experiences with congested classes, such
as those identified in the New Gbawe Experimental 1 Basic School, are frequent and complicated.
Career development and shortage of resources, policy compliance (Muthusamy, 2015), teacher
readiness, and lack of institutional help are some of the reasons that are creating challenging
circumstances for educators (Onwu & Stoffels, 2005). The direction or assistance offered by the
school management, in particular, the head teacher is insufficient. The results have suggested that
New Gbawe Experimental 1 Basic School is not following the policies as required by law. Secondly,
any classroom enrolment exceeds what the policy states. The learner-teacher ratio is 35:1 according to
the Ministry for Education, Ghana (2018). However, enrolment in the New Gbawe Experimental 1
Basic School is higher than the learner-teacher ratio of 35:1, suggesting at this stage the policy is not
being implemented. Unfortunately, teachers may not have the expertise to contend with overcrowded
classrooms, and their capacity to cope with this has been compromised (Mweru, 2010). At New
Gbawe Experimental 1 Basic School shortage of funding was a big problem and this influenced
teaching and learning. Teachers suggested that, due to lack of resources, the lessons cannot be
informative and exciting. Both of the above factors are contributing to traumatic teachers' experiences.

IOJPE
ISSN: 1300 – 915X
www.iojpe.org
International Online Journal of Primary Education 2021, volume 10, issue 1
Copyright © International Online Journal of Primary Education 84
RQ3: Perspectives of educators handling congested classrooms
In research question three, we investigated the strategies teachers use to manage overcrowded
classrooms. Sampled comments made by the teachers are as follows:
"There are social exercises conducted outside to reduce movement and noise. I take one step
at a time to ensure all prescribed work is complete. I like to scream a lot. I reward them with
candy, occasionally. Nobody talks except for putting their hand up.” “Group work is an
efficient way for learners to provide guidance and test work. Consolidating and testing work
in groups is easier for me.” “I am basically struggling with problems to keep things from
worsening. I try to hold the students engaged constructively from the beginning of the lesson
till the end so that they do not get impatient, and mess with other learners. I plan lessons that
make it interesting.” “I lay down simple guidelines for handling classrooms. I don't neglect
lesser discipline problems as they save me time to solve a small issue, then bigger ones. I do
the training without interrupting the lesson. I offer rules and bonuses for good behaviour.” “I'm using corporal punishment and I'm giving students tons of notes to copy and write and
they're occupied but they're always crying and yelling and behaving like your invisible.” “I
am trying to keep an optimistic and relaxed outlook and I am trying to find answers to
problems. I know the learners are victims. They have no alternative in terms of what school
will they go to.”
We found that though educators' encounters with congested classrooms are daunting, the problem is
often addressed by them (Yelkpieri, Namale, Esia-Dankoh, & Ofosu-Dwamena, 2012). Educators
normally rally their resources to enable them to control overcrowded classrooms (Muthusamy, 2015).
Correspondingly, in order to actively involve learners in their lessons and enhance learner
achievement, educators designed cooperative learning activities. Similarly, the teachers used
incentives to encourage positive learner behaviour. Additionally, educators suggested specific rules
and guidelines should be set. Although some teachers were reported to use innovative methods to
handle overcrowded classes, there were others who used offensive tactics such as insulting, yelling,
and corporal punishment (Muthusamy, 2015). Findings from this study revealed that despite the
challenges in overcrowded classrooms encountered by educators in New Gbawe Experimental 1 Basic
School, they are still keen on working hard within the constraints of inadequate resources and the
huge student numbers, suggesting that they have the best interest of the learners.
DISCUSSION and CONCLUSION
Discussion
The results of the study have shown that there are a multitude of difficulties for educators to face in
congested classrooms. The results also suggest that the 'no effort' and often challenging methods used
by educators have shown the Teacher's role in managing congested classrooms and transforming their
schools and classrooms as agents of change (Donnelly, 2019; Fatima, Mushatq, & Fatima, 2019;
Hachem & Mayor, 2019; Khanare, 2009; Marais, 2016; Muthusamy, 2015). The value of the school
reform system driving this research highlights facets of how even the smallest interventions can be
nurtured in the psycho-social well-being of children (Donald & Lolwana, 2006; Donnelly, 2019;
Hachem & Mayor, 2019; Marais, 2016; Muthusamy, 2015). Thus, the researcher suggested in the
results as to why the teachers are getting the experiences they do. The teachers still do this given the
pressures of running overcrowded classrooms. Some teachers had shared optimism and positivity
anyway. This research focused on the theoretical structure for school improvement and is perfect,
because teachers are already familiar with and dealing with congested classrooms as they have a sense
of school improvement and coping strategies. Thus, according to Creemers (2008), educators are seen
as an important tool for progress, as transformation is evident in their classrooms and day-to-day
activities, but effective school initiatives are still needed to bring about change. The emphasis was on
educator interactions with congested classrooms, and why they have the experience they have, and
what management techniques they use to deal with congested classroom challenges.

IOJPE
ISSN: 1300 – 915X
www.iojpe.org
International Online Journal of Primary Education 2021, volume 10, issue 1
Copyright © International Online Journal of Primary Education 85
Conclusions
Teachers’ overcrowded classroom experiences are “stressful.” There are causative factors leading to
traumatic situations for teachers but they often handle the overcrowded situation with tactfulness. As
improvement is the main factor to bring about intervention, it is expedient that the problem is
actionised in order to mitigate it. This will enhance the experience of teaching and learning for both
teachers and learners. In order to cope with overcrowded classrooms in traditional schools, there are a
number of approaches that schools may use to increase teacher ability and school performance as
revealed in this research. From this study, we observed that teachers used different approaches to
enable them overcome overcrowding in their classrooms. Some of the approaches mentioned include
the following. Some teachers use group work in a flexible way to ensure that different ability groups
are taken care of while helping to overcome overcrowding as well. Others used improvisation to
improvise materials to stimulate and maintain the confidence and excitement of students (Marais,
2016; Muthusamy, 2015; West & Meler, 2020). One aspect that the researchers were not enthiused
about was the use of corporal punishment. It is also not advisable for some teachers to keep the lesson
too long in an overcrowded classroom. Keeping the lesson short is very helpful so that teachers can
devote as much time as possible to working with a variety of groups. Keeping learners busy right fom
the start of a lesson is very crucial in successful overcrowded clasrroom management. As a result, it's
important that the teacher keeps the entire class occupied as much as possible. Thua, at the beginning
of each period, get the students to work straight away (Kriegel, n.d.; West & Meler, 2020 ).
Recommendations
It is believed that when the required action is taken, schools experiencing overcrowding across the
country can be improved. The research can be broadened to a number of schools from other
backgrounds such as semi-urban and rural areas to get a clearer picture of the nature of
congested classrooms. It is suggested that research involving other respondents like pupils
using a variety of pedagogic approaches would be fascinating such as art-based approaches to
make the learners' voices heard in their classrooms over-crowded. It is recommended that the
Ghana education service takes a critical look of these behaviour that is exhited by some
teachers in overcrowded classrooms.
Limitations of the Research
This study was conducted in an overcrowded urban school where all the teachers observed and
interviewed were females. It would have been helpful if some of the teachers were males so that their
divergent views could have been compared. Also overcrowded classrooms in semi-urban and rural
areas could have also been considered to compare how teachers and learners will fare in these
locations. It is suggested that further research be undertaken by including the aforementioned
variables.
Acknowledgment
We wish to acknowledge the teachers used in this study for making themselves available and also
allowing us to observe their classroom practice.
REFERENCES
Adejimi, A., Oyediran, O. S., & Ogunsanmi, E. B. (2010). Employing qualitatively enriched semi structured questionnaire
in evaluating ICT impact on Nigerian ‘construction chain integration’. The Built & Human Environment Review,
3(1), 49-62.
Adeyemi, B. A. (2008). Effects of cooperative learning and problem-solving strategies on junior secondary school students’
achievement in social studies. Electronic Journal of Research in Educational Psychology, 6(3), 691-708.
Ahmed, A. U., & Arends-Kuenning, M. (2006). Do crowded classrooms crowd out learning? Evidence from the food for
education program in Bangladesh. World Development, 34, 665–684.

IOJPE
ISSN: 1300 – 915X
www.iojpe.org
International Online Journal of Primary Education 2021, volume 10, issue 1
Copyright © International Online Journal of Primary Education 86
Akoto-Baako, H. (2018). Perceived influence of large class size and psychological classroom environment on students’
academic performance. Retrieved October 01, 2020, from
https://erl.ucc.edu.gh/jspui/bitstream/123456789/3421/1/HANSEN%202018.pdf
Amarat, S. M. (2011). The classroom problems faced teachers at the public schools in Tafila province, and solutions.
International Education Science, 3(1), 37-48.
Arul, A. S. L., & Vimala, A. (2012). School environment and academic achievement of standard IX students. Online
Submission, 2(3), 210-215. https://eric.ed.gov/?id=ED542331
Asodike, J. D., & Onyeike, V. C. (2016). Managing large classes in developing countries. Global Journal of Educational
Research, 15(1), 31-39. DOI:10.4314/gjedr.v15i1.4.
Burns, N., & Grove, S. K. (2010). Understanding nursing research-eBook: Building an evidence-based practice (5th ed.).
Philadelphia: Saunders.
Carr, W., & Kemmis, S. (1986). Becoming critical: Education, knowledge and action research. Lewes: Falmer.
Chepkonga, M. C. (2017). Influence of learning facilities on provision of quality education in early childhood development
centres in Kenya. International Journal of Education and Research, 5(6), 15-26.
China L. (2018, September 13). Anger grows in China over school crowding. Retrieved September 28, 2020, from
https://www.economist.com/china/2018/09/13/anger-grows-in-china-over-school-crowding
China, X. (2016, March 29). Chinese urban schools strive to 'slim' oversize classes. Retrieved September 28, 2020, from
https://www.chinadaily.com.cn/china/2016-03/29/content_24167862.htm
Cohen, L., Manion, L., & Morrison, K. (2011). Research methods in education. (7th ed.). London: Routledge.
Cooper, H., Lindsay, J. J., & Nye, B. (2000). Homework in the home: How student, family, and parenting-style differences
relate to the homework process. Contemporary educational psychology, 25(4), 464-487.
Creemers, B. (2008). Effective school improvement-Ingredients for success, organisational effectiveness and improvement
in education. Buckingham: Open University Press.
Creswell, J. W. (2013). Qualitative inquiry and research design: Choosing among five approaches (3rd ed.). Thousand
Oaks, CA: Sage.
Crossman, A. (2019). An overview of qualitative research methods: Direct observation, interviews, participation,
immersion, focus groups. Retrieved September 28, 2020, from https://www.thoughtco.com/qualitative-research-
methods-3026555.
Donnelly, K. (2019, October 16). Cram school: Two-thirds of primary school pupils stuck in overcrowded classrooms.
Retrieved September 28, 2020, from https://www.independent.ie/irish-news/education/cram-school-two-thirds-of-
primary-school-pupils-stuck-in-overcrowded-classrooms-38316566.html
Edwards, C. H., & Watts, V. J. (2010). Classroom discipline & management (2nd ed.). Milton, Qld.: John Wiley & Sons.
Emmer, T., & Stough, L. (2010). Classroom management: A critical part of educational psychology, with implications for
teacher education. Educational Psychologist, 36(2), 103-112.
Farrokhi, F., & Mahmoudi-Hamidabad, A. (2012). Re-thinking convenience sampling: Defining quality criteria. Theory
and Practice in Language Studies, 2(4), 784-792.
Fatima, Z. U. A., Mushatq, M., & Fatima, Q. U. A. (2019). Overcrowded classroom problems faced by school teachers in
district Muzzafarabad. International Journal of Academic Research in Progressive Education and Development,
8(4), 328–339.
Fife Schwa, T. (2001). There are many steps in carrying out successful research. The Journal of Educational Research,
2(4), 113-125.
Fin, J. D. (2003). Tennessee’s class size study: Findings, implications, misconceptions. Education Evaluation and Policy
Analysis, 21(2), 97-109.
Finn, M., Walton, M., & Elliott-White, M. (2000). Tourism and leisure research methods: Data collection, analysis, and
interpretation. New York City: Pearson education.
Freiberg, H. J. (2013). Classroom management and student achievement. International Guide to Student Achievement, 228-
230.
Ghana Education Service (GES) (2014). Basic education curriculum. Retrieved 09 April 2020 from
https://web.archive.org/web/20140525195225/http://www.ges.gov.gh/?q=content%2Fbasic-education-curriculum-
1.

IOJPE
ISSN: 1300 – 915X
www.iojpe.org
International Online Journal of Primary Education 2021, volume 10, issue 1
Copyright © International Online Journal of Primary Education 87
Hachem, H., & Mayor, P. (2019, October 04). Overcrowding in schools: Why is it a huge Issue? Retrieved September 28,
2020, from https://patch.com/michigan/dearborn/overcrowding-schools-why-it-huge-issue.
Harfitt, G. J., & Tsui, A. B. (2015). An examination of class size reduction on teaching and learning processes: A
theoretical perspective. British Educational Research Journal, 41(5), 845-865.
Iqbal, P., & Khan, M. (2012). Overcrowded classrooms: A serious problem for teachers. Elixir International Journal, 2(5),
10162-10165.
Kedney, R. J. (2013). Performance measurement in non-advanced further education: The use of statistics. (Unpublished
doctoral dissertation). University of Lancaster, United Kingdom.
Kothari, C. R. (2004). Research methodology: Methods & techniques. New Dehli: New Age International (P) Limited
Publishers.
Kriegel, O. (n.d.). 3 tips on how to manage an overcrowded classroom. Retrieved April 02, 2021, from
https://www.wgu.edu/heyteach/article/3-tips-how-manage-overcrowded-classroom1809.html
Kweitsu, R. (2019). Ghana’s education sector: Key challenges hindering the effective delivery of education and the way
forward. Retrieved June, 11, 2020, from https://www.modernghana.com/news/579629/ghanas-education-sector-
key-challenges-hindering.html
Lannoy, A., & Hall, K. (2010). Statistics on children in South Africa. Cape Town: Cape Town University Press.
Lee, E., & Brennenstuhl, S. (2010). How to critically evaluate case studies in social work. London: SAGE Publications.
Marais, P. (2016). “We can’t believe what we see”: Overcrowded classrooms through the eyes of student teachers. South
African Journal of Education, 36(2), 1-10.
Marzano, R. J., & Marzano, J. S. (2003). The key to classroom management. Educational Leadership, 61(1), 6-13.
Ministry of Education (MOE), Ghana (2018). Education sector analysis. Retrieved on April 09, 2020 from
https://sapghana.com/data/documents/Ghana-Education-Sector-Analysis-2018.pdf.
Moreno, V., Cavazotte, F., & Dutra, J. P. (2020). Psychosocial and organisational antecedents of knowledge sharing in the
workplace. Revista de Administração Contemporânea, 24(4), 283-299A.
Mutisya, M. (2020, February 24). Some Kenyan schools are dangerously overcrowded. What must be done? Retrieved
September 01, 2020, from https://theconversation.com/some-kenyan-schools-are-dangerously-overcrowded-what-
must-be-done-131774.
Muthusamy, N. (2015). Teachers’ experiences with overcrowded classrooms in a mainstream school. (Unpublished M.Ed.
dissertation). Durban, South Africa: University of KwaZulu-Natal. Available at
https://researchspace.ukzn.ac.za/bitstream/handle/1
Neale, P., Thapa, S., & Boyce, C. (2006). Preparing a case study: A guide for designing and conducting a case study for
evaluation input. London: Routledge.
O’Sullivan, M. C. (2006). Teaching large classes: The international evidence and a discussion of some good practice in
Ugandan primary schools. International Journal of Educational Development, 26(1), 24-37.
Oliver, R. (2006). Exploring a technology-facilitated solution to cater for advanced students in large undergraduate classes.
Journal of Computer Assisted Learning, 22(1), 1-12.
Onwu, G., & Stoffels, N. (2005). Challenges of large class teaching. Journal of South African Education, 12(10), 14-26.
Palys, T. (2008). Purposive sampling. London: Routledge.
Punch, F. K. (2009). Introduction to research methods in education. London: Sage Publications Ltd.
Saifi, I. L., Hussain, M., Salamat, L., & Bakht, I. (2018). Impact of classroom management on students achievement at
university level. Asian Innovative Journal of Social Sciences and Humanities, 2(2), 13-27.
Shah, J., & Inamullah, H. M. (2012). Overcrowded classrooms: A serious problem for teachers. The Journal of Educational
Strategies, 5(1), 772-789.
Shamaki, T. A. (2015). Influence of learning environment on students’ academic achievement in mathematics: A case study
of some selected secondary schools in Yobe State-Nigeria. Journal of Education and Practice, 6(34), 40-44.
Simpson, M., & Tuson, J. (2005). Using observation in small-scale research. Glasgow: SCRE Publications.
Siperto, J. (2017). Secondary school teachers experience in managing large classes: The case of secondary schools in
Buchosa district council Mwanza. http://repository.out.ac.tz/1915/1/Dissertation%20%20BENJAMIN%20SIPERT
O%20%20Final.pdf
https://theconversation.com/some-kenyan-schools-are-dangerously-overcrowded-what-must-be-done-131774

IOJPE
ISSN: 1300 – 915X
www.iojpe.org
International Online Journal of Primary Education 2021, volume 10, issue 1
Copyright © International Online Journal of Primary Education 88
Smith, M. K. (2020). What is education? A definition and discussion. The encyclopaedia of pedagogy and informal
education. Retrieved on April 07, 2020, from https://infed.org/mobi/what-is-education-a-definition-and-discussion/.
Stepaniuk, V. I. (1997). The use of classroom space in urban schools: The case of Ukraine. The Economics of Education in
the USSR (ed) and Translated by Harold J Noah, New York: Frederick A Praeger Publishers.
Thompson, N. M., & Casely-Hayford, L. (2014). The financing and outcomes of education in Ghana. The University of
Cambridge. pp. 9–14. Retrieved June 13, 2020, from http://ceid.educ.cam.ac.uk/publications/WP16.pdf
UNESCO Institute for Statistics (2008). Education for all: Global monitoring report 2008. Paris: UNESCO.
UNESCO Institute for Statistics. (2018). Ghana: Making inclusive education a reality.
http://www.iiep.unesco.org/en/ghana-making-inclusive-education-reality-4564
UNESCO Institute for Statistics (2020). Ghana: Student teacher ratio, primary school. Retrieved 21 March 2020 from
http://uis.unesco.org/
Van Velzen W., Miles, M., Elholm, M., Hameyer, U., & Robin, D. (1985). Making school improvement work. Leuven:
Belgium ACCO.
West, J., & Meler, C. (2020). Overcrowded classrooms – The Achilles heel of South African education? South African
Journal of Childhood Education 10(1). DOI:10.4102/sajce.v10i1.617
Wilkinson, D., & Birmingham, P. (2003). Using research instruments. London: Routledge.
World Bank (2013). Ratio of girls to boys in primary and secondary education (%). Retrieved March 21, 2020, Available
online: www.worldbank.org
Yelkpieri, D., Namale, M., Esia-Dankoh, K., & Ofosu-Dwamena, E. (2012). Effects of large class size on effective teaching
and learning at the Winneba campus of the University of Education, Winneba, Ghana. US-China Education review
A. 3, 319-332.

IOJPE
ISSN: 1300 – 915X
www.iojpe.org
International Online Journal of Primary Education 2021, volume 10, issue 1
Copyright © International Online Journal of Primary Education 89
THE CONCEPT OF ANGLE IN TURKISH AND SINGAPOREAN
PRIMARY SCHOOL MATHEMATICS TEXTBOOKS: DYNAMIC OR
STATIC?
Suphi Önder BÜTÜNER
Assoc.Prof.Dr., Yozgat Bozok University, Faculty of Education, Mathematics Education Yozgat, Turkey
ORCID: https://orcid.org/0000-0001-7083-6549
Received: November 06, 2020 Accepted: February 08, 2021 Published: June 30, 2021
Suggested Citation:
Bütüner, S. Ö. (2021). The concept of angle in Turkish and Singaporean primary school mathematics textbooks: Dynamic or
static?. International Online Journal of Primary Education (IOJPE), 10(1), 89-105.
This is an open access article under the CC BY 4.0 license.
Abstract
The present study compared Turkish and Singaporean textbooks with respect to their instructional contents on a difficult
topic for most students: the concept of angle. The study used the 3rd and 4th grade mathematics textbooks taught in Turkish
and Singaporean schools. The analysis showed that Turkish textbooks defined the angle as a static concept, and Singaporean
textbooks defined it as both a static and dynamic concept. The definitions of the concept of angle included in the textbooks
reflect on the representation of the angle, instructional tools and problems. Turkish students learn angle from textbooks only
as a static concept, so they may have difficulties and misconceptions about the subject and related concepts. The findings
showed that the contents of Singaporean textbooks offer students more opportunities than Turkish textbooks in learning
about the angle as a static and dynamic concept.
Keywords: Singapore, Turkey, mathematics, textbook, the concept of angle.
INTRODUCTION
Many countries participate in international comparative exams such as TIMSS, PISA and PIRLS in
order to better see their own development in science, mathematics and reading skills. One of these
international exams, TIMSS is held every four years to compare the science and mathematics
achievement levels of elementary 4th and 8th graders. In the exam, participant countries’ mathematics
standards achievement scores are calculated (numbers and operations, geometry, algebra and data-
probability) in order to reach an overall achievement score. In TIMSS 2015, Singapore was the top
country with 617 points, and Turkey remained below the international mean with 463 points in the
geometry domain (Mullis, Martin, Foy, & Hooper, 2016). The differences between Turkish and
Singaporean students’ geometry performances may be attributed to many factors. One reason could be
differences in the content of the textbooks.
Rezat (2006) makes an attempt to develop a framework on the use of textbooks by both teachers and
students. Using the tetrahedron model shown in Figure 1, Rezat (2009) represented the relationships
among textbooks, students, teachers, and mathematical knowledge.
Mathematical knowledge/didactical aspects of the mathematical knowledge
Figure 1. Rezat’s tetrahedron model

IOJPE
ISSN: 1300 – 915X
www.iojpe.org
International Online Journal of Primary Education 2021, volume 10, issue 1
Copyright © International Online Journal of Primary Education 90
Figure 1 indicates the importance of textbooks in the teaching process. Textbooks can be
considered an important resource for both students and teachers (Fan & Zhu, 2000; Son & Hu, 2016).
Textbooks shape what teachers will teach in the classroom and how (Alajmi, 2012; Hirsch, Lappan,
Reys & Reys, 2005; Li, 2000). As different textbooks provide students with different learning
opportunities, textbook comparison studies may help explain the differences in student success (Zhu
& Fan, 2006). It is therefore not surprising that textbook comparison studies have become popular in
recent years. These studies particularly use textbooks from high scoring countries in international
exams such as the TIMSS or PISA namely China, South Korea, Japan, Taiwan, Singapore, and
Finland. Most of these studies have analyzed textbooks with respect to their contents or problem types
(Hong & Choi, 2014). There is a limited number of studies comparing Turkish and Singapore
textbooks. These studies are summarized in Table 1.
Table 1. Studies comparing Turkish and Singapore textbooks and the content of the studies
Author Year Countries Content
Erbaş et al. 2012 Turkey, Singapore, USA Design characteristics
Sağlam and Alacacı 2012 Turkey, Singapore Content, organization, and
presentation style (Quadratics)
Özer and Sezer 2014 Turkey, Singapore, USA Problem type
Bütüner 2019 Turkey, Singapore Problem Analysis (division in fractions)
Toprak and Özmantar 2020 Turkey, Singapore Worked-examples and questions posed
(potential cognitive demand, reasoning and
proof)
Bütüner 2020 Turkey, Singapore Instructional content (division in fractions)
Differently from these previous studies, the present study compares Turkish and Singaporean
textbooks with respect to their instructional contents on a difficult topic for most students: the concept
of angle. There is a limited number of comparative studies on angle in the literature. Park (2015)
compared the teaching contents for angle and measure of an angle in Korean and Japanese
mathematics textbooks. The results show that it is necessary to reconsider the way of the definition of
angle. Kim (2018a) investigated the definitions of angles in the past Korean Elementary Mathematics
Textbooks. The results show that textbooks treat angles solely as a static concept. In another study,
Choi, Kim, and Kwon (2019) examine angle-related contents and learning process and then look at
the perspectives and the size aspects of angle in detail. Singapore, U.K., Australia, and U.S. were
selected as comparable countries in this study. The results show that the dynamic definition of the
angle is described later and less in the Korean curriculum when compared to other countries.
While considering that textbooks are primary sources used by teachers, possessing well-designed
textbooks including correct and complete definitions, examples, representation modes, teaching tools
and problems is one of the effective factors for students to have a correct conceptual image
(Bingölbali, 2016, p. 140). The present study examines the definition of the concept of angle in
Turkish and Singaporean textbooks, its representation (dynamic vs static), the tools used in the
teaching of the angle and their purposes, and the aspect of the angle emphasized in problems
(dynamic vs static). The findings of this study were used to make recommendations to curriculum
designers in Turkish and Singaporean Education Ministries so as to guide them in amending the
deficiencies in textbooks. The recommendations for improving textbooks will guide curriculum
developers in overcoming the deficiencies of textbooks. Different textbooks can offer different
learning opportunities to students and help explain the differences between students’ success levels
(Reys, Reys, & Chavez, 2004; Zhu & Fan, 2006). Therefore, the results of this study may give an idea
about the performances of Turkish and Singaporean students, who will take international exams in
future years, on the concept of angle. The research questions are as following:

IOJPE
ISSN: 1300 – 915X
www.iojpe.org
International Online Journal of Primary Education 2021, volume 10, issue 1
Copyright © International Online Journal of Primary Education 91
• How is the concept of angle defined?
• How is the angle represented?
• What learning tools are used when teaching the concept of angle?
• What are the purposes of using these instructional tools in the process of teaching?
• What aspect of the angle is emphasized in problems related to the concept of angle?
The Concept of Angle: Its Significance, Definitions and Representations
The angle is an important concept in geometry as it is one of the most basic and fundamental
geometry concepts. The concept of angle is always there regardless of the concept being studied (For
instance, when two lines intersect or when we examine a polygon or a polyhedral) (Argün, Arıkan,
Bulut, & Halıcıoğlu, 2014). Angles are also used in various other areas such as engineering,
architecture, land measurement, geology and physics. In high school mathematics, students need
knowledge of angles to solve various mathematical problems. Indeed, the problems that students
encounter regarding the concept of angle also lead to other problems in future topics (trigonometric
functions, etc.) (Moore, 2013).
Henderson and Taimina (2005) list the following conceptions of angle: angle as a geometric shape,
union of two rays with a common end point (static); angle as movement; angle as rotation (dynamic);
angle as measure; and, amount of turning (also dynamic). Older students may be able to conceptualize
angles in turns, ray pairs, or regions, but may not be able to relate them. Younger students may be
able to conceptualize certain angle situations in terms of ray pairs or regions, but may not
conceptualize turns in terms of angles at all (Mitchelmore & White, 1998, p.5). Kim (2018b)
investigated angle concepts and introduction methods of angles in textbooks. Her findings show that
textbooks treat angles solely as a static concept. Kim (2018b) stated that treating angles solely as a
static concept in textbooks leads to certain difficulties for students in understanding the concept.
Bütüner and Filiz (2017) investigated high achievers’ erroneous answers and misconceptions on the
angle concept. According to the results, many students assumed that the size of an angle depends on
the radius of the arc marking the angle and the area of the sector. 32% of students in this study were
unable to recognize a 180° angle.
Presenting the angle as a static concept may lead to certain difficulties for students in understanding
the concept. For instance, they may come to think that the arm length of the angle increases with its
degree, and may therefore find it hard to grasp angles greater than 360°, and some students can not
recognize 0° and 180° angles (Hansen, 2017; Keiser, 2004). Clausen-May (2005) stated that the angle
is usually emphasized not as a measurement (dynamic) but only as a figure (static). In the static
representation, the concept of kinesthetic angle (as motion) is lost, thus blurring the true meaning of
the concept of angle. In order to avoid such problems, students should learn the angle both as a
dynamic and static concept (Barmby, Bilsborough, Harries, & Higgins, 2009; Clausen-May, 2008;
Clements, Wilson, & Sarama, 2004; Crompton, 2013; Mitchelmore & White, 2000). Clausen-May
(2005) states that although it is not possible to show motion on paper, a directed arrow can be used as
its representative. Three different representations of an angle are shown in Figure 2. Textbooks should
therefore include content that enables students to learn the angle both as a dynamic and static concept.
Figure 2. Three different representations of an angle (from left to right: static-static-dynamic)

IOJPE
ISSN: 1300 – 915X
www.iojpe.org
International Online Journal of Primary Education 2021, volume 10, issue 1
Copyright © International Online Journal of Primary Education 92
Tools Used in Teaching the Concept of Angle
The instruction of the angle may involve dynamic mathematics software (Clements & Battista, 1990;
1994; Crompton, 2013; Kaur, 2020), various daily life tools (Clements & Burns, 2000; Fyhn, 2007;
Mitchelmore, 1998; Mitchelmore & White, 2000), body movements (Fyhn, 2006; Smith, King, &
Hoyte, 2014) and out-of-class learning experiences (Munier, Devichi, & Merle, 2008).
In studies conducted in the late 80s, the software Logo was used extensively in teaching the concept
of angle (Clements & Battista, 1989; 1990; Clements, Battista, Sarama, & Swaminathan, 1996;
Clements & Burns, 2000; Simmons & Cope, 1990). The results of previous studies have shown that
Logo-aided learning environments may be effective in students’ understanding of the dynamic
definition of the angle and their skills for predicting the measurement of a given angle. Also, Logo-
aided learning environments prevent the emergence of misconceptions. The literature also includes
studies reporting the positive effects of dynamic geometry software such as Sketchpad (Crompton,
2013; Tieng & Eu, 2014) and Geogebra (Baya'a, Daher, & Mahagna, 2017; Boo & Leong, 2016) in
teaching the concept of angle.
Many daily tools (wheels, doors, scissors, fans, signposts, hills, crossroads, tiles and walls) may be
used when teaching this concept (Mitchelmore, 1998; Mitchelmore & White, 2000). The first four
tools are suitable for teaching the dynamic definition of the angle, while the last five tools are suitable
for teaching the static definition of the angle. Besides, tools such as doors or scissors give the
opportunity to display limited turns, while tools such as wheels, fans, ventilators and wind chimes
give the opportunity to demonstrate unlimited turns. While teaching the concept of angle, learning
objects such as geometry strips or protractors may also be used in addition to daily life tools. In Figure
3, the red strip makes a counter-clockwise quarter turn. If a full turn is 360 degrees, 1 quarter turn
equals to 90 degrees. As can be seen, geometry strips help establish a relationship between the
concepts of angle and fraction (part-whole relationship) when teaching angle as a dynamic concept
(Clausen-May, 2008, p. 6-7).
Figure 3. The use of geometry strips in angle instruction
METHOD
Textbooks Used in the Study
In this study, selected Singaporean (Ming, 2016a, b) and Turkish mathematics (Genç, Güleç, Şahin, &
Taşcı, 2019; Kayapınar, Şahin, Erdem, & Leylek, 2019) textbooks were compared. Textbooks from
these two countries were selected because these countries represent different levels of performance on
the TIMSS. While 4th-grade Singaporean students performed well, 4th-grade Turkish students
performed below the TIMSS scale average. In Turkey, Primary Education involves the education and
training of children in the age group of 6 to 10. Primary education is compulsory for all citizens. It is
free in state schools and lasts four years (1st, 2nd, 3rd, and 4th grades). In Singapore, compulsory
education includes six years of primary school (ages 6-12), four years of secondary school, and one to
three years of post-secondary school. 3rd and 4th grade levels are primary school levels in both
countries. The concept of angle is introduced in the 3rd grade in both countries, and continued in the

IOJPE
ISSN: 1300 – 915X
www.iojpe.org
International Online Journal of Primary Education 2021, volume 10, issue 1
Copyright © International Online Journal of Primary Education 93
4th grade. The objectives regarding the teaching of the angle as a dynamic concept in Turkish and
Singaporean primary mathematics curricula are given in Table 2.
Table 2. The Objectives regarding the teaching of the angle in Turkish and Singaporean primary
mathematics (MONE, 2018, p. 41, 48; MES, 2012, p. 46-51).
Country Grade Objectives
SIN
3
Students should have opportunities to:
*Illustrate an angle as an amount of turning using geostrips / riveted straws and use language
such as “acute angle” and “obtuse angle” to describe angles.
**find angles in the environment and use a “paper right angle” to identify right angles, angles
greater than a right angle and angles smaller than a right angle.
TUR 3 **recognizes the angle and gives examples in the environment
SIN
4
Students should have opportunities to:
*Associate the amount of turning (rotation), clockwise or anti-clockwise, with an angle
measured in degrees
1/4 turn is 90; 1/2 turn is 180
**Estimate before measuring angles using a protractor
**Draw angles using a protractor
**Find the angles (in degrees) between two 8-point compass directions
TUR
4
** Determines the rays that make up the angle and the corner, names the angle and shows it
with a symbol
** Measures angles in non-standard units and explains the need for standard measuring units
** Measures angles with standard angle measuring tools and determines them as acute, obtuse
and right angles.
*Can form an angle using standard measurement tools: ”Realizes with the help of an angle
measurement tool (protractor, goniometer, etc.) that an angle is formed by rotating a ray
around an endpoint”
*The objectives regarding the teaching of the angle as a dynamic concept in Turkish and Singaporean primary mathematics
The study used the 3rd and 4th grade mathematics textbooks taught in Turkish schools and published
by the Turkish Education Ministry, and the Singaporean mathematics textbooks entitled Targeting
Mathematics 3B-4A. “My Pals are here” and “Targeting Mathematics” are commonly used books at
schools in Singapore. These two books are similar in terms of the teaching content of the angle
concept. In Turkey, textbooks are decided by the Ministry of Education. The Turkish Ministry posts
the textbooks used at schools on the webpage http://www.eba.gov.tr/ekitap. The Turkish textbooks
examined in this study were obtained from this website. These textbooks were used on students in the
same age groups that correspond to primary grades 3, and 4 and all books were in use in the
2019-2020 academic year in their respective countries. Two field specialists identified the grade levels
where the textbooks introduced the concept of angle, and then noted the relevant page numbers.
Following this, the analysis (coding) processes started.
The Theoretical Framework for the Analyses
In the study, vertical analyses were performed on the angles content in Turkish and Singaporean
mathematics textbooks. As complementary to horizontal analysis, the vertical analysis offers in-depth
understanding of mathematical content (Hong & Choi, 2014; Yang & Lin, 2015). For example, this
analysis can reveal how the contents of a relevant mathematical concept are presented, what
representation styles are used, what tools are used in concept instruction and their purposes. The scope
of vertical analyses is given in Table 3.

IOJPE
ISSN: 1300 – 915X
www.iojpe.org
International Online Journal of Primary Education 2021, volume 10, issue 1
Copyright © International Online Journal of Primary Education 94
Table 3. Scope of vertical analyses
Vertical Analysis Indicators
How has the concept of angle been defined?
How is the angle represented?
What learning tools are used when teaching the concept of angle?
What are the purposes of using these instructional tools in the process of teaching?
What aspect of the angle is emphasized in problems related to the concept of angle?
Data analysis
In coding the angle as a static or dynamic concept, the opinions in the literature are taken as basis
(Clausen-May, 2005; Henderson & Taimina, 2005; Mitchelmore & White, 2000; Wilson & Adams,
1992). The coding criteria for the angle as a dynamic and static concept is given in Table 4. The
analyses were performed by two academics in the field of mathematics education. The coherence
between the intercoders was calculated using the formula developed by Miles and Huberman (1994).
The agreement for each category varied between 98% and 100%. They debated any differences and
made the final decision based on the views of yet another researcher. The findings were supported
with direct quotes from the textbooks.
Table 4. Coding criteria for the angle as a dynamic and static concept
Indicators Dynamic Static
How has the concept of
angle been defined?
angle as movement; angle as rotation; angle
as measure; and, amount of turning
(Henderson and Taimina, 2005)
angle as a geometric shape, union of two
rays with a common end point (Henderson
and Taimina, 2005)
How is the angle
represented?
a directed arrow Clausen-May, 2005) arrow with no direction; only as two rays-a
corner; no arrow (Clausen-May, 2005)
What learning tools are
used when teaching the
concept of angle?
Wheels, doors, scissors, fans, geometry strips,
riveted straws, clocks etc. (Mitchelmore &
White, 2000).
Signposts, hills, crossroads, tiles, table and
walls etc. (Mitchelmore & White, 2000).
What are the purposes of
using these instructional
tools in the process of
teaching?
An emphasis on the dynamic aspect of the
concept of angle (movement, amount of
rotation) (Henderson and Taimina, 2005).
did not make any emphasis on the dynamic
aspect of the concept of angle (movement,
amount of rotation) (Henderson and
Taimina, 2005)
What aspect of the angle
is emphasized in
problems related to the
concept of angle?
Students are expected to solve, allowing them
to realize that an angle is formed by rotating a
ray around an endpoint and to associate the
degree of the angle with the concept of
fraction (part-whole) etc. (Wilson & Adams,
1992; Clausen-May, 2005, 2008).
Students are not expected to solve, allowing
them to realize that an angle is formed by
rotating a ray around an endpoint (Wilson
& Adams, 1992; Clausen-May, 2005,
2008).
FINDINGS
Table 5 presents the findings concerning how the concept of angle is defined in Turkish and
Singaporean textbooks, how it is represented, what instructional tools are taught to teach it, what
purposes the instructional tools have, and what aspect (dynamic-static) is emphasized in problems
concerning the concept of angle.

IOJPE
ISSN: 1300 – 915X
www.iojpe.org
International Online Journal of Primary Education 2021, volume 10, issue 1
Copyright © International Online Journal of Primary Education 95
Table 5. Vertical analysis findings
Indicators TAR3B TAR4A TR3 TR4
How is the concept of
angle defined?
Both Static and Dynamic Both Static and
Dynamic
Static Static
How is the angle
represented?
A directed arrow; arrow
with no direction
A directed arrow;
arrow with no
direction
Arrow with no
direction; only as
two rays-a corner;
no arrow
Arrow with no
direction; only as
two rays-a corner;
no arrow
What instructional tools
are used to teach the
concept of angle?
Daily life tools, Learning
objects (geometry strips,
riveted straws), Body
movements
Daily life tools,
Learning objects
(geometry strips,
riveted straws and
protractor), Body
movements
Daily life tools Daily life tools,
Learning objects
(protractor)
What purpose do the
instructional tools have?
To teach the static and
dynamic aspects of the
angle
To teach the static and
dynamic aspects of the
angle
To teach the static
aspect of the angle
To teach the static
aspect of the angle
What aspect of the angle
is emphasized in angle
problems?
Both static and dynamic Both static and
dynamic
Static Static
How is the concept of angle defined?
The angle is defined in Turkish textbooks as “a plane formed by two rays with a shared endpoint
(TR3, p. 229)” and “a plane formed by the closed edges of two intersecting rays (TR4, p. 207)”.
Singaporean textbooks state that “an angle is formed when two straight lines meet at a common point.
The size of an angle depends on the amount of turning (TAR3B, p. 60-61, TAR4A, p.116)”. The
Singaporean book also emphasizes the dynamic aspect (quarter turn) when defining the right angle
(Figure 4). As can be seen, Turkish textbooks define the angle as a static concept while Singaporean
textbooks define it as both a static and a dynamic (amount of rotation) concept.
Figure 4. Definition of the right angle in the Singaporean book (TAR3B, p. 62)
How is the angle represented?
The definitions in the textbooks are reflected in angle representation. Singaporean textbooks represent
the angle as an “arrow with direction” or an “arrow with no direction” (Figure 5). Turkish textbooks
represent the angle as an “arrow with no direction” or “only two rays – a corner and no arrow” (Figure
6). Therefore, while the angle exists in Singaporean textbooks as both a dynamic and a static concept,
it remains a static concept in Turkish books. In conclusion, it may be stated that the textbooks from
both countries include representations in line with the definitions of the angle that they adopt.

IOJPE
ISSN: 1300 – 915X
www.iojpe.org
International Online Journal of Primary Education 2021, volume 10, issue 1
Copyright © International Online Journal of Primary Education 96
Figure 5. The dynamic (“arrow with direction,” TAR3B-I, p.60, TAR4A-III, p. 123) and static
(“arrow with no direction,” TAR3B-II, p. 68, TAR4A-IV, p. 117) representations of the angle in the
Singaporean textbook
Figure 6. The static representation of the angle in the Turkish textbook (“arrow with no direction,”
TR3-I, p. 229, TR4-III, p. 209 or “two rays-a corner and no arrow,” TR3-II, p. 230, TR-IV, p. 215).
What instructional tools are used to teach the concept of angle and what purpose do the
instructional tools have?
The instructional tools used in Singaporean textbooks to teach the concept of angle include body
movements, protractor, geometry strips, and daily life tools (fans, computer, traffic signs, scissors,
stairs, clock, stapler, and compass). Singaporean textbooks teach the angle as both a static and
dynamic concept by using these tools. As can be seen in Figure 7, as Singaporean textbooks introduce
the concept of angle, they make use of body movements and riveted straws, thus emphasizing the
dynamic aspect of the angle.

IOJPE
ISSN: 1300 – 915X
www.iojpe.org
International Online Journal of Primary Education 2021, volume 10, issue 1
Copyright © International Online Journal of Primary Education 97
Figure 7. Teaching the angle as a dynamic concept in the Singaporean textbook via body movements
and riveted straws (TAR3B, p. 60-61)
After emphasizing the dynamic aspect of the angle by using body movements, geometry strips and
riveted straws, Singaporean textbooks pass on to the static aspect of angle by using daily life tools
(fans, computer, traffic signs, scissors, stairs) (Figure 8). Visuals pertaining to these tools are given,
asking students to find the angles in them. Even though a fan, notebook computer and scissors are
suitable tools to teach the angle as a dynamic concept and they exist in Singaporean textbooks, they
were there only as examples and did not make any emphasis on the dynamic aspect of the concept of
angle (movement, amount of rotation). In other words, the angle was not treated as a dynamic concept
alone (movement, amount of rotation).
Figure 8. Tools used in the Singaporean textbook when teaching the angle as a static concept
(TAR3B, p. 61).
The 4th grade Singaporean book also teaches the angle as a dynamic concept. As shown in Figure 9,
the book uses geometry strips and makes a connection between the concepts of angle and fraction
(part-whole relationship), thus emphasizing the dynamic aspect of the angle. It is easy to see in Figure
9 that 1 full turn corresponds to 360 degrees, while 1 quarter turn corresponds to 90 degrees, two
quarter turns to 180 degrees, and three quarter turns to 270 degrees.

IOJPE
ISSN: 1300 – 915X
www.iojpe.org
International Online Journal of Primary Education 2021, volume 10, issue 1
Copyright © International Online Journal of Primary Education 98
Figure 9. Teaching the angle in Singaporean books as a dynamic concept by using geometry strips
(TAR4A, p. 123).
In Turkish textbooks, the teaching of the concept of angle made use of a protractor and certain daily
life tools (“hanger, frame, chair” TR3, p. 229; “door, classroom desk, scissors, clock” TR4, p. 207)
(Figure 10). Hanger, frame, chair and classroom desk are suitable tools to teach the angle as a static
concept. Even though door, scissors and clocks are suitable tools to teach the angle as a dynamic
concept and they exist in Turkish textbooks, they were there only as examples and did not make any
emphasis on the dynamic aspect of the concept of angle (movement, amount of rotation). Thus,
Turkish textbooks use these tools to teach the angle only as a static concept.
Figure 10. Tools used in the Turkish textbook to teach the concept of angle (TR3, p. 229; TR4,
p. 207).
What aspect of the angle is emphasized in angle problems?
While the Turkish textbooks only include problems emphasizing the static aspect of the angle,
Singaporean textbooks include problems including both the static and dynamic aspects. The number
of problems with and without solutions in the two textbooks that treat the angle as a static and
dynamic concept are given in Table 6.

IOJPE
ISSN: 1300 – 915X
www.iojpe.org
International Online Journal of Primary Education 2021, volume 10, issue 1
Copyright © International Online Journal of Primary Education 99
Table 6. The Number of Problems in the Textbooks that Treat the Angle as a Static and Dynamic
Concept
Problem Type
Turkish Textbooks Singaporean Textbooks
TR3 TR4 TAR3B TAR4A
Number of solved problems in the textbooks that treat the angle as a
static concept
0 1 1 6
Number of unsolved problems in the textbooks that treat the angle as
a static concept
3 5 10 5
Number of solved problems in the textbooks that treat the angle as a
dynamic concept
0 0 0 5
Number of unsolved problems in the textbooks that treat the angle as
a dynamic concept
0 0 0 3
Turkish textbooks do not include any problems that treat the angle as a dynamic concept. In contrast,
Singaporean textbooks include 5 problems with solutions and 3 questions that treat the angle as a
dynamic concept. The first problem in Appendix 1 is a daily life problem that students are expected to
solve, allowing them to realize that an angle is formed by rotating a ray around an endpoint and to
associate the degree of the angle with the concept of fraction (part-whole) (TAR4A-I). The second
problem expects students to classify given angles as straight, obtuse or acute (TAR4A-II). Therefore,
the first problem emphasizes the dynamic aspect of the angle, while the second problem emphasizes
its static aspect. Appendix 2 shows a problem from the Turkish textbooks emphasizing only the static
aspect of the angle. Students are not expected to solve, allowing them to realize that an angle is
formed by rotating a ray around an endpoint. This problem expects students to show the angles in the
images and classify the given angles as a straight, obtuse, acute or right angle. Other problems from
Turkish and Singaporean textbooks on the concept of angle are given in Appendix 3, 4, and 5.
DISCUSSION and CONCLUSION
The present study investigated how Turkish and Singaporean primary mathematics textbooks define
the concept of angle, how they represent angles, what tools are used with what purpose in teaching
angles, and what aspect of the angle is emphasized in problems regarding the concept of angle. The
concept of angle is introduced in both countries in the 3rd grade and continued in the 4th grade. The
primary mathematics curricula of both countries include objectives concerning “teaching the angle as
a dynamic concept.
The vertical analysis showed that Turkish textbooks defined the angle as a static concept, and
Singaporean textbooks defined it as both a static and dynamic concept. The definitions of the concept
of angle included in the textbooks reflect on the representation of the angle, the aims for using the
selected instructional tools in angle instruction, and the problem structure in the textbooks. In Turkish
textbooks, the angle is represented with “an arrow that does not show direction” or “two rays-a corner
and no arrow.” In Singaporean textbooks, it is represented with “an arrow that shows direction” or “an
arrow that does not show direction.” Therefore, in Singaporean books, the angle was treated both as a
dynamic and static concept, while Turkish books only treated it as a static concept. According to
Clausen-May (2005), the representation in Turkish books is a move away from the true meaning of
the concept of angle. She continues that even when it seems impossible to indicate the movement on a
piece of paper, a directed arrow may be used for representation. Turkish textbooks teach the concept
of angle only by using a protractor and various daily tools (scissors, clocks, chairs, frames, hangers,
doors). These textbooks do not emphasize the dynamic aspect of the concept of angle (motion,
amount of rotation); they are merely included in the textbook as examples. Singaporean textbooks, on
the other hand, use body movement, protractor, geometry strips, and daily materials (fans, computers,
IOJPE
ISSN: 1300 – 915X
www.iojpe.org
International Online Journal of Primary Education 2021, volume 10, issue 1
Copyright © International Online Journal of Primary Education 100
traffic signs, scissors, stairs, clocks, staplers, and compass) as tools in teaching the concept of angle.
In the 3rd grade Singaporean book, as an introduction was made to the concept of angle, it was treated
as a dynamic concept by using body movements and riveted straws. In the 4th grade Singaporean
textbook, geometry strips were used to make a connection between the concepts of angle and fraction
(part-whole relationship) and to emphasize the dynamic aspect of the angle. The literature states that
teaching the angle as a dynamic concept can help make use of learning objects (such as geometry
strips). Considering that a full turn in a circle equals to 360 degrees, the students may be asked to
think what a quarter turn or two quarter turns would equal to in degrees. In this way, students can
have the opportunity to learn the angle as a dynamic concept by mobilizing their existing knowledge
and using the part-whole meaning of fraction (Clausen-May, 2005, 2008; Wilson & Adams, 1992).
There is no emphasis or activity on the use of dynamic geometry software in the textbooks of either
country. The literature also includes studies reporting the positive effects of dynamic geometry
software (Clements et al., 1996; Clements & Burns, 2000; Crompton, 2013; Boo & Leong, 2016). In
GeoGebra software, students may be asked to rotate a ray around its endpoint by using a ‘slider’ and
‘rotate around point.’ Therefore, students may gain an awareness of the dynamic definition of the
angle concept (Bütüner & Filiz, 2017).
The angle was treated as a static concept in all problems in Turkish textbooks. In contrast, the 4th
grade Singaporean book included eight problems that treat the angle as a dynamic concept. Therefore,
it was concluded that in both Turkish and Singaporean textbooks, there was harmony between the
instructional contents of the concept of angle and the angle problems in the textbooks. The results
show that Turkish textbooks need to be enriched with contents regarding teaching the angle as a
dynamic concept. Angle problems that treat the angle as both a dynamic and a static concept should
be added to the Turkish textbooks in a balanced way. When the angle is treated solely as a static
concept, students may end up thinking that an angle may increase when its arm length increases
(Clausen-May, 2008) and fail to recognize angles of 0 degrees or those larger than 360 degrees as
they do not see an openness (Barmby et al, 2009, p. 147). Therefore, many studies have attempted to
teach the angle as a dynamic concept (Clements & Battista, 1989; 1990, Clements et al., 1996;
Clements & Burns, 2000; Mitchelmore, 1998; Mitchelmore & White, 2000; Simmons & Cope, 1990).
Other results from the findings include that, in contrast to the case in Singapore, there is a mismatch
in the contents of Turkish textbooks and the objectives of the primary mathematics curriculum, and
that the contents of Singaporean textbooks offer students more learning opportunities than Turkish
textbooks regarding the concept of angle. These results also suggest that as the concept of angle is
introduced in Turkish and Singaporean textbooks, students should be given learning opportunities to
assist them in constructing the dynamic definition of the concept, rather than directly giving them a
static or dynamic definition.
Limitations and Implications for Future Research
According to the findings, Singaporean students can learn from textbooks that angle is both a static
and a dynamic concept. Therefore, they may not have difficulties or misconceptions about angle and
related concepts (such as trigonometry) in their following years. Turkish students, on the other hand,
learn angle from textbooks only as a static concept, so they may have difficulties and misconceptions
about angle [e.g., students may think that the arm length of an angle affect its degree, (Clausen- May
2005); they may think that the degree of an angle is related to the area surrounded by the arms of the
angle (Keiser, 2004); they may misread an angle on the protractor, (Hansen, 2017) and may have
further problems on related concepts (such as trigonometry)]. The findings have shown that
Singaporean students may display a better performance than Turkish students in problems based on
the concept of angle. Therefore, the results of this study give an idea about the performances (in
problems involving angles, polygons, trigonometry, slope etc.) of Turkish and Singaporean students,
who will take international exams in future years.
The generalization of these results calls for caution as the findings come from two mathematics
textbooks from either one of the two countries (Yang, 2018; Wijaya, Van den Heuvel-Panhuizen, &

IOJPE
ISSN: 1300 – 915X
www.iojpe.org
International Online Journal of Primary Education 2021, volume 10, issue 1
Copyright © International Online Journal of Primary Education 101
Doorman, 2015). A well or poorly designed textbook may find life in the hands of a well-equipped
teacher. Such a teacher may spot the deficiencies in textbooks and enrich classes with contents that
enable students to better grasp mathematical concepts. Future researchers may study whether Turkish
and Singaporean teachers use textbooks when teaching the concept of angle, how they utilize these
books, how they teach the concept of angle, and what type of problems they use in their classes
regarding the concept of angle.
REFERENCES (*Textbooks Used in the Study)
Alajmi, A. H. (2012). How do elementary textbooks address fractions? A review of mathematics textbooks in the USA,
Japan, and Kuwait. Education Studies in Mathematics, 79(2), 239–261.
Argün, Z., Arıkan, A., Bulut, S., & Halıcıoğlu, S. (2014). Temel matematik kavramların künyesi [Identification of basic
mathematical concepts]. Ankara: Gazi Publishing.
Barmby, P., Bilsborough, L., Harries, T., & Higgins, S. (2009). Primary mathematics: teaching for understanding. NY:
McGraw Hill.
Baya’a, N., Daher, W., & Mahagna, S. (2017). The effect of collaborative computerized learning using GeoGebra on the
development of concept images of the angle among seventh graders (pp.208-215). In G. Aldon & J. Trgalova (Eds.),
Proceedings of the 13th International Conference on Technology in Mathematics Teaching (ICTMT 13), Lyon,
France: Ecole Normale Sup´erieure de Lyon.
Bingölbali, E. (2016). Kavram tanımı ve kavram imajı. (In; Matematik Eğitiminde Teoriler, Ed, Bingölbali, E., Arslan, S.,
and Zembat, İ. Ö.). p. 136-148. Ankara: Pegem Akademi.
Boo, J. Y., & Leong, K. E. (2016). Teaching and learning of Geometry in Primary School using GeoGebra. Proceedings of
the 21st Asian Technology Conference in Mathematics, p. 289-300.
Bütüner, S. Ö., & Filiz, M. (2017). Exploring high-achieving sixth grade students’ erroneous answers and misconceptions on
the angle concept. International Journal of Mathematical Education in Science and Technology, 48(4), 533-554.
Bütüner, S. Ö. (2019). Problem analysis in Turkish and Singapore mathematics textbooks: division of fraction. Pamukkale
University Journal of Education, 47, 370-394.
Bütüner, S. Ö. (2020). A comparison of the instructional content on division of fractions in Turkish and Singaporean
textbooks. International Journal of Mathematical Education in Science and Technology, 51(2), 265-293.
Choi, E., Kim, S. Y., & Kwon, O. N. (2019). An International Comparison study in Mathematics Curriculum - Contents for
Angle among the Korea, Singapore U.K., Australia and U.S. Communications of Mathematical Education, 33(3),
295–317.
Clausen-May T. (2005). Teaching maths to pupils with different learning styles. London: Paul Chapman Publishing.
Clausen-May, T. (2008). Another angle on angles. Australian Primary Mathematics Classroom, 13(1), 4-8.
Clements, D. H., & Battista, M. T. (1989). Learning of geometric concepts in a Logo environment. Journal for Research in
Mathematics Education, 20, 450-467.
Clements, D. H., & Battista, M. T. (1990). The effects of logo on children's conceptualizations of angle and polygons.
Journal for Research in Mathematics Education, 21, 356-371.
Clements, D. H., & Battista, M. T. (1994). Computer environments for learning geometry. Journal of Educational
Computing Research, 10(2), 173-197.
Clements, D. H., Battista, M. T., Sarama, J., & Swaminathan, S. (1996). Development of turn and turn measurement
concepts in a computer-based instructional unit. Educational Studies in Mathematics, 30(4), 313-337.
Clements D. H., & Burns B. A. (2000). Students’ development of strategies for turn and angle measure. Educational Studies
in Mathematics, 41, 31–45.
Clements, D. H., Wilson, D. C., & Sarama, J. (2004). Young children’s composition of geometric figures: A learning
trajectory. Mathematical Thinking and Learning, 6(2), 163-184.
Crompton, H. (2013). Coming to understand angle and angle measure: a design-based research curriculum study using
context-aware ubiquitous learning. Unpublished PhD dissertation, University of North Carolina at Chapel Hill.
Erbaş, A. K., Alacacı, C., & Bulut, M. A. (2012). Comparison of Mathematics Textbooks from Turkey, Singapore and the
United States of America. Educational Sciences: Theory and Practice, 12(3), 2311-2329.

IOJPE
ISSN: 1300 – 915X
www.iojpe.org
International Online Journal of Primary Education 2021, volume 10, issue 1
Copyright © International Online Journal of Primary Education 102
Fan, L., & Zhu, Y. (2000). Problem solving in Singaporean secondary mathematics textbooks. Mathematics Education,
5(1/2), 117-141.
Fyhn, A. B. (2006). A climbing girl's reflections about angles. The Journal of Mathematical Behavior, 25, 91-102.
Fyhn, A. B. (2007). A climbing class' reinvention of angles. Educational Studies in Mathematics, 67, 19-35.
*Genç, H., Güleç, H., Şahin, N., & Taşcı, S. (2019). Primary school mathematics 3rd grade textbook, Ankara: National
Education Publications.
Hansen, A. (2017). Children’s errors in Mathematics. Sage Publications: California.
Henderson, D. W., & Taimina, D. (2005). Experiencing geometry: Euclidean and non-Euclidean with history. New York
(NY): Prentice Hall.
Hong, D. S., & Choi, K. M. (2014). A comparison of Korean and American secondary school textbooks: The case of
quadratic equations. Educational Studies in Mathematics, 85(2), 241-263.
Hirsch, C., Lappan, G., Reys, B., & Reys, R. (2005). Curriculum as a focus for improving school mathematics.
Mathematicians and Education Reform Forum Newsletter, 18(1), 12-14.
Kaur, H. (2020). Introducing the concept of angle to young children in a dynamic geometry environment. International
Journal of Mathematical Education in Science and Technology, 51(2), 161-182.
*Kayapınar, A., Şahin, N., Erdem, G., & Leylek, B. Ş. (2019). Primary school mathematics 4th grade textbook, Ankara:
National Education Publications.
Keiser, J. (2004). Struggles with developing the concept of angle: Comparing sixth-grade students’ discourse to the history
of angle concept. Mathematical Thinking and Learning, 6(3), 285-306.
Kim, S. M. (2018a). Research of the Definitions of Angles in the Past Korean Elementary Mathematics Textbooks. Journal
of Educational Research in Mathematics, 28(3), 265-282.
Kim, S. M. (2018b). Angle concepts and introduction methods of angles in elementary mathematics textbooks. Education of
Primary School Mathematics, 21(2), 209-221.
Li, Y. (2000). A comparison of problems that follow selected content presentations in American and Chinese mathematics
textbooks. Journal for Research in Mathematics Education, 31(2), 234–241.
Ministry of Education Singapore [MES] (2012). Mathematics syllabus Primary one to six, Singapore.
Miles, M. B, & Huberman, M. A. (1994). An expanded sourcebook qualitative data analysis. London: Sage.
Ministry of National Education [MONE], (2018). Elementary mathematics curriculum: Grades 1-4, Ankara.
*Ming, E. C. C. (2016a). Targeting mathematics 3B. Singapore: Star Publishing.
*Ming, E. C. C. (2016b). Targeting mathematics 4A. Singapore: Star Publishing.
Mitchelmore, M. C. (1998). Young students' concepts of turning and angle. Cognition and Instruction, 16(3), 265-284.
Mitchelmore, M. C., & White, P. (1998). Development of angle concepts: a framework for research. Mathematics Education
Research Journal, 10, 4-27.
Mitchelmore, M. C., & White, P. (2000). Development of angle concepts by progressive abstraction and generalisation.
Educational Studies in Mathematics, 41, 209–238.
Moore, K. (2013). Making sense by measuring arcs: A teaching experiment in angle measure. Educational Studies in
Mathematics, 83, 225-245.
Mullis, I. V. S., Martin, M. O., Foy, P., & Hooper, M. (2016). TIMSS 2015 international results in mathematics. TIMSS and
PIRLS International Study Center, Boston College, Chestnut Hill, MA.
Munier, V., Devichi, C., & Merle, H. A. (2008). Physical situation as a way to teach angle. Teaching Children Mathematics,
14, 402-407.
Özer, E., & Sezer, R. A. (2014). Comparative analysis of questions in American, Singaporean, and Turkish mathematics
textbooks based on the topics covered in 8th grade in Turkey. Educational Sciences: Theory and Practice, 14(1),
411-421.
Park, K. S. (2015). A comparative study on teaching contents for angle and measure of an angle in elementary mathematics
textbook between Korea and Japan. School Mathematics, 17(1), 35-46.

IOJPE
ISSN: 1300 – 915X
www.iojpe.org
International Online Journal of Primary Education 2021, volume 10, issue 1
Copyright © International Online Journal of Primary Education 103
Sağlam, R., & Alacacı, C. (2012). A Comparative Analysis of Quadratics Unit in Singaporean, Turkish and IBDP
Mathematics Textbooks. Turkish Journal of Computer and Mathematics Education, 3(3), 131-147.
Simmons, M., & Cope, P. (1990). Fragile knowledge of angle in turtle geometry. Educational Studies in Mathematics, 21,
375-382.
Smith, C. P., King, B., & Hoyte, J. (2014). Learning angles through movement: critical actions for developing understanding
in an embodied activity. The Journal of Mathematical Behavior, 36, 95-108.
Son, J. W. & Hu, Q. (2016). The initial treatment of the concept of function in the selected secondary school mathematics
textbooks in the US and China. International Journal of Mathematical Education in Science and Technology, 47(4),
505-530.
Reys, B. J., Reys, R. E., & Chavez, O. (2004). Why mathematics textbooks matter. Education Leadership, 61(5), 61–66.
Rezat, S. (2006). A model of textbook use. In J. Novotna, H. Kratka,& N. Stehlikova (Eds.), Proceedings of the 30th annual
conference of the International Group for the Psychology of Mathematics Education (Vol. 4, pp. 409–416). Prague:
PME.
Rezat S. (2009). The utilization of mathematics textbooks as instruments of learning. In: Durand Guerrier V,
Soury-Lavergne S, Arzarello F, editors. Proceedings of Congress of European Research in Mathematics Education
6; Lyon; p. 1260-1269.
Tieng, P. G., & Eu, L. K. (2014). Improving students’ van hiele level of geometric thinking using geometer’s sketchpad.
The Malaysian Online Journal of Educational Technology, 2(3), 20-31.
Toprak, Z., & Özmantar, M. (2019). A comparative analysis of Turkey and Singapore 5th grade mathematics textbooks in
terms of worked examples and questions. Turkish Journal of Computer and Mathematics Education (TURCOMAT),
10(2), 539-566.
Wilson, P. S., & Adams, V. M. (1992). A dynamic way to teach angle and angle measure. Arithmetic Teacher, 39, 6-13.
Wijaya, A., Van den Heuvel-Panhuizen, M., & Doorman, M. (2015). Opportunity-to-learn context based tasks provided by
mathematics textbooks. Educational Studies in Mathematics, 89, 41-65.
Yang, D. C. (2018). Study of fractions in elementary mathematics textbooks from Finland and Taiwan. Educational Studies,
44(2), 190-211.
Yang, D., & Lin, Y. C. (2015). Examining the differences of linear systems between Finnish and Taiwanese textbooks,
Eurasia Journal of Mathematics, Science & Technology Education, 11(6), 1265-1281.
Zhu, Y., & Fan, L. (2006). Focus on the representation of problem types in intended curriculum: A comparison of selected
mathematics textbooks from mainland China and the United States. International Journal of Science and
Mathematics Education, 4, 609-626.
Appendix 1. Problems from the Singaporean textbook in line with both the dynamic (TAR4A-I,
p.128) and static aspects of the angle (TAR4A-II, p. 116).

IOJPE
ISSN: 1300 – 915X
www.iojpe.org
International Online Journal of Primary Education 2021, volume 10, issue 1
Copyright © International Online Journal of Primary Education 104
Appendix 2. Problem from the Turkish book in line with the static aspect of the angle (show the
angles in the images below, TR3, p.233, find the acute angle, right angle, obtuse angle and straight
angles in the figure) (TR4, p. 212)
Appendix 3. A problem with solution in Singaporean textbook (angle as a dynamic concept) (TAR
4A, p. 127)

IOJPE
ISSN: 1300 – 915X
www.iojpe.org
International Online Journal of Primary Education 2021, volume 10, issue 1
Copyright © International Online Journal of Primary Education 105
Appendix 4. A problem without solution (angle as a dynamic concept) (TAR 4A, p. 129).
Appendix 5. A problem without solution (measure the angles given below and write down their
values) (angle as a static concept) (TR 4, p. 215)

IOJPE
ISSN: 1300 – 915X
www.iojpe.org
International Online Journal of Primary Education 2021, volume 10, issue 1
Copyright © International Online Journal of Primary Education 106
SCIENCING ACTIVITIES AND SCIENTIFIC SKILLS OF CHILDREN AT
PRE-PRIMARY LEVEL IN NIGERIA
Eileen Oluwakemi AKINTEMI
Ph.D., University of Ibadan, Early Childhood Education Unit,
Department of Early Childhood & Educational Foundations, Nigeria
ORCID: https://orcid.org/0000-0003-0233-6504
Esther Abiola ODUOLOWU
Ph.D., University of Ibadan, Early Childhood Education Unit,
Department of Early Childhood & Educational Foundations, Nigeria
ORCID: https://orcid.org/0000-0001-5783-299X
Received: March 22, 2021 Accepted: May 15, 2021 Published: June 30, 2021
Suggested Citation:
Akintemi, E. O., & Oduolowu, E. A. (2021). Sciencing activities and scientific skills of children at pre-primary level in
Nigeria. International Online Journal of Primary Education (IOJPE), 10(1), 106-118.
This is an open access article under the CC BY 4.0 license.
Abstract
Science is taught at the pre-primary level to foster scientific skills, essential for learning science at other levels of education.
There is evidence that children are deficient in the scientific skills of observation, classification, communication, measurement,
prediction and inference. This problem has been attributed to teachers’ non-use of sciencing activities for children. This study
was, therefore, carried out to determine the effects of sciencing activities (formal and informal) on pre-primary school children’s
scientific skills in Ibadan, Nigeria. The pretest-posttest control group quasi-experimental design was adopted. Three public
primary schools were purposively selected from three Local Government Areas in Ibadan, Nigeria. An intact pre-primary class
was used from each school, and randomly assigned to Formal Sciencing (17), Informal Sciencing (19) and Control (24) groups.
Science Process Skills Rating Scale (r=.73) was used to measure the scientific skills of children before and after exposure to
sciencing activities. Data was analysed using descriptive statistics, Analysis of covariance and Scheffe post-hoc test. There were
significant main effects of treatment on children’s scientific skills (F(2, 57)=47.72; partial ῆ2=.65). Among the recommendations
made was that sciencing activities should be adopted by pre-primary teachers to foster scientific skills of pre-primary school
children.
Keywords: Sciencing activities, formal and informal sciencing activities, pre-primary science, scientific skills.
INTRODUCTION
Pre-primary education is essential for children's holistic development and wellbeing. In the Nigerian
education setting, it is the one year education given to five year old children before they begin primary
school (Federal Republic of Nigeria [FRN], 2013). Haque, Nasrin, Yesmin, and Biswas (2013) identifies
the essence of this level of education as ensuring a smooth transition to the primary level of education and
laying the foundation for lifelong learning. This period is considered the right time to expose children to
meaningful science learning that will build the scientific skills needed at other levels of education. It is in
recognition of this that the Nigerian Government has made one of the objectives of pre-primary education
to be to foster scientific skills through the exploration of various objects in the environment (FRN, 2013).
Hernawarti et al. (2018) described scientific skills as thinking skills that teachers and children use while
engaged in science related activities. Durham (2017) also described these skills as the process of doing
science which for young children involves observation, communication, classification, measurement,
prediction and inference. It has been established that scientific skills of children can only be developed

IOJPE
ISSN: 1300 – 915X
www.iojpe.org
International Online Journal of Primary Education 2021, volume 10, issue 1
Copyright © International Online Journal of Primary Education 107
when they are actively engaged in exploration and manipulation of objects in their environment (Suryanti,
Ibrahim, & Lede, 2018; Andiema, 2016).
Oduolowu and Akintemi (2017a) observed that pre-primary school children in Ibadan, Nigeria learn
science in abstraction without any form of active learning and experimentation, exploration and
investigation. Pre-primary school children will not acquire scientific skills by just sitting down and
listening to their teachers rather they acquire such skills through hands-on activities, inquiry, direct
experience, experimentation, discovery and investigation is in line with children’s nature as active
learners.
This is why Yennizar, Eriyam, Susanti, and Kausari (2020) stressed that science teaching at the
pre-primary level should not emphasise teaching children facts but should involve them in observation and
manipulation of objects. The danger in teaching science in abstraction to pre-primary school children is
that they are not adequately prepared for science at the primary level and other levels of education and
teachers only concentrate on scientific facts thereby neglecting the development of the scientific skills in
these children. Consequently, children who are not given the opportunity to be actively involved during
science lessons will not develop these skills and will not be able to use the more complex integrated
science process skills later in life.
However, the way children in Ibadan, Nigeria are learning is bereft of experiential/hands-on learning
activities for children during science lessons as they do not explore, observe and experiment with
materials (living and non-living) in their environment. Invariably, their lack of exposure to hands-on
science activities has negatively affected the development of their scientific skills as they were observed
by Oduolowu and Akintemi (2017b) to be deficient in the basic science process skills of observing,
communicating, classifying, measuring, predicting and inferring. In other words, they have deficiencies in
the skills of observing, classifying, communicating, measuring, predicting and inferring. For Nigeria to
produce the next generation of scientists needed to make scientific advancements and to be globally
recognised scientifically, pre-primary teachers need to go beyond the use of conventional teaching
methods to those that will produce quality science education.
There is thus a dire need to use hands-on activities for pre-primary science which is not only
developmentally appropriate, but can also be very effective in developing the process skills of young
children. Sciencing activities allow children to observe, explore their environment, experiment with
materials and discuss the results of their experiments with others as recommended in the one-year
curriculum for pre-basic science activities (NERDC, 2013). Seefeldt and Galper (2007; 2017) defined
sciencing as hands-on, brains-on endeavor for young children. Neuman (1972) defined sciencing as
science related activities for young children and categorised the activities into three; formal sciencing,
informal sciencing and incidental sciencing.
Lind (1999) observed that these activities differ in terms of who controls the choice of activity, the
teacher or the child and stressed that for formal sciencing activities, the teacher chooses the activities for
the child and gives some directions to the child’s actions, for informal sciencing activities the child
chooses the activity and action but the teacher intervenes at some point and for the incidental sciencing
the child controls choice and actions. Formal and informal sciencing activities were of interest to this
study because by nature both can be planned by the researchers in line with the Nigerian pre-primary
curriculum that was used for this study. Neuman (1972) described formal sciencing activity as a type of
sciencing whereby the teacher plans the lessons, prepares materials and guides children to explore with
the materials and make discoveries.
Researchers have found that formal sciencing activities improve children’s process skills. For instance,
studies by Aydin (2020) and Raymond (2015) indicated that formal sciencing activities enhance the

IOJPE
ISSN: 1300 – 915X
www.iojpe.org
International Online Journal of Primary Education 2021, volume 10, issue 1
Copyright © International Online Journal of Primary Education 108
process skills of children. Despite the benefits of formal sciencing activities to children especially in the
acquisition of scientific skills, Oduolowu and Akintemi (2017a) observed that many pre-primary teachers
do not make use of sciencing activities in their classrooms. Moreover, there seems to be dearth of studies
on the impact of formal sciencing activities on pre-primary science learning outcomes in Nigeria.
Another type of sciencing activity which was of interest to the investigators is the informal sciencing.
According to Mayesky (1990) informal sciencing is non-directional, free investigation by a child. It is a
type of sciencing activity whereby the teacher sets up a science corner and allows children to
independently explore with science materials at the science corner (Neuman, 1972). Creating a science
corner in the classroom allows children to freely explore and experiment with things kept in the science
corner which can foster scientific skills, independence, curiosity and creativity in children. Studies have
established that informal sciencing activities improve scientific skills of children. For instance, Murphy,
Smith, and Broderick (2019) and Legoria (2012) reported that informal sciencing improved the process
skills of children. While Colgrove (2012) reported that informal sciencing activities did not improve the
process skills of children.
Despite these benefits of informal sciencing activities for children, Oduolowu and Akintemi (2017b)
observed that many pre-primary classrooms in Ibadan, Nigeria have no science corners for children to
carry out informal sciencing activities. Where there were science corners, the materials were not
adequate. What was available in most of the corners were old cartons, there were no living things such as
small animals, fishes and plants. Thus, pre-primary children in Ibadan Metropolis may grow up not to
appreciate and love nature because they are not exposed to nature in their classrooms. Appreciation and
stewardship of the natural environment has been identified as one of the 10 pillars of a good childhood
(Association for Childhood Education International, 2012). It also, appears that the impact of informal
sciencing activities on pre-primary science learning outcomes have not been explored by researchers
Ibadan, Nigeria.
Another major problem with pre-primary teachers’ non-use of active learning strategies is that it is not
individually appropriate as it does not consider individual differences in children. According to Browne
and Gordon (2009) teachers’ understanding and considerations for each child’s strengths, weaknesses and
interests will help them to plan and provide learning activities that are adaptable and responsive to
individual differences within a group of children. There are, therefore, certain individual differences in
children that can affect the way they learn science. Martin (2001) identified them as; learning modalities,
locus of control, learning style, gender bias, multiple intelligence and cultural/ethnic differences. Shrooti
(2011) stressed that learning can only be effective when learners’ individual differences are considered. In
other words, science learning at the pre-primary level can only be effective when teachers take
cognizance of individual differences of children in their classroom. However; gender and ethnic
affiliation were of great interest to the investigators because they have been found by researchers to
influence learning outcomes in language during the early years.
Ethnic affiliation determines what children already know about science (pre-existing knowledge) and how
they respond to science or do science (Universal Basic Education, 2010; Martin, 2001). Some of
children’s weaknesses or misconceptions about science come from their socio-cultural beliefs. According
to Chidiebere (2008) socio-cultural beliefs are already formed in the African child before they begin
formal schooling and that there are so many socio-cultural beliefs in Nigeria that make it difficult for
children to learn science because they are contrary to what science is all about. For example, thunder,
lightning, rainbow, rain, sun, stars, moon, rivers, land, trees in the forest are all believed to have
supernatural powers (Chidiebere, 2008). These beliefs can affect children’s understanding of scientific
concepts. Similarly, Luykx, Lee, Mahotiere, Lester, and Deaktor (2007) pointed out that children’s
linguistic characteristics may be inconsistent with the way in which science is taught in schools. Similarly,

IOJPE
ISSN: 1300 – 915X
www.iojpe.org
International Online Journal of Primary Education 2021, volume 10, issue 1
Copyright © International Online Journal of Primary Education 109
the linguistic characteristics of pre-primary school children in Nigeria may also interfere with their ability
to learn science if the medium of instruction used is different from that of their ethnic affiliation especially
when they do not understand the language. This interference will make it difficult for children to be
involved in science activities as they will find it difficult to listen to instructions, express themselves or
talk about their science experiences if the language that is used in the classroom is different from their
home language.
Scholars have documented the influence of ethnic affiliation on scientific skills of children. For instance,
Githinji (2011) observed that ethnic affiliation of children influences the science process skills of children.
On the other hand, Duda, Susilo, and Newcombe (2019) observed that cultural background does not
influence the science process skills of learners. As much as ethnic affiliation is important to the learning of
science, it appears that nothing has been done on how ethnic affiliation influences science learning
outcomes (science knowledge and process skills) at the pre-primary level in Nigeria. There is thus a need
to examine whether the ethnic affiliation of children at the pre-primary level will influence learning
outcomes in science (science knowledge and process skills) while they are carrying out sciencing
activities.
For many years, gender has continued to play a significant role in science education globally. There still
exists a wide gap between the females and males in terms of participation in science. According to the
Soete, Schneegans, Eröcal, Angathevar, and Rasiah (2015) women constitute minority of the world’s
science researchers and in the Sub-Saharan region only 30.0% of the science researchers are women
while the remaining 70.0% are men. The reason for this disparity could have stemmed from the gender
stereotyping of the image of a scientist very early in life. Newton and Newton (2012) observed that
children both boys and girls across many cultures view a scientist as a man in a laboratory coat. This
stereotype if not addressed, could hinder female participation in science as girls would grow up feeling
that they are not competent to learn science or science is meant for boys. Secondly, with the strategy used
where there are no hands-on activities, girls may never be given the opportunity to try out things for
themselves in order to discard this belief and gain confidence in their ability to do science.
Studies have being carried out to examine the influence of gender on science learning outcomes for young
children. For instance, Simsar (2013) observed that gender influences children’s performance in the
science process skills. Similarly, Yuliskurniawati, Noviyanti, Mukti, Mahanal, and Zubaidah (2019)
observed that gender influences the science process skills of learners at the senior secondary level. On the
other hand, Ihejiamazu, Neji, and Isaac (2020) reported that the gender does not influence the science
process skills of learners at the senior secondary level. These studies were not carried out in Nigerian
pre-primary classrooms. Therefore, there is the need to examine how the gender of pre-primary school
children will influence their science process skills while they are involved in sciencing activities.
Purpose of the Study
This study was carried out to determine the effect of sciencing activities (formal and informal) on the
scientific skills of pre-primary school children in Ibadan and the moderating effects of ethnic affiliation
and gender on the scientific skills of children.
Hypotheses of the Study
The following null hypotheses were tested in this study at .05 level of significance.
Ho1: There is no significant main effect of treatment on pre-primary school children’s acquisition of
scientific skills.
Ho2: There is no significant main effect of ethnic affiliation on pre-primary school children’s;
acquisition of scientific skills.

IOJPE
ISSN: 1300 – 915X
www.iojpe.org
International Online Journal of Primary Education 2021, volume 10, issue 1
Copyright © International Online Journal of Primary Education 110
Ho3: There is no significant main effect of gender on pre-primary school children’s; acquisition of
scientific skills.
METHOD
This study adopted a pretest-posttest, control group quasi experimental design (Cohen, Manion, &
Morrison, 2007). Purposive sampling technique was used to select three public primary schools in Ibadan,
Nigeria based on the criteria that; the public primary schools have 5 year old children in pre-primary
classes, teachers’ willingness to participate in the study and parents’ willingness to allow their children to
participate in the study. The sample comprised 60 pre-primary school children selected from the three
public primary schools and intact classes were used. The three schools were randomly assigned to formal
sciencing, informal sciencing, control groups and intact classes were used. Formal sciencing group
comprised 17 children, informal sciencing group comprised 19 children and control group comprised 24
children.
Research Instruments
Science Process Skills Rating Scale
Science Process Skills Rating Scale (r=.73) was used to measure the scientific skills of children before
and after exposure to sciencing activities. It was designed by the researchers using the basic science
process skills indicators by Padilla (1990). It was used to determine the performance of children in the
process skills of observing, classifying, communicating, measuring, predicting and inferring using an
Activity Guide for Hands-on Assessment of Science Process Skills and Science Process Skills Rubric.
The rating scale is made up of two sections A and B. Section A contains the demographic data of the
children. The items in this section are; gender and ethnic affiliation. Section B contains the indicators for
each process skill and the level of performance for each skill. There are four levels of performance for
this instrument (0=no performance, 1=moderate performance, 2=satisfactory performance, 3=excellent
performance). To determine the reliability of the instrument; it was administered to pre-primary school
children who did not participate in this study. Using test-retest method, the reliability coefficient of the
Science Process Skills Checklist obtained was .73 using Pearson Product Moment Correlation.
Activity Guide for Hands-on Assessment of Science Process Skills (AGHASPS)
This instrument was designed by the researchers to guide the activities that were used to determine
pre-primary school children’s proficiency in the science process skills of observing, classifying, inferring,
communicating, measuring and predicting before and after intervention. It is a hands-on assessment guide
and the children were required do each of the activities specified for all the process skills to be assessed
while the researchers or research assistant recorded their observation using the rating scale prepared for
the hands-on assessment. There are specific process skills activities children must carry out to
demonstrate their proficiency in each skill. It is made up of four columns; which are; serial number,
materials to be used, activity and process skills to be assessed The hands-on assessment is the most
suitable type of process skills assessment for pre-primary school children as multiple choice format of
process skills assessment is not appropriate for young children. The content and face validity was
established by experts in Early Childhood Education, Science Education and pre-primary school teachers
who have taught this class for a minimum of five years. Necessary adjustments were made based on their
recommendations.
Science Process Skills Rubric This instrument was designed by the researchers to guide teachers’ and research assistants’ scoring of the
Science Process Skills Rating Scale. It was used to determine specifically what children did to obtain the
following marks indicated in the Science Process Skills Rating Scale; no performance (1mark), moderate

IOJPE
ISSN: 1300 – 915X
www.iojpe.org
International Online Journal of Primary Education 2021, volume 10, issue 1
Copyright © International Online Journal of Primary Education 111
performance (2marks), satisfactory performance (3 marks) and excellent performance (4 marks) using the
activity guide for hands–on assessment of science process skills. For instance to determine children’s
performance in the process skills of observation, children were expected to utilise all the senses. A child
was scored no performance or 0 mark when he/she could not utilise any of the senses, moderate
performance when he/she can utilise at least two senses, satisfactory performance when he/she could
utilise three senses and excellent performance when he/she could utilise all five senses. This instrument is
made up of five columns which are; process skills indicators, no performance (1mark), moderate
performance (2 marks), satisfactory performance (3 marks) and excellent performance (4 marks). Copies
of the instrument were given to experts in Early Childhood Education and Science Education. Also, pre-
primary school teachers who have taught this class for a minimum of five years were given copies of the
instrument. They determined its content and face validity and the clarity of its items.
Procedure
This study lasted for nine weeks. Five scientific activities were selected for the study in line with the
Nigerian pre-primary school curriculum. These activities are; exploring with living things, exploring with
non-living things, sense organs, exploration of seeds, planting of seeds and exploring with sinking and
floating objects. During the first week, a letter of authorization was collected from the Local Government
Education office and presented to Head teachers of participating schools for permission to use their
schools, staff and pre-primary children for the study. For ethical reasons, consent letters were written and
given to parents of the children that participated in the study to give their consent.
By the second week, pre-primary teachers assigned to both formal and informal sciencing groups and
research assistants were trained on how to teach science using formal and informal sciencing activities
and to administer the Science Process Skills Rating Scale (SPSRS). By the third week all pre-primary
school children in the experimental and control groups were exposed to pre-test where the researcher and
research assistants administered Science Process Skills Rating Scale (SPSRS) in order to determine the
comparability of the three groups and this phase lasted for one week. The treatment phase lasted for five
weeks, the experimental groups were exposed to treatments (formal sciencing and informal sciencing)
while the control group were exposed to the conventional strategy.
For the formal sciencing group the activities were as follows:
Step 1 (Sciencing Stage): The teacher plans the sciencing activities, prepares materials to be used for
sciencing activities, and uses questions to activate children’s prior knowledge. Children answer teacher’s
questions and make predictions before the exploration. Children watch short video on the lesson to be
taught and answer questions. Both teacher and children sing science songs relevant to the topic and recite
poems relevant to the science topic.
Step 2 (Sciencing Stage): Teacher guides children’s explorations and documentation of science
experiences. Children make their own discoveries, and document their discoveries in their science journal
by drawing.
Step 3 (Post-Sciencing Stage): Children and teacher reflect on the science experiences and apply the
knowledge gained into real life situations.
For the informal sciencing group the activities were as follows:
Step 1 (Pre-Sciencing Stage): The teacher provides science materials which are structured in line with all
the lesson/activities that were carried out during this study in the science corner for children to explore.
The teacher also provides short videos, songs and rhymes relevant to the lessons/activities at the science
corner.

IOJPE
ISSN: 1300 – 915X
www.iojpe.org
International Online Journal of Primary Education 2021, volume 10, issue 1
Copyright © International Online Journal of Primary Education 112
Step 2 (Sciencing Stage): Children explore the materials in the science corner in whatever way they
choose to, the teacher observes their exploration and gives them minimal support.
Step 3 (Post-Sciencing Stage): After exploration, the teacher finds out about children’s discoveries by
asking them questions and the teacher guides them to relate their experiences into real life situations.
For the control group the activities were as follows:
Step I: The teacher introduces the lesson to the children by asking questions.
Step II: The teacher teaches directly using chalk board.
Step III: Teacher asks children questions to see if they understand the lesson.
During the ninth week administration of post-test occurred across all groups.
Data Analysis
Analysis of Covariance (ANCOVA) was utilized to analyse the data collected. In order to determine the
magnitude of the mean scores of each group, estimated marginal means aspect of ANCOVA was used.
Also, to determine the sources of significant treatment effects observed on the ANCOVA, Scheffe
Post-hoc analysis was used.
RESULT
H01: There is no significant main effect of treatment on pre-primary school children’s acquisition of
science process skills.
Table 1. Summary of analysis of covariance on pre-primary school children science process skills
Table 1 shows that there is a significant main effect of treatment on children’s science process skills
(F(2, 52)=47.72; p<.05; ῆ2=.65). Therefore, hypothesis 1 is rejected. To identify which of the three
treatments have more effect on science process skills, Table 2 presents the estimated marginal means
scores across the various groups.
Source Type III Sum of
Squares
Df Mean Square F Sig. Partial Eta
Squared
Corrected Model 1404.512a 12 117.043 35.194 .000 .890
Intercept 234.785 1 234.785 70.598 .000 .576
Prescoreskills 142.769 1 142.769 42.930 .000 .452
Treatment 317.381 2 158.691 47.717 .000 .647
Gender .465 1 .465 .140 .710 .003
Ethnic 22.463 1 22.463 6.754 .012 .115
treatment * gender .298 2 .149 .045 .956 .002
treatment * ethnic 1,750 2 .875 .263 .770 .010
gender * ethnic ,127 1 .127 .038 .846 .001
treatment * gender * ethnic 12.108 2 6.054 1.820 .172 .065
Error 172.934 52 3.326
Total 7190.000 65
Corrected Total 1577.446 64
a. R Squared = .890 (Adjusted R Squared = .865)

IOJPE
ISSN: 1300 – 915X
www.iojpe.org
International Online Journal of Primary Education 2021, volume 10, issue 1
Copyright © International Online Journal of Primary Education 113
Table 2. Estimated marginal means of the science process skills across the three groups
Variables Mean Std. Error
Intercept
Pre-score process skill
Post-score process skill
5.28
9.552
-
.292
Treatment
Exp. I (Formal)
Exp. II (Informal)
Control (Conventional)
13.21
10.35
5.11
.476
.464
.628
Table 2 indicates that the general performance of the children in science process skills at post-test level
known as the post behaviour (Mean=9.55) is higher than their performance at the pre-test score
(Mean=5.28) known as the entry behaviour. Again, the Table 2 shows that children exposed to formal
sciencing (Experimental I) have the highest science process skills mean score (13.21), followed by those
exposed to informal sciencing (Experimental II) (10.35) while those exposed to conventional strategy
have the lowest science process skills mean score (5.11). The performance in science process skills across
the groups are hereby presented in figure 1 as a bar chart.
Figure 1: Performance of children in science process skills across the groups
Table 3. Scheffe’ post hoc pairwise comparison on science process skills
Groups Exp. I Exp. II Control
Exp. I * *
Exp. II * *
Control * *
Note, * implies that there is a significant difference
Table 3 shows that the significant main effect that was revealed by Table 1 is as a result of the significant
difference between:
i. Experimental I and Experimental II,
ii. Experimental I and control and
iii. Experimental II and control
This implies that formal sciencing enhances the children acquisition of science process skills significantly
better than informal sciencing while informal sciencing is also significantly better than conventional
strategy in enhancing the skills acquisition.
H02: There is no significant main effect of ethnic affiliation on pre-primary school children’s science
process skills.

IOJPE
ISSN: 1300 – 915X
www.iojpe.org
International Online Journal of Primary Education 2021, volume 10, issue 1
Copyright © International Online Journal of Primary Education 114
Table 1 shows that there is a significant main effect of ethnic affiliation on children’s science process
skills (F(1, 52)=6.75; p<.05; ῆ2=.12). Therefore, hypothesis 2 is rejected. In order to know which of the
ethnic groups has the higher science process skills, estimated marginal means was performed and the
summary is presented in Table 4.
Table 4. Estimated marginal means of children’s process skills across ethnic groups
Variables Mean Std. Error
Science process skills
Yoruba
Non-Yoruba
10.33
8.70
.288
.518
Table 4 shows that Yoruba children had significantly higher science process skills mean score (10.33)
than non-Yoruba children (8.70). This performance is graphically represented in a bar chart as shown in
figure 2.
Figure 2: Children’s science process skills across the ethnic affiliations
H03: There is no significant main effect of gender on pre-primary school children’s science process skills.
Table 1 shows that there is no significant main effect of gender on children’s science process skills
(F(1,52)=.14; p>.05; ῆ2=.00). Therefore, hypothesis 3 is not rejected.
DISCUSSION and CONCLUSION
The findings of this study indicated a significant main effect of treatment on pre-primary school
children’s science process skills. Children exposed to formal sciencing activities had the highest mean
score, followed by children exposed to informal sciencing activities while children taught with the
conventional strategy had the least mean score. This means that both formal and informal sciencing
activities are more effective in fostering the acquisition of the science process skills of pre-primary school
children than the conventional strategy. The reason for this could be attributed to the fact that children
exposed to formal and informal sciencing activities were actively engaged in hands-on activities where
they interacted with both living and non-living materials provided for them while children who were
taught with the conventional strategy were not actively engaged in hands-on activities but they were
taught science in abstract. Children’s active engagement during sciencing activities helped them to see
and manipulate materials and subsequently enhance their science process skills. This supports the
assertions of Suryanti, Ibrahim, and Lede (2018) and Andiema (2016) that the science process skills of
children can only be developed when they are engaged in experiential or active learning experiences that
involve exploration and manipulation of materials.
This therefore explains why formal and informal sciencing activities were more effective than the
conventional strategy. The significant main effect of sciencing activities on pre-primary school children’s

IOJPE
ISSN: 1300 – 915X
www.iojpe.org
International Online Journal of Primary Education 2021, volume 10, issue 1
Copyright © International Online Journal of Primary Education 115
science process skills is in agreement with the findings of Raymond (2015) that sciencing activities
improve the science process skills of children. Furthermore, the findings also showed that formal
sciencing activities enhanced the science process skills of pre-primary children better than informal
sciencing activities. This does not uphold the findings of Legoria (2012) that informal sciencing activities
are more effective in fostering the science process skills of children than the formal sciencing activities. It
was also established that children in the informal sciencing activities group performed better than children
in the conventional strategy group. This is contrary to the findings of Colgrove (2012) that there was no
significant difference between informal and conventional strategy in terms of the science process skills of
pre-primary school children. The findings that formal sciencing activities mean score is higher than the
conventional strategy mean scores corroborates the findings of Aydin (2020) that formal sciencing
activities were more effective than the conventional strategy in the fostering of the science process skills
of children.
The findings of the study also established a significant main effect of ethnic affiliation on pre-primary
school children’s science process skills. Yoruba children had significantly higher science process skills
mean score than non-Yoruba Children. In other words, Yoruba children performed better than non-
Yoruba children in science process skills. This finding could be as a result of the fact that the medium of
instruction/communication used in this study was the Yoruba language as recommended in the National
Policy on Education and majority of the children were Yoruba children. Therefore, non-Yoruba children
found it difficult to communicate with and interact with peers and teachers while carrying out sciencing
activities. The finding is in line with the assertions of Harlen (2014) that language particularly discussion
and interaction with others plays an important role in the development of skills. This therefore explains
why Yoruba children out performed non-Yoruba children in the science process skills. The significant
effect of ethnic affiliation on pre-primary school children’s science process skills is in congruence with
the findings of Duda, Susilo, and Newcombe (2019) that ethnic affiliation of children influences their
science process skills.
The findings of the study showed no significant main effect of gender on pre-primary school children’s
science process skills. This finding corroborates Yuliskurniawati et al. (2019) study outcomes which
found no gender difference in the science process skills of children. However, this result is contrary to the
study outcomes of Ihejiamazu, Neji, and Isaac (2020) and Simar (2013) which found gender difference in
the science process skills of children. This could be because sciencing activities allowed both girls and
boys be actively engaged in various activities therefore there were no disparities among both genders.
Conclusion
When pre-primary school children are exposed to formal sciencing activities where
experiences/explorations are hands on, structured and are guided by the teacher, it fosters the scientific
skills of children better than when they are exposed to informal sciencing activities that are not structured
and are given little guidance by the teacher. It also fosters scientific knowledge and skills better than the
conventional strategy. This is because formal sciencing activities are more directional, purposeful,
intentional and interactive than informal sciencing activities and conventional strategy. The study has also
established that ethnic affiliation can hinder pre-primary school children’s science process skills
especially when the medium of instruction is not their own language.
Based on the findings of this study the following recommendations are made:
Pre-primary school teachers should adopt sciencing activities in fostering of scientific skills of pre-
primary school children.
All pre-service Early Childhood Education teachers at the Colleges of Education and the Universities
should be exposed how to teach science at the pre-primary level using sciencing activities. This can

IOJPE
ISSN: 1300 – 915X
www.iojpe.org
International Online Journal of Primary Education 2021, volume 10, issue 1
Copyright © International Online Journal of Primary Education 116
be done by incorporating and emphasising the use of sciencing activities when pre-service teachers in
Colleges of Education are taught ECE 127 (Early Childhood Science) and when pre-service teachers
in the Universities are taught the course science in the early years.
Teachers should also make use of readily available materials in the immediate environment for
sciencing activities to be carried out effectively in pre-primary classes.
The rate at which children at the pre-primary level acquire science process skills when they are taught
science in their own indigenous language also demands that children at that level should not be taught
science in a language that they do not understand. However, in a situation whereby a teacher notices
that some children in his/her class do not understand the language used as medium of instruction,
he/she could make use of “Peer interpreters” that is a child or children in the class who understand
both languages should be paired with another child who does not.
Activity based science text books emphasizing sciencing activities and teachers’ guides should be
written and produced in at least the three major Nigerian languages for the pre-primary level of
education.
Workshops and seminars should be organized to train teachers how to teach science using sciencing
activities.
The study is limited to pre-primary school children in Ibadan, Oyo state, Nigeria. The study determined
the impact of sciencing activities on pre-primary science learning outcomes. In the course of the study
some other constraints encountered were:
1. Transportation of both living and non-living instructional materials, audio visual materials and
generator for the sciencing activities daily because there was no safe place to keep them was very
tasking.
2. The outcome of the first planting experiment was not successful because the plants had to be locked
in the classroom after school hours for fear of being damaged by touts and miscreants that take over
the schools after school hours.
3. Technological issues with the generator and audio visual materials.
4. Teachers’ carefree attitude towards the study posed some frustrations on the researchers and research
assistants.
5. Children’s lack of exposure to the science materials made them to damage the materials and be over
excited.
6. Children in the informal sciencing group were more interested in watching the video than explore at
the science corner.
7. Children from other classes also come to play at the science corner during break time and this caused
distractions for the children in the informal sciencing group.
8. The living and non-living materials in the science corner distracted children from other class
activities.
REFERENCES
Andiema, N. C. (2016). Effect of child centered methods on teaching and learning of science activities in pre-schools in Kenya.
Journal of Education and Practice, 7(27), 222-288.
Association for Childhood Education International (2012). Ten pillars of a good childhood. August 6, 2017 retrieved from
https://acei.org/decade-for-childhood.html
Aydin, G. (2020). The effects of guided inquiry-based learning implementations on 4th grades students and elementary teachers:
A case study. Elementary Education Online, 19(3), 1155-1184.
Browne, K. W., & Gordon A. M. (2009). To teach well: An early childhood practicum guide. Upper-Saddle River, New Jersey:
Pearson Education.

IOJPE
ISSN: 1300 – 915X
www.iojpe.org
International Online Journal of Primary Education 2021, volume 10, issue 1
Copyright © International Online Journal of Primary Education 117
Chidiebere, D. B. (2008). The effects of problem-solving strategy and lecture method on socio-cultural beliefs hindering science
learning at the junior secondary school in FCT Abuja (Doctoral dissertation), Ahmadu Bello University, Zaria.
Cohen, L, Manion, L., & Morrison, K. (2007). Research methods in education. 6th Edition. London: Routledge. p. 276-278.
Colgrove, A. (2012). Approaches to teaching young children science concepts, vocabulary and scientific problem-solving skills
and role of classroom environment. January 01, 2021 retrieved from
https://digitalcommons.unl.edu/cgi/viewcontent.cgi?referer=https://www.google.com/&httpsredir=1&article=1157&cont
ext=cehsdiss
Duda, H., Susilo, H., & Newcombe, P. (2019). Enhancing different ethnicity science process skills: problem-based learning
through practicum and authentic assessment. International Journal of Instruction 12(1), 1207-1222.
Durham, J. (2017). Science process skills. Retrieved (August 26, 2020) from
https://inventorsoftomorrow.com/2017/01/19/science-process-skills/
Federal Republic of Nigeria [FRN] (2013). National policy on education. 6th Edition. NERDC, Lagos.
Githinji, A. W. (2011). Pre-School children’s performance in prediction and hypothesizing: A study of Isinya and Ngong
divisions of Kajiado district, Kenya. Retrieved (September 1, 2020) from
https://ir-library.ku.ac.ke/handle/123456789/1817
Haque, N., Nasrin, S., Yesmin, M., & Biswas, M. (2013). Universal primary education: a comparative study. American Journal
of Educational Research, 1(1), 31-36.
Harlen, W. (2014). Helping children’s development of inquiry skills. Inquiry in Primary Science Education, 1(1), 5-19.
Hernawati, D., Amin, M., Irawati, H., Indriwati E., & Omar, N. (2018). The effectiveness of scientific approach using
encyclopedia as learning materials in improving students’ science process skills in science. Journal Pendidikan IPA
Indonesia (JPII), 7(3), 266-272.
Ihejiamazu, C., Neji, H., & Isaac, A. (2020). Correlates of Science Process Skills Knowledge among Senior Secondary II Biology
Students in Cross River State, Nigeria. European Journal of Scientific Research, 155(3), 346-355.
Legoria, M. F. (2012). An exploratory study of informal science learning by children ages 2-12 years at selected US children’s
garden. (LSU Doctoral Dissertations). Louisiana State University, US. December 30, 2020 retrieved from
https://digitalcommons.lsu.edu/cgi/viewcontent.cgi?article=4578&context=gradschool_dissertations
Lind, K. (1999). Dialogue on early childhood science, mathematics and technology education: Science in early childhood
developing and acquiring fundamental concepts and skills. May 27, 2016 retrieved from
http:// www.project2061.org/publications/earlychildonline/experience/lind.htm
Luykx, A., Lee, O., Mahotiere, M., Lester, B., & Deaktor, R. (2007). Cultural and home language influences on children’s
responses to science assessments. Teachers College Record, 109(4), 879-926.
Martin, D. J. (2001). Constructing early childhood science. Albany, NY: Delmar Thomson Learning.
Mayesky, M. (1990). Creative activities for young children (4th ed). Albany, N.Y: Delmar Publishers.
Murphy, C., Smith, G., & Broderick, N. (2019). A starting point: Provide children opportunities to engage with scientific
inquiry and nature of science. Research in Science Education. April 4, 2021 retrieved from
www.link.springer.com/content/pdf/10.1007/s11165-019-98250.pdf
Neuman, D. (1972). Sciencing for young children. Ideas that work with young children. K. R. Baker (ed), ideas that work with
young children. National Association for the Education of Young Children Washington, DC
Newton, L. D., & Newton, D. P. (2012). Primary children’s conceptions of science and the scientist: is the impact of a national
curriculum breaking down the stereotype? International Journal of Science Education, 20(9), 1137-1149.
Nigerian Educational Research and Development Council [NERDC]. (2013). One year pre-primary school education curriculum.
https://nerdc.org.ng/eCurriculum/
Oduolowu, E., & Akintemi E., (2017a). Analysis of science teaching practices of pre-primary teachers and children in Ibadan,
Oyo State, Nigeria. A paper presented at the ToyinFalola International Conference in Africa and the African Diaspora
(TOPAC) in conjuction with Adeyemi College of Education, Ondo, Nigeria. 3rd-5th July, 2017.

IOJPE
ISSN: 1300 – 915X
www.iojpe.org
International Online Journal of Primary Education 2021, volume 10, issue 1
Copyright © International Online Journal of Primary Education 118
Oduolowu, E., & Akintemi, E., (2017b). Assessment of pre-primary science learning environment and pre-primary school
children’s performance in science process skills in Ibadan, Nigeria. A paper presented at the Aga Khan University
Institute for Human Development Conference on Early Childhood Development Nov 7-9, 2017 at Der es Salaam,
Tanzania.
Padilla, M. J. (1990). The science process skills. Research matters-To the science teacher, No. 9004. Reston, VA: National
Association for Research in Science Teaching (NARST). http://www.narst.org/publications/research/skill.cfm
Raymond, C. (2015). Professional development and family engagement program year one evaluation report. Raymond
Consulting, Inc.
Soete, L., Schneegans, S., Eröcal, D., Angathevar, B., & Rasiah, R. (2015). UNESCO science report: Towards 2030 – Executive
summary. UNESCO Digital Library. Retrieved from https://unesdoc.unesco.org/ark:/48223/pf0000235407
Seefeldt, C., & Galper, A. (2007). “Sciencing” and young children. Early Childhood Today, 21(7), 12-13.
Seefeldt, C., & Galper, A. (2017). Professional development: “Sciencing” and young children. Retrieved May 6, 2017 from
https://www.scholastic.com/teachers/articles/teaching-content/professional-development-quotsciencingquot-and-young-
children/
Shrooti, S. (2011). Individual difference and educational implications-thinking intelligence and
attitude. Retrieved Dec 31, 2020 from https://www.slideshare.net/Shrootishah/individual-differences-28706183
Simsar, A. (2013). Turkish students’ attitudes towards science in early childhood education. (Doctoral dissertation). University
of Dayton, US.
Suryanti, I., Ibrahim, M., & Lede, N. (2018). Process skills approach to develop primary students’ scientific literacy: A case
study with low achieving students on water cycle. The Consortium of Asia-Pacific Education Universities (CAPEU). IOP
Conf. Series: Materials Science and Engineering 296 (2018) 012030 doi:10.1088/1757-899X/296/1/012030, p. 1-
6.1 April, 2021 retrieved from https://iopscience.iop.org/article/10.1088/1757-899X/296/1/012030/pdf
Universal Basic Education (2010). Manual for the re-training of basic education managers/inspectors and supervisors in Kwara
State on UBE 2010. Teacher professional development programmme.
Yennizar, Z., Eriyam, E., Susanti, W., & Kausari, D. (2020). Application of lesson study with scientific approach: A case study
of early childhood education. Journal of Critical Reviews, 7(7), 104-111.
Yuliskurniawati, I., Noviyanti, N., Mukti, W., Mahanal, S., & Zubaidah, S. (2019). Science process skills based on genders of
high school students. June 2019 Journal of Physics Conference Series 1241:012055 DOI:
10.1088/1742-6596/1241/1/012055. 4 April, 2021 retrieved from
https://iopscience.iop.org/article/10.1088/1742-6596/1241/1/012055/meta

IOJPE
ISSN: 1300 – 915X
www.iojpe.org
International Online Journal of Primary Education 2021, volume 10, issue 1
Copyright © International Online Journal of Primary Education 119
PLAYFULNESS OF PRE-SCHOOL CHILDREN IN TURKEY
Dondu Neslihan BAY
Assoc.Prof.Dr., Eskisehir Osmangazi University, Turkey
ORCID: https://orcid.org/0000-0002-2656-0458
Received: July 15, 2020 Accepted: November 03, 2020 Published: June 30, 2021
Suggested Citation:
Bay, D. N. (2021). Playfulness of pre-school children in Turkey. International Online Journal of Primary Education
(IOJPE), 10(1), 119-136.
This is an open access article under the CC BY 4.0 license.
Abstract
In this research, the playfulness of 4- and 5-years-old 181 children, 100 boys and 81 girls, attending a kindergarten in
Turkey, was examined. The research was designed according to relational-correlational survey/research model, one of the
quantitative research methods; the data were collected using Personal Information Form and Children’s Playfulness Scale
(CPS) developed by Barnett (1990) and adapted to Turkish by Keleş and Yurt (2017). The playfulness levels of the children
were analyzed according to gender, age, number of children in the family, duration of pre-school education,
mother’s/father’s age and education level, mother's working status, and father's profession. To identify the playfulness levels
of pre-school children, descriptive statistics and difference statistics were calculated for both overall and each sub-dimension
according to the demographic characteristics of the children. As a result of the study, the playfulness levels of the children
were found to be high and physical spontaneity was observed to be the playfulness characteristic with the highest score.
Significant differences were observed in playfulness of children according to age and duration of pre-school education;
whereas no significant difference was observed according to gender, mother’s/father’s age and education level, mother's
working status, and father's profession.
Keywords: Playfulness, play, early childhood education, child, Turkey.
INTRODUCTION
Providing education in line with the interests and needs of children in pre-school education
institutions and supporting the development of children at maximum level are considered very
important in Turkey. With the increase of the importance of the pre-school education in the country,
researches on children's plays have increased (e.g., Aksoy & Yaralı, 2017; Gündüz, Aktepe,
Uzunoğlu, & Gündüz, 2017; Sapsağlam, 2018; Tuğrul, Boz, Uludağ, Aslan, Çelik, & Çapan, 2019).
Game-based approach has been set as one of the basic principles of the Pre-school Education Program
(2013), which has been put into practice by the Ministry of National Education. The researches
involving the playing behaviors of pre-school children in Turkey, will contribute to increasing the
quality of pre-school education.
Besides the individual differences of children, cultural and environmental differences cause their
cognitive, language, social-emotional and motor development to develop at different rates (Shepard,
Kagan, & Wurtz, 1998). Teachers should organize the educational setting by considering all these
differentiating factors and provide opportunities for children to develop their potential using
supportive methods (Cukierkorn, Karnes, & Manning, 2007). Organizing an educational setting
suitable to play increases the participation of the children and allow them to achieve a better learning
and development (Jones & Reynolds, 2011). In such a setting, children's imaginations, creativity and
academic achievements develop (Kangas & Ruokamo, 2012). However, the increasing tendency
towards acquiring learning and academic skills has created the necessity of intervention in
establishing a playful and creative environment in pre-school education (Lobman, 2003). Children
only perceive the activities they initiate as play, they see the activities that are structured and directed
by the teacher as learning, not play, and therefore learning does not take place in such cases (Karrby,
1989). Instead of limiting or directing the activities, teachers should find ways to get clues from
children's behavior and to expand, and improve their participation (Lobman, 2006). In this study, the

IOJPE
ISSN: 1300 – 915X
www.iojpe.org
International Online Journal of Primary Education 2021, volume 10, issue 1
Copyright © International Online Journal of Primary Education 120
playfulness levels of 181 children attending pre-school education in Turkey were analyzed through
independent variables, based on their teachers' observations. As far as is known, no research has been
conducted for this cultural structure in this context.
The Importance of Playfulness of Pre-school Children Study
There are some reasons that are considered as important in planning the study on the playfulness of
children. One of the most important reasons is the studies revealing that playfulness has an important
effect on children’s learning and development (Barnett, 1991a, 1991b, 2007; Cornelli Sanderson,
2010; Youell, 2008). Playfulness is an important part of the play (Youell, 2008). Play helps children
overcome ordinary challenges they encounter in their lives and share their experiences with adults and
peers. The factor that allows children to enjoy their play with their free will and reveal their creativity
is having the spirit of playfulness (Singer, 2015). Play can be defined through observable features,
however playfulness, which is defined as the child's disposition to play (Keleş & Yurt, 2017) involves children’s intrinsic characteristics, depending on the feelings in the play process (Howard,
Bellin, & Rees, 2002). These intrinsic features are; the internal motivation of the children independent
of external factors, the ability to specify or manage the play, the freedom to use the imagination, and
the ability to communicate and interpret in the play process (Pinchover, 2017). Considering the effect
of these features on learning, it is important to think about children’s perspective as players and to
motivate learning through activities they perceive as plays (Howard, Bellin, & Rees, 2002).
The second important reason is the effect of understanding and improving children's playfulness on
pedagogical goals (Jones & Reynolds, 2011). When the child plays a game within the activity, it is not
clear whether he/she is playing voluntarily (Bateson & Martin, 2013; Howard, Bellin, & Rees, 2002).
Teachers who begin to understand children's play and playfulness, can create more entertaining
educational settings by planning activities that allow children to show their playfulness (Carter, 1993).
Therefore, teachers should observe, understand and support children's playing behavior (Broadhead,
Howard, & Wood, 2010), instead of spoiling their fun by using children's play according to the
educational goals (Pramling Samuelsson & Carlsson, 2008). Because, the developmental potential of
the play is maximized when children perceive the activity as a play and participate in it as a player.
However, further information is needed to understand children's play perceptions and playfulness
(Howard, Bellin, & Rees, 2002). Children start the play based on different motivations and
tendencies. These motivations and tendencies defined as playfulness constitute the child's attitude
during play. Children willingly decide with whom, how, when and how much to play in their games
and enjoy playing by giving meaning to objects as imagined and desired, and adding their own humor,
without being tied to the objective reality. All these playfulness attitudes differ between children
(Román-Oyola, Figueroa-Feliciano, Torres-Martínez, Torres-Vélez, Encarnación-Pizarro, Fragoso-
Pagán, & Torres-Colón, 2018). For this reason, the playfulness characteristics of children should be
examined, and their changing playfulness behaviors should be understood by teachers.
In addition, discovering the effectiveness of various variables on children's playfulness also facilitates
understanding children's playfulness characteristics. Some of the variables that have been found to be
correlated with the playfulness of children in previous studies are; gender (e.g., Barnett, 1991b;
Cornelli Sanderson, 2010; Saunders, Sayer, & Goodale, 1999; Tae-Hyung, Tae-Hyun, & Jae-Shin,
2014; Zachopoulou, Trevlas, & Tsikriki, 2004), age (e.g., Barnett, 1991b; Cornelli Sanderson, 2010;
Lieberman, 1965; Rentzou, 2013; Saunders, Sayer, & Goodale, 1999), number of people in the family
(e.g., Barnett, 1991b; Barnett & Kleiber, 1984; Rentzou, 2013) and parents' occupation and age (e.g.,
Barnett & Kleiber, 1984). In Turkey, there are limited number of studies on children's playfulness
(e.g. Keles & Yurt, 2017; Macun & Güvendi, 2019) and these studies fail to adequately represent
pre-school children's playfulness characteristics. This creates the need to determine children's
playfulness levels and to investigate the variables according to which children's playfulness levels
differ. In order to contribute to the existing literature, the playfulness characteristics of the children
were examined according to various variables in a new cultural context, namely Turkey.

IOJPE
ISSN: 1300 – 915X
www.iojpe.org
International Online Journal of Primary Education 2021, volume 10, issue 1
Copyright © International Online Journal of Primary Education 121
Theoretical Framework
Playfulness is the pure essence of the play (Cornelli Sanderson, 2010; Rentzou, 2013; Youell, 2008).
Huizinga criticized focusing on the educational benefits of the play and argued that the essence of the
play was lost with the functionalist play approach (Singer, 2013). According to Huizinga, the play
cannot be played by force, it is played voluntarily depending on the person's will. At the same time,
the play frees individuals by allowing them to create alternative worlds and identities far from their
daily lives (Huizinga, 1955; Masters, 2008; Singer, 2013). Huizinga's play theory provides an
important framework for defining the elements of the play and playfulness and analyzing the
reflections of player interactions on societies and cultures (Masters, 2008). Contrary to the assumption
that the play should serve other purposes outside the play, which is highlighted by the other play
theories, Huizinga stated that the benefits of the play cannot be achieved without experiencing the fun,
which is the essence of the play. Children play the game because they want it, not for its benefit
(Singer, 2013). As a result, Huizinga’s theory emphasizes the playfulness spirit of the game, which is
a voluntary activity, which gives pleasure and freedom (Huizinga, 1955; Masters, 2008; Singer, 2013;
Singer, 2015). Understanding the reflection of playfulness in children's own culture should be seen as
a premise in achieving development and learning goals through play. Turkey does not have sufficient
amount of research on children's playfulness (e.g. Keles and Yurt, 2017; Macun & Güvendi, 2019). In
this context, it is thought that determining children's playfulness level within their own culture in
Turkey and identifying the variables affecting this level will contribute to support their development
and learning.
Purpose of the Current Study
Besides being a personal tendency (Lieberman, 1977), playfulness is a reflection of the culture
(Huizinga, 1955; Trevarthen, 2011). Therefore, the results obtained from different cultures make
contribution to the literature (Keleş & Yurt, 2017). The purpose of this research is analyzing the
playfulness level of the children who attend pre-school educational institutions in Turkey according to
different factors. In the current study, teachers were asked to fill the playfulness scale to identify the
playfulness levels of the children in their classes.
In this study, the following primary question and two sub-questions were addressed:
What are the playfulness levels of pre-school children and the variables that affect these levels?
1. What are the playfulness levels of pre-school children?
2. Do the playfulness levels of pre-school children significantly differ according to their demographic
characteristics (Gender, age, number of children in the family, duration of pre-school education,
mother’s/father’s age and education level, mother's working status, and father's profession)?
METHOD
This study, in which the playfulness of pre-school children and whether children’s playing tendency
shows a significant difference according to the demographic characteristics were investigated, was
designed according to relational-correlational survey/research model, which is one of the quantitative
research methods. Relational-correlational survey/research is a research approach aiming to describe a
situation that existed in the past or that still exists as it is (Karasar, 2008).
In the research, the playfulness of pre-school children is included in the study as the dependent
variable; whereas children’s age, gender, number of children in the family, duration of pre-school
education, mother’s/father’s age and education level, mother's working status, and father's profession
were included as independent variables.
Participants
This study was carried out with 181 children attending a pre-school education institution in Eskişehir
province, in 2019-2020 academic year. In the study, typical case sampling, one of purposeful
sampling methods was used. Neuman (2014) states that typical case sampling method is used in

IOJPE
ISSN: 1300 – 915X
www.iojpe.org
International Online Journal of Primary Education 2021, volume 10, issue 1
Copyright © International Online Journal of Primary Education 122
researches where a specific application is evaluated, or a typical situation is examined. Accordingly,
based on the sampling feature (McNabb, 2015), the study was conducted with 181 pre-school children
in a school at the center, which shows typical characteristics of Eskişehir.
The distribution of the children participating in the study according to their demographic
characteristics were analyzed and the results are shown in Table 1.
Table 1. Frequency and percentages of pre-school children participating in the research according to
demographic characteristics
Variable Category f %
Age 4-years-old 53 29.3
5-years-old 128 70.7
Gender Female 81 44.8
Male 100 55.8
Number of children in the family 1 child 55 30.4
2 children 95 52.5
3 children and more 31 17.1
Duration of pre-school education 1 year 112 61.9
2 years and more 69 38.1
Mother’s age Less than 30 years old 29 16.0
30-39-years-old 136 75.1
More than 40 years old 16 8.8
Father’s age Less than 30 years old 14 7.7
30-39-years-old 136 75.1
More than 40 years old 31 17.1
Mother’s Education Secondary school or less 50 27.6
High school 89 49.2
University and more 42 23.2
Father’s Education Secondary school or less 47 26.0
High school 98 54.1
University and more 36 19.9
Mother’s working status Not working 126 69.6
Working 55 30.4
Father’s Profession Unemployed 3 1.7
Civil servant 25 13.8
Worker 85 47.0
Self-employed 68 37.6
Regarding the information in Table 1, 29.3% (n=53) of the children participating in the study were
4-year-old and 70.7% (n=128) were 5-year-old. 44.8% (n=81) of the children were girls, and 55.2%
(n=100) were boys. Of the children, 30.4% (n=55) were the only child of the family, there are two
children in the family of 52.5% (n=95), and there are three or more children in the family of 17.1%
(n=31). 61.9% (n=112) of the children attended pre-school education for a year and 38.1% (n=69) for
two or more years. Regarding the age of pre-school children’s mothers, 16.0% (n=29) were less than
30, 75.1% (n=136) were 30-39-years-old, and 8.8% (n=16) were more than 40 years old. Regarding
the age of their fathers, 7.7% (n=14) were less than 30, 75.1% (n=136) were 30-39-year-old, and
17.1% (n=31) were more than 40. Regarding the education of the mothers, 27.6% (n=50) of them
were graduated from secondary school and below, 49.2% (n=89) from high school, and 23.2% (n=42)
were university graduate or more. The education of the fathers are as follows: 26.0% (n=47) were
primary or secondary school graduate, 54.1% (n=89) were high school graduate, and 19.9% (n=36)
were university graduate or more. The mothers of 69.6% (n=126) of the children were not working,
whereas 30.4% (n=55) were working. Regarding the profession of the fathers, 1.7% (n=3) were
observed to be unemployed; 13.8% (n=25) were civil servants, 47.0% (n=85) were workers, and
37.6% (n=68) were self-employed.

IOJPE
ISSN: 1300 – 915X
www.iojpe.org
International Online Journal of Primary Education 2021, volume 10, issue 1
Copyright © International Online Journal of Primary Education 123
Data Collection
The data were collected from the children attending pre-school education institutions using Personal
Information Form and Children’s Playfulness Scale (CPS).
Personal Information Form: It has been developed by the researcher to collect information about
children’s age, gender, number of children in the family, duration of pre-school education,
mother’s/father’s age and education level, mother's working status, and father's profession. Personal
Information Form was filled out by the teachers of the children.
Children’s Playfulness Scale (CPS): CPS, which has been developed by Barnett (1990) and adapted
to Turkish by Keleş and Yurt (2017), was used to identify the playfulness level of the children
attending pre-school education. The scale consists of 23 items grouped under five dimensions. The
scale is answered by the teachers for each child. Items in the scale were rated in 5-point Likert scale,
where 1 means “It doesn’t fit to this child at all” and 5 means “It completely fit to this child”. Two of
the scale items contain negative expressions, whereas the other items are positive. The scale is used to
identify the playfulness levels of 29-61.5-month-old children.
In the process of adapting CPS to Turkish, first, four people who are familiar with both languages
undertook the translation process, then the translations were compared, and expert opinions were
received from five academicians working in the field of pre-school education. In the first pilot study,
the scale was filled for 79 children by their teachers and the expressions of the items were revised. A
second pilot study was conducted to confirm the validity and reliability of the research, in which scale
items whose translations were finalized were filled for 196 children by their teachers (Keleş & Yurt,
2017).
Then, first level and then second level confirmatory factor analysis were performed. As a result of the
analysis, each item of the scale was found to significantly explain the sub-dimension to which it
belongs. The standardized factor loads of the items included in the sub-dimensions were found to vary
as follows: physical spontaneity .68 - .91; social spontaneity .48 - .89; cognitive spontaneity .55 - .89;
manifest joy .68 - .90; and sense of humor .63 - .82. Model-data fit values calculated in the second
level confirmatory factor analysis (X2/df=2.84, RMSEA=.097, CFI=.97, NFI=.96, NNFI=.97,
GFI=.78, RFI=.95), show that the 5-dimensional 23-item structure was confirmed in the Turkish
sample (Keleş & Yurt, 2017).
To determine the reliability of the answers given to the scale items, Cronbach alpha coefficients and
McDonalds’ coefficients were calculated. Cronbach's alpha coefficients were found to be ranged
from .79 to .92 and McDonalds coefficient from .80 to .93, thus the reliability of the scale items
related to their internal consistency was found to be high (Keleş & Yurt, 2017).
Within the scope of this research, CPS was answered by the teachers for 181 children. Cronbach alpha
reliability coefficients were calculated to determine the reliability of the answers given to the scale
items. As a result of this calculation, the reliability coefficients were found as follows: physical
spontaneity .863; social spontaneity .830; cognitive spontaneity .695; manifest joy .805; and sense of
humor .834. The reliability coefficient calculated for the overall scale was .942. These figures show
that the reliability of the answers given to the scale items is high for the children participating in the
research (Kalaycı, 2009).
Data Analysis
During data analysis, the data collected for 182 children were transferred to SPSS 23.0 program, and
the analysis were performed. After confirming that there is no missing and incorrect data, the scores
of the sub-dimensions and the whole scale were calculated. Afterwards, z statistics were used to
analyze the extreme value of the scores (sub-dimensions and overall) and 1 observation showing
extreme value was removed from the dataset. Skewness and kurtosis coefficients were calculated to
check the distribution of the scores of the remaining 181 pre-school children. The results are shown in
Table 2.
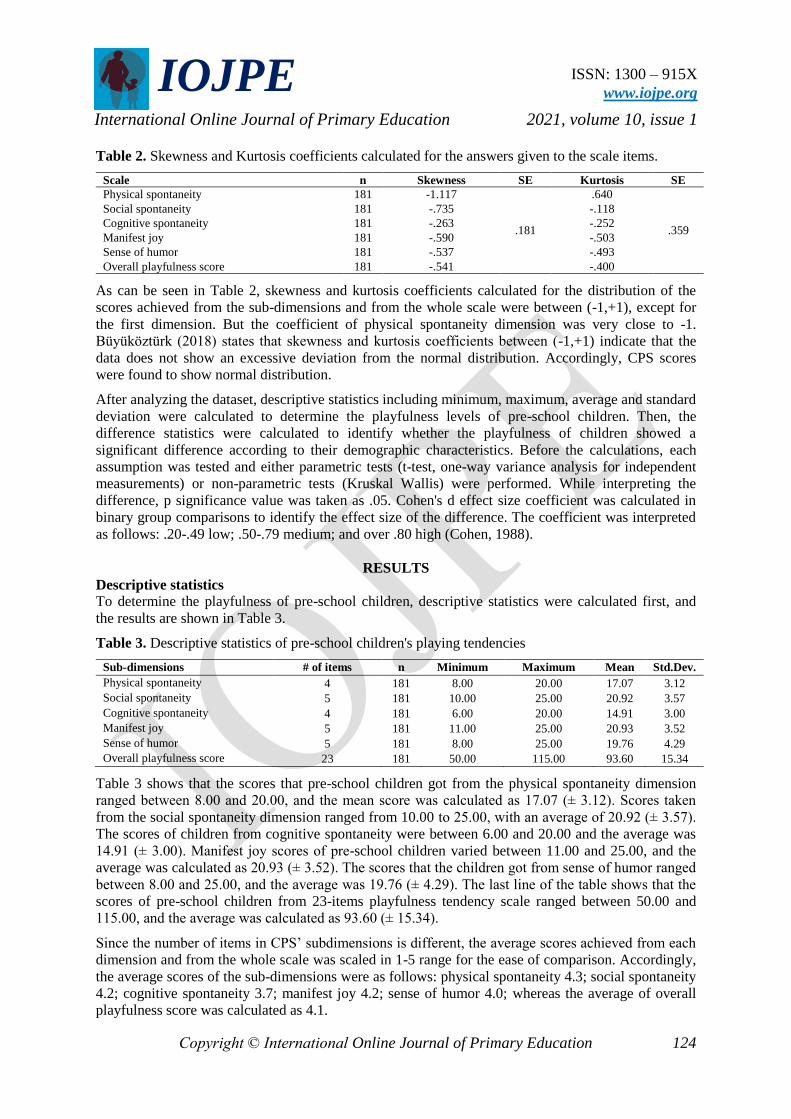
IOJPE
ISSN: 1300 – 915X
www.iojpe.org
International Online Journal of Primary Education 2021, volume 10, issue 1
Copyright © International Online Journal of Primary Education 124
Table 2. Skewness and Kurtosis coefficients calculated for the answers given to the scale items.
Scale n Skewness SE Kurtosis SE
Physical spontaneity 181 -1.117
.181
.640
.359
Social spontaneity 181 -.735 -.118
Cognitive spontaneity 181 -.263 -.252
Manifest joy 181 -.590 -.503
Sense of humor 181 -.537 -.493
Overall playfulness score 181 -.541 -.400
As can be seen in Table 2, skewness and kurtosis coefficients calculated for the distribution of the
scores achieved from the sub-dimensions and from the whole scale were between (-1,+1), except for
the first dimension. But the coefficient of physical spontaneity dimension was very close to -1.
Büyüköztürk (2018) states that skewness and kurtosis coefficients between (-1,+1) indicate that the
data does not show an excessive deviation from the normal distribution. Accordingly, CPS scores
were found to show normal distribution.
After analyzing the dataset, descriptive statistics including minimum, maximum, average and standard
deviation were calculated to determine the playfulness levels of pre-school children. Then, the
difference statistics were calculated to identify whether the playfulness of children showed a
significant difference according to their demographic characteristics. Before the calculations, each
assumption was tested and either parametric tests (t-test, one-way variance analysis for independent
measurements) or non-parametric tests (Kruskal Wallis) were performed. While interpreting the
difference, p significance value was taken as .05. Cohen's d effect size coefficient was calculated in
binary group comparisons to identify the effect size of the difference. The coefficient was interpreted
as follows: .20-.49 low; .50-.79 medium; and over .80 high (Cohen, 1988).
RESULTS
Descriptive statistics
To determine the playfulness of pre-school children, descriptive statistics were calculated first, and
the results are shown in Table 3.
Table 3. Descriptive statistics of pre-school children's playing tendencies
Sub-dimensions # of items n Minimum Maximum Mean Std.Dev.
Physical spontaneity 4 181 8.00 20.00 17.07 3.12
Social spontaneity 5 181 10.00 25.00 20.92 3.57
Cognitive spontaneity 4 181 6.00 20.00 14.91 3.00
Manifest joy 5 181 11.00 25.00 20.93 3.52
Sense of humor 5 181 8.00 25.00 19.76 4.29
Overall playfulness score 23 181 50.00 115.00 93.60 15.34
Table 3 shows that the scores that pre-school children got from the physical spontaneity dimension
ranged between 8.00 and 20.00, and the mean score was calculated as 17.07 (± 3.12). Scores taken
from the social spontaneity dimension ranged from 10.00 to 25.00, with an average of 20.92 (± 3.57).
The scores of children from cognitive spontaneity were between 6.00 and 20.00 and the average was
14.91 (± 3.00). Manifest joy scores of pre-school children varied between 11.00 and 25.00, and the
average was calculated as 20.93 (± 3.52). The scores that the children got from sense of humor ranged
between 8.00 and 25.00, and the average was 19.76 (± 4.29). The last line of the table shows that the
scores of pre-school children from 23-items playfulness tendency scale ranged between 50.00 and
115.00, and the average was calculated as 93.60 (± 15.34).
Since the number of items in CPS’ subdimensions is different, the average scores achieved from each
dimension and from the whole scale was scaled in 1-5 range for the ease of comparison. Accordingly,
the average scores of the sub-dimensions were as follows: physical spontaneity 4.3; social spontaneity
4.2; cognitive spontaneity 3.7; manifest joy 4.2; sense of humor 4.0; whereas the average of overall
playfulness score was calculated as 4.1.

IOJPE
ISSN: 1300 – 915X
www.iojpe.org
International Online Journal of Primary Education 2021, volume 10, issue 1
Copyright © International Online Journal of Primary Education 125
While interpreting the scores, the “ranges/number of categories” proposed by Tekin (2002) was
employed, then;
The scores between 1.0-2.3 were specified as low;
The scores between 2.3-3.7 were specified as medium;
The scores between 3.7-5.0 were specified as high
In line with this information, the playfulness of pre-school children participating in the study was
found to be high for all sub-dimensions and overall scale. The scores were ranked as physical
spontaneity, social spontaneity, manifest joy, sense of humor and cognitive spontaneity.
Difference statistics
The differentiation of the playfulness of children participating in the study according to age was
tested. The scores of the children according to age showed normal distribution, therefore t-test was
used in the comparison of the related measurements, and the results are shown in Table 4.
Table 4. Independent T-test results for pre-school children’s playfulness according to age
Scale Age n Mean Std.Dev. t df P d’
Physical spontaneity 4-years-old 53 16.25 3.07
2.323 179 .021* .35 5-years-old 128 17.41 3.09
Social spontaneity 4-years-old 53 19.09 3.44
4.690 179 .000* .70 5-years-old 128 21.68 3.35
Cognitive spontaneity 4-years-old 53 14.09 2.65
2.387 179 .018* .36 5-years-old 128 15.25 3.08
Manifest joy 4-years-old 53 20.28 3.20
1.606 179 .110 --- 5-years-old 128 21.20 3.62
Sense of humor
4-years-old 53 18.72 4.40 2.128 179 .035* .32
5-years-old 128 20.20 4.19
Overall playfulness
score
4-years-old 53 88.43 14.15 2.980 179 .003* .45
5-years-old 128 95.74 15.35
*p<.05
Regarding the information in Table 4, a significant difference was observed in physical spontaneity
levels of pre-school children according to age (t(179)=2.323; p<.05; d’=.35). Average scores showed
that physical spontaneity level of 5-years-old children (17.41 ± 3.09) was significantly higher than
4-years-old children (16.25 ± 3.07). The calculated Cohen’s d effect size shows that the effect of the
difference is low. A significant difference was also observed in social spontaneity levels of pre-school
children according to age (t(179)=4.690; p<.05; d’=.70). Average scores showed that social spontaneity
level of 5-years-old children (21.68 ± 3.35) was significantly higher than 4-years-old children (19.09
± 3.44). The effect size implies that the effect of the difference is moderate (t(179)=2.387; p<.05;
d’=.36). Moreover, a significant difference was observed in cognitive spontaneity levels of pre-school
children according to age (t(179)=4.690; p<.05; d’=.70). Average scores showed that cognitive
spontaneity level of 5-years-old children (15.25 ± 3.08) was significantly higher than 4-years-old
children (14.09 ± 2.65). The effect size implies that the effect of the difference is low. The difference
of manifest joy level of children was found to be insignificant according to age (t(179)=1.606; p> 0.05).
In other words, manifest joy level of 4 and 5-years-old children was similar. A significant difference
was observed in the sense of humor of pre-school children according to age (t(179)=2.128; p<.05;
d’=.32). Average scores showed that sense of humor of 5-years-old children (20.20 ± 4.19) was
significantly higher than 4-years-old children (18.72 ± 4.40). The effect size shows that the effect of
the difference is low. Lastly in Table 4, the playfulness of pre-school children showed a significant
difference according to age (t(179)=2.980; p<.05; d’=.45). Regarding average scores, the playfulness of
5-year-old children (95.74 ± 15.35) was found to be significantly higher than 4-year-old’s (88.43 ±
14.15). The effect size implies that the effect of the difference is moderate. In other words, 4-years-old
children have a moderately higher tendency to play than 5-years-olds.

IOJPE
ISSN: 1300 – 915X
www.iojpe.org
International Online Journal of Primary Education 2021, volume 10, issue 1
Copyright © International Online Journal of Primary Education 126
The scores of the children according to gender also showed normal distribution, thus t-test was used in
the comparison of the related measurements, and the results are shown in Table 5.
Table 5. Independent T-test results for pre-school children’s playfulness according to gender
Scale Gender n Mean Std.Dev. t df p d’
Physical spontaneity Female 81 17.06 3.06
.039 179 .969 --- Male 100 17.08 3.18
Social spontaneity Female 81 21.14 3.25
.723 179 .471 --- Male 100 20.75 3.81
Cognitive spontaneity Female 81 15.16 2.90
1.004 179 .317 --- Male 100 14.71 3.08
Manifest joy Female 81 21.40 3.30
1.593 179 .113 --- Male 100 20.56 3.66
Sense of humor Female 81 19.96 3.99
.564 179 .573 --- Male 100 19.60 4.54
Overall playfulness score Female 81 94.72 14.22
.879 179 .381 --- Male 100 92.70 16.20
*p<.05
Regarding Table 5, pre-school children’s physical spontaneity (t(179)=.039; p>.05), social spontaneity
(t(179)=.723; p>.05), cognitive spontaneity (t(179)=1.004; p>.05), manifest joy (t(179)=1.593; p>.05), and
sense of humor (t(179)=.564; p>.05) scores did not show significant difference according to gender.
Similarly, the difference on children's overall playfulness scores according to gender was not
significant (t(179)=.879; p>.05). In other words, the playfulness tendencies of girls and boys were found
to be similar both in overall and in all sub-dimensions.
The playfulness of pre-school children according to the number of children in the family was first
tested for normality, and then homogeneity of variances was tested by Levene test. After determining
that the assumptions are met, one-way analysis of variance (ANOVA) was performed for comparison
and the results are shown in Table 6.
Table 6. One way ANOVA analysis results for pre-school children’s playfulness according the
number of children in the family
Scale # of children n Mean Std.Dev. F df p n2
Physical spontaneity
1 child 55 17.33 2.98
1.080
2
180
.969
--- 2 children 95 16.76 3.33
3+ children 31 17.58 2.62
Social spontaneity
1 child 55 20.91 3.57
.174
2
180
.471
--- 2 children 95 20.82 3.74
3+ children 31 21.26 3.05
Cognitive spontaneity 1 child 55 14.85 2.56
.098
2
180
.317
--- 2 children 95 14.87 3.23
3+ children 31 15.13 3.08
Manifest joy
1 child 55 21.25 3.10
.635
2
180
.113
--- 2 children 95 20.65 3.89
3+ children 31 21.23 3.05
Sense of humor
1 child 55 20.15 3.93
.494
2
180
.573
--- 2 children 95 19.46 4.52
3+ children 31 20.00 4.27
Overall playfulness score 1 child 55 94.49 13.32
.472
2
180
.381
--- 2 children 95 92.57 17.00
3+ children 31 95.19 13.40
*p<.05
According to Table 6, the differentiation of physical spontaneity (F(2,180)=1.080; p>.05), social
spontaneity (F(2,180)=.174; p>.05), cognitive spontaneity (F(2,180)=.098; p>.05), manifest joy
(F(2,180)=.635; p>.05), sense of humor (F(2,180)=.494; p>.05) levels were found to be insignificant

IOJPE
ISSN: 1300 – 915X
www.iojpe.org
International Online Journal of Primary Education 2021, volume 10, issue 1
Copyright © International Online Journal of Primary Education 127
according to the number of children in the family. Similarly, pre-school children's overall playfulness
scores did not show a significant difference according to the number of children in the family
(F(2,180)=.472; p>.05). In other words, the playfulness of the children who are the only child of their
family, and who has one, two or more siblings were similar both in overall and in all sub-dimensions.
The differentiation of the playfulness of pre-school children according to the duration of pre-school
education was tested. The scores of the children according to the duration of pre-school education
showed normal distribution, therefore t-test was used in the comparison of the related measurements,
and the results are shown in Table 7.
Table 7. Independent T-test results for pre-school children’s playfulness according to the duration of
pre-school education
Scale Duration of pre-school
education
n Mean Std.Dev. t df p d’
Physical spontaneity 1 year 112 16.61 3.03
2.595
179
.010*
.39 2 years and more 69 17.83 3.14
Social spontaneity 1 year 112 19.95 3.61
4.995
179
.000*
.75 2 years and more 69 22.51 2.88
Cognitive spontaneity 1 year 112 14.67 3.07
1.385
179
.168
--- 2 years and more 69 15.30 2.88
Manifest joy 1 year 112 20.27 3.50
3.330
179
.001*
.50 2 years and more 69 22.01 3.30
Sense of humor
1 year 112 19.04 4.10
2.925
179
.004*
.44 2 years and more 69 20.93 4.37
Overall playfulness score 1 year 112 90.54 15.05
3.534
179
.001*
.53 2 years and more 69 98.58 14.57
*p<.05
Regarding the information in Table 4, a significant difference was observed in physical spontaneity
levels of pre-school children according to the duration of pre-school education (t(179)=2.595; p<.05;
d’=.39). Average scores showed that physical spontaneity level of the children who were attending a
pre-school education institution for two years and more (17.83 ± 3.14) was significantly higher than
those who were attending for one year (16.61 ± 3.03). The calculated effect size shows that the effect
of the difference is low. A significant difference was also observed in social spontaneity levels of pre-
school children according to the duration of pre-school education (t(179)=4.995; p<.05; d’=.75).
Average scores showed that social spontaneity level of the children who were attending a pre-school
education institution for two years and more (22.51 ± 2.88) was significantly higher than those who
were attending for one year (19.95 ± 3.61). The effect size shows that the effect of the difference is
moderate. The difference in cognitive spontaneity level of the children was found to be insignificant
according to the duration of pre-school education (t(179)=1.385; p>.05). In other words, the cognitive
spontaneity levels of the children who have been attending a pre-school education institution for 1
year and 2 years or more were similar. Manifest joy levels of the children were found to significantly
differentiate according to the duration of pre-school education (t(179)=3.330; p<.05; d’=.50). Average
scores showed that manifest joy level of the children who were attending a pre-school education
institution for two years and more (22.01 ± 3.30) was significantly higher than those who were
attending for one year (20.27 ± 3.50). The effect size shows that the effect of the difference is
moderate. Sense of humor of the children was also found to significantly differentiate according to the
duration of pre-school education (t(179)=2.925; p<.05; d’=.44). Average scores showed that sense of
humor level of the children who were attending a pre-school education institution for two years and
more (20.93 ± 4.37) was significantly higher than those who were attending for one year (19.04 ±
4.10). The effect size shows that the effect of the difference is moderate. The table also shows that the
overall playfulness scores of the children significantly differentiated according to the duration of pre-
school education. (t(179)=3.534; p<.05; d’=.53). Regarding average scores, the playfulness of the
children who were attending a pre-school education institution for two years and more (98.58 ± 14.57)

IOJPE
ISSN: 1300 – 915X
www.iojpe.org
International Online Journal of Primary Education 2021, volume 10, issue 1
Copyright © International Online Journal of Primary Education 128
was significantly higher than those who were attending for one year (90.54 ± 15.05). The calculated
effect size shows that the effect of the difference is moderate. In other words, children who have
attended pre-school education for 2 years or more have moderately more playfulness behaviors than
children who have attended pre-school education for one year.
The differentiation of the playfulness of pre-school children according to their mother’s age was
tested. The scores of the children according to mother’s age did not exhibit normal distribution,
therefore Kruskal Wallis test was used in the comparison. The results are shown in Table 8.
Table 8. Kruskal Wallis test results for pre-school children’s playfulness according to mother’s age
Scale Mother’s Age n Mean Std.Dev. Rank
Mean
X2 df p n2
Physical spontaneity
Less than 30 years old 29 17.24 3.16 96.95
1.331
2
.514
--- 30-39-years-old 136 16.99 3.12 88.53
More than 40 years old 16 17.50 3.14 101.19
Social spontaneity
Less than 30 years old 29 19.76 4.37 78.69
3.689
2
.158
--- 30-39-years-old 136 21.03 3.37 91.43
More than 40 years old 16 22.13 3.26 109.63
Cognitive
spontaneity
Less than 30 years old 29 15.00 3.25 93.41
.080
2
.961
--- 30-39-years-old 136 14.90 2.91 90.43
More than 40 years old 16 14.88 3.52 91.50
Manifest joy
Less than 30 years old 29 20.52 4.06 87.07
.268
2
.875
--- 30-39-years-old 136 21.00 3.39 91.37
More than 40 years old 16 21.13 3.76 95.00
Sense of humor
Less than 30 years old 29 19.76 5.10 93.22
.141
2
.932
--- 30-39-years-old 136 19.79 3.96 90.17
More than 40 years old 16 19.56 5.59 94.00
Overall playfulness
score
Less than 30 years old 29 92.28 18.16 89.16
.362
2
.835
--- 30-39-years-old 136 93.70 14.52 90.53
More than 40 years old 16 95.19 17.46 98.34
*p<.05
According to Table 8, the difference on physical spontaneity (X2(2)=1.331; p>.05), social spontaneity
(X2(2)=3.689; p>.05), cognitive spontaneity (X2
(2)=.080; p>.05), manifest joy (X2(2)=.268; p>.05), and
sense of humor (X2(2)=.141; p>.05) levels of the children were observed to be insignificant according
to the age of the mother. Similarly, pre-school children's overall playfulness scores did not show a
significant difference according to the mother’s age (X2(2)=.362; p>.05). In other words, the
playfulness of the children whose mother are younger than 30-years-old, 30-39-years-old, or older
than 40-years-old were similar both in overall and in all sub-dimensions.
The scores of the playfulness of the children participating in the research according to their father’s
age did not exhibit normal distribution, therefore Kruskal Wallis test was used in the comparison. The
results are shown in Table 9a, and Table 9b.
Table 9a. Kruskal Wallis test results for pre-school children’s playfulness according to father’s age
Scale Father’s Age n Mean Std.Dev. Rank
Mean
X2 df p n2
Physical spontaneity
Less than 30 years old 14 16.79 3.24 87.68
.454
2
.797
--- 30-39-years-old 136 17.03 3.15 90.09
More than 40 years old 31 17.39 3.01 96.48
Social spontaneity
Less than 30 years old 14 20.00 4.19 80.18
2.002
2
.368
--- 30-39-years-old 136 20.86 3.52 89.68
More than 40 years old 31 21.61 3.49 101.68
Cognitive
spontaneity
Less than 30 years old 14 15.57 3.61 101.64
1.209
2
.546
--- 30-39-years-old 136 14.75 2.85 88.65
More than 40 years old 31 15.32 3.36 96.50

IOJPE
ISSN: 1300 – 915X
www.iojpe.org
International Online Journal of Primary Education 2021, volume 10, issue 1
Copyright © International Online Journal of Primary Education 129
Table 9b. Kruskal Wallis test results for pre-school children’s playfulness according to father’s age
Scale Father’s Age n Mean Std.Dev. Rank
Mean
X2 df p n2
Manifest joy
Less than 30 years old 14 19.93 3.73 76.36
1.214
2
.545
--- 30-39-years-old 136 21.03 3.53 92.39
More than 40 years old 31 20.97 3.45 91.53
Sense of humor
Less than 30 years old 14 19.71 5.09 91.32
.380
2
.827
--- 30-39-years-old 136 19.71 4.15 89.79
More than 40 years old 31 20.03 4.66 96.16
Overall playfulness
score
Less than 30 years old 14 92.00 18.31 88.50
.612
2
.736
--- 30-39-years-old 136 93.38 15.01 89.74
More than 40 years old 31 95.32 15.74 97.66
*p<.05
The playfulness of pre-school children according to the education level of the mother was tested for
normality and homogeneity of variances (by Levene test). After determining that the assumptions are
met, one-way analysis of variance (ANOVA) was performed for comparison and the results are
shown in Table 10.
Table 10. ANOVA analysis results for pre-school children’s playfulness according to mother’s
education
Scale Mother’s Education Level n Mean Std.Dev. F df p n2
Physical spontaneity
Less than high school 50 17.00 3.12
.049
2
180
.952
--- High school 89 17.15 3.04
University and more 42 17.00 3.34
Social spontaneity
Less than high school 50 20.72 3.42
.177
2
180
.838
--- High school 89 21.08 3.75
University and more 42 20.83 3.39
Cognitive spontaneity Less than high school 50 15.08 3.22
.112
2
180
.894
--- High school 89 14.87 3.07
University and more 42 14.81 2.62
Manifest joy
Less than high school 50 20.56 3.58
.406
2
180
.667
--- High school 89 21.03 3.49
University and more 42 21.17 3.57
Sense of humor
Less than high school 50 19.20 4.27
.605
2
180
.547
--- High school 89 20.02 4.21
University and more 42 19.88 4.53
Overall playfulness
score
Less than high school 50 92.56 15.03
.170
2
180
.843
--- High school 89 94.15 15.70
University and more 42 93.69 15.22
*p<.05
According to Table 10, the difference on physical spontaneity (F(2,180)=.049; p>.05), social spontaneity
(F(2,180)=.177; p>.05), cognitive spontaneity (F(2,180)=.112; p>.05), manifest joy (F(2,180)=.406; p>.05),
and sense of humor (F(2,180)=.605; p>.05) levels of the children were observed to be insignificant
according to the education of the mother. Similarly, pre-school children's overall playfulness scores
did not show a significant difference according to mother’s education (F(2,180)=.170; p>.05). In other
words, the playfulness of the children whose mother are graduated from primary-secondary school,
high school or university were similar both in overall and in all sub-dimensions.
The playfulness of pre-school children according to the education level of the father was found to
show normal distribution and to have homogeneous variances (by Levene test). Therefore, one-way
analysis of variance (ANOVA) was performed for comparison and the results are shown in Table 11.

IOJPE
ISSN: 1300 – 915X
www.iojpe.org
International Online Journal of Primary Education 2021, volume 10, issue 1
Copyright © International Online Journal of Primary Education 130
Table 11. ANOVA analysis results for pre-school children’s playfulness according to father’s
education
Scale Father’s Education Level n Mean Std.Dev. F df p n2
Physical spontaneity
Less than high school 47 16.98 3.46
.789
2
180
.456
--- High school 98 17.31 2.62
University and more 36 16.56 3.85
Social spontaneity
Less than high school 47 20.60 3.81
.424
2
180
.655
--- High school 98 21.14 3.46
University and more 36 20.75 3.57
Cognitive spontaneity Less than high school 47 15.21 3.36
.674
2
180
.511
--- High school 98 14.94 2.97
University and more 36 14.44 2.60
Manifest joy
Less than high school 47 20.53 3.70
.501
2
180
.607
--- High school 98 21.15 3.28
University and more 36 20.86 3.95
Sense of humor
Less than high school 47 19.38 4.27
.440
2
180
.645
--- High school 98 19.76 4.21
University and more 36 20.28 4.61
Overall playfulness
score
Less than high school 47 92.70 16.38
.218
2
180
.804
--- High school 98 94.30 14.44
University and more 36 92.89 16.64
*p<.05
According to Table 11, the difference on physical spontaneity (F(2,180)=.789; p>.05), social spontaneity
(F(2,180)=.424; p>.05), cognitive spontaneity (F(2,180)=.674; p>.05), manifest joy (F(2,180)=.501; p>.05),
and sense of humor (F(2,180)=.440; p>.05) levels of the children were observed to be insignificant
according to the education of the father. Similarly, pre-school children's overall playfulness scores did
not show a significant difference according to father’s education (F(2,180)=.218; p>.05). In other words,
the playfulness of the children whose fathers are graduated from primary-secondary school, high
school or university was similar both in overall and in all sub-dimensions.
Since the playfulness scores of pre-school children participating in the research according to their
mother’s working status showed normal distribution, t-test was used in the comparison of the related
measurements, and the results are shown in Table 12.
Table 12. Independent t-test results for pre-school children’s playfulness according to mother’s
working status
Scale Mother’s working
status
n Mean Std.Dev. t df p d’
Physical spontaneity
Not-working 126 17.13 3.05
.359
179
.720
--- Working 55 16.95 3.30
Social spontaneity
Not-working 126 20.83 3.42
.554
179
.580
--- Working 55 21.15 3.89
Cognitive spontaneity Not-working 126 14.70 3.01
1.450
179
.149
--- Working 55 15.40 2.95
Manifest joy
Not-working 126 20.93 3.54
.030
179
.976
--- Working 55 20.95 3.51
Sense of humor Not-working 126 19.54 4.28
1.057
179
.292
--- Working 55 20.27 4.32
Overall playfulness score Not-working 126 93.12 14.98
.640
179
.523
--- Working 55 94.71 16.22
*p<.05
The working areas of the mothers who participated in the study varied too much, thus the working
status of mothers were evaluated in two categories as working and not-working. According to Table
12, the difference on physical spontaneity (t(179)=.359; p>.05), social spontaneity (t(179)=.559; p>.05),
cognitive spontaneity (t(179)=1.450; p>.05), manifest joy (t(179)=.030; p>.05), and sense of humor

IOJPE
ISSN: 1300 – 915X
www.iojpe.org
International Online Journal of Primary Education 2021, volume 10, issue 1
Copyright © International Online Journal of Primary Education 131
(t(179)=1.057; p>.05) levels of the children were observed to be insignificant according to the working
status of the mother. Similarly, pre-school children's overall playfulness scores did not show a
significant difference according to mother’s working status (t(179)=.640; p>.05). In other words, the
playfulness of the children whose mother are working or not working were similar both in overall and
in all sub-dimensions.
The playfulness of pre-school children according to the profession of their father was analyzed. Since
the father of 1.7% (n=3) of the children who participated in the study were unemployed, the
comparison was made for 177 children whose father were working. The playfulness score of the
children according to the profession of the father was found to show normal distribution and to have
homogeneous variances (by Levene test). Therefore, one-way analysis of variance (ANOVA) was
performed for comparison and the results are shown in Table 13.
Table 13. Independent t-test results for pre-school children’s playfulness according to father’s
profession
Scale Father’s profession n Mean Std.Dev. F df p n2
Physical spontaneity
Civil servant 25 16.96 3.23
.454
2
180
.636
--- Worker 85 16.91 3.43
Self-employed 67 17.37 2.53
Social spontaneity
Civil servant 25 20.84 3.48
.205
2
180
.815
--- Worker 85 20.80 3.74
Self-employed 67 21.16 3.43
Cognitive spontaneity Civil servant 25 14.44 2.18
.469
2
180
.626
--- Worker 85 14.87 3.25
Self-employed 67 15.12 2.99
Manifest joy
Civil servant 25 20.56 3.76
.468
2
180
.627
--- Worker 85 20.85 3.68
Self-employed 67 21.27 3.15
Sense of humor
Civil servant 25 19.60 4.36
.513
2
180
.599
--- Worker 85 19.49 4.55
Self-employed 67 20.19 4.02
Overall playfulness score Civil servant 25 92.40 14.47
.486
2
180
.616
--- Worker 85 92.92 16.41
Self-employed 67 95.12 14.22
*p<.05
According to Table 13, the difference on physical spontaneity (F(2,180)=.454; p>.05), social spontaneity
(F(2,180)=.205; p>.05), cognitive spontaneity (F(2,180)=.469; p>.05), manifest joy (F(2,180)=.468; p>.05),
and sense of humor (F(2,180)=.513; p>.05) levels of the children were observed to be insignificant
according to the profession of the father. Similarly, pre-school children's overall playfulness scores
did not show a significant difference according to father’s profession (F(2,180)=.486; p>.05). In other
words, the playfulness of the children whose father are civil servant, worker or self-employed were
similar both in overall and in all sub-dimensions.
DISCUSSION and CONCLUSION
Current research aimed to discover children’s playfulness level in Turkey and the variables affecting
playfulness level. It was concluded that the playfulness level of the children participating in the study
was high. Regarding the variables, the playfulness level of the children attending pre-school education
for 2 years or more were found to be higher than children received 1 year education; the playfulness
level of 5-years-old children were found to be higher than 4-years-old ones in some sub-dimensions,
although it didn’t create a significant difference in overall score. Other variables did not make a
significant difference in the playfulness levels of the children. These results were discussed through
the relevant literature to identify the implications for pre-school educators.

IOJPE
ISSN: 1300 – 915X
www.iojpe.org
International Online Journal of Primary Education 2021, volume 10, issue 1
Copyright © International Online Journal of Primary Education 132
In the study, the playfulness levels of the children were observed to be high both in overall (M = 4.1)
and in all sub-dimensions. Regarding the ranking of the scores, physical spontaneity dimension was
observed to have the highest average score, whereas cognitive spontaneity dimension had lowest
score. In similar studies, the playfulness levels of children were found to be high (Keleş & Yurt, 2017;
Zachopoulou, Trevlas, & Tsikriki, 2004), the highest average score was observed in physical
spontaneity dimension (Barnet, 1990. 1991a; Zachopoulou, Trevlas, & Tsikriki, 2004), and cognitive
spontaneity had lower average score than other dimensions (Keleş & Yurt, 2017; Macun & Güvendi,
2019; Zachopoulou, Trevlas, & Tsikriki, 2004). Physical spontaneity is one of the basic features of
pre-school children who express their emotions through movement (Zachopoulou, Trevlas, &
Tsikriki, 2004). Children show this feature in the game activity that requires the most movement.
Therefore, high levels of playfulness in physical spontaneity can be considered as an expected result.
In the research, the overall playfulness of the children was analyzed according the certain variables
and playfulness levels of the children were found to be similar for both 4- and 5-years-old ones.
Similarly, Pinchover (2017) concluded that there is no direct relationship between playfulness and
children's age, and playfulness level of children is similar. Regarding the sub-dimensions of
playfulness in the study, the playfulness levels of 5-years-old children was observed to be
significantly higher than 4-years-old ones in terms of physical spontaneity, social spontaneity and
cognitive spontaneity. In the study in which Macun and Güvendi (2019) examined the playfulness
levels of pre-school children, the playfulness levels of children were found to differ in favor of 5-year-
old children in overall and in the sub-dimensions. Barnet (1991b), reported that social spontaneity and
cognitive spontaneity levels of children increased with age. With the increase in the age of the
children, their skills develop, and children become more conscious regarding playing and winning
(Howard, 2002). Therefore, an increase in playfulness level can be observed with age. However,
Saunders, Sayer, and Goodale (1999) found that younger children had higher average playfulness
score. The reason for this difference in the results of the studies may be the experience that 5-years-
old children have gained in terms of playfulness skills. Experiencing playfulness and sense of humor
at a young age, allows children to communicate with others and to show playfulness behaviors at later
ages (Youell, 2008).
The gender variable, whose effect has been widely investigated in studies on playfulness, did not
create a significant difference on the playfulness levels of children in the current study. While some
studies show that gender is a significant factor on children's playfulness levels (Barnett, 1991b;
Cornelli Sanderson, 2010; Saunders, Sayer, & Goodale, 1999; Tae-Hyung, Tae-Hyun, & Jae-Shin,
2014; Zachopoulou, Trevlas, & Tsikriki, 2004), some studies concluded that it has no effect (Keleş &
Yurt, 2017; Macun & Güvendi, 2019; Rentzou, 2013). The fact that gender has no effect on the
playfulness levels of children shows that playfulness is a personality trait (Howard, Bellin, & Rees,
2002; Rentzou, 2013). However, regarding the average scores that children got from the sub-
dimensions, the girls were observed to have higher averages than boys in all dimensions, except
physical spontaneity. Similar studies also found that boys had a higher average than girls in the
physical spontaneity subdimension of playfulness (Barnett, 1991b; Tae-Hyung, Tae-Hyun, & Jae-
Shin, 2014; Zachopoulou, Trevlas, & Tsikriki, 2004). Preferring more active games (Fabes, Martin, &
Hanish, 2003) and being physically more active than girls (Choi & Hyun, 2004) can be considered as
a factor for boys having higher scores in physical spontaneity.
Another variable that makes a significant difference on the playfulness levels of the children is the
duration of attending a pre-school education institution. The playfulness levels of children who
attended pre-school education for two years or more (22.01 ± 3.30) were higher than the children who
attended 1 year or less (20.27 ± 3.50) (p <.05). In their research, Kapıkıran, İvrendi, and Adak (2006)
found that children’s social skill behaviors develop positively as school attendance time increases.
Pre-school education offers children the opportunity to play with their friends. Children playing with
their friends in school environment regulate their behavior towards other children. Play tools in
schools also satisfy the needs of children (Brewer & Kieff, 1996). School experience at an early age

IOJPE
ISSN: 1300 – 915X
www.iojpe.org
International Online Journal of Primary Education 2021, volume 10, issue 1
Copyright © International Online Journal of Primary Education 133
shows that children's behavior is affected by classroom experiences (Howard, Jenvey, & Hill, 2006).
In the study, children's school experiences were found to create a positive effect on their playfulness
levels.
In the study, the number of children in the family was observed to be insignificant on children’s
playfulness level. Regarding the differences in the sub-dimensions of the scale, the average scores
were observed to be close to each other, which led to the conclusion that the playfulness levels of
children with different number of siblings are similar. Similarly, Macun and Güvendi (2019)
concluded that the number of siblings did not make a significant difference on the playfulness level of
the children. In the research examining children's play behaviors, Öztürk and Ahmetoğlu (2018)
revealed that the number of siblings was not effective on the play behaviors. However, in some
studies, it was concluded that the number of siblings caused differences in some sub-dimensions of
the scale (Keleş & Yurt, 2017; Rentzou, 2013). The reason of these differences in the research results
may be due to the age or gender difference of the siblings. In their studies examining the effect of the
gender on children's playmate selection, Alexander and Hines (1994) found that children tend to
choose playmates of the same sex. Moreover, the age differences between siblings can create
differences on children's play skills (Youngblade & Dunn, 1995). While pre-school children mostly
prefer to play imaginary and symbolic games, they switch to play regular games in primary school
(Aksoy, 2014). Game preferences that differ with age can also change the level of sibling exposure.
Other variables addressed in the study (age, education level, working status of the mother and
profession of the father) did not create significant differences in children's playfulness levels.
Similarly, in the study of Macun and Güvendi (2019), education level and working status of the
mothers/fathers were not found to be effective on the playfulness levels of the children. In the study
examining children's play behaviors Camgöz (2010) concluded that the education level and
professional status of the parents have not created a significant difference. However, Öztürk and
Ahmetoğlu (2018) reported that the education level of the father had an effect on the children's play
behavior, while the age of the parents and the education level of the mother had no effect on the
children's play behavior. The differentiation of the study results according to family variables suggests
that different characteristics of the families may have different effects on the playfulness level of the
children. Alessandri (1992) observed that mothers who had experienced negative situations in the
past, had negative communication with their children while playing games. John, Halliburton, &
Humphrey (2012) reported that while playing with children, mothers tend to engage in empathic
conversations and teaching, while fathers tend to engage in physical play, act like they are in their
child's age, and follow the child’s play. Karaca, Gündüz, and Aral (2011) discovered that age and
education levels of families have an impact on children's positive social behavior. To better
understand the effect of the parents on the child's playfulness level, the correlations between the
characteristics of the families and the playfulness levels of the children should be further examined in
future researches.
Conclusion
The playfulness levels of the children in pre-school period provide important information to
educators. Knowledge of play and playfulness, which are among the basic elements of pre-school
education, allows to understand children’s play worlds and support the essence of playfulness by
freeing them (Singer, 2015). Understanding children's perceptions of play and playfulness approach
allows to transfer the play into classroom activities and integrate them into other activities (Howard,
Bellin, & Rees, 2002). In the study, the high playfulness levels of the children indicate that they
intrinsically have a playful mood (Young, 2008). The increase in children's ages and duration of pre-
school education make a positive difference on their playfulness levels, which shows that receiving
pre-school education from an early age will support children intrinsic playfulness feelings. In
addition, the lack of significant differences according to other variables revealed that children's
playfulness levels were based on internal emotions rather than external factors.

IOJPE
ISSN: 1300 – 915X
www.iojpe.org
International Online Journal of Primary Education 2021, volume 10, issue 1
Copyright © International Online Journal of Primary Education 134
Limitations of the Study and Suggestions for Future Research
This study which has been carried out on children attending pre-school education institutions, has
expanded the scope of researches on children's playfulness level in Turkey. However, the study has
some limitations. Data were collected from 181 participants, who were attending a pre-school
educational institution in a province of Turkey. It should be considered that children’s playfulness
may vary according to cultural differences or demographic characteristics of the participants.
Considering that the participants were from similar environments, it should be considered that there
may be differences in the playfulness levels of the children living under different conditions. In
addition, the results should be supported and confirmed by other researches because it is one of the
few studies addressing the playfulness level of pre-school children in Turkey.
For future researches, conducting empirical studies in Turkey on different sample groups, in which
playing behavior of the children are also observed, is very important. In addition, it is suggested to
conduct longitudinal studies to better understand the change of children’s playfulness according to age
and school attendance; and investigate parents and teachers' attitudes by using interview and
observation methods to better understand the effect of the number of children in the family and the
characteristics of the parents as well as teachers (e.g. Carter, 1993; Pinchover, 2017; Trawick-Smith,
& Dziurgot, 2010) on children's playfulness levels.
REFERENCES
Aksoy, A. B. (2014). Çocuğun gelişimine bağlı oyun aşamaları ve oyun türleri [Game stages and game types depending on
the child's development]. Aksor, H. D., and Çiftçi, H. D. (Ed.), Erken Çocukluk döneminde oyun [Play in early
childhood], (36-57). Ankara: Pegem Publishing.
Aksoy, A. B., & Yaralı, K. T. (2017). Çocukların öz düzenleme becerileri ile oyun becerilerinin cinsiyete göre incelenmesi
[Examination of children's self-regulation skills and play skills by gender]. Trakya University Journal of Education
Faculty, 7(2), 442-455.
Alessandri, S. M. (1992). Mother-child interactional correlates of maltreated and nonmaltreated children's play behavior.
Development and Psychopathology, 4(2), 257-270.
Alexander, G. M., & Hines, M. (1994). Gender labels and play styles: Their relative contribution to children's selection of
playmates. Child Development, 65(3), 869-879.
Barnett, L. A. (1990). Playfulness: Definition, design, and measurement. Play & Culture, 3, 319-336.
Barnett, L. A. (1991a). The playful child: Measurement of disposition to play. Play & Culture, 4, 51-74.
Barnett, L. A. (1991b). Characterizing playfulness: Correlates with individual attributes and personality traits. Play &
Culture, 4, 371-393.
Barnett, L. A. (2007). The nature of playfulness in young adults. Personality and Individual Differences, 43(4), 949-958.
doi:10.1016/j.paid.2007.02.018
Barnett, L. A., & Kleiber, D. A. (1982). Concomitants of playfulness in early childhood: Cognitive abilities and gender.
Journal of Genetic Psychology, 141(1), 115–127. doi:10.1080/00221325.1982.10533462
Bateson, P., & Martin, P. (2013). Play, playfulness, creativity and innovation. Cambridge: Cambridge University Press.
Brewer, J. A., & Kieff, J. (1996). Fostering mutual respect for play at home and school. Childhood Education, 73(2), 92-96.
Broadhead, P., Howard, J., & Wood, E. (Eds.). (2010). Play and learning in the early years: From research to practice.
Newcastle upon Tyne: Sage.
Büyüköztürk, Ş., (2018). Sosyal bilimler için veri analizi el kitabı [Manual of data analysis for social sciences] (24th ed.).
Ankara: Pegem Publishing.
Camgöz, A. (2010). Ankara örneklemine Penn etkileşimli akran oyunu ölçeği’nin 60-72 aylık düşük sosyoekonomik
düzeydeki çocukların ebeveyn ve öğretmenlerine uyarlanması [Adapting the Penn interactive peer game scale to the
parents and teachers of 60-72 months old children with low socioeconomic status to the Ankara sample],
(Unpublished master's thesis). Gazi University, Ankara, Turkey.
Carter, M. (1993). Catching the spirit: Training teachers to be playful. Child Care Inf. Exch. 89, 37-39.

IOJPE
ISSN: 1300 – 915X
www.iojpe.org
International Online Journal of Primary Education 2021, volume 10, issue 1
Copyright © International Online Journal of Primary Education 135
Choi, D. H., & Hyun, E. (2004). Examinations of young children’s gender-doing and gender-bending in their play
dynamics: A cross-cultural exploration. International Journal of Early Childhood, 36(1), 49-64.
Cohen, J. (1988). Statistical power analysis for the behavioral sciences (2nd ed.) Hillsdale, NJ: Lawrence Erlbaum
Associates.
Cornelli Sanderson, R. (2010). Towards a new measure of playfulness: The capacity to fully and freely engage in play (PhD
dissertation, Paper 232). Chicago, IL: Loyola University Chicago. 8 June 2020 retrieved from http://ecommons.
luc.edu/luc_diss/232
Cukierkorn, J. R., Karnes, F. A., & Manning, S. J. (2007). Serving the preschool gifted child: Programming and resources.
Roeper Review, 29(4), 271-276 (EJ929839).
Fabes, R. A., Martin, C. L., & Hanish, L. D. (2003). Young children’s play qualities in same, other and mixed-sex peer
groups society for research. Child Development, 74(3), 921-932.
Gündüz, M., Aktepe, V., Uzunoğlu, H., & Gündüz, D. D. (2017). Okul öncesi dönemdeki çocuklara eğitsel oyunlar yoluyla
kazandırılan değerler [Values acquired by preschool children through educational games]. Muğla Sıtkı Koçman
University Journal of Education Faculty, 4(1), 62-70.
Howard, J. (2002). Eliciting young children's perceptions of play, work and learning using the activity apperception story
procedure. Early Child Development and Care, 172(5), 489-502.
Howard, J., Bellin, W., & Rees, V. (2002, September). Eliciting children’s perceptions of play and exploiting playfulness to
maximise learning in the early years classroom. Proceedings from BERA (British Educational Research
Association) Annual Conference, University of Exeter (pp. 11–12). 27 May, 2020 retrieved from
http://www.leeds.ac.uk/educol/documents/00002574.htm
Howard, J., Jenvey, V., & Hill, C. (2006). Children’s categorisation of play and learning based on social context. Early
Child Development and Care, 176(3-4), 379-393.
Huizinga, J. (1955). Homo ludens: a study of the play-element in culture. (First published in 1938). Boston: The Beacon
Press.
John, A., Halliburton, A., & Humphrey, J. (2013). Child-mother and child–father play interaction patterns with
preschoolers. Early Child Development and Care, 183(3-4), 483-497.
Jones, E., & Reynolds, G. (2011). The play’s the thing: Teachers’ roles in children’s play (2nd ed.). New York, NY:
Teachers College Press.
Kalaycı, Ş. (2009). SPSS uygulamalı çok değişkenli istatistik teknikleri [SPSS applied multivariate statistics techniques].
Ankara: Asil Publisher.
Kangas, M., & Ruokamo, H. (2012). Playful Learning Environment(s): Effects on Children’s Learning. In N. Seel (Ed.),
Encyclopedia of the Sciences of Learning (pp. 2653-2655). New York: Springer. 17 May, 2020 retrieved from
https://doi.org/10.1007/978-1-4419-1428-6_756
Kapıkıran, N. A., Kapıkıran, N. A., İvrendi, A. B., & Adak, A. (2006). Okul öncesi çocuklarında sosyal beceri: Durum
saptaması [Social skills in preschool children: Determination of the situation]. Pamukkale University Journal of
Education, 19(19), 19-27.
Karaca, N. H., Gündüz, A., & Aral, N. (2011). Okul öncesi dönem çocuklarının sosyal davranışının incelenmesi
[Examining the social behavior of preschool children]. Journal of Theoretical Educational Science, 4(2), 65-76.
Karasar, N. (2008). Bilimsel araştırma yöntemi [Scientific research method]. Ankara: Nobel Publisher.
Karrby, G. (1989). Children’s conceptions of their own play. International Journal of Early Childhood Education, 21(2),
49-54.
Keleş, S., & Yurt, Ö. (2017). An investigation of playfulness of preschool children in Turkey. Early Child Development
and Care, 187(8), 1372-1387.
Lieberman, J. N. (1965). Playfulness and divergent thinking: An investigation of their relationship at the kindergarten level.
Journal of Genetic Psychology, 107, 219–224. doi:10.1080/00221325.1965.10533661
Lieberman, J. N. (1977). Playfulness: Its relationship to imagination and creativity. New York, NY: Academic Press.
Lobman, C. L. (2003). What should we create today? Improvisational teaching in play-based classrooms. Early Years, 23,
131-142. doi: 10.1080/0957514030 3104
Lobman, C. L. (2006). Improvisation: an analytic tool for examining teacher–child interactions in the early childhood
classroom. Early Childhood Research Quarterly. 21(4), 455-470. doi: 10.1016/j.ecresq.2006.09.004

IOJPE
ISSN: 1300 – 915X
www.iojpe.org
International Online Journal of Primary Education 2021, volume 10, issue 1
Copyright © International Online Journal of Primary Education 136
Macun, B., & Güvendi, Ö. F. (2019). Okul öncesi dönem çocuklarının oynama eğilimlerinin çeşitli değişkenler açısından
incelenmesi [The exemining of the tendency to play of children attending to preschool education ınstitutions in
terms of various variables]. EKEV Academic Review, 23(78), 79-98.
Masters, P. A. (2008). Play theory, playing, and culture. Sociology Compass, 2(3), 856-869.
McNabb, D. E. (2015). Research methods for political science: Quantitative and qualitative methods. London: Routledge.
Neuman, L. W. (2014). Social research methods: qualitative and quantitative approaches (7th ed.). Essex: Pearson
Education Limited.
Öztürk, M. A., & Ahmetoğlu, E. (2018, 11-13 May). Okul öncesi eğitim kurumlarında grup ortamlarındaki oyunun
değerlendirilmesi [Evaluation of the game in group settings in preschool education institutions]. 8th International
Conference of Strategic Research on Scientific Studies and Education, Vienna, Austria.
Pinchover, S. (2017). The relation between teachers’ and children’s playfulness: A pilot study. Frontiers in psychology,
8(2214), 1-8. https://doi.org/10.3389/fpsyg.2017.02214
Pramling Samuelsson, I., & Johansson, E. (2006). Play and learning-inseparable dimensions in preschool practice. Early
child development and care, 176(1), 47-65.
Rentzou, K. (2013). Greek preschool children’s playful behavior: Assessment and correlation with personal and family
characteristics. Early Child Development and Care, 183(11), 1733-1745. doi:10.1080/03004430.2012.752736
Román-Oyola, R., Figueroa-Feliciano, V., Torres-Martínez, Y., Torres-Vélez, J., Encarnación-Pizarro, K., Fragoso-Pagán,
S., & Torres-Colón, L. (2018). Play, Playfulness, and Self-Efficacy: Parental Experiences with Children on the
Autism Spectrum. Occupational Therapy International, Article ID 4636780, 10 pages.
https://doi.org/10.1155/2018/4636780
Sapsağlam, Ö. (2018). Okul öncesi dönem çocuklarının değişen oyun tercihleri. Kırşehir Faculty of Education Journal
(JKEF), 19(1), 1122-1235.
Saunders, I., Sayer, M., & Goodale, A. (1999). The relationship between playfulness and coping in preschool children: A
pilot study. American Journal of Occupational Therapy, 53(2), 221-226. doi:10.5014/ajot.53.2.221
Shepard, L., Kagan, S. L., & Wurtz, L. (1998). Principles and recommendations for early childhood assessments. Goal 1
Early Childhood Assessments Resource Group. Washington, DC: National Education Goals Panel. 03 May. 2020
retrieved from http://govinfo.library.unt.edu/negp/reports/prinrec.pdf.
Singer, E. (2013). Play and playfulness, basic features of early childhood education. European Early Childhood Education
Research Journal, 21(2), 172-184.
Singer, E. (2015). Play and playfulness in early childhood education and care. Psychology in Russia, 8(2), 27-35.
Tae-Hyung, Y., Tae-Hyun, C., & Jae-Shin, L. (2014). The affecting factor on the children’s playfulness in South Korea.
International Journal of Bio-Science and Bio-Technology, 6(5), 23-32.
Tekin, H. (2002). Eğitimde ölçme ve değerlendirme [Measurement and evaluation in education]. Ankara: Yargı Publisher.
Trevarthen, C. (2011). What young children give to their learning, making education work to sustain a community and its
culture. European Early Childhood Education Research Journal, 19, 173-193. doi:
10.1080/1350293X.2011.574405
Trawick-Smith, J., & Dziurgot, T. (2010). Untangling teacher–child play interactions: Do teacher education and experience
influence “Good-Fit” responses to Children's play?. Journal of Early Childhood Teacher Education, 31(2),
106-128. doi: 10.1080/10901021003781148
Tuğrul, B., Boz, M., Uludağ, G., Aslan, Ö. M., Çelik, S. S., & Çapan, A. S. (2019). Okul öncesi dönemdeki çocukların
okuldaki oyun olanaklarının incelenmesi [Examination of preschool children’ play opportunities in schools].
Trakya Journal of Education, 9(2), 185-198.
Youell, B. (2008). The importance of play and playfulness. European Journal of Psychotherapy and Counselling, 10(2),
121-129. doi:10.1080/13642530802076193
Youngblade, L. M., & Dunn, J. (1995). Individual differences in young children's pretend play with mother and sibling:
Links to relationships and understanding of other people's feelings and beliefs. Child Development, 66(5),
1472-1492. doi:10.2307/1131658
Zachopoulou, E., Trevlas, E., & Tsikriki, G. (2004). Perceptions of gender differences in playful behaviour among
kindergarten children. European Early Childhood Education Research Journal, 12(1), 43-53.

IOJPE
ISSN: 1300 – 915X
www.iojpe.org
International Online Journal of Primary Education 2021, volume 10, issue 1
Copyright © International Online Journal of Primary Education 137
EFFECTS OF PERFORMANCE RANKING ON STUDENTS’ VOICE
AND AGENCY IN THE MATHEMATICS CLASSROOM
Samson Murithi NJIRU
PhD., Department of Education, University of Embu, Embu, Kenya
ORCID: https://orcid.org/0000-0002-7748-6438
Simon KARUKU
PhD., Department of Education, University of Embu, Embu, Kenya
ORCID: https://orcid.org/0000-0001-5832-9894
Received: February 25, 2021 Accepted: April 06, 2021 Published: June 30, 2021
Suggested Citation:
Njiru, S. M., & Karuku, S. (2021). Effects of performance ranking on students’ voice and agency in the mathematics
classroom. International Online Journal of Primary Education (IOJPE), 10(1), 137-147.
This is an open access article under the CC BY 4.0 license.
Abstract
The modalities of performance ranking in high stakes testing to a greater extent affect Mathematics teaching and learning.
While performance ranking has the potential of being a critical catalyst in the process of making Mathematics classrooms a
place of positive competition, it fails to balance the most crucial aspects in Mathematics discourses-the voice and agency of
teachers and students. The proactive engagement of all students and teachers equitably with the process of Mathematics
teaching and learning is a necessary condition for ensuring excellent students Mathematics learning outcomes. The purpose
of the study was to investigate the effects of performance ranking on voice and agency in Mathematics teaching and learning
in secondary schools in Embu, Kenya. The study employed a qualitative research approach. Six teachers and eight students
were randomly sampled for interviews, while three teachers and eighteen students were engaged in focus group discussions.
The data analyzed demonstrated that top ranked students become powerful independent learners who are capable of
critiquing work presented to them by their teachers while low ranked students are guided as to whom to seek help from by
the performance ranking data. This paper recommends that performance ranking should be used as a tool to give students
voice and agency by ranking students on the basis of marks scored on continuous assessment tests, students’ entry mark and
value addition.
Keywords: Performance ranking, mathematics, teaching, learning, voice, agency.
INTRODUCTION
Performance rankings in education have been a common feature all over the world. The government
and the news agencies of particular countries obtain and publish the rankings data in an attempt to
compare the relative performance of individual students (or schools) based on academic performance
(Ball, 2009, Hazelkorn, 2008; Leckie & Goldstein, 2019; Wilson & Piebalga, 2008). At the school
level, the rankings are at times published on school notice boards to compare the relative performance
of individual students in the same grade or the relative performance of sections (streams) in a given
grade.
Performance rankings are intended to serve several purposes for students, parents, teachers, school
administrators, policy makers, and politicians. To some, performance rankings are a mechanism for
providing feedback to those who provide resources to run the schools on those schools that are doing
well and those that require intervention. The rankings also enable parents make informed choices
about schools for their children, since such rankings provide a basis for making comparisons. The
rankings thus increase the transparency and the quality of educational processes, thus contributing to
academic excellence (Neves, Pereira, & Nata, 2014). They can also induce organizational changes in
schools that are underperforming (Neves, Pereira, & Nata, 2014) by borrowing the educational
practices and policies of the top-performing schools, or by performing a root cause analysis to uncover

IOJPE
ISSN: 1300 – 915X
www.iojpe.org
International Online Journal of Primary Education 2021, volume 10, issue 1
Copyright © International Online Journal of Primary Education 138
root causes for underperformance and correct deficiencies. They also provide incentives for behavioral
change by stimulating inter-school or inter-student competition.
Critics of performance rankings have several reservations. To begin with is the fact that though
performance rankings tend to change behavior positively, they are deleterious to the education
process. The rankings lead to having important areas in the syllabus ignored following the excessive
focus on improving the rank positions in the league tables.Thus, for example, there is evidence that
performance rankings encourage unethical practices such as grade inflation and exclusion of students
who would drag down the overall performance score of the school (Neves, Pereira, & Nata, 2014) to
the detriment of student choice. These practices, which are exacerbated by the publication of school
rankings, ultimately lead to growing disparities between schools. To be sure, there is a fundamental
distinction between public and private schools in their ability to choose their own students and in the
kind of incentives they may get from responding to market pressures. Private schools are particularly
more subject to market pressures than public schools, and this may contribute to their temptation to
engage in ‘gaming’ to improve their ranking. As a result, performance rankings have been criticized
for sustaining a hierarchy of power and interests that favor established interests (Kell & Kell, 2014;
Neves, Pereira, & Nata, 2014). Schools at the bottom of the rank in the school league tables attract
below average students and in experienced theachers, as the best performing schools siphon the above
average students and experienced teachers. Under these circumstances, rankings can be seen as a
contributing factor to affirming social division, negating the redistribution of resources designed to
redress inequity and social injustices (Kell & Kell, 2014)
Secondly, the validity and reliability of performance rankings have been put into question, owing to
the embedded methodological and philosophical shortcomings. In particular, the rankings have been
criticized for promoting unfair competition (for example, between public and private schools, or
between schools and/or students from different socioeconomic backgrounds) and, therefore,
reinforcing the existing inequalities. Performance rankings have also been criticized for glorifying
examination results at the expense of the authentic goals of education. Indeed, performance rankings
are said to use simplistic outputs as proxies for school quality, whereby the notion of efficiency is seen
as unproblematic, and methods are considered to be ideology-free. For example, league tables do not
consider the school’s context, as some serve the underprivileged students population doubling their
functions. In addition to providing good education they ensure students health is taken care of through
provision of well balanced diet. This impact negatively on the time and energy such schools can
dedicate to improvement of academic performance of students (Neves, Pereira, & Nata, 2014).
Therefore, the low ranked schools are stigmatized and their image in the public domain is often
irreversibly damaged. Instead of channeling resources to the low ranked schools for improvement
purposes the low performance is often accompanied by more punitive measures, more monitoring and
diminished resources. Such schools find themselves subject to uncertainty around government support
and are threatened with closure (Kell & Kell, 2014).
A number of methodologies for performance rankings for schools exist; some compare school average
scores, derived from students’ aggregate scores in high-stakes standardized tests. Others compare
schools using value-added measures of school performance, which is a measure of the progress made
by an individual student or a group of students in comparison to the average progress made by similar
students nationally between key stages. Still others compare schools using contextualized value-added
scores, which in addition to controlling for students’ prior attainment at earlier key stages, factors in a
wide range of non-school factors associated students’ progress such as age, gender, special educational
needs, and ethnicity (Foley & Goldstein, 2012; Leckie & Goldstein, 2019).
This paper focuses on an aspect of performance rankings that is rarely considered in the literature;
namely, the effect of performance rankings on students’ voice and agency. Whereas the notions of
voice and agency have been central to the scholarship on classroom discourse processes and
participatory structures that empower learners to engage in more authentic learning (Cook-Sather,
2006; Nel, 2017; van Lier, 2008), the relationship between performance rankings, on the one hand,

IOJPE
ISSN: 1300 – 915X
www.iojpe.org
International Online Journal of Primary Education 2021, volume 10, issue 1
Copyright © International Online Journal of Primary Education 139
and students’ voice and agency, on the other has been under-researched. Cook-Sather (2006) defines
voice as “having presence, power and agency, the opportunity to speak one’s mind, be heard and
perhaps have an influence on outcomes” (p. 5). Agency on the other hand is, according to Van Lier
(2008), the ability to control one’s behavior, to engage in behavior that affects other entities and the
self and to produce actions that can be evaluated (p. 172). In the teaching-learning contexts, agency is
an action taken by a student in controlling classroom discourse on their behalf and on behalf of other
students (Nel, 2017). Hence, students’ voice and agency have an emancipatory role in the classroom
as they empower students to be actively engaged in the classroom discourse (Khuzwayo & Bansilal,
2012). It is thus critical for teachers to tailor their pedagogical strategies in a manner that support
students’ development of voice and agency in the classroom (Morgan, 2016). This can help in
development of positive attitudes by students, leading to good academic performance.
Regardless of the positive effects studies have shown that, performance ranking can have several
negative effects on teaching and learning. For instance, it can lead to the introduction of inequity in the
classroom through the use of instructional strategies that favour or promote voice of one student over
another. The favoured sections of students often perceive the classroom as being places for positive
competitions, while the other section finds it as a place of discrimination (Bicknell & Riley, 2012). On
the other hand, a student agency can act as an incentive or a deterrent depending on the student’s
position in performance rankings (Wilkins, 2012). This paper seeks to demonstrate that students are
socialized to demonstrate agency and voice in ways that resonate with their position in performance
rankings. The next section reviews the literature related to performance rankings as they related to
voice and agency in the classroom.
Literature Review
Critics of performance rankings have argued that the rankings promote educational inequalities as
some schools are viewed as better than others. This is because the rankings, though certainly not
perfect, are appropriate mechanisms for picking among thousands of schools and determining learning
options for children that are most in line with an individual's wants and needs. For example, rankings
build an institutional reputation by providing a list of top public and private schools in the country
(Hazelkorn, 2008). In this respect, prospective students and their parents identify their school of
choice based on the quality of academics, resources available, future career opportunities, and even
school popularity and reputation. Therefore, publication of performance ranking data may lead to
schools that are perceived to be doing well to enjoy the privilege of attracting students of high levels
of ability while those perceived to be doing badly attracting low achieving students (Kellaghan, 1996).
It may also lead to the transfer of more able teachers, lower morale in individual schools and create a
big achievement gap between secondary schools. Although Burgess, Propper and Wilson (2002) argue
that, provision of information on school performance is a pre-requisite for informed parental choice,
OECD (2012) observe that, where parents with social and/or economic advantage are encouraged to
support schools with good results, morale and performance in poorer performing schools can be
affected negatively.
Secondly, performance ranking builds the capabilities and confidence in top ranked teachers to
autonomously plan their teaching in response to learner’s abilities (Batra, 2005). According to
Andersson and Norén (2011), any practice in teaching and learning worthy of its name should
contribute to processes of subjectification that allow the teachers to become more autonomous and
independent in their thinking. Their decisions are embraced by the school administrators because they
have confidence in them. Being an incentive to them it encourages positive competition in that low
ranked teachers design their instructional techniques in order to obtain the top rank to enjoy teacher
agency in teaching. The dissemination of ranking data creates competition among teachers which in
turn motivate them to design their instructional practices for students’ learning (Chapman & Synder,
2000). Thus, performance ranking may help to raise academic standards, provide feedback on the
teacher’s effectiveness in teaching and student achievement. It also communicates to the students,
parents and others what has been taught (Amunga, Amadalo, & Maiyo, 2010).

IOJPE
ISSN: 1300 – 915X
www.iojpe.org
International Online Journal of Primary Education 2021, volume 10, issue 1
Copyright © International Online Journal of Primary Education 140
Further, performance ranking puts the Mathematics students at the center of Mathematics discussions
so as to obtain the top rank as opposed to the traditional Mathematics classrooms which was the
domain of the teacher (Khuzwayo & Bansilal, 2012). In the traditional classrooms the teacher decides
the content and pedagogical strategies without involving the students. The picture changes when
learners are granted voice and agency in Mathematics classrooms. Thus, students are provided with an
opportunity to create their own knowledge and engage in strategic as opposed to executive help
seeking (Karabenick & Newman, 2013).
Finally, performance ranking in secondary schools is used in informing policymaking (Downes,
Vindurampulle & Victoria, 2007). For example, performance ranking data is utilized in the
identification of schools and students whose achievements are below average. High performing
schools can be used for benchmarking purposes and remedial efforts geared towards schools and
students who are struggling in terms of education gains. Further, the practice points out the areas the
schools are performing below expectations hence helps to direct resources in the schools affected to
ensure they are not left behind as far as education matters are concerned.
Opponents of performance ranking observe that it invites top ranked students voice at the expense of
the low ranked ones in Mathematics classrooms (Morrison, 2008). Students at the bottom of the rank
are viewed as weak and lazy by both students and teachers despite the effort they put in their studies
(Dunne, Humphreys, Sebba, Dyson, Gellannaugh, & Muijis, 2007). The class disrespect could lead to
teachers losing control of the classroom discourse. Besides losing control of the class, teachers fear
that top ranked students will not only take over learning but also deny the low ranked students’
opportunities of contributing ideas in the Mathematics classroom discourse (White, 2003). Moreover,
performance ranking invites the top ranked student’s dominancy in Mathematics lessons making them
ill prepared for the real world where they should learn to accommodate the will of others seeing their
needs going unmet (Morrison, 2008).
An additional constraint of performance ranking is the conventional system of ranking used in internal
and national examinations. The methodology of ranking which employs student’s raw scores is blind
to issues such as the socioeconomic conditions of the students, location of the schools and school
management styles. Thus, deflect teachers and students from creating personal meaning towards
teaching and learning instead focuses all their effort towards the incentives (Niesche & Keddie, 2016).
In other words teachers may tailor their instructional strategies towards test taking skills in order to
obtain a top rank because of the benefits associated with the top rank such as internal promotions.
Such kind of performance orientation complicates teacher-teacher relationship in the department and
in the institution at large. The low ranked teachers feel less powerful and act subserviently to avoid
being reprimanded. The low ranked teachers’ subservience manifests itself in not questioning or
challenging the top ranked teachers’ decisions (Morrison, 2008). Consequently, performance ranking
renders many teachers voiceless in Mathematics matters and dependent on the top ranked ones.
Purpose of the Study The purpose of this study was to investigate the effects of performance ranking on students and
teachers voice and agency in teaching-learning process in secondary schools in Kenya in the
participants’ natural settings.
METHOD
Participants and Context of the Study
The study adopted a qualitative approach and a case study design. Random sampling was used to
select the schools to be in the study. Mathematics students were chosen because they are directly
affected by performance ranking as far as voice and agency is concerned. Teachers were chosen
because they are key to major decisions as per the performance ranking outcomes.

IOJPE
ISSN: 1300 – 915X
www.iojpe.org
International Online Journal of Primary Education 2021, volume 10, issue 1
Copyright © International Online Journal of Primary Education 141
The study was carried out in Kenya. There are forty seven counties in Kenya and in each county there
two major categories of secondary schools namely; public and private. Public schools are further
categorized into four groups depending on students performance and learning resources available (
Makori, Onyura, Cheboiwo, Yegon, & Kandie, 2015) namely; National, Extra County, County and
Sub-County schools. The study was carried out in secondary schools in Embu County which has two
National, fourteen Extra County, twenty two County, one hundred and forty eight Sub-County and
eight private schools. Study participants were nine Mathematics teachers and twenty six students from
seven public and two private secondary schools in Embu County, Kenya.
Data Collection and Data Analysis
Multiple data collection methods were employed in this study namely; face to face semi-structured
interviews, focus group discussions and document analysis. Multiple data collection methods was for
triangulation purposes in order to ensure credibility and validity of the study findings (Plano Clark &
Creswell, 2008). Six interviews and one focus group discussion lasting between 40 to 60 minutes were
conducted with Mathematics teachers while eight interviews and three focus group discussions lasting
between 30 to 40 minutes were conducted with student-participants. The interviews were audio
recorded, transcribed and subjected to qualitative data analysis (Suter, 2012). Further, schools ranking
data, students group organization record and teacher duties and responsibilities record documents were
carefully read and re-read to trace the position in the performance data of those in leadership positions
(O’Leary, 2014). The study participants were guaranteed anonymity and quotations from the
interviews reported accordingly (Sim & Waterfield, 2019).
FINDINGS and DISCUSSION
The interviews and focus group discussions focused on a range of topics, from the methodology of
performance rankings, to their effects on voice and agency in Mathematics teaching and learning. In
brief four major themes emerged from the analysis of the interviews, focus group discussions and
document analysis: while (1) performance rankings are popular in guiding resources allocation to
students, (2) the ranking data guides in selection students’ group leaders since they need to be at the
forefront in Mathematics learning. In addition, (3) performance ranking has greater influence on
teacher promotion. Finally, (4) performance ranking present data that can be used to identify
successful and unsuccessful Mathematics classes hence provides opportunities for benchmarking.
Allocation of Mathematics Revision Resources
Teaching and learning resources provide students with curiosity and independence in Mathematics
classrooms (Kartika, 2018). The independence encourages arguments and disagreements in
Mathematics classrooms providing learners with opportunities to increase understanding of the subject
matter. Studies have shown that inadequate teaching and learning resources in secondary schools are
the cause of poor performance (Kaimenyi, 2013). According to Kaimenyi (2013), in classrooms where
the resources are adequate, students scored higher than in those classes which lacked the resources.
Therefore, the school management should ensure that the students have the necessary materials for
learning and revision during examination preparations (Kimeu, Ronoh, & Tanui, 2015). Such
materials include revision books, past papers, and sample examination papers.
While equitable provision of learning opportunities may seem to be an ultimate challenge,
Mathematics teachers play a crucial role in creating appropriate learning environment for students
through resources allocation. Through appropriate resource allocation strategies teachers can
accomplish remarkable feats thus improving students’ achievement in Mathematics. Performance
ranking of students is among strategies teachers employ in the allocation of resources.
Out of the teachers interviewed majority had no particular modalities of allocating Mathematics
resources. But even in the absence of any particular modalities, there are hints of problems in the
practice. The top ranked students enjoyed the privilege of getting a lion’s share in the resource
allocation whiles those who were at the bottom of the rank missed out in the allocation.

IOJPE
ISSN: 1300 – 915X
www.iojpe.org
International Online Journal of Primary Education 2021, volume 10, issue 1
Copyright © International Online Journal of Primary Education 142
In the allocation of Mathematics textbooks, there is no particular order because I share a
textbook between two students. But the revision books are given, to the top students in
Mathematics. If those at the bottom of the rank are given, they just keep them, and the rest of
the students will not have an opportunity to use them. In situations when those at the bottom of
the rank require the revision books, I give them, and I encourage them to share with the rest
of the students (Form 1 Teacher in an Extra County school).
The students interviewed had similar views to those of the teachers interviewed. In many occasions
Mathematics teachers availed Mathematics revision books in the classroom and encouraged the top
ranked students to pick them in order to score highly and support teachers’ efforts in Mathematics
teaching.
Mathematics revision resources are availed by the teacher and the best students in
Mathematics pick them from the Mathematics teacher. The top students are generous with
their knowledge and revision books. The majority of the students, especially the low achievers
in Mathematics are against having revision books because they are afraid of losing them
(Form 4 student in a Sub-County school).
…top students have the best Mathematics revision books. Immediately they learn of
availability of a new revision book they pester the Mathematics teacher to issue the book to
them… (Students FGD in an Extra county school).
Providing adequate Mathematics teaching and learning resources such as revision books to students at
the top of the rank is a motivation for them to continue working hard to improve their rank. The
practice encourages students’ voice and agency in Mathematics learning. They enjoy the privilege of
controlling all other students in the classroom during the Mathematics learning and group discussions.
Most importantly, students at the top of the rank are empowered in their learning through being able to
access Mathematics revision materials leading to un-even allocation among the students. The lack of
equity in the practice has a negative effect on Mathematics teaching and learning as the students at the
bottom of the rank feel left out thereby developing negative attitudes towards Mathematics teachers
and the subject (Mensah, Okyere, & Kuranchie, 2013).
Influence of Performance Ranking in Selection of Leaders in Mathematics Classrooms
In appointment of study group leaders, Mathematics teachers appoint group leaders considering their
performance in Mathematics. The idea behind the practice is to give the students at the top of the rank
agency in Mathematics classrooms in order to influence the other students to work hard. The move
keeps students on their toes, which lead to a high concentration in Mathematics lesson translating to
high scores in the subject.
In appointing study group leaders in Mathematics, I consider the performance of students in
Mathematics. The one in charge of the group should be at the top of the other students in
performance. This is because they have the command of the group and what they propose is
taken very seriously by the rest of the members (Form 1 teacher in a private school).
….When low achievers in Mathematics are appointed leaders in study groups, they often feel
insecure and threatened when told to lead in groups which comprise top achievers in
Mathematics. In case the Mathematics teacher insists, the students respond by withdrawing
from participation or looking to the teacher to give legitimacy to their responses within
groups due to lack of confidence( Form 2 teacher in a sub- County school).
The appointment into a leadership position in the Mathematics classrooms was given to those students
with leadership qualities. In most cases, students with leadership qualities were the ones at the top of
the rank because they were confident and focused. The low achievers in most cases were shy and
suffer from inferiority complex. Most importantly, the appointment was taken as a reward to the top
achievers. In tandem with the study findings, World Bank (2001) observed that as a result of

IOJPE
ISSN: 1300 – 915X
www.iojpe.org
International Online Journal of Primary Education 2021, volume 10, issue 1
Copyright © International Online Journal of Primary Education 143
performance ranking, the teachers and the school management are able to identify low performing
students as well as those better performing which further guides them in the creation of study groups
bearing in mind the differences in performance among the students.
Teachers have a belief that students at the top of the rank should have voice and agency in
Mathematics learning thereby impart the spirit of working hard to other students. The result will be a
formation of motivated teams in Mathematics learning, translating into high concentration in
Mathematics lessons leading to an improvement of students’ scores in the subject.
Appointment/Promotion of Mathematics Teachers
Internal appointments in the Mathematics department provide teachers with voice in Mathematics
teaching. The policy guidelines on teacher appointment and promotion into administrative position
puts into considerations on teacher academic and professional qualifications, students' performance in
national examinations, participation in co-curricular activities and a teacher's professional conduct
(Republic of Kenya, 2005). The promotion and appointments give teachers agency in teaching in
various institutions.
Administrators use performance ranking in Mathematics in the appointment and promotion of
Mathematics teachers. The Head of the Mathematics Department is required to be at the forefront in
influencing the quality of Mathematics teaching among Mathematics teachers in the department. It is a
challenge for a Head of Department to devote enough time and energy in preparation for their classes
in addition to the administrative duties. The administrators promoted the hard-working Mathematics
teacher to head the department as far as students mean score was concerned.
Sometimes, I wish I could just teach - there is so much administrative work in the Mathematics
department, paperwork, and follow-up of discipline to do when you are ahead of the
department in Mathematics. Teaching suffers on account of this. Therefore, in internal
appointments in the department, performance ranking is considered to have the very
committed head of the Mathematics department. This is because if his/her classes mean score
is below those of other teachers somehow, the head of the department lacks the moral
authority to monitor standards if his/her own is lacking in rigor (Form 3 teacher in a national
school).
…… teacher whose classes perform better in comparison to the others is usually given
privilege in any appointments not necessarily in the Mathematics department. This is because
even the employers of teachers recognize and promote the teachers whose subjects are
performed well comparatively (form 4 teacher in an Extra- County school).
The findings are in line with views of Pope (2019) who found that performance ranking helps in
improving teacher performance and as a result, the best performing teachers are identified and
promoted into their various departments. Such school practices are considered a motivation to the
teacher so that they can inspire the rest of the staff to assist students in their studies creatively. Further,
the teacher at the top of the rank has great influence in the school as directives they issue are taken
seriously by the administrators and other teachers. They are considered to have great authority in the
subject they teach and considered to have the best Mathematics pedagogical strategies. Being the
leader in the department, they enjoy being at the forefront in the development of students
mathematical thinking (Boyd & Ash, 2018).
Identification of Benchmarking Classes and Schools
Identification of benchmarking classes gives teachers voice in the school because they at the center in
decision making as far as which direction Mathematics teaching should take in particular schools.
According to Nyaoga, Mundia, and Irungu (2013), education benchmarking is a study of how other
schools or classes carry out their day-to-day activities for students’ academic achievement.
Benchmarking, as a tool, can be utilized by secondary schools administrators to change performance
from low grade to high grade (Amunga, Ondigi, Ndiku, & Ochieng, 2013). The practice enables the

IOJPE
ISSN: 1300 – 915X
www.iojpe.org
International Online Journal of Primary Education 2021, volume 10, issue 1
Copyright © International Online Journal of Primary Education 144
schools to identify their performance gaps and address them by sharing with the best performing
schools.
Performance ranking influences in the identification of the benchmarking classes in the school. It is
the duty of the school administrators to ensure that all efforts are geared towards ensuring that
students' performance is excellent in the subject. For instance, benchmarking with well-performing
schools to learn the strategies they employ in order to have exemplary results. Therefore, performance
ranking should be encouraged so that the well-performing schools are known and poor performing
schools can visit them for benchmarking.
Performance ranking in Mathematics is good because, through it, one can identify the
secondary schools which have a record of exemplary performance in Mathematics. Like last
year, my students performed poorly in Mathematics, and this year, I am planning to take them
to one of the schools which registered good performance so that they learn the tricks behind
the good performance. I believe they will register good grades this year (Form 4 teacher in a
sub-County school).
Learning is a continuous process, and therefore benchmarking in education is gainful to both the
students and teachers. Students get an opportunity to learn from the experience of other students and
teachers learn from the experience of other teachers handling the same subject. During the
benchmarking process, the students and teachers assess how the best performing schools get their
success. First, the process enables them to identify their performance gaps for continuous
improvement. Secondly, it enables the parties concerned to develop an improvement mindset and
understanding best practices for good results based on the benchmarking outcomes.
Similar to the study findings, Chemers, Hu, and Garcia (2011) opined that through performance
ranking, schools stakeholders can observe the best performing schools as well as those poorly
performing ones. The low performing schools get a chance to benchmark with those better-performing
schools to enhance their performance. Further, the class at the top of the rank in a school with more
than one stream is used for benchmarking within the school. The class enjoys agency in Mathematics
teaching and control the direction in which learning should proceed.
Conclusion
The aim of this paper was to demonstrate that performance ranking has influence on the voice and
agency in Mathematics teaching and learning. The paper has demonstrated that performance ranking
forms a basis in which the Mathematics teachers are evaluated and eventually appointed in leadership
positions in the school giving them voice in Mathematics teaching. Secondly, performance ranking
guides Mathematics teachers in the appointment of discussion group leaders. They do so based on the
students' abilities and leadership qualities. In most cases, the students with leadership qualities are the
ones at the top of the rank because they are confident and focused. Therefore performance ranking
outcomes are of help to the teachers because the leaders should be the ones to impart the spirit of
working hard to the other students. Most importantly, the appointment to student leadership position is
taken as a reward to the top achievers giving them agency in Mathematics learning. Therefore, using
the performance ranking, the teachers and the school management can identify low performing
students as well as those better performing hence forming study groups bearing in mind on the
differences in performance among the students. Further, performance ranking guides teachers in
allocating revision resources whereby the students at the top of the rank are provided with adequate
Mathematics resources in appreciation of their good work. The practice aimed at encouraging the
students to keep on working hard so that the class-mean score improves. Finally, performance ranking
influences in the identification of the benchmarking secondary schools in Mathematics in the county.
Benchmarking with good performing school was found to be crucial to remain competitive and to
achieve better educational outcomes. In this paper, we have demonstrated that benchmarking is gainful
to both the students and teachers. Students get an opportunity to learn from the experience of other
students and teachers learn from the experience of other teachers handling the same subject. During

IOJPE
ISSN: 1300 – 915X
www.iojpe.org
International Online Journal of Primary Education 2021, volume 10, issue 1
Copyright © International Online Journal of Primary Education 145
the benchmarking process, the students and teachers assess how the best performing schools acquire
their success. Further the process enables them to identify their performance gap for continuous
improvement as well as enabling the other parties concerned to develop an improvement mindset and
understanding best practices for good results based on the benchmarking outcomes.
Recommendations
This study recommends that performance ranking should be used as a tool to give students voice and
agency in teaching and learning by ranking students and classes on the basis of marks scored on conti-
nuous assessment tests, students’ entry mark and value addition. The practice will help in identifying
the Mathematics classes and students at the top of the rank to act as a bench-mark. During the
benchmarking process, the students and teachers assess how the best performing schools acquire their
success. This process, therefore, enables them to identify their performance gap for continuous
improvement as well as enabling the other parties concerned to develop an improvement mindset and
understanding best practices for good results based on the benchmarking outcomes.
Limitations of the study
Based on the findings from this study, the authors recommend further research to explore how
contextual value-added data may be used in the newly introduced competency based curriculum in
Kenya since the new curriculum de-emphasizes the standardized testing that was evident in the old
curriculum. In addition, one of the limitations of this study was that it did not consider other factors
that could contribute to the students’ and teachers’ agency and voice in the mathematics classroom,
including the teaching-learning environment. As such, there is need for further research that isolates
these other factors with a view to establish the actual contribution of performance ranking in the
teaching-learning process.
Acknowledgements
The authors wish to acknowledge the great support in gaining entry to the secondary schools in Embu
County to collect data by the office of the County Director of Education Embu County. The authors
are also grateful to the school administrators, Mathematics teachers and students who took part in the
study.
Disclosure Statement
The authors reported that there was no conflict of interest in this study.
REFERENCES
Amunga, J. K., Amadalo, M. M., & Maiyo, J. K. (2010). Ranking of secondary schools and students in national
examinations: The perception of teachers and students. Problems of Education in the 21st Century, 20(15), 9-19.
Amunga, J., Ondigi, B., Ndiku, J., & Ochieng, P. (2013). Collaboration, benchmarking and secondary schools’ mean scores
in the Western region, Kenya: An analytical investigation. International Journal of Education and Research, 1(9), 1-
8.
Andersson, A., & Norén, E. (2011). Agency in Mathematics education. Proceedings from 7th conference for European
research in Mathematics education, (pp. 1389–1398). Stockholm: Stockholm University.
Ball, S. (2009). Privatising education, privatising education policy, privatising educational research: Network governance and
the ‘competition state’. Journal of Education Policy, 24(1), 83-99
Batra, P. (2005). Voice and agency of teachers: Missing link in national curriculum framework 2005. Economic and Political
Weekly, 40(40), 4347-4356.
Bicknell, B., & Riley, T. (2012). The role of competitions in a Mathematics programme. The New Zealand Journal of Gifted
Education, 17(1), 1-9.
Boyd, P., & Ash, A. (2018). Mastery Mathematics: Changing teacher beliefs around in-class grouping and mindset. Teaching
and Teacher Education, 75, 214-223.
Burgess, S., Propper, C., & Wilson D. (2002). Will more choice improve outcomes in education and health care? Evidence
from economic research. CMPO Report, University of Bristol.

IOJPE
ISSN: 1300 – 915X
www.iojpe.org
International Online Journal of Primary Education 2021, volume 10, issue 1
Copyright © International Online Journal of Primary Education 146
Chapman, D. W., & Synder, C. W. (2000). Can high stakes National testing improve instructions? Reexamining conventional
wisdom. International Journal of Educational Development, 20(6), 457-474.
Chemers, M. M., Hu, L. T., & Garcia, B. F. (2001). Academic self-efficacy and first-year college student performance and
adjustment. Journal of Educational Psychology, 93(1), 55-64.
Cook-Sather, A. (2006). Sound, presence, and power: ‘Student voice’ in educational research and reform. Curriculum
Inquiry, 36(4), 359-390.
Downes, D., & Vindurampulle, O. (2007). Value-added measures for school improvement. East Melbourne, Vic.: Dept. of
Education and Early Childhood Development.
Dunne, M., Humphreys, S., Sebba, J., Dyson, A., Gellannaugh, F., & Muijis, D. (2007). Effective teaching and learning for
pupils in low attaining groups. Annesley: Dept. for Children, Schools and Families.
Hazelkorn, E. (2008). Learning to live with league tables and ranking: The experience of institutional leaders. Higher
Education Policy, 21(2), 193-216.
Kaimenyi, N. E. (2013). Factors influencing the academic performance of students in Kenya Certificate of Secondary
Education in Imenti North District, Kenya. (Unpublished master's thesis). University of Nairobi, Kenya.
Karabenick, S. A., & Newman, R. S. (2013). Help seeking in academic settings: Goals, groups, and contexts. New York;
Routledge.
Kartika, H. (2018). Teaching and learning Mathematics through web-based resource: An interactive approach. MaPan:
Jurnal Matematika dan Pembelajaran, 6(1), 1-10.
Kell, M., & Kell, P. (2014). Literacy and language in East Asia: Shifting meanings, values and approaches. New York;
Springer.
Kellaghan, T. (1996). IEA studies and educational policy. Assessment in Education, Principles, Policy & Practice, 3(2), 143–
160.
Khuzwayo, H. B., & Bansilal, S. (2012). Granting learners an authentic voice in the Mathematics classroom for the benefit of
both the teacher and the learner. Pythagoras, 33(2), 1-7.
Kimeu, M, R., Ronoh, A., & Tanui, E. (2015). Influence of instructional resources on secondary school students’ academic
performance in Makueni County, Kenya. International Journal of Scientific Research and Innovative Technology,
2(1), 70-81.
Leckie, G., & Goldstein, H. (2019). The importance of adjusting for pupil background in school value-added models: A study
of Progress and school accountability in England. British Educational Research Journal, 45(3), 518-537.
Makori, A., Onyura, G., Cheboiwo, F., Yegon, J., & Kandie, J. (2015). Form one selection process, an encouragement or a
discouragement: Examining parents’ perceptions in Baringo County, Kenya. Merit Research Journal of Education
and Review, 3(7), 228-234.
Mensah, J. K., Okyere, M., & Kuranchie, A. (2013). Student attitude towards Mathematics and performance: Does the
teacher attitude matter? Journal of Education and Practice, 4(3), 132-139.
Morgan, C. (2016). Studying the role of human agency in school Mathematics. Research in Mathematics Education, 18(2),
120-141.
Morrison, K. A. (2008). Democratic classrooms: Promises and challenges of student voice and choice, part one. Educational
Horizons, 87(1), 50-60.
Nel, M. (2017). Student voice and agency in master’s thesis writing in a second language context: Beyond the use of
pronouns. (Unpublished doctoral dissertation). Stellenbosch University, South Africa.
Neves, T., Pereira, M. J., & Nata, G. (2014). Head teachers’ perceptions of secondary school rankings: Their nature, media
coverage and impact on schools and the educational arena. Education as Change, 18(2), 211-225.
Niesche, R., & Keddie, A. (2016). Leadership, ethics and schooling for social justice. New York, NY: Routledge.
Nyaoga, R. B., Mundia, C. M., & Irungu, I. (2013). The effect of benchmarking on performance in secondary schools in
Nakuru Municipality-Kenya. International Journal of Management, IT and Engineering, 3(2), 283-296.
OECD (Ed.). (2012). Equity and quality in education: Supporting disadvantaged students and schools. Paris: OECD
publishing.
O’Leary, Z. (2014). The essential guide to doing your research project (2nd ed.). Thousand Oaks, CA: SAGE Publications,
Inc.

IOJPE
ISSN: 1300 – 915X
www.iojpe.org
International Online Journal of Primary Education 2021, volume 10, issue 1
Copyright © International Online Journal of Primary Education 147
Plano Clark, V. L, & Creswell, J. W. (2008). Student study guide to accompany Creswell’s educational research planning,
conducting, and evaluating quantitative and qualitative research (3rd ed.). Upper Saddle River N.J.: Pearson
Education.
Pope, N. G. (2019). The effect of teacher ratings on teacher performance. Journal of Public Economics, 172, 84-110.
Republic of Kenya (2005). Sessional paper No.1 of 2005 on a policy framework for education, training, and research.
Nairobi: Government Printer.
Sim, J., & Waterfield, J. (2019). Focus group methodology: Some ethical challenges. Quality and Quantity, 6(53), 3003-
3022.
Suter, W. N. (2012). Introduction to educational research: A critical thinking approach. Thousand Oaks: SAGE
Publications.
Van Lier, L. (2008). Agency in the classroom. In J. P. Lantolf and M. E. Poehner (eds.). Sociocultural theory and the
teaching of second languages, (p. 163-188). London: Equinox.
White, D. Y. (2003). Promoting productive mathematical classroom discourse with diverse students. The Journal of
Mathematical Behavior, 22(1), 37-53.
Wilkins, A. (2012). Push and pull in the classroom: Competition, gender and the neoliberal subject. Gender & Education,
24(7), 765-781.
Wilson, D., & Piebalga, A. (2008). Performance measures, ranking and parental choice: An analysis of the English school
league tables. International Public Management Journal, 11(3), 344-366.
World Bank (2001). Alternative schools and Roma education: A review of alternative secondary school models for the
education of Roma children in Hungary. Budapest, Hungary: World Bank Regional Office.

IOJPE
ISSN: 1300 – 915X
www.iojpe.org
International Online Journal of Primary Education 2021, volume 10, issue 1
Copyright © International Online Journal of Primary Education 148
EFFECTS OF PRIMARY SCHOOL TEACHER PERSONALITY AND
NETWORK INTENTIONS ON CHANGE: MEDIATING ROLE OF
PROFESSIONAL LEARNING
Emre ER
Assistant Professor, Yıldız Technical University, Turkey
ORCID: https://orcid.org/0000-0002-9084-6768
Received: February 03, 2021 Accepted: April 27, 2021 Published: June 30, 2021
Suggested Citation:
Er, E. (2021). Effects of primary school teacher personality and network intentions on change: Mediating role of professional
learning. International Online Journal of Primary Education (IOJPE), 10(1), 148-159.
This is an open access article under the CC BY 4.0 license.
Abstract
This study aims to examine the mediating role of professional learning on change in teacher practice through the proactive
personality and network intentionality. This research also seeks to better comprehend and capture the antecedences and
consequences of the network intentions. 438 primary school teacher from 24 schools participated in the study from Istanbul.
Network intentionality scale, proactive personality scale, teacher professional learning scale, and change in teacher practices
scale were used to collect data. All the measures were conceptualized as individual-level constructs. The results of the study
show that there are positive correlations between proactive personality network intention, professional learning and change
in teacher practice. Also, the study revealed that proactive personality has positive effects on the network intentions; network
intentions has a both direct and indirect effect on the change in teacher practice. These results explicitly indicated that
change in teacher practice is closely associated with teacher professional learning, teacher personality, and network
intentions. Because of the change in teacher practice is closely related to group dynamics and learning, planning a change
strategy about understanding the role of learning and having a relationship with a colleague is so crucial for schools.
Keywords: Professional learning, network intention, proactive personality, change in teacher practice, primary education.
INTRODUCTION
During the last few decades, the social side of teachers’ professional learning has been a trend topic in
the field of educational management and administration (Baker-Boyle & Yoon, 2020; Baker-Boyle &
Yoon, 2018; Van Waes, Van den Bossche, Moolenaar, De Maeyer, & Van Petegem, 2015; Liou &
Daly, 2014; Yoon, Koehler-Yom, & Yang, 2017). Some scholars have stressed that developing
teacher learning programs is closely related to the extent to which teachers have the right to build
collegial relationships with other teachers (Baker-Boyle & Yoon, 2011; Diehl, 2020; Li & Krasny,
2020; Sinnema, Daly, Liou, & Rodway, 2020). Therefore, one of the promising ways conducive to
heightening teacher learning is to establish teacher collaboration networks. While teacher learning
plays a central role in elevating student learning outcomes, available research has shown that these
programs mostly remain ineffective in bringing significant change in teacher’s instructional practices
and thereby improving student learning (Burt & Keenan, 1998). Thus, this paper investigates the role
of “tendency to learning from peer network” and “proactive personality” in sustaining change in
practice and professional teacher learning.
Professional development efforts typically include a range of formal policies and procedures to
improve teacher performance. However, empirical evidence indicates that school-based and ongoing
teacher learning may yield higher quality student outcomes than the top-down and mandated learning
activities where teachers are sent randomly (Baker-Boyle and Yoon, 2010; Porter, Garet, Desimone,
Yoon, & Birman, 2000). Teacher networks have been shown to provide sustainable professional
support and are important sources of teacher knowledge (Lieberman, 2000). Despite the interest and
noted value of developing networks and professional communities, little research effort has been
devoted, so far, to investigating the structure of teacher networks and how they impact teachers’
active participation in professional development programs (Penuel & Riel 2007).

IOJPE
ISSN: 1300 – 915X
www.iojpe.org
International Online Journal of Primary Education 2021, volume 10, issue 1
Copyright © International Online Journal of Primary Education 149
In literature, teacher interaction is represented by several concepts such as professional learning
communities, organizational learning, and communities of practice, peer learning networks, and
advice networks. These concepts highlighted the importance of teachers learning through interaction.
Teachers’ professional learning and changing the instructional practices are the expected results of a
well-designed teacher development program. Thus, understanding the potential reasons for teachers to
change their instructional practices by using a personal network intention lends credence to
discovering more about the dynamics of the teacher learning communities.
Although there is an empirical association between teacher professional development and changing
practice, little is known about how and why teachers change their instructional practices (Boyle,
Lamprianou, & Boyle, 2005; Porter et al., 2000). Research also revealed that change in teacher
practice is mainly driven by teacher beliefs, attitudes, and perceptions on instruction rather than
knowledge. Thus, there are two mainstream teacher change approaches, namely one highlighting the
role of the structure and process of change, the so-called linear model. The other, called the complex
model, is a rather dynamic process that includes different points of view, interpretations, and actors'
connections. Such models are driven by the relationships between peers and represent an informal and
interactive perspective on teacher learning and change. While a range of educational scholars
acknowledges the importance of interpersonal relationships and social interaction for teacher
development (Daly, Moolenaar, Bolivar, & Burke, 2010; Martin & Dawson, 2009; Wubbels, Brok,
Tartwijk, & Levy, 2012), there is little evidence for the informal social interactions and their effects
on change in teachers practices.
Extant research has shown that personal characteristics may affect professional interactions and the
ability to share knowledge (Talebizadeh, Hosseingholizadeh, & Bellibaş, 2021). Although teachers’
personality traits have long been examined, little research effort has been spent investigating the role
of personality in teachers’ professional learning. Therefore, teachers’ proactive personality is a
potential construct to enhance or constrain teachers’ intentions on developing professional learning
networks. In this regard, there is a need for further analysis regarding teacher professional learning
networks, along with how these networks are associated with teacher personality and professional
learning and instructional practices. The current study seeks to contribute to the literature by
explaining the link between proactive personality and network intentions on change in teacher
practice, with the mediating role of teacher professional learning. The study has some potential
contributions to the literature in several ways. First of all, the changes in teachers' instructional
practices are examined in terms of network intention variables. In addition, the mediating level of
professional learning on the effect of personality and network intentions on change was examined.
Theoretical Framework
Social network theory
Social network theory is important for educational science research, as it structurally enables original
evaluations of the whole network and each actor that makes up the network. Since the teaching
profession includes competence areas that can be gained through continuous professional
development on the job, it is predicted that continuous professional development should be achieved
by the efficient use of the school's own resources. The position of teachers in social networks and thus
their level of benefiting from the social capital of the school has determinant effects in the context of
developing learning and teaching practices (Penuel, Riel, Krause, & Frank, 2009). Social network
theory has significant potential for analyzing educational organizations. Especially since the 1990s,
with the spread of social networks primarily in the behavioral sciences field, it has also started to
attract attention in the educational sciences field (Er, 2017). The social network approach, which has
been popular in social sciences for a while, has been used later in educational sciences.
The use of social network theory and methods to understand how teacher collaboration can help or
constrain teaching and educational change is an evolving trend in teacher professional development
research (Coburn, & Russell, 2008; Daly, Moolenaar, Bolivar, & Burke, 2010; Datnow, 2012;

IOJPE
ISSN: 1300 – 915X
www.iojpe.org
International Online Journal of Primary Education 2021, volume 10, issue 1
Copyright © International Online Journal of Primary Education 150
Moolenaar, Sleegers, & Daly, 2012). However, as the professional networks of teachers affect student
success through collective competence (Moolenaar, Sleegers, & Daly, 2012), it plays an important
role in achieving a structure suitable for the purposes of the school. Social network analysis in
educational research typically provides an alternative way of addressing the teachers, not as isolated
actors but as individuals surrounded by others. Therefore, a social network approach offers a powerful
lens to examine the degree to which social systems influence individuals' emotions, behaviors, and
expectations (Siciliano, 2016). There are three avenues of studies that combine social network theory
and education. First, studies that include the structure and characteristics of social networks, second,
studies that address the results revealed by social networks, and finally, studies that examine the
variables that lead to the formation of social networks. An important strength of the current study is
that it covers the structure of social networks, the causes that arise, and the consequences of social
networks. In other words, this study examined the current structure of collaborative professional
learning networks between teachers, the change in professional learning and teaching practices as the
results of the proactive personality and social network structure that is thought to be effective in the
emergence of this structure.
Change in teacher practice
How teachers change their teaching practices and who are more effective in this change process is an
important area of educational research. A study conducted in the literature on the teaching practices of
teachers in the early years of the profession showed that the social networks in which teachers
participate in the process of making sense of new practice and moving from interpretation to practice
are decisive (Frank, Kim, Salloum, Bieda, & Youngs, 2020). Other studies have focused on the
change of teaching practices and the impact of school administrators' leadership (Özdemir, 2019;
Parise & Spillane, 2010).
In recent years, studies on teacher failure and the social aspect of professional learning and change
have been found in research on teacher change in educational sciences. In educational change
literature, it can often be said that teachers seen as only practitioners of change planning. According to
the social network approach, the main factor behind successful educational reforms is not well-
planned reforms or technical support but the intimate and constructive relationships that teachers
provide with their colleagues (Daly, 2010). In this context, it can be said that the colleagues with
whom teachers relate have a significant influence on the change in their professional practice.
Research that emphasizes the importance of social networks in teachers' professional changes presents
change-oriented behavior in a collective context, emphasizes the relationship between individual
views and group characteristics, and focuses on teacher failure (Moolenaar, Sleegers, & Daly, 2012;
Moolenaar, 2012; Spillane, Kim, & Frank, 2012).
Teacher professional learning
A growing body of educational researchers has related teacher professional development to the quality
of teachers’ instructional practices, and eventually, student learning outcomes (Meiers, 2007;
Timperley, & Alton-Lee, 2008). Effective professional development results in the changing daily
practices of the teachers and improvements in student learning outcomes (Darling-Hammond, Hyler,
& Gardner, 2017). The development of teachers in professional learning community studies discussed
in the context of the sharing of expertise and other resources among the social capital (Liou & Daly,
2014). In this sense, it is important for teachers to develop a common purpose in school and support
mutual professional sharing processes in their professional learning. In recent years, it has been
emphasized that individual variables, as well as school or group-level variables, have become
important, especially in studies on concepts that are considered effective in teachers’ professional
learning (Kılınç, Polatcan, Atmaca, & Koşar, 2021; Mockler, 2020).
Teacher proactive personality
The quality of educational systems is closely related to the professional development levels of
teachers. This situation is related to the organization of activities based on continuous and active
participation and the individual involvement of teachers in these activities. Accordingly, teachers with

IOJPE
ISSN: 1300 – 915X
www.iojpe.org
International Online Journal of Primary Education 2021, volume 10, issue 1
Copyright © International Online Journal of Primary Education 151
personality traits that facilitate their professional learning and development will make it easier to
reach the expected educational goals. Personality is one of the important variables in understanding
the effectiveness of teachers (Rushton, Morgan, & Richard, 2007). Although many studies have been
conducted on the relationship between personality and the professional characteristics of teaching, it
is observed that the nature of the relationship teachers establish with their students and the increasing
expectation of leadership for teaching, especially on proactive personality, has been intensified.
Morgan & Richard, 2007). Although many studies have been conducted in which the relationship of
personality with the professional characteristics of teaching is discussed, it is seen that research on
proactive personality is intensified, especially with the nature of the relationship teachers establish
with their students and the expectation of leadership towards increased teaching. Proactive personality
traits include an individual's willingness to influence and change their environment (Bateman &
Crane, 1993). A proactive personality positively affects people's creativity by making it easier for
them to acquire new skills (Joo & Lim, 2009). Individuals with proactive personality traits try to
intervene in the environment for their own purposes rather than adapting to environmental conditions
(Bateman & Crane, 1993). However, it seems that proactive employees evaluate opportunities for
change, make more intensive efforts and take the initiative to achieve set change goals, and try
different ways to change results (Bateman & Crant, 1999). The proactive personality has been the
subject of many studies to reach organizations matches and predict employee performance
(Chackoria, 2019; Gevorkin, 2011; Huber, 2017; Ng, Eby, Sorensen, & Feldman, 2013; Patterson,
2018; Turner, 2003).
Teachers’ proactive personality traits positively influence school climate perceptions and creativity
levels (Gao, Chen, Zhou, & Jiang, 2020). Other studies have found associations with proactive
personality with problem-solving skills (Şener, 2019), perceived organizational support (Yan, 2015),
and access to organizational support networks (Chan, 2006). For reasons such as the difference in
problems encountered in the teaching profession, the need to produce alternative solutions, and the
development of students' original thinking skills inside and outside the classroom, proactive teacher
behavior has begun to be among the variables that need to be focused on. The study hypotheses are
given below:
H1: Proactive personality has positive effects on network intentions.
H2: Proactive personality has positive effects on the teacher's professional learning.
H3: Network intentions have positive effects on the teacher's professional learning.
H4: Network intentions have positive effects on the change in teacher practices.
H5: Teacher professional learning has positive effects on the change in teacher practices.
H6: Network intentions have positive effects for change in teacher practices and would be mediated by
teacher professional learning.
The summary of paths based on the hypotheses presented in the Figure 1.
Figure 1. Hypothetical model

IOJPE
ISSN: 1300 – 915X
www.iojpe.org
International Online Journal of Primary Education 2021, volume 10, issue 1
Copyright © International Online Journal of Primary Education 152
METHOD
Sample and Context
A total of 24 elementary schools in Istanbul participated in this study. Stratified sampling technique
was used to determine the participants of the study. This method of sampling enable representing all
subgroups among the population (Büyüköztürk, Çakmak, Akgün, Karadeniz, & Demirel, 2021). Data
for this study were collected in all 24 elementary schools of the Istanbul European Side School
District, located in Turkey. Istanbul European School District is managed under 25 site administration
which coordinates resources and human capital. The schools in the district mostly are located in urban
areas, and while the schools in the district differed regarding students’ SES. We purposely selected
this large district to ensure data from multiple schools. Data were gathered in 2020 from 438 teachers
reflecting a response rate of 92.4%. Of the educators, 45.2% of the respondents were male and 54.8%
female. These numbers nearly represent the gender ratio in Turkish elementary education across the
country. While 364 (83.1%) of the teachers had a bachelor's degree, only 74 teachers (16.9%) had
completed a graduate degree. The average teaching year of the participants was 9.2, with a standard
deviation of (SD=8.3).
Instrumentation
All the measures were conceptualized as individual-level constructs. Each of four construct was
assessed using a Likert scale; network intentionality scale (1=strongly disagree to 5=strongly agree)
proactive personality (1-totally disagree to 7-totally agree) teacher professional learning (1-totally
disagree to 5-totally agree), change in teacher practices (1-disagree to 4-agree).
Network intentionality
The original scale consists of 14 items and 4 sub-dimensions. Cronbach's Alpha reliability coefficient,
calculated from the total score of the scale in the validity and reliability study conducted by Cohen,
Klein, Daly, and Finnigan (2011). The Turkish adaptation of this scale was conducted by Er (2017).
In Turkish adapted form there are three sub dimensions. The scale evaluated the degree to which an
individual intends to sustain social relationships using four dimensions. The scale explains 66.3% of
the total variance. A sample item is “I actively seek new friendships across the organization.” The
Cronbach's Alpha reliability coefficient for total of the scale was calculated as .88. The sub
dimensions reliability scores were calculated as .83 for actively seeking relationships, .86 for having
the right set of relationships, assessing the relationships and .81 for liking to connect
Teacher proactive personality
The scale, developed by Bateman and Crant (1993), was adapted into Turkish by Akın, Abacı, Kaya,
and Arıcı (2011). Rising scores indicate increased proactivity. The measure is of the Likert Scale
(1=strongly disagree and 7=strongly agree). An example item is “I’m constantly looking for new ways
to improve my own life.” The Cronbach's Alpha reliability coefficient is calculated as .80.
Teacher professional learning
Perceptions of Professional learning of the teachers were measured with 27-item Teacher Professional
Learning Scale developed by Liu and colleagues (2016) and adapted into Turkish by Gümüş,
Apaydın, and Bellibaş (2018). A sample item is “I work together with colleagues to plan educational
activities.” The Cronbach's Alpha reliability coefficient is calculated as .91. The sub dimensions
reliability scores were calculated as .88 for collaboration, .82 for reflection, .85 for experimentation
and .84 for reaching the knowledge base.
Change in teacher practice
Change in teacher practice was measured by the extent to which teachers change their classroom
practices using borrowed items from Geijsel and colleagues (2009). The Turkish adaptation of this 8-
item scale was conducted by Polatcan (2020). A sample item is “I focus more on increasing pupils.”
The Cronbach's Alpha reliability coefficient is calculated as .83.

IOJPE
ISSN: 1300 – 915X
www.iojpe.org
International Online Journal of Primary Education 2021, volume 10, issue 1
Copyright © International Online Journal of Primary Education 153
Analytic Strategy
Participants’ perceptions on the proactive personality, professional learning, and changing practice
were examined in regard of their network intentions. Cronbach's Alpha coefficients (α) and
descriptive statistics between the variables were calculated. Also, confirmatory factor analysis (CFA)
was performed to ensure the construct distinctiveness of the proposed model. Two steps were taken to
test the hypotheses. First, correlation analysis was performed to examine the relationships between
teachers’ network intentions, proactive personality, professional learning, and change in teacher
practice. Second structural equation modeling was applied to test the relationships between variables.
RESULTS
CFA was performed to explain the goodness of fit of the study variables. Results of the analysis
illustrated that χ2/df, RMSEA, SRMR, CFI, GFI were at the acceptable level. Table 1 shows the CFA
results of the scales.
Table 1. CFA results
χ2/df RMSEA SRMR CFI GFI
Proactive personality 2.47 .07 .03 .89 .90
Teacher professional learning 2.49 .08 .02 .90 .93
Change in teacher practice 2.54 .06 .02 .92 .95
Network intention 2.57 .06 .03 .91 .91
Table 2 shows the means, standard deviations and correlation among variables
Table 2. Means, standard deviations and correlation among variables
Mean
SD.
PP
NI
Act.
Like
Bel.
Asse.
..
TPL
Col.
Ref.
Exp.
Reac
…….
CTP
PP 5.45 .92 -
NI 4.16 .49 .41** -
Act. 4.10 .66 .37** .88** -
Lik. 4.20 .53 .44** .92** .83** -
Bel. 4.01 .68 .40** .81** .76** .90** -
Asse. 3.98 .61 .27** .80** .81** .77** .84** -
TPL 3.90 .44 .24** .59** .48** .63** .57** .55** -
Col. 4.01 .54 .32** .62** .51** .67** .44** .47** .91** -
Ref. 3.89 .56 .20** .44** .47** .51** .33** .21** .88** .84** -
Exp. 3.97 .60 .19** .40** .35** .55** .34** .25** .93** .77** .90** -
Reac. 4.08 .71 .22** .33** .29** .47** .37** .35** .92** .80** .89** .88** -
CTP 3.20 .49 .36** .31** .30** .46** .29** .31** .50** .45** .48** .42** .50** -
**: Correlation is significant at the .01 level (2-tailed). SD: Standart deviation PP: Proactive personality, NI: Network
intention, Act: Actively seeking relationships, Like: Liking to connect, Bel: Belief in having the right relationships,
Asse: Assessing relationships, TPL: Teacher Professional learning, Col.: Collaboration, Ref.: Reflection, Exp.:
Experimentation, Reac.: Reaching the Knowledge Base, CTP: Change in teacher practices.
The mean scores show a high level of teacher proactive personality (Mean=5.45, SD=.92), teacher
network intention (Mean=4.16, SD =.49), teacher professional learning (Mean=3.90, SD=.44) and
change in teacher practice (Mean=3.20, SD=.49). At the same time there are positive and moderate
level relations between proactive personality and teacher network intention (r=.41, p<.01) and change
in teacher practice (r=.36, p<.01). In addition there are positive and moderate level relations between
teacher professional network and teacher professional learning (r=.59, p<.01). Finally there is a small
relationship between teacher professional network and change in teacher practice (r=.21, p < .01).
The fit indices, x2/sd=2.34, RMSEA=.06, AGFI=.92, GFI=.91, CFI=.91, IFI=.93, NFI=.91 yielded
acceptable compliance (İlhan & Cetin, 2014). It can be said that the theoretical model created in this
direction is compatible with the obtained data and is verified. The tested structural model is presented
in Figure 2.

IOJPE
ISSN: 1300 – 915X
www.iojpe.org
International Online Journal of Primary Education 2021, volume 10, issue 1
Copyright © International Online Journal of Primary Education 154
Figure 2. SEM model results
Table 3 shows the standardized direct, indirect, and total effects on change in teacher practice.
Table 3. Standardized direct, indirect, and total effects on change in teacher practice
β SE p
Direct Effect
PPNI .32 .06 .00
PPTPL .18 .08 .00
NITPL .56 .12 .00
NITCP .15 .09 .00
TPLTCP .47 .11 .00
Indirect Effect
PPNITCP .04
PPNITPL .18
NITPLTCP .26
Total Effect
NI TCP .41
Total effects of teacher professional network on teacher on change in teacher practice is significant
(β=.41). This revealed that teacher professional learning shapes the change attitude. Additionally, this
study showed that there are some statistically significant indirect effects from proactive personality
and teacher professional network on change in teacher practice. Also, there is some evidence for
explaining the teacher professional learning by teacher professional network and proactive personality
traits.
In order to interpret these effects more accurately, Cohen's f2 analysis results (small=f2≥.02,
medium=f2 ≥.15, large=f2≥.35) were examined (Cohen, 1988). These results showed that the effect
sizes of proactive personality (f2=.32) on change in teacher practice and network intentions (f2=.41)
were large. These results revealed that current model was significant.
DISCUSSION and CONCLUSION
The study found a positive relationship between proactive personality and network intention. In the
literature, there are studies where proactive personality and professional learning are associated (Er &
Çalık, 2020; Tunca, Elçi, & Murat, 2018; Van der Heijden et al., 2015). However, in the current
study, proactive personality is associated with changes in teachers practice. Our findings also found

IOJPE
ISSN: 1300 – 915X
www.iojpe.org
International Online Journal of Primary Education 2021, volume 10, issue 1
Copyright © International Online Journal of Primary Education 155
support from several pieces that evidenced a positive link between proactive personality and
innovation and change in the literature (Li, Liu, Liu, & Wang, 2017).
The results revealed a moderate association between participants' professional learning networks and
professional learning. The paradigm on the rise in teachers' professional learning emphasizes that
learning activities based on participatory, reciprocal relationships, and interaction and performed as
part of a community (Duncan‐Howell, 2010; Krutka et al., 2016; Sinnema et al., 2020). In this
context, it can be said that teachers can't learn independently of each other, and from the point of view
of educational organizations, learning should be considered collectively.
It is seen that positive relations have been achieved between the professional learning of teachers and
the change in teaching practices. Accordingly, it can be said that a positive and moderate link has
been established between learning and change. It is possible to establish similarities with studies in
the literature that have established a relationship between teacher exchange and professional learning
(Guskey, 2008; Timperley & Alton-Lee, 2008; Polatcan, 2020).
As part of the study, it is seen that teachers' professional learning networks have an impact on their
professional practice. Accordingly, the Professional Learning Network has a positive and decisive
impact on the exchange of teachers. In the literature, some studies establish a relationship between the
exchange of teachers and the learning network they participate in (Daly, Moolenaar, Bolivar & Burke,
2010). However, proactive personality traits were found to be effective in establishing a professional
learning network of teachers. In other words, the personality traits of teachers also affect community
participation and learning activities.
According to research results, teachers' professional learning has an impact on the change in their
practice. Accordingly, three variables can be listed as personality, learning, and networking among the
determining factors in changing teachers. According to the results obtained in this study, it is seen that
the proactive personality variable affects teachers' professional learning processes and that the
professional learning network affects the change in teaching practices.
Potentially, this study can make some significant contributions to practitioners and researchers in
terms of understanding the supporting factors for teacher learning, better understanding the structure
and results of teacher learning. In this context, it would be useful to consider vocational learning
based on research results by considering the individual characteristics of teachers and the structure of
the professional group in which they participate. As increasing the number of teachers with whom
teachers establish professional relationships affects professional learning and change, emphasis should
be placed on individual-group harmony. It is recommended to support original areas where teachers
can work together and produce.
The results obtained in the current study clearly show the impact of personality, network intentions,
and professional learning on changing teachers' professional practice. Accordingly, it is meaningful to
define a successful educational reform based on the relationship between learning and individual
variables. However, the study found that proactive personality traits influence teachers' network
intentions. This indicates the importance of personality traits in teachers' potential to learn from each
other. In other studies, teacher learning can be studied more extensively at the individual, group, and
school levels. However, the nature of teachers' professional learning networks is strongly associated
with the resources transferred between actors in the network. Therefore, change in educational
reforms can be seen as a result of strong professional interactions. Examining the change in teacher
practices through a series of time-based studies is important for achieving broader findings. In
addition, it is important to examine the teacher professional network structure, including the density,
reciprocity, and demographic composition of a social relationship pattern.
This study has some key implications for policy, practice, and research. This research has some
potential contribution to the Turkish Educational System’s school-based transformation process in
line with the “Turkey’s Education Vision 2023”. This study also sheds light on developing the school

IOJPE
ISSN: 1300 – 915X
www.iojpe.org
International Online Journal of Primary Education 2021, volume 10, issue 1
Copyright © International Online Journal of Primary Education 156
principal’s leadership practices in regard to social capital and teachers’ individual professional
learning needs. Furthermore, this study provides an understanding of teachers’ interactions and
personality characteristics for explaining the professional learning and change.
Limitation of the study
The study has some limitations that should be taken into account when interpreting its results. First,
this study only including the data through self-reported measures. Therefore participants may falsify
the results of the study. Second, network intentions as a social construct were examined from an
individual perspective. However, there should be some dyadic data to confirm the results revealed
from individuals. Finally, change in teachers practice should be measured with a longitudinal
perspective because of the nature of the change phenomena.
REFERENCES
Akın, A., Abacı, R., Kaya, M., & Arıcı, N. (2011). Kısaltılmış Proaktif Kişilik Ölçeği’nin (KPÖ) Türkçe formunun geçerlik
ve güvenirliği. Paper presented at the ICES11 International Conference on Educational Sciences, June, 22-25,
Famagusta, Cyprus.
Baker‐Doyle, K. J., & Yoon, S. A. (2011). In search of practitioner‐based social capital: A social network analysis tool for
understanding and facilitating teacher collaboration in a US‐based STEM professional development program.
Professional Development in Education, 37(1), 75-93.
Baker-Doyle, K. J., & Yoon, S. A. (2018). Towards intentional network design: Applying what we have learned from
teachers’ social capital interventions. In S. A. Yoon, & K. J. Baker-Doyle (Eds.). Networked by design: Interventions
for teachers to develop social capital (pp. 215–227). New York, NY: Routledge.
Baker-Doyle, K. J., & Yoon, S. A. (2020). The social side of teacher education: Implications of social network research for
the design of professional development. International Journal of Educational Research, 101.
Bateman, T. S., & Crant, J. M. (1999). Proactive behavior: Meaning, impact, recommendations. Business Horizons, 42(3),
63-70.
Boyle, B., Lamprianou, I., & Boyle, T. (2005). A longitudinal study of teacher change: What makes professional
development effective? Report of the second year of the study. School Effectiveness and School Improvement, 16(1),
1-27.
Burt, M., & Keenan, F. (1998). Trends in staff development for adult ESL instructors: ERIC Q & A. Washington, DC:
National Clearinghouse for ESL Literacy Education. Retrieved from
http://search.ebscohost.com/login.aspx?direct=true&db=eric&AN=ED423711&site=ehos t-live
Büyüköztürk, Ş., Çakmak, E., Akgün, Ö. E., Karadeniz, Ş., & Demirel, F. (2021). Eğitimde bilimsel araştırma yöntemleri
[Scientific research methods in education]. Ankara: PegemA.
Chackoria, J. (2019). Proactive personality, presenteeism, and future wellbeing. (Unpublished doctoral dissertation). Illinois
State University, Illinois.
Chan, D. (2006). Interactive effects of situational judgment effectiveness and proactive personality on work perceptions and
work outcomes. Journal of Applied Psychology, 91(2), 475.
Coburn, C. E., & Russell, J. L. (2008). District policy and teachers’ social networks. Educational Evaluation and Policy
Analysis, 30(3), 203-235.
Cohen J. E. (1988). Statistical power analysis for the behavioral sciences. Hillsdale, NJ: Lawrence Erlbaum Associates, Inc.
Cohen, A., Klein, K., Daly, A. J., & Finnigan, K. (2011). Out with the old, in with the new: When are leader successions
successful? New Directions in Leadership Annual Meeting. The Wharton School of Business University of
Pennsylvania.
Daly, A. J., Moolenaar, N. M., Bolivar, J. M., & Burke, P. (2010). Relationships in reform: The role of teachers' social
networks. Journal of Educational Administration, 48(3), 359-391.
Darling-Hammond, L., Hyler, M. E., & Gardner, M. (2017). Effective teacher professional development. Palo Alto, CA:
Learning Policy Institute.
Datnow, A. (2012). Teacher agency in educational reform: Lessons from social networks research. American Journal of
Education, 119(1), 193-201.

IOJPE
ISSN: 1300 – 915X
www.iojpe.org
International Online Journal of Primary Education 2021, volume 10, issue 1
Copyright © International Online Journal of Primary Education 157
Diehl, D. (2020). The multiplexity of professional learning communities: exploring the co-evolution of teacher social
networks. Research Papers in Education, 35(5), 623-639.
Duncan‐Howell, J. (2010). Teachers making connections: Online communities as a source of professional learning. British
Journal of Educational Technology, 41(2), 324-340.
Er, E. (2017). Social network analysis of primary school administrators and teachers relations. (Unpublished Doctoral
Dissertation). Gazi University, Educational Sciences Institute, Ankara.
Er, E., & Çalık, T. (2017). The relationships between primary school teachers’ social network tendency and perceptions on
social network structure of the school. Gazi University Gazi Faculty of Education Journal, 37(3), 1061-1083.
Er, E. & Çalık, T. (2020). Examining the effects of proactive personality, perceived network and demographic features on
professional relationship with social network analysis. In F. G. Yilmaz, M. and Naillioğlu Kaymak (Eds.),
Educational Research 2020, E-ISBN: 978-975-2490-47-5.
Frank, K. A., Kim, J., Salloum, S. J., Bieda, K. N., & Youngs, P. (2020). From interpretation to instructional practice: A
network study of early-career teachers’ sensemaking in the era of accountability pressures and Common Core state
standards. American Educational Research Journal, 57(6), 2293-2338.
Gao, Q., Chen, P., Zhou, Z., & Jiang, J. (2020). The impact of school climate on trait creativity in primary school students:
The mediating role of achievement motivation and proactive personality. Asia Pacific Journal of Education, 40(3),
330-343.
Geijsel, F. P., Sleegers, P. J., Stoel, R. D., & Krüger M. L. (2009). The effect of teacher psychological and school
organizational and leadership factors on teachers' professional learning in Dutch schools. The Elementary School
Journal, 109(4), 406-427. doi: 10.1086/593940.
Gevorkian, M. (2011). Relationships between proactive personality, networking, career satisfaction, and performance
perceptions. Doctoral dissertation, Alliant International University, Marshall Goldsmith School of Management, San
Diego.
Guskey, T. R. (2002). Professional development and teacher change. Teachers and Teaching, 8(3), 381-391.
Gümüş, S., Apaydın, Ç., & Bellibaş. M. Ş. (2018). Adaptation of teacher professional learning scale to Turkish: The validity
and reliability study. Journal of Education and Humanities: Theory and Practice, 9(17), 107-124.
Huber, A. F. (2017). Proactive personality and voluntary turnover: The moderating effects of development and perceived
career opportunities. (Unpublished Doctoral Dissertation). Illinois State University, Illinois.
İlhan, M., & Çetin, B. (2014). LISREL ve AMOS programları kullanılarak gerçekleştirilen yapısal eşitlik modeli (yem)
analizlerine ilişkin sonuçların karşılaştırılması [Comparing the Analysis Results of the Structural Equation Models
(SEM) Conducted Using LISREL and AMOS]. Journal of Measurement and Evaluation in Education and
Psychology, 5(2), 26-42.
Joo, B. K., & Lim, T. (2009). The effects of organizational learning culture, perceived job complexity, and proactive
personality on organizational commitment and intrinsic motivation. Journal of Leadership & Organizational Studies,
16(1), 48-60.
Kılınç, A. Ç., Polatcan, M., Atmaca, T., & Koşar, M. (2021). Teacher self-efficacy and individual academic optimism as
predictors of teacher professional learning: A structural equation modeling. Education and Science, 46(205).
Krutka, D. G., Carpenter, J. P., & Trust, T. (2016). Elements of engagement: A model of teacher interactions via professional
learning networks. Journal of Digital Learning in Teacher Education, 32(4), 150-158.
Li, Y., & Krasny, M. E. (2020). Development of professional networks among environmental educators. Professional
Development in Education, 46(2), 337-353.
Li, M., Liu, Y., Liu, L., & Wang, Z. (2017). Proactive personality and innovative work behavior: The mediating effects of
affective states and creative self-efficacy in teachers. Current Psychology, 36(4), 697-706.
Lieberman, A. (2000). Networks as learning communities: Shaping the future of teacher development. Journal of Teacher
Education, 51(3), 221-227.
Liou, Y. H., & Daly, A. J. (2014). Closer to learning: Social networks, trust, and professional communities. Journal of
School Leadership, 24(4), 753-795.
Liu, S., Hallinger, P., & Feng, D. (2016). Supporting the professional learning of teachers in china: Does principal leadership
make a difference? Teaching and Teacher Education, 59, 79-91.
Martin, A. J., & Dowson, M. (2009). Interpersonal relationships, motivation, engagement, and achievement: Yields for
theory, current issues, and educational practice. Review of Educational Research, 79(1), 327-365.

IOJPE
ISSN: 1300 – 915X
www.iojpe.org
International Online Journal of Primary Education 2021, volume 10, issue 1
Copyright © International Online Journal of Primary Education 158
Meiers, M. (2007). Teacher professional learning, teaching practice and student learning outcomes: Important issues. In
Handbook of Teacher Education (pp. 409-414). Springer, Dordrecht.
Mockler, N. (2020). Teacher professional learning under audit: Reconfiguring practice in an age of standards. Professional
Development in Education, 1-15.
Moolenaar, N. M. (2012). A social network perspective on teacher collaboration in schools: Theory, methodology, and
applications. American Journal of Education, 119(1), 7-39.
Moolenaar, N. M., Sleegers, P. J., & Daly, A. J. (2012). Teaming up: Linking collaboration networks, collective efficacy,
and student achievement. Teaching and Teacher Education, 28(2), 251-262.
Ng, T. W. H., Eby, L. T., Sorensen, K. L., & Feldman, D. C. (2005), Predictors of objective and subjective career success: A
meta-analysis. Personnel Psychology, 58, 367-408.
Özdemir, N. (2019). Principal leadership and students' achievement: Mediated pathways of professional community and
teachers' instructional practices. KEDI Journal of Educational Policy, 16(1), 81-104.
Patterson, M. N. (2018). Proactive personality benefits: The role of work-life salience, career encouragement, and career
satisfaction. Doctoral dissertation. San Jose State University, California.
Penuel, W. R., & Riel, M. (2007). The ‘new’ science of networks and the challenge of school change. Phi Delta Kappan,
88(8), 611-615.
Penuel, W. R., Riel, M. R., Krause, A., & Frank, K. A. (2009). Analyzing teachers’ professional interactions in a school as
social capital: A social network approach. Teachers College Record, 111(1), 124-163.
Polatcan, M. (2020). The adaptation of professional learning activities scale to Turkish: The validity and reliability study.
International Journal of Contemporary Educational Research, 7(2), 281-290. DOI:
https://doi.org/10.33200/ijcer.808721
Porter, A. C., Garet, M. S., Desimone, L. D., Yoon, K. S., & Birman, B. F. (2000). Does professional development change
teaching practice? Results from a three-year study: Executive summary. Washington, DC: U.S. Department of
Education, Office of the Undersecretary.
Rushton, S., Morgan, J., & Richard, M. (2007). Teacher's Myers-Briggs personality profiles: Identifying effective teacher
personality traits. Teaching and Teacher Education, 23(4), 432-441.
Siciliano, M. D. (2016). It’s the quality not the quantity of ties that matters social networks and self‐efficacy beliefs.
American Educational Research Journal, 53, 227– 262. https://doi.org/10.3102/0002831216629207
Sinnema, C., Daly, A. J., Liou, Y. H., & Rodway, J. (2020). Exploring the communities of learning policy in New Zealand
using social network analysis: A case study of leadership, expertise, and networks. International Journal of
Educational Research, 99, 101492.
Spillane, J. P., Kim, C. M., & Frank, K. A. (2012). Instructional advice and information providing and receiving behavior in
elementary schools: Exploring tie formation as a building block in social capital development. American Educational
Research Journal, 49(6), 1112-1145.
Şener, G. (2019). The predictive power of teachers' proactive personality traits on their problem solving skills. Pamukkale
University Journal of Education, 45(45), 175-189.
Talebizadeh, S. M., Hosseingholizadeh, R., & Bellibaş, M. Ş. (2021). Analyzing the relationship between principals’
learning-centered leadership and teacher professional learning: The mediation role of trust and knowledge sharing
behavior. Studies in Educational Evaluation, 68, 100970, 1-10
Timperley, H., & Alton-Lee, A. (2008). Reframing teacher professional learning: An alternative policy approach to
strengthening valued outcomes for diverse learners. Review of Research in Education, 32(1), 328-369.
Tunca, S., Elçi, M., & Murat, G. (2018). The effect of proactive personality structure and innovative behavior on task
performance. Adnan Menderes University Journal of Social Sciences Institutions, 5(1), 325-335.
Turner, J. E. (2003). Proactive personality and the Big Five as predictors of motivation to learn. Doctoral Dissertation, Old
Dominion University, Norfolk.
Van Waes, S., Van den Bossche, P., Moolenaar, N. M., De Maeyer, S., & Van Petegem, P. (2015). Know-who? Linking
faculty’s networks to stages of instructional development. Higher Education, 70(5), 807–826.
Van der Heijden, B. I., Van Vuuren, T. C., Kooij, D. T., & de Lange, A. H. (2015). Tailoring professional development for
teachers in primary education: The role of age and proactive personality. Journal of Managerial Psychology, 30(1),
22-37.

IOJPE
ISSN: 1300 – 915X
www.iojpe.org
International Online Journal of Primary Education 2021, volume 10, issue 1
Copyright © International Online Journal of Primary Education 159
Wubbels, T., den Brok, P., van Tartwijk, J., & Levy, J. (Eds.). (2012). Interpersonal relationships in education: An overview
of contemporary research. Rotterdam: Sense.
Yan, Y. (2015). The effect of perceived organizational support and proactive personality on reentry adjustment for returned
teachers from university. International Journal of Research, 2(6), 16-23.
Yoon, S., Koehler-Yom, J., & Yang, Z. (2017). The effects of teachers’ social and human capital on urban science reform
initiatives: Considerations for Professional development. Teachers College Record, 119(4), 1-32.

IOJPE
ISSN: 1300 – 915X
www.iojpe.org
International Online Journal of Primary Education 2021, volume 10, issue 1
Copyright © International Online Journal of Primary Education 160
A RASCH MODEL ANALYSIS OF PRIMARY SCHOOL STUDENTS’
CONCEPTUAL UNDERSTANDING LEVELS OF THE CONCEPT OF
LIGHT
Hüseyin Cihan BOZDAĞ
Ministry of National Education, Buca Gazi Secondary School, İzmir, Turkey
ORCID: https://orcid.org/0000-0001-6735-7096
Suat TÜRKOĞUZ
Assoc.Prof.Dr. Dokuz Eylul University, Buca Faculty of Education, İzmir, Turkey
ORCID: https://orcid.org/0000-0002-7850-2305
Received: December 05, 2020 Accepted: March 08, 2021 Published: June 30, 2021
Suggested Citation:
Bozdağ, C. H., & Türkoğuz, S. (2021). A Rasch model analysis of primary school students’ conceptual understanding levels
of the concept of light. International Online Journal of Primary Education (IOJPE), 10(1), 160-179.
This is an open access article under the CC BY 4.0 license
Abstract
The study determines the conceptual understanding levels of primary school students on the concept of light according to the
Rasch Model with a Four-tier Light Conceptual Understanding Test (LCUT). The participants were 355 (164 girls and 191
boys) primary school students studying at a public school in Izmir city center. In the study, the Rasch Model, which is
included in the Latent Trait Theory, was used. Also, the data regarding the answers given and the level of confidence in the
responses were associated with the Rasch analysis of LCUT. The results of Rasch analysis showed that LCUT was in full
harmony in the context of infit, outfit, and point measurement correlation statistics, and is a valid and reliable measurement
tool for conceptual understanding. Moreover, these results explained that the students' average conceptual understanding
ability regarding the Light unit was above the average item difficulty.
Keywords: Conceptual understanding, primary school, four-tier diagnostic test, light unit, Rasch model.
INTRODUCTION
The evaluation of the training process is as important as its planning and implementation.
Measurement and evaluation make a great contribution to the education process by determining the
development levels of individuals' knowledge and skills (Çetin, 2019). However, measurement and
evaluation in education is done indirectly with measurement tools consisting of multiple variables,
and therefore this contribution is possible with and data based on consistent, valid and reliable
measurement processes and measurement tools. Likewise, correct statistics, analysis and calculations
may the educational value of these data increase. After all, the sensitivity of the measurement data
increases with the quality of structural statistic analyzes used in the measurement tools and
contributes to the studies in educational assessment indirectly.
In the measurement and evaluation processes, two theories are used, namely, Classical Test Theory
(CTT) and Latent Trait Theory (LTT) (Kan, 2006; Keeves, 1998; Kelecioğlu, 2001). CTT is a
long-known theory where evaluation is made according to the whole test, not to each item (Bulut,
2018). Therefore, the contribution of different items to the individual's success is considered to be
equal (Anshel, Weatherby, Kang, & Watson, 2009). The search for an alternative theory for CTT has
started due to the following limitations: 1) the estimation of individuals' abilities based on their total
score, 2) the scores of the individuals depend on the test applied, 3) item statistics depend on the
characteristics of the group to which the test was applied (Bulut, 2018; Demirtaşlı, 1996; Hambleton
& Jones, 1993; Kelecioğlu, 2001). Accordingly, with the claim that it can overcome these limitations,
LTT was introduced at the end of the 1930s (Doğan & Tezbaşaran, 2003). According to LTT, there is
a relationship between the individuals' ability, which is not directly observed in a certain area, and

IOJPE
ISSN: 1300 – 915X
www.iojpe.org
International Online Journal of Primary Education 2021, volume 10, issue 1
Copyright © International Online Journal of Primary Education 161
their answers to the test items, consisting of questions that examine this area; this relationship can be
expressed mathematically (Kelecioğlu, 2001).
The two most widely used and open-to-develop models of LTT developed as an alternative to CTT
are the “Item Response Theory” (IRT) and the “Rasch Model” (RM) (Akın & Baştürk, 2012). IRT
assumes that a person's performance can be predicted in a test thanks to multiple features (Bulut,
2018). RM, on the other hand, is a technique developed by George Rasch in 1960 and evolved from
IRT (Doğru, 2019). RM determines the difficulty levels of the items and the ability levels of the
individuals. According to the model, it attempts to determine the probability of what an individual
with a certain ability level can do against the desired task (Rasch, 1961).
Although CTT is still widely preferred today in the analysis of a measurement tool, the biggest
limitation of CTT is that the characteristics of participants depend on the item and item characteristics
on the participant characteristics (Demirtaşlı, 1996). Accordingly, the contribution of different items
in predicting individuals' ability levels is equal. On the other hand, RM is different from many other
statistical models since it is a probabilistic model (Boone & Scantlebury, 2006). In RM, the
characteristics of an item can be calculated independently of the ability level of the participants, and
the ability levels of the participants can be estimated independently from the item sample they
answered. Also, the contribution of different items in predicting individuals' ability levels is not equal
(İlhan & Güler, 2017). According to RM, an individual with a higher ability than others is more likely
to correctly answer another item that measures the same structure. Similarly, a question that is easy
for any individual is likely to be answered correctly, and a difficult question is unlikely to be
answered (Bond & Fox, 2007). Accordingly, the mathematical expression describing the relationship
between the test items and the person is shown in Formula 1.
In the formula, (Bn) is a parameter that shows the person's ability. If a person with Bn ability answers a
test item with Di difficulty, it will simply either succeed or fail (Planinic, Boone, Susac & Ivanjek,
2019). Accordingly, the possibility of a person answering an item correctly (P) is related to the
person's ability (Bn) and the difficulty of the answered item (Di) (Boone & Scantlebury, 2006).
According to RM formula, the probability of a correct response is expressed as Bn-Di. If the person's
ability equals item difficulty (Bn=Di), then the probability of a correct response is 50%. If the
difference between person ability and item difficulty increases positively (Bn>Di), then the person has
a higher probability of a correct response to the question (Planinic, Ivanjek, & Susac, 2010; Xiao,
Han, Koenig, Xiong, & Bao, 2018).
Undoubtedly, in the analysis of a measurement tool with RM, associating the ability of the person
with each item (a) facilitates the development of tools that provide useful data, and (b) provides data
that can be safely used for both descriptive and parametric statistics (Boone & Noltemeyer, 2017).
Therefore, instead of evaluating the raw scores in the analysis of the questionnaires and tests
frequently used in education and social sciences, the analyses to be conducted with RM made it
possible to reach more objective measurement results that were stripped of many statistical limitations
(Boone & Noltemeyer, 2017; Gülkaya, 2018; Preece, 1979; Uzunsakal & Yıldız, 2018). This has
enabled RM to have a wide application area and accelerate studies, such as in the fields of health
studies, marketing, education, social sciences, and economics.
In studies on education, researchers have started to use RM widely recently (Baharun, Razi, Abidin,
Musa, & Mahmud, 2017; Boone & Noltemeyer, 2017; Çetin, 2019; İlhan & Güler, 2017; Maat, 2015;
Othman, Salleh, Hussein, & Wahid, 2014). In particular, RM is highly preferred in studies where
measurement tools are developed and analyzed in education (Boone & Scantlebury, 2006; Boone,
Townsend, & Staver, 2011; Planinic, Ivanjek, & Susac, 2010; Sondergeld & Johnson, 2014; Wei, Liu,
Wang, & Wang, 2012). Additionally, conceptual understanding levels can also be analyzed with RM
(Liu, 2010; Kauertz & Fischer, 2006; Mešić et al., 2019; Siang, 2011; Wei, Liu, & Jia, 2014).

IOJPE
ISSN: 1300 – 915X
www.iojpe.org
International Online Journal of Primary Education 2021, volume 10, issue 1
Copyright © International Online Journal of Primary Education 162
One of the integral parts and subjects of everyday life in the field of science is light. The light concept
is used as the primary tool in many fields from physics to biology, medicine to astronomy. Therefore,
students have difficulties in many scientific fields and subjects without understanding the light
concept and its properties (Djanette, Fouad, & Djamel, 2013). The studies related to the light concept
in the literature focuse on the framework of determining misconceptions (Aydoslu, 2018; Blizak,
Chafiqi, & Kendil, 2009; Epik et al., 2002; Fariyani, Rusilowati, & Sugianto, 2017; Galili & Hazan,
2000; Kaplan, 2017; Taşlıdere & Eryılmaz, 2015; Wahyuningsih, Rusilowati, & Hindarto, 2017),
determining the conceptual understanding levels within the framework of CTT (Andersson & Bach,
2005; Ayvacı & Candaş, 2018; Demirci & Ahçı, 2016; Kara, Avcı, & Çekbaş, 2008; Şahin, İpek, &
Ayas, 2008), mental models (Uzun & Karaman, 2016), cognitive structure (Apaydın, Akman, Taş, &
Peker, 2014; Özcan & Tavukçuoğlu, 2018), and teaching methods and techniques (Altun, 2006;
Benek & Kocakaya, 2012; Mazlum & Yiğit, 2017; Şenel, 2016). On the other hand, RM-based studies
on light are limited (Aminudin, Kaniawati, Suhendi, Samsudin, Coştu, & Adimayuda, 2019).
However, the literature has signed that there are not any studies focused on developing a measurement
tool on light and analyzing the conceptual level of understanding with RM.
The starting point of this study is the idea that RM provides statistically more reliable evaluation
results. The model explains how a person's performance for a particular feature can predict a person's
response (eg, true or false) in a particular test item containing that feature (Boone, 2016; Boone &
Scantlebury, 2006). These features that are taken into consideration, such as scientific learning,
scientific inquiry, or attitude toward science, are defined as "latent/implicit features" (Boone &
Scantlebury, 2006; Planinic, Boone, Susac, & Ivanjek, 2019; Xiao et al., 2018). The latent feature
used in the assessment of competencies often constitutes a skill. In this study, the latent feature is the
conceptual understanding ability about light subject. On the other hand, the quality, reliability, and
validity of the test tool used are closely related to the determination of the conceptual understanding
level. In this context, the study searches for answers to the questions below.
Research Questions
1- Is the conceptual understanding test developed on the Light unit a valid and reliable measurement
tool according to RM?
2- Can RM adequately explain students' conceptual understanding levels on the concept of light?
3- According to RM, what level are the students' conceptual understanding level on the concept of
light?
METHOD
Research Model
We analyze LCUT according to the “partial credit or point model” of RM. The model proposed by
Masters in 1982 is a suitable model for polytomous items that require multiple stages and are given
partial points if different stages are completed during the analysis process (Kaskatı, 2011; Yüksel,
2012). In the Partial Credit Model (PCM), each item has its own ordered scale structure (Gülkaya,
2018). In this model, instead of a binary result as yes/no for items, partial scores can be obtained by
considering the answers given when reaching the result (Uzunsakal & Yıldız, 2018). It is useful in
situations where students do not mark only as true or false; thus, student competencies can be
determined in more detail. So, in the study, we determine the competencies of students on the concept
of light from a basic level to a detailed level using PCM.
Participants
The participants were 355 students randomly selected, consisting of 164 girls (46.2%) and 191 boys
(53.8%) in the fifth-grade of a state primary school in İzmir city centre. In the study, we chose the
sample to represent the general population by using random sampling method from students with
similar socio-economic characteristics. The most important feature of this sampling method is that all
units in the general population have an equal and independent chance to be selected for the sample
(Büyüköztürk, Çakmak, Akgün, Karadeniz, & Demirel, 2014).

IOJPE
ISSN: 1300 – 915X
www.iojpe.org
International Online Journal of Primary Education 2021, volume 10, issue 1
Copyright © International Online Journal of Primary Education 163
Development of Data Collection Tool
In the study, we developed the Four-tier Light Conceptual Understanding Test (LCUT) and analyze it
with RM. We used a 4D model (Defining, Designing, Developing, Disseminating), which helps the
researcher to design a product that will help the student develop their skills in the learning process
(Irawan, Nyoman Padmadewi, & Artini, 2018), in the development of LCUT. In the ‘defining’ stage,
we conducted a literature review on the subject of light and four-tier tests. During the ‘designing’
stage, we examined the structure of the four-tier test. The first tier of the four-tier test is the multiple
choice question tier; the third tier is the reasoning tier for the response to the first tier. The second and
the fourth tiers are the confidence tiers. There are six options which are rated between “1” and “6” in
the confidence tier, respectively: “Just guess”, “I'm not too sure”, “I'm not sure”, “I’m sure”, “I'm
pretty sure”, and “I'm absolutely sure.” The design of the four-tier test is shown in Figure 1.
Figure 1. The design of Four-tier test
In the ‘developing’ stage, we considered studies on the literature about conceptual understanding
levels and misconceptions on the subject of light, achievements regarding the subject of light in the
curriculum of the science course, textbook, achievement tests, the suggestions of the course teachers
and experts, and the opinions of the students and the answers given in the open-ended exams. In this
stage, we developed LCUT consisting of fourteen questions and then we examined these items by the
opinions of a faculty member, a field expert, and two science teachers. Considering experts'
evaluations, we took into two questions determined to have the same content into the same question
root, and canceled one question. A Turkish teacher and 20 students in higher education examined
LCUT, which consisted of twelve questions, in terms of reading and understanding. In accordance
with the feedback of languege expert, we eliminated the deficiencies in the form of spelling errors and
we developed the final measurement tool. We applied LCUT to 355 fifth-grade students in
approximately one class hour. Sample questions related to the questions in LCUT are presented in
Figure 2. The distribution of the questions in LCUT according to the achievements of the science
education program (MNE, 2018) is given in Table 1.

IOJPE
ISSN: 1300 – 915X
www.iojpe.org
International Online Journal of Primary Education 2021, volume 10, issue 1
Copyright © International Online Journal of Primary Education 164
Table 1. Achievement distribution of questions
UNIT SUBJECT ACHIEVEMENT QUESTION
SP
RE
AD
ING
TH
E L
IGH
T Spreading the light
1-Observing that the light coming from a source follows a linear path
in all directions, it shows with drawing.
Q1, Q10
Reflaction of light
1-Observes the reflactions of light on smooth and rough surfaces and
shows them by drawing.
Q4, Q6
2-Explains the relationship between the incoming beam, reflected
beam and the normal of surface.
Q2, Q3
Encounter of light
with a substance
1-Categorizes the substances according to their light transmittance
status.
Q7, Q8
Full shadow
1-Observes how the full shadow is formed and shows it with simple
beam drawings.
Q11, Q12
2-Discovers the variables that affect the full shadow with experiments. Q5, Q9, Q12
Figure 2. LCUT sample questios
Analysis of Data
Scoring Categories for LCUT
Due to the four-tier test, we gathered the answer combinations for the responses given to the tiers in
each test item under six categories as Scientific Knowledge, Misconception, Lucky Guess, False
Positive, False Negative, and Lack of Knowledge (See Table 2).
Table 2. Scoring Categories for LCUT
Although six scoring categories are used for four-tier tests, in the study, we determined the conceptual
understanding levels of students based on a Rasch analysis, and therefore, we arranged the 3 different
CATEGORY SK LG FP FN MC LK
1.TIER T T T T T F F T T T F F F F F F
2.TIER S S NS NS S S S S NS NS S S NS NS NS NS
3.TIER T T T T F T F F F F T F T T F F
4.TIER S NS S NS S S S NS S NS NS NS S NS S NS
SK: Scientific Knowledge, LG: Lucky Guess, FP: False Positive, FN: False Negative, MC: Misconception,
LK: Lack of Knowledge, T: True, F: False, S: Sure (Confident Level>3,5), NS: Not Sure: (Confident Level<3,5)

IOJPE
ISSN: 1300 – 915X
www.iojpe.org
International Online Journal of Primary Education 2021, volume 10, issue 1
Copyright © International Online Journal of Primary Education 165
scoring categories for the correct answers given at each tier for RM: Conceptual Understanding,
Misconception, and Confidence Level (See Table 3).
Table 3. Scoring categories for Rasch analysis
CATEGORY TIER SCORE EXPLANATION
CO
NC
EP
TU
AL
UN
DE
RS
TA
ND
ING
1.Tier 1 If the student responds correctly to 1. Tier (Question Tier)
0 If the student responds incorrectly to 1.Tier
3.Tier 1 If the student responds correctly to 3. Tier (Reasoning Tier)
0 If the student responds incorrectly to 3.Tier
1. and 3. Tier 1 If the student responds correctly to 1.and 3. Tier
0 In all other alternatives
All Tiers 1 When the student responds correctly to 1. and 3.Tier with confidence
0 In all other alternatives
MIS
CO
NC
EP
TIO
N
1.Tier 1 If the student responds incorrectly (accompanied by misconception) to 1. Tier
0 If the student responds correctly to 1.Tier
3.Tier 1 If the student responds incorrectly (accompanied by misconception) to 3. Tier
0 If the student responds correctly to 3.Tier
1. and 3. Tier 1 If the student responds incorrectly to 1. and 3. Tier
0 In all other alternatives
All Tiers 1 If the student responds incorrectly to 1. and 3.Tier with confidence
0 In all other alternatives
CO
NF
IDE
NT
LE
VE
L
2.Tier 1 CL >3.5 (Sure)
0 CL < 3.5 (Not Sure)
4.Tier 1 CL >3.5 (Sure)
0 CL < 3.5 (Not Sure)
2. and 4. Tier 1 CL >3.5 (Sure) for 2, and 4. Tier
0 In all other alternatives
CL: Confident Level, The threshold value was considered as 3,5 to determine CL
Table 3 shows that since a certain score is taken based on the responses given in each tier of each test
item, PCM was used in the analyses to be conducted. Within the framework of PCM, partial scores
can be obtained based on the responses given for the tiers of each item of the four-tier test. Therefore,
we converted response alternatives related to the tiers in each test item specified in Table 2 were
converted into partial scoring in line with the scoring categories in Table 3.
Table 4. PCM scoring key
CATEGORY SCORES
Conceptual Understanding Misconception Confident Level
SK 4 0
LG 3 0
FP 1 1
FN 1 1
LK (Alternatives with correct answers) 1 1
LK (Alternatives with wrong answers) 0 3
MC 0 4
S 3
PS 1
NS 0
SK: Scientific Knowledge, LG: Lucky Guess, FP: False Positive, FN: False Negative, MC: A Misconception,
LK: Lack of Knowledge, S: Sure (Confident Level [CL]>3.5 for 2-4.tiers), NS: Not Sure: (CL<3.5 for 2-4 tiers),
PS: Partial Sure (CL>3.5 for 2.tier, CL<3.5 for 4.tier or vice versa)

IOJPE
ISSN: 1300 – 915X
www.iojpe.org
International Online Journal of Primary Education 2021, volume 10, issue 1
Copyright © International Online Journal of Primary Education 166
As a result, the scoring key (0-1-3-4) for conceptual understanding, misconception, and confidence
level was created for the four-tiers (See Table 4).
Rasch Model Analysis Findings
We analysed by the data through WINSTEPS software to answer research questions. In the first part,
we tested LCUT's reliability and its validity. In the second part, we examined students' responses on
LCUT in the scope of conceptual understanding, misconception, and trust level.
Findings on Validity and Reliability
In this part, we evaluated LCUT's reliability and its validity through WINSTEPS software. In Rasch
analysis, reliability is examined under two headings: person reliability and item reliability. Person
reliability refers to the consistency of student responses and item reliability refers to the quality of test
items. Accordingly, Table 5 shows the analysis results on person reliability for students and item
reliability for LCUT's items.
Table 5. Rasch analysis results about person and item for LCUT
PERSON Total
Score
Count Measure Model
S.E.
Infit
Mnsq
Infit
ZSTD
Outfit
Mnsq
Outfit
ZSTD
MEAN 28.8 12.0 52.48 2.23 1.01 .0 1.02 .1
P. SD 9.9 .0 4.41 .65 .38 1.0 .68 .8
S. SD 10.0 .0 4.42 .65 .38 1.0 .68 .8
MAX. 47.0 12.0 66.39 7.48 2.56 2.5 5.67 3.1
MIN. 8.0 12.0 43.06 1.90 .18 -2.9 .17 -1.9
REAL RMSE=2.51, TRUE SD=3.63, SEPARATION=1.45, Person RELIABILITY=.68, S.E.of Person Mean=.24
MODEL RMSE=2.53, TRUE SD=3.75, SEPARATION=1.61, Person RELIABILITY=.72
ITEM Total
Score
Count Measure Model
S.E.
Infit
Mnsq
Infit
ZSTD
Outfit
Mnsq
Outfit
ZSTD
MEAN 866.1 355.0 50.0 .41 .98 -0.1 1.02 .4
P. SD 264.3 .0 4.10 .08 .13 1.7 .26 1.7
S. SD 276.1 .0 4.28 .08 .13 1.7 .27 1.7
MAX. 1300.0 355.0 55.94 .60 1.19 2.7 1.39 2.9
MIN. 456.0 355.0 42.33 .36 .81 -3.1 .54 -1.9
REAL RMSE=.42, TRUE SD=4.08, SEPARATION=9.62, Item RELIABILITY=.99, S.E. of Item Mean = 1.24
MODEL RMSE=.42, TRUE SD=4.08, SEPARATION=9.80, Item RELIABILITY=.99
The results in Table 5 show that while the person reliability for LCUT is in the range of .68-.72, the
Cronbach alpha value is .76 and the item reliability for LCUT is .99. In this case, are the results
reliable or not? To decide to this, the ideal value of person reliability should be greater than .80 (Bond
& Fox, 2007; Linacre, 2014), however, the values greater than .60 can be accepted as reliable,
repeatable, and valid for measurement (Zain, Mohd, & El-Qawasmeh, 2011), and even values greater
than .67 can be considered reasonable (Fisher (2007). Moreover, person reliability is also equivalent
to Cronbach alpha (KR-20), which is CTT reliability (Linacre, 2014). For a measurement tool to be
considered reliable, the Cronbach alpha coefficient must be greater than .70 (Büyüköztürk et al.,
2014). In additon, item reliability, the acceptable value should be greater than .80, and values in the
range of .67-.80 may be reasonable (Fisher, 2007; Linacre, 2014). Overall, the results in Table 5 show
that the person, Cronbach's alpha and item reliability coefficients for the measurement reliability of
LCUT can be accepted within the range of the reliability criteria.
A Rasch analysis allows person and item separation coefficients to evaluate internal consistency of a
test. The person separation coefficient refers to the range of measured ability scores, and the item
separation coefficient refers to the spread of item difficulty levels. Separation coefficient values are
between 0 and infinite, and higher values indicate better separation (Boone & Noltemeyer, 2017).
Linacre (2019) states that the item separation coefficient should be 3 or above. In terms of person
separation coefficient, 1.50 is weak, but acceptable, 2.00 is good, and 3.00 is considered excellent
(Duncan et al., 2003; Fisher, 2007; Linacre, 2019). Therefore, Table 5 shows that both the person
(1.61) and item (9.80) separation coefficients of RM are appropriate and acceptable for the test's
internal consistency.

IOJPE
ISSN: 1300 – 915X
www.iojpe.org
International Online Journal of Primary Education 2021, volume 10, issue 1
Copyright © International Online Journal of Primary Education 167
The determining that the scores of a measurement tool are meaningful, useful, and purposeful by
analyzing the construct validity results in RM is likely. The point measurement correlation (Ptmea
Corr), infit mnsq and outfit mnsq statistics in the analysis of RM can determine the construct validity
of a test. Table 6 shows that the results of the Ptmea-Corr analysis on each item in LCUT.
Table 6. Item analysis results based on RM for LCUT’s construct validity
ITEM TOTAL
SCORE
TOTAL
COUNT
MEASURE MODEL
S.E
INFIT OUTFIT PTMEA-AL EXACT
MATCH
MNSQ ZSTD MNSQ ZSTD Corr. Exp. OB% EXP%
S1 1300 355 42.33 .60 .82 -1.2 .54 -1.9 .36 .27 76.6 73.2
S2 664 355 53.00 .36 1.06 .9 1.09 .9 .52 .55 23.4 23.7
S3 1068 355 47.48 .40 .87 -1.8 .83 -1.1 .49 .43 42.2 37.4
S4 1006 355 48.43 .38 .81 -3.1 .76 -1.9 .53 .46 40.8 33.8
S5 456 355 55.94 .39 1.11 1.5 1.39 2.8 .50 .57 24.3 32.1
S6 1269 355 43.35 .54 .82 -1.5 .69 -1.3 .39 .30 70.5 65.0
S7 782 355 51.46 .36 1.15 2.3 1.16 1.6 .48 .53 21.7 21.1
S8 840 355 50.70 .36 1.02 .4 1.02 .2 .52 .51 19.9 20.6
S9 776 355 51.54 .36 1.02 .3 1.04 .4 .51 .53 22.3 20.6
S10 1058 355 47.64 .40 .95 -.6 1.36 2.2 .43 .44 36.1 35.1
S11 657 355 53.09 .36 .96 -.6 .98 -.1 .56 .55 21.7 23.7
S12 517 355 55.02 .38 1.19 2.7 1.36 2.9 .48 .56 18.5 27.2
Mean 866.1 355 50.00 .41 .98 -.1 1.02 .4 34.8 34.4
P.SD 264.3 4.10 .08 .13 1.7 .26 1.7 19.0 16.6
In Table 6, the Ptmea-Corr values are in the range of .36-.56 for LCUT's items. While Bond and Fox
(2007) stated that the correlation coefficient should have values greater than .30, Othman et al. (2014),
on the other hand, stated that values less than .35 mean weak and low correlation, values between .36-
.67 mean moderate and reasonable correlations, values between .68-1.00 represent strong and high
correlation values. The results in Table 6 explain that the Ptmea-Corr values have a moderate and
reasonable correlation in comparison with these threshold values (Bond & Fox, 2007). This means
that each test item can distinguish the ability of the participants.
Fit statistics in RM were also evaluated for determining the construct validity. Linacre (2002) states
that fit statistics values between .50-1.50 are suitable values for measurement. Considering these
statistics in Table 6, the values of infit mnsq statistics are in the range of .82-1.19 and outfit mnsq
statistics in the range of .54-1.39. In addition, the standardized z values (ZSTD) in Table 6 are
between -3.1/2.7 for infit, and are between -1.9/2.9 for outfit. ZSTD values should be between -
2.0/2.0, but ZSTD values that are not within the desired limits can be ignored if infit and outfit mnsq
statistical values have acceptable values (Bond & Fox, 2007; Linacre, 2014). Therefore, these results
indicate that all the items in LCUT are in harmony for the measurement in the range of Linecra's fit
statistics values.
RM is based on the unidimensionality of the test items. In other words, the test is expected to measure
a single structure. Linacre (2006) suggests to check the multidimensional of test. In this case,
Principal Compenent Analysis (PCA) should be performed to evaluate dimensionality. So, the data
obtained from the Winsteps software were applied PCA. Consequently, the raw variance explained by
measures for LCUT was 42.3% and, the eigenvalues of the unexplained variance in 1st, 2nd, 3rd, and
4th contrasts were 1.4, 1.3, 1.2, and 1.1, respectively. The results verify that data have a
unidimensionality within the criteria determined by Linacre (2006). Overall, we can suggest that the
conceptual understanding test (LCUT) developed on the concept of light is a valid and reliable
measurement tool according to RM.
Findings on Person-Item Wright Map
RM allows the comparison of difficulty levels of each test item with the person’s ability level in a
common metric unit of measurement. Therefore, the Winsteps software allowed the association of
item difficulty level with person ability levels by converting them into common measurement values.
Thus, a common measurement unit on the same linear scale called Person-Item Map (Wright Maps)

IOJPE
ISSN: 1300 – 915X
www.iojpe.org
International Online Journal of Primary Education 2021, volume 10, issue 1
Copyright © International Online Journal of Primary Education 168
can explain person ability and item difficulty measurements (Bond & Fox, 2007). Accordingly, the
person-item map in Figure 3 shows the distribution of test items and persons in a common
measurement metric. The person-item map is arranged in two vertical histograms. The right side is for
participating students, and the left side is for test items. Vertical movement on the person-item map
indicates that the ability of the participants ranked from highest to lowest in the right side, and test
items ranked from hardest to easiest in the left side. “M”, on the separation line in the middle of the
person-item map, means the average of item difficulty and person ability, “S” (Single) means one
standard deviation distance from the average, “T” (Twice) means two standard deviations from the
average.
Figure 3. Conceptual understanding person-item map
Figure 3 shows a great distribution of the test items according to difficulty level and the person ability
level. This distribution indicates that the item and person separation are high and test difficulty is
appropriate. On the other hand, since the Winsteps software determines a common measurement
value, it makes possible to compare the average values of person ability and item difficulty.

IOJPE
ISSN: 1300 – 915X
www.iojpe.org
International Online Journal of Primary Education 2021, volume 10, issue 1
Copyright © International Online Journal of Primary Education 169
Accordingly, the average measurement values in the distribution is 50 for item difficulty and is 52 for
person ability. Consequently, these values are quite close to each other. This indicates that the range
of test items is suitable for the group of participants, that is, test items are not too difficult or too easy
for students. According to the person-item map, the questions below the average item difficulty (S1-
S3-S4-S6-S10) are relatively easy questions, while the questions above the average item difficulty
(S2-S5-S7-S8-S9-S11-S12) are relatively difficult questions. On the basis of person's ability, we
determined that the questions equal to and above the average person ability were the items coded as
S2, S5, S9, S11, S12 (difficult for students), and also the most difficult questions were S5 and S12.
On the other hand, although items coded as S7 and S8 are above the average item difficulty, they
remain below the average person's ability. Accordingly, items coded as S1, S3, S4, S6, S7, S8 and
S10, which are below the average person ability, are easy questions for students. The questions coded
as S1 and S6, which all participants responded correctly, are below the lowest person ability.
Undoubtedly, this assessment is likely to conduct in the context of average person ability and item
difficulty measurement for each person. Therefore, these findings of Rasch analysis indicate that RM
allows to determine the conceptual understanding level regarding the subject of light.
Findings on Students' Conceptual Understanding Levels
The person-item maps can help to identify students with the highest ability and lowest ability. For
example, Figure 3 shows that the ability level of many students is even above the item coded as S5,
which is determined to be the most difficult question. Therefore, the ability level of students who are
above the item coded as S5 in Figure 5 is above the difficulty level of all questions and is at a level
that can answer all questions correctly. Among the students who are above the item coded as S5, a
total of nine students coded as O42, O65, O72, O160, O196, O207, O248, O288, and O337, have the
highest conceptual understanding level. On the other hand, the student coded as O325, which is at the
bottom of the person-item map, has the lowest ability.
In Figure 3, the number of students at and above average person ability is 207. Accordingly, 58.3% of
the students (207/355*100=58.3) are at or above the level of average person ability. Considering this
result, the conceptual understanding level of students about the concept of light is at a medium level.
While the questions above the average person ability (S2-S5-S9-S11-S12) are relatively difficult for
students, the questions below the average person ability (S1-S3-S4-S6-S7-S8-S10) are easy questions.
In the evaluation of the achievement distribution of the questions, the students have low conceptual
understanding abilities in terms of full shadow (S5-S9-S11-S12) and reflaction laws (S2), while they
have high conceptual understanding abilities in light diffusion (S1-S10) and the reflaction of light
(S3-S4-S6). In addition, the conceptual understanding abilities in the subject of light with a substance
(S7-S8) are relatively moderate because the fact that question items coded as S7 and S8 are below the
average ability level.
RM also provides a comparison of students’ ability with other variables. Figure 4 shows that
comparison of students' ability levels with confidence levels. In the Figure 4, the dashed blue lines
show the relationship between the students, while the dashed red lines indicate the relationship
between the questions.
Figure 4 explains that 275 students (77.5%) answered all questions with a high level of confidence.
According to the conceptual understanding person-item map, 58.3% of the students were evaluated in
the scientific knowledge category by answering the questions correctly with a high level of
confidence. This means that there are students who think that the wrong answers are correct within the
group of students with a high level of 77.5% confidence. Students in this group are evaluated in the
category of misconception due to their wrong answers.
When Figure 4 was examined in the context of questions, items coded as S1 and S6 are at the lowest
difficulty level and were responded highly confidently by all students. In fact, there is a similar
situation in questions coded as S3, S4, and S10. Students responded to items coded as S3, S4, and

IOJPE
ISSN: 1300 – 915X
www.iojpe.org
International Online Journal of Primary Education 2021, volume 10, issue 1
Copyright © International Online Journal of Primary Education 170
S10, which were not difficulty to answer, with a high level of confidence. On the other hand, although
items coded as S5, S9, S11, and S12 were difficult questions, many students responded these items
with a high level of confidence. Responding by students with high confidence in difficult items as
well as in easy items indicates that the level of conceptual understanding in these questions is low, but
the possibility of misconceptions is high.
Figure 4. Comparison of conceptual understanding and confidence level person-item maps

IOJPE
ISSN: 1300 – 915X
www.iojpe.org
International Online Journal of Primary Education 2021, volume 10, issue 1
Copyright © International Online Journal of Primary Education 171
Figure 5. Comparison of Conceptual Understanding and Misconception Person-Item Maps

IOJPE
ISSN: 1300 – 915X
www.iojpe.org
International Online Journal of Primary Education 2021, volume 10, issue 1
Copyright © International Online Journal of Primary Education 172
As a result of the comparison of conceptual understanding and confidence level for person ability in
Figure 4, students coded as O42, O65, O72, O160, O196, O207, O248, O288, and O337 have the
highest person ability and confidence level. This high connection shows that students are at a high
cognitive level in terms of conceptual understanding, that scientific knowledge is fully and accurately
placed in their cognitive structures, and therefore they are very confident in their responses. On the
other hand, student coded as O325 has the lowest ability level and a medium level of confidence in
terms of conceptual understanding. This low connection indicates that student coded as O325 does not
reach correct answers in terms of conceptual understanding, but is confident in most of the answers to
the questions in the test.
As a result of the comparison of conceptual understanding and confidence level’s person item maps,
achieving the result that students are sure of their answers, even if they respond incorrectly, required a
comparison on the misconception person-item map in the continuation of this study.
Figure 5 provides a comparison of the conceptual understanding person-item map and the
misconception person-item map. In the evaluation map of the conceptual understanding, the
questions that are difficult to answer by the students are at the left top of the map, the questions that
are easy to answer are at the left bottom. Moreover, in the misconception person-item map, the
questions that are answered incorrectly (the questions with the misconception) are below in right of
the map.
According to Figure 5, the question, which is the most difficult to answer and best determines the
misconception, is the test item coded as S5. In other words, the students answered the item coded as
S5 with the highest rate of misconception. Additionally, the questions that are difficult to answer
correctly and that best determine the misconception are the test items coded as S11 and S12 after the
question item coded as S5. On the other hand, the questions, which are the easiest questions under all
students' abilities and unable to detect the misconception, are the test items coded as S1 and S6. These
data coincide with the data obtained from the person-item map analysis.
In Figure 5, students coded as O42, O65, O72, O160, O196, O207, O248, O288, and O337 have high
ability in terms of conceptual understanding and have the lowest potential in terms of misconception.
Similarly, the findings show that student coded as O325 has the lowest conceptual understanding
ability and the highest potential misconceptions, and different student coded as O206 has the highest
misconception potential and the lowest conceptual understanding.
DISCUSSION and CONCLUSION
In this study, we preferred RM, which provides a detailed analysis of the data obtained from the
measurement tools and allows the researchers to convey the test-scale performance in the best way
(Boone & Noltemeyer, 2017). In this context, we developed a four-tier LCUT with RM and then
analyzed the data obtained from this scale. In the development process of LCUT, we provided
LCUT's validity and reliability with RM.
In terms of validity, RM analysis provides appropriate data on the construct validity of the
measurement tool (Wei, Liu, Wang, & Wang, 2012). Accordingly, we evaluated infit and outfit mnsq
statistics to determine the construct validity. All these statistics were in the range of .54-1.39. These
results show that all the items in LCUT are in the appropriate range for measurement (Linacre, 2002),
and are in harmony. Additionally, we analyzed Ptmea Corr statistics for the consistency between the
scores of the students in the test items and their ability measurements. As a result of the analysis, we
determined that all items were in the desired range (in the range of .36-.56) and positive. According to
the infit and outfit mnsq statistics, all items fit RM very well. As a matter of fact, since Rasch
measurement is based on individual response models that reflect individuals' reasoning skills, good
model-good data compliance shows that students' reasoning about the measurement tool items is
consistent (Wei, Liu, Wang, & Wang, 2012).

IOJPE
ISSN: 1300 – 915X
www.iojpe.org
International Online Journal of Primary Education 2021, volume 10, issue 1
Copyright © International Online Journal of Primary Education 173
When the data fit RM, the test items measure the intended unidimensional structure (Wei, Liu, Wang,
& Wang, 2012). RM is a unidimensional measurement model (Eggert & Bögeholz, 2010; Linacre,
2006; Planinic, Ivanjek, & Susac, 2010); unidimensionality is the basic condition of construct validity
(Rasch, 1961). In this context, we conducted a unidimensional assessment with the PCA for
determining the construct validity of LCUT. Since the results obtained for the explained variance and
the unexplained variance are within the specified criteria, we determined that the data showed a
unidimensional feature.
To determine the measurement reliability of LCUT, we examined person and item reliability, and also
separation coefficient values. First, we determined that the person reliability was .68-.72. We
interpreted this reliability in the same way as traditional Cronbach Alpha (Linacre, 2014), and
concluded that it was reliable, repeatable, and reasonable value in the .67-.69 measurement range
(Fisher, 2007; Zain, Mohd ve El-Qawasmeh, 2011), and therefore the person reliability of IKAT was
satisfactory level. In fact, considering CTT perspective, this reliability value may indicate the
existence of a strong relationship between the observed person scores and the true scores without
errors (Cronbach alpha=.76). Second, we found that item reliability for the quality of test items was
.99. In the literature, values of .80 and above are accepted appropriate for item reliability (Fisher,
2007; Linacre, 2014), and therefore we decided that the item reliability of LCUT was appropriate
value. The separation coefficient is the spread estimate of items and ability, since they are expressing
statistically different levels of performance-difficulty. In the study, we observed that the separation
coefficient was 1.61 for the person and 9.80 for the item. In addition, according to Linacre’s (2016)
guidelines, it is possible to make an assessment by associating the reliability of the person with the
level of performance that the test can distinguish (separation unit 3-4 for .90, separation unit 2-3 for
.80 and separation unit 1-2 for .50). The person separation coefficient determined as 1.61 indicates
that people can be evaluated at two performance levels. Therefore, we can talk about the existence of
a match between the person reliability coefficient (.68-.72) and the determined performance levels.
Consequently, the fact that the person and item spread estimations specified as the separation
coefficient are within the specified criteria also contributes to the reliability of the measurement tool
(Duncan et al., 2003; Fisher, 2007; Linacre, 2019).
Rasch analysis has many advantages in determining students' competencies. The most important
advantages are the representation of the person and test items on the same equal linear scale (Bond &
Fox, 2007). In this way, RM enables the comparison of the ability level of the participants and
difficulty level of the test items by matching them to the determined theoretical latent feature with
positioning in a common metric (Clements, Sarama, & Liu, 2008). The common metric where the
ability level and test items are located is defined as the "Wright Map." In the conceptual
understanding person-item map, it was determined that 207 of 355 students were above the average
ability level, and that the conceptual understanding level was 58.3%. Therefore, on the map, we
observed that the ability level of more than half of the students is above the difficulty level of the
questions. Rasch analysis can help to determine the conceptual understanding level with item
difficulty level in its model (Wei, Liu & Jia, 2013). Considering this opinion, we found that the
students’ ability is above the average item difficulty level, that the majority of the students match the
items difficulty level very well. In other words, the vast majority of the students have the ability to
understand the latent feature to be measured (Baharun et al., 2017). On the other hand, it is possible
to find the study findings that the difficulty of the item is higher than the person's ability, and
therefore the participants have low conceptual understanding ability (Siang, 2011). In limited studies
conducted with Rasch analysis on the concept of light (Aminudin et al., 2019; Mesic et al., 2019),
results indicated that the average difficulty level was above the average ability, and the students were
at a low conceptual understanding level. Therefore, the study results that were based on the analysis
of the four-tier test with RM are important in terms of contributing to the limited study findings in the
literature.

IOJPE
ISSN: 1300 – 915X
www.iojpe.org
International Online Journal of Primary Education 2021, volume 10, issue 1
Copyright © International Online Journal of Primary Education 174
The literature emphasizes the need to conduct a confidence level analysis to see to what extent
students believe in their abilities (Aminudin et al., 2019). In the confidence level analysis of the study,
students answered the questions with a 77.5% confidence level throughout the test. In this context, the
study results indicate that students' confidence levels in their answers were quite high. On the other
hand, the clear difference between the proportion of students who are evaluated at the scientific
knowledge level by responding correctly to all tiers (58.3%) and the confidence level in the test
(77.5%) indicates that some students are quite sure of these answers, even if they responded
incorrectly. This difference points out the existence of students who are evaluated in the
misconception category as well as highly skilled students among high-confidence students. In a
comparison of the conceptual understanding person-item map with the misconception person-item
map, we determined that the data on the maps confirm each other, and that there was a linear
relationship between the students' confidence level and their misconceptions. Indeed, Aminudin et al.
(2019) determined that high-ability students are at a low level of misconception and low ability
students at a high level of misconception as a result of their studies.
In the comparison of the conceptual understanding level and the difficulty levels of the items, we
determined that the students had difficulty in answering some questions of the test (S5-S12), so the
difficulty level of these questions was above the ability level of most students. On the other hand, all
students answered two questions (S1-S6) of the test, correctly. In other words, the ability level of all
students are above the difficulty level of these questions. As a matter of fact, according to the Rasch
analysis, the person is more likely to respond to a lower item on the scale and less likely to respond to
a higher item on the scale (Boone, 2016). On the other hand, it is possible to determine the students
with the lowest and highest conceptual understanding on person-item maps (Bond & Fox, 2007). In
this aspect, we determined that the student with the lowest ability in terms of conceptual
understanding was student coded as O325, and the students with the highest ability were students
coded as O42, O65, O72, O160, O196, O207, O248, O288, and O337. Wright maps allow item
difficulty and person ability to be compared (Liu, 2010). As a matter of fact, thanks to the person-item
maps showing the data of both participants and test items, the most difficult and easiest questions of
the test can be easily determined without the need for another calculation.
In the person-item map of the conceptual understanding, we determined that the seven questions that
were above the average item difficulty were the questions that the students had difficulty in
answering. We listed these questions in the turn of items coded as S5, S12, S2, S11, S9, S7, and S8
starting from the most difficult one. Items coded as S1, S3, S4, S6, and S10 that are below the average
item difficulty level, are the questions that the students have no difficulty in answering. Four
questions (S5-S9-S11-S12) in LCUT are to measure students' the conceptual understanding of full
shadows. These questions have difficult to answer, therefore, students' conceptual understanding is the
lowest level in this test items. As a matter of fact, studies on the concept of light indicate that students
have lacks of knowledge about shadow formation and shape (Blizak, Chafiqi & Kendil, 2009; Epik et
al., 2002; Galili & Hazan, 2000; Taşlıdere & Eryılmaz, 2015), and factors affecting the shadow
formation (Galili & Hazan, 2000), and a full shadow. On the other hand, the most basic concepts in
the light diffusion unit are the diffusion and reflaction of light. In this context, the light, which is an
integral part of our daily life, and connected concepts are fully and correctly must understand.
However, studies display that student’s experience mental confusion about light and have low levels
of conceptual understanding due to the missing experiences they have in daily life (Ayvacı & Candaş,
2018; Şahin, İpek & Ayas, 2008). In the results of Rasch analysis for LCUT, the ability level of
question items coded as S3 (about normal of the surface), S4 and S6 (about reflaction of light on
smooth and rough surfaces) are below the average difficulty level. Inadditon, the ability level of
question item coded as S2 (about the laws of reflaction) is above the average difficulty level and is
challenges for students. These results support the findings of the studies in the literature, which
students have a lack of knowledge about the reflaction of light and the laws of reflaction (Aydoslu,
2018, Fariyani, Rusilowati & Sugianto, 2017; Kaplan, 2017; Wahyuningsih, Rusilowati & Hindarto,
2017). For example, Fariyani, Rusilowati, & Sugianto (2017) and Wahyuningsih, Rusilowati, &

IOJPE
ISSN: 1300 – 915X
www.iojpe.org
International Online Journal of Primary Education 2021, volume 10, issue 1
Copyright © International Online Journal of Primary Education 175
Hindarto (2017) determined that students with a low level of conceptual understanding have
alternative concepts in terms of laws of reflaction, incoming beam, reflected beam, and normal of
surface.
If light encounters a substance, the substances are classified as transparent, translucent, and opaque
according to their light transmission. However, the results of study point out that student has lack
knowledge in the context of classification of substances to light transmittance. As a matter of fact, in
the results of Rasch Analysis, the items coded as S7 and S8 (about light transmission status) are the
questions on average item difficulty, but below the average person's ability. Accordingly, we conclude
that the students' conceptual understanding level for item coded as S7 and S8 is at a medium level.
This result of the study coincides with the studies in the literature and indicates that students have
difficulty in classifying substances according to light transmission (Kaplan, 2017). On the other hand,
the ability level of question items coded as S1 and S10 (about the diffisuon of light) indicates that
students are at a very high level of conceptual understanding.
RM is a theory-based approach to scale development through hypothesis testing (Clements, Sarama &
Liu, 2008). The construct validity of the measurement tool is ensured when the data fit RM. To
answer the first question of the study, we examined infit and outfit mnsq, point measurement
correlation, and reliability statistics. As a result, we observed that these statistical values were within
the desired limits. Accordingly, LCUT is a useful measurement tool with measurement reliability and
validity that allows measuring the level of conceptual understanding of light. In conclusion, we
determined that students' level of conceptual understanding toward the concept of light is above
medium level. Overall, the results on the conceptual understanding level by Rasch analysis for LCUT
are coherent with studies related to conceptual understanding on light in literature and so, will
contribute to the field with this aspect.
Possible Research Limitations
There are some potential limitations of the current study. First, RM was used instead of CTT in
determining the level of conceptual understanding, but only fifth-grade students and fith-grade Light
Unit were preferred for rasch analysis. The results indicate that the measurement tool developed for
determining the conceptual understanding level is a valid and reliable measurement tool according to
RM, and that the conceptual understanding level can be determined by RM. However, it would be
appropriate to compare the analyses with the Light unit and other units, and at other grade levels
regarding the effectiveness of RM. On the other hand, multi-tier tests in the literature mostly diagnose
misconceptions and present them to the educator. However, in the study, we examined the test
parameters of RM on LCUT and so did not diagnose misconceptions. Therefore, the data of the study
were limited by the statistical parameters of RM, and RM was not used to determine misconceptions.
Suggestions for Future Research
In line with the findings and comments of the research, we suggested in the following:
Should be given priority to the use of the analyses that is free from the limitations of CTT,
conducted within the framework of LTT instead of the analyses based on CTT, as it gives
clearer results during the evaluation of the participants.
Increasing the use of Wright Maps in evaluations based on Rasch analysis will provide
satisfying results in terms of evaluation of tests.
Analysis results based on RM can be confirmed with exploratory and confirmatory factor
analyses in the future research.
The frequent use of multi-tier tests, such as four-tier tests, where the participants can be
assessed about how confident they are with their answers rather than multiple-choice tests,
will provide more accurate and reliable results in the diagnosis of conceptual understanding
and misconceptions.

IOJPE
ISSN: 1300 – 915X
www.iojpe.org
International Online Journal of Primary Education 2021, volume 10, issue 1
Copyright © International Online Journal of Primary Education 176
It will be beneficial to employ various methods and techniques in order to make the
knowledge gained by students' daily life activities permanent in subjects such as light, which
is an integral part of daily life.
Since the data obtained from multi-tier tests are used in the diagnosis of misconceptions, it
will be appropriate to conduct the analyses based on RM regarding possible misconceptions.
Disclosure Statement
No potential conflict of interest was reported by the authors.
Data Availability Statement
The data that support the findings of this study are available from the corresponding author, upon
reasonable request.
REFERENCES
Akın, Ö. & Baştürk, R. (2012). The evaluation of the basic skills in violin training by many facet rasch model. Pamukkale
University Journal of Education, 31(31), 175-187.
Altun, D. G. (2006). Effect of sound and light unit prepared using multiple intelligence theory to the student success, level of
retaining, attitudes towards science and multiple intelligence theory. (Unpublished master’s thesis). Institute of
Science, Gazi University, Ankara, Turkey
Aminudin, A. H., Kaniawati, I., Suhendi, E., Samsudin, A., Coştu, B., & Adimayuda, R. (2019). Rasch analysis of multitier
open-ended light-wave ınstrument (MOLWI): Developing and assessing second-years sundanese-scholars alternative
conceptions. Journal for the Education of Gifted Young Scientists, 7(3), 557-579. doi:10.17478/jegys.574524
Andersson, B., & Bach F. (2005). On designing and evaluating teaching sequences taking geometrical optics as an example.
Science Education, 89, 196-218. doi:10.1002/sce.20044
Anshel, M. H., Weatherby, N. L., Kang, M., & Watson, T. (2009). Rasch calibration of a unidimensional perfectionism
inventory for sport. Psychology of Sport and Exercise, 10(1), 210-216. doi:10.1016/j.psychsport.2008.07.006
Apaydın, Z., Akman, E., Taş, E., & Peker, E. A. (2014). Analysis of knowledge structures about light concept of first level
elementary students according to conceptual change theories. Journal of Computer and Education Research, 2(3),
44-68. Retrieved from https://dergipark.org.tr/tr/pub/jcer/issue/18615/196501
Aydoslu, M. (2018). Determination of cognitive structures and misconceptions of middle school students about the concepts
of light and reflection by using alternative measurement and evaluation techniques. (Unpublished master’s thesis).
Institute of Science, Kırıkkale University, Kırıkkale, Turkey
Ayvacı, H. S., & Candas, B. (2018). Students’ understandings on light reflection from different educational level. Journal of
Computer and Education Research, 6(11), 1-32. doi:10.18009/jcer.309748
Baharun, N., Razi, N. F. M., Abidin, R. Z., Musa, N. A. C., & Mahmud, Z. (2017). Measuring students’ understanding in
counting rules and its probability via e-learning mode: a Rasch measurement approach. Journal of Fundamental and
Applied Sciences, 9(6S), 429-441. doi:10.4314/jfas.v9i6s.33
Benek, İ., & Kocakaya, S. (2012). Students’ opinion on learning in stations technique. Journal of Research in Education
and Teaching, 1(3), 2146-9199. Retrieved from http://www.jret.org/FileUpload/ks281142/File/02z.benek.pdf
Blizak, D., Chafiqi, F., & Kendil, D. (2009). Students misconceptions about light in Algeria. In Education and Training in
Optics and Photonics (p. EMA5). Optical Society of America. doi:10.1364/etop.2009.ema5
Bond, T. G & Fox, C. M. (2007). Applying the Rasch model: Fundamental measurement in the human sciences (2nd ed.).
New Jersey: Lawrence Erlbaum Inc. Publishers
Boone, W. J. (2016). Rasch analysis for instrument development: why, when, and how?. CBE-Life Sciences
Education, 15(4), rm4.1-7. doi:10.1187/cbe.16-04-0148
Boone, W. J., & Noltemeyer, A. (2017). Rasch analysis: A primer for school psychology researchers and
practitioners. Cogent Education, 4(1), 1416898. doi:10.1080/2331186x.2017.1416898
Boone, W. J., & Scantlebury, K. (2006). The role of Rasch analysis when conducting science education research, utilizing
multiple choice tests. Science Education, 90(2), 253-269. doi:10.1002/sce.20106

IOJPE
ISSN: 1300 – 915X
www.iojpe.org
International Online Journal of Primary Education 2021, volume 10, issue 1
Copyright © International Online Journal of Primary Education 177
Boone, W. J., Townsend, J. S., & Staver, J. (2011). Using Rasch theory to guide the practice of survey development and
survey data analysis in science education and to inform science reform efforts: An exemplar utilizing STEBI self
efficacy data. Science Education, 95(2), 258-280. doi:10.1002/sce.20413
Bulut, G. (2018). Açık ve uzaktan öğrenmede şans başarısı: Klasik test kuramı (KTK) ve madde tepki kurama (MTK)
temelinde karşılaştırmalı bir analiz. Açıköğretim Uygulamaları ve Araştırmaları Dergisi, 4(1), 78-93. Retrieved from
https://dergipark.org.tr/tr/pub/auad/issue/35189/390471
Büyüköztürk, Ş., Çakmak, E. K., Akgün, Ö. E., Karadeniz, Ş., & Demirel, F. (2014). Scientific research methods. Ankara:
Pegem Publications.
Clements, D. H., Sarama, J. H., & Liu, X. H. (2008). Development of a measure of early mathematics achievement using the
Rasch model: The research based early maths assessment. Educational Psychology, 28(4), 457-482.
doi:10.1080/01443410701777272
Çetin, Ş. (2019, November). Analysis of open-ended questions with many facet Rasch model. In 4th International
Symposium on Innovative Approaches in Health and Sports Sciences. Samsun, Turkey
Demirci, N., & Ahçı, M. (2016). University students’ conceptual understanding on the subjects of light and optics. Necatibey
Faculty of Education Electronic Journal of Science and Mathematics Education 10(1), 142-181.
doi:10.17522/nefefmed.39726
Demirtaşlı, N. Ç. (1996). New approaches in test development: The latent trait theory-basic features, assumptions, models
and limitations. Ankara University Journal of Faculty of Educational Sciences, 28(2), 161-173.
doi:10.1501/Egifak_0000000298
Djanette, B., Fouad, C., & Djamel, K. (2013). What thinks the university's students about propagation of light in the
vacuum? European Scientific Journal, 9(24), 197-213.
Doğan, N. & Tezbaşaran, A. (2003). Klasik test kuramı ve örtük özellikler kuramının örneklemler bağlamında
karşılaştırılması [Comparison of classical test theory and latent traits theory by Samples]. Hacettepe University
Journal of Ecucation, 25(25), 58-67.
Doğru, Ş. C. (2019). The comparison of classical test theory and Rasch model in determining the psychometric properties of
mixed tests. (Unpublished master’s thesis). Institute of Science, Hacettepe University, Ankara, Turkey
Duncan, P. W., Bode, R. K., Lai, S. M., Perera, S., & Glycine Antagonist in Neuroprotection Americas Investigators (2003).
Rasch analysis of a new stroke-specific outcome scale: the stroke impact scale. Archives of Physical Medicine and
Rehabilitation, 84(7), 950-963. doi:10.1016/s0003-9993(03)00035-2
Eggert, S., & Bögeholz, S. (2010). Students' use of decision making strategies with regard to socioscientific issues: An
application of the Rasch partial credit model. Science Education, 94(2), 230-258. doi:10.1002/sce.20358
Epik, Ö., Kalem, R., Kavcar, N., & Çallıca, H. (2002). Investigation of student views on the concepts of light, image
formation and image observation. Buca Faculty of Education Journal, 14, 64-73
Fariyani, Q., Rusilowati, A., & Sugianto, S. (2017). Four-tier diagnostic test to identify misconceptions in geometrical
optics. Unnes Science Education Journal, 6(3), 1724-1729. doi:10.15294/USEJ.V6I3.20396
Fisher, W.P. Jr (2007). Rasch measurement transaction. Rasch Measurement Transactions 21(1), 1087-1096
Galili, I., & Hazan, A. (2000). Learners' knowledge in optics: interpretation, structure and analysis. International Journal of
Science Education, 22(1), 57-88. doi:10.1080/095006900290000
Gülkaya, D. (2018). Rasch analysis and its application. (Unpublished master’s thesis). Institute of Science, Süleyman
Demirel University, Isparta, Turkey
Hambleton, R. K., & Jones, R. W. (1993). An NCME instructional module on: Comparison of classical test theory and item
response theory and their applications to test development. Educational Measurement: Issues and Practice, 12(3),
38-47. doi:10.1111/j.1745-3992.1993.tb00543.x
Irawan, A. G., Nyoman Padmadewi, N., & Artini, L. P. (2018). Instructional materials development through 4D model.
In SHS Web of Conferences, 42. doi:10.1051/shsconf/20184200086
İlhan, M., & Güler, N. (2017). Testing the agreement between ability estimations made through classical test theory and the
ones made through Rasch analysis in likert type scales. Ege Journal of Education, 18(1), 244-265.
doi:10.12984/egeefd.289576
Kan, A. (2006). An empirical study on the comparison of predicted item parameters with respect to classical and item
response test theories. Mersin University Journal of the Faculty of Education, 2(2), 227-235. Retrieved from
https://dergipark.org.tr/tr/pub/mersinefd/issue/17389/181743

IOJPE
ISSN: 1300 – 915X
www.iojpe.org
International Online Journal of Primary Education 2021, volume 10, issue 1
Copyright © International Online Journal of Primary Education 178
Kaplan, E. (2017). Determination of sixth grade students misconceptions on, the light and sound unit with concept test,
concept cartoons, and semi-structured interviews. (Unpublished master’s thesis). Graduate School of Educational
Sciences, Erciyes University, Kayseri, Turkey
Kara, İ. Avcı, D., & Çekbaş, Y. (2008). Investigation of the science teacher candidates’ knowledge level about the concept
of light. Mehmet Akif Ersoy University Journal of Education Faculty, 8 (16), 46-57
Kaskatı, O. (2011). Development of computer adaptive testing method using with Rasch models for assessment of disability
in rheumatoid arthritis patients. (Unpublished doctorate thesis). Institute of Health Science, Ankara University,
Ankara, Turkey
Kauertz, A., & Fischer, H. E. (2006). Assessing students’ level of knowledge and analysing the reasons for learning
difficulties in physics by Rasch analysis. In X.Liu &W.J.Boone (Eds.) Applications of Rasch measurement in science
education, (pp. 212-246). Maple Grove.MN: Jam Press
Keeves, J. P. (1998). Educational research, methodology and measurement: An international Handbook. Oxford: Pergamon
Pres
Kelecioğlu, H. (2001). Relationship between b and a parameters in latent trait theory and p and r statistics in classical test
theory. Hacettepe University Journal of Education, 20, 104-110
Linacre, J.M. (2002). What do infit and outfit, mean-square and standardized mean? Rasch Measurement Transactions,
16(2), 878. Retrieved from https://www.rasch.org/rmt/rmt162f.htm
Linacre, J. M. (2006). Data variance explained by Rasch measures Rasch Measurement Transactions, 20(1), 1045. Retrieved
from https://www.rasch.org/rmt/rmt201a.htm
Linacre, J. M. (2014). Reliability and separation of measures. A user’s guide to Winsteps Ministep Rasch-model computer
programs (version 3.81.0). Retrieved from http://www.winsteps.com/winman/reliability.htm
Linacre, J. M. (2019). A user guide to winsteps ministep Rasch model computer programs: Program manual 4.4.7. Retrieved
from https://www.winsteps.com/a/Winsteps-Manual.pdf
Liu, X. (2010). Using and developing measurement instruments in science education: A Rasch modeling approach. IAP
Information Age Publishing
Maat, S. M. (2015). Psychometric evaluation on mathematics beliefs instrument using Rasch model. Creative
Education, 6(16), 1797-1801. doi:10.4236/ce.2015.616183
Mazlum, E. & Yiğit, N. (2017). Examining indicators of knowledge of light concept through peer tutoring applications.
Hacettepe University Journal of Education, 32(2), 295-311. doi:10.16986/HUJE.2016019933
Mešić, V., Neumann, K., Aviani, I., Hasović, E., Boone, W. J., Erceg, N., Grubelnik, V., Sušac, A., Glamočić, D.S., Karuza,
M., Vidak, A., Alihodžić, A., & Repnik, R. (2019). Measuring students’ conceptual understanding of wave optics: A
Rasch modeling approach. Physical Review Physics Education Research, 15(1), 010115(20).
doi:10.1103/physrevphyseducres.15.010115
Ministry of Education (MNE) (2018). Primary education institutions (primary and secondary schools) science course
(3,4,5,6,7,8. Grades) curriculum. Ankara: Ministry of Education, Board of Education and Discipline
Othman, N. B., Salleh, S. M., Hussein, H., & Wahid, H. B. A. (2014). Assessing construct validity and reliability of
competitiveness scale using Rasch model approach. In Proceedings of the 2014 WEI International Academic
Conference (pp. 113-120)
Özcan, Ö., & Tavukçuoğlu, E. (2018). Investigating the high school students’ cognitive structures about the light concept
through word association test. Journal of Education and Future, (13), 121-132. doi:10.1063/1.5025996
Planinic, M., Ivanjek, L., & Susac, A. (2010). Rasch model based analysis of the force concept inventory. Physical Review
Special Topics-Physics Education Research, 6(1), 010103(20). doi:10.1103/physrevstper.6.010103
Planinic, M., Boone, W. J., Susac, A., & Ivanjek, L. (2019). Rasch analysis in physics education research: Why
measurement matters. Physical Review Physics Education Research, 15(2), 1-14.
doi:10.1103/physrevphyseducres.15.020111
Preece, P. F. W. (1979). Objective measurement in education: The Rasch model. School Science Review, 60(213), 770-73.
ERIC ID. EJ207029
Rasch, G. (1961, July). On general laws and the meaning of measurement in psychology. In Proceedings of the fourth
Berkeley symposium on mathematical statistics and probability. Berkeley, USA.

IOJPE
ISSN: 1300 – 915X
www.iojpe.org
International Online Journal of Primary Education 2021, volume 10, issue 1
Copyright © International Online Journal of Primary Education 179
Siang, L. K. (2011). Developing a profile of conceptual understanding and misconceptions in Newtonian mechanics: Rasch
modelling approach. In International Conference on Measurement and Evaluation in Education, University of
Malaya. Kuala Lumpur, Malaysia.
Sondergeld, T. A., & Johnson, C. C. (2014). Using Rasch measurement for the development and use of affective assessments
in science education research. Science Education, 98(4), 581-613. doi:10.1002/sce.21118
Şahin, Ç., İpek, H., & Ayas, A. (2008, June). Students' understanding of light concepts primary school: A cross-age study.
Asia-Pacific Forum on Science learning and teaching, 9(1), 1-119. Retrieved from https://www.eduhk.hk/apfslt/
Şenel, S.Ö. (2016). Activities based on multiple intelligence theory related on learning and effects about the 7th grade
subject light. (Unpublished master’s thesis). Gazi University, Ankara, Turkey
Taşlıdere, E. & Eryılmaz, A. (2015). Assessment of pre-service teachers’ misconceptions in geometrical optics via a three-
tier misconception test. Bartın University Journal of Faculty of Education, 4 (1), 269-289.
doi:10.14686/buefad.2015111057
Uzun, E. & Karaman İ. (2015). An analysis of prospective science teachers’ mental models about light and sound. Ekev
Akademi Dergisi. 20(65), 141-154. doi:10.17753/Ekev549
Uzunsakal, E. & Yıldız, D. (2018). A comparison of reliability tests in field researches and an applicatıon on agricultural
data. Applied Social Sciences Journal of Istanbul University-Cerrahpasa, 2(1), 14-28. Retrieved from
https://dergipark.org.tr/en/pub/iuusbd/issue/38311/399621
Xiao, Y., Han, J., Koenig, K., Xiong, J., & Bao, L. (2018). Multilevel Rasch modeling of two-tier multiple choice test: A
case study using Lawson’s classroom test of scientific reasoning. Physical Review Physics Education
Research, 14(2), 020104(14). doi:10.1103/physrevphyseducres.14.020104
Wahyuningsih, S., Rusilowati, A., & Hindarto, N. (2017). Analysis of misconception to science literacy using three tier
multiple choice test in the materials of characteristic of light. Unnes Science Education Journal, 6(3), 1736-1743.
doi:10.15294/USEJ.V6I3.20426
Wei, S., Liu, X., & Jia, Y. (2014). Using Rasch measurement to validate the instrument of students’ understanding of models
in science (sums). International Journal of Science and Mathematics Education, 12(5), 1067-1082.
doi:10.1007/s10763-013-9459-z
Wei, S., Liu, X., Wang, Z., & Wang, X. (2012). Using Rasch measurement to develop a computer modeling-based
instrument to assess students’ conceptual understanding of matter. Journal of Chemical Education, 89(3), 335-345.
doi:10.1021/ed100852t
Yüksel, S. (2012). Analyzing differential item functioning by mixed rasch models which stated in scales. (Unpublished
doctorate thesis). Institute of Health Education, Ankara University, Ankara, Turkey
Zain, J. M., Mohd, W. M. W., & El-Qawasmeh, E. (Eds.). (2011). Software engineering and computer systems. In
Proceedings of Second International Conference, ICSECS 2011, Kuantan, Pahang, Malaysia

IOJPE
ISSN: 1300 – 915X
www.iojpe.org
International Online Journal of Primary Education 2021, volume 10, issue 1
Copyright © International Online Journal of Primary Education 180
CLASSROOM TEACHERS’ VIEWS ON THE PHYSICAL LEARNING
ENVIRONMENTS OF PRIMARY SCHOOLS IN TURKEY
Mehmet GÜLTEKİN
Prof.Dr., Anadolu University, Faculty of Education, Primary Education Department, Eskişehir, Turkey
ORCID: https://orcid.org/0000-0002-5281-1767
Gözde ÖZENÇ İRA
Res.Assist., Hacettepe University, Faculty of Education, Primary Education Department, Ankara, Turkey
ORCID: https://orcid.org/0000-0001-6046-0306
Received: September 02, 2020 Accepted: March 19, 2021 Published: June 30, 2021
Suggested Citation:
Gültekin, M., & Özenç Ira, G. (2021). Classroom teachers’ views on the physical learning environments of primary schools
in Turkey. International Online Journal of Primary Education (IOJPE), 10(1), 180-192.
This is an open access article under the CC BY 4.0 license
Abstract
School buildings with inadequate infrastructure and old-fashioned architectural styles cause problems, especially in
developing countries. This study aims to examine the views of primary school teachers on the physical learning environments
of primary schools. A case study method was adopted in this study. The participants of the study consisted of 14 classroom
teachers working in rural and urban areas. The synchronous online focus group interviews were conducted using Zoom, a
commercial web conference service, as a data collection method. A content analysis method was used in the analysis of the
data. The analyses of the semi-structured interviews with the classroom teachers produced four categories-i.e.,
planning-related shortcomings, infrastructure deficiency, child-friendly schools, and the advantages of these schools.
Responses of classroom teachers working in urban areas mostly focused on the crowding of schools. On the other hand, the
answers from the classroom teachers working in rural areas mostly focused on the physical infrastructure of primary schools.
Furthermore, suggestions from all participants pointed out that primary schools must have a more child-friendly
characteristic. The physical learning environments of primary schools require compliance with the needs of modern
pedagogy. In light of the findings, some suggestions were have been made for primary schools in Turkey.
Keywords: The physical learning environment, primary school, school buildings.
INTRODUCTION
The term “learning environment” refers to visual, auditory, and kinesthetic factors enhancing the
physical aspects of human comprehension (Kopec, 2006). The learning environment influences human
behavior and has both direct and indirect impacts on learning and teaching performance
(Higgins, Hall, Wall, Woolner, & McCaughey, 2005; Stricherz, 2000; Şensoy & Sağsöz, 2015;
Trosper, 2017), which can contribute to holistic development of children (Nair & Fielding, 2013). The
learning environments of modern school buildings have been described as aesthetic, appealing, child-
friendly, and providing learning pathways (Craissati, Devi Banerjee, King, Lansdown, & Smith, 2007;
Higgins et al., 2005), which attracts more attention in the literature and in the school reform initiatives.
Within the growing shifts in school facilities, the physical environments of the school include the
whole physical spaces of the school where intentionally support comprehension and teaching
(Churchill, 2014). From this perspective, stereotyped old-fashioned schools do not allow for multiple
interactions between space and pedagogy. Only schools embracing new learning environments could
allow to social and individual learning (OECD, 2013). These schools have a powerful effect on
developing specific teaching strategies or the discipline in a way that stereotyped old-fashioned
schools could not (Wright, Thompson, & Horne, 2021). Therefore, the pedagogy, cognition, and
perception play a vital role in the function of the physical learning environment of schools (Pereira,
Kowaltowski, & Deliberador, 2018).

IOJPE
ISSN: 1300 – 915X
www.iojpe.org
International Online Journal of Primary Education 2021, volume 10, issue 1
Copyright © International Online Journal of Primary Education 181
The pedagogy plays a decisive role in remodeling school buildings and the function of school places.
Today, constructivist approaches (i. e. student-centered education) are adopted, which impacts on the
teacher role and the style of use of the physical space. Constructivist approaches focus on the
subjective nature of knowledge, individual experience, constructivist activity, teacher-student
interaction, and social activity (Stipanovic & Pergantis, 2018). The constructivist approach supports
deliberate interactions between students and, in turn, affects the styles and strategies of teaching, like
group work and individual work, affecting the physical spaces and places of schools which play a role
in facilitating or restricting human actions (Benade, 2019). Thus, modern pedagogy has an extensive
demand for redesigning physical learning environments. Nair and Fielding (2013) stressed that the
current physical environments of schools should meet the following learning approaches (p.19):
Independent study, peer tutoring, team collaborative work, one-on-one learning with teachers,
project-based learning, technology-based learning with mobile computers, distance learning, research
via the internet with wireless network, student presentations, performance and music-based learning,
seminar-style instruction, community service learning, naturalist learning, social/emotional learning,
art-based learning, learning by building.
As mentioned above, the current learning environments need common areas where students can work
together. In specific corners of the school, students can relax, do reading activities and work
independently. Learning areas such as science and art centers and workshops can certainly enhance
student’s learning. Therefore, the physical learning environments of schools should be developed
within the entire school infrastructure. Modern schools that allow the development of 21st-century
skills to learners have flexible learning spaces and sustainable design, and provide meaningful
community participation (Hanover Research, 2011). Aiming to be more flexible, inclusive, and
sustainable, 21st-century school buildings often feature open learning spaces rather than traditional
square-shaped classrooms. Physical learning environments are used as optimized by combining
various activity areas or replacing them in a multi-purpose way (Bardone & Gargiulo, 2014).Despite
improved understanding of the modern school buildings and learning environments, school buildings,
having inadequate infrastructure and old-fashioned architectural styles, remain problematic in
developing countries such as Turkey (Akbaba & Turhan, 2016; OECD, 2018). However, some school
reform initiatives in Turkey have gained momentum in recent years. Some steps have been taken by
the Republic of Turkey Ministry of National Education to improve the schools. The Private Education
Institutions Standards Directive, including the optional and compulsory spaces in primary schools, is
one of them (Republic of Turkey Ministry of National Education, 2020). The Let Schools Be Life
Project, like the other, aimed to make schools a livable and safe area as a social center. For this
purpose, amongst the Ministry of National Education the Ministry of Forestry and Water Affairs, the
Union of Municipalities of Turkey was signed a protocol and was given to the coordination of the
Ministry of National Education General Directorate of Lifelong Learning, located in all provinces in
Turkey and has been active since the 2011 school year. Let Schools Be Life Project aimed to open
schools affiliated with the Ministry of Education to the service of parents and the neighborhood, to
transform students and parents into living safe areas, to use schools for sports, cultural and social
services, and to reorganize school gardens with afforesting (Republic of Turkey Ministry of National
Education, 2020a). Furthermore, Educational Buildings Minimum Design Standards Guide was
revised by the Republic of Turkey the Ministry of Education in 2015. This guide stated that its goal
was to “construct repaired education and training facilities to meet the expectations and needs of
today, by developments in technology in education and training, by the current legislation, region, and
plot conditions, in a safe, economical, aesthetic, and accessible environment for everyone to improve
the quality of education” (Republic of Turkey Ministry of National Education, 2015, p. 2). In the
Republic of Turkey Ministry of Education's 2015-2019 Strategic Plan, the priorities of education
venues were to provide sufficient areas for sports and cultural activities (Directorate of Strategy
Development, 2015). In addition to these studies, in the Republic of Turkey Ministry of Education’s
2019-2023 Strategic Plan document, "school building, garden, gym, laboratories, and other such

IOJPE
ISSN: 1300 – 915X
www.iojpe.org
International Online Journal of Primary Education 2021, volume 10, issue 1
Copyright © International Online Journal of Primary Education 182
facilities” have been stated in the priority areas (Republic of Turkey Ministry of National Education,
2019b).
Although given educational policies can evaluated as positive developments, the literature indicated
the need to improve the physical conditions of primary schools in Turkey (Başar, 2000; Akbaba &
Turhan, 2016; Radmard, Karataş, & Öksüz-Gül, 2021; Yılmaz, 2012). Schools need to meet the
requirements of modern education. The school buildings are typical and old-fashioned. Schools should
be restructured to develop individualized education and to support teaching and learning since the
functionality of the learning environment depends on how it is structured and organized. A well-
designed school encourages better student performance and makes a strong statement to the general
public about the importance of education. For this reason, school buildings are a crucial factor in
educational growth (Mcmichael, 2004). Given the importance for educational growth of the physical
learning environments, restructuring of current school buildings is essential and this study sought to
understand the classroom teacher’s views that might help to alleviate the problem of school
reconstruction. Although an increasing number of scientific studies focusing on the importance of
physical conditions of schools, knowledge on the conditions of primary schools (according to rural
and urban schools) is insufficient. Correspondingly, this study aimed to examine the views of primary
school teachers on the conditions of physical learning environments of primary schools. To this end,
the authors sought to answer the following questions:
What are the views of classroom teachers working in a rural area and those working in an
urban area about the conditions of physical learning environments of primary schools?
What do classroom teachers working in a rural area and those working in an urban area
suggest for enhancement of physical facilities of primary schools?
METHOD
Research Design
In this study, a qualitative approach was adopted to provide a deeper understanding of the views of
classroom teachers regarding the conditions of the physical learning environments of primary schools
in Turkey. The study was designed by a case study method, exploring a bounded system or multiple
bounded systems (Merriam, 2009). This methodology allows for researchers to understand the case
themselves through an interpretation of the data (Creswell, 2007). This is why, in this study, each
condition of rural and urban primary schools is specified as ‘the case’. A case study requires the study
of a real-life, a contemporary context or setting; because of that, interview techniques, focus group
interviews, and document analysis are used predominantly (Creswell, 2013).
Participants
The participants of the study consisted of 14 primary school teachers who participated voluntarily. The
participants were chosen using maximum variation sampling, one of the purposeful sampling
strategies, providing ‘high-quality, detailed descriptions of each case useful for documenting
uniqueness, and important shared patterns that cut across cases and derive their significance from
having emerged out of heterogeneity’ (Patton, 2002, p. 235). The participating teachers were
determined through criterion sampling. The study inclusion criteria for participants were (1) voluntary
participation, and (2) serving as a classroom teacher in rural and urban areas. The participants of the
study were divided into two groups as those working in a rural area and those working in an urban area
in order to be able to compare the views of the participants more clearly. The descriptive information
of the participants was presented in Table 1.
According to Table 1, three of the participants were women. Six participants have completed a
master's degree. All participants have been teaching primary school students for at least four years. Six
of them have been working in rural areas. Primary school teachers from the western and eastern
regions of Turkey participated in the study.

IOJPE
ISSN: 1300 – 915X
www.iojpe.org
International Online Journal of Primary Education 2021, volume 10, issue 1
Copyright © International Online Journal of Primary Education 183
Table 1. Participant’s descriptive information
Participant Gender Grade Education
Level
Professional
Experience (Year)
Location
Emrah Male 1 BSc 13 Adıyaman (in an urban area)
Serhat Male 4 MSc 16 Adıyaman (in a rural area)
Hasan Male 3 BSc 18 Adıyaman (in an urban area)
Çağrı Male 4 BSc 4 Ağrı (in a rural area)
Suat Male 2 MSc 4 Ağrı (in a rural area)
Özge Female 1 BSc 11 Çanakkale (in an urban area)
Seniha Female 2 BSc 13 Çanakkale (in an urban area)
Gökhan Male 4 BSc 36 Çanakkale (in an urban area)
Mehmet Male 3 BSc 30 Çanakkale (in an urban area)
Faruk Male 3 BSc 10 Gaziantep (in a rural area)
Murat Male 4 MSc 16 Gaziantep (in an urban area)
Aslı Female 2 MSc 16 İstanbul (in an urban area)
Kenan Male 2 MSc 13 Kahramanmaraş (in an urban area)
Veli Male 4 MSc 15 Malatya (in an urban area)
* The names of the participants replaced with pseudonyms.
Data collection
In the study, an introductory form and standardized interview techniques were used to collect data.
The interview questions were prepared by the researchers after literature reviews. In the literature,
21st-century learning environments are depicted as a social environment, physical environment, and
digital environment (EDUSPACES21, 2016). In the study, the interview questions focused on the
physical learning environments of primary schools. The interview consisted of five open-ended
questions.
The synchronous online focus group interviews were conducted using Zoom, a commercial web
conferencing service, as a data collection method. The focus group interview was used to obtain in-
depth information through a discussion and unstructured interview, using the effect of group dynamics
in an environment where individuals can express themselves freely. The focus group interview aims to
collect rich data in a social context (Patton, 2002). The interviews lasted 90 minutes, totaling 180
minutes. Interviews were finished once data saturation had been achieved. All interviews were
videotaped and transcribed with the permission of participants.
Data analysis
In this study, a content analysis method was used, referring to 'any data reduction and sense-making
effort that takes some qualitative material and attempts to identify core consistencies and meanings'
(Patton, 2002, p. 453). When analyzing the data, the researchers followed three steps as suggested by
Merriam (2009); creating categories, sorting categories, and naming categories. After all interviews
were transcribed to the Microsoft Word program, the researchers independently encoded the data, and
categorized it according to themes to ensure reliability. Second, they reviewed their codes and themes
together. Lastly, codes and themes were edited and interpreted. In order to provide internal validity of
the study, the member control technique was used during data collection. Direct quotes from
classroom teachers were added to study to ensure external validity.
FINDINGS
In this section, the themes emerging from the data within the scope of the research questions were
presented under two topics; views on the physical learning environments of primary schools, and
suggestions for enhancement the physical facilities of primary schools.

IOJPE
ISSN: 1300 – 915X
www.iojpe.org
International Online Journal of Primary Education 2021, volume 10, issue 1
Copyright © International Online Journal of Primary Education 184
Views on the physical learning environments of primary schools
The teachers were asked what their views were regarding the physical learning environments of
primary schools. The analysis of their responses shows that the responses from both groups can be
divided into four categories: planning-related shortcomings, infrastructure deficiency, child-friendly
schools, and the advantages of these schools. The views on the physical learning environments of
primary schools were presented in Table 2.
Table 2. Views on the physical learning environments of primary schools
Primary school teachers working in urban area Primary school teachers working in rural area
Answers f Answers f
Planning-related shortcomings
Schools with shared yards
2
Planning-related shortcomings
Schools with shared yards
2
Transforming secondary and high schools into primary
schools
2 Adding a new school building to the school area 1
Overcrowded schools 4 Overcrowded schools 2
Total 8 School location 1
Infrastructure deficiency Total 6
Acoustic insulation 1 Infrastructure deficiency
Classrooms and other physical learning areas (art,
sport, and welcoming areas)
11 Classrooms and other physical learning areas (art,
sport, and welcoming areas)
6
Heating 2 Heating 3
Technology 1 Technology 2
Equipment 5 Equipment 5
Security 2 Hygiene 2
Total 22 Total 18
Child-friendly schools Child-friendly schools
Attractiveness 5 Attractiveness 4
Green spaces and soil at the school courtyard 7 Green spaces and soil at the school courtyard 2
Child-scale areas 4 Child-scale areas 1
Community-connected areas 1 Community-connected areas 2
A building with minimal floors 3 Sports, culture, and arts 2
Total 26 Total 13
Advantages Advantages
Technology 3 Technology 1
Large playground 1 A building with minimal floors 1
Hygiene 1 Indoor sports hall 1
Indoor sports hall 1 Total 3
Visual art room 1
Drama room 1
Total 8
The answers about planning-related shortcomings pointed out primary and secondary school buildings
with shared yards, transforming secondary and high schools into primary schools, overcrowded
schools, and adding a new school building to the school area. The participants stated that the proximity
of primary and secondary school buildings create some problems for all students to benefit from the
playground. The answers given by Çağrı, and Emrah were as follows:
The primary school and secondary school, unfortunately, share the same building. We see the
disadvantages of this, especially during the breaks, that primary and secondary school
students cannot move comfortably (Çağrı).
We use the playground with middle school. We are experiencing the troubles that middle
school students suffer. All students find it challenging to benefit from the same playground
(Emrah).

IOJPE
ISSN: 1300 – 915X
www.iojpe.org
International Online Journal of Primary Education 2021, volume 10, issue 1
Copyright © International Online Journal of Primary Education 185
Transforming secondary and high schools into primary schools also causes primary school children to
be educated in a school that does not meet their developmental needs. A similar planning issue
restricting to meet the developmental needs of students is to add a new school building to the school
area, causing the schoolyards to shrink. In addition, the location and environmental conditions of the
school are mentioned in the teacher response. The answers from Murat, and Serhat were as follows:
Our school was first a high school building. It became primary school later. The trucks are
passing in front of our school (Murat).
The population of Kahta district is 80,000-90,000. Although some regions are newly
developed, there is no detailed planning. For example, a new school building is added to a
standard schoolyard (Serhat).
The overcrowding of schools is the main problem affecting directly students’ learning and childhood
development. The participants' views demonstrate that primary schools in an urban area are the most
affected by this problem. Overcrowding of schools can restrict the provision of education and training
in classrooms, resulting in insufficient playgrounds areas and security problems. The responses of
participants show that schools were more crowded in urban areas. The answers given by Serhat and
Veli were as follows:
There are 20 classrooms in our school. Several classes overlap as students step onto the
playground for physical education class (Serhat).
Especially in Adıyaman, Urfa, and Gaziantep, there is an increase in the number of students
due to immigration. Besides, there is migration from villages to cities. The number of students
in village schools is fewer, and the number of students in central schools is very high (Veli).
The place that causes bullying among students at school is mostly the school canteen. In the
school canteen, older students challenge younger students. In our school, living spaces are
lacking, with constantly limited opportunities, there is inevitably tension among the children at
school. There are 700-800 students in primary school. The school capacity is not enough for
this number of students. We cannot do education and training under these circumstances.
When the bell rings, it becomes very difficult to observe our students due to the crowd
(Kenan).
The answers about infrastructure insufficiency of primary schools include acoustic insulation,
inadequate physical learning environments, heating, technology, equipment, security, and hygiene.
The lack of infrastructure of primary schools in rural and urban areas points to crucial points regarding
the effective learning and teaching practices in schools. The answers from the participants were as
follows:
Since our school building is older, physical environments are not sufficient. The school was
built in 1975. There is no place for sports, artistic performances, storage (Mehmet).
We did not have a library at the school. We have only an archive room. We are trying to get
our radiators repaired (Suat).
There are no empty classrooms or rooms in our school. There were three under the stairs to
store the belongings found in our school, we organize them as storage. We even arranged the
staircase on the ground floor like a tea room. Unfortunately, we do not have any room for a
playground, or library or any activity outside the classroom (Faruk).
There are 11 stair ramps on five floors of the school. Therefore it is not safe. Students
occasionally fall and get injured. The school is old and not earthquake-proof. In the last two
or three years, There have been major earthquakes in Elazığ and Malatya in the last 2-3
years. Our school was also affected by these earthquakes. The cracking occurred in the walls.
The inspectors stated that this was okay (Hasan).

IOJPE
ISSN: 1300 – 915X
www.iojpe.org
International Online Journal of Primary Education 2021, volume 10, issue 1
Copyright © International Online Journal of Primary Education 186
We don't have a place for theater or music at school. However, the families in the school
where I work are sending their children to courses outside of school because of the high
economic situation, and make up for this deficiency of the school (Kenan).
According to teachers' views, child-friendly schools include attractiveness, green spaces and soil at the
school courtyard, children-scale areas, community-connected areas, a building with minimal floors, as
well as sports, culture, and arts. The views of participants were presented as follows:
The school is built as a rectangular box and the school architecture is unappealing. Right and
left classes are lined up, the classic school is here (Hasan).
More vivid and interesting colors should be used in primary schools. The classroom
environment should be transformed into environments where the imagination and creativity of
children are supported by removing only the table and the board (Özge).
In our student days, the classes turned it into reinforced concrete due to the mud. This was
good for cleaning but not for children's games (Kenan).
We have a 6-storey building. The playground covered by asphalt is a problem for children.
There is no green space in our school (Aslı).
The desks in the classrooms are quite old, some high and some low; they are not suitable for
students. There is only one basketball hoop in the playgrounds and it is not suitable for
children. For this reason, children do not enjoy the game they play (Kenan).
I think the school where I work is small and has few floors, which is suitable for primary
school children (Seniha).
We can only host parents in our classrooms or use areas such as a warehouse. This situation
affects parents' opinions about the school. We do not have an area where we can organize
activities with parents outside of school, and we do not have such a point of view (Kenan).
The participants’ responses point out how primary schools in urban areas have more advantages in
terms of physical learning environments. Many schools in the city have a sports halls, drama rooms,
and libraries. The participants’ answers about the advantages of their schools are as follows:
There is an English class, gym class, painting class. I think these areas are beneficial for
children (Seniha).
There is a theater area (stage) in the basement of the school. We use this scene on certain
days and weeks (Aslı).
It is an advantage that our school has two floors. Children do not have difficulty entering the
classroom during break. The school where I used to work was a five-storey school. It was not
a suitable building for primary school students. Compared to other schools in the district
center, our school has enough school courtyards (Hasan).
In recent years, large investments such as Fatih Project have been made by the government to
improve the physical and technological infrastructure of schools. However, it is still not
enough. The technological infrastructure of schools in rural areas needs to be improved
(Veli).
We bought projectors and computers for our classes with our own means. Many teachers at
my school use their own projectors and computers. By the way, there is an effort to bring
smart boards to the classrooms within the Fatih Project, and this is a good development
(Hasan).

IOJPE
ISSN: 1300 – 915X
www.iojpe.org
International Online Journal of Primary Education 2021, volume 10, issue 1
Copyright © International Online Journal of Primary Education 187
Suggestions for enhancement of physical facilities of primary schools
The answers of participants delineated that although primary schools in urban areas were more
crowded, rural primary schools have more infrastructure deficiency. Child-friendly areas are needed
for both schools. To minimize these problems, suggestions for improving the physical facilities of
primary schools were given in Table 3.
The participants’ suggestions are as follows:
We cannot provide the education we want due to the physical inadequacy of the school. We
can provide classical/traditional education (Gökhan).
We organize competitions, trips to support children's social interactions. We arrange folk
dances, choir, gymnastics courses, and intelligence games. With these activities, the physical
conditions of our schools have improved over the last five years (Mehmet).
There is no point in having a single school entry. An entire building should have more than
one exit door. It doesn't make much sense to me that children enter and exit the same door in a
restricted way. If there is more than one exit door, it will provide us much more comfort for
evacuation in an event such as an earthquake (Kenan).
Table 3. Suggestions for improving the physical facilities of primary schools
Primary school teachers working in urban area Primary school teachers working in rural area
Answers f Answers f
Elimination of physical infrastructure deficiencies 7 Elimination of physical infrastructure deficiencies 4
Supporting the physical environments to modern
education approaches 2 Supporting the physical environments to modern
education approaches 2
Renovation, the rebuilding of the school Renovation, the rebuilding of the school
Increasing teacher competencies for effective use of
learning spaces 2 Increasing teacher competencies for effective use of
learning spaces 2
Not rushing to open schools if the infrastructure is not
completed. 2 Not rushing to open schools if the infrastructure is not
completed. 1
Tracking the shortcomings of newly opened schools 2 Tracking the shortcomings of newly opened schools 1
Determining the number of students in schools
according to the capacity of the school 4 Supporting the curriculum the effective use of learning
spaces 1
Schools have multiple entrances 2 Areas reserved for out-of-class activities 1
Taking stakeholders' views in the design of school
buildings 2 Total 12
Covering the school floor with soft material 2
The playgrounds in kindergartens for primary schools 1
Wider classes 1
Using every area of the school as a learning area 1
Reflection of regional features to the architectural
structure 1
Teachers' room where students can be observed 1
Total 30
DISCUSSION and CONCLUSION
Today, the developing understanding of physical learning environments has provided the basis for the
restructuring of schools around the world. Nevertheless, there are steps that must be taken in primary
school buildings, especially in developing countries, to support the physical learning environments to
encourage the development of children. This study aimed to investigate primary school teachers' views
on the physical learning environments of primary schools. For this purpose, six classroom teachers
working in urban areas, and eight classroom teachers working in rural areas were interviewed.
Teachers' views on the physical learning environments of primary schools are divided into four
categories: as planning-related shortcomings, infrastructure deficiency, child-friendly schools, and the
advantages of these schools. The answers from the classroom teachers working in urban areas mostly

IOJPE
ISSN: 1300 – 915X
www.iojpe.org
International Online Journal of Primary Education 2021, volume 10, issue 1
Copyright © International Online Journal of Primary Education 188
focused on the crowding of schools and classrooms. On the other hand, the answers of classroom
teachers working in rural areas generally focused on the physical infrastructure of primary schools.
The participating teachers specifically cited the deficiency of physical infrastructure facilities. This
result is compatible with PISA 2015 report results emphasizing the lacking of educational materials
and the physical infrastructures of schools of Turkey. This report pointed out that the lack or
insufficiency of textbooks, technology equipment, library, or laboratory materials and the physical
infrastructure of the school disrupt the educational activities (Hacettepe University, 2020). A vast body
of research utters a truism about the importance of the school infrastructure to meet the needs of
modern schools. Even though scientific studies do not indicate a direct link between student
achievements and advanced facilities, it indicate that student achievement is lower in poor school
infrastructure (Stricherz, 2000). It is alarming that the findings reflect the quantitative fact about
school facilities over a decade ago and implicate urgent needs of school infrastructures.
A key finding from this study that multi-storey school buildings, the transformation of high schools or
secondary schools into primary school buildings, and the lack of large space allocated for schools,
crowded student population minimize the use of the physical learning environments effectively. These
findings are very valuable in that the physical structure of the school can affect students' attitudes and
behaviors as well as social interaction (Frith, 2015). Various studies conducted in Turkey pointed to
similar results obtained from this study. Highlights of the literature with the results of this research
include; insufficient support of physical learning areas to learning (Akbaba & Turhan, 2016; Yılmaz,
2012); technological infrastructure deficiency (Göçen, Eral, & Bücük, 2020), crowded schools (Köse
& Barkul, 2012); the deficiencies of playgrounds (Akbaba & Turhan, 2016; Işıkoğlu-Erdoğan &
Şimşek, 2014; Şişman & Gültürk, 2011). The findings of the study revealed that the school was
crowded in indoor circulation areas. Furthermore, the responses of the participants pointed out that the
indoor circulation areas of the schools should be large and allow for freedom of movement.
Furthermore, physical spaces should allow for flexible arrangements in the classroom to minimize
infrastructure problems and make the optimum use of school and (or) classroom spaces. Şensoy and
Sağsöz (2015) on the design of flexible classrooms; proposed that two classrooms can be combined as
needed, and that physical space arrangement can be made for collaborative work through moving
walls to better implement the constructivist teaching approach in learning areas. These results reveal
that the building structure characteristics of primary schools in both rural and urban areas strongly
impact the provision of contemporary education and training. The answers from the teachers on the
advantages pointed out that the FATİH project contributed to schools in terms of the technological
infrastructure.
As another critical finding of the study is that primary school buildings should have a structure that
supports the physical, affective, cognitive, kinesthetic, and intellectual development of primary school
children, that is; primary school buildings should be child-friendly. Child-friendly schools envisage
making a physical arrangement that meets the needs of the child for different learning styles and
physical characteristics. For this, there should be areas, classrooms, and equipment suitable for
children between the ages of 6-10 in primary schools. A child who has just started primary school
should be able to participate in a wide learning community with the school's facilities. Schools should
support the interaction between children and adults positively to adapt to social life. The prominent
concept at this point is that spaces allow interaction, in other words, they contain community-related
areas (Nair & Fielding, 2013). Schools allow direct or conscious interactions with the community,
making it easier for children and adults to be included in the school community on certain days and
events. The community-related areas of school can make it easier for children to model school
belonging and positive behavior patterns. Similarly, Güner and Kartal (2020) recommend that the
physical learning environments of schools should support teacher-child-family interaction.
Another critical finding of the study is attractiveness. Teachers stated that primary school-age children
do not perceive schools as attractive places. The teachers reported that they paid attention to the
attention of children in terms of classroom layout, color of the cabinets, shape and color of the

IOJPE
ISSN: 1300 – 915X
www.iojpe.org
International Online Journal of Primary Education 2021, volume 10, issue 1
Copyright © International Online Journal of Primary Education 189
materials used. Additionally, the answers from teachers showed that the architectural characteristics of
the school are not very suitable for children. The fact that schools are arranged attracted and suitably is
related to a positive attitude towards schools (Adıgüzel, 2012), which in turn, has the potential to
enhance student learning (Higgins et al., 2005). It can be stated that after pre-school education,
primary schools are a less attractive and motivating place for pupils in Turkey. Similarly, Göçen, Eral,
and Bücük’s (2020) study reveal that the architecture of buildings and the characteristics of physical
learning environments should encourage children to develop positive attitudes towards learning. Thus,
these results provide important clues for redesigning primary schools according to the aesthetic tastes
of the child.
The findings of the study also revealed that the most important learning area emphasized by the
participants emerges as the playground, where children socialize by playing. It was emphasized by the
participants that the playgrounds should be especially rich in equipment; the ground should be covered
with soft surfaces such as grass, soil or rubber. Many participants reported that there were no toys or
benches in the playgrounds. One participant (Aslı) stated that having a park-like playground in
kindergartens would be very valuable for primary school children. The participants stressed that the
playgrounds should provide opportunities for children to learn about ecology and nature. The Turkish
primary school curricula aim to develop knowledge, skills and attitudes about science literacy of
children. For this purpose, out of school activities such as planting seedlings and growing vegetables
in playgrounds have the potential to support children's learning in various ways. However, further
understanding of the potential contribution of this subject to the child development in primary school
contexts is needed. Thus, Radmard, Karataş, and Öksüz-Gül (2021) stressed that to improve students’
environmental literacy and to provide more sustainable schools and ecological learning concepts
should have a more prevalent place in academic works in Turkey. Primary schools should create
opportunities for the implementation of eco pedagogy.
The last findings of the study were suggestions offered by teachers to improve the quality of physical
learning environments of primary schools. All participating teachers agreed that physical infrastructure
deficiencies should be eliminated, physical learning areas should support modern educational
approaches, and old schools should be rebuilt. Furthermore, teacher competencies should be increased
to benefit from learning areas in the most effective way. In this context, the views of the participants
revealed the security problem of schools, crowdedness, and improvement of the playground. The
participants expressed the views on reflecting regional features to the architectural structure, taking the
views of teachers in the design of the physical learning environments of the schools, and the children's
scale of the schools (small, low-rise, the suitability of the materials to children). It has been reported
that the curriculum should especially support activity areas where children can interact with the
community. These results are compatible with the literature. The scientific studies indicated that the
arrangement of primary school buildings and classrooms contributes the development of students'
basic language skills (Tanner, 2009), and wider and more orienting corridors resulted in better learning
progress. Thus, the physical areas of school should be wider to movement and circulation. In this
study, participants stated the importance of wider scale areas for student development. Besides,
participants indicated the using of individual display to promote child’s interest for school. Previous
studies have confirmed that individual display also plays a role in developing a sense of belonging of
children, and the layout of classroom impacts on attitudes to express of children, and the importance of
environmental arrangements for individual differences (Barrett, Davies, Zhang, & Barrett, 2015).
Finally, the findings of this study pointed out the conflict between the current teaching approach and
learning environments, similar to the findings of previous studies (Mellor, 2016).
Limitations of the Study
Although this study descripts the views of classroom teachers, it had some limitations. First of all, the
study was designed with a case study; the data collection method was focus group interviews only.
The data triangulation may contribute to achieving a broad picture of the conditions of primary
schools. The second limitation of the study is the sample size. Despite the maximization of participants

IOJPE
ISSN: 1300 – 915X
www.iojpe.org
International Online Journal of Primary Education 2021, volume 10, issue 1
Copyright © International Online Journal of Primary Education 190
working in rural and urban schools from the east and west regions of Turkey have the potential to give
some common and exclusive findings, the sample size (the participants) could be larger to provide a
higher level of data saturation. Despite the qualitative study allow analytical generalization to draw
theoretical inferences from the findings (Yıldırım & Şimşek, 2016), fewer participants can be at risk
for data saturation.
Implications and Recommendations
The following implications can be given for the physical learning environments of primary schools:
First of all, the infrastructure problems of the schools should be solved and the schools should
be restructured.
Classes should be large enough to accommodate individual and group work.
Primary schools should not be crowded.
Primary school buildings should have minimal floors.
Primary schools should be an area of interest for students. Therefore, students' views should
be taken into account in the architectural and physical space arrangements of the school. 21st-
century schools can be the basis for necessary adjustments.
Primary schools should be an area where students socialize. For this, the playground,
classrooms and common areas of the school should meet the social needs of the students.
Schools must be safe. Safe schools should not be thought of as places only monitored by
cameras. Furthermore, the fact that the interactive environments in the school allow social
interaction, adult support, and more activities for children to help create a safe school.
The school and the ground should be environmentally compatible and sufficient to facilitate
the curriculum.
Cafeterias should be large enough to reduce crowded accommodation.
There should be special areas in the school that welcome parents.
Playgrounds should be large so that primary and secondary school students can be separated
from each other.
Teachers should be informed about the arrangement of learning environments so that they can
effectively benefit from all areas of the school.
Ethical Considerations
An ethical approval was obtained from the Ethics Committee to conduct the study (Project number:
E-30237869-050.99-66327).
REFERENCES
Adıgüzel, A. (2012). The validity and reliability study about school attitude scale. Electronic Journal of Social Sciences,
11(40), 30-45.
Akbaba, A., & Turhan, M. (2016). Investigating teachers’ views about physical problems of primary schools (Van sample).
Karadeniz Technical University Institute of Social Sciences Journal of Social Sciences. 6(12), 341-357.
Bardone, A., & Gargiulo, C. (2014). Learning in twenty-first century schools: Norms and costs of school infrastructure.
Inter-American Development Bank.
Barrett, P., Davies, F., Zhang, Y., & Barrett, L. (2015). The impact of classroom design on pupils' learning: Final results of
a holistic, multi-level analysis. Building and Environment, 89, 118-133.
Başar, M. A. (2000). İlköğretim okullarının işgören ve fiziki olanakları [Employment and physical facilities of primary
schools]. Pamukkale University Journal of Education, 8, 134-140.
Benade, L. (2019). Flexible learning spaces: Inclusive by design? New Zealand Journal of Educational Studies, 54, 53–68.
Craissati, D., Devi Banerjee, U., King, L., Lansdown, G., & Smith, A. (2007). A human rights based approach to education
for all. New York: United Nations Children’s Fund.
Creswell, J. W. (2007). Qualitative enquiry and research design: Choosing among five approaches. Thousand Oaks, CA:
Sage Publications.
Creswell, J. (2013). Qualitative inquiry and research design: Choosing among five approaches. California, CA: SAGE.

IOJPE
ISSN: 1300 – 915X
www.iojpe.org
International Online Journal of Primary Education 2021, volume 10, issue 1
Copyright © International Online Journal of Primary Education 191
Dejong, W. (1997). Building change into new buildings. School Administrator, 54(6), 10-13.
Directorate of Strategy Development. (2015). Ministry of National Education 2015-2019 strategic plan [Millî Eğitim
Bakanlığı 2015-2019 stratejik planı]. Ankara: MoNE.
EDUSPACES21. (2016). Physical and architectural learning environment: Educational spaces 21. open up!. Warsaw:
Center for Citizenship Education Foundation.
Frith, K. (2015). Inside school design: The role of interior design in cultural change. (Unpublished doctoral thesis).
Swinburne University of Technology: Melbourne, Vic. Retrieved from http://hdl. handle. net/1959.3/414201.
Göçen, A., Eral S. H., & Bücük, M. H. (2020). Teacher perceptions of a 21st century classroom. International Journal of
Contemporary Educational Research, 7(1), 85-98. doi: https://doi.org/10.33200/ijcer.638110
Güner, F., & Kartal, H. (2020). Review of classroom teachers’ standpoints for elementary schools in the context of schools’
readiness. Education and Science, 45(203), 411-437. doi: 0.15390/EB.2020.8681
Hacettepe University, the Faculty of Education. (2020). PISA and Turkey (2000-2018). Ankara. Retrieved from
http://www.egitim.hacettepe.edu.tr/belge/pisaveturkiye.pdf
Hanover Research. (2011). School structures that support 21st century learning. Washington DC. Retrieved from
https://www.apsva.us/wp-content/uploads/legacy_assets/www/bda59d16b8-School_Structures.pdf
Higgins, S., Hall, E., Wall, K., Woolner, P., & McCaughey, C. (2005). The impact of school environments: A literature
review. London: Design Council, available at:
https://citeseerx.ist.psu.edu/viewdoc/download?doi=10.1.1.231.7213&rep=rep1&type=pdf
Işıkoğlu-Erdoğan, N., & Şimşek, Z. C. (2014). Investigation of school readiness of first grade children, parents and teachers.
International Journal of New Trends in Arts, Sports & Science Education, 3(2), 62-70.
Kopec, D. (2006). Environmental psychology for design. NY: Fairchild Publication.
Köse, Ç., & Barkul, Ö. (2012). A study on the problems of the implementation of project type primary structures. Megaron
Architecture, 7(2), 94-102.
Mcmichael, C. A. (2004). Perspectives of school planners and architects and professional educators regarding elementary
school facility design characteristics (Doctoral dissertation). The University of Georgia, Athens. Retrieved from
https://athenaeum.libs.uga.edu/handle/10724/22179
Mellor, J. E. (2016). An Action Research investigation into the innovation of a creative pedagogic approach within a
secondary school Building Schools for the Future project. (Unpublished Doctoral dissertation), University of
Leicester, UK.
Merriam, S. B. (2009). Qualitative research: A guide to design and implementation (2nd ed.). San Francisco, CA: Jossey-
Bass.
Nair, P., & Fielding, R. (2013). The language of school design: Design patterns for 21st century schools (3rd ed.).
Minneapolis, USA: Designshare.com.
OECD. (2018). PISA 2015: Results in focus. Retrieved from https://www.oecd.org/pisa/pisa-2015-results-in-focus.pdf
Patton, M. Q. (2002). Qualitative research and evaluation methods (3rd ed.). Thousand Oaks, CA: Sage.
Pereira, P. R. P., Kowaltowski, D. C. C. K., & Deliberador, M. S. (2018). Analysis support for the design process of school
buildings. Ambiente Construído, 18(3), 375-390. http://dx.doi.org/10.1590/s1678-86212018000300287
Radmard, S., Karataş, İ. H., & Öksüz-Gül, F. (2021). The design and aesthetics of school structure: A content analysis of
national and international perspectives. Hacettepe University Journal of Education, 36(2), 406-429.
Republic of Turkey Ministry of National Education. (2015). Educational buildings minimum design standards guide.
Retrieved from
http://erbaa.meb.gov.tr/meb_iys_dosyalar/2016_12/06090414_2015_egitim_yapilari__asgari_tasarim_standartlari__
_klavuzu.pdf
Republic of Turkey Ministry of National Education. (2019b). 2019-2023 strategic plan. Retrieved from
http://ttkb.meb.gov.tr/meb_iys_dosyalar/2020_03/31150840_stratejik_plan_2019_2023.pdf
Republic of Turkey Ministry of National Education. (2020a). Schools get life. Retrieved from
http://okullarhayatolsun.meb.gov.tr/?
Republic of Turkey Ministry of National Education. (2020b). Special education institutions standards directive. Retrieved
from

IOJPE
ISSN: 1300 – 915X
www.iojpe.org
International Online Journal of Primary Education 2021, volume 10, issue 1
Copyright © International Online Journal of Primary Education 192
http://ookgm.meb.gov.tr/meb_iys_dosyalar/2020_03/13113722_OZEL_OYRETYM_kURUMLARI_STANDARTL
AR_YONERGESY_11.03.2020_tarihli_ve_5331494_sayYlY_Makam_Oluru.pdf
Stipanovic, N., & Pergantis, S. I. (2018). Inclusive education for international students: Applications of a constructivist
framework. The International Education Journal: Comparative Perspectives, 17(1), 37-50.
Stricherz, M. (2000). Bricks and mortarboards. Education Week, 20(14), 30–32.
Şensoy, S. A., & Sağsöz, A. (2015). Relation between pupils academic achievement and pyhsical conditions of classrooms.
Kırşehir Faculty of Education Journal (JKEF), 16(3), 87-104.
Şişman, E. E., & Gültürk, P. (2011). A research on primary schoolyards in terms of landscape planing and design: Tekirdag.
Journal of Tekirdag Agricultural Faculty, 8(3), 53-60.
Tanner, C. K. (2009). Effects of school design on student outcomes. Journal of Educational Administration, 47(3), 381-399.
Trosper, S. T. (2017). Safe school building characteristics in Virginia’s elementary schools: architect and principal
perspectives (Doctoral dissertation). The Virginia Polytechnic Institute, USA. Retrieved from
https://vtechworks.lib.vt.edu/bitstream/handle/10919/85258/Trosper_ST_T_2017.pdf?sequence=1&isAllowed=y
Wright, N., Thompson, T., & Horne, T. (2021). Talking spaces: Architects and educators. New Zealand Journal of
Educational Studies, 1-15, https://doi.org/10.1007/s40841-021-00193-5
Yıldırım, A., & Şimşek, H. (2018). Sosyal bilimlerde nitel araştırma yöntemleri [Qualitative research methods in the social
sciences] (11. Ed.). Ankara: Seçkin Publishing.
Yılmaz, A. (2012). The evaluation of the primary schools’ physical structure in terms of education. Balikesir University The
Journal of Social Sciences Institute, 15(28), 78-107.

IOJPE
ISSN: 1300 – 915X
www.iojpe.org
International Online Journal of Primary Education 2021, volume 10, issue 1
Copyright © International Online Journal of Primary Education 193
INVESTIGATION OF THE VIEWS OF PRE-SERVICE TURKISH
TEACHERS IN TERMS OF SPEED READING
Hulusi GEÇGEL
Assoc.Prof.Dr., Çanakkale Onsekiz Mart University, Faculty of Education, Çanakkale, Turkey
ORCID: https://orcid.org/0000-0002-9277-6417
Fatih KANA
Assist.Prof.Dr., Çanakkale Onsekiz Mart University, Faculty of Education, Çanakkale, Turkey
ORCID: https://orcid.org/ 0000-0002-1087-4081
İlknur YALÇIN AKKAŞ
Turkish Language Teacher, Ministry of Education, Çanakkale, Turkey
ORCID: https://orcid.org/ 0000-0001-8497-9161
Received: June 25, 2020 Accepted: September 19, 2020 Published: June 30, 2021
Suggested Citation:
Geçgel, H., Kana, F., & Yalçın Akkaş, İ. (2021). Investigation of the views of pre-service Turkish teachers in terms of speed
reading. International Online Journal of Primary Education (IOJPE), 10(1), 193-206.
This is an open access article under the CC BY 4.0 license.
Abstract
The aim of this study is to reveal the views of pre-service Turkish teachers in terms of the speed reading. To that extent, case
study design was adopted in the research. The study group consists of 85 3rd and 4th grade pre-service teachers from a state
university in the West of Turkey. A semi-structured interview form was used as a data collection tool in the research. The
descriptive analysis method was used in the data analysis of the research. Accordingly, speed reading is a requisite in
Turkish teacher education. Most of the pre-service teachers consider speed reading as an essential ability. Some participants
stated that they had a high concentration level when reading. The participants claim that speed reading will improve their
exam performance, allow them to save time and, to read more books, and it will also contribute them in their future
professions.
Keywords: Reading, speed reading, reading speed, pre-service Turkish teachers.
INTRODUCTION
Today, there is a great deal of information that needs to be accessed in an extremely limited time.
Books, newspapers, magazines, articles, business-related reports, e-mails have become indispensable
parts of daily life as well as the internet and social media. People need new methods that will help
individuals to save time to spend for all these responsibilities in a 24-hour time slot, and one of these
methods is speed reading. When speed reading is mentioned, biases come into people’s mind and a
reading type independent from comprehension is recalled. However, reading cannot be thought
without comprehension. To better understand speed reading, it is necessary to know the concept of
reading well first.
According to Gündüz and Şimşek (2011), reading is an activity of seeing, perceiving, understanding,
and making sense of words, sentences or a text with all its elements. They do not mean basic reading,
but functional reading, which enhances one's world of feeling and thought. In this respect, reading
makes important contributions to the development of personality and the enrichment of individual and
social life. Reading is an activity that enables knowledge, development, and fun. It consists of the
functions of the brain such as vision, perception, vocalization, comprehension, and configuration.
Harris and Sipay (1990, p. 10) describe reading as meaningfully interpreting the language of writing.
Dökmen (1994, p. 15) states that reading is not all about seeing words and sentences, but that mental

IOJPE
ISSN: 1300 – 915X
www.iojpe.org
International Online Journal of Primary Education 2021, volume 10, issue 1
Copyright © International Online Journal of Primary Education 194
activities must occur for reading to take place. Güneş (2009, p. 3) referred to reading as decoding
writings. In addition to this statement, he expressed that reading is about capturing the generic
meaning and so fronted silent reading. According to the constructivist educational approach applied in
the Turkish language curriculum since 2005, reading has been treated as a process that improves
mental structure.
According to the constructivist approach, reading is an active process in which the individual creates
new meanings by integrating the information in the texts one reads with preliminary information and
expands vocabulary. In this process, individuals explore, interpret and remake sense of the meaning of
the writings. The process of reading is mental and complex. Accordingly, individuals use various
mental processes such as sorting, classifying, associating, questioning, analysis-synthesis, evaluation.
The information passed through these processes is re-interpreted with the preliminary information of
the individual and subjected to a new process (Güneş, 2009, p. 3). Reading is the best way to manage
the reading process. A good reader determines the important information in the text s/he reads,
integrates the new information with his / her preliminary information, makes inferences, interprets and
relates it to daily life (Ateş, Güray, Döğmeci, & Gürsoy, 2016). Individuals need to have high-level
thinking skills to make inferences from the text (Özdemir & Kiroğlu, 2019).
Gündüz and Şimşek (2011:145-161) define speed reading as a text length and a type of visual reading
that can be done in unit time. Arıcı (2012) defines speed reading as reading many words in a given
time. According to Ruşen (2006), speed reading increases the level of comprehension of individuals
by the number of words they read. Maviş (2006: 73) describes reading speed as the duration of
reading by understanding a text and states that reading speed is determined by the reader's purpose,
comprehension strength, the difficulty level of the subject and material. Speed reading is known in
society as the number of words an individual reading in a minute. In the constructivist approach,
speed reading is the research, discovery, interpretation, re-interpretation of lines, which are called
writing, and their configuration in the mind. Speed reading is not a simple form of reading, but a
process that works as a mental process by understanding (Güneş, 2009, p. 5). Research on speed
reading (Akçamete, 1989; Dökmen, 1994; Tazebay, 1997; Avcıoğlu, 2000; Coşkun, 2002; Dedebali,
2008; Karadağ, Keskin, & Arı, 2019) focused on the number of words read by the individual.
Richadeau, Gauquelin, and Gauquelin (1990, p. 39-40) express that our eyes move forward by making
leaps and pauses on the text.
Kavcar, Oğuzkan, and Sever (1995) and Ruşen (2006) emphasize that eye training and visual
perception are important in speed reading. Akyol (2007) emphasizes habits in speed reading, while
Brook (1936) emphasizes that line length is important. Ruşen (2006, p. 49) states that the basis of
reading is the individual's desire to acquire new knowledge or the idea that previous knowledge must
be reinforced. In addition to speed of reading, it is also important to understand what is read (Tazebay,
1995; Güneş, 2000; Garland & Çalışkan 2004). When the post-graduate research on speed reading are
examined (Dedebali, 2008; Bozan, 2012; Ciftcibasi, 2013; Kaçar, 2015; Soysal, 2015; Ilter, 2018;
Torppa, Vasalampi, Eklund, Sulkunen, & Niemi, 2018; Astari, 2019; Babayiğit, 2019; Çelik, 2019;
Mergen, 2019; Muñoz, Vejarano, & Vargas, 2019; Yurdakal, 2019; Bergmann, & Bristle, 2020;
Durukan, 2020) many studies with secondary school and high school students were conducted. In
contrary, no study was conducted at universities. In this respect, this study aims to determine the
opinions of pre-service Turkish teachers about fast reading. For this purpose, answers to the following
questions have been investigated in this study:
1. What is the reading speed of pre-service Turkish teachers?
2. What is the perception of pre-service Turkish teachers about their own level of reading?
3. What kind of activities do pre-service Turkish teachers intend to do about speed reading?
4. Is speed reading seen as a need for pre-service Turkish teachers?
5. What do pre-service Turkish teachers think about the articles that should be read in a short
time?
6. What are the reading concentration levels of preservice Turkish teachers?

IOJPE
ISSN: 1300 – 915X
www.iojpe.org
International Online Journal of Primary Education 2021, volume 10, issue 1
Copyright © International Online Journal of Primary Education 195
7. How is the relationship between preservice Turkish teacher reading speeds and
comprehension levels?
8. What are the opinions of preservice Turkish teachers on speed reading?
METHOD
Research Design
The case study design was used in this research. The case study is expressed as an in-depth
investigation and description of a current situation (Merriam, 2013, p. 40). In a case study, there is a
case of an intensive study of an event about how and why questions are being answered in case
studies. In the study, the opinions of the pre-service teachers about speed reading were examined
which is one of the methods of reading skills included in the four basic language skills. When pre-
service teachers start their profession following their graduation, they will give their students speed
reading techniques and ask them to read and understand texts quickly. Getting their opinion on speed
reading before they start their profession will allow them to experience awareness regarding this
process.
Research Group
In the study, a simple random sampling method was used (Büyüköztürk, Çakmak, Akgün, Karadeniz,
& Demirel, 2014). In this study, 85 pre-service Turkish teachers who studied during the 2019-2020
academic year were selected as a sampling group.
Data Collection
A semi-structured interview form was presented to the students in the study. The interview form
consists of questions which has been prepared by the researchers and reviewed by the faculty
members who experts in their field. A semi-structured interview form was administered to the
students after the interview questions were received from the field experts. In accordance with the
feedback received from the student, the questions were revised and modified.
Data Analysis
The data in the study was obtained by interview form. Then, the codes were analyzed by considering
categories. Descriptive analysis was used to evaluate interview forms. Descriptive analysis is the
encoding of qualitative data based on a predetermined framework (Büyüköztürk et al., 2014, p. 240).
The data obtained in the research were analyzed in accordance with the pre-determined themes.
Validity and Reliability of Research
To ensure the structural validity of the research, pre-service teachers with different grade point
averages and different levels were included in the research. The data obtained in the study were
analyzed by different researchers, ensuring that the findings and analyses were consistent with each
other. To ensure the internal validity of the study, the data obtained from the study group were
included in the findings section via extracts. The findings of the study were generalized to ensure the
external validity. To ensure the internal reliability of the research, some other researchers examined
and verified the data (Merriam, 2013).
Ethical Consideration
The permission of the Ethics Committee for the research was obtained by the resolution of the Social
Sciences and Educational Sciences Ethics Committee at Çanakkale Onsekiz Mart University dated
16.04.2020 No. 03. Besides, the participants of the study declared that they participated voluntarily in
the research.
RESULTS
In this part of the study, the views of pre-service Turkish teachers in terms of speed reading were
examined.

IOJPE
ISSN: 1300 – 915X
www.iojpe.org
International Online Journal of Primary Education 2021, volume 10, issue 1
Copyright © International Online Journal of Primary Education 196
Speed Reading Competencies
Table 1. Opinions of pre-service Turkish teachers about their reading speed competency
Codes f (79)
Yes, I consider my reading speed is sufficient. 45
No, I do not consider my reading speed is sufficient 30
I consider it is partly sufficient/ It could be a lit bit quicker/Average 10
When Table 1 was examined, it was seen that pre-service Turkish teachers (n=45) find their reading
speed enough. In contrary, some students do not find their reading speeds enough (n=30), some others
find their reading speed partially enough. Those who said, "Yes, I consider my reading speed
sufficient." expressed their opinion as:
“Yes, I consider it is sufficient. For example, I can finish a novel book in average thickness. I do not
have any problem with solving paragraph questions” (A12).
“I consider it is sufficient. When I start to read a book, I can finish it in a very short time. I did not
have any difficulty in finishing the exams that I had in the past.” (A15).
“I do not consider it is sufficient. I consider I can read neither quick or slow. I think that I have
stabilized my reading skill as I can understand what I read” (A18).
“I consider my reading speed is sufficient because I can solve questions very quickly. The only
problem with my reading is that I do not understand what I read. I mean, the questions that I solve
after a quick reading are often wrong.” (A25).
“I consider it is sufficient because I read for fun. As I read the books that I like, I have no intention to
read them very quickly. Just opposite, I like reading them slowly, having fun.” (A24).
Those who said “No, I do not consider my reading speed is sufficient.” express their opinion as
follows:
“I am not a good reader. I do not consider I am sufficient in that because it requires too many
different texts.” (A1).
“I do not consider it is sufficient for exams, but I am very comfortable when I am reading a novel. I
feel nervous when I must compete in exams; therefore, I may not understand what I read. I am not
concerned with how fast I read when I am reading books. I am engrossed in the book and forget about
all the rest.” (A22).
“I do not consider it is sufficient because I cannot understand what I am reading when I read fast. I
spend time as much as necessary for reading rather than spending more. I do not have much time to
go back when I am solving questions or reading book.” (A23).
Those who said "I consider it is partly sufficient/it could be a little bit faster/average" expressed their
opinion as:
“I consider my reading speed is at an average level. I consider my reading speed satisfactory when I
am reading and having fun. However, I do not consider my reading speed is enough especially when I
have to finish reading something in a very limited time.” (A9).
“I consider it is partly sufficient although it is not too slow because human always wants to be faster
no matter how fast they are. I also want to be faster.” (A44).
Although pre-service teachers consider their reading speed enough, there are also pre-service teachers
who do not see their reading speed enough.

IOJPE
ISSN: 1300 – 915X
www.iojpe.org
International Online Journal of Primary Education 2021, volume 10, issue 1
Copyright © International Online Journal of Primary Education 197
The Level of Being Reader
Table 2. Opinions of pre-service teachers regarding being a reader no matter if they are a good or bad
one
Codes f (85)
I fell myself as a good reader. 53
I fell myself as a bad reader. 15
I fell myself as an average reader. 14
It changes based on time and condition. 1
I find it useless to put myself in a category. 2
When the table 2 was examined, pre-service Turkish teachers (n=53) express that they consider
themselves to be good readers. Some pre-service teachers think of themselves as bad readers (n=15)
and who think they are average readers (n=14). Some think it differs based on time and conditions if
they are good or bad readers, and some do not put themselves in any category. Those who said I
consider I am a good reader” expressed their opinions as follows:
“I am a good reader because I never give a break when I am reading. If I have started, I finish it.
Then I immediately start a new book. I cannot stay away from books.” (A3).
“I consider that I am slightly a good reader. The reason why I say “slightly” is that I cannot spare
much time to reading. Except those, I can read long texts on various topics. There are news sources I
keenly follow.” (A22).
“I consider I am a good reader. There have been no exams which I took and failed to finish all the
questions on time. My immediate friends also say that I read fast. In general, I am a good reader
because I immediately buy or find a new book when I do not have any to read. I am very careful about
finishing a book that I have started.” (A36).
“I consider I am a good reader. The advantage that it brings about is that I am studying at the
department. To be honest, I was the kind of person who liked reading before I started to study at this
department.” (A44).
Those who said “I consider I am a bad reader” expressed their opinions as:
“I am generally a bad reader. It is not a habit for me to read. The books that I read are not various.”
(A5).
“I do not consider it is insufficient. This makes me neither good nor bad because it limits me in the
things that I plan to do even if it satisfies me. Therefore, it is not sufficient.” (A16).
Those who said “I consider I am an average reader” expressed their opinions as:
“I am not one of the bad readers. I do not avoid reading. I like reading and talking about what I have
read, but I cannot claim that I am a very good reader. There are better readers than I am.” (A15).
“I consider I am an average reader. The book series I like consists of three books and I finished it in
two days. I consider it was normal considering that the average page number of each was 300.
However, it took me weeks to finish a thin book (Açlık Oyunları), which was made obligatory by the
school (Sergüzeşt) (A19).
Those who said “It changes based on time and conditions” expressed their opinion as:
“My mind regarding these changes from time to time because I sometimes read very much, and I feel
I read very fast and I am a good reader. However, I feel my reading speed went back.” (A2).
When the opinions of the teacher candidates are examined, the teacher candidates generally see
themselves as good readers.

IOJPE
ISSN: 1300 – 915X
www.iojpe.org
International Online Journal of Primary Education 2021, volume 10, issue 1
Copyright © International Online Journal of Primary Education 198
Speed Reading Activities
Table 3. Opinions of pre-service teachers regarding the activities they have executed, or they plan to
improve their reading speed.
Codes f (84)
I participated. 5
I participated; I am thinking of participating. 1
I participated; I do not think that I will participate. 1
I did not participate. 4
I did not participate; I do not think I will participate 44
I did not participate; I do not think I will participate. 29
When Table 3 was examined, pre-service Turkish teachers (n=44) were found not to have participated
in any seminar, congress, course etc., and they did not intend to participate in the future. Some pre-
service teachers have not previously participated in an activity related to speed reading and are not
considering participating (n=29). Those who said: “I participated; I don't think I will participate."
expressed their opinions as:
“The thing that I do about speed reading is normal reading because I speed up reading and my
vocabulary treasure extends.” (A3). “There were such activities when I was in secondary and high
school. Therefore, I can claim that am a speed reader. I received training on speed reading.” (A28).
“I received training on speed reading. I benefitted a lot from it. But I do not care about reading fast
very much. I prefer reading and interpreting the meaning to speed reading. I think everything is fast
enough. I prefer to be left alone and read.” (A69).
Those who said “I did not participate; I think I will participate” expressed their opinions as:
“I never thought about it before. I am trying to improve it by reading a lot. However, I have started
to think about receiving training on speed reading. I only need to see the outcomes of the training that
I would receive.” (A9).
“I thought about it when I was in high school. There was a training session on speed reading. My
reading speed was not so slow at those times. However, I still thought that I needed to improve it.
However, I did not receive any training on that. Now I am thing about it. Why not?” (A16).
“I am not thinking about participating anything paid. I would participate in any seminar or congress
if they are on education if they teach me how to read fast, how I can be more beneficial to my
students, advantages and disadvantages. If I believe that they would be beneficial upon such briefing,
I can receive such training, but they should be free of charge, you know we are students.” (A19).
Those who said “I did not participate; I do not think I will participate” expressed their opinion as:
“I have never thought about any activity. I can improve myself reading more.” (A4).
“Speed reading is a need for me, not a target. I do not feel any need to participate in such activities as
I read for fun.” (A24).
The pre-service teachers did not participate in activities related to speed reading and do not think to
participate.
Need for Speed Reading
Table 4. Opinions of pre-service teachers regarding speed reading
Codes f (84)
Yes, I feel it is a need. 67
No, I do not think it is a need. 12
I am neutral. 2
Partly. 2
Sometimes. 1

IOJPE
ISSN: 1300 – 915X
www.iojpe.org
International Online Journal of Primary Education 2021, volume 10, issue 1
Copyright © International Online Journal of Primary Education 199
When Table 4 was examined, pre-service Turkish teachers (n=67) consider speed reading necessary.
Some do not consider speed reading necessary (n=12). Some are neutral about the need for speed
reading, those who partly or sometimes consider it as a need. Those who said “Yes, I consider it as a
need" expressed their opinion as:
“I think speed reading is necessary for every individual. I want to be able to read fast especially in
important exams to save time.” (A5).
“Maybe, this outcome will contribute positively to me. In the exam, I can be faster especially in
paragraph type questions and have an advantage over others. Thus, I have a chance to go back to the
unanswered questions." (A67).
“I certainly consider it is a need. We use reading skill in every aspect of our life. As we, as teachers,
will be responsible for helping our students gain these skills, we are supposed to have such skills first.
We save more time in this way.” (A23).
“Speed reading is a need in today's conditions because there is too much information that we need to
learn and there are many books to read. Due to the other responsibilities that we are supposed to
fulfil, speed reading techniques may facilitate our task.” (A80).
“Yes, I consider. Because I think that there are many things that I do not know about speed reading
techniques. It helps me be more conscious. I can teach my students when I become a teacher.” (A13).
“It is not an urgent need actually, but it is a need which may be beneficial to everyone as it is to me.
Speed reading is a habit which may help me gain psychomotor skills. It is also helpful in improving
thinking skills” (A16).
Those who said “No, I do not consider it is a need” expressed their opinions as:
“No. I can read as fast as I need. I do not need more than that. Speed reading is not important but the
quality of reading and understanding what you read is.” (A24).
“I think it will open new doors to my personal development rather than being need.” (A31).
“Speed reading is not a need. But it may be beneficial in personal development by saving time.”
(A58).
Those who said “partly” expressed their opinions as:
“Partly. I spend too much time reading. I do not have so much time. But I have no concern about
reading and finishing a book very quickly. I have fun reading both novel and history book. The time
that I spend is very valuable.” (A14).
“Speed reading helps us in exams. Except for exams, I consider it is better to read slowly and
understand what you read rather than speed reading.” (A79).
When the opinions of the teacher candidates were examined, it was stated that the pre-service teachers
saw speed reading as a need.
Text Reading Processes
Table 5. Opinions of pre-service Turkish teachers regarding long texts which need to be read in a
very short time
Codes f (83)
Yes, it bores. 52
No, it does not bore. 13
It bores sometimes. 18
When Table 5 was examined, it is seen that some think that "texts, articles, books, etc., which they are
too long to read and need to be read in a short time are boring” (n=52); those who do not think that
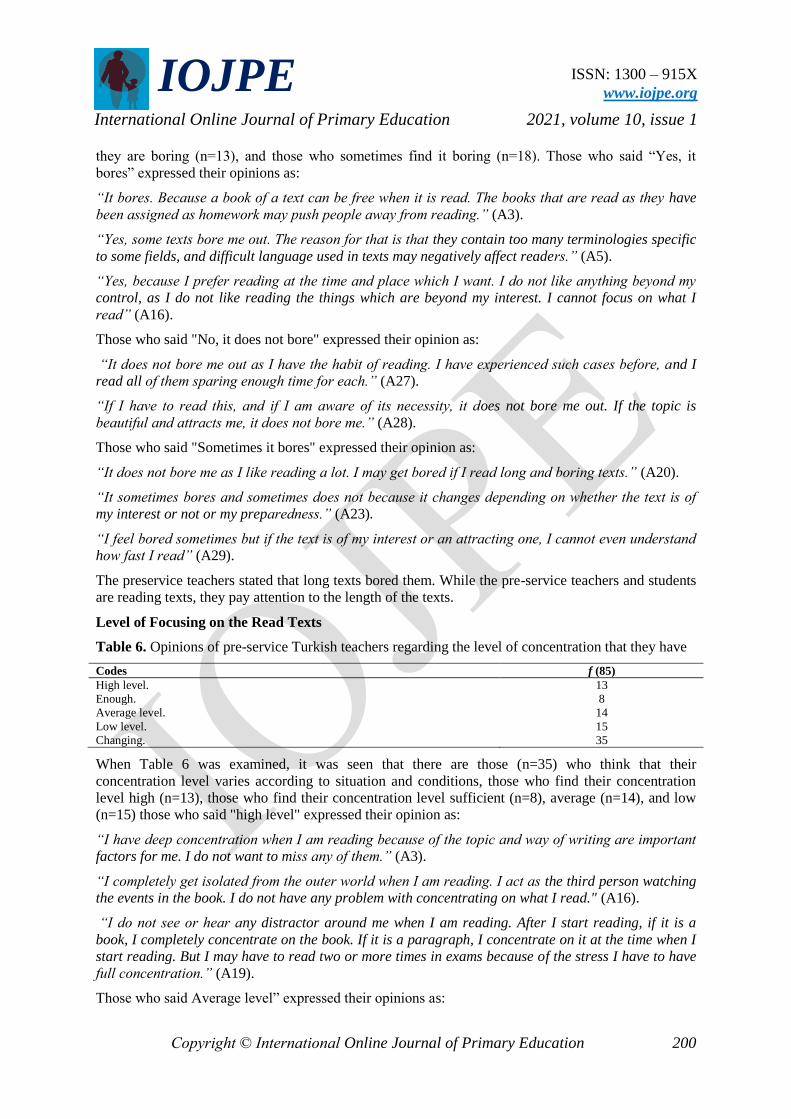
IOJPE
ISSN: 1300 – 915X
www.iojpe.org
International Online Journal of Primary Education 2021, volume 10, issue 1
Copyright © International Online Journal of Primary Education 200
they are boring (n=13), and those who sometimes find it boring (n=18). Those who said “Yes, it
bores” expressed their opinions as:
“It bores. Because a book of a text can be free when it is read. The books that are read as they have
been assigned as homework may push people away from reading.” (A3).
“Yes, some texts bore me out. The reason for that is that they contain too many terminologies specific
to some fields, and difficult language used in texts may negatively affect readers.” (A5).
“Yes, because I prefer reading at the time and place which I want. I do not like anything beyond my
control, as I do not like reading the things which are beyond my interest. I cannot focus on what I
read” (A16).
Those who said "No, it does not bore" expressed their opinion as:
“It does not bore me out as I have the habit of reading. I have experienced such cases before, and I
read all of them sparing enough time for each.” (A27).
“If I have to read this, and if I am aware of its necessity, it does not bore me out. If the topic is
beautiful and attracts me, it does not bore me.” (A28).
Those who said "Sometimes it bores" expressed their opinion as:
“It does not bore me as I like reading a lot. I may get bored if I read long and boring texts.” (A20).
“It sometimes bores and sometimes does not because it changes depending on whether the text is of
my interest or not or my preparedness.” (A23).
“I feel bored sometimes but if the text is of my interest or an attracting one, I cannot even understand
how fast I read” (A29).
The preservice teachers stated that long texts bored them. While the pre-service teachers and students
are reading texts, they pay attention to the length of the texts.
Level of Focusing on the Read Texts
Table 6. Opinions of pre-service Turkish teachers regarding the level of concentration that they have
Codes f (85)
High level. 13
Enough. 8
Average level. 14
Low level. 15
Changing. 35
When Table 6 was examined, it was seen that there are those (n=35) who think that their
concentration level varies according to situation and conditions, those who find their concentration
level high (n=13), those who find their concentration level sufficient (n=8), average (n=14), and low
(n=15) those who said "high level" expressed their opinion as:
“I have deep concentration when I am reading because of the topic and way of writing are important
factors for me. I do not want to miss any of them.” (A3).
“I completely get isolated from the outer world when I am reading. I act as the third person watching
the events in the book. I do not have any problem with concentrating on what I read." (A16).
“I do not see or hear any distractor around me when I am reading. After I start reading, if it is a
book, I completely concentrate on the book. If it is a paragraph, I concentrate on it at the time when I
start reading. But I may have to read two or more times in exams because of the stress I have to have
full concentration.” (A19).
Those who said Average level” expressed their opinions as:
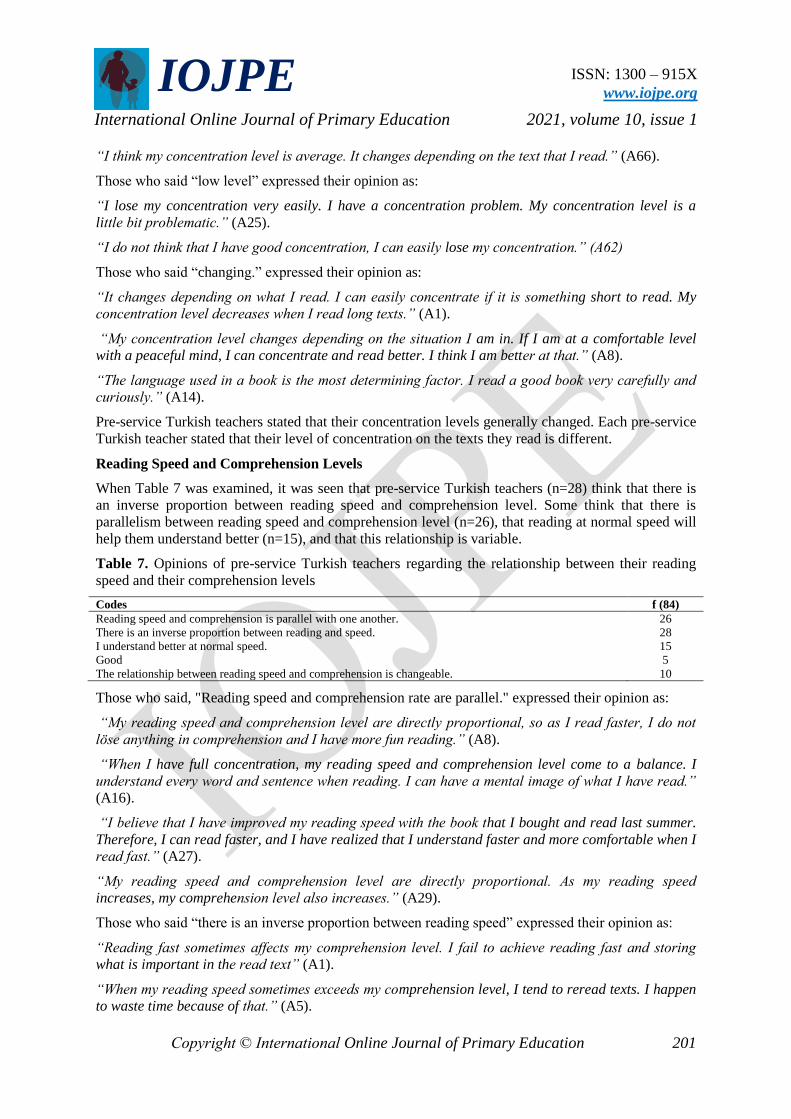
IOJPE
ISSN: 1300 – 915X
www.iojpe.org
International Online Journal of Primary Education 2021, volume 10, issue 1
Copyright © International Online Journal of Primary Education 201
“I think my concentration level is average. It changes depending on the text that I read.” (A66).
Those who said “low level” expressed their opinion as:
“I lose my concentration very easily. I have a concentration problem. My concentration level is a
little bit problematic.” (A25).
“I do not think that I have good concentration, I can easily lose my concentration.” (A62)
Those who said “changing.” expressed their opinion as:
“It changes depending on what I read. I can easily concentrate if it is something short to read. My
concentration level decreases when I read long texts.” (A1).
“My concentration level changes depending on the situation I am in. If I am at a comfortable level
with a peaceful mind, I can concentrate and read better. I think I am better at that.” (A8).
“The language used in a book is the most determining factor. I read a good book very carefully and
curiously.” (A14).
Pre-service Turkish teachers stated that their concentration levels generally changed. Each pre-service
Turkish teacher stated that their level of concentration on the texts they read is different.
Reading Speed and Comprehension Levels
When Table 7 was examined, it was seen that pre-service Turkish teachers (n=28) think that there is
an inverse proportion between reading speed and comprehension level. Some think that there is
parallelism between reading speed and comprehension level (n=26), that reading at normal speed will
help them understand better (n=15), and that this relationship is variable.
Table 7. Opinions of pre-service Turkish teachers regarding the relationship between their reading
speed and their comprehension levels
Codes f (84)
Reading speed and comprehension is parallel with one another. 26
There is an inverse proportion between reading and speed. 28
I understand better at normal speed. 15
Good 5
The relationship between reading speed and comprehension is changeable. 10
Those who said, "Reading speed and comprehension rate are parallel." expressed their opinion as:
“My reading speed and comprehension level are directly proportional, so as I read faster, I do not
löse anything in comprehension and I have more fun reading.” (A8).
“When I have full concentration, my reading speed and comprehension level come to a balance. I
understand every word and sentence when reading. I can have a mental image of what I have read.”
(A16).
“I believe that I have improved my reading speed with the book that I bought and read last summer.
Therefore, I can read faster, and I have realized that I understand faster and more comfortable when I
read fast.” (A27).
“My reading speed and comprehension level are directly proportional. As my reading speed
increases, my comprehension level also increases.” (A29).
Those who said “there is an inverse proportion between reading speed” expressed their opinion as:
“Reading fast sometimes affects my comprehension level. I fail to achieve reading fast and storing
what is important in the read text” (A1).
“When my reading speed sometimes exceeds my comprehension level, I tend to reread texts. I happen
to waste time because of that.” (A5).

IOJPE
ISSN: 1300 – 915X
www.iojpe.org
International Online Journal of Primary Education 2021, volume 10, issue 1
Copyright © International Online Journal of Primary Education 202
Those who said "I understand well at normal speed" expressed their opinion as:
“Without reading fast, I can understand words and sentences, paragraphs in the first reading. This is
closely related to how interesting the text is. I think I can read a hundred-page book in one hour or 80
minutes.” (A19).
“I start to ruminate if I read slowly. I go back and reread, which causes a waste of time. If I read very
fast, I cannot fully understand the content. I feel that I can fully understand what I read when I read at
an average speed.” (A46).
Those who said the relationship between reading speed and comprehension is changeable” expressed
their opinion as:
“When I concentrate on the text that I am reading, I can both read fast and understand what I am
reading. If I ski through a text which is not of my interest as my perception level decreases.” (A2).
“If the topic and content are very interesting, my reading and comprehension level increase.” (A14).
Pre-service teachers have different opinions about reading speed and comprehension rate. They stated
that the relationship between speed and comprehension rate varies. They think they will understand
when they read fast.
Advantages of Speed Reading
Table 8. Views of pre-service Turkish teachers regarding the advantages of speed reading
Codes f (152)
I read more books. 31
My performance in exams increase. 30
It helps save time. 29
My comprehension level increases. 10
It is beneficial. 9
It helps my personal development. 4
My speaking ability improves. 4
It provides Professional advantage and it is a necessity. 4
It provides an advantage. 3
I feel bored less when I am reading. 2
It improves my communication skills. 2
My vocabulary treasure improves. 2
My point of view is developed. 2
My imagination power improves. 2
I can think practically and make up my mind very quickly. 2
My interest in reading increases/my reading speeds up 2
I can find the answers very practically. 1
It helps me think fast. 1
It increases my life quality. 1
It facilitates my life. 1
It improves my thinking skill. 1
My achievement increases in many fields. 1
The joy I have from reading increases and become more intellectual. 1
MY reading skills improve. 1
My comprehension skill improves. 1
I can study more. 1
My reading skill improves. 1
I can read the homework, article etc. better faster. 1
I feel better. 1
My self-confidence increases. 1
When Table 8 was examined, pre-service Turkish teachers (n=31) think that speed reading will bring
the advantage of more book reading. Some think that speed reading will improve their exam
performance (n=30), save their time (n=29), increase their level of comprehension (n=10), be useful
(N=9).

IOJPE
ISSN: 1300 – 915X
www.iojpe.org
International Online Journal of Primary Education 2021, volume 10, issue 1
Copyright © International Online Journal of Primary Education 203
The opinions of pre-service teachers regarding this issue are as follows:
“If I read fast, I feel more motivated to read more and I also save time. Speed reading provides me
with many advantages. In brief, it makes life easier. Of course, it is a necessity of my profession.”
(A1).
“I believe that it will bring any contributions in the short term and long term. I believe that it will
contribute to my exam performance positively.” (A7).
“Reading fast and understanding what you read brings many advantages for readers. The increase in
comprehension level, thinking very practical quick decision making etc. contribute to us in many
ways.” (A8).
“It saves time. It improves thinking skill. It supports imagination power. It helps gain reading habit.
All of this help teach both students and their parents as part of our profession.” (A16).
“We will take the KPSS exam very soon. The faster we read questions in the exam and the better we
understand them, the more beneficial they will be. In addition to these, there are many books and texts
that we need to read as tur Turkish teachers of the future. Speed reading will help us to accomplish
all these.” (A18).
“It will help me overcome the stress resulted from the KPSS exam and time management in the exam.
In the long run, it helps me speed up my reading and helping more students get informed about speed
reading, reading books and articles.” (A23).
The preservice teachers stated that fast reading has many advantages. They stated that they can be
successful both in their lessons and in their private lives thanks to these advantages.
DISCUSSION and CONCLUSION
Speed reading is a skill of training. For the sake of being a fast reader, it is not desirable to increase
reading speed superficially (Güneş, 2009: 11). The pre-service teachers who participated in the
research stated that they considered themselves enough in speed reading. They state that they have
lost their ability to read fast in the environments such as noise, distraction and stress while skimming
through the texts with many words with their eyes and solving the paragraph questions. In an
overview of the research results (Karadağ, Keskin & Arı, 2019; Bergmann & Bristle, 2020), it is seen
once again that the reading rate and accurate word recognition are critical for a qualified skill of
reading/comprehension. Speed develops more quickly in the training of speed-reading techniques, and
comprehension follows it. Speed reading exercises should be performed for at least twenty-one days
for comprehension to take place and the speed to settle permanently. Harris and Sipay (1990), who
think that speed reading can be taught, state that for this, we must know some of the characteristics of
the student population that we have.
Pre-service teachers who consider themselves good reader claim that they do not give break while
reading, and they prefer to qualify works, write long articles on different subjects. Pre-service teachers
have stated that they do not receive professional support for speed reading, that vocabulary is
important in speed reading, and that they are considering taking special courses on the issue. Some
pre-service teachers state that everything in their lives is fast, and reading does not need to be so fast.
According to Dökmen (1994), the reading speed of high school students was determined to be 136.4
words per minute and the reading speed of university students was found to be 145.4 words per
minute. The findings of researches (Akçamete, 1989; Coşkun, 2002; Babayiğit, 2019; Bergmann &
Bristle, 2020; Durukan, 2020) revealed that the text type was effective at the reading speed and
comprehension level of the students. Bozan (2012) and Bergmann & Bristle (2020) stated that the
reading speed and reading comprehension levels of the students involved in the study were found to
be low and that there was a great need for further studies on this subject.

IOJPE
ISSN: 1300 – 915X
www.iojpe.org
International Online Journal of Primary Education 2021, volume 10, issue 1
Copyright © International Online Journal of Primary Education 204
Pre-service teachers think that speed reading is a need to be able to take exams more quickly and
become better equipped for their profession. Students preparing for exams, people who must follow
the printed press, professionals who want to improve themselves, especially teachers, anyone who is
anxious to manage time more efficiently, who competes with time, can participate in speed reading
training. It is possible for students who often take exams to succeed in exams using their time
allocated for each question appropriately (Gündüz & Şimşek 2011; Ilter, 2018; Mergen, 2019; Muñoz,
Vejarano & Vargas, 2019). Pre-service teachers state that they read more books thanks to speed
reading, their exam performance increases, they save time, and their comprehension levels increase.
Pre-service Turkish teachers feel that they get bored when they must read too long texts, too tick
books and too long articles. They claim that nobody can be forced to read, some texts have a difficult
language, so they cannot read fast, and they can't concentrate on the texts they read. They state the
most important reason for their inability to concentrate on the texts they read as a distraction. In a
research conducted by Kemiksiz (2019) and Astari (2019), pre-service teachers with positive
perceptions of speed reading emphasized the facilitative role of speed reading in one's life and stated
that those who use this skill can improve themselves and compete with other people through this
development.
As a result, speed reading is a skill training. Speed reading techniques can be applied to improve
reading speed and readers’ comprehension rate. Many of the pre-service Turkish teachers who find
their reading speed enough or who do not find it enough also see speed reading as a need. A few of
the participants stated that they had a high concentration level when reading. Participants claimed that
speed reading would improve their exam performance, save time, and benefit from professional and
personal development.
Many pre-service Turkish teachers who find their reading speed enough compare themselves to their
surroundings. What makes them feel they are enough or fast is they are reading faster or more books
than those around them. They use a subjective criterion by evaluating in this way. However, there are
no clear values or objective criteria for reading speeds.
Some pre-service Turkish teachers who previously received training on speed reading and those who
did not are also in doubt about the realization of speed reading and how useful it will be. Some of
them think, “I read for pleasure, speed reading is unnecessary”, while others think, “I already read
regularly, so I can increase my reading speed by reading more." However, research shows that reading
speed will be increased by 30% by reading more. Speed reading techniques can increase their speed at
least twice, while those who receive good training on these techniques and work to improve their
skills increase their reading speed more than twice or even 1000 words per minute.
Many pre-service Turkish teachers who find their reading speed enough or who do not find it enough
also see speed reading as a need. Very few of the participants stated that they had a high concentration
level when reading. Participants say that speed reading will improve their exam performance, save
time, read more books, and benefit from their professional and personal development.
Pre-service Turkish teacher stated that they did not receive speed reading training at the university.
Education about speed reading should be given in teacher training. Experimental studies about speed
reading should be done. It should be noted that the texts in Turkish textbooks should not be too long.
REFERENCES
Akçamete, G. (1989) Üniversite öğrencilerinin okumalarının değerlendirilmesi [Evaluation of university students' reading].
Ankara University Journal of Educational Sciences, 22(2), 735-753. https://doi.org/10.1501/Egifak_0000001416
Akçamete, G., & Güneş, F. (1992). Üniversite öğrencilerinde etkili ve hızlı okumanın geliştirilmesi [Improving effective and
fast reading among university students]. Ankara University Journal of Educational Sciences, 25(2), 463-471.
https://doi.org/10.1501/Egifak_0000000597
Akyol, H. (2007). Reading. A. Kırkkılıç and H. Akyol (Ed.). In Turkish teaching in primary education. Ankara: PegemA
Publishing.

IOJPE
ISSN: 1300 – 915X
www.iojpe.org
International Online Journal of Primary Education 2021, volume 10, issue 1
Copyright © International Online Journal of Primary Education 205
Arıcı, A. F. (2012). Reading education Ankara: PegemA Publishing.
Astari, N. W. A. (2019). Pengaruh model pembelajaran directed reading thinking activity (DRTA) terhadap keterampilan
membaca cepat siswa. Journal of Education Technology, 3(2), 119-125. https://doi.org/10.33330/icossit.v1i1.750
Ateş, S., Güray, E., Döğmeci, Y., & Gürsoy, F. F. (2016). Öğretmen ve öğrenci sorularının gerektirdikleri zihinsel süreçler
açısından karşılaştırılması [Comparison of questions of teachers and students in terms of level]. Research in Reading
& Writin Instruction (RRWI), 4(1), 1-13.
Avcıoğlu, H. (2000). İlköğretim ikinci kademe öğrencilerinin okuma becerilerinin değerlendirilmesi [Evaluation of primary
school second grade students' reading skills]. Education and Science, 25(115), 10-17.
Babayiğit, Ö. (2019). Yarıyıl tatili öncesinde ve sonrasında ilkokul öğrencilerinin sesli okuma hızlarının karşılaştırmalı
olarak incelenmesi [Investigation of the reading speeds of primary school students before and after the half term].
Ordu University Journal of Social Science Research, 9(2), 327-334
Bergmann, M., & Bristle, J. (2020). Reading fast, reading slow: The effect of interviewers’ speed in reading introductory
texts on response behaviour. Journal of Survey Statistics and Methodology, 8(2), 325-351,
https://doi.org/10.1093/jssam/smy027
Bozan, A. (2012). Hızlı okuma eğitiminin 10. sınıf öğrencilerinin okuma hızlarına ve anlama düzeylerine etkisi [The effect
of rapid reading education on reading speed and levels of understanding of 10th grade students] (Unpublished master
thesis). Çanakkale Onsekiz Mart University, Çanakkale.
Brooks, T. D. (1936). Okumanın tatbik edilmiş psikolojisi [The applied psychology of reading] (Trans. R. İ. Kolçak).
İstanbul: Şirketi Mürebbiye Publishing.
Buzan, T. (2005). Hızlı okuma [Speed Reading]. İstanbul: Alfa Publishing.
Büyüköztürk Ş., Çakmak K. E., Akgün E. Ö., Karadeniz Ş., & Demirel F. (2014). Bilimsel araştırma yöntemleri [Scientific
research methods] (18th Edition). Ankara: PegemA Publishing.
Coşkun, E. (2002). Lise hızlı okuma teknikleri öğretim programı ve uygulamalarının değerlendirilmesi [Evaluation of high
school speed reading techniques curriculum and applications]. Eurasian Journal of Educational Research, 3(9),
41-51.
Coşkun, E. (2003). Çeşitli değişkenlere göre lise öğrencilerinin etkili okuma becerileri ve bazı öneriler [Effective reading
skills of high school students according to various variables and some suggestions]. Journal of Turkology Research,
13, 101-130.
Çelik, E. C. (2019). İlköğretimde Türkçe ve öğretimi dersinde sınıf içi okuma çalışmaları [Turkish and teaching in primary
educationin-class reading studies]. The Journal of Internaitonal Social Research, 12(67), 668-676.
http://dx.doi.org/10.17719/jisr.2019.3755
Çiftçibaşı, M. C. (2013). Effects of speed reading techniques on sight reading skills in music education. (Unpublished
doctoral thesis). Mehmet Akif Ersoy University Institute of Educational Sciences, Burdur.
Dedebali, N. C. (2008). Hızlı okuma tekniğinin 8. sınıf öğrencilerinin okuma hızlarına ve okuduğunu anlama düzeylerine
etkisi [The effects of rapid reading technique on the eighth graders? reading speed and levels of reading
comprehension]. (Unpublished master thesis). Adnan Menderes University, Aydın.
Dedebali, N. C., & Saracaloğlu, A. S. (2010). Hızlı okuma tekniğinin sekizinci sınıf öğrencilerinin okuma hızlarına ve
okuduğunu anlama düzeylerine etkisi [The effects of rapid reading technique on the eighth graders’reading speed and
levels of reading comprehension]. Pamukkale University Journal of Education, 27(27), 171-183.
Dökmen, Ü. (1994). Okuma becerisi, ilgisi ve alışkanlığı üzerine psiko-sosyal bir araştırma [A psycho-social research on
reading skills, interests and habits]. İstanbul: MEB. Publishing.
Durukan, E. (2020). Impact of speed reading training on reading speeds and comprehension skills of secondary school
students. Cypriot Journal of Educational Science,15(2), 184-193. https://doi.org/10.18844/cjes.v15i2.4491
Gündüz, O., & Şimşek, T. (2011). Anlama teknikleri 1 uygulamalı okuma eğitimi el kitabı [Comprehension techniques 1
handbook of practical reading instruction]. Ankara: Grafiker Publishing.
Güneş, F. (2000). Uygulamalı okuma-yazma öğretimi [Practical teaching of reading and writing]. Ankara: Ocak Publishing.
Güneş, F. (2009). Hızlı okuma ve anlamı yapılandırma [Reading fast and structuring meaning]. Ankara: Nobel Publishing.
Harris, A. J., & Sipay, E. R. (1990). How to increase reading ability: A guide to developmental & remedial methods (9th
Edition). London: Longman Publishing.

IOJPE
ISSN: 1300 – 915X
www.iojpe.org
International Online Journal of Primary Education 2021, volume 10, issue 1
Copyright © International Online Journal of Primary Education 206
İlter, B. (2018). Hızlı okuma teknikleri eğitiminin 5. sınıf öğrencilerinin okuma hızlarına ve anlama düzeylerine etkisi [The
effects of rapid reading techniques on the fifth graders' reading speed and levels of reading comprehension].
(Unpublished master thesis). Çanakkale Onsekiz Mart University, Çanakkale.
Kaçar, K. (2015). The effect of speed reading training on secondary school 7th graders' reading comprehension skills and
attitudes on reading. (Unpublished master thesis). Fırat University Institute of Educational Sciences, Elazığ.
Karadağ, Ö., Keskin, H. K., & Arı, G. (2019). Mediatory effect of reading skill in the rapid automatized naming/reading
comprehension relationship. Education and Science, 44(197). 353-366. http://dx.doi.org/10.15390/EB.2019.7684
Kavcar, C., Oğuzkan, F., & Sever, S. (1995). Türkçe ve sınıf öğretmenleri için Türkçe öğretimi [Teaching Turkish for
Turkish and classroom teachers]. Ankara: Engin Publishing.
Kemiksiz, Ö. (2019). Metaphor perceptions of pre-service Turkish teachers towards "speed reading" skills. Journal of Social
Sciences of Mus Alparslan University, 7(1) 71-84. https://doi.org/10.18506/anemon.410178
Maviş, A. (2006). Anlayarak hızlı okuma ve öğrenme teknikleri [Understanding speed reading and learning techniques].
İstanbul: Hayat Publishing.
Mergen, S. (2019). The effect of speed reading technique on reading speeds and reading comprehension levels of second
grade students. (Unpublished master thesis). Akdeniz University, Antalya, Turkey.
Merriam, S. B. (2013). A guide to qualitative research design and practice (Trans. Ed. S. Turan). Ankara: Nobel Publishing.
Muñoz, L., Vejarano, L., & Vargas, L. (2019, October). ICT-based, fast-reading learning. In 2019 International Conference
on Inclusive Technologies and Education (CONTIE) (pp. 174-1745). IEEE.
Özdemir, Y. & Kıroğlu, K. (2019). Okuduğunu anlama becerilerinin gelişimine uzamsal bir bakış [Developing reading
comprehension skills a longitudinal view]. Amasya Education Journal, 8(1), 85-124.
Richadeau, F., Gauquelin, M., & Gauquelin F. (1990). Very fast reading techniques (Trans. A. Sarp). Ankara: Nil
Publishing.
Ruşen, M. (2006) Hızlı okuma [Fast reading]. İstanbul: Alfa Publishing.
Soysal, T. (2015). The effects of rapid reading techniques on the fifth graders' reading speed and comprehension levels
(Unpublished master thesis). Abant İzzet Baysal University Institute of Educational Sciences, Bolu.
Tazebay, A. (1995). The effect of third fourth graders' reading skill on their comprehension. (Unpublished doctoral thesis).
Hacettepe University, Institute of Social Sciences, Ankara.
Tazebay, A. (1997). İlkokul öğrencilerinin okuma becerilerinin okuduğunu anlamaya etkisi [The effect of primary school
students' reading skills on reading comprehension]. Ankara: MEB Publishing.
Torppa, M., Vasalampi, K., Eklund, K., Sulkunen, S., & Niemi, P. (2020). Reading comprehension difficulty is often distinct
from difficulty in reading fluency and accompanied with problems in motivation and school wellbeing. Educational
Psychology, 40(1), 62–81. doi:10.1080/01443410.2019.1670334
Yurdakal, H. İ. (2019). Investigation of the 4th grade primary school students' attitudes towards reading in the scope of
different variables. World Journal of Education, 9(3), 46-52. https://doi.org/10.5430/wje.v9n3p46
Westbrook, J., Sutherland, J., Oakhill, J., & Sullivan, S. (2018). ‘Just reading’: The impact of a faster pace of reading
narratives on the comprehension of poorer adolescent readers in English classrooms. Literacy, 53(2), 60-68.
https://doi.org/10.1111/lit.12141
IOJPE
ISSN: 1300 – 915X
www.iojpe.org
International Online Journal of Primary Education 2021, volume 10, issue 1
Copyright © International Online Journal of Primary Education 207
EXAMINATION OF THE EFFECTIVENESS OF NATURALISTIC
TEACHING EDUCATION PROGRAM DEVELOPED FOR
PRE-SCHOOL TEACHERS IN TURKEY
Seçil ÇELİK
Dr., Anadolu University, Faculty of Education, Department of Special Education, Eskişehir, Turkey
ORCID: https://orcid.org/0000-0002-1393-3382
İbrahim Halil DİKEN
Prof.Dr., Anadolu University, Faculty of Education, Department of Special Education, Eskişehir, Turkey
ORCID: https://orcid.org/0000-0002-5761-2900
Hasan GÜRGÜR
Prof.Dr., Anadolu University, Faculty of Education, Department of Special Education, Eskişehir, Turkey
ORCID: https://orcid.org/0000-0002-4016-4048
Received: September 17, 2020 Accepted: January 11, 2021 Published: June 30, 2021
Suggested Citation:
Çelik, S., Diken, İ. H., & Gürgür, H. (2021). Examination of the effectiveness of naturalistic teaching education program
developed for pre-school teachers in Turkey. International Online Journal of Primary Education (IOJPE), 10(1), 207-234.
This is an open access article under the CC BY 4.0 license.
Abstract
In the current study, face-to-face and web-based naturalistic teaching teacher education program for pre-school teachers
(NTEPP), who are among the main stakeholders of inclusive education, was developed and examined its effectiveness on
teacher outcomes (naturalistic teaching knowledge level, interactional behavior levels, and level of using naturalistic
teaching strategies in the education processes). In addition, opinions the targeted teachers on the programs were gathered. A
total of 30 teachers in the Face-to-Face (Experimental-1=14) and Web-based (Experimental-2=16) NTEPP groups
participated in the study, which was designed with the "embedded design, one of the mixed research methods." In the study,
face-to-face and web-based programs were found to be effective in increasing teachers' total scores for naturalistic teaching
knowledge, interactional behaviors, and naturalistic teaching strategies used in leisure time and art activities. However, the
results revealed that the face-to-face education program had a more permanent effect on the total scores for naturalistic
teaching knowledge and naturalistic teaching strategies used in leisure time activities compared to the web-based program.
Accordingly, it was determined that web-based programs, the contents of which were designed with visual and written
materials, could be as effective as face-to-face programs on teachers' targeted performance levels. Finally, it was observed
that teachers' opinions on the programs were quite positive.
Keywords: Inclusive education, inclusive pre-school education, naturalistic teaching approach, professional development.
INTRODUCTION
Naturalistic teaching is defined as an approach/process in which teaching is embedded in the natural
daily lives of children (e.g., daily routine, activities and transitions for school and home settings;
Charlop-Christy, LeBlanc, and Carpenter, 1999; Halle, Albert, and Anderson, 1984; Koegel, O’Dell,
and Koegel, 1987). This approach is an “evidence-based” practice and is based on “developmentally
appropriate principles” (National Professional Development Center [NPDC], 2014; National Autism
Center [NAC], 2015). This approach has increasingly become important in inclusive pre-school
education in recent years in that it can be easily implemented without disrupting the education
process, includes appropriate principles for child development, and ensures the easy reinforcement
and generalization of skills and behaviors (Allen & Cowan, 2008; Dunst, Raab, & Trivette, 2011;
McWilliam, 2016; Rakap, 2019; Rakap & Parlak-Rakap, 2011). According to the results of studies,
the lack of knowledge and education of teachers is among the main systemic problems experienced in
the inclusive pre-school education and that the naturalistic teaching approach is among the key issues

IOJPE
ISSN: 1300 – 915X
www.iojpe.org
International Online Journal of Primary Education 2021, volume 10, issue 1
Copyright © International Online Journal of Primary Education 208
on which knowledge and education are needed (Bruder, 2016; Sucuoğlu, Bakkaloğlu, İşçen-Karasu,
Demir, & Akalın, 2013). Therefore, especially in recent years, in order to eliminate their lack of
knowledge and education in the process, researchers aimed to develop programs including the
teaching of evidence-based practices such as naturalistic teaching to pre-school teachers in inclusive
education (Aldemir, 2017; Dick, 2017; Rakap, 2019; Storie, Grygas-Coogle, Rahn, & Riggie-Ottley,
2017; Ünal, 2018).
In recent years, it has begun to be discussed which components and presentation forms should and to
what the content of teacher education programs should be prepared (Bruder, 2016). In fact, “face-to-
face” education programs that were called as traditional methods in the early years have been replaced
by different forms of presentation such as "web-based programs". In addition, education programs
have turned into "multi-component" programs supported by several ways such as coaching,
counseling, and providing feedback on performance (Aldemir, 2017; Dick, 2017; Gianoumis,
Seiverling, & Sturmey, 2012; Harjusola-Webb, & Hess Robbins, 2012; Pianta, Mashburn, Downer,
Hamre, & Justice, 2008; Tate, Thompson, & McKerchar, 2005; Ünal, 2018). In this context,
web-based programs, which are independent of time and space, can be followed individually and can
spread all over the countries, have increasingly gained momentum (Storie et al., 2017; Ünal, 2018).
Moreover, “web-based education programs,” an alternative education approach, have been becoming
more important since the education and training process is being conducted at home due to the
COVID-19 pandemic, and in such cases that may occur later. At this point, the contents of these
programs designed in different ways have also started to be supported with many different visual and
written materials (Dick, 2017; Harjusola et al., 2012; Rakap, 2019). Furthermore, although the effects
of these programs designed with different forms of presentation and various materials on targeted
teacher behaviors have been compared in recent studies, which practices are more "maintened",
"efficient" and "useful/functional" has started to be discussed (e.g., Dick, 2017; Frantz, 2017; Rakap,
2019; Stahmer, Rieth, Lee, Reisinger, Mandell, & Connell, 2015; Ünal, 2018). However, both in the
international literature and Turkish literature, there is no study in which natural teaching strategies,
methods and techniques were used as a “package teacher training program” with guidebooks, expert
and sample application videos, and the effect of this package program has been examined.
Furthermore, there is no study compare the effectiveness and maintenance of the naturalistic teaching
teacher education program which was developed with two different presentation styles (face-to-face
and web-based), with the data obtained from many quantitative and qualitative data collection
procedures. Such a study can be a guide for how pre-school teachers in inclusive education will be
able to improve their professional skills with regard to evidence-based practices such as naturalistic
teaching in the best way. In addition, this study may contribute to the development of quality proceses
in inclusive pre-school education institutions. The aim of the current study was to develop to evaluate
the effectiveness of a "Face-to-Face and Web-based Pre-School Naturalistic Teaching Teacher
Education Program (NTEPP)" for pre-school teachers in inclusive education in Turkey. In line with
this aim, answers to the following research questions were sought:
1. What are the opinions of pre-school teachers regarding their knowledge and experience in
inclusive education and the naturalistic teaching process?
2. Is there a significant difference between the total scores for naturalistic teaching knowledge of
pre-school teachers in inclusive education, who participated in the Face-to-Face NTEPP
(Experimental-1 group) and Web-based NTEPP (Experimental-2 group), in the pre-test, post-
test and follow-up measurements in-group and between-group?
3. Is there a significant difference between the total scores for interactional behaviors of
pre-school teachers in inclusive education, who participated in the Face-to-Face NTEPP
(Experimental-1 group) and Web-based NTEPP (Experimental-2 group), in the pre-test, post-
test and follow-up measurements in-group and between-group?
4. Is there a significant difference between the total scores for naturalistic teaching strategies
used in the classrooms of pre-school teachers in inclusive education, who participated in the

IOJPE
ISSN: 1300 – 915X
www.iojpe.org
International Online Journal of Primary Education 2021, volume 10, issue 1
Copyright © International Online Journal of Primary Education 209
Face-to-Face NTEPP (Experimental-1 group) and Web-based NTEPP (Experimental-2
group), in the pre-test, post-test and follow-up measurements in-group and between-group?
5. What are the opinions of pre-school teachers in inclusive education about the NTEPP (social
validity) offered in two different ways: face-to-face and web-based?
METHOD
Research Design
This study was designed with the "embedded design, one of the mixed research methods." This study
was based on a quasi-experimental process. The qualitative data collection techniques were embedded
in this process to support and diversify quantitative data (e.g., focus group interviews), and thus, multi
quantitative and qualitative data were collected simultaneously in the process. The formulized
expression of the research method is Quantitive (+qualititative) (Cresswell, 2011; 2014; Morse, 1991).
The embedded design scheme of the study is presented in Figure 1.
Figure 1. The embedded design scheme of the study (adapted to study from Creswell, 2011, p. 541.)
The research process, the visual of which is presented in Figure 1, can be summarized as follows:
Focus group interviews were conducted with the participants before and after the implementation of
the education programs. In the pre-implementation interviews, the prior knowledge, opinions and
experiences of the participants regarding inclusive education and naturalistic teaching practices were
determined, and the need for education programs was revealed. In the post-implementation
interviews, experience, opinions, suggestions regarding the completed education programs were
received; thus, social validity data were also obtained. Simultaneously with this process, the
participants' naturalistic teaching knowledge levels were measured with NTP-KT in three different
measurements consisting of pre-test, post-test and follow-up, and the practices they performed in their
classrooms were video-recorded in two different activities, leisure time and art activities. During the
implementation of the programs, data were collected through weekly reflective diaries related to the
participants' experiences on naturalistic teaching practices in the education processes. Furthermore,
quantitative log records were kept for the Web-based NTEPP participants' duration of following the
programs. Moreover, the researcher took field notes and wrote his observations on the whole process.
In the data analysis stage, all quantitative and qualitative data collected were analyzed separately and
integrated in the writing of results.
* Quantitive (+qualititative)

IOJPE
ISSN: 1300 – 915X
www.iojpe.org
International Online Journal of Primary Education 2021, volume 10, issue 1
Copyright © International Online Journal of Primary Education 210
Participants and the Setting
A total of 30 pre-school teachers (Experimental-1=14, Experimental-2=16), who were working in two
independent kindergartens in Eskişehir province in Turkey and were involved in the inclusive
education process, constituted the participants of the study. In the follow-up sessions of the study, one
teacher was appointed to another school within the province. Therefore, follow-up data could not be
collected from one participant. Consequently, the pre-test measurement of the study included 30
individuals, the post-test measurement included 30 individuals, and the follow-up measurement
included 29 individuals.
Table 1a. Descriptive statistics on the demographic characteristics of the participants (ntotal=30)
f: Frequency, %: Percentage values, ASD: Autism Spectrum Disorder, ADHD: Attention Deficit and Hyperactivity Disorder
Group Variables f %
Ex
per
imen
tal-
1 (
Fa
ce-t
o-F
ace
NT
EP
P)
N=
14
Age Group Provided with Education (Mean=4.36, Std.Dev.=.745)
3-4 years 2 14.3
4-5 years 5 35.7
5-6 years 7 50.0
Professional Seniority (Mean=8.57, Std.Dev.=3.251)
4 years 1 7.1
5 years 2 14.3
7 years 2 14.3
8 years 2 14.3
9 years 3 21.4
10 years 1 7.1
11 years 2 14.3
17 years 1 7.1
Inclusive Education Experience (Mean=5.29, Std.Dev.=4.375)
2 years 5 35.7
3 years 1 7.1
4 years 3 21.4
6 years 2 14.3
9 years 1 7.1
11 years 1 7.1
17 years 1 7.1
Number of Students Involved in Inclusive Education
0 student 3 21.4
1 student 8 57.1
2 students 2 14.3
3 students
1 7.1
Diagnoses of Students Involved in Inclusive Education
ASD 8 57.1
Speech and Language Disorder 2 14.3
Visual Disability 1 7.1
Number of Undiagnosed Students with Special Needs
1 student 11 78.6
2 students 3 21.4
Types of Developmental Disabilities in Classrooms
Language and Speech Disorder 10 71.4
ADHD 3 21.4
Disability in Social Skills 1 7.1
Seminars Received
Special Education Seminar 8 57.1
Teaching with Simultaneous Prompting 1 7.1

IOJPE
ISSN: 1300 – 915X
www.iojpe.org
International Online Journal of Primary Education 2021, volume 10, issue 1
Copyright © International Online Journal of Primary Education 211
f: Frequency, %: Percentage values, ASD: Autism Spectrum Disorder, ADHD: Attention Deficit and Hyperactivity Disorder
While determining the participants, prerequisite features were first determined, and then, the Eskişehir
Odunpazarı Counseling and Research Center (CRC) was contacted. Thus, the numbers of independent
kindergartens affiliated to Odunpazarı district in the city center, pre-school teachers working in these
schools, students with special needs and undiagnosed developmental disabilities in inclusive
education were reached. Face-to-face interviews were conducted with kindergarten principals and the
list of schools and teachers volunteering to participate in the study was prepared. The conditions of
voluntary schools such as the numbers of classrooms and students with special needs and undiagnosed
developmental disabilities in inclusive education were evaluated. At the end of the process, two
schools with higher numbers of classrooms and students with special needs and undiagnosed
developmental disabilities in the inclusive education process compared to other schools were selected
Table 1b. Descriptive statistics on the demographic characteristics of the participants (ntotal=30)
Group Variables f %
Ex
per
imen
tal
-2 (
Web
-ba
sed
NT
EP
P)
N=
16
Age Group Provided with Education (Mean=4.19, Std.Dev.=.750)
3-4 years 3 18.8
4-5 years 7 43.8
5-6 years 6 37.5
Professional Seniority (Mean=10.63, Std.Dev.=4.097)
5 years 2 12.5
6 years 2 12.5
8 years 2 12.5
9 years 1 6.3
11 years 2 12.5
12 years 2 12.5
14 years 2 12.5
15 years 1 6.3
16 years 1 6.3
18 years 1 6.3
Inclusive Education Experience (Mean=5.81, Std.Dev.=5.115)
1 year 2 12.5
2 years 6 37.5
5 years 2 12.5
6 years 1 6.3
10 years 2 12.5
13 years 1 6.3
14 years 1 6.3
16 years 1 6.3
Number of Students Involved in Inclusive Education
0 student 7 43.8
1 student 8 50.0
2 students 1 6.3
Diagnoses of Students Involved in Inclusive Education
ASD 4 25.0
Speech and Language Disorder 2 12.5
Mental+Visual Disability 1 6.3
Physical Disability 1 6.3
Cerebral Palsy 1 6.3
Number of Undiagnosed Students with Special Needs
0 student 4 25.0
1 student 8 50.0
2 students 4 25.0
Types of Developmental Disabilities in Classrooms
Speech and Language Disorder 9 56.3
Learning Disability 1 6.3
ADHD 1 6.3
Disability in Social Skills 1 6,3
Seminars Received
Special Education Seminar 9 56.3

IOJPE
ISSN: 1300 – 915X
www.iojpe.org
International Online Journal of Primary Education 2021, volume 10, issue 1
Copyright © International Online Journal of Primary Education 212
to collect a large number of quantitative and qualitative data in a valid and reliable manner. In the
final step, these two schools were randomly assigned to the Experimental-1 and Experimental-2
groups. The prerequisite features required in the selection of the participants are listed below, and the
demographic characteristics of the participants are presented in Table 1a, Table 1b.
Working as a pre-school teacher in kindergartens,
The kindergartens, where the participants work, are located in the same socio-economic
region,
The presence of students with diagnosed with developmental disabilities or undiagnosed
(students with typical development) involved in the inclusive education process in the
classrooms of the participants,
Participants' non-participation in any in-service training on naturalistic teaching,
The presence of internet connection of Web-based NTEPP participants at their homes and
schools,
Web-based NTEPP participants' possession of skills to use information and communication
technologies.
The characteristics of the study setting are as follows: The schools, where teachers in the
Experimental-1 and Experimental-2 groups work, are both in an environment with a mild-socio-
economic level. While the Experimental-1 group school consisted of 14 classrooms, including 7
morning classrooms and 7 afternoon classrooms, the Experimental-2 group school consisted of 15
classrooms, including 7 morning classrooms and 9 afternoon classrooms. In the classrooms, there are
basic learning centers such as block, playing house, book corner included in the Preschool Education
Program. The size of each class varied between 15 and 25. While the daily course of education of the
Pre-school Education Program is flexible by its nature, the half-day education course is conducted in
schools within the scope of the basic draft program in Table 2.
Table 2. Half-day education courses of pre-schools
List of Sequentially Functioning Activities of the Morning and Afternoon Groups
Time of Free Play (Start Time of Day)
Gathering and Cleaning
Breakfast Time
Gathering and Cleaning
Art Activity
Reading-Writing/Science and Nature/Experiment/Game and Music Activities
General Evaluation of the Day, Gathering Time, Preparations for Going Home
Dependent Variable
In the study, the effectiveness of the Face-to-Face and Web-based NTEPP on multiple dependent
variables was tested. Dependent variables were the participants' naturalistic teaching knowledge level,
interactional behavior levels, and level of using naturalistic teaching strategies in their classrooms.
Data Collection Tools
In this study, many quantitative and qualitative data collection tools were used.
Quantitative Data Collection Tools
Naturalistic Teaching Process Knowledge Test (NTP-KT): Pre-test, post-test and follow-up
measurements of pre-school teachers' naturalistic teaching knowledge levels were measured with
"Natural Teaching Process Knowledge Test (NTP-KT)". The NTP-KT is a knowledge test prepared in
cooperation with the The Scientific and Technological Research Council of Turkey 1001 project team
under the leadership of the first author. This knowledge test contains information, definitions, and
case study questions. It consists of 58 questions and can be solved in an average of 70 minutes. Each
item of the test consists of five options, and these options include a correct answer. The lowest and
highest scores to be obtained from the test are 0 and 58, respectively. The increase in the scores
obtained from the test indicates an increase in natural teaching knowledge levels, and the decrease in
the scores indicates a decrease in the knowledge levels.

IOJPE
ISSN: 1300 – 915X
www.iojpe.org
International Online Journal of Primary Education 2021, volume 10, issue 1
Copyright © International Online Journal of Primary Education 213
The steps of "determining the scope of the test," "determining target behaviors," "writing questions
and placing them in the table of signs," "arrangement of test questions," "implementation and scoring
of the test," "performing validity and reliability studies and finalizing the test as a result of the
analyses" were conducted, respectively, while preparing the knowledge test (Şeker & Gençdoğan,
2006). During these steps, the following studies were conducted: The content/scope of this test is
parallel to the content of education programs and contains the topics of “Definition and
Characteristics of the Types of Developmental Disabilities," "Naturalistic Teaching Process,”
"Qualified Adult-Child Interaction Strategies," "Naturalistic Teaching Strategies," and
"Environmental Arrangements." The "Renewed Bloom's Taxonomy of the Cognitive Domain"
consisting of "remembering, understanding, applying, analyzing, evaluating and creating" dimensions
was used to measure which target behaviors pre-school teachers gained after the education programs
(Bloom, 2001). The opinions of two domain experts were consulted for the content and face validity
of the questions, and the questions were rearranged in line with these opinions. Item analyses were
performed for item discriminant validity. In this context, 27% sub-super groups were determined from
the data obtained from the participants' responses to the test items, and the differences between the
items mean scores were tested using the independent samples t-test. The test items that were found to
have low discrimination were excluded from the test.
Parental/Adult Behavior Rating Scale (PBRS-TV): In the pretest, posttest and follow-up
measurements, the levels of interactional behaviors established by pre-school teachers with children
were evaluated by the PBRS-TV. This scale, which was developed and used by Gerald Mahoney was
also used with teachers under the name of the Maternal Behaviors Rating Scale (MBRS) in 2008,
aims to measure the levels of interactional behaviors established by adults with children in the play
setting. The validity and reliability studies of the scale in Turkey were performed with 123 mother-
child dyads by Diken, Topbaş, and Diken (2009). The PBRS-TV consists of three subscales, including
"Sensitivity-Responsivity," "Affect-Expressiveness," and "Achievement-Orientation." There is a total
of 12 items under three subscales. These items are being sensitive, being responsive, being effective,
and being creative in the subscale of "Sensitivity-Responsivity" and acceptance, enjoyment, using
verbal reinforcers, being warm, and being emotionally expressive in the subscale of "Affect-
Expressiveness." The "Achievement-Orientation and Directiveness" subscale includes the items of
being achievement-oriented, directive, and interaction pace (Diken, Topbaş, & Diken, 2009).
Naturalistic Teaching Process (NTP) Video Analysis Form: The intended use of the form is to watch
participants' videos containing their leisure time and art activities during the pre-test, post-test and
follow-up measurements, and to write the naturalistic teaching strategies used in the activities
watched on the form and to convert them into total frequency values. In the preparation of the form,
the strategies to be included in the form and the formal structure of the form were first determined by
a detailed literature review. The strategies, methods, and techniques to be included in the form are
parallel with the content of the education programs developed in the study, and its physical structure
includes the sections in which explanations about the implementation process of the strategies (start
and end time intervals, context and transcriptions of the strategies used by teachers in classrooms),
and the observations in the video recording will be written. This form was designed to get total
scores/frequencies from the main/basic strategies because naturalistic teaching strategies are an
integrated process consisting of many sub-methods and techniques. Thus, by avoiding performing
many different tests on the many methods and techniques included in the main/basic strategies, it was
attempted to prevent results from becoming complicated and to prevent the study from moving away
from its aim. Finally, the opinions of two domain experts were obtained for the content and formal
structure of the form, then, the form was rearranged in line with these opinions, and a pilot study was
carried out on whether the form worked or not by watching five videos of teachers' activities.
Log Records: "Access log records" were used to determine the number and time of displaying the
education site and guide resources of the Web-based NTEPP participants.

IOJPE
ISSN: 1300 – 915X
www.iojpe.org
International Online Journal of Primary Education 2021, volume 10, issue 1
Copyright © International Online Journal of Primary Education 214
Qualitative Data Collection Tools
Focus Group Interviews: The prior knowledge, opinions, and experiences of the participants
regarding inclusive education and the naturalistic teaching process were determined before the
implementation, and their opinions and experiences regarding the programs were determined through
focus group interviews after the implementation. The reason for selecting this type of interview was to
obtain participants' opinions that emerged interactively in depth and to understand and describe them
(Kruger & Casey, 2000; Patton, 2002).
Figure 2. The preparation process for focus group interviews
It is necessary to make some preparations before conducting focus group interviews (Kruger and
Casey, 2000; Patton, 2002). These preparations and the steps followed are presented in Figure 2. As a
result of the preparation process, pre-implementation focus group interview questions consisted of
three basic topics including "students with special needs and their characteristics," "inclusive
pre-school education experiences," and "practices carried out in the daily education process," and
post-implementation focus group interview questions consisted of three basic topics including
"content and implementation processes," "contributions," and "aspects requiring improvement" of the
education programs.
Video Recordings: Videos were collected to evaluate the naturalistic teaching strategies used by the
participants in leisure time (an unstructured activity) and art activities (a structured activity) at three
different times (pre-test=30, post-test=30, follow-up=30, a total of 178 videos). These activities were
selected because leisure time was the most important unstructured activity in pre-school education
programs, and the participants included structured art activities in their daily plans almost every day.
Leisure time activities were recorded for approximately 10-15/20 minutes, and art activities were
recorded until the end of the activities because it is indicated in the literature that interactional
behaviors can be analyzed by recording them for an average of 15-20 minutes, and it is possible to get
an impression on free play times during this period (Karaaslan and Mahoney, 2013; Karaaslan, Diken
and Mahoney, 2013; Mahoney and Perales, 2003). The interruption of art activities that were carried
out as a whole, during video shoots was not found appropriate by domain experts. The videos
recorded enabled the authors to check the codings they made by watching videos repeatedly and to
perform reliability studies. All video recording data were written on the “NTP Video Analysis Form”
and used to convert them into total frequency values.
Naturalistic Teaching Process (NTP) Reflective Diary Form: Participants' experiences of participating
in weekly education programs were collected through the “NTP Reflective Diary Form." This form is
a semi-structured document prepared by the researcher. The reason for this was that teachers did not
have the experience and time to write a reflective diary every week and that data could be collected
from teachers in a focused and easy way. In the preparation stage, face and content validity studies
were performed by receiving the opinions of two domain experts. The content of the form included
questions about “knowledge gained from education on a weekly basis,” “reflecting the knowledge
gained to the class/implementing it in the class,” and “the contributions of knowledge to students.”

IOJPE
ISSN: 1300 – 915X
www.iojpe.org
International Online Journal of Primary Education 2021, volume 10, issue 1
Copyright © International Online Journal of Primary Education 215
Field Notes: The researcher wrote down everything she observed during the whole process and took
field notes. She used these data to support and diversify the results of the study.
Independent Variable and Research Process
The independent variables of the study were the Face-to-Face and Web-based NTEPP. The Face-to-
Face and Web-based NTEPP are five-week teacher education programs. The contents of the education
programs, which were in parallel with each other, were presented to the Experimental-1 group
through face-to-face sessions conducted by the researcher and to the Experimental-2 group through
the website. Nevertheless, this study consisted of five basic stages: preparation, pre-test,
implementation, post-test, and follow-up. All of these stages are presented in Figure 3, and the process
of developing education programs that constituted the basis of the study is explained in the next
section.
Figure 3. Research Process
Development Process of the Education Programs
The program development model used in the development process of the education programs is the
TABA Model (Ornstein & Hunkins, 2008). This model consists of the basic steps of determining the
need for an education program through pre-implementation focus group interviews, determining
general and special objectives, creating the program content, and implementing and evaluating the
program based on the "deductive approach." The content of the program consisted of the following 5-
week content with the data obtained from a detailed literature review and focus group interviews:
1. Definition and Characteristics of the Types of Developmental Disabilities (Intellectual
Disability, Down Syndrome, Hearing Disability, Visual Disability, Speech and Language
Disorder, Autism Spectrum Disorder, Attention Deficit and Hyperactivity Disorder, Cerebral
Palsy)
2. Introduction to the Naturalistic Teaching Process
3. Qualified Adult Behavior Strategies
3.1. Being Sensitive-Responsive (Being Sensitive, Being Responsive, Being Effective, Being
Creative)
3.2. Being Emotionally Expressive (Acceptance, Enjoyment, Being Warm, Using Verbal
Reinforcers)

IOJPE
ISSN: 1300 – 915X
www.iojpe.org
International Online Journal of Primary Education 2021, volume 10, issue 1
Copyright © International Online Journal of Primary Education 216
3.3. Being Achievement-Oriented-Directive (Being Achievement-Oriented, Being Directive,
Interaction Pace)
4. Naturalistic Teaching Strategies
4.1. Modeling
4.1.1. Modeling without Expecting a Response
4.1.1.1. Bombardment of Words
4.1.1.2. Parallel Speech
4.1.1.3. Self-speech
4.1.2. Making choice
4.1.3. Modeling by using expansion
4.1.3.1. Expansion by adding words
4.1.3.2. Expansion by correcting/displacing
4.1.4. Mand-modeling
5. Environmental Arrangements (Making Inaccessible, Leaving Missing, Giving Limitedly/In
Pieces, Creating Surprising/Unexpected Conditions)
The Face-to-Face and Web-Based NTEPP consists of various basic tools and materials. They are five
guide booklets prepared based on the topics in the content, and 221 expert and sample application
videos. These tools and materials were embedded in a website in the Web-Based NTEPP, and all the
contents of these tools and materials were embedded in PowerPoint presentations and presented to the
participants through face-to-face sessions in the Face-to-Face NTEPP. The website of the program
can be accessed at https://www.dogalogretimprojesi.com/
Analysis of Data
The frequency and average values obtained by encoding the NTP-KT and all recorded videos in the
pre-implementation, post-implementation and follow-up measurements through the PBRS-TV and
NTP Video Analysis Form were analyzed by parametric and non-parametric tests. The analyses were
performed on the total scores obtained from three different measurements. The normal distribution
condition of each data set was evaluated before deciding on the tests to be performed. In this context,
kurtosis and skewness values, graphical methods (histogram, box plot diagram, stem-leaf diagram, Q-
Q graph and P-P graph, etc.) and statistical tests (Kolmogorov-Smirnov and Shapiro-Wilk tests, etc.
compliance tests) were used (Huck, 2008; Pallant, 2011; Tabacknick & Fidell, 2007). All focus group
interviews were analyzed by content analysis (inductive thematic analysis) method, and then all
related results were combined. The content analysis allowed the researcher to interpret the data by
creating themes within the data (Patton, 2002). The qualitative data obtained from reflective diaries
and field notes that were analyzed by the macro analysis method, which provides a holistic and wide
view of a lot of data, played a supportive role for all results (Patton, 2002).
Reliability and Validity Studies
The “Inter-Observer Reliability” data were collected on whether the total score, average and
frequency values calculated for the dependent variables of the study (naturalistic teaching knowledge
level, interactional behavior levels, and levels of naturalistic teaching strategies used in classrooms)
were correct, and the "Implementation Reliability" data were collected to determine whether the
independent variables (education programs) were implemented as planned. These data calculated
using the formula of “Consensus/Consensus + Dissensus X 100” ranged from 85.8% to 98.6%. In the
validity studies, while time, external factors, measurement/testing before the experiment, separate
measurement tools and testing, biased grouping and the loss of participants were considered to ensure
the internal validity of quantitative data, measurement-independent variable interaction, biased
selection-independent variable interaction, test response interaction of independent variables (Karasar,
2011) were considered for external validity. Long-term interaction, depth-oriented data collection,
triangulation, expert review, participant confirmation and contrast case analysis factors were taken
into account in the internal validity of qualitative data, and detailed description and detailed sampling
factors were taken into account in their external validity (Daymon & Halloway, 2010; Patton, 2002).

IOJPE
ISSN: 1300 – 915X
www.iojpe.org
International Online Journal of Primary Education 2021, volume 10, issue 1
Copyright © International Online Journal of Primary Education 217
Research Ethics
The ethical considerations that were considered during the research process were as follows:
Obtaining the necessary permissions, protection of the confidentiality of the participants' identities,
non-corruption of the nature of the place investigated, respecting the institution/school culture, clear
transfer of research aims to the participants, respecting the groups with sensitivity to various situations
(inclusive students, etc.), being aware of possible hierarchical power relations in the data collection
process (relations between the researcher-school principals and teachers, etc.), and informing the
participants about the results of the study (Cresswell, 2011).
RESULTS
By the nature of the mixed research method, the results were presented in a supportive and integrated
manner. The results are explained by the order of the research questions.
Determination of the Participants' Knowledge, Opinions, and Experiences Regarding Inclusive
Education and the Naturalistic Teaching Process before the Implementation
Four main themes and ten sub-themes were reached by inductive analysis from the data obtained from
the focus group interviews before the implementation. All themes are presented in Figure 4, and then
these themes are explained in paragraphs.
Figure 4. List of themes and sub-themes resulting from the analysis of focus group interviews
before the implementation
During the interviews, it was observed that the vast majority of the participants emphasized that
inclusive education, which is a legal right in international and national legislation and plays a
significant role in the acceptance of individual differences, is a system that should be present in
Turkey. In addition to the need for inclusive education, the participants also mentioned many
contributions of inclusive education to students, families, teachers, and peers. In the analysis, it was
found that the emphasis was placed, especially on “recognizing and accepting differences” within the
context of contributions. The teachers emphasized that they play a unique role in ensuring the social
acceptance of students with special needs and that their acceptance of students with special needs
quickly reaches other individuals (students, families, etc.) included in inclusive education by creating
a snowball effect. According to the opinions of the participants who described themselves with the
metaphor "We are not Superman!" in the theme of the problems experienced, their lack of
knowledge about approaches/methods such as naturalistic teaching was addressed as one of the main

IOJPE
ISSN: 1300 – 915X
www.iojpe.org
International Online Journal of Primary Education 2021, volume 10, issue 1
Copyright © International Online Journal of Primary Education 218
problems in conducting the inclusive education process. According to the opinions, this lack of
knowledge and education is attempted to be solved through individual efforts. It was considered that it
was difficult, even impossible, to overcome the lack of methodological knowledge in this way.
Furthermore, these studies based on individual efforts lead to a significant loss of time and
occupational burnout, which makes the acceptance of students with special needs difficult, and this
behavior may adversely affect the perspectives of other stakeholders (students, students' families, etc.)
in the system towards students in inclusive education. In the theme of teachers' solution proposals for
the problems, the need for preparing education programs on approaches/methods such as naturalistic
teaching should be among primary suggestions. Thus, the atmosphere of the class will be positively
affected, and the social acceptance of students with special needs in the classroom and other settings
will become easier, which may result in the happiness of all stakeholders with the process. In line with
these results, it is observed that the need referring to the subject of the study was also revealed. The
summarized visual of all these issues associated with each other is presented in Figure 5.
Figure 5. Issues associated with the main theme of problems in inclusive education
Effect of the Education Programs on the Participants' Naturalistic Teaching Knowledge Levels
The 3x2 mixed-design ANOVA (split-plot design ANOVA) test was performed to determine whether
the interactions of the measurement time, group, measurement time, and group factors, which are the
variables of the study, led to a significant difference in the participants' total scores for the NTP-KT.
The descriptive results related to mean, standard deviation, minimum and maximum values of the
total scores of the groups included in the analysis are presented in Table 3, and the results of the
mixed design ANOVA analysis are presented in Table 4.
Table 3. Descriptive statistics related to the total scores for the NTP-KT of the Experimental-1 and
Experimental-2 groups
Group Measurement Time N Mean SD Minimum Maximum
Experimental-1
Face-to-Face NTEPP
Pre-test 14 40.714 3.851 36.00 47.00
Post-test 14 49.928 5.327 41.00 57.00
Follow-up 14 47.574 4.569 40.00 55.00
Experimental-2
Web-Based NTEPP
Pre-test 16 41.687 4.269 32.00 49.00
Post-test 16 47.312 3.772 39.00 53.00
Follow-up 15 43.800 3.648 38.00 52.00
SD: Standard deviation, N: Number of People
According to the descriptive statistics, results revelaed that the total mean scores for the NTP-KT of
the Experimental-1 and Experimental-2 groups increased from pre-test to post-test and decreased from
post-test to follow-up.

IOJPE
ISSN: 1300 – 915X
www.iojpe.org
International Online Journal of Primary Education 2021, volume 10, issue 1
Copyright © International Online Journal of Primary Education 219
Table 4. Mixed Design ANOVA Results of the pre-test/post-test/follow-up total scores for the NTP-
KT of the Experimental-1 and Experimental-2 groups
Source of Variance SS df MS F p np2
Intergroup
Group 74.287 1 74.287 2.064 .162
Error 971.897 27 35.996
Intragroup
Measurement time 771.869 2 385.934 40.306 .000* .599
Measurement*group 96.558 2 48.279 5.042 .010* .157
Error 517.051 54
Total 1.914,611 32
*p<.05, SS: Sum of Squares, df: Degree of freedom, MS: Mean of Squares, np2= Partial Effect Size
When the ANOVA summary chart was examined, it was observed that the change in the total mean
scores for the NTP-KT in the pre-test, post-test, and follow-up measurements did not differ by groups
(F(1,27)=2.064, p>.05). This result can be interpreted that changes in the groups at different
measurement times were similar. Furthermore, a significant difference was found between the mean
scores for the NTP-KT in the repeated measurements of the participants, regardless of the groups
(F(2,54)=40.306; p<.05; np2=.599). According to Cohen (1988) and Huck (2008), while an effect size
value of .01-.06 refers to a small effect, a value of .06 and above refers to a medium effect, and a
value of 0.14 and above refers to a large effect. Accordingly, it can be said that the measurement time,
in other words, both education programs had a large effect on the participants' scores for the NTP-KT.
Finally, it was determined that the measurement time and group interaction were statistically
significant and had a significant effect on the participants' scores for the NTP-KT (F(2,54)=5.042;
p<.05; np2=.157). This result can be interpreted that participation in the face-to-face and web-based
programs had different effects on the participants' total scores for the NTP-KT in at least one of the
three measurement times.
A series of independent samples t-tests were performed to determine whether there was a significant
difference in the total mean scores for the NTP-KT in each measurement between the groups. All
results of the analyses are presented in Table 5.
Table 5. Independent samples t-test results in which the total scores for the NTP-KT obtained from
three measurements were examined by groups
Measurement Time Group N Mean SD df t p n2
Pre-test Experimental-1 14 40.714 3.851
28 -.652 .520 - Experimental-2 16 41.684 4.269
Post-test Experimental-1 14 49.928 5.327
28 1.567 .128 - Experimental-2 16 47.312 3.772
Follow-up Experimental-1 14 47.571 4.569
27 2.465 .020* .183 Experimental-2 15 43.800 3.648
Experimental-1 Face-to-Face NTEPP, Experimental-2 Web-Based NTEPP
*p<.05, N= Number of People, SD= Standard deviation, df= Degree of freedom, n2= Effect Size
It was found that there was no significant difference in the pre-test and post-test between the follow-
up test total mean scores for the NTP-KT of the groups. However, there was a statistically significant
difference in the follow-up test, and this value indicated a large effect (t(27)=.020; p<.05, η2=.183).
When these results were interpreted, it can be stated that both education programs were effective in
increasing the naturalistic teaching knowledge levels of the participants. Furthermore, the results
indicated that a significant difference in the joint interaction between the measurement time and group
variables observed in the mixed design ANOVA analysis occurred in the follow-up measurement.
This result can be interpreted that the knowledge obtained from the Face-to-Face NTEPP was more
permanent compared to theWeb-Based NTEPP. The findings obtained from the analysis of focus

IOJPE
ISSN: 1300 – 915X
www.iojpe.org
International Online Journal of Primary Education 2021, volume 10, issue 1
Copyright © International Online Journal of Primary Education 220
group interviews, reflective diaries, and field notes also support these results. For example, teacher
Eda summarized that the programs increased their naturalistic teaching knowledge levels by stating,
"You caught us at the point where we were missing because we, as pre-school teachers, are unaware
of many topics and practices in inclusion. With this education, we have learned a lot of scientific and
practical information we didn't know…”. These results are presented graphically in Figure 6.
Figure 6. Effect of the interaction between the measurement time and education group on the total
mean scores for the NTP-KT
Effect of the Education Programs on the Participants' Interactional Behavior Levels
While seeking an answer to the third question of the study, the presence of more than one dependent
variable first suggested the mixed design MANOVA analysis, based on the presence of two different
education groups, three different measurement times, and three subscales of the PBRS-TV. However,
there are many prerequisites for performing mixed design MANOVA analysis, such as sample size,
normality, and linearity (Pallant, 2011; Tabachnick & Fidell, 2007). In the study, due to a small
sample size, the presence of a correlation of less than 0.60 between univariate and multivariate
normality and the dependent variables, nonlinear distributions of the dependent variables at
independent variable levels, and failure to meet the homogeneity conditions of the variance-
covariance matrix, multiple 3x2 mixed design ANOVA analyses were performed instead of this
analysis. This method can be preferred by many researchers (Tabachnick & Fidell, 2007).
The descriptive results related to mean, standard deviation, minimum and maximum values of the
total scores of the Experimental-1 and Experimental-2 groups from the subscales of the PBRS-TV at
different measurement times are presented in Table 6. The mixed design ANOVA analyses performed
separately for each subscale are presented in Table 7, and the results of Sidak's multiple comparison
test, which was performed to determine between which measurement times the significant differences
found in the total scores obtained from the scales occurred, are indicated in the source of difference in
Table 6.
When the data were analyzed, it was found that the total mean scores of the participants in both the
Experimental-1 and Experimental-2 groups from the three subscales of the PBRS-TV increased from
pre-test to post-test and that these scores in the post-test were preserved in the follow-up test. The
participants were expected to get a mean score of 3 from the "Achievement-Orientation-
Directiveness" subscale and a mean score of 5 from other subscales. In this context, it can be said that
both education programs increased the participants' total mean scores obtained from three subscales

IOJPE
ISSN: 1300 – 915X
www.iojpe.org
International Online Journal of Primary Education 2021, volume 10, issue 1
Copyright © International Online Journal of Primary Education 221
from pre-test to post-test at an average value, which was quite close to the desired level, which also
preserved in the follow-up measurement.
Table 6. Descriptive statistics related to the total scores of the Experimental-1 and Experimental-2
groups in three subscales of the PBRS-TV
Group Subscales Measurement Time N Mean SD Minimum Maximum
Ex
per
imen
tal-
1
Fa
ce-t
o-F
ace
NT
EP
P Being Sensitive-
Responsive
Pre-test 14 1.57 .852 1 3
Post-test 14 3.36 1.008 2 5
Follow-up 14 3.36 1.151 2 5
Being Emotionally
Expressive
Pre-test 14 1.79 .975 1 4
Post-test 14 3.43 1.016 2 5
Follow-up 14 3.36 1.216 2 5
Being Achievement-
Oriented-Directive
Pre-test 14 1.64 .929 1 3
Post-test 14 2.93 .616 2 4
Follow-up 14 2.71 .914 1 4
Ex
per
imen
tal-
2
Web
-Ba
sed
NT
EP
P Being Sensitive-
Responsive
Pre-test 16 1.56 .727 1 3
Post-test 16 3.38 1.025 2 5
Follow-up 15 3.07 1.100 1 4
Being Emotionally
Expressive
Pre-test 16 1.50 .730 1 3
Post-test 16 3.38 1.025 2 5
Follow-up 15 3.07 1.100 1 4
Being Achievement-
Oriented-Directive
Pre-test 16 1.88 1.088 1 5
Post-test 16 3.06 .680 2 4
Follow-up 15 2.67 .976 1 5
SD: Standard deviation, N: Number of People
When the mixed ANOVA summary chart was examined, it was observed that the change in the total
mean scores obtained from the “Sensitivity-Responsivity” subscale of the PBRS-TV did not differ by
groups (F(1,27)=.066; p>.05). Similar results were also achieved for the subscales of “Affect-
Expressiveness” (F(1,27)=.372) and “Achievement-Orientation-Directiveness” (F(1,27)=.005) (p>.05).
These results can be interpreted that changes in the groups at different measurement times followed a
similar path for all three subscales. Furthermore, it was found in the analyses that measurement and
group interaction was not statistically significant in all three subscales, respectively (F(2,54)=.424;
F(2,54)=.278; F(2,54)=.061; p>.05).
These results can be interpreted that two education programs did not have a different effect on the
total mean scores obtained by the participants from three subscales according to the measurement
time. At this point, it is possible to say that both programs were effective in increasing and
maintaining the interactional behavior levels of the participants.
The findings supporting these results were also achieved in the focus group interviews conducted after
the implementation, weekly reflective diaries, and the researcher's field notes. In the analysis of the
interviews, it was found that both education groups mentioned a number of contributions through
which the knowledge obtained from the programs was transferred to the practices in the education
process (start of using quality interaction and other naturalistic teaching strategies in the education
process, etc.). For example, teacher Gamze exemplified that she started to be a sensitive-responsive
teacher rather than exhibiting directive behaviors after the education by stating, "For example, the
child was standing in the middle, I was directing him right away, go there, play here. But now, I pay
much attention to what he cares about. I name what he is interested in and what he touches and
shows…”. A sample field note taken is as follows: “He was a very exhausted and unenthusiastic
teacher. Now I see that he participates in children's plays and follows their interests warmly. The
power of a teacher comes from love!”

IOJPE
ISSN: 1300 – 915X
www.iojpe.org
International Online Journal of Primary Education 2021, volume 10, issue 1
Copyright © International Online Journal of Primary Education 222
Table 7. Mixed ANOVA results of the total scores of the Experimental-1 and Experimental-2 groups
from the PBRS-TV
Source of Variance SS df MS F p np2 Source of Difference
Sen
siti
vity
-
Res
po
nsi
vity
Intergroup
1<2
1<3
Group .116 1 .116 .066 .799
Error 47.263 27 1.750
Intragroup
Measurement time 56.836 2 28.418 46.890 .000* .635
Measurement*group .514 2 .257 .424 .656
Error 32.727 54 .606
Total 137.456 86
Aff
ect-
Ex
pre
ssiv
enes
s
Intergroup
1<2
1<3
Group .788 1 .788 .372 .547
Error 53.143 27 2.116
Intragroup
Measurement time 53.393 2 26.697 51.260 .000* .655
Measurement*group .290 2 .145 .278 .758
Error 28.124 54 .521
Total 135.738 86
Ach
ieve
men
t-O
rien
tati
on
-
Dir
ecti
ven
ess
Intergroup
1<2
1<3
Group .005 1 .005 .005 .945
Error 30.730 27 1.138
Intragroup
Measurement time 27.638 2 13.819 32.535 .000* .546
Measurement*group .052 2 .026 .061 .941
Error 22.937 54 .425
Total 81.362 86
*p<.05, SS= Sum of Squares, df: Degree of freedom, MS: Mean of Squares, np2= Partial Effect Size
Source of Difference =1:Pre-test, 2:Post-test, 3:Follow-up measurement
Effect of the Education Programs on the Participants' Use of Naturalistic Teaching Strategies in
Education Processes
Leisure Time Activities: The Friedman test analyses were performed to examine the change in the
total scores for naturalistic teaching strategies of the two education groups within themselves from the
pre-test, post-test, and follow-up measurements of leisure time activities. The descriptive results
related to mean, standard deviation, median, minimum and maximum values of the total scores of the
groups analyzed are presented in Table 8, and the Friedman test results are presented in Table 9.
Table 8. Descriptive statistics related to the total scores for Naturalistic Teaching Strategies of the
Experimental-1 and Experimental-2 groups from three different measurements of leisure time
activities
Group Measurement Time N Mean SD Mv Minimum Maximum
Experimental -1
Face-to-Face NTEPP
Pre-test 14 3.64 5.486 1.50 0 19
Post-test 14 29.50 23.167 23.50 2 70
Follow-up 14 30.93 25.254 20.50 1 74
Experimental -2
Web-Based NTEPP
Pre-test 16 1.56 4.211 .00 0 17
Post-test 16 15.25 13.621 11.50 0 44
Follow-up 15 6.40 8.131 2.00 0 26
N= Number of people, SD= Standard deviation, Mv= Median values

IOJPE
ISSN: 1300 – 915X
www.iojpe.org
International Online Journal of Primary Education 2021, volume 10, issue 1
Copyright © International Online Journal of Primary Education 223
When the descriptive data were analyzed, the results revealed that there was an increase of 26 points
in the total mean scores of the Experimental-1 group from pre-test to post-test and there was an
increase of 14 points in the Experimental-2 group and that there was a decrease of 1 point in the
Experimental-1 group from post-test to follow-up and there was a decrease of 9 points in the
Experimental-2 group.
Table 9. Friedman test results related to the total scores for Naturalistic Teaching Strategies of the
Experimental-1 and Experimental-2 groups from the measurements of leisure time activities at three
different times
Group Measurement
Time N Mean R. χ2 df p Kendall’s W
Experimental-1
Face-to-Face NTEPP
Pre-test 14 1.21 33.138 2 .000* .473
Post-test 14 3.79
Follow-up 14 4.07
Experimental-2
Web-Based NTEPP
Pre-test 16 1.87 26.574 2 .000* .354
Post-test 16 4.00
Follow-up 15 2.93
*p<.05, N= Number of People, Md= Median; Mean R.= Mean rank, χ2= Chi-square value, df: Degree of freedom, Kendall’s
W= Kendall's coefficient of concordance
In the Friedman test results, it was found that there was a significant difference between the total
scores for naturalistic teaching strategies of the Experimental-1 and Experimental-2 groups in the
leisure time activity in three different measurements and that this difference indicated a large effect
[χ2 (2, n=14)=33.138, p<.05, Kendall’s W=.473; χ2(2, n=15)=26.574, p<.05, Kendall’s W=.354].
These results can be interpreted that both education programs led to a significant difference between
the total scores at any two measurement times. The results of the Wilcoxon signed-rank test that was
performed to determine the source of the significant difference that emerged, in other words, between
which measurements it occurred, are presented in Table 10. Since pairwise comparisons were
performed between the measurements on the same data sets obtained from three different
measurements of the groups in these tests, the Bonferroni correction (p=.05/3=.017) was performed
by dividing the value of significance by three for each analysis to reduce the possibility of finding
significant results by chance. Thus, it was aimed to reject a truly correct null hypothesis, in other
words, to control Type 1 error (Alpha error), which means finding something that is not really
significant significant (Pallant, 2011, p. 237).
In the Wilcoxon signed-rank test results, it was determined that there was a significant difference
between the pre-test/post-test (z=-3.296; p<.017; r=.88) and pre-test/follow-up total scores for
naturalistic teaching strategies (z=-3.297; p<.017; r=.88) obtained by the Experimental-1 group from
the measurement of leisure time activities, and that there was no significant difference between the
pre-test/follow-up total scores for naturalistic teaching strategies. When the mean rank and totals of
the difference scores were taken into consideration, this difference was observed to be in favor of
positive ranks, in other words, the post-test scores. Similar results were also achieved for the
Experimental-2 group.
Table 10. Wilcoxon signed-rank test results related to the total scores for Naturalistic Teaching
Strategies of the Experimental-1 and Experimental-2 groups obtained from leisure time activities
Group N Mean R. Sum of R. z p r
Ex
per
imen
tal-
1
Fa
ce-t
o-F
ace
NT
EP
P
Post-test/Pre-test
Negative Rank 0 .00 .00 -3.296 .001* .88
Positive Rank 14 7.50 105.00
Equal 0
Follow-up/Post-test
Negative Rank 7 7.00 49.00 -.220 .826 -
Positive Rank 7 8.00 56.00
Equal 0

IOJPE
ISSN: 1300 – 915X
www.iojpe.org
International Online Journal of Primary Education 2021, volume 10, issue 1
Copyright © International Online Journal of Primary Education 224
Follow-up/Pre-test
Negative Rank 0 .00 .00 -3.297 .001* .88
Positive Rank 14 7.50 105.00
Equal 0
Ex
per
imen
tal-
2
Web
-Ba
sed
NT
EP
P
Post-test/Pre-test
Negative Rank 2 2.00 4.00 -3.184 .001* .79
Positive Rank 13 8.92 116.00
Equal 1
Follow-up/Post-test
Negative Rank 10 7.85 78.50 -2.310 .021 -
Positive Rank 3 4.17 12.50
Equal 2
Follow-up/Pre-test
Negative Rank 1 3.00 3.00 -2.695 .007* .69
Positive Rank 10 6.30 63.00
Equal 4
*p<0.017 (Bonferroni correction), N= Number of People, Mean R.= Mean rank, Sum of R.= Sum of ranks, Effect Size
r=z/
A series of the Mann-Whitney U tests were performed for the intergroup comparison of the total
scores for naturalistic teaching strategies used in leisure time activities in the pre-test, post-test, and
follow-up measurements.
Table 11. Mann-Whitney U test results in which the total scores for Naturalistic Teaching Strategies
obtained from the measurement of leisure time activities at three different times were compared by
groups Measurement
Time
Group N Mean R. Sum of R. U z p r
Pre-test Experimental-1 14 18.36 257.00
72.000 -1.782 .075 -
Experimental-2 16 13.00 208.00
Post-test Experimental-1 14 18.29 256.00 73.000 -1.624 .104 -
Experimental-2 16 13.06 209.00
Follow-up Experimental-1 14 20.00 280.00 35.000 -3.064 .002* .81
Experimental-2 15 10.33 155.00
* Experimental-1= Face-to-Face NTEPP, Experimental-2= Web-Based NTEPP *p<.05, N= Number of People, Mean
R.=Mean rank, Sum of R.= Sum of ranks, U=Mann-Whitney U value, Effect Size r=z/
In the analyses, it was observed that there was a significant difference between the total scores for
naturalistic teaching strategies of the groups measured in the same activity, and this difference
indicated a large effect (U=35.000; z=-3.064; p<.017, r=.81). In brief, the fact that no significant
difference was found between the total scores for naturalistic teaching strategies measured in the
leisure time activities of the groups in the pre-test and post-test can be interpreted that both education
programs were effective in increasing the initial total scores of the participants. However, it can be
said that the Face-to-Face NTEPP had a more permanent effect on the total scores for leisure time
naturalistic teaching strategies of the participants.
Art Activities
The change between the total scores for naturalistic teaching strategies obtained by the Experimental-
1 and Experimental-2 groups from the measurement of art activities at three different times was
analyzed by the Friedman test analyses. The descriptive results related to mean, standard deviation,
median, minimum and maximum values of the total scores of the groups included in the analysis are
presented in Table 12, and the Friedman test results are presented in Table 13.

IOJPE
ISSN: 1300 – 915X
www.iojpe.org
International Online Journal of Primary Education 2021, volume 10, issue 1
Copyright © International Online Journal of Primary Education 225
Table 12. Descriptive statistics related to the total scores for Naturalistic Teaching Strategies obtained
by the Experimental-1 and Experimental-2 groups from the measurement of art activities at three
different times
Group Measurement
Time
N Mean SD Md Minimum Maximum
Experimental-1 Face-
to-Face NTEPP
Pre-test 14 15.71 13.903 15.00 0 43
Post-test 14 40.50 31.334 37.00 4 110
Follow-up 14 26.71 21.265 20.50 5 78
Experimental-2
Web-Based NTEPP
Pre-test 16 5.13 10.138 3.00 0 42
Post-test 16 18.88 18.195 19.00 0 66
Follow-up 15 14.73 10.089 15.00 1 35
N= Number of People, SD= Standard deviation, Md= Median values
It was found that there was an increase of 35 points in the total mean scores of the Experimental-1
group from pre-test to post-test and there was an increase of 14 points in the Experimental-2 group
and that there was a decrease of 14 points in the Experimental-1 group from post-test to follow-up and
there was a decrease of 4 points in the Experimental-2 group.
Table 13. Friedman test results related to the total scores for art activity Naturalistic Teaching
Strategies of the Experimental-1 and Experimental-2 groups measured at three different times
Group Measurement
Time N Mean R. χ2 Df p Kendall’s W
Experimental-1
Face-to-Face NTEPP
Pre-test 14 1.36 9.571 2 0.008* 0.342
Post-test 14 2.50
Follow-up 14 2.14
Experimental-2
Web-Based NTEPP
Pre-test 16 1.37 9.390 2 0.009* 0.313
Post-test 16 2.23
Follow-up 15 2.40
*p<.05, N= Number of People, Md= Median; Mean R.= Mean rank, χ2= Chi-square value, Df: Degree of freedom, Kendall’s
W= Kendall's Coefficient of Concordance
It was determined that there was a significant difference between the total scores for art activity
naturalistic teaching strategies of the Experimental-1 and Experimental-2 groups in three different
measurements within themselves and that this difference indicated a large effect [χ2(2, n=14)= 9.571,
p<.05, Kendall’s W=.342; χ2(5, n=15)=9.390, p<.05, Kendall’s W=.313]. The results of the Wilcoxon
signed-ranks tests that were performed to determine between which measurements this difference
occurred are presented in Table 14, and it is observed in the results that there was a difference with a
significant and large effect.
Table 14a. Wilcoxon signed-rank test results related to the total scores for Naturalistic Teaching
Strategies of the Experimental-1 and Experimental-2 groups obtained from art activities
Group N Mean R. Sum of R. z p r
Ex
per
imen
tal-
1
Fa
ce-t
o-F
ace
NT
EP
P
Post-test/Pre-test
Negative Rank 2 5.00 10.00 -2.671 .008* .71
Positive Rank 12 9.92 95.00
Equal 0
Follow-up/Post-test
Negative Rank 9 9.33 84.00 -1.978 .048 -
Positive Rank 5 4.20 21.00
Equal 0
Follow-up/Pre-test
Negative Rank 3 7.17 21.50 -1.947 .052 -
Positive Rank 11 7.59 83.50
Equal 0

IOJPE
ISSN: 1300 – 915X
www.iojpe.org
International Online Journal of Primary Education 2021, volume 10, issue 1
Copyright © International Online Journal of Primary Education 226
Table 14b. Wilcoxon signed-rank test results related to the total scores for Naturalistic Teaching
Strategies of the Experimental-1 and Experimental-2 groups obtained from art activities
Ex
per
imen
tal-
2
W
eb-B
ase
d N
TE
PP
Post-test/Pre-test
Negative Rank 4 3.75 15.00 -2.557 .011* .64
Positive Rank 11 9.55 105.00
Equal 1
Follow-up/Post-test
Negative Rank 7 10.36 72.50 -0.710 .478
Positive Rank 8 5.94 47.50
Equal 0
Follow-up/Pre-test
Negative Rank 2 7.75 15.50 -2.529 .011* .65
Positive Rank 13 8.04 104.50
Equal 0
*p<.017 (Bonferroni correction), N= Number of People, Mean R.= Mean rank, Sum of R.= Sum of ranks, Effect Size
r=z/
A series of Mann-Whitney U tests were performed for the intergroup comparison of the total scores
for art activity naturalistic teaching strategies of the participants measured at three different times.
Table 15. Mann-Whitney U test results in which the total scores for art activity Naturalistic Teaching
Strategies measured at three different times were compared by groups
Measurement Time Group N Mean R. Sum of R. U z p r
Pre-test Experimental-1 14 19.04 266.50 62.500 -2.073 .038* .37
Experimental-2 16 12.41 198.50
Post-test Experimental-1 14 19.54 273.50 55.500 -2.351 .019 -
Experimental-2 16 11.97 191.50
Follow-up Experimental-1 14 17.50 245.00 70.000 -1.532 .126 -
Experimental-2 15 12.67 190.00
Experimental-1: Face-to-Face NTEPP, Experimental-2: Web-Based NTEPP
*p<.05, N= Number of People, Mean R.= Mean rank, Sum of R.= Sum of ranks, U=Mann-Whitney U value, Effect Size
r=z/
When Table 15 was examined, it was found that there was a significant difference between the total
pre-test naturalistic teaching strategies scores measured in the art activities of the Experimental-1 and
Experimental-2 groups and that this difference indicated a large effect (U=62.500; z=-2.073; r=.37;
p>.05). This situation, which can also be observed in descriptive statistics values, can be interpreted
that the total naturalistic teaching strategy levels used by both groups in the art activities were not
similar before the implementation. However, it was considered that this situation that was observed
only in this data set and analysis of the study might be due to the fact that the "total scores for
naturalistic teaching strategies obtained by several participants from the art activity had extreme
values in the data." In the literature, this incident is expressed among the limitations of the "quasi-
experimental design," and it is indicated that the extreme values taken by several participants may
affect the results of the analysis performed with a group having a small sample size (Cresswell, 2011).
To make a decision according to the split-plot in such a data set, or to equalize the groups by
extracting extreme values from the data are among the recommended methods (Pallant, 2011;
Tabachnick & Fidell, 2007). However, since studies were conducted with a special and small target
group in this study, the choice of non-foreign intervention to the test process, and the fact that it was
observed that the difference in the intergroup pre-test scores found only in this analysis was not very
big on the chart, no reduction was made in the data by deleting the extreme values, and the analyses
were performed with normal data.
When all the results are summarized, it is possible to state that both education programs had an effect
on the participants with regard to using and maintaining naturalistic teaching practices in art activities.
The findings supporting these results were also achieved in the focus group interviews conducted after

IOJPE
ISSN: 1300 – 915X
www.iojpe.org
International Online Journal of Primary Education 2021, volume 10, issue 1
Copyright © International Online Journal of Primary Education 227
the implementation, weekly reflective diaries, and the researcher's field notes. In the analysis of the
interviews, one of the topics that were observed to be discussed within the professional contributions
acquired by the participants from the programs was the use of naturalistic teaching strategies in daily
education and training process after the education. The participants exemplified and stated that they
started to use both environmental arrangements and other naturalistic teaching strategies in their daily
activities after the teaching education process. For example, teacher Leyla, one of the Web-Based
NTEPP participants, exemplified that she started to use making inaccessible, one of the environmental
arrangement strategies, and expansion and bombardment of words from other naturalistic teaching
strategies in the education process by stating, "In the art activity, I give the paper to students and wait
for them to ask for their paint…they come and either raise their fingers or ask me to give it. I
immediately expand it by saying, give the paint. I say what they cannot say in the form of
bombardment during the day." Finally, a sample field note regarding this issue was as follows: "Is this
a teacher just sitting in his chair during a leisure time activity that I have seen? It makes me surprised
that he makes children's plays fun by creating surprising situations, presents linguistic models to
children by naming what they do, and expands their reactions. The power of this teacher comes from
his effort to reflect what he has learned into practice.
Examination of the Participants' Opinions and Experiences on the Education Programs
Figure 7. List of Themes and Sub-themes for Post-implementation Focus Group Interviews
At this stage, focus group interviews were conducted with the participants as before the
implementation. As a result of the analysis from the interview data, a total of three main themes and
eleven sub-themes showed in Figure 7 were achieved. First, it was revealed in the analyses that all
participants acquired a large number of contributions through which they could obtain knowledge
about the naturalistic teaching process from the programs professionally, and then they could transfer
this knowledge to various practices. These contributions were better observing students and directing
students and their families to institutions that make a diagnosis or evaluation when required, naming
naturalistic teaching practices that were performed in the daily education process and realizing these
practices in a more conscious way, and starting to use newly learned practices. The participants of
both programs indicated that with these practices they implemented, children became more active in
their classrooms, and a more entertaining atmosphere was formed. Under the main theme of
"Opinions about the content of the programs and implementation processes," it was found that all
participants in both education groups considered the content of the programs as holistic, interrelated

IOJPE
ISSN: 1300 – 915X
www.iojpe.org
International Online Journal of Primary Education 2021, volume 10, issue 1
Copyright © International Online Journal of Primary Education 228
and sufficient, and they considered the materials used as linguistically clear and understandable
materials with visuals, many colors, and case study consisting of pill knowledge. Furthermore, it was
observed that the participants generally described education programs with the words of “effective,”
“successful,” “touching education,” and “fun.” Moreover, it was determined that the education
programs were described by the metaphor of "life buoy." The opinions of teacher Aslı about this
subject are as follows: “… the seminar has provided things that will save our lives in practice. It has
become a life buoy for us. In other seminars, they just tell us, clap your arm, you can swim. I can't
swim… I will somehow go ashore now, but in the meantime, I will have learned to swim...” Along
with these positive opinions, it was observed that the participants also provided some opinions
regarding the aspects of the programs that needed to be developed and the problems experienced
during the implementation process. The participants who attended both the face-to-face and web-
based programs stated that they had difficulty in following the programs due to their personal
responsibilities, that they needed “repetition of knowledge, application practice, and therefore, time”
in order to internalize the naturalistic teaching strategies they learned from the programs and to
specialize in practice, and that a large class size and the lack of auxiliary staff in practice were
complicating factors. These results make it necessary to consider the variables that will increase
motivation in participation in education programs prepared for teachers, and the factors affecting the
functioning of teacher education programs in the inclusive education process in Turkey.
The suggestions for the solution of these problems mentioned by the participants in the analysis of the
interviews were listed as the implementation of programs during the seminar period, the inclusion of
more sample videos that may contribute to the implementation processes and coping strategies with
classroom management/problem behaviors in the programs, and the operation of the coaching system.
Furthermore, it was remarkable that the participants associated their suggestions for the problems
experienced in the implementation of evidence-based applications such as naturalistic teaching in the
education processes with the functioning of inclusive pre-school education in Turkey. In this context,
the participants emphasized that the inclusive school education system, which is functioning
systematically in our country, should be developed, that class sizes should be reduced for the qualified
functioning of this system, that supports for auxiliary staff and materials should be provided, that
different teacher education programs on evidence-based practices such as naturalistic teaching should
be developed, and that the cooperation processes with families and CRC should be accelerated. For
example, teacher Deniz, one of the Face-to-Face NTEPP participants, stated, "...they should assist
each other...The main problem is that there is no inclusive system understanding. Applications and
problems are reflected in the parts of the whole system. If these problems are resolved, teacher
training programs work in a more qualified manner".
In conclusion, the results of this study have formed a basic frame regarding the functioning of
inclusive early childhood education in Turkey and teacher education programs from support services
in this process.
DISCUSSION and CONCLUSION
In the study, the prior knowledge, opinions, and experiences of pre-school teachers regarding
inclusive education and the naturalistic teaching process were first examined before the
implementation, and thus, the need for professional education programs was also revealed. The first
main conclusion obtained from the study is that pre-school teachers indicated that inclusive education
is a system that should be present in Turkey and made a lot of contributions to them, students, and
families with regard to many issues such as recognizing and accepting differences. These results
suggested that teachers might basically have a moderate approach to inclusive education.
Nevertheless, it was determined that the moderate approaches of teachers towards inclusive education
could be affected by various factors. The participants listed these factors as stakeholders, education
and training setting, insufficient support services and problems related to the political system at the
upper level, especially the lack of knowledge about students with special needs and their

IOJPE
ISSN: 1300 – 915X
www.iojpe.org
International Online Journal of Primary Education 2021, volume 10, issue 1
Copyright © International Online Journal of Primary Education 229
characteristics, and practices that can be easily applied in classrooms such as the naturalistic teaching
approach. It was indicated that the improvement of the participants' lack of knowledge through
professional development programs could result in the “social acceptance process” of children with
special needs and their families spreading from teachers, students, and families to the society. All
these results that are associated with each other are also supported by many research results in the
international and national literature (Bailey & Winton, 1987; Bozarslan & Batu, 2014; Diamond &
LeFurgy, 1994; Emam & Mohamed, 2011; Kasari, Freeman, Bauminger, & Alkin, 1999; Krischler,
Pit-ten Cate & Krolak-Schwerdt 2018; Rakap, Parlak-Rakap, & Aydın, 2016; Rakap & Rakap, 2014;
Sucuoğlu, Bakkaloğlu, Akalın, Demir, & İşçen-Karasu, 2015; Sucuoğlu et al., 2013; Winton,
Turnbull, Blacher, & Salkind, 1983). In the studies, teachers' lack of knowledge and education on
evidence-based practices that they can transfer into education processes is considered as one of the
biggest systemic problems experienced in inclusive education, and it is considered that a solution to
the problem of methodological knowledge can be produced through professional development
programs including visual and written materials (Boyd, Kucharczyk, & Wong, 2016; Bruder, 2016).
According to one of the main results of the study, the five-week face-to-face and web-based programs
developed were effective in increasing the participants' total scores for naturalistic teaching
knowledge, interactional behaviors established by them with children, and naturalistic teaching
strategies they used in leisure time and art activities. However, it was found that the face-to-face
education program had a more permanent effect on the participants' total scores for naturalistic
teaching knowledge and naturalistic teaching strategies used in leisure time activities compared to the
web-based program. When the literature is reviewed, it is possible to find studies in which the effects
and permanency of both face-to-face and web-based programs on targeted teacher behaviors are
examined independently of each other (Christensen-Sandfort, & Whinnery, 2013; Harjusola-Webb &
Robbins, 2012; Kohler, Anthony, Steighner, & Hoyson, 2001; Malmskog & McDonnell, 1999;
Marsicano, Morrison, Moomaw, Fite, & Kluesener, 2015; Wolery, Anthony, Caldwell, Snyder, &
Morgante, 2002). However, there was no study in which the effects and permanency of naturalistic
teaching-based face-to-face and web-based education programs in the pre-school inclusive education
process on the targeted performances of participants were compared. The results of the
aforementioned studies revealed that both web-based and face-to-face education programs had a
successful effect on the targeted performance levels of participants. In the literature, it is remarkable
that the features of face-to-face or web-based practices such as their permanence and forms of
presentation were discussed rather than their effects. At this point, it is discussed that face-to-face
education programs have limitations, such as the fact that they may be time-consuming for researchers
and participants. With regard to permanence, there are research results revealing that services such as
counseling and coaching provided with web-based programs or longer-term education may have a
more effective and permanent effect on the knowledge, skills, and behaviors that are aimed to be
acquired by participants and may result in the transfer of the practices learned to the education process
with a higher level of reliability (Kohler et al., 2001; Stahmer et al., 2015; Tate et al., 2005). In
accordance with these results, it can be said that web-based programs, the contents of which were
designed with visual and written materials, could be as effective as face-to-face programs on teachers'
targeted performance levels; however, with which components and in which forms the programs on
permanence should be presented to teachers is on the agenda of scientific discussion. In the focus of
the discussions, it is suggested in the literature that multi-component education programs can be
designed, and it is also emphasized that these designs depend on the situations of the country, the
researcher and the participants such as source, time and motivation (Frantz, 2017; Dick, 2017; Han,
2012; Hemmeter, Snyder, Kinder, & Artman, 2011). In this study, the fact that the face-to-face
education program had a more permanent effect on the participants' naturalistic teaching knowledge
levels compared to the web-based program was considered to be due to systemic (infrastructure-
based) problems in Turkey, along with the individual and motivational issues affecting the
participants' time periods to follow the web-based program. In this context, it was revealed that the
internet infrastructure should be developed, or the videos should be prepared in accordance with this

IOJPE
ISSN: 1300 – 915X
www.iojpe.org
International Online Journal of Primary Education 2021, volume 10, issue 1
Copyright © International Online Journal of Primary Education 230
infrastructure so that teachers working in schools affiliated to the Ministry of Education in Turkey can
watch the videos in the prepared web-based program without interruption. It is recommended to find
the factors that will increase motivation with respect to teachers' more frequent participation in web-
based programs.
Another result obtained from the study was that the teachers' opinions about the programs were quite
positive. In the literature, it was also remarkable that social validity data were collected in the studies
on teacher education programs, and in these data, it was observed that teachers found both face-to-
face and web-based education programs prepared with written and visual materials effective and
successful (Dick, 2017; Frantz, 2017; Gianoumis et al., 2012; Marsicano et al., 2015). Nevertheless,
in the interviews, it was indicated that some problems, such as excessive class size, the lack of
auxiliary staff and materials, and inadequate cooperation with stakeholders, were experienced in the
transfer of knowledge obtained from the programs into practice, and that these problems could be
basically solved by transforming inclusive pre-school education in Turkey into a more functional and
qualified system. In the studies in the literature, inclusive pre-school education was discussed as an
ecological system approach, and it was stated there were many factors that affect the quality of the
system (Odom, 2002; 2016; Odom et al., 1996; Odom et al., 2002). It is observed that these factors
that affect and are affected by each other include issues such as legal regulations, cooperation between
stakeholders, providing support services, and arrangement of the education and training setting and
process (Odom, 2016). It is overemphasized that any problem occurring in these factors, which are
described as inseparable parts within the system, grows like a snowball and disrupts the holistic and
qualified functioning of practices (Odom, 2002; 2016; Odom et al., 1996; Odom et al., 2002).
In brief, it is observed that web-based programs, the content of which is designed with visual and
written materials, can be as effective as face-to-face programs on the targeted performance levels of
teachers and have gained importance with their functionality in recent years. Nowadays, when the
COVID-19 epidemic covering the whole world is experienced, it is observed that web-based
programs, which can be followed at home and can spread all over the countries, have increasingly
gained momentum and that these programs will continue to gain momentum in the future. However, it
can be said that with which components, and in which forms the programs on permanence should be
presented to teachers is on the agenda of scientific discussion. Nevertheless, it can be stated that the
knowledge obtained from teacher education programs can be better reflected in classroom settings by
resolving the infrastructural and systemic problems in Turkey.
The results of this study should be interpreted with some of its limitations. It is important to be able to
ensure control in a lot of quantitative and qualitative data that should be collected due to the nature of
the mixed method (Cresswell, 2014). Therefore, this study was carried out with a quasi-experimental
design with 30 pre-school teachers who were a special study group and voluntarily agreed to
participate in the education programs in Eskişehir province (limited sample size) in Turkey. Based on
the need to focus on examining the effects of teacher education programs on targeted teacher
behaviors and to provide time control, the effects of programs on child outcomes and families could
not be examined. Furthermore, naturalistic teaching is a holistic approach containing many strategies,
methods, and techniques. Therefore, in the study, which of the strategies, methods, and techniques
included in the naturalistic teaching approach were used most or least by teachers was not compared
with each other, and all analyses were performed on the total scores obtained from naturalistic
teaching practices.
Within the context of the problems mentioned above, some suggestions that can be made for a more
qualified functioning of the international inclusive education system and inclusive education system
in Turkey and for further studies can be listed as follows: In the literature, inclusive education is
discussed as an “ecological system,” in which many individuals and services (stakeholders, physical
arrangements, support special education services, etc.) should work together. In this context, it is quite
important to develop a qualified and functioning system for inclusive education both in Turkey and in
other developing countries. Within the system, it is recommended to carry out studies on issues such

IOJPE
ISSN: 1300 – 915X
www.iojpe.org
International Online Journal of Primary Education 2021, volume 10, issue 1
Copyright © International Online Journal of Primary Education 231
as preparing various professional development programs for the solution of the lack of knowledge and
education of teachers, developing a physical environment and material opportunities, planning the
services to be provided to children with special needs and their families, and increasing cooperation
between stakeholders. In order to find solutions to the lack of knowledge and education in inclusive
pre-school education, it may be suggested to develop and implement various education programs on
different evidence-based practices such as naturalistic teaching for teachers and families and to make
them widespread. There is a limited number of studies on the relevant subject in the international
literature and in the literature in Turkey, and it is possible to carry out different scientific studies in
which the effects and permanence of naturalistic teaching approach-based face-to-face and web-based
teacher education programs on teachers, children, and families' performances are compared.
Professional development programs on different evidence-based practices can be developed, and their
effectiveness and permanence can be evaluated.
Acknowledgments This study is a part of the Scientific and Technological Research Council of Turkey (TUBITAK)
1001 Program project no.114K164 and was supported within the scope of the Anadolu University
Scientific Research Projects (BAP) project no.1505E433. This study is part of the first author's
doctoral thesis.
REFERENCES
Aldemir, Ö. (2017). Okul öncesi öğretmenlerince sunulan gömülü öğretimin kaynaştırma öğrencilerinin hedef davranışlarını
edinmelerindeki etkileri [The effects of embedded teaching provided by preschool teachers on the acquisition of
target behaviors by inclusive students]. (Unpublished doctoral dissertation thesis). Anadolu University, Eskişehir.
Allen, K. D., & Cowan, R. J. (2008). Naturalistic teaching procedures. In J.K. Luiselli, D.C. Russo, W.P. Christian, & S.M.
Wilczynski (Eds.), Effective practices for children with autism (pp. 213-240). New York: Oxford University Press.
Bailey, D. B., & Winton, P. J. (1987). Stability and change in parents’ expectations about mainstreaming. Topics in Early
Childhood Special Education, 7, 73-88.
Boyd, B. A., Kucharczyk, S., & Wong, C. (2016). Implementing evidence-based practices in early childhood classroom
settings. In B. Reichow, B.A. Boyd, E.E. Barton, & S.L. Odom (Eds.), Handbook of early childhood special
education (pp. 335-347). Switzerland: Springer International Publishing.
Bozarslan, B., & Batu, E. S. (2014). Özel anaokullarında çalışan eğiticilerin okul öncesi dönemde kaynaştırma ile ilgili görüş
ve önerileri [Opinions and suggestions of educators working in private kindergartens about inclusion in the
pre-school period]. Bolu Abant Izzet Baysal University Journal of Faculty of Education, 14(2), 86-108.
Bruder, M. B. (2016). Personnel development practices in early childhood intervention. In B. Reichow, B. A. Boyd, E. E.
Barton, & S. L. Odom (Eds.), Handbook of early childhood special education (pp. 289-333). Switzerland: Springer
International Publishing.
Charlop-Christy, M. H., LeBlanc, L. A., & Carpenter, M. H. (1999). Naturalistic Teaching strategies (NATS) to teach speech
to children with autism: Historical perspective, development, and current practice. The California School
Psychologist, 4(1), 30-46.
Christensen-Sandfort, R. J., & Whinnery, S. B. (2013). Impact of milieu teaching on communication skills of young children
with Autism Spectrum Disorder. Topics in Early Childhood Special Education, 32(4), 211-222.
Cohen, J. (1988). Statistical power analysis for the behavioral sciences (2nd ed.). Hillsdale, NJ: Lawrence Earlbaum
Associates.
Cresswell, J. W. (2011). Educational research: Planning, conducting, and evaluating quantitative and qualitative research
(4th ed.). Pearson Publishing.
Cresswell, J. W. (2014). A Concise introduction to mixed methods research. Thousand Oaks, CA: Sage.
Daymon, C., & Halloway, I. (2010). Qualitative research methods in public relations and marketing communications (2nd
ed.). Routledge Publishing.
Diamond, K. E., & LeFurgy, W. G. (1994). Attitudes of parents of preschool children toward integration. Early Education
and Development, 5, 69-77.

IOJPE
ISSN: 1300 – 915X
www.iojpe.org
International Online Journal of Primary Education 2021, volume 10, issue 1
Copyright © International Online Journal of Primary Education 232
Dick, K. J. (2017). Effects of a coaching intervention on teacher’s implementation of naturalistic strategies to promote
communication in children. (Unpublished doctoral dissertation thesis). University of Kentucky, Lexington,
Kentucky.
Diken, Ö, Topbaş, S., & Diken, İ. H. (2009). Ebeveyn Davranışını Değerlendirme Ölçeği (EDDÖ) ile Çocuk Davranışını
Değerlendirme Ölçeği (ÇDDÖ)’nin geçerlik ve güvenirlik çalışmaları [Validity and reliability studies of the
Parental Behavior Rating Scale (PBRS) and the Child Behavior Rating Scale (CBRS)]. Ankara University Faculty
of Educational Sciences Journal of Special Education, 10(2), 41-60.
Dunst, C. J., Raab, M., & Trivette, C. M. (2011). Characteristics of naturalistic language intervention strategies. Journal of
Speech-Language Pathology and Applied Behavior Analysis, 5(3-4), 8-16.
Emam, M. M., & Mohamed, A. H. H. (2011). Preschool and primary school teachers' attitudes towards inclusive education
in Egypt: The role of experience and self-efficacy. Procedia-Social and Behavioral Sciences, 29, 976-985.
Frantz, R. J. (2017). Coaching teaching assistants to implement naturalistic behavıoral teaching strategies to enhance social
communication skills during play in the preschool classroom. (Unpublished doctoral dissertation thesis).
University of Oregon, United States.
Gianoumis, S., Seiverling, L., & Sturney, P. (2012). The effects of behavior skills training on correct teacher implementation
of natural language paradigm teaching skills and child behavior. Behavioral Interventions, 27, 57-74.
Halle, J., Albert, C. L., & Anderson, S. L. (1984). Natural environment language assessment and intervention with severely
impaired preschoolers. Topics in Early Childhood Special Education, 4, 36-56.
Han, S. P. (2012). Professional development that works: Shifting preschool teachers’ beliefs and use of instructional
strategies to promote children’s peer social competence. Journal of Early Childhood Teacher Education, 33, 251-
268.
Harjusola-Webb, S. M., & Robbins, H. (2012). The effects of teacher-implemented naturalistic intervention on the
communication of preschoolers with autism. Topics in Early Childhood Special Education, 32(2) 99-110.
Hemmeter, M. L., Snyder, P., Kinder, K., & Artman, K. (2011). Impact of performance feedback delivered via electronic
mail on preschool teachers’ use of descriptive praise. Early Childhood Research Quarterly, 26, 96-109.
Huck, S. W. (2008). Reading statistics and research (5th ed.). Boston: Pearson. In W. Damon & R. Lerner (Series Eds.) & R.
M. Lerner (Vol. Ed.), Handbook of child psychology: Vol 1: Theoretical models of human development (6th ed., pp.
793-828.). New York Wiley.
Karaaslan, O., & Mahoney, G. (2013). Effectiveness of responsive teaching with children with Down syndrome. Intellectual
and Developmental Disabilities, 51, 458-469.
Karaaslan, O., Diken, I. H., & Mahoney, G. (2013). A randomized control study of responsive teaching with young Turkish
children and their mothers. Topics in Early Childhood Special Education, 33, 18-27.
Karasar, N. (2011). Bilimsel araştırma yöntemleri [Scientific research methods] (22nd ed.). Ankara: Nobel Publishing.
Kasari, C., Freeman, S. F. N., Bauminger, N., & Alkin, M. C. (1999). Parental perspectives on inclusion: Effects of autism
and Down syndrome. Journal of Autism and Developmental Disorders, 29, 297-305.
Koegel, R. L., O’Dell, M. C., & Koegel, L. K. (1987). A natural language paradigm for teaching non-verbal autistic children.
Journal of Autism and Developmental Disorders, 17, 187-199.
Kohler, F. W., Anthony, L. J., Steighner, S. A., & Hoyson, M. (2001). Teaching social interaction skills in the integrated
preschool: An examination of naturalistic tactics. Topics in Early Childhood Special Education, 21(2), 93-103.
Krischler, M., Pit-ten Cate, I. M., & Krolak-Schwerdt, S. (2018). Mixed stereotype content and attitudes toward students
with special educational needs and their inclusion in regular schools in Luxembourg. Research in Developmental
Disabilities, 75, 59-67.
Kruger, R. A., and Casey, M. A. (2000). Focus groups: A practical guide for applied research (3rd ed.). Thosand Oaks:
Sage.
Malmskog, S., & McDonnell, A. P. (1999). Teacher-mediated facilitation of engagement by children with developmental
delays in inclusive preschools. Topics in Early Childhood Special Education, 19(4), 213-216.
Marsicano, R. T., Morrison, J. Q., Moomaw, S. C., Fite, N. M., & Kluesener, C. M. (2015). Increasing math milieu teaching
by varying levels of consultation support: An example of analyzing intervention strength. Journal of Behavioral
Education, 24, 112-132.
McWilliam, R. A. (2016). Birth to three: Early intervention. In B. Reichow, B. A. Boyd, E. E. Barton, & S. L. Odom (Eds.),
Handbook of early childhood special education (pp. 75-347). Switzerland: Springer International Publishing.

IOJPE
ISSN: 1300 – 915X
www.iojpe.org
International Online Journal of Primary Education 2021, volume 10, issue 1
Copyright © International Online Journal of Primary Education 233
Morse, J. M. (1991). Approaches to qualitative-quantitative methodological triangulation. Nursing Research, 40, 120-123.
National Autism Center [NAC]. (2015). Findings and conclusions: National standards project, phase 2. Randolph, MA:
Author.
National Professional Development Center on Autism Spectrum Disorder [NPDC]. (2014). What are evidence-based
practices? Retrieved from https://autismpdc.fpg.unc.edu/evidence-based-practices.
Odom, S. L. (2016). The role of theory in early childhood special education and early intervention. In B. Reichow, B. A.
Boyd, E. E. Barton, & S. L. Odom (Eds.), Handbook of early childhood special education (pp. 21-37).
Switzerland: Springer International Publishing.
Odom, S. L. (Ed.). (2002). Widening the circle: Including children with disabilities in preschool programs. New York, NY:
Teacher College Press.
Odom, S. L., Peck, C. A., Hanson, M., Beckman, P. J., Kaiser, A. P., Lieber, J., … Schwartz, I. (1996). Inclusion of
preschool children with disabilities: An ecological systems perspective. SRCD Social Policy Report, 10(2-3), 18-
30.
Odom, S. L., Wolery, R., Leiber, J., and Hanson, M. J. (2002). Social policy and preschool inclusion. In S. L. Odom (Ed.),
Widening the circle: Including children with disabilities in preschool programs (pp. 120-136). New York, NY:
Teachers College Press.
Ornstein, A. C., & Hunkins, F. P. (2008). Curriculum: Foundations, principles, and issues (5th ed.). Allyn & Bacon
Publishing.
Pallant, J. (2011). SPSS survival manual. A step by step guide to data analysis using SPSS (4th ed.). Allen & Unwin.
Patton, M. Q. (2002). Qualitative research and evaluation methods (3rd ed.). Thosand Oaks: Sage.
Pianta, R. C., Mashburn, A. J., Downer, J. T., Hamre, B. K., & Justice, L. (2008). Effects of web-mediated professional
development resources on teacher-child interactions in pre-kindergarten classrooms. Early Childhood Research
Quarterly, 23. 431-451.
Rakap, S. (2019). Re-visiting transition-based teaching: Impact of pre-service teacher's implementation on child outcomes.
Learning and Instruction, 59, 54-64.
Rakap, S., & Parlak-Rakap, A. (2011). Effectiveness of embedded instruction in early childhood special education: A
literature review. European Early Childhood Education Research Journal, 19(1), 79-96.
Rakap, S., & Rakap, S. (2014). Parent-implemented naturalistic language interventions for young children with disabilities:
A systematic review of single-subject experimental research studies. Educational Research Review, 13, 35-51.
Rakap, S., Parlak-Rakap, A., & Aydın, B. (2016). Investigation and comparison of Turkish and American preschool teacher
candidates’ attitudes towards inclusion of young children with disabilities, International Journal of Inclusive
Education, 20(11), 1223-1237.
Stahmer, A. C., Rieth, S., Lee, E., Reisinger, E. M., Mandell, D., & Connell, J. E. (2015). Training teachers to use evidence-
based practices for autism: Examining procedural implementation fidelity. Psychology in the Schools, 52(2), 181-
195.
Storie, S., Coogle, C. G., Rahn, N., & Ottley, J. R. (2017). Distance coaching for pre-service teachers: Impacts on children’s
functional communication in inclusive preschool classrooms. Early Childhood Education Journal, 45, 735-743.
Sucuoǧlu, B., Bakkaloğlu, H., İşçen-Karasu, F., Demir, Ş., & Akalın, S. (2013). Inclusive preschool teachers: Their attitudes
and knowledge about inclusion. International Journal of Early Childhood Special Education, 5(2), 107-128.
Sucuoğlu, B., Bakkaloğlu, H., Akalın, S., Demir, Ş., & İşçen-Karasu, F. (2015). The effects of the preschool inclusion
program on teacher outcomes in Turkey. Journal of Early Childhood Teacher Education, 36(4), 324-341.
Şeker, H., & Gençdoğan, B. (2006). Psikoloji ve eğitimde ölçme aracı geliştirme [Developing a measurement tool in
psychology and education] (2. bs.). Ankara: Nobel Publishing.
Tabachnick, B. G., & Fidell, L. S. (2007). Using multivariate statistics (5th ed.). New York: Allyn and Bacon.
Tate, T. L., Thompson, R. H., & McKerchar, P. M. (2005). Training teachers in an infant classroom to use embedded
teaching strategies. Education and Treatment of Children, 28(3), 206-221.
Ünal, F. (2018). Okul öncesi öğretmenlerine gömülü öğretime dayalı web ortamında sunulan danışmanlığın öğretmenlerin
gömülü öğretim becerileri ve öğrencilerinin hedef davranışları öğrenim düzeyi üzerindeki etkililiği [The
effectiveness of counseling provided to pre-school teachers in the web environment based on embedded teaching
on teachers' embedded teaching skills and students' levels of learning target behaviors] (Unpublished doctoral
dissertation thesis). Anadolu University, Eskişehir.

IOJPE
ISSN: 1300 – 915X
www.iojpe.org
International Online Journal of Primary Education 2021, volume 10, issue 1
Copyright © International Online Journal of Primary Education 234
Winton, P., Turnbull, A. P., Blacher, J. B., & Salkind, N. (1983). Mainstreaming in the kindergarten classroom: Perspectives
of parents of handicapped and nonhandicapped children. Journal of the Division for Early Childhood, 6, 14-20.
Wolery, M., Anthony, L., Caldwell, N. K., Snyder, E. D., & Morgante, J. D. (2002). Embedding and distributing constant
time delay in circle time and transitions. Topics in Early Childhood Special Education, 22(1), 14-25.

IOJPE
ISSN: 1300 – 915X
www.iojpe.org
International Online Journal of Primary Education 2021, volume 10, issue 1
Copyright © International Online Journal of Primary Education 235
INVESTIGATION OF VERBS USED BY PRE-SERVICE PRIMARY
SCHOOL TEACHERS IN THE CONTEXT OF HIERARCHY OF NEEDS
WITH THE SOM-WARD METHOD
İlyas YAZAR
Assoc.Prof.Dr., Department of Elementary Education, Dokuz Eylül University, Turkey
ORCID: https://orcid.org/0000-0002-6784-289X
Dilek HAZAR
Department of Mathematics Education, Dokuz Eylül University, Turkey
ORCID: https://orcid.org/0000-0002-0465-1455
Cenk KEŞAN
Prof.Dr., Department of Mathematics Education, Dokuz Eylül University, Turkey
ORCID: https://orcid.org/0000-0003-2629-8119
Mehmet ÖZER
Assist.Prof.Dr., Department of Elementary Education, Dokuz Eylül University, Turkey
ORCID: https://orcid.org/0000-0001-5274-2936
Received: June 04, 2020 Accepted: February 24, 2021 Published: June 30, 2021
Suggested Citation:
Yazar, I., Hazar, D., Keşan, C., & Özer, M. (2021). Investigation of verbs used by pre-service primary school teachers in the
context of hierarchy of needs with the SOM-Ward method. International Online Journal of Primary Education (IOJPE), 10(1),
235-250.
This is an open access article under the CC BY 4.0 license.
Abstract
The current study examines the verbs used by pre-service primary school teachers in everyday language in the context of the
hierarchy of needs using the SOM-Ward clustering method. The study group of this survey research consists of 271 pre-service
primary school teachers studying at a public university in Turkey. In this research, pre-service primary school teachers were
asked to list the most 10 frequently used verbs in everyday language. Descriptive analysis was conducted by coding the verbs
according to the themes of the hierarchy of needs. The intercoders reliability was calculated as 96 percent. The mean ranks
were calculated on the data obtained according to this coding. Through the SOM-Ward clustering analysis, it was observed that
the pre-service primary school teachers were separated into four clusters. Although not hierarchic, the C1 cluster is compatible
in terms of basic needs; biological and physiological needs were preferred, and then the personal preferences of individuals
were prioritized in determining the needs. Individual preferences prevent the hierarchical approach in determining the needs of
the C2-C3-C4 clusters; it was seen that the love, safety and the aesthetic needs of those who formed these clusters are far greater
than their basic needs. This reveals that there may be greater and higher priority life needs than biological and physiological
needs in an individual. In addition, it was determined that the needs of esteem and superiority shown in the pyramid did not
play a decisive role in the clusters since they did not make a significant impact.
Keywords: SOM-Ward analysis, verb, hierarchy of needs, primary school.
INTRODUCTION
Language is accepted as the greatest ability that people acquire unconsciously and also it is a nested
system which is shaped by the communities. The communities use it, and the language forms the basis
of the agreements that society considers appropriate. Although the carrier characteristics of the common
culture come to the fore in the formation of this basis, it is not possible to explain many differences
regarding the use of language within the same cultural structure by using a random approach. As a result
of the combination of human creativity and flexibility brought by individual language, which is unique

IOJPE
ISSN: 1300 – 915X
www.iojpe.org
International Online Journal of Primary Education 2021, volume 10, issue 1
Copyright © International Online Journal of Primary Education 236
to the person, emerging of these differences is quite normal in terms of daily language. The language
usage patterns of each individual in every society throughout history have been different. These forms
of use contain many clues that have not been explicitly stated but noticed about the individual using
them. Signs such as the spoken words, the chosen words, and the phonetic and morphological features
of the language produced are included as aids which identify the language user. For example, while
speaking on the phone, it is possible to make inferences about the speaker’s age, gender, mood,
education level, society in which he grew up, and culture, even if the speaker himself does not say these
things. In this regard, the examination and understanding of the differences in everyday language use
are primarily related to the knowledge of the individual who uses the language and the language used.
In today's world, it is seen that studies are conducted for the different uses and subtleties of language,
and functional features of a language are emphasized in this context. Within this approach, language is
seen as a part of daily activities and evaluated in these relations. Everyday linguists study language
considering variables such as the orientation and actions of the speaker and the listener. Austin (2009)
mentions that this language, which is used for everyday purposes such as betting, has an indispensable
value for human life since everyday language has a long historical background and it uses the features
of everyday language for different purposes while making various distinctions in the historical process
(Austin, 2009, p. 16). It is seen that human beings can distinguish the male from the female, the living
being from the abiotic, the friend from the enemy, and the good from the bad, thanks to daily language,
which is one of the most natural elements as a means of communication in its great variety of forms in
the universe of life. These distinctions, which extend almost to infinity in everyday language, are not
without reason and support. In every distinction and awareness created, humanity's everlasting worldly
efforts have a purpose, reflection and trace (Çelebi, 2014, p. 74-77).
In our study, while evaluating the factors related to individual’s daily language, basic needs and analyses
related to Maslow's classification were taken into consideration, rather than reasons such as mental
association, socio-economic status or educational level differences. Because human beings exist in the
historical process, they continue their lives as social beings in relation to the dynamic structure and
perception of the value of the society they live in today. The individual has been living in a programmed
way from the first moment he was born in order to meet his needs and to adapt to the conditions of his
universe. Especially, the feeling of hunger in the first moment the individual opens his eyes to the world
clearly shows the individual's need for nutrition. Vital findings reveal the unlimited efforts of the
individual to meet their needs from birth to death. The individual, who must meet his needs due to his
physiological structure, must live in production and consumption to fulfill the requirements that have a
vital function for life. From past to present, individuals have been trying to meet their needs primarily
to produce and consume. In this context, since the individual must meet his physiological needs, s/he
focuses primarily on basic needs such as nutrition and shelter. Besides physiological needs, needs such
as security, love, esteem and self-actualization are among the goals that the individual wants to achieve.
Today, no matter how unlimited the individual's needs are, human beings can only meet their needs at a
certain level according to their situation. For example, while the primary need for a child living in Africa
is only nutrition, the needs in different geographies may reflect different variables.
The individual fulfills his needs in certain steps. It is not expected for the individual to meet the need
for security or love and esteem without fulfilling the need for nutrition and shelter. In this regard,
Maslow has made some insights by creating a hierarchy of needs. According to these findings, it was
underlined that each goal determined in the context of the hierarchy of needs is related to the other, and
the target or need that has the best probability in this context is a preliminary step that must be fulfilled
in the required conditions. According to Maslow, it is predicted that the individual who meets the needs
or needs at any step will be satisfied with the target in the next step of the hierarchy. In this context, in
terms of the hierarchy of needs, the individual cannot move to the need for security without meeting his
physiological needs. This situation also reveals that the needs of individuals are conducted in steps (Shi
& Lin, 2021; Toker, 2007, p. 94-95; Walsh, 2011, p. 791).

IOJPE
ISSN: 1300 – 915X
www.iojpe.org
International Online Journal of Primary Education 2021, volume 10, issue 1
Copyright © International Online Journal of Primary Education 237
The hierarchy of needs was originally introduced as a five-step structure including "physiological-
biological needs, security needs, love-belonging needs, esteem needs and self-actualization," but over
time, it was transformed into an eight-step structure with the addition of "cognitive needs, aesthetic
needs and transcendence" (Maslow, 1970, p. 176). Physiological-biological needs are our basic needs
such as food, water, air, sleep, warming and reproduction, which are necessary for us to continue our
lives. These needs are more important than any other needs. The need for security means safety/security
so we can survive; we need a home, a neighborhood, an economy, and our health security. The feeling
of being loved, accepted, the desire to belong, and the need to be alone are included in the step of the
needs for love-belonging. These needs are met by friendship, family relationships, and membership in
social groups. Every person should feel valued, respected and confident. These esteem needs are met by
participating in social activities, acquiring hobbies, and achieving academic success. The need for
self-actualization is the state of self-realization of the person completely. Realizing every need may
bring about the state of being. For a person to do this, they must have fulfilled their above needs
completely. With these determinations, Maslow contributed to psychology by directing the attention to
the positive aspects of human nature, aspects which give mental health and focus on human potential
(Kleinman, 2014, p. 137-142). However, differences can be put forward in the hierarchy of needs for
each culture because the situation of providing priority for the needs and their satisfaction caused by
different cultures or significantly differentiating environmental adaptation problems may change the
priority of advancement in the steps of the hierarchy of needs (Abdullah & Gallagher, 1995; Hagerty,
1998; Hofstede, 1980; Martinez, 2020; Montag, Sindermann, Lester, & Davis, 2020; Nevis, 1983, Rama,
Harris, Speegle, Nelson, Moen, & Harris, 2020; Taormina & Gao, 2013; Ye, Ng, & Lian, 2015). For
example, the Chinese hierarchy of needs is composed of belonging, physiology, safety, self-actualization
in the service of society, respectively, as explained by Nevis (1983). While Maslow’s hierarchy of needs
stems from Western culture and focuses on the inner needs of individuals, the Chinese hierarchy of
needs stems from Eastern culture and focuses on requirements of the social order (Awanis,
Schlegelmilch, & Cui, 2017; Nevis, 1983; Scheffer & Heckhausen, 2018; Schwartz, 1990). Different
ethnic groups in Iran emphasized basic needs, esteem needs, and self-actualization as interpreted by
Mousavi and Dargahi (2013).
The individual primarily uses the communication elements in meeting his needs. This process, which
starts with body language communication with the individual's arrival in the world, moves to verbal
communication in proportion to psycho-motor and physical developments over time, and written
communication channels can be used eventually. The ability of the individual to use language
proficiency in expressing himself is extremely important.
Today, generations that grow up in the age of information and communication, adopting the technology-
oriented life philosophy can reveal negative results in the development of language skills. The increase
in the number of digital natives who are unable to express their troubles, explain their curiosity and have
difficulty in putting together three or five sentences because of the onset of the information age may be
among the most important problems of societies in this century. This situation should be evaluated as a
corruption, both in the individual and in the culture of a society. Together with the changing world, our
needs also change. According to Nair (2020), the hierarchy of needs for the 21st century is composed of
physiological needs, psychological needs, spiritual needs, self-esteem and existential needs.
In this context, this study is important because it determines and expresses individual needs of
pre-service primary school teachers, uses different language skills such as reflection and presentation,
and shows what language proficiency and everyday language vocabulary mean to the individual and
how much these things are kept in mind and how and to what extent they can be used.
The verbs we use during conversation find a parallel in the different steps in the eight-tier structure of
the hierarchy of needs. For example, while the verbs of hunger and shopping show the behaviors of the
biological-physiological need level, understanding is an example of the behaviors of the aesthetic needs
level and dancing is an example of the cognitive needs level.

IOJPE
ISSN: 1300 – 915X
www.iojpe.org
International Online Journal of Primary Education 2021, volume 10, issue 1
Copyright © International Online Journal of Primary Education 238
The verbs that individuals use in everyday language and the existence of clusters with similar
characteristics according to these verbs are questioned within the scope of this research. When the verbs
are evaluated according to Maslow's hierarchy of needs, what behaviors are seen in clusters with similar
characteristics, their usage frequency, and their hierarchical structures are also revealed.
SOM-Ward Clustering Method
Self-Organizing Maps (SOM) is an effective software tool in which the results obtained using nonlinear
relations between the multi-dimensional input data and the geometric connections between the data are
usually converted into two-dimensional images. This method can also be considered an abstraction
process, as it shortens information while preserving the most important topological-metric properties of
key data components. The process consists of visualization and abstraction stages in which complex
processes such as process analysis, machine detection, control and communication are evaluated
(Kohonen, 1990).
Figure 1. SOM structure
As shown in Figure 1, SOM consists of two interconnected layers, the input layer and the Kohonen
layer. The number of neurons in the input layer is equivalent to the number of attributes of the objects,
and each neuron in the input layer has a feedforward link with every neuron in the Kohonen layer. After
the input data are normalized, inputs are calculated in the Kohonen layer with 𝑦𝑗 = ∑ 𝑤𝑗𝑖𝑥𝑖𝑑𝑖=1 . Here wji
is the weight value of the communication from the input neuron at i to the output neuron at 𝑗 in the
Kohonen layer. Under a winner-takes-all paradigm, the neuron in the Kohonen layer with the biggest 𝑦𝑗
value will be chosen as the winner neuron (Gan, Ma, & Wu, 2007). The SOM algorithm starts by being
initialized with all the connection weights in the network having small random values. Then, the
algorithm continues with the competition, cooperation and adaptation processes (Haykin, 1999).
In the competition process, an object is randomly selected from the input layer 𝑥 = (𝑥1, 𝑥2, … , 𝑥𝑑)𝑇 (d is
the size of the input layer). 𝑑∗ is the total number of neurons in the Kohonen layer, and the weight vector
of the neuron at the j in the Kohonen layer is determined by 𝑤𝑗 = (𝑤𝑗1, 𝑤𝑗2, … , 𝑤𝑗𝑑∗)𝑇 , 𝑗 = 1,2, … , 𝑑∗.
The winner neuron of the input object is denoted by 𝑖(𝑥) = arg 𝑚𝑖𝑛‖𝑥 − 𝑤𝑗‖ , 1 ≤ 𝑗 ≤ 𝑑∗.
The collaboration process is the process of determining the topological neighborhood so that the winner
neuron is at the center of collaborative neurons. The winning neuron is t, and its topological
neighborhood is determined by ℎ𝑗,𝑡. 𝑑𝑡,𝑗 is shown as the distance between the winner neuron t and the
stimulated neuron j.
ℎ𝑗,𝑡 is the symmetry of the maximum point defined by 𝑑𝑡,𝑗 = 0. The width of ℎ𝑗,𝑡 decreases regularly
compared to the adjacent neighborhood of 𝑑𝑡,𝑗 and drops to zero in the case of 𝑑𝑡,𝑗 → ∞. The lateral
distance is defined by 𝑑𝑡,𝑗 = |𝑡 − 𝑗| in lattice. 𝑟𝑡 and 𝑟𝑗 are discrete vectors that determine the positions
of the stimulated neuron 𝑡 and the winner neuron 𝑗 in the two-dimensional lattice model, and the
adjacent neighborhood of 𝑑𝑡,𝑗 is determined by 𝑑𝑡,𝑗 = ‖𝑟𝑡 − 𝑟𝑗‖.
In the adaptation process, 𝑤𝑗 that is the weight vector of the neuron 𝑗 varies according to input object x.
When the learning rate parameter is 𝜂(𝑠) = 𝜂0 exp (−𝑠
𝜏2) , 𝑠 = 0,1,2, … and 𝜎(𝑠) = 𝜎0(−
𝑠
𝜏1), the
neighborhood function is defined as ℎ𝑖𝑗(𝑥)(𝑠) = exp (−𝑑𝑖(𝑥),𝑗
2
2𝜎2(𝑠)) , 𝑠 = 0,1,2, …. If the given weight vector of

IOJPE
ISSN: 1300 – 915X
www.iojpe.org
International Online Journal of Primary Education 2021, volume 10, issue 1
Copyright © International Online Journal of Primary Education 239
neuron j is 𝑤𝑗(𝑠), the new weight vector is determined by 𝑤𝑗
(𝑠+1) = 𝑤𝑗(𝑠) + 𝜂(𝑠)ℎ𝑖𝑗(𝑥)(𝑠)(𝑥 −
𝑤𝑗(𝑠)). Constants can be taken as 𝜂0 = 0.1, 𝜎0 = 𝑙𝑎𝑡𝑡𝑖𝑐𝑒 𝑟𝑎𝑑𝑖𝑢𝑠, 𝜏1 =
1000
log 𝜎0, 𝜏2 = 1000 (Haykin, 1999).
The current study works to order pre-service primary school teachers by their overall similarity
according to the verbs they use most frequently in daily life. For this purpose, the verbs used by
pre-service primary school teachers in daily life were evaluated according to Maslow's hierarchy of
needs. The most frequently used hierarchy steps in daily life were determined according to the verbs
evaluated by using Maslow's hierarchy of needs. Pre-service primary school teachers with similar
characteristics were divided into clusters using the nonparametric regression method. Thus, the study
aims to determine needs most frequently expressed by pre-service primary school teachers in Turkish
culture today and to examine the characteristics of the groups formed according to the priority of the
needs. This study is important in terms of examining the needs and priorities shaped by cultures,
especially changing Turkish culture, and analyzing the characteristics of the pre-service primary teacher
groups that have been ordered by overall similarity concerning prior needs.
METHOD
The research examines the groups formed by those who have similar characteristics, classifying the data
obtained according to the hierarchy of needs by identifying the verbs used in daily life by students
studying in the primary school teaching program. In this context, the study is a survey study. Field
survey studies are conducted to determine the current status of the event or problem to be investigated
(Çepni, 2018). The survey method requires a sample, data collection, data analysis, and construction of
quantitative descriptors of the sample of study (Groves, Fowler, Couper, Lepkowski, Singer, &
Tourangeau, 2009).
Study Group
The study group of the research consisted of 271 undergraduate students studying in a public university
in the faculty of education in the primary school teaching program.
Data Collection Tool
“Write down the top ten verbs you use most frequently in your daily life in order of priority.” was the
instruction given to the students. They wrote the most frequently used verbs in daily life from first to
tenth. The implementation of the data collection tool took about 20 minutes. When the data were
examined, those who did not write ten of the most frequently used verbs in daily life were not taken into
consideration, and the first ten verbs of those who wrote more than ten were evaluated.
Data Analysis
The data, that is, the verbs that students use in daily life, are classified themes according to the steps of
the hierarchy of needs. Descriptive analysis was performed. The coding process for the themes
determined according to Maslow was carried out independently by five researchers who are experts in
their field. The reliability coefficient that shows the internal validity between coders was calculated
using the formula 𝛥 = ∁ ÷ (∁ + 𝜕) × 100 (Miles & Huberman, 1994). Here, 𝛥 refers to the coefficient
of reliability, ∁ is the number of terms with which consensus is reached, 𝜕 is the number of terms with
which there is no consensus. The adjustment among coders is expected to be at least 80% (Patton, 2002).
As a result of the calculations, it was seen that the percentages of adaptation ranged between 51 and 96
percent and the highest compliance percentage of coders was used. The explanation of the themes is
given in Table 1.
Table 1. Themes (Maslow, 1970)
Theme Explanation
Biological and physiological needs Air, food, water, shelter, temperature, sexuality, sleep
Security needs Protection from natural events, safety, order, law, stability, fearlessness
Love and belonging needs Friendship, sincerity, trust and acceptance, love and interest exchange,
attachment, belonging to a group (family, friend, work)
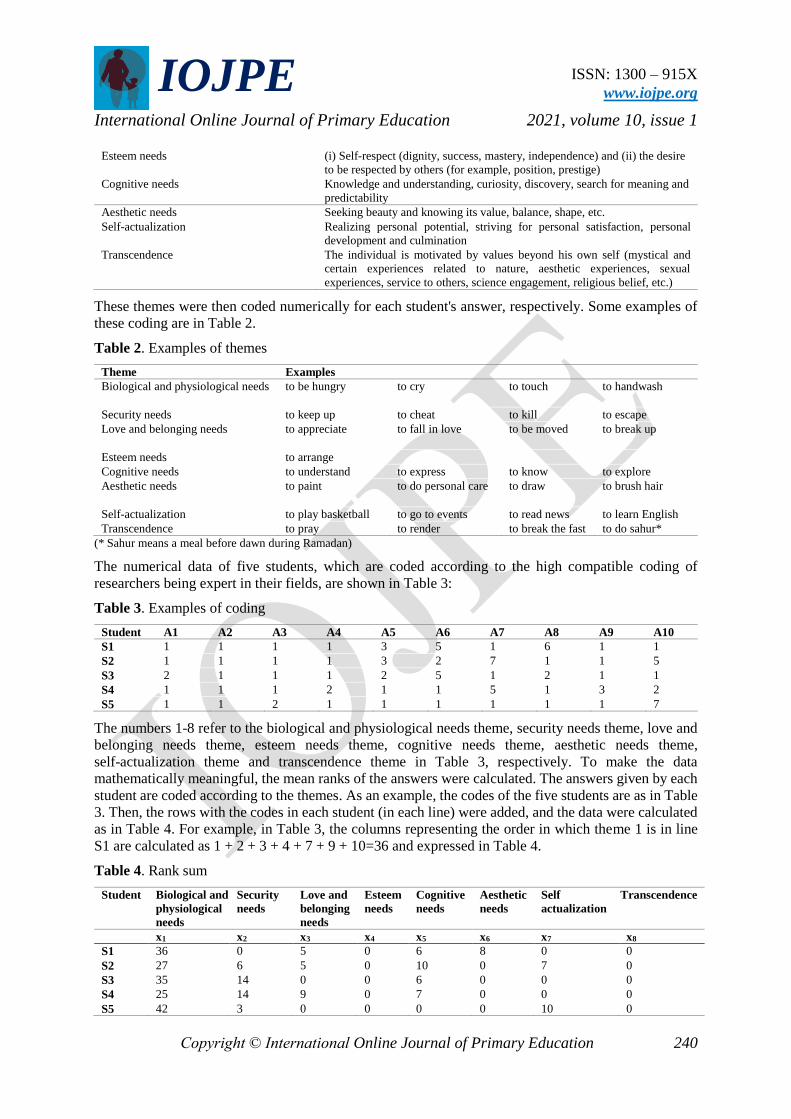
IOJPE
ISSN: 1300 – 915X
www.iojpe.org
International Online Journal of Primary Education 2021, volume 10, issue 1
Copyright © International Online Journal of Primary Education 240
Esteem needs (i) Self-respect (dignity, success, mastery, independence) and (ii) the desire
to be respected by others (for example, position, prestige)
Cognitive needs Knowledge and understanding, curiosity, discovery, search for meaning and
predictability
Aesthetic needs Seeking beauty and knowing its value, balance, shape, etc.
Self-actualization Realizing personal potential, striving for personal satisfaction, personal
development and culmination
Transcendence The individual is motivated by values beyond his own self (mystical and
certain experiences related to nature, aesthetic experiences, sexual
experiences, service to others, science engagement, religious belief, etc.)
These themes were then coded numerically for each student's answer, respectively. Some examples of
these coding are in Table 2.
Table 2. Examples of themes
Theme Examples
Biological and physiological needs to be hungry
to cry
to touch to handwash
Security needs to keep up to cheat to kill to escape
Love and belonging needs to appreciate
to fall in love to be moved to break up
Esteem needs to arrange
Cognitive needs to understand to express to know to explore
Aesthetic needs to paint to do personal care to draw to brush hair
Self-actualization to play basketball to go to events to read news to learn English
Transcendence to pray to render to break the fast to do sahur*
(* Sahur means a meal before dawn during Ramadan)
The numerical data of five students, which are coded according to the high compatible coding of
researchers being expert in their fields, are shown in Table 3:
Table 3. Examples of coding
Student A1 A2 A3 A4 A5 A6 A7 A8 A9 A10
S1 1 1 1 1 3 5 1 6 1 1
S2 1 1 1 1 3 2 7 1 1 5
S3 2 1 1 1 2 5 1 2 1 1
S4 1 1 1 2 1 1 5 1 3 2
S5 1 1 2 1 1 1 1 1 1 7
The numbers 1-8 refer to the biological and physiological needs theme, security needs theme, love and
belonging needs theme, esteem needs theme, cognitive needs theme, aesthetic needs theme,
self-actualization theme and transcendence theme in Table 3, respectively. To make the data
mathematically meaningful, the mean ranks of the answers were calculated. The answers given by each
student are coded according to the themes. As an example, the codes of the five students are as in Table
3. Then, the rows with the codes in each student (in each line) were added, and the data were calculated
as in Table 4. For example, in Table 3, the columns representing the order in which theme 1 is in line
S1 are calculated as 1 + 2 + 3 + 4 + 7 + 9 + 10=36 and expressed in Table 4.
Table 4. Rank sum
Student Biological and
physiological
needs
Security
needs
Love and
belonging
needs
Esteem
needs
Cognitive
needs
Aesthetic
needs
Self
actualization
Transcendence
x1 x2 x3 x4 x5 x6 x7 x8
S1 36 0 5 0 6 8 0 0
S2 27 6 5 0 10 0 7 0
S3 35 14 0 0 6 0 0 0
S4 25 14 9 0 7 0 0 0
S5 42 3 0 0 0 0 10 0

IOJPE
ISSN: 1300 – 915X
www.iojpe.org
International Online Journal of Primary Education 2021, volume 10, issue 1
Copyright © International Online Journal of Primary Education 241
Then, how many times the student wrote each theme (in each line) was calculated according to Table 3
(Table 4). For example, the first student wrote verbs on theme 1 in seven rows, no verb was written for
themes with codes 2, 4, 7, and 8 and one verb was written for themes with codes 3, 5, and 6. As a result,
the first row of Table 5, 7,0,1,0,1,1,0,0, respectively, was calculated. These calculations were made for
other students and the data of the first five students are shown in Table 5.
Table 5. Number of themes
Student Biological
and
physiological
needs
Security
needs
Love and
belonging
needs
Esteem
needs
Cognitive
needs
Aesthetic
needs
Self
actualization
Transcendence
x1 x2 x3 x4 x5 x6 x7 x8
S1 7 0 1 0 1 1 0 0
S2 6 1 1 0 1 0 1 0
S3 6 3 0 0 1 0 0 0
S4 6 2 1 0 1 0 0 0
S5 8 1 0 0 0 0 1 0
Then, the rank-sum values in Table 4 were divided by the number of themes in Table 5 and the mean
ranks of themes were obtained and is shown in Table 6. Instead of undefined values (0 ÷ 0), 0 was
written.
Table 6. Mean rank of themes
Student Biological and
physiological
needs
Security
needs
Love and
belonging
needs
Esteem
needs
Cognitive
needs
Aesthetic
needs
Self
actualization
Transcendence
x1 x2 x3 x4 x5 x6 x7 x8
S1 5.142857 0 5 0 6 8 0 0
S2 4.5 6 5 0 10 0 7 0
S3 5.833333 4.666667 0 0 6 0 0 0
S4 4.166667 7 9 0 7 0 0 0
S5 5.25 3 0 0 0 0 10 0
For the answers given by students to be meaningful in accordance with the order (since ten answers
were given), each numerical value was subtracted from 11 and made ready for analysis. The first five
students belonging to these data are shown in Table 7.
Table 7. Optimized data for analysis
Student Biological
and
physiological
needs
Security
needs
Love and
belonging
needs
Esteem
needs
Cognitive
needs
Aesthetic
needs
Self
actualization
Transcendence
x1 x2 x3 x4 x5 x6 x7 x8
S1 5.857143 0 6 0 5 3 0 0
S2 6.5 5 6 0 1 0 4 0
S3 5.166667 6.333333 0 0 5 0 0 0
S4 6.833333 4 2 0 4 0 0 0
S5 5.75 8 0 0 0 0 1 0
All these calculations are done in Excel. SOM-Ward cluster analysis was applied to the data obtained
from Excel using the Viscovery SOMine program.
The SOM-Ward method, one of the nonparametric regression techniques, creates a nonlinear
representation of data distribution by reducing multidimensional data spaces to lower dimensions and
helps define visually homogeneous data groups (Augustin et al., 2018). Pre-service primary school
teachers were ordered by their overall similarity regarding their frequently used verbs coded according
to the hierarchy of needs. Clusters were generated by using SOM-Ward cluster analysis. Converting into
lower-dimensional abstraction process was carried out by using the two-sided t-test with a confidence

IOJPE
ISSN: 1300 – 915X
www.iojpe.org
International Online Journal of Primary Education 2021, volume 10, issue 1
Copyright © International Online Journal of Primary Education 242
of 95% to identify each cluster of all pre-service primary teacher characteristics that differ significantly
from the study sample. Thus, we can see visual clusters with homogeneous data. Viscovery also
automatically calculated the absolute profile median, frequency, mean, standard deviation for
quantitative variables, percentage for discrete variables, t-test scores, and p-value for the t-test.
RESULTS
As a result of the analyses, there are four clusters that show similar characteristics with the pre-service
primary school teachers’ daily life verbs coded according to the hierarchy of needs. These clusters are
named C1, C2, C3, and C4. The number (N), absolute profile median, frequency, and mean of the eight
themes in these four clusters are shown in Table 8:
Table 8. Characteristics of clusters
N Absolute
profile
median
Frequency x1 x2 x6 x7 x3 x5 x4 x8
C1 123 .3223 45.39 6.211 1.95 .09 3.60 .54 2.50 .00 .016
C2 74 .3680 27.31 5.348 7.42 .05 2.51 .74 3.58 .122 .34
C3 63 .9620 23.25 5.926 4.00 .07 1.70 6.44 2.31 .00 .00
C4 11 2.4844 4.05 5.669 2.03 5.91 3.27 1.82 2.82 .00 .00
Through processing the data in SOM-Ward analysis, 45.93, 27.31, 23.25 and 4.06 percent constituted
C1, C2, C3, and C4 clusters, respectively. With the map obtained from SOM-Ward analysis, the
sequence of verbs of the students also reveals in which cluster they will occur. The map of the clusters
is given in Figure 2.
Figure 2. SOM-Ward cluster map
Table 9. Analysis results of C1
Mean Std.Dev. Diff. mean Profile p t-test
x1 6.211 .75 5.5 .3223 .00 5.053
x2 1.95 2.13 -50.3 -.6149 .00 11.13
x6 .09 .41 -71.3 -.1739 .0088 2.639
x7 3.60 2.96 26.4 .2617 .0001 4.038
x3 .54 1.34 -73.1 -.5099 .00 8.63
x5 2.50 3.15 -9.5 .0836 .2105 1.255
x4 .00 .00 -100 -.0607 .3629 .9114
x8 .016 .180 -83.8 -.1032 .1218 1.552
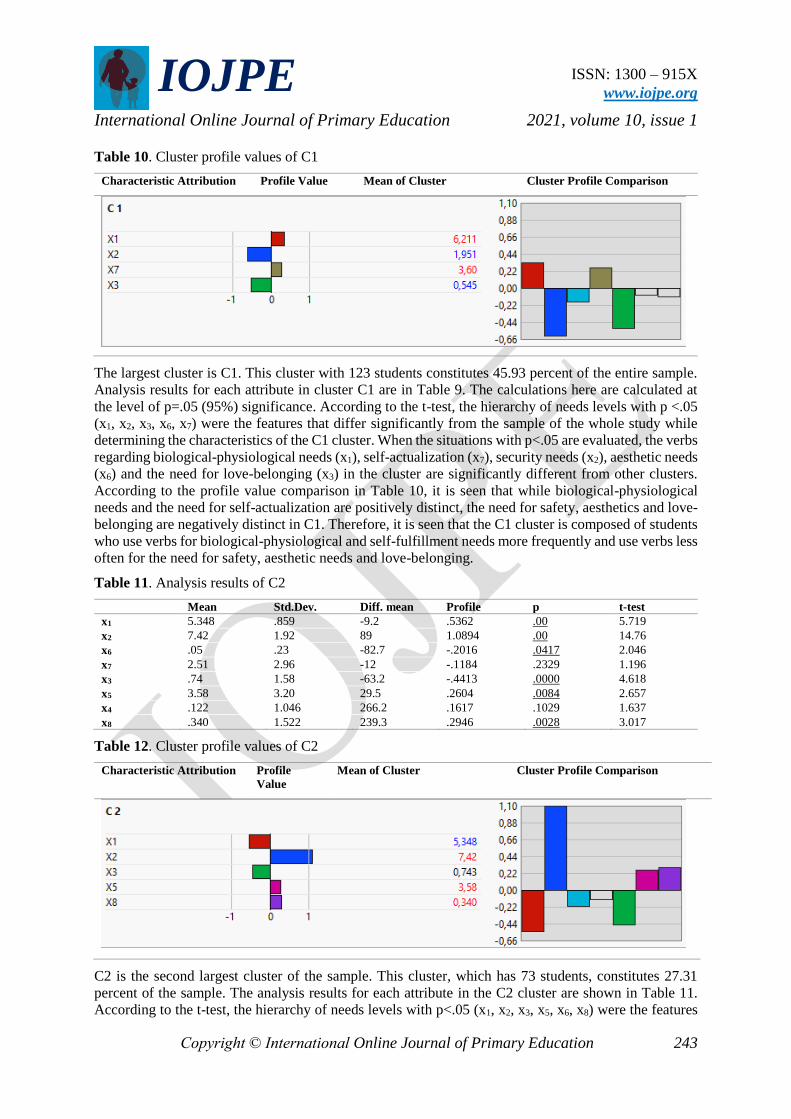
IOJPE
ISSN: 1300 – 915X
www.iojpe.org
International Online Journal of Primary Education 2021, volume 10, issue 1
Copyright © International Online Journal of Primary Education 243
Table 10. Cluster profile values of C1
Characteristic Attribution Profile Value Mean of Cluster Cluster Profile Comparison
The largest cluster is C1. This cluster with 123 students constitutes 45.93 percent of the entire sample.
Analysis results for each attribute in cluster C1 are in Table 9. The calculations here are calculated at
the level of p=.05 (95%) significance. According to the t-test, the hierarchy of needs levels with p <.05
(x1, x2, x3, x6, x7) were the features that differ significantly from the sample of the whole study while
determining the characteristics of the C1 cluster. When the situations with p<.05 are evaluated, the verbs
regarding biological-physiological needs (x1), self-actualization (x7), security needs (x2), aesthetic needs
(x6) and the need for love-belonging (x3) in the cluster are significantly different from other clusters.
According to the profile value comparison in Table 10, it is seen that while biological-physiological
needs and the need for self-actualization are positively distinct, the need for safety, aesthetics and love-
belonging are negatively distinct in C1. Therefore, it is seen that the C1 cluster is composed of students
who use verbs for biological-physiological and self-fulfillment needs more frequently and use verbs less
often for the need for safety, aesthetic needs and love-belonging.
Table 11. Analysis results of C2
Mean Std.Dev. Diff. mean Profile p t-test
x1 5.348 .859 -9.2 .5362 .00 5.719
x2 7.42 1.92 89 1.0894 .00 14.76
x6 .05 .23 -82.7 -.2016 .0417 2.046
x7 2.51 2.96 -12 -.1184 .2329 1.196
x3 .74 1.58 -63.2 -.4413 .0000 4.618
x5 3.58 3.20 29.5 .2604 .0084 2.657
x4 .122 1.046 266.2 .1617 .1029 1.637
x8 .340 1.522 239.3 .2946 .0028 3.017
Table 12. Cluster profile values of C2
Characteristic Attribution Profile
Value
Mean of Cluster Cluster Profile Comparison
C2 is the second largest cluster of the sample. This cluster, which has 73 students, constitutes 27.31
percent of the sample. The analysis results for each attribute in the C2 cluster are shown in Table 11.
According to the t-test, the hierarchy of needs levels with p<.05 (x1, x2, x3, x5, x6, x8) were the features

IOJPE
ISSN: 1300 – 915X
www.iojpe.org
International Online Journal of Primary Education 2021, volume 10, issue 1
Copyright © International Online Journal of Primary Education 244
that differ significantly from the sample of the whole study while determining the characteristics of the
C2 cluster. The calculations here are calculated at the level of p=.05 significance. Verbs regarding
biological-physiological needs, safety needs, aesthetic needs, love and belonging needs, cognitive, and
transcendence needs were significantly determinative in C2 (p<.05). When the profile value comparison
is considered in Table 12, while the security needs, cognitive needs and transcendence were positively
effective, biological and physiological needs, aesthetic and love-belonging needs came out as negative
in C2. From this viewpoint, student teachers in the C2 cluster use verbs more frequently for security
needs, cognitive and transcendence needs but fewer verbs for biological and physiological needs,
aesthetic needs and love-belonging needs.
Table 13. Analysis results of C3
Mean Std.Dev. Diff. mean Profile p t-test
x1 5.926 1.253 .7 .0383 .7290 .3469
x2 4.00 2.75 2 .0242 .8271 .2186
x6 .07 .28 -77.1 -.1880 .0885 1.709
x7 1.70 2.13 -40.2 -.3978 .0003 3.687
x3 6.44 1.74 218.7 1.5261 .0000 25.54
x5 2.31 2.81 -16.5 -.1457 .1874 1.322
x4 .000 .000 -100.0 -.0607 .5830 .5496
x8 .000 .000 -100.0 -.1231 .2654 1.116
Table 14. Cluster profile values of C3
Characteristic Attribution Profile Value Mean of Cluster Cluster Profile Comparison
C3 is the third-largest cluster of the sample. This cluster, with 63 students, constitutes 23.25 percent of
the sample. The analysis results for each attribute in the C3 cluster are shown in Table 13. According to
the t-test, the hierarchy of needs levels with p<.05 (x3, x7) were the features that differ significantly from
the sample of the whole study while determining the characteristics of the C3 cluster. Verbs regarding
the need for self-realization and love-belonging were significative in the C3 cluster (p <.05). According
to the profile value comparison in Table 14, it is seen that the verbs for the love-belonging need are
positively while self-fulfillment needs are negatively decisive in the C3 cluster. It is seen that C3 consists
of students who use verbs for the love-belonging needs of the C3 cluster more frequently and use fewer
verbs for the need of self-realization.
Table 15. Analysis results of C4
Mean Std.Dev. Diff. mean Profile p t-test
x1 5.669 1.315 -3.7 -.2168 .4638 .7336
x2 2.03 2.55 -48.3 -.5911 .0451 2.013
x6 5.91 2.30 1795.1 4.3777 .0000 34.29
x7 3.27 2.83 14.9 .1481 .6170 .5006
x3 1.82 2.40 -10.1 -.0704 .8121 .2379
x5 2.82 3.57 1.9 -.0168 .9549 .0566
x4 .000 .000 -100.0 -.0607 .8375 .2053
x8 .000 .000 -100.0 -.1231 .6775 .4163

IOJPE
ISSN: 1300 – 915X
www.iojpe.org
International Online Journal of Primary Education 2021, volume 10, issue 1
Copyright © International Online Journal of Primary Education 245
Table 16. Cluster profile values of C4
Characteristic Attribution Profile Value Mean of Cluster Cluster Profile Comparison
C4 is the last set of the sample. This cluster, which has 11 students, constitutes 4.06 percent of the
sample. The analysis results for each attribute in C4 are found in Table 15. According to the t-test, the
hierarchy of needs levels with p<.05 (x6) was the feature that differs significantly from the sample of the
whole study while determining the characteristics of the C4 cluster. The verbs-regarding the safety and
aesthetic needs in C4 were significant (p<.05). When the profile value comparison in Table 16 is
examined, it is seen that the verbs for aesthetic needs are positively decisive in C4, while the verbs for
safety needs are negatively decisive. It is seen that it consists of students using verbs more frequently
for aesthetic needs and using fewer verbs for security needs in C4.
These clusters are examined according to the hierarchy of needs in the following figures. The
distribution of clusters according to biological-physiological needs is shown in Figure 3:
Figure 3. The distribution of verbs for biological physiological needs in clusters.
According to Figure 3, it is seen that the frequency of use of verbs for biological-physiological needs is
indicated in green in all clusters. Regions marked in blue in C2, C3, C4 show the frequency of use is
low. This situation also lowers the mean of the cluster. It has been shown with the statistical data above
those verbs for these needs are more decisive in C1. Frequent use of verbs for biological-physiological
needs in all clusters (i.e., all students) is compatible with being the first step of Maslow’s hierarchy of
needs.
In Figure 4, the red and green regions show that verbs for security needs are used less often in C1, while
they are used more frequently in C2. Verbs for security needs are more decisive in C2 as shown (Figure
4). Security needs are felt the most intensely and take priority in C2, while they are at the lowest level
in the C1 and C4 clusters.

IOJPE
ISSN: 1300 – 915X
www.iojpe.org
International Online Journal of Primary Education 2021, volume 10, issue 1
Copyright © International Online Journal of Primary Education 246
When Figure 5 is examined, it can be understood from the intensity of the blue colors that the verbs for
love-belonging needs are used less frequently in clusters C1, C2 and C4; however, the intensity of the
green and red colors shows they are used more frequently in C3. It is seen that students who use the
verbs for their love-belonging needs more frequently are significantly effective in forming C3.
Figure 4. The distribution of verbs for
security needs in clusters.
Figure 5. The distribution of verbs
regarding love-belonging needs in clusters.
When Figure 6 is examined, it is seen that verbs for respect needs are not used frequently by the students
in the sample. This situation is the same in all clusters, and verbs for this theme have not been decisive
in the formation of clusters. It has been observed that verbs related to respect needs are not used
frequently in students' daily lives.
When Figure 7 is examined, it can be seen that the verbs for cognitive needs are used in all clusters at
low and medium levels, and frequently used by students in the C1 and C2 clusters (displayed in red).
Considering the mean and descriptive statistics of the clusters in themselves (Tables 11-12), it is seen
that verbs for this theme play an important role in the formation of C2.
Figure 6. The distribution of verbs for
esteem needs in clusters
Figure 7. The distribution of verbs for
security needs in clusters
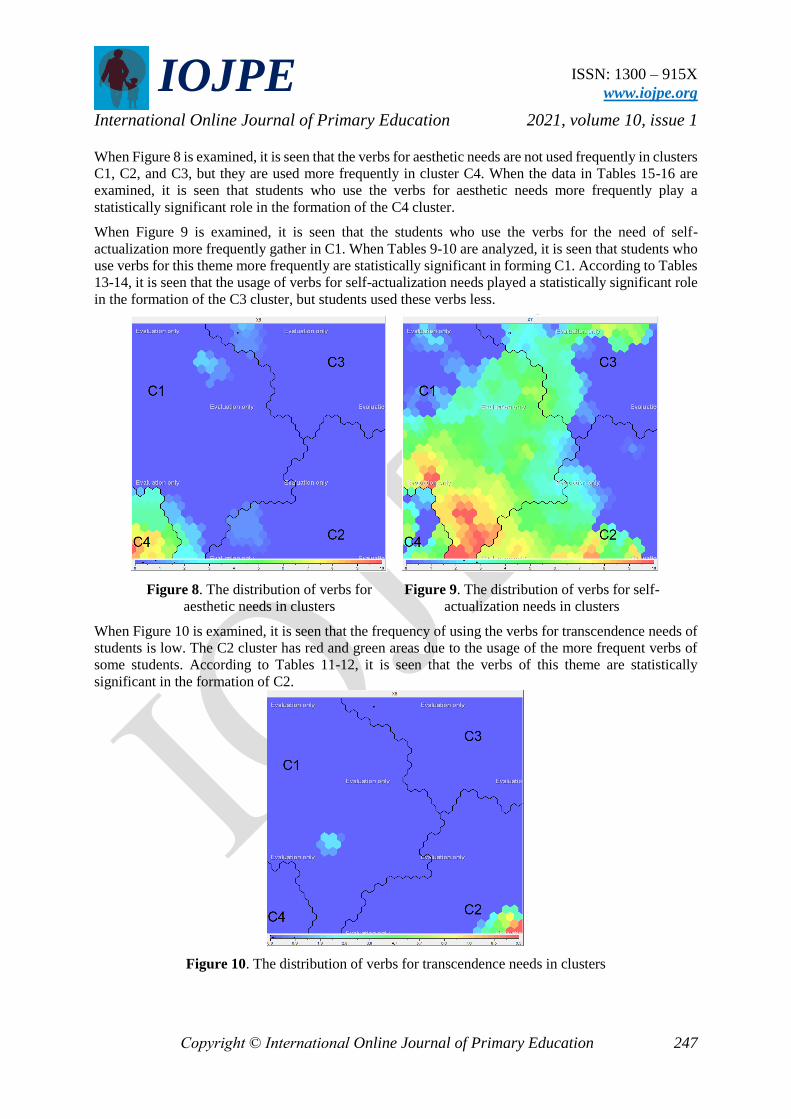
IOJPE
ISSN: 1300 – 915X
www.iojpe.org
International Online Journal of Primary Education 2021, volume 10, issue 1
Copyright © International Online Journal of Primary Education 247
When Figure 8 is examined, it is seen that the verbs for aesthetic needs are not used frequently in clusters
C1, C2, and C3, but they are used more frequently in cluster C4. When the data in Tables 15-16 are
examined, it is seen that students who use the verbs for aesthetic needs more frequently play a
statistically significant role in the formation of the C4 cluster.
When Figure 9 is examined, it is seen that the students who use the verbs for the need of self-
actualization more frequently gather in C1. When Tables 9-10 are analyzed, it is seen that students who
use verbs for this theme more frequently are statistically significant in forming C1. According to Tables
13-14, it is seen that the usage of verbs for self-actualization needs played a statistically significant role
in the formation of the C3 cluster, but students used these verbs less.
Figure 8. The distribution of verbs for
aesthetic needs in clusters
Figure 9. The distribution of verbs for self-
actualization needs in clusters
When Figure 10 is examined, it is seen that the frequency of using the verbs for transcendence needs of
students is low. The C2 cluster has red and green areas due to the usage of the more frequent verbs of
some students. According to Tables 11-12, it is seen that the verbs of this theme are statistically
significant in the formation of C2.
Figure 10. The distribution of verbs for transcendence needs in clusters

IOJPE
ISSN: 1300 – 915X
www.iojpe.org
International Online Journal of Primary Education 2021, volume 10, issue 1
Copyright © International Online Journal of Primary Education 248
DISCUSSION and CONCLUSION
As a result of the evaluation of the study carried out for the pre-service primary school teachers to
determine the most frequently used verbs in daily life in the order of priority and within the given period
in the context of the hierarchy of the needs with SOM-Ward Cluster Analysis, it was observed that the
verbs for biological-physiological needs were used by all students at a medium level. According to the
students' similarity in the verbs they use more frequently, the SOM-Ward Cluster Analysis method was
evaluated, and clusters were created by assembling similar students according to their attributes. When
the four clusters formed in this way are examined, the following conclusions are reached:
The first cluster (C1) consists of students who use biological-physiological and self-realization needs
more frequently. Considering that the realization levels of needs are also hierarchical according to
Maslow's approach, the expected hierarchical progress did not occur despite the students forming the
C1 cluster providing basic level proficiency; instead, there was a leap to the highest level that the
individual prioritized. It reveals that students in C1 are selective after meeting their basic needs. The
second cluster (C2) consists of students who use verbs for security and biological-physiological needs
more frequently. Although those in this group have identified security needs first, there is not a
significant difference compared to biological-physiological needs. However, awareness has been raised
in the identification and hierarchy of needs. The third cluster (C3) consists of students who use verbs
more about love and belonging needs. The needs of the students in this cluster reflect a priority of
individual preferences rather than a hierarchical structuring. It was also noteworthy that the love and
belonging needs were significantly prioritized over biological-physiological needs in this cluster, while
self-actualization needs were not felt. The fourth cluster (C4) consists of students who use the verbs for
aesthetic needs more frequently. In this cluster, there was a situation which was in contradiction to the
hierarchy of needs, where individual preferences come to the fore rather than the hierarchical approach
of the needs. The preference of aesthetic needs in this cluster as the primary and sole choice, while
making an obvious difference as they are never used in the other clusters, reveals the characteristic
attitude of the individuals forming this cluster. The needs of the sample of the study are incompatible
with Maslow's hierarchy of needs in general (Abdullah & Gallagher, 1995; Hagerty, 1998; Hofstede,
1980; Martinez, 2020; Montag et al., 2020; Mousavi & Dargahi, 2013; Nair, 2020; Nevis, 1983; Rama
et al., 2020; Taormina & Gao, 2013; Ye et al., 2015). The reason for it may be the change in prior needs
of pre-service primary school teachers, the prior needs of individuals of Turkish culture or the prior
needs of our age.
The approach put forward by Maslow's hierarchy of needs is compatible with cluster C1 in our study,
although the expected stages do not follow the most basic need; biological and physiological needs were
preferred, and then personal preferences of individuals were prioritized in determining the needs.
According to the pyramid, those in the clusters of C2, C3 and C4 do not comply with the theoretical
approaches proposed in the context of the hierarchy of needs; individual preferences take priority over
the hierarchical approach in determining needs. It has been observed that the safety, love-belonging and
aesthetic needs of those who form these clusters are beyond the basic needs step. It reveals that there
can be greater and higher priority needs in an individual’s life other than biological and physiological
needs.
It was determined that the needs of esteem and transcendence did not play an important role in the
clusters since they did not make a significant difference. It suggests that the individuals involved in the
study do not adequately reflect the verbs based on the need for esteem or transcendence in their daily
lives, and this situation has negative effects on professional life and social life.
According to results of the study, the following suggestions could be implemented: The deficiencies in
the most basic needs in the hierarchy of needs should be met in those whose experience a lack in these
needs; activities such as courses, seminars, and social events on an institutional basis should be
developed in order to overcome the deficiencies in the need for self-actualization; solutions for issues
such as safety, law, stability, fearlessness, and shelter should be found to address the security concerns

IOJPE
ISSN: 1300 – 915X
www.iojpe.org
International Online Journal of Primary Education 2021, volume 10, issue 1
Copyright © International Online Journal of Primary Education 249
of those who make the first step of the hierarchy such concerns by identifying the need for security as a
priority; the reason why the need for respect is hardly mentioned should be examined and an awareness
that this is a need and significant value in education, professional life, and society should be created,
and attitudes and behaviors which support it should be developed; the need for superiority, which is not
found in the clusters and which constitutes a significant deficiency in the students' individual lives
should be met through efforts that make individuals aware of values beyond their own self in various
fields such as mystical experiences, nature-related experiences, aesthetic experiences, service to others,
science engagement, and belief.
REFERENCES
Abdullah, A., & Gallagher, E. (1995). Managing with cultural differences. Malaysian Management Review, 30(2), 1-18.
Augustin, I. M., Spruit, M. A., Houben-Wilke, S., Franssen, F. M., Vanfleteren, L. E., Gaffron, S., ... & Wouters, E. F. (2018).
The respiratory physiome: Clustering based on a comprehensive lung function assessment in patients with COPD.
PLoS One, 13(9), e0201593. https://doi.org/10.1371/journal. pone.0201593
Austin, J. L. (2009). How to do things with words (Trans. R. L. Aysever), Istanbul: Metis Publications.
Awanis, S., Schlegelmilch, B. B., & Cui, C. C. (2017). Asia’s materialists: Reconciling collectivism and materialism. Journal
of International Business Studies, 48(8), 964-991.
Celebi, V. (2014). Ordinary language philosophy and Austin’s Theory of Speech Acts. Beytulhikme an International Journal
of Philosophy, 4(1), 73-89.
Cepni, S. (2018). Arastırma ve proje calısmalarına giris [Introduction to research and project work]. Trabzon: Pegem
Publishing.
Gan, G., Ma, C., & Wu, J. (2007). Data clustering theory, algorithms and applications (Asa-Siam series on statistics and
applied probability). Canada: SIAM Society for Industrial and Applied Mathematics Publishing.
Groves, R. M., Fowler, F. J., Couper, M. P., Lepkowski, J. M., Singer, E., & Tourangeau, R. (2009). An introduction to survey
methodology. Survey methodology. Wiley Series in Survey Methodology. 561 (2 ed.). Hoboken, New Jersey: John
Wiley & Sons.
Hagerty, M. R. (1999). Testing Maslow’s hierarchy of needs: National quality-of-life across time. Social Indicators Research,
46, 249–271.
Haykin, S. (1999). Neural network: a comprehensive foundation. (2 ed.), New Jersey: Prentice Hall International.
Hofstede, G. (1980). Motivation, leadership and organization: Do American theories apply abroad?. Organization Dynamics,
Summer, 9(1), 63-68.
Kleinman, P. (2014). Psiko 1001 (trans. H. Kaplan). Istanbul: Okyanus Publications.
Kohonen, T. (1990). The self-organizing map. Proceedings of IEEE, 78(9), 1464-1480.
Kohonen, T. (2001). Self-organizing maps. New York: Springer.
Martinez, D. (2020). Eudaimonic and hedonic wellbeing among Bangkokians: A qualitative study of Maslow’s needs, intrinsic
and extrinsic values. ASEAN Journal of Management & Innovation, 7(2), 17-47.
Maslow, A. H. (1970). Motivation and personality. New York: Harper & Row.
Miles, M, B., & Huberman, A. M. (1994). Qualitative data analysis: An expanded sourcebook. (2 ed.). Thousand Oaks, CA:
Sage Publications.
Montag, C., Sindermann, C., Lester, D., & Davis, K. L. (2020). Linking individual differences in satisfaction with each of
Maslow's needs to the Big Five personality traits and Panksepp's primary emotional systems. Heliyon, 6(7), 1-9,
e04325.
Mousavi, S. H., & Dargahi, H. (2013). Ethnic differences and motivation based on Maslow’s theory on Iranian employees.
Iranian Journal of Public Health, 42(5), 516-521.
Nair, M. (2020). Handbook of daily movement. Retrieved from: https://www.handbookofdailymovement.com
Nevis, E. C. (1983). Using an American perspective in understanding another culture: toward a hierarchy of needs for the
people’s Republic of China. The Journal of Applied Behavioural Science, 19(3), 249-264.
Patton. M. Q. (2002). Qualitative research and evaluation methods (3 ed.). Thousand Oaks, CA: Sage Publications.

IOJPE
ISSN: 1300 – 915X
www.iojpe.org
International Online Journal of Primary Education 2021, volume 10, issue 1
Copyright © International Online Journal of Primary Education 250
Rama, C. R., Harris, V. W., Speegle, K., Nelson, N., Moen, D., & Harris, H. J. (2020). Familismo: How eight categories of
needs are met in Hispanic American families within the context of familism. Advances in Social Sciences Research
Journal, 7(7), 348-370.
Scheffer, D., & Heckhausen, H. (2018). Trait theories of motivation. In J. Heckhausen & H. Heckhausen (Eds.), Motivation
and action (p. 67–112). New York, NY: Springer.
Schwartz, S. H. (1990). Individualism-collectivism: Critique and proposed refinements. Journal of Cross-Cultural
Psychology, 21(2), 139-157.
Shi, Y., & Lin, X. (2021). A test of Maslow’s hierarchy of needs concept by a correlational model among adult learners.
American Association for Adult and Continuing Education Inaugural 2020 Conference Proceedings (Online, October
27-30, 2020), ED611534.
Toker, B. (2007). The effects of demographic factors on job satisfaction: An application on five- and four-star hotels in Izmir.
Journal of Dogus University, 8(1), 92-107.
Walsh, P. R. (2011). Creating a “values” chain for sustainable development in developing nations: Where Maslow meets
Porter. Environment, Development and Sustainability, 13(4), 789-805.
Ye, D., Ng, Y., & Lian, Y. (2015). Culture and happiness. Social Indicators Research, 123(2), 519-547.