Issue Full File - DergiPark
166
-
Upload
khangminh22 -
Category
Documents
-
view
0 -
download
0
Transcript of Issue Full File - DergiPark


Journal of TourismologyVolume: 6 • Number: 1 • June 2020
e-ISSN: 2459-1939 • DOI: 10.26650/jot
Journal of Tourismology is the official peer-reviewed, international journal of the Istanbul University Faculty of Economics Authors bear responsibility for the content of their published articles.
OwnerIstanbul University, Faculty of Economics
EDITORIAL MANAGEMENT
Editor-in-ChiefsMehmet Erkan (Co-Editor, Prof., Istanbul University, Istanbul, Turkey)
Fusun Istanbullu Dincer (Editor-in-Chief, Prof., Istanbul University, Istanbul, Turkey)Gurel Cetin (Managing Editor, Assoc. Prof., Istanbul University, Istanbul, Turkey)
Production EditorsIbrahim Cifci (Res. Asst., Istanbul University, Department of Tourism Management, Turkey
E-mail: [email protected])Mehmet Altug Sahin (Res. Asst., Istanbul University, Department of Tourism Management, Turkey
E-mail: [email protected])Mert Ogretmenogku (Res. Asst., Istanbul University, Department of Tourism Management, Turkey
E-mail: [email protected])
Methodology EditorHossein Olya (Dr., Tourism Management, Faculty of Business, Oxford Brookes University, UK
E-mail: [email protected])
English Language EditorElizabeth Mary Earl, İstanbul University, School of Foreign Languages (English)
E-mail: [email protected] James Newson, İstanbul University, School of Foreign Languages (English)
E-mail: [email protected]
EDITORIAL BOARDFaizan Ali (Asst. Prof.), Florida State University, USA. Email: [email protected]
Amir Shani (PhD), Ben-Gurion University of The Negev, Israel. Email: [email protected] Antonovica (Profesor Contratado Doctor), Universitad Rey Juan Carlos, Spain. Email: [email protected]
Ashish Dahiya (Prof.), GD Goenka University, India. Email: [email protected] Iaonnides (Prof.), Meet Mid Sweden University, Sweden. Email: [email protected]
Doğan Gursoy (Prof.), Washington State University, USA. Email: [email protected] Fusun Istanbullu Dincer (Prof.), Istanbul University, Turkey. Email: [email protected] Zamani-Farahani (Asst. Prof.), Islamic Azad University, Iran. Email: [email protected]
Hossein Olya (Dr.), Tourism Management, Faculty of Business, Oxford Brookes University, UK. Email: [email protected] Kizilirmak (Prof.), Istanbul University, Turkey. Email: [email protected]
Javier De Esteban Curiel, (Titular de Universidad), Universitad Rey Juan Carlos, Portugal. Email: [email protected]é Antonio C. Santos (Asst. Prof.), University of the Algarve, Portugal. Email: [email protected]
Mehmet Erkan (Prof.), Istanbul University, Turkey. Email: [email protected] Dincer (Prof.), Istanbul University, Turkey. Email: [email protected] Akova (Prof.), Istanbul University, Turkey. Email: [email protected]
Osman Demiroglu (Asst. Prof.), University of Istanbul Bilgi, Turkey. Email: [email protected] Demirkol (Asst. Prof.), Istanbul University, Turkey. Email: [email protected]
Stanislav Ivanov (Prof.), Varna University, Bulgaria. Email: [email protected] Beyoglu (Prof.), Marmara University, Turkey. Email: [email protected]
*In alphabetical order by name

Head Officeİstanbul University Faculty of Economics
Type of PublicationInternational Periodical
LanguageEnglish
Publishing PeriodBiannual (June & December)
Indexed byTürkiye Turizm Dizini
DOAJSOBIAD
ASOS Index (Social Sciences Index)ERIH PLUS
RePEc IDEASRePEc EconPapers
Publishing CompanyIstanbul University Press
Istanbul University Central Campus, 34116, Beyazit, Fatih, Istanbul, TurkeyPhone: +90 (212) 440 00 00
CorrespondenceDepartment of Tourism Management, The Faculty of Economics
Department of Tourism Management, The Faculty of Economics Istanbul University,Beyazit, Fatih, Istanbul, Turkey
Call: +90 (212) 440-0000 / 11540Fax: +90 (212) 520 82 86
Web: http://jt.istanbul.edu.tr/en/_ & www.dergipark.gov.tr/iuturizmolojiEmail: [email protected]

Table of Contents
ARTICLES
Research articleApplying Flow Theory to the Online Booking Experience: The Role of Utilitarian and Hedonic Features ............................................................................................................... 1Engin Tengilimoglu, Azize Hassan
Research articleNew Technologies in the Field of Tourist Guiding: Threat or Tool? ....................................... 13Michelle de la Harpe, Karina Sevenhuysen
Research articleCappadocia: The Effects of Tourist Motivation on Satisfaction and Destination Loyalty ...... 35Faruk Seyitoglu
Research articleFactors Affecting Food Choices of Millennials: How they Decide What to Eat? .................... 49Zehra Dilistan Shipman
Research articlePotential Unexplored? Tourism and Economic Growth of Bangladesh .................................. 63Basharat Hossain, Syed Naimul Wadood
Research articleThe Effect of Digital Content Marketing on Tourists’ Purchase Intention ............................. 79Serife Yazgan Pektas, Azize Hassan
Theoretical articleEconomic Evaluation of Health Tourism in Turkey ................................................................ 99Buse Ceti, Kurban Unluonen
Theoretical articleThe Evaluation of Tourism in Turkey in Terms of Inflation .................................................... 111Serife Yazgan Pektas, Kurban Unluonen
Review articleThe Effects of Industry 4.0 on the Food and Beverage Industry ............................................. 133Yeliz Demir, Fusun Istanbullu Dincer


E D I TO R I A L L E T T E R
Journal of Tourismology
Impact of Covid-19 on Tourism Industry
Tourism has become a major global industry with an annual average growth rate of 4-5%. It also creates 8% of the global GDP and 10% of employment (WTO, 2020). Yet it is also very vulnerable to crises of different origin such as natural disasters, epidemics, economic crises, political crises, and terror (Yozcu & Cetin, 2020). Because tourism product (e.g. hotel beds, airline seats, restaurant tables, guide services) is perishable, unlike physical goods, they cannot be stored for future use. Past crises with few exceptions (e.g. 2008 Financial Crisis) had regional impacts and their global impact on tourism volume was limited. Yet, considering the speed and impact, Covid-19 is the most serious crises tourism industry has ever faced. This crisis is estimated to have a seven time larger impact on tourism than the 2008 Financial Crises. The effects of Covid-19 are expected to extend for eight months and result in a decrease of 39% in global tourism volume. Tourism industry is expected to recover to 2019 pre-crises levels not before 2023 (Tourism Ecomomics, 2020).
Tourism industry in Turkey also makes 12% of employment and 8% of GDP (COMCEC, 2019). Compared to other destinations tourism in Turkey is more resilient to crises as particularly after 1980s the industry went through a series of crises every few years including natural disasters, terror events, military coups and coup attempts, political crises, economic crises and so on. Considering 2019 income from international tourism at 35 billion USD, Turkish Tourism is likely to lose 25 billion USD if we predict the situation will recover in October, 2020. With multiplier effects the total cost will be more than 50 billion USD to Turkish Economy. Another major problem is that Europe, major market for Turkish tourism, is significantly affected by Covid-19.
Tourism is among the first and most severely affected industries from Covid-19. The first response to pandemic was to close the borders and limit human mobility. Moreover tourism demand is not based on a physical need and can be postponed. The recovery is expected to start form domestic tourism and continue with recovered destinations which were usually first affected (e.g. Far East, Europe than Americas). Considering we already lost the high season in Summer, the primary target starting from September is likely to be the third age group, who are retired, have more leisure time and stable income. Yet, one should also consider that these travelers are also among the risk group for Covid-19. Hence sanitation and social distance are off primary concern in product design. Tourism industry might also face new arrangements for international travel. People might, for example, only allowed to travel if
This work is licensed under Creative Commons Attribution-NonCommercial 4.0 International License

they are below 25 years of age, proven immune to Covid-19 or accept to spend 14 days under quarantine upon arrival.
No matter the scenario, tourism will see a sharp and long-term decrease in tourism spending as this pandemic will have economic ripple effects. The purchasing power will decline significantly. Majority of events (e.g. meetings, Olympics) have already been cancelled. The business travel will also continue to shrink as virtual meetings and online systems started to take over. Many governments offered financial packages (e.g. tax holidays, credit facilities, employment support) to help industry survive these difficult times. Yet, this period can also be seen as an opportunity to fix structural problems in the industry concerning sustainability, over-tourism, climate change, and destination governance (Seraphin & Gowreesunkar, 2019).
One might predict that the capacities will fall, the quality will be more important than quantity and the per person tourist spending will increase. Mass tourism will also suffer, all inclusive, open buffet systems will be replaced with more customized and sustainable options. People are also more likely to travel less but stay more nights at a destination. Importance of destination governance and coordinated response is also evident. This will enhance the significance of DMOs. Robots and automated systems will be employed more, ICT and digital systems will also gain power. The room service will be more common, standards for hygiene and sanitation will be enhanced, disposable materials will be more popular, the rooms will also be redesigned to include portable kitchens. The sharing economy will also suffer, people will only consider professional service with proven hygiene standards before hiring these units (Alrawadieh et al., 2020). Importance of creating loyal clients will be more crucial for tourism service providers as trust will play a major role in decision making process (Pektas & Hassan, 2020).
Tours operators will also be specialized, they will host smaller groups. Nature based tours will also be more popular. The disintermediation of brick-and-mortar travel agencies will gain pace. There will be less people willing to go to a travel agency to book. Hence online channels will be even more important (Tengilimoglu & Hassan, 2020). There will also be implications for professional tour guides (De la Harpe & Sevenhuysen, 2020), because the group sizes will shrink the driver-guide will be more popular, particularly for travel agencies.
To conclude both DMOs and tourism industry stakeholders should be ready for post-corona environment. There are different scenarios on when the industry will recover, what new challenges and standards will be imposed, who are more likely to travel which products and services will disappear and transform. Hence the stakeholders should be able to create different action plans for each scenario to be put into action after recovery. Destination image shall also be re-positioned based on safety, health and cleanliness. All stakeholders should also make sure they have a risk and crises management plan and a strong financial structure to improve their resilience in the future.

Finally Journal of Tourismology (JoT) welcomes related papers on the impact of Covid-19 on tourism, recovery, mitigation and adoption strategies during and after Covid-19 for different tourism stakeholders, the role and actions of governments to subsidize tourism industry, possible changes in customer behavior and transformations in tourism services and tourist markets. JoT is an open access journal without any publication fees or whatsoever.
ReferencesAlrawadieh, Z., Guttentag, D., Cifci, M. A., & Cetin, G. (2020). Budget and midrange hotel
managers’ perceptions of and responses to Airbnb. International Journal of Contemporary Hospitality Management.
COMCEC (2019). Tourism Outlook. Çevrimiçi: http://ebook.comcec.org/Kutuphane/Icerik/Yayinlar/Genel_Gorunum/Turizm/Outlook-2018/files/assets/basic-html/page-1.html#, Erişim tarihi: 12.04.2020.
De la Harpe, M., & Sevenhuysen, K. (2020). New Technologies in the Field of Tourist Guiding: Threat or Tool?. Journal of Tourismology, 6(1).
Pektas, S. Y., & Hassan, A. (2020). The Effect of Digital Content Marketing on Tourists’ Purchase Intention. Journal of Tourismology, 6(1).
Seraphin, H., Gowreesunkar, V. G., & Platania, M. (2019). Examining the Relationship between Residents’ Level of Happiness and Supportiveness to Tourism Events: Winchester (UK) as a Case Study. Journal of Tourismology, 5(2).
Tengilimoglu, E., & Hassan, A. (2020). Applying Flow Theory to the Online Booking Experience: The Role of Utilitarian and Hedonic Features. Journal of Tourismology, 6(1).
Tourism Economics (2020). Total Travel Industry Impact. Çevrimiçi: https://www.ustravel.org/toolkit/covid-19-travel-industry-research, Erişim tarihi: 12.04.2020.
WTO (2020). International Tourism Highlights. Çevrimiçi: https://www.e-unwto.org/doi/pdf/10.18111/9789284421152, Erişim tarihi: 12.04.2020.
Yozcu, O. K., & Cetin, G. (2019). A Strategic Approach to Managing Risk and Crisis at Tourist Destinations. In Tourist Destination Management (pp. 273-287). Springer, Cham.
Assoc. Prof. Dr. Gurel CetinManaging Editor


©The Authors. Published by the İstanbul University under the terms of the Creative Commons Attribution License http://creativecommons.org/licenses/by/4.0/, which permits unrestricted use, provided the original author and source are credited.
Journal of Tourismology, 6(1), 1-12
DOI: 10.26650/jot.2020.6.1.0010http://jt.istanbul.edu.en/
Submitted: 21.09.2019Revision Requested: 12.10.2019
Last Revision Received: 02.01.2020Accepted: 18.01.2020
Published Online: 10.03.2020R ES EA RC H A RT I C L E
Journal of Tourismology
1 Correspondence to: Engin Tengilimoglu (Ress. Asst.), Selcuk University, Faculty of Tourism, Department of Tourism Management, Konya, Turkey. E-mail: [email protected] ORCID: 0000-0001-7080-6147
2 Azize Hassan (Prof. Dr.), Hacı Bayram Veli University, Faculty of Tourism, Department of Travel Management and Tourism Guidance, Ankara, Turkey. E-mail: [email protected] ORCID: 0000-0003-2509-1415
To cite this article: Tengilimoglu, E., & Hassan, A. (2020). Applying flow theory to the online booking experience: The role of utilitarian and hedonic features. Journal of Tourismology, 6(1), 1-12. https://doi.org/10.26650/jot.2020.6.1.0010
Engin Tengilimoglu1 , Azize Hassan2
Applying Flow Theory to the Online Booking Experience: The Role of Utilitarian and Hedonic Features
AbstractThe transformations experienced in the tourism industry along with developing internet technologies are bringing out new distribution channels. The presentation of tourism products through these channels has also been rapidly accepted by the tourists. Online travel sales exceeding 690 billion dollars together with developing mobile payment options have made online purchasing behaviors an important issue. Although Flow Theory had been previously used in the fields such as adventure and sports, in the course of time it has started to be used also for understanding online consumer behaviors and it was seen that it has positive effects like trust, and e-loyalty in users. Therefore, determination of the factors that will provide consumers with flow experience in online environments, has also become an important issue. In this study, the features of a booking site that will provide consumers with flow experience were examined and which factors are more effective in the flow theory was searched. Consequently, it was determined that the flow experience is affected by utilitarian and hedonic features offered to consumers. Additionally, it was also observed that hedonic features offered to the consumers during the purchasing process affects the flow experience more than utilitarian features.
KeywordsFlow theory, Online rezervation, Online purchase behavior, Utilitarian and hedonic features
JOURNAL of TOURISMOLOGY
2
IntroductionDeveloping technology has led to major transformations also in the tourism
industry as in every field of life from past to present. One of the most obvious examples of this interaction between technology and tourism is the changes which have resulted from the central rezervation systems (Sabre, Amadeus, Galileo etc.) that appeared in the industry during the 1980s. A series of elements from the business administration practices to the industry’s structure together with global distribution channels have been reshaped during this process (Buhalis and Law, 2008). Afterwards, internet technologies, which were developed and became widespread, have offered unparalleled opportunities to both consumers and suppliers by affecting deeply once again the tourism industry. Evolving internet technologies have allowed suppliers to reach directly to the consumers by filling the gap between the suppliers and consumers and have weakened the loyalty to traditional travel agencies. Online travel agencies (booking.com, expedia.com etc.), which emerged towards the end of the 1990s, have substantially changed the touristic purchasing behaviors (Amaro and Duarte, 2015; Buhalis and Law, 2008) and have made it compulsory for traditional travel agencies to employ developing internet technologies in terms of their survival (Kamau, 2015). Now online distribution channels have reached an important point in the tourism industry. Nowadays, online travel purchasing has reached 694 billion dollars globally owing to the improved mobile payment options and online travel agencies and this figure is expected to rise to 931 billion dollars until 2022 (Emarketer, 2018). This increase in online travel sales and the predictions that this increase will continue have ensured both the industry and academic studies focus on this field by causing the increase of this importance attached to this issue. While the internet has been gaining importance as a new marketing channel that gradually increases the market share in terms of the industry, has both caused a transformation in traditional travel agencies (Kamau, 2015) and paved the way for the emergence of new online travel agencies (Liu and Park, 2015). Meanwhile in the academic circles, with a growing number of studies (Buhalis and Law, 2008), both existing theories (Flow Theory, Planned Behavior Theory) have been adapted to the online distribution channels and new theories (Online Shopping Acceptence Model) have been put forward in line with the developing technologies.
Today, online distribution channels emerged with internet technologies, have resulted in large conversions gradually in the tourism industry, which are being rapidly accepted (Muneta at all, 2013) by both consumers and suppliers (Nusair and Parsa, 2011). Bilgihan (2012) states that tourism products is one of the products which are mostly accepted by consumers among the products sold over the internet. Meanwhile, it is expressed in a study conducted by Tripadvisor (2016) that 86% of the travelers prefer online resources for accommodation (Tripbarometer, 2016).

Tengilimoglu, Hassan / Applying Flow Theory to the Online Booking Experience: The Role of Utilitarian and Hedonic Features
3
The rise of online channels to a significant point in the tourism industry has brought up the subjects such as online consumer behaviours (Amaro and Duarte, 2015) online comments (Tengilimoğlu at all, 2017; Çuhadar at all, 2018; Sunar at all, 2018; Ak and Dinçer, 2019), hotel scoring systems (Liu and Park, 2015; Akgöz and Tengilimoğlu, 2015), ease of use, quality and functionality of the websites (Liu and Zhang, 2014), user security and privacy (Schubert and Henseler, 2018). Moreover, the online purchase experience offered to the consumers has also been one of the most frequently emphasized issues (Novak at all, 2000; Obada, 2013; Özkara at all, 2017) and it has been associated with concepts like online purchasing intent, e-loyalty and trust (Bilgihan, 2012).
Bilgihan (2015) remarks that 24% of annual online revenue is lost globally because of poor online customer experiences while stressing the importance of online booking experience for consumers. The influence of online purchasing experience on consumers’ subsequent purchasing behaviors was extensively examined and various studies have supported the opinion that positive experiences create trust, re-purchases and loyalty (Koufaris, 2002; Hsu at all, 2013; Bilgihan and Bujisic, 2015; Özkara at all, 2017). While this kind of results enables marketers to have interest in this issue (Lopez and Ruiz, 2015), it has also caused the increase of studies explaining the online purchasing behaviors in academic circles (Buhalis and Law, 2008; Noort at all, 2012). Right at this point, the Flow Theory developed by Csikszentmihalyi in 1975 started to be used also in order to examine the interaction with human and computer in online environments (Hoffman and Novak, 1996; Bilgihan, 2012; Obada, 2013) as well as subjects such as sports, adventure and education (Barış, 2015). It is stated in many studies that the flow theory is a convenient instrument to understand the online consumer behaviors (Hoffman and Novak, 1996; Novak at all, 2000; Hsu at all, 2013; Esteban at all, 2014). The shopping experience in online environments expresses the purchasing process realized between the website and consumer. Meanwhile, the flow experience during this process can be expressed by an engrossing and hedonic experience (Bilgihan, 2012) when the consumers behave with full interest and concentration.
Novak et al. (2000) expresses that it is necessary to compose websites allowing flow experience in order to convince consumers to purchase in online environments. Bilgihan (2015) remarks that consumers give importance to both hedonic and utilitarian features which will provide them with flow experience during the online purchasing process. Hedonic and utilitarian features of the websites are the most frequently addressed subjects in the studies conducted on online shopping (Nusair and Parsa, 2011; Bilgihan, 2012; Lopez and Ruiz, 2015). Meanwhile, this study examines the effect of the consumers’ preference reasons of online channels which are determined by Liu and Zhang (2014) for hotel reservation, booking websites’ hedonic

JOURNAL of TOURISMOLOGY
4
based features which have been composed by Bilgihan (2012) and consumers’ web skills described by Koufaris (2002) in his study on the flow experience by means of the perceived usefulness, shopping enjoyment and ease of use.
Hypotheses Development and Theoretical Research ModelOnline travel sales with an increasingly growing share in the market makes the
comprehension of consumers’ online shopping behaviour an important issue. One of the theories preferred for the purpose of understanding online consumer behaviour is the Flow Theory (Hoffman and Novak, 1996; Novak at all, 2000). The word ‘‘flow’’ is used to describe a state of mind that is sometimes experienced by people who are completely engaged in some activity. One example of flow is when a user is shopping online and achieves a state of mind where nothing else matters but the shopping; you engage in online shopping with total involvement, concentration and enjoyment. You are completely and deeply immersed in it. Many people report this state of mind when browsing webpages, chatting online and word processing (Bilgihan, 2015:671). Consumers’ flow experience during the online shopping process is affecting their purchasing behaviors, e-trust and e-loyalty (Koufaris, 2002; Hsu at all, 2013; Bilgihan and Bujisic, 2015; Özkara at all, 2017). These kind of results shown by the studies make the flow experience an important study field about online shopping.
It is seen that the consumers’ flow experience in online environments is related to both hedonic and utilitarian features when the studies and the definitions about the flow experience are examined (Koufaris, 2002; Nusair and Parsa, 2011; Bilgihan, 2012; Lopez and Ruiz, 2015). Besides, the skills of an individual and the difficulty of the work are among the factors affecting the flow experience (Koufaris, 2002). In this context, users’ Flow Experience can be explained by dimensions of the Perceived Usefulness through the influence of utilitarian features of the websites, the Shopping Enjoyment through the influence of hedonic features of the websites and the Perceived Ease of Use through the influence of payment facilities offered and the web skills of an individual. The following study model has been developed on the basis of this thought.
Generated hypothesis are listed below.
H1: The perceived usefulness positively affects the flow experience of consumers.
H2: The perceived ease of use positively affects the flow experience of consumers.
H3: The perceived hedonic level positively affects the flow experience of consumers.

Tengilimoglu, Hassan / Applying Flow Theory to the Online Booking Experience: The Role of Utilitarian and Hedonic Features
5
Figure 1. Research model
MethodThe purpose of this study is to examine which features of booking sites are more
important for the flow experience in online environments. In this context, previous studies have been examined and it was seen that the flow experience is usually associated with utilitarian and hedonic features of booking websites (Bilgihan, 2015). In addition, it is also stated that the ease of use and web skills are effective variables in the flow experience (Koufaris, 2002). In this context, a questionnaire was in compliance with the purpose of the study. Product Price, Product Variety, Product Reviews and Payment scales in the questionnaire have been taken from the study conducted by Liu and Zhang in 2014. Hedonic Features scales relating to the Flow Experience have been obtained from the study of Bilgihan (2012). Finally, Web Skills, Perceived Usefulness, Shopping Enjoyment and Perceived Ease of Use scales have been taken from Koufaris (2002).
The target respondents of the study consists of the people who have already made an hotel booking online. The questionnaire was on google in December 2018. Compliance with target respondents, the questionnaire was sent via social media to individuals and groups who may be interested in online hotel booking. It is recommended to send the survey via internet for the purpose of reaching the target respondents if they are internet users (Liu and Zhang, 2014; Bilgihan, 2015). The first question of the questionnaire is “Have you ever made an online hotel booking?”. The participants, who answered ‘yes’ to this question, continued to reply to the next questions and if they answered ‘no’ then the following questions were not asked to them. Thus, it has been ensured that only the people who had experience on this subject participated in this survey.

JOURNAL of TOURISMOLOGY
6
Table 1 Online Booking Experience
Question Answer N Percent
Have you ever made an online hotel booking? Yes 139 76,0No 44 24,0
Total 183 100
It is presented in the table whether the participants have already experienced online booking by the number of people. Based on the results, 76% of 183 participants, namely 139 participants have made online booking, and 24% of 183 subjects, namely 44 participants have not made. 44 participants who have not online booking experience were excluded from the study for the subsequent parts. Demographic characteristics with regard to 139 respondants who have experienced online booking are given below.
Table 2 Demographic CharacteristicsQuestion Answer N Percent
Are you male or female?Male 87 62,6Female 51 37,4
What is your age?
24 or Younger 25 18,025-34 56 40,335-44 37 26,645-55 19 13,655 or Older 2 1,4
What is your level of education?
Primary School 1 0,7High School 8 5,8Associate degree (2 year) 10 7,2Bachelor‘s Degree (4 year) 59 42,4Postgraduate 59 42,4
Please indicate your occupation.
Academician 47 33,8Government occupations 28 20,3Student 15 10,8Private Sector 20 14,4Others 29 20,7
What is your approximate personal monthly income?
1.000 TL or Less 16 11,51.001 TL - 2.000 TL 11 7,92.001 TL - 3.500 TL 30 21,63.501 TL - 5.000 TL 27 19,45.001 TL or More 55 39,6
Male participants comprises more than half (62%) of the people who participated in the research. The most intensive age range is 25-34 (40%) of the people who participated in the survey. With regard to education, the participants who have Bachelor’s Degree (42%) and Masters’ Degree (42%) stands out. Academicians (33%) are prominent in terms of occupation. It is observed that the participants who have an income of 5001 TL and above (39%) with regard to income level distribution depending on the occupation is quite high.

Tengilimoglu, Hassan / Applying Flow Theory to the Online Booking Experience: The Role of Utilitarian and Hedonic Features
7
In the study, the structural equation model was established by employing the Smart PLS package program. It is set forth that the sampling size of 10 times of the proposition number of the variable having a maximum proposition number in the PLS path model is sufficient (Hair et al, 2014). In our study, the variable which has the highest proposition is Hedonic features with 7 propositions. Therefore, the sampling number must be at least 70 according to this calculation. In our study, the sampling size is 139.
Confirmatory Factor Analysis, Reliability and Validity TestsIt is recommened to carry out Confirmatory Factor Analysis in PLS, to examine
Composite Reliability and AVE values for the purpose of evaluation of results and determination of reliability and validity of the structural equation model (Hair ar all, 2014). Confirmatory Factor Analysis results, Composite Reliability and Average Variance Extracted values are shown in the table below.
A calculation above 0.7 is generally accepted for item loads. When the table above is examined, it is seen that all item loads have been calculated higher than the acceptable value of 0.7.
It is more appropriate to use Composite Reliability for measurement of PLS internal consistency reliability. The values between 60 and 70 is adeaqute for composite reliability for the studies. It is seen in the table above that composite reliability values have been calculated higher than the generally accepted rates. The other matter that must be taken into consideration after the internal consistency test is AVE values. AVE values are expected to be higher than 0,5. When the table is examined, it is seen that this condition is provided, too.
Lastly, Discriminant Validity values have been examined. The correlation with relevant variables of the values representing the square roots of AVE values is expected to be higher than the correlations with other variables. Upon reviewing of the values, it was seen that the study provided Discriminant Validity.
Findings and ConclusionIn the study, the model was run after the reliability and validity tests were done.
Structural equation model involves developing measurement models to define latent variables and then establishing relationships or structural equations among the latent variables. (Bilgihan, 2015). The latent variables measured and the values expressing their interrelation are given in the following research model.
The values in the middle of the circles in the model represent R2s and give the description ratio of relevant dimension. In this context, 38% of the change appeared in the Perceived Usefulness dimension is expressed by Product Price, Product Variety

JOURNAL of TOURISMOLOGY
8
and Product Reviews. Meanwhile, 58% of the Perceived Ease of Use is expressed by Payment and users’ Web Skills. And 34% of the Shopping Enjoyment is expressed by Hedonic Features of the website. Finally, 41% of the change appeared in the flow experience is expressed by Perceived Usefulness, Perceived Ease of Use and Shopping Enjoyment. The path coefficients expressing the interrelation of variables and p values showing whether these coefficients are significant, are shown in the following table.
The table above shows the coefficients of the paths generated and p values of these coefficients. Upon reviewing of the table, it is observed that two of the ten paths generated have no significant effect and other eight paths are significant.
Table 3 Item Loadings and Reliability Scores
Factors Items Factor Loadings Composite Reliability AVE
Flow Experience
F1 0.860
0,913 0.638
F2 0.831F3 0.812F4 0.826F5 0.781F6 0.703
Shopping Enjoyment
SE1 0.876
0.945 0.812SE2 0.914SE3 0.916SE4 0.897
Perceived UsefulnessPU1 0.793
0.871 0.693PU2 0.861PU3 0.842
Peceived Ease of Use
PEU1 0.869
0.934 0.779PEU2 0.872PEU3 0.919PEU4 0.870
Hedonic Features
HF1 0.702
0.905 0.577
HF2 0.789HF3 0.731HF4 0.703HF5 0.811HF6 0.825HF7 0.767
Web SkillsWS1 0.896
0.892 0.734WS2 0.865WS3 0.807
Payment P1 0.860 0.879 0.784P2 0.910
Product Price PP1 0.815 0.776 0.635PP2 0.778
Product ReviewPR1 0.937
0.868 0.768PR2 0.811PR3 0.937
Product Variety
PV1 0.707
0.854 0.595PV2 0.836PV3 0.775PV4 0.761

Tengilimoglu, Hassan / Applying Flow Theory to the Online Booking Experience: The Role of Utilitarian and Hedonic Features
9
Figure 2. Results of model
Table 4 Discriminant Validity
Factors F SE PU PEU HF WS P PP PR PV
Flow 0.799Shopping Enjoyment 0.556 0.901Perceived Usefulness 0.527 0.508 0.833Perceived Ease of Use 0.466 0.369 0.643 0.883Hedonic Features 0.582 0.584 0.680 0.607 0.760Web Skills 0.488 0.278 0.448 0.725 0.515 0.857Payment 0.184 0.353 0.446 0.415 0.503 0.259 0.886Product Price 0.418 0.338 0.445 0.424 0.521 0.458 0.329 0.797Product Review 0.402 0.386 0.549 0.693 0.597 0.551 0.572 0.321 0.876Product Variety 0.410 0.216 0.462 0.546 0.558 0.613 0.365 0.578 0.533 0.771
Tablo 5 Hypotheses, Path Coefficients and P Values
Hypotheses Path Coefficent
Std. Dev.
T Value
P Value Result
H: Product P. → (+) Perceived U. 0.258 0.076 3.422 0.001 YesH: Product V. → (+) Perceived U. 0.091 0.094 0.969 0.333 NoH: Product R. → (+) Perceived U. 0.417 0.081 5.139 0.000 YesH: Payment → (+) Peceived Ease of U. 0.244 0.075 3.268 0.001 YesH: Web S. → (+) Peceived Ease of U. 0.662 0.054 12.297 0.000 YesH: Hedonic F. → (+) Shopping E. 0.584 0.066 8.842 0.000 YesH1: Perceived U. → (+) Flow 0.215 0.109 1.965 0.040 YesH2: Peceived Ease of U. → (+) Flow 0.189 0.101 1.869 0.062 NoH3: Shopping E. → (+) Flow 0.377 0.075 5.040 0.000 Yes

JOURNAL of TOURISMOLOGY
10
At the same time, path coefficients express the impact level of a variable on the respective variable. In this context, it is possible to determine which variables have a larger effect on the flow experience through the coefficients of the paths going the flow experience. When the coefficients are examined, it is seen that the Perceived Usefulness has been calculated as 0,215, the Perceived Ease of Use as 0,189 and the Shopping Enjoyment as 0,377. It was stated that the insignificance of the coefficient calculated for the perceived ease of use was due to the calculation of p value above 0,05. Therefore this coefficient value is not significant. However, the p values (path coefficient) calculated for the Shopping Enjoyment (0,000) and Perceived Usefulness (0,040) shows its significance. When the coefficients are compared, it is seen that the Shopping Enjoyment (0,377) has greater impact than the Perceived Usefulness (0,215). In this context, the hedonic level perceived by users on booking websites becomes an issue more important than the perceived usefulness with regard to the flow experience. This result has also been supported by similar studies (Bilgihan, 2015). Hedonic features (0,584) of the websites affect the Shopping Enjoyment level. In this context, it gains importance for booking websites to turn the booking process into a more entertaining activity by attaching importance to hedonic features in terms of providing users with the flow experience.
Availability of some factors giving benefits (price, comparison, product variability etc.) to the users, may enable consumers to prefer a certain channel (Liu and Zhang, 2014) but it is only possible to create loyalty in consumers towards a specific channel particularly in the environments containing computer human interactions and covering a certain process such as researching, receiving information, comparison like online booking purchases through offering some features which entertain (Bilgihan, 2012) the users (consumers). At this point, the websites’ hedonic features, which express as well as the offering way of utilitarian features to consumers by online channels gain importance.
Utilitarian features which are quite close to each other are presented by many alternatives in online booking websites but the websites’ hedonic features can be seen as an important strategy for the purpose of differing with regard to uniqueness. In consideration of the impact of the hedonic features, which are also supported by this study, on the flow experience and the positive effects of the flow experience, which are showed by former studies such as e-loyalty, e-purchasing and brand equity; the hedonic features of the websites are a matter of subject that must be highlighted with regard to online booking. In this study, the importance of hedonic features of the booking websites were emphasized, and its effect on the flow experience was mentioned through the shopping enjoyment.

Tengilimoglu, Hassan / Applying Flow Theory to the Online Booking Experience: The Role of Utilitarian and Hedonic Features
11
Peer-review: Externally peer-reviewed. Conflict of Interest: The authors have no conflict of interest to declare.Grant Support: The authors declared that this study has received no financial support.
ReferencesAk, S., & Dincer, M. Z. (2019). Investigation of Consumer Reviews on Social Media for Five-Star
Hotel Enterprises in Istanbul: A Case of TripAdvisor. Paper presented at the 18th Traditional Tourism Symposium, Istanbul, Turkey. Proceedings of the Journal of Tourismology, 5(2), 171‒183.
Akgöz, E., & Tengilimoğlu, E. (2015). Online müşteri değerlendirmelerinin, tesis özellikleri açısından incelenmesi; Booking.com örneği. 16. Ulusal Turizm Kongresi, Çanakkale, 145‒163.
Amaro, S., & Duarte P. (2015). An integrative model of consumers’ intentions to purchase travel online. Tourism Management, (46), 64‒79.
Barış, G. (2015). Optimal Deneyimler Psikolojisi. In Yağcı, M. İ. & Çabuk S. (Ed.), Pazarlama Teorileri, (pp. 251-264). MediaCat, İstanbul.
Bilgihan A., Nusair K., Okumus F., & Cobanoglu, C. (2015). Applying flow theory to booking experiences: An integrated model in an online service context. Information & Management, (52), 668–678.
Bilgihan, A. (2012). The role of flow in creatıng e-loyalty: the case of online hotel booking websites. Doctor of Philosophy Dissertation, University of Central Florida, Orlando, Florida.
Bilgihan, A., & Bujisic, M. (2015). The effect of website features in online relationship marketing: A case of online hotel booking. Electronic Commerce Research and Applications, (14), 222–232.
Buhalis, D., & Law, R. (2008). Progress in information technology and tourism management: 20 years on and 10 years after the Internet-The state of eTourism research. Tourism Management, (29), 609–623.
Çuhadar, M. ve Köseoğlu, S. & Gültepe, Ö. (2018). Isparta ilindeki konaklama işletmelerine yönelik çevrimiçi müşteri değerlendirmelerinin incelenmesi: Tripadvisor örneği. Süleyman Demirel Üniversitesi, İktisadi ve İdari Bilimler Fakültesi Dergisi, 23(1), 227-239.
Emarketer (2018). Global digital travel sales 2018. https://www.emarketer.com/content/global-digital-travel-sales-2018. Access Date; 10.12.2018.
Esteban, I., Francisco, M., Martínez, J., David L., & Rodrigez A. I. (2014). The concept of flow in online consumer behavior. In F. J. Martinez-Lopez (Ed.), Handbook of Strategic e-Business Management (pp. 371-402). Springer-Verlag Berlin Heidelberg.
Guo, Y. M., & Poole, M. S. (2009). Antecedents of flow in online shopping: A test of alternative models. Info Systems Journal, (19), 369–390.
Hair, J. F., Hult, G. T., Ringle, C. M., & Sarstedt M. (2014). A Primer On Partial Least Squares Structural Equation Modeling (PLS-SEM), London, SAGE Publications.
Hoffman, D. L., & Novak, T. P. (1996). Marketing in hypermedia computer-mediated environments: conceptual foundations. The Journal of Marketing, 60(3), 50–68.
Hsu, C. L., Wu, C. C., & Mu-Chen C. M. C. (2013). An empirical analysis of the antecedents of e-satisfaction and e-loyalty: focusing on the role of flow and its antecedents. Information Systems E-Bussiness Management, (11), 287–311.

JOURNAL of TOURISMOLOGY
12
Kamau, J. P. W. (2015). Travel agencies response to internet evolution in Nairobi country: an analysis of competitive strategies. Doctor of Philosophy Dissertation, Kenyatta University.
Koufaris, M. (2002). Applying the technology acceptance model and flow theory to online consumer behavior. Inf. Syst. Res., 13(2), 205–223.
Liu, J. N. K., & Zhang, E. Y. (2014). An investigation of factors affecting customer selection of online hotelbooking channels. International Journal of Hospitality Management, (39), 71–83.
Liu, Z., & Park, S. (2015). What makes a useful online review? Implication for travel product websites. Tourism Management, (47),140–151.
Lopez, I., & Ruiz, S. (2011). Explaining website effectiveness: The hedonic–utilitarian dual mediation hypothesis. Electronic Commerce Research and Applications, (10), 49–58.
Muneta, A., Elena, M., & Andrea, O. L. (2013). ICT Impact on tourism industry. International Journal of Management Cases, 15(2), 87–98.
Noort, G. V., Voorveld, H. A. M., & Reijmersdal, E. A. V. (2012). Interactivity in brand web sites: cognitive, affective, and behavioral responses explained by consumers’ online flow experience. Journal of Interactive Marketing, (26), 223–234.
Novak, T. P., Hoffman, D. L., & Yung, Y. F. (2000). Measuring the customer experience in online environments: a structural modeling approach. Marketing Science, 19(1), 22–42.
Nusair, K., & Parsa, H. G. (2011). Introducing flow theory to explain the interactive online shopping experience in a travel context. International Journal of Hospitality Tourism Administration, (121), 1–20.
Obada, D. R. (2013). Flow theory and online marketing outcomes: a critical literature review. Procedia Economics and Finance, (6), 550–561.
Ozkara, B. Y., Ozmen, M., & Kim J. W. (2017). Examining the effect of flow experience on online purchase: A novel approach to the flow theory based on hedonic and utilitarian value. Journal of Retailing and Consumer Services, (37),119–131.
Schuberth, T. M. F., & Henseler, J. (2018). PLS path modeling–a confirmatory approach to study tourism technology and tourist behavior. Journal of Hospitality and Tourism Technology, 9(3), 249–266.
Sunar, H., Gökçe, F. ve Sürücü, A. Ö. (2018). Hatay’ın turizm değerlerinin online müşteri deneyimleri aracılığıyla incelenmesi. Journal of Recreation and Tourism Research, 5(4), 63–71.
Tengilimoğlu, E., Göral, R. ve Akgöz, E. (2017). Olumlu ve olumsuz geri bildirimlerin memnuniyet düzeylerine göre incelenmesi: Booking.com örneği. 18. Ulusal Turizm Kongresi, Mardin, 556-566.
TripAdvisor (2016). TripBarometer, Traveler Trends & Motivations Global Findings.

©The Authors. Published by the İstanbul University under the terms of the Creative Commons Attribution License http://creativecommons.org/licenses/by/4.0/, which permits unrestricted use, provided the original author and source are credited.
Journal of Tourismology, 6(1), 13-33
DOI: 10.26650/jot.2020.6.1.0009http://jt.istanbul.edu.en/
Submitted: 29.09.2018Revision Requested: 06.11.2018
Last Revision Received: 12.12.2019Accepted: 08.01.2020
Published Online: 25.03.2020R ES EA RC H A RT I C L E
Journal of Tourismology
1 Correspondence to: Michelle de la Harpe (Co-founder), University of Pretoria, Department of Historical and Heritage Studies, Pretoria, South Africa. E-mail: [email protected] ORCID: 0000-0002-2433-7287
2 Karina Sevenhuysen (Lecturer), University of Pretoria, Department of Historical and Heritage Studies, Pretoria, South Africa. E-mail: [email protected] ORCID: 0000-0002-6225-9320
To cite this article: de la Harpe, M. & Sevenhuysen, K. (2020). New technologies in the field of tourist guiding: Threat or tool? Journal of Tourismology, 6(1), 13-33. https://doi.org/10.26650/jot.2020.6.1.0009
Michelle de la Harpe1 , Karina Sevenhuysen2
New Technologies in the Field of Tourist Guiding: Threat or Tool?
AbstractThis article examines the impact of new technologies on the field of tourist guiding. It has been found throughout the preliminary research that a large gap in this field exists in academic literature. It is therefore important to study the role of the tourist guide in this era of emerging technologies, both in and outside the museum spectrum, to better understand the future place that tourist guiding will have in the tourism industry. Different types of new technologies are examined in relation to the field of tourist guiding, and the various benefits and limitations of these technologies are also discussed. It can be argued that only when embracing the positive aspects of both new technologies and tourist guiding can one offer tourists the best experience in the digital age. This realisation can greatly impact the way in which tourism managers design tourist experiences and tourist guides interact with both technology and tourists.
KeywordsTourist guide, New technologies, Apps, Smartphones, Virtual tours
JOURNAL of TOURISMOLOGY
14
IntroductionIn this 21st century, one cannot deny the importance and development of new
technologies in almost all aspects of our lives, especially in the tourism industry. It brings into question the impact that these new technologies will have on the future of the tourism industry, and more specifically, the future of tourist guiding. The purpose of this article is to examine the impact that new technologies may have on the tourist guiding industry. The different types of new technologies that are being used today are also discussed. The benefits and limitations of mobile applications, in particular, are looked into. The general consensus is that new technologies can be a very useful aid in the tourism industry; however, there are limitations to these new technologies as well. Further studies into the effects of new technologies on the tourist guiding industry will be needed to fully understand the future of the tourism industry with these new technologies. For the purpose of this article, new technologies include technologies that have been developed mostly in the last two decades. Since academic literature that focuses on the impact of new technologies mostly base their attention on new technologies in museums, examples in this study also greatly make use of examples found in the museum industry amongst others in southern and South Africa.
There are a few concepts that are used throughout this article. These include tourist guide, new technologies, apps, smartphones and virtual tours. These will need further clarification to understand the context these concepts are used in.
There have been many attempts at defining tourist guide. The Oxford dictionary (1933: 490), for example, defines a tourist guide as: “One who leads or shows the way, especially to a traveller in a strange country; spec. one who is hired to conduct a traveller or tourist.” Another definition is given by the World Federation of Tourist Guide Associations as “[a] person who guides visitors in the language of their choice and interprets the cultural and natural heritage of an area of which each person normally possesses an area-specific qualification usually issued and/or recognised by the appropriate authority.” (World Federation of Tourist Guide Associations, 2012).
New Technologies is linked to advances in computer technology. For the purposes of this article, the concept new technologies is used in the context of information technology and the use of new technological devices in the tourism industry. Application, in the context of this article, refers to “a program or piece of software designed to fulfil a particular purpose” (Oxford English Dictionary, 2017). A mobile application will then refer to software programs for the specific use on mobile devices, such as smartphones. Applications are sometimes also referred to as just apps. The concept smartphones is defined as “a mobile phone that performs many of the functions of a computer, typically having a touchscreen interface, Internet access, and an operating system capable of running downloaded apps” (Oxford English Dictionary, 2017).

de la Harpe, Sevenhuysen / New Technologies in the Field of Tourist Guiding: Threat or Tool?
15
Virtual tours can be divided into two concepts. Virtual refers to something that is “not physically existing as such, but made by software to appear to do so” (Oxford English Dictionary, 2017). Tour is defined as “a short trip to or through a place in order to view or inspect something” (Oxford English Dictionary, 2017). A virtual tour can then be defined as a computer-based tour that allows users to visit a place or museum without being there in person. The virtual tour simulates a real tour by making use of interactive 360˚ video software.
Brief Background on the Roles of the Tourist GuideTourist guiding is one of the oldest activities in the world (Cetin & Yarcan, 2017,
345-357). Tourist guiding has become a fundamental part of the global tourism industry. This is the case with both tour leaders and tourist guides (the former leading the group from their place of origin and the latter who meets the tourists at the destination (Cohen, 1985: 6).
Cohen (1985:10) provides two spheres of the roles of tourist guides, namely the leadership and mediator spheres. The leadership sphere involves the roles that the guide has to fulfil in terms of leading his/her group, as well as providing access to certain areas. There is a social element involved as well in the leadership sphere. This element is the responsibility of the guide to provide social unity within the group. The mediator sphere has to do with the guide being a cultural broker, or mediator, between the tour group and the local community (Alrawadieh et al., 2020: 53; Cohen, 1985: 10).
In recent years, the use of new technologies has started to take over the traditional roles of the tourist guides. Some technologies could be placed in the leadership sphere and others will fall into the mediator sphere, depending on whether the new technologies impact the way in which tourists are led at a destination, or help bring them in contact with the local community. Some technologies may even cause an overlap between the two spheres.
The Use of New TechnologiesMany scholars, who look at the future of tourist guiding, mention the impact that
new technologies will have on the industry. For example, Weiler and Black (2014: 167) state that “the advent of technology in both the marketing and the delivery of experiences is also having profound impacts throughout the tourism industry.”
Apart from the new technologies used in the tourism industry to improve the experience of tourists, there are other ways in which technologies impact global tourism. Knowledge about the tourism destination is accessible to tourists even before they travel. The Internet, for example, can provide tourists with most of the

JOURNAL of TOURISMOLOGY
16
knowledge they need, even before they arrive at the destination. This will inevitably pose a few challenges for tourist guides at these destinations, who have to guide tourists who may feel they know everything already. Tourism operators promote the skills, experience and qualifications of the tourist guide as a way of establishing an advantage, not only over the competition, but also as an advantage over the use of non-guided tours that some tourists prefer. Of course, the advantage that guides have will depend on the tourist group catered for. The Internet has also made it possible for tourists to easily review tourist guides, sites and tour operators at no cost to themselves. Websites such as ‘TripAdvisor’ offer this service. This increases the competitive challenges that tour operators are facing (Weiler & Black, 2014: 167).
Weiler and Black (2014: 167) elaborate on new technologies that are used at the tourism site, as well as en route, to aid the visitors’ experience. They mention that a consequence of these new technologies can be the emergence of the perception that these new technologies can overtake the role of the tourist guide. These roles include language translation, direction information, general service information, commentary and interpretation. Many digital guide books exist for use on smartphone devices. Nokia, Apple, Android and Google are just some of the mobile operators that have designed mobile guide books (Weiler & Black, 2014: 167).
Types of New Technologies
Mobile Applications
Background on the Development of Mobile ApplicationsAfter museums started experimenting with audio-tours, certain museums adopted
digital mobile guides in the 1990s. This started from simple audio tours providing information to the tourists as they are moving along the tourist site, to multimedia devices that provided video as well as audio. These have also become location-aware. These were quite attractive devices for museums, since they could be tailored for the specific group of visitors that the museum receives. One such project was the HIPS/HIPPIE (Hyper-Interaction within Physical Space) project in Europe in 1997. The Computer Interchange of Museum Information initiative in 2002 started to look into mobile devices, and stated that in the future, these devices could also possibly serve as virtual guides; electronic maps; a means of communicating with the museum; and as a tool to access gift shops at museums (Economou & Meintani, 2011: 1-2).
Since 2009, some museum-oriented mobile phone applications were released. Today, the area of smartphone applications, or apps, is rapidly expanding. Museums see smartphone applications as a means of reaching a new audience that they were previously incapable of reaching. Smartphones have now evolved into powerful

de la Harpe, Sevenhuysen / New Technologies in the Field of Tourist Guiding: Threat or Tool?
17
devices with large screens, fast and reliable Internet access, with a variety of input capabilities and strong location-awareness functions (Economou & Meintani, 2011: 2-3; Wang et al., 2014: 2).
“With the increasing number of users and greater incursion into people’s life, smartphones have the potential to significantly influence the touristic experience” (Wang et al., 2014: 2). There are a variety of different apps that all serve different purposes — even overlapping in some purposes. Two of the main type of mobile apps that fulfil the roles of the tourist guide and the tour operator are apps that provide guided tours of popular cities and apps that put itineraries together for tours (Reed, 2015: 1).
Smartphone apps can now provide tourists with a range of information and services, for example services surrounding major tourism activities, such as planning, navigation and reservation. Even minor services are available, which include services such as locating fuel stations nearby and waiting time for rides, for example. Thus, the needs of the traveller can be addressed at any time (Wang et al., 2014: 6).
There are many tourist guiding apps available, as will be discussed later in this article. There are also mobile applications available for specific tourism services, such as the ‘Gautrain App’, for Gautrain services in the Gauteng province, South Africa; ‘Flapp’, a flight services application; and even a ‘Kids Aid App’, which helps users in dealing with emergencies with children. These are all apps developed in South Africa (Houston, 2015).
It is becoming increasingly popular for museums and other tourist sites to encourage users to use their smartphones, instead of renting an audio device, or something similar. This is because the use of smartphones is very cost-effective for museums, since they do not need to purchase their own devices. This is also beneficial for tourists, since they would know how to operate their own smartphones, instead of having to learn how to operate another device.
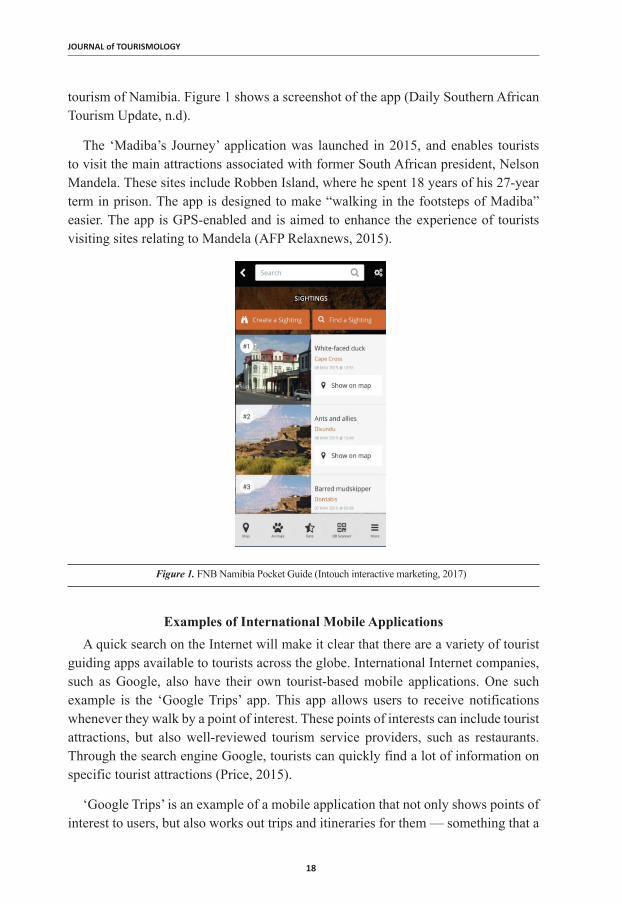
Examples of Mobile Applications in Southern AfricaThe ‘FNB Namibia Pocket Guide’ application was launched after its pilot run in
2013. This app is important for the tourism industry since it collects needed data and improves customer service in the industry. This app allows users to search for different tourism experiences in Namibia, as well as the best places for nearby tourism services, such as accommodation and restaurants. Users are able to share photos of their travels and share their experience of Namibia through the app. The app also makes it possible for people to rate tourism service providers. It also contains important information such as emergency numbers and maps of Namibia. This app was designed to help local tourism establishments and assist the developing national
JOURNAL of TOURISMOLOGY
18
tourism of Namibia. Figure 1 shows a screenshot of the app (Daily Southern African Tourism Update, n.d).
The ‘Madiba’s Journey’ application was launched in 2015, and enables tourists to visit the main attractions associated with former South African president, Nelson Mandela. These sites include Robben Island, where he spent 18 years of his 27-year term in prison. The app is designed to make “walking in the footsteps of Madiba” easier. The app is GPS-enabled and is aimed to enhance the experience of tourists visiting sites relating to Mandela (AFP Relaxnews, 2015).
Figure 1. FNB Namibia Pocket Guide (Intouch interactive marketing, 2017)
Examples of International Mobile ApplicationsA quick search on the Internet will make it clear that there are a variety of tourist
guiding apps available to tourists across the globe. International Internet companies, such as Google, also have their own tourist-based mobile applications. One such example is the ‘Google Trips’ app. This app allows users to receive notifications whenever they walk by a point of interest. These points of interests can include tourist attractions, but also well-reviewed tourism service providers, such as restaurants. Through the search engine Google, tourists can quickly find a lot of information on specific tourist attractions (Price, 2015).
‘Google Trips’ is an example of a mobile application that not only shows points of interest to users, but also works out trips and itineraries for them — something that a

de la Harpe, Sevenhuysen / New Technologies in the Field of Tourist Guiding: Threat or Tool?
19
tour operator normally does. Figures 2 and 3 are advertisements of the app as found on Google’s app store. One can see how the app works out tours for users in Figure 3, using Google Map technology (Google Play, 2017).
Another example of a similar app is ‘Stray Boots’. This application also points tourist in the direction of interesting attractions and sites, but also has a bonus ‘scavenger hunt’ feature, which challenges tourists to try new foods or partake in some tourist activity. It has sixty different self-guided tours available in popular cities such as Copenhagen and Paris (Price, 2015). Some apps are combining history with tourism, by providing users with historic information of their current location, such as ‘History Pin’. This app is provided through a non-profit organisation, powered by Google and makes use of both submitted photos, taken by tourists, as well as archival material (Price, 2015).
Benefits of Mobile ApplicationsThe benefits of mobile applications have not received as much academic attention
as the general use of technologies in museums. The Tourism Update has published an article written by Reed (2015) on the benefits that mobile applications can have for
Figure 2. ‘Google Trips’ (Google, 2017) Figure 3. ‘Google Trips’ (Google, 2017)

JOURNAL of TOURISMOLOGY
20
the tourism industry. The information that apps deliver is often well-researched and likely to be correct. It depends on how they were designed, but if they are correctly set-up, apps can provide the correct content consistently. Apps are also cost-effective. Apps can provide users with a range of content that is relevant to the particular tour, or tourism site. These applications can also provide an overview on the background of the tourism site, and can provide a perspective on why the site is relevant (Reed, 2015: 2-3).
A great benefit of apps is their ability to aid self-drive travellers who like to plan their own travels, independent of tourist guides and operators. Apps also allow visitors to travel at their own pace, which they most likely would not be able to do in a guided tour group. Apps allow tourists to modify their tours. For example, they can skip certain points of interest that they do not want to visit, and add other points of interest which may not be included in guided tours, due to possible lack of interest and time constraints (Reed, 2015: 3).
“Anything that aids and enhances the visitor experience is a good thing.” (Reed, 2013: 3). Apps can cater for visitors of all ages and encourage interaction between family members. Apps can also provide services to a large number of tourists, where this is not always possible for tourist guides who usually have a limited number of people in a guided group. Apps also have the benefit of being available in a wide range of languages (Reed, 2013: 3). Dickenson and other authors argue that apps have in a way made it possible for tourists to escape from the time constraints of their everyday life. They can now access opening times easier and also read through resources of attractions at any time. This has really opened up the tourism industry from being time-constricted (Dickenson et al., 2012).
A big advantage of smartphone applications is the possibility for tourists to share their experience on social media platforms. Tourists can also receive feedback on their shared travels and comments. This allows tourists to connect with other travellers and therefore form a larger overview of the site and its attractions. Tourists feel a sense of excitement when they are able to share their travels with friends and family (Reed, 2015: 4).
If one reads the reviews of some tourist guiding apps, one can quickly discover how many people benefit from the apps on their personal trips. Some of the more stellar reviews of the Google Trips app included one person commentating that: “This app makes everything so easy! It’s great to have all my reservations at one place. I love that it has so many recommendations for attractions and food. This app has everything you could ever need…” and another saying that the app is “Just like a virtual assistant.” Of the poorer reviews, most are about the technical aspects of the apps (such as bugs found with the apps and features they would like to have on the app). One reviewer states that the Madiba Journey App is a “beautifully conceived,

de la Harpe, Sevenhuysen / New Technologies in the Field of Tourist Guiding: Threat or Tool?
21
well executed tourism tool.” He also states that he looks forward to using the app as he tours South Africa (Google Play, 2018).
From these reviews one can see that users view these applications as useful in their travels. As mentioned, most of the lower-star reviews are suggestions on how to improve the applications. From this one can gather that more people would likely use applications if they are well-designed. There is very little talk of the impersonal nature of apps as opposed to making use of real-life tourist guides (Google Play, 2018).
Limitations of Mobile ApplicationsThere are, however, limitations to what apps can offer tourists. Many scholars seem
to agree that tourist guides offer a ‘richer’ experience for tourists. Aspects such a tourist guide’s ability to add his/her interpretation to a site are of great value to many tourists. Tourist guides can offer personal interaction, with the possibility of tourists to interact with the local environment. This is something that tourists are increasingly seeking, and which tourist apps cannot necessarily provide. Things that you can derive from tourist guides, and not apps, include: experience, charisma, personality, and the personalisation of tour experiences. Some scholars argue that although apps can provide tourists with a lot of technical information, it is the narrations of the tourist guide, and his/her way of transferring this information through his/her personality and enthusiasm, which really add value to the information that tourists receive (Reed, 2015: 4-5).
From a South African perspective, tourist guides also have a distinctive advantage over apps. The people of South Africa, with their diverse range of cultures, are part of South Africa’s attraction. A tourist guide is then an ideal way for tourists to experience the rich cultures, by receiving information through a local who understands the cultures. The personal interaction with local people that tourists can experience through tourist guides can be seen as even more interactive than mobile apps. Most leisure tourists want to interact with the local communities in some way. By purely interacting with technological devices and automated processes, the travel experience may be quite dull and sterile (Reed, 2015: 4-5).
Another limitation that apps may have is their ability to answer questions, and follow-up questions. Apps can have a wide range of information, but specific questions, which tourists may wonder about, are not necessarily covered by an app. On an economic note, tourist guiding provides, often much-needed, jobs to the local community. Tourist guides are also often trained to handle real-life situations, such as medical emergencies, which apps cannot handle (Reed, 2015: 5-6).
Because of the connection that tourist guides, in most cases, have with tourism service providers, they are more able to help accommodate special requests of tourists

JOURNAL of TOURISMOLOGY
22
and are therefore excellent problem-solvers. Apps are not always able to handle special requests in terms of tourism services. Tourist guides are able to read tourists better and change the tour to match the needs that tourists may not even realise they have (Reed, 2015: 6).
Limitations to apps that provide maps to tourists have been highlighted by the Tshwane Tourism Association (TTA) in the Gauteng Province of South Africa. According to the TTA, their research has indicated that most people who travel still like to hold a physical map, as opposed to using an app where you have to scroll around to see the map. Tourists also do not necessarily always have Internet access while travelling. This is why the TTA decided to launch a physical map (see Figure 4) of the Tshwane area in 2016, as opposed to developing an app (Daily Southern African Update, 2016).

de la Harpe, Sevenhuysen / New Technologies in the Field of Tourist Guiding: Threat or Tool?
23
Figure 4. Physical map of the Tshwane area (Tshwane Tourism Association, 2017)
Figure 4 shows only a section of the physical map. Already, one can notice an overload of information given to the tourist. An app can categorise the information with specific links to certain information sections to make it easier for tourists to find the information they are looking for. The printed version of this map would be quite big. The argument that the physical map, as opposed to an app, is available to people without an Internet connection can be debated, since one has to visit the

JOURNAL of TOURISMOLOGY
24
Tshwane Tourism Association website to get a PDF version of the map. Not all apps make use of an Internet connection when in use. One does, however, need an Internet connection and a smartphone to download an app.
The Benefits of Mobile Applications In Comparison to Tourist GuidesThe table below provides a comparative analysis of mobile applications and tourist
guides as provided by Reed (2015).
Table 1Benefits and Limitations of Mobile Applications (Reed, 2015)
Benefits of mobile applications Benefits of tourist guidesInformation provided is correct Tourist guides can offer a richer experienceCost-effective Employing local guides can have positive economic
benefits for the local communityProvides range of relevant information Mobile applications often lack personal interaction
with the local community which tourist guides offerProvides overview of background of tourist attractionTourist guides can answer questions and anticipate
follow-up questionsAids self-drive travellers Narrations of tourist guides can add meaning to a
tourVisitors can travel at their own pace Mobile applications often lack personal interaction
with the local community which tourist guides offerCaters to large number of visitors, can be presented in a variety of languages and can cater for different age groups
Most tourist guides possess a certain personality and charisma
Encourages interaction between group members Tourist guides are able to assist in physical emergencies, such as performing CPR.
Since opening times and other resources linked to attraction are easily accessible, tours are not as time-restricted
Tourist guides have the ability to handle special requests regarding tourism services
Other benefits of mobile applications relate to the possibility of visitors to share their experiences on social media, with their friends and family.
Virtual ToursVirtual tours had their origins in the 1990s with the launching of various CD-ROMs,
such as Apple’s ‘Virtual Museum’. The user was able to navigate through sites such as art galleries on a computer screen by using a computer mouse. This raised many questions among scholars about authenticity and how technology might threaten and impact on the authentic experience of tourists, often contextualised by the tourist guide. There are a few distinctive features of virtual realities in terms of museums. One is that they allow access in real-time and are available to multiple users at the same time. This can essentially be done from any computer in the world with Internet connection and has therefore far-reaching accessibility advantages. Users all over the world can now have access to visual information about the museum (Huhtamo, 2013: 121-122; Jackson, 2010: 154-155).

de la Harpe, Sevenhuysen / New Technologies in the Field of Tourist Guiding: Threat or Tool?
25
There has been an attempt by international museums, mostly in developed countries in North America and Western Europe, to achieve the notion of a ‘museum without walls’. This essentially entails the information that the museum has to offer to be available to both on-site and off-site visitors. Museums have also started incorporating the abovementioned mobile apps in achieving the wall-less museum (Arvanitis, 2010: 170).
South African Tourism has started to make some attempts in incorporating virtual reality into the tourism sector. In 2016, South African Tourism hosted a pop-up experience, ‘Find your wild’, where tourists could experience certain South African tourism attractions such as shark cage diving, and penguin spotting at Boulders Beach — all by making use of 360° virtual-reality technology (Benjamin, 2016).
Social media platforms, such as Facebook, have been used in countries like South Africa, to showcase the ability that virtual-reality technology has on promoting tourist attractions of a country. Virtual-reality videos posted on platforms such as Facebook, have received a great amount of positive feedback. This can be witnessed in the campaign ‘South Africa: A 5-minute holiday’. Filmed entirely in South Africa, the campaign produced 5 short 360 ° videos of South African sites, posted to the Facebook page of South African Tourism. The videos have had over a million views, as well as thousands of positive comments (Visualise, 2016).
Here one can note the emergence of the post-museum. Many scholars argue that the museum industry should move away from the 19th-century perception that museums are confined to a building where only factual information is transmitted through the voice of the curator. Instead, the post-museum incorporates multiple voices and embraces subjectivity, where knowledge is constructed rather than only passed on (Arvanitis, 2010: 171). One of the most prominent museums that do have a virtual tour on their website is the Vatican Museum. The information of the museum is transformed into a commodity that can be moved outside the confines of the museum building (Arvanitis, 2010: 170; Musei Vaticani, 2017).
According to the American Association of Museums (AAM), museums should “represent the world’s natural and cultural commonwealth” (Muller, 2010: 295). This is often not possible due to many historical artefacts being stored away safely in museum archives and storages. Many of the world’s heritages are thus inaccessible to tourists. This can be seen in the example of Da Vinci’s painting ‘The Last Supper’. The painting has become a virtual painting, since almost everyone has only seen pictures of the painting, and not the actual painting itself. Thus, virtual representations make heritage accessible to users who would not have been able to experience it otherwise (Muller: 2010: 295). The question and debate about authenticity, however, still remain.

JOURNAL of TOURISMOLOGY
26
Google has extended the use of new technologies to the education sector. With Google’s ‘Expedition’ initiative, teachers can take their classes to historic sites such as the Colosseum, or the Taj Mahal, without leaving the classroom. This is done by making use of virtual-reality headsets and smartphones. In 2017, Google made the app available to the general public as well. Now individuals can tour over 600 tour locations, all from the comfort of their own home. They only need to buy a headset, since many tourists already own smartphones. Virtual-reality headsets are slowly becoming more affordable as well. On a South African online shop, one can purchase a headset for about R250. There is also a group tour option, where individuals can connect with other users over Wi-Fi, and with the help of an Internet connection, a guide then provides tours to the users. Figure 5 shows how an underwater tour would look by using the Google ‘Expeditions’ app with a virtual-reality headset (Matney, 2017; Takealot, 2017).
Figure 5. ‘Google Expeditions’ app (Google, 2017)
Museum Gaming AppsMuseum gaming apps have been used by a few museums in developed countries,
such as the United Kingdom and the United States, to encourage empathy among tourists, relating to the museum’s field of interest. The increase of usage of these types of games correlates with the increasing gamification of cultural objects. Gamification refers to “the growing trend for activities and environments not traditionally understood as video games to take on their mechanics, structures and rewards systems.” (Kidd, 2015: 2). These games have been used to engage and keep the attention of interested parties. There is also an attempt by these games to create

de la Harpe, Sevenhuysen / New Technologies in the Field of Tourist Guiding: Threat or Tool?
27
affective empathy. Affective empathy is defined as “…the capacity to respond with appropriate emotion to another’s mental state” (Kidd, 2015: 3). The main objective of these games, alongside the facilitation of empathy, is to encourage learning: Learning about historical events, learning about museum collections, and even learning how to modify one’s behaviour in the world (Kidd, 2015: 2-3, 9). Examples of these museum gaming apps include: ‘High Tea’ (Welcome Trust, UK), ‘The Beatle’s Game’ (National Museums, UK), ‘Great Fire of London’ (Museum of London, UK), ‘Dressed to Kill’ (Tower of London, UK) and ‘Before the Boycott: Riding the bus’ (National Civil Rights Museum, US) (Kidd, 2015: 4).
By using the first-person perspective in games, the characters in the games can deepen and affect behavioural patterns. The player of the game can really see the historic event through the eyes of the people who lived through it. If, for example, the person playing the game has a willingness to take responsibility for another character, the person can gain that willingness to take the responsibility of another person in real life as well. These benefits are contested by various scholars and are not seen as definite. Empathy has, however, been found to be an important factor in facilitating the learning experience of a person. It can also lead to less social conflict and the diminishing of prejudice (Kidd, 2015: 5-7).
Personal Digital AssistantsPersonal digital assistants (or PDAs) are small portable screens that provide
information to visitors and motivate interaction by tourists through a touch screen. These PDAs can provide text files, as well as multimedia files including video and audio files. The information is given on the screen, while audio is provided through headphones. These PDAs are especially popular in some art galleries. The Cutlery Museum, an art gallery in Spain, is using these PDAs in the museum. The Los Angeles County Museum of Art has also installed PDAs for the use by visitors to the museum, which can be seen in Figure 6. Visitors can then categorise certain museum objects as ‘favourites’ on the device, and the museum will then email information about these specific objects to the visitors. A limitation of these PDAs, and in all probability other similar devices, is that it does not encourage discussion between tourists. Tourists cannot interrupt the transfer of information to give their own opinion or interpretation (Nelson, 2009; Tesoriero et al., 2007: 351; Vom Lehn & Heath, 2005: 6, 9).

JOURNAL of TOURISMOLOGY
28
Figure 6. PDA used by Los Angeles County Museum of Art (Nelson, 2009)
QR CodesQuick Response or QR codes, link to the field of mobile tagging. Mobile tagging
involves the use of one’s smartphone to connect physical objects (for example, artefacts in a museum) to virtual information found through an Internet connection. 2D codes are placed near, or on, certain objects. Using specialised software on one’s mobile phone, one can then ‘scan’ this code which will then link to the relevant webpage. QR codes are used for marketing purposes, providing user-relevant information, and for attaching info to certain buildings and objects. QR codes can be used at the tourism site and in museums, as well as in souvenir shops located at tourism sites. In the tourism industry, QR codes can link tourists to a downloadable PDF document which contains relevant information about the tourism site, or be used to provide information on objects, including historical backgrounds. QR codes can also make use of location-based information to provide tourists with information regarding their specific location. QR codes are also applicable for use on tickets, instead of the usual barcodes, which are often problematic. For example, QR codes are not as sensitive to level surfaces such as normal barcodes (Canadi et al., 2010: 4-5, 9-10).
In South Africa, QR codes have been implemented at tourist attractions such as the Voortrekker Monument in Pretoria/Tshwane (Gauteng Province). In the Cenotaph hall, one can find QR codes located under the marble frieze panels, in the Hall of Heroes. Visitors can then scan the codes, and receive more information

de la Harpe, Sevenhuysen / New Technologies in the Field of Tourist Guiding: Threat or Tool?
29
on the individual panels. These QR codes can be seen in Figure 7 (Voortrekker Monument, 2017).
Figure 7. QR Codes used by the Voortrekker Monument (De la Harpe, 2015)
The town of Mossel Bay in South Africa has launched its own QR-code tour. These codes have been placed at various locations at the Bartolomeu Dias Museum Complex. The vice-chairperson of Mossel Bay tourism, Ray Murray, commented on the new technology that has been implemented: “The future is with us; it is in the new technology, and if you don’t embrace it, you will be left behind.” (Mossel Bay Advertiser, 2012). It seems that South Africa welcomes new technology in museums, even if the progress is slow and can only be seen in certain technologies thus far.
QR codes are very popular in international tourism. Certain tourist sites are making use of online encyclopaedias, such as Wikipedia, as the linked sources of QR codes. Monmouth in Wales was the first town to have these Wikipedia-connected QR codes implemented. Even smaller territories, such as Gibraltar, are becoming ‘Wikipedia-towns’ as the town is dotted with QR codes, linking tourists to online information about specific attractions. Since websites such as Wikipedia are available in a number of languages, the information provided to tourists can be in the tourists’ preferred language. This is just one of the many benefits that tourism operators see in the use of QR codes (Moskvitch, 2012).
Benefits of the use of QR codes include a fast increase in handling experiences and also the flexibility advantages of mobile applications. Limitations include the fact that users have to download software to scan QR codes. These QR scanners are, however, easily accessible and there are a number of applications to choose from. Another limitation is navigating through what may be a lot of information about the tourism site, for the specific information that the tourist is seeking. Internet availability and the cost of maintaining Internet connections are also limitations to the implementation of QR codes (Canadi et al., 2010: 6, 16).

JOURNAL of TOURISMOLOGY
30
In-Ear TranslatorThe ‘Pilot’ system is developed by Waverly labs in the United States, and is an in-ear
device that can translate any language immediately for the user. The device is still only available for pre-ordering, but it is a ground-breaking invention that may significantly change the tourism industry. It is a gadget that can easily fit into the user’s ears and translate any language that the user is hearing in real-time (Gould-Bourn, 2016).
Benefits of the Use of New TechnologiesWeiler and Black (2014: 167) mention that the use of new technologies has made
it possible for people who are mentally and physically differently-abled to travel. Wang and other authors (2014: 5) state that the use of technology and mass media can add significant value to the mediation process in the tourism industry. The Internet, especially, mediates tourism to a greater degree, since it provides interactive possibilities for the media, as well as its audience. The Internet can also show people, by using both visual and audio aids, what certain tourism destinations look like, and might even encourage people to visit these places (Wang et al., 2014: 5).
Limitations to the Use of New TechnologiesVom Lehn and Heath (2005: 14) state that many methods that scholars use to
measure whether or not new technologies are beneficial for museums are not adequate enough. An increase in visitor numbers, or an increase in time spent at an object, is not enough to convince scholars of the efficiency of these new technologies. This is in particular reference to the use of PDAs and information kiosks (Vom Lehn & Heath, 2005: 14).
Vom Lehn and Heath (2005: 15-16) provide a few suggestions that museums should keep in mind when implementing new technologies, such as information screens.
1. Portable devices should not be for one specific person, but designed to be shared between tourists.
2. Display technology should make participation of multiple users possible.
3. Screens with information should be positioned to make it possible for people to see it from different angles.
4. The content on the device should refer back to the artefact so that users will interact with the artefact and the device, and not only with the device.
5. The content on the device should encourage discussion between tourists about the exhibit.

de la Harpe, Sevenhuysen / New Technologies in the Field of Tourist Guiding: Threat or Tool?
31
A further possible limitation to the use of mobile apps in a museum environment is that the interesting technology may overshadow the actual exhibits (Economou & Meintani, 2011: 15).
ConclusionThere are various new technologies being implemented at museums and other
tourist sites all over the world, including South Africa. These new technologies include mobile applications for smartphones, virtual reality, PDAs, QR codes, museum games and devices such as the in-ear translator. There are certain limitations to these technologies, but the benefits of the use of these technologies are hard to ignore. These technologies are used in different ways, but are all implemented to enhance the tourism experience. To better understand the future of the tourism industry, and tourist guiding specifically, one will need to understand these new technologies better. With the increasing number of tourism apps and other technologies, there is no escaping the flood of technology on the tourism industry. A harmonious relationship between new technologies and the tourist industry will have to be established in order for tourist attractions to benefit from these technological tools, without devaluating and threatening the attraction itself, its authenticity and the unique role of the tourist guide in the tourist experience.
Peer-review: Externally peer-reviewed. Conflict of Interest: The authors have no conflict of interest to declare.Grant Support: The authors declared that this study has received no financial support.
ReferencesAFP Relaxnews. (2015). “Madiba’s Journey’ Phone App for Tourists in South Africa”. Retrieved
from https://www.timeslive.co.za/sunday-times/lifestyle/travel/2015-04-02-madibas-journey-phone-app-for-tourists-in-south-africa/ 20.11.2017
Alrawadieh, Z., Cetin, G., Dincer, M. Z., & Istanbullu Dincer, F. (2020). The impact of emotional dissonance on quality of work life and life satisfaction of tour guides. The Service Industries Journal, 40(1-2), 50–64.
Application. (2017). In Oxford Dictionary. Retrieved from https://www.oxfordlearnersdictionaries.com/definition/english/application?q=application.
Arvanitis, K. (2010). Museum Outside Walls: Mobile Phones and The Museum in The Everyday. In R. Parry (Ed.), Museums in a digital age (pp. 170-176). London, England: Routledge.
Benjamin, K. (2016). “South African Tourism Promotes Destination with VR Activity”. Retrieved from https://www.campaignlive.co.uk/south-african-tourism-promotes-destination-vr-activity/%7Bsubjects%7D/article/1409083 12.12.2017
Cetin, G. & Yarcan, S. The professional relationship between tour guides and tour operators. Scandinavian Journal of Hospitality and Tourism, 17(4), 345–357.

JOURNAL of TOURISMOLOGY
32
Cohen, M., Hopken, W., & Fuchs, M. (2010). Application of QR codes in online travel distribution. Information and Communication Technologies in Tourism, 137–148.
Cohen, E. (1985). The tourist guide: The origins, structure and dynamics of a role. Annals of Tourism Research, 12(1), 5–29.
Daily Southern African Tourism Update. “Tshwane Launches Tourist Map”. Retrieved from http://www.tourismupdate.co.za/article/112212/Tshwane-launches-tourist-map 8.8.2016
Daily Southern African Tourism Update. “New ‘FNB Namibia Pocket Guide’ app launched for Tourism Industry”. Retrieved from https://neweralive.na/posts/fnb-namibia-pocket-guide-app-launched-tourism-industry 8.8.2016
Dickenson, J. E., Ghali, K., Cherrett, T., Speed, C., Davies, N., & Norgate, S. (2012). Tourism and the smartphone app: capabilities, emerging practice and scope in the travel domain. Current Issues in Tourism, 17(1), 84–101.
Economou, M., & Meintani, E. (2011). Promising beginnings? Evaluating museum mobile phone apps. Emerging Experiences, 1–20.
Google Play. (2017). Google Trips. Retrieved from https://get.google.com/trips/ 12.12.2017Google Play. (2018). “Google Trips - Travel planner”. Retrieved from https://play.google.com/store/
apps/details?id=com.google.android.apps.travel.onthego&showAllReviews=true 24.8.2018Google Play. (2018). “Madiba’s Journey”. Retrieved from https://play.google.com/store/apps/
details?id=net.southafrica.mandela&showAllReviews=true 24.8.2018Gould-Bourn, J. (2016). “In-Ear Device That Translates Foreign Languages in Real Time”.
Retrieved from http://www.boredpanda.com/real-time-translator-ear-waverly-labs/ 12.8.2016Guide. (2017) In Oxford Dictionary. Retrieved from https://www.oxfordlearnersdictionaries.com/
definition/english/guide_1?q=guide.Houston, R. (2015). “10 Locally Built Travel Apps You Should Be Using”. Retrieved from http://
www.travelstart.co.za/blog/10-south-african-built-travel-apps-you-should-be-using/ 12.12.2018Huhtamo, E. (2013). On the Origins Of The Virtual Museum. In R. Parry (Ed.), Museums in a
digital age (pp. 121-135). London, England: Routledge.Jackson, R. (2010). The Virtual Visit: Towards A New Concept for The Electronic Science Centre.
In R. Parry (Ed.), Museums in a digital age (pp. 153-158). London, England: Routledge.Kidd, J. (2015). Gaming for Affect: Museum Online Games and the Embrace of Empathy. Journal
of Curatorial Studies, 4(3), 414–432.Matney, L. (2017). “Google Opens Expeditions VR Education App To The Public”. Retrieved from
https://techcrunch.com/2017/07/19/google-opens-expeditions-vr-education-app-to-the-public/ 12.12.2017
Moskvitch, K. (2012). “Gibraltar Targets Tourists with Wikipedia QR Codes”. Retrieved from http://www.bbc.com/news/technology-19544299 12.12.2017
Mossel Bay Advertiser. (2012). “Mossel Bay Launches First QR Codes Tour”. Retrieved from https://www.mosselbayadvertiser.com/News/Article/General/mossel-bay-launches-first-qr-codes-tour-20170711 12.12.2017
Muller, K. (2010). Museums and Virtuality. In R. Parry (Ed.), Museums in a digital age (pp. 295-305). London, England: Routledge.
Musei Vaticani. (2017). “Pio Clementino Museum”. Retrieved from http://www.museivaticani.va/content/museivaticani/en/collezioni/musei/museo-pio-clementino/tour-virtuale.html 20.11.2017

de la Harpe, Sevenhuysen / New Technologies in the Field of Tourist Guiding: Threat or Tool?
33
Nelson, R. (2009). “The Art of Wireless: Testing Ensures WLAN Quality Of Service”. Retrieved from https://www.edn.com/design/test-and-measurement/4380620/The-art-of-wireless-Testing-ensures-WLAN-quality-of-service 13.12.2017
Price, E. (2015). “Travel Apps That Can Replace Your Tour Guide”. Retrieved from https://www.cntraveler.com/stories/2015-02-24/travel-apps-that-can-replace-your-tour-guide 12.12.2017
Reed, T. (2015). Can apps replace tourist guides? Daily Southern African Tourism Update.Smartphone. (2017). In Oxford Dictionary. Retrieved from https://www.oxfordlearnersdictionaries.
com/definition/english/smartphone?q=smartphone.Takealot (2017). “Volkano Matrix Series Virtual Reality Headset”. Retrieved
from https://www.takealot.com/volkano-matrix-series-virtual-reality-headset/PLID41221131?gcl id=CjwKCAiAmb7RBRATEiwA7kS8VAtc_5yuM_u6crWj_UCIOcI1sBHSexfVpNSSMZavPbEErNe_Utq9URoCNwIQAvD_BwE 12.12.2017
Tesoriero, R., Lozano, M., Gallud, J. A., & Penichet, V. (2007). Evaluating the users’ experience of a PDA-based software applied in art museums . WEBIST, 2, 351-358.
Tour. (2017). In Oxford Dictionary. Retrieved from https://www.oxfordlearnersdictionaries.com/definition/english/tour_1?q=tour.
Virtual. (2017). In Oxford Dictionary. Retrieved from https://www.oxfordlearnersdictionaries.com/definition/english/virtual?q=virtual.
Visualise. (2016). “VR Travel Experience for South African Tourism”. Retrieved from http://visualise.com/case-study/vr-travel-south-african-tourism 12.12.2017
Vom Lehn, D., & Heath, C. (2005). Accounting for new technology in museum exhibitions. International Journal of Arts Management, 11-21.
Voortrekker Monument. (2017). “Hall of Heroes”. Retrieved from http://www.vtm.org.za/hall-of-heroes/ 12.12.2017
Wang, D., Xiang, Z., & Fesenmaier, D. R. (2014). The role of smartphones in mediating the touristic experience. Annals of Tourism Research, 48, 11–26.
Weiler, B., & Black, R. (2014). Tour Guiding Research: Insights, Issues and Implications (62 ed.). Channel View Publications.
World Federation of Tourist Guide Associations (2012). “What is a Tourist Guide?” Retrieved from http://www.wftga.org/tourist-guiding/what-tourist-guide 23.05.2017


©The Authors. Published by the İstanbul University under the terms of the Creative Commons Attribution License http://creativecommons.org/licenses/by/4.0/, which permits unrestricted use, provided the original author and source are credited.
Journal of Tourismology, 6(1), 35-48
DOI: 10.26650/jot.2020.6.1.0033http://jt.istanbul.edu.en/
Submitted: 07.10.2019Revision Requested: 10.11.2019
Last Revision Received: 15.11.2019Accepted: 06.12.2019
Published Online: 13.03.2020R ES EA RC H A RT I C L E
Journal of Tourismology
1 Correspondence to: Faruk Seyitoglu (Asst. Prof. Dr.), Mardin Artuklu University, Faculty of Tourism, Mardin, Turkey. E-mail: [email protected] ORCID: 0000-0002-7859-6006
To cite this article: Seyitoglu, F. (2020). Cappadocia: The effects of tourist motivation on satisfaction and destination loyalty. Journal of Tourismology, 6(1), 35-48. https://doi.org/10.26650/jot.2020.6.1.0033
Faruk Seyitoglu1
Cappadocia: The Effects of Tourist Motivation on Satisfaction and Destination Loyalty
AbstractThe present study investigates how the motivations of foreign tourists visiting the Cappadocia region in Turkey affect their satisfaction and destination loyalty. The research was conducted using a questionnaire, which was answered by 363 foreign tourists visiting Cappadocia. First, the main factors in tourists’ motivation for travel were determined. These motivation factors and satisfaction and destination loyalty intention scales were used to conduct multiple regression analyses. The results suggest that three categories of tourist motivations (‘novelty and learning’, ‘escape and relaxation’, and ‘socialization’) had a direct correlation with satisfaction, while two (‘novelty and learning’ and ‘escape and relaxation’) had a direct correlation with destination loyalty. This work has implications for destination managers and tourism businesses, and we conclude with suggestions for future studies.
KeywordsMotivation, Satisfaction, Loyalty, Destination, Cappadocia

JOURNAL of TOURISMOLOGY
36
IntroductionThe concept of motivation is defined as a reason for travelling (Jang, Bai, Hu &
Wu, 2009). People are often motivated by their physical and psychological needs (Mill & Morrison, 2002). Pearce and Caltabiano (1983) indicate that motivation is a crucial component in explaining tourists’ activities. Accordingly, it is vital for destination managers to understand tourists’ motivations in order to meet their needs and desires. Moreover, travel motivation is a significant factor in predicting tourists’ behaviours and their destination choices (Chiang, Wang, Lee & Chen, 2015), and is important in determining loyalty (Mathwick, Malhotra & Rigdon, 2002). Therefore, understanding tourist motivations may be beneficial to both destination managers and industry entrepreneurs. In turn, this will help to develop tourism strategies to improve demand (Farmaki, Khalilzadeh & Altinay, 2019).
Motivation can be considered a state of need which requires people to act in order to achieve satisfaction (Farmaki et al., 2019). Factors such as escape, relaxation, novelty, socialization, self-development and learning have been proposed as the most significant motivations for travel (Pearce & Lee, 2005; Yoon & Uysal, 2005), especially for tourists seeking culture and history (Chiang et al., 2015).
According to Crompton (1979), motivation may be push (intrinsic) or pull (extrinsic). While push motivations refer to tourists’ desires and needs, pull motivations consist of the attributes that destinations offer (Do Valle, Silva, Mendes & Guerreiro, 2006). Moreover, tourists’ prior expectations are significant components in determining their satisfaction level (Chon, 1989). Since push motivations differ between individuals, it is possible that different tourist groups will prefer different activities during their vacations. For instance, people motivated by relaxation or seeking an escape may prefer entertainment, nightlife, and sports activities; conversely, tourists that value social status may prefer activities such as tennis, golf, fishing, or gambling (Andreu, Kozak, Avci & Cifter, 2006). In general, motivations vary for each person, destination, market segment and tourists’ decision-making process (Uysal & Hagan, 1993).
Motivation defined as a need that causes a person to act in a certain way (Beerli & Martín, 2004). On the other hand, satisfaction is found to be a moderating variable between motivations and loyalty (Yoon & Uysal, 2005). Moreover, Hallowell (1996) stated that there is a connection between satisfaction and loyalty. Loyalty includes the intention to revisit or repurchase and a willingness to recommend the place or product to others (Do Valle et al., 2006). Studies show that the main driver of loyalty is satisfaction (Brandano, Osti & Pulina, 2019). We can therefore see that motivation, satisfaction, and loyalty are closely interrelated.
This study focuses on Cappadocia, a region containing the cities of Nevşehir, Niğde, Aksaray, Kırşehir and Kayseri. The region’s rocky lands and “fairy chimney”

Seyitoglu / Cappadocia: The Effects of Tourist Motivation on Satisfaction and Destination Loyalty
37
rock formations are mostly located in the Nevşehir province, including the nearby towns of Göreme, Ürgüp, Avanos, Uçhisar, Ihlara and Derinkuyu (Özer & Kozak, 2016). The Cappadocia region is an important attraction for both domestic and foreign tourists in terms of culture and history, as well as the fairy chimney formations. The Cappadocia region is a popular destination for tourists who have cultural and religious motivations (Erdogan & Tosun, 2009). Moreover, the region provides a real authentic experience for tourists (Tucker, 2002) with its unique landscape and authentic rock-cut houses (Tucker, 2003).
The region is also a remarkable destination for academics. Previous studies of the region have examined destination management (Coban & Yildiz, 2019), destination attraction and its relationship with satisfaction and destination loyalty (Coban, 2012), residents’ perceptions of tourism impacts (Tosun, 2002), tourism development (Tosun, 2006), tourist shopping experiences and satisfaction (Tosun, Temizkan, Timothy & Fyall, 2007), and sustainable cultural tourism (Tucker & Emge, 2010). However, no previous research has looked at the motivations of foreign tourists and its relationship with tourist satisfaction and destination loyalty. This study aims to investigate the relationship between travel motivation (grouped under ‘novelty and learning’, ‘socialization’, ‘escape and relaxation’, and ‘self-development’) and the satisfaction and destination loyalty of tourists visiting the Cappadocia region. Additionally, the information sources that tourists used before visiting the region were also examined.
Literature Review
Travel Motivation, Satisfaction and Destination LoyaltyIn the current literature, the concept of motivation is said to be based on consumer
behaviours (Fullerton, 2013). It is also considered to be an indicator of tourists’ decisions during their visits. Moreover, expectations are formed and affected by motivations (Rita, Brochado & Dimova, 2019). Travel motivations that have been studied within the context of tourism (Cohen, Prayag, & Moital, 2014) are mostly associated with tourist preferences when travelling to a destination (Rita et al., 2019). Therefore, it can be concluded that knowing tourists’ motivations is advantageous for destination managers in terms of providing more appropriate tourist products and services (Zoltan & Masiero, 2012).
Research shows that tourists with different cultural and ethnic roots have different motivations (Prayag & Ryan, 2011) and thus, each person may have different motivations – such as to learn, socialize, relax, be entertained and so on (Brandano, Osti & Pulina, 2019). Tourist motivation is a crucial factor in understanding the decision-making behaviour of tourists (Sastre & Phakdee-Auksorn, 2017). The push and pull theory of motivation is the most widely cited mechanism to explain what motivates tourists

JOURNAL of TOURISMOLOGY
38
(Crompton, 1979; Zhang & Peng, 2014, Sastre et al., 2017). Moreover, push and pull motivations are related to tourist satisfaction and loyalty (Yoon & Uysal, 2005).
Both satisfaction and destination loyalty have been examined by various authors (e.g. Yoon & Uysal, 2005; Prayag & Ryan, 2012; Alrawadieh, Prayag, Alrawadieh & Alsalameen, 2019). Tourists satisfied with their visit are likely to revisit the destination and recommend it to others (Patwardhan, Ribeiro, Payini, Woosnam, Mallya & Gopalakrishnan, 2019; Alrawadieh et al., 2019). Satisfaction is considered one of the main indicators of loyalty, as satisfied people tend to revisit or repurchase (Brandano et al., 2019). On the other hand, a tourist’s motivation may affect their satisfaction (Alrawadieh et al., 2019). Additionally, loyalty is crucial in the successful marketing of tourist destinations, because loyal tourists may revisit the destination or recommend it to other travellers (Yoon & Uysal, 2005). Therefore, the concepts of motivation, satisfaction and loyalty are closely related to each other (Wen & Huang, 2019).
Since these concepts are closely interrelated, and given that no study of the Cappadocia region has examined the relationship between them, this study addresses the following research questions:
(1) What are the travel motivations of tourists visiting Cappadocia?
(2) How do the motivations of tourists visiting Cappadocia influence their satisfaction and destination loyalty?
Methodology After conducting a literature review, a questionnaire was developed to investigate the
relationship between tourists’ motivation to travel, their satisfaction, and their destination loyalty. Additionally, the information sources that tourists utilized before visiting the region were examined. The questionnaire consisted of four sections: (i) a profile of the tourists (gender, age, educational status, visit number, and nationality), (ii) information sources they used before travelling, (iii) travel motivations, and (iv) satisfaction and destination loyalty. The question relating to information sources is adapted from Björk & Kauppinen-Räisänen (2016), and identifies 18 different kinds of information sources. Finally, the question (iv) pertaining to satisfaction (two items) and destination loyalty (two items) is adapted from Valle, Siva, Mendes & Guerreiro (2006).
The items were measured using a 7-point Likert scale, ranging from 1 (strongly disagree) to 7 (strongly agree). A pilot test was conducted first with 70 tourists. After checking the questionnaire to ensure the comprehensibility of the questions, tourists in famous touristic places in Cappadocia (e.g. Avanos town, Ürgüp town, Göreme town, Uçhisar town, Göreme Open Air Museum, Uçhisar Castle) were given the questionnaire during several weekends in May and June 2019. When the number

Seyitoglu / Cappadocia: The Effects of Tourist Motivation on Satisfaction and Destination Loyalty
39
of foreign visitors arriving in the previous year is considered, these months can be accepted as the high season, because in 2008, (The recent official data specific to the Cappadocia region could not be found) almost 260 thousand foreign tourists visited the region in May and June. This number corresponds to 22.6 percent of all foreign tourists visiting in the year 2008 (Türkiye Cumhuriyeti Çevre ve Şehircilik Bakanlığı, 2019). Moreover, the questionnaire was conducted face to face and voluntarily, and international tourists over the age of 18 were the target population for this study. In total, 392 tourists filled in the questionnaire, but only 363 of them were not missing any information and were used for the data analysis.
For the data analysis, the SPSS program was used. First, the demographic profile of the participants and the information sources tourists utilized before travelling were identified through frequency analyses. Factor analysis was used to determine their motivations for travel. Finally, regression analysis was used to find the relationship between the travel motivations, satisfaction, and destination loyalty of tourists.
Reliability AnalysisThis study used 363 questionnaires that were completed by tourists visiting the
Cappadocia region. A scale was generated for each topic, and Cronbach’s alpha values were calculated to determine the scales’ reliability. The alpha value for each topic (travel motivation = 0.966, satisfaction = 0.723, and destination loyalty = 0.865) used in this study was over 70%, which means that every topic used in the analysis was found to be effective.
Findings
Profile of Participants As reported in Table 1, almost an equal number of male and female tourists
participated in the present study (48.2% and 51.8%, respectively). More than half of the tourists (56.7%) were 32 years old or younger. It is clear from the findings that most participants were well educated. Since Cappadocia is considered a significant destination for cultural tourism, it is not a surprise to have educated people as visitors. Moreover, the data analysis shows that most of the participants were first-time visitors (66.1%). Finally, we considered tourists’ nationalities; the greatest number of respondents (47 tourists, 12.9%) came from China, followed by England (34 people, 9.4%), the USA (20 people, 5.6%), Spain (19 people, 5.2%), Belgium (17 people, 4.7%), and Germany (15 people, 4.1%). People from the 50 countries classed under “Other” represented the largest group of participants, with 143 (39.4%) respondents. This means that the participants of this study have a multinational structure.

JOURNAL of TOURISMOLOGY
40
Table 1Profile of Participants
Frequency Percent
GenderFemale 188 51.8Male 175 48.2
Age
18-22 51 15.023-27 79 23.228-32 63 18.533-37 35 10.338-42 42 12.2
43 and above 71 20.8
Educational Status
High/Vocational School or Below 15 4.4College 77 22.6
University/undergraduate 20 5.9Master’s degree or above/postgraduate 195 57.2
Visit NumberFirst-time visitors 240 66.1
Repeat visitors 123 33.9
Nationality of Visitors
China 47 12.9England 34 9.4
USA 20 5.6Spain 19 5.2
Belgium 17 4.7Germany 15 4.1
Italy 14 3.8Thailand 13 3.5France 11 3Canada 10 2.8Ireland 10 2.8Russia 10 2.8
Others (50 countries) 143 39.4Total 363 100.0
Information Sources Tourists Utilized Before Travelling to CappadociaTourists visiting Cappadocia used various kinds of information sources including
websites, blogs (e.g., Trip Advisor), travel guidebooks, the internet, family references, tourism brochures, and so on (see Table 2). Our findings suggest that tourists prioritized internet-based sources as one of the most popular sources of information. Therefore, electronic word-of-mouth (e-WOM) is key in terms of the selection of a destination (Jalilvand, Samiei, Dini & Manzari, 2012). Tourists who participated in this study also read travel guidebooks, tourism brochures and newspapers to help them make decisions before travelling. Since the participants of this study were found to be well-educated, it is not surprising that they mostly used internet-based information sources and published documents.

Seyitoglu / Cappadocia: The Effects of Tourist Motivation on Satisfaction and Destination Loyalty
41
Table 2Information Sources Tourists Utilized Before Travelling to CappadociaWebsite, blogs (e.g., Trip Advisor) 299Travel guidebooks 249Internet 236Family 184Tourism brochures 145Public tourist information 108Newspaper 104Websites of destinations 104Travel agency 94Website, company blogs 83TV programme 64TV news 49Travel fairs 48Radio 42Ministry of Foreign Affairs 41TV commercial 28Websites of tour operators 24Embassy 19Note: Each participant may choose more than one information source
Dimensions of the Travel Motivation ScaleExploratory factor analysis was utilized to determine the structure of travel
motivations (Table 3). Initially, a KMO (Kaiser–Meyer–Olkin) analysis was conducted to determine whether the sample number was sufficient; the ratio value was 0.928, which is sufficient (Sipahi, Yurtkoru, & Çinko, 2010). The relationship between the variables was demonstrated using Bartlett’s Test of Sphericity (p = 0.000), and varimax rotation and principal component analysis were used to conduct factor analysis. The eleven questions in the travel motivation section were grouped into four factors, which accounted for 89.977 % of total variance and with eigenvalues greater than one. Cronbach’s alpha values, calculated for the internal consistencies of the four factors, ranged from 0.896 to 0.948; these values confirm the reliability of the scale (Hair, Anderson, Tatham, & Black, 1998). The four factors used here were ‘novelty and learning’, ‘socialization’, ‘escape and relaxation’, and ‘self-development’ (Table 3).
Means of the Dimensions of Travel Motivation of Tourists The mean values of the dimensions of travel motivations of foreign tourists not
quite different (Table 3). However, the dimension of ‘novelty and learning’ came top with a mean value of 4.96. ‘Escape and relaxation’ had the second largest mean value, at 4.88, followed by ‘self-development’ (4.73) and ‘socialization’ (4.36). We see that foreign tourists visiting Cappadocia are mostly motivated by ‘novelty and learning’ and ‘escape and relaxation’. Thus, when tourists’ expectations in these

JOURNAL of TOURISMOLOGY
42
areas are met, tourists are more likely to feel satisfied and this may increase their loyalty intention (Rita et al., 2019).
Table 3Dimensions of Travel Motivation Scale
Dimensions Factorloading Mean Variance
explainedCronbach
AlphaFactor 1: Novelty and learning 4.96 73.192 .948…to learn more about nature and other cultures ,959…to see a new place ,889…to experience new and different things ,837…to develop my knowledge of this place ,746Factor 2: Socialization 4.36 8.026 .896…to meet people with similar interests ,968…to build friendship with others ,801Factor 3: Escape and relaxation 4.88 4.802 .944…to relax mentally ,977…to get refreshed ,962…to get away from the routine of everyday life ,815Factor 4: Self-development 4.73 3.956 .929…to think about who you are ,742…to learn more about yourself ,673Total explained variance (%) 89.977KMO: .928Bartlett sphericity test: 4554.387 p=.000
Impact of Travel Motivation on Satisfaction and Destination Loyalty Problem: To what degree do the motivations of tourists predict their satisfaction
and destination loyalty?
Two different multiple regression analyses calculated the predictive power of tourists’ motivation, for travel and the predictor variables’ effects in the context of satisfaction and destination loyalty; the results of both regression analyses are shown in Table 4.
The first model revealed a significant relationship between satisfaction and three of the four travel motivation factors considered here. These three factors explain approximately 41.7% of the total variance in the dependent variable, namely the satisfaction of tourists who visited Cappadocia. The ‘novelty and learning’ factor had the highest standardized regression coefficient (β = 0.351), followed by ‘escape and relaxation’ (β = 0.292) and ‘socialization’ (β = 0.147). These results demonstrate that ‘novelty and learning’ was the variable most likely to predict the satisfaction of tourists, while ‘escape and relaxation’ came second and ‘socialization’ third. Since there is a positive linear relation between these variables, it can be said that they each increase tourists’ satisfaction. However, the results show that ‘self-development’ does not have a significant relationship with tourist satisfaction.

Seyitoglu / Cappadocia: The Effects of Tourist Motivation on Satisfaction and Destination Loyalty
43
Table 4The Impacts of Travel Motivation on Satisfaction and Destination Loyalty
B Std. Error β t PModel 1Constant 1.754 .204 8.586 .000Socialization .131 .054 .147 2.412 .016**Self-development -.079 .067 -.090 -1.187 .236Novelty and learning .322 .075 .351 4.314 .000*Escape and relaxation .258 .067 .292 3.852 .000*F= 65.666, R² =.417; *p<.01 ** p<0,05/Dependent Variable: SatisfactionModel 2Constant 4.145 .205 20.265 .000Socialization .053 .054 .069 .968 .334Self-development -.073 .067 -.096 -1.089 .277Novelty and learning .223 .075 .284 2.982 .003*Escape and relaxation .165 .067 .218 2.460 .014**F= 23.317, R² =.198; *p<.01 ** p<0,05/Dependent Variable: Destination loyalty
The second model examined whether there is a significant relationship between travel motivation and destination loyalty. We find that there is a significant relationship between two travel motivation factors (‘novelty and learning’, and ‘escape and relaxation’) and destination loyalty. These two predictor variables explain approximately 19.8% of the total variance in the dependent variable, which here is the destination loyalty of tourists who visited the Cappadocia region. As before, the ‘novelty and learning’ factor had the largest standardized regression coefficient (β = 0.284), followed by ‘escape and relaxation’ (β = 0.218). These results demonstrate that ‘novelty and learning’ was the variable most likely to predict the destination loyalty of tourists. Since there is a positive linear relation between the variables, it can be said that ‘novelty and learning’ and ‘escape and relaxation’ are both related to tourists’ destination loyalty. However, we find that ‘socialization’ and ‘self-development’ do not have a significant relationship with destination loyalty.
Conclusion and DiscussionThe main aim of the present study was to test the impact that tourists’ travel
motivations (novelty and learning, socialization, escape and relaxation and self-development) have on their satisfaction and destination loyalty. Additionally, the information sources that tourists utilized before visiting the region were also examined. Results show that most foreign visitors to Cappadocia are well educated and come from many different countries. This may be due to the region’s reputation as a significant cultural tourism destination (Coban & Yildiz, 2019). This may be of use to destination managers and tourism businesses in the region, as knowing the foreign tourist profile may help them to develop appropriate tourism products and strategies.
We find that tourists visiting Cappadocia utilized various information sources including websites, blogs (e.g., Trip Advisor), the internet, travel guidebooks,
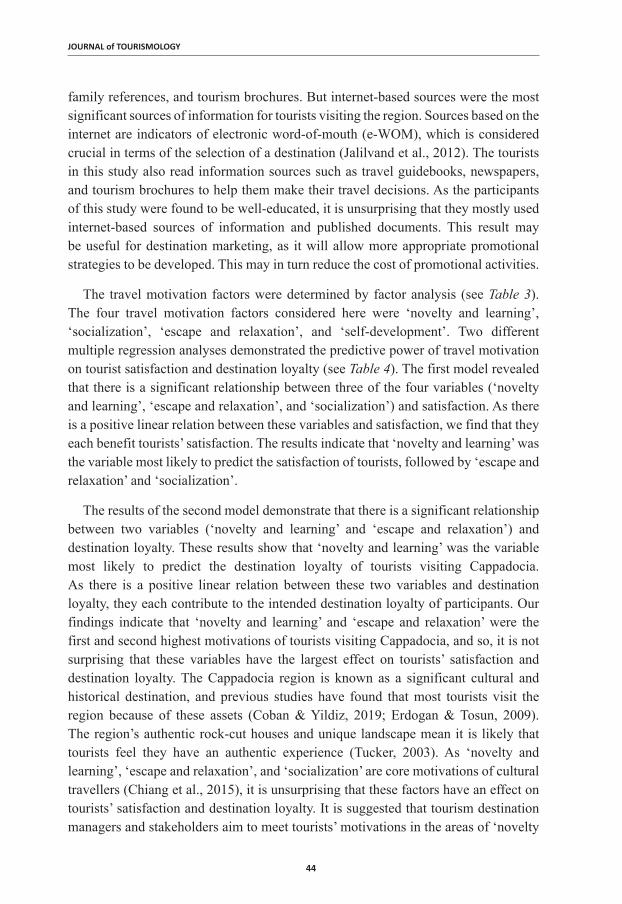
JOURNAL of TOURISMOLOGY
44
family references, and tourism brochures. But internet-based sources were the most significant sources of information for tourists visiting the region. Sources based on the internet are indicators of electronic word-of-mouth (e-WOM), which is considered crucial in terms of the selection of a destination (Jalilvand et al., 2012). The tourists in this study also read information sources such as travel guidebooks, newspapers, and tourism brochures to help them make their travel decisions. As the participants of this study were found to be well-educated, it is unsurprising that they mostly used internet-based sources of information and published documents. This result may be useful for destination marketing, as it will allow more appropriate promotional strategies to be developed. This may in turn reduce the cost of promotional activities.
The travel motivation factors were determined by factor analysis (see Table 3). The four travel motivation factors considered here were ‘novelty and learning’, ‘socialization’, ‘escape and relaxation’, and ‘self-development’. Two different multiple regression analyses demonstrated the predictive power of travel motivation on tourist satisfaction and destination loyalty (see Table 4). The first model revealed that there is a significant relationship between three of the four variables (‘novelty and learning’, ‘escape and relaxation’, and ‘socialization’) and satisfaction. As there is a positive linear relation between these variables and satisfaction, we find that they each benefit tourists’ satisfaction. The results indicate that ‘novelty and learning’ was the variable most likely to predict the satisfaction of tourists, followed by ‘escape and relaxation’ and ‘socialization’.
The results of the second model demonstrate that there is a significant relationship between two variables (‘novelty and learning’ and ‘escape and relaxation’) and destination loyalty. These results show that ‘novelty and learning’ was the variable most likely to predict the destination loyalty of tourists visiting Cappadocia. As there is a positive linear relation between these two variables and destination loyalty, they each contribute to the intended destination loyalty of participants. Our findings indicate that ‘novelty and learning’ and ‘escape and relaxation’ were the first and second highest motivations of tourists visiting Cappadocia, and so, it is not surprising that these variables have the largest effect on tourists’ satisfaction and destination loyalty. The Cappadocia region is known as a significant cultural and historical destination, and previous studies have found that most tourists visit the region because of these assets (Coban & Yildiz, 2019; Erdogan & Tosun, 2009). The region’s authentic rock-cut houses and unique landscape mean it is likely that tourists feel they have an authentic experience (Tucker, 2003). As ‘novelty and learning’, ‘escape and relaxation’, and ‘socialization’ are core motivations of cultural travellers (Chiang et al., 2015), it is unsurprising that these factors have an effect on tourists’ satisfaction and destination loyalty. It is suggested that tourism destination managers and stakeholders aim to meet tourists’ motivations in the areas of ‘novelty

Seyitoglu / Cappadocia: The Effects of Tourist Motivation on Satisfaction and Destination Loyalty
45
and learning’, ‘escape and relaxation’, and ‘socialization’. This may improve the satisfaction and destination loyalty of tourists visiting the Cappadocia region, and may be relevant for other destinations which similarly attract cultural tourists.
Prior work has shown that the ‘novelty and learning’ and ‘escape and relaxation’ motivation factors are linked to the attitudes of tourists towards a destination (Huang & Hsu, 2009; Prayag; Hsu et al., 2010; Chen & Del Chiappa, 2018). Indeed, escape from routine may be one of the main reasons that people decide to travel (Prayag et al., 2018). Li & Cai (2012) examined the relationship between travel motivation factors (‘novelty and learning’, ‘self-development’, ‘escape’, and ‘exciting experience’) and tourist behaviour, and found that only ‘novelty and learning’ had an effect on the behavioural intention of tourists. However, Prayag (2012) indicated that ‘escape and relaxation’ affected the behavioural intention of tourists.
Originality of the Study, Limitations and Suggestions for Future StudiesNo study had been performed in the Cappadocia region that looks at the motivations
of foreign tourists and their impacts on tourist satisfaction and destination loyalty, and so the findings of this study are original. This study may guide further research for other similar cultural destinations and their managers.
Although this study provides valuable findings for managers and tourism businesses in Cappadocia and similar destinations, it does have limitations. The sample of this study consisted of 363 foreign tourists visiting Cappadocia between May and June 2019. The region receives both local and foreign tourists throughout the year, and so, this sample cannot represent the entirety of tourists visiting at other times of year.
Further studies which make comparisons between Cappadocia and similar cultural destinations are needed. A possible line of enquiry for future studies could be a comparison between local and foreign tourists. Additionally, further research may be conducted to examine both the motivations and the experiences of tourists visiting the region. Moreover, since e-WOM was found to be the preferred information source in this study, future work may wish to consider the relationship between e-WOM and other variables such as travel motivation, experience, satisfaction, and destination loyalty.
Peer-review: Externally peer-reviewed. Conflict of Interest: The author has no conflict of interest to declare.Grant Support: The author declared that this study has received no financial support.

JOURNAL of TOURISMOLOGY
46
ReferencesAlrawadieh, Z., Prayag, G., Alrawadieh, Z., & Alsalameen, M. (2019). Self-identification with
a heritage tourism site, visitors’ engagement and destination loyalty: the mediating effects of overall satisfaction. The Service Industries Journal, 39(7-8), 541–558.
Andreu, L., Kozak, M., Avci, N., & Cifter, N. (2006). Market segmentation by motivations to travel: British tourists visiting Turkey. Journal of Travel & Tourism Marketing, 19(1), 1–14.
Beerli, A., & Martin, J. D. (2004). Factors influencing destination image. Annals of tourism research, 31(3), 657–681.
Björk, P., & Kauppinen-Räisänen, H. (2016). Local food: a source for destination attraction. International Journal of Contemporary Hospitality Management, 28(1), 177–194.
Brandano, M. G., Osti, L., & Pulina, M. (2019). How motivations and satisfaction influence wine tourists’ loyalty? An analysis of the Italian case. International Journal of Culture, Tourism and Hospitality Research, 13(1), 55–69.
Chiang, C. C., Wang, M. Y., Lee, C. F., & Chen, Y. C. (2015). Assessing travel motivations of cultural tourists: A factor-cluster segmentation analysis. Journal of Information and Optimization Sciences, 36(3), 269–282.
Chon, K. S. (1989). Understanding recreational traveler’s motivation, attitude and satisfaction. The tourist review, 44(1), 3–7.
Coban, G., & Yildiz, O. S. (2019). Developing a destination management model: Case of Cappadocia. Tourism Management Perspectives, 30, 117–128.
Coban, S. (2012). The effects of the image of destination on tourist satisfaction and loyalty: The case of Cappadocia. European Journal of Social Sciences, 29(2), 222–232.
Cohen, S. A., Prayag, G., & Moital, M. (2014). Consumer behaviour in tourism: Concepts, influences and opportunities. Current issues in Tourism, 17(10), 872–909.
Crompton, J. L. (1979). Motivations for pleasure vacation. Annals of tourism research, 6(4), 408-424.
Do Valle, P. O., Silva, J. A., Mendes, J., & Guerreiro, M. (2006). Tourist satisfaction and destination loyalty intention: a structural and categorical analysis. International Journal of Business Science & Applied Management (IJBSAM), 1(1), 25–44.
Erdogan, N., & Tosun, C. (2009). Environmental performance of tourism accommodations in the protected areas: Case of Goreme Historical National Park. International Journal of Hospitality Management, 28(3), 406–414.
Farmaki, A., Khalilzadeh, J., & Altinay, L. (2019). Travel motivation and demotivation within politically unstable nations. Tourism Management Perspectives, 29, 118–130.
Fullerton, R. A. (2013). The birth of consumer behavior: Motivation research in the 1940s and 1950s. Journal of Historical Research in Marketing, 5(2), 212–222.
Hair, J. F., Anderson, R. E., Tatham, R. L., & Black, W. C. (1998). Multivariate data analysis. Upper Saddle River, NJ: Prentice Hall.
Hallowell, R. (1996). The relationships of customer satisfaction, customer loyalty, and profitability: an empirical study. International journal of service industry management, 7(4), 27–42.
Hsu, C. H., Cai, L. A., & Li, M. (2010). Expectation, motivation, and attitude: A tourist behavioral model. Journal of travel research, 49(3), 282–-296.
Seyitoglu / Cappadocia: The Effects of Tourist Motivation on Satisfaction and Destination Loyalty
47
Huang, S., & Hsu, C. H. (2009). Effects of travel motivation, past experience, perceived constraint, and attitude on revisit intention. Journal of Travel Research, 48(1), 29–44.
Huang, S., & Hsu, C. H. (2009). Effects of travel motivation, past experience, perceived constraint, and attitude on revisit intention. Journal of travel research, 48(1), 29–44.
Jalilvand, M. R., Samiei, N., Dini, B., & Manzari, P. Y. (2012). Examining the structural relationships of electronic word of mouth, destination image, tourist attitude toward destination and travel intention: An integrated approach. Journal of Destination Marketing & Management, 1(1-2), 134–143.
Jang, S., Bai, B., Hu, C., & Wu, C. M. E. (2009). Affect, travel motivation, and travel intention: A senior market. Journal of Hospitality & Tourism Research, 33(1), 51–73.
Li, M., & Cai, L. A. (2012). The effects of personal values on travel motivation and behavioral intention. Journal of Travel Research, 51(4), 473–487.
Mathwick, C., Malhotra, N. K., & Rigdon, E. (2002). The effect of dynamic retail experiences on experiential perceptions of value: an Internet and catalog comparison. Journal of retailing, 78(1), 51–60.
Mill, R. C., & Morrison, A. M. (2002). The tourism system: An introductory text (4th ed.). Dubuque, IA: Kendall/Hunt.
Özel, Ç. H., & Kozak, N. (2017). An exploratory study of resident perceptions toward the tourism industry in Cappadocia: A Social Exchange Theory approach. Asia Pacific Journal of Tourism Research, 22(3), 284–300.
Patwardhan, V., Ribeiro, M. A., Payini, V., Woosnam, K. M., Mallya, J., & Gopalakrishnan, P. (2019). Visitors’ Place Attachment and Destination Loyalty: Examining the Roles of Emotional Solidarity and Perceived Safety. Journal of Travel Research, 0047287518824157.
Pearce, P. L., & Caltabiano, M. (1983). Inferring travel motivation from travelers’ experience. Journal of Travel Research, 12, 16–20.
Pearce, P. L., & Lee, U. I. (2005). Developing the travel career approach to tourist motivation. Journal of travel research, 43(3), 226–237.
Prayag, G. (2012). Senior travelers’ motivations and future behavioral intentions: The case of nice. Journal of Travel & Tourism Marketing, 29(7), 665–681.
Prayag, G., & Ryan, C. (2011). The relationship between the ‘push’and ‘pull’factors of a tourist destination: The role of nationality–an analytical qualitative research approach. Current Issues in Tourism, 14(2), 121–143.
Prayag, G., & Ryan, C. (2012). Antecedents of tourists’ loyalty to Mauritius: The role and influence of destination image, place attachment, personal involvement, and satisfaction. Journal of travel research, 51(3), 342–356.
Prayag, G., Chen, N., & Del Chiappa, G. (2018). Domestic tourists to Sardinia: motivation, overall attitude, attachment, and behavioural intentions. Anatolia, 29(1), 84–97.
Rita, P., Brochado, A., & Dimova, L. (2019). Millennials’ travel motivations and desired activities within destinations: A comparative study of the US and the UK. Current Issues in Tourism, 22(16), 2034–2050.
Sastre, R. P., & Phakdee-Auksorn, P. (2017). Examining Tourists’ Push and Pull Travel Motivations and Behavioral Intentions: The Case of British Outbound Tourists to Phuket, Thailand. Journal of Quality Assurance in Hospitality & Tourism, 18(4), 437–464.

JOURNAL of TOURISMOLOGY
48
Sipahi, B., Yurtkoru, S.E., & Çinko, M. (2010). Sosyal Bilimlerde SPSS’le Veri Analizi. İstanbul: Beta Publishing.
Tosun, C. (2002). Host perceptions of impacts: A comparative tourism study. Annals of tourism research, 29(1), 231–253.
Tosun, C. (2006). Expected nature of community participation in tourism development. Tourism management, 27(3), 493–504.
Tosun, C., Temizkan, S. P., Timothy, D. J., & Fyall, A. (2007). Tourist shopping experiences and satisfaction. International Journal of Tourism Research, 9(2), 87–102.
Tucker, H. (2002). Welcome to Flintstones-land: contesting place and identity in Goreme, Central Turkey. In S. Coleman & M. Crang (eds.). Tourism: Between place and performance, (pp. 143-159). Berghahn: USA.
Tucker, H. (2003). Living with Tourism: Negotiating Identities in a Turkish Village. Routledge: London.
Tucker, H., & Emge, A. (2010). Managing a world heritage site: The case of Cappadocia. Anatolia, 21(1), 41–54.
Türkiye Cumhuriyeti Çevre ve Şehircilik Bakanlığı, https://nevsehir.csb.gov.tr/nev-sharp351-ehir---turizm-sharp304-statistikleri-i-1912 (accessed date: 15/11/2019).
Uysal, M., & Hagan, L. A. R. (1993). Motivation of pleasure travel and tourism. Encyclopedia of hospitality and tourism, 21, 798–810.
Wen, J., & Huang, S. (2019). The effects of push and pull travel motivations, personal values, and destination familiarity on tourist loyalty: a study of Chinese cigar tourists to Cuba. Asia Pacific Journal of Tourism Research, 24(8), 805–821.
Yoon, Y., & Uysal, M. (2005). An examination of the effects of motivation and satisfaction on destination loyalty: a structural model. Tourism management, 26(1), 45–56.
Zhang, Y., & Peng, Y. (2014). Understanding travel motivations of Chinese tourists visiting Cairns, Australia. Journal of Hospitality and Tourism management, 21, 44–53.
Zoltan, J., & Masiero, L. (2012). The relation between push motivation and activity consumption at the destination within the framework of a destination card. Journal of Destination Marketing & Management, 1(1-2), 84–93.

Journal of Tourismology, 6(1), 49-62
DOI: 10.26650/jot.2020.6.1.0036http://jt.istanbul.edu.en/
Submitted: 31.10.2019Accepted: 24.11.2019
Published Online: 10.04.2020
R ES EA RC H A RT I C L E
Journal of Tourismology
1 Correspondence to: Zehra Dilistan Shipman (Asst. Prof. Dr.), İstanbul Bilgi University, School of Tourism and Hospitality, Department of Gastronomy and Culinary Arts, Istanbul, Turkey. E-mail: [email protected] ORCID: 0000-0001-9829-960X
To cite this article: Dilistan-Shipman, Z. (2020). Factors affecting food choices of Millennials: How they decide what to eat? Journal of Tourismology, 6(1), 49-62. https://doi.org/10.26650/jot.2020.6.1.0036
Zehra Dilistan Shipman1
Factors Affecting Food Choices of Millennials: How they Decide What to Eat?
AbstractMillennials, who are also known as generation Y, constitute an important group of consumers for the tourism and hospitality industry. Hence, the purpose of this study is to understand which factors affect their food choices and whether these factors show any difference for demographic variables. A quantitative research design using exploratory factor analysis is employed to understand the different dimensions of food choice behavior of millennials. The findings of the study have explored six factors that guide the food purchase of generation Y. In addition, the relative importance of each factor has provided a better understanding of the role of each dimension. Therefore, this study provides implications about how to address the demands of a generation, which could be considered a unique target market for the hospitality industry.
KeywordsMillennials, Food purchase, Restaurant industry
This work is licensed under Creative Commons Attribution-NonCommercial 4.0 International License

JOURNAL of TOURISMOLOGY
50
IntroductionFood selection is a complex behavior and affected by many interrelated factors,
which can be classified in two ways:
1. Food selection depends on personal choice, economic factors, and influence of social environment.
2. Food selection is also affected by what is available (food area), what is accepted (environmental area), and what is preferred (individual factors). At the individual level, taste, monetary constraints, and health concerns shape the food selection behavior.
Since there is increasing research regarding “Millennials” (Generation Y), who have been born between the years of 1980 and 2000, both academicians and professionals have started to focus on the behaviors of this generation (Lancaster & Stillman, 2003). In considering the studies of generations, research shows evidence that different generations have dissimilar values, beliefs, and attitudes that result in different behaviors (Inglehart & Carballo, 1997). That is, it is especially important to understand the behaviors of Millennials because they represent the potential consumers of the future.
Millennials, who are also named as generation Y, are composed of people between the ages of 19 and 37. Therefore, this generation is the second youngest consumer group at this different stage of their lives. While some of them are still studying at university and living with their families, others are either living alone or are married. Hence, being at different life stages influences the values, life styles, needs, and wants of millennials. This also affects their entertainment activities, how they perceive politics and current events, their attitude toward cooking, what they eat as well as how they shop grocery items. Moreover, their cultural diversity also influences the interest for different types of food and demand for different ethnic cuisines. It can then be concluded that millennials represent a generation, who has special demands for food and beverage as well as who search to meet these demands. In conclusion, the purpose of this research is to understand which factors affect the food choices of Millennials, their relative importance, and how they differ based on different demographic factors.
Technology and MillennialsMillennials, who are also known as generation Y, have been integrated with
technology at every stage of their lives. Mainly, they search on Google, Facebook, Pinterest, and YouTube for recipes and food items. They also use social media to share their views and experiences with friends, family, and other people to discuss their opinions. Through sharing these views or following others, Millennials both develop

Dilistan Shipman / Factors Affecting Food Choices of Millennials: How they Decide What to Eat?
51
and shape their opinions and beliefs. Generation Y usually follow the ones who share their opinions or the ones who are part of the groups that they want to become a member of. As a result, these activities not only shape their values and beliefs but also affect their food choices and purchase decisions (Wohl, 2016). The reason why Millennials, Generation Y, like to share all kinds of food experiences on social media is because they are accustomed to declaring their individuality even if social networks consist of collective opinions (Leslie, 2016). Further, they also order different kinds of food from the same restaurant in order to personalize and individualize their social media experiences. Additionally, they sometimes change their food plate choices by using a cup instead of a plate or vice versa (Watson, 2016). This generation is always looking for new things and they also want to personalize the food with different presentations.
Previous research has indicated that eating does not mean just getting full, but it is a way of expressing yourself as well as an opportunity to acquire new experiences. Moreover, for generation Y, food is a reason for socializing and bringing people together in a highly digitalized era. This generation is usually online to check their accounts and the people they are following. In this way, they can share images or use similar images that they see on the accounts of people they are following. While this generation is successful at using social media, they also share videos and every moment they live with their followers. They use social media for marketing purposesby generating the sales and marketing of meals that they cook via Instagram. Those meals usually represent trendy foods and some millennials take it a step further by creating their own trends in videos on YouTube channels. This generation also helps define the purchasing behaviors and food choices for the future. In this context, generation Y could be considered the determinant of new trends. Additionally, They are different from other generations in thatthey like to discover new dishes and tastes and are more adventurous.
In addition to all these discussions, research also mentions that Millennials pay attention to ethical issues in their food choices. That is, they are more likely to purchase food items whose packages are environmental friendly (Capon, 2012). Therefore, the packaging of a product is also a parameter for their purchasing decision. Since the package is the first touch point with an item, good packaging is a way to attract customers (Gillian & Wilson, 2012). In line with this finding, the respect of Y generation for the environment also results in their concern for the packaging. That is why companies need to use environmental friendly packaging materials and pay attention to recycling of these materials.
Health PerceptionAs discussed before, the food choices of people are formed and shaped due to
various factors. Even it was first developed by family and cultural factors, these

JOURNAL of TOURISMOLOGY
52
choice preferences may vary in time as a result of external factors. Since generation Y is an effective user of social media, they not only set new trends, but they also follow the opinions of other social media users. One of the effects of this influence is the concern for health in recent years. Even though they pay attention to health issues, it has been found that they are not ready to practice a healthy diet. Hence, it is important to analyze the decision process about health food and to understand the factors affecting this process (Corvi & Bigi, 2007; Schewe & Meredith, 2004).
Millennials develop values regarding certain foods and their components because of their tendency to search and engage in social media communications (Leslie, 2016), this generation could institute a motivation for healthy eating (Peskett, 2006). For instance, since sugar has been promoted as unhealthy on social media, there is an increasing interest for Kombucha, vinegar, and traditional tonics that are alternatives for sweet drinks including sugar (Leslie, 2016).
Additionally, it has been found that generation Y spends more money for food items that are considered to be beneficial (Peskett, 2006). They also participate in seminars, workshops, events, tastings, and food festivals related to food consumption.
On the other hand, when we consider the Millennials living separate from their families, they act like generation Z, who focus on tolerance and convenience rather than their diets and health. Some Millennials living by themselves act like the generation X/Baby Boomers in that they care about their health and purchase food that is organic, natural, labeled as clean, and that includes simple ingredients. The food labels that include health and nutritional information constitute a stronger motivation for generation Y, who are more knowledgeable about this. In addition, it has been stated that 60% of Millennials prefer to use fresh ingredients when they cook at home (Suter & Burton, 1996). In this way, they reflect the characteristics of both generation Z and X.
Therefore, it is not reasonable to assume that the purchasing behaviors of Millenials would be totally different from that of other generations. Another difference from other generations is that generation Y gives greater importance to convenience and experience when they are shopping. For example, they prefer to shop in small stores, where there is a higher possibility to find organic foods (Tuttle, 2015). Market analysis proves that this generation looks for healthier and fresher food as well as spending less for eating at home.
The MoodThe mood of generation Y is another important factor affecting the attitude of this
generation toward food items. This finding is similar with the results of previous

Dilistan Shipman / Factors Affecting Food Choices of Millennials: How they Decide What to Eat?
53
research indicating that the mood influences the intention for purchasing traditional as well as European food in China (Wang, De Steur, Gellynck, & Verbek, 2015). The importance of food for influencing food behavior of the Y generation could be explained by their emotional states with high levels of stress, depression, and despair resulting from convenience foods prepared by working mothers (Taub & Robertson, 2013). They feel happier when they have convenient and easy food that they used to have during their childhood to feed their body and spirit (James, 2004). Therefore, food items that are prepared and found easily are highly preferred by generation Y resulting in their having snacks. That is why fresh fruit and vegetables presented in small portions have become popular and have been consumed more often by Generation Y, who care about health issues.
ConvenienceTime constraints or the perception of time constraints have resulted in less cooking
at home, an increase in fast food consumption, a decrease in family meals as well as an increase in easy and ready-to-eat foods. However, these food choices are usually less healthy and they lead to chronic sicknesses like obesity, cardiovascular illnesses, diabetes, and cancer.
Since millennials give importance to convenience, they are more likely to eat at restaurants than other generations. Therefore, grocery stores have started to offer ready-to-eat food items as well as increase other available options. Also, more and more restaurants have started to make deliveries to homes and have made their home delivery menus more accessible. Hence, these kinds of online ordering and delivery applications have a crucial role in making eating more convenient for generation Y. At every income level, this generation prefers foods that are the least processed and allocate a large portion of their budget to ready-to-eat foods, sugar and sweets as well as pasta and low grain foods. The reason for choosing ready-to-eat food is that it is easily prepared and there are usually no dishes to wash (Taylor, 2016). For instance, millennials usually prefer corn flakes or fruit yogurt, which enables them to throw their cups away after eating. Thus, the tendency to have ready-to-eat food could be explained by many factors such as increased number of working women, international students, people living alone, and students with fast living life styles. As a result, restaurants like McDonalds have started to offer standard menus, service, familiar and consistent flavor to provide tourists a food environment that is similar to the food in their home country (Bengtsson, Bardhi, & Venkatraman, 2010). Further, tourists experiencing new tastes are also looking for food items that offer convenience and comfort. However, besides convenience, the availability of food, and health concerns, and some economic factors are also affecting people’s food choices (Logue & King, 1991).

JOURNAL of TOURISMOLOGY
54
Price FactorPrice is an important consideration when choosing among different food
alternatives especially for low income level consumers. It has been found that low income level consumers have higher price value awareness compared to high income level consumers (Steenhuis, Waterlander, & De Mul, 2011). In other words, the cost of food is much more a concern for low income levels in their food purchasing decisions. Another interesting result is that women who have diet restrictions are less affected by price compared to the ones who do not have any restrictions. That is, cost is not as important as the desire to eat low calorie foods or for the ones who eat in limited amounts (Steptoe, Pollard, & Wardle, 1995). Therefore, price decreases could be a more effective tool than health messages to increase the consumption of healthy food (Horgen & Brownell, 2002). Recent studies related to changing eating behaviors resulted in different economic theories such as decreasing the cost of food items according to alternative food choices to decrease the prices (French, 2003). For example, to increase the consumption of healthy food, decreases in the prices of healthy food were achieved through industrial cooperation as a public health strategy.
Weight ControlAnother problem for millennials is obesity. Therefore, engaging in sports activities
has an important place in their lives for weight control. The most recent sports activities, trends, and centers are located at the center of their lives. The concern of millennials for gaining weight is considered to be normal since they are at higher risk of chronic illnesses like obesity, diabetes, and heart diseases as a result of genetics, life styles, socio-economic factors, high levels of stress, lack of sleep and unhealthy eating habits (LaRose, Leahey, Hill, & Wing, 2012).
Since generation Y gives importance to appearance, they spend lots of time exercising in sport centers and consuming energy drinks in their daily lives. In today’s world, modern jobs require individuals who are consistently on the move and who have high energy levels. Thus, energy drinks that are available everywhere seem to be the best alternatives for millennials. However, they gain the calories back easily from the food and drink that they eat when they go out in the evening for entertainment. Moreover, their tight relationship with technology increase their use of mobile phones, computers, and tablets that help them to complete most of their work. As a result, the obesity risk is higher for this generation because they sit and stand still a lot due to the increased time they spend using online games, applications, and social media. In addition, social media and online games affect their sleep patterns and lead to irregular nutrition. Therefore, millennials, who are concerned about their appearance and weight, are more selective about choosing healthier food items.

Dilistan Shipman / Factors Affecting Food Choices of Millennials: How they Decide What to Eat?
55
Ethics and Environmental ConcernsToday, environmental concerns have become a global issue all over the world.
Thus, companies that address these concerns by producing and marketing green as well as environmentally friendly products. Likewise, generation Y pays attention to food company activities that are related to their carbon footprint, ethics management, community involvement, and nutrition because these activities affect both Millenials decision and purchasing activities (Allen & Spialek, 2018).
Marketing ethics and social responsibility require the discussion of researchers and a socially responsible approach to marketing activities still poses conflicts and difficulties for marketers. Since customers are more conscious, their purchase decisions may result in behaviors that prefer ethical companies or that punish the unethical ones (Carrigan & Attalla, 2001).
Methods
SamplingWithin the context of this research 300 structured questionnaires were distributed to
the study participants. The respondents were selected via convenience sampling and at the end 263 usable surveys were used for further data analysis. While 42.6 % of the sample consisted of females, 57.4% consisted of male respondents. Most respondents were between the ages of 18-35 (82.5%). For education level, 85.6% of participants have university degrees and almost 60% of the sample had an income level between 0 and 2,000 TL. The demographic profile of the sample is provided in Table 1.
Table 1Demographic Profile of the Respondents
N %Gender Female 112 42,6%
Male 151 57,4%Age 18-35 217 82,5%
Above 35 46 17,5%Education Level University Degree 225 85,6%
Master Degree 34 12,9%Ph.D. Degree 4 1,5%
Income Level 0-1000 TL 101 38,4%1001 TL-2000 TL 52 19,8%2001 TL-3000 TL 44 16,7%3001 TL-5000 TL 32 12,2%Above 5000 TL 34 12,9%
MeasurementThe factors thataffect food choices were measured by 32 items, in which
respondents rated their level of agreement from strongly disagree to strongly agree

JOURNAL of TOURISMOLOGY
56
on a 5-point Likert scale. The survey was composed of two main parts. The first part included questions related to factors affecting food choices and the second part included demographic questions. Thirty-two factors were used to measure the food choices of customers provided in Table 2. Table 2Measurement Items
Dimension Measurement Item Source
Factors affecting food choices
I prefer dishes that are easy and simple to prepare.
Steptoe, Pollard and
Wardle, 1995
I prefer foods without additives.I prefer low-calorie food items.I prefer foods with natural ingredients.I prefer low price foods.I prefer the food I have tasted before.I prefer low-fat foods.I prefer nutritious foods. I prefer foods with high pulp and fiber. I prefer food that makes me happy when I eat. For the money I pay, I prefer the food I get good value.I prefer easy cooked and prepared dishes.I prefer easy-to-find ingredients in the market.I prefer food that helps me relieve stress.I prefer foods that taste good. I prefer foods that help my weight problem.I prefer food that is nice in texture.I prefer foods whose packages concern about environmental protection.I prefer imported food from countries where I approve their political and life style.I prefer the products in which the country and region are clearly stated.I prefer food that reminds me of the food I had as a child.I prefer food without artificial ingredients. I prefer food that smells good. I prefer food that gives me energy.I prefer foods that make it easier for me to cope with the challenges of life. I prefer food that comforts me.I prefer food with high vitamins.I prefer inexpensive foods.I prefer high protein foods.I prefer foods that are useful for my tooth and skin.I prefer foods that make me healthy.
Analysis and ResultsIn the first phase of statistical analysis, an exploratory factor analysis as well as
reliability analysis were performed for measurement items used in the study. To assess the applicability of factor analysis to the data set, the Kaiser-Meyer-Olkin test was used to assess sampling adequacy. Bartlett’s test of sphericity was used to test the hypothesis of whether the correlation matrix is an identity matrix. Since the value of KMO is higher than 0.50 and Bartlett test is significant at p-value of 0.05, the data set is considered to be appropriate for factor analysis (KMO=0,800, 2
Bartlett
test (231)=2002,633, p=0,000). After analyzing the data with principal component

Dilistan Shipman / Factors Affecting Food Choices of Millennials: How they Decide What to Eat?
57
analysis via varimax rotation. The results of factor loadings, explained variance, and reliability figures are provided in Table 3.
Table 3Results of Exploratory Factor Analysis
Factor Factor Loading
Explained Variance (%) Reliability
HealthI prefer food with high vitamins. 0,755
14,720 0,833
I prefer foods that make me healthy. 0,744I prefer high protein foods. 0,732I prefer nutritious foods. 0,679I prefer foods that are useful for my tooth and skin. 0,626
I prefer food that gives me energy. 0,573MoodI prefer food that makes me happy when I eat. 0,768
11,316 0,687I prefer foods that taste good. 0,714I prefer food that helps me relieve stress. 0,662For the money I pay, I prefer the food I get good value. 0,606
I prefer food that is nice in texture. 0,569Ethics and Environmental ConcernsI prefer the products in which the country and region are clearly stated. 0,859
10,571 0,793I prefer imported food from countries where I approve their political and life style. 0,817
I prefer foods whose packages concern about environmental protection. 0,711
ConvenienceI prefer easy cooked and prepared dishes. 0,851
10,103 0,784I prefer dishes that are easy and simple to prepare. 0,844
Weight ControlI prefer low-calorie food items. 0,816
9,570 0,738I prefer low-fat foods. 0,751I prefer foods that help my weight problem. 0,695PriceI prefer inexpensive foods. 0,830 7,229 0,713I prefer low price foods. 0,814
The results of the factor analysis showed that the factors affecting food choices grouped under six dimensions that are health, mood, ethical concerns, convenience, weight control, and price. The mean values and standard deviation of these six dimensions are shown in Table 4. From the table, the most important factor found was mood followed by health, convenience, and ethical concerns. On the other hand, the least important factor was weight control.

JOURNAL of TOURISMOLOGY
58
Table 4Mean and Standard Deviation of the FactorsFactors Mean Standard DeviationHealth 3.870 0.669Mood 4.207 0.573Ethical Concerns 3.285 0.950Convenience 3.520 0.883Weight Control 3.123 0.922
Lastly, to assess whether each factor showed differences for gender and age, an independent T-test was performed to understand group differences. However, the analysis could not find any statistically significant mean difference for gender and age. Thus, further analyses were conducted to see whether there was any mean difference for each item. As a result, for gender, only two items were found to be significantly different for males and females. The findings show that women are more likely to prefer food items with high protein (male=3,6159, female=3,9196). On the other hand, males were more likely to choose food items that were nice in texture (male=4,0662, female=3,6964) (see Table 5).
Table 5Independent t-test Results for Gender
N Mean Std. Deviation t-value p-value
I prefer high protein foods. Male 151 3.6159 0.915 -2.618 0.009Female 112 3.9196 0.950I prefer food that is nice in texture.
Male 151 4.0662 0.877 3.222 0.001Female 112 3.6964 0.975
For variable age, the analyses found significant differences for the items of “I prefer easy cooked and prepared dishes”, “I prefer low-calorie food items”, “I prefer food that makes me happy when I eat”, “I prefer foods that taste good”, “I prefer food that is nice in texture”, “I prefer food without artificial ingredients”, and “I prefer inexpensive foods” (see Table 6).Table 6Independent t-test Results for Age
N Mean Std. Deviation t-value p-valueI prefer easy cooked and prepared dishes
18-35 217 3,3641 1,08 -2,039 0,04235 + 46 3,7174 1,00I prefer low-calorie food items
18-35 217 2,8664 1,17 -2,745 0,00835 + 46 3,3043 0,94I prefer food that makes me happy when I eat
18-35 217 4,5392 0,70 3,162 0,00335 + 46 4,0870 0,91I prefer foods that taste good
18-35 217 4,5207 0,69 2,590 0,01235 + 46 3,1739 0,85I prefer food that is nice in texture
18-35 217 3,9770 0,91 2,593 0,01035 + 46 3,5870 1,00I prefer food without artificial ingredients
18-35 217 3,7005 1,04 -2,485 0,01535 + 46 4,0870 0,94I prefer inexpensive foods
18-35 217 3,2949 1,06 3,153 0,00235 + 46 2,7826 0,99

Dilistan Shipman / Factors Affecting Food Choices of Millennials: How they Decide What to Eat?
59
In table 6, people between the ages of 18 and 35 gave more importance to items of “I prefer foods that taste good”, “I prefer food that is nice in texture”, I prefer food that makes me happy when I eat”. On the other hand, the items “I prefer easy cooked and prepared dishes”, “I prefer low-calorie food items”, and “I prefer food without artificial ingredients”, were found to be more important for people above 35. The differences are also displayed below in figure 1.
Figure 1. The mean values for age variable
ConclusionThe results of this study provide important conclusions in understanding the food
choices of millennials. First of all, the findings of the exploratory factor analysis showed that factors affecting food choices could be grouped into six different dimensions. Mainly, these dimensions were health, mood, ethical concerns, weight control, and price. From these dimensions, it was found that the most important factor for millennials was mood. When generation Y makes food choices, they like to have food items that relieve stress, make them happy, tastes good, nice texture, and offers value for the money. Therefore, it might be concluded that food companies targeting millennials should focus on the factors that affect the mood of this generation in a positive way.
This generation also gives importance to health issues. Even if they like convenience when they are selecting between food alternatives, they also pay attention to nutritional value of the food items. Even if weight control is the least important factor according to the study results, generation Y likes to check the nutritional values for food and

JOURNAL of TOURISMOLOGY
60
eat accordingly. Other than health, the study also shows evidence that convenience is the third most important factor for millennials. More specifically, they like to have foods that are easy to cook and prepare. This finding implies that food marketers should focus their efforts on ready to cook foods if they are targeting generation Y. They can offer ready to go food items in grocery stores so that people can easily take them home and make it ready in a short time. The convenience factor also creates opportunities for restaurants. That is, restaurants could increase their sales via online food delivery if they provide fast and convenient online food ordering platforms. Lastly, as the study results indicate, millennials also have ethical concerns when they consume food. Especially, they pay attention to the packaging of items. As a result, it suggests that restaurants and food companies need to offer packaging that is environmental friendly as well as recyclable.
Besides the relative importance of these factors for generation Y, the study also analyzed whether millennials show any difference for demographic factors of gender and age. Although, the findings did not show any significant difference for six factors, people showed differences for some items based on their age and gender. Specifically, females are more likely to consume high protein foods, whereas males are more likely to prefer food items that are nice in texture. Thus, it could be concluded that while health seems to be more of a concern for females, it is the mood that is important for males in choosing among food alternatives. On the other hand, for the variable age, people between the ages of 18-35 prefer food items that make them happy, that are nice in texture, and that taste good. People over 35 are likely to use foods that are easy to prepare with low calories. They also pay attention to the ingredients and choose items that do not have artificial things inside.
As a result, this research shows that generation Y is different from other generations in their decision making process for choosing among food alternatives. Therefore, restaurateurs and food companies need to consider them a different target segment and try to appeal to their unique concerns. However, they also need to pay attention to differences among millennials. That is, gender or age could be a factor for the relative importance of factors affecting food decisions. Hence, even though millennials represent a market segment, there might be other segments within millennials. When planning marketing activities, companies should focus on each factor separately to understand its role in food purchasing decisions.
Peer-review: Externally peer-reviewed. Conflict of Interest: The author has no conflict of interest to declare.Grant Support: The author declared that this study has received no financial support.

Dilistan Shipman / Factors Affecting Food Choices of Millennials: How they Decide What to Eat?
61
ReferencesAllen, M. W., & Spialek, M. L. (2018). Young millennials, environmental orientation, food
company sustainability, and green word-of-mouth recommendations. Journal of food products marketing, 24(7), 803–829.
Bengtsson, A., Bardhi, F., & Venkatraman, M. (2010). How global brands travel with consumers: An examination of the relationship between brand consistency and meaning across national boundaries. International Marketing Review, 27(5), 519–540.
Capon, N. (2016). Managing marketing in the 21st century: Developing & implementing the market strategy.
Carrigan, M., & Attalla, A. (2001). The myth of the ethical consumer–do ethics matter in purchase behaviour? Journal of consumer marketing, 18(7), 560–578.
Corvi, E., Bigi, A., & Ng, G. (2007). The European Millennials versus the US Millennials: similarities and differences. Quarto Convegno Annuale della Società Italiana Marketing.
French, S. A. (2003). Pricing effects on food choices. The Journal of nutrition, 133(3), 841S–843S.Gillian, C. & Wilson, M.S.R. (2009). Strategic Marketing Management. UK:Routledge.Horgen, K. B., & Brownell, K. D. (2002). Comparison of price change and health message
interventions in promoting healthy food choices. Health Psychology, 21(5), 505.Inglehart, R., & Carballo, M. (1997). Does Latin America Exist?(And is There a Confucian Culture?):
A Global Analysis of Cross-Cultural Differences 1. PS: Political Science & Politics, 30(1), 34-47.James, D. (2004). Factors influencing food choices, dietary intake, and nutrition-related attitudes
among African Americans: application of a culturally sensitive model. Ethnicity and Health, 9(4), 349–367.
Lancaster, L. C., & Stillman, D. (2003). When generations collide: Who they are, why they clash, how to solve the generational puzzle at work. New York, NY: Harper Business.
LaRose, J. G., Leahey, T. M., Hill, J. O., & Wing, R. R. (2013). Differences in motivations and weight loss behaviors in young adults and older adults in the National Weight Control Registry. Obesity, 21(3), 449–453.
Leslie, John. April 7, 2016. The sugar conspiracy. The Guardian. http://www.theguardian.com/society/2016/ apr/07/the-sugar-conspiracy-robert-lustig-john- yudkin
Logue, A. W., & King, G. R. (1991). Self-control and impulsiveness in adult humans when food is the reinforcer. Appetite, 17(2), 105–120.
Peskett, S. (2006). Under-30s are the big spenders in UK market. Harpers, 10, 26.Schewe, C. D., & Meredith, G. (2004). Segmenting global markets by generational cohorts:
determining motivations by age. Journal of Consumer Behaviour: An International Research Review, 4(1), 51–63.
Steenhuis, I. H., Waterlander, W. E., & De Mul, A. (2011). Consumer food choices: the role of price and pricing strategies. Public health nutrition, 14(12), 2220–2226.
Steptoe, A., Pollard, T. M., & Wardle, J. (1995). Development of a measure of the motives underlying the selection of food: the food choice questionnaire. Appetite, 25(3), 267-284.
Suter, T. A., & Burton, S. (1996). An examination of correlates and effects associated with a concise measure of consumers’ nutrition knowledge. Family and Consumer Sciences Research Journal, 25(2), 117–136.
JOURNAL of TOURISMOLOGY
62
Taub, D. J., & Robertson, J. (Eds.). (2013). Preventing College Student Suicide: New Directions for Student Services, Number 141. John Wiley & Sons.
Taylor, Kate. February (2016). Millennials aren’t eating cereal because it’s too much work.https://www.businessinsider.com/millennials-are-too-lazy-to-eat-cereal-2016-2Tuttle, Brad. July 31, 2015. 10 Things Millennials Buy Far More Often Than Everyone Else.”
Money. http://time.com/money/3979425/millennials-consumersboomers-gen-x/Wang, O., De Steur, H., Gellynck, X., & Verbeke, W. (2015). Motives for consumer choice of
traditional food and European food in mainland China. Appetite, 87, 143–151.Watson, Elaine. April 27, 2016. What Millennials want: From customization to continuous snacking.
Pre- pared Foods. http://www.foodnavigator-usa.com/ Trends/Trendspotter/Packaged-facts-explores-Mil- lennial-food-trends
Wohl, Jessica. May 2, 2016. Pepperidge Farm Puffs up Pastry Sales with Help from Videos. GMA SmartBrief. http://adage.com/article/cmo-strategy/ pepperidge-farm-puffs-pastry-sales-online-vid- eo/303803/

Journal of Tourismology, 6(1), 63-77
DOI: 10.26650/jot.2020.6.1.0031http://jt.istanbul.edu.en/
Submitted: 23.09.2019Revision Requested: 31.10.2019
Last Revision Received: 01.02.2020Accepted: 19.02.2020
Published Online: 25.02.2020R ES EA RC H A RT I C L E
Journal of Tourismology
1 Correspondence to: Basharat Hossain (Asst. Prof.), International Islamic University Chittagong, Faculty of Economics, Department of Business Administration, Chattagram, Bangladesh. E-mail: [email protected] ORCID: 0000-0001-6140-5392
2 Syed Naimul Wadood (Assoc. Prof.), University of Dhaka, Department of Economics, Dhaka, Bangladesh. E-mail: [email protected] ORCID: 0000-0001-7424-7282
To cite this article: Hossain, B., & Wadood, S. N. (2020). Potential unexplored? Tourism and economic growth of Bangladesh. Journal of Tourismology, 6(1), 63-77. https://doi.org/10.26650/jot.2020.6.1.0031
Basharat Hossain1 , Syed Naimul Wadood2
Potential Unexplored? Tourism and Economic Growth of Bangladesh
AbstractThis paper examines the potential effects of tourism on the economic growth of Bangladesh. It is a review paper of the literature based on secondary data. This paper discusses various aspects regarding the effects of the tourism industry on the overall economic progress of the country, including real GDP growth, infrastructural development and employment generation. Since the tourism industry has a small share of revenue to the GDP of Bangladesh’s economy (at this moment), its contribution to economic growth is limited till now. This paper finds that the current size of the Bangladesh tourism economy is BDT 500 million. Besides, Bangladesh earned USD 1157 million from tourism sector during 2009-2018 period. Each year, 0.55 million tourists (on average) visit Bangladesh in the same period. Moreover, it creates 2.23 million jobs each year. The travel and tourism sector contributes 4.4% of the GDP in each year. Bangladesh’s government ensures a lot of facilities for tourists.This article points out a number of issues that need to be considered in the tourism industry to play a more significant role regarding economic growth, and the overall socio-economic development of Bangladesh.
KeywordsImpact, Tourism, Economic growth, Economic development, Banglades
JEL ClassificationZ30, Z32
This work is licensed under Creative Commons Attribution-NonCommercial 4.0 International License

JOURNAL of TOURISMOLOGY
64
IntroductionBangladesh is currently the 41st of the largest economy of the world and the second
largest economy of South Asia, only next to India. Bangladesh is a south Asian and lower-middle-income country with around 163.7 million populations. The current size of Bangladesh’s GDP is USD 286 billion, with 8.13 per cent growth rate in 2018-19 and it is estimated to be the 24th world largest economy by 2033 (Bangladesh Economic Review (BER) 2019, Centre for Economics and Business Research (CEBR), (2018). Apart from the service sector, the industry sector is the highest contributing sector in this economy (35.14 per cent) followed by agriculture (13.61 per cent), transport and communication sectors (10.98 per cent) respectively (BER, 2019). The industry sector covers four sub-sectors; these are: “mining and quarrying, manufacturing, electricity, gas and water supply and construction.”
Table 1The Bangladesh Economy: At A GlanceGDP 286 Billion USD (2018-19 Prov.)GDP Growth Rate 8.13 per cent (2018-19 Prov.)GDP Per Capita USD 1,827 (2019)Population (in Million), Estimated 163.7 (2018)Labor Force Participation Rate 58.2 per cent (2016-17)Literacy Rate (7 Years and Above) 72.3 (Both Sexes), 74.3 (Male), 70.2 (Female), all 2017Life Expectancy at Birth (Yrs) 72.0 (Both Sexes), 70.6 (Male),73.5 (Female), all 2017Incidence of Poverty 21.8 per cent (Upper),11.3 per cent (Lower) (2018estimated)Industry Contribution to GDP 35.14per cent (2018)
Transportation (Km.) Road: 21,596(uptil Feb 2019) (includes 3,906 National)Rail: 3,956 (2017-18)
Inflation Rate (Average) 5.44 per cent (2017)Workers’ Remittances 11,869 Million USD(July-March 2019)Savings (asper cent of GDP) 28.41 (National) (2018-19 Prov.)Investment (as per cent of GDP) 31.56 (Total Investment) 8.17 (Public) 23.4(Private) (2018-19 Prov.)Current Account Balance (Negative) USD 4,270 Million (July-February 2019)
Export Earnings (f.o.b.) 27,563 Million USD(July-March 2019), of which: Ready-made Garments and Knitwear Combined: 23,126 Million USD
Import Payments (f.o.b.) 37,839 Million USD (July-March 2019)Earnings from Tourism 344 Million USD (2017)Budget Deficit (including foreign grants, per cent of GDP) 4.97
Source: BER (2019), Bangladesh Bureau of Statistics (BBS) (2019)
Correspondingly, the agriculture sector of Bangladesh consists of crops, animal farming, forests, and fishing. Around 40.6 per cent of the total labor force is involved in the agriculture sector, whereas another 20.4 per cent is involved in the industry sector. Transport, storage, and communication sector comprise of land, water and air transport, seaport transport, storage, and telecommunications. Moreover, the Bangladesh economy holds approximately 0.40 per cent of the world economy’s GDP (Trading Economics, 2019).

Hossain, Wadood / Potential Unexplored? Tourism and Economic Growth of Bangladesh
65
The ready-made garments and knitwear are the largest source (83.9 per cent) of the total export earnings (BER 2019). All other sectors (such as jute goods, frozen food, agricultural products, etc.) jointly contribute the remaining 16.1 per cent. Hence it is needed that other sectors grow fast, to reduce heavy export earnings dependence on the ready-made garments and knitwear industry. We argue that tourism is one of the best prospective sectors of Bangladesh to raise foreign exchange earnings, and this can contribute to additions to economic development as well. Because it has a large number of tourist spots, exquisite natural sights, pleasant environment, and tourist-friendly weather, the amiable behavior of the people, safety and security of the tourists, etc. Bangladesh earned an annual total of USD 344 million in 2017, USD 214.3 million in 2016, USD 150.3 million in 2015, way up from USD 79 million in 2006, from tourism revenue (Choice for Economic and Investment Research (CEIC), 2019). The number of tourist arrivals was at 830,068 in 2016 and 643,094 in 2015 (op. cit.). One point to be noted is that Bangladesh did not achieve significant success in utilizing the tourism and travel sector as compared to her Asian neighbors, such as Malaysia, Thailand, India, and China. For example, in 2013, the (percentage) total contribution to GDP of tourism with regards to Bangladesh, Malaysia, Thailand, India and China was 4.4, 16.1, 20.2, 6.2 and 9.2 respectively, the same lowest position with regards to total contribution to employment and capital investment in the tourism sector as well. As for information, in 2013-14, tourism directly contributed around 2.1 per cent to Bangladesh’s GDP and supported 1.3 million jobs (Planning Commission (2015), Table 5.3, pp. 270).
The goal of this paper is to assess the contribution of tourism on the economic progress of Bangladesh. The organization of the paper is as follows. Section one is the background of the study, whereas section two describes the objective of the study, and section three is the overview of the literature. Section four describes the methodology, while section five exhibits statistical results, and section six provides recommendations and section seven concludes the article.
An Overviewof the Concept of TourismTourism refers to the businesses that offer the services (e.g., transport, tourist spot
for visiting, or entertaining) for the person seeking to enjoy a vacation (Tourism, 2019). The Collins dictionary delineates tourism as the commercial activities that arrange the facilities for the people on holiday (Tourism, 2019a). Moreover, tourism can be defined as the guidance and management of tourists (Tourism, 2019b). The United Nations World Tourism Organization (UNWTO) defines tourism in the following sentence: “Tourism includes the actions of people visiting to and staying in locations outer of their living place for equal or less than one successive year for relaxation, trade, and other intentions”(UNWTO, 2010) (see Camilleri (2018) for a review of the literature regarding the recent advancements in the tourism industry).

JOURNAL of TOURISMOLOGY
66
A Brief Overview of the Tourism Industry of BangladeshBangladesh has a large number of tourist spots with fanciful natural sights and
beauties. The tourist sites include sea beaches, waterfalls, seaports, river ports, mountains, tea gardens, mangrove forests, roadside green views, safari parks, eco-parks, etc. Other tourist spots include historical monuments, religious monuments, museums, military museums, zoos, entertainment parks, children parks; etc. Table 2 highlights some renowned tourist spots of Bangladesh.
Table 2Tourists Spots of Bangladesh: At a GlanceNature of Tourist Spots Name of Tourist Spots
Sea Beaches and its Adjacent Locations
Cox’s Bazar Beach (longest natural, unbroken sea beach in the world, stretching 120 kilometers, a top tourist destination), Inani Beach, Himchori Waterfall and Hill Track, Laboni Beach, 100 Feet Buddha Statue. Ramu, Ukhia, Bandarban, Rangamati, Sonadia Island, Patenga, Parkir Char, Teknaf, Saint Martin’s Island and Sea Beach, Chandranath Hills (Sitakunda), Sajek Valley (Rangamati), Nilachal (Bandarban), Kuakata Sea Beach (number two tourist destination), Katka (Sundarbans)
Natural Parks Banghabandhu Sheikh Mujib Safari Park (Gazipur), Dulhajra Safari Park (Chattagram), Sitakunda Eco Park (Chattagram), Madhabkunda Eco Park (Moulavibazar), Madhutila Eco Park (Sherpur)
Waterfalls
Himchori (Cox’s Bazar), Madhabkunda (Maulvibazar), Pangthumai (Sylhet), Hum Hum (Sreemangal), Richhang (Khagrachhari), Shoilo Propat (Bandarban), Rijuk Jhorna (Bandarban), Amia khum (Bandarban), Khaiyyachara Falls (Chattagram),Tinap Saitar (Bandarban), Nafa-khum (Bandarban), Shuvolong (Rangamati), Haja Chora (Khagrachari), Jadipai and Baklai Fountains (Bandarban), Jaflong (Sylhet), Songrampunji (Sylhet)
Hills and Mountains
Chattogram Division: Bandarban, Rangamati, Khagrachari, Sitakunda (Chattogram), Cox’s Bazar DistrictSylhet Division: ZaflongMymenshing Division: Garo Hills
Islands
Saint Martin’s Island, Nijhum Dwip, Dublar Char, Burir Char, Bhola Island (the country’s largest island), Sandwip, Urir Char, Swarna Dweep, Hatiya, Manpura Island, Maheshkhali Island, Char Kukri Mukri, Char Lakshmi, Kutubdia, Sonadia
Forests Sundarban Mangrove Forests (Khulna), Lawachora National Forests (Sreemangal), Ratargul Swamp Forest (Sylhet)
Historical Palaces and Monuments
Natore Rajbari (Natore), Ahsan Manzil (Dhaka City), Lalbag Fort (Dhaka City), Huseni Dalan (Dhaka), Muktagacha Palace (Mymensingh), Silaidaha Kuthibari (Kushtia), Jatiyo Smriti Soudho (Savar, Dhaka), Curzon Hall (Dhaka City), the Mosque City of Bagerhat (Bagerhat)
Religious Monuments and Places
Mosque: Baitul Mukarrom Mosque (national mosque), Binot Bibir Mosque, Shaat Gambuj Mosque, Tara Mosque, Khan Md.Mridha Mosque, Bibi Marium Mosque, Al-Falah Mosque, Andarkillah Shahi Mosque, Kusumba Mosque (Rajshahi), Choto Sona Mosque (Chapai Nawabganj), Shat Gombuj Mosque (Bagerhat), Bagha Shahi Mosque (Rajshahi), Guthia Mosque (Barisal)Temple: Kantanagar Temple (Dinajpur) (finest terracotta temple), Adinath Temple (Maheshkhali), Chandranath Temple (Sitakunda), Dhakeswari Temple (Dhaka), Puthia Temple Complex (Rajshahi) Pagoda: Buddha Dhatu Jadi (Bandarban), Ramu Temple Complex (Cox’s Bazar), Ukhia Pagoda Complex (Cox’s Bazar)Church: Armenian Church (Dhaka), St. Peter’s Cathedral (Barisal), the Holy Rosary Cathedral (Chattagram)

Hossain, Wadood / Potential Unexplored? Tourism and Economic Growth of Bangladesh
67
ShrinesShrine of Hazrat Shah Jalal(Sylhet), Shrine of Hazrat Bayazid Bostami (Chattogram), Shrine of Hazrat Makhdum Shah (Rajshahi), Shrine of Lalon Shah (Kushtia)
National InstitutionsJatiyo Sangshod Bhaban (Dhaka City), Central Shaheed Minar (Dhaka City), Mouseleum of Father of the Nation Bangabandhu Sheikh Mujibor Rahman (Tungipara, Gopalganj), World War II Cemetery (Chattogram)
Zoos
Bangladesh National Zoo (Dhaka),Chattagram Zoo and Veterinary Clinic, Comilla Zoo and Botanical Garden, Museum of Zoology (Dhaka), Rangpur Zoo, Rajshahi Central Zoo, Naria Zoo (Shariatpur), ShiteshBabu’s Monster (Shreemangal),Shaheed A.H.M. Kamruzzaman Central Park & Zoo(Rajshahi), Mini Zoo (Mymenshing), Khulna Zoo
Museums National Museum (Dhaka City), Varendra Research Museum (Rajshahi), Ethnographical Museum (Chattagram)
Archaeological Sites Mahasthangarh (oldest archeological site), Somapura Mahavihara (Naogaon), Mainamati (Comilla), Sonargaon (Dhaka), Wari-Bateshwar (Narshingdi)
Rivers Padma, Meghna, Jamuna
Lakes and WetlandsKaptai Lake (Rangamati), Tanguar Hoar (Sunamganj), Hakaluki Haor (Moulvibazar), Foy’s Lake (Chattagram), Madhabpur Lake (Sylhet), Bichnakandi (Sylhet)
Source: Authors Own Compilation from Internet Sources
The tourism sector of Bangladesh is mainly led by the government tourism-related departments, and a large and vibrant private sector is also active and gradually emerging in recent years (encouraged to operate and at the same time, the policy is formulated, and regulation is made by the government tourism department). The tourism sector of Bangladesh is administered and supervised by the Bangladesh Parjatan Corporation (BPC) that was formed in 1972 by the Government of Bangladesh (See Table 3). Moreover, the stated primary objective of the BPC is to make Bangladesh an attractive tourist destination country, and the slogan has been “Beautiful Bangladesh.” The BPC guides the public and private tourism organizations, ensures visa and immigration facilities for foreign tourists and seeks to ease the procedure, ensure security as well as the safety of the tourists.
Table 3List of Tourism Administrations and Associations in Bangladesh
Sl No Name Web site Web siteContents
1Bangladesh Parjatan corporation (BPC)
(Govt. Tourism Organization)http://www.parjatan.gov.bd
List of tourist spots and places, hotel-motel booking, photo gallery,list of hotel-motel,
2 Bangladesh Tourism Board http://www.tourismboard.gov.bd List of tourist spots and places, video gallery
3 Tour Operators Association of Bangladesh (TOAB) http://www.toab.org
List of 586 tour operators in Bangladesh, list of tourist spots and places, newsletter,blog, etc.
Source: Authors’ Own Compilation

JOURNAL of TOURISMOLOGY
68
In addition to this, BPC’s other functions are: human resource formation for the tourism sector, encourage the public and private sector to join in the infrastructure as well as tourism-related projects, promote ecotourism (based on incorporating environmental and anthropological needs within tourism), and finally, improve the means of the tourism sector comprising tourist spot development, making new tourists spots, arranging safe hotels, motels, cottages, restaurants, picnic spots, rent-a-car, etc. (BPC 2019). Besides regulating private sector hotels and motels, the BPC on its own provides residential facilities through 25 hotels in 19 districts of Bangladesh.
The profession of tour guide as an early-career life employment has been popular in Bangladesh. Currently, more than 10,000 tour guides and more than 200 travel and tourism organizations are providing tourism services in Bangladesh (Airways office, 2019). Besides, tourism and hospitality management as an academic discipline has been introduced in graduate and postgraduate levels at the universities. At present, around seventy universities and institutions are offering Tourism and Hospitality Management courses and degrees in Bangladesh.
The tourism industry of Bangladesh suffers from inadequate budget and government supports, and insufficient roads in remote areas, and a small amount of publications, insufficient facilities for tourists, etc. During some periods of time in the past, political instability and violence created additional hindrance for tourism (see Sultana, 2016), whereas, currently the situation is much calmer and peaceful. Nevertheless, the prospects of tourism are comparatively much higher than the problems it faces. A large number of magnificent tourist spots, secure visa facilities, on arrival visa facilities for 60 countries, the lowest visa fee (as low as USD 51), no airport fees, a large number of tourist guides and agencies, easy to book transport tickets, both AC and non-AC private as well as public transports, currency conversion through banking and non-banking agents, fast internet speeds, tourist police for the safety and security of tourists, and so much more (Golden Bengal Tours, 2019).
Objective of the StudyThe main goal of this paper is to inspect the impact of tourism on the economic
growth of Bangladesh. More precisely, this article aims to present a general idea of the tourism industry of Bangladesh. Besides, it scrutinizes the contribution of the tourism sector on the economic growth, employment generation, and development of the tourist areas in Bangladesh.
Overview of the LiteratureA large number of research works have been done on the economic growth and
tourism of different countries, but very few descriptive works are found on the

Hossain, Wadood / Potential Unexplored? Tourism and Economic Growth of Bangladesh
69
tourism of the Bangladesh economy. Table 4 highlights the previous research works and findings on Bangladesh tourism and the rest of the world, respectively.
Table 4Impact of Tourism on the Bangladesh Economic Growth
Serial No Source Topics of the Study Area of the
Study Findings
1. Kobra et al (2018) Descriptive Study Bangladesh -2. Bhuiyan and Darda (2018) Descriptive Study Bangladesh -3. Sayeda (2017) Descriptive Study Bangladesh -4. Amin et al. (2017) Newspaper Article (Descriptive) Bangladesh -5. Sultana (2016) Descriptive Study Bangladesh -6. Rahman (2016) Descriptive Study Bangladesh -7. Roy and Roy (2015) Descriptive Study Bangladesh -8. Salam (2014) Descriptive Study Bangladesh -
9. Ali (2013) Exploratory Factor Analysis Cox’s Bazar, Bangladesh
Positive Impact
10. Ali et al. (2012) Descriptive Study, Ethics and Tourism Bangladesh -
11. Das and Chakraborty (2012) t-test on GDP Growth,including and excluding Tourism Bangladesh Positive
Impact
12. MOEF (2010) Project Paper, Descriptive Study, Climate Change and Tourism Bangladesh -
Source: Compiled by the Authors
Kobra et al. (2018) discuss the good and bad features of promotion regarding investment in the tourism industry of Bangladesh. Some 120 stakeholders (both governmental and non-governmental) were interviewed for their views and opinions about this sector. Investment is insufficient, whereas lack of integration among the different authorities has been identified as one core problem of this sector.
Bhuiyan and Darda (2018) highlight the future possibilities of Halal tourism in Bangladesh. Bangladesh is the fourth largest Muslim populated country in the world and has a large number of Muslim shrines and congregations. Therefore, it has scopes for enhancements of Halal tourism (or Islamic Shariah-based).
Sayeda (2017) examines the prospects of economic, social, cultural, environmental effects of mass tourism in the context of Bangladesh, particularly in the context of Cox’s Bazar and its surrounding areas. Mass tourism is geared towards convenient and economic tourism activities designed for a large number of tourists irrespective of their socio-economic status, and this can be one strategy for a large volume of tourism revenue generation. The concept of sustainable tourism that aims at preserving socio-cultural and natural resources of the tourist destination can be applied to the promotion of tourism in Cox’s Bazar and its adjacent locations in a sustainable way, as per the paper.
Amin et al. (2017) discuss the problems and forecasts the prospective features of ruraltourism in the context of Bangladesh. Bangladesh, with a total count of 86,038

JOURNAL of TOURISMOLOGY
70
villages, is in a perfect position to offer its green fields, wildlife, wetlands, river beds, rural festivals, arts, and crafts to visitors from home and abroad, whereas to keep in mind the plausible adverse effects as well. Sultana (2016) discusses how tourism affects different components of the Bangladesh economy by analyzing secondary data.
Among the other papers, Rhaman (2016) analyzes the impact of tourism on the livelihood of the residents of the Rangamati district in Bangladesh. Salam (2014) focuses on the significance of the socio-economic advantages of tourism in the context of Bangladesh. He clearly shows how the tourism sector earns revenues. Roy and Roy (2015) present an overview of the Bangladesh tourism industry. Ahmad, Shahab Uddin (2013) describes the present scenario, probable effects on the Bangladesh economy, training and product development issues and suggests many steps to expand the tourism sector in Bangladesh. Ali (2013) analyzes the socio-economic influences of Tourism on Cox’s Bazar-the largest sea beach in Bangladesh, and finds a positive impact. Das and Chakraborty (2012) examine the economic impact of tourism by t-test on GDP growth, including and excluding tourism and found a significant effect of tourism on the GDP of Bangladesh. Ali et al. (2012) discuss ethical issues related to tourism development in Bangladesh. The project paper of the Ministry of Environment & Forests, Bangladesh highlights the effects of climate change on the tourism industry in Bangladesh (Ministry of Environment and Forests (MOEF), 2010). Ali and Parvin (2010) discuss how to treat tourism to increase its contribution to the GDP of Bangladesh.
Moreover, several studies tested the influence of tourism on the economic growth and advancement of other countries. Akan et al. (2007), Cetin (2014), Gökovali & Bahar (2006) and Gokovali (2010) find that tourism, economic growth and GNP are strongly related to the Turkish economy. Kadir & Karim (2012) and Puah et al. (2018) state the positive contribution of tourism on the Malaysian economic growth. De Esteban et al. (2015) and Ohlan (2017) concludes that tourism revenue, economic growth and financial development are strongly correlated to each other in the Indian economy. Stauvermann et al. (2016) illustrates the positive relationships among the tourism revenue, exchange rate, capital and economic growth of Sri Lanka. Yahya (2005) discusses the cost of damages incurred by tourism in the Maldives.
The previous studies cover a description of the tourism industry of Bangladesh, details of many tourist spots, prospects of rural tourism, problems and prospects of tourism, one research examines the t-test on the GDP with and without tourism revenue. Moreover, almost all of the earlier analyses (in Bangladesh perspective) were descriptive studies, and these combined the travel and tourism data. On the contrary, this paper separately, incorporates tourism revenue and travel & tourism revenue. Besides, it presents a complete idea about well-known and potential tourist spots and areas,

Hossain, Wadood / Potential Unexplored? Tourism and Economic Growth of Bangladesh
71
tourism administration and tourism organization, facilities (Visa, accommodation, safety in travelling and currency exchange) for the tourists, and tourism education in Bangladesh. Finally, this paper analyzes data regarding Real GDP, tourism budget, tourism revenue, employment in the tourism sector through graphical analysis.
MethodologyThis is an original research paper based on both qualitative and quantitative
analyses. It incorporates the secondary data over the 2009-2017 period. Since the data on the tourism revenue of Bangladesh is not available before 2009, we considered the 2009-2017 period. The data are collected from the World Tourism Outlook 2009-2017, and the Bangladesh Economic Review (various editions). Data on real GDP, investment, tourism income are used in 2009 constant value of the USD. The data are analyzed by using mean, median, standard deviation and graphical analysis.
Assessing the Impact of Tourism on the Economic Growth of BangladeshThe current size of the tourism industry of Bangladesh is BDT 5,000 crore in
2017, that was BDT 500 crore in 2007 (Rahman and Chakma, 2018). Bangladesh earned USD 1,153 million from the tourism sector during the 2009-2017 period (UNWTO, 2009-2018) while the revenue from the travel & tourism sector was BDT 850.7 billion in 2017. On an average, a yearly number of 552,500 tourists visited Bangladesh during the 2009-2017 period. Table 5 explores the revenue of tourism, and travel & tourism industry and its contribution in GDP and employment creation.
Table 5Effect of Tourism on the Economic Growth of Bangladesh
YearTourism
Revenue (In million USD)
No of Tourist visited
Contribution of Travel & Tourism to GDP (In
Billion BDT)
Job in Travel & Tourism
Contribution of Travel &Tourism to GDP
(Per Cent)2009 70 267000 - - 4.62010 81 303000 - - 4.72011 87 440000 381.6 2880500 4.22012 110 600000 - - 4.32013 128 618000 830 1328500 4.42014 153 630000 627.9 1984000 4.52015 148 648000 809.6 2346000 4.42016 213 654000 840.2 2401000 4.32017 337 700000 850.7 2432000 4.32018 - - - - 4.4
2025* - - 1,252.8 2492000 6.12026* - - 2894000 6.42027* - - 1,783.0 2965000 4.72028* - - 1,753.1 - 4.6
Source: UNWTO (2009-2018), The World Travel & Tourism Council (WTTC) (2009-2018), knoema.com (2019); *Projected value.

JOURNAL of TOURISMOLOGY
72
According to the reports of the WTTC, the travel & tourism sector of Bangladesh generated approximately a yearly 2.23 million jobs during the 2011-2017 period. Tourism generates both formal and informal jobs. The most common form of formal job sectors are hotel and motel, cafe & restaurant, shopping malls at the tourist site, transport, tourist guide, tourism agency, local handicrafts, etc. Besides, a large number of local people find their livelihoods in the informal sector, such as, rickshaw driving, hawkers, selling homemade food and non-food items, garbage collecting, unprofessional children singer,cameraman, and so much more. However, Table 6 and Figure 1 summarize the tourism contribution to real GDP of Bangladesh.
Table 6Summary of the Tourism Contribution to Bangladesh EconomyVariable Observation Mean Std. Dev. Min MaxReal GDP (Bill $) 8 113.173 17.486 90.074 140.638Tourism Revenue (Bill $) 8 0.135 0.05 0.07 0.204Tourist Visited (Million) 8 0.52 0.160 0.267 0.654Job in travel & Tourism (JTT) (Million)
8 2.108 0.549 1.22 2.881
Furthermore, tourism sectors stimulate infrastructural development, development of residents of the tourists’ spots, hotels, motels, production of food, and non-food items. In the last decade, Bangladesh experienced tremendous development in the tourism industry. A large number of new tourist spots were constructed around the country. At least ten natural fountains were discovered in the mountains. Besides, ten sea beaches were developed and renovated for the tourists. Moreover, the Bangladesh Roads and Highways Department constructed about ten thousand kilometres of roads to facilitate the tourists. Also, new rail lines and naval routes were developed, and private airlines facilities were introduced. More than 1700 hotels, motels, resorts were constructed around the country.
050
100
150
2008 2010 2012 2014 2016year
Realgdp BIL TR $ bill cons $2009
01
23
2008 2010 2012 2014 2016 2018year
Touristmil JTT mill
Figure 1. Real GDP and Tourism Contribution (Tourism Revenue, Tourist visited and Job in Travel & Tourism (JTT) sector of Bangladesh for 2009-2017

Hossain, Wadood / Potential Unexplored? Tourism and Economic Growth of Bangladesh
73
In the last decade, the Government of Bangladesh has increased the budget (4.87 times increases from 2009 to 2018) in the tourism industry which has opened a new horizon of economic growth and development by the additional revenues from the tourism sector. Figure 2 discloses the tourism budget and revenue for the last decade (2009-2018).
Figure 2. Tourism Budget and Revenue in Bangladesh 2009-2018
ConclusionThis paper explores the potential of the tourism industry, and scrutinizes the effect
of the tourism industry on the overall economic advancement of Bangladesh by analyzing secondary data for eight years. Besides, it presents a detailed idea about the well-known as well as potential tourist spots and areas, tourism administration and tourism organizations, facilities (Visa, accommodation, safety in travelling and currency exchange) for the tourists, infrastructural development, and tourism education in Bangladesh. This paper also scrutinizes data regarding real GDP, tourism budget, tourism revenue, employment in the tourism sector through graphical analysis. This paper exposes that Bangladesh earned USD 1,153 million from its tourism industry during the 2009-2017 period, which is a small share of its GDP. This study summarizes that the small share of tourism revenue has a limited positive effect on the economic growth of Bangladesh at this moment. Though the tourism sector of Bangladesh suffers from a number of problems, it creates employment, innovation and new technology, technology transfer, new infrastructure, friendship among people, and above all, it helps the brand image of the country, which is “Beautiful Bangladesh.” Besides, tourism and hospitality management education is also very popular in Bangladesh. It can be said that the potentiality of the tourism sector is

JOURNAL of TOURISMOLOGY
74
not currently fully explored. If it flourishes smoothly, then it will reduce the revenue dependency on other sectors. This paper suggests the following steps to strengthen the torism sector of Bangladesh.
Ground Details Recommendation
Need a Long Run Vision
Bangladesh should make tourism vision for five to ten years to boost up tourism revenue & contribution to GDP. It may include 8%-10% revenue of
GDP (current figure 4.4% for travel and tourism), infrastructural development and beautification of the tourist spots, construction and renovation of tourist
sites, highways, naval bases, and aviation facilities.
Exploring the tourist spots
Bangladesh has a large number of magnificent tourist spots and locations, but these are not well known to the local and foreign tourists. The BPC may
publish books, booklets, handouts, stickers, images, videos (and make it available to the tourists) to make this site familiar to them (both internal and
foreign tourists).
Upgrading the government tourism
website
The BPC website is dedicated to tourism development, but it is not well updated. Highly qualified practitioners from the tourism field should be recruited into this Corporation. A complete list of all tourist sites is not
available on this website.
Promotion of tourism and hospitality
management education
A good number of facilities should be arranged for tourists. For foreign tourists: one-stop service visa facilities, tourist guide, safety and security in the spots, special rate in currency exchanges facilities, currency exchange facilities
in the tourist spots, tourist cards for discount and facilities, etc.
Employment opportunity in the
Tourism sector
Education of tourism and hospitality management is one of the most popular disciplines in Bangladesh. The BPC may encourage young job seekers to join in the tourism-related agencies by offering special facilities for the tourism
arrangement agencies.
BPC Sponsorship for Domestic Tourism
High schools and colleges need to be coordinated with the BPC and private tour associations to arrange for study tours for the students. It will train the
young generation with regards to tourism, which will boost up domestic tourism in the medium as well as the long term.
Infrastructural Development for the
Tourism Sector
Tourism sector of Bangladesh still suffers from the inadequate number of high-quality roads, especially for waterfalls, beaches, historical monuments in rural areas, etc. The authority should construct suitable roads and communication
system for both local and foreign tourists.
Building up a Strong Handicrafts Market
Bangladesh has a glorious tradition of exquisite handicrafts. People from several religions, caste, tribe and villages love to produce handicrafts. There is a vast possibility to build up a strong handicrafts market in the tourist spots of
Bangladesh.
Promote Festival-centered Tourism
Bangladesh has a rich heritage of diverse cultures, ethnicities, and a large range of festivals throughout the entire country during different points of time in
the year. If promoted and given support, festival-centered tourism has a bright prospect in this country. One most colorful of festivals is the Noboborsho
(Bangla New Year Festival), which is on April 14 each year, and every community across the country has its own ways of celebrating this Noboborsho
festival.
“Beautiful Bangladesh” is the official phrase of Bangladesh’s tourism industry sector. A large amount of investment from both the government as well as the business community, along with a properly formulated policy framework, is needed to explore the full potential of the tourism industry in Bangladesh.

Hossain, Wadood / Potential Unexplored? Tourism and Economic Growth of Bangladesh
75
Peer-review: Externally peer-reviewed. Conflict of Interest: The authors have no conflict of interest to declare.Grant Support: The authors declared that this study has received no financial support.
ReferencesAhmad, S. (2013, March 19). Tourism Industry in Bangladesh, The Daily Star, retrieved from:
https://www.thedailystar.net/news/tourism-industry-in-bangladeshAirways office (2019). Top 10 Travel Agency in Bangladesh, retrieved from: https://airwaysoffice.
com/top-10-travel-agency-in-bangladesh/Akan, Y., İbrahim, A., & Cem, I., (2007). The ımpact of tourism on economic growth: The case of
Turkey. Journal of Tourism, 9, 1–24.Ali, M. B. (2013). Socio-economic ımpacts of tourism development: An empirical study on Cox’s
Bazar. Asian Journal of Business and Management, 1(4), 205–211.Ali, A., Amin, S. B., & Momo, F. T. (2012). The Ethics of Tourism Development in Bangladesh,
Paper presented at the 18th Bangladesh Economic Association Biennial Conference, 13-14th September 2012, Dhaka, Bangladesh. retrieved from: bea-bd.org/site/images/pdf/new17/12.pdf
Amin, S. B., Murshed, M., & Rahman, S. (2017, February 8). Role of Rural Tourism Development in Bangladesh Economy, The Daily Sun, retrieved from: https://www.daily-sun.com/printversion/details/204066/Role-of-Rural-Tourism-Development-in-Bangladesh-Economy
Bangladesh Bureau of Statistics (BBS). (2019). Bangladesh Statistical Yearbook 2018, 38th Edition, P.35, Dhaka: Government of the People’s Republic of Bangladesh.
Bangladesh Economic Review (BER). (2019). Macroeconomic situation, P.1-30, Dhaka: Government of the People’s Republic of Bangladesh. Retrieved from: https://mof.portal.gov.bd/site/page/28ba57f5-59ff-4426-970a-bf014242179e/Bangladesh-Economic-Review
Bangladesh Porjoton Corporation (BPC). (2019). Lokkho o Uddessyho (in Bangla), retrieved from:http://www.parjatan.gov.bd/site/page/68c2d54a-112f-4804-8624-9180bf59df98/-
Bhuiyan, A. H., & Darda, A. (2018). Prospects and potentials of halal tourism development in Bangladesh. Journal of Tourismology, 4(2), 93–106. doi: 10.26650/jot.2018.4.2.0007
Camilleri, M. A. (2018). The Tourism Industry: An Overview, in Travel Marketing, Tourism Economics and the Airline Product, Cham, Switzerland: Springer Nature.
Centre for Economics and Business Research (CEBR). (2018). World Economic League Table 2019, A World Economic League Table with Forecasts for 193 Countries to 2033, Centre for Economics and Business Research. December 2018, 10th Edition , retrieved from: http://assetsds.cdnedge.bluemix.net/sites/default/files/welt-2019-full-report.pdf
Cetin, G. (2014). Sustaining tourism development through city tax: The case of Istanbul. E-review of Tourism Research, 11.
Choice for Economic and Investment Research (CEIC). (2019). Bangladesh Tourism Revenue. Retrieved from: https://www.ceicdata.com/en/indicator/bangladesh/tourism-revenue
Das, R. K., & Chakraborty, J. (2012). An evaluative study on tourism in Bangladesh. Research Journal of Finance and Accounting, 3(1), 84–95.
De Esteban, J., Cetin, G., & Antonovica, A. (2015). Theory of knowledge of tourism: A sociological

JOURNAL of TOURISMOLOGY
76
and epistemological reflection. Journal of Tourismology, 1(1), 2–15.Gökovali, U., & Bahar, O. (2006). Contribution of tourism to economic growth: A panel data
approach. Anatolia, 17(2), 155–167. doi: 10.1080/13032917.2006.9687184Gokovali, U. (2010) Contribution of tourism to economic growth in Turkey. Anatolia, 21(1), 139–
153. doi: 10.1080/13032917.2010.9687095Golden Bengal Tours. (2019). Tourism Infrastructure & Facilities in Bangladesh, retrieved from:
https://www.goldenbengaltours.com/tourism-infrastructure.phpKadir, N., & AbdKarim, M. Z. (2012). Tourism and economic growth in malaysia: Evidence from
tourist arrivals from asean-s countries. Economic Research EkonomskaIstraživanja, 25(4), 1089–1100. doi: 10.1080/1331677X.2012.11517550
knoema.com (2019), Bangladesh- Contribution of Travel and Tourism to GDP as a Share of GDP, retrieved from: https://knoema.com/atlas/Bangladesh/topics/Tourism/Travel-and-Tourism-Total-Contribution-to-GDP/Contribution-of-travel-and-tourism-to-GDP-percent-of-GDP
Kobra, M. K., Bhuiyan, K. H., & Zayed, N. M. (2018). Well and woes of tourism promotion in Bangladesh: Investment perspective. Academy of Accounting and Financial Studies Journal, 22(3), 1–8.
Mahboob, A. M., & Parvin, R. (2010). Strategic management of tourism sector in Bangladesh to raise gross domestic product: An analysis. AIUB Bus Econ Working Paper Series, No 2010-04, from: https://orp.aiub.edu/FileZone/abewp/orpadmin-2010-048589862668081/AIUB-BUS-ECON-2010-04.pdf
Ministry of Environment and Forests (MOEF). (2010). Climate Change and Tourism Industry in Bangladesh, Information Brief, project paper of the Ministry of Environment and Forests, Government of the People’s Republic of Bangladesh, Dhaka: Bangladesh. Retrieved from: https://www.iucn.org/sites/dev/files/import/downloads/tourism.pdf
Ohlan, R. (2017). The relationship between tourism, financial development and economic growth in India. Future Business Journal, 3(1), 9–22.
Planning Commission. (2015). Seventh Five Year Plan FY 2016- FY 2020, Accelerating Growth, Empowering Citizens, Final Draft, 11 November 2015, Dhaka : Bangladesh.
Puah, C. H., Jong, M. C., Ayob, N., & Ismail, S. (2018). The ımpact of tourism on the local economy in Malaysia. International Journal of Business and Management, 13(12), 151–157.
Rahman, S., & Chakma, J. (2018, December 14). Tourism Booming with Economy, The Daily Star, retrieved from: https://www.thedailystar.net/business/news/tourism-booming-economy-1673479
Rhaman, M. R. (2016). The Socio-economic Importance of Tourism and Its Impact on the Livelihood in South Asia Case Rangamati, Bangladesh, Bachelor`s Thesis,CentriaUniversity of Applied Sciences Degree Programme in Tourism, May 2016, retrieved from: https://www.theseus.fi/bitstream/handle/10024/116404/Rezaur_Rhaman.pdf?sequence=1&isAllowed=y
Roy, S. C., & Roy, M. (2015). Tourism in Bangladesh: present status and future prospects. International Journal of Management Science and Business Administration, 1(8), 53–61. doi: 10.18775/ijmsba.1849-5664-5419.2014.18.1006
Salam, R. (2014). Tourism & socio-economic development: Focus on Bangladesh, a destination country. International Journal of Business & Management (Toronto), 1(2), 88–98.
Sayeda, T. (2017). The effects of mass tourism: An evaluative study on Cox’s Bazar, Bangladesh.
Hossain, Wadood / Potential Unexplored? Tourism and Economic Growth of Bangladesh
77
IOSR Journal Of Humanities And Social Science (IOSR-JHSS), 22(5), 31–36.Stauvermann, P. J., Kumar, R. R. ., Shahzad, S. J. H., & Kumar, N. N. (2016). Effect of tourism on
economic growth of Sri Lanka: accounting for capital per worker, exchange rate and structural breaks, Economic Change and Restructuring Springer, 51(1), 49–68.
Sultana, S. (2016), Economic contribution of tourism ındustry in Bangladesh. Journal of Tourism, Hospitality and Sports, 22, 45–54.
Tourism (2019). InCambridge Academic Content Dictionary online, Cambridge University Press: Cambridge, UK. Retrieved from: https://dictionary.cambridge.org/dictionary/english/tourism
Tourism (2019a). In Collins Dictionary Online, retrieved from: https://www.collinsdictionary.com/dictionary/english/tourism
Tourism (2019b). In Merriam-Webster Online, retrieved from: https://www.merriam-webster.com/dictionary/tourism
Trading Economics (2019). Bangladesh GDP, retrieved from: https://tradingeconomics.com/bangladesh/gdp
The World Travel & Tourism Council (WTTC) (2009-2018), World Travel & Tourism Council report 2009-2018, retrieved from: https://www.wttc.org/economic-impact/country-analysis/country-data/
UNWTO- United Nation World Tourism Organization (2010), UNWTO Statistics Guidelines 2010, retrieved from: http://www.tugberkugurlu.com/archive/definintion-of-tourism-unwto-definition-of-tourism-what-is-tourism
Yahya, F., Parameswaran, A., Ahmed, I., & Sebastian, R. (2005). The economic cost of tourism in Maldives. Annals of Tourism Research, Tourism (Zagreb), 53(1), 33–44.

©The Authors. Published by the İstanbul University under the terms of the Creative Commons Attribution License http://creativecommons.org/licenses/by/4.0/, which permits unrestricted use, provided the original author and source are credited.
Journal of Tourismology, 6(1), 79-98
DOI: 10.26650/jot.2020.6.1.0011http://jt.istanbul.edu.en/
Submitted: 31.07.2019Revision Requested: 20.09.2019
Last Revision Received: 01.11.2019Accepted: 12.11.2019
Published Online: 07.02.2020R ES EA RC H A RT I C L E
Journal of Tourismology
1 Correspondence to: Serife Yazgan Pektas (Lec.), Bartın University, School of Advanced Vocational Studies, Department of Transportation Services, Bartın, Turkey. E-mail: [email protected] ORCID: 0000-0001-7467-6669
2 Azize Hassan (Prof.). Ankara Hacı Bayram Veli University, Faculty of Tourism, Department of Tourism Management, Ankara, Turkey. Email: [email protected] ORCID: 0000-0003-2509-1415
To cite this article: Yazgan-Pektas, S., & Hassan, A. (2020). The effect of digital content marketing on tourists’ purchase intention. Journal of Tourismology, 6(1), 79-98. https://doi.org/10.26650/jot.2020.6.1.0011
Serife Yazgan Pektas1 , Azize Hassan2
The Effect of Digital Content Marketing on Tourists’ Purchase Intention
AbstractThe purpose of this study is to reveal the effect of digital contents on tourists’ purchase intention using the persuasion knowledge model. For this purpose, data were collected by purpose sampling method between 25 December 2018 and 31 January 2019 with the approval of Bartin University Social and Humanities Ethics Committee. The obtained 105 data were analyzed. As a result of the analysis, it was found that there were significant positive relationships between tourists’ purchase intention, eWOM and suspicion sub-dimensions (reliability, disbelief). While the reliability of the sub-dimensions of the suspicion scale influenced eWOM and tourists’ purchase intention, it did not appear to have an impact on persuasive information. In addition to the negative correlation between persuasion and suspicion sub-dimensions, it was found that the sub-dimensions of suspicion did not affect persuasion.
KeywordsDigital content marketing, Persuasion knowledge model, Electronic word-of-mouth, Suspicion, Tourists’ purchase intention

JOURNAL of TOURISMOLOGY
80
IntroductionBoth the rapid progress of technology and the ease of accessing the internet
from anywhere via smartphones have increased the consumer’s interest in digital contents. Consumers act with suspicion towards information contained in digital contents, research from different sources and compare this information. Particularly by creating a difference in the digital platform where the competitive environment is intense, people try to attract consumers’ attention. In this context, the establishment of positive relations with the consumer has become inevitable. For this reason, the concept of suspicion towards digital contents is an important element. Skepticism about advertising was described by Obermiller & Spangenberg (1998) as the general tendency towards distrust of advertising claims, and assumed a fundamental market belief about persuasion and variability among individuals. They also stated that suspicion of advertising is an important element of consumer persuasion knowledge. In this context, digital networks encourage marketers and consumers to communicate and share information easily with eWOM. Therefore, if this information sharing is intended to persuade, the perceived value of consumers changes. Consequently, consumers create persuasion structures and these structures are fed with information over time to form a point of view. In this context, it is important to determine whether the tourists’ purchase intention is formed or not.
In this study, where digital contents are handled with Persuasion Knowledge Model, it is thought that individuals will provide important information especially when using digital contents. The main purpose of this study is to examine how digital contents are shaped to create purchasing intention with Persuasion Knowledge Model (PKM). The suspicion approach was evaluated based on the relationship between persuasive information, eWOM and intention to purchase. In the literature, authors have attempted to explain the concept of suspicion by the Elaboration Likelihood Model (ELM) or the Heuristic-Systematic Model (HSM) (Petty et al., 1981; Ritchie & Darke, 2000). In this study, a new perspective is introduced with the Persuasion Knowledge Model (PKM), which interprets the active consumer view with an inclusive approach. In addition, it was observed that the studies were mostly directed towards advertising in the related literature (Boush et al., 1994; Obermiller & Spangenberg, 1998; Obermiller & Spangenberg, 2000; Elpeze Ergeç, 2004).
Theoretical FrameworkIn the theoretical framework, digital content marketing, electronic word-of-mouth,
and persuasion knowledge model that tries to explain how the consumer decides which information to process and what to choose (Friestad & Wright, 1994) are included.

Yazgan Pektas, Hassan / The Effect of Digital Content Marketing on Tourists’ Purchase Intention
81
Digital Content MarketingIn the 1990s Web 1.0, Web 2.0 began to be used actively after the 2000s and Web
3.0 which is also called semantic web, was introduced after 2010. Web 4.0, which is an ultra intelligent electronic agent, is expected to be the digital travel companion that accompanies tourists who are constantly connected to the internet. With Web 4.0, it is stated that it can be communicated with as if talking to a friend to get information (Gelter, 2017: 8). Changes in digitalization and electronic media have led to development in factors such as information gathering, communicating with people, making decisions about traveling or giving up travel decisions and this has increased the importance of online and web resources (Singh & Bhatia, 2016). Such developments in the digital world attract more consumer attention. In this respect, Kotler et al. (2018: 167) defines content marketing as a marketing approach that aims to create interesting, useful content for the target audience, to distribute content and to comment on the content. Institutions or organizations can publish information about their products through different digital channels of Web 2.0, such as blogs, social networking sites, online videos and dictionaries, e-books, e-articles, smartphone and mobile application content. Consumers can learn about these products as well as share their ideas and experiences. In this context, content marketing is tactically measured in five categories as awareness, association, research-ability, action and sharing (Kotler et al., 2018: 182). As digital contents are important sources of information, it should be emphasized that future marketing approaches will be realized in digital environments, especially in social media and mobile environments (Stephen, 2016: 17). De Pelsmacker et al. (2018) stated that digital marketing strategies and tactics indirectly affect hotel performance along with the volume and value of online reviews. It is stated that this is more apparent in chain hotels than in independent hotels and in high-star hotels compared to low-star hotels. In the study in which Meydan Uygur et al. (2018) examined food and beverage businesses with analysis content method in terms of digital marketing, it is stated that the websites of food and beverage businesses are compatible with mobile devices, have up-to-date contact information and include brand experiences. In addition, it is stated that these businesses have links to their social media accounts on their websites so that customers communicate with each other and businesses communicate with customers. Therefore, consumer behavior in digital environments should be emphasized. In particular, it is important to focus on the behavior of women, young people who are influential elements of the digital age, and the so-called net people (Kotler et al., 2018: 59) who work to improve the Internet for the benefit of the world.
Electronic Word-of-Mouth Communication (eWOM) In marketing, the rapid spread of the internet has led to the transition from customer-
to-customer communication to digital networks, a form of traditional word-of-mouth

JOURNAL of TOURISMOLOGY
82
(WOM) to electronic word-of-mouth communication (eWOM) (Golan & Zaidner, 2008: 959). In particular, the rapid adaptation of new generations to innovations has enabled electronic word-of-mouth communication to gain importance (De Bruyn & Lilien, 2004). Electronic word-of-mouth communication (eWOM) is defined as all informal communication directed to consumers through internet-based technology related to the use, features or vendors of certain goods and services (Litvin et al., 2008). Stephen (2016) reviewed the studies published on consumers in digital and social media marketing environments and identified five themes: consumer digital culture, advertising, impact of digital environments, mobile and online WOM. The study found that the majority of available data focuses on online WOM, which is only part of the digital consumer experience. Digital networks encourage marketers and consumers to communicate and share information easily with eWOM. This has led many researchers to focus on eWom-related issues (Henning-Thurau et al., 2004; Çetin & Dinçer, 2014; Teng et al., 2014; Stephen, 2016; Teng et al., 2017), and studies focused more on resource reliability (Wu and Wang; Li & Zhan, 2011; Yoon, 2012). However, Ennew et al. (2000) stated that if the information comes from a reliable and credible person, word-of-mouth communication is effective in purchasing decisions. In the study conducted by Cova & Cova (2002), it was shown that comments made on the electronic media affect consumers more than traditional marketing activities and are found reliable by consumers. In addition, because managers think that the success of a product depends on word-of-mouth communication, managers give importance to this type of communication (Godes & Mayzlin, 2004: 545). Ismagilova et al.’s (2019) study identified the best, the most promising and the least effective predictors of intention to buy in eWOM research.
Persuasion Knowledge ModelThe Persuasion Knowledge Model demonstrates how consumers’ knowledge of
persuasion affects their response to attempts to be thus persuaded (Aytekin & Ay, 2015: 346). According to this model, at the same time as evaluating the opinions of the consumer about the goods or services, it also considers the reasons underlying persuasion attempts (Elpeze Ergeç, 2004). In this context, Friestad & Wright (1994: 1) have created a model of how people’s persuasion knowledge affects their responses to persuasion attempts. In the model, the consumer is defined as a target in the face of persuasion attempts and three knowledge structures are mentioned, namely subject knowledge, persuasion knowledge and agency knowledge (Friestad & Wright, 1994: 2). Subject knowledge includes opinions about the subject of the message to be delivered; persuasion knowledge includes actions to fully evaluate the message given to the consumer to develop attitude. Environmental and cognitive factors influence the development of persuasion knowledge (Aytekin & Ay, 2015: 353). The realization of the cognitive process improves persuasion knowledge and provides insight into

Yazgan Pektas, Hassan / The Effect of Digital Content Marketing on Tourists’ Purchase Intention
83
the consumer’s response to persuasion attempts; agency knowledge is defined as the party attempting to persuade the consumer. These three knowledge structures are used to evaluate the results of the persuasion attempt. Kachersky & Kim (2011) emphasize in their study on the persuasive status of all-inclusive pricing and segmented pricing that subject knowledge is important for pricing to be a persuading element. Here, the consumer focuses on what is important to them and while making a purchase decision, the consumer’s level of consciousness and awareness is considered by the agency. Campbell & Kirmani (2000) state that the cognitive capacity of the consumer and the ability of the agency to reach the secret intent are important in understanding the persuasion intention that underlies the behavior of sales personnel. The concept of persuasion is the channel most used by marketers to influence consumers. In this regard, many studies have been conducted in the literature about the persuasion knowledge model. Boush et al. (1994) handeled the knowledge of daily persuasion by focusing more on knowledge of persuasion tactics and their effects. Also Hardesty et al. (2007) measured contextual objective persuasion tactics with different scales and developed persuasion knowledge scale on pricing tactics (PTPK). In addition, Carlson et al. (2007) measured subjective knowledge with five items adapted from Brucks (1985), and found that the pricing tactic was effective in the relationship between subjective and objective knowledge.
Research Framework and HypothesesThe first hypothesis of the study focuses on the effect of suspicion toward digital
contents on persuasion knowledge. In their study of the effects of television commercials, Friestad & Wright (1995) introduced seven ideas, namely the difficulty of revealing emotions, necessity, impact, awareness, effectiveness, sequence, and the beginning. The difficulty of expressing emotions is related to the success of individuals in expressing their emotions; necessity shows how experienced emotions are necessary during the persuasion process; impact includes the effect of emotion on the purchase; awareness is about how individuals are aware of the psychological tactics they are exposed to; activity relates to how much individuals are used to evaluate the psychological effects of an advertisement to evaluate the overall effectiveness of the advertisement; sequence expresses the order of emotions that emerge during persuasion; the beginning is about the thoughts about whether the emotions are caused by external cause or internal cause. Bearden et al. (2001), on the other hand, considered the knowledge of persuasion as the trust of consumers against the persuasion tactics of marketers. However, Artz & Tybout (1999) stated that paying attention to the reliability of the agency does not always increase persuasion when attempting to persuade. Obermiller & Spangenberg (2000), in their study emphasized the consumer’s skepticism about the sources of information. They also stated that the suspicion of advertising is an important element of consumer persuasion knowledge (Obermiller & Spangenberg, 1998). In support of

JOURNAL of TOURISMOLOGY
84
this view, Elpeze Ergeç (2004), revealed that the consumer’s skepticism tendencies towards advertisements fall into two dimensions namely distrust of advertising claims and disbelief in information elements in advertising. In addition, Elpeze Ergeç (2004) emphasized that consumers are aware of the advertiser’s persuasion initiative and that there is no strong relationship between demographic characteristics and persuasion knowledge about the advertiser’s goals. In this direction, the first hypothesis of the research is as follows:
Hypothesis 1. There is a significant relationship between suspicion against digital contents and persuasion knowledge.
The second hypothesis in this study is the effect of suspicion on digital contents to electronic word-of-mouth communication. Since a certain persuasion tactic activates persuasion knowledge, which is not always consistent in consumers (Ham et al., 2015: 26). In this respect, the persuasion level of the information contained in the digital contents may cause a change in the behavior of consumers. This is because of the factors that shape the persuasion knowledge, such as social impact, personality traits, age and education which affect the consumer’s skepticism towards advertising (Obermiller & Spangenberg, 1998). Suspicion was expressed as a tendency of disbelief or lack of confidence in the actions of sellers. In particular, sharing experiences gained through the use of different tools of digital contents in online environments causes consumers to interpret this information and question it from other sources. Thus, these shares play an active role in consumers’ decision making. Two components are important here; the message given in the content and its format (Bird, 2016: 137). Particularly the shares differ in format in different digital media. For example, while photos and videos can only be shared on Instagram, there are photos and information on websites, and sometimes the same information can be seen as a blog post. In addition, with the increase of smart phones, social media tools are used more frequently in digital contents with the facilitating features of mobile applications. For this reason, all shares made in digital environment are important. In this respect, the second hypothesis of the research is as follows:
Hypothesis 2. There is a significant relationship between suspicion of digital contents and electronic word-of-mouth communication.
In the third hypothesis of the study, the effect of suspicion against digital contents on tourists’ purchase intention is investigated. Calfee & Ford (1988) claimed that consumers should believe in the accuracy of the information contained in advertising in order to understand the impact of advertising on consumers. Therefore, consumers may be skeptical about digital contents because they are afraid of being deceived. In addition, while Friestad & Wright’s (1994) study, which proposed the Persuasion Knowledge Model, evaluated consumers’ opinions about goods and services, it
Yazgan Pektas, Hassan / The Effect of Digital Content Marketing on Tourists’ Purchase Intention
85
was stated that they focused more on the causes of persuasion attempts. This raises suspicion, and the suspicion develops a defense mechanism for consumers to ensure that the information contained in the digital contents are correct or incorrect. Ford et al. (1990) found that they were skeptical about what was told about the products they had not experienced before, but their suspicions diminished over time. In this respect, the third hypothesis of the research is as follows:
Hypothesis 3. There is a significant relationship between the suspicion against digital contents and tourists’ purchase intention.
In the fourth hypothesis of the study, the effect of persuasion knowledge on tourists’ purchase intention is examined. Persuasion knowledge is seen as a necessary source for individuals to be aware of and evaluate the threats they may face in life and to make the right decisions (Aytekin & Ay, 2015: 360). Studies in the relevant literature using the Persuasion Knowledge Model reveal that advertisements are a more persuasive element (Ward, 1972; Friestad & Wright, 1995; Thompson & Malaviya, 2013). Xie et al.’s (2013) studies emphasized that consumers create a negative perception against the product and the product is not considered reliable when the sales intention is not explicitly stated. In this respect, the fourth hypothesis of the research is as follows:
Hypothesis 4. There is a significant relationship between persuasion knowledge and tourists’ purchase intention.
In the fifth hypothesis of the study, the focus is on the effect of electronic word-of-mouth communication on tourists’ purchase intention. Digital contents take online opinions of other consumers and checks their reliability from other sources for consumers before deciding whether to purchase goods or services. Similarly, the sharing of personal experiences and ideas provides important information about which product customers will buy or not (Picazo-Vela et al., 2010: 685). Teng et al. (2014) state that persuasive electronic word-of-mouth messages affect the acceptance of information. In addition, Teng et al.’s (2017) study emphasized that persuasive electronic word-of-mouth messages are a critical factor affecting the attitudes and behavior of Chinese and Malaysian users. In addition, Goldsmith & Horowitz (2006: 3) stated that consumers prefer to make the purchase decision because it reduces the perceived risk. In this respect, the fifth hypothesis of the research is as follows:
Hypothesis 5. There is a significant relationship between electronic word-of-mouth communication and tourists’ purchase intention.
The research model formed in line with the hypotheses of the research is shown in Figure 1. According to this model, suspicion against digital contents, persuasive knowledge and the effect of eWOM on purchasing intent are investigated.

JOURNAL of TOURISMOLOGY
86
Figure 1. Proposed conceptual model
Methodology
The purpose of this research is to determine effect of digital contents on tourists’ purchase intention with persuasion knowledge model. An attempt was made to determine the effect of the subjective evaluations of individuals against the information contained in the digital contents and the persuasion levels of the information contained in the digital contents on the tourists’ purchase intentions. The importance of digital contents have attracted the attention of researchers and many studies have been conducted in the literature (Stephen, 2016; Gelter, 2017; Meydan Uygur et al., 2018; De Pelsmacker et al., 2018). It is thought that this study, where digital contents are handled together with the persuasion knowledge model, will provide important information especially for individuals to develop a new perspective while using digital contents. In addition, the majority of studies in the field of persuasion knowledge model (Boush et al., 1994; Obermiller & Spangenberg, 1998; Obermiller & Spangenberg, 2000; Elpeze Ergeç, 2004) were observed to be related to advertising. In the literature, the concept of suspicion is explained by the Elaboration Likelihood Model (ELM) or the Heuristic-Systematic Model (HSM) (Petty & Cacioppo, 1981; Ritchie & Darke, 2000). In this study, a new perspective has been introduced with the Persuasion Knowledge Model (PKM), which interprets the active consumer view with an inclusive approach.
The field research of the study consists of a total of 549 academic personnel including 21 professors, 36 associate professors, 160 assistant professors, 124 lecturers and 177 research assistants who work in Bartın University (Bartın University, 2019). The study focuses on skepticism against digital contents, and since it is assumed that academics have more knowledge about digital contents depending on their educational background and their work, it is aimed to examine the academicians’ skepticism towards digital contents. However, reaching all academic personnel was impossible because of time,

Yazgan Pektas, Hassan / The Effect of Digital Content Marketing on Tourists’ Purchase Intention
87
difficulty in control and ethical obligations. In the study, an attempt was made to reach all the academicians while data was being obtained. Since sampling was attempted to be achieved in a particular place and at a given time (Kozak, 2014: 118), convenience sampling method was used. Data were collected between 25 December 2018 and 31 January 2019 with the approval of Bartın University Social and Humanities Ethics Committee. Individuals were asked to participate in survey voluntarily.
The questionnaire consists of two parts. In the survey, 8 closed ended expressions for demographic features of participants and 33 expressions on likert scale are included. In order to form the questionnaire, the scale developed by Obermiller & Spangenberg (1998), who included 21 statements to measure participants’ suspicion against digital contents, was used. We also used the scale developed by Van Reijmersdal et al. (2016), which included 4 statements to measure participants’ to purchase intention. In addition we used the scale developed by Vashisht & Royne (2016) containing 5 expressions for measuring persuasion knowledge 3 expressions for measuring electronic word-of-mouth communication were developed by Maxham & Netemeyer (2002) and were translated into Turkish. The control of the statements translated into Turkish was carried out by three academicians. Five point likert-type scale (1: Strongly disagree; 2: Disagree; 3: Neither agree nor disagree; 4: Agree; 5: Strongly agree) was used for measuring participation levels of in the expressions included in scale.
In order to measure the reliability and validity of the questions, 54 people were pre-tested. 33 expressions were included in the original survey form without any need to edit expressions because of not having difficulty in understanding them. The survey form was sent along with an introductory message to the e-mail addresses of 549 academic personnel working in Bartın University. The reason for sending the questionnaire via e-mail was to ensure that the questionnaire was completed in a controlled manner and in a relaxed environment, with the thought that the participants could answer the questions more carefully and diligently in a wider time. A total of 105 academics responded to the questionnaire which was sent to 549 academic personnel and all of them were evaluated. Appropriate sample size varied according to the objectives of the research and the existing limiting factors (Arıkan, 2004: 152). At the significance level of α = 0.05, ±0.10 sampling error was accepted. Sapnas (2004) claims minimum sample sizes including 100 and over data is enough.
Findings
Demographic and Descriptive Characteristics of the ParticipantsIn the study, the main focus was on the distribution of the participants according
to their demographic characteristics. Table 1 presents the distribution of participants according to their demographic and descriptive characteristics.

JOURNAL of TOURISMOLOGY
88
Table 1Demographic and Descriptive Characteristics of the Participants
n=105 %GenderFemale 46 43.81Male 59 56.19Age18-25 5 4.7626-34 41 39.0535-49 54 51.4350-64 5 4.76EducationBachelor 24 22.86Postgraduate Degree 26 24.76Doctoral Degree 55 52.38Marital statusMarried 76 72.38Single 29 27.62TitleLecturer 36 34.29Research Assistant 23 21.90Assistant Professor 33 31.43Associate Professor 5 4.76Professor 8 7.62Devices used in online shoppingSmartphone 51 48.57Computer 52 49.52Tablet 2 1.91Contents used in online shoppingPicture/ Photo 16 15.24Video 2 1.90Social media contents 7 6.67Blog contents 4 3.81e-mail contents 1 0.95Consumer-generated contents 32 30.48Corporate website contents 32 30.48Smartphone and mobile application contents 11 10.47The incentive of digital contents to online shoppingNevermore 3 2.86Rarely 13 12.38Sometimes 61 58.10Often 24 22.86Always 4 3.80
Of the 105 participants taking part in the study, 43.81% were women and 56.19% were men. It is seen that 51.43% of the participants are within an age range of between 35-49 and 72.38% are married. The educational level of the participants is at the doctoral level (52.38%) and their titles are Lecturer (34.29%). The participants stated

Yazgan Pektas, Hassan / The Effect of Digital Content Marketing on Tourists’ Purchase Intention
89
that the most commonly used device in their online shopping is a computer (49.52%). Following the computer, is the smartphone (48.57%) and tablet usage is 1.91%. The participants pointed out that they mostly benefited from consumer generated contents (30.48%) and corporate website contents (30.48%) in online shopping. The majority of the participants (58.10%) expressed that digital contents sometimes made them more willing in online shopping. Furthermore, 2.86% of the participants do not affect the willingness of digital contents in online shopping.
Findings Regarding Reliability and Validity of ScalesFactor analysis was applied to each scale separately to examine the construct
validity of the scales and reliability coefficient (Cronbach Alpha) was used to determine whether the scales used in the study were reliable. As a result of the reliability analysis, three expressions (Q1, Q5, Q14) in the suspicion scale (21 expressions) were excluded from the scale because they reduced the reliability of the scale. In addition, as a result of factor analysis, three expressions (Q10, Q15, Q17) in which one expression was loaded in each factor dimension were excluded from the scale. The reliability coefficient was 0.896 for the suspicion scale (15 expressions), 0.777 for the persuasion knowledge scale (5 expressions), 0.818 for the eWOM scale (3 expressions) and 0.906 for the tourists’ purchase intention scale (4 expressions). Lorcu (2015: 208) stated that the α coefficient was highly reliable between 0.80 and 1.00, and quite reliable between 0.60 and 0.80. When the reliability coefficients of the scales are examined, it is seen that the persuasion knowledge scale is quite reliable and the other scales are highly reliable.
Table 2Exploratory Factor Analysis Towards Variables (n=105)
FL C MeanReliability (eigenvalue: 6.316; % of variance: 42.108% Cronbach’s α=0.891; grand mean: 3.1377)Q2. Digital contents express facts well. 0.742 0.490 2.7238Q3. Digital contents are necessary. 0.648 0.477 3.6762Q6. I believe that digital contents are informative. 0.376 0.374 3.5429Q7. Digital contents are reliable information source about quality and perfor-mance of touristic product.
0.647 0.422 2.9143
Q9. Digital contents offer useful information about touristic product. 0.768 0.615 3.3619Q11. Digital contents offer actual image of touristic product introduced gen-erally.
0.656 0.348 2.9238
Q16. I feel that digital contents inform correctly. 0.759 0.500 2.9143Q18. Digital contents offer necessary basic information about touristic product. 0.595 0.486 3.2571Q19. I rely on accuracy of digital contents. 0.728 0.538 2.8952Q20. Digital contents are generally reliable. 0.735 0.553 2.9524Q21. Digital contents is a good way to get information about touristic product. 0.782 0.665 3.3524Disbelief (eigenvalue: 1.602; % of variance: %10.682 Cronbach’s α= .768; grand mean: 3.5214) Q4. Digital contents can significantly reduce the time that I spend on purchasing decisions.
0.402 0.438 3.7048

JOURNAL of TOURISMOLOGY
90
Q8. I tend to ignore digital contents. 0.703 0.586 3.4286Q12. I don’t get useful information from digital contents. 0.903 0.648 3.5905Q13. I think digital contents are distracting. 0.890 0.780 3.3619Persuasion Knowledge (eigenvalue: 2.689; % of variance : %53.778 Cronbach’s α= 0.777; grand mean: 3.6000)Q26. Digital contents try to take consumer in hand smartly in a way I don’t like. 0.706 0.498 3.3429Q27. I think touristic product offered in digital contents is tried to be sold. 0.842 0.709 3.7905Q28. I notice tricks used to introduce touristic products in digital contents. 0.544 0.296 3.4952Q29. I think digital contents clearly try to persuade to buy touristic product. 0.810 0.656 3.7429Q30. I am disturbed by the fact that digital contents try to keep consumer under control. 0.728 0.530 3.6286eWOM (eigenvalue: 2.200; % of variance: %73.337 Cronbach’s α=0.818; grand mean: 3.2540)Q31. It is likely form e to say positive things about touristic product that I saw in digital contents.
0.850 0.722 3.0095
Q32. I advise touristic product that I saw in digital contents to my relatives and friends. 0.893 0.797 2.9714Q33. If I think touristic product that I see in digital contents will be useful, I advise it to my friend.
0.825 0.680 3.7810
Tourists’ Purchase Intention (eigenvalue: 3.151; % of variance: %78.777 Cronbach’s α= 0.906; grand mean: 2.9429)Q22. I plan to buy touristic product offered in digital contents. 0.926 0.857 3.0857Q23. I intend to buy touristic product offered in digital contents. 0.912 0.832 2.9524Q24. I think of buying touristic product offered in digital contents. 0.934 0.873 3.0667Q25. I make an effort to buy touristic product offered in digital contents. 0.767 0.589 2.6667FL: Faktör Load; C: Communality
Exploratory factor analysis was carried out to test the construct validity of the expressions in the model (Figure 1). In order to determine the factor structure and to obtain meaningful factors, basic components analysis was selected, promax technique was used and the factor load of the expressions was over .30 (expected value> 0.30, Büyüköztürk, 2003: 119). Bartlett’s Test of Sphericity and Kaiser-Meyer-Olkin (KMO) Measure of Sampling Adequacy were performed to determine whether the data were suitable for factor analysis. When KMO (suspicion scale KMO=0.880; persuasion knowledge KMO=0.784; eWOM KMO=0.695; tourists’ purchase intention KMO=0.834) and Bartlett test (suspicion scale Bartlett: x2=681.129, p=.000; persuasion knowledge Bartlett: x2=145.370, p=.000; eWOM Bartlett: x2=111.537, p=.000; tourists’ purchase intention Bartlett: x2=314.483, p=.000) results are analyzed for each scale, it is seen that the sample is sufficient and there are relationships between the variables. The expressions of suspicion scale were gathered under two dimensions and the dimensions were named as reliability and disbelief. Obermiller & Spangenberg’s (1998) study, is similar to the number of dimensions.
Findings Related to Hypothesis TestingCorrelation analysis was performed to determine whether there is a relationship
between reliability of digital contents, disbelief in digital contents, persuasion knowledge, eWOM and tourists’ purchase intention. The analysis results are given in Table 3.

Yazgan Pektas, Hassan / The Effect of Digital Content Marketing on Tourists’ Purchase Intention
91
Table 3Correlations and Descriptive StatisticsVariables Mean SD CrA CR AVE 1 2 3 4 5Reliability 3.1377 0.53769 0.891 0.904 0.469Disbelief 3.5214 0.68738 0.768 0.828 0.565 0.536**
Persuasion knowledge 3.6000 0.62141 0.777 0.850 0.537 -0.211* -0.246*
eWOM 3.2540 0.76310 0.818 0.891 0.733 0.533** 0.373** -0.047Tourists’ purchaseintention 2.9429 0.74377 0.906 0.936 0.787 0.673** 0.386** -0.071 0.456**
SD: Standart Deviation; CrA: Cronbach’s Alphas; CR: Composite Reliability; AVE: Average Variance Extracted, **p<0.01, * p<0.05
When the relationships between the variables in Table 3 were examined, it could be said that there was a low level, positive and significant relationship between disbelief in digital contents (r(105)=.386 and p=.000) and eWOM (r(105)=.456 and p=.000) with tourists’ purchase intention. There was moderate, positive and significant relationship between tourists’ purchase intention and reliability of digital contents (r(105)=.673 and p=.000). Besides, there was low level, positive and significant relationship between eWOM variable and disbelief in digital contents (r(105)=.373 and p=.000). In addition, there was moderate, positive and significant relationship between eWOM and reliability of digital contents (r(105)=.533 and p=.000). While there was no significant relationship between tourists’ purchase intention and eWOM with persuasion knowledge variable (r(105)=-.071 and p=.473; r(105)=-.047 and p=.632), It was determined that there was a low level, significant and inverse relationship between persuasion knowledge variable with disbelief in digital contents (r(105)=-.246 and p=.011) and reliability variables in digital contents (r(105)=-.211 and p=.030). As the level of persuasion knowledge increases, the reliability of the digital contents and the credibility of the information contained in digital contents decreases. Moreover, while the persuasion knowledge variable had a higher mean (mean=3.6000) compared to the other variables, the tourists’ purchase intention variable was found to have a lower mean (mean=2.9429). Composite reliability (CR) and average variance extracted (AVE) were used for convergent validity. The values of CR exceeded the threshold, (0.70) (Domino & Domino, 2006), spreading between 0.828 (Disbelief) and 0.904 (Reliability). This implied that the items utilized in the survey were internally consistent and reliable. In order to obtain information about the validity of the measurement model of the research, AVE values should be examined. All values of AVE overpassed the recommended value, (.40 and above) (Hair et al., 2017: 138), dispersing between .469 (Reliability) and .787 (tourists’ purchase intention) values. To ascertain discriminant validity, the values of squared root of AVE and correlation were compared. The correlations were all smaller than the value of squared root of AVE, which showed an acceptable level of discriminant validity among the variables. As the model was well-fitted to the data and validities displayed proper levels, the hypotheses tests were conducted as a next step. Regression analysis was

JOURNAL of TOURISMOLOGY
92
performed to test the hypotheses of the study. The results of the regression analysis explaining the effect of the suspicion on persuasion knowledge are given in Table 4.
Table 4Linear Regression AnalysisIndependent Variables B SD ß t pReliability -0.128 0.131 -0.111 -0.982 0.328Disbelief -0.169 0.102 -0.187 -1.651 0.102R=0.264, R2=0.070, ΔR²=0.051, F=3.812, Durbin Watson=1.927, p=0.025***Dependent variable: Persuasion knowledge; SD: Standard deviation
The results of the analysis showed that the regression model was not significant and that the independent variable had no significant effect on the dependent variable. In this case, the first hypothesis of the study was not supported. Although it is stated that digital contents present the actual image of tourism product, it is seen that it is seen as a good way to obtain information about tourism product, it does not have any effect on persuasive knowledge.
Table 5Linear Regression AnalysisIndependent Variables B SD ß t pReliability 0.664 0.140 0.468 4.748 0.000Disbelief 0.135 0.109 0.122 1.238 0.218R=0.543; R2=0.295; ΔR²=0.281; F=21.331; Durbin Watson=2.071; p=0.000 ***Dependent variable: eWOM; SD: Standard deviation
When Table 5 was examined, it was seen that reliability (ß=.468, t=4.748, p=.000) had a significant and positive effect on eWOM. It was concluded that if the digital contents are a reliable source of information about tourism product quality and performance and the correct information is provided, the participants will share the information acquired with those around them. However, it was determined that disbelief in digital contents (ß=.122, t=1.238, p=.218) did not affect eWOM.
Table 6Linear Regression AnalysisIndependent Variables B SD ß t pReliability 0.905 0.120 0.654 7.544 0.000Disbelief 0.037 0.094 0.035 0.399 0.691R=0.673; R2=0.454; ΔR²=0.443; F=42.335; Durbin Watson=1.809; p=0.000***Dependent variable: Tourists’ purchase intention; SD: Standard deviation
When Table 6 was examined, it was stated that reliability of digital contents (ß=.654, t=7.544, p=.000) significantly and positively influenced participants’ purchasing intentions. It was seen that disbelief in digital contents (ß=.035, t=.399, p=.691) did not affect eWOM. It was concluded that although the participants tend to ignore the information contained in the digital contents and the digital contents are thought to be disturbing, it does not affect the tourists’ purchase intention.

Yazgan Pektas, Hassan / The Effect of Digital Content Marketing on Tourists’ Purchase Intention
93
Table 7Linear Regression AnalysisIndependent Variables B SD ß t pPersuasion knowledge -0.059 0.105 -0.049 -0.559 0.577eWOM 0.443 0.086 0.454 5.156 0.000R=0.459; R2=0.211; ΔR²=0.195; F= 13.617; Durbin Watson= 1.996; p=0.000***Dependent variable: Tourists’ purchase intention; SD: Standard deviation
According to the results of the regression analysis given in Table 7, it was determined that the variable of persuasion knowledge (ß=-.049, t=-.559, p=.577) did not affect the tourists’ purchase intention and the fourth hypothesis was not supported. eWOM (ß=.454, t=5.156, p=.000) was found to be significant and substantially determinant on tourists’ purchase intention. Accordingly, the fifth hypothesis of the study was supported. In this context, hypothesis test results are given in Table 8.
Table 8Results of Hypothesis Test of Research Model Hypotheses (ß) t-value p-value Result of HypothesisReliability → Persuasion knowledge -0.111 -0.982 0.328 Not supportedDisbelief → Persuasion knowledge -0.187 -1.651 0.102 Not supportedReliability → eWOM 0.468 4.748 0.000 SupportedDisbelief → eWOM 0.122 1.238 0.218 Not supportedReliability → Tourists’ purchase intention 0.654 7.544 0.000 SupportedDisbelief → Tourists’ purchase intention 0.035 0.399 0.691 Not supportedPersuasion knowledge → Tourists’ purchase intention -0.049 -0.559 0.577 Not supportedeWOM → Tourists’ purchase intention 0.454 5.156 0.000 Supported
Conclusion and DiscussionIn this study, the effect of digital contents on tourists’ purchase intention with the
persuasion knowledge model was examined. As a result of the study, it was found that the suspicion scale had a two-dimensional (reliability and disbelief) structure. In the study of Obermiller & Spangenberg (1998), suspicion was expressed in two dimensions as the tendency of sellers to disbelieve or not trust their actions. It was found that while the reliability of the sub-dimensions of the suspicion scale influenced eWOM and tourists’ purchase intention, it did not have effect on persuasion knowledge. However, there is a significant and inverse relationship between the sub-dimensions of the suspicion scale and persuasive knowledge. In this context, if digital contents were believed to be informative and reliable in its accuracy, they concluded that the tricks used to promote tourism products were not noticed and that the tourism products were not intended to be sold. Similarly, the lack of any useful information from the digital contents and the fact that the digital contents were considered to be uncomfortable showed that they were not attempted to persuade to buy tourism products. These results support the study of Elpeze Ergeç (2004). The study found that consumers were aware of the advertiser’s persuasion initiative and that there was no

JOURNAL of TOURISMOLOGY
94
strong relationship between demographic characteristics and persuasion knowledge of the advertiser’s goals. At the same time, Artz & Tybout (1999) stated that paying attention to the reliability of the agency does not always increase persuasion when attempting to persuade. Xie et al.’s (2013) studies, it is emphasized that when the sales intention is not explicitly stated, consumers create negative perception towards the product and the product is not reliable. It was found that disbelief, one of the sub-dimensions of the suspicion scale, had no effect on eWOM and tourists’ purchase intention. However, it was seen that there was a positive and significant relationship between eWOM and tourists’ purchase intention with the disbelief variable, one of the sub-dimensions of the suspicion scale. In this respect, it can be said that disbelief in the sub-dimensions of the suspicion scale constitutes a general idea in the formation of eWOM and tourists’ purchase intention among consumers, but it does not affect the tourists’ purchase intention and eWOM. One of the findings is that persuasive knowledge does not affect the tourists’ purchase intention. It can be said that digital contents do not have an impact on purchase intention expressions that contain persuasive knowledge such as trying to manipulate consumers in a way that they do not like, and disturbing the consumer by trying to control them by digital contents.
In the Persuasion Knowledge Model, different individuals constitute more or less a specific persuasion structure in their life experiences. In this respect, participants highlighted that they benefited from digital contents at different strategic points and at different periods of their lives. As a result of the research, it was determined that eWOM affects the tourists’ purchase intention. Sharing information that is deemed useful from digital contents with others affects consumers’ purchasing intentions. Teng et al. (2014) stated that persuasive electronic word-of-mouth messages affect the acceptance of information. Also in Teng et al.’s (2017) study, persuasive electronic word-of-mouth messages were found to be critical factors affecting attitudes and behaviors. Similar results were obtained in these studies. eWOM, as well as disseminating information, enables consumers to access information quickly. Therefore, easy access to the internet, increasing active use and saving time have made it inevitable to benefit from digital contents. For this reason, it is important for businesses and digital contents creators to provide honest, realistic and reliable information to attract consumers. Creating the right brand image in digital environments will ensure sustainable competitive advantage. Persuasion is one of the important concepts that form the basis of marketing. In this respect, insisting on direct sales is seen as a driving factor for consumers. Developing a consumer-oriented sales policy in digital environments will be more effective on consumers. Thus, the perception of digital contents as convincing for consumers will strengthen its recommendation to others through electronic word-of-mouth communication. In addition, the creation of consumer-oriented content will contribute to the benefit of consumers.

Yazgan Pektas, Hassan / The Effect of Digital Content Marketing on Tourists’ Purchase Intention
95
Participants mostly prefer computers and smart phones for online shopping. In this case, these devices may be easier to access and easy to use. Participants stated that they sometimes use digital contents in their online shopping and stated that they use content created by consumers and corporate website contents more than these contents. Shares such as photos/videos are encouraging and provide an incentive for the participants’ purchase intention. Thus, the perception that they are trying to be persuaded if they trust the digital contents decreases and it is seen that the digital contents affect the tourists’ purchase intention. The participants stated that they are not willing to do online shopping if they do not find the digital contents convincing.
One of the limitations of this research is that it was carried out only among academic personnel of Bartın University. Another limitation is that the sample size is limited and the use of sampling method according to the purpose causes the research results not to be generalized. That the Persuasion Knowledge Model should be dealt with by focusing on the process of using persuasion knowledge is suggested for future studies. At the same time, it is suggested that a cultural dimension should be added in order to make the results generalizable, and a study involving participants from many countries should be conducted.
Peer-review: Externally peer-reviewed. Conflict of Interest: The authors have no conflict of interest to declare.Grant Support: The authors declared that this study has received no financial support.
ReferencesArıkan, R. (2004). Araştırma teknikleri ve rapor hazırlama. Ankara: Asil Yayın.Artz, N., & Tybout, A.M. (1999). The moderating impact of quantitative information on the
relationship between source credibility and persuasion: A persuation knowledge model interpretation. Marketing Letters, 10(1), 51-62.
Aytekin, P., & Ay, C. (2015). İkna Bilgi Modeli in M.İ. Yağcı and S. Çabuk (Eds.), Pazarlama Teorileri (pp. 343-372). İstanbul: MediaCat.
Bartın University (2019). 2019 Yılı Performans Programı, https://cdn.bartin.edu.tr/w3/33a09c581e79b5bd6d9d739698ec97b5/2019-yili-performans-programi.pdf, 06.01.2019.
Bearden, W. O., Hardesty, D. M., & Rose, R. L. (2001). Consumer self-confidence: Refinements in conceptualization and measurement. Journal of Consumer Research, 28(1), 121-134.
Boush, D. M., Friestad, M., & Rose, G. M. (1994). Adolescent skepticism toward TV advertising and knowledge of advertiser tactics. Journal of Consumer Research, 21(1), 165-175.
Brucks, M. (1985). The effects of product class knowledge on information search behavior. Journal of Consumer Research, 12(1), 1-16.
Büyüköztürk, Ş. (2003). Sosyal bilimler için veri analizi el kitabı. Ankara: Pegem Yayıncılık.Calfee, J. E., & Ford, G. T. (1988). Economics, information and consumer behavior in M. J.

JOURNAL of TOURISMOLOGY
96
Houston (Ed.), Advances in Consumer Research Volume 15 (pp. 234-238), Provo, UT: Association for Consumer Research.
Campbell, M. C., & Kirmani, A. (2000). Consumers’ use of persuasion knowledge: The effects of acceppibility and cognitive capacity on perceptions of an influence agent. Journal of Consumer Research, 27(1), 69-83.
Carlson, J. P., Bearden, W. O. & Hardesty, D. M. (2007). Influences on what consumers know and what they think they know regarding marketer pricing tactics. Psychology and Marketing, 24(2), 117-142.
Çetin, G., & İstanbullu Dinçer, F. (2014). Electronic word of mouth among hotel guests: Demographic and tripographic factors. Bilgi Ekonomisi ve Yönetimi Dergisi, 9(2), 35-41.
Cova, B., & Cova, V. (2002). Tribal marketing: The tribalisation of society and it impact on the conduct of marketing. European Journal of Marketing, 36(5/6), 595-620.
De Bruyn, A., & Lilien, G. L. (2004). A multi-stage model of word of mouth through elektronic referrals. eBusiness Research Center Working Paper.
De Pelsmacker, P., Van Tilburg, S., & Holthof, C. (2018). Digital marketing strategies, online reviews and hotel performance. International Journal of Hospitality Management, 72, 47-55.
Domino, G., & Domino, M.L. (2006). Psychological Testing: An Introduction. Cambridge: Cambridge University Press.
Ennew, T. C., Bunerjee, A. K., & Li, D. (2000). Managing word of mouth communication: Empirical evidence from India. International Journal of Bank Marketing, 18(2), 75-83.
Elpeze Ergeç, N. (2004). Televizyon reklamlarına yönelik şüphe: İkna bilgi modelinin yorumlanması. Anadolu Üniversitesi Yayınları No: 1553, İletişim Yayınları No: 57. Eskişehir.
Ford, G. T., Darlene, B. S., & Swasy, J. L. (1990). Consumer skepticism of advertising claims: Testing Hypotheses from economics of information. Journal of Consumer Research, 16(4), 433-441.
Friestad, M. & Wright, P. (1994). The persuasion knowledge model: How people cope with persuasion attempts. Journal of Consumer Research, 21(1), 1-31.
Friestad, M., & Wright, P. (1995). Persuasion knowledge: Lay people’s and researchers’ beliefs about the psychology of advertising. Journal of Consumer Research, 22(1), 62-74.
Gelter, H. (2017). Digital tourism - An analysis of digital trends in tourism and customer digital mobile behaviour for the Visit Arctic Europe Project, http://www.lme.fi/media/vae-outcomes/rd-results/report-visit-arctic-europe-mission-3-summary-2.pdf, 06.01.2018.
Godes D., & Mayzlin D. (2004). Using online conversations to study word-of-mouth communication, Marketing Science, 23(4), 545-560.
Golan, G. J., & Zaidner, L. (2008). Creative strategies in viral advertising: An application of Taylor’s six-segment message strategy wheel. Journal of Computer-Mediated Communication, 13(4), 959-972.
Goldsmith, R. E., & Horowitz, D. (2006). Measuring motivations for online opinion seeking. Journal of Interactive Advertising, 6(2), 1-16.
Hair, J. F., Hult, G. T. M., Ringle, C. M., & Sarstedt, M. (2017). A Primer On Partial Least Squares Structural Equation Modeling (PLS-SEM) (Second Edition). Thousand Oaks: Sage.
Ham, C. D., Nelson, M. R. & Das, S. (2015). How to measure persuasion konowledge. International Journal of Advertising, 34(1), 17-53.

Yazgan Pektas, Hassan / The Effect of Digital Content Marketing on Tourists’ Purchase Intention
97
Hardesty, D. M., Bearden, W. O., & Carlson, J. P. (2007). Persuasion knowledge and consumer reactions to pricing tactics. Journal of Retailing, 83(2), 199-210.
Hennig-Thurau T., Gwinner, K. P, Walsh, G., & Gremler, D. D. (2004). Electronic word-of-mouth via consumer-opinion platforms: What motivates consumers to articulate themselves on the internet?. Journal of Interactive Marketing, 18(1), 38-52.
Ismagilova, E., Slade, E. L., Rana, N. P., & Dwivedi, Y. K. (2019). The Effect of electronic word of mouth communications on intention to buy: A meta-analysis. Information Systems Frontiers, 1-24.
Kachersky, L., & Kim, C. (2011). When consumers cope with price-persuasion knowledge: The role of topic knowledge. Journal of Marketing Management, 27(1), 28-40.
Kotler, P., Kartajaya, H. & Setiawan, I. (2018). Pazarlama 4.0 Gelenekselden Dijitale Geçiş. (Translated, Özata, N.) İstanbul: Optimist Yayın Grubu San. ve Tic. Ltd. Şti.
Kozak, M. (2014). Bilimsel Araştırma: Tasarım, Yazım ve Yayım Teknikleri. Ankara: Detay Yayıncılık.
Kuş, O. (2016). İçerik pazarlama-dijital dünyada marka ve hikaye yaratma stratejileri. İstanbul: Pales Yayınları.
Li, J., & Zhan, L. (2011). Online persuasion: How the written word drives WOM evidence from consumer-generated product reviews. Journal of Advertising Research, 51(1), 239-257.
Litvin, S. W., Goldsmith, R. E., & Pan, B. (2008). Electronic word-of-mouth in hospitality and tourism management. Tourism Management, 29(3), 458-468.
Lorcu, F. (2015). Örneklerle veri analizi SPSS uygulamalı. Ankara: Detay Yayıncılık.Maxham, J. G., & Netemeyer, R. G. (2002). A longitudinal study of complaining customers’
evaluations of multiple service failures and recovery efforts. Journal of Marketing, 66(4), 57-71.
Meydan Uygur, S., Sürücü, Ç. ve Sergen, Y. (2018). Yiyecek içecek işletmelerinin dijital pazarlama açısından incelenmesi. Ankara ili örneği. Güncel Turizm Araştırmaları Dergisi, 2(1), 157-176.
Obermiller, C., & Spangenberg, E. R. (1998). Development of a scale to measure consumer skepticism toward advertising. Journal of Consumer Psychology, 7(2), 159-186.
Obermiller, C. & Spangenberg, E. R. (2000). On the origin and distinctnepp of skepticism toward advertising. Marketing Letters, 11(4). 311-322.
Petty, R. E., Cacioppo, J. T., & Goldman, R. (1981). Personal involvement as a determinant of argument-based persuasion. Journal of Personality and Social Psychology, 41(5), 847-855.
Picazo-Vela, S., Chou S. Y., Melcher A. J., & Pearson, J. M. (2010). Why provide an online review? An extended theory of planned behavior and the role of big-five personality traits. Computers in Human Behavior, 26(4), 685-696.
Ritchie, R. J. B., & Darke, P. R. (2000). In the shadow of doubt: Advertiser deception and the defensive consumer. Poster Session Presented at the Association for Consumer Research Conference, Salt Lake City, UT.
Sapnas, K. G. (2004). Letters to the editor: Determining adequate sample size. Journal of Nursing Scholarship, 36(1), 4-9.
Singh, H., & Bhatia, J. (2016). Evaluation of official tourism websites of world’s leading tourist destinations using the balanced score-card approach. Journal of Tourismology, 2(1), 35-49.

JOURNAL of TOURISMOLOGY
98
Stephen, A. (2016). The role of digital and social media marketing in consumer behavior. Current Opinion in Psychology, 10, 17-21.
Teng S., Khong, K. W., Goh, W. W. & Chong, A. Y. L. (2014). Examining the antecedents of persuasive eWOM messages in social media. Online Information Review, 38(6), 746-768.
Teng, S., Khong, K. W., Chong, A. Y. L., & Lin, B. (2017). Persuasive Electronic Word-of-Mouth Messages in Social Media. Journal of Computer Information Systems, 57(1), 76-88.
Thompson, D. V., & Malaviya, P. (2013). Consumer-generated ads: Does awareness of advertising co-creation help or hurt persuasion? Journal of Marketing, 77(3), 33-47.
Van Reijmersdal, E. A., Fransen, M. L., Guda, V. N., Opree, S. J., Lisa, V., Sanne, R., Van Lieshout, Z. & Boerman, S.C. (2016). Effects of disclosing sponsored content in blogs: how the use of resistance strategies mediates effects on persuasion. American Behavioral Scientist, 60(12), 1458–1474.
Vashisht, D. & Royne, M. B. (2016). Advergame speed influence and brand recall: The moderating effects of brand placement strength and gamers’ persuasion knowledge. Computers in Human Behavior, 63, 162–169.
Ward, S. (1972). Children’s reactions to commercials. Journal of Advertising Research, 12(2), 37-45.
Wu P. C. S., & Wang, Y. C. (2011). The influences of electronic word-ofmouth message appeal and message source credibility on brand attitude. Asia Pacific Journal of Marketing and Logistics, 23(4), 448-472.
Xie, G. X., Boush, D. M., & Liu, R. R. (2013). Tactical deception in covertselling: A persuasion knowledge perspective. Journal of Marketing Communications, 21(3), 224-240.
Yoon, S. J. (2012). A social network approach to the influences of shopping experiences of e-WOM. Journal of Electronic Commerce Research, 13(3), 213-223.

©The Authors. Published by the İstanbul University under the terms of the Creative Commons Attribution License http://creativecommons.org/licenses/by/4.0/, which permits unrestricted use, provided the original author and source are credited.
Journal of Tourismology, 6(1), 99-109
DOI: 10.26650/jot.2020.6.1.0015http://jt.istanbul.edu.en/
Submitted: 05.04.2019Revision Requested: 06.06.2019
Last Revision Received: 25.09.2019Accepted: 12.10.2019
Published Online: 12.06.2020T H EO R E T I C A L A RT I C L E
Journal of Tourismology
1 Correspondence to: Buse Ceti (Ress. Asst.), Çanakkale Onsekiz Mart University, Tourism Faculty, Department of Accommodation Management, Çanakkale, Turkey. E-mail: [email protected] ORCID: 0000-0003-3136-1266
2 Kurban Unluonen (Prof. Dr.), Ankara Hacı Bayram Veli University, Tourism Faculty, Department of Tourism Management, Ankara, Turkey. E-mail: [email protected] ORCID: 0000-0002-4191-9019
To cite this article: Ceti, B., & Unluonen, K. (2020). Economic evaluation of health tourism in Turkey. Journal of Tourismology, 6(1), 99-109. https://doi.org/10.26650/jot.2020.6.1.0015
Buse Ceti1 , Kurban Unluonen2
Economic Evaluation of Health Tourism in Turkey
AbstractThe purpose of this study is to make an economic evaluation of health tourism by utilizing the number of tourists coming to Turkey in order to receive health care, and by taking the expenditures of these tourists into consideration. In the study, the data were obtained from secondary sources, mainly those that have been provided by Turkish Statistical Institute. A descriptive analysis was performed in this study. Within the study, it was determined that the number of tourists coming for health purposes and the share of health expenditures of tourists in total tourism income have increased over the years. Besides, it was seen that the average spending of tourists visiting Turkey for healthcare is much more than the average expenditure of all tourists.
KeywordsHealth, Tourism, Income, Expenditure, Turkey

JOURNAL of TOURISMOLOGY
100
IntroductionIt is known that individuals travel in order to protect or regain their health. Those
individuals, who wish to receive healthcare services in a country other than their own, have various motivations. For example, Jaapar, Musa, Moghavvemi, and Saab (2017: 540) listed these motivations for medical tourism within the scope of health tourism as follows: Cost-saving, timely service, combining medical care and holidays, cultural similarities, regulations relating to certain medical treatment or procedures (i.e. restricted, prohibited or unavailable), the quality of medical services, information availability and supporting services. Similarly, Aydın (2012: 93) stated that health tourism was spreading for reasons such as cost advantage, waiting lists, international travel becoming easier and economical, and that many countries provide healthcare services with high-level technology and at higher standards.
It is seen that an increasing number of tourists is involved in health tourism with different motivations. It can be said that Turkey has a significant potential due to having rich facilities in all types of health tourism. In order to analyze further, firstly, the current state of health tourism should be evaluated. The aim of this study is to evaluate health tourism in terms of the number of tourists coming for healthcare purposes and the amounts these tourists spend. In the present study, firstly, the concept of health tourism is explained, and types of health tourism are discussed. The method section describes how the data are obtained, and how they are evaluated. After presenting the findings of the study, it is completed with conclusions and recommendations.
Concept of Health TourismThe World Health Organization (2018) defines health, not only as mere absence
of disease or infirmity, but as a state of complete physical, mental and social well-being. Health is one of the major reasons that lead people to travel for touristic purposes. In its simplest definition, health tourism is defined as a type of tourism of which the main purpose is to protect or improve health (Szymanska, 2015: 1008). The Healthcare Tourism Coordination Committee (HTCC) defines health tourism as visits of individuals to a country other than their country of residence in order to receive preventive, therapeutic, rehabilitating and health promotion services (HTCC, 2018). According to the definition, it can be concluded that only the visits to another country to receive health care are considered within the scope of health tourism. However, it can be said that travels within the country should be included in the definition of health tourism as well. According to the World Tourism Organization and the European Travel Commission (2018: 63), “health tourism covers those types of tourism which have as a primary motivation, the contribution to physical, mental and/or spiritual health through medical and wellness-based activities which increase

Ceti, Unluonen / Economic Evaluation of Health Tourism in Turkey
101
the capacity of individuals to satisfy their own needs and function better as individuals in their environment and society.”
Health tourism has its own subsections. It can be seen that the Healthcare Tourism Coordination Committee sub-classified health tourism as thermal health tourism, third age tourism, disabled tourism and medical tourism (HTCC, 2018).
Thermal tourism is defined as “using waters with molten minerals for the purpose of relaxation, freshen up, treatment, etc.” (Kozak, Akoglan Kozak, & Kozak, 2015: 31). Thermal tourism is a type of tourism that can be seen throughout the year as an alternative to Turkey’s traditional sea, sand and sun tourism (Emir & Arslanturk, 2015: 566).
Third age tourism is defined as elderly people in need of care traveling to another country to meet their care needs (Ozsarı & Karatana, 2013: 140). Third age tourism is also referred to in the literature as elderly tourism, silver tourism, and senior tourism (Aydemir & Kılıc, 2017: 19).
The third type of health tourism is disabled tourism. Individuals with disabilities can participate in tourism activities with implementation of appropriate and adequate arrangements for them (Dogru, Kaygalak, Miral Cavdırlı, & Bahceci, 2014: 34). The participation of individuals with disabilities in tourism activities both enriches their lives and contributes to the tourism revenues of countries (Sahin & Erkal, 2012: 2).
One of the fastest-growing sectors within the scope of health tourism, however, is medical tourism (Heung, Kucukusta, & Song, 2011: 995). Medical tourists receive medical services abroad due to high costs, lack of insurance, long waiting times and domestically unavailable treatments (Chuang, Liu, Lu, & Lee, 2014: 49).
Health tourism, one of the oldest forms of tourism, dates back to ancient times, and since that time, society has been interested in finding some effective methods for maintaining health (Draghici, Diaconu, Teodorescu, Pintilii, & Ciobotaru, 2016: 387). Ridderstaat, Singh, and DeMicco (2018: 2) stated that health tourism had been practiced for thousands of years, dated back to Egyptians, Greeks and Romans, and that in those days, people had travelled to holy places to soothe and heal their spirits or to take advantage of warm thermal baths which had been thought to be good for the joints. Nowadays, it is possible to say, with technological developments, that individuals can travel easily to many different countries in order to get healthcare services, and that health tourism has a significant share in tourism revenues, in terms of the countries accepting tourists.
For 2015, the World Tourism Organization and the European Travel Commission (2018: 68-70) listed the countries that earned the highest income from health-related

JOURNAL of TOURISMOLOGY
102
international travel and spent the highest amounts for health-related international travel. Accordingly, for the year 2015, the United States was the country that earned the highest income from the health-related international travels and spent the highest amounts. In total, it generated USD 3,598 million as income, and spent USD 1,828 million. Turkey had the second ranking in terms of the highest income, and is followed by Jordan, France, Hungary, Republic of Korea, Thailand, Costa Rica, Belgium, Mexico, Czech Republic and India, respectively. In terms of expenditure, Kuwait ranks second, with USD 1,569 million. Kuwait is followed by Germany, Nigeria, Belgium, Canada, Oman and France, respectively. It is noteworthy that Turkey is not listed within the 25 countries with the highest expenditures, while ranking second in the list of the highest income. Brazil is at the bottom of the list with USD 32 million in terms of income, while Kazakhstan is at the bottom, with USD 35 million in terms of expenditures.
It can be said that many different factors play a role in the development of health tourism. These factors include the high added value of health tourism, presence of tourists who need high-quality health services with low cost, destinations willing to increase the foreign exchange input and continuous change due to the structure of the tourism sector (Bayın, 2015: 50). It is also stated by Loh (2015: 174) that unavailability or inaccessibility of health services in the domestic market is the major driving factor, and that health tourism seems to have gone through a major change in terms of the type of service sought and the demographic characteristics of consumers. Barca, Akdeve, and Gedik Balay (2013: 65) state that, while individuals with sufficient financial condition from developing and underdeveloped countries are traveling to developed countries, the direction of travel has changed because these countries can compete with developed countries due to developments in the field of medicine and lower charges in these countries. Aydın (2012: 93) states that, in the 21st century, patients go to places where the cost is lower and the waiting time is short for treatment purposes, and also adds that the most preferred countries are India, Cuba, Costa Rica, Thailand, Singapore, Colombia and the Philippines. It can be said that although low charges are important among the reasons that make these countries attractive for health care, tourists have many different motivations in selecting the country they will travel to for healthcare. For example, Jaapar, Musa, Moghavvemi, and Saub (2017) examined dental health tourism, and stated that the cost factor was the third most important factor in tourist motivations related to dental health services, after dental care quality and dental care information access. As a matter of fact, Dryglas and Salamaga (2018: 235) stated that despite them being relatively popular especially in developing countries, elite people were still traveling to expensive but reliable medical tourism destinations such as the United States, Switzerland, Germany and the UK, while medical tourism destinations within the scope of health tourism could be found in all continents.

Ceti, Unluonen / Economic Evaluation of Health Tourism in Turkey
103
Different organizations organize health tourism activities, which are preferred by tourists with various motivations. In Turkey, The Ministry of Culture and Tourism acts as a policymaker, guide and supervisor for businesses such as accommodation and travel establishments directly linked to the sector, and The Ministry of Health undertakes the establishment of healthcare institutions, training and recruitment of the necessary personnel and supervision of health care institutions (Altın, Bektas, Antep, & Irban, 2012: 158).
MethodIn this study, health tourism has been evaluated from the economic point of view,
considering the number of tourists and their spending amount for healthcare purposes in Turkey. For this purpose, data were obtained from secondary sources. Secondary data, defined as previously compiled data, allows researchers to conduct a rich study, whether crude or classified (Coskun, Altunısık, Bayraktaroglu, & Yıldırım, 2015: 76). In the study, statistics of tourism income by type of expenditure, and departing visitors by the purpose of visit were used as secondary sources provided by Turkey Statistical Institute (TURKSTAT). When statistics provided by TURKSTAT are analyzed, statistics of the departing visitor according to the purpose of visit start in 2003, and tourism income statistics according to the type of expenditure starts in 2002. For this reason, 2003 was taken as the starting point in terms of the number of visitors, and 2002 in terms of income.
The data collected within the scope of the research were subjected to a descriptive analysis. In the descriptive analysis, which provides the presentation of the findings obtained in an edited and interpreted way, firstly, the data are described systematically and clearly, and then, the descriptions are explained and interpreted, cause-effect relationships are revealed and some results are obtained (Yıldırım & Simsek, 2016: 239-240). In this study, data are presented as tables and evaluated, then, results are explained.
FindingsIt is known that many tourists travel within the tourism sector for healthcare
purposes. This study is conducted to determine the economic contribution of tourists traveling for healthcare purposes to Turkey. According to TURKSTAT data, the total number of incoming tourists to Turkey, and share of tourists traveling for health tourism and rates of increase in the number of tourists compared to the previous year, are given in Table 1.

JOURNAL of TOURISMOLOGY
104
Table 1Number of Tourists and Increase Rates
YearsTotal
Number of Visitors
Total Number of Visitors for
Healthcare Purpose Years
Percentage of Increase in the Total
Number of IncomingVisitors
Percentage of Increase in the Total Number of Visitors
for Healthcare PurposeNumber Percent
2003 16 302 048 139 971 0.862004 20 262 645 171 994 0.85 2004/2003 24.30 22.882005 24 124 504 220 338 0.91 2005/2004 19.06 28.112006 23 148 670 193 728 0.84 2006/2005 -4.04 -12.082007 27 214 986 198 554 0.73 2007/2006 17.57 2.492008 30 979 974 224 654 0.73 2008/2007 13.83 13.152009 31 972 377 201 222 0.63 2009/2008 3.20 -10.432010 33 027 941 163 252 0.49 2010/2009 3.30 -18.872011 36 151 327 187 363 0.52 2011/2010 9.46 14.772012 36 463 921 216 229 0.59 2012/2011 0.86 15.412013 39 226 226 267 461 0.68 2013/2012 7.58 23.692014 41 415 070 414 658 1.00 2014/2013 5.58 55.032015 41 617 530 360 180 0.87 2015/2014 0.49 -13.142016 31 365 330 377 384 1.20 2016/2015 -24.63 4,.782017 38 620 346 433 292 1.12 2017/2016 23.13 14.812018 45 628 673 551 748 1.21 2018/2017 18.15 27.34
Source: TURKSTAT, 2018
45,628,673 tourists visited Turkey in 2018, and 551,748 of these tourists came for health purposes. The number of tourists visiting Turkey was the highest in the year 2018. The highest number of incoming tourists for health purposes was in 2018. According to data, it can be said that there is an upward trend in the number of tourists and health-oriented tourists coming to Turkey. Using the data provided by TURKSTAT, the ratio of the number of tourists arriving for health purposes in the number of total tourists was calculated. It can be seen that the ratio of the number of incoming tourists for healthcare purposes in the total number of tourists was 0.86% in 2003, and this figure was 1.21% as of the end of 2018. The highest ratio of the number of tourists arriving for health purposes in the number of total incoming tourist was in 2018.
When the increase rate of the number of incoming tourists is examined, it is seen that the biggest decrease in the number of tourists occurred in 2016. However, it is observed that the number of tourists arriving dropped only in 2006 and 2016 from 2003 to 2018. The biggest increase was in 2004. It is seen that the number of tourists arriving increased the most in 2017 after 2004. This increase can be largely interpreted as an indication of recovery in the tourism sector after the number of tourist arrivals had a decline in 2016. When Table 1 is examined, it may seem as 2016 was the year when the biggest decline was observed, but 2016 was not the year when the number of tourists was the lowest. Similarly, it may seem that the biggest increase occurred in

Ceti, Unluonen / Economic Evaluation of Health Tourism in Turkey
105
2004, but 2004 was not the year when the number of tourists was the highest, because in Table 1, only the increase rate of the number of incoming tourists compared to the previous year is given.
When the rate of increase in the number of incoming tourists for healthcare purposes is examined, it is determined that the biggest increase was realized in 2014, and the biggest decrease was realized in 2010. In the same way, 2014 was not the year in which the highest number of tourists visiting Turkey for health purposes, and 2010 was not the year when the number of tourists visiting Turkey for health purposes was the lowest. Table 2 shows tourism incomes and the expenditure amount of tourists visiting for healthcare purposes and, in order to obtain more detailed information, increase rates of tourism incomes and health expenditures are provided as compared to the previous year. Table 2Tourism Incomes and Tourist Expenditures for Healthcare Purposes and Increase Rates
Years Tourism Incomes(Thousand $)
Expenditures for Healthcare Purposes
YearsPercentage of
Increase inIncome
Percentage of Increase in
Expenditures on Health
Quantity (Thousand $) Percent
2002 12 420 519 147 844 1.192003 13 854 868 203 703 1.47 2003/2002 11.55 37.782004 17 076 609 283 789 1.66 2004/2003 23.25 39.32 2005 20 322 110 343 181 1.69 2005/2004 19.01 20.93 2006 18 593 950 382 412 2.06 2006/2005 -8.50 11.43 2007 20 942 500 441 677 2.11 2007/2006 12.63 15.50 2008 25 415 067 486 342 1.91 2008/2007 21.37 10.11 2009 25 064 481 447 296 1.78 2009/2008 -1.39 -8.03 2010 24 930 996 433 398 1.74 2010/2009 -0.53 -3.11 2011 28 115 693 488 443 1.74 2011/2010 12.77 12.70 2012 29 007 003 627 862 2.16 2012/2011 3.17 28.54 2013 32 308 991 772 901 2.39 2013/2012 11.38 23.10 2014 34 305 904 837 796 2.44 2014/2013 6.18 8.40 2015 31 464 777 638 622 2.03 2015/2014 -8.28 -23.77 2016 22 107 440 715 438 3.24 2016/2015 -29.74 12.03 2017 26 283 656 827 331 3.15 2017/2016 18.89 15.64 2018 29 512 926 863 307 2.93 2018/2017 12.29 4.35
Source: TURKSTAT, 2018
Turkey achieved 29 billion 512 million dollars in tourism income in 2018. 863 million of this income was obtained from tourists visiting the country for healthcare purposes. It can be said that tourism incomes and expenditures of tourists visiting for healthcare purposes tend to increase generally in these years. When it is examined year by year, it is seen that the year in which tourism incomes were highest was 2014. In terms of the number of incoming tourists, 2018 was the year with the highest number of tourists. It was found that, while the number of incoming tourists was 4,213,603 less in 2014 compared to 2018, income was 4 billion 792 million more.

JOURNAL of TOURISMOLOGY
106
When the income obtained from incoming tourists for healthcare purposes is examined, it is seen that the highest income was obtained in 2018. The year 2018 has also been the year with the highest number of tourists visiting for healthcare purposes. Based on the data provided by TURKSTAT, the ratio of tourism expenditures for health-related tourists in the total tourism incomes were calculated by years. It can be seen that the ratio of tourist expenditures for healthcare purposes in total income was 1.19% in 2002, and this figure was 2.93% as of the end of 2018. While the number of incoming tourists for healthcare purposes and the amount of expenditure of these tourists were the highest in 2018, the highest ratio of tourist expenditures for health purposes in total tourism income was in 2016.
When examining the increase in the amount of income, it is realized that the biggest increase occurred in 2004, and the biggest decrease occurred in 2016. It is observed that the biggest increase in healthcare expenditures was in 2004, and the biggest decrease was in 2015. Although the biggest decline in tourism income was in 2016, compared to the previous year, a 12.03% increase in healthcare expenditures of tourists could be seen in 2016. Likewise, although there was a decrease in income in 2006, there was an increase of 11.43% in the amount of spending on healthcare expenditures.
The average spending amount of tourists was calculated (Table 1-Table 2) by considering the number of incoming tourists, the amount of income, the number of tourists visiting for healthcare purposes and the amount of these tourists’ expenditure. It is seen, that in terms of the average, the per capita expenditure of tourists traveling for healthcare was 1565 dollars in 2018. According to the total number of tourist arrivals and total tourism income, it is seen that the average tourist expenditure was 647 dollars for the year of 2018. Average tourist expenditure was the lowest in 2018, from 2003 until 2018. Table 3 shows a comparison between the average expenditure of tourists and the average expenditure of incoming tourists for healthcare purposes.

Ceti, Unluonen / Economic Evaluation of Health Tourism in Turkey
107
Table 3Average Expenditure Amount of Tourists
Years Average Expenditure of Incoming Visitors to Turkey ($)
Average Expenditure of Visitors For Healthcare Purposes ($)
2003 850 14552004 843 16502005 842 15582006 803 19742007 770 22242008 820 21652009 784 22232010 755 26552011 778 26072012 795 29042013 824 28902014 828 20202015 756 17732016 705 18962017 681 19092018 647 1565
Source: TURKSTAT, 2018
When the data are compared, it is seen that the average spending amount of incoming tourists for healthcare purposes is higher than the average expenditure of all incoming tourists. In this sense, it can be said that attracting more health tourists will make a significant contribution to the increase of tourism income.
Conclusions and RecommendationsBetter prospective plans can be prepared to identify and improve the current
situation. Therefore, in this study, health tourism in Turkey has been evaluated from an economic perspective, and the development of health tourism has been tried to put forward. As a result of the evaluation carried out in this direction, a number of findings on the amount of expenditure of tourists and the number of incoming tourists who visited Turkey for healthcare purposes are presented. It is seen that the number of tourists coming for healthcare purposes has increased by 294.19% from 2003 to 2018, and the share of health tourists within the number of tourists has increased by 40.70%. However, it has been determined that health expenditures have increased by 483.93% from 2002 to 2018, while the share of health expenditures in total income has increased by 146.22%. Accordingly, it can be said that demand for health tourism has increased in terms of Turkey.
Health tourists’ average expenditures have been found to be higher than the average expenditure of all tourists. For this reason, it would be beneficial to increase initiatives in terms of the sector for increasing the number of tourists visiting for health purposes.

JOURNAL of TOURISMOLOGY
108
Turkey ranking second in the list of highest income for health-related international travels indicates that tourists have different motivations to visit Turkey for healthcare purposes. Therefore, within the scope of future academic studies, firstly, profiles of health tourists visiting Turkey should be found. It could be determined which health tourism activities tourists are visiting for, with what motivations they come to Turkey. At the same time, the expectations and experiences of the tourists can be identified and compared.
This study has some limitations. This study only evaluated health tourism in terms of Turkey and within the scope of Turkey, the assessment has been made only about the tourists coming from abroad to Turkey. In terms of domestic tourism, no evaluation has been made regarding the tourists participating in health tourism in this study. However, citizens and foreigners have not been evaluated separately in terms of incoming tourists to Turkey. The evaluations are based on the total number of tourists, including foreigners and citizens. Accordingly, health tourism can be evaluated in terms of domestic tourism in future studies, citizens and foreigners coming to Turkey can be handled separately.
Peer-review: Externally peer-reviewed. Conflict of Interest: The authors have no conflict of interest to declare.Grant Support: The authors declared that this study has received no financial support.
ReferencesAltın, U., Bektas, G., Antep, Z., & Irban, A.(2012). Medical tourism and Turkish marketing for
international patients. Acıbadem Üniversitesi Sağlık Bilimleri Dergisi, 3(3), 157‒163. Aydemir, B., & Kılıc, S. N. (2017). Third age tourism in Turkey and in the world. Yüzüncü Yıl
Üniversitesi Sosyal Bilimler Enstitüsü Dergisi, 1(3), 1‒11.Aydın, O. (2012). An alternative tourism in Turkey; Health tourism. KMU Journal of Social and
Economic Research, 14(23), 91‒96. Barca, M., Akdeve, E., & Gedik Balay, I. (2013). Strategic analysis of medical tourism in Turkey
and strategy recommendations. Journal of Business Research, 5(3), 64‒92.Bayın, G. (2015). Content assessment of the graduate thesis about health tourism in Turkey. KMU
Journal of Social and Economic Research, 17(28), 49‒55.Chuang, T. C., Liu, J. S., Lu, L. Y. Y., & Lee Y. (2014). The main paths of medical tourism: From
transplantation to beautification. Tourism Management, 45, 49‒58.Coskun, R., Altunısık, R., Bayraktaroglu, S. and Yıldırım, E. (2015). Sosyal bilimlerde araştırma
yöntemleri: SPSS uygulamalı. Sakarya: Sakarya Kitabevi. Dogru, H., Kaygalak, S., Miral Cavdırlı, C., & Bahceci, V. (2014). E-Complaints of disabled
individuals against the tourism service. Gazi Üniversitesi Turizm Fakültesi Dergisi, 2, 33‒47.
Draghici, C. C., Diaconu, D., Teodorescu, C, Pintilii, R., & Ciobotaru, A. (2016). Health tourism contribution to the structural dynamics of the territorial systems with tourism functionality. Procedia Environmental Sciences, 32, 386‒393.

Ceti, Unluonen / Economic Evaluation of Health Tourism in Turkey
109
Dryglas, D., & Salamaga, M. (2018). Segmentation by push motives in health tourism destinations: A case study of Polish spa resorts. Journal of Destination Marketing & Management, 9, 234‒246.
Emir, O., & Arslanturk, Y. (2015). Perceptions of tourism students on thermal tourism in Afyonkarahisar. Procedia - Social and Behavioral Sciences, 176, 565‒570.
Heung, V. C. S., Kucukusta, D., & Song, H. (2011). Medical tourism development in Hong Kong: An assessment of the barriers. Tourism Management, 32(5), 995‒1005.
HTCC. (2018). What is health tourism? Retrieved from http://www.saturk.gov.tr/tyst.phpJaapar, M., Musa, G., Moghavvemi, S., & Saub, R. (2017). Dental tourism: Examining tourist
profiles, motivation and satisfaction. Tourism Management, 61, 538‒552.Kozak, N., Akoglan Kozak, M., & Kozak, M. (2015). Genel turizm. Ankara: Detay Yayıncılık. Loh, C. A. (2015). Trends and structural shifts in health tourism: Evidence from seasonal time-
series data on health-related travel spending by Canada during 1970-2010. Social Science & Medicine, 132, 173‒180.
Ozsarı, S. H., & Karatana, O. (2013). Health tourism situation in Turkey. J Kartal TR, 24(2), 136‒144.
Ridderstaat, J., Singh, D., & DeMicco, F. (2019). The impact of major tourist markets on health tourism spending in the United States. Journal of Destination Marketing & Management, 11, 270‒280.
Sahin, H. ve Erkal, S. (2012). Ortopedik ve görme engelli bireyler için konaklama tesislerinde yapılması gereken düzenlemeler. Hacettepe Üniversitesi Sosyolojik Araştırmalar Dergisi, 1‒14.
Szymanska, E. (2015). Construction of the model of health tourism innovativeness. Procedia - Social and Behavioral Sciences, 213, 1008‒1014.
TURKSTAT 2018. Tourism statistics. Retrieved from http://www.turkstat.gov.tr/PreTablo.do?alt_id=1072
World Health Organization. (2018). Constitution. Retrieved from http://www.who.int/about/mission/en/
World Tourism Organization and European Travel Commission. (2018). Exploring Health Tourism. Madrid: UNWTO.
Yıldırım, A. ve Simsek, H. (2016). Sosyal bilimlerde nitel araştırma yöntemleri. Ankara: Seçkin Yayıncılık.


Journal of Tourismology, 6(1), 111-132
DOI: 10.26650/jot.2020.6.1.0012http://jt.istanbul.edu.en/
Submitted: 31.07.2019Revision Requested: 20.09.2019
Last Revision Received: 01.11.2019Accepted: 12.11.2019
T H EO R E T I C A L A RT I C L E
Journal of Tourismology
1 Correspondence to: Serife Yazgan Pektas (Lec.), Bartın University, School of Advanced Vocational Studies, Department of Transportation Services, Bartın, Turkey. Email: [email protected] ORCID: 0000-0001-7467-6669
2 Kurban Unluonen (Prof. Dr.), Ankara Hacı Bayram Veli University, Tourism Faculty, Department of Tourism Management, Ankara, Turkey. E-mail: [email protected] ORCID: 0000-0002-4191-9019
To cite this article: Yazgan-Pektas, S., & Unluonen, K. (2020). The evaluation of tourism in Turkey in terms of ınflation. Journal of Tourismology, 6(1), 111-132. https://doi.org/10.26650/jot.2020.6.1.0012
Serife Yazgan Pektas1 , Kurban Unluonen2
The Evaluation of Tourism in Turkey in Terms of Inflation
AbstractThe purpose of this study is to reveal the relationship between inflation and tourism performance in Turkey using descriptive analysis. In the study, consumer price index (CPI) was examined in the light of numbers of tourist arrivals between 2004 and 2018, tourism income, average spending per person, average overnight stays, and inflation. Data was gathered from the Turkish Statistical Institute (TSI) and the Central Bank of the Republic of Turkey (CBRT). It was determined that inflation rises regionally in the tourist season because tourism has a seasonal characteristic. Our study shows that inflation was the highest between 2004 and 2018 and that although tourism demand increased in 2017 and 2018, tourism income, average spending per person and the number of average overnight stays decreased. In addition, it may be said that the amount of average spending per person by foreign tourists also decreased. In this case, it should be taken into consideration that not only inflation but also factors such as the global economic crisis, the fact that tourists who spend little (apart from on accommodation) prefer Turkey, and the fact that tourists do not have enough information about available tourist products affected the results of this study.
KeywordsInflation, Consumer price index (CPI), The number of tourist, Tourism income, Average spending, Average overnight
This work is licensed under Creative Commons Attribution-NonCommercial 4.0 International License

JOURNAL of TOURISMOLOGY
112
IntroductionInflation, which is as old as market economies (Bagus and Howden, 2011) and
which is regarded as one of the most important issues in regards to the economy, has become a topic that is on the agenda of world economies along with globalization. Inflation can result from financial situations such as increasing of the amount of money in the market, government spendings and bank loans, rising fees and salaries, and government policy of keeping the prices of agricultural products high. Similarly, decrease in demand launched onto the market, working with deficient capacity because of a lack of raw material and foreign currency can also cause inflation (İçöz, 1991: 21). As well as reducing the purchasing power of countries, an atmosphere of uncertainty creates inflation and makes it difficult for countries to make decisions on economic matters (Gündoğdu, 2015: 208). In this respect, the struggle with inflation has great impact on economic growth and price stability (Taban and Şengür, 2016: 48). The presence of price instability forms an insecure environment (İçöz, 1991: 21), and thus, consumers and producers behave with caution against investing (Gürkan, 1997: 189) and spending (Gündoğdu, 2015: 209).
Tourism contributes to balance of payments and especially to narrowing the foreign trade deficit (Çımat and Bahar, 2003: 2). In addition, tourism, which provides foreign currency resources at both regional and national levels, affects inflation due to the increase in the price of tourist products which are also affected by inflation. An increase in prices with rising costs (cost inflation), being created of the expectation that inflation will rise, and the expectation that high inflation will continue due to its having been high in the past may also give rise to inflation (expectation inflation) (CBRT, 2004: 5). Furthermore, an increase in prices when supply does not meet demand (CBRT, 2004: 4) may lead to inflation which is one the most significant concerns of developing countries. The relationship between the tourism sector and inflation has been a research subject in studies before (Atay Kayış and Aygün, 2016; De Esteban et al. 2015; Ilgaz Yıldırım et. al., 2017; Shaari et. al., 2018). The above-mentioned studies focused on the effect of inflation on total tourism income and the number of tourists. In this study, inflation and tourism performance data (total number of tourists, total tourism income, average overnight stay, average expenditure per person, number of foreign and citizentourists, tourism income of foreign tourists, average overnight stay of foreign and citizens tourists, average expenditure per tourist) were examined and an evaluation was made. In the study, the relationship between inflation and the tourism sector is discussed.
MethodologyThe purpose of this study is to reveal the relationship between inflation and
tourism performance in Turkey using descriptive analysis. The data were obtained
Serife Yazgan Pektas, Kurban Unluonen / The Evaluation of Tourism in Turkey in Terms of Inflation
113
from secondary sources. In the study, consumer price index (CPI) statistics, border statistics and departing visitor statistics were used as the secondary source provided by the Turkish Statistical Institute (TSI) and the Central Bank of the Republic of Turkey (CBRT). The data which were collected between 2004 and 2018 show CPI, which expresses inflation, and tourism income, number of tourists, average expenses per capita and average overnights. The study uses these data to show the relationship between inflation and tourism. The data collected within the scope of the research were subjected to descriptive analysis. In the descriptive analysis, the data directly quoted were arranged and defined by creating a frame. Organized and defined data were interpreted, the relationship between them was revealed and some results were obtained (Yıldırım & Şimşek, 2011). In this study, the data are presented and explained in tables and graphs on a monthly-yearly basis.
The Concept of InflationInflation occurs due to a situation of constant increase in prices of all properties or
services (Kelvin, 2010: 402), and the subsequent decrease in purchasing power of the currency (Gürkan, 1997: 186). In defining the concept of inflation, both an increase in prices and a decrease in the purchasing power of currency are prominent points. In addition, the said increase in prices not only refers to specific properties and services, but also covers cases of increase in the total of properties and services in general. Especially after the collapse of the Bretton Woods system, the monetary policy began to become more prominent due to changes in the financial system. This case caused central banks to come to the forefront and central banks determined price stability as the most important target for themselves (Tatlıyer, 2016: 2). From this point of view, due to the Asian crisis in the 1990s and other regional crises, inflation has become uncontrollable, and in order to struggle with inflation, some countries (first New Zealand followed by Canada, England, Armenia, the Czech Republic, Hungary and Poland) have begun to change over to an inflation targeting implementation policy (Gündoğdu, 2015: 208). Turkey changed over to an inflation targeting policy in 2006. Inflation targeting is the central bank’s attempt to keep inflation at a numerically certain value (Bernanke and Mishkin, 1997: 8). Especially in developed countries, inflation has shown a similar pattern between those countries changing over to an inflation targeting policy and those which have not changed. As of 2013, while average inflation has been 1.78% in 12 developed countries changing over to an inflation targeting policy, the inflation rate has been 1.62% in 35 developed countries which have not changed over to such a policy. In developing countries, the rate is 6% (in 137 countries) and 4.69% (in 16 countries) respectively. When examining these rates of inflation, whether a country is developed or developing plays a more determinative role rather than whether it implements an inflation targeting policy or not (Gündoğdu, 2015: 217).

JOURNAL of TOURISMOLOGY
114
Price index shows at which rate prices change according to a certain starting date (Kelvin, 2010: 402). The inflation rate is measured with exchange ratio in price index which is equal to multiplying the ratio between the current year price of a property of a certain dimension and the base year price of the same sized property with 100 (Şimşek, 1998). Price index is explained in two parts, namely consumer price index (CPI) and producer price index (PPI). CPI indicator is used more and the reason for this is the fact that the public is familiar with the term and t data is easily obtainable (Alparslan and Ataman Erdönmez, 2000: 7). Turkey has been divided according to 12 basic spending groups such as food and non-alcoholic drinks, alcoholic beverage and tobacco, clothing and shoes, housing, household goods, health, transportation, communication, entertainment and culture, education, restaurant and hotels, various properties and services (TSI, 03.12.2018).
Table 1Effect of Basic Spending Groups on Monthly and Annually Exchange Ratio in General Index (%) December 2018
Basic Spending Groups
Significance of Spending
Group
Exchange ratio
according to the previous
month
Exchange ratio according to
the same month of the previous
year
Monthly effect of basic
spending groups on exchange
Annually effect of basic
spending groups on exchange
Indexfigures
Turkey 100.00 -0.40 20.30 -0.40 20.30 393.88Food and Non-Alcoholic Drinks 23.03 1.08 25.11 0.25 5.78 454.64
Alcoholic Beverage and Tobacco 5.14 0.16 2.39 0.01 0.12 605.52
Clothing and Shoes 7.21 -4.08 14.83 -0.29 1.07 253.89Housing 14.85 -0.06 23.73 -0.01 3.52 443.54Household Goods 7.66 0.13 31.36 0.01 2.40 339.77Health 2.64 0.62 16.70 0.02 0.44 228.10Transportation 17.47 -2.56 15.97 -0.44 2.79 378.82Communication 3.91 -0.11 9.62 0.00 0.38 147.74Entertainment and Culture 3.39 -0.25 20.86 -0.01 0.71 269.64
Education 2.67 0.02 10.19 0.00 0.27 357.45Restaurants and Hotels 7.27 0.31 19.81 0.02 1.44 578.07
Various Properties and Services 4.76 0.78 28.80 0.04 1.37 507.12
Source: TSI (26.01.2019)
A decrease of 40% occurred in CPI in December 2018 compared to the previous month while an increase of 20.30% occurred compared to the same month of the previous year. However, in December 2018 compared to the previous month, an increase of 1.08% in food and non-alcoholic drinks, 0.16% in alcoholic drinks and tobacco, 0.13% in household goods, 0.62% in health, 0.02% in education, 0.31 in restaurants and hotels and 0.78% in various properties and services occurred, a

Serife Yazgan Pektas, Kurban Unluonen / The Evaluation of Tourism in Turkey in Terms of Inflation
115
decrease of 4.08% in clothing and shoes, 0.06% in housing, 2.56% in transportation, 0.11% in communication, 0.25% in entertainment and culture took place.
The annual ratios of percentage exchange of price index published by TSI, CBRT and World Bank are listed on Table 2. According to data of World Bank, while inflation was around 12 percent all over the world in 1981, it reduced 7% in 1989, and 3% in 1999. In 2008 the global inflation rate was 8.95%, and in 2017, it occurred at a level of 2.18% (World Bank, 2019). Global situations such as the depression after World War I in 1920s, the World Economic Crisis between 1929 and 1939, World War II in 1945, post-war transformation between 1946 and1950, the Korean War between 1950 and1953, the Vietnam War between 1965 and1973, the fight against inflation between 1981 and1989, the new economic model in the early 2000s, and the global crisis occurring in 2008 have affected inflation worldwide. World annual inflation rate was at level of 2% along with small changes after 2008.
Table 2Annual Change of Turkey and World Consumer Price Index According to Years (%)
Turkey World
CPI (Annual % Change) CPI (Annual % Change)2004 9.35 3.3832005 7.72 4.1072006 9.65 4.2672007 8.39 4.812008 10.06 8.952009 6.53 2.9442010 6.40 3.3472011 10.45 4.8392012 6.16 3.7822013 7.40 2.6132014 8.17 2.2942015 8.81 1.4322016 8.53 1.4722017 11.92 2.1872018 20.3 2.466
Sources: CBRT, TSI, World Bank (15.11.2019)
According to data of TSI, the inflation rate was at an average level of 7.4% in Turkey between 1951 and1970. Especially in 1960s, it occurred at a level of 5%. An increase started in the inflation rate after the 1970s, and the inflation rate was at an average level of 42% in the 1970s and 1980s. Inflation went up to very high level (77.2%) between 1990 and 1999 (TSI, 2019).

JOURNAL of TOURISMOLOGY
116
Table 3Annual Change of Consumer Price Index According to Months (%)
Jan. Feb. Mar. Apr. May Jun. Jul. Aug. Sep. Oct. Nov. Dec.2004 10.59 9.48 8.4 7.87 7.31 7.08 7.79 8.45 8.01 9.43 9.47 9.352005 9.23 8.69 7.94 8.18 8.7 8.95 7.82 7.91 7.99 7.52 7.61 7.722006 7.93 8.15 8.16 8.83 9.86 10.12 11.69 10.26 10.55 9.98 9.86 9.652007 9.93 10.16 10.86 10.72 9.23 8.6 6.9 7.39 7.12 7.7 8.4 8.392008 8.17 9.1 9.15 9.66 10.74 10.61 12.06 11.77 11.13 11.99 10.76 10.062009 9.5 7.73 7.89 6.13 5.24 5.73 5.39 5.33 5.27 5.08 5.53 6.532010 8.19 10.13 9.56 10.19 9.1 8.37 7.58 8.33 9.24 8.62 7.29 6.42011 4.9 4.16 3.99 4.26 7.17 6.24 6.31 6.65 6.15 7.66 9.48 10.452012 10.61 10.43 10.43 11.14 8.28 8.87 9.07 8.88 9.19 7.8 6.37 6.162013 7.31 7.03 7.29 6.13 6.52 8.3 8.88 8.17 7.88 7.71 7.32 7.42014 7.75 7.89 8.39 9.38 9.66 9.16 9.32 9.54 8.86 8.96 9.15 8.172015 7.24 7.55 7.61 7.91 8.09 7.2 6.81 7.14 7.95 7.58 8.1 8.812016 9.58 8.78 7.46 6.57 6.58 7.64 8.79 8.05 7.28 7.16 7 8.532017 9.22 10.13 11.29 11.87 11.72 10.9 9.79 10.68 11.2 11.9 12.98 11.922018 10.35 10.26 10.23 10.85 12.15 15.39 15.85 17.9 24.52 25.24 21.62 20.3
Source: TSI (01.02.2019)
Although the inflation rate decreased to one digits between 2004 and 2007, it went up to two-digits (10.06%) with the effect of the world global crisis in 2008. While the inflation rate was 6% from 2009 to 2010, it went up to two-digits (10.45%) again in 2011. Inflation was calculated as an average 7.81% between 2012 and 2016. It rose to two-digits again in 2017. Inflation rates have shown a constant upward trend after March 2018. The inflation rate after September 2018 rose over 20%, but in October 2018 it was 25.24%. This rate is the highest rate in recent years. This case can be explained by the fact that the increase occurring since August 2018 has reflected prices with delay. Consumer inflation decreased 20.3% in the last month in 2018. The implemented strict monetary policies, retreatment of oil and commodity prices, tax deduction in certain products (CBRT, 2019), overall fight program against inflation have become effective for inflation to decrease in the short term. However, obvious recovery has not yet been achieved.

Serife Yazgan Pektas, Kurban Unluonen / The Evaluation of Tourism in Turkey in Terms of Inflation
117
Graph 1. Comparison of Consumer Price Index by Months between 2004 and 2018 in Turkey
Graph 1 shows a decrease in CPI figures which increases in some months and reduce in other months at a certain level from January to June and this occurs in the annual exchange ratio generally in the months between June and August when the summer season starts. Therefore, in the summer months in which tourism is at a peak, the fact that inflation goes down is worthy of mention. But, due to the increase in demand, regional inflation may be mentioned because prices have increased regionally. However, if tourists turn to a variety of products according to their age, gender, occupation, family status, income, tastes and lifestyle, there will be no price increase in all of the requested goods and services (Ünlüönen et al., 2018: 192).
Tourism Inflation RelationshipThe effect of tourism on inflation emerges as a result of the simultaneous growth
of both demand inflation and production costs (Ünlüönen and Tayfun, 2016: 209) and investment-demand imbalance (İçöz, 1991: 20). Prices of real estate and premises increase in the tourism season because of general price increases, purchasing power reduction, and residents hiring or paying more taxes. This situation causes inflationist pressure (Erdoğan, 1996). Moreover, while indispensable, flimsy consumer goods are affected by inflationist pressure, replaceable goods are not affected very much (İçöz, 1991: 20).
The fact that tourism incomes have an important role in national economy and the question of whether or not there is an interaction with inflation, being a social concept, have attracted the attention of researchers and studies related to this have begun to be conducted (Ilgaz Yıldırım et. al., 2017; Atay Kayış and Aygün, 2016; Aktaş, 2005; İçöz, 1991). Ilgaz Yıldırımet. al. (2017) determined that there is a long-term relation

JOURNAL of TOURISMOLOGY
118
between inflation and tourism incomes, but that there is no relation between variables in the short term. They also stated that inflation affects tourism incomes negatively. Atay Kayış and Aygün (2016) stated that there is no real effect in terms of casualty relationship between inflation and tourism income, and it was seen in the variance analysis carried out that tourism income and inflation variables explain each other at very low levels. Moreover, i in Wu and Li’s study (2012) which examined the relation between growth and inflation on Hainan Island, it was determined that there is a relationship between tourism and inflation in the long term. In the study conducted by Shaari et. al. (2018) in which consumer price index and data of the number tourists between 1986 and 2014 were studied, it was emphasized that the tourism sector plays an important role in the determination of inflation both in the short term and in the long term and therefore governments should take proactive precautions to determine whether any growth in the tourism sector can prevent inflation. In the study that Foon Tang (2011) conducted, it was expressed that long-term unemployment, inflation and the number of tourists caused crime rate to increase. Coppin (1993) stated that tourism activities are an important determinative for inflation.
Table 4Consumer Price Index of Countries Attracting Tourists at Most in World (%)
China France Germany Italy Thailand Mexico Spain UK USA Turkey
2004 3.82 2.14 1.67 2.21 2.8 4.69 3.04 1.39 2.68 8.602005 1.78 1.75 1.55 1.99 4.5 3.99 3.37 2.09 3.39 8.182006 1.65 1.68 1.58 2.09 4.6 3.63 3.52 2.46 3.23 9.602007 4.82 1.49 2.30 1.83 2.2 3.97 2.79 2.39 2.85 8.762008 5.93 2.81 2.63 3.35 5.50 5.12 4.08 3.52 3.84 10.442009 -0.73 0.09 0.31 0.77 -0.80 5.30 -0.29 1.96 -0.36 6.252010 3.18 1.53 1.10 1.53 3.20 4.16 1.80 2.49 1.64 8.572011 5.55 2.11 2.08 2.78 3.81 3.41 3.20 3.86 3.16 6.472012 2.62 1.95 2.01 3.04 3.01 4.11 2.45 2.57 2.07 8.892013 2.62 0.86 1.50 1.22 2.18 3.81 1.41 2.29 1.46 7.492014 1.92 0.51 0.91 0.24 1.90 4.02 -0.15 1.45 1.62 8.852015 1.44 0.04 0.23 0.04 -0.90 2.72 -0.50 0.37 0.12 7.672016 2.00 0.18 0.48 -0.09 0.19 2.82 -0.20 1.01 1.26 7.782017 1.59 1.03 1.74 1.23 0.67 6.04 1.96 2.56 2.13 11.142018 2.07 1.85 1.93 1.14 1.06 4.90 1.68 2.29 2.44 16.33
Source: IMF (03.02.2019)
Table 4 shows rates calculated considering a twelve-month consumer price index average according to IMF data of the countries shown. When examining a comparison of consumer price index of the countries that most attract tourists according to years on Table 4, it may be expressed that the inflation rate is low in developed countries. It was determined that average consumer price indexes of France (1.33%), Germany (1.48%), Italy (1.56%) and Spain (1.87%) between 2004 and 2018 are under 2%. Considering the 2008 consumer price index, it may be said that countries were

Serife Yazgan Pektas, Kurban Unluonen / The Evaluation of Tourism in Turkey in Terms of Inflation
119
affected by the global economic crisis. In 2009, inflation rates reduced significantly compared to the previous year in countries except for Mexico. Turkey is observed to be among countries in which inflation rates are high.
Table 5Tourist Numbers of Countries Attracting Tourists at Most in the World According to Years (Million)
China France Germany Italy Thailand Mexico Spain UK USA Turkey2004 41.761 75.121 20.137 37.071 11.737 20.618 52.430 27.754 46.084 20.2632005 46.809 75.908 21.500 36.513 11.567 21.915 55.914 28.039 49.206 24.1252006 49.600 79.083 23.569 41.058 13.882 21.353 58.451 30.654 51.063 23.1492007 54.720 80.853 24.420 43.654 14.464 21.370 58.666 30.871 55.979 27.2152008 53.049 79.218 24.886 42.734 14.584 22.637 57.192 30.142 57.937 30.9802009 50.875 74.200 24.224 43.239 14.145 21.454 52.231 28.033 54.884 32.0062010 55.665 77.648 26.875 43.626 15.936 23.290 52.677 28.296 60.010 33.0282011 57.581 81.552 28.352 46.119 19.230 23.403 56.177 29.306 62.711 36.1512012 57.725 83.018 30.408 46.360 22.354 23.403 57.701 29.282 66.969 36.4642013 55.686 83.634 31.545 47.704 26.547 24.151 60.675 31.064 69.995 39.2262014 55.622 83.701 33.005 48.576 24.810 29.346 64.939 32.613 75.022 41.4152015 56.886 84.452 34.972 50.732 29.881 32.093 68.215 34.436 77.510 41.6182016 59.270 82.700 35.595 52.372 32.588 35.079 75.315 35.814 76.407 31.3652017 60.740 86.918 37.452 58.253 35.381 39.298 81.786 37.651 76.941 38.6202018* 62.900 89.400 38.881 62.146 38.277 41.447 82.773 36.316 79.618 45.629
Source: UNWTO (03.02.2019); UNWTO (18.11.2019) * Provisional figure
Table 5 shows tourist numbers of countries attracting themost tourists in the world according to years. In terms of tourist numbers, France is located at the top. It is followed by Spain, USA and China. Table 6 shows tourism incomes of countries attracting the most tourists in the world according to years.
Table 6Tourism Incomes of Countries Attracting Tourists at Most According to Years (000 $)
China France Germany Italy Thailand Mexico Spain UK USA Turkey2004 25.739 40.841 27.668 35.656 10.034 10.796 45.248 28.221 74.547 17.0772005 29.296 42.276 29.173 35.398 9.591 11.803 47.970 30.675 81.799 20.3222006 33.949 42.910 32.760 38.129 12.423 12.177 51.115 33.695 85.694 18.5942007 37.233 54.273 36.038 42.651 16.669 12.852 57.645 38.602 96.896 20.9432008 40.843 56.573 40.021 45.727 18.173 13.289 61.628 36.028 109.976 25.4152009 39.675 49.398 34.709 40.249 15.901 11.275 53.177 30.038 93.917 25.0642010 45.814 57.059 34.679 38.786 20.104 11.992 54.641 33.978 137.010 24.9312011 45.814 54.512 38.869 43.000 27.184 11.869 59.892 35.069 115.552 28.1162012 48.464 53.697 38.114 41.185 30.092 12.739 55.916 36.373 126.214 29.0072013 51.664 56.562 41.279 43.912 41.780 13.949 62.637 41.624 177.484 32.3092014 105.380 58.150 43.321 45.488 38.423 16.208 65.111 46.539 191.325 34.3062015 114.109 45.920 36.867 39.449 44.553 17.734 56.526 45.464 204.523 31.4652016 44.432 54.531 37.455 40.246 48.792 19.650 60.503 47.906 206.902 22.1072017 32.617 60.681 39.823 44.233 57.477 21.333 67.964 51.211 210.747 26.2842018* 40.386 67.370 42.977 49.262 63.042 22.510 73.765 51.882 214.468 29.513
Source: TSI (26.01.2019); UNWTO (03.02.2019); UNWTO (18.11.2019)* Provisional figure

JOURNAL of TOURISMOLOGY
120
The country whose tourism income is the highest is USA. It is followed by Spain, France and Thailand. Although it is not located on the top in terms of tourist numbers, USA’s getting the most income is a remarkable factor. Even though France is placed at the top in terms of tourist numbers, it is ranked 3th in terms of tourism income. Although the numbers of tourists coming to England is low compared to the countries on Table 6, it takes an important share in terms of the income it gets. Thailand is ranked 4th in 2016-2017 in terms of tourism income although its tourism demand is low compared to other countries. Mexico is the country whose tourism income is the least among other countries.
Table 7Turkey’s Tourism Performance and CPI between 2004 and 2018
Number of Departing Visitors
(million)
Tourism Income(000 $)
Average Expenses Per Capita ($)
Average Number of Overnights CPI (%)
2004 20.263 17.077 843 10.7 9.352005 24.125 20.322 842 10.4 7.722006 23.149 18.594 803 12.0 9.652007 27.215 20.943 770 11.3 8.392008 30.980 25.415 820 11.0 10.062009 32.006 25.064 783 11.2 6.532010 33.028 24.931 755 10.8 6.402011 36.151 28.116 778 11.0 10.452012 36.464 29.007 795 10.8 6.162013 39.226 32.309 824 10.2 7.402014 41.415 34.306 828 10.0 8.172015 41.618 31.465 756 10.1 8.812016 31.365 22.107 705 11.4 8.532017 38.620 26.284 681 10.9 11.922018 45.629 29.513 647 9.9 20.3
Source: TSI (26.01.2019); CBRT, TSI (15.11.2019)
Table 7 shows the total number of tourists entering Turkey, tourism income, average spending per person and the number of average overnight stays. In the tourism sector, not only the number of tourists entering the country within the year but also the amount of gained income is important. In this respect, although there are small changes in the examined periods, increase and decrease of tourism incomes show parallelism with numbers of tourists entering the country between 2004 and 2014. In the years after 2014, tourism income and tourist numbers did not show a simultaneous increase. The situations affecting this are that Turkey’s recognition as a cheap country increased and thus it became the preferred tourism choice by a low-income group. Graph 2 shows the comparison of tourism revenue, consumer price index and number of tourists.

Serife Yazgan Pektas, Kurban Unluonen / The Evaluation of Tourism in Turkey in Terms of Inflation
121
Graph 2. Comparison of CPI, Total Tourism Income and Number of Departing Visitors between 2004 and 2018 in Turkey
(Note: The left axis is tourism income and number of departing visitors series, the right axis is the axis of inflation series.)
Graph 2 shows that there are fluctuations in the inflation rate by years, but inflation is not a direct determinant of the total number of tourists and tourism income.
Graph 3. Comparison of Average Expenses per Capita, Average Number of Overnights and CPI between 2004-2018 in Turkey
(Note: The left axis is average expenses per capita series, the right axis is the axis of inflation and average number of overnights series.)
Graph 3 shows the comparison of average expenses per capita, number of overnight stays and CPI between 2004 and 2018 in Turkey. In the light of the amount of average spending per person and CPI rate, a decrease after 2014 is seen. A significant change in the time of average overnight stays is not seen among years. In particular,

JOURNAL of TOURISMOLOGY
122
the inflation rate in 2018 was the highest since 2004, and the average per capita expenditure and average number of overnight stays were at the lowest level. Despite the increase in the number of tourists and tourism income, average expenditure per capita decreased in these years. It can be said that the rise in the inflation rate also affected this situation.
Table 8Total Number of Tourist Arrivals by Months between 2004-2018 in Turkey
Jan. Feb. Mar. Apr. May Jun. Jul. Aug. Sep. Oct. Nov. Dec.
2004 776.493 671.579 850.450 1.118.261 1.696.312 1.932.218 2.525.427 3.436.520 2.823.724 2.337.510 1.174.213 919.9342005 960.696 777.537 1.117.340 1.351.782 2.181.170 2.353.311 3.073.718 4.002.939 3.201.087 2.704.246 1.359.041 1.041.6322006 961.975 752.435 1.021.400 1.392.730 1.870.470 2.278.204 3.007.073 3.997.000 3.135.379 2.226.270 1.347.781 1.157.9542007 1.048.926 922.186 1.221.195 1.576.592 2.222.123 2.689.096 3.535.458 4.649.749 3.685.704 2.771.875 1.618.703 1.273.3802008 1.172.736 1.073.986 1.478.744 1.677.867 2.769.178 3.175.128 4.138.652 5.298.575 3.917.099 3.186.698 1.762.312 1.329.0052009 1.151.951 1.057.976 1.426.537 1.824.721 2.656.507 3.261.081 4.218.369 5.491.275 3.989.011 3.515.977 1.945.675 1.467.0702010 1.133.655 1.105.749 1.513.316 1.875.486 2.952.864 3.545.058 4.450.459 5.145.381 4.265.936 3.639.656 2.002.607 1.397.7782011 1.331.253 1.261.709 1.805.273 2.279.409 3.265.347 3.793.320 4.967.182 5.139.322 4.884.766 3.860.053 2.151.034 1.412.6602012 1.374.401 1.209.064 1.635.696 2.231.943 3.194.547 3.896.971 4.953.266 5.384.021 5.099.835 3.836.383 2.154.009 1.493.7852013 1.466.128 1.415.328 1.892.370 2.418.962 3.717.734 4.131.081 4.791.585 5.930.881 5.335.184 4.294.6462.234.267 1.598.0592014 1.575.399 1.523.245 1.967.114 2.573.139 3.863.883 4.530.079 4.952.404 6.635.627 5.495.982 4.293.279 2.264.373 1.740.5462015 1.762.004 1.564.925 2.017.645 2.626.663 3.775.013 4.349.675 5.244.965 6.748.708 5.415.322 4.161.806 2.236.998 1.713.8072016 1.691.287 1.517.504 1.898.762 2.049.238 2.749.648 2.696.149 3.482.544 4.565.837 4.014.930 3.190.334 1.879.625 1.629.4712017 1.568.344 1.432.342 1.844.076 2.278.538 3.095.282 3.489.572 5.032.488 6.323.888 5.306.888 3.913.759 2.293.847 2.041.3232018 2.045.341 1.806.822 2.270.019 2.870.569 3.790.524 4.406.894 5.712.975 7.052.433 6.021.357 4.791.439 2.679.420 2.180.881
Source: TSI (02.12.2019)Note: Monthly tourism data before the revision between 2004 and 2011 were accessed.
Table 8 shows the total number of tourist arrivals by months between the years 2004 and 2018 in Turkey. There was an increase in the number of tourists between the months of April and October when the tourism season started. Graph 4 shows a comparison of tourist arrivals by months between the years 2004 and 2018 in Turkey.
Graph 4. Comparison of the Tourist Arrivals by Months between 2004 and 2018 in Turkey
The graph shows that the number of tourists declined in 2016 compared to other years. The reason for the decreased number of tourists in 2016 was due to the Syrian

Serife Yazgan Pektas, Kurban Unluonen / The Evaluation of Tourism in Turkey in Terms of Inflation
123
civil war and related geopolitical risks in the region and the increase of security concerns after the attack in Turkey.
Table 9Total Tourism Receipts by Months between 2004 and 2018 in Turkey (000 $)
Jan. Feb. Mar. Apr. May Jun. Jul. Aug. Sep. Oct. Nov. Dec.2004 602.045 502.895 608.034 773.147 1.164.860 1.331.924 2.154.390 3.023.864 2.482.890 1.729.276 856.104 658.2702005 689.539 547.523 756.662 860.424 1.400.417 1.499.980 2.602.469 3.453.346 2.762.394 1.899.391 943.918 737.4412006 721.701 548.592 731.338 937.468 1.244.569 1.510.904 2.356.097 3.162.449 2.518.483 1.450.099 887.632 781.6162007 727.443 624.345 810.785 920.958 1.269.784 1.536.613 2.582.508 3.404.423 2.745.277 1.855.004 1.134.933 874.9342008 885.472 800.964 1.089.843 1.052.667 1.692.125 1.948.415 3.054.319 3.995.011 2.938.647 2.261.537 1.269.634 962.1732009 798.687 722.308 945.578 1.021.414 1.444.132 1.777.999 2.906.793 3.805.708 2.805.708 2.466.201 1.441.776 1.104.9212010 735.469 721.358 956.697 1.044.281 1.600.640 1.913.929 2.741.035 3.197.707 2.636.147 2.684.864 1.516.808 1.057.7722011 933.488 909.268 1.257.515 1.315.174 1.874.845 2.182.170 3.096.033 3.198.256 3.044.739 2.683.655 1.505.237 1.020.0132012 1.128.718 1.038.923 1.356.781 1.718.082 2.402.636 2.945.297 3.553.776 3.808.867 3.692.444 3.764.026 2.107.761 1.489.6912013 1.450.971 1.383.654 1.814.191 1.951.501 2.992.734 3.371.554 3.469.464 4.204.769 3.904.773 4.086.642 2.131.506 1.547.2322014 1.520.364 1.442.260 1.845.212 2.103.336 3.146.369 3.726.270 3.705.635 4.946.631 4.202.107 3.965.329 2.098.795 1.603.5952015 1.625.569 1.427.246 1.816.076 1.863.812 2.719.378 3.150.486 3.682.936 4.742.362 3.868.890 3.381.453 1.797.335 1.389.2352016 1.411.952 1.188.825 1.465.606 1.352.858 1.838.478 1.789.982 2.390.550 3.098.464 2.787.995 2.309.663 1.330.946 1.142.1202017 1.143.592 992.270 1.233.891 1.372.138 1.905.142 2.135.768 3.468.884 4.270.002 3.652.782 3.012.571 1.667.008 1.429.6082018 1.511.187 1.301.446 1.612.603 1.810.125 2.421.944 2.812.521 3.535.009 4.281.331 3.686.324 3.318.226 1.794.595 1.427.614
Source: TSI (02.12.2019) Note: Monthly tourism data before the revision between 2004 and 2011 were accessed.
In Table 8, which includes the total number of tourists per month, the number of tourists arriving is shown to be higher in the summer months, but when Table 9 is examined, it is seen that more tourism income is obtained in the first quarter (January, February and March) and fourth quarter (October, November and December). Graph 5 shows the comparison of tourism receipts by months between 2004 and 2018 in Turkey. In July, August and September (3rd quarter), tourism receipts were higher compared to other months. However, when compared with the number of tourists, the tourism receipt rate obtained in the third quarter was lower than the first quarter and the fourth quarter.

JOURNAL of TOURISMOLOGY
124
Graph 5. Comparison of the Tourism Receipts by Months between 2004 and 2018 in Turkey
Tablo 10 shows the total average expenditure per capita by months between 2004 and 2018 in Turkey. When Table 10 is analyzed, it is seen that the average expense per capita is low between April and October, where the number of tourists is intense over the years.
Table 10 Total Average Expenses Per Capita by Months between 2004-2018 in Turkey ($)
Jan. Feb. Mar. Apr. May Jun. Jul. Aug. Sep. Oct. Nov. Dec.2004 775 749 715 691 687 689 853 880 879 740 729 7162005 718 704 677 637 642 637 847 863 863 702 695 7082006 750 729 716 673 665 663 784 791 803 651 659 6752007 694 677 664 584 571 571 730 732 745 669 701 6872008 755 746 737 627 611 614 738 754 750 710 720 7242009 693 683 663 560 544 545 689 695 703 701 741 7532010 649 652 632 557 542 540 616 621 618 738 757 7572011 701 721 697 577 574 575 623 622 623 695 700 7222012 821 859 829 770 752 756 717 707 724 981 979 9972013 990 978 959 807 805 816 724 709 732 952 954 9682014 965 947 938 817 814 823 748 745 765 924 927 9212015 923 912 900 710 720 724 702 703 714 812 803 8112016 835 783 772 660 669 664 686 679 694 724 708 7012017 729 693 669 602 615 612 689 675 688 770 727 7002018 739 720 710 631 639 638 619 607 612 693 670 655
Source: TSI (02.12.2019) Note: Monthly tourism data before the revision between 2004 and 2011 were accessed.
When graph 6 is examined, it can be observed that the average per capita expenditure decreased after February 2017, when inflation increased to double digits. In the first quarter (January, February and March), where the average per capita expenditure was high by years, total per capita average expenditure was observed

Serife Yazgan Pektas, Kurban Unluonen / The Evaluation of Tourism in Turkey in Terms of Inflation
125
to be low in 2007 and 2017. When the inflation rates of the same period (2007 and 2017 January, February and March) are analyzed, it can be seen that the inflation rate increased (2007: January 9.93%, February 10.16%, March 10.86%; 2017: January 9.22%, February 10.13%, March 11.29%).
Graph 6. Comparison of the Average Expenditure Per Capita by Months between 2004 and 2018 in Turkey ($)
In addition, it was found that the average per capita expenditure was high in the fourth quarter between 2004 and 2018 and the average per capita expenditure was low in the fourth quarter of 2018. It was observed that the inflation rate in 2018 increased to 24.52% in September and thus the monthly inflation rate increased the most between 2004 and 2018. In addition, the average per capita expenditure was the lowest ($612) compared to the month of September in other years. This shows that the continuous increase in prices affects the purchasing power. Table 11 shows Turkey’s CPI, Tourism Performance Belonging to Foreign Visitors and Citizens between 2004 and 2018.

JOURNAL of TOURISMOLOGY
126
Table 11Turkey’s CPI, Tourism Performance Belonging to Foreign Visitors and Citizens between 2004 and 2018
Foreign Visitors Citizens (Resident Abroad)
The Number of Foreign
Visitors (million)
Tourism Income(000 $)
Average Expenses
Per Capita ($)
Average Number of Overnights
The Number of Citizen Visitors (million)
Tourism Income(000 $)
Average Expenses
Per Capita ($)
Average Number of Overnight
stays
2004 17.202.996 13.061.118 759 8.2 3.059.644 3.862.552 1.262 24.12005 20.522.621 15.725.813 766 7.9 3.601.880 4.374.383 1.214 23.92006 19.275.948 13.918.757 722 9.4 3.872.721 4.463.614 1.153 24.42007 23.017.081 15.936.347 692 8.8 4.197.907 4.703.850 1.121 24.12008 26.431.124 19.612.296 742 8.8 4.548.855 5.418.439 1.191 22.72009 27.347.977 19.063.702 697 8.9 4.658.172 5.690.629 1.222 23.92010 28.510.852 19.110.003 670 8.7 4.517.091 5.558.366 1.231 22.92011 31.324.528 22.222.454 709 9.1 4.826.800 5.638.484 1.168 22.42012 31.342.464 22.410.365 715 9.0 5.121.457 6.354.379 1.241 21.42013 33.827.474 25.322.291 749 8.6 5.398.752 6.760.180 1.252 19.72014 35.850.286 27.778.026 775 8.6 5.564.784 6.289.260 1.130 18.52015 35.592.160 25.438.923 715 8.7 6.025.370 5.843.074 970 17.52016 25.265.406 15.991.381 633 9.8 6.099.924 5.964.853 978 17.42017 32.079.527 20.222.971 630 9.6 6.540.819 5.908.752 903 16.92018 38.951.902 24.028.311 617 9 6.676.771 5.345.472 801 15.3
Source: TSI (26.01.2019); CBRT, TSI (15.11.2019)
On Table 11, although the numbers of both foreign visitors and visits from citizens living abroad increased between 2004 and 2018, a significant increase in terms of tourism income is not seen. Indeed, much as tourist numbers increased, a decrease in tourism income was observed. Though there are small deviations in lengths of stay of foreign visitors, it was observed that average overnight stays of citizens living abroad decreased significantly after 2009. The reason for this situation could be attributed to the global crisis which prevailed at the time as well as to different factors. Furthermore, such factors as terrorist incidents, political reasons, political unrest, safety and security, health conditions, as well as war occurring in neighbour countries may also have contributed to this situation. Graph 7 shows the comparison of tourism income, consumer price index and number of foreign and citizen visitors between 2004 and 2018 in Turkey.

Serife Yazgan Pektas, Kurban Unluonen / The Evaluation of Tourism in Turkey in Terms of Inflation
127
Graph 7. Comparison of the Consumer Price Index, Tourism Income and Number of Foreign and Citizen Visitors Between 2004 and 2018 in Turkey
(Note: The left axis is tourism income and the number of foreign and citizen visitor series, the right axis is the axis of inflation series.)
When Graph 7 is analyzed, it can be seen that when inflation increases in general, the number of foreign tourists and tourism income increase as well. The depreciation of the Turkish lira against foreign currency can cause Turkey to be regarded as a more attractive holiday destination. In addition, there is no significant change in the number of citizen visitors and tourism income.
Graph 8. Comparison of Consumer Price Index, Average Expenses Per Capita and Average Number of Overnight Stays of Foreign and Citizen Visitors Between 2004 and 2018 in Turkey
(Note: The left axis is average expenses per capita of foreign and citizen visitors series, the right axis is the axis of inflation, average number of overnights of foreign and citizen visitors series.)
Graph 8 shows that the rise or fall of inflation does not directly affect the average number of overnight stays. However, although the number of overnight stays of foreign tourists after 2016 is high, there is a decrease in average per capita expenditure. This

JOURNAL of TOURISMOLOGY
128
case shows that tourists coming to Turkey spend less. When the average expenditure per person, average overnight stay and inflation rate of the citizens were compared, it was found that the average expenditure per capita decreased during periods of high inflation. However, there is a continuous decrease in the average overnight stay after 2012. The rise in inflation affected citizens, but time series analysis is needed to determine if it is fully effective.
Conclusion and DiscussionEconomic instability caused by high and constant inflation in existence since around
1950 has caused growth performance to decrease and has had a negative effect on incomedistribution, both reducing the welfare level and bringing about instability in every field (CBRT, 24.11.2018). Price increases particularly in tourism areas have caused inflation to rise with the knock-on effect of causing the purchasing power of local resident to fall. The fact that the Turkish Lira lost value against the increased values of foreign currency has also triggered inflation. Producers have had no choice but to raise their prices due to the fact that the national currency lost value against foreign currency and the purchasing power of foreigners or citizens living abroad has increased along with the desire to buy high priced products. In addition, due to the increase in demand for luxury goods, some products are imported in order to meet the demand. In this case, a certain part of the income comes out. In this study, we attempted to explain the relationship between inflation and tourism using CPI representing inflation between 2004 and 2018 and data on tourism performance, including tourism revenue, tourist arrivals, average expenditure per person and average number of overnights. Inflation and tourism are two phenomena affecting each other bi-directionally. One of the most important factors influencing tourism demand has been the change in prices. The share in the budget of the holiday cost of tourists affects the prices. So, as prices rise, tourism demand in the domestic market falls. Tourists’ spending in order to meet their needs in the country to which they have travelled provides an income for local people (Bahar and Kozak, 2015: 161). Tourism interacts with many sectors and causes production, consumption, exportation and importation of goods and services. Spending the income which was obtained in this way creates a multiplier effect in the economy (Bahar and Kozak, 2015: 162). Preferences of tourists, the economic structure of the country and changes in prices based on natural conditions all work together to bring about the demand for change (İçöz, 1991: 20), and this situation explains the effect of income on tourism. Accordingly, the negative effect of inflation on income distribution causes a decrease in production, an increase in exportation and a fall in imports over time. Furthermore, the presence of steady increases in prices particularly affects income from tourism, and the amount of spending per person and may cause a decrease in tourism demand in time. In addition, it must be stated that inflation cannot be regarded as the single factor affecting tourism performance.

Serife Yazgan Pektas, Kurban Unluonen / The Evaluation of Tourism in Turkey in Terms of Inflation
129
On Table 3 in which the annual exchange ratio of consumer price index according to months is shown, it is clear that a general decrease in annual exchange ratio of CPI figures occurs in the months of June to August. The pressure of inflation on tourism causes regional inflation as prices increase regionally rather than affecting an increase of inflation across the country. Thus, it should be mentioned that tourism is not directly responsible for the decrease or increase in inflation across the country in the summer months when the tourism season is at its highest.
By comparison to CPI, the total number of departing visitors and tourism revenues in Turkey show that there is fluctuation in the inflation rate by years, but inflation is not a direct determinant of the total number of tourists and tourism income. By comparison to the average expenses per capita and despite the increase in the number of tourists and tourism income, the average overnight and CPI in Turkey between the years 2004 and 2018 show that the average expenditure per person decreased during the periods when inflation increased. In this case, it can be said that the increase in the inflation rate may be effective.
Although tourism demand of citizens living abroad increased steadily between 2014 and 2018, it is clear that tourism income, average spending per person, and average overnight stays were at the lowest level in 2017 and 2018 when inflation was particularly high. However, after 2014 when the inflation rate started to rise in Turkey, it is striking that the amount of spending of citizens living abroad per person started to fall in the same year. Compared with the consumer price index, tourism revenue and the number of foreign visitors and citizens in Turkey between the years 2004 and 2018, generally also increased tourism income and the number of foreign tourists, when inflation increased. However, it was determined that there was no significant change in tourism income and the number of citizen visitors. Also, it was determined that the average expenses per capita of citizens decreased during high inflation periods. The increase in inflation rate has affected citizens, but time series analysis needs to be carried out to more clearly determine whether it is fully effective. In this respect, the increase of mobility in the domestic market should provide for inflation being kept under control and achieving stability. Creating awareness by giving importance particularly to the introduction of touristic products and addressing the spending tourist profile will help eliminate the inflationary pressure of tourism. This case will increase the purchasing power of the local people. Besides this case will also affect welfare levels.
One of the limitations of this study is the conceptual evaluation of statistical data. Forfuture academic studies, in order to reveal the relationship between tourism and inflation more clearly, we suggest that the correlation between CPI and tourism income, number of tourists, per capita expenditure and overnight stays per capita

JOURNAL of TOURISMOLOGY
130
should be determined using time series analysis. In addition, this study does not include statistical information about domestic tourists. In future studies, it is recommended that the tourism performances by months of domestic and foreign tourists with CPI be studied. Thus, the seasonality effect will be more clearly demonstrated.
Peer-review: Externally peer-reviewed. Conflict of Interest: The authors have no conflict of interest to declare.Grant Support: The authors declared that this study has received no financial support.
ReferencesAktaş, C. (2005). Türkiye’nin turizm gelirlerini etkileyen değişkenler için en uygun regresyon
denkleminin belirlenmesi. Doğuş Üniversitesi Dergisi, 6(2), 163‒174.Alparslan, M., & Ataman Erdönmez, P. (2000). Enflasyon hedeflemesi. Türkiye Bankalar Birliği,
Bankacılar Dergisi, 35, https://www.tbb.org.tr/Dosyalar/Dosyalar/ Enflasyon_Hed eflemesi.doc, 28.11.2018.
Atay-Kayış, A. & Aygün, Ş. (2016). Türkiye’de turizm sektörünün enflasyon üzerine etkisini açıklamaya yönelik bir model önerisi. Uluslararası İş, Ekonomi ve Yönetim Perspektifleri Dergisi, 1(1), 37‒57.
Bagus, P., & Howden, D. (2011). Unanswered quibbles with fractional reserve free banking. Libertarian Papers, 3(18), 1‒24.
Bahar, O., & Kozak, M. (2015). Turizm Ekonomisi. Ankara: Detay Yayıncılık.Bernanke, B., & Mishkin, F. (1997). Inflation targeting: A new framework for monetary
policy. Journal of Economic Perspectives, 5(11), 97‒116.Central Bank of the Republic of Turkey (CBRT). (2019). Tüketici Fiyat Endeksi Oranları,
https://www.tcmb.gov.tr/wps/wcm/connect/TR/TCMB+TR/Main+Menu/Istatistikler/Enflasyon+Verileri/Tuketici+Fiyatlari, 15.11.2019.
Central Bank of the Republic of Turkey (CBRT). (2019). Enflasyon Raporu 2019-I. https://www.tcmb.gov.tr/wps/wcm/connect/cb440689-938f-45e0-8cc2f8700c7b677a/ki191 .pdf?MOD=AJPERES&CACHEID=ROOTWORKSPACE-cb440689-938f-45e0-8cc2f870 0c7b677a-mytN4Mp, 03.02.2019.
Central Bank of the Republic of Turkey (CBRT). (2004). Enflasyon Raporu. https://www.tcmb.gov.tr/wps/wcm/connect/b62e1fb7-ebc1-4922-99dcb3ba23320b9f/enfla syon.pdf?MOD=AJPERES&CACHEID=ROOTWORKSPACE-b62e1fb7-ebc1-492299dc -b3ba23320b9f-m5lk-1M, 24.11.2018.
Coppin, A. (1993). Recent evidence on the determinants of inflation in a tourism oriented economy: Barbados. Social and Economic Studies, 42(2/3), 65‒80.
Çımat, A., & Bahar, O. (2003). Turizm sektörünün Türkiye ekonomisi içindeki yeri ve önemi üzerine bir değerlendirme. Akdeniz Üniversitesi İktisadi ve İdari Bilimler Fakültesi Dergisi, 3(6), 1‒18.
De Esteban, J., Cetin, G., & Antonovica, A. (2015). Theory of knowledge of tourism: A sociological and epistemological reflection. Journal of Tourismology, 1(1), 2‒15.
Erdoğan, H. (1996). Ekonomik, sosyal, kültürel, çevresel yönleriyle uluslararası turizm. Bursa: Uludağ Üniversitesi Basımevi.
Serife Yazgan Pektas, Kurban Unluonen / The Evaluation of Tourism in Turkey in Terms of Inflation
131
Foon-Tang, C. (2011). An exploration of dynamic relationship between tourist arrivals, inflation, unemployment and crimerates in Malaysia. International Journal of Social Economics, 38(1), 50‒69.
Gündoğdu, A. (2015). Küresel finans krizi sürerken enflasyon ile mücadelede enflasyon hedeflemesi uygulamasının analizi. International Journal of Economic and Administrative Studies, 8(15), 207‒220.
Gürkan, Ö. (1997). İktisada Giriş. Ankara: Attila Kitabevi. Ilgaz-Yıldırım, B, Yıldırım, F., & Gülmez, M. (2017). Türkiye’de enflasyon ve turizm gelirleri
ilişkisi üzerine ekonometrik bir analiz. Uluslararası İktisadi ve İdari Bilimler Dergisi, 3(1), 69‒81.
International Monetary Fund (IMF). Consumer Price Index (CPI). http://data.imf.org/?sk=4 FFB52B2-3653-409A-B471-D47B46D904B5&sId=1485878855 236, 03.02.2019.
İçöz, O. (1991). Enflasyonun Turizm Sektörüne Etkileri. Anatolia Dergisi, Ocak-Şubat: 19-21.Kelvin, L. (2010). Measuring Economic Activity in Paula Samuelson and William D. Nordhaus
(Ed.). Economics (pp. 386-407). Newyork: The McGraw-Hill Companies, Inc. Shaari, M. S., Salha Tunku Ahmad, T., & Razali, R. (2018). Tourism led-inflation: A case of
Malaysia. MATEC Web of Conferences, 150, 06026, 1-6. Şimşek, N. (1998). Fiyatlarının Konjonktürel Davranışına İlişkin Bir Araştırma, 1963-1995
Türkiye Örneği. Yayınlanmamış Yüksek Lisans Tezi, Dokuz Eylül Üniversitesi Sosyal Bilimler Enstitüsü, İzmir.
Taban, S., & Şengür, M. (2016). Türkiye’de enflasyonun kaynağının belirlenmesine yönelik ekonometrik bir analiz. Erciyes Üniversitesi İktisadi ve İdari Bilimler Fakültesi Dergisi, 47, 47‒64.
Tatlıyer, M. (2016). Enflasyon neden yükselir, nasıl düşer?: Türkiye örneği. Uluslararası Yönetim İktisat ve İşletme Dergisi, 12(30), 1‒20.
Turkish Statistical Institute (TSI). (2019). Aylara Göre Çıkış Yapan Yabancı ve Vatandaş Ziyaretçi Sayısı ve Turizm Geliri. http://rapory.tuik.gov.tr/29-12-2019-18:52:57-12274538813353494301204231879.html?, 02.12.2019.
Turkish Statistical Institute (TSI). (2019). Aylara Göre Çıkış Yapan Yabancı ve Vatandaş Ziyaretçi Sayısı ve Turizm Geliri. http://rapory.tuik.gov.tr/29-12-2019-19:06:56-154663422112749573961263052021.html?, 02.12.2019.
Turkish Statistical Institute (TSI). (2019). Tüketici Fiyat Endeksi Oranları. http://www.tuik. gov.tr /UstMenu.do?metod=temelist, 15.11.2019.
Turkish Statistical Institute (TSI). (2019). Ana Harcama Gruplarının Genel Endeksteki Aylık Değişime Olan Etkisi. http://www.tuik.gov.tr/PreTablo.do?alt_id=1014, 26.01.2019.
Turkish Statistical Institute (TSI). (2019). Turizm Geliri, Gideri ve Ortalama Geceleme Sayısı. http://www.tuik.gov.tr/UstMenu.do?metod=temelist, 26.01.2019.
Turkish Statistical Institute (TSI). (2019). http://www.tuik.gov.tr/PreTablo.do?alt_id=1014, 01.02.2019.
Ünlüönen, K. ve Tayfun, A. (2016). Ekonomiye Giriş. (5. Basım), Ankara: Nobel Akademik Yayıncılık.
Ünlüönen, K., Tayfun, A. ve Kılıçlar, A. (2018). Turizm Ekonomisi. (6. Basım), Ankara: Nobel Akademik Yayıncılık.

JOURNAL of TOURISMOLOGY
132
World Bank. (2019). World Consumer Price Index Rates, https://data.worldbank.org/indicator/ FP.CPI.TOTL.ZG, 15.11.2019.
World Tourism Organization (UNWTO). (2019). UNWTO Tourism Highlights 2018 Edition. https://www.e-unwto.org/doi/pdf/10.18111/9789284419876, 03.02.2019.
World Tourism Organization (UNWTO). (2019). UNWTO Tourism Highlights 2016 Edition. http://www.dadosefatos.turismo.gov.br/images/pdf/estatisticas_indicadores/UNTWO_Tourism_Highlights_2016_Edition.pdf, 03.02.2019.
World Tourism Organization (UNWTO). (2019). UNWTO Tourism Highlights 2013 Edition. https://www.e-unwto.org/doi/pdf/10.18111/9789284415427, 03.02.2019.
World Tourism Organization (UNWTO). (2019). UNWTO Tourism Highlights 2010 Edition. https://www.e-unwto.org/doi/pdf/10.18111/9789284413720, 03.02.2019.
World Tourism Organization (UNWTO). (2019). UNWTO Tourism Highlights 2007 Edition. https://www.e-unwto.org/doi/pdf/10.18111/9789284413539, 03.02.2019.
World Tourism Organization (UNWTO). (2019). UNWTO Tourism Highlights 2006 Edition. https://www.e-unwto.org/doi/pdf/10.18111/9789284413492, 03.02.2019.
World Tourism Organization (UNWTO). (2019). International Tourism Highlights 2019 Edition. https://www.e-unwto.org/doi/pdf/10.18111/9789284421152, 18.11.2019.
Wu, X. P., & Li, J. Y. (2012). Relationship between growth of tourism industry and inflation: evidence from Hainan Island. Tourism Tribune/Lvyou Xuekan, 27(11), 66-71.
Yıldırım, A. ve Şimşek, H. (2011). Sosyal bilimlerde nitel araştırma yöntemleri. Ankara: Seçkin Yayıncılık.

©The Authors. Published by the İstanbul University under the terms of the Creative Commons Attribution License http://creativecommons.org/licenses/by/4.0/, which permits unrestricted use, provided the original author and source are credited.
Journal of Tourismology, 6(1), 133-145
DOI: 10.26650/jot.2020.6.1.0006http://jt.istanbul.edu.en/
Submitted: 14.03.2019Revision Requested: 25.04.2019
Last Revision Received: 29.09.2019Accepted: 23.10.2019
Published Online: 13.03.2020R E V I E W A RT I C L E
Journal of Tourismology
1 Correspondence to: Yeliz Demir (PhD. Student), Istanbul University, Social Sciences Institute, Department of Tourism Management, Istanbul, Turkey. E-mail: [email protected] ORCID: 0000-0003-0184-6828
2 Fusun Istanbullu Dincer (Prof. Dr.), Istanbul University, Faculty of Economics, Tourism Management Department, Istanbul, Turkey. E-mail: [email protected] ORCID: 0000-0001-9446-5519
To cite this article: Demir, Y., & Istanbullu-Dincer, F. (2020). The effects of industry 4.0 on the food and beverage industry. Journal of Tourismology, 6(1), 133-145. https://doi.org/10.26650/jot.2020.6.1.0006
Yeliz Demir1 , Fusun Istanbullu Dincer2
The Effects of Industry 4.0 on the Food and Beverage Industry
AbstractProduction and technology are the two concepts which have a significant relationship with each other. The food and beverage industry is a broad industry where raw materials, semi-finished and finished foodstuffs are processed, packaged and distributed. In order to understand the effects of Industry 4.0 on the food and beverage industry; the issues of digitalization, interaction and future factories are examined in accordance with the relevant literature. The present study discusses the big data in the food and beverage industry, cloud computing, visual technologies, cyber-physical systems, 3D printers, and the ways of using smart factories. Based on a review of previous research studies, this study also offers specific recommendations for both practitioners and future research.
KeywordsIndustrial revolution, Industry 4.0, Components of industry 4.0, Food and beverage industry, Kitchen practices

JOURNAL of TOURISMOLOGY
134
IntroductionIn line with the developments within the field of artificial intelligence such as
three-dimensional (3D) printers robotics and bio-, nano- and, space technology; Industry 4.0 is defined as a smart production age that allows any being or object, alive or not to interact with each other through an internet connection (Aksoy, 2017). With the involvement of Cyber-Physical Systems during production, it will be possible to make an improvement within the production process, which is customized, eco-friendly and has good visual perception skills (Bulut & Akçacı, 2017). Industry 4.0 includes Internet of Things (IoT), Cyber-physical systems, big data and cloud computing, visual technologies (Augmented Reality/Virtual Reality/ Computer Vision), cybersecurity, additive manufacturing, advanced robotic systems, automation and control systems.
The Industry 4.0 revolution continues to influence almost all industries in several ways. It, for instance, had a significant influence on the food and beverage industry, which is a mass-production type. The food industry benefits from technological resources in order to meet the nutritional needs of the world population in accordance with human health, food safety and food legislation. For a long time, technology has been used in several stages of food and beverage production such as transportation, processing, packaging and storage of food products. On the other hand, through social media, consumers are aware of the fact that new food trends have been constantly emerging in the world. This situation, therefore, results in an added pressure on the food industry. The food industry can reduce the severity of this pressure by taking advantage of using the aforementioned technological resources.
In the relevant literature, it has been observed that there are a few comprehensive studies (Luque et al. 2017) examining the effect of all the technological innovations provided by Industry 4.0 on the food and beverage industry. The present study focuses on the effects of technological innovations such as big data, cloud computing, visual technologies (augmented reality/ virtual reality/ computer vision), Internet of Things (IoT), Cyber-physical systems, additive manufacturing, advanced robotic systems automation and control systems on the food and beverage industry.
The present study consists of two parts. The first part discusses the current and potential impacts of Industry 4.0 on the food and beverage industry in accordance with the relevant literature. In the second part, the current and potential situation of Industry 4.0 in the food and beverage industry is examined. Finally, recommendations for future studies are made so that technological innovations can be used commonly in several stages of food and beverage production.

Demir, Istanbullu-Dincer / The Effects of Industry 4.0 on the Food and Beverage Industry
135
The Effects of Industry 4.0 on the Food and Beverage IndustryFood industry is a multi-dimensional, complex and challenging sector due to the
manufacturing of raw materials, semi-finished products and finished products. Moreover, the term ‘food industry’ refers to the companies that produce, process, manufacture, sell and serve food, beverages and dietary supplements (Luque et al. 2017).
With the development of the commercial kitchen, for many years mass-production techniques have been used in food and beverage companies (Okumus & Cetin, 2019; White, Barreda, and Hein, 2019). However, it is perceived that mass-production is not enough in terms of both the food service business and the customers. Thus, the concept of “industrial kitchen” has emerged (Aktaş & Özdemir, 2007). It, hereby, refers to an innovative approach that combines the best features of mass-production and customer orientation. The industrial kitchen is based on three principles as follows; intensive customer focus, increase in production and new production technologies (Bradford, 1997; cited from, Aktaş & Özdemir, 2007). In the 21st century, it has become an important issue to cope with the negative effects of the food industry such as perishable products, food safety, production of waste and food packages in the environment (Luque et al., 2017). The technological advantages provided by Industry 4.0 and the role they have and will have in the future in food industry are as follows (Luque et al., 2017):
• Internet of Things (IoT), Artificial Intelligent and Big Data
• Microencapsulation and nanoencapsulation for the next generation ingredient design
• Chemical images for quality control and food security
• Bacteriophages; new biological methods for food security
• Pressure as a tool for food process transformation
• Proteomics
• Active packaging, the skin of the 21st century food

JOURNAL of TOURISMOLOGY
136
Figure 1. Industry 4.0 Leading Technologies (Source: adapted from Tübitak, 2016, cited from Aksoy, 2017)
In order to examine the effects of Industry 4.0 on the food and beverage industry, technological developments, digitalization, interaction and future factories within the scope of Industry 4.0 are illustrated in Figure 2. Firstly, digitalization, involves technological developments related to big data and cloud computing, virtualization and cyber security. Secondly, interaction refers to technological developments regarding the IoT and Cyber-physical systems. Finally, the future of factories consists of technological developments related to additive manufacturing, advanced robotic systems and automation and control systems.
Digitalization
Big Data and Cloud ComputingBecause of the use of the internet and social media tools, access to information and
problems of redundant and false information has consequently increased. The big data concept has made it possible to access and store real and reliable information more easily. Big data, respectively, involves a large number of information sources such as web server logs, internet statistics, information from social media posts, microblogs, climate and other similar sensors, and call records from GSM operators (EBSO, 2015).

Demir, Istanbullu-Dincer / The Effects of Industry 4.0 on the Food and Beverage Industry
137
There is no need to download the data obtained by the cloud technology. Web-based applications (for instance, iCloud, Google Drive, Yandex Disk, and Dropbox) provide online storage services for users. This technology allows people to access information stored in the cloud from any place or device as long as you are connected to the internet. Cloud technology obviates the need for an individual or corporate user to physically keep hard disks (Aksoy, 2017).
In the food and beverage industry, cloud computing is also used in agricultural activities such as production planning (Hori et al., 2010; TongKe, 2013), operational planning (Hori et al., 2010), various management strategies for different growing processes of essential plants (TongKe, 2013), reliable data sharing between administrators and employees (Hori et al., 2010), and tracing systems for agriculture lands and products (Hori et al., 2010; TongKe, 2013). In addition, cloud computing makes it possible for people to recognize foods by displaying their images on their devices (Duan et al., 2013). In this system, the user only needs to take a picture with his device and then upload it to the server. Afterwards, the system processes the picture and eventually sends feedback to the user accordingly.
Big Data allows machinery failure prediction, anticipation of maintenance operations, improving process optimization, and identifying the client consumption patterns (Luque et al., 2017). The large amount of data obtained by using radio frequency identification, wireless communication, automatic control, and the information sensing techniques of IoT are handled with agricultural information cloud computing (TongKe, 2013). In the new smart industries, information is stored on the cloud instead of the computers or servers of the company (Luque et al., 2017).
Visual technologies (Augmented Reality/ Virtual Reality/ Computer vision) Augmented reality (AR) is the visualization of digital media generated by
computers with audio, video, graphic or GPS data in a graphical environment that can affect the senses of people (Bulut & Akçacı, 2017). This concept is about changing and increasing reality with the use of a computer. The user can interact with the information around himself thanks to the developing augmented reality technology. When using this technology, artificial information and elements related to the environment are compatible with the real world (EBSO, 2015).
Today, restaurants try to differentiate the experience of consumers by applying technological innovations in the restaurant atmosphere. Inamo soho restaurant, for instance, allows its customers to have a unique experience while eating their food. This restaurant, besides eating, provides its customers an opportunity to play games in rooms, drink or sing. Inamo soho restaurant, therefore, creates a fun and interactive atmosphere where people can eat and have a good time at the same time. To illustrate

JOURNAL of TOURISMOLOGY
138
another example, IEAT is an interactive table that includes augmented reality. IEAT table provides a variety of augmented reality technology facilities such as ordering, playing, decorating the table surface and communicating (for other examples see Margetis et al., 2013).
Cyber SecurityThe role of cybersecurity is essential in Industry 4.0. In accordance with the
discussions so far, there are several technological systems and many industrial objects related to interchanging information that are able to control production systems. Thus, adequate protection measures need to be taken to prevent attacks that could change the correct operation of factories with a consequent potential for economic risk. (Luque et al., 2017). Cyber security ensures that data security is kept under control. Otherwise, having regularly active devices on the internet might cause data loss and severe problems in information security (Bulut & Akçacı, 2017). Today, cyber security is an important issue since sharing information among animate and inanimate objects is spectacularly rapid.
Interaction
Internet of Things (IoT) Zanella et.al., (2014) define IoT as a recent communication paradigm that
conceives a near future, in which the objects that we use every day will be supplied with microcontrollers, transceivers for digital communication, and appropriate protocol stacks that will make them able to interact with each another and with the users, becoming an integral part of the Internet. Whitmore et.al., (2015) claim that IoT devices will be ubiquitous, context-aware and will enable ambient intelligence. IoT, additionally, can not only save people and organizations time and money, but also help improve decision making skills and outcomes in a wide range of application areas (Whitmore et.al., 2015).
Human-computer interaction (HCI) activated by IoT assists people’s kitchen practices. For example, technological cutting boards can sense the weight of various foods processed on it while cutting during meal preparation (Kranz et al., 2010). Also , by analyzing the force and torque changes that occur when users are chopping food, the blade feature can determine the type of food to be chopped (see for example Kranz et al., 2010). IoT controls the food supply chain through effective information processes. It requires equipping machines and industrial objects with sensor systems and electronics with embedded software and connectivity. This, accordingly, allows the objects to collect and exchange the data using the internet infrastructure. (Luque et al., 2017). Numerous examples exist, including...

Demir, Istanbullu-Dincer / The Effects of Industry 4.0 on the Food and Beverage Industry
139
Cyber-physical systemsCyber-physical systems make physical machines much more intelligent by being
integrated with cyber technology (EBSO, 2015). RFID (Radiofrequency Identification) technology is a working form of a cyber-physical system (Selek, 2015 cited in Aksoy, 2017) that facilitates automatic identification of items using radio waves (Nambiar, 2009). In factory production, radio frequency identifier labels, which are one of the most essential elements of Industry 4.0, are attached on products, for example, soap bottles. These labels, in fact, have the feature of transferring information such as color, size, and the volume of the bottle into the machine. Through the use of these labels, the smart machines then classify and identify the bottles according to their determined features and fill the bottles with soap according to their color. This system, ultimately, makes it possible to store the information of a product that has been transferred via radio signals to the digital platform since the beginning of its production process. RFID technology also has advantages in the physical production field and production processes.
RFID technology has remarkable advantages for the food and beverage industry. Firstly, as it can identify the quality information of products, RFID technology stores the data of the manufacturing methods and transfer period of the products and classifies them accordingly. Secondly, RFID is quite beneficial for wholesalers, vendors and retailers as they can check the supply chain of each product with it. In addition, consumers can check the supply chain of each product using the RFID readers through their web and smartphone applications. Finally, the collected data can be used by research institutions (Costa et al., 2013). Abad et al., (2009) have reported that RFID systems offer significant advantages for its users. They, for instance, offer more memory and can be reused rather than being disposed of. There is also no need for human participation or a physical tag to read the labels on the product.
RFID technology enables the sharing of information among manufacturers, vendors and consumers in the food industry. Therefore, this information exchange creates mutual trust in the supply chain. Moreover, RFID technology facilitates safe food production with objective data provided in the production area.
The Future of Factories
Additive manufacturing and 3D printing3D printing is known as a process of “additive manufacturing” or slowly building
layer upon layer in the food industry. The printer needs to be working well with food such as sugar, starches, and/or proteins. Printing food, basically, involves carefully layering tiny semi-liquefied food particles on top of each other to create novel processed foods (Lam et al., 2012, cited from, Lin, 2015). Techniques in 3D printing

JOURNAL of TOURISMOLOGY
140
food can be divided into three techniques as follows: bio-driven (meats), bottom-up (uncommon source such as algae and insects), and mixed insect powders with other printable food (cheese et.) and it can make delicious ingredients. Insect powder can be an alternative protein resource for addressing the global food shortage crisis (Sun et al., 2015). Top-down researchers look to develop additive manufacturing techniques that use traditional edible materials, such as chocolate, dough, and vegetable puree as base ingredients (Lipton et al., 2015). Besides this, available printing materials can be considered as a process of natively printable materials, non-printable traditional food materials, alternative ingredients, and post-processing.
In the food industry, FOODINI appliances can be observed within the scope of 3D. FOODINI is a 3D food printer + IoT ) new-generation kitchen appliance that makes cooking better with fresh, real ingredients. FOODINI is the first 3D printer to print all types of foods from savory to sweet using fresh and real ingredients. 3D printers can be used to cook using ingredients such as chocolate, icing, hydrogel, cheese, hummus, pastry dough, butter, jelly, starch and granulated sugar (Izdebska & Tryznowska, 2016). On the other hand, 3D printers cannot be used to print traditional food materials containing meat, rice, vegetables and fruits. However, the author of the study highlights that these ‘non-printable’ foods are added to materials such as hydrocolloids (Sun et al., 2015), xanthan gum, and gelatin and can be processed in 3D printers (Izdebska, & Tryznowska, 2016).
3D food printing technology can be good for consumer-produced foods at home, small-scale food production and industrial scale food production (Lipton et al., 2015). This technology can make production more efficient and decrease manufacturing cost for customized food products fabrication (Sun et al., 2015). Additionally, 3D food printers can be quite advantageous for food production topics such as various food decoration, geometric complexity, developed recipes (Lipton et al., 2015), personalized food production (Lin, 2015; Lipton et al., 2015; Sun et al., 2015; Lille et al., 2018), customized food design, customized food supply chain (Sun et al., 2015), saving time, preventing food waste (Izdebska, & Tryznowska, 2016)., enhancement of manufacturer’s skills (Lipton et al., 2015; Sun et al. 2015). Moreover, it is easier to, transport of prepacked cartridges to distant locations since prepacked cartridges (mashed food is filled into the cartridges and printed in 3D food printers.) can stay fresh longer than fresh fruits and vegetables (Lin, 2015).
So, On the other hand, Lipton et al., (2015) discuss that most of the 3D printer food stock has an extremely limited shelf life. However, current 3D printing technology is limited due to reasons such as cost, time (Lin, 2015), and more importantly it is a food process that is practiced slowly compared to other techniques (Lipton et al., 2015).

Demir, Istanbullu-Dincer / The Effects of Industry 4.0 on the Food and Beverage Industry
141
Advanced Robotic systems, Automation and Control SystemsIqbal et al. (2017) discuss that earlier use of robots in the food industry was restricted
to packaging of food and palletizing in dairy, beverages, chocolates and food tins. Nowadays, robots are used in numerous areas of the food industry such as seeding, spraying water, harvesting, cutting, processing and packaging of food products (Sun, 2016 cited from Iqbal et al., 2017), meat processing and automatic quality detection of final bakery products. In addition, bottles are automatically cleaned, counted, filled and arranged on a conveyer belt with the help of robotic machines (Saravacos and Kostaropoulos, 2016 cited in Iqbal et al., 2017). The benefits of robots to the food industry can be illustrated as follows: kinematics, dynamics, control, hygiene, productivity and worker safety (Iqbal et al., 2017). Specifically, Iqbal et al., (2017) assert that picking and placing, packing and palletizing are the steps where robots serve especially well.
One of the most important areas where transformation takes place in Industry 4.0 is the factories equipped with smart technology. These factories are also described as dark factories (lights out) since there are no people working in them. At the beginning of these factories’ existence, the major areas of use the production areas in which people are exposed to dangerous working conditions such as high temperatures, heavy weights, and toxic gases (Aksoy, 2017).
In recent studies, it has been revealed that robot chefs are able to make basic recipes such as cookies (Bollini et al., 2011), and pancakes (Betzz et al., 2011). These studies particularly reveal that robot chefs can perform daily kitchen actions such as pouring, mixing, placing and cooking. In addition, Japan has developed the idea of robots serving customers (Iqbal et al., 2017).
These days, people benefit from robots in the food and beverage industry in fields such as washing, extracting, cutting, processing and packaging of food and beverage products. Robot chefs or service robots that can be considered as advanced technological innovations are not yet widely used in the food and beverage industry since these innovations are currently only in the prototype stage of development.
ConclusionThe purpose of the present study was to address the effects of technological
innovations in Industry 4.0 on the food and beverage industry. In accordance with the existing relevant literature, the study revealed that Industry 4.0 provides technological innovations as follows; cloud computing, visual technologies, cyber security, IoT cyber-physical systems, 3D printers and smart factories.

JOURNAL of TOURISMOLOGY
142
Big data technology enables the determination and storage of safe and real information. Big data also helps to predict the malfunction of machines that are used in the food and beverage industry and check their maintenance. Moreover, it effectively improves the production process and specifies the profiles for the consumers. Cloud computing is a technology system that helps to store the collected big data. Thanks to this technology, computer storage space or hard disk space is not required, and data storage and access is possible via online networks from anywhere that has internet connection. The present study has also discovered that consumers within the food and beverage industry benefit from the cloud computing system when figuring out the features of the foods in the agricultural practices. This technology, especially, provides a fast and safe method of information sharing among employers and customers.
Within the scope of augmented reality technology, restaurants can use smart tables in their workplaces. On these tables, customers experience several activities such as ordering, table decorating, getting information about the food, sharing instant posts on social media and playing games. As a consequence of these tables are required to recognize the foods that the customers eat or detect to what extent they would impact the socialization level of the customers with the other people next to themselves.
IoT is defined as the communication of things using the internet and managing actions autonomously (EBSO, 2015). This technological development decreases the costs of food production as well as increasing time efficiency. Especially within kitchen production areas, human-computer interaction helps people with the cutting process thanks to the smart cutting boards and the knives attached to them. However, it can be observed that this innovation is a prototype study at this time.
Radio Frequency Identification (RFID) labels are involved within cyber-physical systems. RFID technology allows factories to produce foods and beverages with different features on the same production line. It, in addition, makes it possible for manufacturers to produce safe foods and beverages as it provides them with data about the production, storage and transfer of foods and beverages. As it provides consumers with information about the product as well, it allows them to check the supply chain. However, due to technical and economical obstacles, the use of this technology becomes restricted.
3D food printers help to prepare the final products using ingredients such as chocolate, cream, cheese, hummus, dough, butter, jelly, starch and granulated sugar as wished. Within the existing related literature, there have been numerous studies and debates regarding 3D food printers. For instance, whereas the manufacturers of FOODINI brand asserts production of any kind of fresh and real ingredients, from sweet to salty, can be performed/achieved by 3D printers, Izdebska & Tryznowska (2016) state that meat, rice, vegetables and fruits are counted as the ingredients which

Demir, Istanbullu-Dincer / The Effects of Industry 4.0 on the Food and Beverage Industry
143
cannot be printed by 3D printers. They also claim that it is possible to process these ingredients with additives such as xanthan gum or gelatin. It is believed that 3D printers will increase the production power, decrease costs, enable customized food production, and manufacture geometric food shapes easily with the help of these machines. Lin (2015) asserts that food that is prepared and packaged in prepacked cartridges is more appropriate for transportation across long distances since they have longer shelf lives than fresh fruits and vegetables. On the other hand, Lipton et al. (2015) state that most of the food stock that is produced with 3D printers has a limited shelf life. In the food and beverage industry, 3D printers are not very common due to their cost and the long process required for printing food products.
In factories that produce food and beverages, machines and robots are used efficiently in the stages such as shelling, washing, processing, packaging and counting. The technological innovations brought to this industry by Industry 4.0 such as big data, cloud computing, IoT, human-computer interaction, RFID technology, and 3D printers form the basis of smart factories. It can be considered that within these factories there will be a quantitative decrease yet qualitative increase in staff number. Nowadays, robot chefs and service robots that can make recipes are in the phase trial.
In the food and beverage industry, there is a need for investment to make the technological innovations provided by Industry 4.0 more common. Investor workplaces need to be informed about the technological innovations as well. In addition to bringing the technological innovations into the production areas, there is also a need for staff that are qualified enough to understand and use these innovations. Appropriate courses, particularly, need to be added to the curriculum in order to provide necessary training for the staff to be employed in the food production area. In this way, young people will be both using the technological innovations within the production area and closely following recent technological developments in the world thanks to the awareness they gain in the training. For further recommendations, researchers can conduct studies focusing on the experience and perceptions of the employees on the technological innovations provided by Industry 4.0 in the food and beverage industry. Another study can examine the advantages and disadvantages of these innovations for the food and beverage industry.
Acknowledgements: The authors are thankful to the anonymous reviewers for their valued comments and observations that aid to enrich the contents of the manuscript. An abridged version of this paper has been presented in “18. Geleneksel Turizm Sempozyumu 2019” Istanbul Turkey, April 12th, 2019.
Peer-review: Externally peer-reviewed. Conflict of Interest: The authors have no conflict of interest to declare.Grant Support: The authors declared that this study has received no financial support.

JOURNAL of TOURISMOLOGY
144
ReferencesAbad, E., Palacio, F., Nuin, M., De Zarate, A. G., Juarros, A., Gómez, J. M., & Marco, S. (2009).
RFID smart tag for traceability and cold chain monitoring of foods: Demonstration in an intercontinental fresh fish logistic chain. Journal of food engineering, 93(4), 394–399.
Aksoy, S. (2017). Değişen teknolojiler ve endüstri 4.0: endüstri 4.0’ı anlamaya dair bir giriş. SAV Katkı, 4, 34–44.
Aktaş, A. ve Özdemir, B. (2007). Otel işletmelerinde mutfak yönetimi. Ankara: Detay Yayıncılık.Beetz, M., Klank, U., Kresse, I., Maldonado, A., Mösenlechner, L., Pangercic, D., & Tenorth, M.
(2011, October). Robotic roommates making pancakes. In Humanoid Robots (Humanoids), 2011 11th IEEE-RAS International Conference on (pp. 529-536). IEEE.
Bollini, M., Barry, J., & Rus, D. (2011, September). Bakebot: Baking cookies with the pr2. In The PR2 Workshop: Results, Challenges and Lessons Learned in Advancing Robots with a Common Platform, IROS.
Bulut, E., & Akçacı, T. (2017). Endüstri 4.0 ve inovasyon göstergeleri kapsaminda Türkiye analizi. Assam Uluslararası Hakemli Dergi, 4(7), 55–77.
Costa, C., Antonucci, F., Pallottino, F., Aguzzi, J., Sarriá, D., & Menesatti, P. (2013). A review on agri-food supply chain traceability by means of RFID technology. Food and bioprocess technology, 6(2), 353–366.
Duan, P., Wang, W., Zhang, W., Gong, F., Zhang, P., & Rao, Y. (2013, August). Food image recognition using pervasive cloud computing. In Green Computing and Communications (GreenCom), 2013 IEEE and Internet of Things (iThings/CPSCom), IEEE International Conference on and IEEE Cyber, Physical and Social Computing (pp. 1631-1637). IEEE.
EBSO. (2015). “Sanayi 4.0”, Ege Bölgesi Sanayiciler Odası, Araştırma Müdürlüğü.Retrieved from: http://www.ebso.org.tr/ebsomedia/documents/sanayi-40_88510761.pdf
Food Ink. http://foodink.io/shop/, Connected Date: 06.01.19.Hori, M., Kawashima, E., & Yamazaki, T. (2010). Application of cloud computing to agriculture
and prospects in other fields. Fujitsu Sci. Tech. J, 46(4), 446–454.Inamo restaurant, Soho, London Games Room & Onyx Room - Award Winning private venues.
https://www.inamo-restaurant.com/promos/gamesroom/ Izdebska, J., & Zolek-Tryznowska, Z. (2016). 3D food printing–facts and future. Agro FOOD
Industry Hi Tech, 27(2), 33–37.Iqbal, J., Khan, Z. H., & Khalid, A. (2017). Prospects of robotics in food industry. Food Science
and Technology, 37(2), 159-165.Kranz, M., Holleis, P., & Schmidt, A. (2010). Embedded interaction: Interacting with the internet of
things. IEEE internet computing, 14(2), 46–53.Lille, M., Nurmela, A., Nordlund, E., Metsä-Kortelainen, S., & Sozer, N. (2018). Applicability
of protein and fiber-rich food materials in extrusion-based 3D printing. Journal of Food Engineering, 220, 20-27.
Lin, C. (2015). 3D food printing: a taste of the future. Journal of Food Science Education, 14(3), 86–87.
Lipton, J. I., Cutler, M., Nigl, F., Cohen, D., & Lipson, H. (2015). Additive manufacturing for the food industry. Trends in food science & technology, 43(1), 114–123.

Demir, Istanbullu-Dincer / The Effects of Industry 4.0 on the Food and Beverage Industry
145
Luque, A., Peralta, M. E., De Las Heras, A., & Córdoba, A. (2017). State of the Industry 4.0 in the Andalusian food sector. Procedia Manufacturing, 13, 1199–1205.
Margetis, G., Grammenos, D., Zabulis, X., & Stephanidis, C. (2013, July). iEat: An Interactive Table for Restaurant Customers’ Experience Enhancement. In International Conference on Human-Computer Interaction (pp. 666-670). Springer, Berlin, Heidelberg.
Nambiar, A. N. (2009, October). RFID technology: A review of its applications. In Proceedings of the world congress on engineering and computer science (Vol. 2, pp. 20-22).
Okumus, B., & Cetin, G. (2018). Marketing Istanbul as a culinary destination. Journal of Destination Marketing & Management, 9, 340–346.
Sun, J., Peng, Z., Zhou, W., Fuh, J. Y., Hong, G. S., & Chiu, A. (2015). A review on 3D printing for customized food fabrication. Procedia Manufacturing, 1, 308–319.
TongKe, F. (2013). Smart agriculture based on cloud computing and IOT. Journal of Convergence Information Technology, 8(2).
Whitmore, A., Agarwal, A., & Da Xu, L. (2015). The Internet of Things—A survey of topics and trends. Information Systems Frontiers, 17(2), 261–274.
Zanella, A., Bui, N., Castellani, A., Vangelista, L., & Zorzi, M. (2014). Internet of things for smart cities. IEEE Internet of Things journal, 1(1), 22-32.
White, W., Barreda, A. A., & Hein, S. Gastrodiplomacy: Captivating a Global Audience Through Cultural Cuisine-A Systematic Review of the Literature. Journal of Tourismology, 5(2), 127–144.

JOURNAL of TOURISMOLOGY
146

INFORMATION FOR AUTHORS
AIM AND SCOPE
Journal of Tourismology (JoT) publishes two issues per year; one in December and the other in June. JoT is an open access journal without any submission or processing charges or fees that aims to be a comprehensive and innovative publication for scholars to present views and ideas at international level on key issues that shape tourism knowledge and industry from past to present.
The objectives of the journal are: (i) To present the latest disciplinary/multidisciplinary set of views and trends on tourism; (ii) To contribute a deeper understanding of international tourism devolopment; (iii) To create and disseminate knowledge by providing insights into developments, issues and methods in tourism research
JoT strongly encourages scholars and professionals in the tourism to share their ideas and research through the journal. Submitted papers should not have been previously published nor be currently under consideration for publication elsewhere. All submissions are double blind refereed which takes on average 6 weeks. The journal’s contents reflect its integrative approach - theoretical, empirical or policy-related papers, discussion of current issues, case studies, reports, book reviews, research notes and forthcoming meetings might be submitted to the journal. The topics of journal include (but are not limited to) the following:
• Tourism theory• Tourism research and methodology• Advances in tourism development, planning and policy-making• Tourism education and its role in managing tourism development• Economic/social/environmental/cultural impact of tourism and sustainability• Hospitality, gastronomy, transportation, attractions, recreations, leisure studies• Tourism industry, marketing, organizational aspects, technology• Cross-cultural differences- tourist and traveler behavior• Tourism sociology and psychology• Alternative and special forms of tourism• Terrorism, safety and security in tourism• Globalisation and tourism• Future of tourism
EDITORIAL POLICIES AND PEER REVIEW PROCESS
Publication Policy
The subjects covered in the manuscripts submitted to the Journal for publication must be in accordance with the aim and scope of the Journal. The Journal gives priority to original research papers submitted for publication.
General Principles
Only those manuscripts approved by its every individual author and that were not published before in or sent to another journal, are accepted for evaluation.
Submitted manuscripts that pass preliminary control are scanned for plagiarism using iThenticate software. After plagiarism check, the eligible ones are evaluated by editor-in-chief for their originality, methodology, the importance of the subject covered and compliance with the journal scope.
Short presentations that took place in scientific meetings can be referred if indicated in the article. The editor hands over the papers matching the formal rules to at least two national/international referees for evaluation and gives green light for publication upon modification by the authors in accordance with the referees’ claims. Changing the name of an author (omission, addition or order)

Notes for Contributors
in papers submitted to the Journal requires written permission of all declared authors. Refused manuscripts and graphics are not returned to the author. The copyright of the published articles and pictures belong to the Journal.
Author Responsibilities
It is authors’ responsibility to ensure that the article is in accordance with scientific and ethical standards and rules. And authors must ensure that submitted work is original. They must certify that the manuscript has not previously been published elsewhere or is not currently being considered for publication elsewhere, in any language. Applicable copyright laws and conventions must be followed. Copyright material (e.g. tables, figures or extensive quotations) must be reproduced only with appropriate permission and acknowledgement. Any work or words of other authors, contributors, or sources must be appropriately credited and referenced.
All the authors of a submitted manuscript must have direct scientific and academic contribution to the manuscript. The author(s) of the original research articles is defined as a person who is significantly involved in “conceptualization and design of the study”, “collecting the data”, “analyzing the data”, “writing the manuscript”, “reviewing the manuscript with a critical perspective” and “planning/conducting the study of the manuscript and/or revising it”. Fund raising, data collection or supervision of the research group are not sufficient roles to be accepted as an author. The author(s) must meet all these criteria described above. The order of names in the author list of an article must be a co-decision and it must be indicated in the Copyright Agreement Form. The individuals who do not meet the authorship criteria but contributed to the study must take place in the acknowledgement section. Individuals providing technical support, assisting writing, providing a general support, providing material or financial support are examples to be indicated in acknowledgement section.
All authors must disclose all issues concerning financial relationship, conflict of interest, and competing interest that may potentially influence the results of the research or scientific judgment.
When an author discovers a significant error or inaccuracy in his/her own published paper, it is the author’s obligation to promptly cooperate with the Editor-in-Chief to provide retractions or corrections of mistakes.
Peer Review Process
Only those manuscripts approved by its every individual author and that were not published before in or sent to another journal, are accepted for evaluation.
Submitted manuscripts that pass preliminary control are scanned for plagiarism using iThenticate software. After plagiarism check, the eligible ones are evaluated by editor-in-chief for their originality, methodology, the importance of the subject covered and compliance with the journal scope. Editor-in-chief evaluates manuscripts for their scientific content without regard to ethnic origin, gender, sexual orientation, citizenship, religious belief or political philosophy of the authors and ensures a fair double-blind peer review of the selected manuscripts.
The selected manuscripts are sent to at least two national/international referees for evaluation and publication decision is given by editor-in-chief upon modification by the authors in accordance with the referees’ claims.
Editor in chief does not allow any conflicts of interest between the authors, editors and reviewers and is responsible for final decision for publication of the manuscripts in the Journal.
Reviewers’ judgments must be objective. Reviewers’ comments on the following aspects are expected while conducting the review.
- Does the manuscript contain new and significant information?- Does the abstract clearly and accurately describe the content of the manuscript?

INFORMATION FOR AUTHORS
- Is the problem significant and concisely stated?- Are the methods described comprehensively?- Are the interpretations and consclusions justified by the results?- Is adequate references made to other Works in the field?- Is the language acceptable?
Reviewers must ensure that all the information related to submitted manuscripts is kept as confidential and must report to the editor if they are aware of copyright infringement and plagiarism on the author’s side.
A reviewer who feels unqualified to review the topic of a manuscript or knows that its prompt review will be impossible should notify the editor and excuse himself from the review process.
The editor informs the reviewers that the manuscripts are confidential information and that this is a privileged interaction. The reviewers and editorial board cannot discuss the manuscripts with other persons. The anonymity of the referees is important.
PUBLICATION ETHICS AND PUBLICATION MALPRACTICE STATEMENT
Journal of Tourismology is committed to upholding the highest standards of publication ethics and pays regard to Principles of Transparency and Best Practice in Scholarly Publishing published by the Committee on Publication Ethics (COPE), the Directory of Open Access Journals (DOAJ), the Open Access Scholarly Publishers Association (OASPA), and the World Association of Medical Editors (WAME) on https://publicationethics.org/resources/guidelines-new/principles-transparency-and-best-practice-scholarly-publishing
All parties involved in the publishing process (Editors, Reviewers, Authors and Publishers) are expected to agree on the following ethical principles.
All submissions must be original, unpublished (including as full text in conference proceedings), and not under the review of any other publication synchronously. Each manuscript is reviewed by one of the editors and at least two referees under double-blind peer review process. Plagiarism, duplication, fraud authorship/denied authorship, research/data fabrication, salami slicing/salami publication, breaching of copyrights, prevailing conflict of interest are unnethical behaviors.
All manuscripts not in accordance with the accepted ethical standards will be removed from the publication. This also contains any possible malpractice discovered after the publication. In accordance with the code of conduct we will report any cases of suspected plagiarism or duplicate publishing.
Research Ethics
The journal adheres to the highest standards in research ethics and follows the principles of international research ethics as defined below. The authors are responsible for the compliance of the manuscripts with the ethical rules.
- Principles of integrity, quality and transparency should be sustained in designing the research, reviewing the design and conducting the research.
- The research team and participants should be fully informed about the aim, methods, possible uses and requirements of the research and risks of participation in research.
- The confidentiality of the information provided by the research participants and the confidentiality of the respondents should be ensured. The research should be designed to protect the autonomy and dignity of the participants.
- Research participants should participate in the research voluntarily, not under any coercion.- Any possible harm to participants must be avoided. The research should be planned in such a
way that the participants are not at risk.- The independence of research must be clear; and any conflict of interest or must be disclosed.

INFORMATION FOR AUTHORS
- In experimental studies with human subjects, written informed consent of the participants who decide to participate in the research must be obtained. In the case of children and those under wardship or with confirmed insanity, legal custodian’s assent must be obtained.
- If the study is to be carried out in any institution or organization, approval must be obtained from this institution or organization.
- In studies with human subject, it must be noted in the method’s section of the manuscript that the informed consent of the participants and ethics committee approval from the institution where the study has been conducted have been obtained.
Author Responsibilities
It is authors’ responsibility to ensure that the article is in accordance with scientific and ethical standards and rules. And authors must ensure that submitted work is original. They must certify that the manuscript has not previously been published elsewhere or is not currently being considered for publication elsewhere, in any language. Applicable copyright laws and conventions must be followed. Copyright material (e.g. tables, figures or extensive quotations) must be reproduced only with appropriate permission and acknowledgement. Any work or words of other authors, contributors, or sources must be appropriately credited and referenced.
All the authors of a submitted manuscript must have direct scientific and academic contribution to the manuscript. The author(s) of the original research articles is defined as a person who is significantly involved in “conceptualization and design of the study”, “collecting the data”, “analyzing the data”, “writing the manuscript”, “reviewing the manuscript with a critical perspective” and “planning/conducting the study of the manuscript and/or revising it”. Fund raising, data collection or supervision of the research group are not sufficient roles to be accepted as an author. The author(s) must meet all these criteria described above. The order of names in the author list of an article must be a co-decision and it must be indicated in the Copyright Agreement Form. The individuals who do not meet the authorship criteria but contributed to the study must take place in the acknowledgement section. Individuals providing technical support, assisting writing, providing a general support, providing material or financial support are examples to be indicated in acknowledgement section.
All authors must disclose all issues concerning financial relationship, conflict of interest, and competing interest that may potentially influence the results of the research or scientific judgment.
When an author discovers a significant error or inaccuracy in his/her own published paper, it is the author’s obligation to promptly cooperate with the Editor to provide retractions or corrections of mistakes.
Responsibility for the Editor and Reviewers
Editor-in-Chief evaluates manuscripts for their scientific content without regard to ethnic origin, gender, sexual orientation, citizenship, religious belief or political philosophy of the authors. He/She provides a fair double-blind peer review of the submitted articles for publication and ensures that all the information related to submitted manuscripts is kept as confidential before publishing.
Editor-in-Chief is responsible for the contents and overall quality of the publication. He/She must publish errata pages or make corrections when needed.
Editor-in-Chief does not allow any conflicts of interest between the authors, editors and reviewers. Only he has the full authority to assign a reviewer and is responsible for final decision for publication of the manuscripts in the Journal.
Reviewers must have no conflict of interest with respect to the research, the authors and/or the research funders. Their judgments must be objective.
Reviewers must ensure that all the information related to submitted manuscripts is kept as confidential and must report to the editor if they are aware of copyright infringement and plagiarism on the author’s side.

INFORMATION FOR AUTHORS
A reviewer who feels unqualified to review the topic of a manuscript or knows that its prompt review will be impossible should notify the editor and excuse himself from the review process.
The editor informs the reviewers that the manuscripts are confidential information and that this is a privileged interaction. The reviewers and editorial board cannot discuss the manuscripts with other persons. The anonymity of the referees must be ensured. In particular situations, the editor may share the review of one reviewer with other reviewers to clarify a particular point.
MANUSCRIPT SUBMISSION GUIDE
Language
The language of the journal is English.
Manuscript Organization and Submission
All correspondence will be sent to the first-named author unless otherwise specified. Manuscpript is to be submitted online via http://jecs.istanbul.edu.tr and it must be accompanied by a cover letter indicating that the manuscript is intended for publication, specifying the article category (i.e. research article, review etc.) and including information about the manuscript (see the Submission Checklist). Manuscripts should be prepared in Microsoft Word 2003 and upper versions. In addition, Copyright Agreement Form that has to be signed by all authors must be submitted.
1. The manuscripts should be in A4 paper standards: having 2.5 cm margins from right, left, bottom and top, Times New Roman font style in 12 font size and line spacing of 1.5.
2. The manuscripts should contain between 4500 and 8500 words and the page numbers must be at the bottom and in the middle.
3. The name(s) of author(s) should be given just beneath the title of the study aligned to the right. Also the affiliation, title, e-mail and phone of the author(s) must be indicated on the bottom of the page as a footnote marked with an asterisk (*).
4. Submitted manuscripts in Turkish must have before the introduction section, the abstract both in Turkish and English, between 200 and 250 words and an extended abstract in English between 600-800 words, summarizing the scope, the purpose, the results of the study and the methodology used. Underneath the abstracts, 3 to 5 keywords that inform the reader about the content of the study should be specified in Turkish and in English. If the manuscript is written in English, it must include an abstract only in English.
5. The manuscripts should contain mainly these components: title, abstract and keywords; extended abstract, body text with sections, footnotes and references.
6. The 6th version of the APA (American Psychological Association) reference style should be used for in-text citation and references list. For information and samples on the APA 6 style please refer to http://jecs.istanbul.edu.tr/en/content/information-for-authors/references and/or REFERENCES section in the Information for Authors.
7. Tables, graphs and figures can be given with a number and a defining title if and only if it is necessary to follow the idea of the article. the article. The title of table should be placed above the table; caption of figure should be placed beneath the figure. Features like demographic characteristics that can be given within the text should not be indicated as tables separately.
8. A title page including author information must be submitted together with the manuscript. The title page is to include fully descriptive title of the manuscript and, affiliation, title, e-mail address, postal address, phone and fax number of the author(s) (see The Submission Checklist).
9. Authors are responsible for all statements made in their work submitted to the Journal for publication.
10. The author(s) can be asked to make some changes in their articles due to peer reviews.11. A copy of the journal will be sent to each author of the accepted articles upon their request.12. The manuscripts that were submitted to the journal will not be returned whether they are
published or not.

INFORMATION FOR AUTHORS
REFERENCES
Although references to review articles can be an efficient way to guide readers to a body of literature, review articles do not always reflect original work accurately. Readers should therefore be provided with direct references to original research sources whenever possible. On the other hand, extensive lists of references to original work on a topic can use excessive space on the printed page. Small numbers of references to key original papers often serve as well as more exhaustive lists, particularly since references can now be added to the electronic version of published papers, and since electronic literature searching allows readers to retrieve published literature efficiently. Papers accepted but not yet included in the issue are published online in the Early View section and they should be cited as “advance online publication”. Citing a “personal communication” should be avoided unless it provides essential information not available from a public source, in which case the name of the person and date of communication should be cited in parentheses in the text. For scientific articles, written permission and confirmation of accuracy from the source of a personal communication must be obtained.
Reference Style and Format
Journal of Tourismology complies with APA (American Psychological Association) style 6th Edition for referencing and quoting. For more information:
- American Psychological Association. (2010). Publication manual of the American Psychological Association (6th ed.). Washington, DC: APA.
- http://www.apastyle.org
Citations in the Text
Citations must be indicated with the author surname and publication year within the parenthesis.
If more than one citation is made within the same paranthesis, separate them with (;).
Samples:
More than one citation;(Esin, et al., 2002; Karasar, 1995)Citation with one author;(Akyolcu, 2007)Citation with two authors;(Sayıner & Demirci, 2007)Citation with three, four, five authors;First citation in the text: (Ailen, Ciambrune, & Welch, 2000) Subsequent citations in the text: (Ailen, et al., 2000)Citations with more than six authors;(Çavdar, et al., 2003)
Citations in the Reference
All the citations done in the text should be listed in the References section in alphabetical order of author surname without numbering. Below given examples should be considered in citing the references.
Basic Reference Types
Booka) Turkish BookKarasar, N. (1995). Araştırmalarda rapor hazırlama (8th ed.) [Preparing research reports]. Ankara,
Turkey: 3A Eğitim Danışmanlık Ltd.

INFORMATION FOR AUTHORS
b) Book Translated into TurkishMucchielli, A. (1991). Zihniyetler [Mindsets] (A. Kotil, Trans.). İstanbul, Turkey: İletişim Yayınları.c) Edited BookÖren, T., Üney, T., & Çölkesen, R. (Eds.). (2006). Türkiye bilişim ansiklopedisi [Turkish
Encyclopedia of Informatics]. İstanbul, Turkey: Papatya Yayıncılık.d) Turkish Book with Multiple AuthorsTonta, Y., Bitirim, Y., & Sever, H. (2002). Türkçe arama motorlarında performans
değerlendirme [Performance evaluation in Turkish search engines]. Ankara, Turkey: Total Bilişim.
e) Book in EnglishKamien R., & Kamien A. (2014). Music: An appreciation. New York, NY: McGraw-Hill Education.f) Chapter in an Edited BookBassett, C. (2006). Cultural studies and new media. In G. Hall & C. Birchall (Eds.), New cultural
studies: Adventures in theory (pp. 220–237). Edinburgh, UK: Edinburgh University Press.g) Chapter in an Edited Book in TurkishErkmen, T. (2012). Örgüt kültürü: Fonksiyonları, öğeleri, işletme yönetimi ve liderlikteki önemi
[Organization culture: Its functions, elements and importance in leadership and business management]. In M. Zencirkıran (Ed.), Örgüt sosyolojisi [Organization sociology] (pp. 233–263). Bursa, Turkey: Dora Basım Yayın.
h) Book with the same organization as author and publisherAmerican Psychological Association. (2009). Publication manual of the American psychological
association (6th ed.). Washington, DC: Author.
Articlea) Turkish ArticleMutlu, B., & Savaşer, S. (2007). Çocuğu ameliyat sonrası yoğun bakımda olan ebeveynlerde stres
nedenleri ve azaltma girişimleri [Source and intervention reduction of stress for parents whose children are in intensive care unit after surgery]. Istanbul University Florence Nightingale Journal of Nursing, 15(60), 179–182.
b) English Articlede Cillia, R., Reisigl, M., & Wodak, R. (1999). The discursive construction of national identity. Discourse
and Society, 10(2), 149–173. http://dx.doi.org/10.1177/0957926599010002002c) Journal Article with DOI and More Than Seven AuthorsLal, H., Cunningham, A. L., Godeaux, O., Chlibek, R., Diez-Domingo, J., Hwang, S.-J. ... Heineman,
T. C. (2015). Efficacy of an adjuvanted herpes zoster subunit vaccine in older adults. New England Journal of Medicine, 372, 2087–2096. http://dx.doi.org/10.1056/NEJMoa1501184
d) Journal Article from Web, without DOISidani, S. (2003). Enhancing the evaluation of nursing care effectiveness. Canadian Journal of
Nursing Research, 35(3), 26–38. Retrieved from http://cjnr.mcgill.cae) Journal Article wih DOITurner, S. J. (2010). Website statistics 2.0: Using Google Analytics to measure library website
effectiveness. Technical Services Quarterly, 27, 261–278. http://dx.doi.org/10.1080/ 07317131003765910
f) Advance Online PublicationSmith, J. A. (2010). Citing advance online publication: A review. Journal of Psychology. Advance
online publication. http://dx.doi.org/10.1037/a45d7867g) Article in a MagazineHenry, W. A., III. (1990, April 9). Making the grade in today’s schools. Time, 135, 28–31.
Doctoral Dissertation, Master’s Thesis, Presentation, Proceedinga) Dissertation/Thesis from a Commercial DatabaseVan Brunt, D. (1997). Networked consumer health information systems (Doctoral dissertation).
Available from ProQuest Dissertations and Theses database. (UMI No. 9943436)

INFORMATION FOR AUTHORS
b) Dissertation/Thesis from an Institutional DatabaseYaylalı-Yıldız, B. (2014). University campuses as places of potential publicness: Exploring the
politicals, social and cultural practices in Ege University (Doctoral dissertation). Retrieved from Retrieved from: http://library.iyte.edu.tr/tr/hizli-erisim/iyte-tez-portali
c) Dissertation/Thesis from WebTonta, Y. A. (1992). An analysis of search failures in online library catalogs (Doctoral dissertation,
University of California, Berkeley). Retrieved from http://yunus.hacettepe.edu.tr/~tonta/yayinlar /phd/ickapak.html
d) Dissertation/Thesis abstracted in Dissertations Abstracts InternationalAppelbaum, L. G. (2005). Three studies of human information processing: Texture amplifica tion,
motion representation, and figure-ground segregation. Dissertation Abstracts International: Section B. Sciences and Engineering, 65(10), 5428.
e) Symposium ContributionKrinsky-McHale, S. J., Zigman, W. B., & Silverman, W. (2012, August). Are neuropsychiatric
symptoms markers of prodromal Alzheimer’s disease in adults with Down syndrome? In W. B. Zigman (Chair), Predictors of mild cognitive impairment, dementia, and mortality in adults with Down syndrome. Symposium conducted at the meeting of the American Psychological Association, Orlando, FL.
f) Conference Paper Abstract Retrieved OnlineLiu, S. (2005, May). Defending against business crises with the help of intelligent agent based
early warning solutions. Paper presented at the Seventh International Conference on Enterprise Information Systems, Miami, FL. Abstract retrieved from http://www.iceis.org/iceis2005/abstracts_2005.htm
g) Conference Paper - In Regularly Published Proceedings and Retrieved OnlineHerculano-Houzel, S., Collins, C. E., Wong, P., Kaas, J. H., & Lent, R. (2008). The basic
nonuniformity of the cerebral cortex. Proceedings of the National Academy of Sciences, 105, 12593–12598. http://dx.doi.org/10.1073/pnas.0805417105
h) Proceeding in Book FormParsons, O. A., Pryzwansky, W. B., Weinstein, D. J., & Wiens, A. N. (1995). Taxonomy for
psychology. In J. N. Reich, H. Sands, & A. N. Wiens (Eds.), Education and training beyond the doctoral degree: Proceedings of the American Psychological Association National Conference on Postdoctoral Education and Training in Psychology (pp. 45–50). Washington, DC: American Psychological Association.
i) Paper PresentationNguyen, C. A. (2012, August). Humor and deception in advertising: When laughter may not be
the best medicine. Paper presented at the meeting of the American Psychological Association, Orlando, FL.
Other Sourcesa) Newspaper ArticleBrowne, R. (2010, March 21). This brainless patient is no dummy. Sydney Morning Herald, 45.b) Newspaper Article with no AuthorNew drug appears to sharply cut risk of death from heart failure. (1993, July 15). The Washington
Post, p. A12.c) Web Page/Blog PostBordwell, D. (2013, June 18). David Koepp: Making the world movie-sized [Web log post].
Retrieved from http://www.davidbordwell.net/blog/page/27/d) Online Encyclopedia/DictionaryIgnition. (1989). In Oxford English online dictionary (2nd ed.). Retrieved from http://dictionary.
oed.comMarcoux, A. (2008). Business ethics. In E. N. Zalta (Ed.). The Stanford encyclopedia of
philosophy. Retrieved from http://plato.stanford.edu/entries/ethics-business/

INFORMATION FOR AUTHORS
e) PodcastDunning, B. (Producer). (2011, January 12). in Fact: Conspiracy theories [Video podcast].
Retrieved from http://itunes.apple.com/f) Single Episode in a Television SeriesEgan, D. (Writer), & Alexander, J. (Director). (2005). Failure to communicate. [Television series
episode]. In D. Shore (Executive producer), House; New York, NY: Fox Broadcasting.g) MusicFuchs, G. (2004). Light the menorah. On Eight nights of Hanukkah [CD]. Brick, NJ: Kid Kosher.
SUBMISSION CHECKLIST
Ensure that the following items are present:● Cover letter to the editor The category of the manuscript Confirming that “the paper is not under consideration for publication in another journal”. Including disclosure of any commercial or financial involvement. Confirming that last control for fluent English was done. Confirming that journal policies detailed in Information for Authors have been reviewed. Confirming that the references cited in the text and listed in the references section are in line
with APA 6.● Copyright Agreement Form ● Permission of previous published material if used in the present manuscript● Title page The category of the manuscript The title of the manuscript both in the language of article and in English All authors’ names and affiliations (institution, faculty/department, city, country), e-mail
addresses Corresponding author’s email address, full postal address, telephone and fax number ORCIDs of all authors.● Main Manuscript Document The title of the manuscript both in the language of article and in English Abstracts (200-250 words) both in the language of article and in English Key words: 5 words both in the language of article and in English Grant support (if exists) Conflict of interest (if exists) Acknowledgement (if exists) References All tables, illustrations (figures) (including title, description, footnotes

COPYRIGHT AGREEMENT FORM
Responsible/Corresponding AuthorSorumlu YazarTitle of ManuscriptMakalenin BaşlığıAcceptance dateKabul TarihiList of authorsYazarların Listesi
Responsible/Corresponding Author;Sorumlu Yazar; Signature / İmza Date / Tarih
……../……../……………
SıraNo
Name - SurnameAdı-Soyadı
E-mailE-Posta
Signatureİmza
DateTarih
1
2
3
4
5
Manuscript Type (Research Article, Review, Short communication, etc.)Makalenin türü (Araştırma makalesi, Derleme, Kısa bildiri, v.b.)Responsible/Corresponding Author: Sorumlu Yazar:
University/company/institution Çalıştığı kurumAddress Posta adresiE-mail E-postaPhone; mobile phone Telefon no; GSM no
The author(s) agrees that:The manuscript submitted is his/her/their own original work, and has not been plagiarized from any prior work,all authors participated in the work in a substantive way, and are prepared to take public responsibility for the work,all authors have seen and approved the manuscript as submitted,the manuscript has not been published and is not being submitted or considered for publication elsewhere,the text, illustrations, and any other materials included in the manuscript do not infringe upon any existing copyright or other rights of anyone.ISTANBUL UNIVERSITY will publish the content under Creative Commons Attribution-NonCommercial 4.0 International (CC BY-NC 4.0) license that gives permission to copy and redistribute the material in any medium or format other than commercial purposes as well as remix, transform and build upon the material by providing appropriate credit to the original work.The Contributor(s) or, if applicable the Contributor’s Employer, retain(s) all proprietary rights in addition to copyright, patent rights;to use, free of charge, all parts of this article for the author’s future works in books, lectures, classroom teaching or oral presentations,the right to reproduce the article for their own purposes provided the copies are not offered for sale.All materials related to manuscripts, accepted or rejected, including photographs, original figures etc., will be kept by ISTANBUL UNIVERSITY for one year following the editor’s decision. These materials will then be destroyed.I/We indemnify ISTANBUL UNIVERSITY and the Editors of the Journals, and hold them harmless from any loss, expense or damage occasioned by a claim or suit by a third party for copyright infringement, or any suit arising out of any breach of the foregoing warranties as a result of publication of my/our article. I/We also warrant that the article contains no libelous or unlawful statements, and does not contain material or instructions that might cause harm or injury.This Copyright Agreement Form must be signed/ratified by all authors. Separate copies of the form (completed in full) may be submitted by authors located at different institutions; however, all signatures must be original and authenticated.Yazar(lar) aşağıdaki hususları kabul ederSunulan makalenin yazar(lar)ın orijinal çalışması olduğunu ve intihal yapmadıklarını,Tüm yazarların bu çalışmaya asli olarak katılmış olduklarını ve bu çalışma için her türlü sorumluluğu aldıklarını,Tüm yazarların sunulan makalenin son halini gördüklerini ve onayladıklarını,Makalenin başka bir yerde basılmadığını veya basılmak için sunulmadığını,Makalede bulunan metnin, şekillerin ve dokümanların diğer şahıslara ait olan Telif Haklarını ihlal etmediğini kabul ve taahhüt ederler.İSTANBUL ÜNİVERSİTESİ’nin bu fikri eseri, Creative Commons Atıf-GayrıTicari 4.0 Uluslararası (CC BY-NC 4.0) lisansı ile yayınlamasına izin verirler. Creative Commons Atıf-GayrıTicari 4.0 Uluslararası (CC BY-NC 4.0) lisansı, eserin ticari kullanım dışında her boyut ve formatta paylaşılmasına, kopyalanmasına, çoğaltılmasına ve orijinal esere uygun şekilde atıfta bulunmak kaydıyla yeniden düzenleme, dönüştürme ve eserin üzerine inşa etme dâhil adapte edilmesine izin verir.Yazar(lar)ın veya varsa yazar(lar)ın işvereninin telif dâhil patent hakları, yazar(lar)ın gelecekte kitaplarında veya diğer çalışmalarında makalenin tümünü ücret ödemeksizin kullanma hakkı makaleyi satmamak koşuluyla kendi amaçları için çoğaltma hakkı gibi fikri mülkiyet hakları saklıdır.Yayımlanan veya yayıma kabul edilmeyen makalelerle ilgili dokümanlar (fotoğraf, orijinal şekil vb.) karar tarihinden başlamak üzere bir yıl süreyle İSTANBUL ÜNİVERSİTESİ’nce saklanır ve bu sürenin sonunda imha edilir.Ben/Biz, telif hakkı ihlali nedeniyle üçüncü şahıslarca vuku bulacak hak talebi veya açılacak davalarda İSTANBUL ÜNİVERSİTESİ ve Dergi Editörlerinin hiçbir sorumluluğunun olmadığını, tüm sorumluluğun yazarlara ait olduğunu taahhüt ederim/ederiz.Ayrıca Ben/Biz makalede hiçbir suç unsuru veya kanuna aykırı ifade bulunmadığını, araştırma yapılırken kanuna aykırı herhangi bir malzeme ve yöntem kullanılmadığını taahhüt ederim/ederiz.Bu Telif Hakkı Anlaşması Formu tüm yazarlar tarafından imzalanmalıdır/onaylanmalıdır. Form farklı kurumlarda bulunan yazarlar tarafından ayrı kopyalar halinde doldurularak sunulabilir. Ancak, tüm imzaların orijinal veya kanıtlanabilir şekilde onaylı olması gerekir..
Journal name: Journal of TourismologyDergi Adı: Journal of Tourismology
Copyright Agreement Form Telif Hakkı Anlaşması Formu
İstanbul Universityİstanbul Üniversitesi