Abundance Gradients and the Role of Supernovae in M87
19
arXiv:astro-ph/0202095v1 5 Feb 2002 TO APPEAR IN APJ Preprint typeset using L A T E X style emulateapj v. 11/12/01 ABUNDANCE GRADIENTS AND THE ROLE OF SNE IN M87 FABIO GASTALDELLO IASF - CNR, via Bassini 15, I-20133 Milano, Italy Università di Milano Bicocca, Dip. di Fisica, P.za della Scienza 3 I-20133 Milano, Italy [email protected] AND SILVANO MOLENDI IASF - CNR, via Bassini 15, I-20133 Milano, Italy [email protected] to appear in ApJ ABSTRACT We make a detailed measurement of the metal abundance profiles and metal abundance ratios of the inner core of M87/Virgo observed by XMM-Newton during the PV phase. We use multi temperature models for the inner regions and we compare the plasma codes APEC and MEKAL. We confirm the strong heavy elements gradient previously found by ASCA and BeppoSAX, but also find a significant increase in light elements, in particular O. This fact together with the constant O/Fe ratio in the inner 9 arcmin indicates an enhancement of contribution in the core of the cluster not only by SNIa but also by SNII. Subject headings: X-rays: galaxies — Galaxies: clusters — Galaxies: individual: M87 — Galaxies: abundances 1. INTRODUCTION The X-ray emitting hot intra-cluster medium (ICM) of clus- ters of galaxies is known to contain a large amount of metals: for rich clusters between red-shift 0.3-0.4 and the present day the observed metallicity is about 1/3 the solar value (Mushotzky & Lowenstein 1997; Fukazawa et al. 1998; Allen & Fabian 1998; Della Ceca et al. 2000; Ettori et al. 2001), suggesting that a significant fraction of the ICM has been processed into stars already at intermediate red-shifts. While the origin of the metals observed in the ICM is clear (they are produced by supernovae), less clear is the transfer mechanism of these metals to the ICM. The main mechanisms that have been proposed for the metal enrichment in clusters are: enrichment of gas during the formation of the proto-cluster (Kauffman & Charlot 1998); ram pressure stripping of metal enriched gas from cluster galaxies (Gunn & Gott 1972; Toni- azzo & Schindler 2001); stellar winds AGN- or SN-induced in Early-type galaxies (Matteucci & Vettolani 1988; Renzini 1997). Spatially resolved abundance measurement in galaxy clus- ters are of great importance because they can be used to mea- sure the precise amounts of metals in the ICM and to constrain the origin of metals both spatially and in terms of the different contributions of the two different type of SNe (SNII and SNIa) as a function of the position in the cluster. The first two satel- lites able to perform spatially resolved spectroscopy, ASCA and BeppoSAX have revealed abundance gradients in cD clusters (Dupke & White 2000b; De Grandi & Molendi 2001), in partic- ular M87/Virgo (Matsumoto et al. 1996; Guainazzi & Molendi 2000), and variations in Si/Fe within a cluster (Finoguenov et al. 2000) and among clusters (Fukazawa et al. 1998). Since the SNIa products are iron enriched, while the SNII products are rich in α elements, such as O, Ne, Mg and Si, the variations in Si/Fe suggest that the metals in the ICM have been produced by a mix of the two types of SNe. The exact amount of these mix still remain controversial: Mushotzky et al. (1996) and Mushotzky & Lowenstein (1997) showed a dominance of SNII ejecta, while other works on ASCA data (Ishimaru & Arimoto 1997; Fukazawa et al. 1998; Finoguenov et al. 2000; Dupke & White 2000a), still indicating a predominance of SNII enrich- ment at large radii in clusters, do not exclude that as much as 50% of the iron in clusters come from SNIa ejecta in the inner part of clusters. M87 is the cD galaxy of the nearest cluster and its high flux and close location allows, using the unprecedented combina- tion of spectral and spatial resolution and high throughput of the EPIC experiment on board XMM-Newton, a detailed study of the ICM abundance down to the scale of the kpc. Through- out this paper, we assume H 0 = 50kms -1 Mpc -1 , q 0 =0.5 and at the distance of M87 1 ′ corresponds to 5 kpc. Recently, when we were finishing the writing of the paper, we have learned of the Finoguenov et al (2001) analysis of the same data. Our work is complementary with theirs in the sense that we use 10 annular bins instead of 2, fully exploiting the quality of the XMM data and taking into account the multi tem- perature appearance of spectra in the inner regions with ade- quate spectral modeling. The outline of the paper is as follows. In section 2 we give information about the XMM observation and on the data prepa- ration. In section 3 we suggest the use of a unique set of “stan- dard” abundances. In section 4 we describe our spectral mod- eling. In section 5 we present spatially resolved measurements of metal abundances and abundance ratios and in section 6 we discuss our results. A summary of our conclusions is given in section 7. 2. OBSERVATION AND DATA PREPARATION M87/Virgo was observed with XMM-Newton (Jansen et al. 2001) during the PV phase with the MOS detector in Full Frame Mode for an effective exposure time of about 39 ks. Details on the observation have been published in Böhringer et al. (2001) and Belsole et al. (2001). We have obtained calibrated event files for the MOS1 and MOS2 cameras with SASv5.0. Data 1
Transcript of Abundance Gradients and the Role of Supernovae in M87
arX
iv:a
stro
-ph/
0202
095v
1 5
Feb
200
2TO APPEAR IN APJ
Preprint typeset using LATEX style emulateapj v. 11/12/01
ABUNDANCE GRADIENTS AND THE ROLE OF SNE IN M87
FABIO GASTALDELLO
IASF - CNR, via Bassini 15, I-20133 Milano, ItalyUniversità di Milano Bicocca, Dip. di Fisica, P.za della Scienza 3 I-20133 Milano, Italy
AND
SILVANO MOLENDI
IASF - CNR, via Bassini 15, I-20133 Milano, [email protected]
to appear in ApJ
ABSTRACT
We make a detailed measurement of the metal abundance profiles and metal abundance ratios of the inner coreof M87/Virgo observed byXMM-Newtonduring the PV phase. We use multi temperature models for the innerregions and we compare the plasma codes APEC and MEKAL. We confirm the strong heavy elements gradientpreviously found byASCAandBeppoSAX, but also find a significant increase in light elements, in particular O.This fact together with the constant O/Fe ratio in the inner 9arcmin indicates an enhancement of contribution inthe core of the cluster not only by SNIa but also by SNII.
Subject headings:X-rays: galaxies — Galaxies: clusters — Galaxies: individual: M87 — Galaxies: abundances
1. INTRODUCTION
The X-ray emitting hot intra-cluster medium (ICM) of clus-ters of galaxies is known to contain a large amount of metals:for rich clusters between red-shift 0.3-0.4 and the presentdaythe observed metallicity is about 1/3 the solar value (Mushotzky& Lowenstein 1997; Fukazawa et al. 1998; Allen & Fabian1998; Della Ceca et al. 2000; Ettori et al. 2001), suggestingthat a significant fraction of the ICM has been processed intostars already at intermediate red-shifts.
While the origin of the metals observed in the ICM is clear(they are produced by supernovae), less clear is the transfermechanism of these metals to the ICM. The main mechanismsthat have been proposed for the metal enrichment in clustersare: enrichment of gas during the formation of the proto-cluster(Kauffman & Charlot 1998); ram pressure stripping of metalenriched gas from cluster galaxies (Gunn & Gott 1972; Toni-azzo & Schindler 2001); stellar winds AGN- or SN-inducedin Early-type galaxies (Matteucci & Vettolani 1988; Renzini1997).
Spatially resolved abundance measurement in galaxy clus-ters are of great importance because they can be used to mea-sure the precise amounts of metals in the ICM and to constrainthe origin of metals both spatially and in terms of the differentcontributions of the two different type of SNe (SNII and SNIa)as a function of the position in the cluster. The first two satel-lites able to perform spatially resolved spectroscopy,ASCAandBeppoSAXhave revealed abundance gradients in cD clusters(Dupke & White 2000b; De Grandi & Molendi 2001), in partic-ular M87/Virgo (Matsumoto et al. 1996; Guainazzi & Molendi2000), and variations in Si/Fe within a cluster (Finoguenovetal. 2000) and among clusters (Fukazawa et al. 1998). Since theSNIa products are iron enriched, while the SNII products arerich in α elements, such as O, Ne, Mg and Si, the variations inSi/Fe suggest that the metals in the ICM have been producedby a mix of the two types of SNe. The exact amount of thesemix still remain controversial: Mushotzky et al. (1996) and
Mushotzky & Lowenstein (1997) showed a dominance of SNIIejecta, while other works onASCAdata (Ishimaru & Arimoto1997; Fukazawa et al. 1998; Finoguenov et al. 2000; Dupke &White 2000a), still indicating a predominance of SNII enrich-ment at large radii in clusters, do not exclude that as much as50% of the iron in clusters come from SNIa ejecta in the innerpart of clusters.
M87 is the cD galaxy of the nearest cluster and its high fluxand close location allows, using the unprecedented combina-tion of spectral and spatial resolution and high throughputofthe EPIC experiment on boardXMM-Newton, a detailed studyof the ICM abundance down to the scale of the kpc. Through-out this paper, we assumeH0 = 50kms−1Mpc−1, q0 = 0.5 and atthe distance of M87 1′ corresponds to 5 kpc.
Recently, when we were finishing the writing of the paper,we have learned of the Finoguenov et al (2001) analysis of thesame data. Our work is complementary with theirs in the sensethat we use 10 annular bins instead of 2, fully exploiting thequality of theXMM data and taking into account the multi tem-perature appearance of spectra in the inner regions with ade-quate spectral modeling.
The outline of the paper is as follows. In section 2 we giveinformation about theXMM observation and on the data prepa-ration. In section 3 we suggest the use of a unique set of “stan-dard” abundances. In section 4 we describe our spectral mod-eling. In section 5 we present spatially resolved measurementsof metal abundances and abundance ratios and in section 6 wediscuss our results. A summary of our conclusions is given insection 7.
2. OBSERVATION AND DATA PREPARATION
M87/Virgo was observed withXMM-Newton(Jansen et al.2001) during the PV phase with the MOS detector in Full FrameMode for an effective exposure time of about 39 ks. Details onthe observation have been published in Böhringer et al. (2001)and Belsole et al. (2001). We have obtained calibrated eventfiles for the MOS1 and MOS2 cameras with SASv5.0. Data
1
2 Gastaldello & Molendi
were manually screened to remove any remaining bright pixelsor hot column. Periods in which the background is increasedby soft proton flares have been excluded using an intensity fil-ter: we rejected all events accumulated when the count ratesexceeds 15 cts/100s in the [10 – 12] keV band for the two MOScameras.
We have accumulated spectra in 10 concentric annular re-gions centered on the emission peak extending our analysis outto 14 arcmin from the emission peak, thus exploiting the entireXMM field of view. We have removed point sources and thesubstructures which are clearly visible from the X-ray image(Belsole et al. 2001) except in the innermost region, where wehave kept the nucleus and knot A, because on angular scalesso small it is not possible to exclude completely their emis-sion. We prefer to fit the spectrum of this region with a modelwhich includes a power law component to fit the two point likesources. We include only one power law component due to thesimilarity of the two sources spectra (Böhringer et al. 2001).The bounding radii are 0′-0.5′, 0.5′-1′, 1′-2′, 2′-3′, 3′-4′, 4′-5′,5′-7′, 7′-9′, 9′-11′ and 11′-14′. The analysis of the 4 centralregions within 3 arcmin was already discussed in Molendi &Gastaldello (2001).
Spectra have been accumulated for MOS1 and MOS2 inde-pendently. The Lockman Hole observations have been used forthe background. Background spectra have been accumulatedfrom the same detector regions as the source spectra.
The vignetting correction has been applied to the spectrarather than to the effective area, as is customary in the analysisof EPIC data (Arnaud et al. 2001). Spectral fits were performedin the 0.5-4.0 keV band. Data below 0.5 keV were excluded toavoid residual calibration problems in the MOS response matri-ces at soft energies. Data above 4 keV were excluded becauseof substantial contamination of the spectra by hotter gas emit-ting further out in the cluster, on the same line of sight.
As discussed in Molendi (2001) there are cross-calibrationuncertainties between the spectral response of the two EPICin-struments, MOS and PN. In particular for what concern the softenergy band (0.5-1.0 keV) fitting six extra-galactic spectra forwhich no excess absorption is expected, MOS recovered the NHgalactic value, while PN gives smaller NH by 1− 2×1020cm−2.Thus we think that at the moment the MOS results are morereliable than the PN ones in this energy band, which is crucialfor the O abundance measure. For this reason and for the betterspectral resolutions of MOS, which is again important in deriv-ing the O abundance, we limit our analysis to MOS data.
3. SOLAR ABUNDANCES
The elemental abundances of astrophysical objects are usu-ally expressed by the relative values to the solar abundances.The so-called solar abundances can be either “meteoritic” or“photospheric”.
This distinction between “meteoritic” and “photospheric”so-lar abundances was made in the review by Anders & Grevesse(1989). Significant discrepancies exist between the two sets ofabundances quoted in that paper, particularly for iron and thishas caused in the past some controversy in the discussion of theresults of cluster abundances (Ishimaru & Arimoto 1997; Gib-son et al. 1997). However recent photospheric models of thesun indicate that photospheric and meteoritic abundances agreeperfectly and the community has converged toward a “standardsolar composition” (Grevesse & Sauval 1998), with sugges-tions to the astrophysical community to accept this new state
of the art (Brighenti & Mathews 1999). For the above reason,in this paper we shall adopt the Grevesse & Sauval (1998) val-ues. Since the solar abundance table used by default in XSPECis based on photospheric values of Anders & Grevesse (1989),we have switched to a table taken from the data by Grevesse& Sauval (1998) by means of the XSPEC command ABUND.In general a simple scaling allows to switch from one set ofabundances to the other.
4. SPECTRAL MODELING AND PLASMA CODES
All spectral fitting has been performed using version 11.0.1of the XSPEC package.
All models discussed below include a multiplicative com-ponent to account for the galactic absorption on the line ofsight of M87. The column density is always fixed at a valueof 1.8×1020cm−2, which is derived from 21cm measurements(Lieu et al. 1996). Leaving NH to freely vary does not improvethe fit and does not affect the measure of the oxygen abundance,which could have been the more sensitive to the presence of ex-cess absorption. The NH value obtained is consistent within theerrors with the 21cm value.
The temperature profile for M87 (Böhringer et al. 2001)shows a small gradient for radii larger than∼ 2 arcmin anda rapid decrease for smaller radii. Moreover, as pointed outin Molendi & Pizzolato (2001) all spectra at radii larger than2 arcmin are characterized by being substantially isothermal(although the spectra of the regions between 2 and 7 arcminare multi temperature spectra with a narrow temperature rangerather than single temperature spectra), while at radii smallerthan 2 arcmin we need models which can reproduce the broadtemperature distribution of the inner regions.
We therefore apply to the central regions (inside 3 arcmin)three different spectral models.
A two temperature model (vmekal + vmekal in XSPEC andmodel II in Molendi & Gastaldello (2001) using the plasmacode MEKAL (Mewe et al. 1985; Liedahl et al. 1995). Thismodel has 15 free parameters: the temperature and the normal-ization of the two components and the abundance of O, Ne, Na,Mg, Al, Si, S, Ar, Ca, Fe and Ni, all expressed in solar units.The metal abundance of each element of the second thermalcomponent is bound to be equal to the same parameter of thefirst thermal component. This model is used (e.g. Makishimaet al. (2001) and refs. therein) as an alternative to cooling-flowmodels in fitting the central regions of galaxy clusters.
A “fake multi-phase” model (vmekal + vmcflow in XSPECand model III in Molendi & Gastaldello (2001). This modelhas 15 free parameters, as the two temperature model, becausethe maximum temperatureTmax is tied to the vmekal componenttemperature. As indicated in recent papers (Molendi & Pizzo-lato 2001; Molendi & Gastaldello 2001) this model is used todescribe a scenario different from a multi-phase gas, for whichit was written for: the gas is all at one temperature and themulti-phase appearance of the spectrum comes from projectionof emission from many different physical radii. A more correctdescription will be given by a real deprojection of the spectrum(Pizzolato et al., in preparation).
The third model is the analogue of the vmekal two tempera-ture model using the plasma code APEC (Smith et al. 2001).This model has 14 free parameters, one less than the corre-sponding model using vmekal because APEC misses the Naparameter.
We can’t adopt an APEC analogue of the fake multi-phase
Abundance gradients and the role of SNe in M87 3
model because the cooling flow model calculating its emissionusing APEC is still under development. Given the substantialagreement between 2T and fake multi-phase model (Molendi& Gastaldello 2001), we can regard the 2T APEC results asindicative also for a fake multi-phase model.
For the spectrum accumulated in the innermost region we in-cluded also a power law component to model the emission ofthe nucleus and of knot A.
For the outer regions (from 3 arcmin outwards) we apply sin-gle temperature models: vmekal using the MEKAL code, with13 free parameters and vapec using the APEC code, with 12free parameters.
As pointed out by the authors of the new code, cross-checking is very important, since each plasma emission coderequires choosing from a large overlapping but incomplete setof atomic data and the results obtained by using independentmodels allows critical comparison and evaluation of errorsinthe code and in the atomic database.
5. RESULTS
5.1. Abundance measurements and modeling concerns
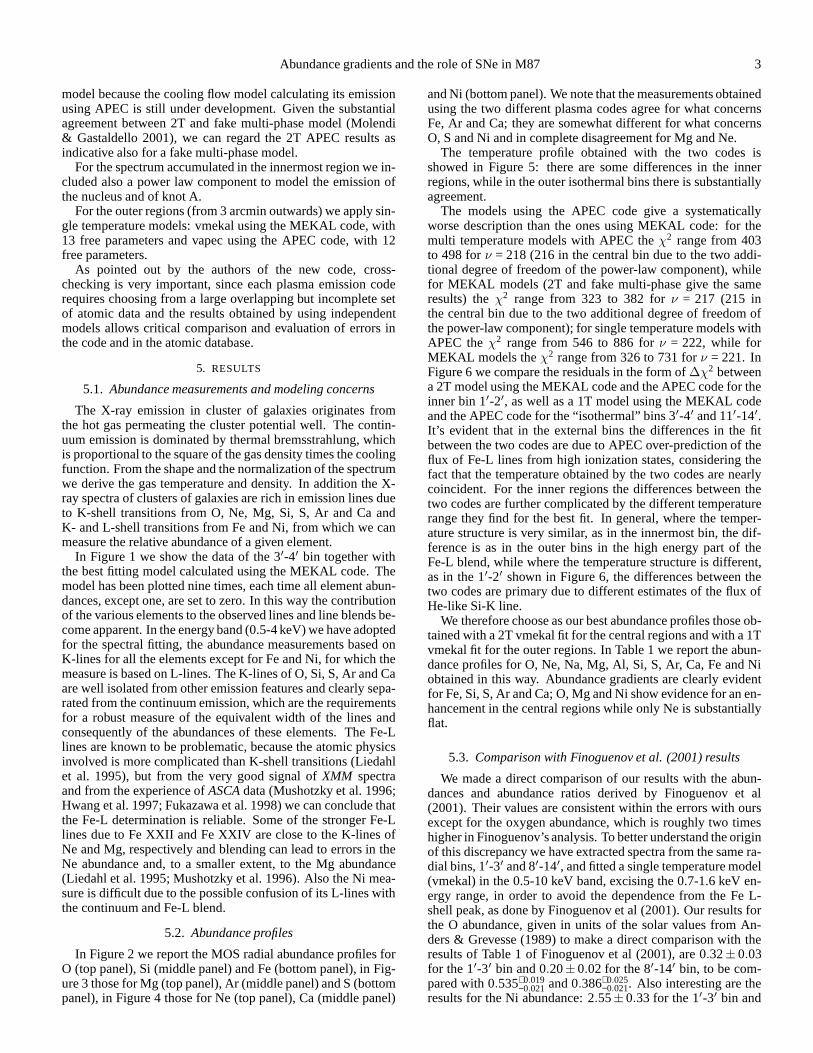
The X-ray emission in cluster of galaxies originates fromthe hot gas permeating the cluster potential well. The contin-uum emission is dominated by thermal bremsstrahlung, whichis proportional to the square of the gas density times the coolingfunction. From the shape and the normalization of the spectrumwe derive the gas temperature and density. In addition the X-ray spectra of clusters of galaxies are rich in emission lines dueto K-shell transitions from O, Ne, Mg, Si, S, Ar and Ca andK- and L-shell transitions from Fe and Ni, from which we canmeasure the relative abundance of a given element.
In Figure 1 we show the data of the 3′-4′ bin together withthe best fitting model calculated using the MEKAL code. Themodel has been plotted nine times, each time all element abun-dances, except one, are set to zero. In this way the contributionof the various elements to the observed lines and line blendsbe-come apparent. In the energy band (0.5-4 keV) we have adoptedfor the spectral fitting, the abundance measurements based onK-lines for all the elements except for Fe and Ni, for which themeasure is based on L-lines. The K-lines of O, Si, S, Ar and Caare well isolated from other emission features and clearly sepa-rated from the continuum emission, which are the requirementsfor a robust measure of the equivalent width of the lines andconsequently of the abundances of these elements. The Fe-Llines are known to be problematic, because the atomic physicsinvolved is more complicated than K-shell transitions (Liedahlet al. 1995), but from the very good signal ofXMM spectraand from the experience ofASCAdata (Mushotzky et al. 1996;Hwang et al. 1997; Fukazawa et al. 1998) we can conclude thatthe Fe-L determination is reliable. Some of the stronger Fe-Llines due to Fe XXII and Fe XXIV are close to the K-lines ofNe and Mg, respectively and blending can lead to errors in theNe abundance and, to a smaller extent, to the Mg abundance(Liedahl et al. 1995; Mushotzky et al. 1996). Also the Ni mea-sure is difficult due to the possible confusion of its L-lineswiththe continuum and Fe-L blend.
5.2. Abundance profiles
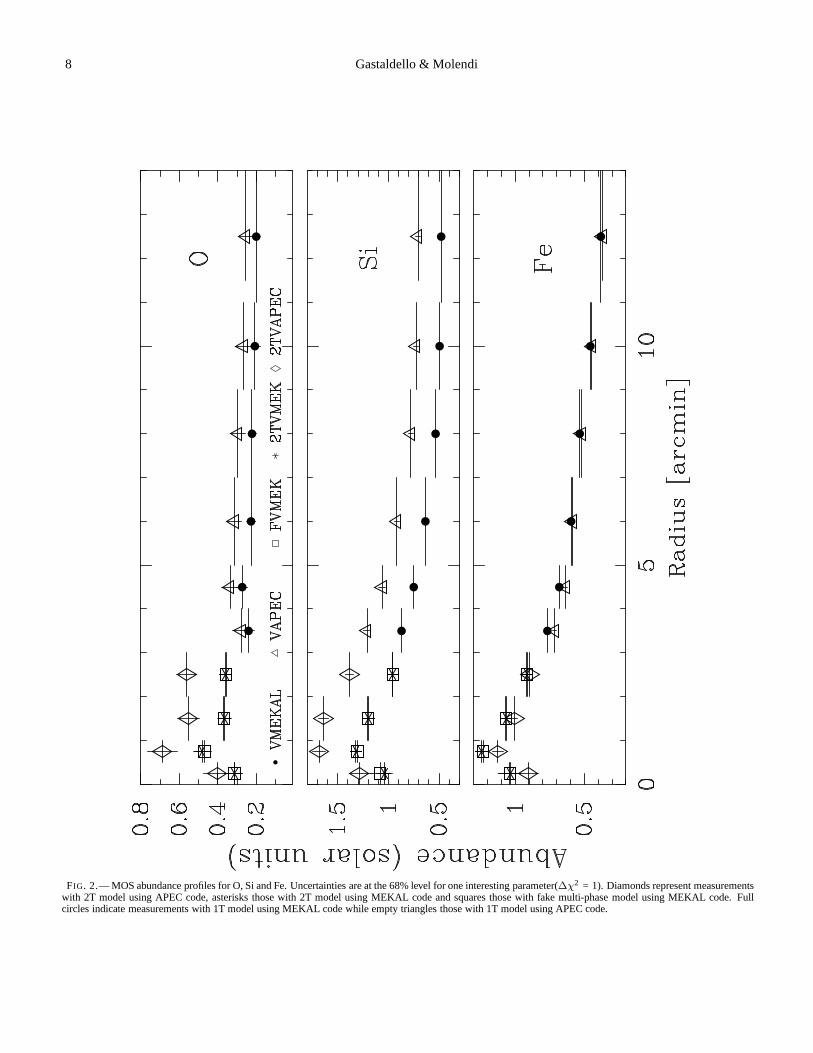
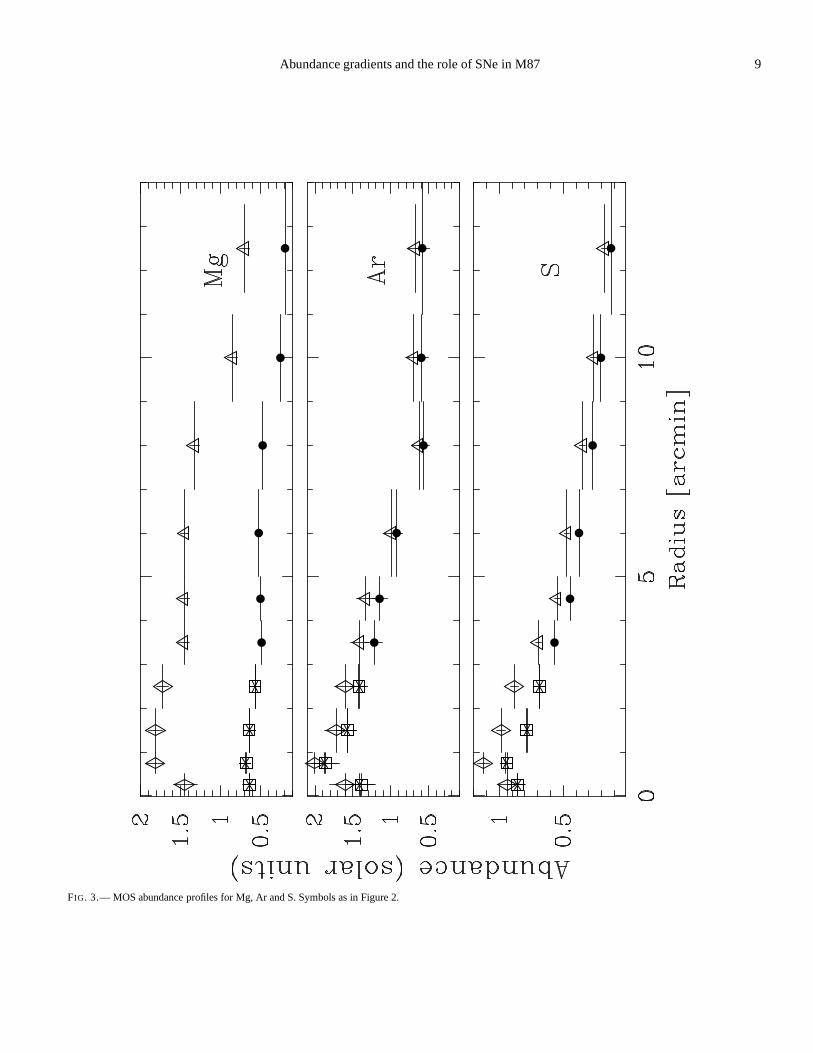
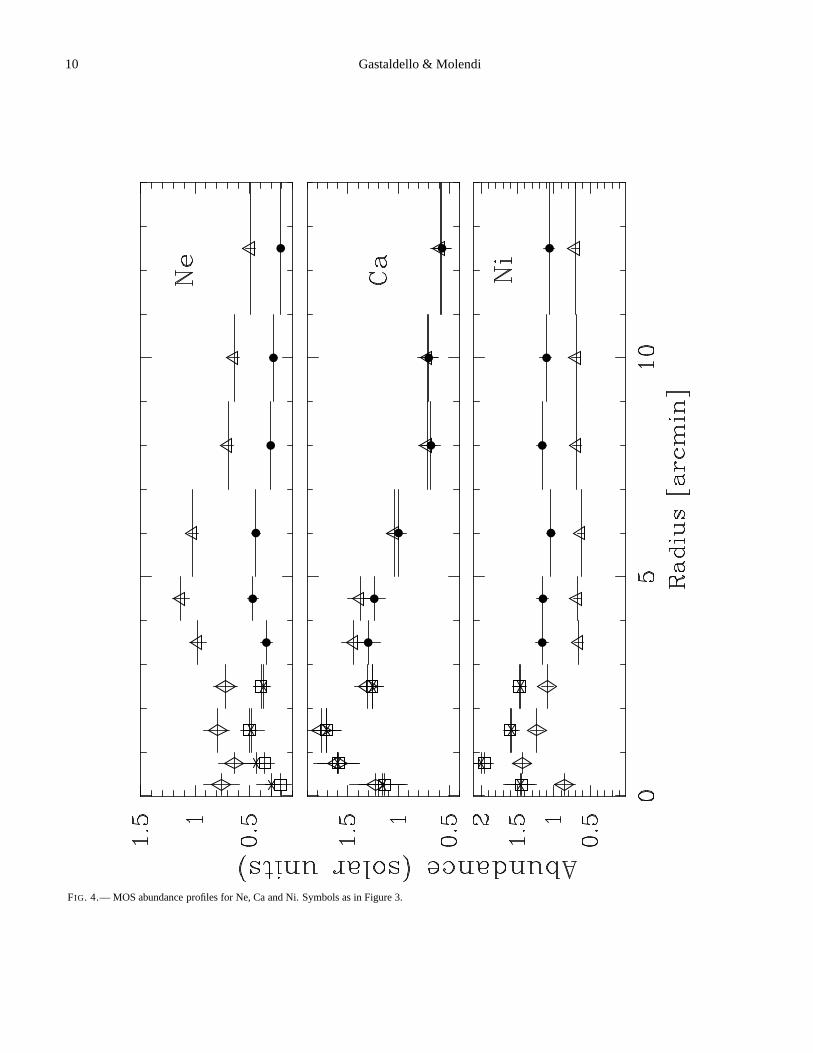
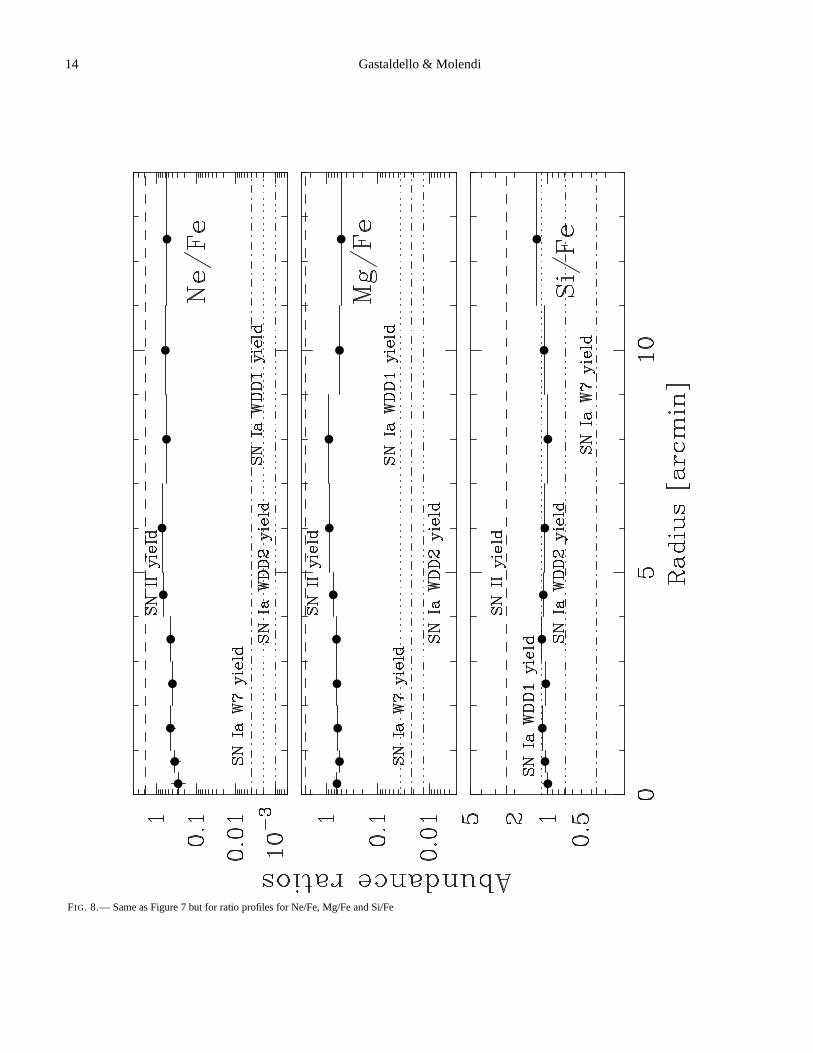
In Figure 2 we report the MOS radial abundance profiles forO (top panel), Si (middle panel) and Fe (bottom panel), in Fig-ure 3 those for Mg (top panel), Ar (middle panel) and S (bottompanel), in Figure 4 those for Ne (top panel), Ca (middle panel)
and Ni (bottom panel). We note that the measurements obtainedusing the two different plasma codes agree for what concernsFe, Ar and Ca; they are somewhat different for what concernsO, S and Ni and in complete disagreement for Mg and Ne.
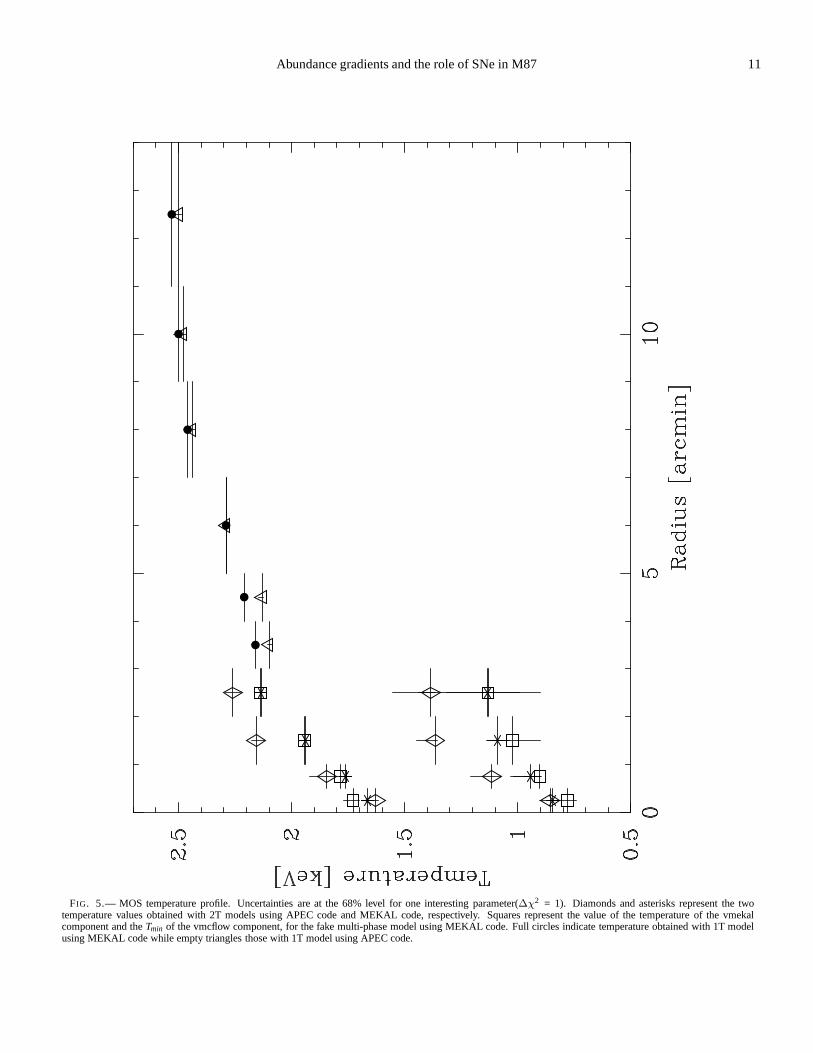
The temperature profile obtained with the two codes isshowed in Figure 5: there are some differences in the innerregions, while in the outer isothermal bins there is substantiallyagreement.
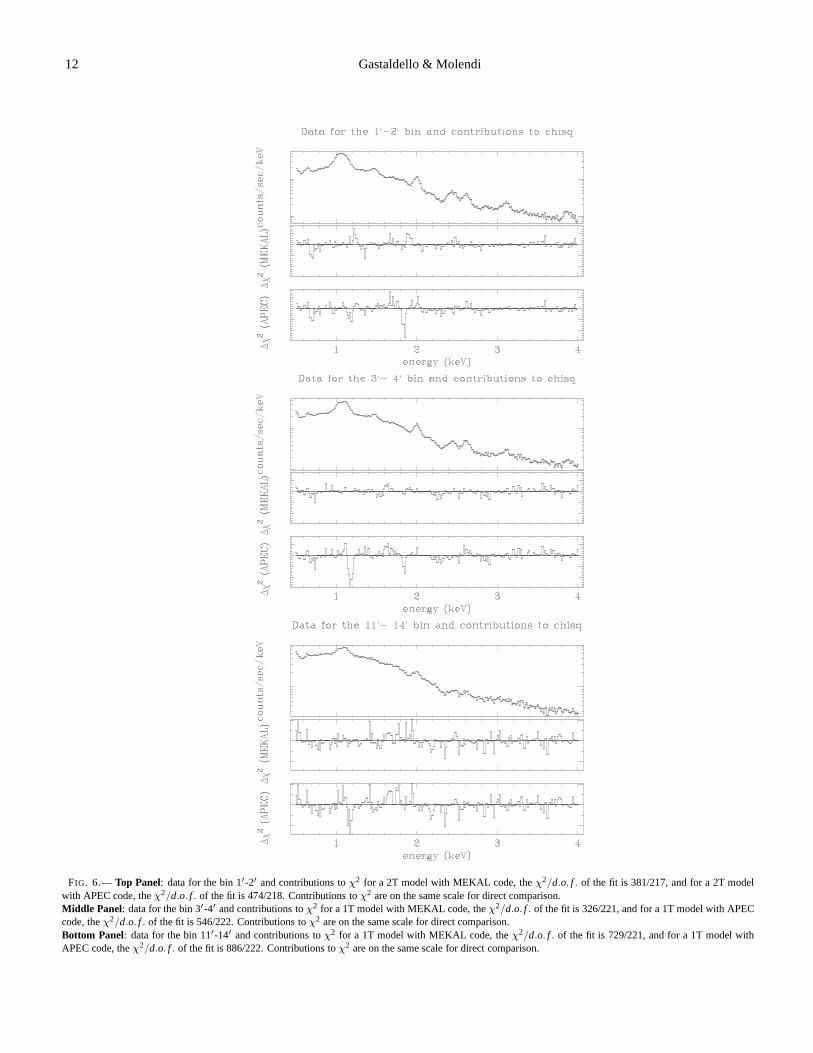
The models using the APEC code give a systematicallyworse description than the ones using MEKAL code: for themulti temperature models with APEC theχ2 range from 403to 498 forν = 218 (216 in the central bin due to the two addi-tional degree of freedom of the power-law component), whilefor MEKAL models (2T and fake multi-phase give the sameresults) theχ2 range from 323 to 382 forν = 217 (215 inthe central bin due to the two additional degree of freedom ofthe power-law component); for single temperature models withAPEC theχ2 range from 546 to 886 forν = 222, while forMEKAL models theχ2 range from 326 to 731 forν = 221. InFigure 6 we compare the residuals in the form of∆χ2 betweena 2T model using the MEKAL code and the APEC code for theinner bin 1′-2′, as well as a 1T model using the MEKAL codeand the APEC code for the “isothermal” bins 3′-4′ and 11′-14′.It’s evident that in the external bins the differences in thefitbetween the two codes are due to APEC over-prediction of theflux of Fe-L lines from high ionization states, considering thefact that the temperature obtained by the two codes are nearlycoincident. For the inner regions the differences between thetwo codes are further complicated by the different temperaturerange they find for the best fit. In general, where the temper-ature structure is very similar, as in the innermost bin, thedif-ference is as in the outer bins in the high energy part of theFe-L blend, while where the temperature structure is different,as in the 1′-2′ shown in Figure 6, the differences between thetwo codes are primary due to different estimates of the flux ofHe-like Si-K line.
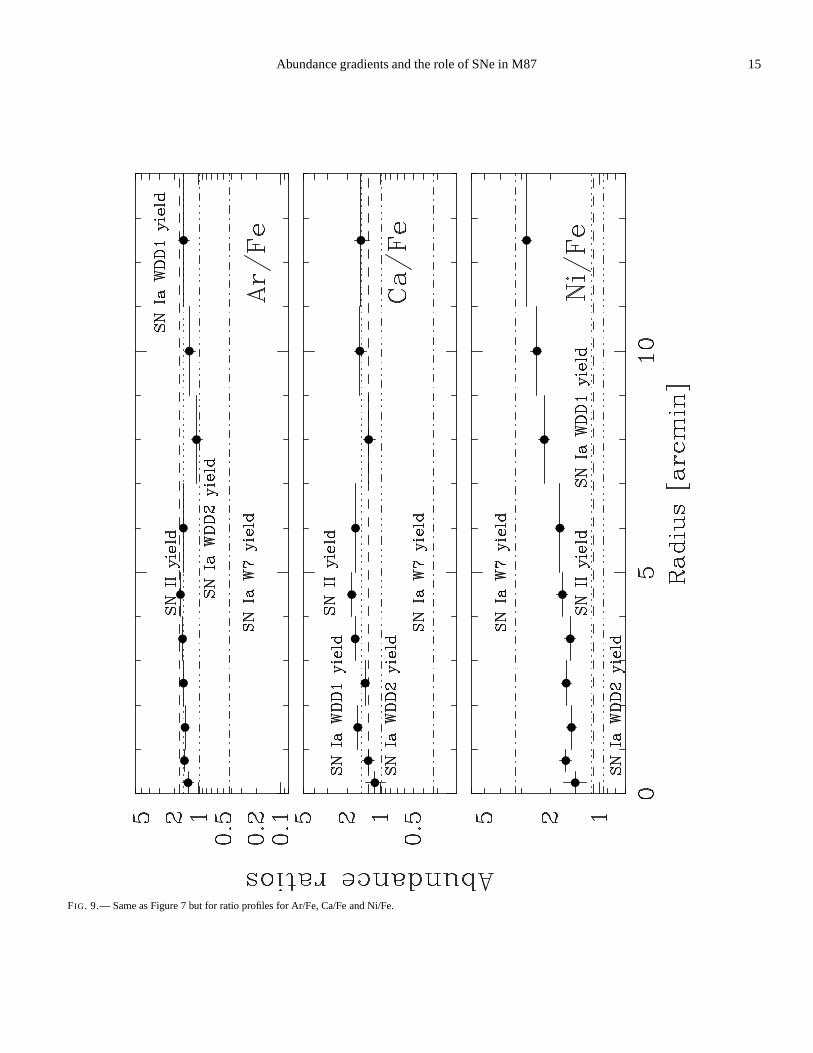
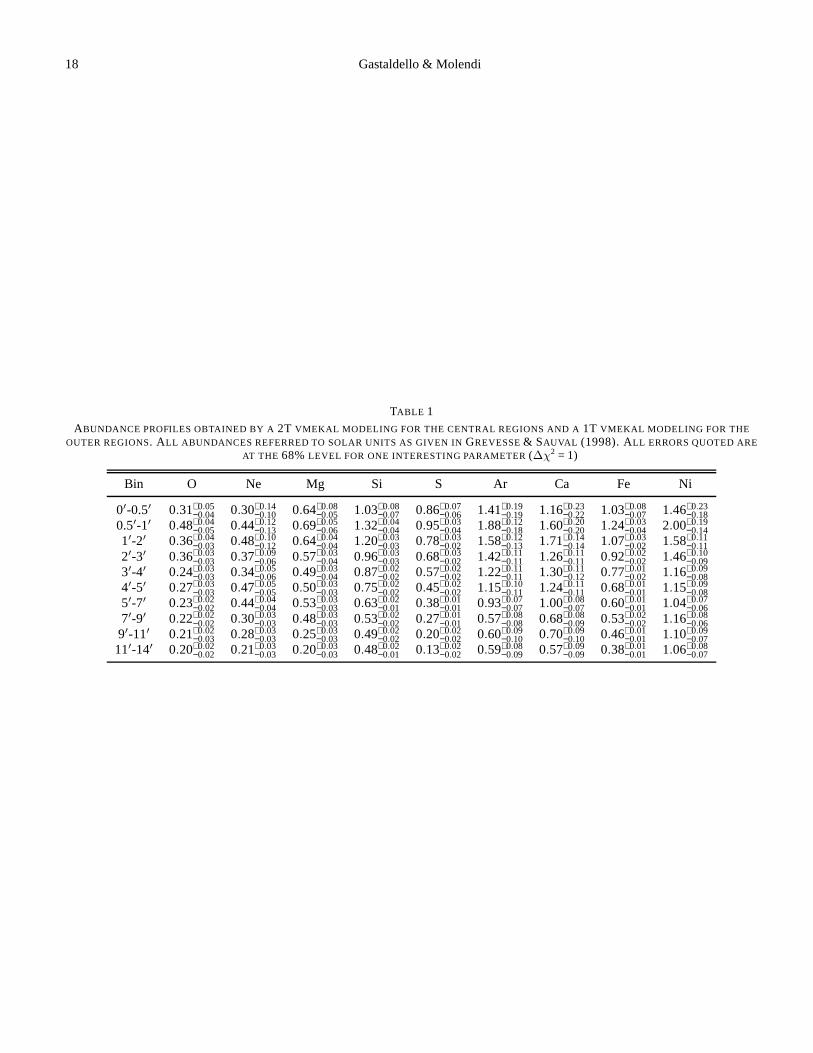
We therefore choose as our best abundance profiles those ob-tained with a 2T vmekal fit for the central regions and with a 1Tvmekal fit for the outer regions. In Table 1 we report the abun-dance profiles for O, Ne, Na, Mg, Al, Si, S, Ar, Ca, Fe and Niobtained in this way. Abundance gradients are clearly evidentfor Fe, Si, S, Ar and Ca; O, Mg and Ni show evidence for an en-hancement in the central regions while only Ne is substantiallyflat.
5.3. Comparison with Finoguenov et al. (2001) results
We made a direct comparison of our results with the abun-dances and abundance ratios derived by Finoguenov et al(2001). Their values are consistent within the errors with oursexcept for the oxygen abundance, which is roughly two timeshigher in Finoguenov’s analysis. To better understand the originof this discrepancy we have extracted spectra from the same ra-dial bins, 1′-3′ and 8′-14′, and fitted a single temperature model(vmekal) in the 0.5-10 keV band, excising the 0.7-1.6 keV en-ergy range, in order to avoid the dependence from the Fe L-shell peak, as done by Finoguenov et al (2001). Our results forthe O abundance, given in units of the solar values from An-ders & Grevesse (1989) to make a direct comparison with theresults of Table 1 of Finoguenov et al (2001), are 0.32± 0.03for the 1′-3′ bin and 0.20±0.02 for the 8′-14′ bin, to be com-pared with 0.535+0.019
−0.021 and 0.386+0.025−0.021. Also interesting are the
results for the Ni abundance: 2.55±0.33 for the 1′-3′ bin and
4 Gastaldello & Molendi
2.34±0.26 for the 8′-14′ bin, to be compared with 2.573+0.924−0.918
and 0.800+1.732−0.800. We also note that a 2T modeling of the inner
bin 1′-3′ gives a statistically better fit over a single temperaturemodel (χ2/d.o.f of 919/440 respect to 1083/442, using the 0.5-10 keV band) breaking down the assumption of near isother-mality.
We also cross compare the K- and L-shell results for Ni andFe in our analysis, performing the spectral fits for all the ra-dial bins in the 0.5-10 keV band, but excising the 0.7-1.6 keVenergy range. The derived abundances for the two elementsare consistent within 1σ, although the K-shell Ni abundance is20% higher than the L-shell abundance in the bins fitted with asingle temperature model. It should be borne in mind that par-ticularly for the outer bins the K-shell Ni abundance measure isvery sensitive to the background estimate.
5.4. Abundance ratios and SNIa Fe mass fraction
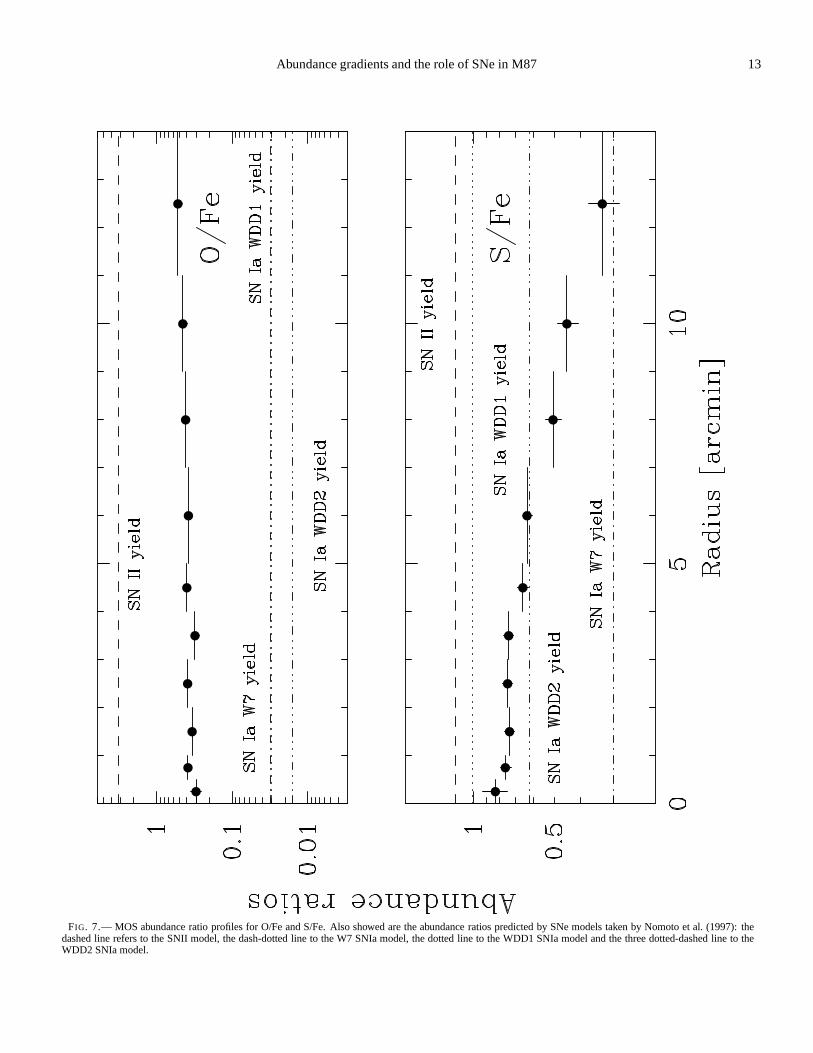
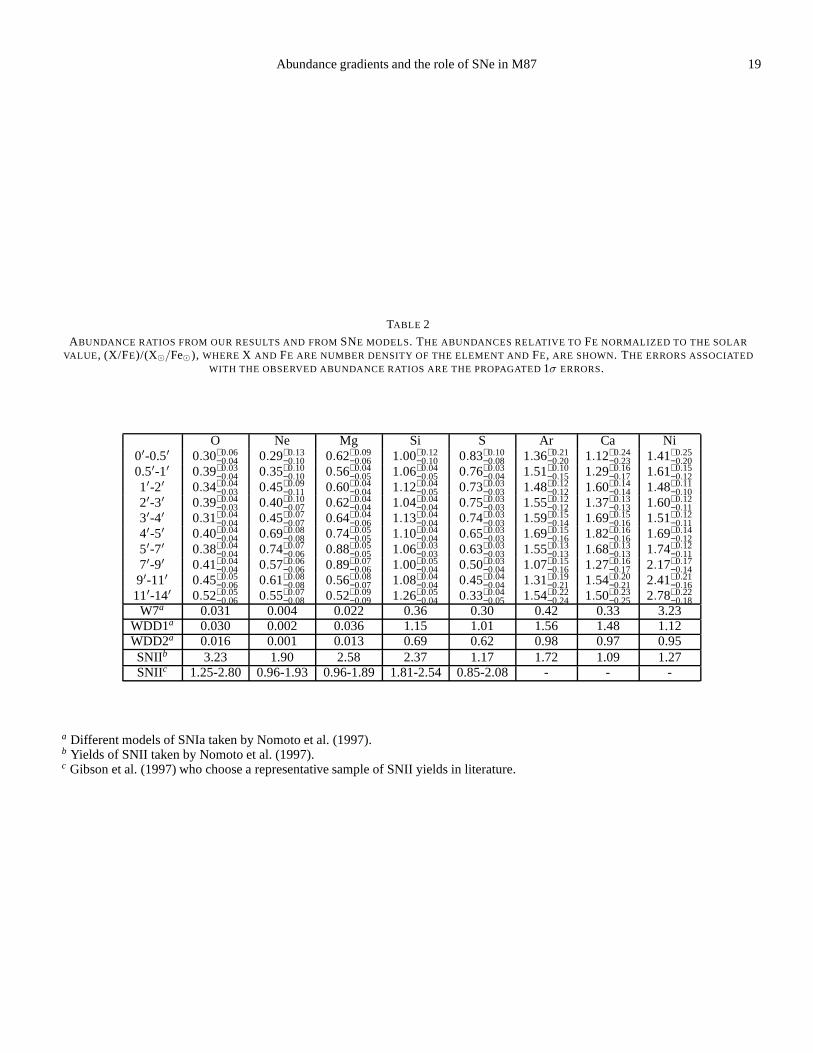
From the abundance measurements we obtain the abundanceratios between all the elements relative to Fe, normalized to thesolar value. They are shown in Figure 7, Figure 8, Figure 9 andin Table 2, together with the abundance ratios obtained by mod-els of supernovae taken by Nomoto et al. (1997) and rescaled tothe solar abundances reported in Grevesse & Sauval (1998). Weuse those abundance ratios to estimate the relative contributionsof SNIa and SNII to the metal enrichment of the intra-clustergas. Such estimates are complicated by uncertainties both inthe observations and in the theoretical yields. Our approach isto use the complete set of ratios trying to find the best fit of thefunction
( X/FeX⊙/Fe⊙
)
observed= f
( X/FeX⊙/Fe⊙
)
SNIa+(1− f )
( X/FeX⊙/Fe⊙
)
SNII
(1)
where(
X/FeX⊙/Fe⊙
)
observedis the measured abundance ratio of
the X element toFe, given in solar units,(
X/FeX⊙/Fe⊙
)
SNIaand
(
X/FeX⊙/Fe⊙
)
SNIIare the theoretical abundance ratio by the two
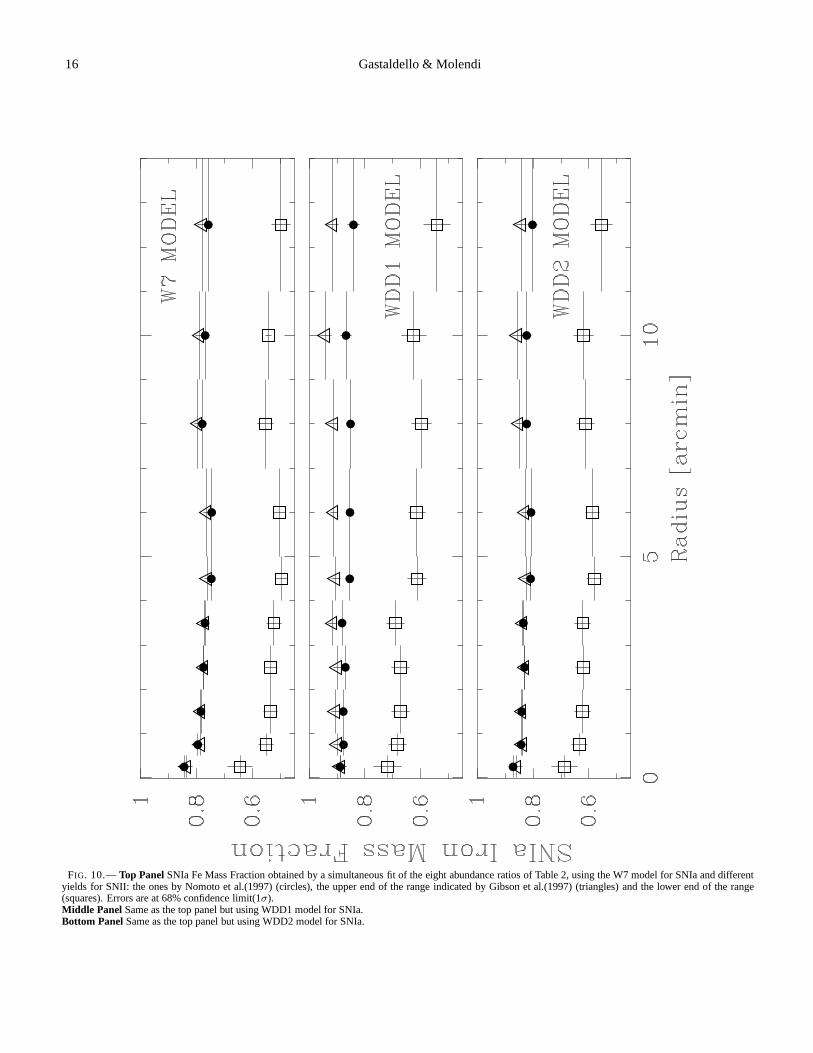
types of supernovae, also given in solar units andf is directlythe SNIa Fe mass fraction. The result of the simultaneous fitof the eight ratios is presented as circles in Figure 10, usingthe SNII model by Nomoto et al. (1997) and W7, WDD1 andWDD2 models for SNIa respectively for the three panels. Dueto the large uncertainties in the yields for the SNII model, theresults are strongly SNII model dependent. For comparison weuse the range of SNII yields calculated by Gibson et al. (1997),also listed in Table 2, which involve only ratios for O, Ne, Mg,Si and S and as before finding the best fit for eq.(1). The re-sults are shown as squares for the lower end of the range andtriangles for the upper part of the range.
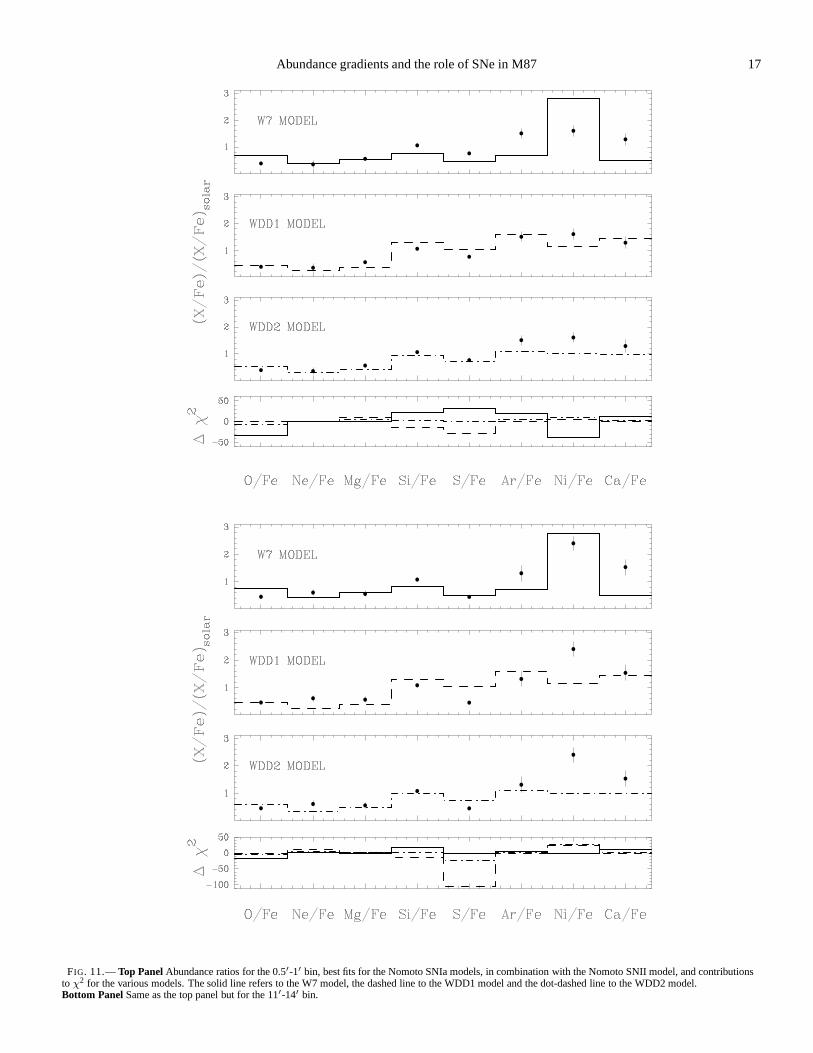
The best fits are obtained in the inner bins with a combina-tion of the WDD2 model for SNIa and the Nomoto model forSNII, with reducedχ2 which ranges from 2 in the inner bin upto 10 in the 4′-5′ bin. In the outer bins the fit is slightly better(reducedχ2 of 8-10 instead of 12-13) with a combination ofthe W7 model for SNIa and the Nomoto model for SNII. Thisis shown in Figure 11 where the fits with the three SNIa mod-els together with the Nomoto SNII model are reported for the0.5′-1′ bin and for the 11′-14′ bin. It’s clear from the inspectionof the residuals in terms of∆χ2 that the combination of W7model and Nomoto SNII model fails in the inner bins becauseit predicts a higher Ni/Fe and O/Fe ratio, compared to the de-
layed detonation models. The situation is the opposite for theouter bins where a higher Ni/Fe and a lower S/Fe favors the W7model. However the preference for the W7 model in combina-tion with the Nomoto SNII model in the outer bins is stronglydependent on the Ni/Fe ratio: if we exclude it from the fit theWDD2 model provides the better fit to the data.
6. DISCUSSION
The model emerging from theASCAandBeppoSAXdata forthe explanation of abundance gradients in galaxy clusters wasthat of a homogeneous enrichment by SNII, the main sourceof α elements, maybe in the form of strong galactic winds inthe proto-cluster phase and the central increase in the heavy el-ement distribution due to an enhanced contribution by SNIa,strongly related to the presence of a cD galaxy (Fukazawa etal. 1998; Dupke & White 2000b; Finoguenov et al. 2000; DeGrandi & Molendi 2001; Makishima et al. 2001). As a text-book example we can consider the case of A496 observed byXMM-Newton(Tamura et al. 2001). The O-Ne-Mg abundanceis radially constant over the cluster, while the excess of heavyelements as Fe, Ar, Ca and Ni in the core is consistent with theassumption that the metal excess is solely produced by SNIain the cD galaxy. The crucial ratio for the discrimination ofthe enrichment by the two types of supernovae, O/Fe, is thendecreasing towards the center.
TheXMM results for M87/Virgo question this picture. Theyconfirm and improve the accuracy of the measure of heavy ele-ments gradients previously found byASCAandBeppoSAX, butthey also show a a statistically significant enhancement ofαelements O and Mg in the core. If we consider the inner 9 ar-cmin the ratio O/Fe is constant withχ2 = 6.9 for 7 d.of. andadding a linear component does not improve the fit (χ2 = 5.4for 6 d.o.f). These facts points toward an increase in contribu-tion also of SNII, since O is basically produced only by thiskind of supernovae. Although there is little or no evidence ofcurrent star formation in the core of M87, the O excess couldbe related to a recent past episode of star formation triggeredby the passage of the radio jet, as we see in cD galaxies witha radio source (A1795 cD: van Breugel et al. 1984 and A2597cD: Koekemoer et al. 1999), nearby (Cen A: Graham 1998) anddistant radio galaxies (van Breugel et al. 1985; van Breugel&Dey 1993; Bicknell et al. 2000) (for a comprehensive discus-sion see McNamara 1999).To put the above idea quantitatively, waiting for a true depro-jection of our data, we use previousROSATestimate of thedeprojected electron density in the center of the Virgo clus-ter (Nulsen & Böhringer 1995) to calculate the excess massof oxygen. To estimate the excess abundance we fit the in-ner bins, where we see the stronger increase in the O abun-dance, with a constant obtaining an abundance of 0.32, whilefor the outer bins we obtain an abundance of 0.21 so the ex-cess is 0.11. Then we estimate the oxygen mass,MO to beMO = AOyO,⊙ Zexcess
O MH , whereMH = 0.82ne4π
3 (Rout−Rin)3, Rin
andRout being the bounding radii in kpc of the bins,AO = 16 andyO,⊙ = 6.76×10⁻⁵ from Grevesse & Sauval (1998). We obtaina rough estimate of 107M⊙ which, assuming that about 80M⊙of star formation are required to generate a SNII (Thomas &Fabian 1990) and Nomoto SNII oxygen yield, requires a cumu-lative star formation of 4− 5×10⁷M⊙. This star formation isin agreement with a burst mode of star formation (. 107 yr) atrates of∼ 10− 40M⊙yr−1, as it is observed in the CD galaxiesof A1795 and A2597 (McNamara 1999).
Abundance gradients and the role of SNe in M87 5
For what concern heavy element gradients and the contribu-tion of SNIa, M87 data suggests an agreement with delayeddetonation models (in particular for the inner bins), as stressedby Finoguenov et al (2001), in contrast with the preference ofW7 model set by the high Ni/Fe ratios found by Dupke & White(2000a). This is particular evident if we consider the S/Fe ra-tio in Figure 7. If we consider the set of theoretical values forSNII and W7 SNIa models the behavior of these ratio wouldindicate an increasing contribution by SNIa goingoutward tothe center. We recover the correct behavior if we choose theWDD1 yield and we reduce the S SNII yield of Nomoto et al.(1997) by a factor of two to three, as was already indicated byASCAdata (Dupke & White 2000a). We caution however thatthis is a substantial contribution larger than that allowedby theSNII models choosed by Gibson et al. (1997). The use of de-layed detonation model for SNIa could also explain the overabundance of S and also Si (respect to the W7 model) found byTamura et al. (2001) for the core of A496.With increasing radius the W7 model gives a better fit to thedata respect to delayed detonation models. This fact indicates aSNIa abundance pattern change with radius and could be takenas an independent X-ray confirmation of the conclusions ofHatano et al. (2000) on the optical spectroscopic diversityofSNIa, as suggested by Finoguenov et al (2001). However westress that the preference of W7 over WDD models in the outerbins is entirely due to the Ni/Fe ratio which could be affectedby systematic uncertainties, as discussed in section 5.1 and 5.3.
In Figure 10, we show the relative importance of SNIa, mea-sured by the Fe mass fraction provided by this kind of super-novae. This is substantially constant through the 14 arcminan-alyzed. This fraction is considerable and ranges between the50% and 80% and it depends only slightly on the SNIa modelused. Instead the uncertainties involved in using different SNIImodels are large and a definitive answer cannot be reached untilfurther convergence of SNII models is achieved.
7. SUMMARY
We have performed a spatially resolved measurement of theelement abundances in M87, the Virgo cluster cD galaxy. Themain conclusion of our work are:
• the APEC code gives a systematically worse descriptionthan the MEKAL code in modeling M87 spectra;
• we confirm the increase of Fe and other heavy elementstowards the core indicating that the SNIa contributionincreases;
• the increase in O abundance and a constant O/Fe ratioin the inner 9 arcmin indicates an increase also in SNIIejecta possibly from star-burst in the recent past;
• Si/Fe and S/Fe profiles favor WDD models over W7,also requiring substantial reduction of the SNII yield ofS;
• the indication of a change of the SNIa abundance pat-tern, provided by a preference of the W7 model overdelayed detonation models in the outer bins, is entirelydue to the Ni/Fe ratio. Since the Ni measurement is dif-ficult and uncertain, this indication should be taken withsome caution.
S. Ettori and S. Ghizzardi are thanked for useful discussionsand suggestions. We thank the referee for several suggestionsthat improved the presentation of this work. This work is basedon observations obtained withXMM-Newton, an ESA sciencemission with instruments and contributions directly funded byESA Member States and the USA (NASA).
REFERENCES
Allen, S. W. & Fabian, A. C. 1998, MNRAS, 297, L63Anders, E. & Grevesse, N. 1989, Geochimica et Cosmochimica Acta, 53, 197Arnaud, M., Neumann, D. M., Aghanim, N., Gastaud, R., Majerowicz, S.,
Hughes, J. P. 2001, A&A, 365, L80Belsole, E., Sauvageot, J. L., Böhringer, H., Worral, D. M.,Matsushita, K.,
Mushotzky, R. F., Sakelliou, I., Molendi, S., Ehle, M., Kennea, J., Stewart,G., Vestrand, W. T. 2001, A&A, 365, L188
Bicknell, G., Sutherland, R., van Breugel, W.J.M., Dopita,M.A., Dey, A, Miley,G.K. 2000, ApJ, 540, 678
Böhringer, H., Belsole, E., Kennea, J., Matsushita, K., Molendi, S., Worral, D.M., Mushotzky, R. F., Ehle, M., Guainazzi, M., Sakelliou, I., Stewart, G.,Vestrand, W. T., Dos Santos, S. 2001, A&A, 365 L181
Brighenti, F. & Mathews, W. G. 1999, ApJ, 515, 542De Grandi, S. & Molendi, S. 2001, ApJ, 551, 153Della Ceca, R., Scaramella, R., Gioia, I. M., Rosati, P., Fiore, F., Squires, G.
2000, A&A, 353, 498Dupke, R. A. & White R. 2000a, ApJ, 528, 139Dupke, R. A. & White R. 2000b, ApJ, 537, 123Ettori, S., Allen, S. W., Fabian, A. C. 2001, MNRAS, 322, 187Finoguenov, A., David, L. P., Ponman, T. J. 2000, ApJ, 544, 188Finoguenov, A., Matsushita, K., Böhringer, H., Ikebe, Y., Arnaud, M. 2001,
A&A in press, (astro-ph/0110516)Fukazawa, Y., Makishima, K., Tamura, T., Ezawa, H., Xu, H., Ikebe, Y.,
kikuchi, K., Ohashi, T. 1998, PASJ, 50, 187Gibson, B. K., Lowenstein, M., Mushotzky, R. F. 1997, MNRAS,290, 623Graham, J.A., 1998, ApJ, 502, 245Grevesse, N. & Sauval, A. J., 1998, Space Science Reviews, 85, 161Guainazzi, M. & Molendi, S. 2000, A&A, 351, L19Gunn, J. E. & Gott, J. R. 1972, ApJ, 176, 1Hatano, K., Branch, D., Lents, E.J., Baron, E., Filippenko,A.V., Garnavich,
P.M., 2000, ApJ, 543, L9Hwang, U., Mushotzky R., Loewenstein, M., Markert, T. H., Fukazawa, Y.,
Matsumoto, H. 1997, ApJ, 476, 560
Kauffmann, G. & Charlot, S. 1998, MNRAS, 294, 705Koekemoer, A.M., O’Dea, C.P., Sarazin, C.L., McNamara, B.R., Donahue, M.,
Voit, G.M., Baum, S.A., Gallimore, J.F., ApJ, 525, 621Jansen, F., Lumb, D., Altieri, B., Clavel, J., Ehle, M., Erd,C., Gabriel, C.,
Guainazzi, M., Gondoin, P., Much, R., Munoz, R., Santos, M.,Schartel, N.,Texier, D., Vacanti, G. 2001, A&A, 365, L1
Ishimaru, Y. & Arimoto, N. 1997, PASJ, 49,1Liedahl, D. A., Osterheld A. L., Goldstein, W. H. 1995, ApJ, 438, L115Lieu, R., Mittaz, J. P. D., Bowyer, S., Lockman, F. J., Hwang„C. Y., Schmitt,
J. H. M. M. 1996, ApJ, 458, L5Makishima, K., Ezawa, H., Fukazawa, Y., Honda, H., Ikebe, Y., Kamae,
T., Kikuchi, K., Matsushita, K., Nakazawa, K., Ohashi, T., Takahashi, T.,Tamura, T., Xu, H. 2001, PASJ, 53, 401
Matsumoto, H., Koyama, K., Awaki, H., Tomida, H., Tsuru, T.,Mushotzky, R.,Hatsukade, I. 1996, PASJ, 48, 201
Matteucci, F. & Vettolani, G. 1988, A&A, 202, 21McNamara 1999, presented at “Life cycles of Radio Galaxies”, July 15-17,
1999, STScI, Baltimore (astro-ph/9911129)Mewe, R., Gronenschild, E. H. B. M., van den Oord, G. H. J., 1985, A&AS,
62, 197Molendi, S.Report on MOS PN cross-calibration presented at Leicester EPIC
calibration meeting held in June 2001Molendi, S. & Gastaldello, F. 2001, A&A, 375, L14Molendi, S. & Pizzolato, F. 2001, ApJ, 560, 194Mushotzky, R., Loewenstein, M., Arnaud, K. A., Tamura, T., Fukazawa, Y.,
Matsushita, K., Kikuchi, K., Hatsukade, I. 1996, ApJ, 466, 686Mushotzky, R. & Lowenstein, M. 1997, ApJ, 481, L63Nomoto, K., Iwamoto, K., Nakasato, N., Thielemann, F. K., Brachwitz, F.,
Tsujimoto, T., Kubo, Y., Kishimoto, N. 1997, Nucl.Phys. A, 621, 467Nulsen, P.E.J. & Böhringer, H., 1995, MNRAS, 274, 1093Renzini, A., 1997, ApJ, 488, 35Smith, R. K., Brickhouse, N. S., Liedahl, D. A., Raymond, J. C. 2001, ApJ,
556, L91

6 Gastaldello & Molendi
Tamura, T., Bleeker, A.M., Kaastra, J.S., Ferrigno, C., Molendi, S. 2001, A&A,379, 107
Thomas, P.A. & Fabian, A.C., 1990, MNRAS, 246, 156Toniazzo, T. & Schindler, S. 2001, MNRAS, 325, 509
van Breugel, W.J.M., Heckman, T., Miley, G. 1984, ApJ, 276, 79van Breugel, W.J.M., Filippenko, A.V., Heckman, T., Miley,G. 1985, ApJ, 293,
83van Breugel, W.J.M. & Dey, A. 1993, ApJ, 414, 563
Abundance gradients and the role of SNe in M87 7
FIG. 1.— Data of the 3′-4′ bin and lines of the various elements, obtained by setting all element abundances to zero except the one of interest, calculated usingthe MEKAL code.Top Panel: the lines of O, Fe, Ne, Ni, Mg and Si used for the analysis in the 0.5-2 keV energy range.Bottom Panel: the lines of Si, S, Ar andCa used for the analysis in the 2-4 keV energy range.
8 Gastaldello & Molendi
FIG. 2.— MOS abundance profiles for O, Si and Fe. Uncertainties are at the 68% level for one interesting parameter(∆χ2 = 1). Diamonds represent measurements
with 2T model using APEC code, asterisks those with 2T model using MEKAL code and squares those with fake multi-phase model using MEKAL code. Fullcircles indicate measurements with 1T model using MEKAL code while empty triangles those with 1T model using APEC code.
Abundance gradients and the role of SNe in M87 9
FIG. 3.— MOS abundance profiles for Mg, Ar and S. Symbols as in Figure 2.
10 Gastaldello & Molendi
FIG. 4.— MOS abundance profiles for Ne, Ca and Ni. Symbols as in Figure 3.
Abundance gradients and the role of SNe in M87 11
FIG. 5.— MOS temperature profile. Uncertainties are at the 68% level for one interesting parameter(∆χ2 = 1). Diamonds and asterisks represent the two
temperature values obtained with 2T models using APEC code and MEKAL code, respectively. Squares represent the value ofthe temperature of the vmekalcomponent and theTmin of the vmcflow component, for the fake multi-phase model using MEKAL code. Full circles indicate temperature obtained with 1T modelusing MEKAL code while empty triangles those with 1T model using APEC code.
12 Gastaldello & Molendi
FIG. 6.— Top Panel: data for the bin 1′-2′ and contributions toχ2 for a 2T model with MEKAL code, theχ2/d.o. f . of the fit is 381/217, and for a 2T modelwith APEC code, theχ2/d.o. f . of the fit is 474/218. Contributions toχ2 are on the same scale for direct comparison.Middle Panel: data for the bin 3′-4′ and contributions toχ2 for a 1T model with MEKAL code, theχ2/d.o. f . of the fit is 326/221, and for a 1T model with APECcode, theχ2/d.o. f . of the fit is 546/222. Contributions toχ2 are on the same scale for direct comparison.Bottom Panel: data for the bin 11′-14′ and contributions toχ2 for a 1T model with MEKAL code, theχ2/d.o. f . of the fit is 729/221, and for a 1T model withAPEC code, theχ2/d.o. f . of the fit is 886/222. Contributions toχ2 are on the same scale for direct comparison.
Abundance gradients and the role of SNe in M87 13
FIG. 7.— MOS abundance ratio profiles for O/Fe and S/Fe. Also showed are the abundance ratios predicted by SNe models taken by Nomoto et al. (1997): thedashed line refers to the SNII model, the dash-dotted line tothe W7 SNIa model, the dotted line to the WDD1 SNIa model and the three dotted-dashed line to theWDD2 SNIa model.
14 Gastaldello & Molendi
FIG. 8.— Same as Figure 7 but for ratio profiles for Ne/Fe, Mg/Fe and Si/Fe
Abundance gradients and the role of SNe in M87 15
FIG. 9.— Same as Figure 7 but for ratio profiles for Ar/Fe, Ca/Fe and Ni/Fe.
16 Gastaldello & Molendi
FIG. 10.—Top Panel SNIa Fe Mass Fraction obtained by a simultaneous fit of the eight abundance ratios of Table 2, using the W7 model for SNIa anddifferentyields for SNII: the ones by Nomoto et al.(1997) (circles), the upper end of the range indicated by Gibson et al.(1997) (triangles) and the lower end of the range(squares). Errors are at 68% confidence limit(1σ).Middle Panel Same as the top panel but using WDD1 model for SNIa.Bottom Panel Same as the top panel but using WDD2 model for SNIa.
Abundance gradients and the role of SNe in M87 17
FIG. 11.—Top Panel Abundance ratios for the 0.5′-1′ bin, best fits for the Nomoto SNIa models, in combination withthe Nomoto SNII model, and contributionsto χ
2 for the various models. The solid line refers to the W7 model,the dashed line to the WDD1 model and the dot-dashed line to the WDD2 model.Bottom Panel Same as the top panel but for the 11′-14′ bin.
18 Gastaldello & Molendi
TABLE 1
ABUNDANCE PROFILES OBTAINED BY A2T VMEKAL MODELING FOR THE CENTRAL REGIONS AND A1T VMEKAL MODELING FOR THE
OUTER REGIONS. ALL ABUNDANCES REFERRED TO SOLAR UNITS AS GIVEN INGREVESSE& SAUVAL (1998). ALL ERRORS QUOTED ARE
AT THE 68% LEVEL FOR ONE INTERESTING PARAMETER(∆χ2 = 1)
Bin O Ne Mg Si S Ar Ca Fe Ni
0′-0.5′ 0.31+0.05−0.04 0.30+0.14
−0.10 0.64+0.08−0.05 1.03+0.08
−0.07 0.86+0.07−0.06 1.41+0.19
−0.19 1.16+0.23−0.22 1.03+0.08
−0.07 1.46+0.23−0.18
0.5′-1′ 0.48+0.04−0.05 0.44+0.12
−0.13 0.69+0.05−0.06 1.32+0.04
−0.04 0.95+0.03−0.04 1.88+0.12
−0.18 1.60+0.20−0.20 1.24+0.03
−0.04 2.00+0.19−0.14
1′-2′ 0.36+0.04−0.03 0.48+0.10
−0.12 0.64+0.04−0.04 1.20+0.03
−0.03 0.78+0.03−0.02 1.58+0.12
−0.13 1.71+0.14−0.14 1.07+0.03
−0.02 1.58+0.11−0.11
2′-3′ 0.36+0.03−0.03 0.37+0.09
−0.06 0.57+0.03−0.04 0.96+0.03
−0.03 0.68+0.03−0.02 1.42+0.11
−0.11 1.26+0.11−0.11 0.92+0.02
−0.02 1.46+0.10−0.09
3′-4′ 0.24+0.03−0.03 0.34+0.05
−0.06 0.49+0.03−0.04 0.87+0.02
−0.02 0.57+0.02−0.02 1.22+0.11
−0.11 1.30+0.11−0.12 0.77+0.01
−0.02 1.16+0.09−0.08
4′-5′ 0.27+0.03−0.03 0.47+0.05
−0.05 0.50+0.03−0.03 0.75+0.02
−0.02 0.45+0.02−0.02 1.15+0.10
−0.11 1.24+0.11−0.11 0.68+0.01
−0.01 1.15+0.09−0.08
5′-7′ 0.23+0.02−0.02 0.44+0.04
−0.04 0.53+0.03−0.03 0.63+0.02
−0.01 0.38+0.01−0.01 0.93+0.07
−0.07 1.00+0.08−0.07 0.60+0.01
−0.01 1.04+0.07−0.06
7′-9′ 0.22+0.02−0.02 0.30+0.03
−0.03 0.48+0.03−0.03 0.53+0.02
−0.02 0.27+0.01−0.01 0.57+0.08
−0.08 0.68+0.08−0.09 0.53+0.02
−0.02 1.16+0.08−0.06
9′-11′ 0.21+0.02−0.03 0.28+0.03
−0.03 0.25+0.03−0.03 0.49+0.02
−0.02 0.20+0.02−0.02 0.60+0.09
−0.10 0.70+0.09−0.10 0.46+0.01
−0.01 1.10+0.09−0.07
11′-14′ 0.20+0.02−0.02 0.21+0.03
−0.03 0.20+0.03−0.03 0.48+0.02
−0.01 0.13+0.02−0.02 0.59+0.08
−0.09 0.57+0.09−0.09 0.38+0.01
−0.01 1.06+0.08−0.07
Abundance gradients and the role of SNe in M87 19
TABLE 2
ABUNDANCE RATIOS FROM OUR RESULTS AND FROMSNE MODELS. THE ABUNDANCES RELATIVE TO FE NORMALIZED TO THE SOLAR
VALUE , (X/FE)/(X⊙/Fe⊙), WHERE X AND FE ARE NUMBER DENSITY OF THE ELEMENT ANDFE, ARE SHOWN. THE ERRORS ASSOCIATED
WITH THE OBSERVED ABUNDANCE RATIOS ARE THE PROPAGATED1σ ERRORS.
O Ne Mg Si S Ar Ca Ni0′-0.5′ 0.30+0.06
−0.04 0.29+0.13−0.10 0.62+0.09
−0.06 1.00+0.12−0.10 0.83+0.10
−0.08 1.36+0.21−0.20 1.12+0.24
−0.23 1.41+0.25−0.20
0.5′-1′ 0.39+0.03−0.04 0.35+0.10
−0.10 0.56+0.04−0.05 1.06+0.04
−0.05 0.76+0.03−0.04 1.51+0.10
−0.15 1.29+0.16−0.17 1.61+0.15
−0.121′-2′ 0.34+0.04
−0.03 0.45+0.09−0.11 0.60+0.04
−0.04 1.12+0.04−0.05 0.73+0.03
−0.03 1.48+0.12−0.12 1.60+0.14
−0.14 1.48+0.11−0.10
2′-3′ 0.39+0.04−0.03 0.40+0.10
−0.07 0.62+0.04−0.04 1.04+0.04
−0.04 0.75+0.03−0.03 1.55+0.12
−0.12 1.37+0.13−0.13 1.60+0.12
−0.113′-4′ 0.31+0.04
−0.04 0.45+0.07−0.07 0.64+0.04
−0.06 1.13+0.04−0.04 0.74+0.03
−0.03 1.59+0.15−0.14 1.69+0.15
−0.16 1.51+0.12−0.11
4′-5′ 0.40+0.04−0.04 0.69+0.08
−0.08 0.74+0.05−0.05 1.10+0.04
−0.04 0.65+0.03−0.03 1.69+0.15
−0.16 1.82+0.16−0.16 1.69+0.14
−0.125′-7′ 0.38+0.04
−0.04 0.74+0.07−0.06 0.88+0.05
−0.05 1.06+0.03−0.03 0.63+0.03
−0.03 1.55+0.13−0.13 1.68+0.13
−0.13 1.74+0.12−0.11
7′-9′ 0.41+0.04−0.04 0.57+0.06
−0.06 0.89+0.07−0.06 1.00+0.05
−0.04 0.50+0.03−0.04 1.07+0.15
−0.16 1.27+0.16−0.17 2.17+0.17
−0.149′-11′ 0.45+0.05
−0.06 0.61+0.08−0.08 0.56+0.08
−0.07 1.08+0.04−0.04 0.45+0.04
−0.04 1.31+0.19−0.21 1.54+0.20
−0.21 2.41+0.21−0.16
11′-14′ 0.52+0.05−0.06 0.55+0.07
−0.08 0.52+0.09−0.09 1.26+0.05
−0.04 0.33+0.04−0.05 1.54+0.22
−0.24 1.50+0.23−0.25 2.78+0.22
−0.18W7a 0.031 0.004 0.022 0.36 0.30 0.42 0.33 3.23
WDD1a 0.030 0.002 0.036 1.15 1.01 1.56 1.48 1.12WDD2a 0.016 0.001 0.013 0.69 0.62 0.98 0.97 0.95SNIIb 3.23 1.90 2.58 2.37 1.17 1.72 1.09 1.27SNIIc 1.25-2.80 0.96-1.93 0.96-1.89 1.81-2.54 0.85-2.08 - - -
a Different models of SNIa taken by Nomoto et al. (1997).b Yields of SNII taken by Nomoto et al. (1997).c Gibson et al. (1997) who choose a representative sample of SNII yields in literature.