Synthesis and Disordered Crystal Structure of Al 3 O 3.5 C 0.5
6
Synthesis and Disordered Crystal Structure of Al 3 O 3.5 C 0.5 Toru Asaka, † Ryosuke Kotani, † Tatsunari Kudo, † Hideto Yoshida, ‡ and Koichiro Fukuda* ,† † Department of Materials Science and Engineering, Nagoya Institute of Technology, Nagoya 466-8555, Japan ‡ Department of Earth and Planetary Science, Graduate School of Science, The University of Tokyo, Tokyo 113-0033, Japan * S Supporting Information ABSTRACT: The crystal structure of Al 3 O 3.5 C 0.5 (Z = 3) has been characterized by X-ray powder diffraction (XRPD), transmission electron microscopy, and electron probe micro- analysis. The title compound is trigonal with space group R3̅m (centrosymmetric) and hexagonal unit-cell dimensions a = 0.29588(1) nm, c = 2.84080(7) nm, and V = 0.21538(1) nm 3 . The initial structural model was determined by the charge- flipping method and subsequently refined by the Rietveld method. The final structural model showed the positional disordering of one of the two types of Al sites. The maximum- entropy method-based pattern fitting (MPF) method was used to confirm the validity of the split-atom model, in which conventional structure bias caused by assuming intensity partitioning was minimized. The reliability indices calculated from the MPF were R wp = 4.03%, S (= R wp /R e ) = 1.17, R p = 3.08%, R B = 0.82%, and R F = 0.72%. The crystal was composed of antiphase domains, suggesting the occurrence of the high-low phase transition during the cooling process. The transition would be accompanied by the loss of unit-lattice translation, and hence the disordered structural model determined by XRPD might be of the average structure of the low-temperature phase. ■ INTRODUCTION In the system Al−O−C, there are four types of binary and ternary compounds established so far; they are Al 2 O 3 , Al 4 C 3 , Al 4 O 4 C, and Al 2 OC. 1 The chemical compositions of the latter two compounds necessarily lie on the tie line Al 2 O 3 −Al 4 C 3 . In this binary system, Sitnikov et al. have reported a new aluminum oxycarbide, Al 3 O 3.5 C 0.5 (2Al 2 O 3 ·Al 2 OC or Al 6 O 7 C in the original report). 2 However, we have insufficient characterization data for this material, partly because its crystal structure has not yet been clarified. In the crystal structure of α- Al 2 O 3 the oxygen atoms are arranged in approximately hexagonal close packing. 3 Between the two oxygen layers there are positions for Al atoms such that each one is surrounded by six O atoms arranged octahedrally. Only two- thirds of the available positions are filled, with the remaining one-third of these being vacant. With Al 4 C 3 , the crystal structure can be described in terms of a three-dimensional network of [AlC 4 ] tetrahedra which are associated by sharing corners and edges. 4 The average Al−C distance of [AlC 4 ] tetrahedra is 0.206 nm for Al 4 C 3 . With [AlO 4 ] tetrahedra, the ionic radii of Al 3+ in the 4-fold coordination [r(Al 3+ (4)) = 0.039 nm and r(O 2‑ (4)) = 0.138 nm] 5 predicts the interatomic distance of 0.177 nm. Thus, the average interatomic distances are generally longer for [AlC 4 ] than for [AlO 4 ]. Recent advances in the field of crystal-structure analysis from X-ray powder diffraction (XRPD) data have enabled us to investigate unknown structures as well as complex structures, including positional disordering of atoms. To begin with, initial structural models are required, which may be determined by, for example, powder charge-flipping method. 6,7 The structural parameters are subsequently refined using the Rietveld method. 8 A combined use of the Rietveld method, the maximum-entropy method (MEM), 9 and the MEM-based pattern fitting (MPF) method 10 has enabled us to disclose new structural details. MEM is capable of estimating structure factors of unobserved reflections and improving those of overlapped reflections, which give MEM advantages over the classical Fourier method. However, the Rietveld method and MEM have a drawback in determining the electron-density distributions (EDD) because the observed structure factors, F o (Rietveld), are biased toward the structural model assuming intensity partitioning. On the other hand, the MPF method can minimize the structural bias. Thus, the MEM and MPF analyses are alternately repeated (REMEDY cycle) until the reliability indices reach minima. Crystal structures can be seen clearly from EDD determined by MPF. Nevertheless, the X-ray diffraction methods only determine the time- and space- averaged distribution of atoms. Transmission electron micros- copy (TEM) is an effective technique for the local structure investigations. These two types of methods are complementary, and both are indispensible tools for identifying unknown phases. Intracrystalline microstructures in crystals are often induced by phase transitions that occur during the cooling process. When the low temperature phase is a subgroup of the high Received: December 5, 2012 Published: February 14, 2013 Article pubs.acs.org/IC © 2013 American Chemical Society 2648 dx.doi.org/10.1021/ic302674g | Inorg. Chem. 2013, 52, 2648−2653
-
Upload
independent -
Category
Documents
-
view
1 -
download
0
Transcript of Synthesis and Disordered Crystal Structure of Al 3 O 3.5 C 0.5

Synthesis and Disordered Crystal Structure of Al3O3.5C0.5
Toru Asaka,† Ryosuke Kotani,† Tatsunari Kudo,† Hideto Yoshida,‡ and Koichiro Fukuda*,†
†Department of Materials Science and Engineering, Nagoya Institute of Technology, Nagoya 466-8555, Japan‡Department of Earth and Planetary Science, Graduate School of Science, The University of Tokyo, Tokyo 113-0033, Japan
*S Supporting Information
ABSTRACT: The crystal structure of Al3O3.5C0.5 (Z = 3) hasbeen characterized by X-ray powder diffraction (XRPD),transmission electron microscopy, and electron probe micro-analysis. The title compound is trigonal with space group R3 ̅m(centrosymmetric) and hexagonal unit-cell dimensions a =0.29588(1) nm, c = 2.84080(7) nm, and V = 0.21538(1) nm3.The initial structural model was determined by the charge-flipping method and subsequently refined by the Rietveldmethod. The final structural model showed the positionaldisordering of one of the two types of Al sites. The maximum-entropy method-based pattern fitting (MPF) method was usedto confirm the validity of the split-atom model, in whichconventional structure bias caused by assuming intensitypartitioning was minimized. The reliability indices calculated from the MPF were Rwp = 4.03%, S (= Rwp/Re) = 1.17, Rp = 3.08%,RB = 0.82%, and RF = 0.72%. The crystal was composed of antiphase domains, suggesting the occurrence of the high-low phasetransition during the cooling process. The transition would be accompanied by the loss of unit-lattice translation, and hence thedisordered structural model determined by XRPD might be of the average structure of the low-temperature phase.
■ INTRODUCTIONIn the system Al−O−C, there are four types of binary andternary compounds established so far; they are Al2O3, Al4C3,Al4O4C, and Al2OC.
1 The chemical compositions of the lattertwo compounds necessarily lie on the tie line Al2O3−Al4C3. Inthis binary system, Sitnikov et al. have reported a newaluminum oxycarbide, Al3O3.5C0.5 (2Al2O3·Al2OC or Al6O7Cin the original report).2 However, we have insufficientcharacterization data for this material, partly because its crystalstructure has not yet been clarified. In the crystal structure of α-Al2O3 the oxygen atoms are arranged in approximatelyhexagonal close packing.3 Between the two oxygen layersthere are positions for Al atoms such that each one issurrounded by six O atoms arranged octahedrally. Only two-thirds of the available positions are filled, with the remainingone-third of these being vacant. With Al4C3, the crystalstructure can be described in terms of a three-dimensionalnetwork of [AlC4] tetrahedra which are associated by sharingcorners and edges.4 The average Al−C distance of [AlC4]tetrahedra is 0.206 nm for Al4C3. With [AlO4] tetrahedra, theionic radii of Al3+ in the 4-fold coordination [r(Al3+(4)) = 0.039nm and r(O2‑(4)) = 0.138 nm]5 predicts the interatomicdistance of 0.177 nm. Thus, the average interatomic distancesare generally longer for [AlC4] than for [AlO4].Recent advances in the field of crystal-structure analysis from
X-ray powder diffraction (XRPD) data have enabled us toinvestigate unknown structures as well as complex structures,including positional disordering of atoms. To begin with, initialstructural models are required, which may be determined by,
for example, powder charge-flipping method.6,7 The structuralparameters are subsequently refined using the Rietveldmethod.8 A combined use of the Rietveld method, themaximum-entropy method (MEM),9 and the MEM-basedpattern fitting (MPF) method10 has enabled us to disclose newstructural details. MEM is capable of estimating structurefactors of unobserved reflections and improving those ofoverlapped reflections, which give MEM advantages over theclassical Fourier method. However, the Rietveld method andMEM have a drawback in determining the electron-densitydistributions (EDD) because the observed structure factors,Fo(Rietveld), are biased toward the structural model assumingintensity partitioning. On the other hand, the MPF method canminimize the structural bias. Thus, the MEM and MPF analysesare alternately repeated (REMEDY cycle) until the reliabilityindices reach minima. Crystal structures can be seen clearlyfrom EDD determined by MPF. Nevertheless, the X-raydiffraction methods only determine the time- and space-averaged distribution of atoms. Transmission electron micros-copy (TEM) is an effective technique for the local structureinvestigations. These two types of methods are complementary,and both are indispensible tools for identifying unknownphases.Intracrystalline microstructures in crystals are often induced
by phase transitions that occur during the cooling process.When the low temperature phase is a subgroup of the high
Received: December 5, 2012Published: February 14, 2013
Article
pubs.acs.org/IC
© 2013 American Chemical Society 2648 dx.doi.org/10.1021/ic302674g | Inorg. Chem. 2013, 52, 2648−2653

temperature phase, two fundamentally different types ofmicrostructures result: antiphase domains (APDs) and twindomains. The APDs arise from transitions in which the pointgroup remains the same but the number of lattice points perunit volume is reduced.11 The displacement vector relating thedomains is the vector from the origin to the lost lattice point.The APD boundaries are made visible in TEM because of achange in the phase of the electron beam as it crosses theboundary. The formation of APDs is usually accompanied bythe appearance of extra reflections in the electron diffractionpattern.In the present study, we have structurally characterized
Al3O3.5C0.5 in the Al2O3−Al4C3 system. The crystal structurehas been expressed by the split-atom model, in which one ofthe two types of Al sites is positionally disordered. The crystalis probably composed of APDs with ordered crystal structure.
■ EXPERIMENTAL SECTIONMaterials. The reagent-grade chemicals of Al (99.9%, KCL Co.,
Ltd., Saitama, Japan), Al2O3 (99%, Kishida Chemical Co., Ltd., Osaka,Japan), and Al4C3 (98%, Mitsuwa Chemical Co., Ltd., Kanagawa,Japan) were mixed in molar ratios of [Al:Al2O3:Al4C3] = [3:5:2],corresponding to [Al:O:C] = [7:5:2] (Figure S1, see SupportingInformation). The well-mixed chemicals were pressed into pellets(φ25 mm × 10 mm), loaded into an open carbon crucible, heated in acarbon resistance furnace (FVHP-R-1, Fuji Dempa Kogyo Co. Ltd.,Osaka, Japan) at 2223 K for 1 h in inert gas atmosphere of Ar,followed by cooling to ambient temperature by cutting furnace power.The cooling rate from 2223 to 1773 K was estimated to be ca. 54 K/min. During the heating process, the sample was partially melted, andthe densely sintered polycrystalline material was obtained. Thesintered material was subsequently soaked in an aqueous solution ofHCl (2 mol/L) at 298 K for 14 d for complete dissolution of thecoexisting Al4C3 and Al2OC compounds and Al(metal). The resultingporous granules were washed by distilled water and dried in an oven at353 K for 8 h.Inside the electric furnace, a small amount of O2 gas that was
adsorbed on the graphite insulation board would be continuouslyreleased during the heating process. In our previous studies onoxycarbides, we have confirmed that the experimental oxygen partialpressure (PO2) in the furnace is necessarily kept near the carbon−carbon monoxide (CCO) buffer during the heating process.12−15
Thus, the PO2-value at 2223 K is estimated to be 1.6 × 10⁻¹⁴ atm (logPO2 = −13.80) based on the CCO buffer (Figure S2, see SupportingInformation).16,17 This implies that, at 2223 K and below, the Al4C3component will be continuously oxidized by the reaction with CO gasduring the heating and cooling process according to Al4C3(s) +6CO(g) → 2Al2O3(s) + 9C(s).Optical Microscopy and EPMA. One part of the granule sample
was made into a thin section, and the microtexture was observed underan optical microscope. Quantitative spot analysis was made for thethin-section specimen using an electron probe microanalyzer (EPMA,JXA-8900L, JEOL Ltd., Tokyo, Japan). The correction for intensitieswas made using the ZAF routines. A sintered specimen of Al4O4C wasused for the standard material.X-ray Powder Diffraction. The other part of the sample was
finely ground to obtain powder specimen and introduced into a glasscapillary tube of internal diameter ca. 0.4 mm. The XRPD intensitieswere collected on a diffractometer (SmartLab, Rigaku Co., Tokyo,Japan), equipped with an incident-beam Ge(111) Johanssonmonochromator to obtain Cu Kα1 radiation, and a high-speeddetector (Rigaku D/teX) was used in the Debye−Scherrer geometry.The X-ray generator was operated at 45 kV and 200 mA. Otherexperimental conditions are given in Table 1. No preferred orientationcould be seen in the diffraction pattern which was collected with thespecimen rotating. We corrected the X-ray absorption using the μrvalue (μ, linear absorption coefficient; r, sample radius) of the sampleand capillary tube, which was determined by the transmittance of
direct incident beam. The entire experimental diffraction pattern wasemployed for the crystal-structure analysis. The structure data werestandardized according to the rules formulated by Parthe ́ and Gelato18
using the computer program STRUCTURE TIDY.19 The EDD with64 × 64 × 614 pixels in the unit cell, the spatial resolution of which isapproximately 0.005 nm, were obtained from the MPF method usingthe computer programs RIETAN-FP20 and Dysnomia.21 The crystalstructure models and equidensity isosurfaces of EDD were visualizedwith the computer program VESTA.22
Transmission Electron Microscopy. The powder specimen wasalso examined using TEM (JEM 2100F, JEOL ltd., Tokyo, Japan)operated at 200 kV and equipped with an electron energy lossspectrometer (EELS, Enfina, Gatan Inc., Pleasanton, CA). The powderparticles were deposited with ethyl alcohol on a copper grid. Selectedarea electron diffraction (SAED) patterns and corresponding latticeimages were obtained. The multislice simulation image, which wasgenerated using a software package xHREM (HREM Research Inc.,Saitama, Japan), was compared with the high resolution image toconfirm the validity of the structural model.
■ RESULTS AND DISCUSSIONMicrotextures and Chemical Compositions. The optical
microscopic observation (Figure 1) indicated that the samplewas composed mainly of lath-shaped transparent crystals,together with a smaller amount of opaque materials that wereamorphous or poorly crystalline as evidenced by XRPD. TheXRPD pattern also showed the coexistence of the trivialamount of α-Al2O3 (Figure 2). The analyzing spots for EPMAwere selected carefully for the lath-shaped crystals under themicroscope since most of the crystal grains were deficient insize. We found relatively large crystal grains up to 15 μm anddetermined the average chemical composition by measuringone point for each of the three crystal grains to be 43.3(4) mol% Al, 50.7(2) mol % O, and 6.0(5) mol % C, where the figuresin parentheses indicate standard deviations. The anion ratioswere derived on the basis of three Al atoms to be [Al:O:C] =[3:3.51(3):0.41(4)], indicating that the [Al:O:C] ratios are[3:3.5:0.5]. In the light of the chemical composition (87.5 mol
Table 1. Conditions of the XRPD Experiment and Parts ofData Related to the Rietveld Refinement for Al3O3.5C0.5
chemical formula Al3O3.5C0.5
space group R3̅m (No. 166)a/nm 0.29588(1)c/nm 2.84080(7)V/nm3 0.21538(1)Z 3Dx/Mg m−3 3.306wavelength/nm 0.154 0593 (Cu Kα1)2θ range/deg 5.0−157.0step size, 2θ /deg 0.01total experimental time/h 12.7no. of intensity data 15 201no. of contributing reflections 112no. of refined structural parameters 63no. of background parameters 12no. of nonlinear constraints 24Rwp (Rietveld) 0.041 10S (Rietveld) 1.199Rp (Rietveld) 0.031 37RB (Rietveld) 0.019 64RF (Rietveld) 0.014 31RB (MPF) 0.008 24RF (MPF) 0.007 19
Inorganic Chemistry Article
dx.doi.org/10.1021/ic302674g | Inorg. Chem. 2013, 52, 2648−26532649
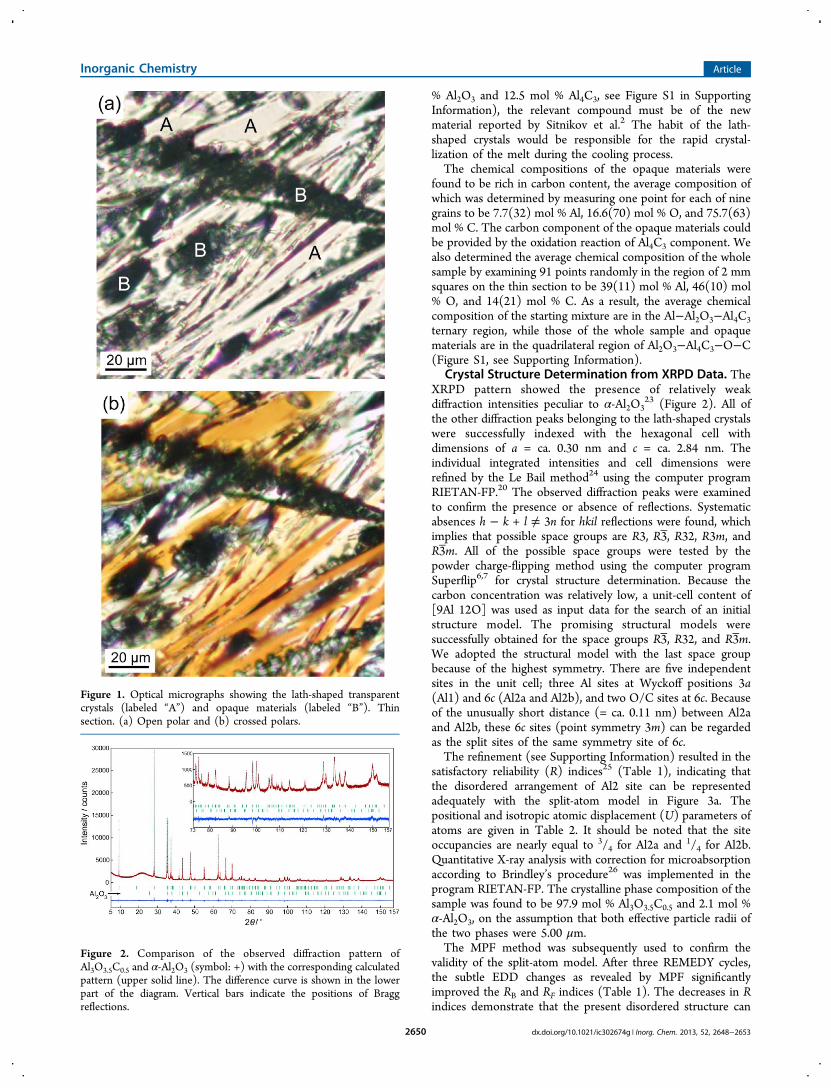
% Al2O3 and 12.5 mol % Al4C3, see Figure S1 in SupportingInformation), the relevant compound must be of the newmaterial reported by Sitnikov et al.2 The habit of the lath-shaped crystals would be responsible for the rapid crystal-lization of the melt during the cooling process.The chemical compositions of the opaque materials were
found to be rich in carbon content, the average composition ofwhich was determined by measuring one point for each of ninegrains to be 7.7(32) mol % Al, 16.6(70) mol % O, and 75.7(63)mol % C. The carbon component of the opaque materials couldbe provided by the oxidation reaction of Al4C3 component. Wealso determined the average chemical composition of the wholesample by examining 91 points randomly in the region of 2 mmsquares on the thin section to be 39(11) mol % Al, 46(10) mol% O, and 14(21) mol % C. As a result, the average chemicalcomposition of the starting mixture are in the Al−Al2O3−Al4C3ternary region, while those of the whole sample and opaquematerials are in the quadrilateral region of Al2O3−Al4C3−O−C(Figure S1, see Supporting Information).
Crystal Structure Determination from XRPD Data. TheXRPD pattern showed the presence of relatively weakdiffraction intensities peculiar to α-Al2O3
23 (Figure 2). All ofthe other diffraction peaks belonging to the lath-shaped crystalswere successfully indexed with the hexagonal cell withdimensions of a = ca. 0.30 nm and c = ca. 2.84 nm. Theindividual integrated intensities and cell dimensions wererefined by the Le Bail method24 using the computer programRIETAN-FP.20 The observed diffraction peaks were examinedto confirm the presence or absence of reflections. Systematicabsences h − k + l ≠ 3n for hkil reflections were found, whichimplies that possible space groups are R3, R3̅, R32, R3m, andR3 ̅m. All of the possible space groups were tested by thepowder charge-flipping method using the computer programSuperflip6,7 for crystal structure determination. Because thecarbon concentration was relatively low, a unit-cell content of[9Al 12O] was used as input data for the search of an initialstructure model. The promising structural models weresuccessfully obtained for the space groups R3 ̅, R32, and R3 ̅m.We adopted the structural model with the last space groupbecause of the highest symmetry. There are five independentsites in the unit cell; three Al sites at Wyckoff positions 3a(Al1) and 6c (Al2a and Al2b), and two O/C sites at 6c. Becauseof the unusually short distance (= ca. 0.11 nm) between Al2aand Al2b, these 6c sites (point symmetry 3m) can be regardedas the split sites of the same symmetry site of 6c.The refinement (see Supporting Information) resulted in the
satisfactory reliability (R) indices25 (Table 1), indicating thatthe disordered arrangement of Al2 site can be representedadequately with the split-atom model in Figure 3a. Thepositional and isotropic atomic displacement (U) parameters ofatoms are given in Table 2. It should be noted that the siteoccupancies are nearly equal to 3/4 for Al2a and 1/4 for Al2b.Quantitative X-ray analysis with correction for microabsorptionaccording to Brindley’s procedure26 was implemented in theprogram RIETAN-FP. The crystalline phase composition of thesample was found to be 97.9 mol % Al3O3.5C0.5 and 2.1 mol %α-Al2O3, on the assumption that both effective particle radii ofthe two phases were 5.00 μm.The MPF method was subsequently used to confirm the
validity of the split-atom model. After three REMEDY cycles,the subtle EDD changes as revealed by MPF significantlyimproved the RB and RF indices (Table 1). The decreases in Rindices demonstrate that the present disordered structure can
Figure 1. Optical micrographs showing the lath-shaped transparentcrystals (labeled “A”) and opaque materials (labeled “B”). Thinsection. (a) Open polar and (b) crossed polars.
Figure 2. Comparison of the observed diffraction pattern ofAl3O3.5C0.5 and α-Al2O3 (symbol: +) with the corresponding calculatedpattern (upper solid line). The difference curve is shown in the lowerpart of the diagram. Vertical bars indicate the positions of Braggreflections.
Inorganic Chemistry Article
dx.doi.org/10.1021/ic302674g | Inorg. Chem. 2013, 52, 2648−26532650

be seen more clearly from EDD rather than from theconventional structural parameters reported in Table 2.Observed, calculated, and difference XRPD patterns for theMPF are plotted in Figure 2. The EDD determined by MPF arein reasonably good agreement with the atom arrangements(Figure 3b). We therefore concluded that, as long as the crystalstructure was expressed by a ball-and-stick structural model, thepresent split-atom model would be satisfactory.Structure Description. The coordination elements of the
structure are [AlO6] octahedron and two types of [Al(O,C)4]
tetrahedra. The ionic radii of Al3+ in the 6-fold coordination[r(Al3+(6)) = 0.0535 nm and r(O2‑(4)) = 0.138 nm]5 predictsthe interatomic distance of 0.1915 nm for Al−O. This predictedvalue is in good agreement with the Al−O distance of 0.1956nm in [Al1O6] octahedron (Table S1, see SupportingInformation). The average interatomic distances are longerfor the [Al2b(O,C)4] tetrahedron (0.192 nm) than for the[Al2a(O,C)4] tetrahedron (0.180 nm). This difference ininteratomic distance is probably caused by the higherconcentration of C for the former tetrahedral ligand (25% Cand 75% O) than for the latter ligand (18.75% C and 81.25%O) since the average interatomic distance would increase withincreasing C/(C + O) ratio as evidenced by the two extremesof [AlC4] and [AlO4] tetrahedra.The crystal structure of Al3O3.5C0.5 can be regarded as
intergrowth structure, which consists of the α-Al2O3-type[AlO2] single layers (denoted by A) with thickness of ca. 0.191nm separated by the [Al2(O,C)4] unit layers (B) of ca. 0.756nm thickness (Figure 3a). The atom arrangement of the formerlayer is similar to that of α-Al2O3 because, between the twooxygen layers, there are positions for Al atoms such that eachones is octahedrally surrounded by six O atoms. Although one-third of the available positions are vacant for α-Al2O3, all ofthose are filled for the present [AlO2] layer. The atomarrangement of the [Al2(O,C)4] unit layer can be described interms of a three-dimensional network of [Al(O,C)4] tetrahedrawhich are associated by sharing corners. These two types oflayers are alternately stacked in the c-axis direction with asequence ⟨ABABAB⟩ in the unit cell to form a three-dimensional structure.
Antiphase-Domain Structure. We have confirmed usingEELS that the lath-shaped crystals are composed of a smallamount of C atoms together with O atoms (Figure 4). The
main diffraction spots of SAED pattern in Figure 5a, obtainedfrom the selected area of ca. 500 nm in diameter, weresuccessfully indexed with the hexagonal cell with dimensions ofa = ca. 0.30 nm and c = ca. 2.84 nm. The corresponding latticeimage (Figure 5b) strongly suggests that the crystal ischaracterized by a layered structure with the periodicity of ca.2.8 nm along the c axis. The intensity distribution of the main
Figure 3. (a) Crystal structure of Al3O3.5C0.5 (space group R3 ̅m) and(b) three-dimensional electron density distribution determined byMPF. All the atoms in part a are expressed as solid spheres. Becausethe occupancies of Al2a and Al2b sites are less than unity, the Al atomsoccupying there are displayed as blue circle graphs for occupancies.Red and yellow bicolor balls are for oxygen (red) and carbon (yellow)sites. Isosurfaces in part b expressed in smooth shading style for anequidensity level of 0.001 nm−3. Atom numbering in parts a and bcorresponds to that given in Table 1.
Table 2. Structural Parameters and Atomic DisplacementParameters (×10−2 nm2) for Al3O3.5C0.5
siteWyckoffposition g x y z U
Al1 3a 1 0 0 0 0.0094(2)Al2a 6c 0.745(1) 0 0 0.23391(2) 0.0071(2)Al2b 6c 0.255 0 0 0.19499(7) 0.0071O/C 6c 0.75/0.25 0 0 0.11634(4) 0.0139(2)O 6c 1 0 0 0.29981(3) 0.0089(3)
Figure 4. Identification of the presence of C and O in the compound.Electron energy loss spectrum.
Inorganic Chemistry Article
dx.doi.org/10.1021/ic302674g | Inorg. Chem. 2013, 52, 2648−26532651

spots and the lattice image are consistent with the presentstructural model determined by XRPD; the distributions ofblack and white contrast of the simulated image were consistentwith those of the corresponding high resolution micrograph.However, all of the diffraction spots including very weak ones
(Figure 5a) lead to a doubling of the a axis with respect to thehexagonal basic cell. Actually, we have observed APDs usingdark-field TEM technique (Figure 6). Since the superstructurereflections as recognized in the SAED pattern have never beendetectable for the XRPD pattern, the dimensions of the APDsmust be within the coherence range of X-rays. As shown in
Figure 6, the size distribution of the APDs ranges from 1 to 2nm along the c axis and from 2 to 4 nm for the directionperpendicular to the c axis for this compound.The most plausible explanation for the formation of APDs in
Al3O3.5C0.5 is that the phase transition from the high-temperature (H) phase to the low-temperature (L) phase,which must be accompanied by the loss of translationalsymmetry, occurs on cooling. The size of the unit cell would beincreased by 4 during the phase transition since the unit-celldimensions of the H-phase (aH and cH) and those of the L-phase (aL and cL) would be related by aL ≈ 2 × aH and cL ≈ cH.The number of variants possible to produce during the phasetransition is 4. These four variants are related across theantiphase boundaries by the displacement vectors 1/2[100]L,1/2[010]L, and 1/2[110]L. We have observed the APDs thatare related by the displacement vector 1/2[010] (Figure 6).The displacement vectors in the H-phase can acquire differentenergies in the L-phase. Thus these energy difference can favorthe formation of one orientation over the other.
Structural Models Proposed for the H- and L-Phases.We have constructed one of the probable atom arrangements inthe antiphase domains, taking into consideration of the siteoccupancies of Al atoms in the crystal structure ([g(Al2a):-g(Al2b)] = [3:1]). There are eight independent sites in theordered structural model (space group R3 ̅m and Z = 12): fourAl sites at Wyckoff positions 3a (Al1), 6c (Al2), 9e (Al3), and18h (Al4); two O/C sites at 6c and 18h; and two O sites at 6cand 18h (Table S2, see Supporting Information). Each of theAl1 and Al3 atoms is coordinated by six O atoms. The Al4 andAl2 sites, corresponding to the former Al2a and Al2b sites,respectively, are coordinated by four (O, C) atoms (Figure S3,see Supporting Information). The numbers of these sites in theunit cell (N) are 18 for Al4 and 6 for Al2 ([NAl4:NAl2] = [3: 1]).The crystal structure is characterized by the two types oftunnel-like cavities running parallel to ⟨100⟩ (Figure S4, seeSupporting Information). With the H-phase, one of the most
Figure 5. (a) Selected-area electron diffraction pattern and (b)corresponding lattice image. Incident beam almost parallel to thehexagonal a axis. The red open circle in part a indicates thesuperstructure reflection with the indices 0 1/2 2. The simulated imageof Al3O3.5C0.5 (specimen thickness = 88.8 nm and defocus value =−400 nm) is inserted in the lattice image in part b.
Figure 6. Dark-field image formed with the 0 1/2 2 reflection, showingAPD boundaries. One of the distinct boundaries is indicated by anarrow.
Inorganic Chemistry Article
dx.doi.org/10.1021/ic302674g | Inorg. Chem. 2013, 52, 2648−26532652

plausible structural models would be obtained by unifying thesplit sites (Al2a and Al2b) into a single Al site, the z-coordinateof which would be close to 0.215 (≈{z(Al2a) + z(Al2b)}/2).
■ CONCLUSIONWe have determined the electron density distributions andcrystal structure of Al3O3.5C0.5 in the Al2O3−Al4C3 system. Thecrystal structure was satisfactorily represented by the split-atommodel with the space group R3 ̅m (centrosymmetric). The MPFmethod was used to confirm the validity of the structuralmodel. The three-dimensional EDD determined by MPF werein reasonably good agreement with the atom arrangements.The dark-field TEM showed that the crystal was composed ofAPDs related by the unit-lattice translation, suggesting theoccurrence of the high−low phase transition. Thus, the presentstructural model determined by the X-ray diffraction methodmight be of the average crystal structure of the low-temperaturephase.
■ ASSOCIATED CONTENT*S Supporting InformationCIF dataa, tables (interatomic distances and structuralparameters), and figures (chemical compositions, phaseboundaries and ordered structural model). This material isavailable free of charge via the Internet at http://pubs.acs.org.
■ AUTHOR INFORMATIONCorresponding Author*E-mail: [email protected] authors declare no competing financial interest.
■ ACKNOWLEDGMENTSThanks are due to Drs. T. Iwata and H. Toraya, Rigaku Co.Japan, for their technical assistance in XRPD.
■ REFERENCES(1) Qui, C.; Metselaar, R. Z. Metallkd. 1995, 86, 198.(2) Sitnikov, P. A.; Lopatin, S. I.; Ryabkov, Yu. I.; GrassJuly, V. E.Russ. J. Gen. Chem. 2004, 74, 989.(3) Bragg, L.; Claringbull, G. F. In Crystal Structures of Minerals; G.Bell and Sons Ltd.: London, 1965.(4) Th. Gesing, M.; Jeitschko, W. Z. Naturforsch. 1995, 50b, 196.(5) Shannon, R. D. Acta Crystallogr. 1976, A32, 751.(6) Oszlanyi, G.; Suto, A. Acta Crystallogr. 2004, A60, 134.(7) Palatinus, L.; Chapuis, G. J. Appl. Crystallogr. 2007, 40, 786.(8) Rietveld, H. M. Acta Crystallogr. 1967, 22, 151.(9) Takata, M.; Nishibori, E.; Sakata, M. Z. Kristallogr. 2001, 216, 71.(10) Izumi, F. Solid State Ionics 2004, 172, 1.(11) Nord, G. L., Jr. In Minerals and Reactions at the Atomic Scale:Transmission Electron Microscopy: Imaging Transformation-InducedMicrostructures; Buseck, P. R., Ed.; Mineralogical Society of America:Washington, DC, 1992; pp 455−508.(12) Kaga, M.; Urushihara, D.; Iwata, T.; Sugiura, K.; Nakano, H.;Fukuda, K. J. Solid State Chem. 2010, 183, 2183.(13) Inuzuka, H.; Kaga, M.; Urushihara, D.; Nakano, H.; Asaka, T.;Fukuda, K. J. Solid State Chem. 2010, 183, 2570.(14) Urushihara, D.; Kaga, M.; Asaka, T.; Nakano, H.; Fukuda, K. J.Solid State Chem. 2011, 184, 2278.(15) Urushihara, D.; Asaka, T.; Takeda, T.; Hirosaki, N.; Fukuda, K.Powder Diffr. 2011, 26, 4.(16) Kulikov, I. S. Thermodynamics of Oxides, Metallurgiya: Moscow,1986.(17) NIST-JANAF Thermochemical Tables, 4th ed.; Chase, M. W., Jr.,Ed.; Journal of Physical Chemistry Reference Data Monograph No. 9;
American Chemical Society and American Institute of Physics:Woodbury, NY, 1998.(18) Parthe,́ E.; Gelato, L. M. Acta Crystallogr. 1984, A40, 169.(19) Gelato, L. M.; Parthe,́ E. J. Appl. Crystallogr. 1987, 20, 139.(20) Izumi, F.; Momma, K. Solid State Phenom. 2007, 130, 15.(21) Izumi, F.; Momma, K. IOP Conf. Ser.: Mater. Sci. Eng. 2011, 18,022001.(22) Momma, K.; Izumi, F. J. Appl. Crystallogr. 2011, 44, 1272.(23) Lutterotti, L.; Scardi, P. J. Appl. Crystallogr. 1990, 23, 246.(24) Le Bail, A.; Duroy, H.; Fourquet, J. L. Mater. Res. Bull. 1988, 23,447.(25) Young, R. A. Introduction to the Rietveld Method. In TheRietveld Method; Young, R. A., Ed.; Oxford University Press: Oxford,U.K., 1993; pp 1−38.(26) Brindley, G. W. Bull. Soc. Chim. Fr. 1949, D59.
Inorganic Chemistry Article
dx.doi.org/10.1021/ic302674g | Inorg. Chem. 2013, 52, 2648−26532653