abdelmjeed kamal abdelrahman mohamed 2017 - KFUPM ...
92
-
Upload
khangminh22 -
Category
Documents
-
view
0 -
download
0
Transcript of abdelmjeed kamal abdelrahman mohamed 2017 - KFUPM ...


© ABDELMJEED KAMAL ABDELRAHMAN MOHAMED
2017

This work is dedicated to my strength, lovely family.
I
ACKNOWLEDGMENT
The author would like to thank King Fahd University of Petroleum & minerals for the
scholarship to fulfill my master degree in petroleum engineering. Gratitude is to be extended
to petroleum engineering department and the research institute for cooperation and help in
conducting all the experiments.
I would like also to extend my gratitude to Dr. Salaheldin Elkatatny, my thesis advisor, and
all my committee members for their help, cooperation, guidance throughout the work. They,
all, have always been generous with their time.
Appreciation to Mr. Abdussamad, Dr. Badr Ba Geri, Mr. Mohammedin, and Mr. Assad Barri
for their cooperation and help throughout the experimental work, their efforts would never be
forgotten.
Eventually, I would like to thank Dr. Mohamed H. Abdrabou from mechanical engineering
department, for his valuable help and advices in barite ball milling part. He was always keen
to help.

II
TABLE OF CONTENTS
ACKNOWLEDGMENT .......................................................................................... I
TABLE OF CONTENTS ........................................................................................ II
LIST OF TABLES ................................................................................................ V
LIST OF FIGURES .............................................................................................. VI
LIST OF ABBREVIATIONS .............................................................................. VIII
ABSTRACT ....................................................................................................... IX
الرسالة ملخص .................................................................................................... XII
CHAPTER I ........................................................................................................ 1
INTRODUCTION ................................................................................................ 1
1.1 Background ........................................................................................................................1
1.2 High Pressure High Temperature (HPHT) Wells ....................................................................2
1.3 Formation Damage ..............................................................................................................3
1.4 Micronized Barite, BaSO4 ....................................................................................................4
CHAPTER II ....................................................................................................... 5
LITERATURE REVIEW ....................................................................................... 5
2.1 Conventional Drilling Fluids .................................................................................................5
2.2 Heavy Brines ......................................................................................................................7
2.3 Formation Damage from Completion and Workover Fluids ................................................... 13
2.4 Laboratory Evaluation for Completion and Workover Fluids ................................................. 19
2.5 Barite Removal ................................................................................................................. 20
2.6 Barite Ball Milling ............................................................................................................. 22

III
CHAPTER III .................................................................................................... 25
RESEARCH OBJECTIVES AND METHODOLOGY ................................................. 25
3.1 Problem Statement ............................................................................................................ 25
3.2 Research Objectives ........................................................................................................... 26
3.3 Research Methodology and Experimental Work ................................................................... 26
3.3.1 Materials ....................................................................................................................... 26
3.3.2 Barite Ball Milling .......................................................................................................... 28
3.3.3 Solubility Test ................................................................................................................ 31
3.3.4 Zeta Potential Measurements ........................................................................................... 34
3.3.5 Fluid Preparation and Rheology Measurements ................................................................. 36
3.3.6 Sag Test ......................................................................................................................... 39
3.3.7 HPHT Filtration Test ...................................................................................................... 40
CHAPTER IV .................................................................................................... 42
RESULTS AND DISCUSSION .............................................................................. 42
4.1 Barite Ball Milling ............................................................................................................. 42
4.2 The Effect of Barite Particle Size on Fluid Stability ............................................................... 45
4.2.1 Zeta Potential Measurement ............................................................................................ 46
4.2.2 Sag Test ......................................................................................................................... 47
4.3 The Effect of Barite Particle Size on Rheology ...................................................................... 52
4.4 The Effect of Particle Size on Barite Removal ....................................................................... 56
4.4.1 Solubility Test ................................................................................................................ 56
4.4.2 HPHT Filtration Test ...................................................................................................... 59
CHAPTER V ..................................................................................................... 63
CONCLUSION AND RECOMMENDATIONS ......................................................... 63
5.1 Conclusion ........................................................................................................................ 63
5.2 Recommendations ............................................................................................................. 65

IV
REFERENCES ................................................................................................... 66
APPENDIX ....................................................................................................... 70
VITAE .............................................................................................................. 76

V
LIST OF TABLES
Table 1.1: The Common Used Brine as Completion Fluids .................................................... 2
Table 1.2: Common Weighting Materials Densities ............................................................... 4
Table 2.1: Solids Free Completion Fluids- Case Histories ..................................................... 8
Table 2.2: Average Properties of Field Drilling Fluids Used for Tests ................................. 14
Table 2.3: Completion and Workover Fluids Selection Guide .............................................. 22
Table 2.4: Barite Ball Milling Case Studies ......................................................................... 24
Table 3.1: Completion Fluid Additives ................................................................................ 28
Table 3.2: Ball Milling Operating Parameters ...................................................................... 29
Table 3.3: Solubility Test Summary .................................................................................... 32
Table 3.4: Zeta Potential and Colloids Stability ................................................................... 35
Table 3.5: Completion Fluid Formulation ............................................................................ 37
Table 3.6: Completion Fluid Properties ............................................................................... 37
Table 4.1: Barite Particle Size Before and After Ball Milling ............................................... 45
Table 4.2: Completion Fluid Formulation ............................................................................ 49
Table 4.3: Completion Fluid Properties ............................................................................... 49
Table 4.4: Completion Fluid Rheology at 120 °F ................................................................. 55
Table 4.5: Completion Fluid Rheology at 250 °F ................................................................. 55
Table 4.6: Chemical Composition of Barite Samples (Oxides) ............................................. 58
Table 4.7: Chemical Composition of Barite Samples (Elements) ......................................... 59
Table 4.8: HPHT Filtration Test Summary .......................................................................... 62
Table A.1: Zeta Potential Measurements of Raw Barite ....................................................... 72
Table A.2: Zeta Potential Measurements of Barite (106-75 µm) .......................................... 72
Table A.3: Zeta Potential Measurements of Barite (75-40 µm) ............................................ 72
Table A.4: Zeta Potential Measurements of Barite (<40 µm) ............................................... 72
Table A.5: Zeta Potential Measurements of Micronized Barite (1.5 µm) .............................. 73
Table A.6: Filtrate Volume with Time for Micronized Barite at 250 °F (Old Formulation) .. 73
Table A.7: Filtrate Volume with Time for Micronized Barite at 250 °F (New Formulation). 74
Table A.8: Filtrate Volume with Time for Raw Barite at 250 °F .......................................... 75

VI
LIST OF FIGURES
Figure 2.1: Completion Fluid Loss to Formation- Total Fluid Lost per Completion ............. 10
Figure 2.2: Corrosion Rate of CaBr2 Brine versus pH ......................................................... 11
Figure 2.3: Corrosion Rate of Brine versus Temperature ..................................................... 11
Figure 2.4: Corrosion Rate of ZnCl2-CaCl2 Brine versus Density ...................................... 11
Figure 2.5: The Effect of Field Oil-Based Mud on Permeability to Oil of 1-in. Diameter
Berea Sandstone Cores ..................................................................................... 15
Figure 2.6: The Effect of Field Clay-Water Mud on Permeability to Oil of 1-in. Diameter
Berea Sandstone Cores ..................................................................................... 15
Figure 2.7: The Effect of Field Emulsion Mud on Permeability to Oil of 1-in. Diameter
Berea Sandstone Cores ..................................................................................... 16
Figure 2.8: Apparent Permeability Reduction in Cypress Sandstone Cores due to Injection
of Various Treated and Untreated Bay Water .................................................... 17
Figure 2.9: Effect of Enzyme-Broken Guar Gum Solution on Permeability of Cypress
Sandstone ......................................................................................................... 18
Figure 2.10: Effect of Unbroken Guar Gum Solution on Permeability of Cypress
Sandstone…. .................................................................................................... 18
Figure 2.11: Schematic of Return Permeability Test Apparatus .......................................... 21
Figure 3.1: Particle Size Distribution of Raw Barite Sample ................................................ 27
Figure 3.2: Elemental Composition of Raw Barite Sample .................................................. 27
Figure 3.3: TENCAN Planetary Ball Milling Machine ........................................................ 29
Figure 3.4: SEM Machine.................................................................................................... 30
Figure 3.5: XRD Machine, D8 Advance .............................................................................. 30
Figure 3.6: TURBOTRAC Particle Size Analyzer ............................................................... 31
Figure 3.7: Solubility Test Setup ......................................................................................... 33
Figure 3.8: Filtration Setup .................................................................................................. 33
Figure 3.9: Weight Balance ................................................................................................. 34
Figure 3.10: JENWAY pH Meter ........................................................................................ 35
Figure 3.11: LAB-LINE Multi-Wrist Shaker ....................................................................... 35
Figure 3.12: ZetaPALS Zeta Potential Analyzer .................................................................. 36
Figure 3.13: Drilling Fluid Mixer ........................................................................................ 37
Figure 3.14: Mud Balance ................................................................................................... 38
Figure 3.15: Fan 35A Viscometer ........................................................................................ 38
Figure 3.16: GRACE m5600 Rheometer ............................................................................. 38
Figure 3.17: Static Sag Test Setup ....................................................................................... 40
Figure 3.18: HPHT Filter press, 500 ml, OFITE .................................................................. 41
Figure 4.1: XRD Patterns of Barite Before and After Ball Milling ....................................... 44
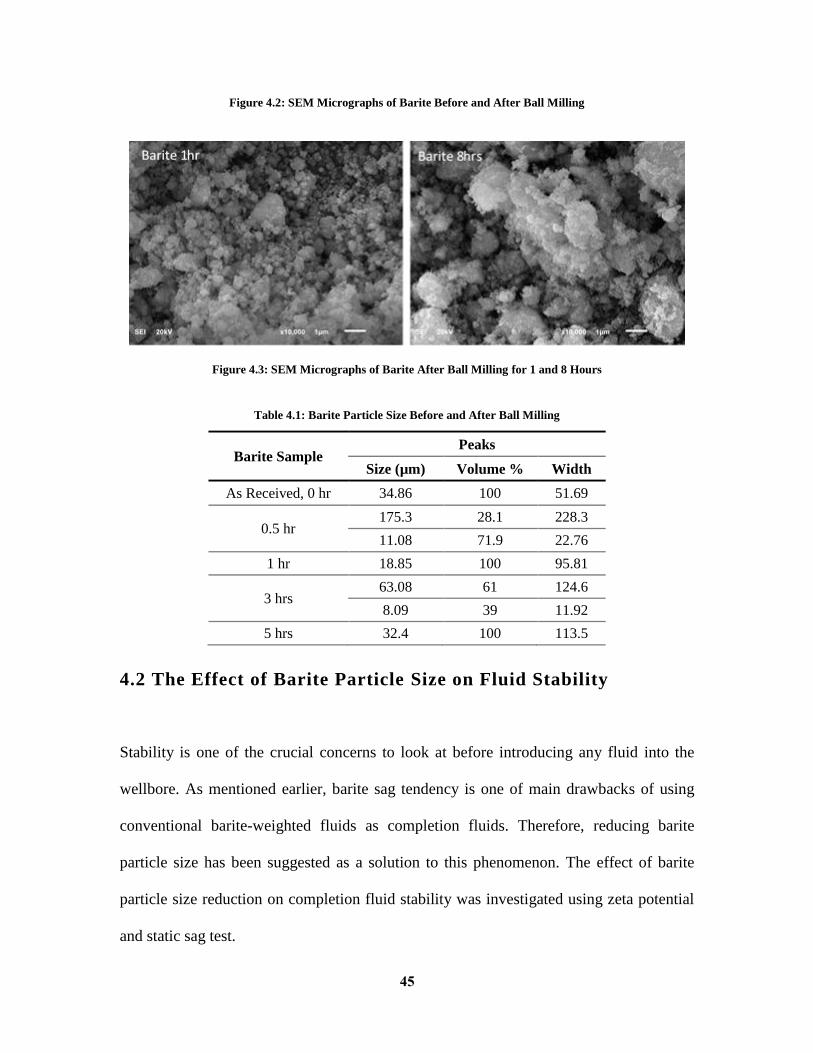
Figure 4.2: SEM Micrographs of Barite Before and After Ball Milling ................................ 45
Figure 4.3: SEM Micrographs of Barite After Ball Milling for 1 and 8 Hours ...................... 45
Figure 4.4: The Effect of Barite Particle Size on Zeta Potential Measurement...................... 47
Figure 4.5: Temperature Effect on Densities Difference for Raw Barite After 24 Hours ...... 50
Figure 4.6: Temperature Effect on Sag Factor for Raw Barite After 24 Hours ..................... 50
Figure 4.7: A Sample of Completion Fluid After 24 Hours at 312 °F ................................... 51
file:///F:/KFUPM/Thesis/Reports/Thesis/MSc-Thesis-ABDELMJEED-KAMAL-January-2017.docx%23_Toc470833599

VII
Figure 4.8: The Effect of Barite Particle Size on Densities Difference at 230 °F After 24
Hours................................................................................................................ 51
Figure 4.9: The Effect of Barite Particle Size on Sag Factor at 230 °F After 24 Hours ......... 52
Figure 4.10: The Effect of Barite Particle Size on Rheology at 120 °F ................................. 53
Figure 4.11: The Effect of Barite Particle Size on Gel Strength at 120 °F ............................ 54
Figure 4.12: The Effect of Barite Particle Size on Rheology at 250 °F and 300 psi .............. 54
Figure 4.13: The Effect of Barite Particle Size on Gel Strength at 250 °F ............................ 55
Figure 4.14: The Effect of Particle Size on Barite Solubility (g/L) in DTPA with K2CO3..... 57
Figure 4.15: The Effect of Particle Size on Barite Solubility (%) in DTPA with K2CO3 ....... 57
Figure 4.16: Barite Solubility in DTPA with K2CO3 for Two Different Barite Samples ....... 58
Figure 4.17: The Effect of Adding Different Proportions of Bridging Agent on Filtration
Performance of Micronized Barite ................................................................... 61
Figure 4.18: Filtration Performance of Raw and Micronized Barite Samples ....................... 61
Figure 4.19: Filter-cake Before (a) and After Removal (b) ................................................... 62
Figure A.1: Particle Size Distribution of Barite Sample (106-75 µm) .................................. 70
Figure A.2: Particle Size Distribution of Barite Sample (75-40 µm) .................................... 70
Figure A.3: Particle Size Distribution of Barite Sample (Less than 40 µm) .......................... 71
Figure A.4: Particle Size Distribution of Micronized Barite Sample .................................... 71

VIII
LIST OF ABBREVIATIONS
HPHT: High Pressure High Temperature
DTPA: Di-ethylene Tri-amine Penta acetic Acid
XRD: X-Ray Diffraction
SEM: Scanning Electron Microscope
XRF: X-Ray Fluorescence

IX
ABSTRACT
Full Name : Abdelmjeed Kamal Abdelrahman Mohamed
Thesis Title : The Evaluation of Using Micronized Barite as a Completion Fluid
Weighting Material in HPHT Wells
Major Field : Petroleum Engineering
Date of Degree : January 2017
Completion and workover fluids are one of the prominent factors that play a great role in the
success of completion and workover operations. Since these fluids have a great impact on
personnel safety, environment, wells productivity, and the total cost of the operation, great
efforts should be put into selecting the optimal fluid to accomplish the required job.
Completing high pressure high temperature wells is one of the challenging jobs that require
formulating a special type of fluids due to the complexity and the critical downhole
conditions of high pressure high temperature wells. This complexity and the new technical
developments on drilling and completion operations pushed the industry towards the
development of new formulations and implementation of advanced technologies to meet all
the requirements and the use of conventional drill-in fluids, barite-weighted fluids, was
discontinued. However, some of the proposed fluids have environmental issues while others
are costly.
Since conventional drill-in fluids have high density, are environmentally friendly and
relatively inexpensive, this work aims to evaluate micronized barite as a weighting material
to resolve the problems associated with conventional drill-in fluids, i.e. formation damage

X
and fluid stability, in order to use these fluids as completion and workover fluids in HPHT
wells.
In addition to the commercial sample of barite, different sizes of barite, i.e. 106-75 µm, 75-40
µm, and less than 40µm, were prepared using sieve analysis. Moreover, a sample of
micronized barite was prepared by reducing barite particle size to a few microns using ball
milling machine after optimizing the operating parameters of ball milling machine.
Afterwards, solubility tests were conducted to study the effect of particle size on barite
removal using a recently developed formulation, DTPA with potassium carbonate as a
catalyst. The effect of barite particle size on the rheological properties of the drill-in fluids
was investigated at 120 and 250°F. Barite particle size effect on fluids stability was also
investigated using zeta potential measurements and static sag test.
Furthermore, a new formulation using different proportions of bridging agent (calcium
carbonate) was designed to mitigate the resulted formation damage by minimizing fluid
filtrate and solid particles invasion into the formation. The new formulation was evaluated to
ensure its capability to properly accomplish the required job.
As a result of barite particle size reduction, solubility test results showed a good enhancement
in barite removal due to the increase of chemical reaction surface area, and HPHT filtration
test confirmed these results and showed an improvement of around 5% in filter cake removal
efficiency.
Moreover, reducing barite particle size showed a thickening behavior in rheology of
completion fluids and as the temperature increases, the thickening behavior becomes more
noticeable.

XI
Finally, zeta potential measurements showed a good enhancement in stability with
micronized barite for a pH range greater than 8, while the other sizes of barite were lying in
the unstable range, i.e. -30 to +30 mv. While, in contrast, sag test showed insignificant
enhancement in fluid stability as barite particle size was reduced to micronized size with a
sag factor of 0.546 as compared to 0.563 for the normal size at 230°F.

XII
ملخص الرسالة
المجيد كمال عبدالرحمن محمدعبد :االسم الكامل
ذات الضغط و اآلبارودراسة البارايت ذو الجزيئات الصغيرة كمادة لزيادة كثافة السوائل إلستكمال تقييم :عنوان الرسالة
درجات الحرارة المرتفعة
هندسة النفط التخصص:
2016 يناير :تاريخ الدرجة العلمية
وصيانة ستكمالدورا كبيرا في نجاح عمليات إ من العوامل البارزة التي تلعبهي واحدة وصيانة اآلبار ستكمالإ سوائل
اآلبار. وبما أن هذه السوائل يكون لها تأثير كبير على سالمة األفراد والبيئة واآلبار اإلنتاجية، والتكلفة اإلجمالية للعملية،
.يجب وضع جهودا كبيرة في اختيار السائل األمثل إلنجاز العمل المطلوب
ن نوع خاص م تقديمالوظائف الصعبة التي تتطلب هي واحدة من المرتفعة درجة الحرارة وضغط ال ذات اآلبارإستكمال
يد والتطورات درجة الحرارة. هذا التعق ارتفاعو ارتفاع ضغط المكامن ،في اسفل البئرجة الحر للظروفالسوائل نظرا
متقدمة لتلبية جميع قنياتوتنفيذ ت السوائل الصناعة نحو تطوير تعستكمال دفالعمليات الحفر وا فيالتقنية الجديدة
افإن بعض السوائل المقترحة لديه قد توقف. ومع ذلك،يت، االبارالتقليدية، الحفر سوائل جديدة واستخدام المتطلبات ال
.مكلفة األخرىبيئية في حين أن مشاكل
ذو الجزيئات يتاالعمل إلى تقييم البار ة وغير مكلفة نسبيا، ويهدف هذاالتقليدية لديها كثافة عالية، وصديقة للبيئالسوائل
خفض االنتاجية، أي ضرر الحفر التقليدية سوائلب لحسم المشاكل المرتبطة مضافة لزيادة كثافة السوائلالصغيرة كمادة
الضغط و درجة الحرارة العالية.ار ذات إنجاز وصيانة اآلب فيالسوائل، وذلك لالستفادة من هذه السوائل هذه يةستقراروا
تم تجهيز عينات من البارايت بجزيئات مختلفة الحجم و ذلك عن طريق الغربال و الطحن و ذلك لدراسة تأثير حجم
لدراسة تأثير يةبعد ذلك، تم إجراء اختبار الذوبان و في إزالة هذه السوائل لرفع االنتاجية.ارية السوائل رالجزيئات في استق
مع كربونات (DTPA)باستخدام السوائل المخلبية يت باستخدام صيغة وضعت مؤخرا، اعلى إزالة البار زيئاتحجم الج
(.Rheologyكما تمت دراسة تأثير تقليل حجم الجزيئات على خواص الجريان )البوتاسيوم كعامل محفز.
غيرة مع اإلضافات المناسبة وذلك لتخفيف الص جزيئاتالذو يت اوعالوة على ذلك، تم تصميم صياغة جديدة باستخدام البار
الضغط و الحرارة . تم تقييم صياغة جديدة في ظل ظروفالصغيرة للطبقة المنتجةالناتج عن غزو الجسيمات الضرر
.لضمان قدرتها على إنجاز المهمة المطلوبة بشكل صحيح العالية
كما كان فاءة إزالة البارايت و بالتالي رفع انتاجية االبارو من نتائج هذه الدراسة أن تقليل حجم الجزيئات أسهم في رفع ك
.عامال فعاال في تحسين استقرارية هذه السوائل

1
CHAPTER I
INTRODUCTION
1.1 Background
Completion and workover fluids can be defined as the fluids that are mainly used to
maintain and control the well pressure during completion and workover jobs, such as
perforation, sand consolidation operations, gravel packing, or any other completion
techniques. Several types of completion fluids can be introduced into the well, however,
this fluid should be dense enough to balance the formation pressure, the higher formation
pressure we encounter the denser fluid is required.
Moreover, completion and workover fluids must also be capable of suspending the free
solids that are required in some operations, such as under reaming and gravel packing,
additionally, in well killing and cementing, for instance, it must be able to replace other
fluids in the wellbore.(Patton and Phelan, 1985) Efficiency, safety, cost, and the impact
on well productivity are the main factors should be put into consideration while selecting
and designing any completion fluid.
Different fluids were used to maintain that positive differential pressure such as, salt
water, sodium chloride, calcium chloride, and zinc chloride. Nevertheless, each fluid has
some drawbacks which require formulating special types of completion fluids for any
reservoir conditions. For instance, although salt water is economical to be used as a
2
completion fluid but low densities can be obtained, only up to 10 lb/gal, which cannot be
used safely in deep reservoirs due to the high formation pressures.(Paul et al., 1974)
Calcium chloride can also be used with a density up to 11.6 lb/gal and some insoluble
weighting materials are used, to accomplish higher densities but, in facts, those materials
cause some problems such like permeability reduction which, in some severe cases, leads
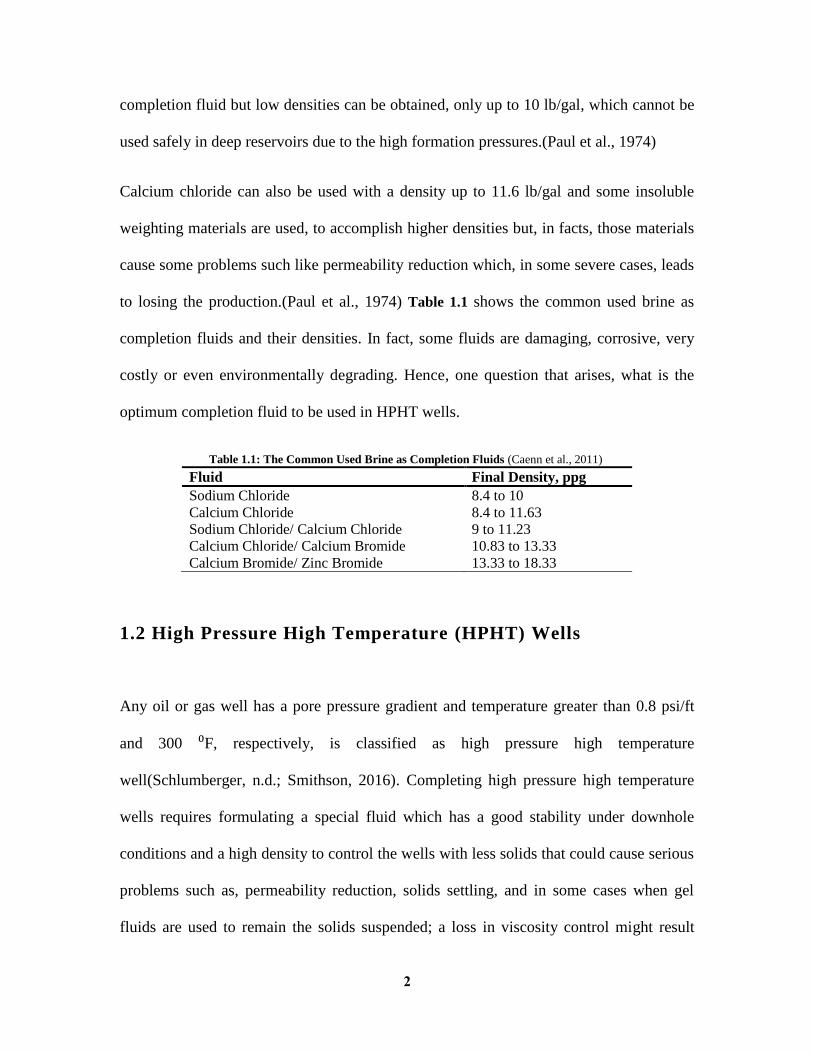
to losing the production.(Paul et al., 1974) Table 1.1 shows the common used brine as
completion fluids and their densities. In fact, some fluids are damaging, corrosive, very
costly or even environmentally degrading. Hence, one question that arises, what is the
optimum completion fluid to be used in HPHT wells.
(Caenn et al., 2011)Table 1.1: The Common Used Brine as Completion Fluids
Fluid Final Density, ppg
Sodium Chloride 8.4 to 10
Calcium Chloride 8.4 to 11.63
Sodium Chloride/ Calcium Chloride 9 to 11.23
Calcium Chloride/ Calcium Bromide 10.83 to 13.33
Calcium Bromide/ Zinc Bromide 13.33 to 18.33
1.2 High Pressure High Temperature (HPHT) Wells
Any oil or gas well has a pore pressure gradient and temperature greater than 0.8 psi/ft
and 300 ⁰F, respectively, is classified as high pressure high temperature
well(Schlumberger, n.d.; Smithson, 2016). Completing high pressure high temperature
wells requires formulating a special fluid which has a good stability under downhole
conditions and a high density to control the wells with less solids that could cause serious
problems such as, permeability reduction, solids settling, and in some cases when gel
fluids are used to remain the solids suspended; a loss in viscosity control might result

3
especially with uncertain bottom-hole temperatures. Generally, two choices of
completion fluids were reported in the literature, either utilizing the conventional drilling
fluids or using heavy brine formulations.
1.3 Formation Damage
Formation damage is defined as any interaction between drilling, completion, or
stimulation fluids and the formation/formation fluid, that might cause an impairment to
the reservoir, i.e. permeability reduction in the near-wellbore area. Many fields and
research studies have assured that selecting the inappropriate completion fluid or
additives is one of the main causes of formation damage that leads to permeability
reduction in the vicinity of the wellbore and in some severe cases it might lead to losing
the production. Basically, formation damage due to completion fluids occurs from the
filtrate invasion into the formation, thus the only way to significantly mitigate the damage
is to reduce the filtrate to the least possible amount using the suitable additives and
formulation. (Reed, 1989) Formation damage occurs in the forms of:
Clay swelling
Fines migration
Emulsion and water blocks
Scales precipitation
Relative permeability effect
Dissolution

4
Plugging the formations due to improper operation conditions or introducing
plugging materials. (Eaton and Smithey, 1971; Millhone, 1983)
Generally, there are three techniques to avoid formation damage: underbalance, where
there is no fluid invasion into the formation, balanced, where a little fluid invasion is
expected, and overbalance with appropriate selection of non-damaging, degradable
fluids.(Millhone, 1983)
1.4 Micronized Barite, BaSO4
Micronized barite could be defined as barite that has an average particle size of a few
micrometers. Basically, barite is one of the most common used weighting materials for
conventional drilling fluids. It has been used since 1920s due to its high density, 4.5
g/cm3, which makes it a good candidate to control high pressure high temperature wells.
Moreover, it is easy to handle and relatively not costly. Nevertheless, its use in
completion fluids was stopped due to the formation damage and stability issues. (Patton
and Phelan, 1985) Table 1.2 shows the most common used weighting materials and their
densities.
Table 1.2: Common Weighting Materials Densities (Caenn et al., 2011)
Weighting Material Density, g/cm3
Calcite 2.7
Aragonite 2.8
Iron carbonate 3.9
Zinc carbonate 4.4
Barite 4.5
Ilmenite
Manganese tetroxide
Iron oxide
Zinc oxide
Zirconium oxide
Lead carbonate
4.5
4.7
5.1
5.6
5.7
6.6

5
CHAPTER II
LITERATURE REVIEW
Completion and workover fluids play a great role in the success of the completion and
workover fluids. Since, producing formations, rig personnel, and the environment are
exposed to these fluids thus, great efforts should be put while selecting and designing
completion and workover fluids.
In general, completion and workover fluids can be classified into two main categories:
clear fluids (solid-free fluid) and solid-weighted fluids. The difference between these
categories is the presence of solid particles as weighting material to increase the fluid
density. Fluid efficiency, compatibility with the formation, environmental impact, and the
cost are the main factors should be considered before selecting and designing completion
and workover fluids to ensure their ability to successfully accomplish the required job.
Fluid efficiency is the capability of the fluid to control the well throughout completion
and workover operations, fluid stability under downhole conditions (i.e. pressure and
temperature, and well geometry and inclination), and the ability of the fluid to displace
the other fluid in the wellbore (rheology).
2.1 Conventional Drilling Fluids
Since fluid density can reach 20 ppg, conventional drilling fluids were used as
completion and workover fluids. Three systems were used, water-based, oil-based, and
emulsion mud. Consequently, formation damage resulted in many cases.

6
In 1985, Patton and Phelan reported that the main problem of using conventional drilling
fluids as completion fluids is the high solid content and these solid particulates were
found to be the main cause of formation damage in so many cases in the literature, and
therefore, their use was stopped. (Patton and Phelan, 1985) Another problem of using the
drilling fluids is the possibility of solid particles settlement, sag effect, which would not
solely lead to losing their efficiency to control the well, but these solid particles will also
interfere with completion and workover operations. (Scott et al., 2004)
Barite sag, or solids sag, is a complex phenomenon and very likely to occur in deviated
wells especially in low-shear cases(Hanson et al., 1990). Although it is very difficult to
simulate, but a good optimization and monitoring for mud rheological properties, sound
strategies, and training for drilling personnel would help manage solids sag and mitigate
its consequences. (Scott et al., 2004)
Many cases of the sag effect were documented in the literature, for instance, during
completing the first well in Hulder field in the North Sea using barite- weighted oil-based
mud, a severe kick was encountered. It occurred because of barite sag, and well geometry
contributed in the sag effect. (Saasen et al., 2002)
Alabdullatif et al. introduced a new formulation of water base mud to kill the over-
pressured formations. They combined Mn3O4 to the normal weighting material, barite, to
overcome barite sag tendency that was encountered in previous operations. Mn3O4 was
very effective in enhancing sag performance and minimizing the risk of losing well
control especially after a long time of static condition. (Alabdullatif et al., 2015)

7
In summary, if these two problems, formation damage and sag effect, were solved, the
conventional drilling fluids would be one of the best choices of well servicing fluids due
to their relatively low cost and the possibility of having high density fluid that could
perfectly control high pressure wells.
2.2 Heavy Brines
In general, heavy brine could be classified into two categories, particulate-weighted
fluids which are formulated by adding acid-soluble weighting agents and/or without non-
damaging polymers, and clear fluids (solids-free fluids). (Paul et al., 1974)
In 1973, Paul J. R. and Plonka J. H. proposed “calcium bromide/ calcium chloride” as a
solution to high pressure wells. They reported that the proposed solution of calcium
bromide/ calcium chloride could be prepared with a range of density from 11.6 lb/gal and
up to 15.1 lb/gal with no solids (Table 2.1). Additionally, it has been proved that calcium
bromide is corrosion resistive and environmentally friendly. Although the cost of calcium
bromide/ calcium chloride is less than double of the cost of conventional drilling muds
but, for instance, one dead well or a fishing job for a stuck packer in an offshore well that
might result from using that conventional drilling muds would be too much expensive
than using calcium bromide/ calcium chloride as a completion fluid. (Paul and Plonka,
1973)
In 1979, from the case of Cal Canal field, Conners and Bruton confirmed that calcium
bromide/calcium chloride solution can be successfully used as a drill-in fluid. Ordinary
drilling mud was replaced by calcium bromide/calcium chloride to drill the producing

8
formation in around 18 wells and almost no formation damage was recorded. They also
concluded that the high cost of using calcium bromide/calcium chloride could be
minimized by experience and correct practices, especially with a large number of wells.
Drilling with calcium bromide/calcium chloride requires effective solid removal
equipment and prior thorough study to determine its applicability. (Conners and Bruton,
1979)
Table 2.1: Solids Free Completion Fluids- Case Histories (Paul and Plonka, 1973)
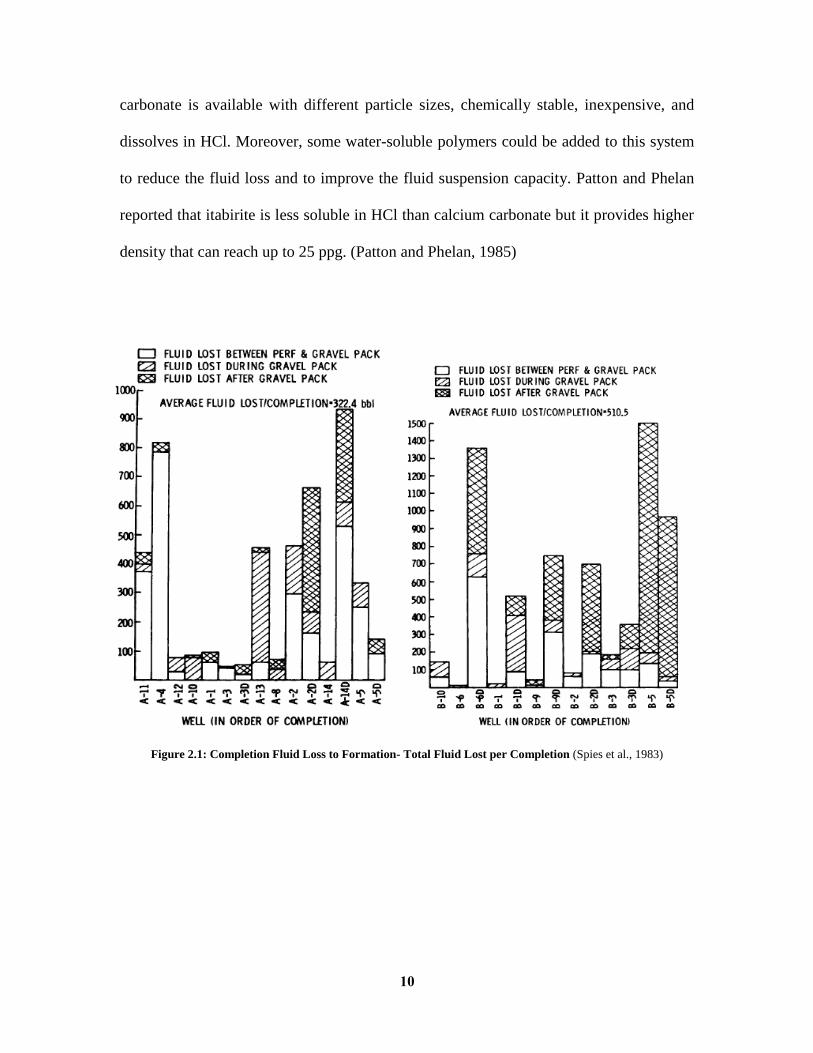
Another case of using calcium bromide/calcium chloride brine as a completion fluid was
found in the literature. It has been used in the Gulf Mexico by Amoco Production
Company and two problems were encountered: 1) High fluid losses at the surface and
into the formation that led to an extreme increase in the cost of the completion job
(Figure 2.1), 2) losing some weight of the completion fluid due to hydration, mixing with
air and formation fluids, and crystallization due to the bottom hole temperature and that
would result in losing well control. Thus, Zinc bromide was added to the solution to
increase the fluid density with 200 psi overbalance in order to maintain the well control
Well A B C D E to H
Location Offshore Louisiana Offshore Louisiana Offshore Louisiana Offshore Louisiana Offshore Louisiana
Depth, ft 8,000 8,500 10,000 10,500 8,000 Range
Well Status New Workover New New New Workover
Completion Fluid:
Type CaBr2/CaCl2 CaCl2 CaBr2/CaCl2 CaBr2/CaCl2 CaBr2/CaCl2
Density, ppg 15 11.7 12.5 12.5 12
Volume, bbls 35 1000 125 150 100
Oil or Gas Oil Oil Oil Oil Oil
Reservoir Pressure, psi 5,800 5,100 7,000 7,200 4,400
Casing Size 7" 7 5/8" - - 7 5/8 - 9 5/8"
Tubing Size 2 3/8" 2 3/8" Dual 3 1/2" 3 1/2" 2 3/8 - 2 7/8''
Packer Yes Yes No No Yes
Purpose To control pressure for packer hold To control pressure
during gravel pack down fluid during during sand clearout
procedure; no perforating and and general workover
injection of solids completing of well; operations
to formation gravel pack
Results Successful Successful Successful Successful Successful
To control reservoir pressure
during plastic sand consolidation
and well completion

9
during the whole period of completion operation. Nevertheless, zinc bromide was found
to be environmentally hazardous and causes skin diseases and loss of vision when eyes
are exposed to it, thus all personnel on the floor were required to use safety goggles.
(Spies et al., 1983)
To reduce the fluid losses into the formation, various types of polymers have been used to
maintain the desirable viscosity. Darlington et al. found out that the rate of yield of
viscosity and the final viscosity are highly dependent on the brine composition, the
method of preparation and the activation. According to the amount of residual polymer
after degrading, hydroxyethyl cellulose (HEC) was found to be the less damaging
polymer, no polymer is as effective as HEC to be used with heavy brines. Nevertheless,
HEC cannot viscosify any brine formulation, especially when the density of brine is high,
and therefore the activation process is needed. They also concluded that the efficiency of
activated HEC is higher than HEC powder and the activated HEC reduces the time of
yielding and requires smaller amount of polymer. (Darlington et al., 1982)
The good optimization of particulates size can be an effective way to reduce the fluid loss
into the formation. Brans stated that the large solid particles of the fluid loss additives
should be at least one-third the diameter of the pores openings of the formation. (Tuttle
and Barkman, 1974)
Another advances in the design of the particulate-weighted fluid is using acid-soluble
weighting materials, such as calcium carbonate, magnesium carbonate, and itabirite. The
resulted filter cake could be easily removed by washing the formation by hydrochloric
acid. Calcium carbonate-brine system was found to be the best because calcium
10
carbonate is available with different particle sizes, chemically stable, inexpensive, and
dissolves in HCl. Moreover, some water-soluble polymers could be added to this system
to reduce the fluid loss and to improve the fluid suspension capacity. Patton and Phelan
reported that itabirite is less soluble in HCl than calcium carbonate but it provides higher
density that can reach up to 25 ppg. (Patton and Phelan, 1985)
Figure 2.1: Completion Fluid Loss to Formation- Total Fluid Lost per Completion (Spies et al., 1983)

11
Figure 2.2: Corrosion Rate of CaBr2 Brine versus
pH (Paul and Plonka, 1973) Figure 2.3: Corrosion Rate of Brine versus
Temperature (Paul and Plonka, 1973)
Figure 2.4: Corrosion Rate of ZnCl2-CaCl2 Brine
versus Density (Paul and Plonka, 1973)

12
In 1984, Thomas D. C. et al. pointed out that pressure and temperature have a significant
impact on the brine density, a good prediction of the resultant fluid density does help in
optimizing the fluid formulation and cost and with poor estimation either a failure in well
control would occur in case of low estimates or a high amount of fluid losses due to the
excessive overbalance in case of conservative estimates. Accordingly, they developed a
model to estimate the brine density- CaCl2, CaBr2, and ZnBr2, accounting for the effect of
pressure and temperature. The model was based on the experimental and literature
data.(Thomas et al., 1984)
Formate brine is the solution of alkali-metal salts of formic acid. In general, these alkali-
metals are: sodium, potassium, and cesium. Cesium formate is the highest density. Water-
soluble polymers and filtration control agents should be added to the solution to meet all
the needed properties of completion and workover fluids. These formulations were
proved to be environmentally friendly and could be reused after treatment. (Downs et al.,
1994) Moreover, many cases in the literature have shown a great success of using formate
brine as a drill-in and completion fluid. (Berg et al., 2009; Black et al., 1990; Carnegie et
al., 2013; Conners and Bruton, 1979; Downs and Fluids, 2011; Downs et al., 2006)
Nevertheless, more efforts are needed to control the losses of these costly fluids. (Black
et al., 1990)
In 1996, Ramsey et. al. investigated the use of cesium formate (18.7 ppg) as a drill-in
fluid. Cesium formate showed higher drilling rate when compared with water-base
hematite drilling mud. The formed filter cake was very thin and a high spurt loss was
exhibited. (Black et al., 1990)

13
In 2003, Javora et. al. spotted the light on other problems of using formate brines as a
completion and workover fluids by studying the chemistry of formate brines under
downhole conditions. They concluded that corrosion and decomposition of these fluids
are likely, especially in the presence of hydrogen sulfide and carbon dioxide and this
could be mitigated to certain extent by adding buffer additives. They also concluded that
the corrosion and decomposition is highly dependent on the metal type that the brine is in
contact with. (Javora et al., 2003)
One more problem of using formate brines is that they affect the reading of nuclear logs,
due to the high filtrate invasion. (Galford et al., 2005; Moake, 2012) In 2005, in an effort
to eliminate the effect of brine-based mud on the reading of nuclear logs, Galford et. al.
proposed a model that estimates the additional effect of brine filtrate on log readings.
This model was based on laboratory measurements and numerical simulation. (Galford et
al., 2005)
2.3 Formation Damage from Completion and Workover Fluids
There are many research and field studies were reported in the literature related to
formation damage and many techniques were developed to prevent, mitigate, or remove
the damage induced by drilling, completion, or well stimulation fluids.
In 1954, Krueger and Vogel investigated the effect of different types of drilling fluids,
oil-base mud, water-base mud, emulsion mud, on several cores of Berea sandstone under
high pressure high temperature dynamic conditions (Table 2.2). A permanent damage to
the cores resulted due to solid particles invasion. They found out that this damage

14
depends on fluid type and exposure time. The longer the exposure time the higher
permeability reduction. They also concluded that the damage caused by fluid filtrate in
water-sensitive formations is higher than that caused by solid invasion for a short time of
exposure but, for 20 to 30 days of completion the later will be more damaging to the
formation (Figures: 2.5, 2.6 & 2.7). (Krueger and Vogel, 1954)
In 1974, Tuttle and Barkman conducted a study on the completion fluids that had been
commonly used by Shell Company in the Gulf Coast area, which were: filtered or
unfiltered bay water with 5% NaCl, and bay water with 5% NaCl with adding guar gum.
They found out that bay water solids caused a high decrease in the core permeability
(Figure 2.8) and only 10% to 30% of the original permeability could be restored by back
flowing with brine and not more than 50% could be regained by acid treatment. They also
concluded that, in case of guar gum damage, 50% of the original permeability could be
regained by back flowing after breaking the guar gum and only 25% could be regained
with unbroken guar gum (Figures: 2.9 & 2.10). (Tuttle and Barkman, 1974)
Table 2.2: Average Properties of Field Drilling Fluids Used for Tests (Krueger and Vogel, 1954)
Drilling Fluid Weight, PCF
Marsh
Funnel
Viscosity, Sec at 170 °F
Fluid Loss (API), cc Time in Use
in Drilling
Well, days
Room Temperature 200 °F
15 min 1 hour 15 min 1 hour
Emulsion 68 45 0.8 3.2 5 9.5 27+
Oil-base
Sample1 65 60 - - - - 4.5
Sample2 63 54 - - - - 11
Clay-water
Sample1 73 50 11 11 9 20 2.5
Sample2 74 45 3.2 7.8 6 14 27

15
Figure 2.5: The Effect of Field Oil-Based Mud on Permeability to Oil of 1-in. Diameter Berea Sandstone Cores
(Krueger and Vogel, 1954)
Figure 2.6: The Effect of Field Clay-Water Mud on Permeability to Oil of 1-in. Diameter Berea Sandstone
Cores(Krueger and Vogel, 1954)

16
Figure 2.7: The Effect of Field Emulsion Mud on Permeability to Oil of 1-in. Diameter Berea Sandstone Cores
(Krueger and Vogel, 1954)

17
Figure 2.8: Apparent Permeability Reduction in Cypress Sandstone Cores due to Injection of Various Treated
and Untreated Bay Water (Tuttle and Barkman, 1974)

18
Figure 2.9: Effect of Enzyme-Broken Guar Gum Solution on Permeability of Cypress Sandstone (Tuttle and
Barkman, 1974)
Figure 2.10: Effect of Unbroken Guar Gum Solution on Permeability of Cypress Sandstone (Tuttle and Barkman,
1974)

19
In 1985, Morgenthaler L. N. conducted a study on sandstone cores to investigate the
formation damage caused by high-density brine completion fluids. He reported that the
main causes of formation damage when using solids-free completion fluids, especially
calcium carbonate, is saults precipitation not because of the unfavorable interactions
between the fluid filtrate and the clay that presents in the cores. Formulating the brines
that have a density greater than 14 ppg with at least 8% of zinc bromide was
recommended to decrease the pH in order to prevent saults precipitation. (Morgenthaler,
1986)
In 2001, Suri and Sharma stated that a proper selection of particle size would
significantly minimize the formation damage caused by solid particles from drilling and
completion fluids. They also developed a filtration model that quantifies the formation
damage caused by different particle sizes. This model yielded reasonable results when it
was compared with actual experimental data. (Suri and Sharma, 2001)
2.4 Laboratory Evaluation for Completion and Workover Fluids
Evaluating completion and workover fluids requires a series of experiments and
measurements that should be conducted prior to the field applications under the expected
downhole conditions in order to simulate the actual case. In general, these measurements
include rheological properties measurements and fluid stability and compatibility with the
target formation.

20
From field experience, some compatibility issues are well documented in the literature
and do not require performing any experiments, for instance, active clays cannot be
drilled using non-inhibited water-based mud. Nevertheless, usually compatibility study
should be conducted especially with new fluid formulations or in critical conditions.
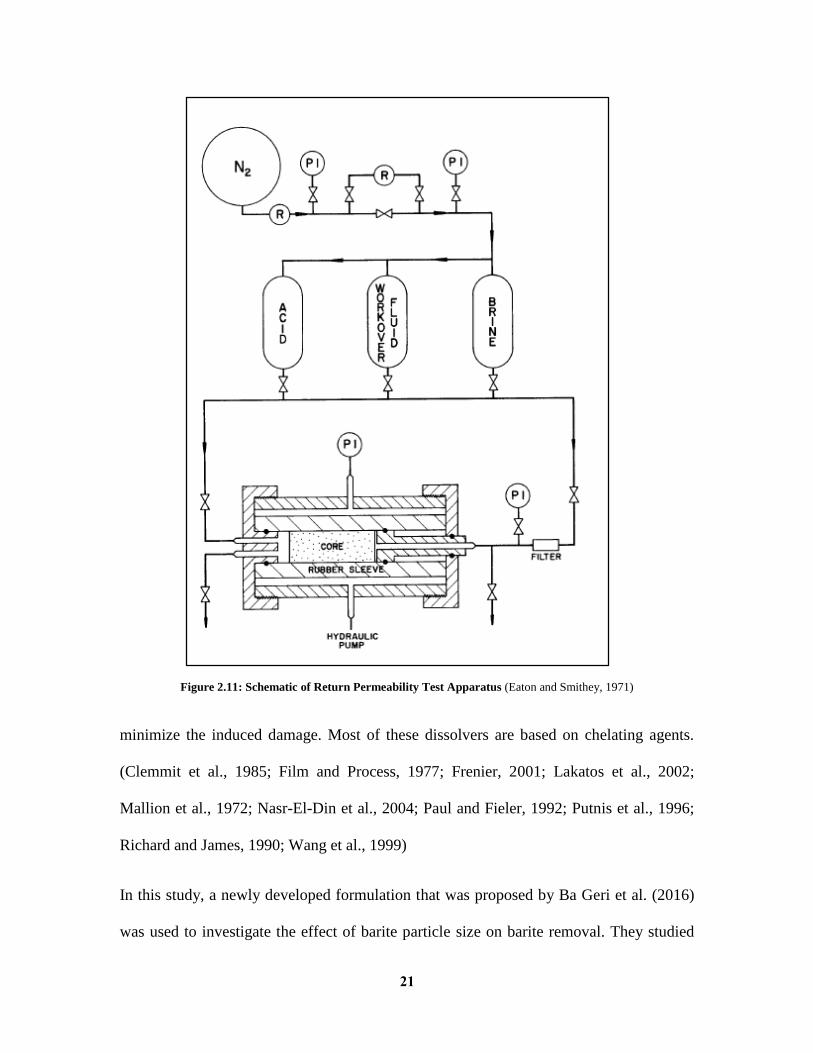
In 1971, Eaton and Smithey modified the conventional core flooding apparatus to
quantify the return permeability and the permeability reduction that resulted from
different completion and workover fluids. To simulate the actual fluid invasion, a new
line was added to inject the tested fluid in the reverse direction of the core. Flow rate was
recorded to measure the permeability before and after injection of the tested fluid. (Eaton
and Smithey, 1971) Figure 2.11 shows a schematic illustration of return permeability test
apparatus.
The return permeability is then calculated using equation (2.1):
% Return K = K at any point of return flow
K originalx100 … … … … (2.1)
2.5 Barite Removal
Barite is one of the most common used weighting materials for conventional drilling
fluids. It has been used since 1920s due to its high density, 4.5 g/cm3, which makes it a
good candidate to control high pressure high temperature wells. Moreover, it is easy to
handle and relatively inexpensive. Since, barite is used for well control, formation
damage is highly anticipated due to solids invasion. In fact, barite has a very low
solubility in water therefore, many barite dissolvers were introduced to eliminate and
21
Figure 2.11: Schematic of Return Permeability Test Apparatus (Eaton and Smithey, 1971)
minimize the induced damage. Most of these dissolvers are based on chelating agents.
(Clemmit et al., 1985; Film and Process, 1977; Frenier, 2001; Lakatos et al., 2002;
Mallion et al., 1972; Nasr-El-Din et al., 2004; Paul and Fieler, 1992; Putnis et al., 1996;
Richard and James, 1990; Wang et al., 1999)
In this study, a newly developed formulation that was proposed by Ba Geri et al. (2016)
was used to investigate the effect of barite particle size on barite removal. They studied

22
the performance of different chelating agents on barite removal after optimizing the
concentration of each chelation agents. Afterwards, many catalysts were tested with
different concentrations and the final formulation gave a solubility of around 41 g/L at
150 °C for 24 hours.
Table 2.3: Completion and Workover Fluids Selection Guide (Millhone, 1983)
2.6 Barite Ball Milling
Ball milling is a process that basically used to grind and blend materials where particle
size is reduced to the desired size. A ball mill works on the principal of impact and
attrition where balls are the grinding media that utilizes the energy of rotation and
vibration. In general, there are two techniques of grinding either wet or dry grinding and
both have their own applications. However, optimizing the operating parameters such as,
Fluid Density, ppg Stability (Static) Clay Reactions Solids Corrosion
Gas:
Air/natural gas 0 to 8.3 unlimited - - minor
Mist 0 to 8.4 none minor minor variable
Foam 0 to 8.5 limited minor - variable
Methanol 6.6 unlimited minor - variable
Oil:
Diesel 7.03 very long - - -
Crude(treated) 7 to 8 very long - - -
Emulsions 7 to 8.3 long minor - minor
Weighted oil 7 to 17 variable - Calcite, siderite -
Weighted emulsions 8.3 to 17 long minor Calcite, siderite minor
Water:
Fresh 8.3 unlimited none to extreme - variable
Seawater (treated) 8.5 very long none to extreme - minor
Brines:
KCl 8.3 to 9.8 very long none to major - minor
NaCl 8.3 to 10 very long none to major - minor
CaCl2 8.3 to 11.6 very long none to major - minor
CaBr2 8.3 to 15.2 very long none to major - moderate
ZnBr2 8.3 to 19.2 very long none to moderate - major
Weighted Water/Brine:
Salt 8.3 to 15 short to very long none to major NaCl minor
Carbonates 8.3 to 17 short to very long variable Calcite, siderite variable

23
milling time, balls-to-powder ratio, balls specifications, and rotational speed- RPM,
would determine the average particle size of the produced materials, therefore, an
experimental study should be conducted prior to production.
In fact, many studies on ball milling of different materials have been conducted and well
documented in the literature. (Deniz, 2012; Hamel et al., 2012; Khalil et al., 2010; Patel
et al., 2012; Teke et al., 2002; Umucu et al., 2014) Table 2.4 shows some of the studies
that have been conducted to produce barite Nano particle.

24
No.
Pap
erM
ater
ials
Equ
ipm
ent
Tim
e in
terv
al
Ran
ge o
f pa
ram
eter
s
barit
e (1
1.18
mic
rons
)di
sper
sant
con
cent
ratio
n
Dis
pers
ant:
sodi
um s
alt o
f pol
yacr
ylic
aci
d (2
0 w
t%)
grin
ding
tim
e
Che
tan
M. P
atel
, Z.V
.P. M
urth
y , M
ousu
mi C
hakr
abor
tydi
oini
zed
wat
er fo
r su
spen
sion
30
min
ph c
ontr
ol
Effe
cts
of o
pera
ting
para
met
ers
on th
e pr
oduc
tion
of b
ariu
m s
ulfa
te n
anop
artic
les
HN
O3
and
Nao
h fo
r ph
con
trol
w
et g
rindi
ng u
sing
stir
red
med
ia m
illpi
n le
ngth
in s
tirre
d m
edia
mill
ph=
6 st
ainl
ess
stee
l ves
sel (
0.73
6 m
L)
sam
ple:
2-3
mL
med
ia d
iam
eter
2012
cesi
um o
xide
-sta
biliz
ed z
ircon
ia g
rindi
ng b
eads
solid
mas
s fr
actio
n
stirr
er s
peed
120
0 R
PM
E. T
eke,
M. Y
ekel
er *
, U. U
luso
y, M
. Can
bazo
glu
barit
e an
d ca
lcite
ball
mill
ing
ball
size
: 46,
26,
12.
8 m
m
Kin
etic
s of
dry
grin
ding
of i
ndus
tria
l min
eral
s: c
alci
te a
nd b
arite
barit
e: -
800,
+30
0 m
icom
eter
s (v
ario
us fe
eds)
dry
grin
ding
ball
spec
ific
grav
ity:7
.81
g/cc
2002
pow
der-
ball
ratio
: 0.5
Cla
udin
e H
amel
, Thi
erry
Bro
usse
, Dan
iel B
´ela
nger
, and
Dan
iel G
uay
3 ba
lls
Effe
ct o
f Bal
l-M
illin
g on
the
Phy
sica
l and
Ele
ctro
chem
ical
PbO
2 an
d B
aSO
4ba
ll m
illin
g15
min
to 4
5 hr
sba
lls s
izes
: 2of
7/1
6", 1
of 1
/2"
Pro
pert
ies
of P
bO2
and
PbO
2/B
aSO
4 N
anoc
ompo
site
(5, 1
0 an
d 20
w%
BaS
O4)
SP
EX
800
0 m
illco
nsta
nt b
all-
to-p
owde
r ra
tio: 5
to 1
2012
stai
nles
s st
eel c
ruci
ble
and
balls
final
siz
e: 1
0 nm
Haz
em K
halil
et.
al1-
pla
neta
ry b
all m
ill P
ulve
riset
te 5
BaS
O4-
, CaF
2-, a
nd A
l-M
alea
te-D
eriv
ed N
anoc
ompo
site
Coa
tings
B
aSO
4 30
wt%
+ C
aF2
(nan
o co
mpo
site
)ba
lls o
f 0.5
–0.8
cm
with
Exc
elle
nt M
echa
nica
l, T
herm
al, a
nd O
ptic
al P
rope
rtie
s2-
hig
h-en
ergy
attr
ition
mill
2010
cera
mic
bea
ds (
ZrO
2) 0
.7–1
.2m
m
Ved
at D
eniz
barit
e (-
0.85
, +0.
106
mm
)ba
ll m
illin
g sp
eed:
76
rpm
The
effe
cts
of b
all f
illin
g an
d ba
ll di
amet
er o
n ki
netic
bre
akag
e pa
ram
eter
sdr
y m
illin
gba
ll si
ze: 1
5, 2
5.4,
40
mm
of b
arite
pow
der
cell:
628
0 cc
ball
spec
ific
grav
ity:7
.8 g
/cc
2012
ball
fillin
g vo
lum
e: 2
5, 3
5, 4
5
53 4
1, 2
hrs
30 m
in
spee
d: 4
00 r
pm
spee
d: 3
000
rpm
1 2
Table 2.4: Barite Ball Milling Case Studies

25
CHAPTER III
RESEARCH OBJECTIVES AND METHODOLOGY
3.1 Problem Statement
The complexity and the critical downhole conditions that will be encountered while
completing high pressure high temperature wells require a special formulation of
completion and workover fluids to ensure a safe and successful operation. The introduced
fluid should provide enough hydrostatic pressure to equalize the high formation pressure
and should be stable under that critical downhole conditions.
Moreover, since oil or gas formation, rig personnel, and environment are all exposed to
completion and workover fluids, these formulations should not have an impact on the
environment and well productivity which will consequently decrease the ultimate oil or
gas production and the feasibility of the completion and workover operations.
In fact, many fluids are used in the industry for completion and workover operations at
high pressure and high temperature conditions. However, some of the proposed fluids
have environmental or technical issues while others are costly.
Conventional drilling fluids have many good characteristics such as, they have high
density and they are easy to handle, environmentally friendly, and relatively inexpensive.
All these characteristics lead us to reconsider barite as a weighting material for
completion and workover fluids in HPHT wells after solving the associated problems,
formation damage and fluids stability.

26
3.2 Research Objectives
This work aims to:
1. Study the effect of the average particle size on barite removal using solubility test.
2. Study the effect of reducing barite particle size on fluids stability under HPHT
conditions.
3. Design a new formulation of completion fluids that could minimize the formation
damage that might result from solids invasion using micronized barite with
appropriate additives.
4. Evaluate micronized barite as a completion fluid weighting material to complete
HPHT wells.
3.3 Research Methodology and Experimental Work
3.3.1 Materials
A sample of commercial barite (obtained from a local supplier) with an average particle
size of 35 microns was used in this study. The particle size distribution and the elemental
composition of barite are shown on Figures: 3.1 & 3.2. DTPA chelating agent of initial
concentration of 40 wt% was used. DTPA was diluted with deionized water to obtain the
desired concentration of 20 wt%. Potassium carbonate was added to DTPA with a
concentration of 6 wt% as a catalyst to remove barite. Several barite samples with
different particle sizes were prepared using sieve analysis and ball milling machine.
NaOH and HCl were used to adjust the pH of deionized water for zeta potential
measurements. Some additives (obtained from local supplier) were used to formulate the

27
completion fluid and they are listed in Table 3.1. Ceramic disks of 2.5-inch diameter and
0.25-inch thickness were also used in filtration test.
Figure 3.1: Particle Size Distribution of Raw Barite Sample
Figure 3.2: Elemental Composition of Raw Barite Sample

28
Table 3.1: Completion Fluid Additives
Additive Specific Gravity Function
Soda ash 2.54 Maintain calcium level
Bentonite 4.3 Viscosifier
Xhanthan polymer 0.801 Viscosifier
Potassium chloride, KCl 1.98 Clay stabilizer
Potassium hydroxide, KOH 2.12 pH adjustment
Calcium carbonate, CaCO3 2.71 Bridging agent
Barite 4.5 Weighting material
Sodium sulfite 2.63 Oxygen scavenger
3.3.2 Barite Ball Milling
Ball milling was mainly used to reduce the average particle size of barite to investigate
the effect of particle size reduction on fluid stability as well as its impact on enhancing
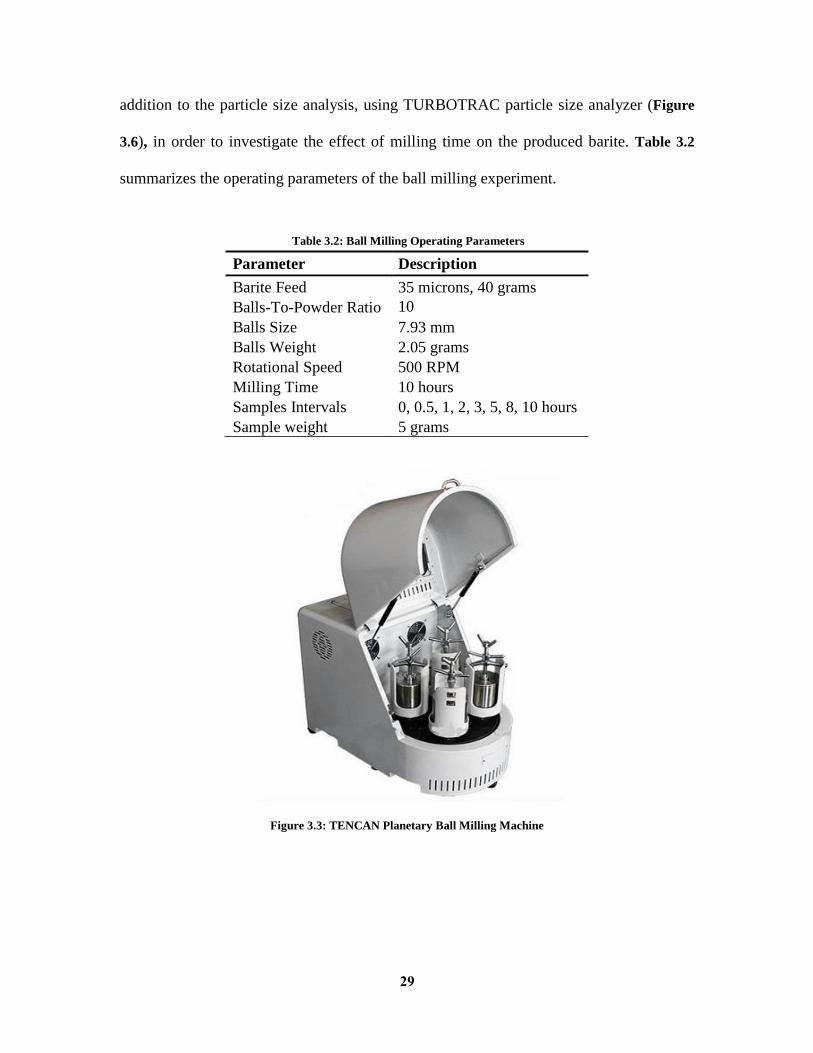
barite removal. TENCAN planetary ball milling machine (Figure 3.3) was used to reduce
barite particle size. From the previous studies, an initial guess to all the operating
parameters was used and kept fixed throughout the experiments and the milling time was
the only variable parameter to be optimized. These parameters are: feed weight, balls-to-
powder ratio, balls size, rotational speed, and milling time.
A 40-gram sample of barite that has a particle size less than 75 microns (with an average
particle size of 35 microns) was used as the feed to ball milling machine. Stainless steel
balls of 7.93 mm diameter were used as grinding media with balls-to-powder ratio of 10.
The machine was running at 500 RPM rotational speed. The experiment was run for 10
hours milling time. 5-gram samples were taken after 0.5, 1, 2, 3, 5, 8, and 10 hours while,
for consistency, the balls-to-powder ratio was kept constant at 10 during the whole
experiment. Afterwards, these samples were characterized using scanning electron
microscope, SEM (Figure 3.4) and X-Ray diffraction, XRD (Figure 3.5) techniques, in
29
addition to the particle size analysis, using TURBOTRAC particle size analyzer (Figure
3.6), in order to investigate the effect of milling time on the produced barite. Table 3.2
summarizes the operating parameters of the ball milling experiment.
Table 3.2: Ball Milling Operating Parameters
Parameter Description
Barite Feed 35 microns, 40 grams
Balls-To-Powder Ratio 10
Balls Size 7.93 mm
Balls Weight 2.05 grams
Rotational Speed 500 RPM
Milling Time 10 hours
Samples Intervals 0, 0.5, 1, 2, 3, 5, 8, 10 hours
Sample weight 5 grams
Figure 3.3: TENCAN Planetary Ball Milling Machine

30
Figure 3.4: SEM Machine
Figure 3.5: XRD Machine, D8 Advance

31
Figure 3.6: TURBOTRAC Particle Size Analyzer
3.3.3 Solubility Test
Solubility tests were conducted to measure the amount of barite solid particles that could
be removed, i.e. it gives an indication to the amount of permeability that could be
restored. A new formulation that has been introduced by Ba Geri et. al. (2016) was used
to investigate the effect of particle size on barite removal.
DTPA at high pH with a concentration of 40 wt% was diluted to 20 wt% using deionized
water. 6 wt.% of potassium carbonate was added to the solution as a catalyst. Different
samples of barite with different particle size were added to the solution, with a ratio of 1
gram to 20 ml, and put on a multiple heating magnetic stirrer at dynamic condition for 24
hours at a temperature of 300 °F (Figure 3.7). After 24 hours the samples were filtered
using filter papers to quantify barite solubility (Figure 3.8). Afterwards, the filtered
solids were left in the oven for 2-3 hours to make sure that they were completely dry. The
weight of filter papers was measured before and after the test using weight balance

32
(Figure 3.9). Then, the solubility was calculated using equation (3.1) & (3.2). Table 3.3
summarizes solubility test experiments.
Solubility, % =WSolids − (Wafter − Wbefore)
WSolidsx100 … … … … … … (3.1)
Solubility, g/L =WSolids − (Wafter − Wbefore)
VSolutionx1000 … … … … … … (3.2)
Where;
Wsolids= Weight of barite solid particles, g
Wafter= Weight of the filter paper after the test, g
Wbefore= Weight of the filter paper before the test, g
Vsolution= Volume of the solution, mL
Table 3.3: Solubility Test Summary
Parameter Description
Barite 1 gram
DTPA 20 wt.%
Potassium Carbonate 6 wt.%
Total Solution 20 mL
pH 13.5
Temperature 300 °F
Condition Dynamic
Solubility Time 24 hours
Drying Time 2-3 hours

33
Figure 3.7: Solubility Test Setup
Figure 3.8: Filtration Setup

34
Figure 3.9: Weight Balance
3.3.4 Zeta Potential Measurements
Zeta potential is the physical property of solid particles in suspension and it is a measure
of charge, repulsion or attraction, between colloids. Zeta potential was measured over a
wide range of pH to investigate the effect of barite particle size on fluid stability, a fluid
that has a zeta potential value in the range from 0 to ±30 is considered unstable (Table
3.4).
Several samples of water were prepared with different pH, alkaline, neutral and acidic.
Caustic soda and HCl were used as pH control agents. Different barite samples with
different particle sizes were added to water samples with a concentration of 0.5 wt.%.
Then these samples were placed in a multi-wrist shaker at room temperature for 20 to 24
hours to ensure that the charges equilibrium took place (Figure 3.11).
Afterwards, a sample from each solution was taken using a syringe with 5 µm filter. Zeta
potential was measured using ZetaPALS zeta potential analyzer (Figure 3.12). An

35
average value of zeta potential was calculated from 5 readings and 20 runs for each
reading.
Table 3.4: Zeta Potential and Colloids Stability
Zeta Potential [mV] Stability Behavior of the Colloid
0 to ±5 Rapid coagulation or flocculation
±10 to ±30 Incipient instability
±30 to ±40 Moderate stability
±40 to ±60 Good stability
More than ±61 Excellent stability
Figure 3.10: JENWAY pH Meter
Figure 3.11: LAB-LINE Multi-Wrist Shaker

36
Figure 3.12: ZetaPALS Zeta Potential Analyzer
3.3.5 Fluid Preparation and Rheology Measurements
A high density completion fluid, 15.3 ppg, was prepared. Water was added with a ratio of
0.7 bbl, (245 g in lab units), and poured in the drilling fluid mixer (Figure 3.13).
Defoamer and soda ash were added to prevent the formation of foam and to maintain the
level of calcium in water, respectively. Then, other additives were added and mixed for
some time, starting by viscosity control agent, Xanthan polymer and bentonite, starting
by a low rotational speed and then the rotational speed was increased gradually as
viscosity built up. Different sizes of barite were added as weighting material. Table 3.5
lists all the additives, their ratios and functions, and the mixing time.
After fluid preparation, fluid density was measured using mud balance (Figure 3.14), and
all the rheological properties were measured at 120 °F using Fan35A viscometer (Figure
3.15). Rheology measurements were also conducted at HPHT conditions using GRACE
m5600 rheometer (Figure 3.16) to investigate fluid stability at that critical conditions. All
fluid properties are listed in Table 3.6.

37
Table 3.5: Completion Fluid Formulation
Name Description Field Units/
Lab Units
Mixing Time,
min Function
Water 0.7 bbl/g - Base
Defoamer
- Anti-Foam Agent
Soda ash 0.5 lb/g 10 Maintain Calcium Level
KOH 0.5 lb/g 10 pH Adjustment
Bentonite 4 lb/g 10 Viscosifier
XC-polymer 1-1.5 lb/g 20 Viscosifier
KCl 20 lb/g 10 Clay Stabilizer
CaCO3 5 lb/g 10 Bridging Agent
Barite 350 lb/g 10 Weighting Material
Sodium sulfite 0.25 lb/g 10 Oxygen Scavenger
Table 3.6: Completion Fluid Properties
Property Unit Range
Density pcf 115
Plastic Viscosity cP 20-30
Yield Point Lb/100 ft2 20-25
Gel Strength, 10 sec Lb/100 ft2 10
Gel Strength, 10 min Lb/100 ft2 15
Gel Strength, 30 min Lb/100 ft2 20
pH - 9.5-10
Figure 3.13: Drilling Fluid Mixer

38
Figure 3.14: Mud Balance
Figure 3.15: Fan 35A Viscometer
Figure 3.16: GRACE m5600 Rheometer

39
3.3.6 Sag Test
Sag test was conducted to measure barite sag tendency to ensure that completion fluids
are stable under HPHT conditions. First, completion fluid was agitated using drilling
fluid mixer. A Teflon vessel was used to contain the fluid and an aging cell was used to
keep the fluid pressurized (Figure 3.17). A pressure of 500 psi was applied using
nitrogen to prevent fluid from evaporation and the aging cell was put vertically in the
oven for 24 hours at different temperatures. The test was conducted at static conditions.
After 24 hours, the cell was left to cool down and the pressure was released. Afterwards,
two fluid samples were taken from the top and the bottom of the vessel. The densities of
the two samples were measured and the sag factor was calculated using equation (3.3).
The fluid that has a sag factor between 0.5 and 0.53 would have a good sag performance
while a sag factor greater than 0.53 would result in a bad sag performance and solid
particles settlement is very likely to occur.
Sag Factor =ρ𝐵𝑜𝑡𝑡𝑜𝑚
ρ𝐵𝑜𝑡𝑡𝑜𝑚 + ρ𝑇𝑜𝑝… … … … … … … … … … (3.3)
Where;
ρBottom = Bottom density, PCF
ρTop = Top density, PCF

40
Figure 3.17: Static Sag Test Setup
3.3.7 HPHT Filtration Test
Filtration test was conducted to evaluate the new formulation of completion fluid by
measuring fluid loss into the formation. A ceramic disc, of 2.5” diameter and 0.5”
thickness, was immersed in fresh water and left for some time to be completely saturated.
The ceramic disc was weighted before and after saturation and then placed into the
filtration cell then, 350 ml of completion fluid was poured inside the cell. The cell was
closed and a pressure of 300 psi was applied using nitrogen cell and the filtration cell was
heated gradually up to 250 °F. The test was conducted at static condition.
Afterwards, the valve was opened and the filtrate volume was recorded with time. The
experiment was run for 30 minutes then, the valve was closed, the cell was cooled down
and the pressure was released. Furthermore, the disc was taken out and the filter cake was
characterized by measuring the weight and the thickness. Another part of the experiment
was to quantify filter cake removal efficiency. This part was conducted in one step at the
same conditions of pressure and temperature using a high pH solution of DTPA (20

41
wt.%) with potassium carbonate (6 wt.%) and enzyme (7 wt.%) to break the polymer for
24 hours. Eventually, the disc was weighted after the removal. Filter cake removal
efficiency was calculated using equations: (3.4) & (3.5).
Removal Efficiency, % =W𝐹𝑖𝑙𝑡𝑒𝑟 𝑐𝑎𝑘𝑒 − (Wd3 − Wd1)
WFilter cakex100 … … … … … … (3.4)
WFilter cake = (Wd2 − Wd1) … … … … … … … … … … … … … … . … … … … … … (3.5)
Where;
WFilter cake= Weight of the filter cake, g
Wd1= Weight of the saturated ceramic disc, g
Wd2= Weight of the ceramic disc after filtration, g
Wd3= Weight of the ceramic disc after removal, g
Figure 3.18: HPHT Filter press, 500 ml, OFITE

42
CHAPTER IV
RESULTS AND DISCUSSION
4.1 Barite Ball Milling
Ball milling was mainly used to reduce the average particle size of barite to investigate
the effect of particle size reduction on fluid stability as well as to see its impact on
enhancing barite removal. TENCAN planetary ball milling machine was used to reduce
barite particle size. A preliminary study was conducted to optimize the milling time and
to study the effect of ball milling on barite. From the previous studies in the literature, an
initial guess to all the operating parameters was opted and kept fixed and the milling time
was the only variable parameter to be optimized. These parameters are: feed weight,
balls-to-powder ratio, balls size, rotational speed, and milling time.
Two 40-gram samples of barite that have a particle size less than 75 microns (with an
average particle size of 35 microns) were loaded in 2 vials to keep the machine balanced.
Stainless steel balls of 7.93 mm diameter were used as grinding media with balls-to-
powder ratio of 10. The machine was running at 500 RPM rotational speed. The
experiment was run for 10 hours milling time. 5-gram samples were taken after 0.5, 1, 2,
3, 5, 8, and 10 hours while, for consistency, the balls-to-powder ratio was kept constant at
10 during the whole experiment.

43
Afterwards, these samples were characterized using X-Ray diffraction (XRD), scanning
electron microscope (SEM) techniques, in addition to the particle size analysis in order to
investigate the effect of milling time on the produced barite.
Figure 4.1 shows the XRD patterns for barite before and after ball milling for 0.5, 1, 2, 3,
5, 8, and 10 hours. This figure shows a series of diffraction peaks that correspond to
barite, their full width at half maximum, FWHM, increased as a result of ball milling. No
new diffraction peak was observed which indicates that no Fe contamination took place,
and the elemental composition from EDS Technique confirmed that.
Barite samples were also characterized using scanning electron microscopy, SEM, to
investigate the effect of ball milling on morphological properties. Figure 4.2 shows the
SEM micrographs of barite as received, ball milled barite after 0.5, 1, and 8 hours. A
variety in particle size and shape of barite as received sample was observed and after ball
milling a very fine powder was produced. As a result of ball milling, small particles
clustered and some agglomeration took place due to the fact that large particles breakage
depleted oxygen at the surface and consequently increased the surface energy of the small
particles that agglomerated to reduce their high energy(Hamel et al., 2012; Rochefort and
Guay, 2005) (Figure 4.3).
Particle size analysis was performed using Turbotrac particle size analyzer. Particle size
analysis results endorsed SEM observation and barite particle size was reduced to a few
microns after milling for half an hour and then particle size started to increase again due
to the small particles agglomeration. Table 4.1 shows particle size analysis results for
barite as received and ball milled after 0.5, 1, 3, and 5 hours.

44
Figure 4.1: XRD Patterns of Barite Before and After Ball Milling
45
Figure 4.2: SEM Micrographs of Barite Before and After Ball Milling
Figure 4.3: SEM Micrographs of Barite After Ball Milling for 1 and 8 Hours
Table 4.1: Barite Particle Size Before and After Ball Milling
Barite Sample Peaks
Size (µm) Volume % Width
As Received, 0 hr 34.86 100 51.69
0.5 hr 175.3 28.1 228.3
11.08 71.9 22.76
1 hr 18.85 100 95.81
3 hrs 63.08 61 124.6
8.09 39 11.92
5 hrs 32.4 100 113.5
4.2 The Effect of Barite Particle Size on Fluid Stability
Stability is one of the crucial concerns to look at before introducing any fluid into the
wellbore. As mentioned earlier, barite sag tendency is one of main drawbacks of using
conventional barite-weighted fluids as completion fluids. Therefore, reducing barite
particle size has been suggested as a solution to this phenomenon. The effect of barite
particle size reduction on completion fluid stability was investigated using zeta potential
and static sag test.

46
4.2.1 Zeta Potential Measurement
Zeta potential was measured over a wide range of pH to investigate the effect of barite
particle size on fluid stability. Several samples of water were prepared with different pH,
alkaline, neutral and acidic. Caustic soda and HCl were used as pH control agents.
Different barite samples with different particle size were added to water samples with a
concentration of 0.5 wt.%. Then these samples were placed in a multi-wrist shaker at
room temperature for 20 to 24 hours to ensure that the charges equilibrium took place.
Afterwards, a sample from each solution was taken using a syringe with 5 µm filter. Zeta
potential was measured using ZetaPALS zeta potential analyzer. An average value of zeta
potential was calculated from 5 measurements, 20 runs for each reading.
As a result, it was found that for all barite samples: raw barite, 106-75 µm, and 75-40
µm, there was almost no enhancement in fluids stability over the whole range of pH, they
were all lying with in the unstable range, ±30 mv, which indicates solids settlement.
While barite sample of less than 40 µm was found to be stable at pH greater than 12. In
contrast, micronized barite, around 1.5 µm, showed a moderate stability at pH values
greater than 8 which includes the optimum range of pH at which conventional drilling
fluids should be, i.e. 9-11. (Figure 4.4)
Although, zeta potential measurements were not conducted at the real field conditions, in
terms of fluid composition, solids percent, temperature and pressure, these results gave an
indication that reducing barite particle size to a few microns would improve fluid stability
and minimize the risk of barite sag.

47
Figure 4.4: The Effect of Barite Particle Size on Zeta Potential Measurement
4.2.2 Sag Test
Unlike zeta potential, Sag test, to some extent, is the simulation of the real case. It was
mainly performed to measure barite sag tendency to ensure completion fluids stability
under HPHT conditions. First, different completion fluids were prepared using different
barite particle size. Fluids were agitated using drilling fluid mixer. A Teflon vessel was
used to contain the fluid and an aging cell was used to keep the fluid pressurized. A
pressure of 500 psi was applied using nitrogen to prevent fluid from evaporation and the
aging cell was put vertically in the oven for 24 hours at different temperatures. The test
was conducted at static conditions. After 24 hours, the cell was taken out of the oven and
left to cool down and the pressure was then released. Afterwards, two fluid samples were
taken from the top and the bottom of the vessel. The densities of the two samples were
measured and the difference in densities could be a qualitative tool to indicate fluid
stability under that conditions.
-40
-30
-20
-10
0
10
20
30
40
0 2 4 6 8 10 12 14
Zet
a P
ote
nti
al,
mv
pH
Raw Barite
Barite (75-106 µm)
Barite (40-75 µm)
Barite (<40 µm)
Barite (1.5 µm)
Unstable Range
Stable Range
Stable Range
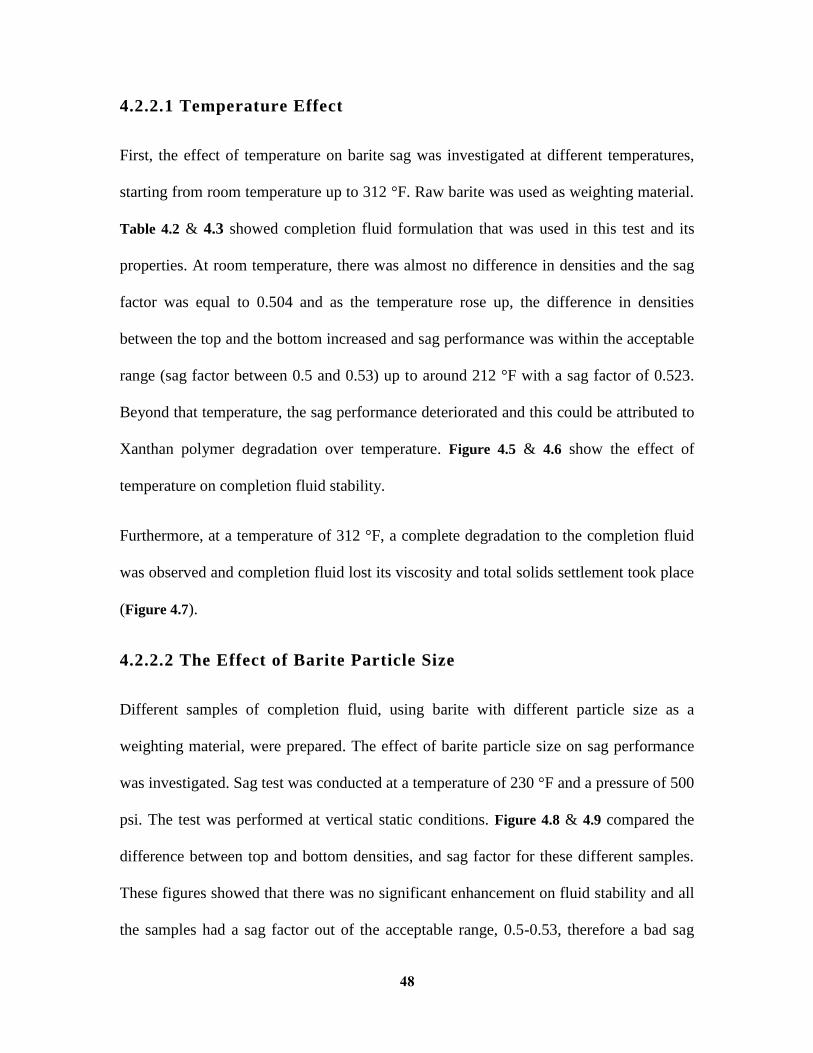
48
4.2.2.1 Temperature Effect
First, the effect of temperature on barite sag was investigated at different temperatures,
starting from room temperature up to 312 °F. Raw barite was used as weighting material.
Table 4.2 & 4.3 showed completion fluid formulation that was used in this test and its
properties. At room temperature, there was almost no difference in densities and the sag
factor was equal to 0.504 and as the temperature rose up, the difference in densities
between the top and the bottom increased and sag performance was within the acceptable
range (sag factor between 0.5 and 0.53) up to around 212 °F with a sag factor of 0.523.
Beyond that temperature, the sag performance deteriorated and this could be attributed to
Xanthan polymer degradation over temperature. Figure 4.5 & 4.6 show the effect of
temperature on completion fluid stability.
Furthermore, at a temperature of 312 °F, a complete degradation to the completion fluid
was observed and completion fluid lost its viscosity and total solids settlement took place
(Figure 4.7).
4.2.2.2 The Effect of Barite Particle Size
Different samples of completion fluid, using barite with different particle size as a
weighting material, were prepared. The effect of barite particle size on sag performance
was investigated. Sag test was conducted at a temperature of 230 °F and a pressure of 500
psi. The test was performed at vertical static conditions. Figure 4.8 & 4.9 compared the
difference between top and bottom densities, and sag factor for these different samples.
These figures showed that there was no significant enhancement on fluid stability and all
the samples had a sag factor out of the acceptable range, 0.5-0.53, therefore a bad sag

49
performance is highly anticipated at that conditions. Moreover, these results endorse the
results of zeta potential measurement that reducing barite particle size to a few microns
has impact on completion fluid stability however, this effect is not significant for a long
time under the downhole conditions of high pressure and high temperature therefore,
some dispersant for weighting material should be introduced to enhance completion fluid
stability.
Table 4.2: Completion Fluid Formulation
Name Description Field Units/
Lab Units
Mixing Time,
min Function
Water 0.7 bbl/g - Base
Defoamer
- Anti-Foam Agent
Soda ash 0.5 lb/g 10 Maintain Calcium Level
KOH 0.5 lb/g 10 pH Adjustment
Bentonite 4 lb/g 10 Viscosifier
XC-polymer 1-1.5 lb/g 20 Viscosifier
KCl 20 lb/g 10 Clay Stabilizer
CaCO3 5 lb/g 10 Bridging Agent
Barite 350 lb/g 10 Weighting Material
Sodium sulfite 0.25 lb/g 10 Oxygen Scavenger
Table 4.3: Completion Fluid Properties
Property Unit Value
Density Pcf 115
Plastic Viscosity cP 30
Yield Point Lb/100 ft2 35
Gel Strength, 10 sec Lb/100 ft2 20
Gel Strength, 10 min Lb/100 ft2 35
Gel Strength, 30 min Lb/100 ft2 45
pH - 10

50
Figure 4.5: Temperature Effect on Densities Difference for Raw Barite After 24 Hours
Figure 4.6: Temperature Effect on Sag Factor for Raw Barite After 24 Hours

51
Figure 4.7: A Sample of Completion Fluid After 24 Hours at 312 °F
Figure 4.8: The Effect of Barite Particle Size on Densities Difference at 230 °F After 24 Hours

52
Figure 4.9: The Effect of Barite Particle Size on Sag Factor at 230 °F After 24 Hours
4.3 The Effect of Barite Particle Size on Rheology
Several samples of completion fluids were prepared using barite of different particle size
as a weighting material. All samples have a density of 115 PCF. First, rheology was
measured at 120 °F using FAN 35A rheometer. When fan readings (shear stress) were
plotted against shear rate for all the samples, it was found that reducing barite particle
size slightly shifted the curve up which indicates a thickening behavior and that could be
attributed to the increase in surface area that consequently increase the friction between
barite particles (Figure 4.10). Figure 4.11 compares gel strength values after 10 seconds,
10 minutes, and 30 minutes for all fluid samples that were also measured at 120 °F. This
figure also confirms the thickening behavior. This phenomenon can also confirm the
results of zeta potential measurement and sag test that reducing barite particles size helps
in improving fluid stability.
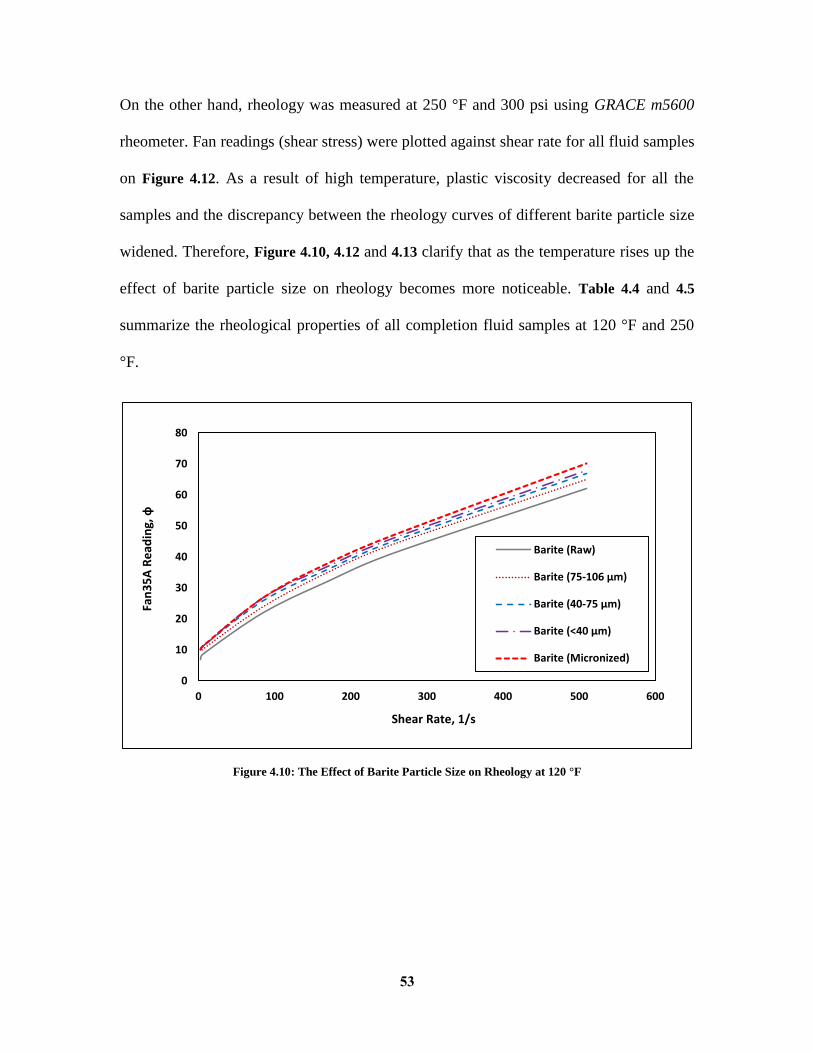
53
On the other hand, rheology was measured at 250 °F and 300 psi using GRACE m5600
rheometer. Fan readings (shear stress) were plotted against shear rate for all fluid samples
on Figure 4.12. As a result of high temperature, plastic viscosity decreased for all the
samples and the discrepancy between the rheology curves of different barite particle size
widened. Therefore, Figure 4.10, 4.12 and 4.13 clarify that as the temperature rises up the
effect of barite particle size on rheology becomes more noticeable. Table 4.4 and 4.5
summarize the rheological properties of all completion fluid samples at 120 °F and 250
°F.
Figure 4.10: The Effect of Barite Particle Size on Rheology at 120 °F
0
10
20
30
40
50
60
70
80
0 100 200 300 400 500 600
Fan
35
A R
ead
ing,
ф
Shear Rate, 1/s
Barite (Raw)
Barite (75-106 µm)
Barite (40-75 µm)
Barite (<40 µm)
Barite (Micronized)
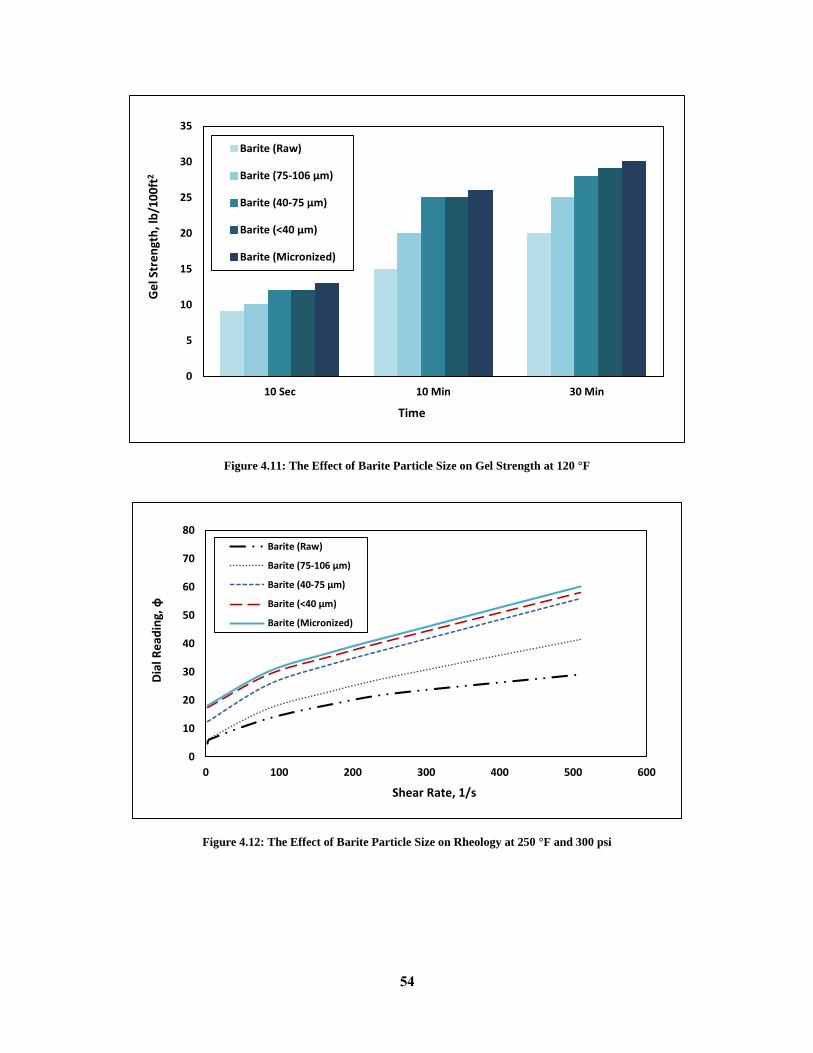
54
Figure 4.11: The Effect of Barite Particle Size on Gel Strength at 120 °F
Figure 4.12: The Effect of Barite Particle Size on Rheology at 250 °F and 300 psi
0
5
10
15
20
25
30
35
10 Sec 10 Min 30 Min
Ge
l Str
en
gth
, lb
/10
0ft
2
Time
Barite (Raw)
Barite (75-106 µm)
Barite (40-75 µm)
Barite (<40 µm)
Barite (Micronized)
0
10
20
30
40
50
60
70
80
0 100 200 300 400 500 600
Dia
l Re
adin
g, ф
Shear Rate, 1/s
Barite (Raw)
Barite (75-106 µm)
Barite (40-75 µm)
Barite (<40 µm)
Barite (Micronized)

55
Figure 4.13: The Effect of Barite Particle Size on Gel Strength at 250 °F
Table 4.4: Completion Fluid Rheology at 120 °F
Property Raw
Barite Barite
75-106 µm Barite
40-75 µm Barite
<40 µm Micronized
Barite
Density, PCF 115 115 115 115 115
Plastic Viscosity, cP 21 21 22 22 23
Yield Point, Lb/100 ft2 20 23 23 24 24
Gel Strength (10 sec), Lb/100 ft2 9 10 12 12 13
Gel Strength (10 min), Lb/100 ft2 15 20 25 25 26
Gel Strength (30 min), Lb/100 ft2 20 25 28 29 30
pH 10 10 10 10 10
Table 4.5: Completion Fluid Rheology at 250 °F
Property Raw
Barite
Barite Barite Barite Micronized
75-106 µm 40-75 µm <40 µm Barite
Density, PCF 115 115 115 115 116
Plastic Viscosity, cP 6.75 12.9 17.5 16.5 17
Yield Point, Lb/100 ft2 15.6 15.6 21 25 26
Gel Strength (10 sec), Lb/100 ft2 6.8 7 13 18 20
Gel Strength (10 min), Lb/100 ft2 9 12 24 27 29
Gel Strength (30 min), Lb/100 ft2 17 19 31 35 36
pH 10 10 10 10 10
0
5
10
15
20
25
30
35
40
10 Sec 10 Min 30 Min
Ge
l Str
en
gth
, lb
/10
0ft
2
Time
Barite (Raw)
Barite (Micronized)

56
4.4 The Effect of Particle Size on Barite Removal
4.4.1 Solubility Test
Solubility test was performed to investigate the effect of particle size on barite removal.
A new formulation that has been introduced by Ba Geri et. al. (2016) was used. This
formulation is mainly based on DTPA chelating agent at high pH in addition to potassium
carbonate as a catalyst. All the experiments were conducted with a ratio of 1 gram to 20
ml at a temperature of 312 °F at dynamic condition.
Figure 4.14 & 4.15 show the results of solubility test of barite with different particle size
in DTPA with potassium carbonate. These figures show a slight increase in barite
solubility as the particle size decreases and this is due to the fact that reducing barite
particle size increases the surface area therefore, enhances the chemical reaction. An
enhancement of around 11 g/L in solubility was observed between the ball milled sample
of barite to the largest sample that was obtained using sieve analysis, 75-106 µm.
Another sample of barite was tested to ensure the effectiveness of particle size reduction
on barite removal. The new sample has an average particle size of 1.5 microns that was
measured using Turbtrac particle size analyzer. Table 4.6 and 4.7 show the chemical
composition of both samples of barite that was determined using XRF technique. Figure
4.16 compared the solubility of the two samples in percentage and gram per liter. It shows
a small discrepancy in barite solubility, around 1 g/L, that could be attributed to the
difference in chemical composition of both samples of barite. Thus, it confirms the
effectiveness of reducing barite particle size.

57
Figure 4.14: The Effect of Particle Size on Barite Solubility (g/L) in DTPA with K2CO3
Figure 4.15: The Effect of Particle Size on Barite Solubility (%) in DTPA with K2CO3
35.65
41.95 42.244.42
46.4
0
10
20
30
40
50
60
75-106 Raw 40-75 <40 Micronized
Solu
bili
ty,
g/L
Particle size, µm
71.3
83.9 84.488.84
92.8
0
10
20
30
40
50
60
70
80
90
100
75-106 Raw 40-75 <40 Micronized
Solu
bili
ty,
wt%
Particle size, µm

58
Figure 4.16: Barite Solubility in DTPA with K2CO3 for Two Different Barite Samples
Table 4.6: Chemical Composition of Barite Samples (Oxides)
Element Sample 1 Sample 2
wt.% mol% wt.% mol%
SiO2 3.5793 7.0605 1.8825 3.7033
SO3 25.1894 37.2893 28.9102 42.6802
K2O 0.5714 0.7189 - -
CaO 0.1328 0.2806 0.0862 0.1816
Fe2O3 1.3336 0.9898 0.8381 0.6203
CuO 0.037 0.0551 0.0359 0.0534
SrO 0.4619 0.5283 0.7157 0.8164
MoO 0.0121 0.0128 0.0059 0.0062
BaO 68.6162 53.0401 67.0289 51.6711
Ta2O5 0.0411 0.011 - -
PbO 0.0254 0.0135 0.4291 0.2272
ZnO - - 0.0192 0.0278
Re2O7 - - 0.0177 0.0043
Au2O3 - - 0.0308 0.0082
46.4 45.25
92.8 90.5
0
10
20
30
40
50
60
70
80
90
100
Sample 1 Sample 2
Solu
bili
ty
Gram per liter, g/L
Percentage, %

59
Table 4.7: Chemical Composition of Barite Samples (Elements)
Element Sample 1 Sample 2
wt.% mol% wt.% mol%
Si 1.9916 6.3483 1.1527 3.6047
S 12.6341 35.275 15.2679 41.8223
K 0.6331 1.4498 - -
Ca 0.1109 0.2478 0.0789 0.1729
Fe 1.3338 2.1383 0.8188 1.2879
Ni 0.0157 0.024 - -
Cu 0.0354 0.0499 0.0392 0.0542
Sr 0.5518 0.5638 0.8483 0.8504
Mo 0.017 0.0159 - -
Ba 82.6171 53.8602 81.2085 51.9405
Ta 0.023 0.0114 - -
Pb 0.0366 0.0158 0.5652 0.2396
Zn - - 0.0205 0.0275
4.4.2 HPHT Filtration Test
Filtration test was conducted to evaluate the effect of reducing barite particle size on fluid
filtration performance and barite removal which consequently affect the resulted
formation damage. Two samples of completion fluid were prepared using barite of two
different sizes as weighting material, raw barite and micronized barite of around 5 µm.
Both samples have the same fluid formulation (Table 4.2). Different proportions of
calcium carbonate (medium and fine with a ratio of 3.5 to 1.5 grams, respectively) were
combined to mitigate solid particles invasion with micronized barite. Filtration test was
performed at static conditions at 250 °F and 300 psi.
Figure 4.17 shows the filtration performance of both fluid samples of micronized barite. The old
formulation of completion fluid using calcium carbonate with medium particle size as a bridging
agent, while the new formulation was designed by combining two proportions of calcium
carbonate (medium and fine with a ratio of 3.5 to 1.5 grams, respectively). This figure

60
shows that reducing barite particle size increases the amount of fluid filtrate into the
formation and therefore increases the possibility of formation damage due to the poor
bridging that resulted from reducing the particle size. Moreover, the old formulation
failed to build a proper filter cake, thin and impermeable, while combining different
proportions of calcium carbonate which works as bridging agent helped in minimizing
the fluid filtrate to its minimum and the difference in filtrate volume between raw and
micronized barite was reduced to only around 1 cc and good filter cake was built (Figure
4.18).
In removal part, DTPA (20 wt.%) of high pH was used to remove filter cake. 6 wt.% of
potassium carbonate was added to DTPA as a catalyst and 7 wt.% of enzyme was added
to break the polymer. Removal part was performed at the same condition of temperature
and pressure and it was run for 24 hours. As a result of removal test, reducing barite
particle size to a few microns enhanced the removal efficiency by 5%, from 84.3% for
raw barite to 89.23% for micronized barite which confirmed the results of solubility test.
Nevertheless, there is a difference in barite removal percentage between solubility test
and HPHT filtration test and this discrepancy is due to the presence of other additives in
completion fluid and the difference in experimental conditions for each test. Table 4.8
summarizes the results of HPHT filtration test and Figure 4.19 shows the resulted filter
cake before and after removal.

61
Figure 4.17: The Effect of Adding Different Proportions of Bridging Agent on Filtration Performance of
Micronized Barite
Figure 4.18: Filtration Performance of Raw and Micronized Barite Samples
0
10
20
30
40
50
60
0 5 10 15 20 25 30 35
Fil
tra
te V
olu
me,
cc
Time, minutes
Old Formulation New Formulation
0
1
2
3
4
5
6
7
8
0 5 10 15 20 25 30 35
Fil
tra
te V
olu
me,
cc
Time, min
Micronized Barite (New Formulation) Raw Barite

62
Table 4.8: HPHT Filtration Test Summary
Parameter Raw Barite Micronized Barite
Filtrate, cm3/30min 6.7 7.6
Filter-cake Weight, g 20.33 21.35
Removed filter cake, g 17.14 19.05
Removal Efficiency, wt.% 84.3 89.23
Figure 4.19: Filter-cake Before (a) and After Removal (b)

63
CHAPTER V
CONCLUSION AND RECOMMENDATIONS
5.1 Conclusion
In this study, different samples of barite with different particle size ranges were used to
investigate the effect of barite particle size on completion fluids performance at high
pressure high temperature conditions (HPHT). These samples were obtained using sieve
analysis and ball milling.
Ball milling experiments showed small particles agglomeration after milling for a long
time and that was confirmed by SEM micrographs and particle size analysis. Milling time
of half an hour was used to produce the micronized barite sample. And another sample of
micronized barite with an average particle size of 1.5 micron was used also to evaluate
micronized barite as a completion fluid weighting material.
These barite samples were added to deionized water with a wide range of pH with a
concentration of 5 wt.%. HCL and NaOH were used as pH control agents. Suspensions
were left for 20-24 hours before measuring zeta potential. Zeta potential measurements
showed that reducing barite particle size to a few microns improved the fluid stability and
moderate stability was observed for pH range greater than 8 which includes the normal
range of completion and drilling fluids. In contrast, all the other sizes of barite were lying
in the unstable range (±30 mv) and no enhancement in fluid stability was observed.

64
Completion fluids were prepared with a density of 115 pcf and rheological properties
were measured at 120 and 250 °F. Rheology measurements showed a thickening behavior
as barite particle size decreased and this behavior was more noticeable at high
temperatures.
Completion fluid formulation showed a good sag performance up to around 215 °F and
as the temperature rises up sag performance deteriorates until 270 °F. Beyond that
temperature a complete degradation to Xanthan polymer occurred and total solids
settlement occurred. Sag test results also showed insignificant improvement in sag
performance as the particle size was reduced.
Diethylene tri-amine penta-acetic acid (DTPA) with potassium carbonate was used to
remove barite with a concentration of 20 wt.% and 6 wt.%, respectively. Barite was
added to this formulation with a ratio of 1 gram to 20 ml. Solubility test results showed a
good enhancement in barite removal as the particle size was reduced with a difference of
around 11 g/L (20 wt.%) between the largest and the micronized size of barite.
HPHT Filtration test confirmed that combining different sizes of bridging agent (calcium
carbonate) plays a great role in minimizing the volume of fluid filtrate into the formation
and there for mitigate the risk of formation damage. It also confirmed the solubility test
results and an enhancement of 5% in removal efficiency was recorded as barite particle
size was reduced to few microns.
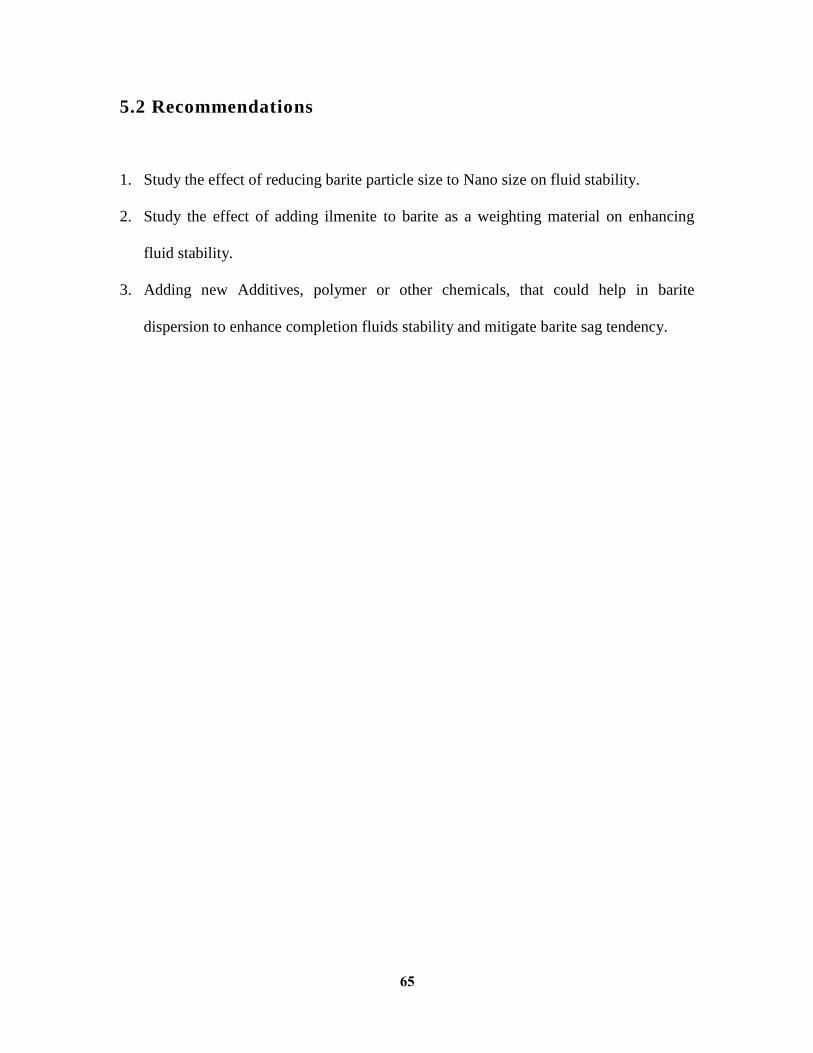
65
5.2 Recommendations
1. Study the effect of reducing barite particle size to Nano size on fluid stability.
2. Study the effect of adding ilmenite to barite as a weighting material on enhancing
fluid stability.
3. Adding new Additives, polymer or other chemicals, that could help in barite
dispersion to enhance completion fluids stability and mitigate barite sag tendency.

66
REFERENCES
A. M. Ezzat, 1990. Completion Fluids Design Criteria and Current Technology
Weaknesses. Paper SPE 19434 presented at the SPE Formation Damage Control
Symposium. Lafayette. February 22-23.
Alabdullatif, Z., Al-yami, A., Wagle, V., Bubshait, A., Al-safran, A., Aramco, S., 2015.
Development of New Kill Fluids with Minimum Sagging Problems for High
Pressure Jilh Formation in Saudi Arabia. Saudi Aramco J. Technol. Spring 2015.
Allen, F.L., Riley, S.M., Strassner, J.E., 1984. Initial Study of Temperature and Pressure
Effects on Formation Damage by Completion Fluids. Paper SPE 12488 presented at
the SPE Formation Damage Control Symposium. Bakersfield. February 13-14.
Berg, P.C., Pedersen, E.S., Lauritsen, A., Behjat, N., Hagerup-Jenssen, S., Howard, S.,
Olsvik, G., Downs, J.D., Turner, J., Harris, M., 2009. Drilling and Completing High-
Angle Wells in High-Density, Cesium Formate Brine-The Kvitebjorn Experience,
2004-2006. Spe Drill. Complet. 24, 15–24.
Black, A., Curry, D., Lang, B.J., 1996. Cesium Formate: Results and Analysis of Drilling
with a New High Density Unweighed Brine. Paper SPE 36425 presented at the SPE
Annual Technical Conference and Exhibition. Denver. October 6-9.
Caenn, R., Darley, H.C.H., Gray, G.R., 2011. Composition and Properties of Drilling and
Completion Fluids, six. ed, Composition and Properties of Drilling and Completion
Fluids. Elsevier.
Carnegie, A.W., Fluids, C.S., Omar, M., Carigali, P., Bhd, S., Colman, G., Specialty, C.,
Supriyono, H., Kmc, S., Bhd, S., 2013. Experience with Formate Fluids for
Managed Pressure Drilling and Completion of Subsea Carbonate Gas Development
Wells. Paper SPE 165761 presented at the SPE Asia Pacific Oil & Gas Conference
and Exhibition. Jakarta. October 22-24.
Clemmit, a F., Ballance, D.C., Hunton, a G., 1985. The dissolution of scales in oilfield
systems. Paper SPE 14010 presented at the Offshore Europe. Aberdeen. September
10-13.
Conners, J.H., Bruton, J.R., 1979. Use of Clear Brine Completion Fluids as Drill-in
Fluids. Paper SPE 8223 presented at the 54th Annual Fall Technical Conference and
Exhibition of the Society of Petroleum Engineers of AIME. Las Vegas. September
23-26.
Darlington, R.K., House, R.F., Hunter, D. V., 1982. Viscous Heavy Brine Completion
Fluids. Paper SPE 10671 presented at the SPE Formation Damage Control
Symposium. Lafayette. March 24-25.
Deniz, V., 2012. The effects of ball filling and ball diameter on kinetic breakage

67
parameters of barite powder. Adv. Powder Technol. 23, 640–646.
Downs, J., Fluids, C.S., 2011. Life Without Barite : Ten Years of Drilling Deep HPHT
Gas Wells With Cesium Formate Brine. Paper SPE/IADC 145562 presented at the
SPE/IADC Middle East Drilling Technology Conference and Exhibition. Muscat.
October 24-26.
Downs, J.D., Blaszczynski, M., Turner, J., Harris, M., Fluids, C.S., 2006. Drilling and
Completing Difficult HP / HT Wells W ith the Aid of Cesium Formate Brines — A
Performance Review. Paper IADC/SPE 99068 presented at the IADC/SPE Drilling
Conference. Miami. February 23-24.
Downs, J.D., Killie, S., Whale, G.F., Inglesfield, C., 1994. Development of
Environmentally Benign Formate-Based Drilling and Completion Fluids. Paper SPE
27143 presented at the 2nd International Conference on Health, Safety &
Environment in Oil & Gas Exploration & Production. Jakarta. January 25-27.
Eaton, B.A., Smithey, M., 1971. Formation Damage from Workover and Completion
Fluids. Paper SPE 3707 presented at the 42nd Annual California Regional Meeting
of the Society of Petroleum Engineers of AIME. Les Angeles. November 4-5.
Film, R., Process, I., 1977. Ecnomically Dissolving Barium Sulfate Scale with a
Chelating Agent. Patent US4030548.
Frenier, W.W., 2001. Novel Scale Removers are Developed for Dissolving Alkaline
Earth Deposits. Paper SPE 65027 presented at the SPE International Symposium on
Oilfield Chemistry. Houston. February 13-16.
Galford, J., Truax, J., Moake, G.L., Services, H.E., 2005. Borehole and Formation
Invasion Effects of Formate-Based Mud Systems on Nuclear Logs. Paper presented
at the SPWLA 46th Annual Logging Symposium. New Orleans. June 26-29.
Hamel, C., Brousse, T., Belanger, D., Guay, D., 2012. Effect of Ball-Milling on the
Physical and Electrochemical Properties of PbO2 and PbO2∕BaSO4 Nanocomposite.
J. Electrochem. Soc. 159.
Hanson, P.M., Co, M.D.F., Jr, T.K.T., 1990. Investigation of Barite “Sag” in Weighted
Drilling Fluids in Highly Deviated Wells. Paper SPE 20423 presented at the 65th
Annual Technical Conference and Exhibition. New Orleans. September 23-26.
Javora, P.H., Ke, M., Stevens, R.F., Berry, S.L., 2003. The Chemistry of Formate Brines
at Downhole Conditions. Paper SPE 80211 presented at the SPE International
Symposium on Oilfield Chemistry. Houston. February 5-7.
Khalil, H., Gläsel, H.J., Köhler, K., Hardinghaus, F., Buchmeiser, M.R., 2010. BaSO4-,
CaF2-, and Al-maleate-derived nanocomposite coatings with excellent mechanical,
thermal, and optical properties. Macromol. Mater. Eng. 295, 276–282.
Krueger, R., Vogel, L., 1954. Damage to sandstone cores by particles from drilling fluids.
Drill. Prod. Pract. 158–171.

68
Lakatos, I., Lakatos-Szabo, J., Kosztin, B., 2002. Comparative study of different barite
dissolvers: technical and economic aspects. Paper SPE 73719 presented at the SPE
International Symposium and Exhibition on Formation Damage Control. Lafayette.
February 20-21.
Mallion, K.B., Turner, R.W., Todd, A.H., 1972. Aqueous Reactive Scale Solvent. Patent
US3660287.
Millhone, R., 1983. Completion Fluids for Maximizing Productivity--State of the Art. J.
Pet. Technol. 35, 47–55.
Moake, G.L., 2012. Formate Mud Effects on Density Logs. Paper presented at the
SPWLA 53rd Annual Logging Symposium. Cartagena. June 16-20.
Morgenthaler, L.N., 1986. Formation Damage Tests of High-Density Brine Completion
Fluids. Paper SPE 13811 presented at the SPE Production Engineering. Oklahoma
City. March 10-12.
Nasr-El-Din, H.A., Al-Mutairi, S.H., Al-Hajji, H.H., Lynn, J.D., 2004. Evaluation of a
New Barite Dissolver: Lab Studies. Paper SPE 86501 presented at the SPE
International Symposium and Exhibition on Formation Damage Control. Lafayette.
February 18-20.
Patel, C.M., Murthy, Z.V.P., Chakraborty, M., 2012. Effects of operating parameters on
the production of barium sulfate nanoparticles in stirred media mill. J. Ind. Eng.
Chem. 18, 1450–1457.
Patton, J.T., Phelan, P.F., 1985. Well Damage Hazards Associated With Conventional
Completion Fluids. Paper SPE 13800 presented at the SPE Production Operations
Symposium. Oklahoma City. March 10-12.
Paul, J.M., Fieler, E.R., 1992. A New Solvent for Oilfield Scales. Paper SPE 24847
presented at the 67th Annual Technical Conference and Exhibition of the Society of
Petroleum Engineers. Washington. October 4-7.
Paul, J.R., Plonka, J.H., 1973. Solids Free Completion Fluids Maintain Formation
Permeability. Paper SPE 4655 presented at the 48th Annual Fall Meeting of the
Society of Petroleum Engineers of AIME. Las Vegas. October 30.
Paul, J.R., Plonka, J.H., Engineers, P., 1974. New High-Density Completion Fluids Meet
Needs of High-Pressure Offshore WeIIs. Paper OCT 2130 presented at the Offshore
Technology Conference. Dallas. May 6-8.
Putnis, A., Putnis, C. V, Paul, J.M., 1996. The Efficiency of a DTPA-Based Solvent in
the Dissolutionof Barium Sulfate Scale Deposits. Paper SPE 29094 presented at the
SPE International Symposium on Oilfield Chemistry. San Antonio. February 14-17.
Reed, M.G., 1989. Formation Damage Prevention During Drilling and Completion. Paper
SPE 20149 presented at the SPE Centennial Symposium at New Mexico Tech. New
Mexico Tech. October 15-19.

69
Richard, L.M., James, M.P., 1990. Method for Removing Alkaline Sulfate Scale. Patent
US4980077.
Rochefort, D., Guay, D., 2005. Modification to the composition of nanocrystalline RuO2
through reactive milling under O2. J. Alloys Compd. 400, 257–264.
Saasen, A., Jordal, O.H., Asa, S., Burkhead, D., Berg, P.C., Løklingholm, G., Pedersen,
E.S., Asa, S., Turner, J., Harris, M.J., Fluids, C.S., 2002. Drilling HT / HP Wells
Using a Cesium Formate Based Drilling Fluid. Paper IADC/SPE 74541 presented at
the IADC/SPE Drilling Conference. Dallas. February 26-28.
Schlumberger, n.d. HPHT - Schlumberger Oilfield Glossary.
http://www.glossary.oilfield.slb.com/Terms/h/hpht.aspx
Scott, P.D., Company, M.O., Zamora, M., Aldea, C., 2004. Barite-Sag Management :
Challenges , Strategies , Opportunities. Paper IADC/SPE 87136 presented at the
IADC/SPE Drilling Conference. Dallas. March 2-4.
Smithson, T., 2016. THE DEFINING SERIES HPHT Wells.
Sollee, S.S., Elson, T.D., Lerma, M.K., 2013. Field Application of Clean Completion
Fluids. Paper SPE 14318 presented at the SPE Annual Technical Conference and
Exhibition. Las Vegas. September 22-25.
Spies, R.J., Himmatramka, A.K., Smith, J.R., Thomas, D.C., 1983. Field Experience
Utilizing High-Density Brines as Completion Fluids. J. Pet. Technol. 881–888.
Suri, A., Sharma, M., 2001. Strategies for Sizing Particles in Drilling and Completion
Fluids. Paper SPE 68964 presented at the SPE European Formation Damage
Conference. The Hague. May 21-22.
Teke, E., Yekeler, M., Ulusoy, U., Canbazoglu, M., 2002. Kinetics of dry grinding of
industrial minerals: Calcite and barite. Int. J. Miner. Process. 67, 29–42.
Thomas, D.C., Atkinson, G., Atkinson, B.L., 1984. Pressure and Temperature Effects on
Brine Completion Fluid Density. Paper SPE 12489 presented at the SPE Formation
Damage Control Symposium. Bakersfield. February 13-14.
Tuttle, R.N., Barkman, J.H., 1974. New Nondamaging and Acid-Degradable Drilling and
Completion Fluids. J. Pet. Technol. 26, 1221–1226.
Umucu, Y., Altinigne, M.Y., Deniz, V., 2014. The Effects of Ball Types on Breakage
Parameters of Barite. J. Polish Miner. Eng. Soc. 113–117.
Wang, K.S., Resch, R., Dunn, K., Shuler, P., Tang, Y., Koel, B.E., Yen, T.F., 1999.
Dissolution of the barite (001) surface by the chelating agent DTPA as studied with
non-contact atomic force microscopy. Colloids Surfaces A Physicochem. Eng. Asp.
160, 217–227.
(A. M. Ezzat, 1990; Allen et al., 1984; Sollee et al., 2013)
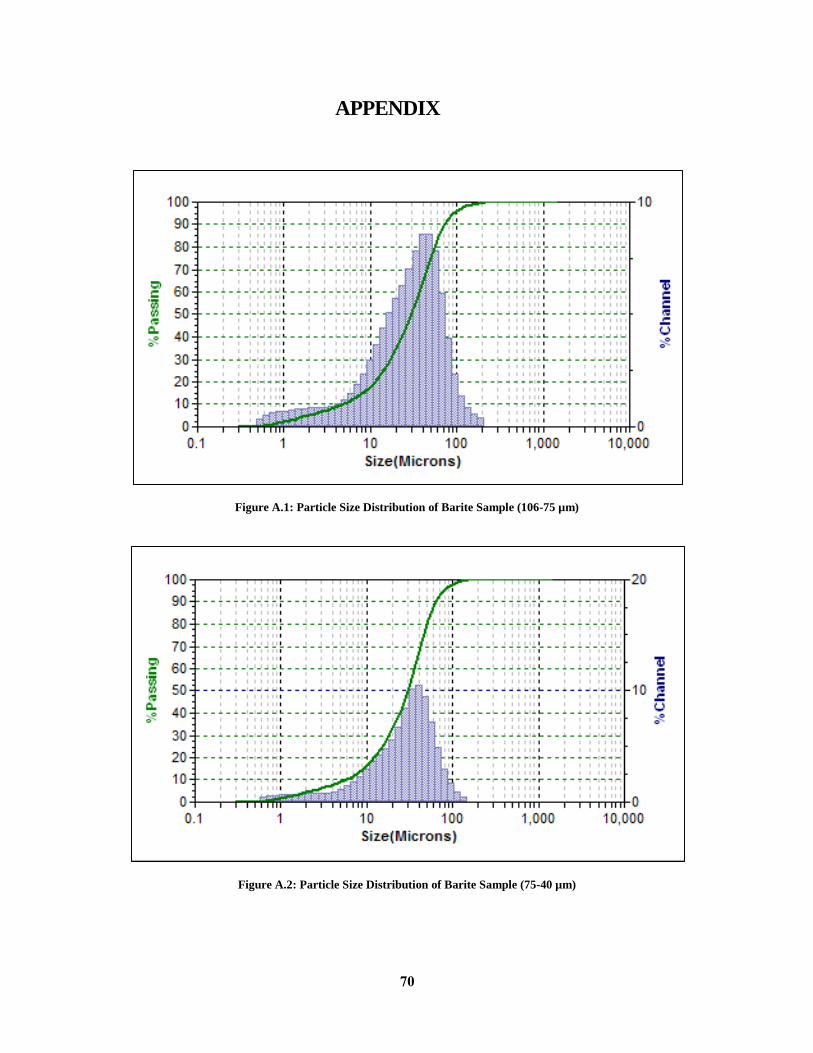
70
APPENDIX
Figure A.1: Particle Size Distribution of Barite Sample (106-75 µm)
Figure A.2: Particle Size Distribution of Barite Sample (75-40 µm)

71
Figure A.3: Particle Size Distribution of Barite Sample (Less than 40 µm)
Figure A.4: Particle Size Distribution of Micronized Barite Sample
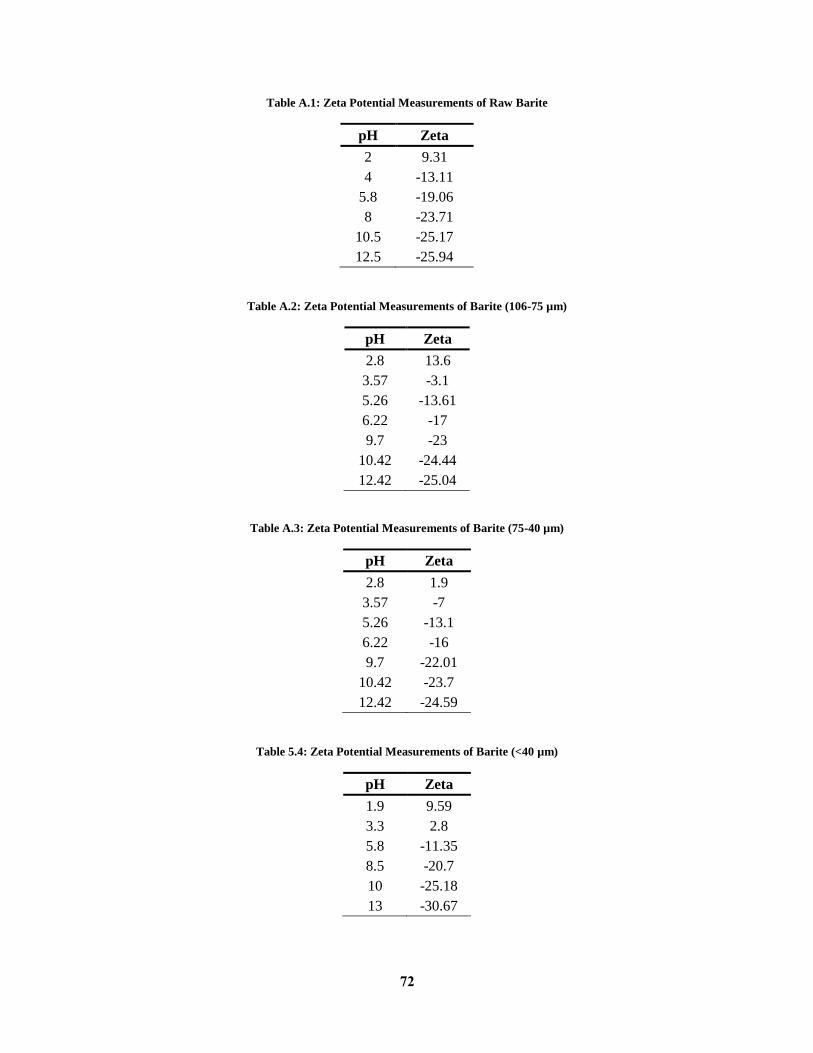
72
Table A.1: Zeta Potential Measurements of Raw Barite
pH Zeta
2 9.31
4 -13.11
5.8 -19.06
8 -23.71
10.5 -25.17
12.5 -25.94
Table A.2: Zeta Potential Measurements of Barite (106-75 µm)
pH Zeta
2.8 13.6
3.57 -3.1
5.26 -13.61
6.22 -17
9.7 -23
10.42 -24.44
12.42 -25.04
Table A.3: Zeta Potential Measurements of Barite (75-40 µm)
pH Zeta
2.8 1.9
3.57 -7
5.26 -13.1
6.22 -16
9.7 -22.01
10.42 -23.7
12.42 -24.59
Table 5.4: Zeta Potential Measurements of Barite (<40 µm)
pH Zeta
1.9 9.59
3.3 2.8
5.8 -11.35
8.5 -20.7
10 -25.18
13 -30.67

73
Table A.5: Zeta Potential Measurements of Micronized Barite (1.5 µm)
pH Zeta
1.9 17.03
3.3 0.11
5.8 -22.22
8.5 -31.86
10 -32.85
13 -33.28
Table A.6: Filtrate Volume with Time for Micronized Barite at 250 °F (Old Formulation)
Time, min Filtrate volume, cc
0.25 6
0.67 7
0.84 7.7
1 8
2 11.2
3 16
4 20
5 23.4
10 35.6
15 40
20 45.3
25 49.3
30 53.2

74
Table A.7: Filtrate Volume with Time for Micronized Barite at 250 °F (New Formulation)
Time, min Filtrate volume, cc
0.08 4
0.42 4.5
0.58 4.65
0.75 4.8
0.92 4.8
1 5
2 5.3
3 5.5
4 5.7
5 6
6 6.2
7 6.4
8 6.54
9 6.7
10 6.84
15 7.1
20 7.5
25 7.6
30 7.6

75
Table A.8: Filtrate Volume with Time for Raw Barite at 250 °F
Time, min Filtrate volume, cc
0.08 2
0.42 2.3
0.58 2.4
0.75 2.6
0.92 2.7
1 2.75
2 3.1
3 3.28
4 3.48
5 3.8
6 4
7 4.5
8 4.6
9 5
10 5.2
15 6
20 6.6
25 6.7
30 6.7

76
Vitae
Name: Abdelmjeed Kamal Abdelrahman Mohamed.
Nationality: Sudanese.
Date of Birth: 24/August/1992
Email: [email protected].
Address: Block 8-Al_Thawra-Omdurman-Sudan
Academic Background: B.Sc. in Petroleum Engineering, (2013)
Department of Petroleum and Natural Gas Engineering
Faculty of Engineering, University of Khartoum
Khartoum, Sudan.
Publications: A. K. Mohamed, S. A. Elkatatny, M. A. Mahmoud, R. A.
Shawabkeh, A. A. Al-Majed. 2017. The Evaluation of
Micronized Barite as a Weighting Material for Completing
HPHT Wells. Paper SPE-183768-MS Accepted for the
presentation at the SPE Middle East Oil & Gas Show and
Conference held in Manama, Kingdom of Bahrain, 6–9
March.