Complex reservoir sedimentation revealed by an unusual combination of sediment records, Kangaroo...
15
ORIGINAL PAPER Complex reservoir sedimentation revealed by an unusual combination of sediment records, Kangaroo Creek Reservoir, South Australia John Tibby Peter Gell Gary Hancock Malcolm Clark Received: 5 May 2009 / Accepted: 14 May 2009 / Published online: 23 June 2009 Ó Springer Science+Business Media B.V. 2009 Abstract Despite their direct links to human use, reservoirs are not widely utilised, relative to natural lakes, for deriving sediment histories. One explana- tion is the complex sedimentation patterns observed in water storages. Here a highly unusual combination of sedimentary records is used to determine the sedi- mentation history of Kangaroo Creek Reservoir, South Australia. We compare contiguous high reso- lution (0.5 cm sampling interval) diatom records from an almost 1.3 m core extracted from the bottom of the reservoir and from a 0.4 m monolith of sediment perched 15 m above the reservoir bottom on a disused bridge that was submerged following initial reservoir filling in 1970. The diatom histories are supplemented by evidence provided by other indicators, most notably radionuclide concentrations and ratios. Inter- estingly, despite the fact that the reservoir has been [ 20 m deep for more than 70% of its recorded history, distinct sections of the reservoir bottom core, but not the bridge monolith, are dominated by non- planktonic diatoms. We attribute the occurrences of these phases to inflows that occur following heavy catchment rains at times when the reservoir is drawn down. These characteristic sections have, in turn, been used to refine the site’s chronology. Despite having a length of almost 1.3 m, a variety of data suggests that the core has not recovered pre-reservoir sediment, but rather spans the period from 1981 (11 years after first filling) to 2001, when the core was extracted. It is clear, therefore, that sediments in the bottom of the reservoir are accumulating rapidly ( [ 7 cm year -1 ), although more than 40% of this deposition occurs in less than 5% of the time. It appears that in the period 1996–2001, quiescent sedimentation rates, both in the perched bridge locality and on the reservoir bottom, slowed in response to reduced stream flow. Our findings indicate that, with caution, complex patterns of sedimentation in water storages can be disentan- gled. However, it was difficult to precisely correlate diatom sequences from the two records even in periods of quiescent sedimentation, suggesting that reservoir bottom diatom sequences should be inter- preted with considerable caution. Furthermore, while storm-derived inflows such as those identified may Electronic supplementary material The online version of this article (doi:10.1007/s10933-009-9349-0) contains supplementary material, which is available to authorized users. J. Tibby (&) P. Gell Geographical and Environmental Studies, University of Adelaide, Adelaide, SA 5005, Australia e-mail: [email protected] P. Gell School of Science & Engineering, University of Ballarat, Ballarat, VIC 3353, Australia G. Hancock Rivers and Coasts, CSIRO Land and Water, Canberra, ACT 2601, Australia M. Clark School of Mathematical Sciences, Monash University, Clayton, VIC 3800, Australia 123 J Paleolimnol (2010) 43:535–549 DOI 10.1007/s10933-009-9349-0
Transcript of Complex reservoir sedimentation revealed by an unusual combination of sediment records, Kangaroo...

ORIGINAL PAPER
Complex reservoir sedimentation revealedby an unusual combination of sediment records,Kangaroo Creek Reservoir, South Australia
John Tibby Æ Peter Gell Æ Gary Hancock ÆMalcolm Clark
Received: 5 May 2009 / Accepted: 14 May 2009 / Published online: 23 June 2009
� Springer Science+Business Media B.V. 2009
Abstract Despite their direct links to human use,
reservoirs are not widely utilised, relative to natural
lakes, for deriving sediment histories. One explana-
tion is the complex sedimentation patterns observed in
water storages. Here a highly unusual combination of
sedimentary records is used to determine the sedi-
mentation history of Kangaroo Creek Reservoir,
South Australia. We compare contiguous high reso-
lution (0.5 cm sampling interval) diatom records from
an almost 1.3 m core extracted from the bottom of the
reservoir and from a 0.4 m monolith of sediment
perched 15 m above the reservoir bottom on a disused
bridge that was submerged following initial reservoir
filling in 1970. The diatom histories are supplemented
by evidence provided by other indicators, most
notably radionuclide concentrations and ratios. Inter-
estingly, despite the fact that the reservoir has
been [20 m deep for more than 70% of its recorded
history, distinct sections of the reservoir bottom core,
but not the bridge monolith, are dominated by non-
planktonic diatoms. We attribute the occurrences of
these phases to inflows that occur following heavy
catchment rains at times when the reservoir is drawn
down. These characteristic sections have, in turn, been
used to refine the site’s chronology. Despite having a
length of almost 1.3 m, a variety of data suggests that
the core has not recovered pre-reservoir sediment, but
rather spans the period from 1981 (11 years after first
filling) to 2001, when the core was extracted. It is
clear, therefore, that sediments in the bottom of the
reservoir are accumulating rapidly ([7 cm year-1),
although more than 40% of this deposition occurs in
less than 5% of the time. It appears that in the period
1996–2001, quiescent sedimentation rates, both in the
perched bridge locality and on the reservoir bottom,
slowed in response to reduced stream flow. Our
findings indicate that, with caution, complex patterns
of sedimentation in water storages can be disentan-
gled. However, it was difficult to precisely correlate
diatom sequences from the two records even in
periods of quiescent sedimentation, suggesting that
reservoir bottom diatom sequences should be inter-
preted with considerable caution. Furthermore, while
storm-derived inflows such as those identified may
Electronic supplementary material The online version ofthis article (doi:10.1007/s10933-009-9349-0) containssupplementary material, which is available to authorized users.
J. Tibby (&) � P. Gell
Geographical and Environmental Studies, University of
Adelaide, Adelaide, SA 5005, Australia
e-mail: [email protected]
P. Gell
School of Science & Engineering, University of Ballarat,
Ballarat, VIC 3353, Australia
G. Hancock
Rivers and Coasts, CSIRO Land and Water, Canberra,
ACT 2601, Australia
M. Clark
School of Mathematical Sciences, Monash University,
Clayton, VIC 3800, Australia
123
J Paleolimnol (2010) 43:535–549
DOI 10.1007/s10933-009-9349-0

deliver a substantial proportion of sediment and
phosphorus load to storages, the ensuing deposition
patterns may render much of the phosphorus unavail-
able to the overlying waters.
Keywords Reservoir � Diatoms � Sequence
slotting � Correlation � Sedimentation rates
Introduction
Although by no means as well studied as natural lakes,
reservoirs are increasingly being utilised as sites for
sediment-based research (Clark and Wasson 1986;
Hall et al. 1999), with varied objectives including
reconstruction of water quality (Hall et al. 1999;
Yoshikawa et al. 2000), atmospheric and catchment
pollution (Kim 2005; Shotbolt et al. 2006) and
sediment tracing (Wasson et al. 1987; Garzanti et al.
2006). Reservoirs have important features as palaeo-
limnological sites. In particular, sediment regularly
accumulates rapidly due to high trap efficiency and
positioning on high order streams (Clark and Wasson
1986), while often extensive historical information,
particularly related to hydrology, helps to identify
processes affecting site and catchment histories.
A major reason for a relative lack of reservoir-
based sediment studies is the potential for them to
exhibit complex sediment deposition patterns as a
result of factors such as the drawdown of water levels
and the large and variable discharges of input streams
(Shotbolt et al. 2005). Here we investigate two
sediment records from Kangaroo Creek Reservoir.
One record represents a typical sediment sequence, a
core extracted from a deep-water site using percus-
sion coring. The second record is more unusual: a
monolith sampled in situ from sediments deposited
on a disused bridge perched approximately 15 m
above the reservoir bottom which has been sub-
merged for almost all the time since the Reservoir
was first filled in 1970. Through independent analysis
and comparison of the two records, we show that they
exhibit distinctly different deposition histories, allow-
ing us to elucidate information about the pattern and
timing of sedimentation. In turn, the implications for
reservoir palaeolimnological studies are highlighted.
Descriptions of sites studied
Kangaroo Creek Reservoir (34�520S, 138�460E) is a
relatively large (current capacity approximately
19 9 107 m3, dam wall height 63 m) domestic water
storage on the River Torrens, South Australia (Fig. 1).
It is the fifth largest capacity storage in South
Australia. Kangaroo Creek Reservoir drains a
Mount Pleasantdissipators
Torre
ns
River
Kangaroo CreekReservoir
Angus Creekdissipators
GumerachaWeir
Torrens toMilbrookdiversion
Millbrookdissipators
MillbrookReservoir
Mannum - Adelaide pipeline
0 5km
River Torrenscatchment
(a)
138 46’E
S’25 43
o
o
dam wall04
0203
05
01
04
0203
05
01
04
- Location of monolith
- Location of core extraction- Reservoir thalweg
Kangaroo CreekReservoir
0 metres
500
(b)KEY
KEY
Kangaroo Creek
River
Torrens
River
Torrens
Water storages
Localities of River Murray water input
River Torrens
Fig. 1 a Location of Kangaroo Creek Reservoir and the Upper
River Torrens catchment. Also shown in a are the major
localities for water transfer in the Upper Torrens system.
b Bathymetry of Kangaroo Creek Reservoir and locations for
extraction of the core and bridge monolith sediment records
536 J Paleolimnol (2010) 43:535–549
123

catchment of approximately 290 km2 that is charac-
terised by a variety of mixed land uses, of which
broadscale grazing ([60% area) and native vegetation
are the dominant types (Anon 2000). Natural inflows
to reservoirs in the Torrens system are augmented by
inter-basin transfers of water from the River Murray
(approximately 80 km to the east). Inflows of River
Murray water into the system are limited by the
capacity of the pipeline (300,000 m3 a day) to deliver
water. By contrast, owing to the absence of upstream
storages, with the exception of Millbrook Reservoir
(capacity 16,500 9 106 m3) which drains approxi-
mately 12% of the catchment (Heneker 2003), natural
rainfall events can generate substantial inflow into
the reservoir, although some of this discharge can be
diverted to Millbrook Reservoir via pipeline from the
pool at Gumeracha Weir (Fig. 1).
Materials and methods
During lowering of Kangaroo Creek Reservoir’s water
level for valve maintenance, a monolith 40 cm long,
25 cm wide and approximately 10 cm thick was
extracted using a flat-bladed shovel from the surface
of the former Gorge Road Bridge. The bridge is
approximately 15 m above the current base of the
reservoir. The monolith was supported by a board,
wrapped and transported to the laboratory. A sediment
core was extracted from approximately 5 m of water
using a percussion corer (Chambers and Cameron
2001). Coring was halted before basal sediments were
reached for fear that the corer would become fixed in
the clay-rich sediments. In the laboratory, diatom
samples were removed from previously unexposed
surfaces at 0.5 cm resolution from the monolith and
the core. Contiguous centimetre-thick samples were
taken from the monolith for radionuclide determina-
tions. The smaller volume of the core meant that
contiguous 5-cm-thick slices were required for radio-
nuclide determination using gamma spectroscopy.
Organic matter was estimated by firing oven dried
samples at 550�C for 2 h on contiguous centimetre
samples from both records (Dean 1974).
Uranium and thorium series radionuclides and
fallout 137Cs were determined by gamma spectrom-
etry (Murray et al. 1987). A known weight (30–80 g)
of dry homogenized sediment was mixed with a
polyester resin and formed into a known geometry.
The radioactivity of the sample was measured using
high-purity Ge detectors. The nuclides measured
include 238U, 226Ra, 210Pb, 228Ra, 228Th, and 137Cs.
Charcoal particles [125 lm were counted from
the monolith to aid in the refinement of the chronol-
ogy as particles of this size often reflect local fires as
they are transported relatively short distances by air
(Clark and Hussey 1996). Using a technique based on
Rhodes (1995), weighed samples were dispersed
in *50�C 10% KOH for 12 h, centrifuged and the
supernatant discarded. Non-charcoal organic matter
was bleached in 4% H2O2 for 12 h. Samples were
then passed through a 125-lm sieve and the contents
retained. All black, angular, particles were counted at
509 magnification in a graduated petri dish using a
Zeiss Sterni 2000-C binocular microscope. Charcoal
was not analysed from the core.
Diatoms were prepared using a modified version of
Battarbee et al. (2001), with 2–3 h treatments in 10%
HCl and 10% H202, respectively, to remove carbonate
and organic matter. Following each of these steps,
samples were washed three times in distilled water and
allowed to settle for 12 h. Prepared slurries were dried
on coverslips which were then inverted and mounted on
permanent slides using Naphrax� mounting medium.
Diatoms were identified at 10009 magnification, using
either a Nikon Eclipse E600 with differential interfer-
ence contrast optics or with an Olympus BH2 micro-
scope with brightfield illumination. Diatoms were
identified with reference to a variety of sources, in
particular, Krammer and Lange-Bertalot (1986, 1988,
1991a, b) and Sonneman et al. (2000). There was some
disparity between analysts regarding the identity of
Staurosira construens Ehrenb. and Staurosira elliptica
(Ehrenb.) D. M. Williams et Round. Hence, these taxa
were grouped for data analysis and display.
In order to identify key points of change in the
perched bridge diatom monolith, we undertook strati-
graphically constrained cluster analysis using
CONISS (Grimm 1987) using Euclidean distance.
By contrast, hierarchical cluster analysis of the core
record was used to identify diatom assemblages which
had similar composition, regardless of their strati-
graphic position. We undertook this analysis in SPSS
for Windows 13.0 (SPSS 2004) with squared Euclid-
ean distance as the distance measure. The resultant
dendrogram (Appendix 1, available online as Elec-
tronic Supplementary Material) is not presented here
due to both the large sample size (n = 255) and the
J Paleolimnol (2010) 43:535–549 537
123

fact that the stratigraphically unconstrained cluster
could not be readily displayed in relation to the diatom
stratigraphy. Rather, membership of four clusters is
displayed on the diatom stratigraphy (Fig. 5). In both
cases, cluster analysis was undertaken on all taxa with
a relative abundance C1%.
We used sequence slotting (Thompson and Clark
1989) of the two diatom records to identify likely
correlations between the core and the bridge monolith
diatom deposits. In order to ensure maximum compa-
rability between the records, we only undertook
slotting on the four most abundant planktonic diatom
taxa with relative abundances expressed as a propor-
tion of the total of these taxa. Core samples dominated
by non-planktonic diatoms (shaded in Fig. 5) were first
removed from the analysis. Since the procedure in
Clark (1985) is limited to a maximum of 100 samples,
it was necessary to first average every two samples
(representing a centimetre of sediment) from the core.
This created a data set of 68 core samples and 70
monolith samples. For every pair of samples, the
dissimilarity in their diatom assemblages was mea-
sured using a chord distance based on the relative
proportions of the four diatom taxa. The two sequences
were then combined, subject to the stratigraphic
constraints, into a single, combined sequence with
minimum total dissimilarity (equivalently, minimum
combined path length) using a dynamic programming
approach (Delcoigne and Hansen 1975). Correlations
between the monolith and core were deduced from the
relative positions of the corresponding sample in the
combined sequence.
We utilised changes in radioisotopes to correlate
between the perched bridge monolith record and the
reservoir bottom core sequence. In particular we used
the activity ratio of the two fallout nuclides 210Pbex and137Cs. Since both these nulcides are adsorbed to the
surfaces of sediment grains, their ratio is less subject to
nuclide concentration variations associated with par-
ticle size differences. Given the different settings of
the core and the monolith, such differences are likely.
Historical stream discharge data and water levels
were obtained from the Department of Land, Water
and Biodiversity Conservation, South Australia.
Unfortunately, water level data were only available
from June 1979, while stream discharge data extended
to the beginning of 1974. Water levels were converted
to reservoir volumes using ratings curves supplied by
SA Water.
Results
210Pb stratigraphy and monolith chronology
Only the bridge monolith chronology is addressed in
this section. The chronology of the bottom core is
more problematic and is discussed in detail in the
Discussion section. 210Pbex values in the monolith
decline irregularly with depth (Fig. 2a), with several
non-monotonic features including peaks in concen-
tration at 1–2, 20–21 and 38–39 cm. The sections
between 12–18 and 29–32 cm are characterised by,
respectively, elevated and constant values relative to
samples above. 210Pbex in the core also generally
declines with depth in a non-monotonic fashion
(Fig. 2b), with values relatively constant between 35
and 60 cm and from 110 cm to the base of the core
(128.5 cm). 210Pbex values are somewhat variable in
the upper 30 cm of the core, while there is a peak
between 60 and 75 cm.
The chronology of the monolith is assessed using
the two commonly used approaches to 210Pb geo-
chronology, the CIC (constant initial 210Pbex con-
centration) and the CRS (constant rate of 210Pbex
supply) algorithms (Robbins 1978; Appleby and
Oldfield 1978). The CIC algorithm assumes the210Pbex activity of sediment being deposited is
constant, and the sediment age at depth x is
determined from
ti ¼ �1
kln
Cð0ÞCðxÞ
� �ð1Þ
where t(x) is the age at depth x, C(0) is the initial210Pbex concentration of sediment being deposited
and C(x) is the 210Pbex activity at depth x. Obtaining a
chronology for the monolith profile using Eq. (1) is
complicated by the difficulty in defining C(0). To
obtain a meaningful chronology using CIC the value
of C(0) needs to have been approximately constant
over the chronological period of interest. If this
occurs there will be a monotonic decrease in 210Pbex
with depth. Examination of the depth profile shows
that constant C(0) is unlikely to have occurred.
At the monolith surface the 210Pbex concentration is
about 60 Bq kg-1. The concentration C(x) increases
immediately below the surface to a value of
*100 Bq kg-1, before decreasing again. More non-
monotonic behaviour is seen at various depths in the
monolith, especially in the 17–22 cm depth interval.
538 J Paleolimnol (2010) 43:535–549
123

The ages calculated using Eq. 1 are shown in Fig. 3
(open circles). The age trend reflects the non-
monotonic 210Pbex concentrations, with large scatter
and inverted ages at some points where ages actually
increase with depth.
The CRS algorithm assumes constant 210Pbex flux,
therefore allowing variable 210Pbex activity of the
depositing sediment. The sediment age is determined
from
ti ¼ �1
kln
AðiÞAð1Þ
� �ð2Þ
where A(x) is the integrated activity (Bq m-2) of
excess 210Pb below depth x, and A(?) is the total
integrated activity of the sediment column, given by
Að1Þ ¼X1i¼1
cimi ð3Þ
where ci and mi is the concentration and mass of the
ith depth interval. Because the complete 210Pbex
profile was not captured by the monolith (210Pbex is
detected in the basal layer) A(?) cannot be measured
absolutely, and Eq. 2 cannot be applied. Conse-
quently we have used a variation on the traditional
CRS algorithm, as given by Appleby (2001). Here we
essentially ‘‘calibrate’’ the rate of 210Pb supply using
horizons of known age, rather than estimating it from
A(?). For the monolith the horizons of known age
correspond to the sediment surface (the year 2001 at
x = 0 cm) and the age of initial filling of the
reservoir (1970 at x = 36 cm). A depth of 36 cm is
0
20
40
60
80
100
120
Ra-226/Ra-228
Dep
th (
cm)
0
5
10
15
20
25
30
35
40D
epth
(cm
)
Dep
th (
cm)
{
210Pbex (Bq kg-1: ) 210Pbex (Bq kg-1: )
210Pbex/137Cs
0
5
10
15
20
25
30
35
40
Dep
th (
cm)
210Pbex/137Cs
Dep
th (
cm)
0
5
10
15
20
25
30
35
40
0.5 0.6 0.7 0.8
0 20 40 60 80 100 120
0.00 5.00 10.00 15.00 20.000.00 5.00 10.00 15.00 20.00
0.4 0.6 0.8 1
Dep
th (
cm) ?
?
226Ra/228Ra
0
20
40
60
80
100
120
0
20
40
60
80
100
120
0 20 40 60 80 100 120(a) (b)
(c) (d)
(e) (f)
Fig. 2 Radionuclide data
from Kangaroo Creek
Reservoir records. Excess210Pb concentrations in (a)
Kangaroo Creek Reservoir
bridge monolith and (b)
core. Ratio of excess 210Pb
to 137Cs in the monolith (c)
and core (d). Ratio of 226Ra
to 228Ra in the monolith (e)
and core (f) The shadedcore sections in b, d and fare characterised by diatom
assemblages not found in
the monolith and are
discussed below. Y-axes are
scaled to highlight the
proposed correlations
(indicated by arrows)
between the data series
J Paleolimnol (2010) 43:535–549 539
123

chosen to represent sediment delivered in 1970 rather
than the absolute base of the monolith (x = 38.5 cm)
due to the likelihood that the anomalous 2.5 cm layer
of sediment at the base of the monolith sediment
constitutes material of unknown origin deposited
during or shortly after construction of the dam ceased,
and should not therefore be considered part of the
modelled profile. A third horizon of known age is
revealed by a major charcoal peak seen in the 23–
24 cm depth section (Fig. 3); this peak was correlated
with the largest wild fire in the reservoir’s history
which occurred in February 1983. We hypothesise that
elevated charcoal levels above this point are related to
continued in-wash of 1983 charcoal from the catch-
ment. Thus, we model 210Pbex as having two periods of
constant flux, from 1970 to 1983, and from 1983 to
2001. For each period the flux (F) is determined from
F ¼ kAðt1; t2Þe�kt1 � e�kt2
ð4Þ
where A(t1, t2) is the 210Pbex inventory between the
horizons of known ages t1 and t2 occurring at depths
x1 and x2. The sediment age (t) at depth x is given by
t ¼ 1
kln e�kt1 þ k
FAðx; x1Þ
� �ð5Þ
where A(x, x1) is the 210Pbex inventory between depth x
and x2. The 210Pbex fluxes, F, are 379 Bq m-2 year-1
for 1971–1983 and 561 Bq m-2 year-1 for 1983–
2001. Both these values are many times greater than
the flux expected from direct atmospheric fallout for
Adelaide (*50 Bq m-2 year-1, Turekian et al. 1977),
indicating that 210Pbex delivery to the reservoir is
mainly associated with 210Pbex bound to sediment
eroded from the catchment hillslopes. This result is not
surprising given the high trap efficiency of reservoirs
for sediment. While a catchment source of 210Pbex
tends to argue against CRS as the appropriate
algorithm for 210Pbex geochronology (Appleby and
Oldfield 1992), the repeated filling of the reservoir in
most winters (see below), would have provided
relatively constant sediment source, and hence 210Pbex
input to the reservoir. We contend, therefore, that the
CRS approach is a reasonable approximation for
determining the 210Pbex chronology.
The piecewise CRS chronology determined using
Eq. 5 (Fig. 3, closed circles) shows the same general
trend as the CIC ages, but with much tighter
constraints on the dated horizons shown in Fig. 3 as
vertical dashed lines. Given the scatter in the CIC
ages, and the fact that the CRS chronology is well
calibrated at the base and mid-depth horizons, we
consider the CRS chronology to be more credible and
it is adopted hereafter.
A profile of sediment accumulation determined
from the piecewise CRS chronology of the monolith
0
5
10
15
20
25
30
35
40
19601970198019902000
Year (AD)
Dep
th (
cm)
CRSCIC
Charcoal (particles >125 µm g-1)
Charcoal
0 200 0 1 2 3
1.02
1.42
0.92
Sedimentation rate (cm yr-1)100
(a) (b)Fig. 3 a Kangaroo Creek
Reservoir bridge monolith
age-depth relationships
based on 2a. derived from
constant initial
concentration (CIC) and
constant rate of supply
(CRS). Also shown are the
concentrations of
macrocharcoal particles in
the monolith and the two
chronological tie-points
used to constrain the
CRS-derived age-depth
relationship. b Bridge
monolith sedimentation
rates
540 J Paleolimnol (2010) 43:535–549
123

is shown in Fig. 3b. The profile indicates higher rates
of accumulation in the 1980s and 1990s. Mean rates
for the periods 1971–1983, 1983–1997 and 1997–
2001 are given and show that sediment accumu-
lation was about 50% lower before 1983 compared to
1983–1997 (0.92 ± 0.16 cm year-1 compared to
1.42 ± 0.05 cm year-1). There is evidence for
lower sedimentation in the monolith after 1997
(1.03 ± 0.09 cm year-1).
As noted above, an independent 210Pb-based
chronology for the core was not derived as the
variable nature of the 210Pbex profile does not lend
itself to CIC modelling, while a CRS-based chronol-
ogy could not be applied because the complete post-
reservoir sediment profile was not recovered. Thus,
unlike the monolith, the basal age of the core is not
known and the rate of 210Pbex supply could not be
determined absolutely. As a result, we explore the
chronological relationships between the monolith and
the core in the following Discussion section based on
correlations between the two records, in addition to
their relationship to historical events.
Diatom stratigraphies
The majority of the diatom record from the Kangaroo
Creek monolith is dominated by planktonic diatoms.
The major exception to this observation is in zone 4
where, for approximately the bottom half of the zone,
the total proportion of plankton is less than 50%
(Fig. 4). Of the non-planktonic taxa represented in
zone four, Achnanthidium minutissimum (Kutz.)
Czarn. is the most abundant. Fragilaria capucina
Desm. is also an important part of the assemblages in
this zone. Key features of the remaining plankton-
dominated zones include peaks in Asterionella
formosa Hass. and Aulacoseira granulata (Ehr.)
Simonsen across the zone 4/3 boundary, a peak in
Cyclotella stelligera Cleve & Grun. in Cleve) Van
Heurck in the bottom half of zone 3 and a peak in
Aulacoseira subborealis (Nygaard) Denys, Muylaert
and Krammer in zone 2.
Unlike the monolith, the core shows distinct phases
dominated by non-planktonic diatoms (shown shaded
in Fig. 5). The assemblages in these phases are, for the
Asterio
nella
form
osa
Aulaco
seira
gra
nulat
a
Aulaco
seira
subb
orea
lis
Cyclot
ella
men
eghin
iana
Cyclot
ella
stellig
era
Fragil
aria
capu
cina
Achna
nthid
ium m
inutis
simum
Melo
sira
varia
ns
Navicu
la ve
neta
Nitzsc
hia fr
ustu
lum
Nitzsc
hia in
cons
picua
Planot
hidium
deli
catu
lum
Staur
osira
ellip
tica
Staur
osire
lla p
innat
a
0 200 20 40 0 20 40 0 20 40 0 20 40 0 20 0 20 0 0 0 0 20 0 0 20 0 0 20 40 60 80
Plankto
n
0.4 0.8 1.2 1.6 2.0 2.4 2.8 3.2
Total sum of squares
ZONE
1
2
3
4
CONISS
0 5 10 15
LOI0
4
8
12
16
20
24
28
32
36
40
Planktonic taxa
1996
1993
1990
1986
1981
1976
1970
2001
Age (AD)210Pb CRS
model derived
Dep
th (
cm)
(% dry mass lost @ 550OC)
%
Fig. 4 Summary diatom diagram from Kangaroo Creek Reservoir monolith. Also shown is the loss-on-ignition (LOI) after firing at
550�C. Note that diatoms were not sampled below the 35–35.5 cm sample
J Paleolimnol (2010) 43:535–549 541
123

most part, identified by cluster analysis as distinct from
other assemblages in the core (group 1 in Fig. 5). These
sections are dominated by Staurosirella pinnata (Ehr.)
Williams & Round, S. construens and S. elliptica and,
additionally, in the upper part of the record, by
Melosira varians Agardh. The depths of sections are
5.5–9.5, 14–16.5, 30.5–62.5, 79.5, 107.5–128.5 cm,
the latter being the basal sample (Fig. 5). Notably, loss-
on-ignition (LOI) values indicate that these parts of the
core are characterised by organic matter that is less
variable than in adjacent core sections (standard
deviation in LOI in these sections: 1.2%, in remaining
sections: 2.2%) (Fig. 5). The remaining core sections,
defined as groups 3 and 4, have much higher propor-
tions of planktonic diatoms. The predominant plank-
tonic diatoms that characterise these sections are
A. subborealis, A. granulata, C. stelligera and C.
meneghiniana Kutz. The latter taxon is notably more
abundant above 30 cm, while A. subborealis is partic-
ularly abundant between 62.5–75 cm.
Discussion
Conventional 210Pb dating approaches were not able
to provide a chronology for the core. Hence, we
firstly utilise the history of inflow events to propose
ages for the deposition of bulk sediment units in the
core and then assess these ages using correlations
between indicators in the core and the 210Pb dated
bridge monolith.
Timing, mechanisms and character of bulk
sediment deposition in the Kangaroo Creek
Reservoir core
In contrast to surface sediments in other south-east
Australian reservoirs, where planktonic diatoms
are [50% in all sites [5 m maximum depth (Fig. 2
in Tibby 2004), sections of the Kangaroo Creek
Reservoir core have very low proportions of plank-
tonic diatoms. These sections are also characterised
by sediment geochemistry and LOI that has lower
variability than other sections. Given that planktonic
diatoms dominate deep reservoir sediments generally
and, specifically, regularly dominate water column
phytoplankton in Kangaroo Creek Reservoir (unpub-
lished SA Water data), it is unlikely that units
dominated by non-planktonic diatoms were deposited
when the reservoir was deep. However, despite the
fact that non-planktonic-dominated sections make up
over 45% of the core profile, there have been no
0
10
20
30
40
50
60
70
80
90
100
110
120
130
Dep
th
20 40 60 80
Aulaco
seira
subb
orea
lis
Aulaco
seira
gra
nulat
a
Cyclot
ella
men
eghin
iana
Cyclot
ella
stellig
era
Fragil
aria
capu
cina
Achna
nthid
ium m
inutis
simum
Amph
ora
pedic
ulus
20
Melo
sira
varia
ns
Navicu
la cr
ypto
ceph
ala
20
Navicu
la ro
tund
a
Nitzsc
hia re
cta
20
Staur
osira
cons
truen
s &ell
iptica
20 40 20 40 20 40 20 40
Staur
osire
lla p
innat
a
Planktonic taxa
0 1 2 3 4 5Gro
up n
umbe
r
0 20
LOI
(% dry mass lost @ 550OC)
0 20 40 60 0 8 16 24 0 2 4 6 8 10 0.0 0.1 0.2 0.3
P2O5SiO2 Al2O3 Fe2O3
%
%
%
Fig. 5 Summary diatom and major element diagram from
Kangaroo Creek Reservoir core. Also displayed is the group to
which each sample belongs as determined by cluster analysis.
Note that the shaded samples dominated by non-planktonic
diatoms are either in group one or are individual two samples
(shown by hollow circles) located in regions dominated by
group one assemblages. LOI data are plotted at the mid-point
of 5-cm slices. Note that the major elements are scaled to their
maximum abundance
542 J Paleolimnol (2010) 43:535–549
123

prolonged periods of low reservoir water levels.
Water levels lower than 15 m occurred less than 15%
of the period mid-1979 to mid-2001 (Fig. 6) and the
longest period of water levels \15 m was less than
6 months (25.3.94–13.9.94). Hence, prolonged low
stands appear an unlikely mechanism to explain the
prevalence of non-planktonic-diatom-dominated sed-
iments in Kangaroo Creek Reservoir.
Reservoirs are known to deposit large volumes of
sediment via density currents in short-lived events
(Outhet 1991; Shotbolt et al. 2005). These currents
travel along the reservoir bottom as a result of a
relatively high density that originates from factors
such as lower temperature or elevated suspended
solid concentrations. Sediment proxies deposited by
these currents are often characterised by relatively
low variability (Tibby 2001; Shotbolt et al. 2005), as
is the case for the core LOI, diatom and major
element data (Fig. 5). In Burrinjuck Reservoir, NSW,
Australia density currents have been documented at
thicknesses exceeding 50 cm (Wasson et al. 1987;
Tibby 2001). Such deposition may occur infre-
quently, e.g. when heavy rainfall occurs while
reservoirs are drawn down (Wasson et al. 1987;
Shotbolt et al. 2005). We contend that this mecha-
nism explains the deposition of thick, relatively
homogenous sediments in the Kangaroo Creek Res-
ervoir core and their absence in the monolith.
Furthermore, these deposits were likely to have been
deposited at times when the reservoir filled quickly
following substantial draw down. Such circumstances
combine high stream power with shorter transport
distances from the inflow to the core site. This
interpretation permits a refinement of the core’s
chronology.
In late June 1981, in response to the highest
catchment discharges ([25 9 107 m3/month) in over
20 years, water levels in Kangaroo Creek Reservoir
rose from approximately 26 m deep to over 35 m
deep, representing an increase in reservoir volume
from approximately 5.7 9 106 m3 to 11 9 106 m3
(Fig. 6). Given that a number of data sources indicate
that the core sediment record commences at around
this time, we are confident that the basal core
sediment section was deposited at this time. A similar
set of environmental conditions also occurred in late
August 1992, when the reservoir almost doubled in
volume (9.9 9 106 m3–18.7 9 106 m3) in a single
20 40 60 80
Aulac
oseir
a sub
bore
alis
20 40
Cyclo
tella
men
eghi
nian
a
20 40
Cyclo
tella
stell
iger
a
20
Stau
rosir
a elli
ptica
+cons
truen
s
20 40
Stau
rosir
ella p
inna
ta
June 1976
June 1980
June 1984
June 1988
June 1992
June 1996
June 2000
{
{
Discharge at Gumeracha Weir
30 10 0 0 -2 12 8 4
0(m day-1)
Kangaroo Creek Reservoir water level increase
(106 m3 month-1)102030
(m)
Kangaroo Creek Reservoir water depth
%
Fig. 6 Monthly discharge over Gumeracha Weir (upstream of
Kangaroo Creek Reservoir), water level change in metres/day
in Kangaroo Creek Reservoir and summary diatom diagram
from the Kangaroo Creek Reservoir core. It is suggested that,
at the times of high stream discharge and rapid water level
change, core sections dominated by non-planktonic diatoms
were deposited
J Paleolimnol (2010) 43:535–549 543
123
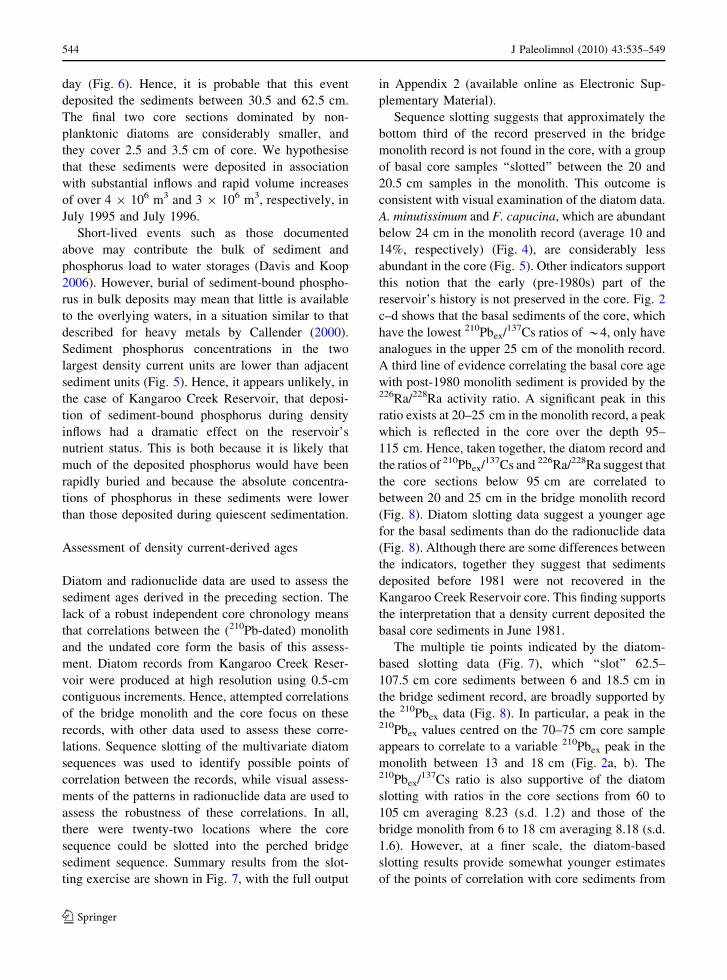
day (Fig. 6). Hence, it is probable that this event
deposited the sediments between 30.5 and 62.5 cm.
The final two core sections dominated by non-
planktonic diatoms are considerably smaller, and
they cover 2.5 and 3.5 cm of core. We hypothesise
that these sediments were deposited in association
with substantial inflows and rapid volume increases
of over 4 9 106 m3 and 3 9 106 m3, respectively, in
July 1995 and July 1996.
Short-lived events such as those documented
above may contribute the bulk of sediment and
phosphorus load to water storages (Davis and Koop
2006). However, burial of sediment-bound phospho-
rus in bulk deposits may mean that little is available
to the overlying waters, in a situation similar to that
described for heavy metals by Callender (2000).
Sediment phosphorus concentrations in the two
largest density current units are lower than adjacent
sediment units (Fig. 5). Hence, it appears unlikely, in
the case of Kangaroo Creek Reservoir, that deposi-
tion of sediment-bound phosphorus during density
inflows had a dramatic effect on the reservoir’s
nutrient status. This is both because it is likely that
much of the deposited phosphorus would have been
rapidly buried and because the absolute concentra-
tions of phosphorus in these sediments were lower
than those deposited during quiescent sedimentation.
Assessment of density current-derived ages
Diatom and radionuclide data are used to assess the
sediment ages derived in the preceding section. The
lack of a robust independent core chronology means
that correlations between the (210Pb-dated) monolith
and the undated core form the basis of this assess-
ment. Diatom records from Kangaroo Creek Reser-
voir were produced at high resolution using 0.5-cm
contiguous increments. Hence, attempted correlations
of the bridge monolith and the core focus on these
records, with other data used to assess these corre-
lations. Sequence slotting of the multivariate diatom
sequences was used to identify possible points of
correlation between the records, while visual assess-
ments of the patterns in radionuclide data are used to
assess the robustness of these correlations. In all,
there were twenty-two locations where the core
sequence could be slotted into the perched bridge
sediment sequence. Summary results from the slot-
ting exercise are shown in Fig. 7, with the full output
in Appendix 2 (available online as Electronic Sup-
plementary Material).
Sequence slotting suggests that approximately the
bottom third of the record preserved in the bridge
monolith record is not found in the core, with a group
of basal core samples ‘‘slotted’’ between the 20 and
20.5 cm samples in the monolith. This outcome is
consistent with visual examination of the diatom data.
A. minutissimum and F. capucina, which are abundant
below 24 cm in the monolith record (average 10 and
14%, respectively) (Fig. 4), are considerably less
abundant in the core (Fig. 5). Other indicators support
this notion that the early (pre-1980s) part of the
reservoir’s history is not preserved in the core. Fig. 2
c–d shows that the basal sediments of the core, which
have the lowest 210Pbex/137Cs ratios of *4, only have
analogues in the upper 25 cm of the monolith record.
A third line of evidence correlating the basal core age
with post-1980 monolith sediment is provided by the226Ra/228Ra activity ratio. A significant peak in this
ratio exists at 20–25 cm in the monolith record, a peak
which is reflected in the core over the depth 95–
115 cm. Hence, taken together, the diatom record and
the ratios of 210Pbex/137Cs and 226Ra/228Ra suggest that
the core sections below 95 cm are correlated to
between 20 and 25 cm in the bridge monolith record
(Fig. 8). Diatom slotting data suggest a younger age
for the basal sediments than do the radionuclide data
(Fig. 8). Although there are some differences between
the indicators, together they suggest that sediments
deposited before 1981 were not recovered in the
Kangaroo Creek Reservoir core. This finding supports
the interpretation that a density current deposited the
basal core sediments in June 1981.
The multiple tie points indicated by the diatom-
based slotting data (Fig. 7), which ‘‘slot’’ 62.5–
107.5 cm core sediments between 6 and 18.5 cm in
the bridge sediment record, are broadly supported by
the 210Pbex data (Fig. 8). In particular, a peak in the210Pbex values centred on the 70–75 cm core sample
appears to correlate to a variable 210Pbex peak in the
monolith between 13 and 18 cm (Fig. 2a, b). The210Pbex/137Cs ratio is also supportive of the diatom
slotting with ratios in the core sections from 60 to
105 cm averaging 8.23 (s.d. 1.2) and those of the
bridge monolith from 6 to 18 cm averaging 8.18 (s.d.
1.6). However, at a finer scale, the diatom-based
slotting results provide somewhat younger estimates
of the points of correlation with core sediments from
544 J Paleolimnol (2010) 43:535–549
123

74.5 to 85.5 cm ‘‘slotted’’ between the 13.5 and
14 cm samples in the bridge monolith (Figs. 7 and 8).
Indeed, age-depth estimates derived from the diatom
sequence slotting data suggest that core sediments are
consistently more recent than those inferred from
density current deposits (Fig. 9).
The core section 30.5–62.5 cm is dominated by
non-planktonic diatoms and was excluded from
sequence slotting. We have suggested, based on
correlating density current deposits with historical
data, that this section of the core was deposited in
1992. Applying the 210Pbex-based chronology for the
monolith (Fig. 3) would mean that these core samples
should correlate to between 11 and 13 cm (dated to
1992) in the monolith (Fig. 8). The 210Pbex data and
the 210Pbex/137Cs ratio suggest this is the case
(Figs. 2, 8). By contrast, the diatom slotting data
suggest that diatom core sequences immediately
below this unit (i.e. those from 62.5 to 63.5 cm) slot
above 7 cm in the monolith (dated to 1995) and
therefore provide somewhat later age estimates for
the core sediments. Given the size of stream inflows
0
5
10
15
20
25
30
35
Dep
th (
cm)
Asterio
nella
form
osa
Aulaco
seira
subb
orea
lis
Aulaco
seira
gra
nulat
a
Cyclot
ella
men
eghin
iana
Cyclot
ella
stellig
era
1996
1993
1990
1986
1981
1976
20 20 40 60 20 40 20 40 60 80 20 40 60
20 40 60 80 20 40 60 20 40 60 80 20 40 60
0.0 0.5 1.01.5 2.0 2.53.0 3.5 4.04.5 5.0 9.510.0 10.5 11.011.5 12.0 12.513.0 13.5 16.517.0 17.5 18.018.5 19.0 19.520.0 20.5 21.021.5 22.0 22.523.0 23.5 24.024.5 25.0 25.526.0 26.5 27.027.5 28.0 28.529.0 29.5 30.062.5 63.0 63.564.0 64.5 65.065.5 66.0 66.567.0 67.5 68.068.5 69.0 69.570.0 70.5 71.071.5 72.0 72.573.0 73.5 74.074.5 75.0 75.576.0 76.5 77.077.5 78.0 78.579.0 80.0 80.581.0 81.5 82.082.5 83.0 83.584.0 84.5 85.085.5 86.0 86.587.0 87.5 88.088.5 89.0 89.590.0 90.5 91.091.5 92.0 92.593.0 93.5 94.094.5 95.0 95.596.0 96.5 97.097.5 98.0 99.099.5 100.0 100.5101.0 101.5 102.0102.5 103.0 103.5104.0 104.5 105.0105.5 106.0 106.5107.0
Asterio
nella
form
osa
Aulaco
seira
subb
orea
lis
Aulaco
seira
gra
nulat
a
Cyclot
ella
men
eghin
iana
Cyclot
ella
stellig
era
Depth
(cm
)
1970
2001
Age (AD)210Pb CRS
model derived
%
%
(a) (b)
Fig. 7 Attempted correlation between Kangaroo Creek Res-
ervoir monolith (a) and core (b) diatom sequences derived
from sequence slotting. Note that where samples are shaded in
the core record, a number of samples are ‘‘slotted’’ between
monolith samples, where a dashed line is shown only a single
sample is slotted. Arrows highlight points at which core
sections dominated by non-planktonic diatoms have been
removed (see Fig. 5)
0
20
60
80
100
40
120
0
5
10
15
20
25
30
35
40
210Pbex
Diatoms (slotting)
210Pbex:137 Cs
Date of density inflow
{
{
Core depth (cm)Monolith depth (cm)
1996
1993
1990
1986
1981
1976
1970
2001
Age (AD)210Pb CRS
model derived
Fig. 8 Summary of
correlations based on210Pbex, 210Pbex/137Cs ratio,226Ra/228Ra, diatom
(sequence slotting) data and
that derived by ascribing
dates to inferred density
currents. Note that
ambiguous correlations are
not displayed
J Paleolimnol (2010) 43:535–549 545
123

and water level change in June 1992, we assign this
date, rather than the 1995 age suggested by sequence
slotting (particularly given the problems with these
data highlighted below), to this core section.
An unexpected outcome of the sequence slotting
suggests that diatom assemblages from the upper
27.5 cm of the core are not represented in the
monolith. Importantly, this occurs despite the exclu-
sion of thirteen samples dominated by non-planktonic
taxa from the analysis, see Appendix 2 (available
online as Electronic Supplementary Material). By
contrast, correlations between density currents and
water level change (Fig. 6) suggest the upper 30 cm of
the core was deposited between late 1992 and mid
2001. During this period, the Gorge Road Bridge was
predominantly submerged (Fig. 6) and thus it would
be expected that diatoms are preserved in both records.
The 210Pbex chronology suggests that this period is
preserved in the upper 12 cm of the monolith.210Pbex/137Cs ratios in the upper 30 cm of the core
average 14.1, with comparable average ratios in the
upper 5 cm of the monolith (13.2). These data, in line
with expectations, suggest that the time period repre-
sented in the upper 30 cm of the core are found in the
monolith record. As a result, it is difficult to reconcile
the diatom slotting data for these upper sediments. It
may be that because this period is characterised by
lower water levels in Kangaroo Creek Reservoir than
any similar length period (Fig. 7), processes such as
density currents operated at a scale which influenced
the composition of the core diatom assemblages, but
were not readily detectable as massive deposits.
Shotbolt et al. (2005) indicate that such a situation
provides a substantial challenge for the study of
reservoir sediments since records of environmental
change are modified in ways that are not easily
identified.
In summary, it appears that a number of broadly
consistent correlations can be derived between a core
extracted from the bottom of Kangaroo Creek Reser-
voir and a record of sediments deposited on a disused
bridge perched 15 m above the reservoir bed. How-
ever, the higher energy setting of the core means that
much of the proxy record preserved is likely to be
unrepresentative of the average conditions in the
reservoir water column. Moreover, with particular
reference to the diatom record, it is clear that, at a
minimum, half the core record deposited at the bottom
of the reservoir is representative of diatom composi-
tion of an unknown upstream location. Furthermore,
despite the construction of monolith and core diatom
data sets designed to minimise any discrepancy
between the depositional setting of the two records
by focussing on a limited number of planktonic taxa
and excluding a priori some core sections, it was not
possible to utilise sequence slotting to reliably refine
the chronology of the core, with the output from the
sequence slotting contrasting to other lines of evi-
dence. This, in combination with the unlikely notion
that the top 27.5 cm of the core is not preserved in the
monolith, indicates that the diatom data are not useful
for refining the chronology of the core record.
Furthermore, our inability to derive reliable correla-
tions between the bridge monolith and core diatom
sequences suggests that, even in the absence of large
density currents, reservoir bottom diatom sedimenta-
tion is affected by processes that do not reflect water
column conditions.
An age-depth record for the core
Age-depth curves for the core record (Fig. 9) include
the record based on proposed density currents (solid
0
20
40
60
80
100
120
1980 1985 1990 1995 2000
Age (AD)D
epth
(cm
)
s.s. derived
d.c.
d.c.
210Pbex peak
d.c. derived210 Pb derivedd.c.
Fig. 9 Age-depth relationship for the Kangaroo Creek core
derived from sedimentation events and core-monolith correla-
tions outlined in this study. Density current (d.c). Age-depth
relationships derived from sequence slotting (s.s.) of diatom
assemblages and CRS modelling of the 210Pbex are also shown.
Note that the d.c. derived relationship is the preferred
chronology (see text for details)
546 J Paleolimnol (2010) 43:535–549
123

line), sequence slotting (dotted line) and a calibrated210Pbex CRS chronology. The CRS chronology is
determined assuming the base of the core corresponds
to 1981 (approximate uncertainty ± 1 year). Equa-
tions (4) and (5) are used to calculate dates with the
known time horizons being the years 2001 (depth
0 cm) and 1981 (depth 130 cm). In general the210Pbex CRS chronology supports our proposed
density current record over the sequence slotting
approach, with the only significant deviation between
the density current record and the CRS chronology
(1–2 years) occurring during the period of low
sedimentation in the mid-late 1990s. It is likely that
the assumption of constant 210Pbex flux during this
period of low sedimentation is not valid, and is
responsible for the dating differences.
Whilst the proposed density current record obvi-
ously emphasises the rapid accumulation that occurs in
bottom sediments during the deposition of density
currents, it also allows for some comparisons to be
made of the mean sedimentation rates that occur
between density currents. Whilst substantial caveats
must be placed on such inferences, since allochthonous
density currents can entrain autochthonous sediment,
Fig. 9 indicates that, following the last density inflows,
from mid-1996 to mid-2001, sedimentation was nota-
bly slower than the periods 1981–1992 and 1992–
1996, which followed the first and second inflows,
respectively. The apparent slowing of sedimentation
since mid 1996 is also observed in the CRS-derived
sedimentation rate from the bridge monolith record
(Fig. 3b). The proposed 210Pbex bottom core chronol-
ogy also indicates a reduction in sedimentation by
almost half since *1995. Since 1996, stream flows to
Kangaroo Creek Reservoir have been markedly
reduced relative to the other periods (Fig. 6), a fact
consistent with our sedimentation observations.
Conclusions
Palaeolimnological analyses of sediments deposited
in Kangaroo Creek Reservoir have revealed the
history of sediment deposition in two contrasting
sedimentary environments. The record preserved on a
submerged disused bridge covers the full period from
first filling to 2001, with the exception of some short
time periods when the bridge was exposed during
reservoir draw down. By contrast, the 128.5-cm core
record appears to only span the period since late
1981.
The CRS-based chronology for monolith sedi-
ments indicates that, on a decadal timescale, sediment
accumulation on the George Road Bridge has not
undergone major fluctuations. The high-resolution
diatom analysis of bottom reservoir sediments, how-
ever, has provided indications of very different basal
sediment behaviours. In particular, diatoms show that
the core record is characterised by substantial
sections with high proportions of non-planktonic
diatoms and sediment properties that are distinct from
the remainder of the record. These sections were
deposited rapidly by density currents that occurred at
times of high upstream discharge. These findings
have important implications for catchment manage-
ment. In particular, although these sections contain
47% of the sediments deposited at the core site, they
are likely to have been deposited in less than 5% of
the time. Despite this, it appears unlikely that that this
deposition resulted in large increases in the pool of
sediment-bound nutrients since these sediments had
relatively low concentrations of phosphorus and were
rapidly buried. The bottom sediment accumulation
rate during periods between density currents exhibits
a trend similar to that observed in the perched bridge
monolith record, with an apparent slowing of sedi-
ment accumulation from 1996 to 2001, possibly as a
result of reduced catchment inflows.
Despite the very different depositional histories of
the two records presented, correlation based on a
variety of indicators was still possible. Notably,
diatoms provided a less reliable indicator with which
to correlate the records than the radionuclide data. It
is clear that, in reservoirs such as this, cores raised
from bottom sediments may be characterised by
sequences in which much of the sediment is not
representative of the long-term history of the reser-
voir water column. Hence, although reservoirs still
represent a relatively untapped resource for palaeo-
limnological study, considerable caution is warranted
when interpreting reservoir diatom records. In this
study, bottom sediment accumulation associated with
phases of sediment mobility, presumably driven by
density currents, were readily identifiable. However,
the problem of a background deposition of allochth-
onous diatoms was also highlighted, particularly
by the inability to slot sequences in the upper part
of the core record. This issue perhaps provides a
J Paleolimnol (2010) 43:535–549 547
123

fundamental challenge to interpreting diatom-based
records from reservoirs.
Acknowledgments This project was supported by the
Torrens Catchment Water Management Board and the
Australian Research Council via Linkage project LP0347579
to PG and Peter Wallbrink. Diatoms were counted by Greg
Smith, Cameron Barr, Jonathan Tyler, Nicole Morcom and J.T.
Teresa Heneker, Department of Land, Water and Biodiversity
Conservation provided much of the hydrological data. Peter
Murphy, SA Water, provided the water level to volume
conversion tools for Kangaroo Creek Reservoir.
References
Anon (2000) Torrens Catchment Management Plan. Torrens
Catchment Modelling. Tonkin Consulting, Adelaide
Appleby PG (2001) Chronostratigraphic techniques in recent
sediments. In: Last WM, Smol JP (eds) Tracking envi-
ronmental change using lake sediments, vol 1: basin
analysis, coring and chronological techniques. Kluwer
Academic Publishers, Dordrecht, pp 171–204
Appleby PG, Oldfield F (1978) The calculation of lead-210
dates assuming a constant rate of supply of unsupported210Pb to the sediment. Catena 5:1–8. doi:10.1016/S0341-
8162(78)80002-2
Appleby PG, Oldfield F (1992) Application of lead-210 to
sedimentation studies. In: Ivanovich M, Harmon RS (eds)
Uranium-series disequilibrium: applications to earth,
marine and environmental sciences. Clarendon Press,
Oxford, pp 731–778
Battarbee RW, Jones VJ, Flower RJ, Cameron NG, Bennion H,
Carvalho L, Juggins S (2001) Diatoms. In: Smol JP, Last
WM, Birks HJB (eds) Tracking environmental change
using lake sediments, vol 3: terrestrial, algal and siliceous
indicators. Kluwer Academic Publishers, Dordrecht,
pp 155–202
Callender E (2000) Geochemical effects of rapid sedimentation
in aquatic systems: minimal diagenesis and the preserva-
tion of historical metal signatures. J Paleolimnol 23:
243–260. doi:10.1023/A:1008114630756
Chambers JW, Cameron NG (2001) A rod-less piston corer for
lake sediments: an improved, rope-operated percussion
corer. J Paleolimnol 25:117–122. doi:10.1023/A:1008181
406301
Clark RM (1985) A FORTRAN program for constrained
sequence-slotting based on minimum combined path
length. Comput Geosci 11:605–617. doi:10.1016/0098-30
04(85)90089-5
Clark JS, Hussey TC (1996) Estimating the mass flux of
charcoal from sediment records: the effect of particle size,
morphology, and orientation. Holocene 6:129–144. doi:
10.1177/095968369600600201
Clark RL, Wasson RJ (1986) Reservoir sediments. In: De-
Deckker P, Williams WD (eds) Limnology in Australia.
CSIRO, Melbourne, pp 497–507
Davis J, Koop K (2006) Eutrophication in Australian riv-
ers, reservoirs and estuaries—a southern hemisphere
perspective on the science and its implications. Hydrobi-
ologia 559:23–76. doi:10.1007/s10750-005-4429-2
Dean WE (1974) Determination of carbonate and organic
matter in calcareous sediment and sedimentary rocks by
loss on ignition: comparison with other methods. J Sedi-
ment Petrol 44:242–248
Delcoigne A, Hansen P (1975) Sequence comparison by
dynamic programming. Biometrika 62:661–664. doi:
10.1093/biomet/62.3.661
Garzanti E, Ando S, Vezzoli G, Ali Abdel Megid A, El Kammar
A (2006) Petrology of Nile River sands (Ethiopia and
Sudan): sediment budgets and erosion patterns. Earth Pla-
net Sci Lett 252:327–341. doi:10.1016/j.epsl.2006.10.001
Grimm EC (1987) CONISS: a FORTRAN 77 program for
stratigraphically constrained cluster analysis by the
method of incremental sum of squares. Comput Geosci
13:13–35. doi:10.1016/0098-3004(87)90022-7
Hall RI, Leavitt PR, Dixit AS, Quinlan R, Smol JP (1999)
Limnological succession in reservoirs: a paleolimnologi-
cal comparison of two methods of reservoir formation.
Can J Fish Aquat Sci 56:1109–1121. doi:10.1139/cjfas-
56-6-1109
Heneker TM (2003) Surface water assessment of the upper
River Torrens catchment. Department of Water, Land and
Biodiversity Conservation, Adelaide
Kim JG (2005) Assessment of recent industrialization in wet-
lands near Ulsan, Korea. J Paleolimnol 33:433–444. doi:
10.1007/s10933-004-7617-6
Krammer K, Lange-Bertalot H (1986) Bacillariophyceae. 1:
Teil: Naviculaceae. Gustav Fischer Verlag, Jena
Krammer K, Lange-Bertalot H (1988) Bacillariophyceae. 2:
Teil: Bacillariaceae, Epthimiaceae, Surirellaceae. Gustav
Fischer Verlag, Jena
Krammer K, Lange-Bertalot H (1991a) Bacillariophyceae. 3:
Centrales, Fragilariaceae, Eunotiaceae. Gustav Fischer
Verlag, Stuttgart
Krammer K, Lange-Bertalot H (1991b) Bacillariophyceae. 4:
Achnanthes, Kritische Erganzunhen zu Navicula (Lineo-
latae) und Gomphonema Gesamtliteraturverzeichnis Teil
1-4. Gustav Fischer Verlag, Stuttgart
Murray AS, Marten R, Johnston A, Martin P (1987) Analysis
of naturally occurring radionuclides at environmental
concentrations by gamma spectrometry. J Radioanal Nucl
Chem 115:263–288. doi:10.1007/BF02037443
Outhet DN (1991) Sedimentation in variable reservoirs in New
South Wales. Unpublished Ph.D. thesis, School of Earth
Science, Macquarie University, Sydney
Rhodes AN (1995) A method for the preparation and quantifi-
cation of microscopic charcoal from terrestrial and lacus-
trine sediment cores. Holocene 8:113–117. doi:10.1191/
095968398671104653
Robbins JA (1978) Geochemical and geophysical applications
of radioactive lead. In: Nriagu JO (ed) The biogeochem-
istry of lead in the environment, Part A. Elsevier Scien-
tific, Amsterdam, pp 285–393
Shotbolt LA, Thomas AD, Hutchinson SM (2005) The use of
reservoir sediments as environmental archives of catch-
ment inputs and atmospheric pollution. Prog Phys Geogr
29:337–361. doi:10.1191/0309133305pp452ra
Shotbolt L, Hutchinson S, Thomas A (2006) Sediment stra-
tigraphy and heavy metal fluxes to reservoirs in the
548 J Paleolimnol (2010) 43:535–549
123

Southern Pennine Uplands, UK. J Paleolimnol 35:305–
322. doi:10.1007/s10933-005-1594-2
Sonneman JA, Sincock A, Fluin J, Reid M, Newall P, Tibby J,
Gell P (2000) An Illustrated guide to common stream
diatoms from temperate Australia. Cooperative Research
Centre for Freshwater Ecology, Thurgoona
SPSS (2004) SPSS for windows 13.0. SPSS, Chicago
Thompson R, Clark RM (1989) Sequence slotting for strati-
graphic correlation between cores: theory and practice.
J Paleolimnol 2:173–184. doi:10.1007/BF00202045
Tibby J (2001) Diatoms as indicators of sedimentary processes
in Burrinjuck reservoir, New South Wales, Australia. Q
Int 83–85:245–256. doi:10.1016/S1040-6182(01)00043-X
Tibby J (2004) Development of a diatom-based model for
inferring total phosphorus in south-eastern Australian
water storages. J Paleolimnol 31:23–36. doi:10.1023/
B:JOPL.0000013272.25122.2a
Turekian KK, Nozaki Y, Benninger LK (1977) Geochemistry
of atmospheric radon and radon products. Annu Rev Earth
Planet Sci 5:227–255. doi:10.1146/annurev.ea.05.050177.
001303
Wasson RJ, Clark RL, Nanninga PM, Waters J (1987) 210Pb as
a chronometer and sediment tracer, Burrinjuck Reservoir,
Australia. Earth Surf Process Landf 12:399–414. doi:
10.1002/esp.3290120406
Yoshikawa S, Yamaguchi S, Hata A (2000) Paleolimnological
investigation of recent acidity changes in Sawanoike
Pond, Kyoto, Japan. J Paleolimnol 23:285–304. doi:
10.1023/A:1008199830698
J Paleolimnol (2010) 43:535–549 549
123