New Total Sediment-Load Sampler
21
BED-LOAD SAMPLING IN SAND-BED RIVERS By Moustafa T. K. Gaweesh ~ and Leo C. van Rijn2 ABSTRACT: Bed-loadsampling in sand-bedriverswas studied. A mechanical sam- pler called the Delft Nile sampler was designed and operated in flume and field conditions. The flume data obtained for different bed material sizes in the range of 280-1,070 Ixmwere used to determine the sampling efficiency factor of the bed- load sampler. The samplingefficiencyfactor was found to be about 1.0 for bed material sizes larger than about 400 Ixm and about 1.5 for finer bed material sizes. Field measurementsin the Nile river (Egypt) and in the Rhine river (The Neth- erlands) were taken to determine the proper number of samples to be taken in a cross sectionin relation to the errors involved.The bed-loadsamplerwas equipped with an underwater video camera to facilitate visual observationsof the bed-load sampling process. Based on the visual observations, fivetypesof bed-loadsamplings were distinguished and a computation method was proposed to determine the proper mean bed-load transport rate from the collected samples at a certain sam- pling station. The error of the mean transport rate in a samplingstation was de- termined as a functionof the number of samples. The samples should be taken at different locationsalong a bed form (dune). Finally, the overall error of the cross- section integrated bed-load transport rate was determined as a function of the number of samplesin a samplingstation and the number of samplingstations in a cross section. INTRODUCTION Bed-load sampling in rivers is rather complicated, especially in conditions with combined bed-load and suspended-load transport. Considerable atten- tion has been given to bed-load sampling in gravel-bed rivers (Einstein 1937; Hubbell 1964; Helley and Smith 1971; Emmett 1980; Hubbell et al. 1985; Carey 1985). In this paper, the sampling process in sand-bed rivers with combined bed-load and suspended-load transport is studied. The emphasis is herein laid on the bed-load transport process. Bed-load transport is defined as the movement of bed material particles by sliding, rolling, and jumping along the bed (Bagnold 1966, Van Rijn 1984). In the lower transport regime these types of motions manifest them- selves in the form of mini ripples (height of 0.01-0.05 m; length of 0.1-0.5 m) migrating over the upper side of larger-scale dunes. In the upper trans- port regime, with plane bed conditions, the bed-load transport process shows a sheet flow behavior, with a thickness on the order of 0.01-0.03 m. The accuracy of the bed-load transport measured by use of a mechanical sampler depends on its sampling efficiency (instrumental errors), on the sampling location with respect to the bed-form geometry (spatial variability) and on the near-bed turbulence structure (temporal variability). A detailed discus- sion was given by Van Rijn and Gaweesh (1992) and Gaweesh and Van Rijn (1992). Typical sampling problems related to the instrumental design (sampler geometry) are: (1) The initial effect (disturbance of bed material when the sampler touches the bed); (2) the gap effect (space between sampler nozzle 1Deputy Dir., Hydr. and Sediment Res. Inst., Delta Barrage 13621, Egypt. 2Sr. Engr., Delft Hydr., P.O. Box 152, 8300 AD, Emmeloord, The Netherlands. Note. Discussion open until May 1, 1995. To extend the closing date one month, a written request must be filed with the ASCE Manager of Journals. The manuscript for this paper was submitted for review and possible publication on December 9, 1993. This paper is part of the Journal of Hydraulic Engineering, Vol. 120, No. 12, December, 1994. ISSN 0733-9429/94/0012-1364/$2.00 + $.25 per page. Paper No. 7492. 1364
-
Upload
nwrc-egypt -
Category
Documents
-
view
4 -
download
0
Transcript of New Total Sediment-Load Sampler

B E D - L O A D S A M P L I N G IN S A N D - B E D R I V E R S
By Moustafa T. K. Gaweesh ~ and Leo C. van Rijn 2
ABSTRACT: Bed-load sampling in sand-bed rivers was studied. A mechanical sam- pler called the Delft Nile sampler was designed and operated in flume and field conditions. The flume data obtained for different bed material sizes in the range of 280-1,070 Ixm were used to determine the sampling efficiency factor of the bed- load sampler. The sampling efficiency factor was found to be about 1.0 for bed material sizes larger than about 400 Ixm and about 1.5 for finer bed material sizes. Field measurements in the Nile river (Egypt) and in the Rhine river (The Neth- erlands) were taken to determine the proper number of samples to be taken in a cross section in relation to the errors involved. The bed-load sampler was equipped with an underwater video camera to facilitate visual observations of the bed-load sampling process. Based on the visual observations, five types of bed-load samplings were distinguished and a computation method was proposed to determine the proper mean bed-load transport rate from the collected samples at a certain sam- pling station. The error of the mean transport rate in a sampling station was de- termined as a function of the number of samples. The samples should be taken at different locations along a bed form (dune). Finally, the overall error of the cross- section integrated bed-load transport rate was determined as a function of the number of samples in a sampling station and the number of sampling stations in a cross section.
INTRODUCTION
Bed-load sampling in rivers is rather complicated, especially in conditions with combined bed-load and suspended-load transport. Considerable atten- tion has been given to bed-load sampling in gravel-bed rivers (Einstein 1937; Hubbell 1964; Helley and Smith 1971; Emmet t 1980; Hubbel l et al. 1985; Carey 1985). In this paper, the sampling process in sand-bed rivers with combined bed-load and suspended-load transport is studied. The emphasis is herein laid on the bed-load transport process.
Bed-load transport is defined as the movement of bed material particles by sliding, rolling, and jumping along the bed (Bagnold 1966, Van Rijn 1984). In the lower transport regime these types of motions manifest them- selves in the form of mini ripples (height of 0.01-0.05 m; length of 0 .1-0 .5 m) migrating over the upper side of larger-scale dunes. In the upper trans- port regime, with plane bed conditions, the bed-load transport process shows a sheet flow behavior, with a thickness on the order of 0.01-0.03 m. The accuracy of the bed-load transport measured by use of a mechanical sampler depends on its sampling efficiency ( instrumental errors), on the sampling location with respect to the bed-form geometry (spatial variability) and on the near-bed turbulence structure (temporal variability). A detailed discus- sion was given by Van Rijn and Gaweesh (1992) and Gaweesh and Van Rijn (1992).
Typical sampling problems related to the instrumental design (sampler geometry) are: (1) The initial effect (disturbance of bed material when the sampler touches the bed); (2) the gap effect (space between sampler nozzle
1Deputy Dir., Hydr. and Sediment Res. Inst., Delta Barrage 13621, Egypt. 2Sr. Engr., Delft Hydr., P.O. Box 152, 8300 AD, Emmeloord, The Netherlands. Note. Discussion open until May 1, 1995. To extend the closing date one month,
a written request must be filed with the ASCE Manager of Journals. The manuscript for this paper was submitted for review and possible publication on December 9, 1993. This paper is part of the Journal of Hydraulic Engineering, Vol. 120, No. 12, December, 1994. �9 ISSN 0733-9429/94/0012-1364/$2.00 + $.25 per page. Paper No. 7492.
1364

and bed); and (3) the scooping effect (sampler scoops through the bed when it is raised).
Typical sampling difficulties related to the behavior of the physical pro- cesses involved, are: (1) The sampling duration of each measurement; (2) the variability of the transport process along a bed form in a subsection of the cross section; and (3) the variability of the transport process in different subsections across the river.
To simultaneously measure the bed-load and the suspended-load trans- port, a mechanical sampler called the Delft Nile sampler (Van Rijn and Gaweesh 1992) has been designed and has been tested in flume and field conditions (Nile river, Egypt, and Rhine river, The Netherlands).
The present research is a combined effort of Delft Hydraulics (The Neth- erlands) and Hydraulics and Sediment Research Institute [(HSRI) in Egypt], aimed at measuring the total-load transport in the Nile river. The sampler was extensively tested in a flume at HSRI using different bed materials and flow velocities to determine the sampling efficiency. Field measurements in the Nile river and in the Rhine river have been carried out to study the sampling performance and statistics.
INSTRUMENT DESIGN AND SAMPLING CHARACTERISTICS
Instrument The new instrument consists of a bed-load sampler and a suspended-load
sampler attached to a supporting frame. The sampler has a weight of about 60 kg. The suspended-load sampler consists of seven intake nozzles (inner diameter = 0.003 m) that are connected to plastic hoses and operated by small pulsation pumps. The bed-load sampler consists of a nozzle (entrance width = 0.096 m; entrance height = 0.055 m; length = 0.085 m; rear width -- 0.105 m; rear height = 0.06 m) connected to a bag. The bag consists of Nylon material with a mesh size of 150 or 250 Ixm, depending on the size of bed material. At the upper side of the bag a patch (0.10 x 0.15 m 2) consisting of 500 Ixm Nylon material is present to reduce the blocking effect by fine silt, clay, and organic materials as much as possible, see Fig. 1. The sampler is equipped with an underwater video camera to observe the sam- pling process. More details are given by Van Rijn and Gaweesh (1992) (and see Table 1).
Sampling Characteristics As the bed-load sampler has relatively small dimensions (height of nozzle
= 0 . 0 5 5 m; width of nozzle -- 0.096 m) it will take samples of the mini ripples migrating over the upper side of larger-scale dunes. Representative sampling therefore requires sampling at different locations along the larger- scale dunes (spatial averaging).
Part of the flow through the nozzle of the sampler will leave the bag
patch
nozzle
I I
500 #,m dividing streamline
\trapped sediment
FIG. 1. Sampler Nozzle and Nylon Bag
1365

TA
BL
E
1.
Bas
ic D
ata
of
Bed
For
ms
and
Sed
imen
t Tr
ansp
ort
Mea
sure
d in
Flu
me
03
{3
")
"lo
st
num
ber
(1) 1 2 4 5 6 7 8 9
10
11
Bed
-For
m D
imen
sion
s
Hei
ght
(m)
(2)
0.0
21
0.0
54
0.0
95
0.0
71
0.0
83
0.0
23
0.0
29
0.0
70
0.0
73
Leng
th
(m)
(3)
0.1
98
1.3
40
0.8
30
1.4t
0 1
.16
0
0.1
51
0.2
35
1.2
30
1.32
0
Bed
load
(k
g/s/
m)
(4)
3.1
0E
-
03
6.0
0E
-
03
10
.00
E
- 0
3
13
.00
E
- 0
3
17
.34
E
- 0
3
26
.58
E
- 0
3
2,0
7E
-
03
10
.76
E
- 0
3
15
.07
E
- 0
3
17
.90
E
- 0
3
Sed
imen
t Tra
nspo
rt R
ate
Sus
pend
ed l
oad
(kg/
s/m
) (5
) 0
.10
E
- 0
3
0.2
0E
-
03
0.3
0E
-
03
0.1
0E
-
03
0.4
0E
-
03
0.5
0E
-
03
0.7
0E
-
03
4.0
0E
-
03
0.0
0E
-
00
0.0
0E
-
00
Tota
l lo
ad
(kg/
s/m
) (6
) 3
.20
E
- 0
3
6.2
0E
-
03
10
.30
E
- 0
3
13
.10
E
- 0
3
17
.74
E
- 0
3
27
.08
E
- 0
3
2.7
7E
-
03
14
.76
E
- 0
3
15
.07
E
- 0
3
17
.90
E
- 0
3
Flow
di
scha
rge
(ma/
s)
(7)
0.2
10
0.2
10
0.2
10
0.2
56
0.2
56
0.2
56
0.2
25
0.2
39
0.2
40
0.2
37
Wat
er s
urfa
ce
slop
e (8
) 4
.2E
-
04
5.2
E
- 0
4
6.0
E
- 0
4
4.7
E
- 0
4
5.8
E
- 0
4
7.5
E
- 0
4
3.0
E
- 0
4
4.1
E
- 0
4
7.1
E
- 0
4
7.5
E
- 0
4
Wat
er
tem
pera
ture
(~
(9)
20
29
22
20
26
27
27
21
23
25

through the patch at the upper side. Streamline measurements using a thin thread connected to a rod were carried out to determine the dividing stream- line; defined as that streamline just passing along the edge of the patch (see Fig. 1). The height (a) of the dividing streamline above the bottom of the sampler nozzle was found to be about 0.03 m (filling percentage of bag approximately 25%), which is roughly equal to the average height of the migrating mini ripples in the Nile and Rhine rivers (based on camera re- cordings). The sediment particles transported in the flow layer above (a) are here assumed to be suspended sediment particles that will leave the bag through the patch. The particles in the layer below (a) will be trapped in the bag. The transport rate of these latter particles is here defined as the bed-load transport rate. In the lower regime, it is realistic to assume that bed-load transport takes palce by migrating mini ripples with a height on the order of 0.03 m. However, errors related to sampling of suspended-load as bed load will be minimum. In the upper regime, some oversampling may occur as the bed-load layer thickness may not be larger than 0.01 m. The particles in the layer between 0.01 m and a = 0.03 m will be transported as suspended load, but they will be trapped in the Nylon bag as bed load.
The suspended-load transport rate is determined by depth-integration from measurements of sand concentration and flow velocity with integration limits between the water surface level and a reference level equal to the thickness of bed-load layer as follows:
(t , = u c d z (1)
in which qs = time-averaged suspended-load transport rate per unit width (kg/s/m); a = thickness of bed-load layer; h = water depth (m); u = flow velocity (m/s) at height z above the bed; and c = suspended sand concen- tration (kg/m 3) at height z above the bed.
The velocity and concentration data are extrapolated down to the height of the bed-load layer. Extrapolation methods are given by Van R!jn (1986, 1992, 1993).
This proposed schematization will inherently involve errors, which will be taken into account by the sampling efficiency factor. Calibration exper- iments with relatively fine bed material (280 ~m) have been carried out to study the sampling error in conditions with combined bed-load and sus- pended-load transport (see next section).
CALIBRATION OF DELFT NILE SAMPLER
Sampling Efficiency Mechanical samplers may not catch material at the actual rate and must
be calibrated to determine their sampling efficiency under different flow conditions, transport rates, and bed-material particle sizes.
The sampling efficiency factor is herein defined as "the ratio of the bed- load transport measured by the sampler at a certain location during a certain period and the actual bed-load transport at the same location during the same period, if the sampler had not been there," (Hubbell 1964). The sampling efficiency (or sediment trapping efficiency) of a bed-load sampler depends on: (1) The hydraulic coefficient; (2) the degree of contact of the sampler nozzle with the bed (during sampling); and (3) the sampling dis- turbances generated at the beginning and at the end of the sampling period.
1367
The sampling efficiency factor of many samplers is not constant but varies with the transport rate and sediment size (Novak 1957).
The hydraulic coefficient of the bed-load sampler is defined as "the ratio of the mean inflow velocity through the sampler nozzle and the mean am- bient flow velocity" (Hubbell 1964). The hydraulic coefficient of the Delft Nile sampler was determined by measurements in a laboratory flume and was found to be between 0.8 and 1.0 for filling percentages of the bag up to 50% (Van Rijn and Gaweesh 1992). However, a hydraulic coefficient of unity does not necessarily give a sampling efficiency of unity, because other factors are involved.
Usually, the sampling efficiency is derived from tests in a small-scale laboratory flume. The question arises whether the sampling efficiency ob- tained from the flume data can be reliably applied to the field data. The most important problem involved is the composition of the bed material and the shape and size of the bed forms, which will be quite different in flume and in field conditions (scale effect). Therefore, the results of the flume tests should be interpreted as indicative rather than as absolute. Field calibration, although difficult and expensive, remains always necessary.
The sampling efficiency expresses sampling errors related to the initial and scooping effect, the gap effect and the loss of sand particles through the patch of the sampler bag.
Laboratory and field observations of large variations in measured bed- load transport rates have been reported in the literature [e.g., Leopold and Emmett (1976), Hubbell et al. (1985), and Carey (1985)]. Their observations showed that the measured bed-load transport rate at a fixed sampling lo- cation varied in a cyclic manner over a wide range during constant water discharge. The variation can be so large that the mean transport rate may not b e accurately estimated by a small number of samples at that location. The number of samples necessary for an accurate mean value of the transport rate depends upon the accuracy required by the sampling program and the time scale of the cyclic rate variations. Therefore, accurate determination of the mean bed-load transport rate requires sequential sampling for a long enough time to sample both the high- and low-frequency-rate cycles (Carey 1985).
Calibration Tests Bed-load samplers are generally calibrated to define their efficiency for
the specific ranges of transport rates and particle sizes as would be en- countered at different measuring sites. In the present study, a simple tra- ditional method has been used to calibrate the bed-load sampler in a lab- oratory flume. The method is based on conducting a series of runs having different mean transport rates obtained by averaging all samples for each run. The sampling efficiency is derived from group means, which may lead to some degree of error in the sampling efficiency factor when this latter is dependent on the transport rate (nonlinear effect). However, the method is simple and adequate to obtain indicative results, as mentioned previously.
The flume tests related to the sampling efficiency of the Delft Nile sampler were performed at HSRI, in Egypt (Gaweesh 1993). The flume has a length of 26 m, a width of 1 m, and a depth of i m and is operated as a sand-feed system. The sand bed (0.2-m thickness) was placed on the flume floor along a test section of 20 m. A sand trap was located at the downstream end of the flume to collect the transported sand during the run time. An amount of sand per unit time, as determined from the transport rate, was contin-
1368

uously washed into the flume at the entrance section by means of a container ending in three tubes (with an inner diameter of 0.02 m) at about 0.2 m above the bed. Flow discharges up to about 0.26 ma/s could be delivered, by a pump, into the flume inlet. A tail-gate was located downstream of the sand trap, which can be adjusted to attain a preselected flow depth. The sampler was raised and lowered with a pulley chain at a fixed sampling section located at the middle of the test reach. The flume was provided with glass side walls to facilitate visual observations.
The sampling efficiency was determined by means of a series of tests, where different flow velocities (transport rates) and different sizes of bed material with Dso ranges between about 300 p,m and 1,000 Ixm and geometric standard deviation ranges between about 1.5 and 2.0 were considered. The sampler has been tested for different sampling periods of 1, 3, 5, 10, and 15 min. The maximum sampling period, in each test, was selected so as to obtain samples that would not fill more than 50% of the capacity of the sampler bag. In each test, bed-load sampling was started after a reasonably stable (equilibrium) flow condition had been reached. An equilibrium con- dition was assumed to be established when the water surface and bed slope along the test section remained about the same over time and the mass of sand in the feeding and trap system was more or less equal. Usually, this condition was reached after about 80-100 hr of flume operation.
The total-load transport rate determined from the time-averaged mass (of dry sand) of the feed and trap system was used as an estimate of the actual time-averaged total-load transport rate (qt). The difference between the actual total-load transport rate (t~,) and the time averaged suspended- load transport rate (q~), as determined from (1), was used as an estimate of the actual time-averaged bed-load transport rate (qb = el, -- Ci~)- This value is compared with the time-average bed-load transport rate (qb,m) mea- sured by the sampler.
The suspended load was relatively small during the tests (maximum about 30% of total load, see column 8 in Table 2).
The individual measured bed-load transport rate (glb.m) per unit width measured by the sampler (in kg/s/m) is calculated as
qb.m = ( G s - Go)/bt (2)
in which Gs = dry mass of individual sand catch (kg); Go = dry mass of sand catch related to initial and scooping effect; determined during a "zero" sampling period (instantaneous sampling); the sampler was lowered to the bed and immediately raised after the nozzle had touched the bed (kg); b = width of the sampler nozzle (m); and t = sampling period (s).
The mean of Go-values was determined, in each test, by taking 30 "zero" samples and was found to be in the range of 6-35 g, during the tests.
In each test, individual bed-load samples (with the same sampling period) were collected consecutively throughout the run time. The total sampling time of the individual samples collected during each test was more or less constant. The time-averaged bed-load transport rate (qb,,~) measured by the sampler was determined based on statistical analysis of moving averages, which essentially smoothed out the fluctuations of the individual bed-load transport rates.
The sampling efficiency factor (~) of the Delft Nile sampler was deter- mined as
= qb,m/qb (3)
1369

TA
BL
E 2
. S
ampl
ing
Eff
icie
ncy
Fact
or o
f D
elft
Nile
Sam
pler
Bas
ed o
n Fl
ume
Test
s
Bed
mat
eria
l siz
e M
ean
flow
S
ampl
ing
Per
cent
age
of
Sam
plin
g Te
st
(Ds0
) ve
loci
ty
Flow
dep
th
Mes
h si
ze b
ag
perio
d N
umbe
r of
be
d lo
ad
effic
ienc
y fa
ctor
nu
mbe
r 0x
m)
(m/s
) (m
) (~
m)
(min
) sa
mpl
es
(%)
(a)
(1)
(2)
(3)
(4)
(5)
(6)
(7)
(8)
(9)
..,4
o
1 1 1 2 2 2 4 4 4 5 5 5 6 6 6 7 7 8a
8a
8a
8b
8b
8b
9 9 9 10
10
10
11
11
11
426
426
426
622
622
663
280
280
327
1070
1070
0.43
0.47
0.51
0.55
0.58
0.61
0.45
0.45
0.57
0.59
0.64
0.48
5
0.44
5
0.41
0
0.46
5
0.44
5
0.42
0
0.50
0
0.50
0
0.42
0
0.41
0
0.37
0
250
250
250
250
250
250
250
150
150
250
250
5 10
15
5 10
15 3 5 10 3 5 10
3 5 10 1 3 3 5 10 3 5 10 3 5 10 3 5 10 3 5 10
65
40
30
90
45
30
100 60
30
10
0 60
30
1130
60
30
30
0 10
0 10
0 60
30
10
0 60
30
100 60
30
10
0 60
30
10
0 60
30
97
97
97
99
98
98
75
75
73
100
100
0.91
0.
85
0.68
1.
34
1.03
1.
23
0.85
0.
88
0.81
0
.~
0.89
1.
12
0.76
0~
82
0.96
0.
62
0.98
1.
06
1.38
0.
96
1.52
1.
34
1.32
1.
56
1.84
1.
29
0.78
0.
89
1.06
0.
72
0.87
0.
97

in which t~ = sampling efficiency factor of the Delft Nile sampler; C]b.,, = mean bed-load transport rate per unit width measured by the sampler (kg/ s/m); and C]b = actual time-averaged bed-load transport rate per unit width (kg/s/in).
Results Visual observations showed that in nearly all measurements a perfect
contact between the lower edge of the sampler nozzle and the bed was achieved. Small scour holes (gaps) were, however, generated at the corners of the sampler nozzle within a period of 2 or 3 min after the nozzle had touched the bed. The largest part of the scour holes was located just down- stream of the nozzle entrance. During all samplings, bed forms (ripple-type and/or dune-type) were present. The measured mean bed-form height, throughout the tests, varied between 0.02 m and 0.10 m and the mean bed- form length varied between 0.15 m and 1.40 m. The basic data of bed forms and sediment transport rates measured in the flume are given in Table 1.
In each test, all bed-load samples (of the same sampling period) were separately dried, weighed and then put together to obtain a bulk sample for particle size analysis. This was compared with the particle size analysis of the bed material used in the flume. Comparison of the D10, Dso, and 090 values of the bed material and bed-load samples, of each test, shows close agreement. In all tests, the overall average values of the particle size of bed-load samples were about 2 -8% smaller than those of the bed material samples, indicating representative sampling of the Delft Nile sampler.
The results of the sampling efficiency factor (a) are presented in Table 2. For bed material with Ds0 larger than 400 txm and sampling periods of 3-10 min, the sampling efficiency factor (a) was generally found to be somewhat less than 1.0, see Fig. 2. This is due to the presence of small
i . O
_o .9.o =. O~ c
E n
u )
2 . 0 ~
1.8-
1.6-
1.4-
1,2-
1 . 0
0.8-
0 . 6
0 . 4
0 . 2
0 . O 2O0
§ +
-+ o
+ []
f
~o ~o ~o ~o 76o ~o 9o0 looo
D []
+*
1100
Median particle diameter of bed matedal (pm)
FIG, 2. Sampling-Efficiency Factor of Bed-Load Sampler versus Median Particle Diameter of Bed Material (Based on Different Sampling Periods)
1371

scour holes (visual observations) at one or both corners of the sampler nozzle, which reduces the effective sampling width of the nozzle entrance. The scour holes were extremely small for particle sizes larger than 600 I~m. The sampling period of 3 min generally gives a relatively small sampling efficiency factor between 0.7 and 0.9, which may be attributed to the initial effect. The sampling period of 10 min gives a sampling efficiency factor of about 1.0, probably because the initial effect is almost negligible with respect to the sampling period. For bed material with Ds0 < 400 Ixm and sampling periods of 3-10 min, the sampling efficiency factor (a) was generally found to be between 1.0 and 1.8. Visual observations showed that the sampler nozzle sank into the (loose) bed for only few millimeters giving no chance for scour holes to develop. This will consequently cause the sampling effi- ciency factor to be greater than 1.0. For such type of bed material (D50 < 400 p~m) further research needs to be carried out, especially in case of dominating suspended load transport.
Based on the flume data of bed material with Ds0 larger than 400 Ixm, a sampling efficiency factor of about 0.9 seems to be most appropriate. How- ever, taking all uncertainties into acocunt a sampling efficiency factor of 1.0 is recommended to be used in field conditions. For finer materials a sampling efficiency factor of about 1.5 is recommended to be used at present stage of research. The sampling period should not be shorter than 3 min in the lower flow regime with mean flow velocities up to 1.3 m/s to obtain sufficiently large samples. In the upper flow regime smaller sampling periods may be used.
Finally, it is stated that the calibration results based on the flume data should be interpreted as indicative rather than as absolute. For example, visual observations during the flume tests always showed a good contact between the nozzle entrance and the sand bed, whereas in nature occa- sionally small gaps were observed due to the presence of small irregularities of the bed (gravel, small stones, etc.). Furthermore, the bed forms in the flume are relatively small compared to those in nature (scale effect). Field calibration, although difficult and expensive, remains necessary.
SAMPLING STATISTICS IN FIELD CONDITIONS
General Aspects The bed-load transport passing a cross section of a river usually is mea-
sured by sampling in a number of subsections over the width of the river. The cross-section integrated bed-load transport rate can be approximated by
Qb = ~ (0b,iAW,) + g (4) i = 1
in which Qb = cross-section integrated bed-load transport; qb,i = bed-load transport in subsection i; Aw, = width of subsection i; m = number of subsections; and ~ = interpolation error (8 ~ 0 for m---~ oo), which is related to the representation of a smooth curve by means of a series of line segments.
The interpolation error depends on the number of subsections and on the width of each subsection across the river. The bed-load transport passing a subsection is measured by taking samples at a representative station in each subsection. When large-scale bed forms are present at that station, samples should be taken at different locations along the bed-form length to account for the variability of the transport processes. Bed-load transport is
1372

maximum near the bed-form crest (high velocities) and minimum near the trough of the bed form (low velocities). The inaccuracy of the cross-section integrated bed-load transport rate can be estimated by assuming that ~lb,i and Awi are independent stochastic variables having a normal Gaussian distribution, resulting in
(oo 2 _1 --~ I = m L \ -~ I + \ a w l J + -~ (5)
in which ~ = standard deviation. Thus, the relative error of the cross-section integrated transport rate (Qb)
depends on the: (1) Variability of the bed-load transport in a subsection as expressed by (crqb); (2) variability of the width of the subsection (Crqb); and (3) number of subsections (m) and the corresponding interpolation error (~).
The variability of the bed-load transport process related to the presence of bed forms at a certain station has been studied by performing measure- ments in two major rivers: the Nile river, in Egypt, and the Rhine river, in The Netherlands. The number of subsections required over the width of the river and the associated interpolation error was studied by performing numerical computations based on measured flow velocities and the transport formula of Engelund and Hansen (1967) for some cross-sections of the Nile river,
Field Conditions The bed-load transport measurements in the Nile river, in Egypt, were
carried out in a cross section located approximately 4 km upstream of the town of Bani Mazar (200 km south of Cairo) (Gaweesh 1991, 1992). At that location, the cross section consists of a major left channel (width of about 200 m, maximum depth of about 5 m) and a minor right channel (width of about 200 m, maximum depth of about 2 m). The channels are separated by a shallow area (width of about 180 m). The bed-load transport measurements were performed in the deepest part of the left channel. The bed consisted of sand with a median particle diameter of about 450 p.m. Sand dunes with a mean height of about 0.2 m and a mean length of about 20 m were observed from echo sounding recordings. The water surface was determined from local gauge readings. The observed water surface levels did not change during the measuring period. The basic data are given in Table 3.
The measurements in the Rhine river, in The Netherlands, were carried out in two cross sections: near the villages of Woudrichem and Druten (Van Rijn 1991, 1992). The cross section near Woudrichem is located in the lower reach of the river where the influence of the tide is just noticeable (tidal range of about 0.20 m). Therefore, the water surface slope was not mea- sured. The width of the river near Woudrichem is about 350 m. The max- imum water depth was about 6 m. The bed consisted of sand with median particle diameters in the range of 500 to 900 p.m. The local bed forms consisted of megaripples with a mean height of 0.2 m and mean length of 5m.
The cross section near Druten is about 200 km upstream of the river outlet in the North Sea. The river width near Druten is about 300 m. The maximum water depth was about 6 m. The bed forms consisted of dunes with mean height of about 0.8 m and mean length of about 70 m. The basic data are given in Table 3.
1373

TAB
LE 3
. H
ydra
ulic
and
Sed
imen
t Tr
ansp
ort
Dat
a M
easu
red
in N
ile a
nd R
hine
Riv
ers
..q
Riv
er
Sta
tion
(1)
(2)
Nil
e B
ani
Maz
ar
Nil
e B
ani
Maz
ar
Nil
e B
ani
Maz
ar
Nil
e B
ani
Maz
ar
Nil
e B
ani
Maz
ar
Nil
e B
ani
Maz
ar
Rh
ine
Wo
ud
rich
em
Rhi
ne [
Wo
ud
rich
em
Rh
ine
! Wo
ud
rich
em
Rh
ine
Wo
ud
rich
em
Rhi
ne
Wo
ud
rich
em
Rhi
ne
Wo
ud
rich
em
Rh
ine
! Wo
ud
rich
em
Rhi
ne
Wo
ud
rich
em
Rh
ine
Dru
ten
R
hin
e D
rute
n
Rh
ine
Dru
ten
R
hine
i D
rute
n
Wat
er
Mea
n de
pth
velo
city
D
ate
(m)
(m/s
) (3
) (4
) (5
)
11-1
8-91
3.
9 0.
90
11-1
9-91
3.
9 0.
89
11-2
0-91
4.
0 0.
92
11-2
1-91
4.
0 0.
90
5-26
-92
5.6
0.84
5-
28-9
2 5.
7 0.
85
6-3/
7-91
4.
5 0.
45
6-7/
7-91
4.
5 0.
60
6-28
-91
4.9
0.82
4-
6-92
4.
7 0.
96
4-7-
92
5.2
0.93
4-
8-92
5.
8 0.
97
4-9-
92
6.7
1.03
4-
10-9
2 7.
4 0.
93
5-18
-92
6.1
1.15
5-
19-9
2 5.
5 1.
20
5-20
-92
5.0
1.25
5-
22-9
2 4.
8 1.
30
Effe
ctiv
e W
ater
be
d su
rface
ro
ughn
ess
slop
e (m
) (6
) (7
) 8
x 10
s
0.08
8
x 10
-5
0.09
8
x 10
5
0.07
8
x 10
s
0.09
8
x 10
5
0.40
8
x 10
-5
0.40
0.
05
0.05
0.
05
0.30
0.
10
0.30
0.
10
0.20
11
•
10
s 0.
30
1t
x 10
-5
0.20
11
x
10
s 0.
20
11
x 10
-5
0.20
Par
ticle
Siz
e
Dso
D
go
(l~m
) (~
m)
(8)
(9)
405
945
390
890
445
1,03
5 48
5 t,
165
45
5 1,
070
445
1,00
5 52
5 71
5 52
5 71
5 52
5 71
5 53
0 91
5 50
5 90
0 52
5 90
5 71
5 1,
285
915
1,45
0 75
5 1,
145
720
1,27
0 80
5 1,
460
725
1,38
0
Bed
-Loa
d Tr
ansp
ort
Var
iatio
n M
ean
coef
ficie
nt
(kg/
s/m
) (%
) (1
0)
(11)
23
• 10
-3
20
17
x 10
-3
15
9 •
10 -
3 20
16
•
10 -
3 10
21
x
10 -
3 20
19
x
10 -3
15
2
x 10
-3
25
5 •
10 -
3 17
31
x
10 -
3 20
51
x
10 -
3 10
49
x
10 -
3 10
45
x
10 -3
10
51
•
10 .3
12
41
x
10 .3
10
50
x
10 .3
12
82
x
10 -
3 10
67
x
10 -
3 10
8
0
• 1
0 -
3
12
Num
ber
of
loca
tions
N
umbe
r S
ampl
ing
alon
g be
d of
pe
riod
form
sa
mpl
es
(s)
(12)
(1
3)
(14)
5 24
30
0 5
40
180
1 24
30
0 1
40
180
5 50
18
0 5
50
60
4 40
30
0 7
70
300
1 24
30
0 5
40
180
5 40
18
0 5
40
180
5 40
18
0 5
40
180
5 40
18
0 5
40
180
5 40
18
0 5
40
180

Instrumentation and Measuring Procedure The Delft Nile sampler was used to collect bed-load samples in both
rivers. Two small propeller meters were attached to the sampler to measure the current velocities at 0.15 m and 0.5 m above the bed. During the mea- surements in 1992 an underwater video camera connected to a monitor was installed in front of the sampler nozzle to observe the sampling process. A separate instrument equipped with a propeller meter and an echo sounder for depth determination was used to measure the flow velocities at 1 m, 2 m, 3 m, 4 m, and 5 m, above the bed and near the water surface. Suspended- sediment samples were not collected. A grab sampler was used to collect bed-material samples.
To study the variability of the bed-load transport processes along a bed form at a certain station, first the mean bed-form length was determined from echo-sounding recordings (in longitudinal direction) and then mea- surements were performed at five locations distributed equally along the bed-form length. The number of samples collected and the duration of each sampling are given in Table 3.
The complete measuring procedure at each location consisted of taking the following:
�9 10 "zero"-samplings �9 Eight to 10 bed-load transport samPlings (including video record-
ings) �9 Two velocity measurements at 0.15 m at 0.5 m above the bed during
each bed-load measurement �9 Five or six separate velocity measurements, at 1, 2, 3, 4, and 5 m
above the bed and near the water surface �9 Two bed material samples
Generally, the completion of this measuring procedure took about 1-1.5 hr at each location. The bed-load samples were dried and weighed and then put together to make a bulk sample for sieve analysis to be compared with that of the bed material samples. The measured velocity profiles were used to compute the local depth-averaged velocity. The velocity profile data were also analyzed by fitting a logarithmic velocity function (Van Rijn 1990) to determine the effective bed roughness (ks), see Table 3.
The actual bed-load transport rates (~]b) have been computed by (2) and (3) using a sampling efficiency factor of a = 1.0 for the Nile and Rhine rivers (bed material larger than 400 ~m).
Variability of Bed-Load Transport in Subsection A part of the variability of the bed load (samples) is inherently caused
by using a mechanical sampler, which interferes with the physical processes. These instrumental effects were analyzed by means of the video recordings corresponding to the bed-load catches.
The video recordings clearly showed the presence of the initial effect. When the sampler nozzle touches the bed, sediment particles are stirred up and are then trapped into the sampler nozzle. On the average, the initial effect results in a relatively small catch (sample) of about 20-40 g, which should be subtracted from the bed-load catches. To reduce the errors in- volved, the sampling period must be so long that the bed-load catch is relatively large compared to the initial catch (G, > > Go). The scooping
1375
sampler nozz le
O) Type 2 (c) Type 3
(e) Type 5 (d) Type 4
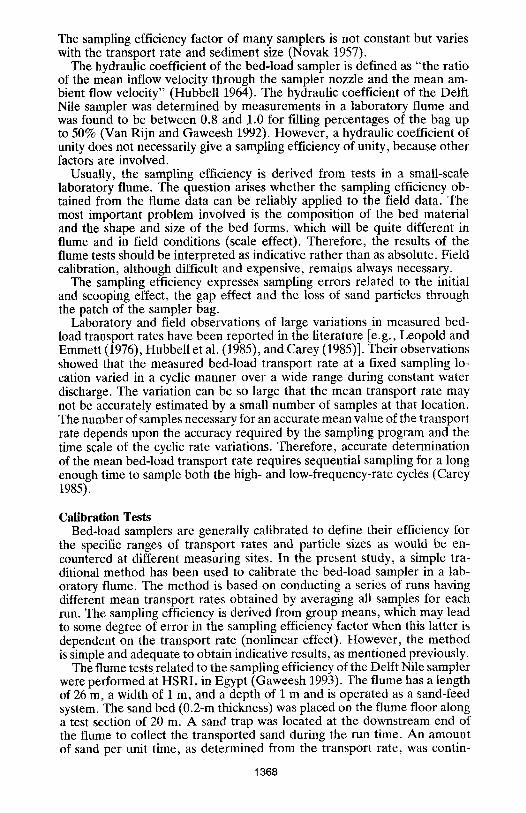
FIG. 3. Types of Bed-Load Samplings (Front View)
effect was never observed under condit ions with mean flow velocities up to 1.3 m/s.
According to the visual observat ions , five types of samplings can be dis- tiguished; the characterist ics of these five types are as follows (see also Fig. 3).
Type 1
�9 Initial gap at one (or two) corners �9 Gap size increases due to scour �9 Big gap at end of sampling t ime �9 Very small t ransport rate �9 Very small catch
Type 2
�9 Good initial contact �9 Scour gap develops at one (or two) corners �9 Sometimes big gap at end of sampling t ime �9 Small t ransport rate �9 Small catch
Type 3
�9 Good initial contact �9 No scour at corners �9 Bed remains flat �9 Medium t ranspor t ra te �9 Medium catch
Type 4
�9 Lower edge of sampler entrance sinks into bed (about 5 mm) �9 No scour at corners (if gap develops, it is refil led) �9 Approach ing ripples (sometimes) �9 High t ranspor t rate �9 Big catch
1376
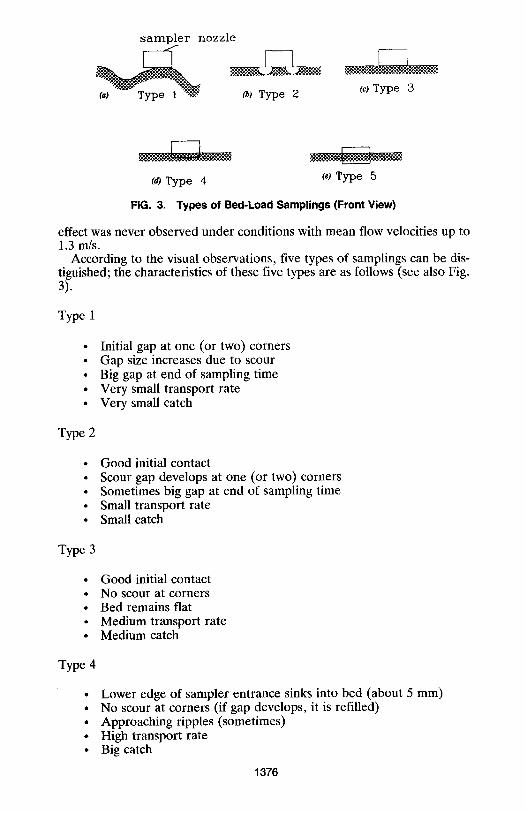
Type 5
�9 Lower edge sinks into (downsloping) bed 2 - 4 cm) �9 No scour �9 Bed is loose (sample probably taken at lee-side slope of dune) �9 Low transport rate �9 Medium to big catch (relatively coarse material)
The type 1 and type 5 sampling are incorrect samplings related to the inevitable shortcomings of a mechanical sampler. Type 1 samples tend to underestimate the transport rate, whereas type 5 samples tend to overes- timate the transport rate. Both types of samplings did occur occasionally in field conditions (percentage of occurrence of about 10%), but they were hardly observed in flume conditions because the bed-form variability in a flume is less pronounced. The available visual information complicates the detemination of the mean bed-load transport rate because not all samplings are correct. To study the relative errors involved, three methods were used to compute the mean bed-load transport rate, as follows: (1) Method A: all samples are used; (2) Method B: all type 1 and type 5 samples are excluded; and (3) Method C: the 10% biggest samples and the 10% smallest samples are excluded.
The measured transport rates according to method A, B, and C are given in Table 4. The maximum differences between the three methods are about 25%. Method B is the most accurate method because all visual information are taken into account. The disadvantage of method B is that the use of a video camera is required, which is not always available. Furthermore, the video camera cannot be used in silty conditions, because of poor visibility conditions. Therefore, method C is preferred as a more general method. The bed-load transport rates given in Table 3 are based on method C. In all cases the difference between the results of method A and C was smaller than 10%. Generally, method C yields smaller transport rates compared to method A and B.
The variability of individual bed-load transport rates at one location (No- vember 21, 1991, Nile river) and at five locations (May 28, 1992, Nile river) along a bed form has been investigated. The data of November 21, 1991, when 50 samples at one location were taken, did not show significant var- iations. The data of May 28, 1992, when 10 samples at each of five different locations were taken, show considerable variability (see Fig. 4). Cyclic pat- terns can be observed in the figure, which is most probably related to the migration of small-scale bed forms. Low transport rates can be observed at location 1, which may have occurred near the trough region of a dune; high transport rates can be observed at location 5, which may have occurred near
TABLE 4, Bed-Load Transport Rates Measured in Nile River According to Meth- ods A, B, and C
Method (1)
Bed-Load Transport Rate (kg/s/m)
May 26, 1992 (2)
May 28,1992 (3)
A 26 x 10 -3 26 • 10 -3
B 18 x 10 -3 23 x 10 -3
C 21 x 10 -3 19 :x 10 -3
1377

i s~ / I= 140~
1300 ~ bed load '
r 1
0 5 10 15 20 25
velocity
3O
28 / 5 / 1992
1.o
f o.9
0.8
0.7
-0.6
-0.5
-0.4
"-0.3
-0.2
-0.1
0.0 3~5 40 ,~5 50
Loc. 1 Loc. 2 Loc. 3 Loc. 4 Loc. 5
r
r J:
br~
r _=
Sample Number
FIG. 4. Individual Bed-Load Transport Rates and Flow Velocities at 0.15 m above Bed, Measured at Five Locations (on May 28, 1902), in Nile River at Bani Mazar
the dune crest. Fig. 4 shows individual transport rates and velocity mea- surements at 0.15 m above the bed at 5 locations on May 28, 1992. A clear relationship between the velocities and the transport rates cannot be ob- served. This may be attributed to the lateral and vertical distance between the location of the propeller meter (velocity) and the sampler nozzle (bed load). The overall distance of about 0.2 m between the propeller meter and the sampler nozzle seems to be too large to find a good correlation.
The variability of the mean bed-load transport rate at five locations along the bed form is shown in Fig. 5. The ratio of the local mean transport rate and the overall mean transport rate is presented. The maximum deviation from the overall mean transport rate is about ___ 50%, which means that the overall mean transport rate may be over or underestimated by about 50% when only one location along a bed form is selected.
The measured bed-load transport rates were used to determine the var- iation coefficient (vc) defined as:
Or
v c - IxX/N (6)
in which o- = standard deviation of measured transport rates using N sam- ples; and Ix = arithmetic mean value of measured transport rates using N samples.
Fig. 6 shows the variation coefficients as a function of the number of samples. In the Nile river about 40 samples distributed over five locations along a bed form are necessary to bring the variation coefficient down to 0.2, which means that the measured mean transport rate differs not more than _+ 20% from the actual mean transport rate. In the Rhine river about 20 samples are necessary to bring the variation coefficient down to 0.2.
The envelope curve for all data (see Fig. 6) can be used to get an estimate
1378

2.0
~-1.5
E
~1.0 O-
~0.5 O_
r 0
0 I
0 O - 2 . 0 I1)
c 1.5
~ 1.0
0 - e O . 5 �84 C C~
C 0
E
2.0 0
0 1.5
0
0
1.0
0.5
0
I t Rhine River, 6,7,8,9,10 april 1992
..-...-~':."Zq'----" """: ~';-.,-~<:~-~q .;, J . . ~ " ~ ' = ' , ..... ":
(a)
2 3 4 ~.- locat ion along bed form
I I Rhine River, 18,19,20,22 may 1992
5
./I.-'.-'L : " "
,~
, J
2 5 4 5 ~ . location along bed form
Nile River, ~176176176176176
o.~176 ~ -"-~176 ,..~.;~,.-" "-,,. ........ "~' ~ " " ' . ,
(c)
18,19 november 1991, 26,28 may 1992
�9 ~ .,~ "~ ~
"'o~ i .'"
2 3 4 5 locat ion along bed form
FIG. 5. Relative Transport Rates Measured at Different Locations along Bed Form
1379

0.7
0.6
0.5
0.4
0.3
0.2
0.1
0 0
26.05.92 &
28.os.92 XX 1 8 . 1 1 . 9 1 . . 2 x "~ t ~ 20 11 91 ,.,.....t~. . . . .
21.11.91 ~
envelope
2-_.---:---:
Nile River
curve (all data)
i f + + - ~ . i . . . . I . . . . . . . . . . . . . 4 . . . . . . . . . . i ~
10 20 .30 40 number of samples in a sub-sect ion -E
0.5 \ (D 9.04\ o 0.4 o \
,o.+~,\
'~_ ,+.o+, ' \ \ \ ~> 0.2 ~','\k
8.04". \ "..". "~.~ l ,<..,,~ ,,,...-. I :<.
O. 1 ~:0+\.'
50
1 I I Rhine River, Woudrichem april 1992
�9 ..o:
envelope curve (all dato)
L
F- ' - ' - - -
0 20 30 40 number of samples in o sub-sect ion
0.3
0.2 l&OSx, l!A \ .~?.
12,0 t \. @. 1 :o, og
0~) 10
\ .y ._ :------..,
50
envelope curve (all data)
. " ~ - ~ . . . ~ ~
: . 7 . s . 2 .2 ........ ~ " �9 ~ 2.'~.~.~.22..~2 ~ I " ~
~ ~ ; ' 2 . . . . . . . . . . . . . . . . . . , _ I
" T - - . . . . . F- . . . . . Rhine River, Druten may 1992
I I 20 30 40 50
number of samples in o sub-sect ion
FIG. 6. Variation Coefficient as Function of Number of Samples
of the relative error [~rq+lqb; see (5)] of the mean bed- load t ransport rate at a certain subsection. Using the p roposed measuring procedure , con- sistent results are obtained. This can be shown by comparing the t ranspor t rates measured on different dates at the same location. In all cases the maximum deviat ion from the mean value is not more than about 20% (May 26 and 28, 1992 at Bani Mazar; Apr i l 6 - 8 , 1992 at Woudr ichem, see Table 3).
1380
100 Relative interpolation error (%)
10
1 0 2 4 6 8 10 12 14 16 18 20 22 24 26 28 30 32 34 36 38 40
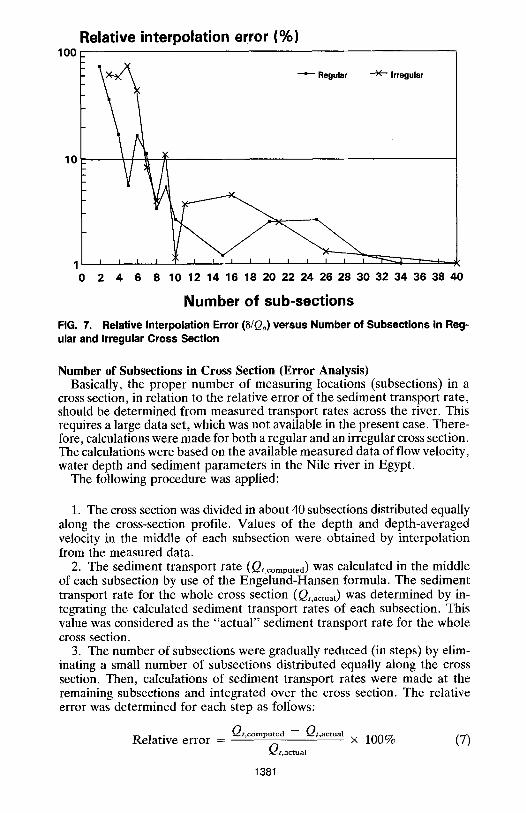
Number of sub-sections FIG. 7. Relative Interpolation Error (5/Qb) versus Number of Subsections in Reg- ular and Irregular Cross Section
Number of Subsections in Cross Section (Error Analysis) Basically, the proper number of measuring locations (subsections) in a
cross section, in relation to the relative error of the sediment transport rate, should be determined from measured transport rates across the river. This requires a large data set, which was not available in the present case. There- fore, calculations were made for both a regular and an irregular cross section. The calculations were based on the available measured data of flow velocity, water depth and sediment parameters in the Nile river in Egypt.
The following procedure was. applied:
1. The cross section was divided in about 40 subsections distributed equally along the cross-section profile. Values of the depth and depth-averaged velocity in the middle of each subsection were obtained by interpolation from the measured data.
2. The sediment transport rate (Q ..... putea) was calculated in the middle of each subsection by use of the Engelund-Hansen formula. The sediment transport rate for the whole cross section (Q,,~ctual) was determined by in- tegrating the calculated sediment transport rates of each subsection. This value was considered as the "actual" sediment transport rate for the whole cross section.
3. The number of subsections were gradually reduced (in steps) by elim- inating a small number of subsections distributed equally along the cross section. Then, calculations of sediment transport rates were made at the remaining subsections and integrated over the cross section. The relative error was determined for each step as foliows:
Qt,computed- Qt,actual Relative error = x 100% (7)
Qt, actual
1381

Overall relative error (%) of cross-section integrated bed-load transport
100
Number of bed-load samples in a sub-section l 5 " " ~ " " 50 |
J
�9 " % 4 ~ ............................ § ......................
. . . . . . . . . . , ~ . . . . . . . . . . . . . . . . . . . . . . . . . . . . . . . . . . . - . . . . . . . . . . . . . . . . . . . .
1 i i ~ i i p i i i i i i L i i i i E i i i i i ~ i ~ i i i i i i ~ i i i i i i
2 4 6 8 10 12 14 16 18 20 22 24 26 28 30 32 34 36 38 40
Number of sub-sections
FIG. 8. Overall Relative Error (~Qb/Qb) of Cross-Section Integrated Bed-Load Transport versus Number of Subsections in Irregular Cross Section
4. The relation between the relative error of the sediment transport rate and the number of subsections for a regular and an irregular cross section were plotted, as shown in Fig. 7.
As can be observed in Fig. 7, the relative interpolation error is less than 20% for seven subsections.
Overall Error of Cross-Section Integrated Bed-Load Transport Based on (5), the overall relative error of the cross-section integrated
bed-load transport (tro/Qb) was computed assuming a conservative value of traw/AW = 0.05, trq/glb as given by the envelope curve of Fig. 6 and ~/Qb as given by the curves of Fig. 7. To be on the safe side, the m-parameter in (5) was replaced by the square root of m. The results are shown in Fig. 8. To reduce the relative error to about 20%, the (irregular) cross section should be divided in about seven subsections and about 25 samples distrib- uted along the bed-form length should be taken in each subsection. This results in a total amount of 175 samples, which can be collected in about 4 days.
CONCLUSIONS
Based on the flume data, the sampling efficiency factor of the Delft Nile sampler was found to be about 1.0 for bed material with Ds0 larger than about 400 Ixm and about 1.5 for bed material with Ds0 smaller than about 400 Ixm:
Based on visual observations of the bed-load sampling process, five types of samplings were distinguished. The type 1 and type 5 samplings are in- correct samplings related to the shortcomings of the mechanical sampler.
1382

Both types of samplings did occur occasionally. A computation method was proposed to eliminate the effect of the incorrect samplings.
The sampling period should not be less than 3 min in the lower flow regime with mean flow velocities up to 1.3 m/s to obtain sufficiently large samples. In the upper flow regime smaller sampling periods may be used. The volume of the sample should not be more than 50% of the volume of the sampler bag.
The variability of the bed-load transport rate at different locations along a bed form (dune) is quite large. High transport values may occur near the bed-form crest and small transport values may occur near the trough. In the Nile river about 40 samples distributed equally over five locations are necessary to reduce the relative error of the mean bed-load transport rate to about 20%. Taking samples at only one location, may result in an error of about 50%.
The overall relative error of the cross-section integrated bed-load trans- port rate depends on the relative error of the mean bed-load transport rate in a subsection, the number of subsections in a cross section, the type of cross section (regular or irregular) and the relative interpolation error. To reduce the overall relative error to about 20%, the (irregular) cross section should be divided in about seven subsections and about 25 samples distrib- uted equally along the bed-form length should be taken in each subsection.
Future research will be aimed at measuring and analyzing the cross-section integrated bed-load transport rate and suspended-load transport rate at various cross sections along the Nile river, in Egypt.
ACKNOWLEDGMENTS
The laboratory and field facilities in this research were provided by the Hydraulics and Sediment Research Institute, Delta Barrage (Egypt), in close cooperation with Delft Hydraulics (The Netherlands), within the framework of the Netherlands Technical Assistance Project. The writers would like to express their sincere appreciation to all the engineers, technicians, and laborers who have worked and assisted throughout this research program. Eng. Ahmed. M. Amin of HSRI is especially acknowledged for his valuable assistance in the laboratory and field investigations.
The field survey departments of Direktie Zuid-Holland van Rijkswater- staat, at Dordrecht, and Direktie Gelderland van Rijkswaterstaat, at Arn- hem, The Netherlands, are gratefully acknowledged for providing boat fa- cilities to perform measurements in the Rhine river.
APPENDIX. REFERENCES
Bagnold, R. A. (1966). "An approach to the sediment transport problem from general physics." U.S. Geological Survey Profl. Paper 442-1, U.S. Geological Survey, Washington, D.C.
Carey, W. P. (1985). "Variability in measured bedload transport rates." Water Re- sour. Bull., 21(1).
Einstein, A. H. (1937). "Die Eichung des im Rhein Verwendeten Geschiebefangers." Schweizer, Bauzeitung, 110(12) (ih German).
Emmett, W. W. (1980). "A field calibration of the sediment-trapping characteristics of the Helley-Smith bedload sampler." U.S. Geological Survey Profl. Paper 1139, U.S. Geological Survey, Washington, D.C.
Englund, F., and Hansen, E. (1967). A monograph on sediment transport in alluvial streams. Teknisk Vorlag, Copenhagen, Denmark.
1383

Gaweesh, M. T. K. (1992). "Measurements of sediment transport in the Nile river at Bani-Mazar with the Delft Nile sampler." Rep., HSRI, Delta Barrage, Egypt.
Gaweesh, M. T. K., and Van Rijn, L. C. (1992). "Laboratory and field investigation of a new bed load sampler for rivers." Proc., 2nd Int. Conf. on Hydr. and Envir. of Coast., Estuarine and River Waters, Vol. 2, Bradford, England.
Gaweesh, M. T. K. (1993). "Calibration of the Delft Nile sampler at HSRI Flume." Rep., HSRI, Delta Barrage, Egypt.
Helley, E. J., and Smith, W. (1971). "Development and calibration of a pressure- difference bed-load sampler." U.S. Geological Survey Open-File Rep., U.S. Geo- logical Survey, Menlo Park, Calif.
Hubbell, D. W. (1964). "Apparatus and techniques for measuring bed-load." U.S. Geological Survey Water-Supply Paper 1748, U.S. Geological Survey, Washington, D.C.
Hubbell, D. W., Stevens, H. H., Skinner, J. V., and Beverage, J. P. (1985). "New approach to calibrating bed-load samplers." J. Hydr. Engrg., ASCE, 111(4).
Leopold, L. B., and Emmett, W. W. (1976). "Bedload measurements, East Fork, River, Wyoming." Nat. Academy of Sci. Proc., 73(4).
Novak, P. (1957). "Bed load meters--development of a new type and determination of their efficiency with the aid of scale models." Trans., 7th General Meeting, International Association of Hydraulic Research (IAHR), Vol. 1, Lisbon, Por- tugal.
Van Rijn, L. C. (1984). "Sediment transport. Part 1: bed-toad transport." J. Hydr. Engrg., ASCE, 110(10).
Van Rijn, L. C. (1992a). "Database sand concentration profiles and sand transport for currents and waves." Rep., Delft Hydraulics, Delft, The Netherlands.
Van Rijn, L. C. (1993a). "Manual sediment transport measurements." Rep., Delft Hydraulics, Delft, The Netherlands.
Van Rijn, L. C. (1990). Principles of fluid flow and surface waves in rivers, estuaries, seas and oceans. Aqua Publications, Amsterdam, The Netherlands.
Van Rijn, L. C. (1991). "Bed-load transport measurements in the River Waal." Rep. Q 1300.02 Part 1, Delft Hydraulics, Delft, The Netherlands.
Van Rijn, L. C. (1992b). "Bed-load transport measurements in the River Waat near Woudrichem and near Druten." Rep. Q 1300.02 Part 2 and Part 3, Delft Hy- draulics, Delft, The Netherlands..
Van Rijn, L. C. (1993b). Principles of sediment transport in rivers, estuaries, coastal seas and oceans. Aqua Publications, Amsterdam, The Netherlands.
Van Rijn, L. C., and Gaweesh, M. T. K. (1992). "A new total sediment load sampler." J. Hydr. Engrg., ASCE, 118(12).
1384