Deployment of a threshold activated pump sampler in an industrial shock load impact study
13
Hydrobiologia 344: 181–193, 1997. 181 c 1997 Kluwer Academic Publishers. Printed in Belgium. Deployment of a threshold activated pump sampler in an industrial shock load impact study Mike Dickman 1 & Frank Johnson 2 1 Ecology and Biodiversity Department, The University of Hong Kong, Pokfulam Road, Hong Kong 2 Ottawa Instrumentation Ltd., 169 Fifth Avenue, Ottawa, Ontario K1S 2M8, Canada Received 28 May 1996; in revised form 15 October 1996; accepted 10 December 1996 Key words: Shock load impacts, impacts of sporadic toxic discharges, threshold activated pump sampler, biological monitoring, riverine wetlands, macrophyte indicator assemblages, Daphnia magna, Notropis atherinoides, acute toxicity, chronic toxicity Abstract Shock loading of toxic substances into natural waterways is a pervasive practice which has substantial impacts on their biota. This paper describes the effects of shock (pulse) pollution loading from two major industries on a river and wetland system in southern Ontario, Canada. The assessment of shock loading frequency indicated that sporadic discharges of polluted water occurred on average once every other day during the 38 days of monitoring in the period April, 1986 to November, 1987. To estimate the frequency and intensity of the shock loads, an automatic pump sampler that was activated by a threshold conductivity was constructed and deployed. Samples were withdrawn from the river when the specific conductivity of the stream exceeded a threshold value of two times background. Background specific conductivity ranged between 200–250 S cm 1 . The impact of these shock load discharges on a downstream aquatic plant community in a Class One (Provincially Significant) wetland was examined. The area of Thompson’s Creek upstream of the Cyanamid Chemical Company displayed a normal complement of aquatic organisms while downstream of the company’s main discharges for a distance of nearly 2 km, the stream was barren of nearly all aquatic life. A reef-like structure in which nickel, chromium, and lead reached respectively 2900, 2100 and 2210 mg kg 1 dry weight of sediment was located in the Welland River near the outfall of the Atlas-Mansfield storm sewer adjacent to the Atlas Specialty Steels Company. The average flow rate at the outfall of the Atlas-Mansfield storm sewer into the Welland River was approximately 28400 m 3 day 1 in 1986 (MOE 1987). A small area referred to as the Atlas reef because of the high iron concentrations giving the sediments a cement-like condition, was devoid of all higher aquatic plants. Introduction Wetlands are among the most productive and the most threatened habitats worldwide (Euler, 1984). Of the two million hectares of presettlement wetlands found in southern Ontario, over 75% have been severely altered or have completely disappeared. Furthermore, wetland losses in southern Ontario are occurring at a rate of one to two percent a year (Euler, 1984). Wetlands are now receiving international recogni- tion, as demonstrated by the fact that over forty coun- tries are now adherents to the Ramsar Convention on Wetlands of International Importance (IUCN, 1980). In Southern Ontario, many of the wetland areas have been damaged or destroyed by rapid, unsustain- able development. Some have been destroyed by direct activities such as infilling for farmland or subdivi- sions while others have been impacted by industrial and domestic pollutants (Ontario Ministry of Natural Resources, 1984a). Two of the best remaining repre- sentative wetlands in the Niagara Peninsula are those found in the Welland River and Lyons Creek (Ontario Ministry of Natural Resources, 1984b; Brady, 1985).
Transcript of Deployment of a threshold activated pump sampler in an industrial shock load impact study
Hydrobiologia 344: 181–193, 1997. 181c 1997 Kluwer Academic Publishers. Printed in Belgium.
Deployment of a threshold activated pump sampler in an industrial shockload impact study
Mike Dickman1 & Frank Johnson2
1Ecology and Biodiversity Department, The University of Hong Kong, Pokfulam Road, Hong Kong2Ottawa Instrumentation Ltd., 169 Fifth Avenue, Ottawa, Ontario K1S 2M8, Canada
Received 28 May 1996; in revised form 15 October 1996; accepted 10 December 1996
Key words: Shock load impacts, impacts of sporadic toxic discharges, threshold activated pump sampler, biologicalmonitoring, riverine wetlands, macrophyte indicator assemblages, Daphnia magna, Notropis atherinoides, acutetoxicity, chronic toxicity
Abstract
Shock loading of toxic substances into natural waterways is a pervasive practice which has substantial impactson their biota. This paper describes the effects of shock (pulse) pollution loading from two major industries on ariver and wetland system in southern Ontario, Canada. The assessment of shock loading frequency indicated thatsporadic discharges of polluted water occurred on average once every other day during the 38 days of monitoringin the period April, 1986 to November, 1987.
To estimate the frequency and intensity of the shock loads, an automatic pump sampler that was activatedby a threshold conductivity was constructed and deployed. Samples were withdrawn from the river when thespecific conductivity of the stream exceeded a threshold value of two times background. Background specificconductivity ranged between 200–250 �S cm�1. The impact of these shock load discharges on a downstreamaquatic plant community in a Class One (Provincially Significant) wetland was examined. The area of Thompson’sCreek upstream of the Cyanamid Chemical Company displayed a normal complement of aquatic organisms whiledownstream of the company’s main discharges for a distance of nearly 2 km, the stream was barren of nearly allaquatic life. A reef-like structure in which nickel, chromium, and lead reached respectively 2900, 2100 and 2210 mgkg�1 dry weight of sediment was located in the Welland River near the outfall of the Atlas-Mansfield storm seweradjacent to the Atlas Specialty Steels Company. The average flow rate at the outfall of the Atlas-Mansfield stormsewer into the Welland River was approximately 28 400 m3 day�1 in 1986 (MOE 1987). A small area referred toas the Atlas reef because of the high iron concentrations giving the sediments a cement-like condition, was devoidof all higher aquatic plants.
Introduction
Wetlands are among the most productive and the mostthreatened habitats worldwide (Euler, 1984). Of thetwo million hectares of presettlement wetlands found insouthern Ontario, over 75% have been severely alteredor have completely disappeared. Furthermore, wetlandlosses in southern Ontario are occurring at a rate of oneto two percent a year (Euler, 1984).
Wetlands are now receiving international recogni-tion, as demonstrated by the fact that over forty coun-
tries are now adherents to the Ramsar Convention onWetlands of International Importance (IUCN, 1980).
In Southern Ontario, many of the wetland areashave been damaged or destroyed by rapid, unsustain-able development. Some have been destroyed by directactivities such as infilling for farmland or subdivi-sions while others have been impacted by industrialand domestic pollutants (Ontario Ministry of NaturalResources, 1984a). Two of the best remaining repre-sentative wetlands in the Niagara Peninsula are thosefound in the Welland River and Lyons Creek (OntarioMinistry of Natural Resources, 1984b; Brady, 1985).
Article: hydr 3603 Pips nr 129575 BIO2KAP
*129575 hy3603.tex; 13/03/1997; 9:55; v.7; p.1
182
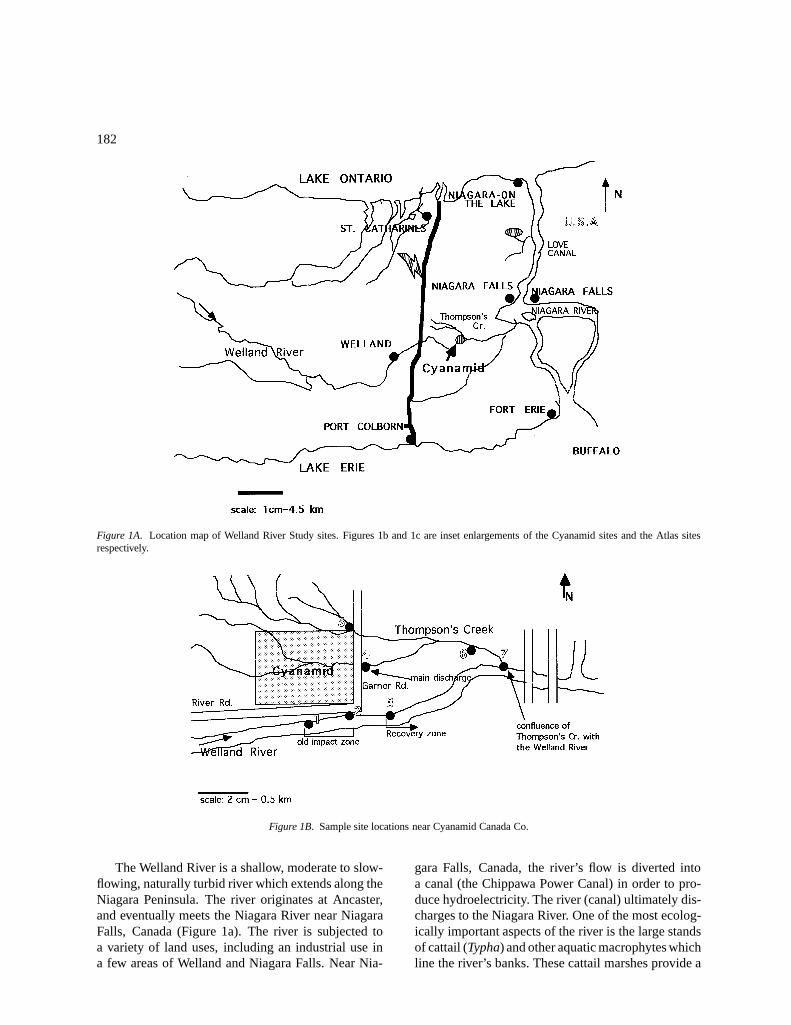
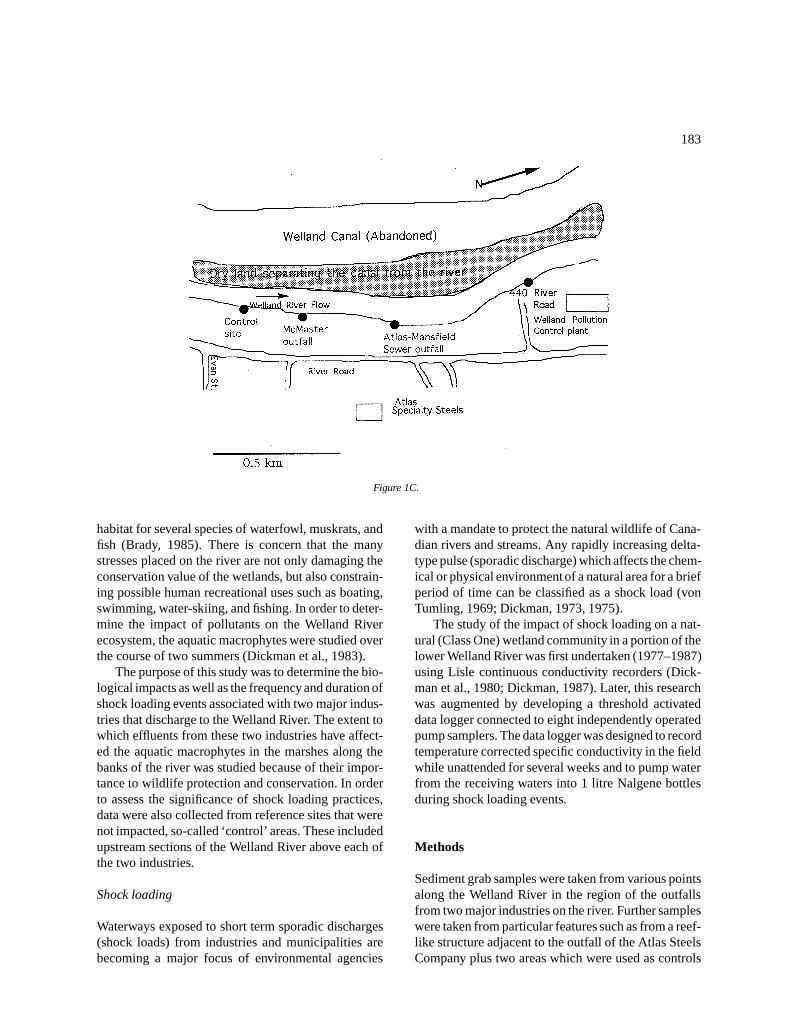
Figure 1A. Location map of Welland River Study sites. Figures 1b and 1c are inset enlargements of the Cyanamid sites and the Atlas sitesrespectively.
Figure 1B. Sample site locations near Cyanamid Canada Co.
The Welland River is a shallow, moderate to slow-flowing, naturally turbid river which extends along theNiagara Peninsula. The river originates at Ancaster,and eventually meets the Niagara River near NiagaraFalls, Canada (Figure 1a). The river is subjected toa variety of land uses, including an industrial use ina few areas of Welland and Niagara Falls. Near Nia-
gara Falls, Canada, the river’s flow is diverted intoa canal (the Chippawa Power Canal) in order to pro-duce hydroelectricity. The river (canal) ultimately dis-charges to the Niagara River. One of the most ecolog-ically important aspects of the river is the large standsof cattail (Typha) and other aquatic macrophytes whichline the river’s banks. These cattail marshes provide a
hy3603.tex; 13/03/1997; 9:55; v.7; p.2
183
Figure 1C.
habitat for several species of waterfowl, muskrats, andfish (Brady, 1985). There is concern that the manystresses placed on the river are not only damaging theconservation value of the wetlands, but also constrain-ing possible human recreational uses such as boating,swimming, water-skiing, and fishing. In order to deter-mine the impact of pollutants on the Welland Riverecosystem, the aquatic macrophytes were studied overthe course of two summers (Dickman et al., 1983).
The purpose of this study was to determine the bio-logical impacts as well as the frequency and duration ofshock loading events associated with two major indus-tries that discharge to the Welland River. The extent towhich effluents from these two industries have affect-ed the aquatic macrophytes in the marshes along thebanks of the river was studied because of their impor-tance to wildlife protection and conservation. In orderto assess the significance of shock loading practices,data were also collected from reference sites that werenot impacted, so-called ‘control’ areas. These includedupstream sections of the Welland River above each ofthe two industries.
Shock loading
Waterways exposed to short term sporadic discharges(shock loads) from industries and municipalities arebecoming a major focus of environmental agencies
with a mandate to protect the natural wildlife of Cana-dian rivers and streams. Any rapidly increasing delta-type pulse (sporadic discharge) which affects the chem-ical or physical environment of a natural area for a briefperiod of time can be classified as a shock load (vonTumling, 1969; Dickman, 1973, 1975).
The study of the impact of shock loading on a nat-ural (Class One) wetland community in a portion of thelower Welland River was first undertaken (1977–1987)using Lisle continuous conductivity recorders (Dick-man et al., 1980; Dickman, 1987). Later, this researchwas augmented by developing a threshold activateddata logger connected to eight independently operatedpump samplers. The data logger was designed to recordtemperature corrected specific conductivity in the fieldwhile unattended for several weeks and to pump waterfrom the receiving waters into 1 litre Nalgene bottlesduring shock loading events.
Methods
Sediment grab samples were taken from various pointsalong the Welland River in the region of the outfallsfrom two major industries on the river. Further sampleswere taken from particular features such as from a reef-like structure adjacent to the outfall of the Atlas SteelsCompany plus two areas which were used as controls
hy3603.tex; 13/03/1997; 9:55; v.7; p.3
184
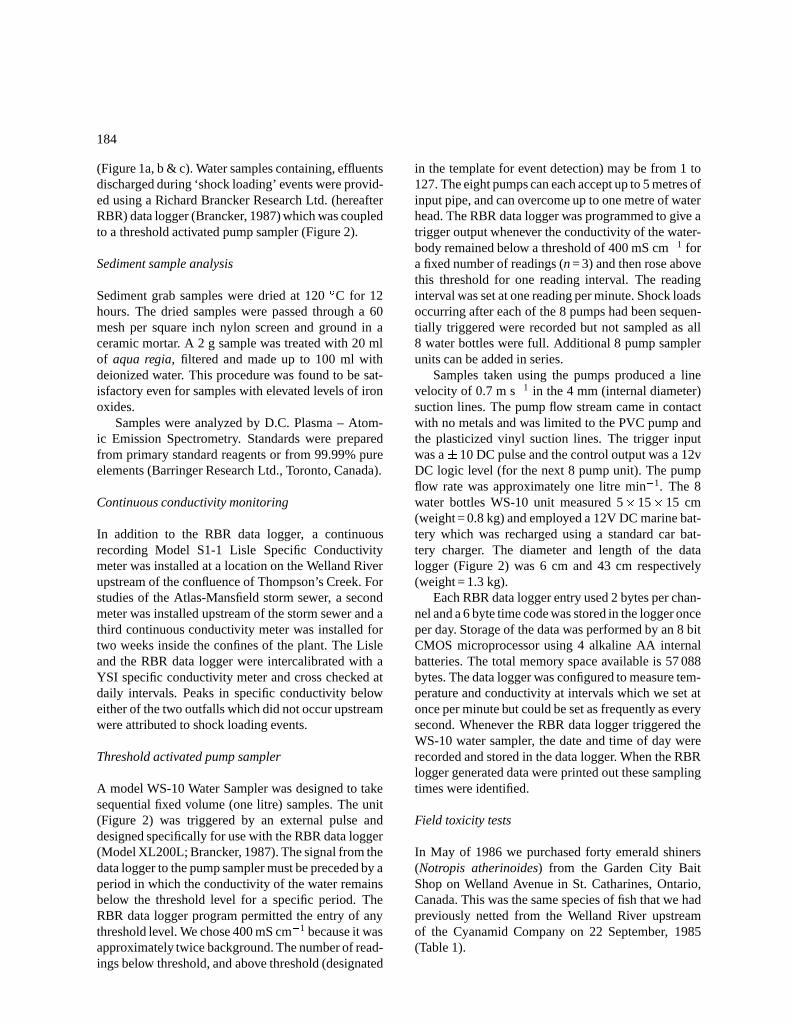
(Figure 1a, b & c). Water samples containing, effluentsdischarged during ‘shock loading’ events were provid-ed using a Richard Brancker Research Ltd. (hereafterRBR) data logger (Brancker, 1987) which was coupledto a threshold activated pump sampler (Figure 2).
Sediment sample analysis
Sediment grab samples were dried at 120 �C for 12hours. The dried samples were passed through a 60mesh per square inch nylon screen and ground in aceramic mortar. A 2 g sample was treated with 20 mlof aqua regia, filtered and made up to 100 ml withdeionized water. This procedure was found to be sat-isfactory even for samples with elevated levels of ironoxides.
Samples were analyzed by D.C. Plasma – Atom-ic Emission Spectrometry. Standards were preparedfrom primary standard reagents or from 99.99% pureelements (Barringer Research Ltd., Toronto, Canada).
Continuous conductivity monitoring
In addition to the RBR data logger, a continuousrecording Model S1-1 Lisle Specific Conductivitymeter was installed at a location on the Welland Riverupstream of the confluence of Thompson’s Creek. Forstudies of the Atlas-Mansfield storm sewer, a secondmeter was installed upstream of the storm sewer and athird continuous conductivity meter was installed fortwo weeks inside the confines of the plant. The Lisleand the RBR data logger were intercalibrated with aYSI specific conductivity meter and cross checked atdaily intervals. Peaks in specific conductivity beloweither of the two outfalls which did not occur upstreamwere attributed to shock loading events.
Threshold activated pump sampler
A model WS-10 Water Sampler was designed to takesequential fixed volume (one litre) samples. The unit(Figure 2) was triggered by an external pulse anddesigned specifically for use with the RBR data logger(Model XL200L; Brancker, 1987). The signal from thedata logger to the pump sampler must be preceded by aperiod in which the conductivity of the water remainsbelow the threshold level for a specific period. TheRBR data logger program permitted the entry of anythreshold level. We chose 400 mS cm�1 because it wasapproximately twice background. The number of read-ings below threshold, and above threshold (designated
in the template for event detection) may be from 1 to127. The eight pumps can each accept up to 5 metres ofinput pipe, and can overcome up to one metre of waterhead. The RBR data logger was programmed to give atrigger output whenever the conductivity of the water-body remained below a threshold of 400 mS cm�1 fora fixed number of readings (n = 3) and then rose abovethis threshold for one reading interval. The readinginterval was set at one reading per minute. Shock loadsoccurring after each of the 8 pumps had been sequen-tially triggered were recorded but not sampled as all8 water bottles were full. Additional 8 pump samplerunits can be added in series.
Samples taken using the pumps produced a linevelocity of 0.7 m s�1 in the 4 mm (internal diameter)suction lines. The pump flow stream came in contactwith no metals and was limited to the PVC pump andthe plasticized vinyl suction lines. The trigger inputwas a � 10 DC pulse and the control output was a 12vDC logic level (for the next 8 pump unit). The pumpflow rate was approximately one litre min�1. The 8water bottles WS-10 unit measured 5� 15� 15 cm(weight = 0.8 kg) and employed a 12V DC marine bat-tery which was recharged using a standard car bat-tery charger. The diameter and length of the datalogger (Figure 2) was 6 cm and 43 cm respectively(weight = 1.3 kg).
Each RBR data logger entry used 2 bytes per chan-nel and a 6 byte time code was stored in the logger onceper day. Storage of the data was performed by an 8 bitCMOS microprocessor using 4 alkaline AA internalbatteries. The total memory space available is 57 088bytes. The data logger was configured to measure tem-perature and conductivity at intervals which we set atonce per minute but could be set as frequently as everysecond. Whenever the RBR data logger triggered theWS-10 water sampler, the date and time of day wererecorded and stored in the data logger. When the RBRlogger generated data were printed out these samplingtimes were identified.
Field toxicity tests
In May of 1986 we purchased forty emerald shiners(Notropis atherinoides) from the Garden City BaitShop on Welland Avenue in St. Catharines, Ontario,Canada. This was the same species of fish that we hadpreviously netted from the Welland River upstreamof the Cyanamid Company on 22 September, 1985(Table 1).
hy3603.tex; 13/03/1997; 9:55; v.7; p.4
185
Figure 2. The RBR XL200L Data logger and WS-10 pump Water Sampler.
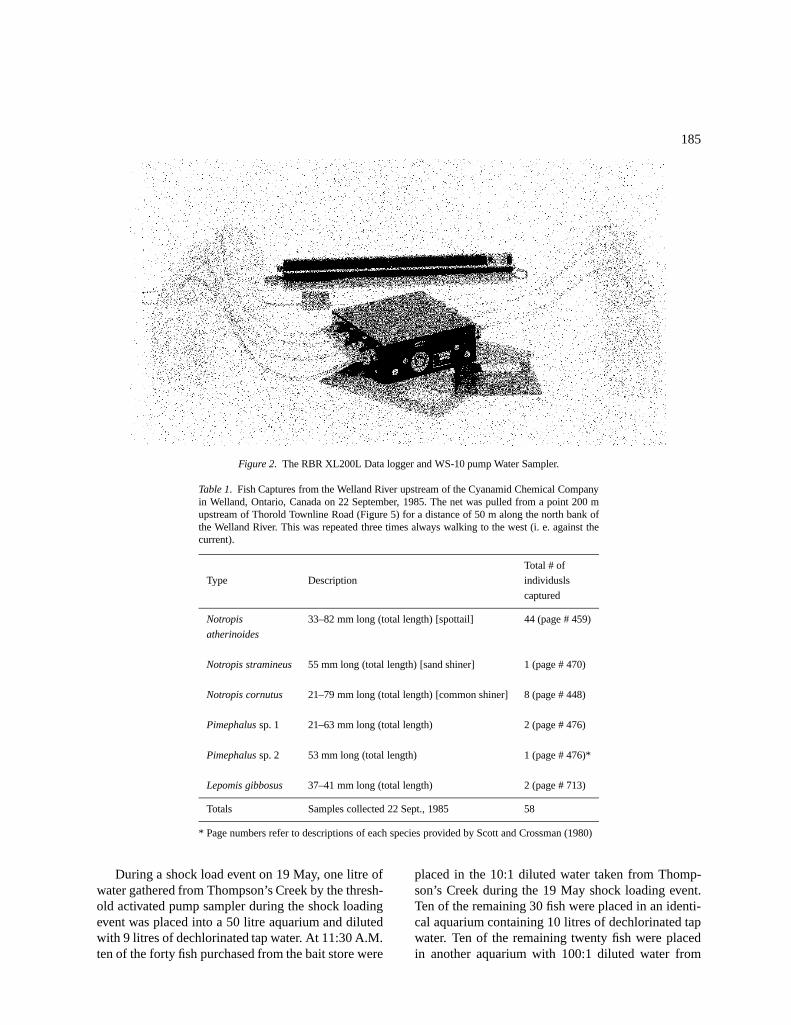
Table 1. Fish Captures from the Welland River upstream of the Cyanamid Chemical Companyin Welland, Ontario, Canada on 22 September, 1985. The net was pulled from a point 200 mupstream of Thorold Townline Road (Figure 5) for a distance of 50 m along the north bank ofthe Welland River. This was repeated three times always walking to the west (i. e. against thecurrent).
Total # of
Type Description individusls
captured
Notropis 33–82 mm long (total length) [spottail] 44 (page # 459)
atherinoides
Notropis stramineus 55 mm long (total length) [sand shiner] 1 (page # 470)
Notropis cornutus 21–79 mm long (total length) [common shiner] 8 (page # 448)
Pimephalus sp. 1 21–63 mm long (total length) 2 (page # 476)
Pimephalus sp. 2 53 mm long (total length) 1 (page # 476)*
Lepomis gibbosus 37–41 mm long (total length) 2 (page # 713)
Totals Samples collected 22 Sept., 1985 58
* Page numbers refer to descriptions of each species provided by Scott and Crossman (1980)
During a shock load event on 19 May, one litre ofwater gathered from Thompson’s Creek by the thresh-old activated pump sampler during the shock loadingevent was placed into a 50 litre aquarium and dilutedwith 9 litres of dechlorinated tap water. At 11:30 A.M.ten of the forty fish purchased from the bait store were
placed in the 10:1 diluted water taken from Thomp-son’s Creek during the 19 May shock loading event.Ten of the remaining 30 fish were placed in an identi-cal aquarium containing 10 litres of dechlorinated tapwater. Ten of the remaining twenty fish were placedin another aquarium with 100:1 diluted water from
hy3603.tex; 13/03/1997; 9:55; v.7; p.5
186
Thompson’s Creek and the remaining ten fish wereplaced into a fourth aquarium containing 10 litres ofdechlorinated tap water.
Emerald shiner toxicity tests
Fish holding cages measuring 25 cm� 16 cm� 16 cmhigh were constructed using nontoxic plastic meshand garden binder twine. Four adult emerald shiners(Notropis atherinoides) were placed in each cage. Fourcages were placed in each receiving water body; twodownstream and two upstream of the discharge pointsource. The nets were held in place by plastic tetherstied to the nets anchored with large stones. Conductiv-ity and temperature were recorded at all locations. ALisle Instruments Co. conductivity meter and/or RBRData Logger remained on site for the duration of thefish toxicity experiments. Fish mortalities in the cageswere observed daily for a period of 96 hours.
Cladoceran toxicity tests
The standard 7 day cladoceran toxicity test (Mount &Norberg, 1984) was performed at the Canada Centrefor Inland Waters (Burlington, Ontario) using sampleswhich we provided following shock loading episodesat Cyanamid and Atlas Steels. A 48 hour bioassaywas carried out by introducing ten Daphnia magna,which were less than 24 hours old, into each of sevenconcentrations of the test solution (0.1%, 1%, 10%,30%, 50%, 70%, and 100%). The number of Daphniasurviving was determined after 1, 2, 4, 8, 16, 24 and48 hours.
Higher aquatic plant survey
Cairns et al. (1972) in their study of microfloral pollu-tion induced distributions, described structural changeswhich occurred in the aquatic communities down-stream of pollution point sources. Their approach wasemulated in our study of the microbiota of the WellandRiver (Dickman & Hayes, 1986). A distance of 0.2 kmabove and below each of the point sources in theWelland River was walked and the locations whereeach new aquatic plant taxa was located was markedon a map. This map was then used to determine theaquatic plant zonation pattern above and below eachpoint source.
Description of the study area
A total of 7 stations were sampled within the WellandRiver (Figure 1b). Station 4 was located on Thomp-son’s Creek, the Cyanamid Company’s major pointsource discharge. The company produces organic andinorganic nitrogen and phosphorous products. Sta-tion 5 (Figure 1c) was located where surface watersand runoff from the northern edge of the plant site dis-charge into Thompson’s Creek. Stations 6 and 7 weresituated along Thompson’s Creek with station 7 beingclosest to the mouth of the Welland River. Station 6was relatively remote and was chosen for this reasonso that the threshold activated pump sampler (Figure 2)could be hidden nearby with little chance of its detec-tion. Pump samples were returned to the lab where theywere tested for toxicity and electrolyte levels.
Sampling methods
Fish, other aquatic animals and vegetation were cap-tured with a 15 metre long 1 centimetre mesh purseseine net. Each seine net sample was obtained by car-rying the net out from the shore until a water depth of0.5 m was reached. All specimens were transferred toglass jars. Buffered formalin was added to each jar asa preservative.
Results
Inorganic analysis
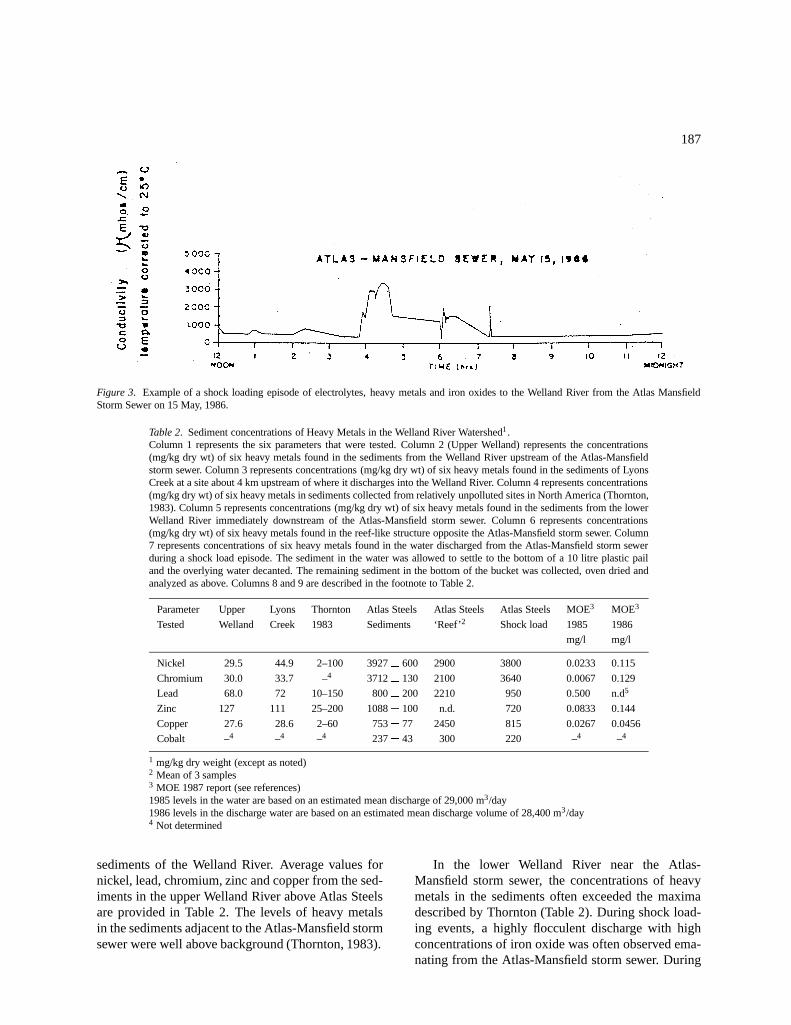
In the initial work on the Welland River, shock loadsof electrolytes and associated nonelectrolytes wereobserved at the Atlas-Mansfield storm sewer (Fig-ure 3). These increases in conductivity were due largelyto elevated carbonate, calcium and iron levels. Calciumand carbonate concentrations rose from a backgroundlevel of around 75 ppm to over 300 ppm during theseevents. Iron levels rose from a background level of5 ppm. Most of the iron (up to 260 ppm during shockloading events) was readily identifiable as hydratediron oxide. Peaks in specific conductivity (Figure 3)recorded at the Atlas-Mansfield storm sewers’ conflu-ence with the Welland River were always associatedwith sporadic discharges into the Atlas-Mansfield 4200
line.On the basis of determinations made near the Atlas
Steels outfall, it was clear that substantial quantitiesof heavy metals had accumulated in the downstream
hy3603.tex; 13/03/1997; 9:55; v.7; p.6
187
Figure 3. Example of a shock loading episode of electrolytes, heavy metals and iron oxides to the Welland River from the Atlas MansfieldStorm Sewer on 15 May, 1986.
Table 2. Sediment concentrations of Heavy Metals in the Welland River Watershed1.Column 1 represents the six parameters that were tested. Column 2 (Upper Welland) represents the concentrations(mg/kg dry wt) of six heavy metals found in the sediments from the Welland River upstream of the Atlas-Mansfieldstorm sewer. Column 3 represents concentrations (mg/kg dry wt) of six heavy metals found in the sediments of LyonsCreek at a site about 4 km upstream of where it discharges into the Welland River. Column 4 represents concentrations(mg/kg dry wt) of six heavy metals in sediments collected from relatively unpolluted sites in North America (Thornton,1983). Column 5 represents concentrations (mg/kg dry wt) of six heavy metals found in the sediments from the lowerWelland River immediately downstream of the Atlas-Mansfield storm sewer. Column 6 represents concentrations(mg/kg dry wt) of six heavy metals found in the reef-like structure opposite the Atlas-Mansfield storm sewer. Column7 represents concentrations of six heavy metals found in the water discharged from the Atlas-Mansfield storm sewerduring a shock load episode. The sediment in the water was allowed to settle to the bottom of a 10 litre plastic pailand the overlying water decanted. The remaining sediment in the bottom of the bucket was collected, oven dried andanalyzed as above. Columns 8 and 9 are described in the footnote to Table 2.
Parameter Upper Lyons Thornton Atlas Steels Atlas Steels Atlas Steels MOE3 MOE3
Tested Welland Creek 1983 Sediments ‘Reef’2 Shock load 1985 1986
mg/l mg/l
Nickel 29.5 44.9 2–100 3927 � 600 2900 3800 0.0233 0.115
Chromium 30.0 33.7 –4 3712 � 130 2100 3640 0.0067 0.129
Lead 68.0 72 10–150 800 � 200 2210 950 0.500 n.d5
Zinc 127 111 25–200 1088 � 100 n.d. 720 0.0833 0.144
Copper 27.6 28.6 2–60 753� 77 2450 815 0.0267 0.0456
Cobalt –4 –4 –4 237 � 43 300 220 –4 –4
1 mg/kg dry weight (except as noted)2 Mean of 3 samples3 MOE 1987 report (see references)1985 levels in the water are based on an estimated mean discharge of 29,000 m3/day1986 levels in the discharge water are based on an estimated mean discharge volume of 28,400 m3/day4 Not determined
sediments of the Welland River. Average values fornickel, lead, chromium, zinc and copper from the sed-iments in the upper Welland River above Atlas Steelsare provided in Table 2. The levels of heavy metalsin the sediments adjacent to the Atlas-Mansfield stormsewer were well above background (Thornton, 1983).
In the lower Welland River near the Atlas-Mansfield storm sewer, the concentrations of heavymetals in the sediments often exceeded the maximadescribed by Thornton (Table 2). During shock load-ing events, a highly flocculent discharge with highconcentrations of iron oxide was often observed ema-nating from the Atlas-Mansfield storm sewer. During
hy3603.tex; 13/03/1997; 9:55; v.7; p.7
188
severe episodes of shock loading the Welland Riverwould turn a bright red. Pictures of this were publishedin colour by the Water Pollution Research Journal ofCanada (Dickman et al., 1980). The iron oxide flocbehaved as a sequestering agent accumulating lead,chromium, nickel, and other heavy metals (Table 2).Analysis of the reef sediments from near the Atlas out-fall revealed significant increases above backgroundof Ni, Cr, Pb, Zn, Cu and Co (Table 2). Much of theiron oxide released during shock loading events settledout in the ‘mixing zone’ around the outfall. A reef-like structure was the result. As previously noted, thisreef-like structure also displayed elevated heavy metalconcentrations (Table 2).
Acute toxicity studies
The emerald shiner acute toxicity study of the Atlao,-Mansfield storm sewer was carried out over a 96 hrexposure period. The number of fish dying in the twocontrol cages located upstream of the Atlas-Mansfieldstorm sewer were not very different from the numberdying in cages located downstream of the point source(n = 3). Daphnia magna, a water flea (a Crustaceanwhich is often referred to as the ‘white rat’ of fresh-water toxicologists) was used to determine the acutetoxicity of the Atlas Steels’ discharge at the 4200 pipeduring a shock loading event which occurred in Sep-tember of 1987. Thirty percent of the Daphnia magnaexposed to the undiluted effluent taken from the Atlas-Mansfield storm sewer during the shock load dischargedied during the 48 hr exposure period (S. Rao, 1987).
Cyanamid monitoring results
Shock loading events observed near the mouth ofThompson’s Creek were frequently associated with thedischarge of nitrogenous wastes (Dickman & Rygiel,1993). In 1984, Cyanamid discharged 28 400 m day�1
of waste water into Thompson’s Creek (MOE, 1987).On occasions when shock loads occurred as a resultof backflushing by the company or washouts, therewere a few instances when the entire Creek turned abright yellow-orange colour (Dickman et al., 1990). Ingeneral, however, a classical ‘wash out’ curve (Fig-ure 4) resulted when electrolytes from a number ofsources (e.g. backflushing of the Cyanamid deioniz-ers) was released into Thompsons Creek. These shockloads were quite toxic as indicated by the completeabsence of aquatic life in the lower reaches of Thomp-son’s Creek, the receiving water body, and the 100%
mortality of Daphnia magna when exposed to the efflu-ent taken from the creek during a shock loading event(EC50 = 1%) (Rao, 1987). Free ammonia was the mostlikely cause of the observed mortality following shockloads (Sprague, Personal Communication).
Cyanamid caged fish study
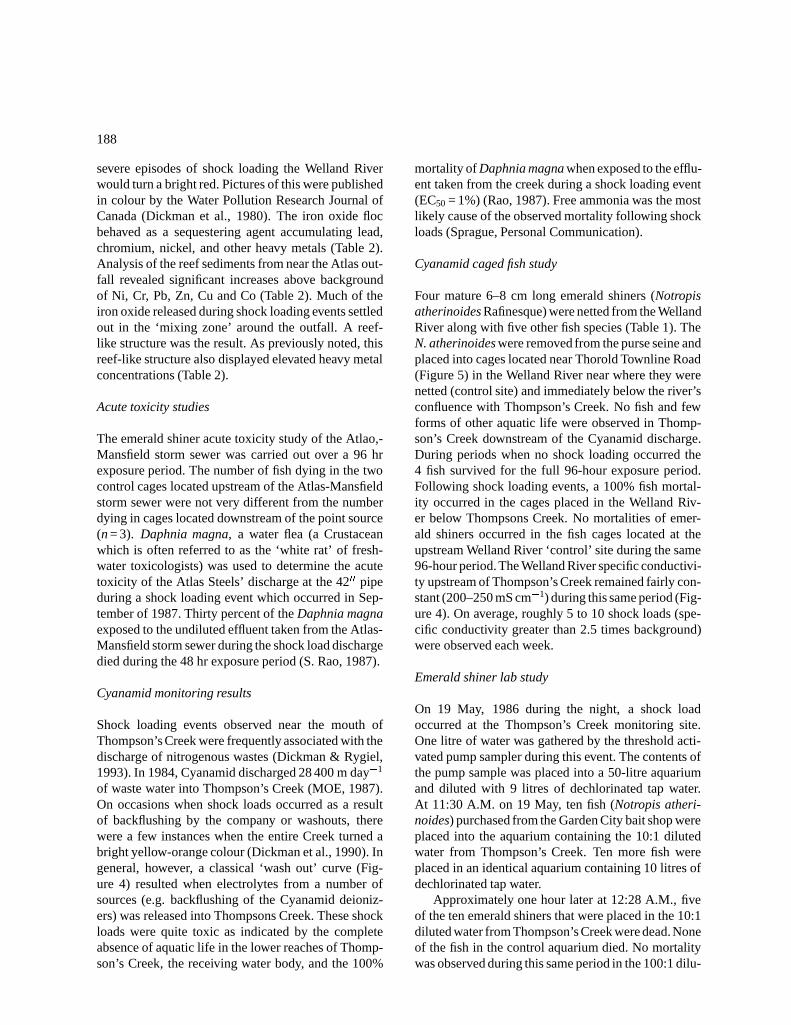
Four mature 6–8 cm long emerald shiners (Notropisatherinoides Rafinesque) were netted from the WellandRiver along with five other fish species (Table 1). TheN. atherinoides were removed from the purse seine andplaced into cages located near Thorold Townline Road(Figure 5) in the Welland River near where they werenetted (control site) and immediately below the river’sconfluence with Thompson’s Creek. No fish and fewforms of other aquatic life were observed in Thomp-son’s Creek downstream of the Cyanamid discharge.During periods when no shock loading occurred the4 fish survived for the full 96-hour exposure period.Following shock loading events, a 100% fish mortal-ity occurred in the cages placed in the Welland Riv-er below Thompsons Creek. No mortalities of emer-ald shiners occurred in the fish cages located at theupstream Welland River ‘control’ site during the same96-hour period. The Welland River specific conductivi-ty upstream of Thompson’s Creek remained fairly con-stant (200–250 mS cm�1) during this same period (Fig-ure 4). On average, roughly 5 to 10 shock loads (spe-cific conductivity greater than 2.5 times background)were observed each week.
Emerald shiner lab study
On 19 May, 1986 during the night, a shock loadoccurred at the Thompson’s Creek monitoring site.One litre of water was gathered by the threshold acti-vated pump sampler during this event. The contents ofthe pump sample was placed into a 50-litre aquariumand diluted with 9 litres of dechlorinated tap water.At 11:30 A.M. on 19 May, ten fish (Notropis atheri-noides) purchased from the Garden City bait shop wereplaced into the aquarium containing the 10:1 dilutedwater from Thompson’s Creek. Ten more fish wereplaced in an identical aquarium containing 10 litres ofdechlorinated tap water.
Approximately one hour later at 12:28 A.M., fiveof the ten emerald shiners that were placed in the 10:1diluted water from Thompson’s Creek were dead.Noneof the fish in the control aquarium died. No mortalitywas observed during this same period in the 100:1 dilu-
hy3603.tex; 13/03/1997; 9:55; v.7; p.8
189
Figure 4. The RBR data logger temperature and conductivity profiles are depicted for a typical week long period for 23–30 October, 1987. Theupstream control (dashed line) was based on a Lisle Instrument Co. continuous conductivity recorder located in the Welland River about 100 mupstream of the confluence with Thompson’s Creek.
tion study (see methods for details). However, some ofthe control aquarium fish died after 12 hours and thelab study was abandoned at 10:30 P.M. on 19 May,1986.
In addition to the aquarium study described above,an in-stream caged fish exposure study was conducted.Locally seined Notropis atherinoides were placed inplastic mesh cages that were anchored to the bottom ofthe Welland River and Thompson’s Creek. No mortali-ty occurred over a 96-hour period in the upstream ‘con-trol’ site located above the Cyanamid discharge pipe.Specific conductivity at this site (Figure 1b) remainedrelatively constant (200–250 mS cm�1) over the 96-hour period. At the downstream site, station 6 (Fig-ure 1b) in Thompson’s Creek, the specific conductivityreached 700 mS cm�1 for a few hours during a shockloading event (Figure 4) that was associated with a
100% mortality of the caged fish in each of the threecages at this site.
Discussion
Cyanamid
Fish placed in plastic mesh cages located in theWelland River and in Thompson’s Creek near its con-fluence with the Welland River were monitored for 96hours. No mortalities of Emerald shiners occurred inthe fish cages located at the upstream Welland River‘control’ cages during the 96-hourperiod. The WellandRiver specific conductivity upstream of Thompson’sCreek remained fairly constant (200–250 mS cm�1)during this period unlike the situation at the Thomp-
hy3603.tex; 13/03/1997; 9:55; v.7; p.9
190
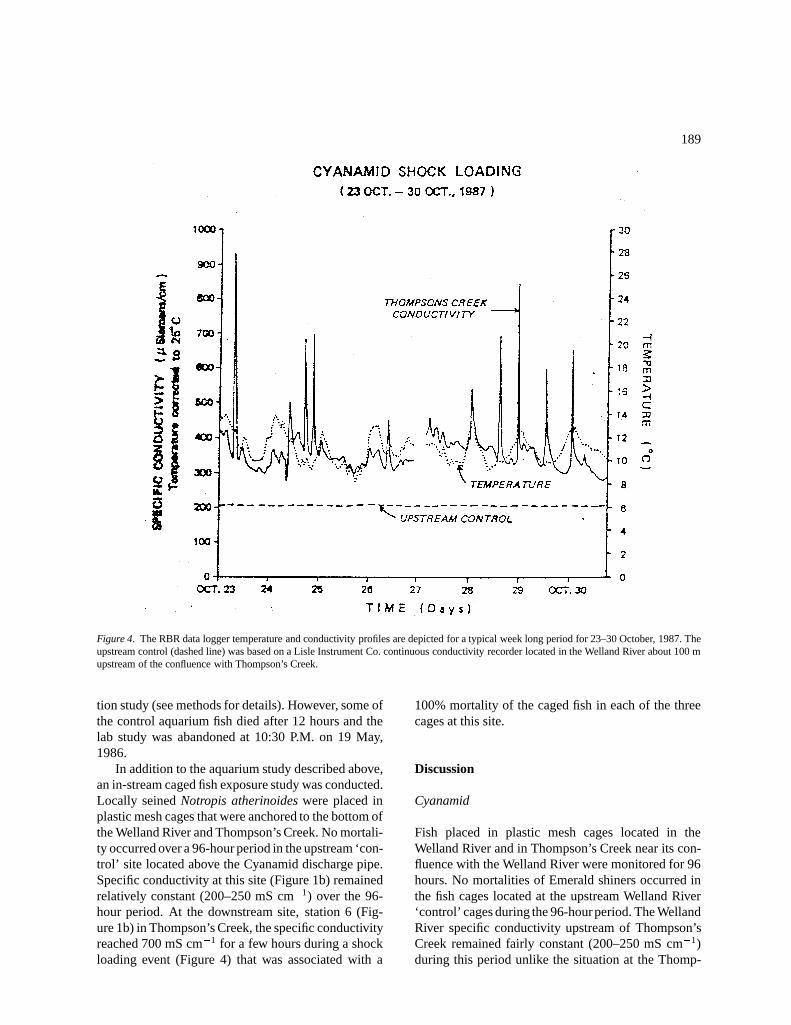
Figure 5. Floristic zonation pattern in the Welland River upstream (zone 5) and downstream (zones 1–4) of the confluence with Thompson’sCreek. From the confluence of Thompson’s Creek to zone 4 represents a distance of about 1 km.
son’s Creek site where acute toxicities were high(Daphnia magna EC50 = 1%) a 100% fish mortalityoccurred in less than 96 hours after a shock load event.
According to Tessier and Campbell (1987), heavymetals which are bound to iron oxide flocs are extreme-ly insoluble and quickly settle out of solution. As aresult, mortalities of caged fish placed in the impactzone downstream of the Atlas-Mansfield storm sew-er were not significantly higher than those occurringupstream. One should not assume from these results
that these heavy metals will not pose a longer termhazard in terms of chronic toxicity since some of theseprecipitated heavy metals can be methylated or alky-lated or otherwise rendered more soluble (Schuytemaet al., 1984). Thus the heavy metal contaminated sed-iments downstream of Atlas Steels would appear torepresent a chronic toxicity threat rather than an acutetoxicity threat.
hy3603.tex; 13/03/1997; 9:55; v.7; p.10
191
The impact of the cyanamid effluent
The Cyanamid Canada Inc. Welland River Plant hasseveral outfalls to Thompson’s Creek which carriestheir wastes into the Welland River approximately4.5 km upstream of the Niagara River at Queenston(Figure 5). Cyanamid manufactures a wide varietyof nitrogen and phosphorus based chemical productsincluding ammonia, urea, nitric acid, dicyandiamide,xanthate, cyphos animal feed, phosphates, guanidine,tetrabutyl-phospho pesticides and phosphine (Dalrym-ple, 1985, average flow from Cyanamid was 19 200 m3
day�1). On average, this daily discharge contained184 kg phosphorus, 9370 kg ammonia and urea nitro-gen, 5210 kg nitrate nitrogen, 5.57 kg free cyanide,4.86 kg chromium, 1.78 kg nickel, 2.97 kg zinc and0.113, 0.008, 0.064, 0.019, 0.008 kg of total phenols,arsenic, toluene, chloroform and naphthalene respec-tively (1981 EPS data reported by Dalrymple, 1985).
The relationship between the aquatic plant zonationpattern below an industrial outfall and the toxicity ofthat industry’s discharge is complicated by the factthat few industries discharge their toxic wastes in acontinuous fashion. Shock loading is the rule ratherthan the exception (Dickman, 1975).
Atlas shock loading
The average flow rate at the outfall of the Atlas-Mansfield storm sewer into the Welland River wasapproximately 28 400 m3 day�1 in 1986 (MOE 1987).Discussions with the management of Atlas Steels abouttheir shock loading problems led to the conclusion thatthey were associated with the operation of their Vacu-um Oxygen Refining System (VORS). Remedial actionwas taken by Atlas Steels to minimize their shock load-ing to the Welland River due to the VORS operation.According to the Niaraga River Toxics Report (Dal-rymple & King, 1985), Atlas Steels was a major dis-charge source of chromium, iron, lead, nickel and zincin the early 1980’s. However, our data and those of theMOE (1987) indicate that their loadings to the WellandRiver were significantly reduced in the late 1980’s sothat they fell well below levels reported by Dalrymple& King (1985).
Floristic zonation
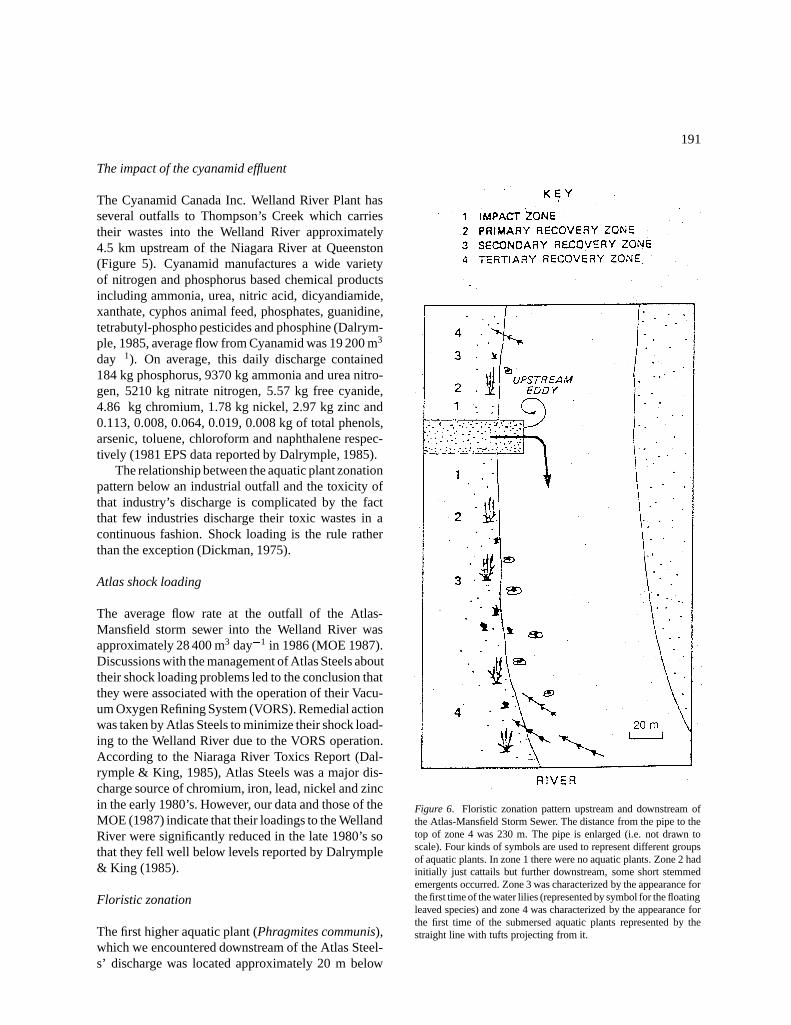
The first higher aquatic plant (Phragmites communis),which we encountered downstream of the Atlas Steel-s’ discharge was located approximately 20 m below
Figure 6. Floristic zonation pattern upstream and downstream ofthe Atlas-Mansfield Storm Sewer. The distance from the pipe to thetop of zone 4 was 230 m. The pipe is enlarged (i.e. not drawn toscale). Four kinds of symbols are used to represent different groupsof aquatic plants. In zone 1 there were no aquatic plants. Zone 2 hadinitially just cattails but further downstream, some short stemmedemergents occurred. Zone 3 was characterized by the appearance forthe first time of the water lilies (represented by symbol for the floatingleaved species) and zone 4 was characterized by the appearance forthe first time of the submersed aquatic plants represented by thestraight line with tufts projecting from it.
hy3603.tex; 13/03/1997; 9:55; v.7; p.11
192
the Atlas-Mansfield storm Sewer outfall (Figure 6). InThompson’s Creek where acute toxicities were high(Daphnia magna EC50 = 1%) a 100% fish mortalityoccurred in less than 96 hours after a particularly severeshock loading event occurred. A dead zone of morethan 2 km in length was found in Thompson’s Creekdownstream of the Cyanamid discharge in which nohigher aquatic plants could survive (Figure 5).
Conclusions
When a continuous conductivity recorder was coupledto a water sampler so that samples could be taken dur-ing periods of shock loading, the analysis of these sam-ples improved our ability to interpret the distributionof the biotic assemblages located below two industrialoutfalls which we examined. The associated aquaticbiota (e.g. aquatic plants and caged fish) responded topeak loads and peak toxicity levels rather than meanlevels.
If the natural biota of our waterways are to be pro-tected, legislators must assign maximal concentrationlimits to effluents discharged to the aquatic environ-ment rather than mean loading limits. In addition, bio-logical parameters such as biotoxicity data should beconsidered in setting upper limits for shock load con-centrations.
Where point source discharges contain electrolytes,continuous specific conductivity monitoring permits abetter estimate of the frequency and intensity of shockloading events than is provided by composite sam-plers. The significance of this conclusion is importantto environmental agencies entrusted with monitoringthe effects of industrial discharges on the natural bio-ta of our lakes and streams. To date, most Canadianenvironmental agencies and industries have persistedin collecting composite samples rather than continu-ous samples (Dalrymple, 1985). Composite samplersfail to adequately register sporadic discharges becausethey often mix the shock load discharged effluent withthe water being discharged before and after peak dis-charges. Because the biota respond to the peak con-centrations and not the mean concentrations, compos-ite sampled mean concentrations, composite samplesgive a misleading picture of the impact of industrialdischarges for industries practicing shock loading.
Acknowledgments
The work outlined in this paper was supported bygrants from the Wildlife Toxicology Fund, Environ-ment Canada, the Ontario Ministry of the Environment,the Ministry of Employment and Immigration, and theDepartment of Fisheries and Oceans.
We are grateful to Dr John Middleton for his com-ments on wetland areas and to members of the M.O.E.Niagara River Improvement Team and Mr R. Branck-er for reviewing this paper and providing constructivecriticism. Any errors in the text are those of the seniorauthor.
We are also grateful to members of the Employ-ment and Immigration, Fisheries and Oceans toxicolo-gy team, Dr Salem Rao, Patricia Hayes, Dave Neufeld,Bill Parkins and Robert Steele for collecting the fieldsamples and the specific conductivity data and to EvaTam, Virginie Lerouge, Barbara Hamilton and MarilynFerracuti for preparing figures and typing the manu-script.
References
Barringer Research Ltd., Barringer Laboratories, 5735 McAdamRoad, Mississauga, Ontario L4Z 1N9, Canada.
Brady, R. F, 1985. Natural areas of the Niagara Region: A prelim-inary survey. Planning and Development Department, RegionalMunicipality of Niagara, Thorold, Ont.
Brancker, R., 1987. The RBR Data Logger (Model XD200L).Richard Brancker Research Ltd. 27 Monk Street, Ottawa, OntarioK1S 3Y7.
Cairns, J. C., G. R. Lanza & B. C. Parker, 1972. Pollution relatedstructural and functional changes in aquatic communities withemphasis on freshwater algae and protozoa In Proc. Acad. nat.Sci. Philad. 124: 79–127.
Comba, M. E. & K. Kaiser, 1984. Tracking River Plumes withvolatile halocarbon contaminants: the Niagara River – LakeOntario example. J. Great Lakes Res. 10: 375–382.
Dalrymple, R. J., 1985. Canadian Point Sources to the NiagaraRiver. Final report on M.O.E. and E.P.S. 1981/82 surveys. NRTCAppendix report, Ontario Ministry of the Environment, NiagaraRiver Improvement Project. Rexdale, Ontario, 157 pp.
Dalrymple, R. J. & L. W. King, 1985. Canadian Point Sources tothe Niagara River. Final report on M.O.E. and E.P.S. 1981/82surveys. NRTC Appendix report, Toronto, Ontario, 157 pp.
Dickman, M., 1973. Total dissolved electrolyte effects on periphytonJ. Wat. Pollut. Cont. Fed. 45: 2211–2215.
Dickman, M., 1975. A comparison between the effects of sporadicand continuous loading from sulphite paper mills on attachedalgae in the Ottawa River near Ottawa, Canada. Proc. WaterPollut. Res. J. 10: 65–72.
Dickman, M., 1987. Impact of Industrial Shock Loading on theAquatic Plant Community of a Class One Wetlands in RegionalNiagara, Ontario, Canada. International Wellands Conference,Edmonton, Alberta 23–29 August, 1987.
hy3603.tex; 13/03/1997; 9:55; v.7; p.12
193
Dickman, M. & P. Hayes, 1986. Evaluation of the Impact of ShockLoading on the Microbiota of the Welland River. Proceedings ofthe Technology Transfer Conference, December, 1986, Toronto,Ontario.
Dickman, M. D., J. R. Yang & D. Brindle, 1990. Impacts of HeavyMetals on higher aquatic plant, diatom and benthic inverte-brate communities in the Niagara River watershed near Welland,Ontario. Wat. PolluT Res. J. Canada 25: 131–159.
Dickman, M. & G. Rygiel, 1993. Impact of Cyanamid Canada Co.discharges on benthic invertebrates in the Welland River, NiagaraFalls, Canada. Ecotoxicology 2: 93–120.
Dickman, M., C. Prescott & K. L. E. Kaiser, 1983. Variations in theaquatic vegetation of the Welland River (Ontario, Canada) aboveand below an industrial waste discharge. J. Great Lakes Res. 9:317–325.
Dickman, M., J. Smol & P. Steele, 1980. The impact of industrialshock loading on selected biocoenoses in the lower Welland River,Ontario. Water Pollut. Res. J. Canada 15: 17–31.
Euler, D. L., 1984. An evaluation system for wetlands of Ontariosouth of the precambrian shield. Second edition Ontario Ministryof Natural Resources, Whitney Block, Queen’s Park, Toronto,Ontario.
IUCN, 1980. World Conservation Strategy. Gland Switzerland.Kaiser, K., M. Comba & H. Huneault, 1983. Volatile halocarbon
contaminants in the Niagara River and in Lake Ontario. J. GreatLakes Res. 9: 212–223.
MOE [Ontario Ministry of the Environment], 1987. Priority Chemi-cal loadings from Ontario Point Sources Discharging to the Nia-gara River. 1981–1987. ISBN 0-7729-2981-5. River Improve-ment Project Update Report. Hamilton, Ontario, Canada.
Moore, J. W., 1979. Diversity and indicator species as measures ofwater pollution in a subarctic lake. Hydriobiologia 66: 73–80.
Mount, D. I. & T. J. Norberg, 1984. A seven-day life cycle Clado-ceran toxicity test. Envir. Toxicol. Chem. 3: 425–434.Niagara River Toxics Committee Report, 1984. US Environmen-tal Protection Agency New York, NY New York State Dept. ofEnvironmental Conservation, Albany, New York: A-26.
Ontario Ministry of Natural Resources, 1984a. An evaluation systemfor wetlands of southern Ontario south of the Precambrian shield;second edition. Toronto, Ontario Ministry of Natural Resources.
Ontario Ministry of Natural Resources, 1984b. Guidelines for wet-lands management in Ontario. Toronto, Ontario Ministry of Nat-ural Resources.
Rao, S., 1987. Personal Communication from the Senior scientist incharge of the Daphnia magna EC50 acute toxicity program at theCanada Centre for Inland Waters. Box 5050 Burlington, Ontario,Canada.
Schuytema, G. S., P. O. Nelson, K. W. Malueg, A. G. Nebeker,D. F. Krawczyk, A. K. Ratcliff & J. H. Gakstatter, 1984. Toxicityof cadmium in water and sediment slurries to Daphnia magna.Envir. Toxicol. Chem. 3: 293–308.
Scott, W. B. & E. J. Crossman, 1973. Freshwater Fishes of Cana-da. Bulletin #184 Fisheries Research Board of Canada, Ottawa,966 pp.
Sprague, J. Biology Department, Guelph, University, Guelph,Ontario, Canada.
Tessier, A. & P. G. C. Campbell, 1987. Partitioning of trace metals insediments: relationships with bioavailability. Hydrobiologia 149:43–52.
Thornton, I., 1983. Geochemistry applied to agriculture. In Thorn-ton, I. (ed.), Applied Environmental Geochemistry, AcademicPress, New York, 235 pp.
Von Tumling, W., 1969. Suggested classification of water quali-ty based on biological characteristics. Pergamon Press, Oxford.Proc. Fourth Int. conf. Water pollut. Res. 4: 40–42.
hy3603.tex; 13/03/1997; 9:55; v.7; p.13