Management of Coarse Sediment in Regulated Rivers of ...
103
UC Berkeley Technical Completion Reports Title Management of Coarse Sediment in Regulated Rivers of California Permalink https://escholarship.org/uc/item/5rw9k19j Authors Kondolf, G. Mathias Matthews, W.V. Graham Publication Date 1991-12-01 eScholarship.org Powered by the California Digital Library University of California
-
Upload
khangminh22 -
Category
Documents
-
view
0 -
download
0
Transcript of Management of Coarse Sediment in Regulated Rivers of ...

UC BerkeleyTechnical Completion Reports
TitleManagement of Coarse Sediment in Regulated Rivers of California
Permalinkhttps://escholarship.org/uc/item/5rw9k19j
AuthorsKondolf, G. MathiasMatthews, W.V. Graham
Publication Date1991-12-01
eScholarship.org Powered by the California Digital LibraryUniversity of California

MANAGEMENT OF COARSE SEDIMENTIN REGULATED RIVERS OF CALIFORNIA
ByG. Mathias Kondolf
Principal Investigator
andw.v. Graham MatthewsResearch Associate
Center for Environmental Design ResearchUniversity of California
Berkeley CA 94720
TECHNICAL COMPLETION REPORT
, Project No. UCAL-WRC-W-748.\.
December 1991
University of California Water Resources Center
The research leading to this report was supported by the Universityof California, water Resources Center, as part of Water ResourcesCenter Project UCAL-WRC-W-748.
:TCR
/
Abstract
There are significant problems in the management of coarsesediment (sand and gravels) in regulated rivers of California.Unfortunately, these have been generally treated (or ignored) ona case-by-case basis, however, the effects are pervasive andprofound, with substantial costs and severe environmental impacts.Problems arise due to the human manipulation of coarse sedimentthrough reservoir construction, which blocks the movement of coarsesediment down the river, and through instream gravel mining, whichremoves this material from the river system for use primarily inconstruction-related projects. Impacts identified include: bedmaterial coarsening, channel incision, channel geometry changes,hydrologic regime alterations, and changes in transport ofsediment. Many of these impacts result in damage to or destructionof anadromous fisheries habitat, and are partly responsible for thedramatic declines in anadromous fisheries resources in the last 50years. other types of impacts include damage to instreamstructures, loss of riparian habitat, and increased risk ofdamaging channel changes.
We documented these types of impacts on a set of major riverdrainages on the western slope of the Sierra Nevada, along withseveral rivers in the Coast Ranges. We have reviewed theinstitutional and regulatory framework for both reservoir operationand instream mining, finding inconsistencies and lack of standardrequirements for monitoring and mitigation of environmentalimpacts. various techniques that comprise the existing piecemealapproach to restoration and enhancement of coarse sedimentresources were inventoried. We propose alternative strategies formanagement of coarse sediment that incorporate planning on asystem-wide (i.e. watershed) scale.
Key Words: darns, sediment transport, fisheries, fish ecology,regulatory permits, mining, reservoir management,channels
ii

! .
MANAGEMENT OF COARSE SEDIMENTIN REGULATED RIVERS OF CALIFORNIA
Table of Contents
Abstract ............................................................... iiTable of Contents iiiList of Tables .............•...•...............••.•.•. ivList of Figures v
Introduction 1
Scope and Objectives 3
Methods ...... .. ........... .. .. . ... .. ........ ... .. ........ 3
General Effects of Reservoir Construction and operation 5General Effects of Instream Gravel Mining 14
Reservoir Effects in California 19
Instream Gravel Mining Effects 30
Existing Policies: Reservoirs .•.............•......••. 34
Existing Policies: Gravel Mining .................... 40
Recent Restoration Efforts ......................... 44
Alternatives strategies for Coarse Sediment Management 49
Conclusions ........ .. ............................... 56
References .. .. ................................... - . 57
TablesFigures
iii

j .,
;:Table 1:
'Table 2:
Table 3:
Table 4 :
Table 5:
Table 6 :
Table 7:
Table 8:
Table 9:
List of Tables
Abbreviations Used in this Report
Inventory of Dams for Selected Basins
Merced River Basin: Inventory of DSD-Regulated Dams
Tuolumne River Basin: Inventory of DSD-Regulated Dams,
Calaveras River Basin: Inventory of DSD-Regulated Dams
Stanislaus River Basin: Inventory of DSD-Regulated Dams
Mokelumne River Basin: Inventory of DSD-Regulated Dams
Reservoir Sedimentation, Sierran Drainages
Reservoir Sedimentation, Coast Range Drainages
Table 10: Gages Downstream of Reservoirs on Selected Drainages
Table 11: Pre-Dam and Post-Dam Flood peaks for Selected Rivers
Table 12: Ratio of Post-Dam to Pre-Dam Peak Discharge and MaximumRecorded Floods Pre- and Post-Dam
Table 13: Channel Incision Below Dams
Table 14: Bed Coarsening Below Dams
Table 15: Examples of Fine Sediment Accumulation in Channel BedsBelow Dams
Table 16: Channel Incision from Instream Gravel Mining
Table 17: A Partial Inventory of Bridge Repair Costs Attributedto Instream Gravel Mining Through 1984
Table 18: Gravel Enhancement Projects
Table 19: Artificial spawning Channels Below Dams
iv

Figure 1:
Figure 2 :
Figure 3 :
Figure 4 :
Figure 5:
Figure 6:
Figure 7 :
List of Figures
Location Map of Principal study Basins
Impacts of Large Reservoir construction and Operationon Resources
Impacts of Instream Gravel Mining
Knickpoint Migration Following pit Excavation
Reservoir Sedimentation in Los Padres Reservoir,Monterey county, 1949-1980
Yuba River Incision During 1986 Flood
Jurisdictional and Non-Jurisdictional Dam andReservoir Sizes, Department of water Resources,Division of Safety of Dams
Figure 8: Sediment Movement after Middle Yuba River High FlowEvents
Figure 9: six Storm Hydrographs for Middle Yuba River below OurHouse Dam during 1987 to 1989
Figure 10: Middle Yuba River Cross-sectional Changes
Figure 11: Map Submitted with Reclamation Plan to Glenn county
v
Coarse Sediment Management in Regulated Rivers
INTRODUCTION
Coarse Sediment in River SystemsCoarse sediment (gravel and sand), generated by erosion in
upper reaches of a watershed, is delivered to the stream network,and transported through the network predominantly by large runoffevents. The coarse component of the total sediment load typicallymoves in rivers as bedload, by rolling, bouncing, and saltatingalong the bed, although in large floods and steep channels theselarger materials may move in suspension (Richards 1982). Bedloadcommonly constitutes from 2 to 6 percent of suspended load inlowland rivers, 8 to 16 percent in mountain streams (Collins andDunne 1990). The gravel fraction of this bedload is smaller still(and quite variable), but is of particular importance becausesalmon and trout depend upon gravels for spawning and incubationof their eggs. The size of gravel required for spawning varieswith the size of the fish, but median diameters suitable forspawning range from about 15 mm for small trout to about 50 mm forlarge salmon (Kondolf 1988).
The gravel yield of a watershed depends in large part on theunderlying lithology. For example, coarse grained granitic rockscommonly weather to coarse sand and granules (often referred to as"dgll for "decomposed graniten), with little gravel of sizessuitable for spawning. By contrast, volcanic lithologies commonlyweather to produce suitable spawning gravels, as well as abundantsuspended sediment.
Because coarse sediments constitute a small fraction of totalsediment load on most rivers, because the measurement of bedloadwas virtually impossible until recently (Emmett 1980), and becausepollutants commonly adsorb onto clays within the suspendedfraction, most management-related studies of sediment haveemphasized fine, suspended sediments. Suspended load is dominantespecially in large rivers, which tend to have lower gradients than

ICoarse Sediment Management in Regulated"Rivers
small rivers and streams (Richards 1982). Thus, the biggestreservoir sedimentation problems have involved deposition of finesediment, a fact reflected in the widespread use of the term"siltation" to describe reservoir sedimentation (Mahmood 1987,Vanoni 1975).
Problem statementDams interrupt the natural flow of sediment through a river
system by trapping gravel and some sand. Reservoir storagecapacity is lost, and the supply of gravel (needed by salmon andtrout for spawning) to downstream reaches is eliminated. Damschange the flow regime, typically reducing flood peaks, in manycases depriving downstream reaches of high flows needed to flushfine sediment from spawning gravels.
Instream gravel mines operate or have operated on many riversand streams, further reducing the supply of gravel available forspawning fish. By removing gravel from the transport system,instream mines deprive the river of its natural sediment load andcan_inducing downcutting, undermining bridges and other structures.Regulation of these gravel mines has proved difficult, even thoseoperating on reaches important to spawning salmon and when thesupply of gravel is known to be limiting fish population. Instreamgravel mining below dams pose an especially serious threat becauseof the lack of replenishment from upstream reaches.
Despite the occurrence of these problems in rivers throughoutthe state, to date there has been no attempt to develop a coherentstrategy for managing these coarse sediments in regulated rivers.It has not even been recognized as a general problem requiring acomprehensive treatment, but has been addressed only on a site-specific basis. Responses to these problems (by both dam operatorsand resource agencies) have been inconsistent from region to regionwithin the state.
2

Coarse Sediment Management in Regulated Rivers
This study was undertaken to provide a comprehensive, planninglevel examination of the problem, identifying interactions amongprocesses evident in diverse sites, and to suggest a more coherentapproach in place of the presently scattered and inconsistentpolicies around the state.
SCOPE AND OBJECTIVESThe objectives of this research were to assess the magnitude r
and nature of the problem of managing coarse sediments in regulatedrivers, to assess the impacts on the physical system of damconstruction and instream gravel mining by compilation of basicdata on hydrology, river channel, and aquatic habitat changes, toinventory and evaluate strategies currently employed by damoperators, gravel extractors, and resource agencies, and torecommend comprehensive approaches for management of coarsesediment to reduce environmental impacts and maintenance costs andto enhance existing degraded aquatic and riparian resources.
METHODSAt the outset of our study, we selected for detailed study a
set of basins on the western slope of the Sierra Nevada withsimilar lithology, aspect, climate, vegetation, land-use, andmanagement, from the Feather River south to the Merced River.Because of their importance for fisheries and pre-existingrecognition of coarse sediment management problems, we alsoselected the Sacramento River below Keswick Dam and the TrinityRiver below Trinity Dam. For these basins, we systematicallycompiled hydrologic data and sought data on changes in bed materialsize and channel geometry. We also sought information onmanagement strategies by reservoir operators. We were mostsuccessful in obtaining hydrologic information, but learned oflittle documentation of pre-dam bed material size and channel
3

, !
Coarse Sediment Management in Regulated RiversI
geometry, and encountered resistance to release of information onmanagement practices such as sluicing operations. Thus, weexpanded our scope to include basins elsewhere in the state forwhich data were available to illustrate the problems addressed inthis study.
To analyze changes in flow regime induced by reservoirs, wecompiled hydrologic data from the US Army Corps of Engineers(USACE), the US Geological Survey (USGS), the US Bureau ofReclamation (USBR), and regional water districts (e.g., East BayMunicipal utilities District, EBMUD, and the Monterey Peninsulawater Management District, MPWMD). We analyzed changes in flowregime by comparing flood frequency curves for pre- and post-darn,up- versus downstream gages, or regulated versus computed naturalinflow. We used existing flood frequency analyses where possible.
To measure the percentage of watersheds for which sedimentyield is now trapped by reservoirs, we compiled lists of dams(under jurisdiction of the California Department of WaterResources, DWR, Division of Dam Safety, DSD) for a set of river,~basins selected for study. The areas above each reservoir werecompiled and used in computation of unit sediment yield for thelargest, downstream reservoirs. We compiled reservoirsedimentation data from operating agencies and published sources,adjusting these values for upstream impoundments.
To document channel response to upstream reservoirconstruction and operation, and to instream gravel mining, wecompiled data on bed degradation and changes in bed material size.Bed degradation data were compiled from previous field work by theauthors, from discharge measurement notes at USGS gages, and frombridge maintenance files at the California Department ofTransportation in Sacramento. Bed coarsening below darnswas moredifficult to document because data on bed material size prior todam construction was generally not obtainable; in some cases we
4

Coarse Sediment Management in Regulated Rivers
inferred approximate pre-dam gravel sizes based on observedspawning activity. We collected data on current bed material sizesfrom reconnaissance-level field work, from agency reports, and fromunpublished data and observations by agency personnel.
We compiled data on problems of fine sediment accumulation ingravels below dams from published sources, agency and consultantreports, and discussions with agency personnel.
We interviewed dam operators and resource agency personnelregarding policies on coarse sediment management, such as sluicingof small diversion structures. We compiled information on gravelenhancement projects (volumes and costs) from agency personnel,agency reports, and unpublished data. Costs of other mitigationmeasures, such as flushing flows and removal of sedimentsaccumulated in reservoirs, were also compiled.
To document the degree to which instream gravel mining is nowregulated and monitored, we conducted telephone interviews with allcounty-level lead agencies to learn of the extent of instreammining in the jurisdictions, and any strategies used to monitor andevaluate the excavations and compliance with reclamation plans.
Based on results of the above studies, we developedrecommended strategies for management of coarse sediment thatrecognize the interactions among the effects of diverse activitiesand attempt to view the problems in a basin-wide context.
GENERAL EFFECTS OF RESERVOIR CONSTRUCTION AND OPERATIONAlthough dams are constructed and operated for a wide variety
of purposes including water supply (residential, commercial, andagricultural), flood and/or debris control, and hydropowerproduction, they share many of the same effects on their riversystems. All dams trap sediment to some degree, and most alter theflood peaks and seasonal distribution of flows.
5

! '
'; [ r :
Coarse Sediment Management in Regulated Rivers
At this point it is useful to distinguish the effects of smalldiversion dams (common in the sierra Nevada but frequentlyoverlooked) from the effects of larger dams. Most of the followingdiscussion applies primarily to larger dams, but in this study wehave also considered management of the small diversion structures,which have relatively little effect in modifying flood peaks andlimited capacity to store sediment, but to maintain operationalintegrity, sediments must be mechanically removed or sluiced fromthem. Sluicing can alter the timing of delivery of sediment todownstream reaches. /
Reservoir Sedimentation.Dams interrupt the flux of sediment through the river system.
As a result, reservoirs trap all of a river's bedload and a portionof the suspended load that depends upon the ratio of inflow tocapacity (Brune 1953). Large reservoirs such as Clair Engle Lakeon the Trinity River have trap efficiencies of essentially 100%,while small reservoirs like San Clemente (on the Carmel River) havetrap efficiencies as low as 21% (estimated at 60% after closure,since reduced by sedimentation)(Matthews 1988). Small diversionponds may fill with sediment in a single wet year, as occurredbehind Log Cabin Dam on Oregon Creek, Our House Dam (also listedas "Hour House") on the Middle Yuba River, and other suchstructures in 1986.
In most cases, reservoir sedimentation is an undesirablebyproduct of reservoir construction and operation. In some cases,however, reservoirs have been constructed specifically to trapsediment. One such dam was completed last year on Grass ValleyCreek, a tributary to the Trinity River below Lewiston Dam, toreduce the tributary's sediment input to the mainstem (D. Denton,DWR, personal communication 1991).
6

Coarse Sediment Management in Regulated Rivers
More massive projects were undertaken in the Sierra Nevadaunder the California Debris Commission through 1940. A number of"debris dams" were constructed for the purpose of trapping sedimentintroduced by hydraulic mining, thereby isolating the effects ofhydraulic mining from urban and agricultural areas downstream(Yeend 1974). Englebright Dam was constructed as a debris dam but \~was subsequently retrofitted for hydropower production. In someother cases, debris dams have been abandoned. An example is thedebris dam on Slate Creek in the North Yuba watershed about 0.5miles upstream of the Oroville-Wyandotte Irrigation District (OWID)
v diversion structure, which filled with sediment (largely gravel)and was illegally dynamited in the 1960's by placer miners seekingto liberate the gravel stored behind it. The dam now has a largecrack through which sediment stored in backwater deposits upstreamis metered out at flood stage, creating sediment problems for theOWID diversion structure downstream. No agency is willing to takesteps to address this problem because none wishes to becomeresponsible for the dam and its safety (Kondolf 1986).
Reservoir Filling with Sediment.UItimately, all reservoirs can be expected to fill with
sediment. If current sedimentation rates (presented below) areprojected into the future, most large reservoirs have lifetimes ofa century of more. However, sedimentation rates will increase ifsediment yields from the watershed increase, as may occur fromchanges in land use.
Many small reservoirs have already largely or completelyfilled with sediment, such as the small impoundments behind PG&Ediversion dams (discussed below). Another example is the formerSweasey Dam on the Mad River near Arcata, which filled rapidly withsediment and was removed in 1970; sediment stored in the reservoirwas transported downstream in subsequent high-flow years (R. Kiah,
7

· j
Coarse Sediment Management in Regulated Rivers
Caltrans, personal communication 1991). Unfortunately, thedownstream migration of this sediment (as a pulse or dispersed) wasnot well documented. Since 1970, the mouth of the Mad River hasmigrated northward, threatening Highway 101, but it is not clearwhether this effect was due to release of sediment from SweaseyDam, from instream mining, or other causes (G. Heise, CDFG,personal communication 1991).
A dam on Malibu Creek has completely filled with sediment,and there is interest in having the dam removed among local groupsand the California Department of Parks and Recreation (CDPR), whichnow owns the site. The dams blocks upstream migration for thesouthernmost remnant run of steelhead trout in California.However, the cost and logistical difficulties of operating withinthe confines of the canyon, as well as liability for possibledownstream impacts, has prevented any such action to date (T.Taylor, CDPR, personal communication 1989).
Once a reservoir fills with sediment, most of its originalfunctions are lost: water storage for water supply, flood control,etc. In cases of small diversion dams, water storage is not anissue, but if sediment fills the reservoir to the intake level,bedload may be transported into tunnel or penstock intakes,potentially damaging structures. Moreover, DSD regulations requirethat low-level outlets be operable so that reservoirs can be drawndown in emergency situations (OSD 1991). Low-level outlets arerendered inoperable in reservoirs completely filled with sediment.Maintenance of low-level outlets appears to be a principal reasonfor sediment removal from small diversion dams. Many older damsare not equipped with low-level outlets, and thus have no suchrequirement.
Once sediment has completely filled-in behind a smalldiversion dam, bedload can pass over the top of the structure, andthe dam no longer interrupts the natural flux of sediment through
8

Coarse Sediment Management in Regulated Rivers
the river system. The dam simply acts like a large waterfall. Itmay block fish passage and have other effects, but it no longerinterrupts the continuity of sediment transport.
One aspect of this problem appears to have been unaddressedin the literature: .the potential for dam failure resulting fromtransport of bedload through outlet works. Bedload should have'agreater potential for abrasion and erosion than clear water,potentially increasing the risk of damage to the dam and itsability to pass large floods safely. We have examined some smallconcrete-arch diversion dams in the Sierra over which bedload wastransported, at least in the February 1986 event, and we detectedno evidence of accelerated spillway abrasion. It is probable thatearthen dams would be more vulnerable to failure in this fashionbecause destruction of the spillway could potentially exposereadily entrained sediment constituted the bulk of the structure.The potential for increased abrasion and risk of structural damageis an engineering question for which we do not possess expertise.However, it remains unclear to us whether this potential hazard is,in fact, not serious, or whether there has been no encouragementwithin engineering community to raise such an uncomfortablequestion.
Another curious aspect of the reservoir filling problem isthat once the reservoir has completely filled, its capacity fallsunder the 15 ac-ft minimum size for jurisdiction by DSD. TheMalibu Creek reservoir is an example (D. Babbitt, DSD, personalcommunication 1991). It is unclear whether this loophole wouldapply only to older structures not equipped with low-level outlets,or if it would apply to any reservoir that completely filled.
Once a reservoir has filled with sediment, it can be left asis (trusting that abrasion will not destabilize the darn outletworks), the sediment behind it could be removed, or the darncouldbe removed. Removal of sediment from small reservoirs can cost
9

· !
Coarse Sediment Management in Regulated Rivers
upwards of $100 per cubic foot, depending upon access and distanceto a disposal site (E. stassevich, PG&E Hydro-Generation, SanFrancisco, personal communication 1987). As discussed below, thepotential for exploitation of these sediments as aggregate has beeninadequately explored in most parts of the state. As pollutantshave been termed "resources out of place" (Miller 1990), so thecoarse sediments accumulated in reservoirs can be viewed aspotential sources of aggregate.
Removal of dams completely filled with sediment can result incatastrophically increased delivery of sediment to downstreamreaches, potentially overwhelming the channel, resulting inaggradation and destabilization. The change in sediment load wouldnot be fully apparent until the first high flow following damremoval. Thus, several years could pass before the newly availablesediment migrated to downstream reaches.
In the case of concrete dams, it may be possible to removethem in stages, so that the sediment could be metered out todownstream reaches, reducing the risk of catastrophic channelchange. In the case of earthen dams, however, no such optionexists. Once the hardened superstructure was removed, the earthenmaterial constituting most of the dam would be readily entrainedby high flows and dam would be rapidly destroyed, much as occurredwith the Auburn cofferdam in February 1986.
Downstream Coarsening and Incision.While a review of the relevant geomorphic and hydrologic
literature shows a proliferation of reports on the physicalcharacteristics of the channel downstream that have been alteredby dam construction in the last two or three decades, it is onlyin the last ten years that information on the ecologicalconsequences of these changes has become available. The physicaleffects described in the literature include bed degradation or
10

Coarse Sediment Management in Regulated Rivers
incision, bed coarsening or armoring, decreased sediment transportof downstream tributary derived materials, tributary incision,changes in channel geometry and capacity , and encroachment ofriparian vegetation. (In this study, we use the terms bed"degradation" and "incision" synonymously.) These changes inducedby dam construction and reservoir operation are the result of theinterruption of the movement of sediments through the river systemand alteration of the pre-dam flow regime. The chart in Figure 2links these direct effects of dams with the physical changes whichresult and finally the ecological impacts downstream. Thefollowing paragraphs describe these changes and their associatedimpacts in more detail.
Channel degradation is generally observed below dams becausethe reservoirs commqnly trap all of the bedload and a substantialportion of the suspended load derived from the upstream watershedand release clear water. This water is often termed "hungry" waterbecause it possesses stream power greatly in excess of its reducedsediment load and is often sufficiently capable of eroding its bedand banks in an effort to regain its "equilibriumll sediment load.Incision below dams is most pronounced in rivers with fine-grainedbed materials and in those which have lesser impacts on flood peaks(Williams and Wolman 1984). In gravel-bed rivers, a stable, coarsesurface layer is typically observed to develop (the process isoften called "armoring") below reservoirs as finer materials arewinnowed downstream by the hungry water (Williams and Wolman 1984).This armor layer will continue to develop and coarsen until thematerial is no longer capable of being moved by the reservoirreleases or spills. The magnitude of bed degradation depends uponthe reservoir operation, channel characteristics, and the sequenceof flood events following dam closure. For example, up to 6 metersof bed degradation have been observed on the Colorado River belowDavis Dam (Williams and Wolman 1984) and numerous other examples
11

Coarse Sediment Management in Regulated Rivers
of channel downcutting in the 1-3 meter range are presented inWilliams and Wolman (1984) and Petts (1984). Examples of armorlayer development are described by Borland and Miller (1960),Harrison (1950), and Williams and Wolman (1984).
The ecological impacts from this bed coarsening are primarilycentered around changes to, and loss of, aquatic habitat foranadromous fisheries. In many cases, the channel bed coarsens tosuch an extent that the fish are no longer able to create spawningnests, or redds. In extreme cases, virtually all of the alluvialmaterial is removed and only boulders and bedrock remain.
The availability of spawning gravels can also be reduced belowdarnsas a result of channel incision, in which formerly submergedgravel beds are isolated as terrace or floodplain deposits and fromelimination of gravel recruitment from bank erosion as encroachingvegetation stabilizes banks (e.g., Hazel et al. 1976, p.496).
Changes in Sediment Transport DownstreamDecreased sediment transport below reservoirs has been
documented in many rivers (Williams and Wolman 1984) due to thesediment trapping ability of the reservoirs, and the sediment loadof most of these rivers does not recover to the rate upstream ofthe reservoir despite downstream tributary contributions. Thecombination of flow regulation and sediment trapping by reservoirsSUbstantially reduces the amount of sediment available for beachreplenishment. Further upstream, both the capacity and competenceof the river in terms of sediment transport is reduced due tochanges in flow regime, and in many cases, streamflow is notcapable of flushing tributary-derived sediments through themainstem. Tributary sediment delivery rates may be accelerated byland use changes or by incision of the tributary channel as aresult of the desynchronization of tributary and mainstem peakflows due to lags from reservoir storage effects, or through base
12

Coarse Sediment Management in Regulated Rivers
level lowering from streambed degradation in the mainstem. Theimpact of tributary sediment loads in excess of the mainstem'sability to transport them lies in the deposition of fine sediments,generally sand-sized material, in remaining spawning gravels, ifany, which will fUrther reduce spawning success. Examples of theseeffects are described in King (1961), Hathaway (1948), Warner(1981), Kellerhals and Gill (1973), Petts (1984), and Williams andWolman (1984).
Channel Geometry ChangesChanges to downstream channel geometry are caused by the bed
degradation and due to a reduction in the frequency and magnitudeof flood scour from regulation which permits riparian vegetationto encroach into the active channel. While variations exist dueto differing reservoir operations, in many rivers the channelgeometry adjusts to a shape in equilibrium with the post-damdominant discharge. Unfortunately, most of the documentation ofreported changes are not accompanied by data on the change in flowregime that produced the channel adjustment (Petts 1984, Gregory1987). Increases in width are typically found below reservoirsoperated for hydroelectric power generation, in which rapid changesin stage are common and the channel contains water most of thetime. Channels that experience low flows during much of the yeartend to experience decreases in width through the encroachment ofvegetation and deposition of sediments along the channel marginsas a result of the increased hydraulic roughness from thevegetation (Williams and Wolman 1984). While the encroachment ofvegetation produces certain positive habitat values, such as coverand shading of the stream channel, in many cases, the channelbecomes too uniform and, with the absence of large flood peaks, sostable that the natural diversity caused by a certain amount ofbank erosion and channel migration is eliminated.
13

Coarse Sediment Management in Regulated Rivers
.The regulation of rivers through dam construction has producedmany beneficial results for society, although the environmentalcosts of these benefits have all too frequently been overlooked.By understanding the effects caused by this regulation, it ispossible to develop management techniques that may be able topartially mitigate these impacts.
GENERAL EFFECTS OF INSTREAM GRAVEL MININGDemand for Aggregate from Active Streambeds
Instream gravel mining is the other significant human activitythat affects the movement of coarse sediment through a riversystem. Sand and gravel are used for a large variety ofconstruction activities including roads and highways (base materialand asphalt), pipelines (bedding), septic systems (drain rock inleach fields), and concrete (aggregate mix) for highways andbuildings. River sediments are typically of excellent qualitybecause natural river processes eliminate weak materials byabrasion and attrition, and the resulting deposits are durable,rounded t well-sorted, and relatively free of interstitial finesediment.
With the rapid population growth and consequent constructionboom in California, the demand for aggregate has been strong. In1986, the production of sand and gravel in California, primarilyderived from river channels and their floodplains was estimated at128,500,000 tons with an estimated value of nearly $500,000,000(Sandecki 1989). This amount is almost double the estimatedproduction of 65,000,000 tons in 1955.
The aggregate available from active riverbeds is especiallydesirable because it requires little processing (having been washedby fluvial processes) and, commonly, little transportation becausesui table stream gravel deposits are typically located near themarkets for the product. Transportation costs are especially
14

Coarse Sediment Management in Regulated Rivers
important to the industry, because the material itself isessentially free except for processing. A rule-of-thumb is thatthe cost of the product doubles with each 25 miles of transport(Randy Sater, Teichert Construction Company I personal communication1991).
Until recently (and still in many areas) environmental costsof instream gravel extraction have not been factored intoproduction costs, making instream sources more attractive thanalternatives such as dry terrace mines (in which interstitial finesediment content is often greater, requlrlng additionalprocessing), quarries (from which rock must be crushed, washed,and sorted), or distant sources, such as reservoir deltas,involving greater transportation costs.
In this study, we define five types of mining of gravel withinthe channel and floodplain: dry-pit and wet-pit mining in theactive channel, bar skimming, and dry-pit and wet-pit mining on thefloodplain. In-channel pit mining involves excavation of a pitbelow the thalweg (lowest point in the stream cross section). Dry-pit refers to pits excavated on dry ephemeral stream beds withconventional bulldozers, scrapers, and loaders; wet-pit requiresuse of a dragline or hydraulic excavator to extract gravel frombelow the water table level or in the stream itself. Bar skimmingrefers to scraping of the top layer (of variable thickness) froma gravel bar without excavating below the summer water level.Floodplain pit mining refers to excavation of pits on the currentfloodplain or adjacent river terraces. In some cases these pitsare constructed adjacent to the active channel, separated only bya small levee.
The first three types of mining are clearly operations in theactive channel and are defined as instream gravel mining in thisstudy. Floodplain mining, on the other hand, is isolated from theactive channel, at least in the short term. However, it is likely
15

Coarse Sediment Management in Regulated Rivers
that during major floods these floodplain operations may becomepart of the active channel through bank erosion and/or channelavulsion, and is considered potentially instream. The risk ofchannel changes is greatly reduced where large upstream reservoirsare able to completely control even floods as large as the 100-yearflood. In these cases, floodplain mining could be consideredgeomorphically distinct in the near term. Terrace mining that isgeomorphically distinct from the active floodplain falls in anothercategory and is not directly considered in this study.
Depending on the type and amount of mining, the physicaleffects of sand and gravel extraction range from beneficial floodcontrol and channel stability enhancement through control ofchannel aggradation (Griffiths 1979), a situation uncommon inCalifornia at present, to the destruction of aquatic and riparianhabitat through large changes in channel morphology (Woodward-ClydeConsultants 1976). Impacts described in the literature include:bed degradation, bed coarsening, lowered alluvial water tables, andchannel instability. These physical impacts result in degradationof riparian and aquatic ecology, and in undermining of bridges andother structures (Figure 3).
Incision Produced by Instream MiningAs noted above, the sediment in the bed of rivers is not a
static feature, but is a dynamic feature, in transit through thesystem during floods. The flux of bed sediment depends on thesupply of coarse sediment from the watershed and the transportingpower of the river, and transport rates vary over space and time.The size and shape of the stream channel reflects its prevailingflow and"sediment load (Leopold et al. 1964). If the sediment fluxis altered, the river channel is likely to adjust to the changedcondi tions. Instream gravel mining, by removing sediment from thiscontinuum, disrupts the preexisting balance between sediment supply
16

Coarse Sediment Management in Regulated Rivers
and transporting power.The concept of "replenishment ratell is commonly applied to
instream gravel mining to specify acceptable levels of sustainedyield. The notion is that if the harvest rate does not exceed therate at which coarse sediment is delivered from upstream, theharvesting can be sustained without impact on the channel system.However, when viewed in the larger context, this extraction sitecan be seen as the "upstream" from which downstream reaches derivetheir coarse sediment supply. If the sediment in transit throughthe system is rerouted out of the channel into gravel trucks, theflow of gravel is interrupted and downstream reaches are deprivedof their sediment load. One effect of this is essentially thecreation of hungry water downstream of extraction sites, and theriver will typically expend its excess stream power by eroding bedand banks. Thus, channel incision and instability may resultdownstream of extraction sites even if the extraction rate does notexceed the "replenishment rate."
The most dramatic effects of instream mining occur when pitmining is conducted within the active channel. By excavating largepits, whether shallow or deep, the "equilibrium" profile of thestreambed is altered and the channel must adjust to the locallysteeper gradient upon entering the pit (Figure 4). This steepergradient creates a stream power excess which is generally capableof eroding the bed. This process is known as "headcutting" or"knickpoint migration", and the effects may translate upstream forconsiderable distances. Continued extraction may cause the entirestreambed to degrade to the depth of excavation. As the streambeddegrades, the material remaining on the surface will coarsen as thefiner material is more easily transported leaving a coarse lag, andan armor layer similar to that seen downstream of dams forms. Insevere cases, the degradation will continue until bedrock or oldersubstrates under the recent alluvium are uncovered. Pit excavation
17

Coarse Sediment Management in Regulated Rivers
will also induce bed degradation downstream, because much of theincoming sediment load will be trapped in the backwater created bythe pit llreservoir", and relatively clear water will exit thedownstream end of the pit.
Gravel bar skimming withdraws sediment from the transportsystem and thus alters supply to downstream reaches, but thevolumes removed are typically less than pit mining. Gravel barskimming, even when rates are less than "replenishment", can havea profound impact on channel geometry by creating a wide flat crosssection that changes the channel hydraulics, eliminating channelconfinement and removing the "pavement," the coarse surface layerthan occurs on many natural river beds and appears to regulaterates of bedload transport. When rates are in excess ofreplenishment, bed coarsening and degradation may occur downstream,and these effects can propagate upstream much as the knickpointcreated by pit mining (Matthews and Associates 1991). Anotherimpact of pavement removal is exposure of finer subsurface materialto entrainment at low flows; this fine sediment may be transporteddownstream to be deposited in gravels and in pools (Matthews andAssociates 1991).
Incision has many direct effects, notably the undermining ofbridge piers and other structures. The cost of such damage tobridges through 1984 in the state probably exceeded $12 million,as discussed below. Degradation can induc~~ ~hannel instability /'and trigger bank erosion and channel migration in formerly stablereaches. The physical alteration of the stream channel may resultin destruction of existing riparian vegetation and reduction ofavailable area for seedling establishment. Loss of vegetationimpacts riparian and aquatic habitat by loss of temperaturemoderating effects of shade and cover, and habitat diversity. Asnoted in the section on reservoir impacts, bed coarsening resultsin loss of spawning gravels for sa1monids. Extensive degradation
18

Coarse Sediment Management in Regulated Rivers
may induce a decline in the alluvial water table, as the banks areeffectively drained to a lowered level. Lowered water tables haveaffected riparian vegetation and water supply wells (Woodward-ClydeConsultants 1976).
By eliminating channel confinement,reduces habitat diversity, resulting in alacking in the pools and cover needed by fish, and potentiallyincreased water temperatures.
By virtue of its removal from the active channel, terrace-pitmining (wet and dry) generally does not impact coarse sediment fluxin the channel. However I many of these pits are separated from theactive channel only by levees; in some rivers, these levees havebeen breached during floods, and the channel has avulsed ormigrated into the pits, resulting in an unstable, chaotic channelconfiguration.
gravel bar skimmingwide, shallow channel
RESERVOIR EFFECTS IN CALIFORNIADensity of Reseryoirs in California
California rivers are highly regulated. Among the state'slarge rivers, only the Smith remains unregulated. Many west-slopeSierran drainages are now a staircase of dams and reservoirs, withflow largely routed through tunnels and canals for powerproduction. There are 1212 dams regulated by the CaliforniaDepartment of water Resources Division of Safety of Dams (DSO) andanother 144 dams operated by the federal government withinCalifornia (DWR 1988).
There are many small dams that are considered too small to beregulated and are not included in these figures: dams that 1) areless than 25 ft in height and that impound less than 50 ac-ft, or2) are less than 6 it in height regardless of size of impoundment,or 3) impound less than 15 ac-ft regardless of height (DWR 1988).Although DSD maintains no listing of non-jurisdictional dams, they
19

Coarse Sediment Management in Regulated Rivers
could be identified from records in the Division of water Rights.The number of these smaller, non-jurisdictional dams is suggestedby the change in the number of jurisdictional dams that accompanieda relaxing of the jurisdictional size in the 1930's. The originallegislation establishing state regulation of dam safety, passed in1929 in the aftermath of the Saint Francis Dam failure, requiredthat the state regulate dams greater than 15 ft in height, 30 ac-ft in capacity. The jurisdictional size was increased to thepresent 25-ft height and 50-ae-ft capacity during the depressionto reduce costs. This action cut the number of jurisdictional damsroughly in half (D. Babbitt, DSD personal communication 1991).
For the central west-slope Sierra, our inventory of dams ispresented in Table 2. In addition to DSD-regulated dams, thistable includes a listing of smaller structures operated by PacificGas and Electric Company (PG&E) (PG&E unpublished data). Non-DSD 1,/'
dams operated by other agencies are not included in this tabulationbut may be numerous. In the highly regulated stanislaus Riverbasin, there are 40 dams upstream of the major downstream dam. Wepresent detailed tabulations of upstream dams in five of thesecentral west-slope basins in Tables 3-7.
Despite their numbers, these smaller upstream dams are dwarfedin effect by the large downstream reservoirs located in thefoothills. For example, in the Stanislaus River system, the 40upstream dams account for only 16% of the total basin impoundment;the major downstream dam, New Melones, impounds 84%. In manycases, dams were located at or near these downstream sites earlyin the century, but the dams were enlarged in the 1960's or 1970's(Table 2).
Upstream DamsThe smaller upstream dams are typically operated very
differently from the major downstream projects. Many of the small
20

Coarse Sediment Management in Regulated Rivers
structures are diversion dams without significant storage (andcommonly smaller than DSD-jurisdictional size) that serve only toprovide favorable conditions for operation of tunnel intakes (e.g.,Log Cabin Dam on Oregon Creek). Many of these structures are partof high-head hydroelectric projects and operate in a "run-of-the-river" mode, that is without enough storage to affect the seasonaldistribution of flows. However, by virtue of nearly constantdiversions from the river, they have a proportionally greaterimpact on low flows.
In other cases, upstream dams have enough storage tosignificantly affect the seasonal distribution of flows. Anexample is the New Spicer Meadows Dam in the Stanislaus Riverbasin (Table 6). This reservoir stores snowmelt (and rain-an-snow)runoff for gradual release through the summer, resulting in ananticipated 10-fold increase in summer base flows in much of theNorth Fork Stanislaus River (Calaveras County Water District 1985).
There is little consumptive use of water from the upstreamimpoundments. Mostly, water is stored seasonally or shifted toadjacent drainages. Some upstream reservoirs may store waterseasonally, but typically do not have capacity for significantinterannual storage. There are numerous interbasin diversions inwest-slope Sierran drainages, typically to maximize powergeneration. For example, Slate Creek in the North Yuba drainageis dammed and diverted via tunnel into the South Fork Feathersystem. Another example is the Middle Yuba, which is diverted atOur House Dam via tunnel into Oregon Creek, and thence via tunnelinto the North Yuba River to augment storage in New Bullards BarReservoir. (The Yuba River system is unusual in that thedownstream-most reservoir is not the largest reservoir.Englebright Dam was built to trap debris from hydraulic mining with70,000 ac-ft capacity; upstream on the North Yuba, New Bullards Barhas 969,000 ac-ft capacity.)
21
Coarse Sediment Management in Regulated Rivers
The upstream dams are also distinctive in the fish resourcesthey affect: resident trout and non-game species. Anadromoussalmonids cannot migrate past the downstream dams, so the fishresources are limited to resident populations, which by nature aresmaller and require less suitable spawning gravel to naturallymaintain themselves.
The upstream dams, by virtue of their smaller capacities, aremore vulnerable to filling by sediment, but it is also easier toremove sediment from them mechanically or by sluicing, as discussedbelow.
Major Downstream DamsThe large dams, commonly located in the foothills, have
effected massive changes upon the hydrology, sediment transport,and aquatic ecology of west-slope Sierran rivers. The nature ofthese hydrologic changes is discussed below. The large d~ms alsotrap all bedload and most suspended load, depriving downstreamreaches of upstream gravel supply. As a result, spawning gravelsmay be progressively lost from the system, with recruitment of newgravels limited to bank erosion and tributary contributions. Asdiscussed above, incision is common below these dams.
The most significant ecological effect of these dams hasprobably been prevention of anadromous salmonids from reachingtheir natal spawning grounds. This single effect has beendevastating to ~almonid populations throughout western NorthAmerica, resulting in the extinction of numerous races adapted tospecific drainages. Now that anadromous salmonids are limited tospawning in reaches downstream of the major dams (and in a fewunobstructed tributaries), the next most important impact is thealteration of flow magnitUde, timing, and temperature, as well asloss of young fish to diversions (Hallock 1987, CACSST 1988,USRFRHAC 1989). For example, because of storage of snowmelt runoff
22

Coarse Sediment Management in Regulated Rivers
by Shasta Dam and effects of heated irrigation return flow, themainstem Sacramento River may reach temperatures lethal to salmonsmolts by the end of May, so only smolts that leave early can out-migrate successfully. The rest (probably a majority) successfullyfollow tributaries (such as the American) to the Sacramentoconfluence, where they are killed by thermal shock (F. Meyer, CDFG,personal communication 1991).
As we discuss other effects of these large dams, it is wellto keep in mind that anadromous salmonid populations are mosturgently threatened by flow reductions, cut-off of upstreamspawning grounds, and commercial harvesting offshore. However,the sediment-related problems we discuss here are important, andwill assume greater importance if these more urgent threats to thefish are resolved.
Reservoir SedimentationData on reservoir sedimentation rates were surprisingly rare
in recent decades. In general, large reservoirs have not beenresurveyed since the 1940's, presumably because of budgetlimitations and confidence in the adequacy of reservoir capacitywhich allowed for sedimentation in the reservoir design and sizing.Smaller reservoirs such as the Carmel River reservoirs have beensurveyed more frequently, probably because lifetimes of thesereservoirs are shorter and because of the increasing demand for thewater resources from the growing communities that depend upon them.Many large reservoirs have not been surveyed in recent years,including Pardee and Camanche reservoirs on the Mokelumne, whichhave not been surveyed since 1943 (T. Linville, EBMUD, personalcommunication 1991); Folsom reservoir on the American (J. Maglinte,USBR, personal communication 1991); Soulajoule, Nicasio, and Kentreservoirs in Marin County, which have never been resurveyed (R.Arena, MMWD, personal communication 1991); Calaveras and San
23

Coarse Sediment Management in Regulated Rivers
Antonio reservoirs in Alameda County, which have never beenresurveyed (E. stewart, SFWD, personal communication 1991).
Table 8 presents reservoir sedimentation data provided to usby operating agencies or drawn from older surveys for Sierranwatersheds, where sediment yields are typically 0.1-0.4 ac-ft/mi2/yr. Coast range watersheds (Table 9) may yield over 1 ac-ft/mi2/yr due to more erodible lithologies.
The sediments filling these reservoirs are not all coarse,but few data are available to describe the variations in sizewithin the reservoirs. In general, gravels and sand are depositedin deltas prograding into the reservoirs from their upstream ends.However, sediment distributions are complicated by fluctuatingwater levels within the reservoirs. When reservoirs are drawndown, the influent channels incise through the delta deposits, andthe locus of deposition shifts farther into the reservoir.
In Tables 8 and 9, sediment yields per unit area are presentedfor the reservoirs using the entire upstream drainage area and foronly the area unregulated by upstream impoundments. The rationalefor this practice is that upstream reservoirs trap sediment derivedfrom their watersheds, so these areas should not be included indrainage area computations. This should be true for bedload, butnot suspended load, especially given the potentially low trapefficiencies for smaller upstream impoundments.
Land-use practices in the watershed may increase sedimentyields and thus sedimentation rates in the receiving reservoirs.such Changes may have already occurred since the 1940's, the lasttime some reservoirs were surveyed. Thus, projection of historicrates may not accurately indicate future sedimentation. Becauseof increased timber harvest in the watershed above PardeeReservoir, the East Bay Municipal utilities District (EBMUD) hasinitiated studies of cumulative watershed effects and developmentof sediment budgets for watershed lands so that potential impacts
24

Coarse Sediment Management in Regulated Rivers
can be understood, and perhaps controlled before consequences havebecome severe.
The effects of fire in increasing sediment yield and reservoirsedimentation rates are well-documented in central and southernCalifornia. Los Padres Reservoir on the Carmel River experiencedan average annual sedimentation rate of 19 ac-ft from 1947-1977,22.5 ac-ft from 1978-1980. However, in the year 1977-1978, 555 ac-ft of sediment was deposited as a result of increased sedimentyield resulting from the Marble-Cone Fire and heavy runoff over thefollowing winter (Figure 5).
Hydrologic AlterationsPrincipal downstream gages on selected major drainages are
listed in Table 10. In many cases, gages have been operating sincethe turn of the century; in others, since about 1940. Commonly,one finds that stream gaging did not begin until shortly beforewater development works were undertaken, so it may be difficult tocompare river hydrology before and after the project. Moreover,the extreme interannual variability in streamflow in Californiameans that the same hydrologic record could produce very differentflow statistics if different periods were sampled. Accordingly,most of the pre-dam data compiled in Tables 11 and 12 were computedby the USACE using reservoir storage changes. Data sources arepresented in Table 12.
The principal hydrologic modification effected by the largedams has been a reduction in flood peaks (Tables 11 and 12).Larger reservoirs such as New Exchequer and New Don Pedro arecapable of swallowing even the 100-yr floods, with releases lessthan 10% of inflow. (The degree of modification depends onoperations rules as well as capacity.) Smaller dams such as CampFar West have little effect on the 100-yr flood peak. All thesedams have reduced the magnitude of floods with return periods of
25

Coarse Sediment Management in Regulated Rivers
5 years and less.These hydrologic modifications have potentially profound
implications for channel form and sediment transport downstream.As discussed above, when the bankfull discharge, generally the 1.5-2.0 yr flow (Leopold et aL, 1964), is reduced, the channelsdownstream may adjust by narrowing (Williams and Wolman 1984). 'Similarly, the decreased frequency of high flows results in aproportionally greater decrease in sediment transport. One effectof this is reduced frequency of mobilization of gravel beds, sothat grains can become interlocked and difficult for spawning fishto move. A related impact is coarsening of bed material below damsresulting from winnowing of finer sediments without fresh supplyfrom upstream, as discussed below.
Fine sediment delivered to the channel from tributary andother sources may accumulate because flows capable of moving it nolonger occur. In many channels below dams, fine sediment hasaccumulated, impacting not only spawning gravels, but pool andcobble habitat as well (the details are described in a followingsection) .
The effects of timing of tributary and mainstem peak areillustrated by Cottonwood Creek near Redding, which reached itspeak discharge in 1986 while the Sacramento River was also high.Normally, the USBR would operate Shasta Dam to reduce flow in themainstem Sacramento when high flows were expected from tributariessuch as Cottonwood Creek. In the 1986 storm, however, the rainfallintensities telemetered from the Cottonwood Creek basin were sogreat that the USBR personnel assumed the instrument wasmalfunctioning and did not reduce flow in the mainstem. Thus thehigh flow in cottonwood Creek joined the already high SacramentoRiver, causing a backwater effect in Cottonwood Creek and resultingin extensive deposition of gravel for 0.5 mile above the confluence(K. Buer, DWR, pers. comm. 1989).
26

Coarse Sediment Management in Regulated Rivers
Incision and Coarsening belQw ReseryoirsExamples of channel incision below dams in California are
presented in Table 13. This listing is only partial because oftime limitations, but would probably expand considerably if moreextensive historical research could be undertaken. Documentingsuch channel changes requires searching out sequential bridgesurveys in state and county files, retrieval of old gaging stationrecords from Federal Storage in San Bruno, and other sources ofdata as described by Kondolf and Sale (1985). For the large numberof rivers studied here and the range of impacts being addressed,compilation and analysis of these data were simply not possible.Nonetheless, the large body of literature documenting these effectsin rivers outside California argues that such impacts wouldmanifest in many California rivers.
The magnitude of incision below dams is related to bedmaterial size and post-dam flood regime. Finer grained substratesshow greater incision (Williams and Wolman 1984), while armor layerdevelopment in gravel bed rivers limits ultimate incision.
Incision below dams will proceed episodically, when reservoirreleases or spills exceed the critical shear stress for theinitiation of bed material movement. To the extent that reservoirsreduce the frequency of these high flows from pre-dam conditions,the rate and ultimate magnitude of incision will be limited. Asthe bed coarsens, the threshold of entrainment progressivelyincreases. Moreover, incision directly below the dam results ina decrease in channel gradient. The effect of these two processesis to fUrther reduce the progress of incision.
Counteracting these negative feedback processes is a tendencyfor the channel to narrow from vegetation encroachment. As thechannel narrows, shear stress is locally increased by virtue ofconcentration of flow within a narrower cross section, resulting
27

Coarse Sediment Management in Regulated Rivers
in greater depths for a given discharge.The capacity and operation of reservoirs will determine the
relative magnitude of incision and bed coarsening. A largereservoir that effectively swallows all flood flows will result indrastically reduced frequency of bed entrainment and thus limitsthe rate of incision downstream (e.g., Trinity Dam on the TrinityRiver, where Q2 was reduced from 16,000 cfs to about 300 cfs byregulation) (Tables 11 and 12). Conversely, reservoirs with limitedcapacity and/or operations that do not include a flood controlcomponent (e.g. irrigation or municipal water supply reservoirs)will have relatively little effect on flood flows, so the bed willbe mobilized at roughly pre-dam rates. As a result, incision willproceed rapidly, limited only by coarsening and gradient reduction(e.g., San Clemente Dam on the Carmel River, where post-dam Q2 iswithin a few percent of pre-dam values in all but extremely dryyears) (Matthews 1987).
An example of rapid incision occurred on the Yuba River belowEnglebright Dam during the 1986 flood. Englebright was constructedin 1940 as a debris dam to eliminate the continued flux ofhydraulic mining debris downriver. The channel below the dam priorto 1986 was floored with large cobbles and boulders, apparently asa result of incision and coarsening following darn construction.USGS gage records indicate that the channel at the gaging stationhad been stable for many years, probably the result of the verycoarse armor layer which protected the bed. However, the February1986 flood was apparently large enough to mobilize even thisboulder-scale bed material and cause up to 4 feet of incision asdocumented by sequential cross sections at the USGS gage (Figure6).
Selected examples of bed-material coarsening below dams inCalifornia are presented in Table 14. This listing includes some
28
Coarse Sediment Management in Regulated Rivers
entries based on anecdotal information. As noted above,quantitative data for pre-dam bed material size distributions arenon-existent. In a number of cases, we have measured present bedmaterial size below dams, and have relied on anecdotal informationto estimate pre-dam conditions.
It is clear that bed material coarsening has occurred belowmany dams because reaches that were formerly heavily used byspawning salmon are now underlain by cobbles, boulders, or bedrock.
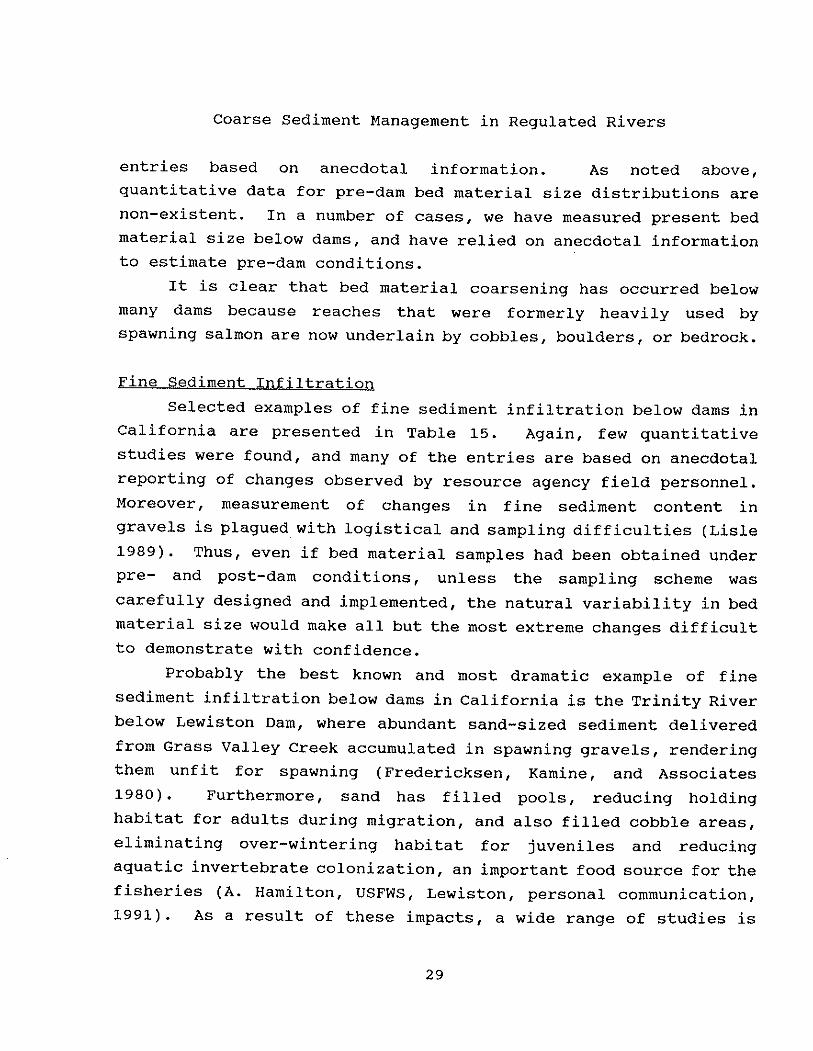
Fine Sediment InfiltrationSelected examples of fine sediment infiltration below darnsin
California are presented in Table 15. Again, few quantitativestudies were found, and many of the entries are based on anecdotalreporting of changes observed by resource agency field personnel.Moreover, measurement of changes in fine sediment content ingravels is plagued with logistical and sampling difficulties (Lisle1989). Thus, even if bed material samples had been obtained underpre- and post-darn conditions, unless the sampling scheme wascarefully designed and implemented, the natural variability in bedmaterial size would make all but the most extreme changes difficultto demonstrate with confidence.
Probably the best known and most dramatic example of finesediment infiltration below dams in California is the Trinity Riverbelow Lewiston Dam, where abundant sand-sized sediment deliveredfrom Grass Valley Creek accumulated in spawning gravels, renderingthem unfit for spawning (Fredericksen, Kamine, and Associates1980) • Furthermore, sand has filled pools, reducing holdinghabitat for adults during migration, and also filled cobble areas,eliminating over-wintering habitat for juveniles and reducingaquatic invertebrate colonization, an important food source for thefisheries (A. Hamilton, USFWS, Lewiston, personal communication,1991). As a result of these impacts, a wide range of studies is
29

Coarse Seqiment Management in Regulated Rivers
now underway to determine minimum flow releases required to enhancethe remaining fishery below the dam. The Trinity River is anextreme case of flow modification, with 90% of the flow divertedfrom the basin into the Sacramento River, and the 2-year flow only2% of its pre-dam value.
INSTREAM GRAVEL MINING EFFECTSInstream gravel mining is widespread throughout California,
although the type of operations is highly variable in part due tothe nature of the available deposits and in part to the localregulatory framework. Major extraction sites are located close tothe demand of rapidly growing urban areas, such as north and eastof San Francisco Bay, the Sacramento area, the stockton area andother growing Central Valley cities, and Southern California. Insome locations, virtually all instream mining has been replaced byfloodplain pit mining (such as along the Tuolumne River), notnecessarily for environmental reasons, but rather that instreamgravels were so limited below La Grange Dam due to the lack ofrecruitment and because demand had increased so rapidly that muchlarger sources of material were needed. In other areas, such asStony Creek and Thomes Creek, which are dry for long periods eachyear, almost all of the extraction remains instream.
Channel IncisionTable 16 presents data on channel incision attributable to
instream gravel m1nlng from files of Caltrans (CaliforniaDepartment of Transportation), Division of structures, Sacramentoand other sources. Many of these examples of incision weredocumented from sequential bridge surveys or soundings and havebeen attributed by Caltrans staff to nearby instream gravel mining,although comprehensive studies may not have been conducted.Photographs included in bridge files show active gravel extraction
30

Coarse Sediment Management in Regulated Rivers
immediately upstream or downstream of many of the bridges. Thetemporal and spatial patterns of the incision indicate thatinstream gravel extraction is responsible. In many cases, localhydraulic adjustments to the presence of the bridge occurred withina few years of construction, after which the bed was stable untilcommencement of instream mining, when incision abruptly began.
In certain cases, excellent documentation exists to pinpointcauses of incision. On Stony Creek in Glenn County, Swanson andKondolf (1991) conducted a detailed study of historical channelchanges and changes in sediment flux, using sequential aerialphotographs, historical channel surveys, analysis of reservoirsedimentation rates and permitted extraction rates. Incisionresulting from construction of Black Butte Reservoir (in 1963)extended downstream less than 8 miles. A distinct episode ofincision (up to 16 ft from 1973 to 1990) centered at the Highway32 bridge crossing 13 miles below the dam was clearly related tointensive instream gravel extraction in pits immediately upstreamand downstream (Swanson and Kondolf 1991).
Perhaps the best known examples of channel incision resultingfrom instream gravel extraction are found on t.he Russian Riverbelow Healdsburg and on Cache Creek in Yolo County. On the RussianRiver, extensive wet pit mining in the active channel in the 1950'Sand 1960's effectively lowered the bed in excess of 10 ft overseven river miles, with a maximum incision of 18 ft. As a result,the form of the river has been changed from a wide, braided channelto a deeply incised channel with a straighter course. By the mid-1960's, channel pit mining was abandoned and replaced by bar-skimming and terrace mining (Collins and Dunne 1990). Cache Creekwas the source for 80-90 million tons of aggregate from 1905 to1983. As a result of this massive extraction, channel incision ofup to 27 ft has occurred, as documented by stage dischargerelations at a USGS gaging station, and repeat surveys of
31

Coarse Sediment Management in Regulated Rivers
longitudinal profiles and bridge cross sections (Woodward-ClydeConsultants 1976). The future management of this reach remainshighly controversial, and was subject of a recent EIR andprotracted public hearings (Dames and Moore 1991). The incisionof Cache Creek has resulted in a loss of alluvial groundwaterstorage potential, although overdraft complicates the groundwaterpicture (Environ 1980).
Undermining of Highway BridgesOne of the consequences of channel incision is undermining of
structures, such as pipelines, canal crossings, and highwaybridges. Table 17 presents a partial inventory of bridge repaircosts for state highway bridges through 1984 that have beenattributed to instream extraction. This table is only a partiallisting, and with further research the figure for costs through1984 would likely double (R. Hackett, Caltrans Division ofStructures, unpublished memo 1984).
Intensive extraction on the Santa Clara River in VenturaCounty resulted in failure of the Highway 118 bridge during the1969 flood, resulting in repairs costing $730,000 (in 1969dollars). The Highway 67 bridge over the San Diego River wascompletely replaced in 1981 (at a cost of $3.3 million) as a resultof extraction-related undermining. Incision on stony Creek,discussed above, will require bridge repairs costing $1 million(Table 17).
Bed CoarseningInstream mining has selectively removed spawning sized gravels
from many rivers, although documentation is poor. One of the bestdocumented examples is the Upper Sacramento River, in which theimpacts of upstream dam construction were compounded by intensivein-channel extraction (for construction of the dam) and subsequent
32

Coarse Sediment Management in Regulated Rivers
intensive extraction from tributaries (Parfitt and Buer 1980).Construction of Shasta Dam (completed in 1944) required 7.1 millionyd3 of aggregate, which was derived from two large gravel bars inthe Sacramento River downstream of the dam site. The entirety ofone bar was excavated, locally to a depth of 50 ft (Parfitt andBuer 1980). THe gravel remaining in the channel after this massiveremoval was subsequently transported downstream by clearwaterreleases from the dam, leaving only a lag of cobbles, boulders, andbedrock in the reach near Redding.
with continued urbanization of the northern Sacramento Valley,extensive gravel extraction occurred in tributary channels. OnClear Creek, the combination of intensive mining and subsequentflood flows has resulted in a channel scoureQ to bedrock in manyplaces and armored with coarse material elsewhere (Parfitt and Buer1980). Bed coarsening on these tributaries has directly reducedpotential spawning grounds in the tributaries themselves andgreatly reduced the remaining gravel supply to the mainstemSacramento River below Shasta Dam. These tributary effects havecontributed to coarsening on the mainstem.
An example at a smaller scale is San Simeon Creek in San LuisObispo County I where bar skimming over a 30 year period hasresulted in development of a coarse cobble lag and incision tohardpan over a reach of about 0.5 mi upstream of the extraction(Table 14).
Although in this study we could locate documentation forrelatively few examples of bed coarsening resulting from instreammining, we expect that this effect must be manifest in otherchannels.
Channel InstabilityChannel instability resulting from instream gravel mining
could be expected, given the disruption of pre-existing channel
33

Coarse Sediment Management in Regulated Rivers
geometry (Collins and Dunne 1990). stony Creek at the Highway 32Bridge illustrates this phenomenon, as the incised channel hasmigrated laterally towards bridge abutments (Swanson and Kondolf1991).
EXISTING POLICIES: RESERVOIRSDam Safety
As noted above, dams higher than 25 ft or with capacitiesexceeding 50 ac-ft come under the jurisdiction of DSD, unless theheight is less than 6 ft or capacity is less than 15 ac-ft (Figure7) (DWR 1988). DSD is required to inspect these dams at leastannually for evidence of safety problems.
DSD (1991) requires that low level outlets be operable so thatreservoirs can be drawn down in emergencies. For new dams lessthan 5000 ac-ft, outlets must be designed to drain 50% of thereservoir volume in 7 days. This rule cannot be applied to largerreservoirs because of the unrealistically large outlet pipes thatwould be required, so the criteria require the dam to be "wellengineered. If For example, the requirement at New spicer Meadow Damis that the reservoir level can be dropped to 10% below the fixedspillway_ At Oroville Dam, two 5-ft diameter valves nea~ the baseof the dam were used during reservoir filling but rarely since.Even with 5-ft outlets, draining such a large reservoir could notpossibly be accomplished in anything like 7 days (D. Babbitt, DSD,personal communication 1991).
For smaller reservoirs, DSD requires owners to exercise theirvalves on a periodic basis to demonstrate operability and to removeaccumulated sediments that could interfere with operability (D.Babbitt, DSD, personal communication 1991). The downstream impactsof sluicing can be significant, and they are discussed in moredetail below.
34

Coarse Sediment Management in Regulated Rivers
As noted above, reservoirs that have completely filled withsediment pass out of the jurisdiction of DSD because theircapacities are less than 15 ac-ft (Figure 7).
SluicingSluicing is conducted in small reservoirs and diversion
structures to remove sediments accumulated above the dam as wellas for maintenance of outlet works. Intentional sluicing istypically accomplished by opening the outlet pipe or sluice gatesand permitting the reservoir to draw down sufficiently to resuspendsediment. Accidental sluices have also occurred during maintenanceor repair work. Recently, these episodes have come to theattention of regulatory agencies and resulted in substantialcleanup costs for the dam operators.
CDFG has long been concerned about the impacts of sluicingbecause it is frequently conducted during summer months, when flowsare inadequate to disperse sluiced sediment (J. Mensch, CDFG,personal communication 1991). On dams larger than small diversionstructures, the sediment accumulated around outlet is usually siltand clay. Release of this material and its deposition downstreamcan be extremely deleterious to aquatic life. For example, openingof the low level outlet on Los Padres Dam on the Carmel River in1980 resulted in a large fish kill (Buel 1980); the dam operatorhas since been required to use a suction dredge to maintain theoutlet (D. Dettman, MPWMD, personal communication 1990). Sluicingof smaller diversion dams can release sand to downstream reaches,as occurred in the South Fork Feather River below ForbestonReservoir in 1986, when a layer of sand (about 5-10 mm thick) wasdeposited over the entire channel width for an undetermineddistance downstream (Kondolf 1986).
Two recent, controversial sluicing incidents, described below,illustrate the serious nature of the problem.
35

Coarse Sediment Management in Regulated Rivers
Our House Reservoir (capacity 285 ac-ft) on the Middle YubaRiver, completely filled with sediment during the February 1986stormflow because of the high influx of sediment and because thesluice gates were inoperable. During the following August, thedam operator, Yuba County water Agency (YCWA) began mechanicalremoval of the accumulated sediment, which was trucked out of thecanyon to a disposal site. During this work, the cofferdamdirecting the river flow around the work area failed. The sluicegate was open, and sediment began to flush from the reservoirthrough the gate, spreading out over the channel bed downstream.The gate was not closed and the situation was not rectified forthree days, during which time a plume of turbid water reached theHighway 49 bridge crossing 8 miles downstream. Bathers at thebridge complained to the CDFG warden, who visited the dam and'ordered the sluice gate closed immediately. By this time, anestimated 15,000 yd3 of sand and gravel had deposited over a 4000ft reach below the dam (EBASCO Environmental 1989).
In subsequent negotiations with resource and regulatoryagencies, YCWA (and PG&E, with whom YCWA contracted operations)agreed to mechanically remove 8000 yd3. This operation requiredconstruction of a road into the channel, operation of heavyequipment in the channel bed, and rearrangement of boulders in thebed to permit excavation to proceed. Total cost of this operationwas $1.3 million, excluding costs of study design and subsequentmonitoring. Much of the remaining sediment (estimated at 7000 yd3)was transported downstream by spills in 1987-1989, as shown inFigure 8. Spills during 1987 and 1988 (Figure 9) were relativelysmall and brief; their net effect was to cause the tongue of sandto extend downstream in steps several hundred ft long,progressively filling pools. The larger spill of March 1989,however, effectively suspended sand, scoured pools, and dispersedsand in harmless concentrations over three miles downstream. The
36

Coarse Sediment Management in Regulated Rivers
cycle of deposition and scour is illustrated in Figure 10,sequential surveys of Cross Section 5d across a pool (Figure 8).This pool, unaffected by the initial sluice, was buried by theprograding tongue of sediment during the November 1988 spill, andthe partially scoured by the March 1989 spill (EBASCO Environmental1989).
The progressive extension of sediment tongue during the modestspills of 1987 and 1988 contrasts with the dispersion of sedimentin the large 1989 spill, and emphasizes that when sediment isintroduced at low flows, mitigation is difficult. However, at highflows, sediment is readily dispersed, in a fashion similar to thenatUral movement of sediment through the river system.
A similar event occurred below Poe Dam on the North Fork ofthe Feather River in 1988. During maintenance work on a spillwaygate, approximately 23,000 yd3 of fine sands (and an undeterminedvolume of silt) were accidentally released. The sand deposited inthree pools below the dam. The dam operator, PG&E, agreed tomechanically remove sediment from the first pool and make acontrolled release of 2500 cfs for two days to flush the remainingsediment through the system. During extraction of the sedimentfrom the first pool, an unusually large storm hit the Feather Riverbasin and a large spill (peak flow of approximately 18,000 cfs)occurred. On the recession limb, PG&E maintained a discharge atthe required 2500 cfs to complete the two-day period. Subsequentmonitoring of cross sections and streambed materials indicated thatthe sluiced sediments had been completely flushed from the system(Ramey and Beck 1990).
It is notable that in the absence of the fortuitous storm andspill, the required 2500 cfs release would have been quiteexpensive in terms of lost hydroelectric revenues. The costs ofmechanical removal, monitoring study, and 2500 cfs release for 24hours were not reported (Ramey and Beck 1990).
37
Coarse Sediment Management in Regulated Rivers
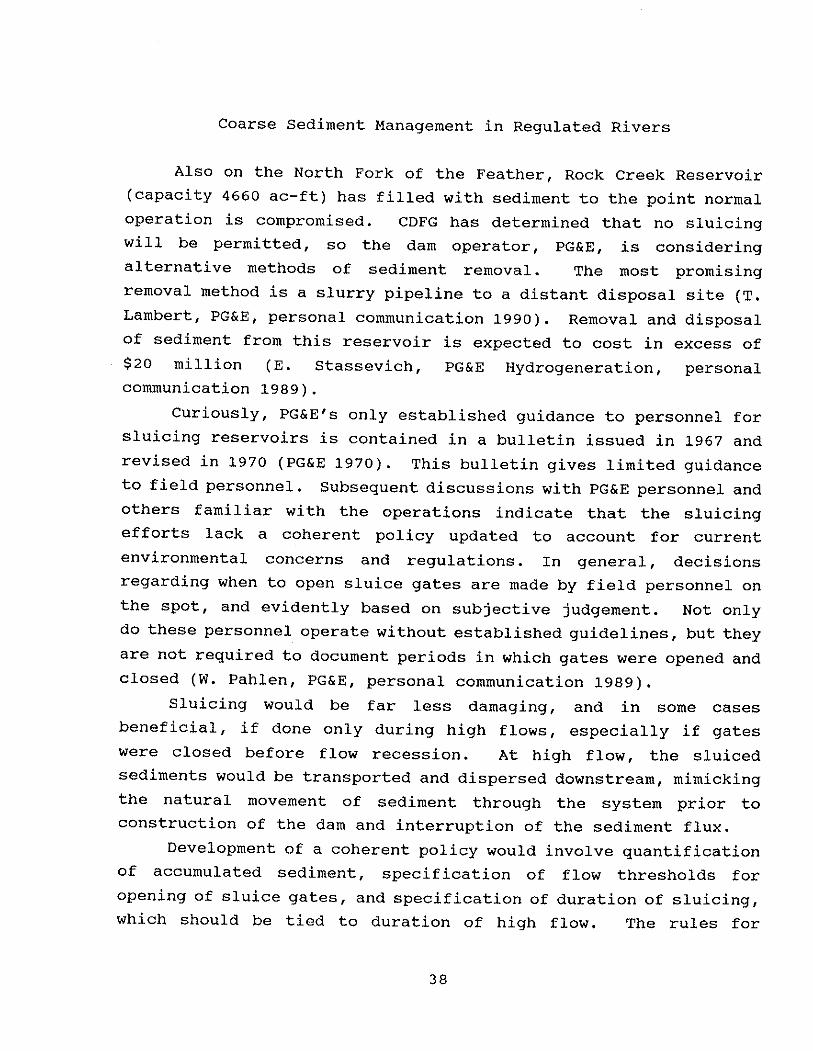
Also on the North Fork of the Feather, Rock Creek Reservoir(capacity 4660 ac-ft) has filled with sediment to the point normaloperation is compromised. CDFG has determined that no sluicingwill be permitted, so the dam operator, PG&E, is consideringaLternative methods of sediment removal. The most promisingremoval method is a slurry pipeline to a distant disposal site (T.Lambert, PG&E, personal communication 1990). Removal and disposalof sediment from this reservoir is expected to cost in excess of$20 million (E. Stassevich, PG&E Hydrogeneration, personalcommunication 1989).
Curiously, PG&E's only established guidance to personnel forsluicing reservoirs is contained in a bulletin issued in 1967 andrevised in 1970 (PG&E 1970). This bulletin gives limited guidanceto field personnel. Subsequent discussions with PG&E personnel andothers familiar with the operations indicate that the sluicingefforts lack a coherent policy updated to account for currentenvironmental concerns and regulations. In general, decisionsregarding when to open sluice gates are made by field personnel onthe spot, and evidently based on subjective jUdgement. Not onlydo these personnel operate without established guidelines, but theyare not required to document periods in which gates were opened andclosed (W. Pahlen, PG&E, personal communication 1989).
Sluicing would be far less damaging, and in some casesbeneficial, if done only during high flows, especially if gateswere closed before flow recession. At high flow, the sluicedsediments would be transported and dispersed downstream, mimickingthe natural movement of sediment through the system prior toconstruction of the dam and interruption of the sediment flux.
Development of a coherent policy would involve quantificationof accumulated sediment, specification of flow thresholds foropening of sluice gates, and specification of duration of sluicing,which should be tied to duration of high flow. The rules for
38
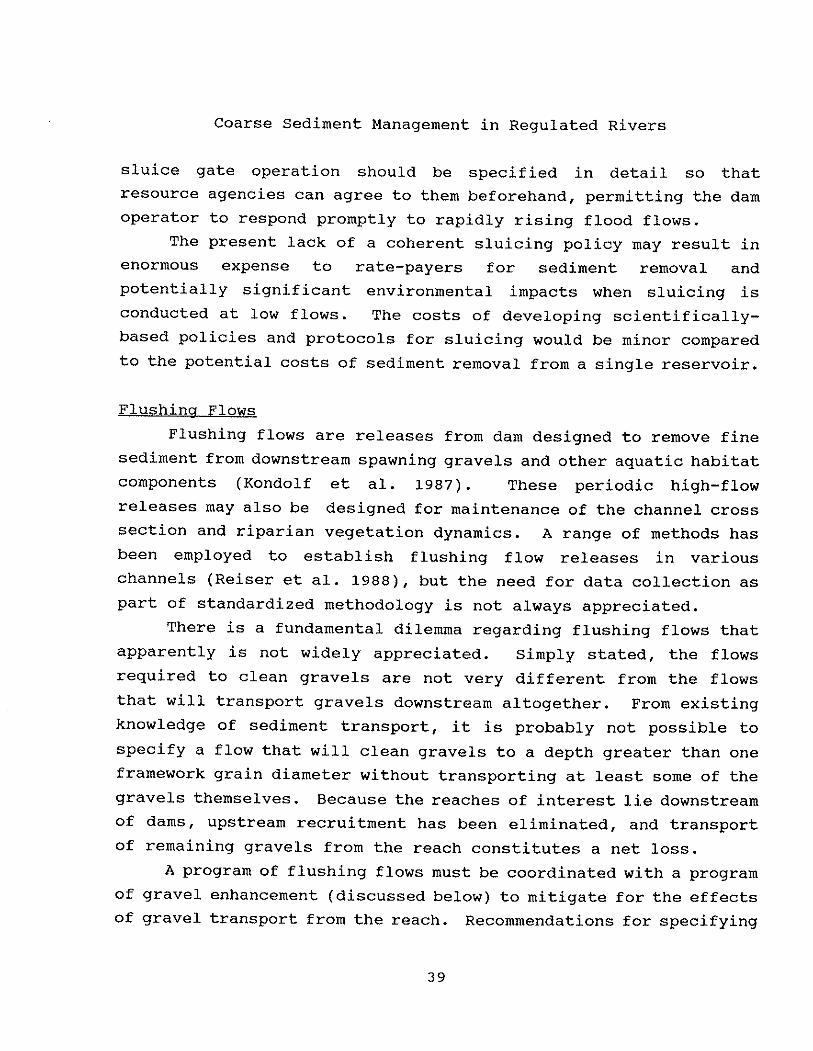
Coarse Sediment Management in Regulated Rivers
sluice gate operation should be specified in detail so thatresource agencies can agree to them beforehand, permitting the damoperator to respond promptly to rapidly rising flood flows.
The present lack of a coherent sluicing policy may result inenormous expense to rate-payers for sediment removal andpotentially significant environmental impacts when sluicing isconducted at low flows. The costs of developing scientifically-based policies and protocols for sluicing would be minor comparedto the potential costs of sediment removal from a single reservoir.
Flushing FlowsFlushing flows are releases from dam designed to remove fine
sediment from downstream spawning gravels and other aquatic habitatcomponents (Kondolf et al. 1987). These periodic high-flowreleases may also be designed for maintenance of the channel crosssection and riparian vegetation dynamics. A range of methods hasbeen employed to establish flushing flow releases in variouschannels (Reiser et al. 1988), but the need for data collection aspart of standardized methodology is not always appreciated.
There is a fundamental dilemma regarding flushing flows thatapparently is not widely appreciated. Simply stated, the flowsrequired to clean gravels are not very different from the flowsthat will transport gravels downstream altogether. From existingknowledge of sediment transport, it is probably not possible tospecify a flow that will clean gravels to a depth greater than oneframework grain diameter without transporting at least some of thegravels themselves. Because the reaches of interest lie downstreamof dams, upstream recruitment has been eliminated, and transportof remaining gravels from the reach constitutes a net loss.
A program of flushing flows must be coordinated with a programof gravel enhancement (discussed below) to mitigate for the effectsof gravel transport from the reach. Recommendations for specifying
39

Coarse Sediment Management in Regulated Rivers
flushing flows constitute a separate area of study and are beyondthe scope of this report.
EXISTING POLICIES: GRAVEL MININGAt present, instream gravel mining is largely unregulated
because many operations are grandfathered (under "vested rights"),the relevant state legislation is weak, and information onextraction volumes has generally been unavailable.
Regulation of Instream MiningThe principal statewide regulation of instream gravel mining
is conducted under SMARA, the Surface Mine and Reclamation Act of1975 (with subsequent amendments). SMARA places mostresponsibility for regulation on lead agencies, usually countiesand cities. Lead agencies must receive approval from the StateMining and Geology Board for a "mining ordinancefl• Under SMARA,all extractors are required to submit "reclamation plan",describing the existing environment and the intended ultimatereclamation of the site. The lead agencies are responsible foraccepting reclamation plans. The California Division of Mines andGeology (CDMG) will provide technical assistance in reviewingreclamation plans, but CDMG acts in an advisory capacity only.
Operations begun after January 1, 1976 are required to obtaina county use permit, but older operations are "vestedfl and do notrequire a use permit unless they propose to expand theirboundaries.
Instream gravel mines also require a CDFG 1603 streambedAlteration Agreement, issued by the CDFG warden. Conditions underthe 1603 permit are often more stringent that those under the usepermit, especially in northern Californian rivers with anadromoussalmonid populations. CDFG has limited power to refuse to issuea 1603 agreement, and in any case, CDFG appears not to have had the
40

Coarse Sediment Management in Regulated Rivers
political clout to stop instream mines in important salmonidhabitats.
In most cases, instream mines have not obtained USACE 404wetland permits, because the permits are regarded as necessary onlyif the project involves filling (and gravel mining is excavating).However, this is being reevaluated by USACE personnel becausegravel extraction operations generally involve grading, which bydefinition involves some fill (L. Varnahagen, USACE, personalcommunication 1991).
Shortcomings of Existing RegulationSMARA is primarily oriented to surface mines and their
reclamation, based on the model of the open-pit or strip mine. Ifsuch mines are abandoned, they may constitute unsightly anddangerous scars on the land, so the state seeks to insure that themine operator will reclaim the mined land to productive use. Theconcept is reasonable when applied to essentially staticenvironments that can be disturbed within a confined area, withoutaffecting surrounding areas, and then reclaimed. The extensivesurface mine south of Teichert Construction Company's Perkins Plantin Sacramento is an example. After being mined, the land isreturned to productive agricultural use, only shifted down by about12 ft.
Under SMARA, the reclamation concept has been applied toextraction of gravel from active riverbeds as well, despite verydifferent conditions. The beds of rivers and streams are extremelydynamic environments. As discussed above, disturbance of the bedin one locality can result in propagation of the impact for longdistances up- or downstream. Thus, it is not possible to disturbone site in isolation from the environment and "reclaim" it. Thereclamation concept cannot be intelligently applied to an activeriverbed.
41

Coarse Sediment Management in Regulated Rivers
Under SMARA, lead agencies are responsible for reviewingreclamation plans, as well as conducting CEQA review.Unfortunately, counties and cities can generally not afford thetechnical staff needed to evaluate reclamation plans or to monitorperformance of the extractor. Moreover, counties - especiallysmall rural counties - may be subject to political pressure fromextractors. Because CDMG has only an advisory role under SMARA,the law lacks effective enforcement.
Moreover, production figures have been consider proprietaryinformation, and this information has not been available to thepublic or other agencies. Recent (1991) amendments to SMARAinclude reporting requirements, which should make rationaleplanning and management more possible.
Many reclamation plans are weak, containing little evidencethat the authors made a serious effort to understand theenvironmental impacts of the operation and most effective means ofrestoring those values. The SMARA guidelines for the reclamationplan section uEnvironmental Setting" follow, with that sectionexcerpted in its entirety from one reclamation plan that wasaccepted by Glenn County.
SMARA Guidelines for Environmental Setting:Describe the project site as it exists before the project,including information on topography, soil stability, plantsand animals, and any cultural historical or scenic aspects.Describe any existing structures on the site, and the use ofthe structures. Attach photographs of the site. Snapshotsor polaroid photos will be accepted.
Applicant section on Environmental Setting:The present site is basically a level area of sand and gravelcovered with bamboo, grasses and some trees. Area containsusual creek side wildlife. Does not appear to be anycultural, historical or scenic aspects. Existing buildingsare old out buildings of an insignificant nature.
Source: Swanson and Kondolf 1991, Appendix F
42

Coarse Sediment Management in Regulated Rivers
Survey of County Lead AgenciesIn order to assess the effectiveness of impact evaluation and
monitoring among lead agencies, two graduate students at UCBerkeley (Sue Huse and Tom Murphy) conducted a telephone survey of56 county lead agencies. Of these lead agencies, only 9 haveestablished limits for mining that are tied to hydrology or channelconditions, only 11 required stream channel cross sections and someaerial photography as part of the monitoring requirement. Only 5of the lead agencies had taken a regional look at gravel resourcemanagement and implemented studies of sand/gravel replenishment;another 3 were studying such a regional approach. Most countieshad no data on actual extraction volumes, no data on amounts minedinstream vs off-channel, and no systematic monitoring program.
Thus, existing lead agencies under SMARA appear poorlyequipped to deal with the responsibility thrust upon them by SMARA.
Role of CaltransBecause of the serious impacts upon highway bridges, Caltrans
pushed for an amendment to SMARA in 1984 requiring all applicantsfor new instream mining permits to notify Caltrans if the proposedmine would be within 1 mile of a Caltrans bridge. However,Caltrans is limited to a review capacity, and can only comment uponthe proposal.
Caltrans has initiated a statewide inventory of bridges withpotential scour problems. Of the 15,000 bridges over water inCalifornia, about 150, or 1%, are considered to criticallythreatened by scour (C. Crossett, Caltrans, personal communication1990). The agency has begun efforts to identify the cause of theseproblems and to develop approaches to prevent such problems in thefuture.
43

Coarse Sediment Management in Regulated Rivers
RECENT RESTORATION EFFORTSRecent restoration efforts have included importing gravel into
gravel-deficient channels, scarification of immobile gravel beds,construction of artificial side channels with conditions suitablefor spawning fish, flushing flows, construction of sediment traps,mechanical excavation of pools filled with sediment, andrestoration of natural channel geometry and riparian vegetation indisturbed streams. Flushing flows were briefly addressed in theprevious section and will not be considered further.
Gravel replenishment projectsTable 18 presents a partial listing of gravel replenishment
projects in California compiled in the course of this study. Aswith many of the restoration activities described in this section,the implementation of these gravel replenishment projects has begunvery recently: 13 of the 16 projects listed in Table 18 have beencompleted since 1987, with 8 in 1990 or 1991. The costs and scaleof the projects run from placement of 40 yd3 in the Carmel Riverin 1990 at a cost of $580 up to anticipated placement of 8,000 yd3in the Sacramento River below Shasta Darnat a cost of $19 millionover the next decade. Costs per cubic yard are highly variabledepending on access limitations and other site work required. Manyprojects fall in the $15-30/yd3 range with economies of scaleevident for some of the larger projects. For smaller projects withdifficul t access or long transport distances f costs of up to$200/yd3 were reported.
Expensive as the Sacramento River efforts are, it is unlikelythat they can bring about a long term solution. Any gravels placedin the main channel are likely to be scoured and progressivelymoved downstream by floods (e.g. the 1979 project on the SacramentoRiver, see Table 18). Thus, the very nature of the problem(progressive bed coarsening during clearwater spills) precludes a
44

ir :
:v
1 i· ~ . C j, _i ~ I C
Coarse Sediment Management in Regulated Rivers'; . ~i ~
-. I·i;one-time solution. Gravel replenishment must be undertaken on aperiodic basis, with the frequency of placement depending upon themagnitude and duration of reservoir spills capable of entrainingthe gravels.
Methods of gravel placement range from hand placement byvolunteers or the California Conservation Corps to sluice pipes forsites with access difficulties to dumping by trucks in piles thatwill be reworked and spread naturally downstream by subsequentflows to placement by helicopter for particularly remote orinaccessible sites.
Spawning gravel replenishment is perhaps most effective whencombined with construction of limited in-channel' structures toretain as much gravel as possible on-site. These structures havebeen constructed along many rivers (e.g. Klamath, Trinity,Sacramento, Tuolumne) and may consist of large boulders, gabionsills, or log sills.
Unfortunately, an important component of restoration 'pr-o jeot.s f
post-construction monitoring, appears to be haphazard: there arefew examples of systematic post-project evaluation of theseefforts. Moreover, the agencies undertaking these efforts oftenknow little of similar efforts elsewhere. When interviewed aftercompleting a gravel replenishment project in Lagunitas Creek, MMWDdirector Leo Cronin was quoted in the point Reyes Light as stating,"This is experimental. I've never seen anything like this."Efforts to restore gravel supplies to stream can only benefit fromthe experience of other such projects, especially if their successwere systematically evaluated.
Artificial Spawning ChannelsThe construction of artificial spawning channels, on the other
hand, has been practiced for many years to compensate for blockedor 'inundated spawning areas. This mitigation technique has
45

Coarse Sediment Management in Regulated Rivers
probably been more common because it is similar in some respectsto a hatchery and would thus have a more traditional appeal, andbeing isolated from the active channel, typically only requiressignificant maintenance following large floods, if facilities existto filter out or otherwise block fine sediments from infiltratingthe gravels. Table 19 presents selected examples of artificialspawning channel construction. The type of artificial spawningchannel constructed may range from concrete-lined to the usage ofnatural side channels requiring only the construction of localhydraulic controls and stocking with spawning gravels. Spawningchannels have also been constructed across large point bars (e.g.along the Trinity River). The success of these facilities hasvaried substantially: the Merced River spawning channel increasedsalmon stocks dramatically between 1966 and 1973 (Hazel et aL,
1976, p. 510), while the Tehama-Colusa Fish Facilities haveexperienced numerous problems including insufficient water supply,excessive water temperatures, adverse hydraulic conditions, growthof aquatic weeds, and disease (USRFRHAC, 1989) .
. ,with proper design, construction, and maintenance, artificial
spawning channels can be an effective means of mitigation.
Riffle ScarificationThis restoration technique involves cleaning of compacted
gravels that have been infiltrated by fine sediment. The mostcommon method has typically been "riffle ripping", where abulldozer with ripping attachments scarifies known or potentialspawning sites. The technique is simple and relativelyinexpensive, but must be repeated periodically and causes short-term increases in turbidity. Bulldozer ripping has been conductedon the Trinity and Sacramento Rivers, and along Clear Creek.Alternatives to ripping with heavy equipment have been explored onthe Trinity River, with the most promising involving use of suction
46

, J'"i
I ..
{": ICoarse Sediment Management in Regulate~ ,Rive~s.
~-, " ~: :,"'; , :
dredges. This application has the advantage of removing all finesediment directly from the channel, and that is may be used indeeper water. Unfortunately, it is considerably more laborintensive and expensive.
Pool ExcavationDownstream of dams where mainstem hydrologic alteration in
combination with high sediment yields from tributaries leads to theaccumulation of sediments in pools, restoration has taken the formof pool excavation through dredging. Furthermore, fine sedimentmay reduce pool volume and depth even in unregulated streams ifland use changes upstream, such as logging, result in sedimentdelivery in excess of transporting capacity. Anecdotal informationfrom residents and fishermen along both the Russian and GarciaRiver indicates this scenario has occurred (C. Bell, professionalfishing guide, personal communication, 1991).
On the Trinity River, where tributary sedimentation isparticularly severe, the USFWS restoration program dredged 3 poolsin 1990 using hydraulic excavators and draglines. Additional poolsare planned to be excavated in 1992 using a suction dredge (A.Hamilton, USFWS, Lewiston, personal communication, 1991). withouta reduction in sediment supply, however, the pools will likelyrefill quickly, providing only a short-term improvement in habitatvalues.
On the Garcia River in 1990, a gravel operator was requestedto excavate "pools" by the local CDFG biologist to compensate forloss of habitat values from previous bar skimming operations. Thematerial extracted was stockpiled by the operator for futureprocessing and sale. Unsupervised work resulted in the excavationof large trenches that bear little resemblance to natural pools.Detailed surveys by CDFG and the Mendocino County Water Agencyfollowing the excavation will enable the tracking of potential
47

Coarse Sediment Management in Regulated Rivers
knickpoint migration and other impacts (G. Heise, CDFG HydraulicEngineer, personal communication, 1991).
A gravel operator on the Russian River has proposed similarexcavations, arguing that substantial habitat would be created.Unfortunately, the desire on the part of an operator to extract asmuch material as possible, creating unnaturally large deviationsfrom the equilibrium profile, would have the potential to causesignificant impacts, and can hardly be considered habitatrestoration. While pool excavation has a legitimate place instream and habitat restoration projects, as discussed below, theappropriate scale is too small to provide for the needs of graveloperations, and, furthermore, all of the coarse sediment (gravelsand larger) should be returned to the channel.
construction ot Sediment Trap§This type of restoration teChnique has been primarily limited
to tributaries which are delivering high sediment loads (e.g. GrassValley Creek on the Trinity River), although Gardiner (1988)describes the installation of a sediment trap in the mainstem ofa river to reduce sand transport downstream into a restored reach.These sediment traps may range from large debris basins (numerousexamples in southern California) to pools with high trapefficiencies (Grass Valley Creek just above the confluence with theTrinity River). In general, though, such structures will requirefrequent maintenance in order to maintain capacity.
stream Restorationstreams and rivers may have become degraded from a wide
variety of human impacts, and the nature of the disturbance alsocomes in many forms. Impacts typically center around channelinstability, either of the profile or planform characteristics,leading to erosion and downstream sedimentation, loss of riparian
48

-, !:. :
Coarse Sediment Management in Regulated Rivers
vegetation, and loss of habitat values. In recent years, asincreased awareness has been focussed on these problems, thedevelopment of a stream restoration movement has occurred. Due tothe scale difficulties of working on the larger rivers, however,more attention has been placed on smaller streams. streamrestoration is comprised of "biotechnicaltl techniques that seek toreestablish the natural characteristics of the site prior toinstability or loss of habitat value, by a combination ofstructures and vegetative plantings. Many of the techniquesdescribed in previous sections are included in restorationprograms, although the emphasis lies on the entire system, not juststreambed materials.
For example, on the Carmel River, restoration of disturbedareas has involved reconstruction of channel geometry toapproximate historically "stable" conditions, replanting of'riparian species along the "restored" banks and floodplain, re-creation of a pool and riffle sequence connected by a clearlydefined low-flow channel, and replacement of streambed gravelsafter mechanical sorting (Matthews 1990). Enhancement of spawninggravels is one component of a systems approach to habitat.restoration.
12. ALTERNATIVE STRATEGIES FOR COARSE SEDIMENT MANAGEMENTObjectives Qf Coarse Sediment Management
The management of coarse sediment must recognize theinteractions among sediment sources, transport pathways, and sinks,so that proposed actions are considered not in isolation, butrather as part of a system-wide (i.e. watershed) approach.
Goals of a coherent, comprehensive program of coarse sedimentmanagement should include:
1. establishment of a balance between the Public Trustobligations for maintenance and enhancement of aquaticand riparian habitat and other beneficial uses for water
49

Coarse Sediment Management in Regulated Rivers
development and instream mining2. development of standard protocbls, methods, and
techniques for reservoir operations (such as operatingrules and sluicing), mitigations (such as flushing flows,gravel enhancement, side channel construction), andmonitoring and the active dissemination of thesetechniques to those in regulatory or manageme~tcapacities
3. protection of public and private facilities from theimpacts of instream mining
4. restoration of existing degraded rivers in order toassist in carrying out the mandate of SB 2261 requiringsignificant improvements in fishery resources by the endof this century
5. integration of coarse sediment management into the largerframework of watershed planning and management
General Management RecommendationsThe development and implementation of comprehensive river
basin management plans is essential in an era of competition forlimited resources, and such watershed plans must consider sedimentissues. Sediment supply must be addressed on a watershed-scale,while aggregate demand must be viewed on a regional scale, whichmay encompass several watersheds. This process should be fundedby user fees paid by those who derive benefit from waterdevelopments and harvesting of aggregate, such as hydroelectricpower producers and users, irrigation districts, water supplydistricts, flood control districts, and aggregate producers andusers.
State-level and statewide regulation and enforcement ofstandards is essential. Comprehensive river basin management plansare needed to balance beneficial uses with natural resourceprotection and restoration. The planning we envision would beunlike traditional river basin development, in which hydroelectric
50

: ::
Coarse Sediment Management in Regulated Rivers
1:generation, irrigation diversions, flood control, and gravelextraction have been pursued at the expense of natural resources.Instead, the existing uses must be reviewed in light of impactsupon the environment, and all new projects must incorporate asignificant element of habitat restoration, as done now in theUnited Kingdom under the auspices of the National rivers Authority(Gardiner 1988, 1990).
Specific Management RecommendationsOne approach to managing coarse sediment throughout river
systems involves the recognition of geomorphically distinctenvironments based on the availability of sediment, and theintegration of this knowledge of sediment supply with the locationin a given watershed of reservoirs. Thus, our recommendations formanagement strategies differ for three sediment supply categories(aggradational, equilibrium, or degradational) and three distinctsettings: reaches below reservoirs, reaches without reservoirsupstream, and reaches above reservoirs. Aggradational environmentsare limited in most of California, the exceptions being primarilyin more arid regions of California (predominantly southern) wherealluvial fans are an important feature. Other locations arelimited to severely disturbed watersheds (generally by logging),or to areas impacted by unusually large floods which deliver largevolumes of sediment to channels through landslides and debrisflows.
Reaches Downstream of ReservoirsThese reaches are the most sensitive to manipulate of coarse
sediment because all coarse sediment yield from the upstream basinis trapped by the reservoir. Instream gravel mining should beprohibited in all such reaches. If terrace deposits are present,these may be exploited provided sufficient setback from the active
51

Coarse Sediment Management in Regulated Rivers
channel to allow for the development of a riparian corridor wherelacking or the expansion of an existing but areally limitedcorridor. This riparian corridor will substantially reduce therisk of channel avulsion, while providing wildlife habitat. Thepits should be designed to maximize wildlife habitat uponreclamation. As mitigation for the impacts of dam construction andterrace extraction, operators should be required to enhanceexisting instream habitat through gravel replenishment and streamrestoration projects, such as that underway on the Tuolumne River(Chuck Falkenstein, M.J. Ruddy & Sons, personal communication1991). The amount and frequency of gravel replenishment may becalculated based upon the channel hydraulics and post-dam flowregime. Monitoring should be incorporated into these projects, sothat with experience the most effective techniques can bedeveloped.
Dam operators should be required to make more effectiveflushing flows which mimic the natural pattern of streamflows(magnitude, duration, and seasonal distribution) to the greatestextent feasible. Such releases are necessary to flush finesediment from gravelS, particularly after storms which would causefine sediment to be delivered from downstream tributaries to themainstem. The magnitUde of flushing flows may be estimated frommeasurement of bed ~aterial size distribution, velocity profiles,and channel geometry, while the duration of the flow can beestimated from the volume of fine sediment to be flushed and thesize of the dispersal area.
Tributary management becomes essential in highly regulatedsystems to reduce mainstem sedimentation, and the need for frequentflushing flows. Tributary watershed management involves monitoringof flow and sediment delivery, Changes in land use, andimplementation of Best Management Practices (BMP's) for operationssuch as timber harvest or road construction. In severe cases, such
52

Coarse Sediment Management in Regulated Rivers'
as the Trinity River, debris dams or other sediment traps may needto be constructed, funded by those impacting the watershed.Maintenance of the traps should involve screening and removal offine sediment, while allowing gravels to continue movingdownstream.
Reaches Upstream of ReservoirsMuch of the watershed area upstream of reservoirs is
relatively inaccessible, typically only has minor alluvialdeposits, and is farther from aggregate demand, thus has littlepressure for extraction. Upper watershed areas are typicallymanaged for resident trout populations, if downstream dams blockanadromous fisheries migration. The primary management aspectneeded in these areas is watershed management to reduce sedimentyields which ultimately result in the loss of reservoir capacity.
Reservoir ManagementThe interface between river and reservoir at the upstream end
of the reservoir pool provides a unique opportunity to obtainaggregate with virtually no environmental impacts and at the sametime improve reservoir capacity. Coarse sediment is deposited ina delta that progrades into the reservoir depending on poolelevation. Extraction of coarse sediment from reservoir deltasshould be undertaken where access is feasible. This isparticularly important at smaller, run-of-the-river type diversionstructures. Extraction has all of the advantages of instreammining (replenishable, well-sorted, clean, extract with standardheavy equipment) without any of the drawbacks (environmentaldamage, land acquisition costs, reclamation costs) except hauldistance, although many of the foothill reservoirs would be withina reasonable haul distance. This strategy has been used at LakeCombie (capacity 5500 ac-ft) on the Bear River and is used
53

Coarse Sediment Management in Regulated Rivers
extensively in Europe (Hack 1986). Furthermore, it would be arelatively simple matter to take a portion of the gravels extractedfrom the delta and inject them downstream of the dam as gravelreplenishment. In most reservoirs, seasonal drawdown of the poolwould provide a predictable extraction season, that would be evenlonger during droughts as opposed to instream mining which may seeno replenishment to the site for several years during extendeddrought periods.
A management strategy recently developed in Europe to reducesedimentation problems for run-of-the-ri ver structures involves theconstruction of training walls within the reservoir pool tomaintain a narrower channel (Hack 1986). A narrower channel willmore easily resuspend fine sediment deposits allowing more completeflushing during floods or sluicing events, reducing maintenancecosts.
Reaches without ReservoirsUnless obvious stream bed aggradation is occurring, it must
be assumed that sediment supply is in approximate equilibrium withtransport capacity. Instream mining should be prohibited exceptin cases of fine-grained ephemeral channels that are not used byanadromous fisheries even on a seasonal basis. If instream miningis allowed, locations should be utilized that reduce risk to publicand private facilities, such as bridges, a maximum excavation depthshould be set to minimize risk of knickpoint migration, andextraction should be performed by a modified bar skimming methodthat maintains low-flow channel confinement to reduce the risk ofinstability. Similar considerations for terrace or flood plainmining as previously described should be used.
54

Coarse Sediment Management in Regulated Rivers
Alternative Sources of GravelAn inventory of gravel sources as an alternative to instream
mining has been developed. The sources are ranked in order ofpreference from a perspective of minimizing natural resourceimpacts.
1. Dredger tailings: extensive areas of dredger tailings,remnants of hydraulic mining in the mid to late 1800's,are present on the flood plain along many central Sierranrivers, including the Mokelumne, American, Bear, Yuba,and Feather Rivers. These tailings fill flood plains,increasing flood risk, reduce areas of riparian habitat,and are unsightly. Utilization would clean-upfloodplains allowing riparian restoration, as theTeichert operation on Mississippi Bar, Lake Nimbusdemonstrates.
2. Reservoir deltas: as described above, extraction fromdeltas has many advantages, limited only by thefeasibility of access and hauling distance.
3. Quarries: there are a number of locations with extensivedeposits of Tertiary or Pleistocene gravels away from themodern stream channel that would have many fewer impactsthan instream mining. Hardrock quarries are options insome locations depending upon lithology, and intendeduse.
4. Terrace mining geomorphically isolated from activechannel (dry pit): this type has no risk of flood-causedfailures, and is easily reclaimed to agriculture orhousing following completion of extraction. An exampleis the Teichert operations in southeast Sacramento.
5. Terrace mining not geomorphically isolated from activechannel (dry pit): if extraction does not proceed belowthe water table, reclamation is straight-forward, andthere is considerably less disaster potential whenprotecting levee fails. Maintain minimum 200 footsetback for riparian corridor and buffer.
6. Terrace mining not isolated (wet pit): this type haslimited reclamation possibilities, and has greater damagepotential from levee failure.
7. Instream mining: controlled extraction through modified
55

Coarse Sediment Management in Regulated Rivers
bar skimming, limited to areas with minimal habitat.
CONCLUSIONSThe problems created by human manipulation of coarse sediment
resources are generally treated at a site-specific basis, however,the effects are pervasive and profound with substantial costs andsevere environmental impacts. The failure to effectively mitigatefor the loss of spawning gravels due to darn construction andinstream gravel mining is partially responsible for the drasticdeclines in anadromous fisheries resources in California in thelast 50 years. The need for a revised approach to coarse sedimentmanagement that incorporates watershed- and regional-scale planningis evident. Alternative management strategies have been appliedon a piecemeal basis, and lack of careful, comprehensive monitoringhas prevented a thorough evaluation that would lead to thedevelopment of standard procedures and techniques. Furthermore,the regulatory framework is clearly inadequate to assess thepotential impacts of proposed operations and to manage and monitorexisting operations. The costs to those who benef it from, orcreate the demand for, water development and/or instream gravelmining do not include the actual environmental costs of theseactivities.
Recent trends in legislation regulating instream mining andin the implementation of small-scale restoration or enhancementprojects provide the basis for hope that the situation isimproving.
56

REFERENCES CITEDUSRFRHAC (Upper Sacramento River Fisheries and Riparian Habitat
Advisory Council). 1989. Upper Sacramento River fisheries andriparian habitat management plan. Report prepared for theCalifornia Resources Agency by the Advisory Councilestablished by SB 1086. 158 pp.
Beak Consultants. 1989. Historical channel stability analysis andassessment of spawning gravels in the Lower Yuba River,California. Appendix C to Yuba River Fisheries Investigations,1986-1988. Beak Consultants, Sacramento CA.
Borland, W.M., and C.R. Miller. 1960. Sediment problems of theLower Colorado River. Journal Hydrualics Division, Americansociety of Civil Engineers. HY4:61-88.
Brune, G.M. 1953. The trap efficency of reservoirs. Transactionsof the American Geophyscial Union. 34:407-418.
Buel, B. 1980. Effects of Los Padres Reservoir silt release.Unpublished memo, Monterey Peninsula water ManagementDistrict, Monterey CA.
Buer, K. 1981. Klamath and Shasta Rivers spawning gravelenhancement study. DWR (California Department of WaterResources), Northern District, Red Bluff. March 1981.
CACSST (California Advisory Committee on Salmon and SteelheadTrout). 1988. Restoring the balance: 1988 Annual Report.CACSST, Sausalito CA.
Calaveras County Water District. 1985. Environmental impact reportfor hydroelectric development, North Fork stanislaus River.Sonora, CA.
Collins, B.C., and T. Dunne. 1990. Fluvial geomorphology and rivergravel mining: a guide for planners, case studies included.CDMG (California Division of Mines and Geology) SpecialPublication 98. CDMG, Sacramento CA.
DWR (California Department of Water Resources). 1988. Dams withinthe jursidiction of the state of California. DWR Bulletin 17-88.
DSD (Division of Safety of Dams, California Department of WaterResources). 1991. Statutes and regUlations pertaining tosupervision of dams and reservoirs. DSD, Sacramento CA.
DWR (California D~partment of Water Resources). 1980. UpperSacramento River Spawning Gravel Study. DWR Northern District,Red Bluff.
57

DWR (California Department of water Resources). 1982.Feather River Spawning Gravel Baseline study. DWR NorthernDistrict, Red Bluff.
DWR (California Department of water Resources). 1983.Monitoring Spawning Habitat, Feather River, California. DWRNorthern District, Red Bluff.
Dames & Moore. 1991. Cache Creek aggregate resources miningactivities and policy alternatives. Draft program,environmental impact report. Unpublished report submitted ~oCounty of Yolo, May 1991.
Dendy, F.E., and W.A. Champion. 1973. Summary of reservoirsediment deposition surveys made in the United states through1970. USDA Miscellaneous Pulication 1266.
Dendy, F.E., and W.A. Champion. 1978. Sediment deposition in U.S.reservoirs: Summary of data reported through 1975. USDAMiscellaneous Pulication 1362. ,~,........ 22.(, J'~-- 't ....•
Denton, D.N. 1986. Clear Creek fishery study. unpublished report.DWR (California Department of Water Resources), NorthernDistrict, Red Bluff CA. March 1986.
Denton, D.N. 1991. Sacramento River gravel restoration projectporogress report. Unpublished report. DWR (CaliforniaDepartment of water Resources), Northern District, Red BluffCA. January 1991.
EBASCO Environmental. 1989. continued monitoring report for1988/1989 for the cleanup and abatement of sediments sluicedfrom Our House Reservoir, Middle Yuba River. unpublishedreport to YWCA (Yuba County water Agency) • EBASCOEnvironmental, Sacramento CA.
Emmett, W.W. 1980. A field calibration of the sediment-trappingcharacteristics of the Helley-smith bed load sampler. U.S.Geological Survey, Prof. Paper, 1139, 44pp.
Environ, Inc. 1980. Draft EIR on sand and gravel operations alongCache Creek between Capay and Yolo: Unpublished report to YoloCounty Planning Department, Woodland CA.
Fredericksen, Kamine, and Associates. 1980. Proposed TrinityRiver Basin fish and wildlife management program. unpublishedreport to US water and Power Resources Service (as USBR wasthen called).
Gardiner, J.L. 1988. Environmentally sound river engineering:examples from the Thames Catchment. Regulated Rivers. 2:445-469.
58

Gardiner, J.L. 1990. Influences on the development of rivercatchment planning in the Thames Basin. Ph.D. thesis inGeography, University of Southampton, England.
Gregory, K.J. 1987. River channels. in Human activity andenvironmental processes. John Wiley & Sons, Ltd., Chichester,England. p.207-235.
Griffiths, G.A. 1979. Recent sedimentation history of theWaimakariri River, New Zealand. Journal of Hydrology (NewZealand). 18:6-28.
Hack, H.P. 1986. Design and calculation of reservoirs of r~n ofriver stations incorporating sedimentation. in W. Bechteler,ed., Transport of suspended solids in open channels,proceedings of Euromech 192. Munich, Germany. June 11-15,1985.
Hallock, R.J. 1987. Sacramento River system salmon and steelheadproblems and enhancement opportunities. unpublished report toCACSST.
Harrison, A.S. 1950. Report on special investigation of bedsediment segregation in a degrading bed. California Instituteof Engineering Research Series. v.33:1.
Hathaway, G.A. 1948. Observations on channel changes,degradation, and scour below dams. in Report on Second Meetingof the International Association of Hydraulic Research.stockholm, June 1948. p.267-307.
Hazel, C., S. Herrera, H. Rectenwald and J. Ives. 1976. Assessmentof effects of altered stream flow characteristics on fish andwildlife. Part B: California Case studies. Report by Jones andStokes, Inc. to US Dept. of Interior I Fish and WildlifeService.
Kellerhals, R., and D. Gill. 1973. Observations and potentialdownstream effects of large storage projects in northernCanada. in Transactions of the Eleventh International Congressof Large Dams, Madrid, Spain. v. 1, International Commissionon Large Dams. Paris. p. 731-754.
King, N.G. 1961. An example of channel aggradation induced by floodcontrol. US Geological Survey Professional Paper 424B, p. 29-32.
Knott, J.M. and C.A. Dunnam. 1969. Sedimentation in Upper StonyCreek Basin, eastern flank of the Coast Ranges of northernCalifornia. us Geological Survey Water-Supply Paper 1798-F.
59

Kondolf, G.M. 1982. Recent channel instability and historic channelchanges of the Carmel River, Monterey County, California. MSthesis, University of California at santa Cruz.
Kondolf, G.M. 1986. Reconnaissance-level study of sedimentconditions in the South Fork Feather River and Slate Creek,Yuba and Plumas Counties. unpublished report to EnvirosphereCompany, Sacramento CA.
Kondolf, G .M. 1988. Salmonid spawning gravels: a geomorphicperspective on their size distribution, modification byspawning fish, and criteria for gravel quality. PhD. Diss:,Johns Hopkins University, Baltimore, MD. 396 pp.
Kondolf, G.M., and W.V.G. Matthews. 1990. Assessment of potentialimpacts of Monterey Peninsula water Supply Projectondownstream channel geomorphology of the Carmel River.unpublished report to the Monterey Peninsula water ManagementDistrict, Monterey CA.
Kondolf, G.M. and M.J. Sale. 1985. Application of historicalchannel stability analysis (HCSA) to instream flow studies.Proceedings of the Symposium on Small Hydropower andFisheries. American Fisheries Society, Bio-Engineering Sectionand Western Diversion, May 1-3, 1985, Denver, CO. pp. 184-194.
Leopold, L.B., M.G. Wolman and J.P. Miller. 1964. Fluvial processesin geomorphology. W.H. Freeman Co. San Francisco, CA. 522 pp.
Lisle, T.E. 1989. Sediment transport and resulting deposition nispawning gravels, north coastal California. water ResourcesResearch, Vol. 25, no. 6, pp. 1303-1319.
Mahmood, K. 1987. Reservoir sedimentation: Impact, extent, andmitigation. World Bank Technical Paper Number 71. The WorldBank, Washington D.C. 118 pp.
Matthews, W.V.G. 1983. Discharge and sediment load for tributariesto the Carmel River. MPWMD Carmel River Watershed ManagementPlan Working Paper Number 5, October 1983
Matthews, W.V.G. 1987. Evaluation of the effects of the feasibleNew San Clemente Project alternatives on the channel stabilityand sediment transport of the Carmel River. Monterey PeninsulaWater Management District (MPWMD) Technical Memorandum 87-13.MPWMD, Monterey CA.
Matthews, W.V.G. 1988. Evaluation of reservoir sedimentationrates in the Upper Carmel River watershed. Monterey PeninsulaWater Management District Technical Memorandum 88-03. MPWMD,Monterey, CA.
60

Matthews, W.V.G.bed riversvegetation.
California Santa
1990. Design of restoration projects on gravel-emphasizing the reestablishment of riparian
unpublished M.S. thesis, University ofCruz, Santa Cruz, CA.
Matthews and Associates. 1991. Hydrology, geomorphology, andhistoric channel changes of San Simeon Creek, San Luis ObispoCounty, California. unpublished report to Cambria communityServices District, Cambria, CA.
Milhous, R.T. 1982. Effect of sediment transport and flowregulation on the ecology of gravel-bed rivers. in R.D. Hey,J.C. Bathurst, and C.R. Thorne, eds., Gravel-Bed Rivers., JohnWiley & Sons, Chichester, England. p.819-842.
Miller, G.T. 1990. Living in the environment. 6th edition.Wadsworth Pbulishing Co., Belmont CA.
PG&E (Pacific Gas and Electric Co.). 1970. Sluicing reservoiroutlets. Bulletin No. 26, Hydro Generation Electric OperationsDivision, PG&E, San Francsico CA.
PG&E (Pacific Gas and Electric Co.). unpublished data describingreservoirs and diversions for hydrogeneration projects.
Parfitt, D. and K. Buer. 1980. Upper Sacramento River spawninggravel study. California Department of water Resources,Northern District, Redding, CA.
Petts, G.E. 1984. Impounded rivers. John Wiley and Sons,Chichester. 325 pp.
Point Reyes Light 1991. Vol. 5, no. 38, Nov. 7, 1991.Ramey, M.P., and S.M. Beck. 1990. Flushing flow evaluation: the
North Fork of the Feather River below Poe Dam. Environment,Health, and Safety Report 009.4-89.9. Pacific Gas and ElectricCompany, Department of Research and Development, San Ramon CA.
Reiser, D.W., M.P. Ramey, and T.A. Wesche. 1988. Flushing flows.Chapter 4 in Alternatives in regulated river management. CRCPress, Boca Raton FL. p.91-135.
Richards, K. 1982. Rivers: form and process in alluvial channels.Methuen, London, UK. 358 pp.
Sandecki, M. 1989. Aggregate mining in river systems. CaliforniaGeology, vol. 42, no. 4, pp. 88-94.
Simons, Li, and Associates. 1983. Hydraulic, erosion andsedimentation study of the Santa Clara River, Ventura County,California. unpublished report to ventura County Flood Control
61

District, Ventura, CA.Swanson, M.L. and G.M. Kondolf. 1991. Geomorphic study of bed
degradation in stony Creek, Glenn County, California. Reportto California Dept. of Transportation, Division of structures,30 June 1991.
USACE (US Army Corps of Engineers). 1979. New Melones Dam andLake, stanislaus River, California: Report on reservoirregulation and flood control. unpublished report, USACE I
Sacrmento District.USACE (US Army Corps of Engineers). 1981a. Camanche Dam and
Reservoir, Mokelumne River, California: water control manual.Appendix II to master manual of reservoir regulation, SanJoaquin River Basin, California. USACE, Sacramento District.september 1981.
USACE (US Army Corps of Engineers). 1981b. New Exchequer Damand Reservoir, Merced River, California: Water control manual.Appendix VII to master water control manual, San Joaquin RiverBasin, California. USACE, Sacramento District. october 1981.
USACE (US Army Corps of Engineers). 1983. New Hogan Dam and LakeCalaveras River, California: water Control Manual. USACESacramento District. Appendix III to master water controlmanual, San Joaquin River Basin, California. USACE, SacramentoDistrict. June 1983 .•
USACE (US Army Corps of Engineers). 1987. Black Butte DarnandLake, stony Creek, California: water control manual. AppendixIII to master water control manual, Sacramento River Basin,California. USACE, Sacramento District. May 1987.
USACE (US Army Corps of Engineers). 1989a. Mokelumne River,California: 1% Flood at Franklin Road hydrology. unpublishedreport. USACE, Sacramento District. May 1989.
USACE (US Army Corps of Engineers). 1989b. New Don Pedro Lake,Tuolumne River, California: water control manual. Appendix VIto master water control manual, San Joaquin River Basin,California. USACE, Sacramento District. September 1989.
USACE (US Army Corps of Engineers). 1990a. American River andSacramento Metro investigations, California, hydrology officereport. unpublished report. USACE, Sacramento District.January 1990.
USACE (US Army Corps of Engineers). 1990b. Bear and Yuba RiverBasins, California, discharge-frequency relationaships.unpublished report to the USACE Sacremento District preparedby the USACE Hydrologic Engineering Center. Project report
62

No. 90-4. June 1990.USACE (US Army Corps of Engineers). 1991. Draft feasibility
report, American River watershed investigation, California,documentation report. unpublished report. USACE SacramentoDistrict, South Pacific Division. April 1991.
USBR (US Bureau of Reclamation). 1975. Report on standard projectflood and intermediate regional flood determination, upperTrinity River basin, Trinity County, California.
USGS. water Resources Data for California. various years.US Bureau of Sport Fisheries and Wildlife. 1968. Fish and wildlife
resources of the Klamath River drainage, Oregon andCalifornia, with brief comments relating to the Eel, Mad andSmith Rivers. unpublished. 20 pp.
Vanoni, V., ed. 1975. Sedimentation engineering. American societyof Civil Engineers, New York. 745 pp.
Warner, R.F. 1981. The impacts of dams and weirs on the Hawkesbury-Nepean River System, New South Wales, Australia. paperpresented to the Second INternational Conference on FluvialSediments, University of Keele, UK, September 1981.
Williams, G.P. and M.G. Wolman. 1984. Downstream effects of damson alluvial rivers. US Geological Survey Professional Paper1286.
Woodward-Clyde Consultants, Inc. 1976. Aggregate extractionmanagement stUdy, Yolo County, CA. Report to the county ofYolo Planning Department, Woodland, CA, 128 pp.
Yeend, W .• 1974. Gold-bearing gravel of the ancestral Yuba River,Sierra Nevada, CA. U.S. Geological survey Prof. Paper, 772.
63

Table 1. Abbreviations Used in this Report
Agencies
CalTransCDFGCDMGCDPRCRSADSDDWREBMUDLADWPMIDMMWDMPWMDNCPAPG&ESCESCSSCVWDSCWASFWDSMARASSWDTIDTUUSACEUSBRUSFSUSGSYCWA
Units of Measure
ac-ft, AFefsD50D84ftkmmmmmiydyr, y
California Department of TransportationCalifornia Department of Fish and GameCalifornia Division of Mines and GeologyCalifornia Department of Parks and RecreationCannel River Steelhead AssociationCalifornia Deptartment of Water Resources, Division of Safety of DarnsCalifornia Department of Water ResourcesEast Bay Municipal Utilities District'City of Los Angeles Department of Water and PowerModesto Irrigation DistrictMarin Municipal Water DistrictMonterey Peninsula Water Management DistrictNorthern California Power AgencyPacific Gas and Electric CompanySouthern California EdisonSoil Conservation Service (U.S. Department of Agriculture)Santa Clara Valley Water DistrictSonoma County Water AgencySan Francisco Water DistrictSurface Mine and Reclamation ActSouth Sutter Water DistrictTurlock Irrigation DistrictTrout UnlimitedU.S. Army Corps of EngineersU.S. Bureau of ReclamationU.S. Forest ServiceU.S. Geological SurveyYuba County Water Agency
acre-feetcubic feet per secondmedian sediment grain size (mm)size (mm) of which 84% of grains are finerfeetkilometermetermilimetermileyardyear

Table 1. Abbreviations Used in this Report (cont.)
Miscellaneous
abappxbelckDAnandN Fk, S Fknrnyappers. comm.QQMaxRRIRMtrib
aboveapproximatelybelowcreekdrainage areanot applicableno dataNorth Fork, South Forknearnot yet availablepresentpersonal communicationwater discharge or flowpeak dischargeriverrecurrence intervalriver miletributary

Table 2. Inventory of Dams for Selected Basins
River Basin Major DA Original RM of Darn % Basin Number of DSD Number of PG&E Total ReservoirLowermost Dam (rnr') Capacity Blocked reservoirs in (non-DSD) dams Capacity in basin
(M) system (a) in system (b) (M)Merced New Exchequer 1,037 1,024,000 62.5 81.7 8 1,044,485Tuolumne Don Pedro 1,533 2,030,000 54.8 81.8 27 2,710,848
LaGrange 500 52.2
Calaveras New Hogan 363 317,055 44.6 -na- 15 331,222Stanislaus New Melones 900 2,419,523 90.3 28 12 2,871,647
Tulloch 986 68,400 60
Mokelumne Camanche 619 430,300 63.6 93.6 29 6 895,300Cosumnes no mainstem -na- -na- -na- -na- -na-
dams
American Folsom 1,875 1,010,300 -na- 100.0 -nya- 0Bear Camp Far West 285 102,200 -na- 97.6 -nya-
Yuba Englebright 1,108 70,000 -na- 827 -nya- 14Feather Oroville 3,607 2,685,385 68.2 (c) 99.0 -nya- 0
Sacramento Shasta 6,421 4,436,400 302.1 (d) 40.6 -nya-
Clear Creek Whiskeytown 200 241,088 16.5 84.0 1 241,088Trinity Trinity 692 2,427,700 112 (e) 25.2 2 2,442,400
Stony Creek Black Butte 738+/- 160,CXXl 24.8 95.5 2 258,300
(a) as listed in DWR Bulletin 1984(b) from PG&E records only(c) river mile at Thermalito Div, Dam(d) river mile at Keswick Dam(e) river mile at Lewiston Dam

Table 3. Merced River Basin: Inventory of DSD-Regulated Dams
Total Dams: 8 Total Capacity: 1,044,485 ac-ft
Source: DWR 1988

Total Dams: 27 Total Capacity: 2.710.848 ac-ft
Source: DWR 1988
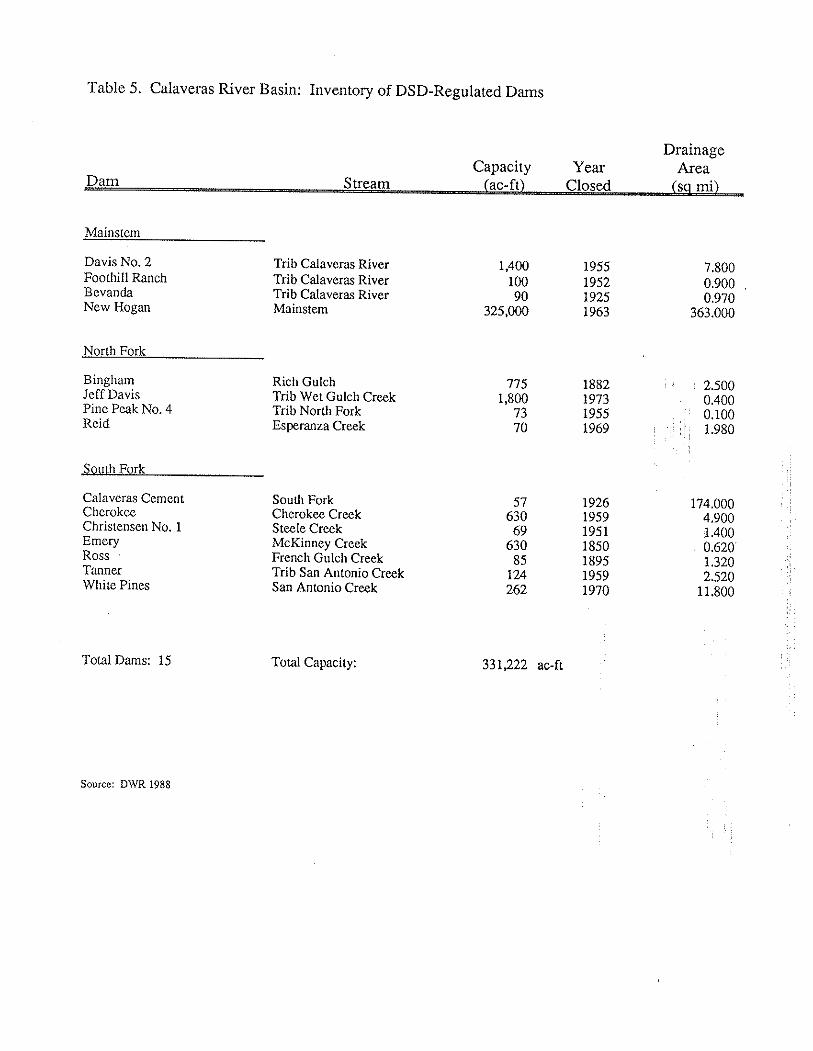
Table 5. Calaveras River Basin: Inventory of DSD-Regulated Dams
DrainageCapacity Year Area
Dam Stream (ac-ft) Closed (S9 mi)
Mainstem
Davis NO.2 Trib Calaveras River 1,400 1955 7.S00Foothill Ranch Trib Calaveras River 100 1952 0.900Bevanda Trib Calaveras River 90 1925 0.970New Hogan Mainstern 325,000 1963 363.000
North Fork
Bingham Rich Gulch 775 IS82 2.500Jeff Davis Trib Wet Gulch Creek I,SOO 1973 00400Pine Peak NO.4 Trib North Fork 73 1955 0.100Reid Esperanza Creek 70 1969 1.980
South Fork
Calaveras Cement Sout.hFork 57 1926 174.000Cherokee Cherokee Creek 630 1959 4.900Christensen No.1 Steele Creek 69 1951 10400Emery McKinney Creek 630 1850 0.620Ross French Gulch Creek 85 IS95 1.320Tanner Trib San Antonio Creek 124 1959 2.520White Pines San Antonio Creek 262 1970 I1.S00
Total Dams: 15 Total Capacity: 331,222 ac-ft
Source: DWR 1988

Table 6. Stanislaus River Basin: Inventory of DSD-Regulated Dams
i" DrainageCapacity Year Area
Dam Stream (ac-ft) Closed (sg mi)
Mainstem
Andrew Cadernartori Trib Angels Creek 142 1983 0.050Copperopolis Penney Creek 225 1905 1.400Forest Meadows Angels Creek 108 1975 0.430Goodwin Mainstem 500 1912 975.000Holman Trib Angels Creek 250 1976 0.060McCarty Trib Johnny Creek 93 1938 0.570Murphys Afterbay Trib Angels Creek 40 1953 2.800Murphys Forebay Trib Angels Creek 54 1953 0.004Murphys Wastewater Trib Six-Mile Creek 140 1980 0.100New Melones Mainstem 2,400,000 1979 900.000Rodden Lake Lesnini Creek 380 1916 1.630Stanislaus Forebay Trib Stanislaus River 320 1908 0.100Tulloch Mainstem 68,400 1958 971.000
North Fork
Alpine Silver Creek 4,600 1906 5.100Bear Vly Sewage Hldg Trib Bloods Creek 346 1975 0.100Fly-In Acres Moran Creek 100 1953 2.450Hunters Mill Creek 200 1928 12.500Reba Trib Bloods Creek 240 1965 0.770Spicer Meadows Highland Creek 189,000 1988 44.000Union NFork 2,000 1902 15.000Utica NFork 2,400 1908 15.000
Middle Fork
Beardsley Middle Fork 97,500 1957 310.000Beardsley Afterbay Middle Fork 320 1958 305.000DonneUs Middle Fork 64,500 1958 226.000Leland Meadows Leland Creek 79 1978 0.370Relief Relief Creek 15,122 1910 25.000
South Fork
Lyons South Fork 6,228 1932 67.800Main Strawberry South Fork 18,600 1916 27.000
Total Dams: 28 Total Capacity: 2,871,647 ac-ft
Source: DWR 1988

Table 7. Mokelumne River Basin: Inventory of DSD-Regulated Dams
DrainageCapacity Year Area
Dam Stream (ac-ft) Closed (s9 rni)
Mainstem
Beggs Trib Mokelumne River 81 1971 0.097Camanche Mainstern 431,500 1963 619.000Mine Run Mine Run Creek 31 1979 0.700Mokelumne Hill Trib Mainstem 52 1973 0.010Pardee Mainstem 210,000 1929 575.000Woodbridge Diversion Mainstem 2,464 1910 667.000
Dry Creek
Arroyo Seco Trib Dry Creek 2,433 1957 0.440Goffinet Jackass Creek 197 1954 1.350Hamel Trib Dry Creek 350 1957 0.730Henderson Jackass Creek 500 1923 1.000Jackson Creek Jackson Creek 22,000 1965 58.000John Orr Trib Jackson Creek 152 1959 0.850Lake Tabeaud South Fork Jackson Creek 1,170 1901 0.750Preston Trib Mile Creek 268 1949 0.120Preston Forebay Trib Sutter Creek 30 1892Sand Plant South Fork Merchant Creek 414 1962 0.125
North Fork
Lower Bear River Bear River 52,025 1952 37.000Lower Highland North Fork 175 1900 0.500Lower Blue Lake Blue Creek 4,300 1903 4.800Meadow Lake Meadow Creek 5,850 1903 5.500Salt Springs North Fork 139,400 1931 169.000Tiger Creek Afterbay North Fork 3,960 1931 360.000Tiger Creek Reg Tiger Creek 540 1931 9.000Tiger Creek Forebay Tiger Creek 36 1931Twin Lakes Meadow Creek 1,300 1901 0.800Upper Blue Lake Blue Creek 7,500 1901 2.700Upper Bear River Bear River 6,756 1900 28.000
Middle Fork
Middle fork Middle Fork 1,718 1939 28.500West Point Reg Ruse Creek 50 1965 0.300
Total Dams: 29 Total Capacity: 895,252 ac-ft
Source: DWR 1988

Table 8, Reservoir Sedimentation, Sierran Drainages
Drainage Area (m?) Sed. Yield Capacity (AF)(AFfmi2/v)
Reservoir Stream Total Contrib. Period Total Contrib. Orig. Last Capacity RemarksSurvey Loss %
Lake Merced R 1037 1022 1926-1946 0,18 0.18 289,000 285,646 1.2 Enlarged in 1967 to USACE (199Oa)reportedMcOure 0.167 1,032,000 AF 0.18;Dendy & Champion (1973)reported 0.167
Don Pedro Tuolumne R 1533 1001 1923-1945 0.21 0.32 289,000 284,266 1.6 Enlargement completed Dendy & Champion 19731971 to 2.030,000 AF
Pardee Mokelumne R 575 387 1929-1943 0.15 0.22 210,000 209,183 0.4 Excludes areas above Salt USACE 1990aSpring & Bear RiverReservoir
Bullards Bar N. Yuba R 481 479 1919-1939 0.28 0,28 31,500 28,893 8.3 Enlargement completed USACEI990a1970 to 969,600 AF
Combie BearR 130 129 1928-1935 0.75 0,75 8,545 7,840 8.3 USACE 1990a5,555
New Stanislaus R 900 7 0.13 nya 2,419,523 unknown method ofMelones computation
Oroville Feather R 36(J7 ? O.2(a) nya 2,685,385 unknown method of USACEI990acomputation
Auburn American R 974 449 NA O.27(a) 0.59 600,000 -na- Under Construction; USACE 1990aestimate from USBR basedon sed. sampling
La Grange Tuolumne R 1501 1501 1895-1905 0.083 0.083 2,332 1,058 54.2 first Don Pedro built justupstream in 1923

Table 9. Reservoir Sedimentation, Coast Range Drainages
Drainage Area (mi~ Sed. Yield Capacity (AF)(AF/mi2/y)
Reservoir Stream Total Contrib. Period Total Contrib. Orig. Last Capacity Remarks SourceSurvey Loss 0/0
Black Butte Stony Ck 738 440 1963-1984 1.04 1.74 160,(0) 143,800 10.1 Swanson and Kondolf 1991
East Park Stony Ck 102 102 1910-1962 0.37 0.37 50,900 48,940 3.9 Knott & Dunnan 1969
Stony Gorge StonyCk 301 199 1928-1962 0.27 0.41 50,(0) 48,160 3.7 Knott & Dunnan 1969
Matanzas Matanzas 11 11 1963-1982 0.79 0.79 SCWAI991
Scott EelR 288 1921-1984 0.83 94,400 80,700 14.5 SCWA 1991
Coyote Russian R 105 1952-1985 0.93 91,800 88,580 3.4 SCWA 1991
Los Padres CannelR 44.9 44.9 1949-1984 0.79 0.79 3,100 1,930 37.7 Large fire in 1977 contributed Matthews 1988500+ AF in 1978
San Cannel R 125 80.1 1921-1949 0.14 0.14 1,400 900 35.7 Los Padres built upstream 1949 Matthews 1988Clemente 1949-1973 0.04 0.06 900 715 44.6 reduces contributing area. Fire
1973-1984 0.31 0.48 775 316 84.6 and airstrip constructionincreased yield 1973-1984.

Table 10. Gages Downstream of Major Reservoirs on Selected Rivers
River Basin USGS Gage Gage Location Name DA,me Period of Avg Q (cfs) Avg Q (AP)# (RM) Record
Merced 11272500 nr Stevinson 1,273 (4.4) 1941-P 691 500,60011270900 bel Merced Falls Dam 1,061 1901-P 1,342 972,300
nr Snelling
Tuolumne 11290000 at Modesto 1,884 (16.2) 1896, 1941-P 1,385 1,003,000Calaveras 11308900 bel New Hogan Dam 363 (439) 1961-1990 229 165,900
nr Valley Springs
Stanislaus 11303000 at Ripon 1,075 (9.5) 1941-P 1,014 734,600Mokelumne 11325500 at Woodbridge 661 1929-P 600 434,700Cosumnes 11335000 at Michigan Bar 536 1908-P 491 355,700American 11446500 at Fair Oaks 1,888 1905-P 3,741 (a) 2,708,000 (a)
3,779 (b) 2,738,000 (b)Bear 11424000 nr Wheatland 292 1929-P 417 (c) 301,900 (c)
404 (d) 292,700 (d)Yuba 11421000 nr Marysville 1,339 1941-P 2,490 1,804,000Feather 11407000 at Oroville 3,624 (17.3) 1902-P 5,836 4,225,000Sacramento 11370500 at Keswick 6,468 1929-P 8,376 6,064,000
at Red Bluff 8,900 1892-P 11,400 8,259,000Clear Creek 11372000 nr Igo 228 1940-P 413 299,200Trinity 11525500 at Lewiston 719 (111) 1913-P 1,641 1,189,000Stony Creek 11388000 bel Black Butte Dam 738 1956-1990 635 460,100
nr Orland
(a) Pre-dam period, 1905-1956 (c) Pre-dam period, 1930-1963(b) Post-dam period, 1956-1990 (d) Post-dam period, 1963-1990
(Source: USGS published records, Water Resources Data for California)

Table 11. Pre-Dam and Post-Dam Flood Peaks for Selected Rivers
PEAK DISCHARGE, ANl'i"UAL MAXIMAl
Pre-Dam Post-DamRiver Dam Location of Q1-5 2 5 10 20 50 100 Q1.5 2 5 10 20 50 100Gage for
Computations
Merced New bl McSwain 6,600 10,500 26,000 41,000 62,000 98,000 135,000 1,800 2,200 2,900 5,000 5,500 5,800 6,000EXchequer Dam
Tuolumne/ Don Pedro nr LaGrange 12,000 13,500 16,000 18,000 19,500 21,500 23,000 400 670 4,800 7,300 8,500 10,000 11,500
Stanislaus New Melones at New 6,300 10,300 26,000 43,000 63,000 99,000 135,000 3,100 3,500 7,200 8,000 8,000 8,000 800Melones
Calaveras New Hogan bi New Hogan 9,500 12,500 21,500 28,500 36,000 59,000 70,000 1,450 1,950 7,000 8,100 9,000 127,000 12,500Mokelumne Comanche bl Comanche 3,800 5,900 13,500 21,500 31,500 48,500 65,000 1,500 1,900 3,900 5.000 5.100 5,100 20,000Cosumnes' at Michigan 4,500 6.900 14,300 20,200 ?:l,roJ 37,500 47.000 no mainste dams
Bar mAmerican" Folsom at Fair Oaks 20,500 31,000 69,000 105,000 150,000 220,000 285,000 7,800 16,000 68,000 100,000 115,000 115,000 230,000
Bear Camp Far nr WheaIland 8,700 12,000 22,000 30,000 38,000 52,000 62,000 2,900 6,600 20,500 29,500 38,000 52,000 62,000West
Yuba" Englebri ght bl Englebrighr 21,000 33,000 82,000 128,000 185,000 280,000 370,000 14,000 21,500 49,000 76,000 100,000 110,000 160,000
IFor sources of data, see Table 12
~e-dam and post-dam are mean daily flows
3UnreguIated flows computed from mean daily records
"Pre-darn computed from mean daily flowsPost-dam computed from peak discharges

Table 11. Pre-Dam and Post-Dam Flood Peaks for Selected Rivers (cont.)
Pre-DamPost-Dam
River Dam Location of Q1.5 2 5 10 20 50 100 Q1.5 2 5 10 20 50 lOOGage forComputations
Feather Oroville at Oroville 37,500 55,000 1105,000 133,000 195,000 265,000 325,000 11,500 19,000 59,000 82,000 127,000 150,000 150,000
Upper Shasta at Keswick nyaSacramento at Red Bluff
Gear Ck Whiskeytown nya
Trinity Trinity at Lewiston 11,400 16,000 3 t,500 45,000 60,000 84,000 105,000 300 300 1,500 2,700 3,700 5,700 8,400
Coast Range:
Stony Ck Black Buue bl Black Buue 9,000 14,500 32,000 45,000 58,000 78,000 93,000 3,800 10,000 15,000 15,000 15,000 15,000 20,000

Table 12. Ratio of Post-Dam to Pre-Dam Peak Discharge and Maximum Recorded Floods Pre- and Post-Dam
Ratio of Post-Dam to Pre-Dam Peak Discharge Recorded QMax (USGS Records)
River Dam Operating Year of Q1.5 2 5 10 20 50 100 Pre (Yr) Post (Yr) Source NotesAgency Closure
Merced New MID 1967 O.T! 0.21 0.11 0.12 0.09 0'(J6 0.04 47,700 (1911) 8,100 (1983) USACE 1981b RainfloodExchequer
Tuolumne DonPcdro TID & 1971 57,000 (1950) 13,800 (1983) USACE 1989b Mean daily,MID snowmelt
Stanislaus New Melones USBR 1979 0.49 0.34 0.28 0.19 0.13 0.08 0.06 62,500 (1955) . 6,620 (1986) USACE 1979 Rainflood
Calaveras New Hogan USACE 1963 0.15 0.16 0.33 0.28 0.25 0.20 0.18 50,000 (1911) 10,000 (1980) USACE 1983 Rainflood
Mokelumne Comanche EBMUD 1963 0.39 0.32 0.29 0.23 0.16 0.11 0.31 T!,rIXJ (1950) 5,340 USACE 1981a Rainflood
Cosumnes no significant 45,100 (1986) not regulated USACE 1989a Mean dailyregulation
American Folsom USBR 1956 180,rIXJ (1950) 134,000 (1986) USACE 1991 P=Mean daily,rain; Poseepeak
Bear Camp Far SSWD 1963 0.33 0.55 0.93 0.98 1.00 1.00 1.00 35,000 (1955) 48,000 (1986) USACE 1990b RainfloodWest
Yuba Englebright USACE 1941 0.67 0.65 0.60 0.59 0.54 0.39 0.43 -na- 171,000 (1964) USACE 1990b R.ain.tJ.ood
Feather Oroville DWR 1968 0.31 0.35 0.56 0.55 0.65 0.57 0.46 230,000 (1907) 134,000 (1986) DWR 1982 Rainflood
Upper Shasta USBR 1945 nya 186,(0) (1940)1 81,400 (1974)1Sacramento 291,(0) (1940/ 157,000 (1970)z
Clear Ck Whiskeytown USBR 1963 nya 24,500 (1935) 89,200 (1988)
Trinity Trinity USBR 1962 0.03 0.02 0.05 0.06 0.06 0.Q7 0.08 71,600 (1955) 14,400 (1974) USBR 1975 USBR chgd OJ'<'".
policy afte- 1974 flood
Stony Ck Black Buue USACE 1963 0.42 0.69 0.47 0.33 0.26 0.19 0.22 36,300 (1958) 23,300 (1986) USACE 1987 Hi.gh« release to
l'f"Vent add'l spilldonage in 1986
'at Keswick
2at Red Bluff

Tat. . Channel Incision Below Darns
Stream Darn Avgfmax.incision
(ft)
Stony Black Butte 1·3Creek
Cannel San 5+River Clemente
Coyote Leroy 5 est.Creek Anderson
Yuba Englebright 4River
Period Remarks
1963·1990 Reach immed. below darn
1947·1982 Complicated due to concurrent response to 1911 flood (100 yr)and 1921 dam construction
1950-1989
1979·1986 Thalweg incised 4 ft in channel immediately downstream ofdarn
Source
Swanson & Kondolf 1991
Kondolf 1982
Kondolf & Matthews 1990
Beak Consultants 1989

Table 14. Bed Coarsening Below Dams
Bed MaterialSize
Stream Dam DA Year of Pre-Darn Post-Dam Source Remarks(mi~ Closure
Sacramento River Shasta' 6,421 1945 gravel boulders, bedrock Parfin and Buer,1980
Gear Creek Whiskeytown 200 1963 gravel cobbles Denton. 1986 CDFG biologists estimate 93% loss of spawning gravelsfrom 1956 to 1970in six-mile reach upstream SaeltzerDam
Klamath River Iron Gale 4,630 1962 D5O: 30- D50: 4O-13Omm Buer, 1981 Former heavily used spawning riffles; assume pre-196240rnrn D50 of 30-40mm had become too coarse for spawning
Trinity River Trinity/ 692 1962 gravel cobbles Hazel, et al, 1976, p. Important spawning grounds just below darns scoured outLewiston 73 by high flows in 1970 and 1974
Putah Creek Monticello 576 1957 gravel Bedrock, Deuman (pers.(1972) boulders (1983) COOlm., 1991)
Feather River Oroville 3,(jJ7 1%8 R. Painter, F. Meyer, No measurements were made, but was considered enoughpers. comm. 1991 of a problem by resource agencies to go ahead with gravel
enhancement
Yuba River Englebrighr 1,108 1941 gravel cobbles, boulders D50 rapidly increases from 67 nun near Parks Bar bridgeto 90 mm at Roase Bar to boulders in narrows downstreamof darn
Bear River Camp Far West gravel Hardpan exposed Channel degradation documented at bridge and gage crossover long reaches sections. Relict gravels on high bars, floodplain, but not in
channeL
American River FolsomlNimbus 1,875 1956 gravel Dettman (pers.comm.,1991)
Carmel River Los Padres 44 1947 gravel boulders Deuman, 1991 Pre-darn based on material in reservoir deltas and gravelsSan Clemente 121 1921 available upstream reservoirs
N Fk American NOl1h Fork 343 1939 nya D5O= 112rn.m Pre-darn assumed to have gravel based on material foundRiver in reservoir deltas
IReregulated by Keswick Dam

Table 14. Bed Coarsening Bc!ow Dams (cont.)
Bed MateriatSize
Stream Dam DA Year of Pre-Darn Post-Dam Source Remarks(mi2) Closure
Silver Branch Silver Lake 14 1876 gravel bedrockAmerican River
Eel River Cape Hom 1907 gravel cobbles Hazel et al, 1976, p. Lack of replenishment & reduced gravel availability belowScott 1922 329 dams and vegetation encroachment
Lagunitas Creek Peters 1954 gravel cobbles Point Reves Light gravels progressively washed away15:38, Nov. 7, 1991
San Simeon Creek gravel Bedrock and Mauhews & Assoc. Due to instream gravel mining 2,00J..{i,CXXlft. downstreamhardpan exposed 1991

Table 15. Examples of Fine Sediment Accumulation in Channel Beds Below Dams
Dam River Period Observations Source
Lewiston Trinity 1%2-79 fine sediment «4.76 mm) in reach above Grass Valley Creek Frederiksen, Kamine &averaged l3%, in reach below averaged 28% Assoc. 1980
sedimentation destroyed an estimated 80% of salmon spawning Hazel, et al. 1976habitat in 2-mile reach below Grass Valley Ck (CDFG 1967)
Whiskeytown Clear Ck 1%3-82 fme sediment «4.0 mm) content averaged -16.5% in 1%5 bed Denton 1986samples, 24% in 1982 samples
Iron Gate Klamath 1962-76 accumulated fine sediment observed along with increase in aquatic U.S. Bureau of Sportvegetation Fisheries & Wildlife 1968
San Clemente Carmel 1983-1986 fine sediment «4.Omm) from Tularcitos Ck completely smothered Matthews 1983; Dettman.channel for 3 km. Mostly flushed out by subsequent high flows pers, comm. 1991
Friant San Joaquin 1942-1976 siltation & vegetation encroachment greatly reduced spawning Hazel, et al. 1976gravels
Baum Lake Hat Ck 1989-1991 possible sources of fine sediments accumulated below reservoirinclude:
(1) fine sediment stored in reservoir transported todownstream reach through piping in volcanic terrain;
(2) sediment generated from road washout
Tulloch! Stanislaus 1959-1972 siltation and compaction at gravels, encroachment of riparian Hazel, et aI. 1976Goodwin vegetation. 35% of gravels lost
Ruth Mad 1%1-1976 loss of spawning gravel by sedimentation of fine materials Hazel, et al. 1976
Isabella Kern 1955-1976 fine sediment deposits below SCE & PG&E diversions Hazel, et al, 1976, P 415downstream

Tal.). Channel Incision from Instream Gravel Mining
Stream Avgfmax Period Remarks Sourceincision
Cft)
San Simeon Creek 5-7!I0 1966-1991 At San Simeon Creek Road, 1st Bridge Mauhews & Associates 1991
Russian River 115/18 1940-1972 Below Healdsburg Dam, deep pit mining 195()...6(),bar skimming Collins & Dunne 1990196Q..90
Cache Creek 15(27 1959-1980 Collins & Dunne 1990; Envion 1980; Dames& Moore 1991; CalTrans bridge records
Stony Creek 16 1976-1990 Maximum 16 ft at Highway 32 Swanson & Kondolf 1991; CalTrans bridgerecords
Putah Creek 8/15 1954-1982 Built 1954; heavy rock placed several times, most recently 1982 CalTrans bridge records
Thomes 4+/- 1965-1975 Built 1965 CalTrans bridge records
Etna 4/8 1959-1987 built 1959 CalT rans bridge records
Gear Creek >3 1950-1987 Buill 1950; incision occurred 1971-1987 CalTrans bridge records
Couonwood Creek 8-101>14 1964-1986 Built 1964 CalTrans bridge records
Dry Creek 5/8 1955-1986 Built 1954; built rock dam 1980 CalTrans bridge records
Frasier Creek 6/8 1954-1980 Built 1952; 1966-86 noted degradation and instream mining in CalTrans bridge recordsvicinity
Sulphur Creek 4-5/7 1964-1980 Built 1948; bridge washed out 1963; rock check: dam installed Cal'Irans bridge records1980
Dibble Creek 5·6{7 1965-1987 Built 1965; rock dam built 1982 CalTrans bridge records
East Sand Slough 6t 1947-1987 Built 1947; rock work 1961,1966 CalTrans bridge records
Merced River 6/8 1953·1972 CalTrans bridge records
Santa Clara River 16 1957-1968 Partial failure 1979 Simons & Li Assoc. 1981add'l13 1969-1978 Foundations lowered
Santa Ysabel Creek >10 1%8-1980 CalTrans bridge records

Table 17. A Partial Inventory of Bridge Repair Costs Attributed to Instream Gravel Mining Through 1984
Stream Highway Bridge Maximum Dates of Cost of RemarksNo_ Degradation Repair Repairs
(ft)
Russian River 222 10-80 15 1978-1984 NA Repeated placement of riprapRussian River 101 20-69 17 NA NA
Kelsey Creek 29 14-64 NA 1969-1983 $ 3,500+ Riprap placement in 1%9, 1974, 1983. Cost of 1974riprap = $3,500.
Putah Creek 29 14-14 NA 1958 6,()()()+ Riprap, partial cost only
Stony Creek 32 11-29 14 1979-1984 431,000 Extended concrete footings, replaced riprap.Cache Creek 505 22-101R 19 1970-1982 105,000+ Additional piles and needle pins under piers, riprapKaweah River 216 NA 7 1956 58,000 Repair of pier settled 7 ft
San Diego River 67 57-87, NA 1981 3,339,514 Bridge replaced due to extensive undercutting59-936
San Juan Creek 74 55-60 NA 1983 250,000 Grade control, abutment repair
Big Tujunga Wash 210 53-17 NA 1%9-1970 571,104 Concrete mattress, substructure protection
So. Branch Big 210 53-18 NA 1975 440,000 Bridge replacedTujunga Wash
Santa Clara River ll8 52-49 NA 1%9-1980 732,042 Six spans and footing replaced, footing lowered
Temecula Creek 79 56-188 NA 1980 423,000 Bridge replaced
$6,360,000 Total does not include all costs involved at these sites, andincludes no costs at unlisted sites. With more carefulresearch, this figure would at least double (Ray Hackett,Caltrans, unpub. memo, 1984).
Source: unpub, data in files of California Department of Transportation. Sacramento

Table 18. Gravel Enhancement Projects
Reservoir River Year Vol. Cost (S) Agency Remarks (source)(Dam) Emplaced
(yd')
Camanche Mokelumne 1990 100 S 20,000 EBMUD (Joe Miyamoto, EBMUD, peTS. cornm. 1991)
Shasta! Sacramento 1979 8,700 CDFG 85% of emplaced gravel (D50=13.5, D84=24mm) was removed by high flows in Jan, and Feb.1980 (parfitt & Buer (980)
Shasta' Sacramento 1988 100,000 250,000 CDFG Gravel placed at mouth of Salt Ck., 1 mi downstream of Keswick Dam, funded by USBR(Denice 1991)
Shasta' Sacramento 1989 900,000 200,000 CDFG Gravel placed at mouth of Salt Ck., 1 mi downstream of Keswick Dam, funded by USBR(Demeo 1991)
Shasta! Sacramento 1990 16,000 2,200,000 DWR,CDFG Sacramento R. from Keswick Dam to Clear Ck. Funded by Delta Pumps Fish ProtectionAgreement 1986 (Denton 1991)
Shasta' Sacramento planned 8,000 19,800,000 DWR,CDFG Sacramento R., Keswick Dam downstream. Cost based on S22!ydJ• (Demon 1991)1991-2000
Los Padres Carmel 1990 40 580 MPWMD, Gravel emplaced by CCC hand labor in potential spawning sites (cost does not include1991 800 82,000 CRSA supJplanning cost or labor); redistributed by 1991 flood (RI-2 yr) (D. Dettman, MPWMD, pers.
ccmm.I991)
Iron Gate Klamath 1985 2,180 136.000 CDFG Includes costs of channel work including bed. excavation of 9,800 ydJ and boulder placement (R.Painter, CDFG, pers. comm. 1991)
Kent Lagunitas 1991 54 800 .M11WD,tu Cost does not include value of volunteer labor to emplace gravel, transport, etc. (Newspaper(peter's) Ck article in Point Reves Light, Nov. 7, 1991)
Courtwright N Fk Kings 19897 nya nya PG&E Helicopter used to drop gravel in narrow gorge by hopper (E. Waters, PG&E, pen. comm.1989)
Clair Engle Trinity 1989 1,950 22,000 USBR Gravels emplaced at 5 sites (R. Smith, USBR, pen. comm., 1991)(Trinity)"
lReregulated by Keswick Dam
~eregu1ated by Lewiston Dam

Table 18. Gravel Enhancement Projects (con't.)
Reservoir River Year VoL Cost ($) Agency Remarks (source)(Dam) Emplaced
(y<f)
Folsom? American 1991 1,000 30,000 Sacramento Gravels emplaced below Nimbus Dam as mitigation for disruption of spawning beds at Sunrise ·1County Ave. bridge (F. Meyer, CDFG, and J. Purvis, Teichert Construction, peTS. comm, 1991) i
.JUnnamed Lee Vining 1991 300 4,500 LADWP Cost reflects delivered price of gravel (at $15/yd3 only, does not include planning, design, or
Clc placement costs (S. English, pers. comm. 1991)
Grant Lake Rush Ck 1991 1,200 18,000 LADWP Cost reflects delivered price of gravel (at S15/yd3 only, does not include planningg, design, orplacement costs (S. English, pers. comm. 1991)
Oroville Feather 1982 3,000 nya CDFG,DWR Gravel emplacement part of larger project involving maintenance of spawning channels andgravel ripping (DWR 1983; F. Meyer, R. Painter, CDFG, pers, comm., 1991)
Oroville Feather 1987 2,040 nya CDFG,DWR Gravel emplacement part of larger project involving maintenance of spawning channels andgravel ripping (DWR 1983; F.Meyer, R. Painter, CDFG, pets. cornm., 1991)
Pleasant Owens 1962 830 nya LADWP Gravel imported to artificial spawning channel (Hazel, et al, 1976)Valley
3Reregulated by Nimbus Dam

Table 19. Artificial Spawning Channels Below Dams
Reservoir River YearlOam
Agency Project Description(source)
New Merced 1966Exchequer
oroville Feather 1974
New Don Tuolumne 1973Pedro
Pleasant Owens 1962
Clair Engle Trinity 1987ITrinity -90
Red Bluff Sacramento 1971DiversionDam
Keswick Sacramento 19861988
MID Spawning channel con-structed downstream ofCrocker-Huffman DiversionDam (Hazel et al 1976, p.505)
CDFG Spawning channel known as"Moe's Ditchll construct-ed. Has required period-ic rebuilding after largefloods (DWR 1982, DWR1983)
MID Spawning channel con--TID structed by grading of
stream bed over 57 ac(Hazel et al. 1976, p.496)
LADWP Spawning channel 100 ftlong, 15 ft wide (Hazelet al. 1976, pp. 556-557)
USBR Several side channels forspawning and rearing con-structed between LewistonDam and Grass Valley Ck(A. Hamilton, USFWS,pers. comm., 1991)
USBR 3.25-mile spawning chan-nel known as Tehama-Colusa Can Fish Facili-ties constructed to miti-gate for loss of 3,000adult fall-run chinooksalmon; facility operatedby USFWS. Numerous prob-lems have plagued thefacility (USRFRHAC, 1989)
DWR At two sites, known asTurtle Bay East and west,side channels were en-hanced with gravels tocreate spawning site

Figure 1. Location Map of Principal Study Basins
Collman Hatcl,.ryBetti' Cr.
Pa)'n,sCr.Ant,lop, Cr.
_Mill crrO",. Cr.
t
Sholta Oem) Reci:lin9
cuor Cr. $
LOCATION MAP
ClouQh Dam
I,
IOroville ~~ -""
Feather RiveHatchery
o 10 20 ~O MI.e.=s iiil.·~
!.:EGEND- IMPASSABLE DAM
.a LADOERED DAM
HATCHERY
--
(Source: Hallock 1987)

Figure 2. Impacts of Large Reservoir Construction and Operation on Resources
Direct Effecu ofLarge Dl:ms
Trap ill bedload,most sediment !Dad
Row regime altered(depends upon reservoircapacity and opcrnilIl;)
Upstream fishmigration prevented
Irnpacu OIl
Resources
Operation of ootId. •• Costs of dredging, sediment<wocU.~ --------------------I.rtmOYall'l maintain owlet worb
Stonge Clpacity Reduced net w..c.eryieldlost -------------------j ••~ and power producUoo
It Reduced lUppIyof tand10 beaches
Deposirioa of sediment/ :-- Gravel recruitment from---------..... upstream eliminated
'" Clearwater releases Coarsening of.
from reservoir ~ bed material
Degradation ~-- •••_~ Tributary heada.lning:-lou of.tributary habitat~
-introduce gravel to mainnem -
-introduce uibutary-derivedfine .ediment to mainstem
Los. of.spawninggravel
Underrotting bridgesand ocher .wtJCfllrcs
Bank eronon .:::~~-----, ••_~ intragravel flow, -..... Reduced spawning SUa:es5
suffocating /embIyos
-~_~ Bank erosion reduced ~ Reduced gravelrecruitment
..--••••• No flushing ..c......__ ---.l_~flow.
Base flow. ----+ __a.increased
Tributariesdesynchrecized
mailman
Spawning beds above• reservoir no longer
accessible

Figure 3. Impacts of Instrearn Gravel Mining
TYPE PHYSICAL IMPACTS RESOURCE IMPACTS
Lowered water table, Impacts onreduced aquifer storage-. existing wells
capacity
INSTREAMGRAVEL MINING
Dry pit mining Create profile Heldcuttinglin dlannel""","""-II~ instability---1"_.taiIcutting • Bed degradation
"knickpoint migration"/
Wcr.pit mining ~~----:::"";:---Exceed replenishmentin dianne!
Impa.cu to S1ructtlres
(bridges, pipelines.diversion or summer
dmt)
Bat skimming
Fine sed. downnreatn; Reduce coverRemove gr.vd layer ~ /... ~
Deposition in p001.& E1im.inneriparilll1 Increase water~ vegetation temperature
Create wide, flat --tta- Olmge channel ~ Uct of confinement ~ Reduce~depthcross section hydraulics ~
Removd of natural Release fme sediment _....... Fine sediment infiltntiooarmor layer ••.••• downstream in first ------ in remaining downstream gavels
storms
TI:RRACE ORFLOODPLAJN --- __ ..,•••••• Potential mlmlcl -Ji. Otanncl migration
MINING instability if or avulsionwidt no setback but dwmel fails
levee
All lead to:
.Dowmtream
impacts on tributaryand mainstem
/ gravel supply
Reduced gravel Beachrecruitment ••• nourishment

Figure 4. Knickpoint Migration Following Pit Excavation
oo 0
C>
------- KNICK POINT
EXCAVATION
• '~',cc
'" KNICK POINT{- ~s ~ -=-::>.:--\. .- <{jMIGRATION
-;- o EROSION~~~(~ DEPOSITION WITHIN PIT
c,

Figure 5. Reservoir Sedimentation in Los Padres Reservoir,Monterey County, 1946-1980
1500 .,.--------------------------------.
Marble-Cone FireSept. 1977, 1978 runoff.
1950 1960 1970 1980
(Source: Matthews 1988)

Ioow>oen<:(
zof=<(>W-lW
Figure 6. Yuba River Incision During 1986 Flood
YUBA RIVER BELOW D~GLEBRIGHT DAM
; :
12
11
10
9
87
6
5
4
3'"'lc:
1
0
-1'';2~", -:
-<3
-4-5
120 140 300160 180 200 220 240 260 280
STATJONlt-JGACROSS CHAt~NEL (ft)o Feb 5, 1986 + Apr 2. 1986
(Source: Beak Consultants 1989)

25
6
Figure 7. Jurisdictional and Non-Jurisdictional Darn andReservoir Sizes, Department of Water ResourcesDivision of Dam Safety
PROVISIONS OF DIVISION 3 OF THE CALIFORNIA WATER CODEAFFECTING JURISDICTION OVER DAMS AND RESERVOIRS
~
~ e---~~-~~~~~~Specific exemptions from jUrisdiction, apply toI OaSTRUCTIONS IN A CANAL to raise, lower or divert~ ~ water therefrom; LEVEESj RAILROAD FILLS; ROADS or
~I HIGH~AY FILLS; CIRCULAR TANKS; TANKS ELEVATEDabove the ground; barriers OFF-STREAM for AGRI·
~
CULTURAL USE or use as a SE~AGE SLUDGE DRYING. fACILITIES; OBSTRUCTIONS in channels or water-courses whIch are 15 feet or less in height, '~,.~ which single purpose is for spread-, t=> ing water within the bed of the stream orwatercourse upstream for percoLation under-
/:ground; and ~ASTE ~ATER CONTROL FACILITYponds, which are 15 feet or tess in
I Z height and storage is 1500acre-feet or less, off-I ~ stream, and the operating
~
public agency adopts certainI resolutions' and FEDERAL:.f. DAMS. Further details areI provided in the Stat-
(;utes and RegulationsI Pertaining to Sup-ervision of Dams andI Reservoirs.
-----+-------III
- - - - - .f:::::================
o~-----~l':-S --------------S..LO---------
'"Acre-F eetRESERVOIR CAPACITY .~..~.
(Source: DWR 1988)

Figure 8. Sediment Movement after Middle Yuba River High Flow Events
•••FLOW
(Source:
I Predominant movement as•• bedload ·slug·(Deposit continuous, sand and gravel
Predominant movement assuspended sand
(Deposit discontinuous, sand only)
Emory Island
EBASCO Environmental 1989)
~~~~ ~August 1986
~gj.!ml Feb.-March 1987
~~~~ December 1987
'\[--<-:..-"-'-'-' November 1988
j:·:·...;.',i",·:·../:·JSuspended Sand DistributionMarch,April 1989
sScale 1:24,000
ot------- 'f'''',

Figure 9. Six Storm Hydrographs for Middle Yuba River below Our HouseDam during1987 to 1989
5500
~
\I \ A"
IV v~, ~:. ,\ •,
1\ I, I , \ ~ 1\\\--1 'oJ \ -r-.1 \JV ~2/13-14/87
3112-13/87 12/2/87 12/12/87 11122-
281882122-23/89
312/894/11/89
5000
4500
4000
3500
-..U).•..
30000--:s:0...J 2500u,
2000
1500
1000
500
0
DATE
(Source: EBASCO Environmental 1989)

Figure 10. Middle Yuba River Cross-Sectional Changes
~ 102Qj
~ 100:E:J
98l-e:(
o>- 96a:e:(
94a:-ן
m 92a:e:(
w 90>0ill 88e:(
z 860~e:(
84>w-Jw 82
a
Erosion
Deposition
20 40 60 80 100 120DISTANCE FROM LEFT BANK PIN (feet)
(Source: EBASCO Environmental)
09/06/88
11129188
04126/89
06120/89
09/06r89
140

Figure 11. Map Submitted with Reclamation Plan to Glenn CountyI NO (H,.:.-~-r--- - --..~----_ /' ..i..- ~
J1
------ --..""""-
C!lirfi,U:. SJf(5fE f.f(<<f/cH
I
IIII d~.vrII '" xII).. /0 a f()lt,.
)1 'wO\. ~ ~ D'~ S,f 'k:. ~L' _III...•'
5 i L. r ..:~J G r .(
s .,,('r(..j ly,~,()£J.
PARI CCJI S'".2 /j- EL.
ri.1.t,,·o,u, w,u,"'fN~~,J,.tl";Lr lIyLqs H C#N sT~~cr.·.".a 6c-t(e~.L Co"rNl;c,r<>r.
(
(Source: Swanson & Kondolf 1991)
N~r(.ir"L
D f E tJ
,2/0(;L:-
t. . -.-- _...x--
«., ~ I('Gr'J( v c-/Jr V.::tl
£'\In~·,!:,.·~ -A·
CclP ~ S9·o.J