Electrical Interconnection Systems for Heavy-Duty Applications
Upload
khangminh22Category
view
0download
0
GREATER MEKONG SUBREGION
LAOS-MYANMAR INTERCONNECTION
RPTCC-27
Project : TA-8830-REG: Harmonizing the Greater Mekong SubregionPower Systems to Facilitate Regional Power Trade (47129-001)
Contract Number: 139061-S53235
MILESTONE 2: SYSTEM STUDYVIDEO CONFERENCE
THURSDAY OCTOBER 15TH, 2020
Summary
Introduction:
Scope of work for ADB TA 8830-REG: Lao PDR – Myanmar Power Interconnection Project
Milestone 2
Part 1: Economic Study
1.1 Assumptions on interconnection and Generation economic costs
1.2 Generation cost comparison
1.3 Load Patterns comparison
1.4 Regional Supply Demand Analysis
1.5 Conclusion
Part 2: System Study
2.1 Assumptions
2.2 Methodology
2.3 Results
2.4 Conclusion
Conclusion
RPTCC-27 October 15th,, 2020
TA-8830-REG, Harmonizing the GMS Power Systems to Facilitate Regional Power Trade
3
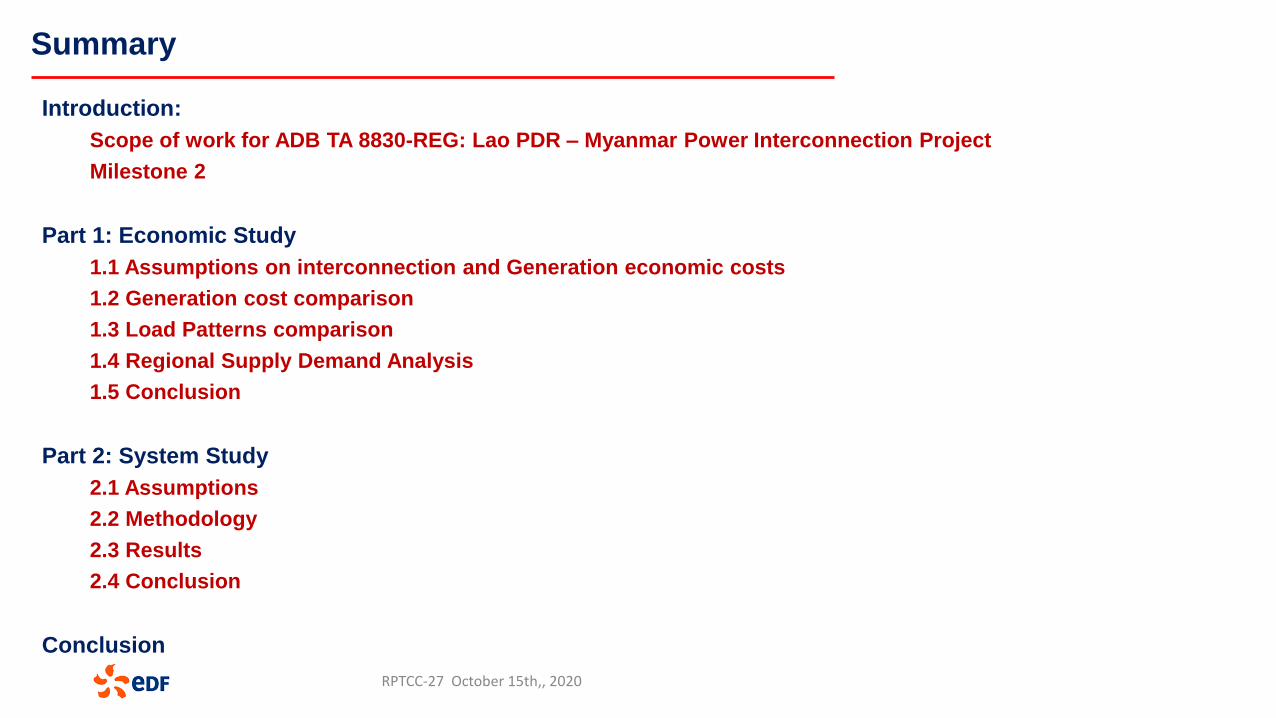
ADB TA 8830-REG: Lao PDR – Myanmar Power Interconnection Project
Activity Schedule for Technical Assessments of Lao-Myanmar interconnection validated on September 13th, 2019 in Yangon (YESC)Consultancy Firm – Electricity De France
Key Components
Milestone 1:Feasibility study of (i) Tachileik – Kengtung (116.3km) transmission line and Tachileik substation; and (ii) Tachileik – Kenglatt, (75.7 km) Transmission line
Milestone 2: System study of high voltage power transmission systems in Myanmar and Lao PDR (230 kV, 66 kV and future 500 kV) with the objective of interconnecting the two power systems.
Milestone 3:Assess the technical gaps and recommend options in synchronizing Myanmar power system with Lao PDR and Thailand power systems. (Common technical standards and gaps have been already established by ADB for RPTCC).
TA-8830-REG, Harmonizing the GMS Power Systems to Facilitate Regional Power Trade
4
ADB TA 8830-REG: Lao PDR – Myanmar Power Interconnection ProjectActivity Schedule for Technical Assessments of Laos-Myanmar interconnection validated on July 13th, 2019 in Yangon (YESC)Consultancy Firm – Electricity De France
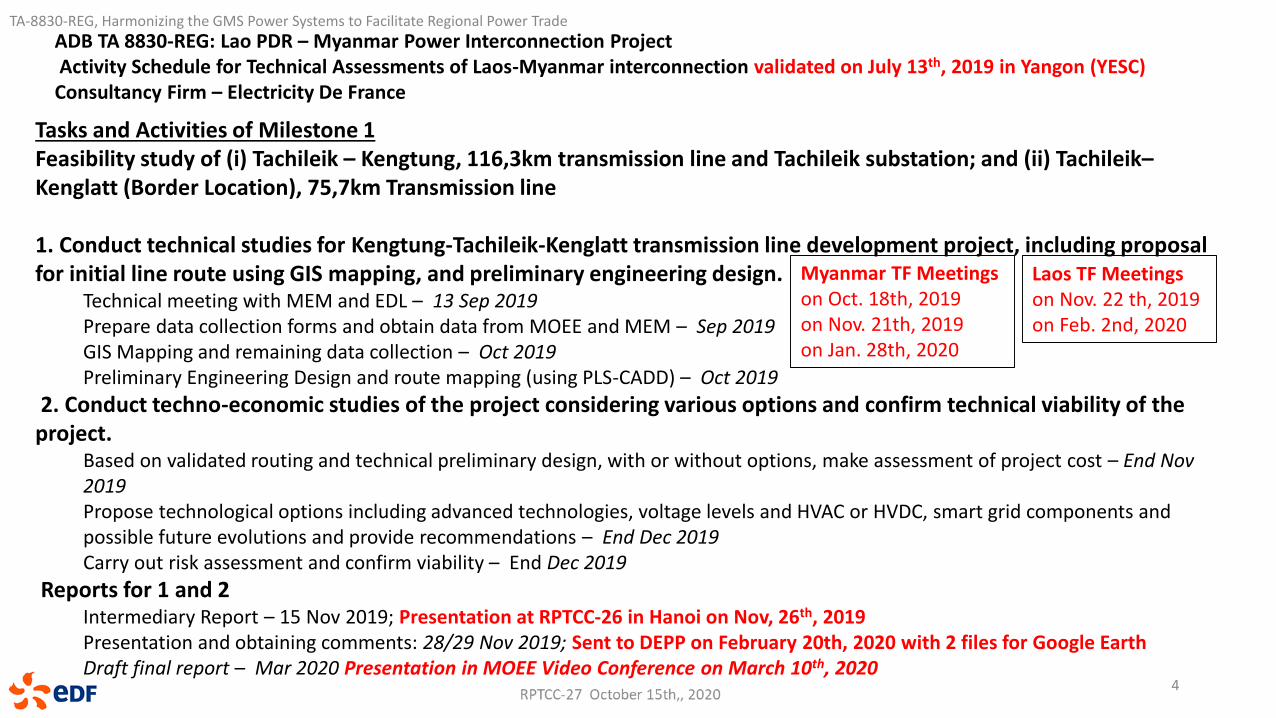
Tasks and Activities of Milestone 1Feasibility study of (i) Tachileik – Kengtung, 116,3km transmission line and Tachileik substation; and (ii) Tachileik–Kenglatt (Border Location), 75,7km Transmission line
1. Conduct technical studies for Kengtung-Tachileik-Kenglatt transmission line development project, including proposal for initial line route using GIS mapping, and preliminary engineering design.
Technical meeting with MEM and EDL – 13 Sep 2019Prepare data collection forms and obtain data from MOEE and MEM – Sep 2019GIS Mapping and remaining data collection – Oct 2019Preliminary Engineering Design and route mapping (using PLS-CADD) – Oct 2019
2. Conduct techno-economic studies of the project considering various options and confirm technical viability of the project.
Based on validated routing and technical preliminary design, with or without options, make assessment of project cost – End Nov 2019 Propose technological options including advanced technologies, voltage levels and HVAC or HVDC, smart grid components and possible future evolutions and provide recommendations – End Dec 2019Carry out risk assessment and confirm viability – End Dec 2019
Reports for 1 and 2Intermediary Report – 15 Nov 2019; Presentation at RPTCC-26 in Hanoi on Nov, 26th, 2019Presentation and obtaining comments: 28/29 Nov 2019; Sent to DEPP on February 20th, 2020 with 2 files for Google EarthDraft final report – Mar 2020 Presentation in MOEE Video Conference on March 10th, 2020
Myanmar TF Meetingson Oct. 18th, 2019on Nov. 21th, 2019on Jan. 28th, 2020
Laos TF Meetingson Nov. 22 th, 2019on Feb. 2nd, 2020
TA-8830-REG, Harmonizing the GMS Power Systems to Facilitate Regional Power Trade
5
ADB TA 8830-REG: Lao PDR – Myanmar Power Interconnection ProjectActivity Schedule for Technical Assessments of Laos-Myanmar interconnection validated on July 13th, 2019 in Yangon (YESC)Consultancy Firm – Electricity De France
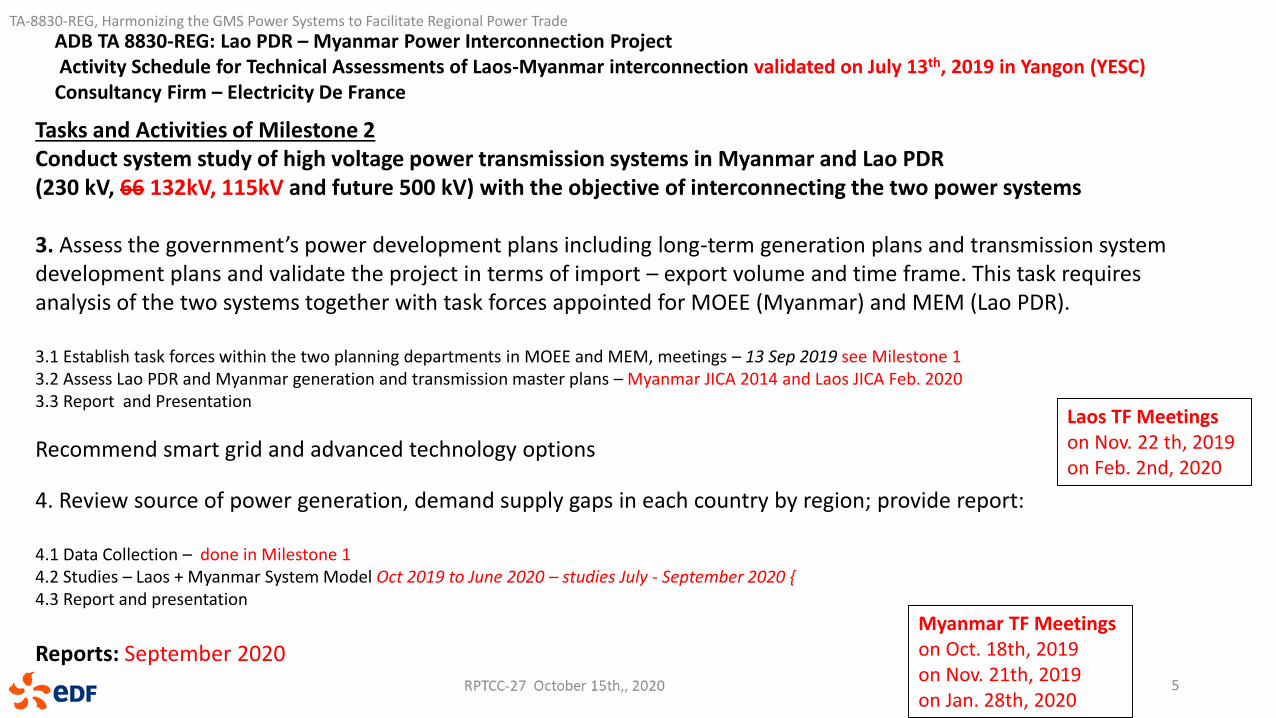
Tasks and Activities of Milestone 2Conduct system study of high voltage power transmission systems in Myanmar and Lao PDR (230 kV, 66 132kV, 115kV and future 500 kV) with the objective of interconnecting the two power systems
3. Assess the government’s power development plans including long-term generation plans and transmission system development plans and validate the project in terms of import – export volume and time frame. This task requires analysis of the two systems together with task forces appointed for MOEE (Myanmar) and MEM (Lao PDR).
3.1 Establish task forces within the two planning departments in MOEE and MEM, meetings – 13 Sep 2019 see Milestone 1 3.2 Assess Lao PDR and Myanmar generation and transmission master plans – Myanmar JICA 2014 and Laos JICA Feb. 20203.3 Report and Presentation
Recommend smart grid and advanced technology options
4. Review source of power generation, demand supply gaps in each country by region; provide report:
4.1 Data Collection – done in Milestone 1 4.2 Studies – Laos + Myanmar System Model Oct 2019 to June 2020 – studies July - September 2020 {4.3 Report and presentation
Reports: September 2020
Myanmar TF Meetingson Oct. 18th, 2019on Nov. 21th, 2019on Jan. 28th, 2020
Laos TF Meetingson Nov. 22 th, 2019on Feb. 2nd, 2020
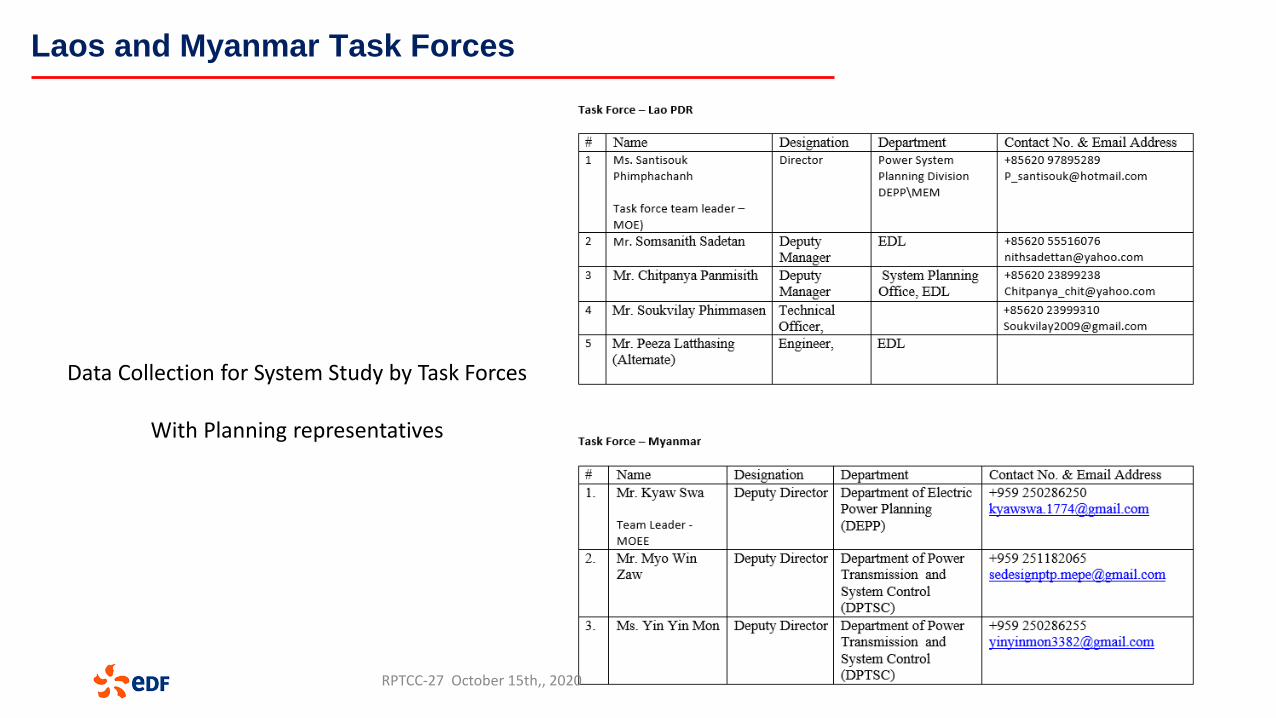
Laos and Myanmar Task Forces
Data Collection for System Study by Task Forces
With Planning representatives
RPTCC-27 October 15th,, 2020
| 7
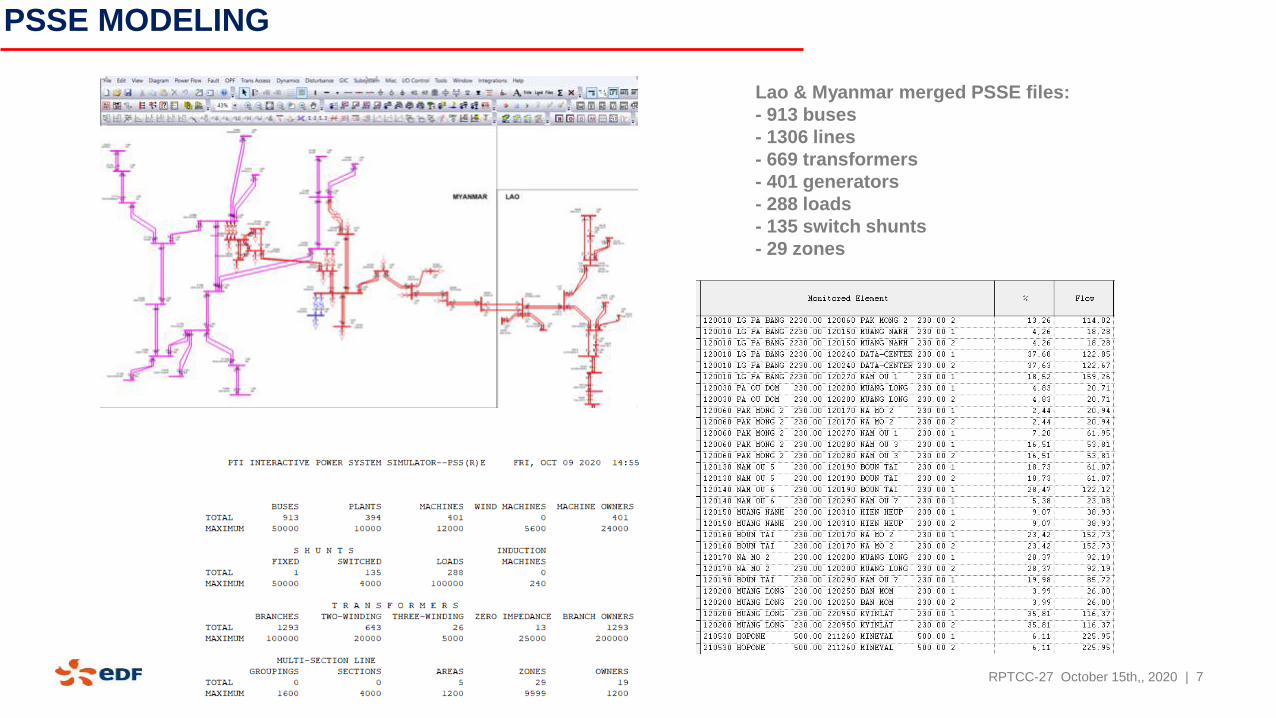
PSSE MODELING
RPTCC-27 October 15th,, 2020
Lao & Myanmar merged PSSE files:
- 913 buses
- 1306 lines
- 669 transformers
- 401 generators
- 288 loads
- 135 switch shunts
- 29 zones
Part 1: Economic Study
RPTCC-27 October 15th,, 2020
Namsang
MinePinnKengtung
Tachilek
Kenglat Muang long
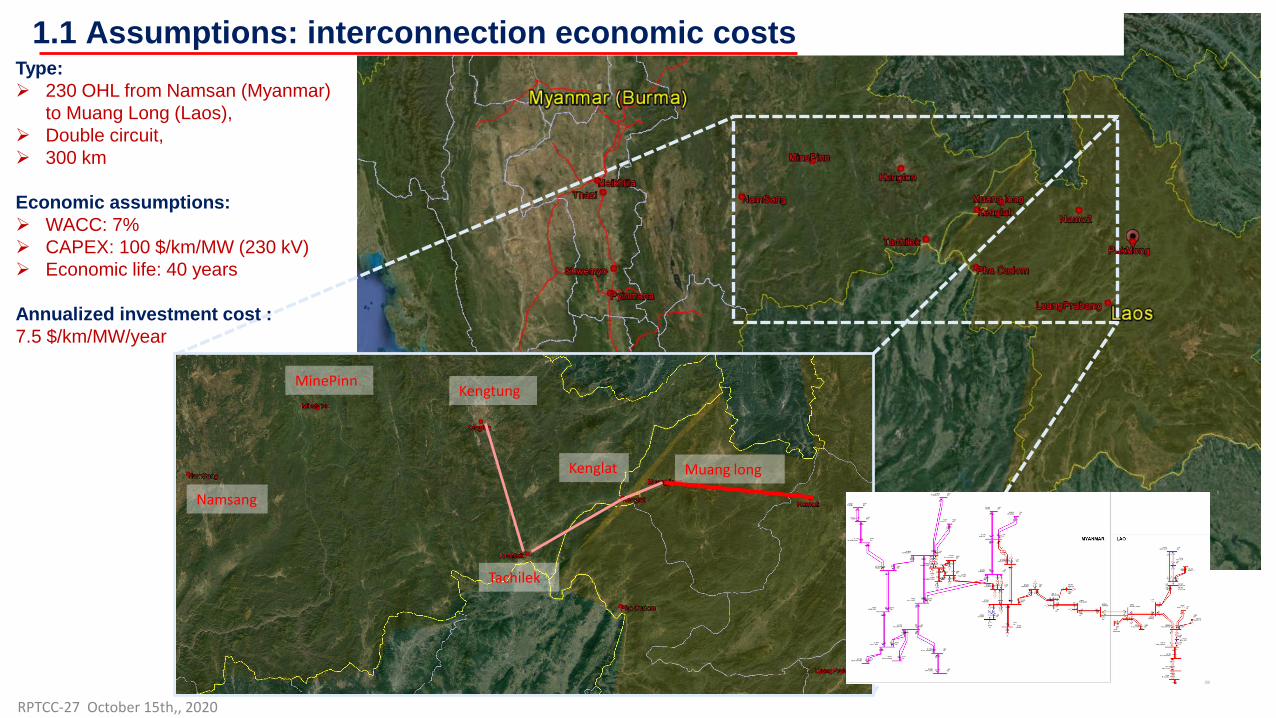
Type:
230 OHL from Namsan (Myanmar)
to Muang Long (Laos),
Double circuit,
300 km
Economic assumptions:
WACC: 7%
CAPEX: 100 $/km/MW (230 kV)
Economic life: 40 years
Annualized investment cost :
7.5 $/km/MW/year
1.1 Assumptions: interconnection economic costs
RPTCC-27 October 15th,, 2020
Technology CAPEX ($/kW)
Economic life(year)
Annualized investment cost
($/kW/year)
Fixed O&M cost($/kW/year)
Variable O&M Cost($/MWh)
Fuel Cost($/MWh)
Annual power factor
(%)
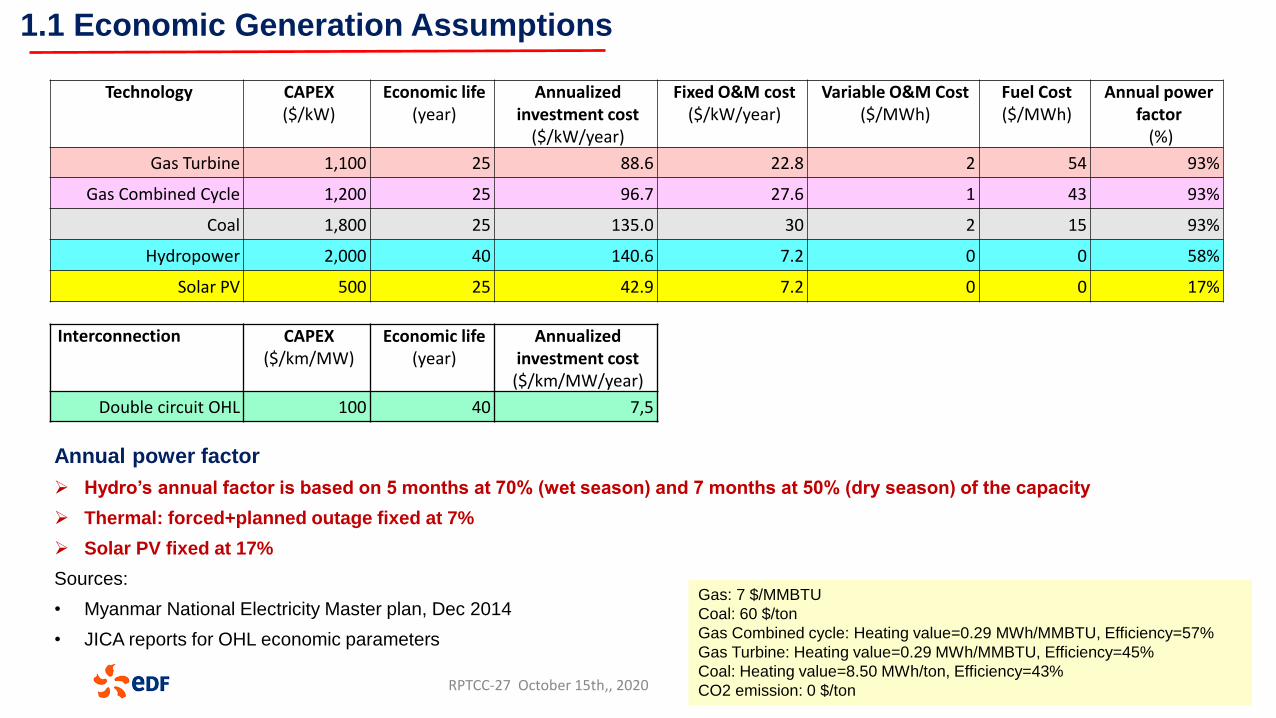
Gas Turbine 1,100 25 88.6 22.8 2 54 93%
Gas Combined Cycle 1,200 25 96.7 27.6 1 43 93%
Coal 1,800 25 135.0 30 2 15 93%
Hydropower 2,000 40 140.6 7.2 0 0 58%
Solar PV 500 25 42.9 7.2 0 0 17%
Interconnection CAPEX ($/km/MW)
Economic life(year)
Annualized investment cost($/km/MW/year)
Double circuit OHL 100 40 7,5
1.1 Economic Generation Assumptions
Annual power factor
Hydro’s annual factor is based on 5 months at 70% (wet season) and 7 months at 50% (dry season) of the capacity
Thermal: forced+planned outage fixed at 7%
Solar PV fixed at 17%
Sources:
• Myanmar National Electricity Master plan, Dec 2014
• JICA reports for OHL economic parameters
Gas: 7 $/MMBTU
Coal: 60 $/ton
Gas Combined cycle: Heating value=0.29 MWh/MMBTU, Efficiency=57%
Gas Turbine: Heating value=0.29 MWh/MMBTU, Efficiency=45%
Coal: Heating value=8.50 MWh/ton, Efficiency=43%
CO2 emission: 0 $/tonRPTCC-27 October 15th,, 2020
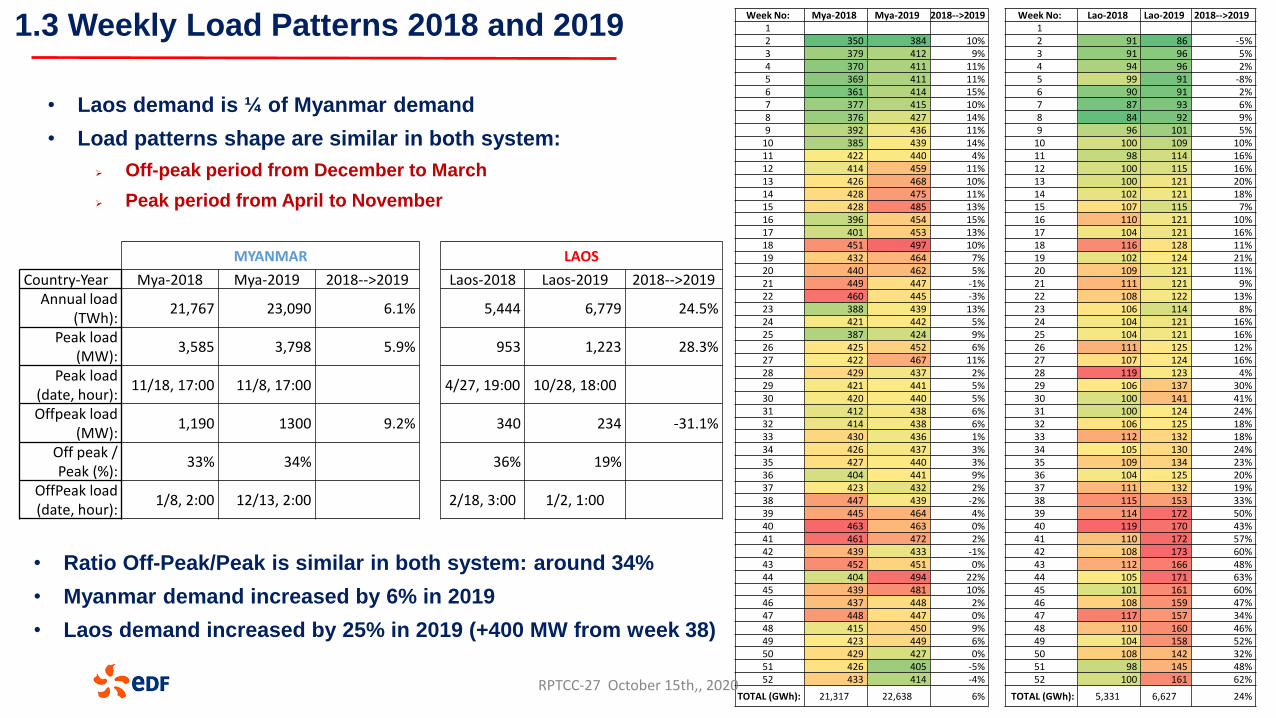
1.3 Weekly Load Patterns 2018 and 2019
• Laos demand is ¼ of Myanmar demand
• Load patterns shape are similar in both system:
Off-peak period from December to March
Peak period from April to November
Week No: Mya-2018 Mya-2019 2018-->2019 Week No: Lao-2018 Lao-2019 2018-->20191 12 350 384 10% 2 91 86 -5%3 379 412 9% 3 91 96 5%4 370 411 11% 4 94 96 2%5 369 411 11% 5 99 91 -8%6 361 414 15% 6 90 91 2%7 377 415 10% 7 87 93 6%8 376 427 14% 8 84 92 9%9 392 436 11% 9 96 101 5%
10 385 439 14% 10 100 109 10%11 422 440 4% 11 98 114 16%12 414 459 11% 12 100 115 16%13 426 468 10% 13 100 121 20%14 428 475 11% 14 102 121 18%15 428 485 13% 15 107 115 7%16 396 454 15% 16 110 121 10%17 401 453 13% 17 104 121 16%18 451 497 10% 18 116 128 11%19 432 464 7% 19 102 124 21%20 440 462 5% 20 109 121 11%21 449 447 -1% 21 111 121 9%22 460 445 -3% 22 108 122 13%23 388 439 13% 23 106 114 8%24 421 442 5% 24 104 121 16%25 387 424 9% 25 104 121 16%26 425 452 6% 26 111 125 12%27 422 467 11% 27 107 124 16%28 429 437 2% 28 119 123 4%29 421 441 5% 29 106 137 30%30 420 440 5% 30 100 141 41%31 412 438 6% 31 100 124 24%32 414 438 6% 32 106 125 18%33 430 436 1% 33 112 132 18%34 426 437 3% 34 105 130 24%35 427 440 3% 35 109 134 23%36 404 441 9% 36 104 125 20%37 423 432 2% 37 111 132 19%38 447 439 -2% 38 115 153 33%39 445 464 4% 39 114 172 50%40 463 463 0% 40 119 170 43%41 461 472 2% 41 110 172 57%42 439 433 -1% 42 108 173 60%43 452 451 0% 43 112 166 48%44 404 494 22% 44 105 171 63%45 439 481 10% 45 101 161 60%46 437 448 2% 46 108 159 47%47 448 447 0% 47 117 157 34%48 415 450 9% 48 110 160 46%49 423 449 6% 49 104 158 52%50 429 427 0% 50 108 142 32%51 426 405 -5% 51 98 145 48%52 433 414 -4% 52 100 161 62%
TOTAL (GWh): 21,317 22,638 6% TOTAL (GWh): 5,331 6,627 24%
MYANMAR LAOS
Country-Year Mya-2018 Mya-2019 2018-->2019 Laos-2018 Laos-2019 2018-->2019Annual load
(TWh):21,767 23,090 6.1% 5,444 6,779 24.5%
Peak load (MW):
3,585 3,798 5.9% 953 1,223 28.3%
Peak load (date, hour):
11/18, 17:00 11/8, 17:00 4/27, 19:00 10/28, 18:00
Offpeak load (MW):
1,190 1300 9.2% 340 234 -31.1%
Off peak / Peak (%):
33% 34% 36% 19%
OffPeak load (date, hour):
1/8, 2:00 12/13, 2:00 2/18, 3:00 1/2, 1:00
• Ratio Off-Peak/Peak is similar in both system: around 34%
• Myanmar demand increased by 6% in 2019
• Laos demand increased by 25% in 2019 (+400 MW from week 38)
RPTCC-27 October 15th,, 2020
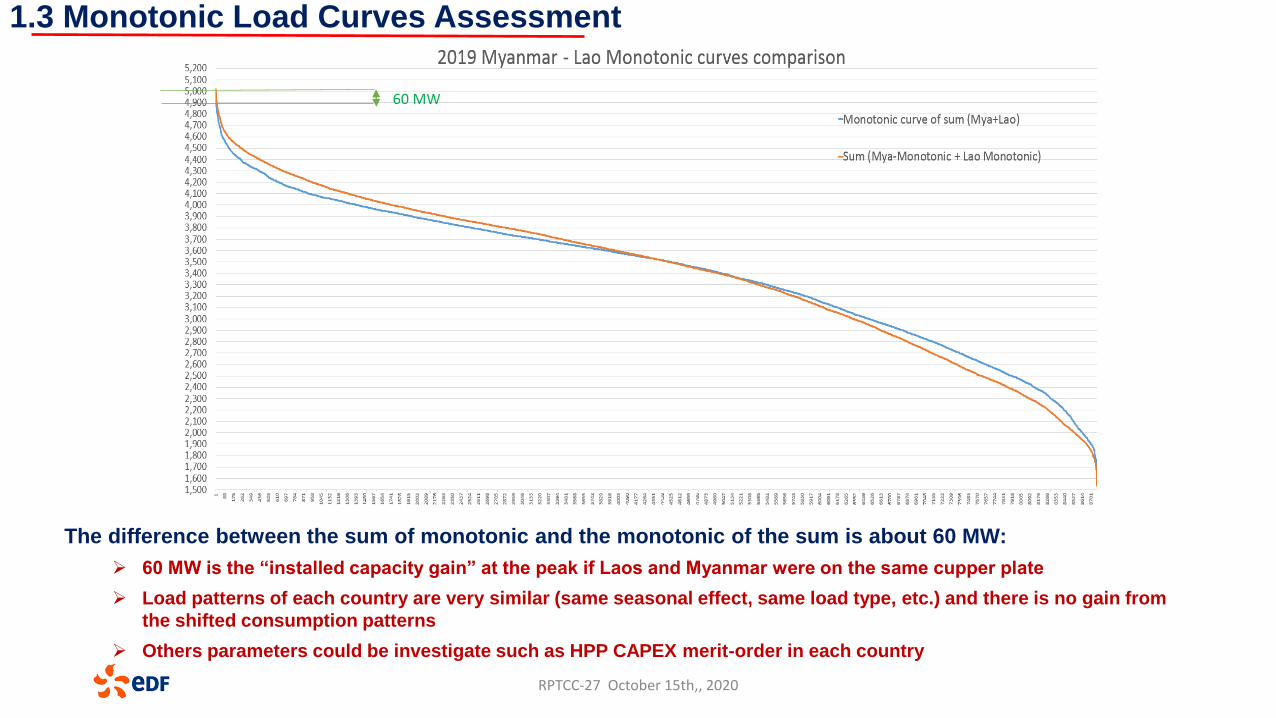
The difference between the sum of monotonic and the monotonic of the sum is about 60 MW:
60 MW is the “installed capacity gain” at the peak if Laos and Myanmar were on the same cupper plate
Load patterns of each country are very similar (same seasonal effect, same load type, etc.) and there is no gain from
the shifted consumption patterns
Others parameters could be investigate such as HPP CAPEX merit-order in each country
60 MW
1.3 Monotonic Load Curves Assessment
RPTCC-27 October 15th,, 2020
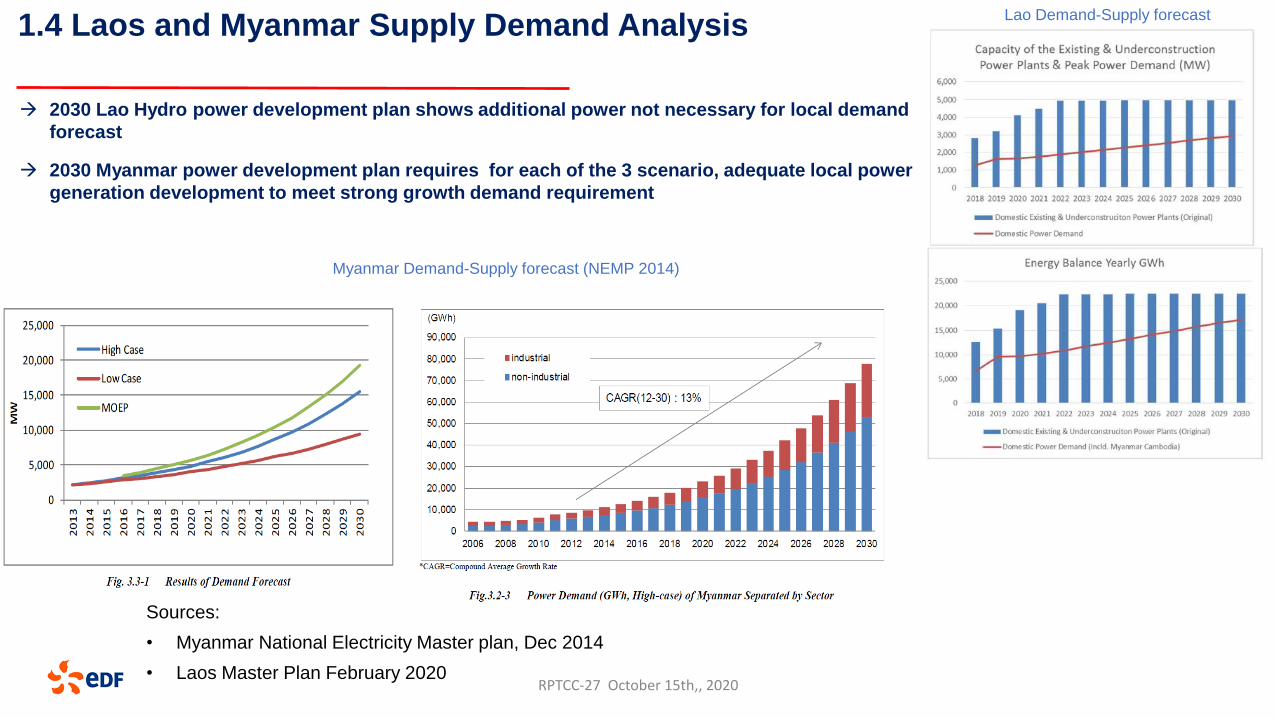
1.4 Laos and Myanmar Supply Demand Analysis
2030 Lao Hydro power development plan shows additional power not necessary for local demand
forecast
2030 Myanmar power development plan requires for each of the 3 scenario, adequate local power
generation development to meet strong growth demand requirement
Lao Demand-Supply forecast
Myanmar Demand-Supply forecast (NEMP 2014)
Sources:
• Myanmar National Electricity Master plan, Dec 2014
• Laos Master Plan February 2020RPTCC-27 October 15th,, 2020
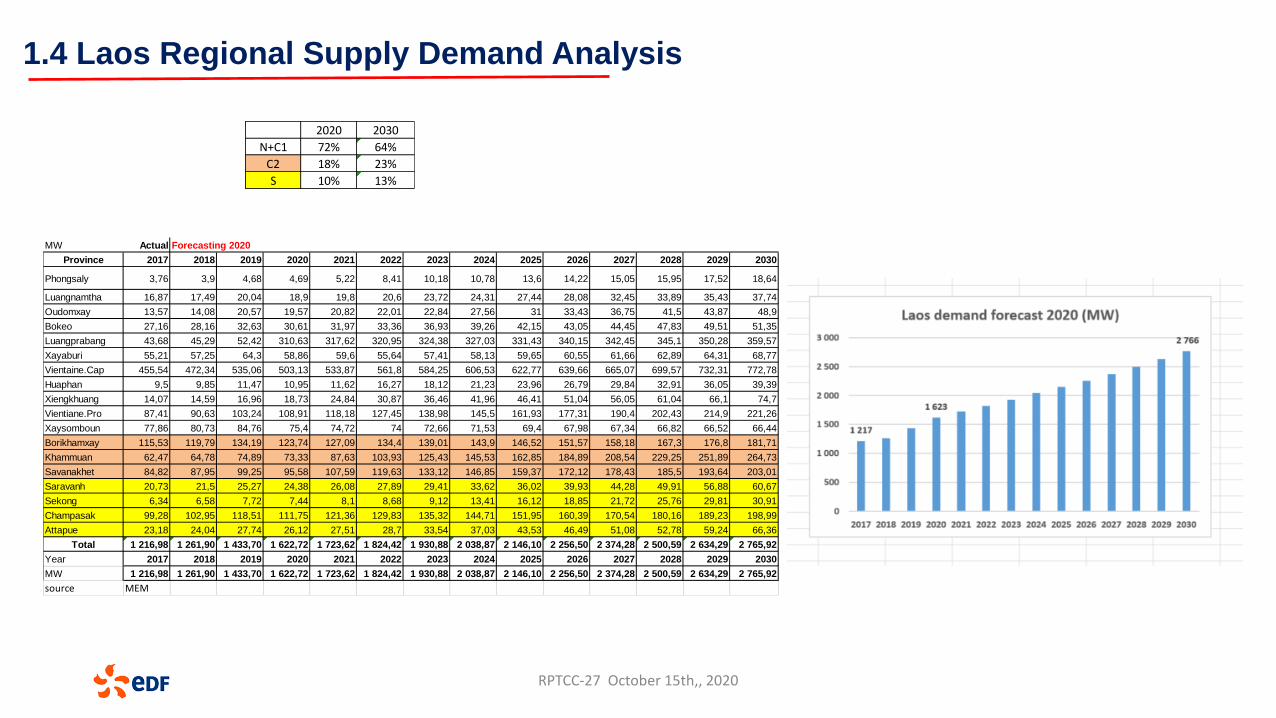
1.4 Laos Regional Supply Demand Analysis
MW Actual Forecasting 2020
Province 2017 2018 2019 2020 2021 2022 2023 2024 2025 2026 2027 2028 2029 2030
Phongsaly 3,76 3,9 4,68 4,69 5,22 8,41 10,18 10,78 13,6 14,22 15,05 15,95 17,52 18,64
Luangnamtha 16,87 17,49 20,04 18,9 19,8 20,6 23,72 24,31 27,44 28,08 32,45 33,89 35,43 37,74
Oudomxay 13,57 14,08 20,57 19,57 20,82 22,01 22,84 27,56 31 33,43 36,75 41,5 43,87 48,9
Bokeo 27,16 28,16 32,63 30,61 31,97 33,36 36,93 39,26 42,15 43,05 44,45 47,83 49,51 51,35
Luangprabang 43,68 45,29 52,42 310,63 317,62 320,95 324,38 327,03 331,43 340,15 342,45 345,1 350,28 359,57
Xayaburi 55,21 57,25 64,3 58,86 59,6 55,64 57,41 58,13 59,65 60,55 61,66 62,89 64,31 68,77
Vientaine.Cap 455,54 472,34 535,06 503,13 533,87 561,8 584,25 606,53 622,77 639,66 665,07 699,57 732,31 772,78
Huaphan 9,5 9,85 11,47 10,95 11,62 16,27 18,12 21,23 23,96 26,79 29,84 32,91 36,05 39,39
Xiengkhuang 14,07 14,59 16,96 18,73 24,84 30,87 36,46 41,96 46,41 51,04 56,05 61,04 66,1 74,7
Vientiane.Pro 87,41 90,63 103,24 108,91 118,18 127,45 138,98 145,5 161,93 177,31 190,4 202,43 214,9 221,26
Xaysomboun 77,86 80,73 84,76 75,4 74,72 74 72,66 71,53 69,4 67,98 67,34 66,82 66,52 66,44
Borikhamxay 115,53 119,79 134,19 123,74 127,09 134,4 139,01 143,9 146,52 151,57 158,18 167,3 176,8 181,71
Khammuan 62,47 64,78 74,89 73,33 87,63 103,93 125,43 145,53 162,85 184,89 208,54 229,25 251,89 264,73
Savanakhet 84,82 87,95 99,25 95,58 107,59 119,63 133,12 146,85 159,37 172,12 178,43 185,5 193,64 203,01
Saravanh 20,73 21,5 25,27 24,38 26,08 27,89 29,41 33,62 36,02 39,93 44,28 49,91 56,88 60,67
Sekong 6,34 6,58 7,72 7,44 8,1 8,68 9,12 13,41 16,12 18,85 21,72 25,76 29,81 30,91
Champasak 99,28 102,95 118,51 111,75 121,36 129,83 135,32 144,71 151,95 160,39 170,54 180,16 189,23 198,99
Attapue 23,18 24,04 27,74 26,12 27,51 28,7 33,54 37,03 43,53 46,49 51,08 52,78 59,24 66,36
Total 1 216,98 1 261,90 1 433,70 1 622,72 1 723,62 1 824,42 1 930,88 2 038,87 2 146,10 2 256,50 2 374,28 2 500,59 2 634,29 2 765,92
Year 2017 2018 2019 2020 2021 2022 2023 2024 2025 2026 2027 2028 2029 2030
MW 1 216,98 1 261,90 1 433,70 1 622,72 1 723,62 1 824,42 1 930,88 2 038,87 2 146,10 2 256,50 2 374,28 2 500,59 2 634,29 2 765,92
source MEM
2020 2030
N+C1 72% 64%
C2 18% 23%
S 10% 13%
RPTCC-27 October 15th,, 2020
| 15
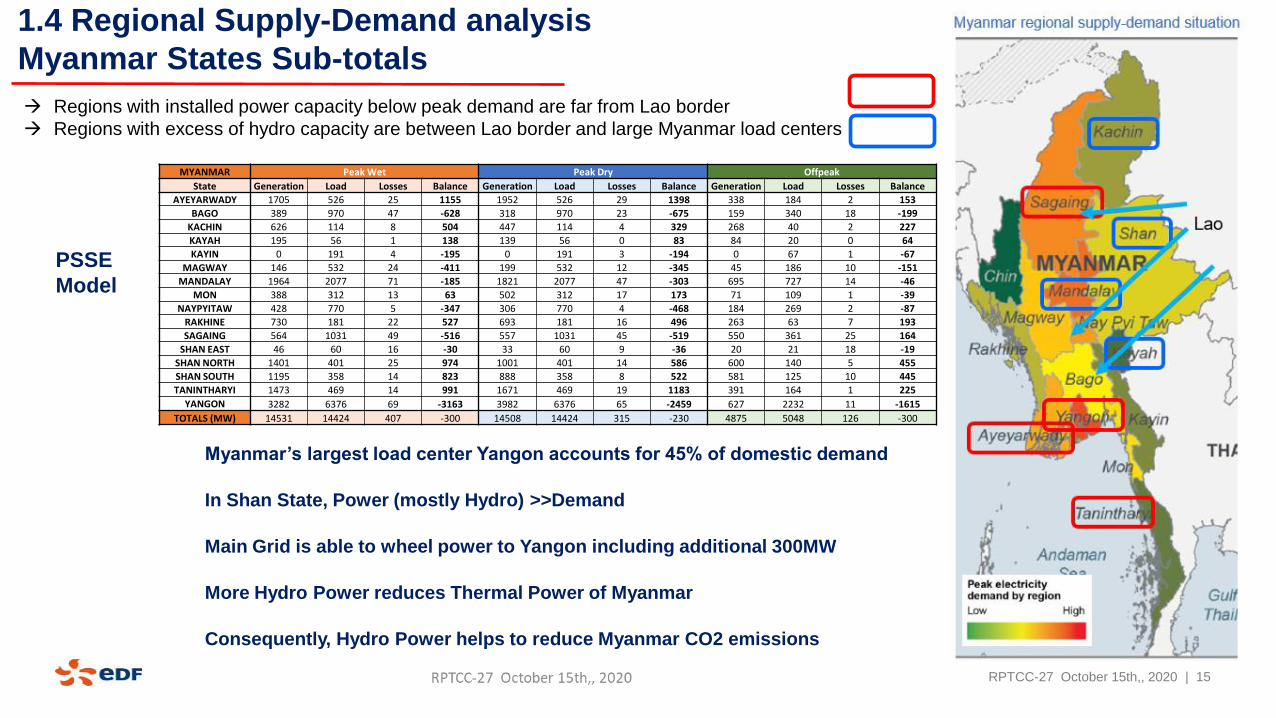
1.4 Regional Supply-Demand analysis
Myanmar States Sub-totals
RPTCC-27 October 15th,, 2020
Myanmar’s largest load center Yangon accounts for 45% of domestic demand
In Shan State, Power (mostly Hydro) >>Demand
Main Grid is able to wheel power to Yangon including additional 300MW
More Hydro Power reduces Thermal Power of Myanmar
Consequently, Hydro Power helps to reduce Myanmar CO2 emissions
MYANMAR Peak Wet Peak Dry Offpeak
State Generation Load Losses Balance Generation Load Losses Balance Generation Load Losses Balance
AYEYARWADY 1705 526 25 1155 1952 526 29 1398 338 184 2 153
BAGO 389 970 47 -628 318 970 23 -675 159 340 18 -199
KACHIN 626 114 8 504 447 114 4 329 268 40 2 227
KAYAH 195 56 1 138 139 56 0 83 84 20 0 64
KAYIN 0 191 4 -195 0 191 3 -194 0 67 1 -67
MAGWAY 146 532 24 -411 199 532 12 -345 45 186 10 -151
MANDALAY 1964 2077 71 -185 1821 2077 47 -303 695 727 14 -46
MON 388 312 13 63 502 312 17 173 71 109 1 -39
NAYPYITAW 428 770 5 -347 306 770 4 -468 184 269 2 -87
RAKHINE 730 181 22 527 693 181 16 496 263 63 7 193
SAGAING 564 1031 49 -516 557 1031 45 -519 550 361 25 164
SHAN EAST 46 60 16 -30 33 60 9 -36 20 21 18 -19
SHAN NORTH 1401 401 25 974 1001 401 14 586 600 140 5 455
SHAN SOUTH 1195 358 14 823 888 358 8 522 581 125 10 445
TANINTHARYI 1473 469 14 991 1671 469 19 1183 391 164 1 225
YANGON 3282 6376 69 -3163 3982 6376 65 -2459 627 2232 11 -1615
TOTALS (MW) 14531 14424 407 -300 14508 14424 315 -230 4875 5048 126 -300
Regions with installed power capacity below peak demand are far from Lao border
Regions with excess of hydro capacity are between Lao border and large Myanmar load centers
PSSE
Model
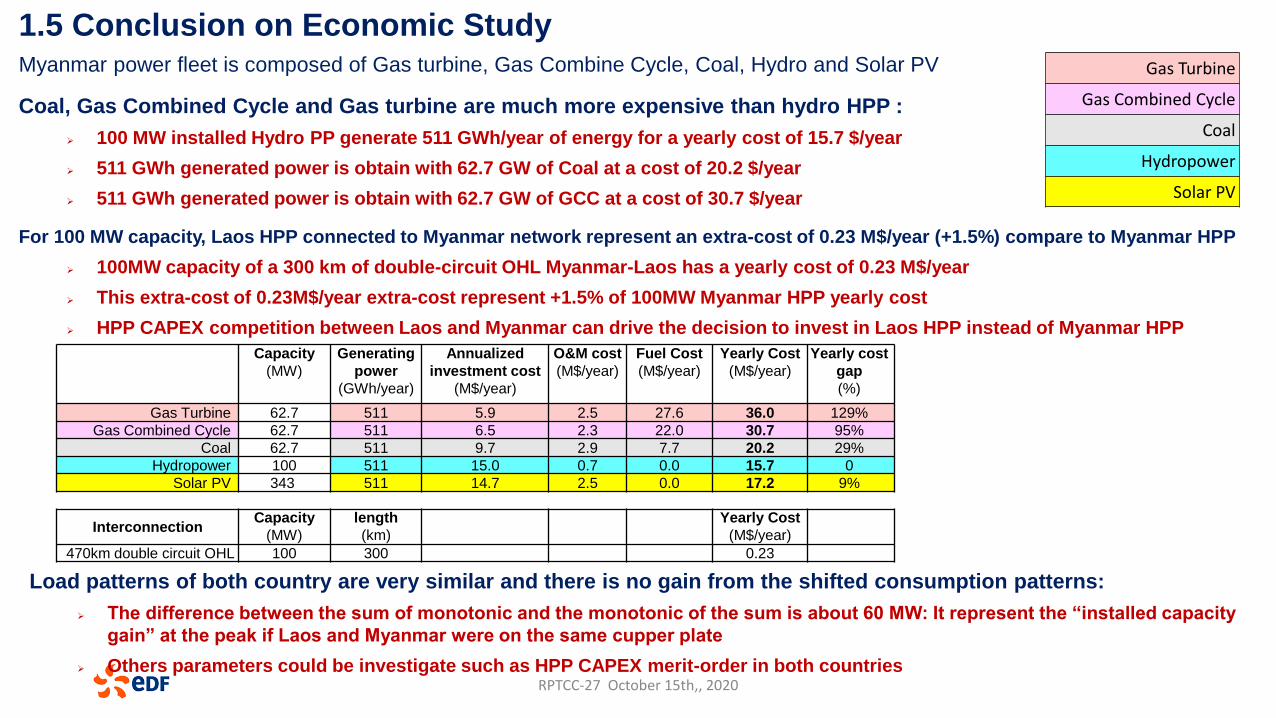
1.5 Conclusion on Economic Study Myanmar power fleet is composed of Gas turbine, Gas Combine Cycle, Coal, Hydro and Solar PV
Coal, Gas Combined Cycle and Gas turbine are much more expensive than hydro HPP :
100 MW installed Hydro PP generate 511 GWh/year of energy for a yearly cost of 15.7 $/year
511 GWh generated power is obtain with 62.7 GW of Coal at a cost of 20.2 $/year
511 GWh generated power is obtain with 62.7 GW of GCC at a cost of 30.7 $/year
For 100 MW capacity, Laos HPP connected to Myanmar network represent an extra-cost of 0.23 M$/year (+1.5%) compare to Myanmar HPP
100MW capacity of a 300 km of double-circuit OHL Myanmar-Laos has a yearly cost of 0.23 M$/year
This extra-cost of 0.23M$/year extra-cost represent +1.5% of 100MW Myanmar HPP yearly cost
HPP CAPEX competition between Laos and Myanmar can drive the decision to invest in Laos HPP instead of Myanmar HPP
Gas Turbine
Gas Combined Cycle
Coal
Hydropower
Solar PV
Capacity
(MW)
Generating
power
(GWh/year)
Annualized
investment cost
(M$/year)
O&M cost
(M$/year)
Fuel Cost
(M$/year)
Yearly Cost
(M$/year)
Yearly cost
gap
(%)
Gas Turbine 62.7 511 5.9 2.5 27.6 36.0 129%
Gas Combined Cycle 62.7 511 6.5 2.3 22.0 30.7 95%
Coal 62.7 511 9.7 2.9 7.7 20.2 29%
Hydropower 100 511 15.0 0.7 0.0 15.7 0
Solar PV 343 511 14.7 2.5 0.0 17.2 9%
InterconnectionCapacity
(MW)
length
(km)
Yearly Cost
(M$/year)
470km double circuit OHL 100 300 0.23
Load patterns of both country are very similar and there is no gain from the shifted consumption patterns:
The difference between the sum of monotonic and the monotonic of the sum is about 60 MW: It represent the “installed capacity
gain” at the peak if Laos and Myanmar were on the same cupper plate
Others parameters could be investigate such as HPP CAPEX merit-order in both countriesRPTCC-27 October 15th,, 2020
Part 2: System Study
RPTCC-27 October 15th,, 2020
| 18
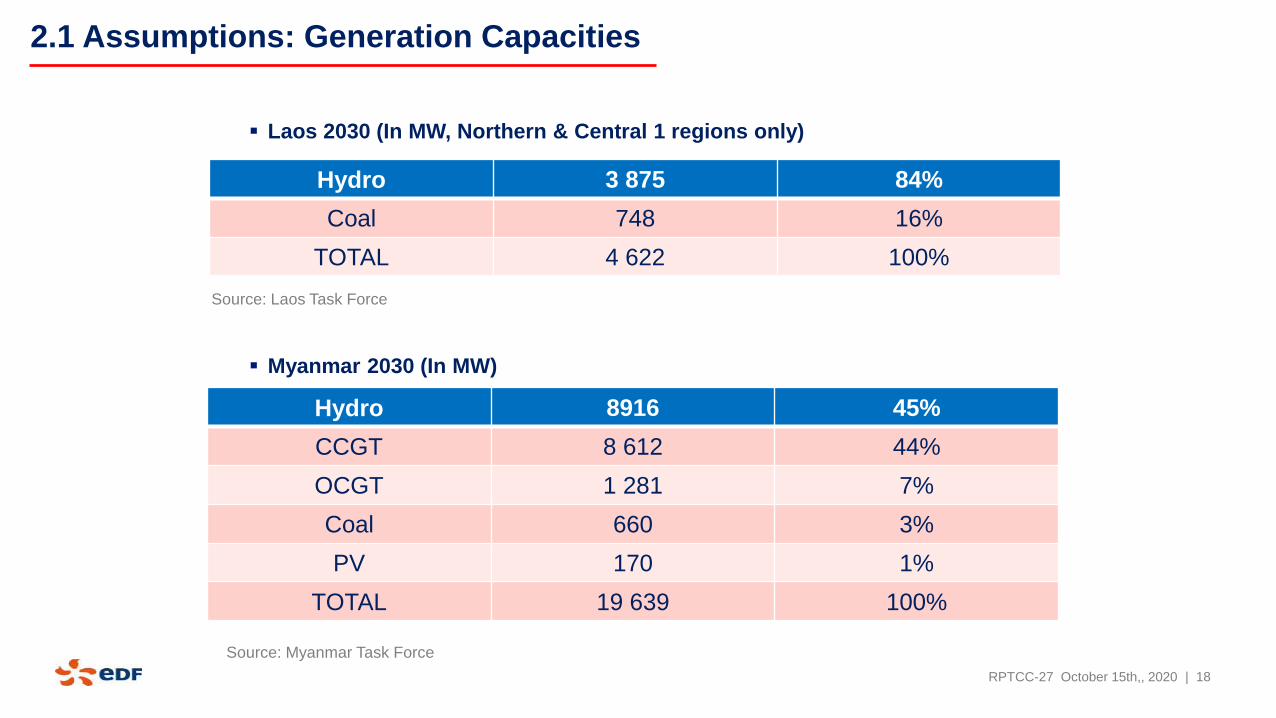
2.1 Assumptions: Generation Capacities
Laos 2030 (In MW, Northern & Central 1 regions only)
Myanmar 2030 (In MW)
Hydro 3 875 84%
Coal 748 16%
TOTAL 4 622 100%
Hydro 8916 45%
CCGT 8 612 44%
OCGT 1 281 7%
Coal 660 3%
PV 170 1%
TOTAL 19 639 100%
Source: Myanmar Task Force
Source: Laos Task Force
RPTCC-27 October 15th,, 2020
| 19
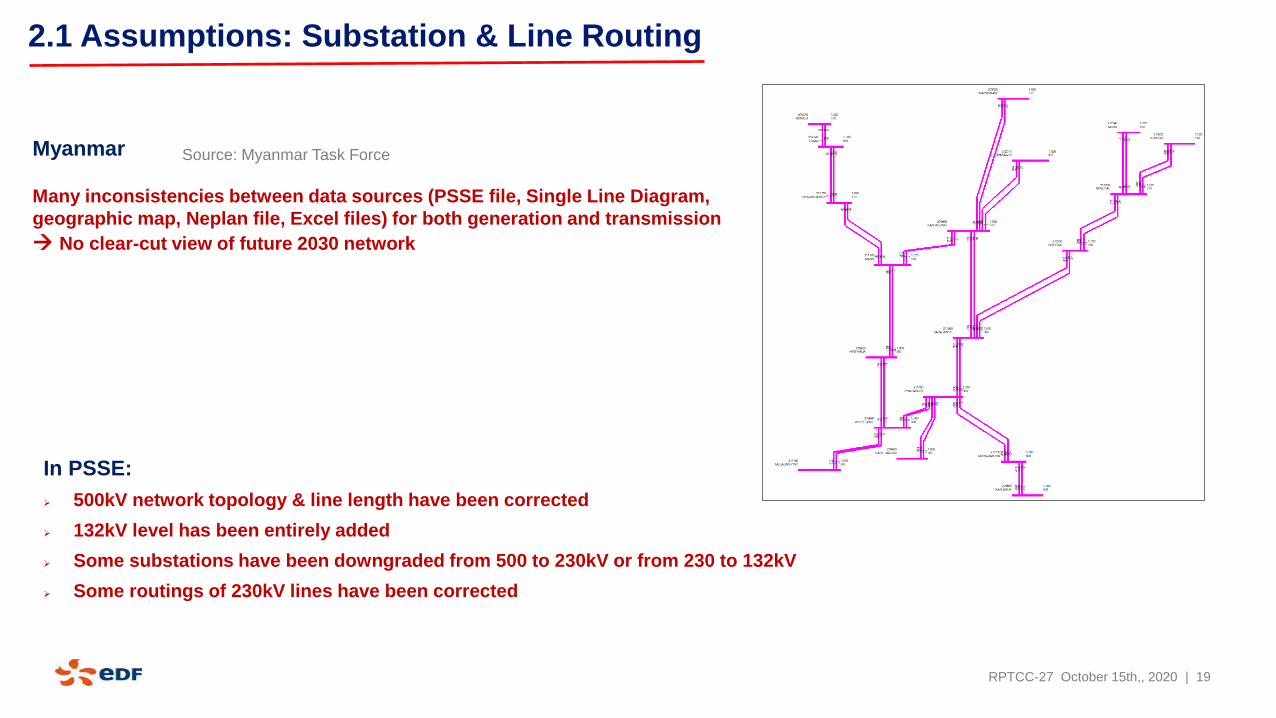
2.1 Assumptions: Substation & Line Routing
Myanmar
Many inconsistencies between data sources (PSSE file, Single Line Diagram,
geographic map, Neplan file, Excel files) for both generation and transmission
No clear-cut view of future 2030 network
In PSSE:
500kV network topology & line length have been corrected
132kV level has been entirely added
Some substations have been downgraded from 500 to 230kV or from 230 to 132kV
Some routings of 230kV lines have been corrected
Source: Myanmar Task Force
RPTCC-27 October 15th,, 2020
| 20
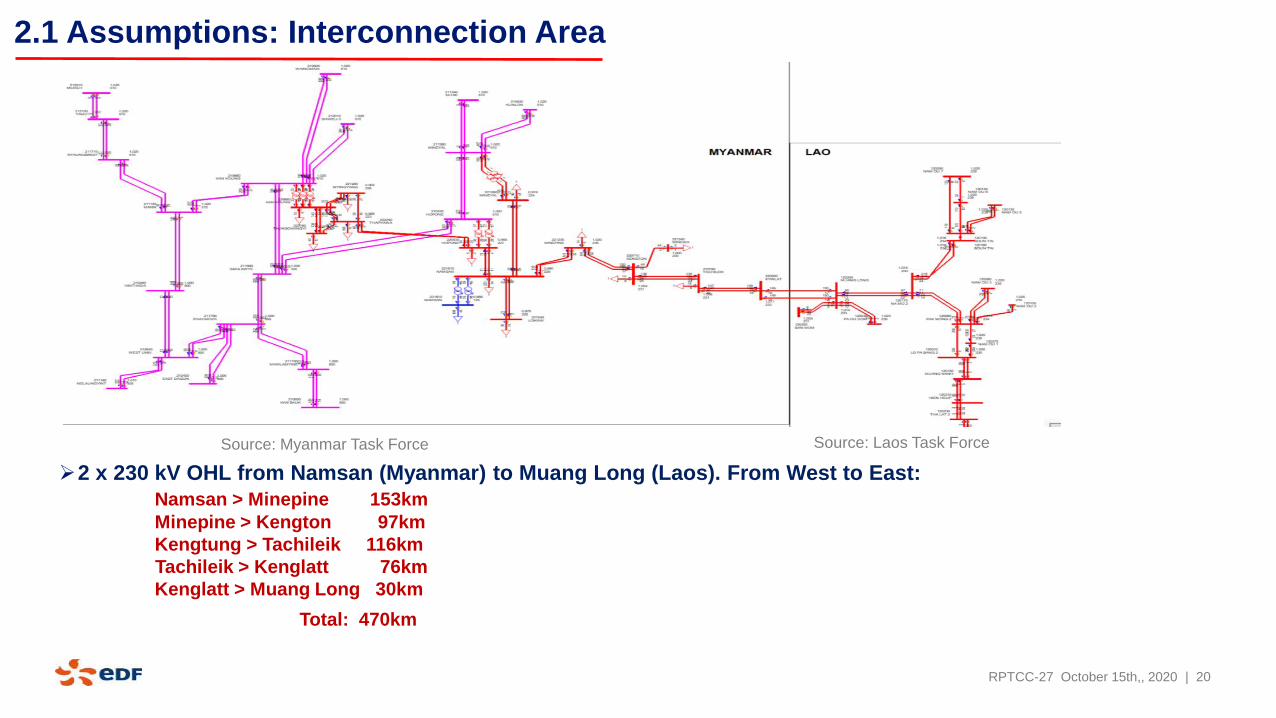
2.1 Assumptions: Interconnection Area
2 x 230 kV OHL from Namsan (Myanmar) to Muang Long (Laos). From West to East:
Namsan > Minepine 153km
Minepine > Kengton 97km
Kengtung > Tachileik 116km
Tachileik > Kenglatt 76km
Kenglatt > Muang Long 30km
Total: 470km
Source: Myanmar Task Force Source: Laos Task Force
RPTCC-27 October 15th,, 2020
| 21
2.1 Assumptions: Loads
For LAOS + MYANMAR
We assume a 35% off-peak load ratio based on current load patterns (Myanmar 2018 and 2019, Laos 2018 load curve)
For MYANMAR
Loads were all located on 230kV network We relocated some loads on 132kV network. Some substations still are heavily loaded
(>500MW in 230kV)
Initially in provided PSSE file all the loads had 0.95 power factor. We assume:
0.92 for domestic load
0.85 for industrial load
Source: Myanmar Task Force
Source: Laos Task Force
RPTCC-27 October 15th,, 2020
| 22
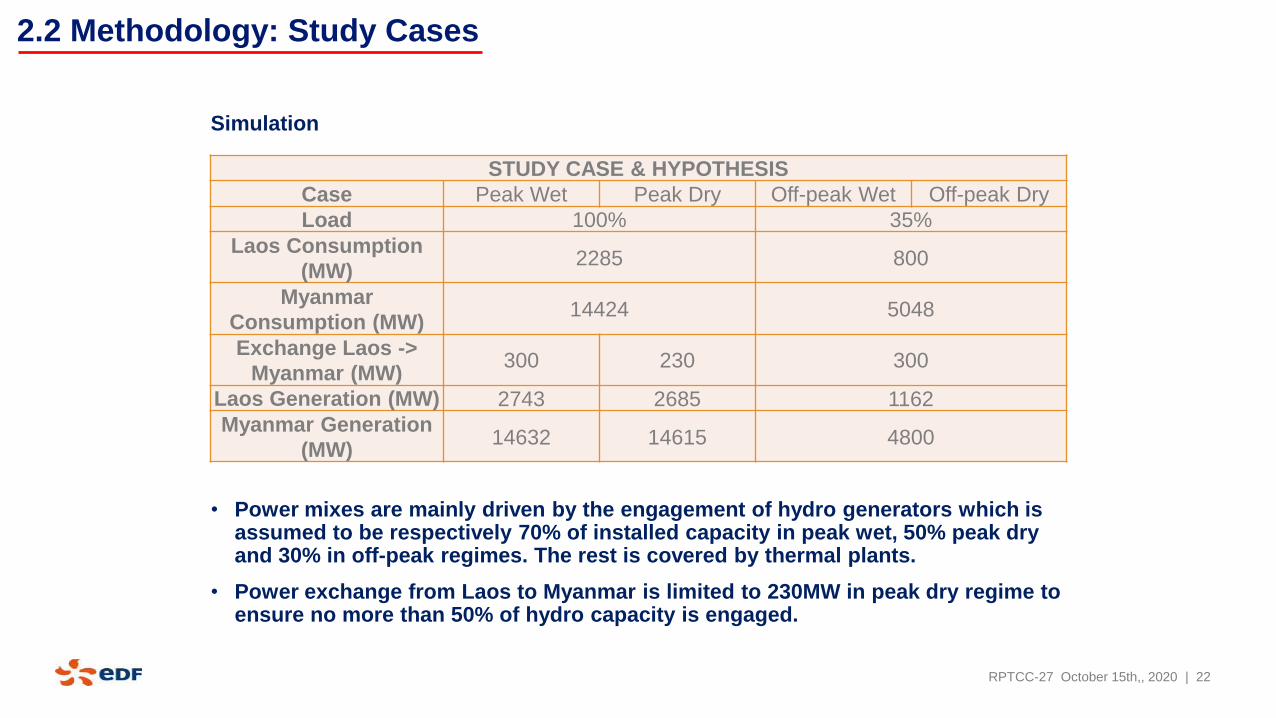
2.2 Methodology: Study Cases
STUDY CASE & HYPOTHESIS
Case Peak Wet Peak Dry Off-peak Wet Off-peak Dry
Load 100% 35%
Laos Consumption
(MW)2285 800
Myanmar
Consumption (MW)14424 5048
Exchange Laos ->
Myanmar (MW)300 230 300
Laos Generation (MW) 2743 2685 1162
Myanmar Generation
(MW)14632 14615 4800
Simulation
• Power mixes are mainly driven by the engagement of hydro generators which is assumed to be respectively 70% of installed capacity in peak wet, 50% peak dry and 30% in off-peak regimes. The rest is covered by thermal plants.
• Power exchange from Laos to Myanmar is limited to 230MW in peak dry regime to ensure no more than 50% of hydro capacity is engaged.
RPTCC-27 October 15th,, 2020
| 23
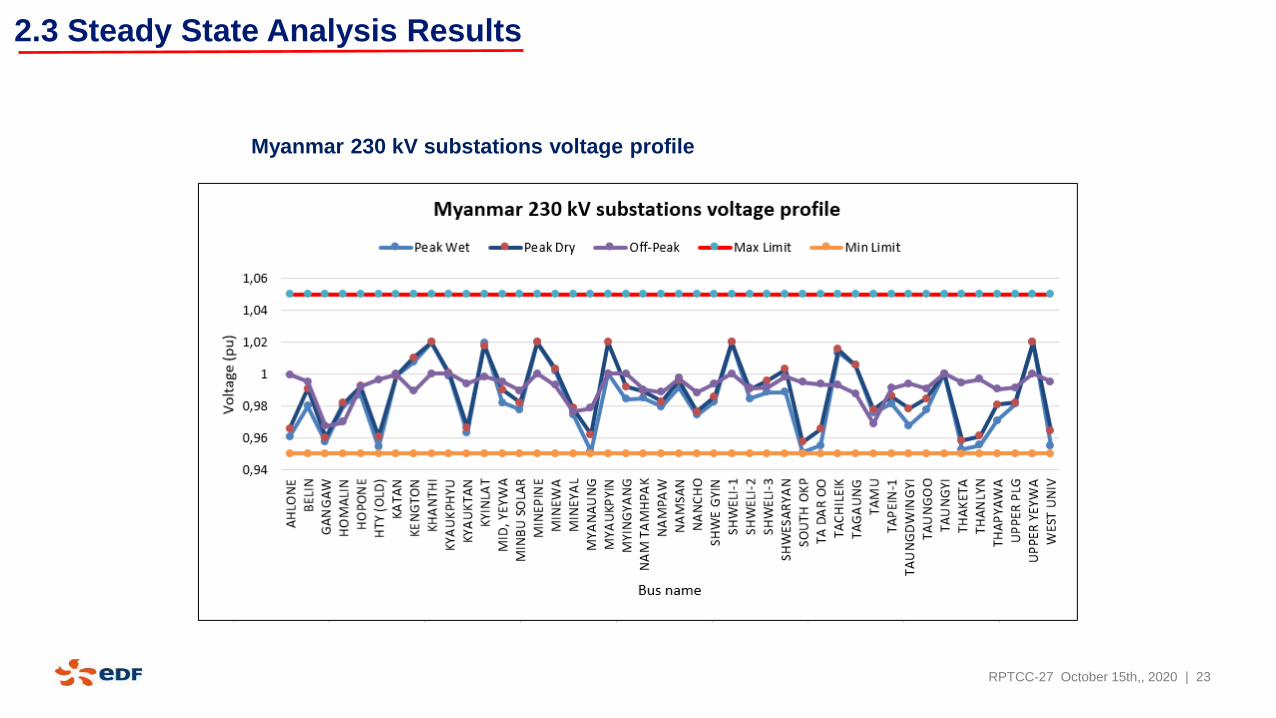
Myanmar 230 kV substations voltage profile
2.3 Steady State Analysis Results
RPTCC-27 October 15th,, 2020
| 24
• No voltage nor flow issues were encountered in N & N-1 situations in interconnection area
• The interconnection has no significant impact on the power systems of both countries
2.3 Steady State Analysis Results
RPTCC-27 October 15th,, 2020
| 25
2.3 Flow Assessment: Conclusions
• In Peak Wet and Off-Peak scenarios, Laos will be able to export 300 MW to Myanmar
• The interconnection has no impact on lines loading.
• As observed in Peak Wet, Peak Dry and Off-Peak scenarios, the loading on the double-circuit lines remains
below 50% (i.e no overload in N-1)
RPTCC-27 October 15th,, 2020
| 26
2.3 Short Circuit Analysis
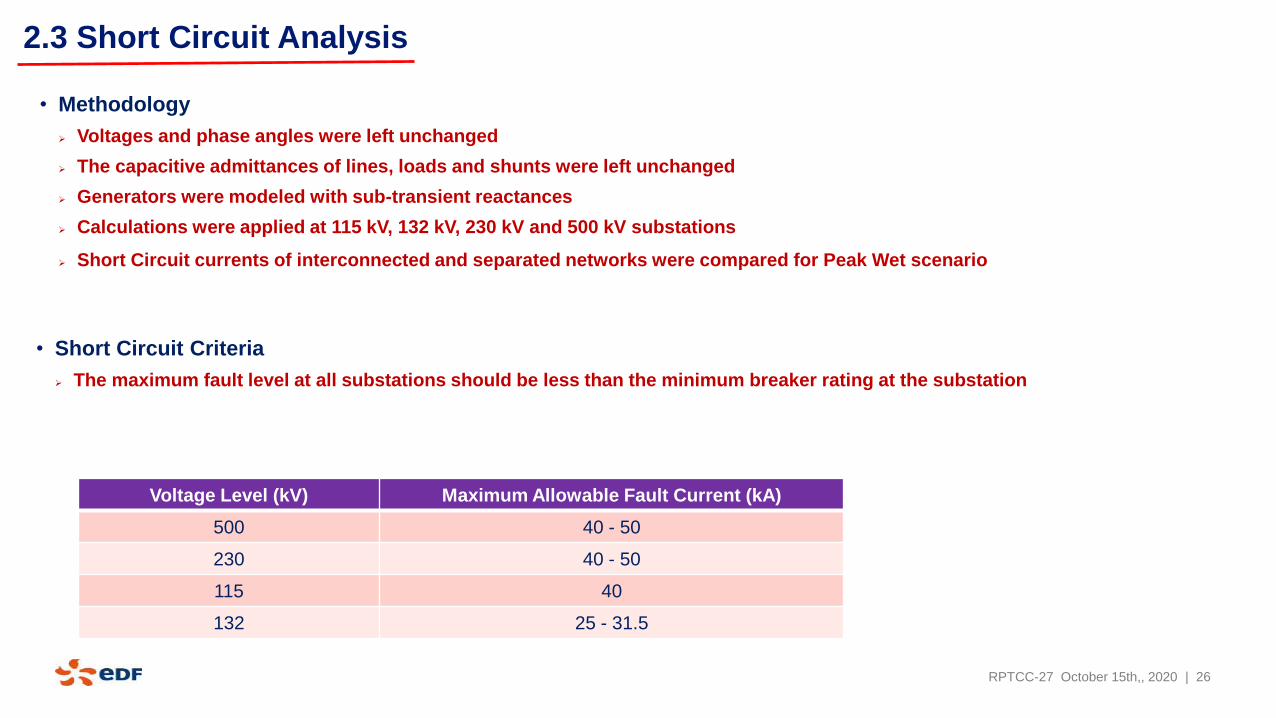
• Methodology
Voltages and phase angles were left unchanged
The capacitive admittances of lines, loads and shunts were left unchanged
Generators were modeled with sub-transient reactances
Calculations were applied at 115 kV, 132 kV, 230 kV and 500 kV substations
Short Circuit currents of interconnected and separated networks were compared for Peak Wet scenario
• Short Circuit Criteria
The maximum fault level at all substations should be less than the minimum breaker rating at the substation
Voltage Level (kV) Maximum Allowable Fault Current (kA)
500 40 - 50
230 40 - 50
115 40
132 25 - 31.5
RPTCC-27 October 15th,, 2020
| 27
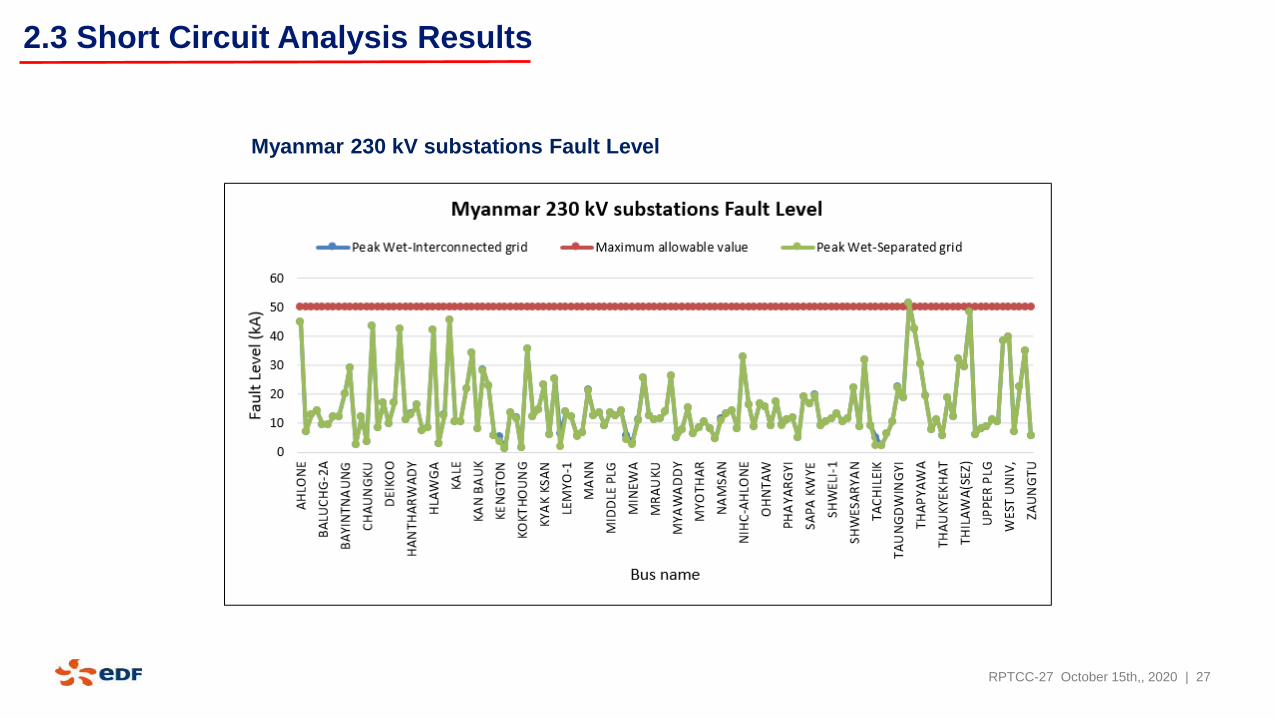
Myanmar 230 kV substations Fault Level
2.3 Short Circuit Analysis Results
RPTCC-27 October 15th,, 2020
| 28
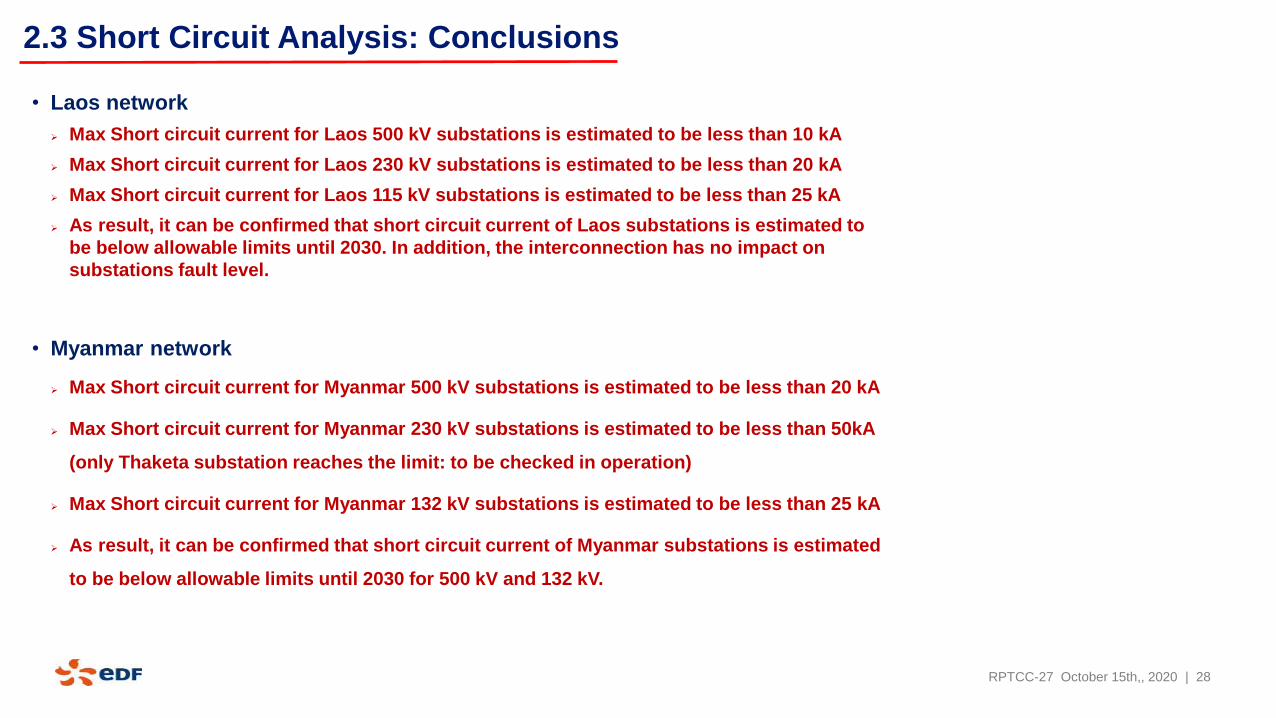
• Laos network
Max Short circuit current for Laos 500 kV substations is estimated to be less than 10 kA
Max Short circuit current for Laos 230 kV substations is estimated to be less than 20 kA
Max Short circuit current for Laos 115 kV substations is estimated to be less than 25 kA
As result, it can be confirmed that short circuit current of Laos substations is estimated to
be below allowable limits until 2030. In addition, the interconnection has no impact on
substations fault level.
• Myanmar network
Max Short circuit current for Myanmar 500 kV substations is estimated to be less than 20 kA
Max Short circuit current for Myanmar 230 kV substations is estimated to be less than 50kA
(only Thaketa substation reaches the limit: to be checked in operation)
Max Short circuit current for Myanmar 132 kV substations is estimated to be less than 25 kA
As result, it can be confirmed that short circuit current of Myanmar substations is estimated
to be below allowable limits until 2030 for 500 kV and 132 kV.
2.3 Short Circuit Analysis: Conclusions
RPTCC-27 October 15th,, 2020
| 29
• Static voltage compensation will be necessary at Mine Pinn Myanmar and Muang Long Laos
(around 25Mvar)
2.3 Voltage Management
RPTCC-27 October 15th,, 2020
| 30
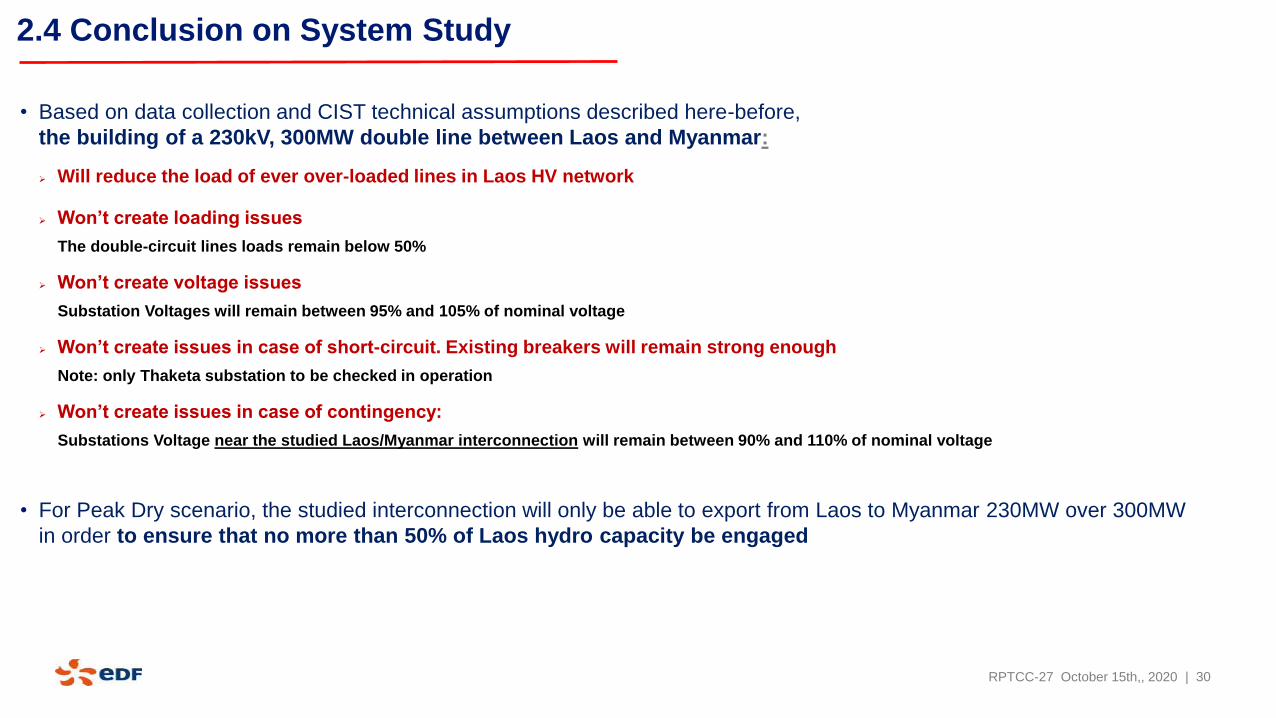
• Based on data collection and CIST technical assumptions described here-before,
the building of a 230kV, 300MW double line between Laos and Myanmar:
Will reduce the load of ever over-loaded lines in Laos HV network
Won’t create loading issues
The double-circuit lines loads remain below 50%
Won’t create voltage issues
Substation Voltages will remain between 95% and 105% of nominal voltage
Won’t create issues in case of short-circuit. Existing breakers will remain strong enough
Note: only Thaketa substation to be checked in operation
Won’t create issues in case of contingency:
Substations Voltage near the studied Laos/Myanmar interconnection will remain between 90% and 110% of nominal voltage
• For Peak Dry scenario, the studied interconnection will only be able to export from Laos to Myanmar 230MW over 300MW
in order to ensure that no more than 50% of Laos hydro capacity be engaged
2.4 Conclusion on System Study
RPTCC-27 October 15th,, 2020

| 31
Main similarities regarding Laos and Myanmar Systems: Generation costs, load patterns, regions weakly interconnected
Main differences regarding Laos and Myanmar Systems: Laos demand Myanmar demand
Laos exportation capacities in the North are able to help Myanmar power needs in short/medium terms
No major issue for interconnecting Laos and Myanmar from Grid capacity perspective: 300MW is feasible
The cost of interconnection assets will slightly affect Laos importation in Myanmar that will remain cost-effective
System-to-System operation seems possible but should be proven with specific dynamic studies.
These studies are not possible with the current data collection.
Without clear conclusion, a B2B in Tachileik or Muang Long should be envisaged.
3. Conclusion on Milestone 2
RPTCC-27 October 15th,, 2020

| 32
Thank you for your attention
RPTCC-27 October 15th,, 2020
Copyright © 2022 FDOKUMEN