
Groundwater numerical modelling for the Namoi subregion
157
A scientific collaboration between the Department of the Environment and Energy, Bureau of Meteorology, CSIRO and Geoscience Australia 2 Groundwater numerical modelling for the Namoi subregion Product 2.6.2 for the Namoi subregion from the Northern Inland Catchments Bioregional Assessment 2018
-
Upload
khangminh22 -
Category
Documents
-
view
2 -
download
0
Transcript of Groundwater numerical modelling for the Namoi subregion

A scientific collaboration between the Department of the Environment and Energy, Bureau of Meteorology, CSIRO and Geoscience Australia
2 Groundwater numerical modelling for the Namoi subregion Product 2.6.2 for the Namoi subregion from the Northern Inland Catchments Bioregional Assessment
2018

v20180619
The Bioregional Assessment Programme The Bioregional Assessment Programme is a transparent and accessible programme of baseline assessments that increase the available science for decision making associated with coal seam gas and large coal mines. A bioregional assessment is a scientific analysis of the ecology, hydrology, geology and hydrogeology of a bioregion with explicit assessment of the potential impacts of coal seam gas and large coal mining development on water resources. This Programme draws on the best available scientific information and knowledge from many sources, including government, industry and regional communities, to produce bioregional assessments that are independent, scientifically robust, and relevant and meaningful at a regional scale.
The Programme is funded by the Australian Government Department of the Environment and Energy. The Department of the Environment and Energy, Bureau of Meteorology, CSIRO and Geoscience Australia are collaborating to undertake bioregional assessments. For more information, visit http://www.bioregionalassessments.gov.au.
Department of the Environment and Energy The Australian Government Department of the Environment and Energy is strengthening the regulation of coal seam gas and large coal mining development by ensuring that future decisions are informed by substantially improved science and independent expert advice about the potential water-related impacts of those developments. For more information, visit https://www.environment.gov.au/water/coal-and-coal-seam-gas/office-of-water-science.
Bureau of Meteorology The Bureau of Meteorology is Australia’s national weather, climate and water agency. Under the Water Act 2007, the Bureau is responsible for compiling and disseminating Australia's water information. The Bureau is committed to increasing access to water information to support informed decision making about the management of water resources. For more information, visit http://www.bom.gov.au/water/.
CSIRO Australia is founding its future on science and innovation. Its national science agency, CSIRO, is a powerhouse of ideas, technologies and skills for building prosperity, growth, health and sustainability. It serves governments, industries, business and communities across the nation. For more information, visit http://www.csiro.au.
Geoscience Australia Geoscience Australia is Australia’s national geoscience agency and exists to apply geoscience to Australia’s most important challenges. Geoscience Australia provides geoscientific advice and information to the Australian Government to support current priorities. These include contributing to responsible resource development; cleaner and low emission energy technologies; community safety; and improving marine planning and protection. The outcome of Geoscience Australia’s work is an enhanced potential for the Australian community to obtain economic, social and environmental benefits through the application of first class research and information. For more information, visit http://www.ga.gov.au.
ISBN-PDF 978-1-925315-65-3
Citation Janardhanan S, Crosbie R, Pickett T, Cui T, Peeters L, Slatter E, Northey J, Merrin LE, Davies P, Miotlinski K, Schmid W and Herr A (2018) Groundwater numerical modelling for the Namoi subregion. Product 2.6.2 for the Namoi subregion from the Northern Inland Catchments Bioregional Assessment. Department of the Environment and Energy, Bureau of Meteorology, CSIRO and Geoscience Australia, Australia. http://data.bioregionalassessments.gov.au/product/NIC/NAM/2.6.2.
Authorship is listed in relative order of contribution.
Copyright
© Commonwealth of Australia 2018 With the exception of the Commonwealth Coat of Arms and where otherwise noted, all material in this publication is provided under a Creative Commons Attribution 3.0 Australia Licence http://www.creativecommons.org/licenses/by/3.0/au/deed.en. The Bioregional Assessment Programme requests attribution as ‘© Commonwealth of Australia (Bioregional Assessment Programme http://www.bioregionalassessments.gov.au)’.
Disclaimer The information contained in this report is based on the best available information at the time of publication. The reader is advised that such information may be incomplete or unable to be used in any specific situation. Therefore decisions should not be made based solely on this information or without seeking prior expert professional, scientific and technical advice. The Bioregional Assessment Programme is committed to providing web accessible content wherever possible. If you are having difficulties with accessing this document please contact [email protected].
Cover photograph Gulligal Lagoon, which is located about halfway between Gunnedah and Boggabri on the western side of the Namoi River, NSW, 2005
Credit: Neal Foster

Groundwater numerical modelling for the Namoi subregion | i
Executive summary Coal resource development can potentially affect water-dependent assets through changes in groundwater hydrology. The bioregional assessment (BA) groundwater numerical modelling provides probabilities of groundwater drawdown and changes in the surface water – groundwater flux due to coal resource development in the Namoi subregion.
This product describes the model development and presents the modelled hydrological changes due to coal resource development in the Namoi subregion. Results are reported for the difference in model outputs between the two potential futures considered in a BA:
• baseline coal resource development (baseline): a future that includes all coal mines and coal seam gas (CSG) fields that are commercially producing as of December 2012
• coal resource development pathway (CRDP): a future that includes all coal mines and CSG fields that are in the baseline as well as those that are expected to begin commercial production after December 2012.
The difference in model outputs between CRDP and baseline is due to additional coal resource development – all coal mines and CSG fields, including expansions of baseline operations, that are expected to begin commercial production after December 2012.
Baseline coal mines and additional coal resource development were defined in Section 2.3.4 of companion product 2.3 (conceptual modelling) for the Namoi subregion. The baseline includes six coal mines: five open-cut coal mines: Boggabri Coal Mine, Rocglen Mine, Sunnyside Mine, Tarrawonga Mine and Werris Creek Mine; and one underground longwall mine: Narrabri North. The ten additional coal resource developments include nine coal mines and one CSG development: Boggabri Coal Expansion Project, Caroona Coal Project, Gunnedah Precinct, Maules Creek Mine, Narrabri South, Tarrawonga Coal Expansion Project, Vickery Coal Project, Vickery South Coal Project, Watermark Coal Project and Narrabri Gas Project. Due to insufficient information regarding the location and depth of mining, two of the additional coal resource developments, Vickery South Coal Project (open-cut coal mine) and the Gunnedah Precinct (open-cut and underground) are not being modelled. Of the baseline coal mines, Werris Creek Mine is not modelled because it belongs to a geologically separate basin (Werrie Basin). Analysis of the potential impacts and risks of these developments will be restricted to commentary in product 3-4 (impact and risk analysis).
BHP discontinued the development of the Caroona Coal Mine in August 2016. The NSW Government bought back BHP’s Caroona coal exploration licences on the Liverpool Plains in August 2016. This occurred after the finalisation and modelling of the CRDP, thus the Caroona Coal Mine was included in the modelling even though it is no longer proceeding. Similarly, there have been changes to the mining licence for the Watermark Coal Project. Nevertheless, for reasons outlined in the companion submethodology M04, this development forms part of the CRDP.
There have been many groundwater models developed in the Namoi subregion. A review identified two models of sufficient scale and complexity; however, neither model was able to be re-purposed for use in BA. The Namoi Catchment Water Study model did not have the stability required for the uncertainty analysis due to problems with numerical convergence, and the

ii | Groundwater numerical modelling for the Namoi subregion
Gunnedah Basin Regional Model had limitations with the conceptualisation of the alluvium and Great Artesian Basin (GAB) layers. For BA purposes, the MODFLOW-USG regional-scale numerical groundwater model was built to evaluate hydrological changes due to additional coal resource development in the Namoi subregion.
The groundwater model consists of up to nine hydrostratigraphic layers with the alluvium, Pilliga Sandstone, Hoskissons Coal and Maules Creek Formation explicitly included, and with other formations combined into interburden layers. These interburden layers comprise mostly aquitard formations and occasional aquifer formations that are not largely used for beneficial water use. The modelling domain spans an area of about 59,000 km2 with depths exceeding 1500 m. It is represented by a variable Voronoi mesh with a resolution of 300 m around coal resource developments and streams and increasing to 3000 m in areas remote from the coal resource developments and streams.
Of the 81 parameters in the model, a subset of 37 is allowed to vary stochastically to form the basis for the sensitivity and uncertainty analyses. The observed groundwater levels in the surficial aquifers and surface water – groundwater flux are most sensitive to depth of incision of the streambed, the scaler on diffuse recharge and the hydraulic properties of the alluvium. The main prediction, drawdown due to additional coal resource development, is sensitive to the hydraulic properties of the interburden and the hydraulic properties of the coal-bearing formations. As the groundwater level and streamflow observations are not sensitive to these parameters, these parameters will not be constrained greatly in the uncertainty analysis.
The groundwater numerical modelling allows drawdown due to additional coal resource development to be predicted. In BAs, a conservative 0.2 m drawdown threshold is chosen as it aligns with NSW regulatory thresholds for the protection of springs, and is close to the practical resolution limits of modelled and measured drawdown, within the bounds of seasonal and climatic variability. A zone of potential hydrological change is identified as the area of the regional watertable aquifer where there is a greater than 5% chance that drawdown due to additional coal resource development exceeds 0.2 m. For the majority of the model domain in the Namoi subregion, the median drawdown due to additional coal resource development is less than 0.2 m. The probability of exceeding this threshold is 100% within the immediate vicinity of a mine footprint area and decreases rapidly with increasing distance from a development. This zone of potential hydrological change is generally within 10 km of the boundary of the footprint of the additional coal resource developments. This also means that the zone of potential hydrological change of two developments only overlaps when they are within 20 km of each other. In most cases the drawdown is attenuated at the alluvium boundary due to the high transmissivity and so the largest magnitude drawdowns occur in the consolidated rock rather than the alluvium.
The probability of drawdown exceeding 2 m in the alluvium is very small and very restricted in area. Within 5 km of the mine footprint of the larger mines, there is a 5% probability of exceeding 2 m drawdown due to additional coal resource development, however, this does not propagate more than 2 km from the alluvium boundary.
In the Pilliga forest area, the probability of exceeding 2 m drawdown due to additional coal resource development is limited to the area close to Narrabri South. The probability of exceeding

Groundwater numerical modelling for the Namoi subregion | iii
0.2 m drawdown due to additional coal resource development has a wider spatial extent and is up to 10 km from the planned CSG developments.
An important outcome from BA is identifying the main sources of uncertainty and the opportunities for improving regional-scale groundwater modelling in the Namoi subregion. The qualitative uncertainty analysis highlighted that the implementation of the CRDP has the highest potential to impact on the predictions, particularly in situations where the CRDP becomes out of date if identified coal resource developments do not proceed or new coal resource developments are proposed. Other factors that may have potential impacts on the model predictions include choice of model parameterisation and resolution of the model grid. This regional model is suitable only for quantifying cumulative drawdown impacts on a regional scale. Local models developed using detailed representation of the local geology are more appropriate for making drawdown predictions around individual mines.
Opportunities to improve the groundwater model can be directed to better constraining the assumptions that have the most influence on model results. The Namoi subregion groundwater model is a stochastic regional-scale model: it has a large modelling domain and a relatively coarse model resolution. While it does not provide the level of lithological and hydrogeological information that is represented in local-scale groundwater models built for small areas within the Namoi subregion, it enables a probabilistic assessment of the model results. This provides precisions for model outputs, which makes it highly suitable for a risk analysis.
The results of groundwater numerical modelling for the Namoi subregion inform product 3-4 (impact and risk analysis). Estimates of the probability of hydrological changes due to coal resource development will be used to assess direct and indirect impacts on ecological, economic and sociocultural water-dependent assets, where ecological assets are grouped into landscape classes and incorporate ecosystems such as groundwater-dependent ecosystems.

iv | Groundwater numerical modelling for the Namoi subregion

Groundwater numerical modelling for the Namoi subregion | v
Contents
Executive summary ....................................................................................................................... i
Contributors to the Technical Programme .................................................................................. xii
Acknowledgements ................................................................................................................... xiv
Currency of scientific results ....................................................................................................... xv
Introduction ................................................................................................................................. 1
The Bioregional Assessment Programme ................................................................................... 1
Methodologies ............................................................................................................................ 3
Technical products ...................................................................................................................... 5
About this technical product ...................................................................................................... 8
References .................................................................................................................................. 8
2.6.2.1 Methods ................................................................................................................... 10
2.6.2.1.1 Background and context ............................................................................................ 10
2.6.2.1.2 Groundwater numerical modelling ........................................................................... 13
References ................................................................................................................................ 21
Datasets ................................................................................................................................... 23
2.6.2.2 Review of existing models ......................................................................................... 25
2.6.2.2.1 Namoi Catchment Water Study (NCWS) model ........................................................ 27
2.6.2.2.2 Gunnedah Basin Regional Model (GBRM) ................................................................. 28
2.6.2.2.3 Rationale for building new model ............................................................................. 28
References ................................................................................................................................ 30
Datasets ................................................................................................................................... 31
2.6.2.3 Model development ................................................................................................. 33
2.6.2.3.1 Objectives .................................................................................................................. 33
2.6.2.3.2 Hydrogeological conceptual model ........................................................................... 34
2.6.2.3.3 Design and implementation ...................................................................................... 36
2.6.2.3.4 Model code and solver .............................................................................................. 40
References ................................................................................................................................ 41
Datasets ................................................................................................................................... 42
2.6.2.4 Boundary and initial conditions ................................................................................ 43
2.6.2.4.1 Lateral ........................................................................................................................ 43
2.6.2.4.2 Land surface fluxes .................................................................................................... 45
2.6.2.4.3 Surface water – groundwater interactions ............................................................... 48

vi | Groundwater numerical modelling for the Namoi subregion
2.6.2.4.4 Bore extraction .......................................................................................................... 51
2.6.2.4.5 Initial conditions ........................................................................................................ 54
References ................................................................................................................................ 54
Datasets ................................................................................................................................... 56
2.6.2.5 Implementation of the coal resource development pathway .................................... 57
2.6.2.5.5 Spatial extent ............................................................................................................. 59
2.6.2.5.6 Mine and coal seam gas groundwater extractions as drain boundary condition ..... 60
2.6.2.5.7 Temporal extent ........................................................................................................ 60
2.6.2.5.8 Hydraulic conductivity enhancement ....................................................................... 62
2.6.2.5.9 Simulations ................................................................................................................ 64
References ................................................................................................................................ 64
Datasets ................................................................................................................................... 65
2.6.2.6 Parameterisation ...................................................................................................... 67
2.6.2.6.1 Hydraulic properties .................................................................................................. 67
2.6.2.6.2 Summary of parameters in the groundwater model ................................................ 69
References ................................................................................................................................ 74
Datasets ................................................................................................................................... 74
2.6.2.7 Observations and predictions ................................................................................... 75
2.6.2.7.1 Observations .............................................................................................................. 75
2.6.2.7.2 Predictions ................................................................................................................. 81
2.6.2.7.3 Design of experiment and sensitivity analysis .......................................................... 83
References ................................................................................................................................ 93
Datasets ................................................................................................................................... 95
2.6.2.8 Uncertainty analysis .................................................................................................. 97
2.6.2.8.1 Factors included in formal uncertainty analysis ........................................................ 97
2.6.2.8.2 Factors not included in formal uncertainty analysis ............................................... 112
References .............................................................................................................................. 123
Datasets ................................................................................................................................. 125
2.6.2.9 Limitations .............................................................................................................. 127
2.6.2.9.1 Data gaps and opportunities to reduce predictive uncertainty .............................. 127
2.6.2.9.2 Limitations ............................................................................................................... 128
2.6.2.9.3 Conclusions .............................................................................................................. 129
References .............................................................................................................................. 130
Glossary ................................................................................................................................... 132

Groundwater numerical modelling for the Namoi subregion | vii
Figures
Figure 1 Schematic diagram of the bioregional assessment methodology ......................................... 2
Figure 2 Technical products and submethodologies associated with each component of a bioregional assessment ........................................................................................................................ 6
Figure 3 Model nodes for the Namoi groundwater model ............................................................... 15
Figure 4 Model sequence for the Namoi subregion .......................................................................... 17
Figure 5 Uncertainty analysis workflow ............................................................................................. 19
Figure 6 Location of regional-scale groundwater models in the Namoi subregion .......................... 27
Figure 7 Drawdown calculated by the Namoi Catchment Water Study (NCWS) model (SWS, 2012) and the Gunnedah Basin Regional Model (GBRM) .................................................................. 29
Figure 8 (a) Namoi subregion model grid and (b) detail around Watermark and Caroona coal mines with rivers shown .................................................................................................................... 38
Figure 9 Plan view of the surface layer of the numerical model grid of the bioregional assessment Namoi groundwater model ............................................................................................ 39
Figure 10 Cross-section through the model domain showing the hydrostratigraphic layers used in the model ....................................................................................................................................... 40
Figure 11 Lateral boundaries of the groundwater model for the Namoi subregion ......................... 45
Figure 12 Location of the floodplain (blue) where flood recharge is added and the areas under irrigation (green) where irrigation recharge is added to the model for the Namoi subregion ......... 47
Figure 13 Vegetation height used as a determinant in the extinction depth of evapotranspiration from groundwater in the Namoi subregion ....................................................... 48
Figure 14 The river network as implemented in the groundwater model in the Namoi subregion . 49
Figure 15 Extraction bores that have their pumping included in the groundwater model for the Namoi subregion ................................................................................................................................ 51
Figure 16 Location of developments listed in the coal resource development pathway that have been modelled ................................................................................................................................... 59
Figure 17 Detail of model grid showing refinement around the location of mines, coal seam gas (CSG) wells and streams ..................................................................................................................... 61
Figure 18 Assumed relationship between the conductivity-change parameter, ∆, and the height above the mining seam, h .................................................................................................................. 63

viii | Groundwater numerical modelling for the Namoi subregion
Figure 19 Parameter space explored in the numerical modelling for the hydraulic conductivity and specific storage for the interburden and coal layers (from Figure 21 in companion product 2.1-2.2 for the Namoi subregion (Aryal et al., 2018)) ........................................................................ 69
Figure 20 Location of 134 monitoring bores used to constrain model parameters.......................... 77
Figure 21 Example of groundwater model output time series for one model node ........................ 81
Figure 22 The 5th, 50th and 95th percentiles of the change in surface water – groundwater (SW-GW) flux predicted for each reach in the river model domain for the minimum and maximum change in a time step over the period 2013–2102 ........................................................... 83
Figure 23 Scatter plots of the simulated equivalents to the average groundwater level at observation bore GW030226.1.1 for the year 2012 and 16 of the 37 parameters varied in the model ................................................................................................................................................. 86
Figure 24 Boxplots of sensitivity indices for (a) all available groundwater level simulated equivalents to observations, (b) simulated mine water make and coal seam gas (CSG) co-produced water, (c) average historical simulated surface water – groundwater flux, (d) predictions of additional drawdown, and (e) year of maximum change (tmax) ............................... 87
Figure 25 Scatter plots of the parameter values versus the simulated mine water make for Caroona Coal Project for all evaluated design-of-experiment model runs ....................................... 89
Figure 26 Scatter plots of the parameter values versus the simulated average historical surface water – groundwater flux at gauge location 419051 for all evaluated design-of-experiment model runs ......................................................................................................................................... 90
Figure 27 Scatter plots of the parameter values versus the predicted maximum difference in drawdown (dmax) at model node 66996 for all evaluated design-of-experiment model runs ........ 92
Figure 28 Weights of observations in objective function of the distance between observation and prediction for different values of w .......................................................................................... 100
Figure 29 Fraction of design-of-experiment model runs that meet the objective function thresholds at each individual prediction location for (a) all three objective functions combined, (b) groundwater levels, (c) coal resource development water production rates, and (d) surface water – groundwater flux ................................................................................................................ 103
Figure 30 Histograms of the 5th, 50th and 95th percentile of (a) additional drawdown at the regional watertable and (b) year of maximum change; plot (c) shows the additional drawdown in the range from 0 m to 2.5 m ........................................................................................................ 105
Figure 31 Probability of drawdown at the regional watertable exceeding 0.2 m under baseline and under the coal resource development pathway (CRDP), and the difference in results between baseline and CRDP, which is the change due to additional coal resource development (ACRD) .............................................................................................................................................. 106

Groundwater numerical modelling for the Namoi subregion | ix
Figure 32 Probability of drawdown at the regional watertable exceeding 2 m under baseline and under the coal resource development pathway (CRDP), and the difference in results between baseline and CRDP, which is the change due to additional coal resource development (ACRD) ... 107
Figure 33 Probability of drawdown at the regional watertable exceeding 5 m under baseline and under the coal resource development pathway (CRDP), and the difference in results between baseline and CRDP, which is the change due to additional coal resource development (ACRD) ... 108
Figure 34 5th, 50th and 95th percentile of drawdown at the regional watertable under baseline 110
Figure 35 5th, 50th and 95th percentile of drawdown at the regional watertable under the coal resource development pathway (CRDP) .......................................................................................... 111
Figure 36 5th, 50th and 95th percentile of drawdown at the regional watertable due to additional coal resource development (ACRD) ................................................................................ 112
x | Groundwater numerical modelling for the Namoi subregion
Tables
Table 1 Methodologies ........................................................................................................................ 4
Table 2 Technical products delivered for the Namoi subregion .......................................................... 7
Table 3 Assessment of groundwater numerical modelling approach in the Namoi subregion ........ 13
Table 4 Summary of existing models in the Namoi subregion .......................................................... 26
Table 5 Hydrostratigaphy of groundwater model for the Namoi subregion .................................... 37
Table 6 Groundwater source and related model layer for the Namoi subregion ............................. 52
Table 7 Estimation of extraction rates from stock and domestic bores in the Namoi subregion ..... 53
Table 8 Summary of developments modelled under the baseline and coal resource development pathway (CRDP) ........................................................................................................... 58
Table 9 Model parameters for representing hydraulic conductivity enhancements for the longwall mines in the Namoi subregion ............................................................................................ 64
Table 10 Groundwater model parameters: minimum and maximum values used in the uncertainty analysis ........................................................................................................................... 71
Table 11 Summary of groundwater level observations ..................................................................... 76
Table 12 Mean daily streamflow at 31 gauges used to contrain the groundwater model ............... 79
Table 13 Summary coal resource water production rates ................................................................ 80
Table 14 Qualitative uncertainty analysis for the groundwater model of the Namoi subregion ... 114

Groundwater numerical modelling for the Namoi subregion | xi

xii | Groundwater numerical modelling for the Namoi subregion
Contributors to the Technical Programme
The following individuals have contributed to the Technical Programme, the part of the Bioregional Assessment Programme that undertakes bioregional assessments.
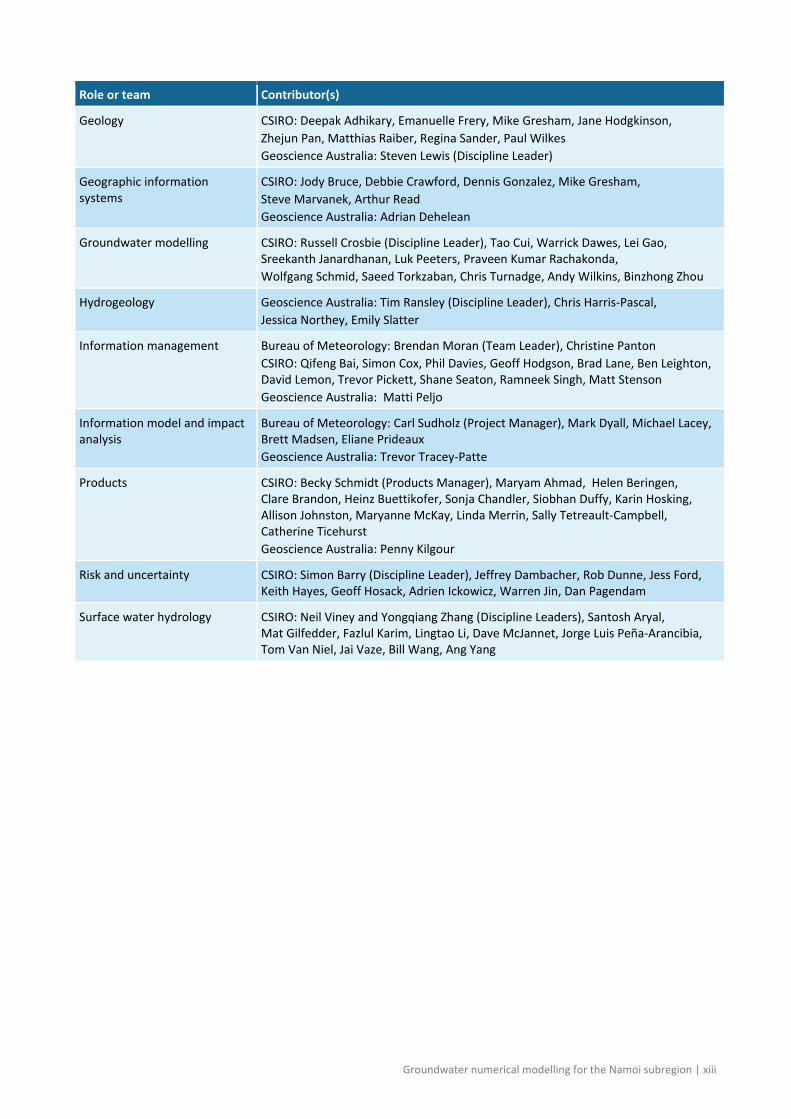
Role or team Contributor(s)
Assistant Secretary Department of the Environment and Energy: Matthew Whitfort
Programme Director Department of the Environment and Energy: John Higgins, Anthony Swirepik
Technical Programme Director Bureau of Meteorology: Julie Burke
Projects Director CSIRO: David Post
Principal Science Advisor Department of the Environment and Energy: Peter Baker
Science Directors CSIRO: Brent Henderson Geoscience Australia: Steven Lewis
Integration Bureau of Meteorology: Richard Mount (Integration Leader) CSIRO: Becky Schmidt
Programme management Bureau of Meteorology: Louise Minty CSIRO: Paul Bertsch, Warwick McDonald Geoscience Australia: Stuart Minchin
Project Leaders CSIRO: Alexander Herr, Kate Holland, Tim McVicar, David Rassam Geoscience Australia: Tim Evans Bureau of Meteorology: Natasha Herron
Assets and receptors Bureau of Meteorology: Richard Mount (Discipline Leader) Department of the Environment and Energy: Glenn Johnstone, Wasantha Perera, Jin Wang
Bioregional Assessment Information Platform
Bureau of Meteorology: Lakshmi Devanathan (Team Leader), Derek Chen, Trevor Christie-Taylor, Melita Dahl, Angus MacAulay, Christine Price, Paul Sheahan, Kellie Stuart CSIRO: Peter Fitch, Ashley Sommer Geoscience Australia: Neal Evans
Communications Bureau of Meteorology: Jessica York CSIRO: Clare Brandon Department of the Environment and Energy: John Higgins, Miriam McMillan, Milica Milanja Geoscience Australia: Aliesha Lavers
Coordination Bureau of Meteorology: Brendan Moran, Eliane Prideaux, Sarah van Rooyen CSIRO: Ruth Palmer Department of the Environment and Energy: Anisa Coric, Lucy Elliott, James Hill, Andrew Stacey, David Thomas, Emily Turner
Ecology CSIRO: Anthony O'Grady (Discipline Leader), Caroline Bruce, Tanya Doody, Brendan Ebner, Craig MacFarlane, Patrick Mitchell, Justine Murray, Chris Pavey, Jodie Pritchard, Nat Raisbeck-Brown, Ashley Sparrow
Groundwater numerical modelling for the Namoi subregion | xiii
Role or team Contributor(s)
Geology CSIRO: Deepak Adhikary, Emanuelle Frery, Mike Gresham, Jane Hodgkinson, Zhejun Pan, Matthias Raiber, Regina Sander, Paul Wilkes Geoscience Australia: Steven Lewis (Discipline Leader)
Geographic information systems
CSIRO: Jody Bruce, Debbie Crawford, Dennis Gonzalez, Mike Gresham, Steve Marvanek, Arthur Read Geoscience Australia: Adrian Dehelean
Groundwater modelling CSIRO: Russell Crosbie (Discipline Leader), Tao Cui, Warrick Dawes, Lei Gao, Sreekanth Janardhanan, Luk Peeters, Praveen Kumar Rachakonda, Wolfgang Schmid, Saeed Torkzaban, Chris Turnadge, Andy Wilkins, Binzhong Zhou
Hydrogeology Geoscience Australia: Tim Ransley (Discipline Leader), Chris Harris-Pascal, Jessica Northey, Emily Slatter
Information management Bureau of Meteorology: Brendan Moran (Team Leader), Christine Panton CSIRO: Qifeng Bai, Simon Cox, Phil Davies, Geoff Hodgson, Brad Lane, Ben Leighton, David Lemon, Trevor Pickett, Shane Seaton, Ramneek Singh, Matt Stenson Geoscience Australia: Matti Peljo
Information model and impact analysis
Bureau of Meteorology: Carl Sudholz (Project Manager), Mark Dyall, Michael Lacey, Brett Madsen, Eliane Prideaux Geoscience Australia: Trevor Tracey-Patte
Products CSIRO: Becky Schmidt (Products Manager), Maryam Ahmad, Helen Beringen, Clare Brandon, Heinz Buettikofer, Sonja Chandler, Siobhan Duffy, Karin Hosking, Allison Johnston, Maryanne McKay, Linda Merrin, Sally Tetreault-Campbell, Catherine Ticehurst Geoscience Australia: Penny Kilgour
Risk and uncertainty CSIRO: Simon Barry (Discipline Leader), Jeffrey Dambacher, Rob Dunne, Jess Ford, Keith Hayes, Geoff Hosack, Adrien Ickowicz, Warren Jin, Dan Pagendam
Surface water hydrology CSIRO: Neil Viney and Yongqiang Zhang (Discipline Leaders), Santosh Aryal, Mat Gilfedder, Fazlul Karim, Lingtao Li, Dave McJannet, Jorge Luis Peña-Arancibia, Tom Van Niel, Jai Vaze, Bill Wang, Ang Yang

xiv | Groundwater numerical modelling for the Namoi subregion
Acknowledgements
This technical product was reviewed by several groups:
• Senior Science Leaders: David Post (Projects Director), Steven Lewis (Science Director, Geoscience Australia), Brent Henderson (Science Director, CSIRO), Becky Schmidt (Products Manager)
• Technical Assurance Reference Group: Chaired by Peter Baker (Principal Science Advisor, Department of the Environment and Energy), this group comprises officials from the NSW, Queensland, South Australian and Victorian governments.

Groundwater numerical modelling for the Namoi subregion | xv
Currency of scientific results
The modelling results contained in this product were completed in November 2016 using the best available data, models and approaches available at that time. The product content was completed in February 2018.
All products in the model-data analysis, impact and risk analysis, and outcome synthesis (see Figure 1) were published as a suite when completed.

xvi | Groundwater numerical modelling for the Namoi subregion

Groundwater numerical modelling for the Namoi subregion | 1
Introduction
The Independent Expert Scientific Committee on Coal Seam Gas and Large Coal Mining Development (IESC) was established to provide advice to the federal Minister for the Environment on potential water-related impacts of coal seam gas (CSG) and large coal mining developments (IESC, 2015).
Bioregional assessments (BAs) are one of the key mechanisms to assist the IESC in developing this advice so that it is based on best available science and independent expert knowledge. Importantly, technical products from BAs are also expected to be made available to the public, providing the opportunity for all other interested parties, including government regulators, industry, community and the general public, to draw from a single set of accessible information. A BA is a scientific analysis, providing a baseline level of information on the ecology, hydrology, geology and hydrogeology of a bioregion with explicit assessment of the potential impacts of CSG and coal mining development on water resources.
The IESC has been involved in the development of Methodology for bioregional assessments of the impacts of coal seam gas and coal mining development on water resources (the BA methodology; Barrett et al., 2013) and has endorsed it. The BA methodology specifies how BAs should be undertaken. Broadly, a BA comprises five components of activity, as illustrated in Figure 1. Each BA is different, due in part to regional differences, but also in response to the availability of data, information and fit-for-purpose models. Where differences occur, these are recorded, judgments exercised on what can be achieved, and an explicit record is made of the confidence in the scientific advice produced from the BA.
The Bioregional Assessment Programme The Bioregional Assessment Programme is a collaboration between the Department of the Environment and Energy, the Bureau of Meteorology, CSIRO and Geoscience Australia. Other technical expertise, such as from state governments or universities, is also drawn on as required. For example, natural resource management groups and catchment management authorities identify assets that the community values by providing the list of water-dependent assets, a key input.
The Technical Programme, part of the Bioregional Assessment Programme, has undertaken BAs for the following bioregions and subregions (see http://www.bioregionalassessments.gov.au/assessments for a map and further information):
• the Galilee, Cooper, Pedirka and Arckaringa subregions, within the Lake Eyre Basin bioregion
• the Maranoa-Balonne-Condamine, Gwydir, Namoi and Central West subregions, within the Northern Inland Catchments bioregion
• the Clarence-Moreton bioregion
• the Hunter and Gloucester subregions, within the Northern Sydney Basin bioregion

2 | Groundwater numerical modelling for the Namoi subregion
• the Sydney Basin bioregion
• the Gippsland Basin bioregion.
Technical products (described in a later section) will progressively be delivered throughout the Programme.
Figure 1 Schematic diagram of the bioregional assessment methodology The methodology comprises five components, each delivering information into the bioregional assessment and building on prior components, thereby contributing to the accumulation of scientific knowledge. The small grey circles indicate activities external to the bioregional assessment. Risk identification and risk likelihoods are conducted within a bioregional assessment (as part of Component 4) and may contribute activities undertaken externally, such as risk evaluation, risk assessment and risk treatment. Source: Figure 1 in Barrett et al. (2013), © Commonwealth of Australia

Groundwater numerical modelling for the Namoi subregion | 3
Methodologies The overall scientific and intellectual basis of the BAs is provided in the BA methodology (Barrett et al., 2013). Additional guidance is required, however, about how to apply the BA methodology to a range of subregions and bioregions. To this end, the teams undertaking the BAs have developed and documented detailed scientific submethodologies (Table 1), in the first instance, to support the consistency of their work across the BAs and, secondly, to open the approach to scrutiny, criticism and improvement through review and publication. In some instances, methodologies applied in a particular BA may differ from what is documented in the submethodologies.
The relationship of the submethodologies to BA components and technical products is illustrated in Figure 2. While much scientific attention is given to assembling and transforming information, particularly through the development of the numerical, conceptual and receptor impact models, integration of the overall assessment is critical to achieving the aim of the BAs. To this end, each submethodology explains how it is related to other submethodologies and what inputs and outputs are required. They also define the technical products and provide guidance on the content to be included. When this full suite of submethodologies is implemented, a BA will result in a substantial body of collated and integrated information for a subregion or bioregion, including new information about the potential impacts of coal resource development on water and water-dependent assets.

4 | Groundwater numerical modelling for the Namoi subregion
Table 1 Methodologies Each submethodology is available online at http://data.bioregionalassessments.gov.au/submethodology/XXX, where ‘XXX’ is replaced by the code in the first column. For example, the BA methodology is available at http://data.bioregionalassessments.gov.au/submethodology/bioregional-assessment-methodology and submethodology M02 is available at http://data.bioregionalassessments.gov.au/submethodology/M02. Submethodologies might be added in the future.
Code Proposed title Summary of content
bioregional-assessment-methodology
Methodology for bioregional assessments of the impacts of coal seam gas and coal mining development on water resources
A high-level description of the scientific and intellectual basis for a consistent approach to all bioregional assessments
M02 Compiling water-dependent assets Describes the approach for determining water-dependent assets
M03 Assigning receptors to water-dependent assets
Describes the approach for determining receptors associated with water-dependent assets
M04 Developing a coal resource development pathway
Specifies the information that needs to be collected and reported about known coal and coal seam gas resources as well as current and potential resource developments
M05 Developing the conceptual model of causal pathways
Describes the development of the conceptual model of causal pathways, which summarises how the ‘system’ operates and articulates the potential links between coal resource development and changes to surface water or groundwater
M06 Surface water modelling Describes the approach taken for surface water modelling
M07 Groundwater modelling Describes the approach taken for groundwater modelling
M08 Receptor impact modelling Describes how to develop receptor impact models for assessing potential impact to assets due to hydrological changes that might arise from coal resource development
M09 Propagating uncertainty through models
Describes the approach to sensitivity analysis and quantification of uncertainty in the modelled hydrological changes that might occur in response to coal resource development
M10 Impacts and risks Describes the logical basis for analysing impact and risk
M11 Systematic analysis of water-related hazards associated with coal resource development
Describes the process to identify potential water-related hazards from coal resource development

Groundwater numerical modelling for the Namoi subregion | 5
Technical products The outputs of the BAs include a suite of technical products presenting information about the ecology, hydrology, hydrogeology and geology of a bioregion and the potential impacts of CSG and coal mining developments on water resources, both above and below ground. Importantly, these technical products are available to the public, providing the opportunity for all interested parties, including community, industry and government regulators, to draw from a single set of accessible information when considering CSG and large coal mining developments in a particular area.
The information included in the technical products is specified in the BA methodology. Figure 2 shows the relationship of the technical products to BA components and submethodologies. Table 2 lists the content provided in the technical products, with cross-references to the part of the BA methodology that specifies it. The red outlines in both Figure 2 and Table 2 indicate the information included in this technical product.
Technical products are delivered as reports (PDFs). Additional material is also provided, as specified by the BA methodology:
• unencumbered data syntheses and databases
• unencumbered tools, model code, procedures, routines and algorithms
• unencumbered forcing, boundary condition, parameter and initial condition datasets
• lineage of datasets (the origin of datasets and how they are changed as the BA progresses)
• gaps in data and modelling capability.
In this context, unencumbered material is material that can be published according to conditions in the licences or any applicable legislation. All reasonable efforts were made to provide all material under a Creative Commons Attribution 3.0 Australia Licence.
Technical products, and the additional material, are available online at http://www.bioregionalassessments.gov.au.
The Bureau of Meteorology archives a copy of all datasets used in the BAs. This archive includes datasets that are too large to be stored online and datasets that are encumbered. The community can request a copy of these archived data at http://www.bioregionalassessments.gov.au.

6 | Groundwater numerical modelling for the Namoi subregion
Figure 2 Technical products and submethodologies associated with each component of a bioregional assessment In each component (Figure 1) of a bioregional assessment, a number of technical products (coloured boxes, see also Table 2) are potentially created, depending on the availability of data and models. The light grey boxes indicate submethodologies (Table 1) that specify the approach used for each technical product. The red outline indicates this technical product. The BA methodology (Barrett et al., 2013) specifies the overall approach.

Groundwater numerical modelling for the Namoi subregion | 7
Table 2 Technical products delivered for the Namoi subregion For each subregion in the Northern Inland Catchments Bioregional Assessment, technical products are delivered online at http://www.bioregionalassessments.gov.au, as indicated in the ‘Type’ columna. Other products – such as datasets, metadata, data visualisation and factsheets – are provided online. There is no product 1.4. Originally this product was going to describe the receptor register and application of landscape classes as per Section 3.5 of the BA methodology, but this information is now included in product 2.3 (conceptual modelling) and used in product 2.6.1 (surface water numerical modelling) and product 2.6.2 (groundwater numerical modelling). There is no product 2.4. Originally this product was going to include two- and three-dimensional representations as per Section 4.2 of the BA methodology, but these are instead included in products such as product 2.3 (conceptual modelling), product 2.6.1 (surface water numerical modelling) and product 2.6.2 (groundwater numerical modelling).
Component Product code
Title Section in the BA methodologyb
Typea
Component 1: Contextual information for the Namoi subregion
1.1 Context statement 2.5.1.1, 3.2 PDF, HTML
1.2 Coal and coal seam gas resource assessment 2.5.1.2, 3.3 PDF, HTML
1.3 Description of the water-dependent asset register 2.5.1.3, 3.4 PDF, HTML, register
1.5 Current water accounts and water quality 2.5.1.5 PDF, HTML
1.6 Data register 2.5.1.6 Register
Component 2: Model-data analysis for the Namoi subregion
2.1-2.2 Observations analysis, statistical analysis and interpolation 2.5.2.1, 2.5.2.2 PDF, HTML
2.3 Conceptual modelling 2.5.2.3, 4.3 PDF, HTML
2.5 Water balance assessment 2.5.2.4 PDF, HTML
2.6.1 Surface water numerical modelling 4.4 PDF, HTML
2.6.2 Groundwater numerical modelling 4.4 PDF, HTML
2.7 Receptor impact modelling 2.5.2.6, 4.5 PDF, HTML
Component 3 and Component 4: Impact and risk analysis for the Namoi subregion
3-4 Impact and risk analysis 5.2.1, 2.5.4, 5.3 PDF, HTML
Component 5: Outcome synthesis for the Namoi subregion
5 Outcome synthesis 2.5.5 PDF, HTML
aThe types of products are as follows: ● ‘PDF’ indicates a PDF document that is developed by the Northern Inland Catchments Bioregional Assessment using the structure, standards and format specified by the Programme. ● ‘HTML’ indicates the same content as in the PDF document, but delivered as webpages. ● ‘Register’ indicates controlled lists that are delivered using a variety of formats as appropriate.
bMethodology for bioregional assessments of the impacts of coal seam gas and coal mining development on water resources (Barrett et al., 2013)

8 | Groundwater numerical modelling for the Namoi subregion
About this technical product The following notes are relevant only for this technical product.
• All reasonable efforts were made to provide all material under a Creative Commons Attribution 3.0 Australia Licence.
• All maps created as part of this BA for inclusion in this product used the Albers equal area projection with a central meridian of 151.0° East for the Northern Inland Catchments bioregion and two standard parallels of –18.0° and –36.0°.
• Visit http://www.bioregionalassessments.gov.au to access metadata (including copyright, attribution and licensing information) for datasets cited or used to make figures in this product.
• In addition, the datasets are published online if they are unencumbered (able to be published according to conditions in the licence or any applicable legislation). The Bureau of Meteorology archives a copy of all datasets used in the BAs. This archive includes datasets that are too large to be stored online and datasets that are encumbered. The community can request a copy of these archived data at http://www.bioregionalassessments.gov.au.
• The citation details of datasets are correct to the best of the knowledge of the Bioregional Assessment Programme at the publication date of this product. Readers should use the hyperlinks provided to access the most up-to-date information about these data; where there are discrepancies, the information provided online should be considered correct. The dates used to identify Bioregional Assessment Source Datasets are the dataset’s published date. Where the published date is not available, the last updated date or created date is used. For Bioregional Assessment Derived Datasets, the created date is used.
References
Barrett DJ, Couch CA, Metcalfe DJ, Lytton L, Adhikary DP and Schmidt RK (2013) Methodology for bioregional assessments of the impacts of coal seam gas and coal mining development on water resources. A report prepared for the Independent Expert Scientific Committee on Coal Seam Gas and Large Coal Mining Development through the Department of the Environment. Department of the Environment, Australia. Viewed 19 June 2018, http://data.bioregionalassessments.gov.au/submethodology/bioregional-assessment-methodology.
IESC (2015) Information guidelines for the Independent Expert Scientific Committee advice on coal seam gas and large coal mining development proposals. Independent Expert Scientific Committee on Coal Seam Gas and Large Coal Mining Development, Australia. Viewed 19 June 2018, http://www.iesc.environment.gov.au/publications/information-guidelines-independent-expert-scientific-committee-advice-coal-seam-gas.

Groundwater numerical modelling for the Namoi subregion | 9
2.6.2 Groundwater numerical modelling for the Namoi subregion Coal and coal seam gas (CSG) development can potentially affect water-dependent assets (either negatively or positively) through impacts on groundwater hydrology. This product presents the modelling of groundwater hydrology within the Namoi subregion.
First, the methods are summarised and existing models reviewed, followed by details regarding the development and parameterisation of the model. The product concludes with probabilistic predictions of hydrological change, including uncertainty analysis and a discussion of model limitations, opportunities and conclusions.
Results are reported for the two potential futures considered in a bioregional assessment:
• baseline coal resource development (baseline): a future that includes all coal mines and coal seam gas (CSG) fields that are commercially producing as of December 2012
• coal resource development pathway (CRDP): a future that includes all coal mines and CSG fields that are in the baseline as well as those that are expected to begin commercial production after December 2012.
The difference in results between CRDP and baseline is the change that is primarily reported in a bioregional assessment. This change is due to the additional coal resource development – all coal mines and CSG fields, including expansions of baseline operations, that are expected to begin commercial production after December 2012.
This product reports results for only those developments in the baseline and CRDP that can be modelled. Results generated at model nodes are interpolated to estimate potential hydrological changes for groundwater. Similarly, potential hydrological changes are estimated for surface water in product 2.6.1 (surface water numerical modelling). Product 3-4 (impact and risk analysis) then reports impacts on landscape classes and water-dependent assets arising from these hydrological changes.
The hydrological results from both product 2.6.1 (surface water numerical modelling) and product 2.6.2 (groundwater numerical modelling) are used to assess water balances, reported in product 2.5 (water balance assessment)

2.6.2.1 Methods
10 | Groundwater numerical modelling for the Namoi subregion
Com
pone
nt 2
: Mod
el-d
ata
anal
ysis
for t
he N
amoi
subr
egio
n 2.6.2.1 Methods
Summary
This section summarises the groundwater modelling approach with reference to the Namoi subregion conceptual model and the objectives of the bioregional assessment.
The groundwater numerical modelling is designed to provide probabilistic estimates of groundwater drawdown and changes in the surface water – groundwater flux due to additional coal resource development in the Namoi subregion. Results can be expressed in terms of contour maps of the percent chance of exceeding a specified drawdown and/or percentiles of drawdown. The approach in the Namoi subregion is consistent with the Bioregional Assessment Programme’s companion submethodology M07 (as listed in Table 1) for groundwater modelling (Crosbie et al., 2016), and companion submethodology M09 (as listed in Table 1) for propagating uncertainty through models (Peeters et al., 2016).
The model chain comprises a subregion-wide groundwater model and surface water model (see companion product 2.6.1 for the Namoi subregion (Aryal et al., 2018)). This model chain is evaluated many times to characterise the prediction uncertainty for two hydrological response variables:
• dmax, the maximum difference in drawdown
• tmax, the year of maximum change.
The modelled changes in surface water – groundwater flux inform the potential changes in total streamflow, modelled using the Namoi subregion surface water model.
2.6.2.1.1 Background and context
The groundwater modelling in bioregional assessments (BAs) has a very specific objective: to probabilistically evaluate potential drawdown and changes in surface water – groundwater flux relevant to the surface water modelling in the coal resource development pathway (CRDP) relative to the baseline at specified locations in the landscape to inform the impact and risk analysis reported in product 3-4 (impact and risk analysis).
The modelling is focused on the change in hydrogeological stress and the hydraulic properties, rather than on reproducing historical conditions or predicting future state variables of the system, such as groundwater levels or fluxes. The main rationale for this approach is that in confined groundwater systems, and to a lesser extent in unconfined systems, the response in groundwater level or flux is linear with respect to the change in stress – that is, a doubling of the pumping rate will result in a doubling of drawdown (Reilly et al., 1987; Rassam et al., 2004). If a system behaves linearly, it means that changes are additive, which is known as the principle of superposition (Reilly et al., 1987). The biggest implication of this is that the change to the system due to a change in stress is largely independent of current or initial conditions. The most well-known example is the interpretation of a pumping test; the drawdown is only a function of the hydraulic properties of the aquifer, not of the initial conditions.
2.6.2.1 Methods
Groundwater numerical modelling for the Namoi subregion | 11
Component 2: M
odel-data analysis for the Nam
oi subregion
By applying the principle of superposition, predictive modelling puts the primary focus on quantifying changes in groundwater levels and fluxes caused by changes in hydrogeological stress and the hydraulic properties, rather than on reproducing historical conditions or predicting future state variables of the system, such as groundwater levels or fluxes. This is because the primary objective of modelling is a probabilistic quantification of changes in drawdown and fluxes caused by additional coal resource development especially considering the limited availability of historical groundwater monitoring information from the deep sedimentary basins in the region.
The probabilistic aspect of the analysis implies that modelling does not provide a single best estimate of the change, but rather an ensemble of estimates based on user-defined probability distributions of input parameters. This allows results to be presented either as a probability of exceeding a threshold drawdown (e.g. 2 m) or as a percentile of drawdown (e.g. 95th percentile).
To generate these ensembles of predictions, a large number of model parameter sets will be evaluated for the surface water and groundwater models. The range of parameters reflects both the natural variability of the system and the uncertainty in the understanding of the system as of September 2015. During the uncertainty analysis, these parameter combinations are filtered in such a way that only those that are consistent with the available observations and the understanding of the system are used to generate the ensemble of predictions. When no relevant observations are available, the prior parameter combinations are not constrained. The details are documented in companion submethodology M09 (as listed in Table 1) for propagating uncertainty through models (Peeters et al., 2016).
It is not possible to capture all uncertainty in the understanding of the system in the parameterisation of the numerical models. It is, therefore, inevitable that there will be a number of assumptions and model choices necessary to create the models. This is often referred to as structural or conceptual model uncertainty. These assumptions are introduced and briefly discussed in Section 2.6.2.3 about model development. The qualitative uncertainty analysis in Section 2.6.2.8.2 further provides a systematic and comprehensive discussion of these assumptions. This discussion focuses on the rationale behind the assumptions and the effect on the predictions.
A precautionary approach is adopted in making modelling choices and assumptions to reduce the likelihood of under estimating the hydrological changes arising from coal resource development (e.g. using a wide parameter range when little measured information exists). However, an overly conservative estimate of impact is not desirable either. If there are sound reasons to believe that predicted hydrological changes are unrealistically high (e.g. in comparison to earlier modelling efforts in the subregion) the assumptions will be revisited as part of the model development process. This precautionary approach allows us to be very confident in areas that are ruled out of having any potential impacts due to drawdown.
The effect on predictions is crucial in justifying assumptions. In a conservative numerical modelling analysis the precautionary principle is adopted: impacts are over estimated rather than under estimated. Wherever possible, this precautionary principle is adopted and if it can be shown that an assumption over estimates – not under estimates – impacts, the assumption is considered appropriate for the specific purpose of this modelling. This approach is also adopted by the US Environmental Protection Agency (US Environmental Protection Agency, 2004).

2.6.2.1 Methods
12 | Groundwater numerical modelling for the Namoi subregion
Com
pone
nt 2
: Mod
el-d
ata
anal
ysis
for t
he N
amoi
subr
egio
n The stochastic approach to modelling uncertainty also enables a comprehensive sensitivity analysis to identify the model parameters or aspects of the system that are most influential on the predictions – and others that have little or no effect on the predictions. This information can guide future data collection and model development or inform the regulatory process.
This product reports only the drawdown due to coal resource development. The drawdown due to additional coal resource development is particularly emphasised, and drawdown under baseline and under the CRDP are also reported for context. Only for these predictions is it ensured that all the model assumptions are valid and conservative. In addition to that, the parameter distributions are tailored to these predictions. This means that this product will not present simulated historical groundwater levels or potentiometric surfaces.
In deterministic groundwater modelling (i.e. simulation of current and future aquifer states over the entire model domain based on a single parameter set), this information, together with calibration results, are used to build confidence in the model predictions. This is based on the premise that a model that can accurately reproduce historical states, such as groundwater levels, will be able to make accurate predictions. The work by, among others, Moore and Doherty (2005) and Doherty and Welter (2010) have shown that this premise is not universally valid and very dependent on the type and nature of the observations and the type and nature of the predictions. In extremis, matching historical observations can lead to an increase in predictive uncertainty (White et al., 2014). In order to safeguard the analysis from these pitfalls, while still ensuring the model is consistent with available relevant observations, the sensitivity analysis is focused on identifying the parameters the predictions are sensitive to and, should observations be available, identifying which parameters can be constrained by observations. In the uncertainty analysis a set of rules or objective functions is defined, if relevant observations are available, that needs to be satisfied before a particular parameter combination is considered suitable to make predictions. An example of such a rule is that the mismatch between simulated and observed groundwater levels is less than a predefined threshold or that the surface water – groundwater flux is within a specified range.
This approach to modelling is a departure from the traditional approach focused on deterministic aquifer simulation reflected in the Australian groundwater modelling guidelines (Barnett et al., 2012). The report structure therefore does not adhere fully to the reporting structure recommended in the guidelines. This product starts with an overview of the groundwater modelling methods as applied to the Namoi subregion (Section 2.6.2.1.2), in which a high-level overview is provided of the conceptualisation, modelling approach, interaction with the surface water model and uncertainty analysis in relation to the other companion documents for this subregion and the BA submethodologies. The methods section is followed with a review of the existing groundwater models (Section 2.6.2.2). Section 2.6.2.3 to Section 2.6.2.6 describe the development of the model, boundary conditions, implementation of the CRDP and the parameterisation of the model. In these sections, model choices and assumptions are discussed. The available observations, as well as the type and location of the predictions, are presented in Section 2.6.2.7. This section also includes the sensitivity analysis of the model parameters to observations and predictions. The probabilistic estimates of drawdown are presented in Section 2.6.2.8. This section also provides an in-depth formal discussion of the justification of assumptions and their effect on predictions. The final section, Section 2.6.2.9, does not only contain the

2.6.2.1 Methods
Groundwater numerical modelling for the Namoi subregion | 13
Component 2: M
odel-data analysis for the Nam
oi subregion
conclusions of the model, but also the limitations and opportunities to reduce predictive uncertainty.
2.6.2.1.2 Groundwater numerical modelling
In the Namoi subregion, the groundwater model has been developed using the MODFLOW-USG code (Section 2.6.2.3). To be fit for the purposes of a BA, the groundwater model needs to satisfy the criteria listed in Table 3. The remainder of this section discusses each of these criteria with regard to the numerical modelling approach undertaken in the Namoi subregion.
Table 3 Assessment of groundwater numerical modelling approach in the Namoi subregion
Fit-for-purpose assessment criteria Components
1. Prediction of hydrological response variables
Probabilistic estimates of hydrological change at model nodes
Integration with receptor impact modelling
Integration with surface water numerical models
2. Design and construction Modelling objectives stated
Model confidence level
Modelling approach
3. Integration with sensitivity and uncertainty analyses workflow
Formally address uncertainty
Parameterisation
Convergence
4. Water balance components Conceptual model agreement
5. Transparent and reproducible model outputs
Model data repository
Model code and executables
Pre- and post-processing scripts
2.6.2.1.2.1 Prediction of hydrological response variables
The objective of the numerical modelling in BAs is to assess hydrological changes arising from coal resource development using a probabilistic approach. In the Namoi subregion, the CRDP includes existing open-cut and underground mining operations, proposals to expand existing open-cut and underground mines and proposals for new open-cut and underground mines and a coal seam gas (CSG) development (see Section 2.3.4 of companion product 2.3 for the Namoi subregion (Herr et al., 2018)).
The groundwater and surface water models predict changes for a set of hydrological response variables, chosen to represent important hydrological characteristics of the system or landscape class (e.g. flow volumes, flow frequencies). Some of the hydrological outputs become inputs to receptor impact models through which the potential impacts of coal resource development on water-dependent assets can be evaluated.
The hydrological response variables for groundwater are: (i) maximum difference in drawdown (dmax); and (ii) year of maximum change (tmax). Drawdown is the difference in groundwater level between the baseline and CRDP within a regional-scale, unconfined aquifer that spans the entire

2.6.2.1 Methods
14 | Groundwater numerical modelling for the Namoi subregion
Com
pone
nt 2
: Mod
el-d
ata
anal
ysis
for t
he N
amoi
subr
egio
n model domain. These variables are generated in the model at the model nodes shown in Figure 3. There are 13,629 model nodes in the regional watertable to enable an interpolated surface of drawdown to be created so that impacts on ecological, economic and sociocultural assets can be assessed and there are another 580 model nodes in the confined part of the Pilliga Sandstone that can be used to estimate impacts on economic assets. The regional watertable is the surface layer of the model which includes all geological units that outcrop. This is the uppermost geological unit, except where the alluvium is present. These model nodes are restricted in space to where there is drawdown due to coal resource development; there is no drawdown outside of the area with model nodes. Although the change in surface water – groundwater flux is an output of the groundwater model, it is an input into the river modelling and therefore encapsulated within the set of surface water hydrological response variables (see companion submethodology M06 (as listed in Table 1) for surface water modelling (Viney, 2016)). The surface water – groundwater nodes in Figure 3 show where changes in surface water – groundwater flux are generated in the groundwater model. Changes in the nine hydrological response variables for streamflow due to the coal resource development are reported in companion product 2.6.1 for the Namoi subregion (Aryal et al., 2018). Figure 3 shows the location of the surface water model nodes relative to the groundwater model nodes where surface water – groundwater fluxes are calculated.
The groundwater model is run 3500 times using a wide range of parameter values to generate an ensemble of predictions. From this set of runs, a probability distribution is defined for each groundwater hydrological response variable at each groundwater model node in the subregion. This distribution summarises uncertainty in the prediction (Section 2.6.2.8).

2.6.2.1 Methods
Groundwater numerical modelling for the Namoi subregion | 15
Component 2: M
odel-data analysis for the Nam
oi subregion
Figure 3 Model nodes for the Namoi groundwater model The blue dots are the model nodes in the regional watertable (their density is too great to see individual model nodes in most of this area), and the yellow dots are where the surface water – groundwater fluxes are aggregated from upstream. Data: Bioregional Assessment Programme (Dataset 1)
Pumping water that flows from the coal seam, interburden and weathered rock into the working area during mining produces a cone of drawdown and a drop in the watertable around the worked area; similarly, depressurisation from CSG developments may propagate drawdown into geological layers above. Where drawdowns expand into alluvial aquifers that intersect the river channel, the flux of water from the alluvial aquifer to the river will tend to decrease. To represent this surface water – groundwater interaction, the groundwater model represents alluvial aquifers and the river network in its model structure. A river model constructed to represent the same river network can receive these changes in surface water – groundwater flux at specified points along its network to represent the combined effect of changes to surface runoff and groundwater flux on streamflow. Since groundwater and surface water systems operate at different temporal scales, the models used to represent these processes run on different time steps. Streamflow is very responsive to individual rainfall events and is usually modelled at a daily time step or finer. Groundwater levels
2.6.2.1 Methods
16 | Groundwater numerical modelling for the Namoi subregion
Com
pone
nt 2
: Mod
el-d
ata
anal
ysis
for t
he N
amoi
subr
egio
n in shallow, unconsolidated alluvium are also responsive to changes in rainfall and river stage, but also to exchanges with deeper, intermediate- and regional-scale groundwater aquifers in more consolidated material (i.e. lower transmissivities), which respond relatively slowly to changes in rainfall recharge. To predict these intermediate- and regional-scale groundwater systems, a monthly or more infrequent time step can suffice. The length of the stress periods used for the model developed in this work is a month with a single time-step for most of the stress periods. However, the stress periods are divided into five time-steps for active long-wall mine development periods to implement time-varying properties of the interburden above long-wall mines.
While fully coupled surface water – groundwater model codes are available (e.g. HydroGeoSphere, Brunner and Simmons, 2012), their use is not feasible within BAs due to their high data requirements for parameterisation and operational constraints. The latter relates mainly to the general numerical instability of such models and long run times which would severely limit a probabilistic uncertainty analysis that requires the models to be evaluated thousands of times with vastly different parameter sets.
For the Namoi subregion, the modelling suite includes the Australian Water Resources Assessment (AWRA) landscape water balance model (AWRA-L) (Viney et al., 2015) to calculate the surface runoff to streams; the MODFLOW-USG groundwater model to predict drawdown and change in surface water – groundwater flux (detailed in this product); and the AWRA river model (AWRA-R) (Dutta et al., 2015) via which surface runoff and change in surface water – groundwater flux are propagated downstream. The individual models have different spatial and temporal resolution which requires a set of customised processing steps to upscale or downscale model data to allow the models to be linked.
Figure 4 illustrates the model sequencing, parameters exchanged between models and the outputs generated at model nodes to inform the receptor impact modelling. The MODFLOW-USG, AWRA-L and AWRA-R baseline runs predict the hydrological changes of modelled coal mines that were commercially producing coal as at December 2012. The corresponding CRDP runs predict the combined hydrological changes of the baseline coal resource development (baseline) and those expected to begin commercial production after 2012 (see Section 2.3.4 of companion product 2.3 for the Namoi subregion (Herr et al., 2018)).
The maximum difference in predicted drawdown between baseline and CRDP runs, expressed in terms of dmax and tmax, yields the predicted hydrological changes due to additional coal resource development in the Namoi subregion. In the receptor impact modelling (companion product 2.7 for the Namoi subregion), the potential ecological consequences of the predicted changes in hydrological response variables in the fractured rock aquifers and alluvial aquifers are assessed.

2.6.2.1 Methods
Groundwater numerical modelling for the Namoi subregion | 17
Component 2: M
odel‐data analysis for the Nam
oi subregion
Figure 4 Model sequence for the Namoi subregion AWRA‐L = landscape model; AWRA‐R = river model; GW = groundwater; SW = surface water; No dev = no coal resource development model run; BL = baseline model run; CRDP = coal resource development pathway model run; HRV = hydrological response variable
AWRA-L Change in BL surface runoff
AWRA-R BL
GW BL
Change in SW-GW flux
Stream stage
AWRA-R CRDP
Change in CRDP surface
runoff
AWRA-R CRDP
AWRA-R No dev
Stream stage
Stream stage GW CRDP
GW No dev
Change in SW-GW flux
AWRA-R BL
SW HRVs
GW HRVs

2.6.2.1 Methods
18 | Groundwater numerical modelling for the Namoi subregion
Compo
nent 2: M
odel‐data an
alysis for the
Nam
oi su
bregion 2.6.2.1.2.2 Design and construction
According to the Australian groundwater modelling guidelines (Barnett et al., 2012), the design and construction of a groundwater model should meet a clear set of objectives (see preceding section) and provide some measure of model confidence. The model confidence level is an a priori categorisation of a groundwater model to reflect its predictive capability and is a function of model complexity, prediction time frame and data availability. As explained in companion submethodology M07 (as listed in Table 1) for groundwater modelling (Crosbie et al., 2016), the groundwater models in the BAs are all Class 1 (lowest level) models because they are required to make predictions of unprecedented stresses over time frames longer than the periods with data available to constrain the model.
Further technical detail of the conceptualisation, parameterisation and implementation are provided in Section 2.6.2.3 for the MODFLOW‐USG groundwater model and in companion product 2.6.1 for the Namoi subregion (Aryal et al., 2018) for the AWRA‐L and AWRA‐R models.

2.6.2.1 Methods
Groundwater numerical modelling for the Namoi subregion | 19
Component 2: M
odel-data analysis for the Nam
oi subregion
2.6.2.1.2.3 Integration with sensitivity and uncertainty analyses workflow
Figure 5 Uncertainty analysis workflow Blue boxes pertain to the design of experiment phase and green boxes pertain to the uncertainty analysis phase. ABC = Approximate Bayesian Computation; HRV = hydrological response variable
Companion submethodology M09 (as listed in Table 1) for propagating uncertainty through models (Peeters et al., 2016) discusses in detail the propagation of uncertainty through numerical models in the BAs.

2.6.2.1 Methods
20 | Groundwater numerical modelling for the Namoi subregion
Com
pone
nt 2
: Mod
el-d
ata
anal
ysis
for t
he N
amoi
subr
egio
n Figure 5 summarises the uncertainty propagation workflow which consists of three major steps:
1. Design of experiment: large number of model chain evaluations from the prior parameter values
2. Evaluate model runs and record:
a. each hydrological response variable at each model node
b. objective function tailored to each hydrological response variable at each model node
3. Sample model runs with an Approximate Bayesian Computation rejection sampler based on the objective function to generate a probability distribution for each hydrological response variable at each model node.
The first step is to carry out a large number of model chain evaluations, sampling extensively from the prior parameter distributions, the most likely range of the parameter values based on data and expert knowledge. For each evaluation, the corresponding predicted changes in hydrological response variables at the model nodes are stored, together with the predicted equivalents to the observations. The latter are summarised into objective functions, tailored to each hydrological response variable.
This information forms the basis for the subsequent uncertainty analysis. In the uncertainty analysis, the Approximate Bayesian Computation methodology is used to filter the predictions by only accepting those simulations that have an objective function below a predefined threshold (Vrugt and Sadegh, 2013). This results in a posterior prediction distribution, tailored to a specific hydrological response variable.
To incorporate the model chain into the uncertainty analysis it needs to be scripted so the parameter values can be changed in an automated fashion, be evaluated from a command line on high performance computers and, most importantly, be numerically stable so that the model converges for a wide range of parameter values.
The three models in the model chain for the Namoi subregion have text files as input files and can be executed from the command line. The robustness of each model is tested through a stress test in which a selection of extreme parameter combinations is evaluated. While this does not guarantee that all model evaluations will converge, it provides confidence that the majority of parameter combinations will.
Section 2.6.2.7 and Section 2.6.2.8 provide details of the implementation of this uncertainty propagation workflow for the Namoi groundwater model. The uncertainty analysis for the surface water model is in Section 2.6.1.5 and Section 2.6.1.6 of companion product 2.6.1 for the Namoi subregion (Aryal et al., 2018). These sections also have a qualitative uncertainty analysis that provides a structured discussion of the assumptions and model choices not included in the numerical uncertainty analysis and the perceived effect on the predictions.
2.6.2.1.2.4 Water balance components
A secondary objective of the numerical models is to inform the water balance reporting in companion product 2.5 for the Namoi subregion (Crosbie et al., 2018). The groundwater model and AWRA models produce estimates of the water balances under baseline and CRDP.

2.6.2.1 Methods
Groundwater numerical modelling for the Namoi subregion | 21
Component 2: M
odel-data analysis for the Nam
oi subregion
2.6.2.1.2.5 Transparent and reproducible model outputs
An overarching requirement of the BAs is for all model outputs to be transparent and reproducible.
Input data, model files (including the pre- and post-processing scripts and executables), and results are available at www.bioregionalassessments.gov.au with the specific URL listed in the dataset citation at the end of each section.
As the evaluation of the model chain is a highly automated and scripted process, it is possible to reproduce the results reported in this product using the scripts and executables, provided the computational resources are available.
References
Aryal SK, Peña Arancibia J, Viney N, Yang A, Wang B, Hughes J, Merrin LE, Marvanek S, Davies P, Bell J, Zhang Y, Vaze J, Singh R and Kim S (2018) Surface water numerical modelling for the Namoi subregion. Product 2.6.1 for the Namoi subregion from the Northern Inland Catchments Bioregional Assessment. Department of the Environment and Energy, Bureau of Meteorology, CSIRO and Geoscience Australia, Australia. http://data.bioregionalassessments.gov.au/product/NIC/NAM/2.6.1.
Barnett B, Townley L, Post V, Evans R, Hunt R, Peeters L, Richardson S, Werner A, Knapton A and Boronkay A (2012) Australian groundwater modelling guidelines. Waterlines Report No. 82. National Water Commission, Canberra. Viewed 19 April 2016, http://nwc.gov.au/__data/assets/pdf_file/0016/22840/Waterlines-82-Australian-groundwater-modelling-guidelines.pdf.
Brunner P and Simmons CT (2012) HydroGeoSphere: a fully integrated, physically based hydrological model. Ground Water 50, 170–176.
Crosbie R, Peeters L and Carey H (2016) Groundwater modelling. Submethodology M07 from the Bioregional Assessment Technical Programme. Department of the Environment and Energy, Bureau of Meteorology, CSIRO and Geoscience Australia, Australia. http://data.bioregionalassessments.gov.au/submethodology/M07.
Crosbie R, Aryal SK, Janardhanan S and Peña-Arancibia J (2018) Water balance assessment for the Namoi subregion. Product 2.5 for the Namoi subregion from the Northern Inland Catchments Bioregional Assessment. Department of the Environment and Energy, Bureau of Meteorology, CSIRO and Geoscience Australia, Australia. http://data.bioregionalassessments.gov.au/product/NIC/NAM/2.5.
Doherty J and Welter D (2010) A short exploration of structural noise. Water Resources Research 46, W05525.
Dutta D, Kim S, Hughes J, Vaze J and Yang A (2015) AWRA-R v5.0 Technical report. CSIRO Land and Water, Australia.

2.6.2.1 Methods
22 | Groundwater numerical modelling for the Namoi subregion
Com
pone
nt 2
: Mod
el-d
ata
anal
ysis
for t
he N
amoi
subr
egio
n Herr A, Northey J, Mitchell PJ, Aryal SK, Merrin LE and Slatter E (2018) Conceptual modelling for the Namoi subregion. Product 2.3 for the Namoi subregion from the Northern Inland Catchments Bioregional Assessment. Department of the Environment and Energy, Bureau of Meteorology, CSIRO and Geoscience Australia, Australia. http://data.bioregionalassessments.gov.au/product/NIC/NAM/2.3.
Moore C and Doherty J (2005) Role of the calibration process in reducing model predictive error. Water Resources Research 41, W05020.
Peeters L, Pagendam D, Gao L, Hosack G, Jiang W and Henderson BL (2016) Propagating uncertainty through models. Submethodology M09 from the Bioregional Assessment Technical Programme. Department of the Environment and Energy, Bureau of Meteorology, CSIRO and Geoscience Australia, Australia. http://data.bioregionalassessments.gov.au/submethodology/M09.
Reilly TE, Franke OL and Bennet GD (1987) The principle of superposition and its application in groundwater hydraulics. In: Techniques of water-resources investigations of the U.S. Geological Survey, Book 3: Applications of hydraulics, Section B: Ground-water techniques, Chapter B6. Viewed 02 March 2016, http://pubs.usgs.gov/twri/twri3-b6/html/pdf.html.
Rassam D, Walker G and Knight J (2004) Applicability of the Unit Response Equation to assess salinity impacts of irrigation development in the Mallee region. Technical report No. 35.04. CSIRO Land and Water, Australia.
US Environmental Protection Agency (2004) Air toxics risk assessment reference library. Volume 1 Technical Resource Manual. EPA-453-K-04-001A. Prepared by ICF consulting, Fairfax, Virginia. Viewed 20 September 2016, https://www.epa.gov/fera/risk-assessment-and-modeling-air-toxics-risk-assessment-reference-library.
Viney N (2016) Surface water modelling. Submethodology M06 from the Bioregional Assessment Technical Programme. Department of the Environment and Energy, Bureau of Meteorology, CSIRO and Geoscience Australia, Australia. http://data.bioregionalassessments.gov.au/submethodology/M06.
Viney N, Vaze J, Crosbie R, Wang B, Dawes W and Frost A (2015) AWRA-L v4.5: technical description of model algorithms and inputs. CSIRO, Australia.
Vrugt J A and Sadegh M (2013) Toward diagnostic model calibration and evaluation: Approximate Bayesian Computation. Water Resources Research 49, 4335–4345.
White JT, Doherty JE and Hughes JD (2014) Quantifying the predictive consequences of model error with linear subspace analysis. Water Resources Research 50, 1152–1173. Viewed 20 September 2016, http://dx.doi.org/10.1002/2013WR014767.

2.6.2.1 Methods
Groundwater numerical modelling for the Namoi subregion | 23
Component 2: M
odel-data analysis for the Nam
oi subregion
Datasets
Dataset 1 Bioregional Assessment Programme (2016) Namoi groundwater model input shapefiles. Bioregional Assessment Derived Dataset. Viewed 16 December 2016, http://data.bioregionalassessments.gov.au/dataset/fb22671f-8b47-48e2-9fcd-232543fb8ad6.

2.6.2.1 Methods
24 | Groundwater numerical modelling for the Namoi subregion
Com
pone
nt 2
: Mod
el-d
ata
anal
ysis
for t
he N
amoi
subr
egio
n

2.6.2.2 Review of existing models
Groundwater numerical modelling for the Namoi subregion | 25
Component 2: M
odel-data analysis for the Nam
oi subregion
2.6.2.2 Review of existing models
Summary
There have been many groundwater models developed in the Namoi subregion for a variety of different purposes. This review identified two models of a sufficient scale and complexity that warranted a detailed investigation as to their suitability for use in the bioregional assessment (BA) for the Namoi subregion. The owners of both of these models made them available for use in BA. The Namoi Catchment Water Study model did not suit the stability requirements that is necessary for BA analysis and the Gunnedah Basin Regional Model has limitations around the conceptualisation of the alluvium and Great Artesian Basin layers. Neither model was able to be re-purposed for use in BA in its current form and this warranted the development of a new model for BA.
There have been many models developed over the years in the Namoi subregion for a variety of purposes. These range from small-scale investigations on mine sites (e.g. Rocglen (Douglas Partners, 2010)) to the scale of the entire Great Artesian Basin (Welsh, 2006). Table 4 lists a selection of the existing models in the Namoi subregion relevant to the BA. It is clear that models developed for mining developments generally have a smaller extent (area) and a smaller grid cell size than the models developed for coal seam gas (CSG) operations or water resources assessment. To be useful in a BA context, a model would need to cover (or be extended to cover) the region that encompasses all developments and the potentially impacted area from these developments (see companion product M07 (as listed in Table 1) for groundwater modelling (Crosbie et al., 2016)). In the Namoi subregion there are two models that fulfil this criteria and warrant further investigation: the Namoi Catchment Water Study (NCWS) model (SWS, 2012) and the Gunnedah Basin Regional Model (GBRM) developed for the Narrabri Gas Project (CDM Smith, 2014). The extent of these models is shown in Figure 6.

2.6.2.2 Review of existing models
26 | Groundwater numerical modelling for the Namoi subregion
Com
pone
nt 2
: Mod
el-d
ata
anal
ysis
for t
he N
amoi
subr
egio
n Table 4 Summary of existing models in the Namoi subregion
Project name Assessment purpose Area (km2)
Grid size (m)
Reference
GABtran model Water resources 1,539,480 5000 Welsh (2006)
Lower Namoi Water resources 5,267 2500 Merrick (2001)
Upper Namoi Water resources 2,365 1000 McNeilage (2006)
Boggabri Mine 892 50–100 AGE (2010)
Werris Creek Mine 93.5 25–100 RCA (2010)
Rocglen Mine <100 60–500 Douglas Partners (2010)
Maules Creek Mine 1,190 50–500 AGE (2011)
NCWS Cumulative impacts of mining and CSG
30,381 1000 SWS (2012)
Tarrawonga Mine 1,518 50–500 Heritage Computing (2012)
Vickery Mine 957 50–500 Heritage Computing (2013)
Watermark Mine 6,825 50–500 AGE (2013)
Narrabri CSG CSG 11,460 500–1000 Santos (2013)
Narrabri CSG (GBRM)
CSG 53,219 1000–5000 CDM Smith (2014)
Caroona Mine 6,832 400 Hydro Simulations (2014)
Narrabri North Mine 3,970 50–500 Hydro Simulations (2015)
CSG = coal seam gas; GABtran model = Great Artesian Basin transient model; NCWS = Namoi Catchment Water Study; GBRM = Gunnedah Basin Regional Model. All these models were developed in MODFLOW.

2.6.2.2 Review of existing models
Groundwater numerical modelling for the Namoi subregion | 27
Component 2: M
odel-data analysis for the Nam
oi subregion
Figure 6 Location of regional-scale groundwater models in the Namoi subregion GBRM =Gunnedah Basin Regional Model; NCWS = Namoi Catchment Water Study Data: Bioregional Assessment Programme (Dataset 1)
2.6.2.2.1 Namoi Catchment Water Study (NCWS) model
The purpose of the NCWS was to assess the cumulative impact of coal mining and CSG developments in the Gunnedah Basin on water resources in the Namoi river basin. Hence the study area covered the surface water catchment (Figure 6). The NCWS model was constructed using MODFLOW-2000 code (Harbaugh et al., 2000). The model has a uniform finite-difference grid, with 1 x 1 km cells, and an active model area of approximately 30,400 km2. The model was constructed with 20 numerical layers to represent Cenozoic, Cretaceous-Jurassic, Triassic and Permian stratigraphic units with a total thickness of greater than 1500 m. As discussed in companion product M07 (as listed in Table 1) for groundwater modelling (Crosbie et al., 2016), the method employed for uncertainty analysis in a BA requires a stable model that can achieve numerical convergence for a wide range of parameter combinations. The NCWS model did not have the stability required for the uncertainty analysis that is required in BA. Significant changes

2.6.2.2 Review of existing models
28 | Groundwater numerical modelling for the Namoi subregion
Com
pone
nt 2
: Mod
el-d
ata
anal
ysis
for t
he N
amoi
subr
egio
n would have to be made to the NCWS model to adapt it for BA purposes and will still retain the limitations of the structured grid.
2.6.2.2.2 Gunnedah Basin Regional Model (GBRM)
The GBRM was built for Santos (CDM Smith, 2014). The purpose of the modelling was to assess the potential impacts to the groundwater resources and associated environmental values arising from proposed CSG extractions in the Gunnedah Basin (Figure 6). The GBRM was constructed using MODFLOW-SURFACT code (Panday and Huyakorn, 2008). The model has a rectilinear finite-difference grid, with cell dimensions from 1 to 5 km, and an active model area of approximately 53,200 km2. The model was constructed with 24 numerical layers to represent Cenozoic, Cretaceous-Jurassic, Triassic and Permian units with a total thickness of greater than 1400 m. Upon investigation of the suitability of this model for use in BA, it was found that the model has limitations around the conceptualisation of the alluvium and Great Artesian Basin (GAB) layers that prevented it being used for BA purposes (see companion product 2.1-2.2 for the Namoi subregion (Aryal et al., 2018) for more details).
2.6.2.2.3 Rationale for building new model
Although both these regional-scale models were made available by their owners for use in BA, neither were found to be suitable for this purpose in their current form. It was also deemed that these models would be difficult to be made suitable for BA with minor changes. Both these models are built using rectilinear finite-difference grids for MODFLOW. Thus, both these models come with the inherent limitations of the structured grids, including an inability to accommodate pinching out layers and an inflexibility to refine the grid around coal mines, CSG fields and rivers. The unstructured grid version of MODFLOW called MODFLOW-USG provides the flexibility to refine the grids and also permits pinching out of layers. Both these advantages are useful for the Namoi subregion, considering that grid refinement is required for improved accuracy of simulation around multiple mines and the CSG development and also around linear features like rivers. Formations of both the Gunnedah and Surat basins pinch out within the modelled extent and warranted the development of a new model using MODFLOW-USG. However, both the NCWS and GBRM models have informed the conceptualisation and parameterisation of the new model and their results provide a useful comparison to the BA results.
Scenario 1 in the NCWS (SWS, 2012) is akin to the BA baseline which includes current developments, and Scenario 2 is akin to the BA coal resource development pathway (CRDP) which includes both current and proposed developments. Scenario 2 considers ten approved future open-cut mines and two underground coal mines and two CSG gas fields. The coal mines for the Scenario 2 configuration include Werris Creek Mine and extension, Boggabri Coal Mine and Boggabri Coal Expansion Project, Tarrawonga Mine and Tarrawonga Coal Expansion Project, Sunnyside Mine, Rocglen Mine, Canyon, Narrabri North, Maules Creek Mine, Watermark Coal Project and Caroona Coal Project. The CSG gas fields are Narrabri Gas Project and Santos Bando. The list of developments included in the NCWS Scenario 2 is slightly different to BA, in particular the addition of CSG extraction in the Bando trough. The Werris Creek Mine is not included in the BA modelling. Figure 7a and Figure 7b show the 0.2 and 2 m drawdown contours for both scenarios from the NCWS model. The GBRM (CDM Smith, 2014) similarly has a scenario that correlates with the BA baseline that includes the Narrabri North mine (NCM), and a scenario that

2.6.2.2 Review of existing models
Groundwater numerical modelling for the Namoi subregion | 29
Component 2: M
odel-data analysis for the Nam
oi subregion
correlates with the BA CRDP that includes both the Narrabri North mine and the CSG development (NCM-BC). Although this model is larger than the NCWS model it only includes those developments whose groundwater extraction interacts with that of the CSG production. The 0.5 and 2 m drawdown contours for both scenarios from the GBRM are shown in Figure 7c and Figure 7d. The only areas where these two model results can be directly compared is around the CSG development in the Pilliga. The NCWS has greater drawdown than the GBRM primarily because of the higher pumping rates imposed on the model.
Figure 7 Drawdown calculated by the Namoi Catchment Water Study (NCWS) model (SWS, 2012) and the Gunnedah Basin Regional Model (GBRM) (a) NCWS Scenario 1 and (b) NCWS Scenario 2 are akin to the bioregional assessment (BA) baseline and coal resource development pathway (CRDP), respectively. (c) GBRM simulation NCM and (d) GBRM simulation NCM-BC are akin to the BA baseline and CRDP, respectively. These drawdowns are for the surface and are the maximum for the period of simulation. Source: CDM Smith (2014), Data: Bioregional Assessment Programme (Dataset 1, Dataset 2)

2.6.2.2 Review of existing models
30 | Groundwater numerical modelling for the Namoi subregion
Com
pone
nt 2
: Mod
el-d
ata
anal
ysis
for t
he N
amoi
subr
egio
n References
AGE (2010) Continuation of Boggabri Coal Mine groundwater assessment. Australasian Groundwater & Environmental Consultants Pty Ltd, October 2010.
AGE (2011) Maules Creek Coal Project groundwater impact assessment. Australasian Groundwater & Environmental Consultants Pty Ltd, June 2011.
AGE (2013) Watermark Coal Project groundwater assessment. Australasian Groundwater & Environmental Consultants Pty Ltd, January 2013.
Aryal SK, Northey J, Slatter E, Ivkovic K, Crosbie R, Janardhanan S, Peña-Arancibia J and Bell J (2018) Observations analysis, statistical analysis and interpolation for the Namoi subregion. Product 2.1-2.2 for the Namoi subregion from the Northern Inland Catchments Bioregional Assessment. Department of the Environment and Energy, Bureau of Meteorology, CSIRO and Geoscience Australia, Australia. http://data.bioregionalassessments.gov.au/product/NIC/NAM/2.1-2.2.
CDM Smith (2014) Santos Narrabri Gas Project groundwater modelling report. CDM Smith Australia Pty Ltd, September 2014.
Crosbie R, Peeters L and Carey H (2016) Groundwater modelling. Submethodology M07 from the Bioregional Assessment Technical Programme. Department of the Environment and Energy, Bureau of Meteorology, CSIRO and Geoscience Australia, Australia. http://data.bioregionalassessments.gov.au/submethodology/M07.
Douglas Partners (2010) Hydrogeological assessment for Rocglen Coal Mine Extension Project. Douglas Partners, December 2010.
Harbaugh AW, Banta ER, Hill MC and McDonald MG (2000) MODFLOW-2000, the U.S. Geological Survey modular ground-water model – user guide to modularization concepts and the ground-water flow process. US Geological Survey Open-File Report. Viewed 21 April 2017, https://pubs.usgs.gov/of/2000/0092/report.pdf.
Heritage Computing (2012) A hydrogeological assessment in support of the Tarrawonga Coal Project environmental assessment. Heritage Computing Pty Ltd, January 2012.
Heritage Computing (2013) Vickery Coal Project groundwater assessment. Heritage Computing Pty Ltd, January 2013.
Hydro Simulations (2014) Caroona Coal Project: gateway application preliminary groundwater assessment. Heritage Computing Pty Ltd, March 2014.
Hydro Simulations (2015) Narrabri mine modification groundwater assessment. Heritage Computing Pty Ltd, August 2015.
McNeilage C (2006) Upper Namoi groundwater flow model, model development & calibration. NSW Government – Department of Natural Resources, Parramatta.

2.6.2.2 Review of existing models
Groundwater numerical modelling for the Namoi subregion | 31
Component 2: M
odel-data analysis for the Nam
oi subregion
Merrick N (2001) Report on Lower Namoi groundwater flow model: calibration 1980–1998. Project Number C99/44/001. Insearch Limited report for Department of Land & Water Conservation, Sydney.
Panday S and Huyakorn PS (2008) MODFLOW SURFACT: a state-of-the-art use of vadose zone flow and transport equations and numerical techniques for environmental evaluations. Vadose Zone Journal 7(2), 610. DOI: 10.2136/vzj2007.0052. Viewed 21 April 2017, https://dl.sciencesocieties.org/publications/vzj/abstracts/7/2/610.
RCA (2010) Groundwater impact assessment for Werris Creek Coal Mine Project. Robert Carr & Associates Pty Ltd, December 2010.
Santos (2013) Groundwater impact assessment. Narrabri Gas Project. Halcrow for Santos Limited.
SWS (2012) Namoi Catchment water study. Phase 3 report. Schlumberger Water Services. Viewed 25 November 2016, http://archive.lls.nsw.gov.au/__data/assets/pdf_file/0020/526430/archive_NCWS_Phase-3-report.pdf.
Welsh WD (2006) Great Artesian Basin transient groundwater model. Bureau of Rural Sciences, Canberra. Viewed 21 April 2017, http://www.southwestnrm.org.au/sites/default/files/uploads/ihub/welsh-wd-2006-great-artesian-basin-transient-groundwater-model.pdf.
Datasets
Dataset 1 Bioregional Assessment Programme (2016) Previous regional groundwater models within the NAM subregion. Bioregional Assessment Derived Dataset. Viewed 16 December 2016, http://data.bioregionalassessments.gov.au/dataset/f740efec-9f93-478f-80c8-3b67629860db.
Dataset 2 Bioregional Assessment Programme (2016) Namoi groundwater model alluvium extent. Bioregional Assessment Derived Dataset. Viewed 16 December 2016, http://data.bioregionalassessments.gov.au/dataset/e7e79c42-89aa-4278-b14c-d7c67ebd4d89.

2.6.2.2 Review of existing models
32 | Groundwater numerical modelling for the Namoi subregion
Com
pone
nt 2
: Mod
el-d
ata
anal
ysis
for t
he N
amoi
subr
egio
n
2.6.2.3 Model development
Groundwater numerical modelling for the Namoi subregion | 33
Component 2: M
odel-data analysis for the Nam
oi subregion
2.6.2.3 Model development
Summary
A regional-scale numerical groundwater model was built using the MODFLOW-USG code to evaluate the changes in groundwater due to additional coal resource development in the Namoi subregion.
The groundwater model consists of up to nine hydrostratigraphic layers with the alluvium, Pilliga Sandstone, Hoskissons Coal and Maules Creek Formation explicitly included and other formations lumped into interburden layers. The modelling domain spans an area of about 59,000 km2 with thickness exceeding 1500 m. It is represented by a variable Voronoi mesh with a resolution of 300 m around coal resource developments and streams, increasing to 3000 m in areas remote from the coal resource developments and streams.
2.6.2.3.1 Objectives
As stated in Section 2.6.2.1, the primary objective of bioregional assessment (BA) groundwater modelling is to quantify the changes in regional groundwater due to additional coal resource development, which is based on the difference in results between the baseline coal resource development (baseline) and coal resource development pathway (CRDP) simulations. A new regional-scale numerical groundwater model was deemed to be required for this purpose in the Namoi subregion. The main objectives of the regional groundwater model are:
• to assess the drawdown due to additional coal resource development at the model nodes and the corresponding year at which maximum change occurs by comparing the drawdown for the baseline and CRDP futures
• to provide the change in surface water – groundwater flux to the river model (reported in companion product 2.6.1 (Aryal et al., 2018b)).
A probabilistic approach of modelling is used which requires the groundwater model to be run thousands of times with different parameter combinations. This can have high computational overheads if the model domain is large and finely resolved. For the Namoi subregion, the modelling domain must encompass all the coal mines and coal seam gas (CSG) developments that are distributed across the subregion (see companion product 2.3 for more details on the coal resource development pathway (Herr et al., 2018)). Given this large domain and the requirement to do thousands of simulations, the groundwater model must be computationally efficient, represent just the key processes for a regional-scale assessment and have a spatial resolution appropriate for representing local- to regional-scale effects of coal resource development.
The model needs to represent the main causal pathway groups that link mine and CSG development hazards to groundwater responses on and off the mine sites (see companion product 2.3 for the Namoi subregion (Herr et al., 2018)):
• the ‘Subsurface depressurisation and dewatering’ causal pathway group, which involves subsurface depressurisation and dewatering from the excavation of coal seams, mine water pumping and CSG developments

2.6.2.3 Model development
34 | Groundwater numerical modelling for the Namoi subregion
Com
pone
nt 2
: Mod
el-d
ata
anal
ysis
for t
he N
amoi
subr
egio
n • the 'Subsurface physical flow paths’ causal pathway group, which involves changes in subsurface physical pathways due to hydraulic conductivity changes resulting from rock deformation due to mining
• the ‘Surface water drainage’ causal pathway group, which involves changes to surface water drainage through its interaction with groundwater.
Key outputs from the model are groundwater drawdowns and changes in surface water – groundwater exchanges, which are summarised as changes in key groundwater and surface water hydrological response variables at model nodes across the modelling domain (Section 2.6.2.1.2.1).
Drawdowns due to additional coal resource development are reported as probability distributions of the differences in drawdown between the CRDP and baseline simulations. The drawdowns are reported by the groundwater model at each model node in the model domain, but since most water-dependent assets access water that is at or near the ground surface in the alluvium and outcropping areas of other geological units, these shallow model nodes that comprise the regional watertable are the model nodes of greatest interest. In addition to the drawdown due to additional coal resource development at the model nodes, probabilistic maps of the drawdown under the baseline and under the CRDP are presented, as well as maps of the difference between the two futures for the regional watertable.
The groundwater model is also used to estimate the change in surface water – groundwater flux to propagate to the surface water models (companion product 2.6.1 for the Namoi subregion (Aryal et al., 2018b). The changes in baseflow from the CRDP and baseline simulations are used in the Namoi river model, where they are incorporated into the hydrological response variables generated as part of the surface water modelling (Aryal et al., 2018b).
Since the main objective of the BA numerical modelling is to quantify the difference between two modelled futures, the emphasis on producing a well-calibrated model is lower than if the objective were to predict the state of groundwater under baseline and under CRDP (Section 2.6.2.1.2). The principle of superposition enables the modelling to focus on the change in hydrogeological stress and the hydraulic properties, rather than on reproducing historical conditions or predicting future state variables of the system, such as groundwater levels or fluxes.
Probabilistic estimates of CSG water production rates and mine water makes are also provided by the groundwater model that are used in comparing the results to the water pumped reported by the proponents’ models (see Section 2.6.2.7). A more comprehensive discussion on the water balance components of the Namoi subregion is presented in companion product 2.5 (Crosbie et al., 2018).
2.6.2.3.2 Hydrogeological conceptual model
The conceptual understanding of the Namoi subregion is defined in companion product 2.1-2.2 (Aryal et al., 2018a) and companion product 2.3 (Herr et al., 2018) and summarised in Section 2.6.2.1. This section pertains to the conceptualisation of groundwater flow in the alluvial and deeper sedimentary layers in the parts of the Surat and Gunnedah basins that are included in the numerical groundwater modelling for the Namoi subregion. The main geological domains in the Namoi subregion are, from oldest to youngest, the Permian Gunnedah Basin, the Jurassic to

2.6.2.3 Model development
Groundwater numerical modelling for the Namoi subregion | 35
Component 2: M
odel-data analysis for the Nam
oi subregion
Cretaceous Surat Basin and the Cenozoic alluvium. Hydrogeology in this region can be conceptualised as consisting of three distinct but connected groundwater flow systems comprising shallow alluvial groundwater sources, deep groundwater sources primarily in the Pilliga Sandstone and other confined aquifers, and the surface water sources within the Namoi River and connected streams and creeks.
Quaternary-age alluvial deposits occur along the Namoi River and creeks feeding into the river. They are important sources of fresh groundwater for the subregion and have higher hydraulic conductivities than the underlying sedimentary rocks. The aquifers in the alluvium are major groundwater sources supporting agriculture in the Namoi subregion. The major regional groundwater source in the Surat Basin in the Namoi subregion is the Pilliga Sandstone. Hydrogeologically, sandstone formations typically act like aquifers (i.e. units capable of transmitting and storing useful quantities of groundwater), whereas shale and siltstone layers have hydraulic properties typical of aquitards. Non-alluvial near-surface rock units are typically more weathered and have higher hydraulic conductivities than deeper rock units and are commonly only partially saturated.
The subregion boundary to the eastern side is defined by the Hunter-Mooki Thrust Fault, which separates the geological Sydney Basin from the Gunnedah and Werrie basins (see Section 2.3.2.2.1 of companion product 2.3 for the Namoi subregion (Herr et al., 2018)). Since this is the edge of the basin, it is assumed to be a zero-flow boundary, as discussed further in Section 2.6.2.4. However, contouring of the base of the alluvial sediments indicates they form continuous units across the Hunter-Mooki Thrust Fault, extending beyond the eastern boundary of the Namoi subregion, similar to the surface water catchment. Regional-scale groundwater flow generally follows the direction of the topography from an east to north-westerly to westerly direction.
Losses from the Namoi River (including flood recharge) and irrigation recharge are the major inputs to the groundwater system in the Lower Namoi Alluvium. In Section 2.1.5 of Aryal et al. (2018a), river connectivity to the alluvial aquifers is described in detail. High levels of historical groundwater use have impacted on the surface water – groundwater interaction in Lower Namoi, converting the river to be a predominantly losing stream. CSIRO (2007) estimated that the total average impact on tributary streamflow by 2100 would be a loss to groundwater of 19 GL/year more than that included in the river planning models examined. Discharges of groundwater to gaining streams (i.e. baseflow) sustain flow in the Upper Namoi reaches where the watertable is shallow. Along the eastern extent of the Great Artesian Basin outcrop, it is considered that Pilliga Sandstone is providing baseflow to the river (Herczeg, 2008) but estimates of their contribution to total flow are highly variable. Because of this uncertainty, model parameters that control baseflow are varied in the uncertainty analysis (see Section 2.6.2.7).
Coal mining is undertaken using open-cut and longwall mining methods in the six major baseline mines and eight modelled additional coal resource developments of the Namoi subregion. These methods of coal extraction involve mine dewatering, resulting in aquifer depressurisation. The methods of extraction modify subsurface physical flow paths, particularly above longwall mines where hydraulic enhancement is an inevitable consequence of collapsing the longwall panels. The effects of these changes are drawdown of the watertable (and confined aquifers) and changes in the magnitude and timing of exchanges with streams that are connected to groundwater.
2.6.2.3 Model development
36 | Groundwater numerical modelling for the Namoi subregion
Com
pone
nt 2
: Mod
el-d
ata
anal
ysis
for t
he N
amoi
subr
egio
n Details of the datasets and data analyses that have informed the conceptualisation and development of the groundwater model are provided in Section 2.1.3 and Section 2.1.5 of companion product 2.1-2.2 for the Namoi subregion (Aryal et al., 2018a). They include the mapped extent of the Namoi alluvium (Section 2.1.3.1.3), the generation of a spatially varying rainfall-recharge surface for the subregion (Section 2.1.3.1.4), results from the analysis of hydraulic conductivity measurements by lithology (Section 2.1.3.1.2), and an assessment of the surface water – groundwater interactions (Section 2.1.5). Details of the mine footprints and flow rates (i.e. the assumed pumping rates to dewater mines) used to represent the hydrological changes due to mining are provided in Section 2.1.6.
2.6.2.3.3 Design and implementation
2.6.2.3.3.1 Geometry and hydrostratigraphy
Coal mining and CSG development activities in the Namoi subregion focus on the Hoskissons Coal and Maules Creek Formation in the Gunnedah Basin. The majority of groundwater-dependent assets in the Namoi subregion rely on water from the alluvial formations, Pilliga Sandstone or in the outcrop of other formations. Therefore, these formations were conceptualised as independent layers in the numerical groundwater model (Table 5). The Namoi alluvium was vertically discretised into two different model layers corresponding to the upper Narrabri and lower Gunnedah formations. Other Cretaceous-age formations that are present between the alluvium and Pilliga Sandstone are conceptualised as an interburden layer with depth-dependent hydraulic characteristics. Similarly, the formations between the Pilliga Sandstone and the Hoskissons Coal and between the Hoskissons Coal and Maules Creek Formation are represented in the numerical groundwater model by means of interburden layers with distinct effective hydraulic characteristics that vary with depth. A more detailed explanation of this depth-varying parameterisation is provided in Section 2.6.2.8.2.6. The basement rock under the Maules Creek Formation is represented by means of another layer in the numerical model layer. This resulted in a numerical model architecture with nine layers to represent the hydrostratigraphy. (Note that each interburden layer in the hydrostratigraphy consists of three numerical layers in the groundwater model to allow for the timing of drawdown to propagate vertically through the interburden.)

2.6.2.3 Model development
Groundwater numerical modelling for the Namoi subregion | 37
Component 2: M
odel-data analysis for the Nam
oi subregion
Table 5 Hydrostratigaphy of groundwater model for the Namoi subregion
Layer name Model layer
Geological units
Alluvium 1 1 Narrabri Formation
Alluvium 2 2 Gunnedah Formation Cubbaroo Formation
Interburden 1 3 Warrumbungle Volcanics Liverpool Range Volcanics Rolling Downs Group
Pilliga Sandstone 4 Pilliga Sandstone
Interburden 2 5 Purlawaugh Formation Garrawilla Volcanics Napperby and Deriah formations Black Jack Group – Coogal and Nea subgroups
Hoskissons Coal 6 Hoskissons Coal
Interburden 3 7 Black Jack Group – Brothers subgroup Watermark Formation Porcupine Formation
Maules Creek Formation 8 Maules Creek Formation
Basement 9 Boggabri Volcanics
Geological models identify more geologically distinct units in the Namoi subregion (see companion product 2.1-2.2 (Aryal et al., 2018a)), but building a numerical model with a minimum of one layer per distinct geological formation was deemed unnecessary for the BA modelling given that the vertical propagation of depressurisation into any layer depends only on the effective maximum vertical hydraulic conductivity across the underlying formations. Parsimony in vertical discretisation of the model was also useful for minimising the model run times and improving model stability that was required for running the model thousands of times as envisaged by the BA groundwater modelling methodology.
Each interburden layer is an accumulation of different geological layers, in some cases lumping aquifers with aquitards. This can be accommodated within the model by using a wide range in the parameterisation of the hydraulic properties, see Section 2.6.2.6 for more details. Discretisation of each interburden layer into three numerical model layers with spatially variable hydraulic characteristics also ensured that uncertainties in the hydraulic properties of the geologic formations in the Gunnedah and Surat basins could be evaluated during the uncertainty analysis.
The analysis done for the Narrabri Gas Project (CDM Smith, 2014) showed that faults are not important in the Namoi subregion for propagating drawdown between layers. The lack of hydrocarbon presence in the Surat sequence in this region and the sealing effect produced by the Napperby Formation shale in general indicates that faults may not act as conduits that can affect regional-scale drawdown prediction. Therefore there are no faults built into the model. However, further research is required to quantify the potential effect of geologic structures on the propagation of depressurisation impacts.

2.6.2.3 Model development
38 | Groundwater numerical modelling for the Namoi subregion
Com
pone
nt 2
: Mod
el-d
ata
anal
ysis
for t
he N
amoi
subr
egio
n 2.6.2.3.3.2 Model grid
The numerical model was built using MODFLOW-USG and uses unstructured Voronoi grids. The model cell size in plan view was chosen to be 300 m in the vicinity of the mines, CSG project area and river nodes, and up to 3 km elsewhere. The plan mesh is shown in Figure 8. The finer mesh clearly identifies the areas of mining and coal seam gas development within the Namoi subregion. Also visible is a higher density of elements along the river network. Smaller-sized Voronoi cells (distinct polygons/cells within the modelled area for which model inputs/parameters/outputs are defined) were included along the rivers to provide higher resolution output of the change in surface water – groundwater flux for input into the Australian Water Resources Assessment river model (AWRA-R) (see companion product 2.6.1 for the Namoi subregion (Aryal et al., 2018b)). The resulting mesh has 58,649 Voronoi cells in plan view, covering an area of approximately 59,000 km2. The number of cells in each model layer may be less than this number depending on the extent of each model layer which can be smaller than the entire model domain where layers are absent. Layers are absent in the numerical groundwater model where they do not exist, the most obvious example is the alluvium which only covers a fraction of the the model domain (Figure 9).
Figure 8 (a) Namoi subregion model grid and (b) detail around Watermark and Caroona coal mines with rivers shown Data: Bioregional Assessment Programme (Dataset 1, Dataset 2)
A plan view of the model grid is shown in Figure 9 highlighting the model layers that outcrop and a cross-section is shown in Figure 10 approximately following the river downstream. This shows that in the south the alluvium is sitting on the Gunnedah Basin layers but in the north the Pilliga Sandstone of the Surat Basin is in between the Gunnedah Basin layers and the alluvium.

2.6.2.3 Model development
Groundwater numerical modelling for the Namoi subregion | 39
Component 2: M
odel-data analysis for the Nam
oi subregion
Figure 9 Plan view of the surface layer of the numerical model grid of the bioregional assessment Namoi groundwater model Alluvium 2, Hoskissons Coal and basement do not outcrop so cannot be seen in this figure. Data: Bioregional Assessment Programme (Dataset 1)

2.6.2.3 Model development
40 | Groundwater numerical modelling for the Namoi subregion
Com
pone
nt 2
: Mod
el-d
ata
anal
ysis
for t
he N
amoi
subr
egio
n
Figure 10 Cross-section through the model domain showing the hydrostratigraphic layers used in the model Location of cross-section is shown on Figure 9. Data: Bioregional Assessment Programme (Dataset 1)
2.6.2.3.4 Model code and solver
The model was run using the MODFLOW-USG, the unstructured grid version of MODFLOW (Panday et al., 2013). Many local and regional groundwater models of CSG and coal mining in the Namoi subregion use versions of MODFLOW (see Section 2.6.2.2). MODFLOW-USG is an open-source code and meets the transparency requirements of BA. The code was assessed against the following criteria:
• open source and well tested – MODFLOW-USG is open source and has been used in many groundwater models
• able to run in batch-mode on high-performance computing clusters to complete the uncertainty analysis – multiple single-core MODFLOW-USG jobs may be submitted to compute clusters
• able to represent both fine spatial details horizontally around mines, as well as a large regional area – MODFLOW-USG can use an unstructured grid to capture spatial detail in plan (x, y) view
• able to enhance hydraulic conductivity around longwall mines – changes in the hydraulic properties above longwall mines caused by subsidence can be simulated in MODFLOW-USG using the Time Varying Materials package
• numerically stable so that certain parameter combinations encountered in the uncertainty analysis do not cause the program to crash – user experience with conventional MODFLOW is that sometimes-certain parameter sets cause it to fail. MODFLOW-USG has enhanced features and flexibility in the design of the model grid that helps to achieve better stability.
In conclusion, MODFLOW-USG has the features necessary to build a fit-for-purpose groundwater model of the Namoi subregion.
2.6.2.3 Model development
Groundwater numerical modelling for the Namoi subregion | 41
Component 2: M
odel-data analysis for the Nam
oi subregion
References
Aryal SK, Northey J, Slatter E, Ivkovic K, Crosbie R, Janardhanan S, Peña-Arancibia J and Bell J (2018a) Observations analysis, statistical analysis and interpolation for the Namoi subregion. Product 2.1-2.2 for the Namoi subregion from the Northern Inland Catchments Bioregional Assessment. Department of the Environment and Energy, Bureau of Meteorology, CSIRO and Geoscience Australia, Australia. http://data.bioregionalassessments.gov.au/product/NIC/NAM/2.1-2.2.
Aryal SK, Peña-Arancibia J, Viney N, Yang A, Wang B, Hughes J, Merrin LE, Marvanek S, Davies P, Bell J, Zhang Y, Vaze J, Singh R and Kim S (2018b) Surface water numerical modelling for the Namoi subregion. Product 2.6.1 for the Namoi subregion from the Northern Inland Catchments Bioregional Assessment. Department of the Environment and Energy, Bureau of Meteorology, CSIRO and Geoscience Australia, Australia. http://data.bioregionalassessments.gov.au/product/NIC/NAM/2.6.1.
CDM Smith (2014) Santos Narrabri Gas Project groundwater modelling report. CDM Smith Australia Pty Ltd, September 2014.
CSIRO (2007) Water availability in the Namoi. A report to the Australian Government from the CSIRO Murray-Darling Basin Sustainable Yields Project. CSIRO, Australia. Viewed 01 August 2016, https://publications.csiro.au/rpr/pub?list=SEA&pid=procite:e8a9a3fd-3db7-4b3e-2624 80f4-cfac36446bc5.
Crosbie R, Aryal SK, Janardhanan S and Peña-Arancibia J (2018) Water balance assessment for the Namoi subregion. Product 2.5 for the Namoi subregion from the Northern Inland Catchments Bioregional Assessment. Department of the Environment and Energy, Bureau of Meteorology, CSIRO and Geoscience Australia, Australia. http://data.bioregionalassessments.gov.au/product/NIC/NAM/2.5.
Herczeg AL (2008) Background report on the Great Artesian Basin, a report to the Australian government from the CSIRO Murray-Darling Basin Sustainable Yields Project. CSIRO, Australia.
Herr A, Northey J, Mitchell PJ, Aryal SK, Merrin LE and Slatter E (2018) Conceptual modelling for the Namoi subregion. Product 2.3 for the Namoi subregion from the Northern Inland Catchments Bioregional Assessment. Department of the Environment and Energy, Bureau of Meteorology, CSIRO and Geoscience Australia, Australia. http://data.bioregionalassessments.gov.au/product/NIC/NAM/2.3.
Panday S, Langevin CD, Niswonger RG, Ibaraki M and Hughes JD (2013) MODFLOW–USG version 1: an unstructured grid version of MODFLOW for simulating groundwater flow and tightly coupled processes using a control volume finite-difference formulation (No. 6-A45). US Geological Survey.
2.6.2.3 Model development
42 | Groundwater numerical modelling for the Namoi subregion
Com
pone
nt 2
: Mod
el-d
ata
anal
ysis
for t
he N
amoi
subr
egio
n Datasets
Dataset 1 Bioregional Assessment Programme (2016) Namoi groundwater model input shapefiles. Bioregional Assessment Derived Dataset. Viewed 16 December 2016, http://data.bioregionalassessments.gov.au/dataset/fb22671f-8b47-48e2-9fcd-232543fb8ad6.
Dataset 2 Bioregional Assessment Programme (2018) Namoi groundwater model mine footprints. Bioregional Assessment Derived Dataset. Viewed 13 March 2018, http://data.bioregionalassessments.gov.au/dataset/89e3501a-0c7a-426e-98ff-5c96f92673ea.

2.6.2.4 Boundary and initial conditions
Groundwater numerical modelling for the Namoi subregion | 43
Component 2: M
odel-data analysis for the Nam
oi subregion
2.6.2.4 Boundary and initial conditions
Summary
The eastern boundary of the Namoi subregion groundwater model is defined by the Hunter-Mooki Thrust Fault and is assumed to be impermeable. The northern boundary is also assumed to be a no-flow boundary as it is parallel to groundwater-flow direction in the Great Artesian Basin. Elsewhere the model domain extends beyond the subregion boundary in order to minimise boundary effects in the model results, and general-head boundary conditions are used.
The model’s land surface is subject to recharge due to rainfall, overbank flooding and irrigation. Recharge varies spatially and temporally. The land surface is also subject to a depth-dependent evapotranspiration boundary condition.
All major rivers, along with some minor reaches, are represented in the model. These represent the points at which the groundwater model interacts with the surface water model. This is a two-way exchange of water between models: when the river stage is above the watertable the river can leak to the groundwater, when the watertable is above the river stage the groundwater model will contribute baseflow to the river.
A total of 11,785 groundwater extraction bores are included in the model. Each is assumed to extract water according to its full entitlement.
2.6.2.4.1 Lateral
The model is a three-dimensional model with vertical sides. Its base is defined by the Namoi subregion bioregional assessment (BA) geological model (see companion product 2.1-2.2 (Aryal et al., 2018a) for more details) for the Surat and Gunnedah basins in the Namoi subregion (Bioregional Assessment Programme, Dataset 1). Its top is defined by the land topography (Caltech/JPL, Dataset 2).
The model’s outer boundary was chosen to extend beyond the outer boundary of the subregion and coincide with the preliminary assessment extent (PAE) in the northern direction. The limits of the model boundary have been selected to go beyond the expected hydraulic impacts of coal seam gas (CSG) development and coal mining in the Namoi subregion. The exception to this is in the eastern boundary where a natural boundary condition exists due to the presence of the Hunter-Mooki Thrust Fault.
2.6.2.4.1.1 East boundary
The eastern boundary of the groundwater model along the Hunter-Mooki Thrust Fault is assumed to be a no-flow boundary (Figure 11). There might be some groundwater flow across this boundary, particularly in the alluvium, but the flux and timing are uncertain. Assumption of a no-flow boundary is conservative and follows the BA groundwater modelling methodology (see companion submethodology M07 (as listed in Table 1) for groundwater modelling (Crosbie et al., 2016)). The implication of this assumption in the predictive modelling is that groundwater to the

2.6.2.4 Boundary and initial conditions
44 | Groundwater numerical modelling for the Namoi subregion
Com
pone
nt 2
: Mod
el-d
ata
anal
ysis
for t
he N
amoi
subr
egio
n east of the Hunter-Mooki Thrust Fault cannot contribute to the mining and CSG extractions, which if it was occurring would result in overprediction of drawdown at the model boundary.
2.6.2.4.1.2 North boundary
No-flow conditions are assumed for all model layers along the northern boundary of the model (Figure 11). The Gunnedah Basin units continue with the corresponding Bowen Basin units along this boundary. For the model layers corresponding to the Great Artesian Basin (GAB) aquifers and other Surat Basin units, this boundary is approximately aligned with the regional flow direction within the Coonamble Embayment of the GAB (Ransley and Smerdon, 2012).
Assignment of a no-flow boundary condition to the north of the model implies that water sources north of this boundary cannot contribute to the CSG and mine water extractions within the Namoi subregion. Given that this boundary is far away from any expected hydraulic head changes induced by the mining and CSG operations this boundary condition best reflects the current understanding of the flow in this region. This also follows the precautionary principle as drawdown effects in the Namoi subregion will be overstated as flow from the Surat and Bowen basins in the north would be prevented because of the no-flow assumption. More research is needed to improve the understanding of flow across this boundary.
2.6.2.4.1.3 North-west and west and south-east boundaries
The north-west boundary of the model is aligned along the extent of the PAE in this direction (Figure 11). This boundary slightly extends beyond the western extent of the Lower Namoi alluvium. The head-dependent flow boundary condition is used for the model layers that exist along the north-west boundary. Similarly, a general-head boundary was used for the model layers representing the units of the Surat Basin to characterise the flow boundary in the straight western edge of the model. The general-head boundary condition was also used to characterise the flow across the south-east boundary of the model. These model boundaries are expected to have no influence on the simulation of drawdown changes caused by the coal mining and CSG development because of the large distance (>100 km) of these boundaries from the coal resource development locations. The head-dependent boundary condition was simulated using MODFLOW’s general-head boundary (GHB) package. However, influence of the hydraulic characteristics of these boundaries are further tested and evaluated in a stress-test of the model, reported in Section 2.6.2.7.3.1, to explore the prediction uncertainty caused by the uncertainty in the parameters of the GHB package.

2.6.2.4 Boundary and initial conditions
Groundwater numerical modelling for the Namoi subregion | 45
Component 2: M
odel-data analysis for the Nam
oi subregion
Figure 11 Lateral boundaries of the groundwater model for the Namoi subregion Data: Bioregional Assessment Programme (Dataset 1)
2.6.2.4.2 Land surface fluxes
2.6.2.4.2.1 Recharge
There are three components to the recharge as applied to the Namoi subregion groundwater model, these are: diffuse recharge due to rainfall, flood recharge due to overbank flooding from the river, and irrigation recharge under areas that are irrigated. They were implemented in the model using the Recharge (RCH) package for MODFLOW-USG.
Rainfall recharge is spatially and temporally varying, reflecting spatial differences in near-surface geology and temporal variation in rainfall. The derivation of a mean annual recharge surface for the Namoi subregion using a chloride mass balance approach is described in Section 2.1.3 of companion product 2.1-2.2 for the Namoi subregion (Aryal et al., 2018a). The temporal variation of rainfall recharge is provided by the Australian Water Resources Assessment (AWRA) landscape model (AWRA-L) (see companion product 2.6.1 for the Namoi subregion for details (Aryal et al.,

2.6.2.4 Boundary and initial conditions
46 | Groundwater numerical modelling for the Namoi subregion
Com
pone
nt 2
: Mod
el-d
ata
anal
ysis
for t
he N
amoi
subr
egio
n 2018b)). This is normalised so its average throughout the period 1983 to 2012 is 1, and the resultant time series is multiplied by the spatial variation from the chloride mass balance to yield the final spatial and temporally varying recharge as applied to the model (more details of this process are in Crosbie et al. (2015)).
In addition to the rainfall recharge, groundwater inflows from flood and irrigation recharge were added to the recharge package. The depth of flood and irrigation recharge is calculated on a daily time step at the reach scale in the AWRA river model (AWRA-R) (for details see companion product 2.6.1 for the Namoi subregion (Aryal et al., 2018b)). The reaches that contain floodplain and irrigation areas are shown in Figure 12. Flood and irrigation recharge are applied to the groundwater model cells that are contained within the floodplain and irrigation areas.
Recharge is applied as a source of water of prescribed rate to the land surface of the model. To account for uncertainties in both the temporal and spatial variation of recharge, its magnitude is varied in the uncertainty analysis for each of the three components (see companion submethodology M07 (as listed in Table 1) for groundwater modelling (Crosbie et al., 2016)).

2.6.2.4 Boundary and initial conditions
Groundwater numerical modelling for the Namoi subregion | 47
Component 2: M
odel-data analysis for the Nam
oi subregion
Figure 12 Location of the floodplain (blue) where flood recharge is added and the areas under irrigation (green) where irrigation recharge is added to the model for the Namoi subregion AWRA-R = Australian Water Resources Assessment river model Data: Bioregional Assessment Programme (Dataset 1)
2.6.2.4.2.2 Evapotranspiration
Evapotranspiration is represented by a sink of groundwater applied across the entire land surface of the model using the EVT package in MODFLOW-USG. Generally in groundwater models, evapotranspiration from groundwater is assumed to be a maximum when the watertable is at ground surface, or above it (e.g. in the case of ponding). Conversely, evapotranspiration from groundwater is generally assumed to be zero when the watertable is deep below the ground surface where plant roots cannot draw water from the deep groundwater reserves. There is an analysis of the depth to watertable for the Namoi subregion in companion product 2.1-2.2 (Aryal et al., 2018a) which is indicative of where an evapotranspiration flux from groundwater may be significant. The maximum evapotranspiration rate was set as a constant across the model domain and the extinction depth was related to the vegetation height using the assumption that taller vegetation have deeper roots. The extinction depth was calculated as a quarter of the vegetation

2.6.2.4 Boundary and initial conditions
48 | Groundwater numerical modelling for the Namoi subregion
Com
pone
nt 2
: Mod
el-d
ata
anal
ysis
for t
he N
amoi
subr
egio
n height (Figure 13) plus 1, this means that with 40 m vegetation height there is an extinction depth of 11 m and for vegetation that has zero height (i.e. bare ground) there is an extinction depth of 1 m.
Figure 13 Vegetation height used as a determinant in the extinction depth of evapotranspiration from groundwater in the Namoi subregion Data: Caltech/JPL (Dataset 2)
2.6.2.4.3 Surface water – groundwater interactions
2.6.2.4.3.1 Geometry
All major rivers (54 reaches) within the Namoi subregion (Geoscience Australia, Dataset 4) are represented in the model. Some additional small reaches were added to ensure that change in surface water – groundwater flux could be generated along rivers represented in the AWRA-R node-link network. The polylines used to define the locations of rivers in the groundwater model are shown in Figure 14.

2.6.2.4 Boundary and initial conditions
Groundwater numerical modelling for the Namoi subregion | 49
Component 2: M
odel-data analysis for the Nam
oi subregion
Figure 14 The river network as implemented in the groundwater model in the Namoi subregion Also shown are the Australian Water Resources Assessment river model (AWRA-R) catchments (red lines) and the surface water nodes (yellow dots) where the change in surface water – groundwater flux is aggregated. Data: Bioregional Assessment Programme (Dataset 1)
The River (RIV) package for MODFLOW-USG uses a series of model cells to represent the river boundary condition. Close to the CSG and coal mining developments the model was discretised as 300 m cells. In these regions, the river was decomposed into a sequence of points, spaced at 300 m intervals. This means surface water – groundwater flux is recorded only at 300 m intervals, rather than continuously along a river reach. The parameters necessary for the RIV package are stage height, conductance and river-bed geometry.
A steady-state river stage for the first stress period of the model was implemented based on average river stages for the historical period (1983–2012). The steady-state stages were interpolated from measurements obtained at 54 gauge sites located within the model domain (Figure 14). Transient river stages at the 54 gauges were derived from rating curves based on historical records and the flow volumes from the surface water modelling.

2.6.2.4 Boundary and initial conditions
50 | Groundwater numerical modelling for the Namoi subregion
Com
pone
nt 2
: Mod
el-d
ata
anal
ysis
for t
he N
amoi
subr
egio
n Another key controlling parameter is the riverbed conductance, CRIV, which is defined as follows:
CRIV𝑛𝑛 = 𝐾𝐾𝑛𝑛𝐿𝐿𝑛𝑛𝑊𝑊𝑛𝑛
𝑀𝑀𝑛𝑛 (1)
where Kn and Mn represent the hydraulic conductivity and thickness of the riverbed, respectively, and Ln and Wn represent the length and width of the river reach at node n, respectively (Harbaugh, 2005). Due to a lack of data in the Namoi subregion, hydraulic conductivity of the riverbed was initially assigned values that range from 1e–6 to 1e0 m/day. Since the gaining and losing nature of a river depends largely on the relative elevation of the river stage with respect to the groundwater level in the watertable aquifer, depth of the riverbed below the land surface was identified as the most important parameter that influences the surface water – groundwater connectivity in the Namoi subregion. This was further tested in the groundwater model stress-test and is reported in Section 2.6.2.7.
It is widely accepted that riverbed hydraulic conductivity is primarily a function of reach geometry, streamflow velocity, composition and erodibility of catchment, and bed disturbance frequency (Stewardson et al., 2016). The riverbed hydraulic conductivity generally increases with riverbed slope when other factors are similar (Pérez-Paricio et al., 2010). The current study explored the conceptualisation of hydraulic conductivity variation in direct relationship with the riverbed slope. However, it was found that the surface water – groundwater interaction was mostly sensitive to the depth of the river bottom in relation to the groundwater level in the watertable aquifer.
Depth of the river bottom was considered to vary between 2 to 15 m below the model’s topography. This is for two reasons. Firstly, rivers tend to incise channels below the land surface at a scale that may be too fine to be represented in the 3-second digital elevation model (Geoscience Australia, Dataset 4) used to define the surface topography. At some points on the river network, surveyed information has been recorded that could be used instead, but this is not available for most of the river network. Secondly, the model further discretises this digital elevation model with resolution as coarse as 3 km, so many points at their true elevation according to the digital elevation model would lie outside the model domain (above the model topography). For these two reasons, it is appropriate to shift the riverbed’s vertical position downwards in relation to the land surface in the model. This shift is varied in the uncertainty analysis.
2.6.2.4.3.2 AWRA-R baseflows
The river model contains 54 nodes at which the groundwater model can provide change in surface water – groundwater flux estimates. Nodes mostly correspond to streamflow gauging stations, but some nodes have been included specifically for assessing hydrological changes in response to coal resource development under the baseline and under the CRDP. The baseflows (positive) and leakages (negative) are summed for all the points in the link upstream of a node in order to calculate the total change in surface water – groundwater flux at the node. The numerical implementation of the groundwater model runs using nominal monthly time steps, so can only provide a monthly time series of change in surface water – groundwater flux. The river model runs using daily time steps, and the groundwater model results are interpolated linearly to provide this.

2.6.2.4 Boundary and initial conditions
Groundwater numerical modelling for the Namoi subregion | 51
Component 2: M
odel-data analysis for the Nam
oi subregion
2.6.2.4.4 Bore extraction
The Namoi subregion contains many bores licensed to extract groundwater (Bioregional Assessment Programme, Dataset 1). After removing points that lie outside the model domain and those associated with mine licence volumes which are already accounted for in the model via the water makes (Section 2.6.2.5), 11,785 production bores were represented in the model (Figure 15) (Bioregional Assessment Programme, Dataset 1).
Figure 15 Extraction bores that have their pumping included in the groundwater model for the Namoi subregion Data: Bioregional Assessment Programme (Dataset 1)
Bioregional Assessment Programme (Dataset 3) provides information on the category of the bore (e.g. licence type such as ‘Basic Right’ or ‘Supplementary’), the groundwater source targeted, and the licensed extraction volume (ML/year). The actual time series of extraction from 1983–2012 is not known as metering of bores has only been available for a fraction of this time and not all bores are required to be metered (e.g. stock and domestic bores).

2.6.2.4 Boundary and initial conditions
52 | Groundwater numerical modelling for the Namoi subregion
Com
pone
nt 2
: Mod
el-d
ata
anal
ysis
for t
he N
amoi
subr
egio
n In the Bioregional Assessment Programme (Dataset 3), bores are assigned to a groundwater source (through the ‘WATER.SOURCE’ column). Table 6 gives the relationship between groundwater sources and layers within the groundwater model. This indicates where extraction rates for stock and domestic bores and licensed extraction bores were assigned within the model.
Table 6 Groundwater source and related model layer for the Namoi subregion
Groundwater source Model layer (actual formation name)
Liverpool Ranges Basalt MDB Interburden 1
Gunnedah – Oxley Basin MDB Interburden 2
Warrumbungle Basalt Interburden 1
Southern Recharge Pilliga Sandstone
Surat Pilliga Sandstone
Great Artesian Basin Surat Shallow Interburden 1
Currabubula Alluvial Alluvium: The depth of the bore was then used to determine which alluvium layer the bore was assigned to: • Alluvium 1 – bore depth 0–45 m below ground surface • Alluvium 2 – bore depth greater than 45 m below ground surface
Quipolly Alluvial
Quirindi Alluvial
Lower Namoi
Upper Namoi – zones 1 to 11
MDB = Murray–Darling Basin
The majority of extractions are from the two alluvial formations (Peña-Arancibia et al., 2016). These extractions are potentially the greatest sink of groundwater in the region (apart from natural evapotranspiration), so represent a significant source of uncertainty in the water balance. Groundwater-use data come from metering in some groundwater sources, for example all licensed bores in the Upper Namoi water sources (approximately 1100 bores) (Barrett, 2010) are metered. However, metering of groundwater extraction is not yet mandatory across all groundwater sources (NSW Office of Water, 2012b). Metering is not required for stock and domestic bores (license type ‘basic right’), meaning that basic right volumes are estimated.
Basic right (stock and domestic) extraction volumes were estimated for the groundwater model as shown in Table 7. The ‘Stock and domestic right estimate’ values (second column) are drawn from the relevant water sharing plans. The total number of stock and domestic bores in each groundwater source (third column) comes from the Bioregional Assessment Programme (Dataset 3), from which the number of bores with a ‘Category’ column equal to ‘Basic Right’ was calculated for each groundwater source. The basic right extraction rate for each groundwater source (fourth column) was then estimated as equal to the second column divided by the third column (stock and domestic right estimate divided by the number of stock and domestic bores within the source). The extraction rate for each groundwater source was then assigned to all ‘basic right’ bores in that groundwater source.
It may be noted that these extraction rates are based on the basic right extraction volumes estimated from the water sharing plan rather than the actual extraction rates. The actual extraction rate can be much smaller than this value particularly for some of the sources like the

2.6.2.4 Boundary and initial conditions
Groundwater numerical modelling for the Namoi subregion | 53
Component 2: M
odel-data analysis for the Nam
oi subregion
Surat. Interested readers are referred to companion product 1.5 for the Namoi subregion (Peña-Arancibia et al., 2016) for the details.
Table 7 Estimation of extraction rates from stock and domestic bores in the Namoi subregion
Groundwater source Stock and domestic right estimate
and/or licensed entitlementa (ML/y)
Number of bores listed with
'Category' as 'basic right'b
Estimated extraction rate per bore (ML/y)
Great Artesian Basin Surat Shallow 978 652 1.5
Surat 28,100 1138 24.69
Southern Recharge 3,000 3498 0.86
Gunnedah – Oxley Basin MDB 5,778 3395 1.70
Liverpool Ranges Basalt MDB 1,828 445 4.11
Warrumbungle Basalt 540 109 4.95
Currabubula Alluvial 17.8 16 1.11
Quipolly Alluvial 3.9 19 0.21
Quirindi Alluvial 14.1 30 0.47
Lower Namoi 3,304 1282 2.58
Zone 1, Borambil Creek 39 64 0.61
Zone 2, Coxs Creek (Mullaley to Boggabri) 359 158 2.27
Zone 3, Mooki Valley (Breeza to Gunnedah) 470 360 1.31
Zone 4, Namoi Valley (Keepit Dam to Gins Leap) 667 525 1.27
Zone 5, Namoi Valley (Gins Leap to Narrabri) 262 347 0.76
Zone 6, Tributaries of the Liverpool Range (south to Pine Ridge Road)
274 178 1.54
Zone 7, Yarraman Creek (east of Lake Goran to Mooki River)
89 33 2.70
Zone 8, Mooki Valley (Quirindi – Pine Ridge Road to Breeza)
166 173 0.96
Zone 9, Coxs Creek (upstream Mullaley) 187 68 2.75
Zone 10, Warrah Creek 36 27 1.33
Zone 11, Maules Creek 210 141 1.49 aStock and domestic usage estimates for each groundwater source were taken from the relevant water sharing plans. bNumber of basic right bores was calculated from the Bioregional Assessment Programme (Dataset 3). MDB = Murray–Darling Basin Source: Burrell et al. (2014); NSW Government (2003); NSW Department of Water and Energy (2009); NSW Office of Water (2011, 2012a, 2012b, 2013) Data: Bioregional Assessment Programme (Dataset 3)
For all other bores, the ‘entitlement volume’ provided in Bioregional Assessment Programme (Dataset 3) was used as the extraction rate. A constant rate of extraction is assumed over the simulation period 1983 to 2102. As the timing of extractions is not recorded for each bore, the simplistic assumption is made that the full entitlement is extracted at a uniform rate over the year at each bore. Groundwater extractions are the same under the baseline and under the CRDP.

2.6.2.4 Boundary and initial conditions
54 | Groundwater numerical modelling for the Namoi subregion
Com
pone
nt 2
: Mod
el-d
ata
anal
ysis
for t
he N
amoi
subr
egio
n As demonstrated in Peña-Arancibia et al. (2016) licensed extraction volumes (entitlement volumes) are, on average, significantly higher than actual use volumes, and entitlement volumes are currently in a process of adjustment (generally decreasing) through the implementation of water sharing plans. For example, the ongoing program of reducing groundwater entitlement volumes has meant that the entitlement volume for all ‘Supplementary Water’ licenses has been reduced to zero from the start of the 2015–2016 water year. Due to these factors and the inherent uncertainty in quantifying unmetered extraction volumes, there will be some impact on the ability of historic and future modelling to accurately represent the water balance within the subregion.
2.6.2.4.5 Initial conditions
The transient simulation of the model is for a period between 1983 to 2102. This corresponds to a baseline simulation period between 1983 and 2012 and a simulation period of 90 years to evaluate the effects of additional coal resource development from 2012 to 2102. The initial conditions prior to 1983 are obtained using a steady-state simulation of the model. Long-term average river stages obtained from the AWRA-R simulation were used to define the river boundary for this simulation. The groundwater pumping as reported in Section 2.6.2.4.4 was not included in this steady-state simulation. This is because these relatively high rates are known to correspond to an unsteady state and would result in substantially lower water levels particularly in the alluvial aquifers if used in the steady-state simulation. However, it is acknowledged that this representation does not capture the agricultural extraction from the 1970s onwards and this can have an effect on the water levels in the alluvial aquifers. For this reason, the comparison of the model predictions to observations to constrain the simuations was performed only for the period starting from 1993.
The first stress-period of the model used this steady-state simulation to obtain the initial conditions that were used for the subsequent transient simulations. Thus distinct steady-steate initial conditions were obtained for every model simulation with a distinct set of model parameters.
References
Aryal SK, Northey J, Slatter E, Ivkovic K, Crosbie R, Janardhanan S, Peña-Arancibia J and Bell J (2018a) Observations analysis, statistical analysis and interpolation for the Namoi subregion. Product 2.1-2.2 for the Namoi subregion from the Northern Inland Catchments Bioregional Assessment. Department of the Environment and Energy, Bureau of Meteorology, CSIRO and Geoscience Australia, Australia. http://data.bioregionalassessments.gov.au/product/NIC/NAM/2.1-2.2.
Aryal SK, Peña-Arancibia J, Viney N, Yang A, Wang B, Hughes J, Merrin LE, Marvanek S, Davies P, Bell J, Zhang Y, Vaze J, Singh R and Kim S (2018b) Surface water numerical modelling for the Namoi subregion. Product 2.6.1 for the Namoi subregion from the Northern Inland Catchments Bioregional Assessment. Department of the Environment and Energy, Bureau of Meteorology, CSIRO and Geoscience Australia, Australia. http://data.bioregionalassessments.gov.au/product/NIC/NAM/2.6.1.

2.6.2.4 Boundary and initial conditions
Groundwater numerical modelling for the Namoi subregion | 55
Component 2: M
odel-data analysis for the Nam
oi subregion
Barrett C (2010) Upper Namoi groundwater sources – resource condition assessment report. NSW Department of Environment, Climate Change and Water, Office of Water, Sydney.
Burrell M, Moss P, Petrovic J and Ali A (2014) General purpose water accounting report 2012–2013: Namoi Catchment. NSW Department of Primary Industries, Sydney.
Crosbie R, Raiber M, Cui T and Viney N (2015) Blending field observations and AWRA outputs for groundwater recharge estimation in a coal basin in eastern Australia. MODSIM 2015. Viewed 8 December 2016, http://www.mssanz.org.au/modsim2015/L2/crosbie.pdf.
Crosbie R, Peeters L and Carey H (2016) Groundwater modelling. Submethodology M07 from the Bioregional Assessment Technical Programme. Department of the Environment and Energy, Bureau of Meteorology, CSIRO and Geoscience Australia, Australia. http://data.bioregionalassessments.gov.au/submethodology/M07.
Harbaugh AW (2005) MODFLOW-2005, The U.S. Geological Survey modular ground-water model - The ground-water flow process. Viewed 8 December 2016, http://pubs.water.usgs.gov/tm6a16.
NSW Department of Water and Energy (2009) Water Sharing Plan: NSW Great Artesian Basin Groundwater Sources – background document. Viewed 8 March 2015, http://www.water.nsw.gov.au/ArticleDocuments/34/wsp_nsw_gab_background.pdf.aspx.
NSW Government (2003) Water Sharing Plan for the Upper and Lower Namoi Groundwater Sources. Viewed 7 March 2015, http://www.legislation.nsw.gov.au/viewtop/inforce/subordleg+1035+2002+FIRST+0+N/.
NSW Office of Water (2011) Water Sharing Plan for the NSW Great Artesian Basin Shallow Groundwater Sources – background document. Viewed 8 March 2015, http://www.water.nsw.gov.au/ArticleDocuments/34/wsp_nsw_great_artesian_basin_shallow_groundwater_sources_background.pdf.aspx.
NSW Office of Water (2012a) Water Sharing Plan for the Murray-Darling Basin Fractured Rock Groundwater Sources – background document. Viewed 8 March 2015, http://www.water.nsw.gov.au/ArticleDocuments/34/wsp_murray_darling_basin_fractured_rock_groundwater_background.pdf.aspx.
NSW Office of Water (2012b) Water Sharing Plan for the Murray-Darling Basin Porous Rock Groundwater Sources – background document. Viewed 8 March 2015, http://www.water.nsw.gov.au/ArticleDocuments/34/wsp_murray_darling_basin_porous_rock_groundwater_background.pdf.aspx.
NSW Office of Water (2013) Water Sharing Plan for the Namoi Unregulated and Alluvial Water Sources – background document. Viewed 16 September 2015, http://www.water.nsw.gov.au/__data/assets/pdf_file/0011/549047/wsp_namoi_unreg_alluvial_background_document.pdf.

2.6.2.4 Boundary and initial conditions
56 | Groundwater numerical modelling for the Namoi subregion
Com
pone
nt 2
: Mod
el-d
ata
anal
ysis
for t
he N
amoi
subr
egio
n Peña-Arancibia J, Slatter E, Northey J and Cassel R (2016) Current water accounts and water quality for the Namoi subregion. Product 1.5 for the Namoi subregion from the Northern Inland Catchments Bioregional Assessment. Department of the Environment, Bureau of Meteorology, CSIRO and Geoscience Australia, Australia. Viewed 30 May 2017, http://data.bioregionalassessments.gov.au/product/NIC/NAM/1.5.
Pérez-Paricio A, Hunink JE, Kupper E and Raso Quintana J (2010) Estimation of the river conductance coefficient using streambed slope for modeling of regional river-aquifer interaction. Proceedings, 18th International Conference on Water Resources. International Center for Numerical Methods in Engineering, Barcelona, Spain, 1–9.
Ransley TR and Smerdon BD (eds) (2012) Hydrostratigraphy, hydrogeology and system conceptualisation of the Great Artesian Basin. A technical report to the Australian Government from the CSIRO Great Artesian Basin Water Resource Assessment. CSIRO Water for a Healthy Country Flagship, Australia.
Stewardson MJ, Datry T, Lamouroux N, Pella H, Thommeret N, Valette L and Grant SB (2016) Variation in reach-scale hydraulic conductivity of streambeds. Geomorphology 259, 70–80. Viewed 29 November 2016, http://dx.doi.org/10.1016/j.geomorph.2016.02.001.
Datasets
Dataset 1 Bioregional Assessment Programme (2016) Namoi groundwater model input shapefiles. Bioregional Assessment Derived Dataset. Viewed 16 December 2016, http://data.bioregionalassessments.gov.au/dataset/fb22671f-8b47-48e2-9fcd-232543fb8ad6.
Dataset 2 Caltech/JPL (2014) Vegetation height for Australia (Simard). Bioregional Assessment Source Dataset. Viewed 20 December 2016, http://data.bioregionalassessments.gov.au/dataset/09f0ceb4-d401-410c-bd4f-dfbc5276ef8b.
Dataset 3 Bioregional Assessment Programme (2014) NSW Office of Water Groundwater licences extract linked to spatial locations NIC v3 (13 March 2014). Bioregional Assessment Derived Dataset. Viewed 10 November 2015, http://data.bioregionalassessments.gov.au/dataset/b0ea1363-4603-463a-b82e-fc586db6b967.
Dataset 4 Geoscience Australia (2010) Geoscience Australia, 3 second SRTM Digital Elevation Model (DEM) v01. Bioregional Assessment Source Dataset. Viewed 10 November 2015, http://data.bioregionalassessments.gov.au/dataset/12e0731d-96dd-49cc-aa21-ebfd65a3f67a.

2.6.2.5 Implementation of the coal resource development pathway
Groundwater numerical modelling for the Namoi subregion | 57
Component 2: M
odel-data analysis for the Nam
oi subregion
2.6.2.5 Implementation of the coal resource development pathway
Summary
Groundwater modelling is undertaken for 12 coal resource development pathway mines and 1 coal seam gas development, comprising 5 baseline mines and 8 additional coal resource developments. The Caroona Coal Project is included in the modelling of the coal resource development pathway based on the information available at the time of commencement of the bioregional assessment work. However, the latest available information is that this mining project is cancelled and the impact predictions provided in this report are redundant. One baseline and two additional coal resource developments were not modelled due to lack of data or scale of proposed change.
The spatial extent of each mine working is represented in the model by its footprint and varies through time. Each working is associated with a coal seam, which defines its depth. Footprints were obtained from a number of sources. Each development is included in the model as a head-dependent boundary which results in the water produced being dependent upon the model parameters rather than an imposed stress.
Hydraulic enhancement above longwall mines is implemented over the mine footprint and the change is assumed to be permanent. The magnitude of and depths over which hydraulic enhancement occur is uncertain and the parameters that govern these terms are varied in the uncertainty analysis.
Baseline coal mines and additional coal resource development were defined in Section 2.3.4 of companion product 2.3 for the Namoi subregion (Herr et al., 2018) and are summarised in Table 8 and shown in Figure 16. The baseline includes six coal mines; the additional coal resource development includes nine coal mines and one coal seam gas (CSG) development. Due to insufficient data or insignificant changes in mine pumping rates from additional coal resource development, two coal mines in the additional coal resource development were not included in the groundwater modelling. Of the baseline coal mines, Werris Creek Mine is not modelled because it belongs to a geologically separate basin (Werrie Basin). For the 12 modelled mines and 1 CSG development, each has to be defined in terms of its location, type of operation (open-cut, underground or CSG), area, depth (seam) and depth of excavation. A few parameters also need to be defined to characterise changes in the hydraulic conductivity of units above and below the mine workings as a consequence of mining. For the one CSG development, the spatial extent, target formation depth and proposed depressurisation need to be defined.
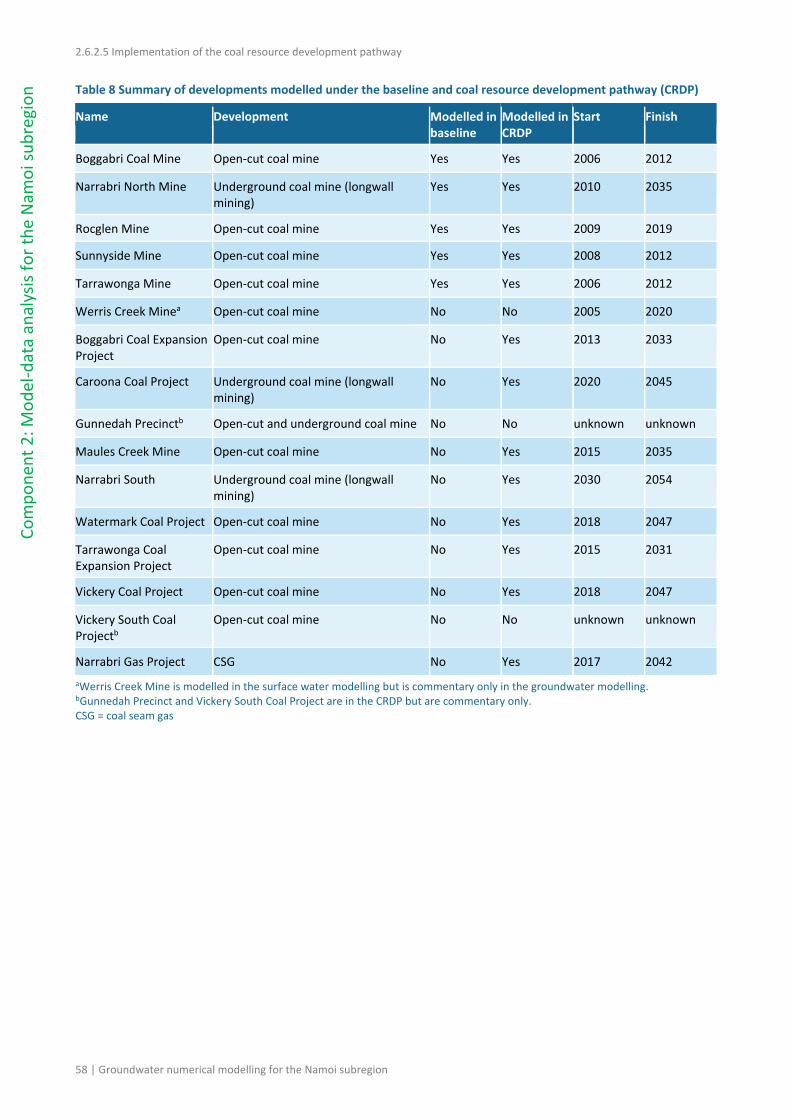
2.6.2.5 Implementation of the coal resource development pathway
58 | Groundwater numerical modelling for the Namoi subregion
Com
pone
nt 2
: Mod
el-d
ata
anal
ysis
for t
he N
amoi
subr
egio
n Table 8 Summary of developments modelled under the baseline and coal resource development pathway (CRDP)
Name Development Modelled in baseline
Modelled in CRDP
Start Finish
Boggabri Coal Mine Open-cut coal mine Yes Yes 2006 2012
Narrabri North Mine Underground coal mine (longwall mining)
Yes Yes 2010 2035
Rocglen Mine Open-cut coal mine Yes Yes 2009 2019
Sunnyside Mine Open-cut coal mine Yes Yes 2008 2012
Tarrawonga Mine Open-cut coal mine Yes Yes 2006 2012
Werris Creek Minea Open-cut coal mine No No 2005 2020
Boggabri Coal Expansion Project
Open-cut coal mine No Yes 2013 2033
Caroona Coal Project Underground coal mine (longwall mining)
No Yes 2020 2045
Gunnedah Precinctb Open-cut and underground coal mine No No unknown unknown
Maules Creek Mine Open-cut coal mine No Yes 2015 2035
Narrabri South Underground coal mine (longwall mining)
No Yes 2030 2054
Watermark Coal Project Open-cut coal mine No Yes 2018 2047
Tarrawonga Coal Expansion Project
Open-cut coal mine No Yes 2015 2031
Vickery Coal Project Open-cut coal mine No Yes 2018 2047
Vickery South Coal Projectb
Open-cut coal mine No No unknown unknown
Narrabri Gas Project CSG No Yes 2017 2042 aWerris Creek Mine is modelled in the surface water modelling but is commentary only in the groundwater modelling. bGunnedah Precinct and Vickery South Coal Project are in the CRDP but are commentary only. CSG = coal seam gas

2.6.2.5 Implementation of the coal resource development pathway
Groundwater numerical modelling for the Namoi subregion | 59
Component 2: M
odel-data analysis for the Nam
oi subregion
Figure 16 Location of developments listed in the coal resource development pathway that have been modelled ACRD = additional coal resource development Data: Bioregional Assessment Programme (Dataset 1, Dataset 2)
2.6.2.5.1 Spatial extent
For the groundwater modelling, a ‘mine footprint’ represents the area of mining only. That is, the footprint involves only the open-pit or longwall panels, and does not include site facilities or other changes at the surface. Thus, the mine footprints for groundwater modelling are not always the same as those used in the surface water modelling, which include all areas where surface water drainage is disrupted, such as from site facilities, water storages, drainage diversions, spoil heaps and roads (see companion product 2.1-2.2 (Aryal et al., 2018a), companion product 2.3 (Herr et al., 2018) and companion product 2.6.1 (Aryal et al., 2018b) for the Namoi subregion). Similarly, the spatial extent of the CSG development is the location of the extraction wells but does not include the site works and pipelines.
2.6.2.5 Implementation of the coal resource development pathway
60 | Groundwater numerical modelling for the Namoi subregion
Com
pone
nt 2
: Mod
el-d
ata
anal
ysis
for t
he N
amoi
subr
egio
n Mine workings, whether they are open-cut or longwall, are represented by georeferenced polygons, which locate the ‘mine’ cells within the plan model grid. As stated in Section 2.6.2.3.3.2, the plan mesh conforms, where possible, to the mine polygons.
Mine footprints were obtained from a number of sources, including existing digital data from some mining companies and the NSW Department of Trade and Investment, and footprints digitised specifically for the project from Landsat TM images of open-cut mines or from maps published in mine environmental impact statements (EISs). Details of the source data can be found in Section 2.1.6 of companion product 2.1-2.2 for the Namoi subregion (Aryal et al., 2018a).
In all, 12 mine footprint polygons and 1 CSG development footprint were used to define the coal resource development areas for the coal resource development pathway (CRDP) in the Namoi subregion for groundwater modelling. The full extent of mining footprints is shown in Figure 33 in Section 2.3.4 of companion product 2.3 for the Namoi subregion (Herr et al., 2018).
2.6.2.5.2 Mine and coal seam gas groundwater extractions as drain boundary condition
In order to model the extraction of groundwater from mine workings and CSG development wells, the MODFLOW Drain (DRN) package is used. The DRN package uses a head-dependent flux boundary condition that removes water from the model cells that represent the coal mines and the CSG wells. In the case of open-cut coal mines, the drain boundary condition is applied to all model cells of all layers in and above the target coal seam that are within the mine footprints. In the case of longwall mines, the drain boundary condition is applied only to the model layer corresponding to the Hoskissons Coal which is the target formation for the three longwall-mining projects in the Namoi subregion. However, the hydraulic properties of the overburden material above the longwall panels are progressively changed over the simulation period to reflect hydraulic conductivity enhancement as reported in Section 2.6.2.5.3. In the case of CSG wells, the drain boundary condition is applied to the model cells within which a proposed CSG well of the Narrabri Gas Project is present. A specified flow rate is not used in defining the mine and CSG extractions because of the large uncertainty in those flow rates. By using the DRN package for representing the mine and CSG water extractions it is possible to parameterise the drain conductance using a wide range of values over multiple model runs and thus explore the uncertainty in the mine water makes and produced water and the resulting impact on drawdown distribution. This approach also enables constraining the groundwater model using the historical mine water makes and produced water during uncertainty analysis rather than forcing the mine water make and produced water as a specified input.
The flow rate time series generated for baseline and CRDP mines are provided in Section 2.1.6 of companion product 2.1-2.2 for the Namoi subregion (Aryal et al., 2018a).
2.6.2.5.3 Temporal extent
The mine footprint varies over the life of the mine for most of the mines. When available, a 5-yearly time series of the footprint was used in the groundwater modelling, broadly corresponding to the maximum footprint in any specified 5-yearly period. Given the coarse resolution of the regional-scale groundwater model (minimum pixel size of around 300 m), the finer detail of

2.6.2.5 Implementation of the coal resource development pathway
Groundwater numerical modelling for the Namoi subregion | 61
Component 2: M
odel-data analysis for the Nam
oi subregion
individual roadways, chain pillars, etc. are not represented in the model. The individual longwall panels are also not resolved for the longwall mines. The mine footprints are used in the design of the unstructured grid for the model so that the model grid conforms to the mine footprints. Figure 17 illustrates how the model grid is refined around the mine footprints, CSG production wells and the stream network.
Figure 17 Detail of model grid showing refinement around the location of mines, coal seam gas (CSG) wells and streams ACRD = additional coal resource development Data: Bioregional Assessment Programme (Dataset 1, Dataset 2)
In the case of the Narrabri Gas Project, the latest information available from the CDM Smith (2014) report about the proposed sequence of drilling CSG production wells in the Pilliga region was used for implementing the drain boundary condition. Santos had developed a field development plan in the CDM Smith (2014) report for the purpose of assessing the potential impacts on groundwater

2.6.2.5 Implementation of the coal resource development pathway
62 | Groundwater numerical modelling for the Namoi subregion
Com
pone
nt 2
: Mod
el-d
ata
anal
ysis
for t
he N
amoi
subr
egio
n resources for peak gas production of 200 terajoules per day (TJ/day). The field development plan is based on a maximum number of 425 CSG well pairs (850 wells) distributed across 18 water extraction areas. Owing to the large uncertainty, the water production rates are not directly used as a specified flux boundary condition in the bioregional assessment (BA) modelling for the Namoi subregion. Instead the head-dependent flux boundary condition implemented by using the DRN package is considered more appropriate to simulate the groundwater extraction by the CSG project. The large uncertainty in the water production curves is addressed in the BA modelling for the Namoi subregion by varying the drain conductance of the CSG wells over a wide range for the uncertainty analysis.
The void remaining after mining coal underground is not represented as a ‘hole’ in the model. Such holes are common in models coupled with geomechanics, and in models where very local-scale effects are being studied, such as assessing how much water is produced from the roof, floor and chain pillars. In the Namoi subregion groundwater model, water is simply extracted from the polygons, as described above.
The drain conductance for the open-cut and longwall mines and the CSG wells are varied in the uncertainty analysis (see Section 2.6.2.8). This is important since the estimated and reported historical flow rates are subject to errors, while future flow rates are necessarily predictions, informed by mine-scale groundwater modelling and assumptions about the hydrogeology and development of the mine, and are also uncertain.
2.6.2.5.4 Hydraulic conductivity enhancement
Mining relieves in situ stresses in the surrounding rock mass, causing deformation including fracturing. For example, in parts of the active caving zone of longwall mines, total strains can easily exceed 100%. The strain increments naturally alter the hydraulic properties of the surrounding rock, and it is generally assumed that the conductivity will increase by orders of magnitude in both the horizontal and vertical directions (Adhikary and Wilkins, 2012). This is because rock plastic deformation dilates existing micro and macro fractures and creates new ones. The rock-mass conductivity after caving and consolidation can be inferred from the response of piezometers or the measurement of water or gas flows within, above and below the goaf (Guo et al., 2014). It is always higher than the in situ value. This is the reason that the water make in a typical longwall mine will increase as panel width (and conductivity changes) increases. Therefore, in the Namoi subregion groundwater model, the hydraulic conductivity of rock units above and below each longwall mine working is assumed to be different from the in situ value.
In the Namoi subregion groundwater model, the hydraulic conductivity, K, above and below each mine working, is enhanced according to:
K(x,y,z,t) = 10∆ K0(x,y,z) (2)
where K0 is the base conductivity (both horizontal and vertical components), determined by layer number, lithology and depth, as described in Section 2.6.2.3; and ∆ parameterises the conductivity change. ∆ = 0 before mining of the seam commences, and ∆ = ∆(h) at height, h, above the seam immediately after mining commences. This conductivity enhancement is assumed to remain after

2.6.2.5 Implementation of the coal resource development pathway
Groundwater numerical modelling for the Namoi subregion | 63
Component 2: M
odel-data analysis for the Nam
oi subregion
mining ceases, thus a separate ‘active phase’ (with ∆ large) and ‘consolidation phase’ (with ∆ smaller) above longwall mines is not included in the model (such phases would be important to include if the model were trying to predict mine water makes rather than treating them as an input parameter). However, ∆ may be defined differently for each polygon. ∆ is calculated using the following piecewise-linear function of the height above the mining seam, h:
∆ = 0 for h>Z≥0 (3)
∆ = 0 for h<z<0 (4)
∆ = M(Z–h)/Z for 0≤h≤Z (5)
∆ = m(h–z)/z for z<h<0 (6)
The general form of the relationship is illustrated in Figure 18, where it is clear that conductivity change is M orders of magnitude directly above the seam, and m orders of magnitude directly below the seam, and that the conductivity changes occur between z metres below the seam and Z metres above the seam.
Figure 18 Assumed relationship between the conductivity-change parameter, ∆, and the height above the mining seam, h

2.6.2.5 Implementation of the coal resource development pathway
64 | Groundwater numerical modelling for the Namoi subregion
Com
pone
nt 2
: Mod
el-d
ata
anal
ysis
for t
he N
amoi
subr
egio
n As discussed in Adhikary and Wilkins (2012), longwall mining enhances the permeability greatly compared with bord-and-pillar mines, simply because the rock deformation caused by the latter is comparatively small. The effective conductivity in the immediate roof of longwall mines can be enhanced by up to 10 orders of magnitude (Adhikary and Wilkins, 2012; Guo et al., 2014). The values M, m, Z and z are varied in the uncertainty analysis around the values given in Table 9. The maximum increase in hydraulic conductivity has been limited to 4 orders of magnitude due to the scale of the modelling, the size of the mesh used would overstate the impacts if 10 orders of magnitude were used for this parameter.
Table 9 Model parameters for representing hydraulic conductivity enhancements for the longwall mines in the Namoi subregion
Parameter Longwall
Min Max
M 0 4
Z 100 500
m M/4 M/4
z Z/4 Z/4
Hydraulic enhancement is implemented in the groundwater model over the maximum footprint area of the three longwall mines (Narrabri North, Narrabri South and Caroona) starting at the stress period corresponding to the commencement of operation of the mine. The hydraulic enhancement then linearly increases. The enhancement is assumed to be permanent.
2.6.2.5.5 Simulations
For each parameter set in the uncertainty analysis, three simulations are undertaken as follows:
• no coal-development simulation – This simulation runs from 1983 to 2102 on a monthlystress period. The heads at all the model cells are initialised with their values using a steady-state simulation for the first stress period of the model. No mining is performed.Groundwater is extracted via licensed bores for the transient stress periods. Rainfallrecharge and evapotranspiration are spatially and temporally varying.
• baseline simulation – This is identical to the no-coal-development simulation, except thatthe five baseline mines are made active (including the drain boundary simulating minedewatering and conductivity enhancement for those mines).
• CRDP simulation – This is identical to the baseline simulation except that all additional coalresource developments are also made active for a total of 12 mines and 1 CSG development.
References
Adhikary DP and Wilkins A (2012) Reducing the impact of longwall extraction on groundwater systems. ACARP Report C18016. Viewed 21 April 2017, http://www.acarp.com.au/abstracts.aspx?repId=C18016.

2.6.2.5 Implementation of the coal resource development pathway
Groundwater numerical modelling for the Namoi subregion | 65
Component 2: M
odel-data analysis for the Nam
oi subregion
Aryal SK, Northey J, Slatter E, Ivkovic K, Crosbie R, Janardhanan S, Peña-Arancibia J and Bell J (2018a) Observations analysis, statistical analysis and interpolation for the Namoi subregion. Product 2.1-2.2 for the Namoi subregion from the Northern Inland Catchments Bioregional Assessment. Department of the Environment and Energy, Bureau of Meteorology, CSIRO and Geoscience Australia, Australia. http://data.bioregionalassessments.gov.au/product/NIC/NAM/2.1-2.2.
Aryal SK, Peña-Arancibia J, Viney N, Yang A, Wang B, Hughes J, Merrin LE, Marvanek S, Davies P, Bell J, Zhang Y, Vaze J, Singh R and Kim S (2018b) Surface water numerical modelling for the Namoi subregion. Product 2.6.1 for the Namoi subregion from the Northern Inland Catchments Bioregional Assessment. Department of the Environment and Energy, Bureau of Meteorology, CSIRO and Geoscience Australia, Australia. http://data.bioregionalassessments.gov.au/product/NIC/NAM/2.6.1.
CDM Smith (2014) Santos Narrabri Gas Project groundwater modelling report. CDM Smith Australia Pty Ltd, September 2014.
Guo H, Qu QD, Qin J, Jayasundara C, Wilkins A and Xue S (2014) Horizontal post-drainage design. ACARP Report C18047. Viewed 21 April 2017, http://www.acarp.com.au/abstracts.aspx?repId=C18047.
Herr A, Northey J, Mitchell PJ, Aryal SK, Merrin LE, Slatter E (2018) Conceptual modelling for the Namoi subregion. Product 2.3 for the Namoi subregion from the Northern Inland Catchments Bioregional Assessment. Department of the Environment and Energy, Bureau of Meteorology, CSIRO and Geoscience Australia, Australia. http://data.bioregionalassessments.gov.au/product/NIC/NAM/2.3.
Datasets
Dataset 1 Bioregional Assessment Programme (2016) Namoi groundwater model input shapefiles. Bioregional Assessment Derived Dataset. Viewed 16 December 2016, http://data.bioregionalassessments.gov.au/dataset/fb22671f-8b47-48e2-9fcd-232543fb8ad6.
Dataset 2 Bioregional Assessment Programme (2018) Namoi groundwater model mine footprints. Bioregional Assessment Derived Dataset. Viewed 13 March 2018, http://data.bioregionalassessments.gov.au/dataset/89e3501a-0c7a-426e-98ff-5c96f92673ea.

2.6.2.5 Implementation of the coal resource development pathway
66 | Groundwater numerical modelling for the Namoi subregion
Com
pone
nt 2
: Mod
el-d
ata
anal
ysis
for t
he N
amoi
subr
egio
n

2.6.2.6 Parameterisation
Groundwater numerical modelling for the Namoi subregion | 67
Component 2: M
odel-data analysis for the Nam
oi subregion
2.6.2.6 Parameterisation
Summary
The Namoi subregion groundwater model has 81 parameters of which 37 were varied during the sensitivity analysis. These can be broadly grouped into the following categories: land-surface flux parameters; general-head parameters; surface water – groundwater parameters; hydraulic properties; and parameters associated with the implementation of the coal resource developments.
Details of hydraulic properties are provided, and other parameters are discussed in other sections of the product. A simple scheme that considered hydraulic properties as a function of depth was used for parameterisation of multiple model layers. Values for fixed parameters are specified. Default values, multipliers and parameter ranges for those parameters varied in the uncertainty analysis are specified.
2.6.2.6.1 Hydraulic properties
The groundwater model needs to define horizontal and vertical hydraulic conductivity and specific storage for every model cell. These properties vary depending on the composition and architecture of the rocks and sediments. An analysis of 463 hydraulic conductivity measurements from the Namoi subregion found a correlation with depth (see Figure 17 in Aryal et al., 2018). Companion submethodology M07 for groundwater modelling (Crosbie et al., 2016) proposes the use of a simple parameterisation of hydrostratigraphy in bioregional assessment (BA) groundwater model layers that treats the layers as homogeneous, but varies hydraulic properties with depth. In the absence of a good basis for varying hydraulic properties by lithology or geology, the parameterisation of the Namoi subregion groundwater model adopts this approach. Setting up of distinct model layers as aquifers and interburden sequences and parameterising them independently based on a depth relationship enabled parameterisation of the layers based on the characteristics of the formation. For example, a deeper aquifer/coal seam formation can be parameterised with higher hydraulic conductivity values than an overlying interburden.
As described in Section 2.6.2.3.3.1, every point in the model domain can be defined in terms of a layer number, node number and a depth, d, below the model surface topography. The horizontal hydraulic conductivity, Kh, and the specific storage, SS, are assumed to be of the form:
𝐾𝐾(𝑑𝑑) = (1 + 10𝑤𝑤𝑤𝑤 ∗ 𝐸𝐸𝐸𝐸𝐸𝐸(−0.06 ∗ 𝑤𝑤𝑤𝑤0.5 ∗ 𝑑𝑑)) ∗ (𝐾𝐾0 ∗ 𝐸𝐸𝐸𝐸𝐸𝐸(−𝛼𝛼𝐾𝐾 ∗ 𝑑𝑑)) (7)
𝑆𝑆𝑆𝑆(𝑑𝑑) = 𝑆𝑆𝑆𝑆0 ∗ 𝐸𝐸𝐸𝐸𝐸𝐸(−𝛼𝛼𝑆𝑆 ∗ 𝑑𝑑) (8)
where K(d) is the hydraulic conductivity (K, m/day) at a certain depth d, (m), we is the enhancement due to weathering (orders of magnitude), K0 is the hydraulic conductivity of fresh material at the surface, αK is the decay constant, SS(d) is the specific storage (SS, m–1) at a certain depth (d, m), SS0 is the specific storage at the surface and αS is the decay constant. A constant storage coefficient is assumed throughout the simulation using the MODFLOW layer type 0. This

2.6.2.6 Parameterisation
68 | Groundwater numerical modelling for the Namoi subregion
Com
pone
nt 2
: Mod
el-d
ata
anal
ysis
for t
he N
amoi
subr
egio
n means that the model is unable to switch from confined to unconfined conditions during the model simulation. This assumption is used primarily to increase the model stability and achieve a robust model that is required for the comprehensive uncertainty analysis. The areas that will be effected by this assumpation are only where the top layer of the model drys out, with generally thick model layers this only occurs in small areas around open-cut mines. The effect on predictions is an overestimate of the drawdown. The effect of this simplification on the model predictions is minimised by using storage values based on specific yield in areas where layers are outcropping. The specific yield parameters used for this are also included in the uncertainty analysis to explore prediction uncertainty caused by uncertainty of the specific yield parameters.
It is not appropriate to directly use the raw conductivity data presented in companion product 2.1-2.2 (Aryal et al., 2018) in the groundwater model. This is because the measured data pertain to samples on the spatial scale of centimetres (for lab measurements) to a few tens of metres (in-situ measurements). The regional groundwater model has a best resolution of 300 m, so some ‘upscaling’ of the raw data is necessary. Consider the problem of prescribing a suitable conductivity to a 300 m zone of the groundwater model. Typically there will be some regions of low conductivity within that region, but there will also be regions of high conductivity, and water will flow preferentially through those highly conductive regions, almost entirely bypassing the regions of low conductivity. As the true hydraulic properties of the model domain are unknown, these properties will be determined probabilistically; representative samples of the distribution of the hydraulic properties for the coal-bearing units (Hoskissons Coal, Maules Creek Formation) and the interburden are shown in Figure 19.

2.6.2.6 Parameterisation
Groundwater numerical modelling for the Namoi subregion | 69
Component 2: M
odel-data analysis for the Nam
oi subregion
Figure 19 Parameter space explored in the numerical modelling for the hydraulic conductivity and specific storage for the interburden and coal layers (from Figure 21 in companion product 2.1-2.2 for the Namoi subregion (Aryal et al., 2018)) The orange line is a least squares fit of the measured hydraulic conductivity data (red dots) for the interburden and coal-bearing layers. The black lines are 64 random realisations of the parameter space that is used in the sensitivity analysis. Data: Bioregional Assessment Programme (Dataset 1)
Less data are available to constrain vertical conductivity. Aquitards typically occur as roughly horizontal layers of low conductivity in stratified geological systems such as the Namoi subregion. Such aquitards have little effect on horizontal water flow, since it flows quickly through the surrounding aquifers, but have a greater effect on vertical flow, since the water must pass through the aquitard. This means that groundwater models typically use a vertical conductivity that is a small multiple of horizontal conductivity. A multiplying factor (Kv to Kh ratio) is chosen in the Namoi subregion groundwater model (and this is varied in the uncertainty analysis).
The productive aquifers of the alluvium are assumed to be more porous and conduct water more rapidly than the interburden layers, reflecting their grain size and arrangement (see companion product 2.1-2.2 (Aryal et al., 2018)). The alluvium model layers do not have a decay in the hydraulic conductivity with depth as there was no evidence seen in the field measurements (see companion product 2.1-2.2 (Aryal et al., 2018)).
2.6.2.6.2 Summary of parameters in the groundwater model
Eighty-one parameters were used in the groundwater model. After the stress test described in Section 2.6.2.7.3.1 some of the parameters were identified to have an insignificant influence on the model predictions. These parameters were then either fixed or tied to the independent

2.6.2.6 Parameterisation
70 | Groundwater numerical modelling for the Namoi subregion
Com
pone
nt 2
: Mod
el-d
ata
anal
ysis
for t
he N
amoi
subr
egio
n parameters leaving a total of 37 parameters that varied in the sensitivity and uncertainty analyses. These parameters can be broadly grouped by model function into parameters relating to:
• land-surface fluxes: three fixed parameters for defining evapotranspiration processes (see Section 2.6.2.4.2); one parameter each for the diffuse, irrigation and flood recharge used as multipliers vary the recharge input to explore uncertainty in these components of recharge
• general-head boundary behaviour: two fixed parameters to explore variability in the head and conductance of all lateral boundaries
• surface water – groundwater fluxes: five parameters that define the boundary conditions for the movement of water between groundwater and the river. River-stage height varies with riverbed depth. Two parameters that limit the minimum and maximum hydraulic conductivity of the riverbed and two parameters that define the slope of the riverbed in any model cell are used to compute the conductance of the riverbed in all river cells (see Section 2.6.2.4.3)
• hydraulic properties: parameters to define horizontal and vertical hydraulic conductivities and storage that varies with depth for each model layer (Section 2.6.2.6.1)
• hydraulic enhancement: two parameters to characterise the magnitude of and depth over which hydraulic conductivity changes occur due to longwall mining (see Section 2.6.2.5.3)
• drains: three parameters control the conductance of the open-cut mines, longwall mines and coal seam gas wells.
Table 10 summarises the groundwater model parameters, including the minimum and maximum values of the range over which parameters are varied in the uncertainty analysis (see Section 2.6.2.8) and salient points. As identified above, a number of these parameters are dealt with in other sections of this product.
The range of conductivity and storage values explored in the sensitivity analysis and its comparison with measured data is shown in Figure 19 (which is Figure 21 in companion product 2.1-2.2 for the Namoi subregion (Aryal et al., 2018)). As mentioned above, an upscaling analysis may be performed to yield a probability distribution for hydraulic conductivity, and the result of such an analysis is shown in Figure 19, which motivates the uncertainty bounds in Table 10.
Conductivity enhancement above and below mines is discussed in Section 2.6.2.5.3, and the wide range of variation (four orders of magnitude, and heights ranging between 100 m and 500 m above longwall workings) reflects the wide variation that may be experienced in different mining scenarios (Adhikary and Wilkins, 2012; Guo et al., 2014).

2.6.2.6 Parameterisation
Groundwater numerical modelling for the Namoi subregion | 71
Component 2: M
odel-data analysis for the Nam
oi subregion
Table 10 Groundwater model parameters: minimum and maximum values used in the uncertainty analysis
Number Package Name Description Note Unit Minimum Maximum
1 RCH Scale_r_fl scaler on flood recharge log - 0.01 0.1
2 RCH Scale_r_ir scaler on irrigation recharge log - 0.01 1
3 RCH Scale_r_dr scaler on diffuse recharge linear - 0.5 2
4 RIV k_min minimum conductivity of river bed fixed m/d 1 1
5 RIV k_max maximum conductivity of river bed fixed m/d 3 3
6 RIV m_min minimum depth of river bed fixed m 0.5 0.5
7 RIV m_max maximum depth of river bed fixed m 5 5
8 RIV dh depth of river incision below topography
linear m 2 15
9 GHB Scale_ghb_h scaler on general head bounday head fixed - 1 1
10 GHB Scale_ghb_cond scaler on general head boundary conductance
fixed - 1 1
11 EVT sc_PET scaler on PET fixed - 1 1
12 EVT minrd minimum rooting depth fixed m 1 1
13 EVT rd_vh fraction of vegetation height added to minimum rooting depth
fixed - 0.2 0.2
14 LPF al1_kh alluvium layer 1 horizontal conductivity
log m/d 0.1 3
15 LPF al1_ka alluvium layer 1 horizontal conductivity decay constant
fixed /m 0 0
16 LPF al1_we alluvium weathered zone parameter fixed - 0 0
17 LPF al1_kv alluvium layer 1 vertical conductivity scaler
linear - 0.5 1.5
18 LPF al1_S0 alluvium layer 1 Storage log - 0.0001 0.01
19 LPF al1_Sa alluvium layer 1 storage decay fixed /m 0 0
20 LPF al1_SY alluvium specific yield log - 0.05 0.3
21 LPF al2_kh alluvium layer 2 horizontal conductivity
log m/d 1 10
22 LPF al2_ka alluvium 2 horizontal conductivity decay constant
fixed /m 0 0
23 LPF al2_we alluvium 2 weathered zone paramter fixed - 0 0
24 LPF al2_kv alluvium layer 2 vertical conductivity log - 0.001 0.1
25 LPF al2_S0 alluvium layer 2 storage log - 0.0001 0.01
26 LPF al2_Sa alluvium 2 storage decay constant fixed /m 0 0
27 LPF al2_SY alluvium layer 2 specific yield log - 0.05 0.3
28 LPF IB1_k0 interburden 1 horizontal conductivity at surface
log m/d 0.0001 0.01

2.6.2.6 Parameterisation
72 | Groundwater numerical modelling for the Namoi subregion
Com
pone
nt 2
: Mod
el-d
ata
anal
ysis
for t
he N
amoi
subr
egio
n Number Package Name Description Note Unit Minimum Maximum
29 LPF IB1_ka interburden 1 horizontal conductivity decay constant
linear /m 0.003 0.01
30 LPF IB1_we interburden 1 weathered zone linear - 1 3
31 LPF IB1_kv interburden 1 ratio of kv to kh log - 0.001 0.1
32 LPF IB1_S0 interburden 1 storage at surface log - 0.000001 0.0001
33 LPF IB1_sa interburden 1 storage decay constant linear /m 0 0.03
34 LPF IB1_SY interburden 1 specific yield log - 0.0005 0.05
35 LPF pil_k0 Pilliga horizontal conductivity at surface
log m/d 0.001 1
36 LPF pil_ka Pilliga horizontal conductivity decay constant
linear /m 0.003 0.01
37 LPF pil_we Pilliga 1 weathered zone linear - 1 3
38 LPF pil_kv Pilliga ratio of kv to kh log - 0.001 0.1
39 LPF pil_S0 Pilliga storage at surface log - 0.000001 0.0001
40 LPF pil_sa Pilliga storage decay constant fixed /m 0 0
41 LPF pil_SY Pilliga specific yield log - 0.001 0.1
42 LPF IB2_k0 interburden 2 horizontal conductivity at surface
tied IB1_k0
m/d 0.0001 0.01
43 LPF IB2_ka interburden 2 horizontal conductivity decay constant
tied IB1_ka
/m 0.003 0.01
44 LPF IB2_we interburden 2 weathered zone parameter
tied IB1_we
- 1 3
45 LPF IB2_kv interburden 2 ratio of kv to kh tied IB1_kv
- 0.001 0.1
46 LPF IB2_S0 interburden 2 storage at surface tied IB1_S0
- 0.000001 0.0001
47 LPF IB2_sa interburden 2 storage decay constant tied IB1_sa
/m 0 0.03
48 LPF IB2_SY interburden 2 specific yield tied IB1_SY
- 0.0005 0.05
49 LPF hos_k0 Hoskissons horizontal conductivity at surface
log m/d 0.001 0.1
50 LPF hos_ka Hoskissons horizontal conductivity decay constant
linear /m 0.003 0.01
51 LPF hos_we Hoskissons weathered zone parameter
linear - 1 3
52 LPF hos_kv Hoskissons ratio of kv to kh log - 0.01 1
53 LPF hos_S0 Hoskissons storage at surface log - 0.000001 0.0001
54 LPF hos_sa Hoskissons storage decay constant linear /m 0 0.03

2.6.2.6 Parameterisation
Groundwater numerical modelling for the Namoi subregion | 73
Component 2: M
odel-data analysis for the Nam
oi subregion
Number Package Name Description Note Unit Minimum Maximum
55 LPF hos_SY Hoskissons specific yield log - 0.001 0.1
56 LPF IB3_k0 interburden 3 horizontal conductivity at surface
tied IB1_k0
m/d 0.0001 0.01
57 LPF IB3_ka interburden 3 horizontal conductivity decay constant
tied IB1_ka
/m 0.003 0.01
58 LPF IB3_we interburden 3 weathered zone parameter
tied IB1_we
- 1 3
59 LPF IB3_kv interburden 3 ratio of kv to kh tied IB1_kv
- 0.001 0.1
60 LPF IB3_S0 interburden 3 storage at surface tied IB1_S0
- 0.000001 0.0001
61 LPF IB3_sa interburden 3 storage decay constant tied IB1_sa
/m 0 0.03
62 LPF IB3_SY interburden 3 specific yield tied IB1_SY
- 0.0005 0.05
63 LPF mau_k0 Maules ck horizontal conductivity at surface
tied hos_k0
m/d 0.001 0.1
64 LPF mau_ka Maules ck horizontal conductivity decay constant
tied hos_ka
/m 0.003 0.01
65 LPF mau_we Maules creek weathered zone parameter
tied hos_we
- 1 3
66 LPF mau_kv Maules ck ratio of kv to kh tied hos_kv
- 0.01 1
67 LPF mau_S0 Maules ck storage at surface tied hos_S0
- 0.000001 0.0001
68 LPF mau_sa Maules ck storage decay constant tied hos_sa
/m 0 0.03
69 LPF mau_SY Maules creek specific yield tied hos_SY
- 0.001 0.1
70 LPF base_k0 basement horizontal conductivity at surface
tied IB1_k0
m/d 0.0001 0.01
71 LPF base_ka basement horizontal conductivity decay constant
tied IB1_ka
/m 0.003 0.01
72 LPF base_we basement weathered zone parameter tied IB1_we
- 1 3
73 LPF base_kv basement ratio of kv to kh tied IB1_kv
- 0.001 0.1
74 LPF base_S0 basement storage at surface tied IB1_S0
- 0.000001 0.0001
75 LPF base_sa basement storage decay constant tied IB1_sa
/m 0 0.03
76 LPF base_SY basement specific yield tied IB1_SY
- 0.0005 0.05

2.6.2.6 Parameterisation
74 | Groundwater numerical modelling for the Namoi subregion
Com
pone
nt 2
: Mod
el-d
ata
anal
ysis
for t
he N
amoi
subr
egio
n Number Package Name Description Note Unit Minimum Maximum
77 TVM K_ramp_up ramp function maximum impacted distance up
linear m 100 500
78 TVM max_dk_up ramp function maximum change in k in up direction (orders of magnitude)
linear - 0 4
79 DRN Cond_mine_OC scaler for open cut drain conductance log - 6,000 100,000
80 DRN Cond_mine_LW scaler for longwall mine conductance log - 2,000 25,000
81 DRN Cond_CSG scaler for CSG drain conductance log - 1,000 15,000
Package refers to the MODFLOW package that the parameter belongs to, these are: recharge (RCH), river (RIV), general-head boundary (GHB), evapotranspiration (EVT), layer properties flow (LPF), time varying materials (TVM) and drain (DRN). Note refers to the treatment of the parameter, linear is uniformly distributed between minimum and maximum, log is log transformed and then fitted uniformly between minimum and maximum, fixed means the parameter does not vary between model runs and tied means that the parameter is made equal to another parameter in the list. PET = potential evapotranspiration; ET = evapotranspiration; GHB = general-head boundary; SW = surface water; GW = groundwater; CSG = coal seam gas
References
Aryal SK, Northey J, Slatter E, Ivkovic K, Crosbie R, Janardhanan S, Peña-Arancibia J and Bell J (2018) Observations analysis, statistical analysis and interpolation for the Namoi subregion. Product 2.1-2.2 for the Namoi subregion from the Northern Inland Catchments Bioregional Assessment. Department of the Environment and Energy, Bureau of Meteorology, CSIRO and Geoscience Australia, Australia. http://data.bioregionalassessments.gov.au/product/NIC/NAM/2.1-2.2.
Adhikary DP and Wilkins A (2012) Reducing the impact of longwall extraction on groundwater system. ACARP Report C18016. http://www.acarp.com.au/abstracts.aspx?repId=C18016.
Crosbie R, Peeters L and Carey H (2016) Groundwater modelling. Submethodology M07 from the Bioregional Assessment Technical Programme. Department of the Environment and Energy, Bureau of Meteorology, CSIRO and Geoscience Australia, Australia. http://data.bioregionalassessments.gov.au/submethodology/M07.
Guo H, Qu QD, Qin J, Jayasundara C, Wilkins A and Xue S (2014) Horizontal post-drainage design. ACARP Report C18047. http://www.acarp.com.au/abstracts.aspx?repId=C18047.
Datasets
Dataset 1 Bioregional Assessment Programme (2016) Namoi hydraulic conductivity measurements. Bioregional Assessment Source Dataset. Viewed 16 December 2016, http://data.bioregionalassessments.gov.au/dataset/5f88517d-8154-411d-907f-4e2c2d12a912.

2.6.2.7 Observations and predictions
Groundwater numerical modelling for the Namoi subregion | 75
Component 2: M
odel-data analysis for the Nam
oi subregion
2.6.2.7 Observations and predictions
Summary
Historical groundwater level and streamflow data are used to constrain groundwater model predictions. Through a rigorous quality control process, 134 groundwater monitoring sites are selected to constrain the numerical modelling. In the absence of reliable, regional estimates of surface water – groundwater flux, observed streamflow data are used to impose upper bounds on the modelled surface water – groundwater flux. The water production by coal resource developments, estimated by the proponents, is compared to the simulated water production rates to further constrain the model.
At each model node in the model domain, the model simulates the time series of groundwater level under the baseline and under the coal resource development pathway (CRDP). The maximum difference in drawdown (dmax) between the modelled CRDP and baseline, due to additional coal resource development, and the year of maximum change (tmax), are calculated as the difference between the two time series. At points along the prescribed stream network, the model also generates the change in surface water – groundwater flux. The resulting changes in flux time series are inputs to the river model and are encapsulated in the streamflow hydrological response variables reported in companion product 2.6.1 for the Namoi subregion (Aryal et al., 2018b).
A subset of 37 groundwater model parameters is allowed to vary stochastically to form the basis for the sensitivity and uncertainty analyses. The groundwater levels and surface water – groundwater flux are most sensitive to depth of incision of the streambed (dh), the scaler on the diffuse recharge (Scale_r_dr) and the hydraulic properties of the alluvium (al1_kh, al1_SY and al2_kh).
The main prediction, the drawdown due to additional coal resource development, is sensitive to the hydraulic properties of the interburden (IB1_k0, IB1_kv, IB1_ka) and the hydraulic properties of the coal-bearing units (hos_k0, hos_ka). As the groundwater level and streamflow observations are not sensitive to these parameters, these parameters will not be constrained greatly in the uncertainty analysis.
2.6.2.7.1 Observations
2.6.2.7.1.1 Groundwater levels
The HYDMEAS database (NSW Office of Water, Dataset 1) contains the observations of the regional groundwater monitoring network. Groundwater level measurements from 170 monitoring sites across the Namoi subregion (see Figure 17 in Section 2.1.3 in companion product 2.1-2.2 for the Namoi subregion (Aryal et al., 2018a)) were selected as having at least one reliable spatial attribute (location or elevation). Of these, 36 monitoring sites did not have reliable observations and were removed from the observation dataset used to constrain the model parameters. From the remaining monitoring sites, those sites which have at least four records in any year between 1993 and 2012 were identified; this left 134 monitoring sites for use in

2.6.2.7 Observations and predictions
76 | Groundwater numerical modelling for the Namoi subregion
Com
pone
nt 2
: Mod
el-d
ata
anal
ysis
for t
he N
amoi
subr
egio
n constraining the model. The groundwater level data from these 134 sites (Figure 20, Table 11) were used for evaluating the objective function that was used for constraining the model predictions as described in Section 2.6.2.8.1.2. Agricultural extractions are represented in the model from the year 1983 onwards at a constant rate, therefore the model simulations do not accurately capture the expansion of groundwater extraction from the 1970s onwards and hence the water levels are not comparable to the observations during the first ten years of simulation. Considering this, the observation data for the period prior to 1993 were discarded. As the agricultural extraction is implemented in the model at a constant rate throughout the year, the seasonal dynamics of extraction and therefore groundwater levels are not captured, and so only those monitoring bores with enough records to form a representative annual average water level were used. It is noteworthy that this assumption does not grossly affect the primary objective of the model development (i.e. simulation of drawdown due to additional coal resource development that occurs after 2012).
Table 11 Summary of groundwater level observations
Number of bores Average number of observations per bore
Minimum groundwater level
(m AHD)
Maximum groundwater level
(m AHD)
134 12 116 564
m AHD = metres Australian Height Datum
Local monitoring information, including monitoring data from mining companies, is not included in the analysis to avoid biasing the objective function used for constraining the model with measurements predominantly affected by local hydrogeological conditions that are not captured in the regional model. Mining companies install monitoring wells in the vicinity of the mine sites to capture information about local hydrogeological conditions, surface water features or local lenses of more or less permeable strata. Within a site-scale groundwater model, these local features and stresses can be represented with sufficient spatial detail for the groundwater level observations to be used to infer local parameter values or constrain local predictions. In a regional-scale model, the representation of local features and stresses cannot be done at a resolution sufficient to match the information from local-scale observations and the regional-scale parameters will compensate for the missing spatial detail (see companion submethodology M07 for groundwater modelling (Crosbie et al., 2016)). As shown by Doherty and Welter (2010) and White et al. (2014), this can lead to a bias in the inferred parameter values, and in turn to biased predictions. Local information can be used in a regional context, if the tolerance of model-to-measurement misfit is increased to account for the missing local detail. This means in the vicinity of mines where, due to the historical pumping rates, hydraulic gradients are expected to be high, large discrepancies between modelled and observed groundwater levels should be expected and tolerated. Effectively, this reduces the information content of the local observations. Establishing an appropriate weighting or tolerance for local observations is site-specific and subjective. In order to limit the propensity of biasing regional parameter values through the incorporation of local-scale observations and the inherently subjective weighting of these observations, local-scale information from mine groundwater-monitoring networks is not used.

2.6.2.7 Observations and predictions
Groundwater numerical modelling for the Namoi subregion | 77
Component 2: M
odel-data analysis for the Nam
oi subregion
Figure 20 Location of 134 monitoring bores used to constrain model parameters Data: Bioregional Assessment Programme (Dataset 2)
Section 2.6.2.8.1 provides the details of how these groundwater level observations are integrated into the objective function to constrain the groundwater model.
2.6.2.7.1.2 Streamflow
The groundwater model was not designed to simulate total streamflow in the river system within its model domain, but rather to generate estimates of the change in surface water – groundwater flux due to coal resource development at points along a prescribed stream network. Constraining these fluxes requires regional estimates of the surface water – groundwater flux, which, as discussed in Section 2.1.5 in companion product 2.1-2.2 for the Namoi subregion (Aryal et al., 2018a), are not easy to determine.
As an alternative, mean daily streamflow at 31 gauges (Table 12) based on long-term observed streamflow hydrographs (NSW Office of Water, Dataset 3) has been used as a proxy to constrain estimates of surface water – groundwater flux by the groundwater model. Parameter

2.6.2.7 Observations and predictions
78 | Groundwater numerical modelling for the Namoi subregion
Com
pone
nt 2
: Mod
el-d
ata
anal
ysis
for t
he N
amoi
subr
egio
n combinations that result in long-term historical surface water – groundwater fluxes in excess of the mean daily surface water flow were deemed unacceptable. This constraint is considered to be conservative because in the perennial stream reaches in the Namoi subregion the majority of the flow is sourced from upstream outside of the groundwater model domain and so would be expected to have a low percentage of flow sourced from groundwater within the model domain. The majority of the headwater streams in the Namoi subregion are ephemeral and so this criterion will accept any stream modelled as being losing in the groundwater model.
Section 2.6.2.8.1 provides more detail on how these streamflow observations are integrated in the objective function to constrain the groundwater model.

2.6.2.7 Observations and predictions
Groundwater numerical modelling for the Namoi subregion | 79
Component 2: M
odel-data analysis for the Nam
oi subregion
Table 12 Mean daily streamflow at 31 gauges used to contrain the groundwater model
Gauge Mean daily streamflow (m3/d)
419027 382,698.0
4190273 50,700.8
419032 589,706.6
4190035 48,652.8
419012 1,898,237.4
4190275 37,518.2
4190011 4,900.2
4190274 52,011.0
419001 1,764,173.4
4190036 17,280.2
4190121 8,841.9
4190123 13,021.7
419033 87,094.9
419039 2,063,094.7
4190031 1,342.5
419021 1,579,488.8
419003 2,079,245.8
4190034 4,188.6
419051 60,975.8
419068 1,028,790.2
4190611 48,456.4
419059 1,360,950.7
419061 423,896.3
419088 160,736.9
419089 185,491.6
419026 1,704,567.4
419049 353,311.1
419091 2,275,115.6
4190393 24,211.9
419072 100,700.7
419053 98,423.4
These gauges are also displayed in Figure 11 of companion product 2.6.1 for the Namoi subregion (Aryal et al., 2018b) Data: NSW Office of Water (Dataset 3)

2.6.2.7 Observations and predictions
80 | Groundwater numerical modelling for the Namoi subregion
Com
pone
nt 2
: Mod
el-d
ata
anal
ysis
for t
he N
amoi
subr
egio
n 2.6.2.7.1.3 Water production for coal resource developments
Another type of observation to constrain the groundwater model is the expected annual total water production during coal seam gas (CSG) production from the Narrabri Gas Project and other coal mining projects as reported in companion product 2.1-2.2 for the Namoi subregion (Aryal et al., 2018a). In the groundwater model, CSG production and water extraction from the mines are implemented using the Drain package of MODFLOW-USG. The volume of water that needs to be extracted to achieve the specified drawdown at the cells with a drain boundary will therefore depend on the hydraulic parameters of the model. While it is by no means a goal of the bioregional assessment (BA) modelling to reproduce these values exactly, the simulated water extraction rates across multiple model runs should be within a range that is consistent with these estimates, especially since these are based on detailed local information and pilot production testing. The usage of the data in objective functions is further described in Section 2.6.2.8.1.
Table 13 shows the water production rates, estimated by the various proponents, associated with the planned coal mining or coal seam gas activities. These estimates integrate local geological information as well as operational detail. The implementation of the CRDP through drain boundary conditions ensures that water production rates are simulated by the groundwater model as well. The simulated water production rates are compared with the proponents’ estimates to verify that the simulated stress imposed on the groundwater system is consistent with the planned stress.
Table 13 Summary coal resource water production rates
Observation ID Estimated water production (ML/y)
Mine name No of years simulated
Remark/reference
owp_BOGGA 270 Boggabri Coal Mnie 6 Boggabri Coal Pty Ltd (2014)
owp_CAROONA 1407 Caroona Coal Project 25 Mean predicted water takes requiring licensing (Nicol et al., 2014)
owp_MAULES 550 Maules Creek Mine 20 Mean annual groundwater inflow to the pit (AGE, 2011)
owp_NARRAN 1376 Narrabri North Mine 25 Predicted annual inflow volume (HydroSimulations, 2015)
owp_ROC 820 Rocglen Mine 10 Mean mine inflows (Douglas Partners, 2010)
owp_SUNNY 83.6 Sunnyside Mine 4 Mean potential groundwater inflow for low hydraulic conductivity scenario (Geoterra Pty Ltd, 2008)
owp_TARRA 258.72 Tarrawonga Coal Expansion Project
6 Mean predicted pit inflows (Merrick and Alkhatib, 2012)
owp_VICK 394.47 Vickery Coal Project 25 Mean predicted pit inflows (Merrick and Alkhatib, 2013)
owp_WM 193.5 Watermark Coal Project 29 WRM Water and Environment (2013)
owp_NGP 2776 Narrabri Gas Project 25 Estimated peak water production (Santos, 2012)

2.6.2.7 Observations and predictions
Groundwater numerical modelling for the Namoi subregion | 81
Component 2: M
odel-data analysis for the Nam
oi subregion
2.6.2.7.2 Predictions
2.6.2.7.2.1 Drawdown due to additional coal resource development
As discussed in Section 2.6.2.1, the primary objective of the groundwater modelling is to provide probabilistic estimates of drawdown at the regional watertable due to additional coal resource development. The regional watertable is where the majority of the ecological, economic and sociocultural assets are dependent upon water. Drawdown in the confined part of the Pilliga Sandstone is also predicted as there are economic assets dependent upon this water source.
At each model node (shown in Figure 3, Section 2.6.2.1), time series of groundwater level in the regional watertable aquifer are simulated for the baseline and the CRDP. The maximum difference in drawdown (dmax) between the modelled CRDP and baseline, due to additional coal resource development, and the year of maximum change (tmax), are calculated using the difference between the two time series.This is illustrated in Figure 21 for one model node.
Figure 21 Example of groundwater model output time series for one model node Groundwater level is relative to height above the Australian Height Datum (AHD). CRDP = coal resource development pathway. Additional drawdown is the maximum difference in drawdown (dmax) between the coal resource development pathway (CRDP) and baseline, due to additional coal resource development.

2.6.2.7 Observations and predictions
82 | Groundwater numerical modelling for the Namoi subregion
Com
pone
nt 2
: Mod
el-d
ata
anal
ysis
for t
he N
amoi
subr
egio
n 2.6.2.7.2.2 Change in surface water – groundwater flux due to additional coal resource development
The difference in the surface water – groundwater flux due to additional coal resource development is simulated for points along the groundwater model stream network shown in Figure 14 in Section 2.6.2.4. The changes in surface water – groundwater flux upstream of each surface water model node in Figure 14 in Section 2.6.2.4 are aggregated at the node. The resulting change in flux time series are inputs to the surface water modelling, as documented in Section 2.6.2.1 and in greater detail in companion product 2.6.1 for the Namoi subregion (Aryal et al., 2018b).
Generally, the extraction of water by coal mines causes baseflow to decrease. However, the modelling indicates that longwall mining can also increase baseflow. This is due to hydraulic conductivity enhancement above underground mines and is explained in more detail in a numerical experiment reported in the groundwater modelling product for the Hunter subregion (Herron et al., 2018). The results concluded that there are three ways that baseflow can increase due to mining:
• in the short term (weeks), water stored in the interburden can be released as the groundwater finds a new equilibrium after the enhancement of hydraulic conductivity due to the collapse of the goaf (this is modelled in the Namoi subregion groundwater model)
• when the groundwater’s new phreatic surface is deeper than prior to mining, resulting in less evapotranspiration from groundwater (this is modelled in the Namoi subregion groundwater model)
• in the longer term (years), when a new equilibrium is established, the enhanced conductivity means that: (i) groundwater moves faster due to an increase in transmissivity that more than compensates for a reduction in hydraulic gradient (this is modelled); and (ii) rainfall recharge is potentially higher (this is not modelled).
The maximum and minimum change in the surface water – groundwater flux for each time series and for each stream reach in the river model have been summarised in Figure 22. This shows that decreases in the surface water - groundwater flux occur in the vicinity of all coal resource developments but increases in surface water – groundwater flux only occur in the vicinity of longwall mines.

2.6.2.7 Observations and predictions
Groundwater numerical modelling for the Namoi subregion | 83
Component 2: M
odel-data analysis for the Nam
oi subregion
Figure 22 The 5th, 50th and 95th percentiles of the change in surface water – groundwater (SW-GW) flux predicted for each reach in the river model domain for the minimum and maximum change in a time step over the period 2013–2102
2.6.2.7.3 Design of experiment and sensitivity analysis
2.6.2.7.3.1 Stress testing of the groundwater model
As outlined in Section 2.6.2.1, the groundwater model is evaluated for a wide range of parameter combinations chosen in a systematic and efficient way. The first stage of this evaluation applied a stress test to evaluate the stability of the model when run using a wide range of parameters. The stress testing involved undertaking 100 model runs. This exercise also helped to identify the minimum and maximum of the range of parameters for the design of experiments that can result in better model stability while ensuring that sampling from within this range explores the full range of predictive uncertainty. Further, it helped in identifying parameters that did not affect the model predictions. Based on the outcomes of the stress test, model parameterisation is further reviewed to either remove the parameters that did not affect the predictions or tie these parameters to other independent parameters.

2.6.2.7 Observations and predictions
84 | Groundwater numerical modelling for the Namoi subregion
Com
pone
nt 2
: Mod
el-d
ata
anal
ysis
for t
he N
amoi
subr
egio
n The stress testing of the Namoi subregion groundwater model revealed that many of the 81 parameters chosen for the initial parameterisation of the model contained insensitive parameters and that a parameterisation scheme with 37 independent parameters is sufficient to comprehensively explore model sensitivity to parameters (parameters are listed as free or tied in Table 10 of Section 2.6.2.6). The stress testing informed that it is not critical to parameterise each interburden layer with a separate parameter for its hydraulic properties at zero depth (e.g. IB_K0). Instead, the same parameter could be used for all the nine numerical model layers corresponding to the three interburden layers. Despite using the same parameter value, the depth-based decay of hydraulic properties ensures that all the nine interburden layers assume distinct values of hydraulic properties.
Subsequent to the stress testing, the groundwater model is evaluated for a wide range of parameter combinations chosen in a systematic and efficient way that is referred to as the design of experiment (see companion submethodology M09 (as listed in Table 1) for propagating uncertainty through models (Peeters et al., 2016)). The results of these model runs, the simulated equivalents to the observations described in Section 2.6.2.7.1 and the predictions described in Section 2.6.2.7.2, are used for the sensitivity analysis. In the uncertainty analysis the results are filtered and only the runs that are consistent with the observations are retained (see Section 2.6.2.8.1). Each parameter is sampled across a wide range to ensure sufficient coverage of the parameter space. The design-of-experiment model runs also allow a comprehensive sensitivity analysis to be undertaken. Such an analysis provides insight into the functioning of the model and aids in identifying which parameters the predictions are most sensitive to and if the observations are able to constrain these parameters.
Table 10 in Section 2.6.2.6 lists the 81 parameters in the model and identifies the 37 that were varied in the sensitivity and uncertainty analyses and how they relate to the hydraulic properties, stresses and boundary conditions of the groundwater model. The ‘Description’ column provides a plain-English description of the parameters. The ‘Note’ column identifies which parameters were fixed and also whether they have been sampled after being log-transformed. The ‘Minimum’ and ‘Maximum’ columns provide the range over which the parameter is sampled. Not all the model parameters were carried through to the sensitivity and uncertainty analyses. Rationalising the number of parameters was undertaken to reduce the total number of simulations needed to characterise modelling uncertainty. Where a number of parameters are used to define a process in the model, it is possible to fix some and vary others to obtain a satisfactory characterisation of the range of possible outcomes. The parameters relating to the general-head boundary conductance, the riverbed conductance and evapotranspiration are not included in the uncertainty analysis as initial model runs indicated that these parameters have a very limited effect on predictions.
Using a maximin Latin Hypercube design (see Santner et al., 2003, p. 138), 3500 parameter combinations were generated for the entire parameter space for the groundwater model. The maximin Latin Hypercube design is generated like a standard Latin Hypercube design, one design point at a time, but with each new point selected to maximise the minimum Euclidean distance between design points in the parameter space. Points in the design span the full range of parameter values in each dimension of the parameter space, but also avoid redundancy among points by maximising the Euclidean distance between two points (since nearby points are likely to have similar model output). The parameter ranges are sampled uniformly from their range.

2.6.2.7 Observations and predictions
Groundwater numerical modelling for the Namoi subregion | 85
Component 2: M
odel-data analysis for the Nam
oi subregion
Of the 3500 parameter combinations, 2618 resulted in successful runs of the model that produced all the required outputs. Within the available time frame and with the available computational resources, the modelling team was able to successfully evaluate 2618 parameter combinations. Although the coverage of a 37-dimensional parameter space is limited with 2618 simulations, visual inspection of the parameter combinations evaluated showed that there was no bias or gaps in the sampling of the parameter hyperspace.
The following sections describe the sensitivity of the observations and predictions to the 37 parameters, based on these model runs.
2.6.2.7.3.2 Simulated equivalents to observations from the design of experiment
The best appreciation of the relationship between a parameter and an observation or prediction is through the inspection of scatter plots. The large dimensionality of parameters, observations and predictions precludes this type of visualisation for all parameter–prediction combinations, so a few scatter plots are provided as illustration. A comprehensive assessment of sensitivity is provided through sensitivity indices. These indices, computed using the methodology outlined in Plischke et al. (2013), are a density rather than variance-based quantification of the change in a prediction or observation due to a change in a parameter value. It is a relative metric in which large values indicate high sensitivity, whereas low values indicate low sensitivity. The indices are normalised by the largest sensitivity index, such that the most sensitive parameter has an index value of 1.
Figure 23 shows how the average predicted groundwater levels at observation bore GW030226.1.1 in 2012 vary with parameter values. The sensitivity index for each parameter is also shown. The blue line indicates the observed groundwater level. It is clear that there are parameter combinations that can match the observed value of the average groundwater level in 2012 but the variation in the prediction is completely dominated by a single parameter, dh, the depth of incision of the streambed below topography. This demonstrates that this particular observation is not sensitive to other parameters such as recharge or hydraulic conductivity that would ordinarily have an influence over the groundwater level; the reason for this is that the location of this particular observation bore is close to the river and therefore is controlled by the elevation of the water in the river.
Figure 24a shows boxplots of the sensitivity indices for all available simulated equivalents to groundwater level observations. As with observation bore GW030226.1.1, the depth of incision of the streambed (dh) is the most influential parameter across all groundwater level observations but there are also some observations that are sensitive to the scaler applied to diffuse recharge (Scale_r_dr) and the hydraulic properties of the alluvium (al1_kh, al1_SY, al2_kh and al2_SY). The relative insensitivity of groundwater level predictions to the other parameters does not mean these variables have no effect; rather it indicates the effect of these parameters is small compared to other parameters and is too small to be distinguished based on a design of experiment with 2618 evaluated parameter combinations.

2.6.2.7 Observations and predictions
86 | Groundwater numerical modelling for the Namoi subregion
Com
pone
nt 2
: Mod
el-d
ata
anal
ysis
for t
he N
amoi
subr
egio
n
Figure 23 Scatter plots of the simulated equivalents to the average groundwater level at observation bore GW030226.1.1 for the year 2012 and 16 of the 37 parameters varied in the model The blue line is the observed groundwater level and the red lines are the median of the predicted water level binned over a quintile of the parameter space. GWL = groundwater level; mAHD = metres above the Australian Height Datum; SI = sensitivity index; parameter names are described in Table 10.

2.6.2.7 Observations and predictions
Groundwater numerical modelling for the Namoi subregion | 87
Component 2: M
odel-data analysis for the Nam
oi subregion
Figure 24 Boxplots of sensitivity indices for (a) all available groundwater level simulated equivalents to observations, (b) simulated mine water make and coal seam gas (CSG) co-produced water, (c) average historical simulated surface water – groundwater flux, (d) predictions of additional drawdown, and (e) year of maximum change (tmax) Additional drawdown is the maximum difference in drawdown (dmax) between the coal resource development pathway (CRDP) and baseline, due to additional coal resource development. For those parameters that do not seem to have an inter-quartile range, the range is narrower than the size of the green dot indicating the median SW = surface water; GW = groundwater; n = the number of observations, parameter names are described in Table 10.

2.6.2.7 Observations and predictions
88 | Groundwater numerical modelling for the Namoi subregion
Com
pone
nt 2
: Mod
el-d
ata
anal
ysis
for t
he N
amoi
subr
egio
n Figure 25 shows scatter plots of the parameter values versus the simulated mine water make for the proposed underground mine at the Caroona Coal Project for all of the evaluated design-of-experiment model runs. The most sensitive parameters are the hydraulic conductivity enhancement after the longwall panels collapse (max_dk_up) and the horizontal and vertical hydraulic conductivities of the interburden (IB1_k0, IB1_kv). This shows that with increasing hydraulic conductivity (either native or enhanced) there is an increase in mine water make. Figure 24b shows that the other mines behave similarly with the hydraulic conductivity enhancement (max_dk_up) being influential for the longwall mines and the hydraulic properties of the coal-bearing units (hos_k0, hos_ka and hos_SY) and interburden (IB1_k0 and IB1_kv) also being influential. The sensitivity of simulated mine water makes to the other parameters is small (i.e. beyond the resolution of the design of experiment).
Figure 26 shows scatter plots of the parameter values versus the simulated average historical surface water – groundwater flux at gauge location 419051 for all of the evaluated design-of-experiment model runs. The most sensitive parameters are the scaler applied to diffuse recharge (Scale_r_dr) and the depth of incision of the streambed below topography (dh). This shows that as recharge increases, the surface water – groundwater flux becomes more negative (i.e. groundwater leaving the model domain as discharge to surface water); the converse is also true with low recharge the flux direction is reversed and the river loses water to groundwater. Similarly with the depth of incision of the streambed, a shallow streambed incision results in a losing stream while a deep incision leads to a gaining stream. Figure 24c confirms that these parameters are influential for the other gauge locations as well along with the hydraulic conductivity of the alluvium (al1_kh). As for the other model outputs, the effect of other parameters on surface water – groundwater flux is too small to be distinguished with the current set of model runs.

2.6.2.7 Observations and predictions
Groundwater numerical modelling for the Namoi subregion | 89
Component 2: M
odel-data analysis for the Nam
oi subregion
Figure 25 Scatter plots of the parameter values versus the simulated mine water make for Caroona Coal Project for all evaluated design-of-experiment model runs The blue line is the mine water make reported for the Caroona Coal Project as part of their environmental impact statement (EIS) and the red lines are the median of the simulated mine water make binned over a quintile of the parameter space. SI = sensitivity index; parameter names are described in Table 10.
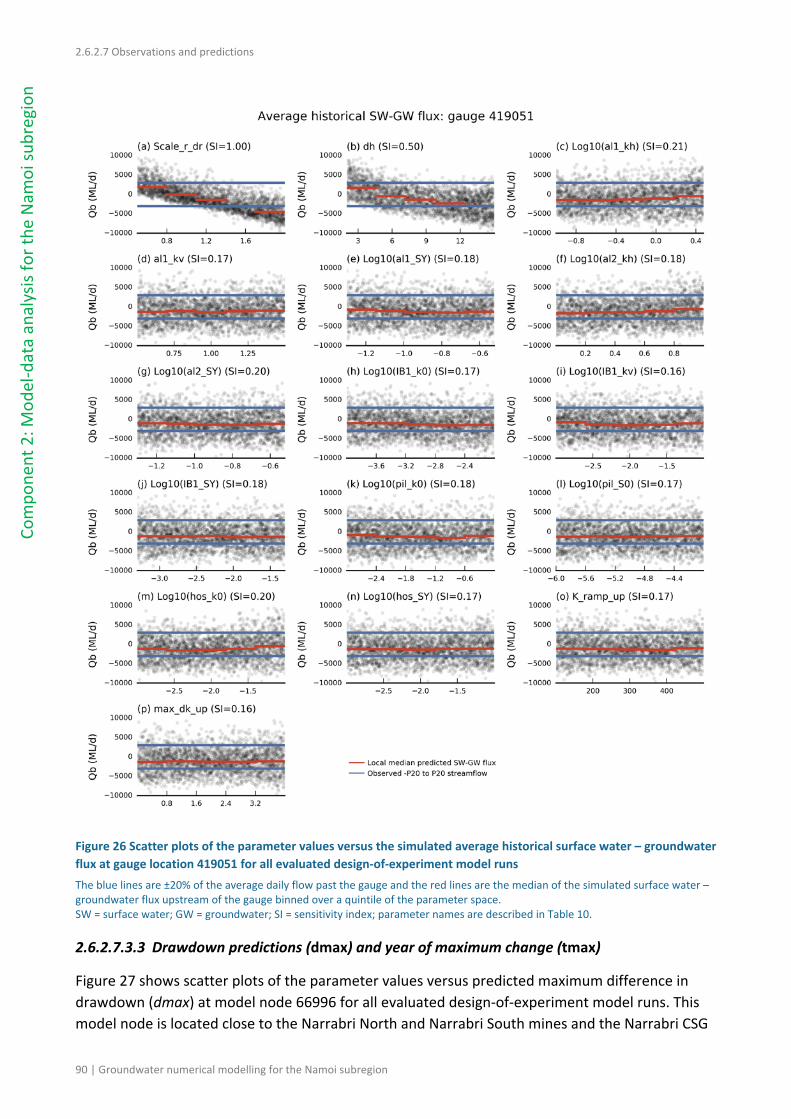
2.6.2.7 Observations and predictions
90 | Groundwater numerical modelling for the Namoi subregion
Com
pone
nt 2
: Mod
el-d
ata
anal
ysis
for t
he N
amoi
subr
egio
n
Figure 26 Scatter plots of the parameter values versus the simulated average historical surface water – groundwater flux at gauge location 419051 for all evaluated design-of-experiment model runs The blue lines are ±20% of the average daily flow past the gauge and the red lines are the median of the simulated surface water –groundwater flux upstream of the gauge binned over a quintile of the parameter space. SW = surface water; GW = groundwater; SI = sensitivity index; parameter names are described in Table 10.
2.6.2.7.3.3 Drawdown predictions (dmax) and year of maximum change (tmax)
Figure 27 shows scatter plots of the parameter values versus predicted maximum difference in drawdown (dmax) at model node 66996 for all evaluated design-of-experiment model runs. This model node is located close to the Narrabri North and Narrabri South mines and the Narrabri CSG
2.6.2.7 Observations and predictions
Groundwater numerical modelling for the Namoi subregion | 91
Component 2: M
odel-data analysis for the Nam
oi subregion
Project. The most sensitive parameters for the drawdown prediction at this location are the hydraulic conductivity of the layer that it is located in (pil_k0), the hydraulic properties of the interburden (IB1_k0 and IB1_kv) and the hydraulic conductivity enhancement after longwall mine collapse (max_dk_up). These parameters all show that higher conductivity leads to higher drawdown. Figure 24d shows that across all model nodes it is the hydraulic properties of the interburden, the coal-bearing units and the Pilliga Sandstone that are the most influential. The hydraulic enhancement after longwall mine collapse is not very influential across all model nodes because there are only three longwall mines compared to 10 open-cut mines. The relative insensitivity of drawdown to the other parameters does not mean these variables have no effect; rather it indicates the effect of these parameters is small compared to other parameters and is too small to be distinguished based on the number of samples in this design of experiment.

2.6.2.7 Observations and predictions
92 | Groundwater numerical modelling for the Namoi subregion
Com
pone
nt 2
: Mod
el-d
ata
anal
ysis
for t
he N
amoi
subr
egio
n
Figure 27 Scatter plots of the parameter values versus the predicted maximum difference in drawdown (dmax) at model node 66996 for all evaluated design-of-experiment model runs SI = sensitivity index; parameter names are described in Table 10.

2.6.2.7 Observations and predictions
Groundwater numerical modelling for the Namoi subregion | 93
Component 2: M
odel-data analysis for the Nam
oi subregion
References
AGE Pty Ltd (2011) Maules Creek Coal Project environmental assessment – Appendix M – groundwater impact assessment. Prepared for Aston Resources Ltd. Viewed 9 September 2015, http://www.whitehavencoal.com.au/environment/docs/appendix-m-groundwater-assessment-part-1.pdf.
Aryal SK, Northey J, Slatter E, Ivkovic K, Crosbie R, Janardhanan S, Peña-Arancibia J and Bell J (2018a) Observations analysis, statistical analysis and interpolation for the Namoi subregion. Product 2.1-2.2 for the Namoi subregion from the Northern Inland Catchments Bioregional Assessment. Department of the Environment and Energy, Bureau of Meteorology, CSIRO and Geoscience Australia, Australia. http://data.bioregionalassessments.gov.au/product/NIC/NAM/2.1-2.2.
Aryal SK, Peña-Arancibia J, Viney N, Yang A, Wang B, Hughes J, Merrin LE, Marvanek S, Davies P, Bell J, Zhang Y, Vaze J, Singh R and Kim S (2018b) Surface water numerical modelling for the Namoi subregion. Product 2.6.1 for the Namoi subregion from the Northern Inland Catchments Bioregional Assessment. Department of the Environment and Energy, Bureau of Meteorology, CSIRO and Geoscience Australia, Australia. http://data.bioregionalassessments.gov.au/product/NIC/NAM/2.6.1.
Boggabri Coal Pty Ltd (2014) Site water balance. Viewed 21 July 2015, https://idemitsu.com.au/uploads/files/bcenviro/EMPS/130212_BogSWB_Rev5.pdf.
Crosbie R, Peeters L and Carey H (2016) Groundwater modelling. Submethodology M07 from the Bioregional Assessment Technical Programme. Department of the Environment and Energy, Bureau of Meteorology, CSIRO and Geoscience Australia, Australia. http://data.bioregionalassessments.gov.au/submethodology/M07.
Doherty J and Welter D (2010) A short exploration of structural noise. Water Resources Research 46, W05525.
Douglas Partners (2010) Hydrogeological assessment – Appendix R Rocglen Coal Mine Extension Project environmental assessment. Prepared for Whitehaven Coal Limited. Viewed 30 August 2016, http://www.whitehavencoal.com.au/environment/docs/appendix-r-hydrogeological-assessment.pdf.
GeoTerra Pty Ltd (2008) Sunnyside Coal Project groundwater assessment. Specialist Consultant Studies Compendium, part 1. Prepared for Namoi Minint Pty Ltd. Viewed 16 December 2015, http://www.whitehavencoal.com.au/environment/docs/part-1-groundwater-assessment-a.pdf.
Herron NF, Peeters L, Crosbie R, Marvanek SP, Pagendam D, Ramage A, Rachakonda PK and Wilkins A (2018) Groundwater numerical modelling for the Hunter subregion. Product 2.6.2 for the Hunter subregion from the Northern Sydney Basin Bioregional Assessment. Department of the Environment and Energy, Bureau of Meteorology, CSIRO and Geoscience Australia, Australia. http://data.bioregionalassessments.gov.au/product/NSB/HUN/2.6.2.

2.6.2.7 Observations and predictions
94 | Groundwater numerical modelling for the Namoi subregion
Com
pone
nt 2
: Mod
el-d
ata
anal
ysis
for t
he N
amoi
subr
egio
n HydroSimulations (2015) Narrabri Mine Modification 5 environmental assessment Appendix B – groundwater assessment. Prepared for Narrabri Coal Operations Pty Ltd. Viewed 08 March 2016, http://www.whitehavencoal.com.au/environment/docs/pa-080144-mod-5-appendix-b-groundwater-assessment.pdf.
Merrick NP and Alkhatib M (2012) Tarrawonga Coal Project – environmental assessment: Appendix A – groundwater assessment. Prepared for Tarrawonga Coal Pty Ltd. Viewed 01 August 2016, http://www.whitehavencoal.com.au/environment/docs/01185252-appendix-a-groundwater-assessment-part-1.pdf.
Merrick NP and Alkhatib M (2013) Vickery Coal Project environmental impact statement – Appendix A: groundwater assessment. Prepared for Whitehaven Coal Limited. Viewed 16 December 2015, http://www.whitehavencoal.com.au/environment/docs/appendix-a-groundwater-assessment-part-1.pdf.
Nicol C, Liu T and Merrick NP (2014) Caroona Coal Project: gateway application – Appendix C: preliminary groundwater assessment. Prepared for BHP Billiton.
Peeters L, Pagendam D, Gao L, Hosack G, Jiang W and Henderson BL (2016) Propagating uncertainty through models. Submethodology M09 from the Bioregional Assessment Technical Programme. Department of the Environment and Energy, Bureau of Meteorology, CSIRO and Geoscience Australia, Australia. http://data.bioregionalassessments.gov.au/submethodology/M09.
Plischke E, Borgonovo E and Smith CL (2013) Global sensitivity measures from given data. European Journal of Operational Research 226, 536–550.
Santner TJ, Williams BJ and Notz WI (2003) The design and analysis of computer experiments. Springer, New York.
Santos (2012) Surface water management. Presentation to Santos Community Committee – Narrabri. Viewed 7 September 2016, https://narrabrigasproject.com.au/uploads/2015/10/SantosCCC_Narrabri_minutes_9Oct2012_presentation.pdf.
White JT, Doherty JE and Hughes JD (2014) Quantifying the predictive consequences of model error with linear subspace analysis. Water Resources Research 50, 1152–1173. Viewed 20 September 2016, http://dx.doi.org/10.1002/2013WR014767.
WRM Water and Environment (2013) Watermark Coal Project environmental impact statement – Appendix S surface water impact assessment. Prepared for Shenhua Watermark Coal Pty Limited. Viewed on 8 September 2015, https://majorprojects.affinitylive.com/public/f37282787960f34d67369c3c8633cd03/20.%20Watermark%20Coal%20Project%20EIS%20-%20Appendix%20S%20-%20Surface%20Water%20Impact%20Assessment.pdf.

2.6.2.7 Observations and predictions
Groundwater numerical modelling for the Namoi subregion | 95
Component 2: M
odel-data analysis for the Nam
oi subregion
Datasets
Dataset 1 NSW Office of Water (2014) Hydstra Groundwater Measurement Update - NSW Office of Water, Nov2013. Bioregional Assessment Source Dataset. Viewed 05 September 2016, http://data.bioregionalassessments.gov.au/dataset/08b34518-c947-4665-82e5-c144b5b24e01.
Dataset 2 Bioregional Assessment Programme (2016) Namoi groundwater model input shapefiles. Bioregional Assessment Derived Dataset. Viewed 16 December 2016, http://data.bioregionalassessments.gov.au/dataset/fb22671f-8b47-48e2-9fcd-232543fb8ad6.
Dataset 3 NSW Office of Water (2014) Namoi Hydstra surface water time series v1 extracted 140814. Bioregional Assessment Source Dataset. Viewed 05 September 2016, http://data.bioregionalassessments.gov.au/dataset/10fc9dd2-fc95-4357-86f1-c59e69678c5c.

2.6.2.7 Observations and predictions
96 | Groundwater numerical modelling for the Namoi subregion
Com
pone
nt 2
: Mod
el-d
ata
anal
ysis
for t
he N
amoi
subr
egio
n

2.6.2.8 Uncertainty analysis
Groundwater numerical modelling for the Namoi subregion | 97
Component 2: M
odel-data analysis for the Nam
oi subregion
2.6.2.8 Uncertainty analysis
Summary
The uncertainty analysis is consistent with the approach described in companion submethodology M09 (as listed in Table 1) for propagating uncertainty through models (Peeters et al., 2016). The same 37 parameters investigated in the sensitivity analysis are considered in the uncertainty analysis of the groundwater model for the Namoi subregion.
Prior distributions for each parameter assume a uniform distribution, with no covariance of parameters. Groundwater level observations from a limited set of observation sites, observed streamflow data and estimates of coal resource development water makes are used to constrain the parameter space. Parameter sets for groundwater levels are considered acceptable when they result in average groundwater level predictions that are within 10 m of observed historical averages at observation sites within 30 km of the prediction site. Acceptable parameter sets for modelled surface water – groundwater fluxes are those in which the average of the simulated historical surface water – groundwater flux is less than the 20th percentile of observed streamflow. Acceptable parameter sets for the mine water makes are those in which the simulated coal resource development water makes are within an order of magnitude of estimations from the proponents’ environmental impact statement (EIS) modelling.
Predictions close to Narrabri and Gunnedah are well constrained, while the observation data are not able to greatly reduce the predictive uncertainty of drawdown due to additional coal resource development in the Pilliga area.
Drawdown due to additional coal resource development was analysed at 14,209 model nodes within the model. The predicted drawdown is less than 2 m for three-quarters of the model nodes and less than 0.2 m for two-thirds of these model nodes. Drawdown due to additional coal resource development is localised around the additional coal resource development mines. At a distance of about 10 km from the mine sites, there is only about a 5% chance of additional drawdown exceeding 0.2 m. In general, tmax occurs relatively quickly in the immediate vicinity of the mines, but progressively later with increasing distance from the mines. In most cases the drawdown is attenuated at the alluvium boundary due to the high transmissivity and so the largest magnitude drawdowns occur in the consolidated rock units rather than the alluvium.
2.6.2.8.1 Factors included in formal uncertainty analysis
Section 2.6.2.7 described the available observations, predictions required of the model and sampling of parameter space in the design of experiment for sensitivity and uncertainty analyses. The same parameters evaluated in the sensitivity analysis are considered in the formal uncertainty analysis, although the sensitivity analysis indicated that only a limited number of these parameters influence the predictions.

2.6.2.8 Uncertainty analysis
98 | Groundwater numerical modelling for the Namoi subregion
Com
pone
nt 2
: Mod
el-d
ata
anal
ysis
for t
he N
amoi
subr
egio
n As described in companion submethodology M09 (as listed in Table 1) for propagating uncertainty through models (Peeters et al., 2016) and in Section 2.6.2.1, the parameter space is constrained by the observations relevant to the predictions through a Monte Carlo sampling using the Approximate Bayesian Computation (ABC) methodology (Beaumont et al., 2002; Vrugt and Sadegh, 2013). As in any Bayesian methodology, a set of prior parameter distributions needs to be defined that encapsulates the current information and knowledge, including correlation or covariance of parameters. This is described in Section 2.6.2.8.1.1.
The prior parameter distributions are constrained by observations with the ABC methodology to generate posterior parameter distributions. The posterior parameter distributions are then used to generate the final set of predictions from which the uncertainty of drawdown due to additional coal resource development (i.e. maximum difference in drawdown, dmax) and year of maximum change (tmax) predictions can be characterised. The process of constraining the prior parameter distributions by observations is described and discussed in Section 2.6.2.8.1.2, while the resulting posterior predictive distributions are detailed in Section 2.6.2.8.1.3.
The uncertainty analysis is focused on predictions of dmax and tmax due to additional coal resource development. The surface water – groundwater fluxes generated along the river network within the groundwater model domain are inputs to the Namoi river model (see companion product 2.6.1 for the Namoi subregion (Aryal et al., 2018b)) and included in the characterisation of uncertainty of streamflow predictions in that product. Results from the groundwater modelling are summarised as a water balance across the entire modelling domain in companion product 2.5 for the Namoi subregion (Crosbie et al., 2018).
2.6.2.8.1.1 Prior parameter distributions
The model parameters are not varied directly in the sensitivity and uncertainty analyses, but rather through a set of offsets, multipliers or coefficients of depth-dependent relationships. The initial values of the model parameters and the ranges of the offsets, multipliers and coefficients listed in Table 10 are based on information available about the groundwater systems, summarised in companion product 2.1-2.2 (Aryal et al., 2018a) and companion product 2.3 (Herr et al., 2018) for the Namoi subregion. The ranges of parameter values reflect the uncertainty in characterising the system due to spatial variability and incomplete knowledge of the system.
The information available was not deemed sufficient to justify any other distribution than a uniform distribution. The prior parameter distributions of the parameters listed in Table 10 are all uniform distributions with ranges corresponding to the minimum and maximum values given in the table. No covariance between parameters is specified as insufficient information is available to justify specifying such covariance. Assuming no correlation between parameters is a conservative assumption as it is likely to result in wider predictive intervals.
2.6.2.8.1.2 Posterior parameter distributions
The posterior parameter distribution for each prediction is obtained by accepting the parameter combinations from the design of experiment model runs when the run satisfies predefined objective function thresholds.

2.6.2.8 Uncertainty analysis
Groundwater numerical modelling for the Namoi subregion | 99
Component 2: M
odel-data analysis for the Nam
oi subregion
The objective functions for the Namoi subregion groundwater model summarise its performance in reproducing historical groundwater levels and surface water – groundwater fluxes and predicting coal resource development water production rates, compared to estimates from the coal resource development proponents. The ABC methodology requires not only definition of an objective function, but also the threshold value above which the parameter set is deemed to be acceptable. Ideally, this threshold is based on an independent estimate of the observation error.
These three objective functions are defined for each individual prediction (i.e. each model node for which a dmax and tmax value will be computed). The contribution of each observation (groundwater level, surface water – groundwater flux or coal resource development water production rate) is weighted based on the distance between the prediction location and the observation so that matching observations close to the prediction location is more important than matching observations that are further removed from the prediction location.
For each prediction, 𝑝𝑝, a set of three vectors, 𝑑𝑑ℎ𝑝𝑝,𝑑𝑑𝑚𝑚
𝑝𝑝 ,𝑑𝑑𝑟𝑟𝑝𝑝, is defined where the subscripts ℎ, 𝑚𝑚 and
𝑟𝑟 stand for groundwater level, mine water production rate and surface water – groundwater flux, respectively.
The vector 𝑑𝑑ℎ𝑝𝑝 is the collection of distances 𝑑𝑑ℎ,𝑖𝑖
𝑝𝑝 , the distance between groundwater level observation 𝑖𝑖 and prediction 𝑝𝑝, for all 𝑗𝑗 observations:
𝑑𝑑ℎ𝑝𝑝 = �𝑑𝑑ℎ,1
𝑝𝑝 ,⋯ ,𝑑𝑑ℎ,𝑗𝑗𝑝𝑝 � (9)
𝑑𝑑ℎ,𝑖𝑖𝑝𝑝 = ��𝑥𝑥𝑝𝑝 − 𝑥𝑥ℎ,𝑖𝑖�
2 + �𝑦𝑦𝑝𝑝 − 𝑦𝑦ℎ,𝑖𝑖�2
(10)
The vector 𝑑𝑑𝑚𝑚𝑝𝑝 is the collection of distances 𝑑𝑑𝑚𝑚,𝑖𝑖
𝑝𝑝 , the shortest distance between coal resource development 𝑖𝑖 and prediction 𝑝𝑝, for all 𝑙𝑙 coal resource developments:
𝑑𝑑𝑚𝑚𝑝𝑝 = �𝑑𝑑𝑚𝑚,1
𝑝𝑝 ,⋯ ,𝑑𝑑𝑚𝑚,𝑙𝑙𝑝𝑝 � (11)
𝑑𝑑𝑚𝑚,𝑖𝑖𝑝𝑝 = ��𝑥𝑥𝑝𝑝 − 𝑥𝑥𝑚𝑚,𝑖𝑖�
2 + �𝑦𝑦𝑝𝑝 − 𝑦𝑦𝑚𝑚,𝑖𝑖�2
(12)
The vector 𝑑𝑑𝑟𝑟𝑝𝑝 is the collection of distances 𝑑𝑑𝑟𝑟,𝑖𝑖
𝑝𝑝 , the shortest distance between river reach 𝑖𝑖 and prediction 𝑝𝑝, for all 𝑘𝑘 river reaches:
𝑑𝑑𝑟𝑟𝑝𝑝 = �𝑑𝑑𝑟𝑟,1
𝑝𝑝 ,⋯ ,𝑑𝑑𝑟𝑟,𝑘𝑘𝑝𝑝 � (13)
𝑑𝑑𝑟𝑟,𝑖𝑖𝑝𝑝 = ��𝑥𝑥𝑝𝑝 − 𝑥𝑥𝑟𝑟,𝑖𝑖�
2 + �𝑦𝑦𝑝𝑝 − 𝑦𝑦𝑟𝑟,𝑖𝑖�2
(14)

2.6.2.8 Uncertainty analysis
100 | Groundwater numerical modelling for the Namoi subregion
Com
pone
nt 2
: Mod
el-d
ata
anal
ysis
for t
he N
amoi
subr
egio
n The distance weighting function 𝑓𝑓𝑤𝑤(𝑑𝑑) is defined as:
𝑓𝑓𝑤𝑤(𝑑𝑑) = 1 − tanh �𝑑𝑑𝑤𝑤�
(15)
Coefficient 𝑤𝑤 controls how rapidly the weight decreases with increasing distance. The tanh function allows the weight of an observation to decrease almost linearly with distance and to gradually become zero at a distance of approximately 3𝑤𝑤. This is illustrated in Figure 28 for different values of 𝑤𝑤. For groundwater level observations 𝑤𝑤 is set to 10 km; for mine water production rates and surface water – groundwater fluxes it is set to 20 km. This implies that a groundwater level observation residual will get a zero weight if it is more than 30 km from the prediction location, while the weight for mines and river reaches will only become zero when they are more than 60 km from the prediction location. These 𝑤𝑤 values represent a pragmatic trade-off between capturing local and regional groundwater flow dynamics.
Figure 28 Weights of observations in objective function of the distance between observation and prediction for different values of w d = distance between observation and prediction (km); w = distance weighting coefficient Data: Bioregional Assessment Programme (Dataset 1)
Each objective function is a weighted sum of residuals. The acceptance criterion for an objective function is the objective function corresponding to a predefined acceptable threshold residual.

2.6.2.8 Uncertainty analysis
Groundwater numerical modelling for the Namoi subregion | 101
Component 2: M
odel-data analysis for the Nam
oi subregion
For groundwater level observations, the criterion becomes:
𝑂𝑂𝐹𝐹ℎ : �𝑟𝑟𝑖𝑖𝑛𝑛𝑖𝑖𝑓𝑓𝑤𝑤(
𝑗𝑗
𝑖𝑖=1
𝑑𝑑ℎ,𝑖𝑖𝑝𝑝 )�ℎ𝑜𝑜𝑜𝑜𝑜𝑜,𝑖𝑖 − ℎ𝑜𝑜𝑖𝑖𝑚𝑚,𝑖𝑖�
2 < �𝑟𝑟𝑖𝑖𝑛𝑛𝑖𝑖𝑓𝑓𝑤𝑤(
𝑗𝑗
𝑖𝑖=1
𝑑𝑑ℎ,𝑖𝑖𝑝𝑝 )(10)2 (16)
with 𝑟𝑟𝑖𝑖 the distance of observation 𝑖𝑖 to the nearest blue line network, 𝑛𝑛𝑖𝑖 the number of observations at that location, ℎ𝑜𝑜𝑜𝑜𝑜𝑜,𝑖𝑖 the head observation and ℎ𝑜𝑜𝑖𝑖𝑚𝑚,𝑖𝑖 the simulated equivalent. The distance between the observation and the nearest blue line network is included in the objective function to reduce the weight of groundwater level observations in the immediate vicinity of rivers. At these locations, groundwater level observations are dominated by groundwater dynamics at a spatial and temporal scale that is beyond the resolution of the model. Matching such observations therefore has great potential to bias parameter estimates. Further away from the river, groundwater level observations receive a greater weight as these observations are less affected by surface water – groundwater interaction and therefore will be able to better constrain hydraulic properties.
This objective function accepts simulations with a head residual less than 10 m. As the range of groundwater level observations spans about 450 m (see Section 2.6.2.7.1.1), this threshold implies that the accepted parameter combinations will at least have a normalised root mean squared error of 2.5%, which is generally considered to be acceptable for a regional groundwater model (Barnett et al., 2012). The 10 m acceptance reflects observation uncertainty, positional uncertainty (surveying), resolution uncertainty (point measurement vs grid cell) and local structural noise and boundary condition uncertainty (e.g. local pumping rates).
For coal resource development water production rates, the criterion becomes:
𝑂𝑂𝐹𝐹𝑚𝑚 : �𝑓𝑓𝑤𝑤(𝑙𝑙
𝑖𝑖=1
𝑑𝑑𝑚𝑚,𝑖𝑖𝑝𝑝 )�log�𝑄𝑄𝑜𝑜𝑜𝑜𝑜𝑜,𝑖𝑖
𝑚𝑚 � − log�𝑄𝑄𝑜𝑜𝑖𝑖𝑚𝑚,𝑖𝑖𝑚𝑚 ��2 < �𝑓𝑓𝑤𝑤(
𝑙𝑙
𝑖𝑖=1
𝑑𝑑𝑚𝑚,𝑖𝑖𝑝𝑝 )(1)2 (17)
with 𝑄𝑄𝑜𝑜𝑜𝑜𝑜𝑜,𝑖𝑖𝑚𝑚 the observed water production rate and 𝑄𝑄𝑜𝑜𝑖𝑖𝑚𝑚,𝑖𝑖
𝑚𝑚 the simulated equivalent. This objective function accepts simulations in which the mine water production rate is within an order of magnitude of the rate estimated by the various proponents in the reports supporting environmental impact statements for their development. The order of magnitude threshold allows for the water production rates to deviate from the proponents’ estimates in order to be consistent with the conceptualisation and parameterisation of the bioregional assessment (BA) model while ensuring at the same time that the stress on the system is still comparable with the planned extraction rates.
For the surface water – groundwater flux, the criterion becomes:
𝑂𝑂𝐹𝐹𝑟𝑟 : �𝑓𝑓𝑤𝑤(𝑘𝑘
𝑖𝑖=1
𝑑𝑑𝑟𝑟,𝑖𝑖𝑝𝑝 )�
𝑄𝑄𝑜𝑜𝑖𝑖𝑚𝑚,𝑖𝑖𝑟𝑟 𝑄𝑄𝑜𝑜𝑜𝑜𝑜𝑜,𝑖𝑖𝑟𝑟 �
2
< �𝑓𝑓𝑤𝑤(𝑘𝑘
𝑖𝑖=1
𝑑𝑑𝑟𝑟,𝑖𝑖𝑝𝑝 )(1)2 (18)

2.6.2.8 Uncertainty analysis
102 | Groundwater numerical modelling for the Namoi subregion
Com
pone
nt 2
: Mod
el-d
ata
anal
ysis
for t
he N
amoi
subr
egio
n with 𝑄𝑄𝑜𝑜𝑜𝑜𝑜𝑜,𝑖𝑖𝑟𝑟 the 20th percentile of streamflow and 𝑄𝑄𝑜𝑜𝑖𝑖𝑚𝑚,𝑖𝑖
𝑟𝑟 the simulated surface water – groundwater flux. This objective function accepts simulations for which the surface water – groundwater flux is less than the 20th percentile of observed streamflow. Note that rivers that are simulated to be losing will always meet this criterion. This threshold recognises that as the Namoi river system is largely regulated and dominantly losing water to groundwater, it is unlikely that the surface water – groundwater flux accounts for more than 20% of streamflow. Locally, more detailed information on the connection status of river reaches is available (see Section 2.1.5 in companion product 2.1-2.2 for the Namoi subregion (Aryal et al., 2018a)) or on the surface water – groundwater flux. The local connection status is, however, very much influenced by the magnitude and timing of groundwater pumping and riverbed hydraulic properties. Without a commensurate effort in estimating historical groundwater pumping and riverbed hydraulic properties, constraining the model with such local information will lead to biased parameter estimates.
2.6.2.8.1.3 Predictions
For all of the model nodes at which the 95th percentile of drawdown for the design-of-experiment runs is in excess of 0.01 m, a posterior predictive distribution is generated by filtering the results of the design of experiment with the objective functions and corresponding thresholds as outlined above. At model nodes where the 95th percentile of drawdown for the design-of-experiment runs is less than 0.01 m, the predicted dmax is set to 0 and tmax to 2102. The choice for the 0.01 m threshold is linked to the observation threshold, as any change in groundwater level of less than 0.01 m will not be able to be measured reliably. The constrained posterior parameter combinations, by definition, are a subset of the prior parameter combinations.
Figure 29 shows the fraction of evaluated parameter combinations of the design of experiment that meets the groundwater level (Figure 29b), coal resource development water production rate (Figure 29c), surface water – groundwater flux acceptance criteria (Figure 29d) and the fraction that meet all three criteria combined (Figure 29a) at the model nodes where design of experiment runs indicate potential measurable drawdown. Acceptance rate values in excess of 0.9 indicate that most parameter combinations evaluated in the design of experiment produce simulated equivalents that are within the specified acceptable range of the relevant observations.
In Figure 29b, acceptance rate based on groundwater level observations, the predictions in the Pilliga area have very high acceptance rates. This is because there are no groundwater level observations in that region and the predictions in that region are thus not constrained by groundwater level observations. To the east, in the Upper Namoi area, more observations are available and the predictions are constrained. However, the smallest acceptance rates are still in excess of 60%, indicating that more than half of the parameter combinations result in simulated values within the acceptable range of the observations.
The coal resource water production rates provide a stronger constrain on the parameters, especially in the south-east, where acceptance rates are between 50% and 60%. Contrary to the groundwater level criterion, the coal resource water production rate does constrain the predictions in the Pilliga areas, albeit to a lesser extent than in the south-east of the model domain.
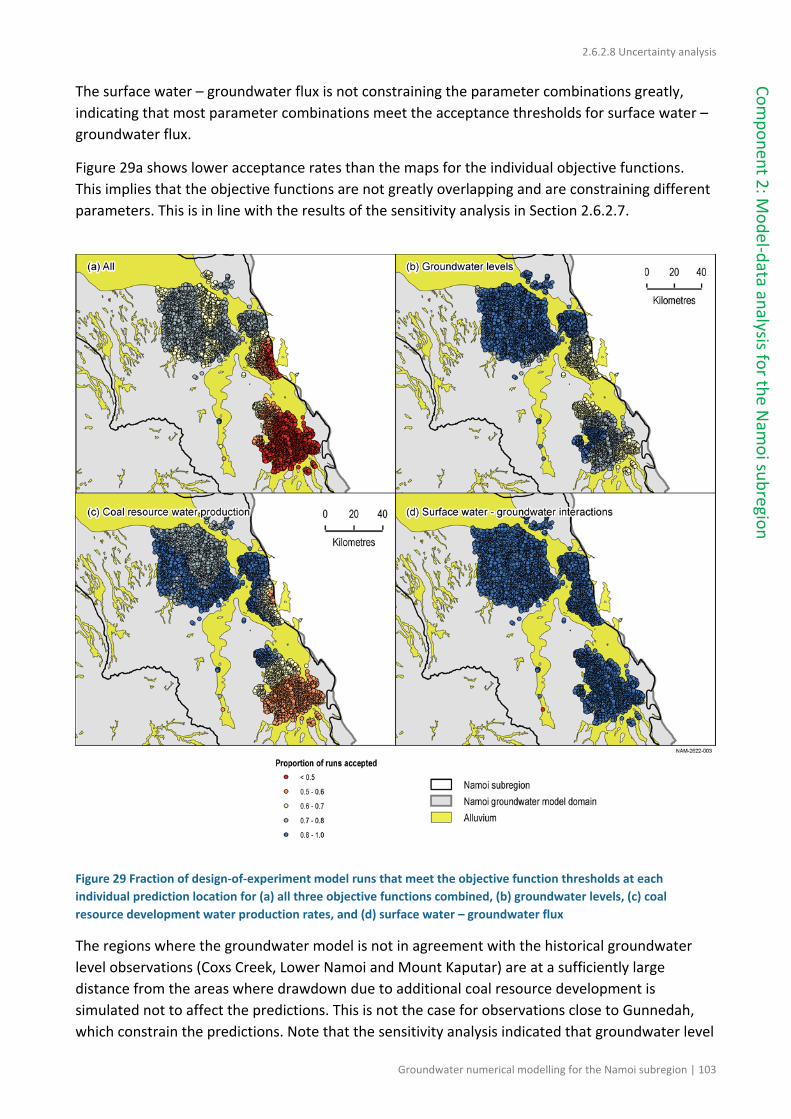
2.6.2.8 Uncertainty analysis
Groundwater numerical modelling for the Namoi subregion | 103
Component 2: M
odel-data analysis for the Nam
oi subregion
The surface water – groundwater flux is not constraining the parameter combinations greatly, indicating that most parameter combinations meet the acceptance thresholds for surface water – groundwater flux.
Figure 29a shows lower acceptance rates than the maps for the individual objective functions. This implies that the objective functions are not greatly overlapping and are constraining different parameters. This is in line with the results of the sensitivity analysis in Section 2.6.2.7.
Figure 29 Fraction of design-of-experiment model runs that meet the objective function thresholds at each individual prediction location for (a) all three objective functions combined, (b) groundwater levels, (c) coal resource development water production rates, and (d) surface water – groundwater flux
The regions where the groundwater model is not in agreement with the historical groundwater level observations (Coxs Creek, Lower Namoi and Mount Kaputar) are at a sufficiently large distance from the areas where drawdown due to additional coal resource development is simulated not to affect the predictions. This is not the case for observations close to Gunnedah, which constrain the predictions. Note that the sensitivity analysis indicated that groundwater level

2.6.2.8 Uncertainty analysis
104 | Groundwater numerical modelling for the Namoi subregion
Com
pone
nt 2
: Mod
el-d
ata
anal
ysis
for t
he N
amoi
subr
egio
n observations can constrain the river stage offset and to a lesser extent the diffuse recharge and horizontal hydraulic conductivity of the alluvium, but are not sensitive to the parameters that affect predictions of drawdown due to additional coal resource development (hydraulic conductivity and storage of coal-bearing units and interburden). The water production rates are sensitive to those parameters and the water production rate objective function is able to constrain the predictions of dmax and tmax.
The resulting maximum difference in drawdown (dmax) due to additional coal resource development at the regional watertable and year of maximum change are summarised using the 5th, 50th and 95th percentiles. Figure 30a and Figure 30b show the histograms of the 5th, 50th and 95th percentile of dmax and tmax, respectively, at the model nodes shown in Figure 29. A log10 scale is used on the y-axis as the hydrological change is very skewed. The median drawdown due to additional coal resource development exceeds 0.2 m only at 527 model nodes, while the 95th percentile of drawdown due to additional coal resource development exceeds 2 m at 827 model nodes. Due to the high density of model nodes, many model nodes fall within mine footprints. At these model nodes, drawdown due to additional coal resource development can reach up to 260 m.
The histograms of tmax (Figure 30b) show that at most model nodes, the maximum difference in drawdown (dmax) due to additional coal resource development occurs after 2040, with a very large proportion of model nodes that have a tmax equal to 2102. This is the value assigned to all model nodes for which dmax is equal to 0 m or dmax is not realised within the simulation period.

2.6.2.8 Uncertainty analysis
Groundwater numerical modelling for the Namoi subregion | 105
Component 2: M
odel-data analysis for the Nam
oi subregion
Figure 30 Histograms of the 5th, 50th and 95th percentile of (a) additional drawdown at the regional watertable and (b) year of maximum change; plot (c) shows the additional drawdown in the range from 0 m to 2.5 m Additional drawdown is the maximum difference in drawdown (dmax) between the coal resource development pathway (CRDP) and baseline, due to additional coal resource development; tmax = year of maximum change. A tmax value of 2102 is assigned to all predictions in which the dmax is not realised during the simulation period or the dmax is equal to 0 m. Model nodes within mine footprints have not been excluded from the histograms. Data: Bioregional Assessment Programme (Dataset 1)
Figure 31, Figure 32 and Figure 33 show the probability of drawdown due to additional coal resource development at the regional watertable exceeding 0.2 m, 2 m and 5 m, respectively. The smaller inset maps show the probability of drawdown under baseline and under the coal resource development pathway (CRDP) exceeding 0.2 m, 2 m and 5 m, respectively.
The contour of a 5% probability of the drawdown due to additional coal resource development (i.e. maximum difference in drawdown between the CRDP and baseline) exceeding 0.2 m is used to define the zone of potential hydrological change. This polygon delineates the analysis extent for the receptor impact modelling related to groundwater in following BA products.
The zone of potential hydrological change coincides approximately with a 10 km buffer around the mine footprints, except in the Pilliga area. The combined effect of Narrabri mine and the Narrabri Gas Project result in an extensive area with a probability of less than 50% of exceeding 0.2 m drawdown due to additional coal resource development. The probability of exceeding 2 m drawdown due to additional coal resource development is limited to the area close to Narrabri mine.

2.6.2.8 Uncertainty analysis
106 | Groundwater numerical modelling for the Namoi subregion
Com
pone
nt 2
: Mod
el-d
ata
anal
ysis
for t
he N
amoi
subr
egio
n The zone of potential hydrological change overlaps with the alluvium only south of the Vickery mine and between the Watermark and Caroona mines. The probability of exceeding 0.2 m is less than 50% at these locations and the exceedance probability of 2 m drawdown due to additional coal resource development reduces to approximately zero in the alluvium (Figure 32). The probability of exceeding 2 m drawdown due to additional coal resource development is generally only above 5% within 5 km of the mine footprints of the larger mines.
Figure 31 Probability of drawdown at the regional watertable exceeding 0.2 m under baseline and under the coal resource development pathway (CRDP), and the difference in results between baseline and CRDP, which is the change due to additional coal resource development (ACRD) The difference in drawdown between the coal resource development pathway (CRDP) and baseline is due to additional coal resource development (ACRD). Drawdown under the baseline is relative to drawdown with no coal resource development; likewise, drawdown under the CRDP is relative to drawdown with no coal resource development. Data: Bioregional Assessment Programme (Dataset 1)

2.6.2.8 Uncertainty analysis
Groundwater numerical modelling for the Namoi subregion | 107
Component 2: M
odel-data analysis for the Nam
oi subregion
Figure 32 Probability of drawdown at the regional watertable exceeding 2 m under baseline and under the coal resource development pathway (CRDP), and the difference in results between baseline and CRDP, which is the change due to additional coal resource development (ACRD) The difference in drawdown between the coal resource development pathway (CRDP) and baseline is due to additional coal resource development (ACRD). Drawdown under the baseline is relative to drawdown with no coal resource development; likewise, drawdown under the CRDP is relative to drawdown with no coal resource development. Data: Bioregional Assessment Programme (Dataset 1)

2.6.2.8 Uncertainty analysis
108 | Groundwater numerical modelling for the Namoi subregion
Com
pone
nt 2
: Mod
el-d
ata
anal
ysis
for t
he N
amoi
subr
egio
n
Figure 33 Probability of drawdown at the regional watertable exceeding 5 m under baseline and under the coal resource development pathway (CRDP), and the difference in results between baseline and CRDP, which is the change due to additional coal resource development (ACRD) The difference in drawdown between the coal resource development pathway (CRDP) and baseline is due to additional coal resource development (ACRD). Drawdown under the baseline is relative to drawdown with no coal resource development; likewise, drawdown under the CRDP is relative to drawdown with no coal resource development. Data: Bioregional Assessment Programme (Dataset 1)
2.6.2.8.1.4 Comparison with results from other models
Section 2.6.2.2 provides a list of groundwater models that have been developed on behalf of various coal resource development proponents and government agencies in the Namoi subregion. These are deterministic models, which means they provide a single estimate of hydrological change based on a single parameter combination that is considered optimal, whereas the Namoi subregion groundwater modelling package is designed to provide probabilistic ensembles of predictions, based on a range of likely parameter combinations.

2.6.2.8 Uncertainty analysis
Groundwater numerical modelling for the Namoi subregion | 109
Component 2: M
odel-data analysis for the Nam
oi subregion
The primary predictions from the Namoi subregion groundwater model are drawdown and year of maximum change (tmax) whereas the existing models are designed to provide changes in groundwater levels and fluxes at selected times in the future. Further complicating direct comparisons between model outputs are the differences in conceptualisation, boundary conditions and, critically, the implementation of coal resource development.
Given these points of difference, it is not considered warranted to make direct comparisons between results from these models and from the groundwater model developed for the Namoi subregion.
The only model that is comparable in extent and the developments included in the modelling is the Namoi Catchment Water Study (NCWS) model. Figure 34 and Figure 35 show the 5th, 50th and 95th percentiles of drawdown at the regional watertable under baseline and under CRDP (relative to no coal resource development), respectively, together with the contours of drawdown exceeding 0.2 m and 2 m from the NCWS. For completeness, Figure 36 shows drawdown due to additional coal resource development (the difference in drawdown between CRDP and baseline) at the regional watertable. This figure has no NCWS drawdown contours as no equivalent results are available in the report. Contours of the Gunnedah Basin Regional Model (GBRM) are not shown as this model only includes two developments, the Narrabri Gas Project and the Narrabri South coal mine.
These figures show that the NCWS results overall can be considered conservative as they are closer in extent to the 95th percentile of drawdown than to the 50th percentile. Noteworthy differences are that the NCWS drawdown contours extend across the interfluvium between Coxs Creek and Upper Namoi. Contrary to the NCWS model, the Namoi subregion groundwater model does not simulate coal seam gas (CSG) development in that part of the sedimentary basin as it is not part of the CRDP. This is most likely also the reason why in the south, the NCWS model does indicate that drawdowns extend into the alluvium, whereas the results of the Namoi subregion model show very limited impact in the alluvium. West of Gunnedah, drawdown is simulated in the baseline Namoi subregion model due to Sunnyside Mine (Figure 34), which is not included in the NCWS.

2.6.2.8 Uncertainty analysis
110 | Groundwater numerical modelling for the Namoi subregion
Com
pone
nt 2
: Mod
el-d
ata
anal
ysis
for t
he N
amoi
subr
egio
n
Figure 34 5th, 50th and 95th percentile of drawdown at the regional watertable under baseline NCWS = Namoi Catchment Water Study The difference in drawdown between the coal resource development pathway (CRDP) and baseline is due to additional coal resource development (ACRD). Drawdown under the baseline is relative to drawdown with no coal resource development (baseline drawdown); likewise, drawdown under the CRDP is relative to drawdown with no coal resource development (CRDP drawdown). Data: Bioregional Assessment Programme (Dataset 1)

2.6.2.8 Uncertainty analysis
Groundwater numerical modelling for the Namoi subregion | 111
Component 2: M
odel-data analysis for the Nam
oi subregion
Figure 35 5th, 50th and 95th percentile of drawdown at the regional watertable under the coal resource development pathway (CRDP) NCWS = Namoi Catchment Water Study The difference in drawdown between the coal resource development pathway (CRDP) and baseline is due to additional coal resource development (ACRD). Drawdown under the baseline is relative to drawdown with no coal resource development (baseline drawdown); likewise, drawdown under the CRDP is relative to drawdown with no coal resource development (CRDP drawdown). Data: Bioregional Assessment Programme (Dataset 1)

2.6.2.8 Uncertainty analysis
112 | Groundwater numerical modelling for the Namoi subregion
Com
pone
nt 2
: Mod
el-d
ata
anal
ysis
for t
he N
amoi
subr
egio
n
Figure 36 5th, 50th and 95th percentile of drawdown at the regional watertable due to additional coal resource development (ACRD) Additional drawdown is the maximum difference in drawdown (dmax) for one realisation within an ensemble of groundwater modelling runs, obtained by choosing the maximum of the time series of differences between two futures The difference in drawdown between the coal resource development pathway (CRDP) and baseline is due to additional coal resource development (ACRD). Drawdown under the baseline is relative to drawdown with no coal resource development; likewise, drawdown under the CRDP is relative to drawdown with no coal resource development. Data: Bioregional Assessment Programme (Dataset 1)
2.6.2.8.2 Factors not included in formal uncertainty analysis
The major assumptions and model choices underpinning the Namoi subregion groundwater model are listed in Table 14. The goal of the table is to provide a non-technical audience with a systematic overview of the model assumptions, their justification and effect on predictions, as judged by the modelling team. This table is aimed to assist in an open and transparent review of the modelling.

2.6.2.8 Uncertainty analysis
Groundwater numerical modelling for the Namoi subregion | 113
Component 2: M
odel-data analysis for the Nam
oi subregion
In the table each assumption is scored on four attributes using three levels: ‘high’, ‘medium’ and ‘low’. Beneath the table, each of the assumptions are discussed in detail, including the rationale for the scoring.
The data column is the degree to which the question ‘if more or different data were available, would this assumption/choice still have been made?’ would be answered positively. A ‘low’ score means that the assumption is not influenced by data availability while a ‘high’ score would indicate that this choice would be revisited if more data were available. Closely related is the resources attribute. This column captures the extent to which resources available for the modelling, such as computing resources, personnel and time, influenced this assumption or model choice. Again, a ‘low’ score indicates the same assumption would have been made with unlimited resources, while a ‘high’ value indicates the assumption is driven by resource constraints. The third attribute deals with the technical and computational issues. ‘High’ is assigned to assumptions and model choices that are dominantly driven by computational or technical limitations of the model code. These include issues related to spatial and temporal resolution of the models.
The final, and most important column, is the effect of the assumption or model choice on the predictions. This is a qualitative assessment by the modelling team of the extent to which a model choice will affect the model predictions, with ‘low’ indicating a minimal effect and ‘high’ a large effect. Especially for the assumptions with a large potential impact on the predictions, it will be discussed that the precautionary principle is applied; that is, the hydrological change is over rather than under estimated.

2.6.2.8 Uncertainty analysis
114 | Groundwater numerical modelling for the Namoi subregion
Com
pone
nt 2
: Mod
el-d
ata
anal
ysis
for t
he N
amoi
subr
egio
n Table 14 Qualitative uncertainty analysis for the groundwater model of the Namoi subregion
No. Assumption of model choice Data Resources Technical Effect on predictions
1 Single geological and conceptual model High Medium Medium Low
2 Lateral and internal boundary conditions Medium Medium Medium Low
3 Implementation of coal mine developments High Low Low High
4 Implementation of coal seam gas developments High Low Low High
5 Spatial variability of hydraulic properties Medium Medium Medium Medium
6 Depth-varying parameterisation of hydraulic properties High Low Low High
7 Hydraulic enhancement after longwall mine collapse High Low Low Medium
8 Specification of prior parameter distributions High Low Low Medium
9 Distance-based weighting of observations Medium Medium Low Medium
10 Constraining parameters with groundwater level observations
High Medium Low Medium
11 Constraining parameters with streamflow observations High Medium Low Medium
12 Zonal recharge from chloride mass balance High Low Low Low
13 Simulation period from 2012 to 2102 Low High Medium Low
14 Non-mining groundwater extraction rates Low Low Low Low
15 Aggregating hydrostratigraphic units High High Low Low
2.6.2.8.2.1 Single geological and conceptual model
The Namoi subregion groundwater model is based on the geological model discussed in companion product 2.1-2.2 (Aryal et al., 2018a) and the conceptual model discussed in companion product 2.3 (Herr et al., 2018). Both products highlight and discuss the uncertainties associated with the geological and conceptual model.
One of the main sources of uncertainty in the geological model is availability of data, especially in the deeper sedimentary basins, such as the Gunnedah Basin. A higher density of bores with lithological and/or stratigraphic data may allow refinement of the geological model as would additional seismic reflection data. The data density in the Namoi alluvium is much greater but nevertheless there is considerable uncertainty in the vertical and lateral lithological variation within these deposits. This affects the confinement status of especially the deeper sections of the Namoi alluvium. The data attribute is therefore scored ‘high’ as more borehole and seismic data will allow refinement of the geological and conceptual model.
With the currently available data it would be possible to investigate different geological and conceptual models that are consistent with the geological and hydrogeological understanding of the subregion. Comprehensively formulating these different geological interpretations and conceptualisations in a stochastic manner that is amenable to numerical evaluation within the project timeline, is beyond the available resources. The resources attribute is therefore scored ‘medium’.

2.6.2.8 Uncertainty analysis
Groundwater numerical modelling for the Namoi subregion | 115
Component 2: M
odel-data analysis for the Nam
oi subregion
Related to this are the technical challenges of implementing and evaluating different geological and conceptual models with the MODFLOW code. The MODFLOW-USG code used is very flexible and is able to accurately represent a wider range of geological conditions than previous versions of MODFLOW. Nevertheless, the level of pre- and post-processing required to stochastically vary the geological model and conceptual model, requires the development of elaborate, custom-made computer scripts. This is technically possible, but far from trivial. The technical attribute is therefore scored ‘medium’.
The overall effect on predictions is, however, scored ‘low’. The NCWS and GBRM models are both regional models with comparable extent to the Namoi subregion. Each of these models is based on a different geological model and various aspects of the conceptualisation are different. Despite these differences, the results of the models are quite consistent, when the differences in stress due to coal resource development are accounted for. While this by no means is a comprehensive analysis of the effect of geological and conceptual uncertainty particularly with regards to geological structures, it does provide a level of confidence that the predictions and conclusions are robust against variations in geological and conceptual model.
2.6.2.8.2.2 Lateral and internal boundary conditions
The interaction of groundwater with surface water and with the surrounding area in the Namoi subregion groundwater model is described in Section 2.6.2.4. These include the lateral no-flow and general-head boundaries, the spatially variable recharge and evapotranspiration fluxes (and associated evapotranspiration depth) and the localised surface water – groundwater interaction linked to the river network.
The boundary conditions are assigned a ‘medium’ score for all three attributes of data, resources and technical, indicating that no single attribute dominates the choice and implementation of the boundary conditions. Additional data and resources may allow more detailed and complex representations of these boundary conditions. The resulting increased dimensionality, however, will increase the technical challenge of carrying out a comprehensive uncertainty analysis.
To the extent possible within the project timeline, the majority of these boundary conditions are included in the stochastic parameterisation of the model. During the stress testing of the model, it became apparent that aspects such as the general-head boundary had very limited to no impact on the predictions. These parameters were therefore excluded from the sensitivity and uncertainty analyses. Recharge, evapotranspiration and depth of incision of the riverbed, however, are included in the sensitivity analysis. While the groundwater level and river flux observations are sensitive to some of these parameters, especially the depth of incision of the riverbed, the predictions of dmax and tmax are not sensitive to the parameters associated with boundary conditions. The effect on predictions is therefore scored ‘low’.
2.6.2.8.2.3 Implementation of coal mine developments
Coal mines are implemented through drain boundary conditions. The drain boundary is not specified for individual coal seams but for the model layer that hosts the coal seams at the grid cells contained in the mine footprint.

2.6.2.8 Uncertainty analysis
116 | Groundwater numerical modelling for the Namoi subregion
Com
pone
nt 2
: Mod
el-d
ata
anal
ysis
for t
he N
amoi
subr
egio
n The data attribute is scored ‘high’. The location and timing of planned coal and CSG developments is generally well known from the proponents’ environmental impact statements. The drain elevation, the level to which the aquifer locally will be drained, is informed by the geological model. Additional local mine development and geological data would allow refinement of these drainage elevations.
The resources and technical columns are both scored ‘low’ to indicate that changing the implementation of the coal mines is not limited by available resources or technical challenges.
The effect on predictions is scored ‘high’ because the predictions are conditioned on the presence and implementation of coal mines. The largest differences between the NCWS and Namoi subregion groundwater model are related to differences in developments included in both models. Likewise, the Namoi subregion groundwater model simulates substantial drawdowns associated with the Caroona Coal Project in the south of the region. During model development, it transpired that the Caroona Coal Project development is not likely to proceed. This implies that those drawdown predictions no longer reflect the most likely CRDP. In addition to this, deviations from the coal mine development plan are very likely due to technical and geological issues during production.
Constraining all parameter combinations with the estimated water production rates – at the very least – ensures that the predicted impacts are, to a degree, consistent with the more detailed local simulations carried out by the various proponents.
2.6.2.8.2.4 Implementation of coal seam gas developments
CSG dewatering is implemented as a drainage boundary condition in model layers representing the Hoskissons Coal seam and the Maules Creek Formation and water is sourced from the entire layer, not from individual coal seams.
While non-trivial and challenging (Moore et al., 2015), it is technically possible, and within the resources of the BA, to implement a more detailed conceptualisation of the CSG depressurisation.
However, insufficient data are available, both on the physical system and on the dimensions of the planned development, to adequately parameterise the added complexity. This motivates the scoring of ‘high’ on the data column with ‘low’ for resources and technical attributes.
One of the limitations of the current modelling approach is that it is not able to simulate dual-phase flow. Using a single-phase model is, however, likely to over estimate drawdowns and water extraction volumes (Herckenrath et al., 2015), in line with the precautionary principle. The model code does allow specification of pumping rates, but these are not known and, because of the dual-phase aspect, will be unlikely to result in a drawdown that is representative of the depressurisation required for CSG extraction (see submethodology M07 (as listed in Table 1) for groundwater modelling (Crosbie et al., 2016)).
The effect of changing the water production rates on the predictions is scored ‘high’, for the same reasons as outlined above; the presence or absence of a development will fundamentally affect the predictions. It has to be noted, however, that for additional coal resource developments, the

2.6.2.8 Uncertainty analysis
Groundwater numerical modelling for the Namoi subregion | 117
Component 2: M
odel-data analysis for the Nam
oi subregion
drawdown due to CSG development is spatially more extensive than the drawdown due to coal mines, but lower in magnitude.
Like with the coal mines, constraining parameter combinations with the estimated water production rates ensures that the predicted impacts are consistent with the more detailed local simulations and reservoir simulations carried out by the CSG proponent.
2.6.2.8.2.5 Spatial variability of hydraulic properties
The hydraulic properties are implemented as spatially uniform horizontally, although they are varied with depth (see Section 2.6.2.8.2.6).
Insufficient data are available to characterise spatial variability at a regional scale, although in the vicinity of existing and proposed mines more information is available. The data availability attribute therefore receives a ‘medium’ score.
The level of spatial detail that can be accommodated in a numerical model is governed by the horizontal and vertical discretisation, but will always require upscaling. Upscaling is a challenging technical task and there are a wide variety of techniques available to scale measurements at a point-scale into hydraulic properties representative of wider areas for use in numerical modelling (Renard and de Marsily, 1997). The technical column is rated ‘medium’.
These technical challenges can be partly overcome through stochastic simulation of spatially variable hydraulic properties within model layers. The time and computational resources required to develop and apply stochastic hydraulic property simulators tailored to the subregion are not available within the operational constraints of the Bioregional Assessment Programme. The resources column is therefore rated ‘medium’ as well.
The effect on the final predictions of the uncertainty in hydraulic properties is deemed to be moderate and is therefore rated ‘medium’. Any change in the hydraulic properties, especially the hydraulic conductivity parameters, will affect the predictions directly. The wide prior distributions defined for the parameters ensure, however, that this uncertainty is adequately captured in the predictive distributions of drawdown and change in surface water – groundwater flux.
At the regional scale and for groundwater quantity predictions, guiding principle 7.3 in the Australian groundwater modelling guidelines (Barnett et al., 2012) highlights that the representative elementary volume is valid and can be applied to capture spatial variability in hydraulic properties by using equivalent values.
Although introducing spatial heterogeneity might have an effect on the extent of predicted changes in groundwater level in the immediate vicinity of the mines, at regional scales the effect is minimal (see companion submethodology M07 (as listed in Table 1) for groundwater modelling (Crosbie et al., 2016)).
2.6.2.8.2.6 Depth-varying parameterisation of hydraulic properties
The hydraulic properties, hydraulic conductivity and storage, for interburden and coal-bearing layers are varied with depth rather than with stratigraphy, based on an observed decrease of hydraulic conductivity with depth (Section 2.6.2.6).

2.6.2.8 Uncertainty analysis
118 | Groundwater numerical modelling for the Namoi subregion
Com
pone
nt 2
: Mod
el-d
ata
anal
ysis
for t
he N
amoi
subr
egio
n The data attribute is scored ‘high’ as the data are sparse and highly variable. A higher resolution dataset of hydraulic conductivities will allow refinement of the depth-varying parameterisation or enable establishment of a relationship between stratigraphy and hydraulic properties.
The choice of varying hydraulic properties of interburden and coal-bearing layers with depth is not constrained by technical or resource limitations, hence the ‘low’ score for both attributes.
The effect on predictions is rated ‘high’ as the predictions of drawdown are very sensitive to the hydraulic properties and the observation data have limited potential to constrain the hydraulic property parameters.
This is mitigated by including the coefficients of the depth-varying hydraulic conductivity function in the uncertainty analysis with prior parameter ranges that ensure that the entire spectrum from no variation with depth to a strong decrease with depth are included in the simulations. Each model run thus has an individual depth-varying hydraulic conductivity function.
2.6.2.8.2.7 Hydraulic enhancement after longwall mine collapse
The hydraulic properties above mined coal seams are changed after mining commences to represent the effects of longwall mine collapse.
The data attribute is rated ‘high’ as the process is well described, but data on hydraulic properties after longwall mine collapse are scarce.
Both the resources and technical attributes are rated ‘low’, as it is trivial to implement hydraulic enhancement differently. The hydraulic conductivity enhancement due to underground mining is modelled by a ramp function. The enhancement is applied to the entire area above and below the active drain cells which increment every 5 years through the operation phases of the mine. The actual enhancement from each mine working will be dynamic, advancing with the mining face and consolidating in the goaf region. If higher temporal resolution data on the phasing of each mine working were included, a more accurate representation of the groundwater in regions close to the mines would be obtained.
The effect on predictions is rated ‘medium’, as hydraulic enhancement is locally important for prediction above or close to the mine footprints. Further away from the mines, the enhancement is less important. Related to the hydraulic enhancement is the potential for an increase in recharge in areas affected by subsidence and longwall mine collapse. This feature is not implemented; however, an increase in recharge would likely counter the drawdown due to additional coal resource development. By not including this enhanced recharge, drawdown due to additional coal resource development is likely to be over estimated.
2.6.2.8.2.8 Specification of prior parameter distributions
The prior parameter distributions are chosen to be uniform within the ranges selected by the modelling team, based on the information available for the Namoi subregion and equivalent analogue sedimentary basins in Australia and the world.
Additional data will allow adjustment of these prior distributions to agree more closely with the conditions in the Namoi subregion. This warrants the ‘high’ score for the data component.

2.6.2.8 Uncertainty analysis
Groundwater numerical modelling for the Namoi subregion | 119
Component 2: M
odel-data analysis for the Nam
oi subregion
Specifying prior distributions is not constrained by resources and there are no technical issues as the uncertainty analysis methodology is not prescriptive in the type of prior distribution used in the analysis. Both of these attributes score ‘low’.
The effect of the choice of parameter distributions is potentially important as many of the parameters the predictions are sensitive to are not greatly constrained by the available observations. The posterior parameter distributions for these parameters are very similar to the prior distributions. The effect on predictions is therefore rated ‘medium’.
To mitigate this, the distributions are chosen to be conservative, spanning at least two orders of magnitude for most hydraulic properties, so as to ensure the predictive uncertainty is over estimated rather than under estimated.
2.6.2.8.2.9 Distance-based weighting of observations
The weight of an observation in constraining parameters for a particular prediction is based on the distance between observation and prediction and the distance of the observation to the nearest blue line network – that is, the mapped river network.
With the available data density and operational constraints, development of a tailored weighting for each observation based on the aquifer it is situated in and local hydrogeological conditions is not possible. Therefore the data and resources columns are rated ‘medium’. Technically it is trivial to implement a different weighting scheme, so the technical column rates ‘low’.
The overall effect on predictions is small, as the information in the groundwater level observations is generally not able to constrain the parameters relevant to the groundwater change predictions. Locally, however, the effect on predictions could be important, such as in regions where none of the simulated groundwater levels are in agreement with the relevant observations and the model is not deemed reliable. The extent and shape of these regions is fully governed by the observation weighting function. The overall scoring of the effect on predictions is therefore ‘medium’.
2.6.2.8.2.10 Constraining parameters with groundwater level observations
Groundwater level observations are often the only data used to constrain the parameters and conceptualisation of a groundwater model. In the groundwater model for the Namoi subregion, groundwater level observations are used to constrain the model parameters as well as streamflow observations and mine water production rates.
In Section 2.6.2.7.1 the available groundwater observation data from the NSW Department of Primary Industries (NSW Office of Water, Dataset 2) in the groundwater model domain are presented and discussed. A large number of these observations date back to the late 1970s or early 1980s and mostly correspond to single water level readings carried out directly after installing a groundwater bore. Some of these readings are likely to be spurious. The metadata associated with these measurements often indicate that the coordinates of the observation location are not surveyed, but are estimated from a map. The elevation of ground level or the reference points for depth-to-watertable measurements is in most cases not surveyed either, but estimated from maps or digital elevation models.

2.6.2.8 Uncertainty analysis
120 | Groundwater numerical modelling for the Namoi subregion
Com
pone
nt 2
: Mod
el-d
ata
anal
ysis
for t
he N
amoi
subr
egio
n High quality observation data are essential for building a conceptual understanding of groundwater flow in a region and identifying general trends in piezometric surface. However, uncertainties arising from poorly specified x, y, z information and the representativeness of groundwater levels measured in bores shortly after their installation undermine the utility of an observation for constraining a groundwater model. Observations that had no surveyed coordinates or were not from groundwater observation bores were excluded from the dataset used to constrain the groundwater model. This greatly reduced the number of observation points to constrain the model.
Mining companies install and maintain groundwater monitoring networks in the vicinity of their developments. These data are not publicly available and a licence to use this data requires individual negotiations with the mining companies. Even when a licence to use the groundwater level observations is granted, the data need to be subjected to a stringent quality assurance as well. The main concern here is not the spatial accuracy of the measurements, but the representativeness of the observation for regional groundwater flow conditions. Mine monitoring networks are usually designed to monitor groundwater level changes in the immediate vicinity of the mine or around areas of potential concern, such as close to a surface water feature. Such local detail is not captured in the regional model and using observations dominated by local hydrogeological conditions in constraining the model can introduce considerable bias in the regional parameter estimates.
Thus, in terms of data available to constrain the groundwater model, this is rated ‘high’. Data from a more extensive, quality-assured regional observation network will provide a stronger basis for constraining groundwater models in this subregion. This issue receives a ‘medium’ score on the resources attribute. The quality control and assurance of the database entries, and their suitability to be included in the observation dataset to constrain the model, is based on a desktop study of the information provided in the database. Access to and more comprehensive analysis of the original records and/or a field campaign to identify and verify spatial coordinates of the database entries have the potential to reduce uncertainty in the observation record. There are no technical issues for collecting, verifying or using groundwater level observations, hence the ‘low’ score for the technical attribute.
Despite the limited data availability and uncertainties in the observation record, the effect on predictions is rated ‘medium’. The assumption is important but not deemed to dominate the predictions. A larger observation database with less observation uncertainty has the potential to locally change the conceptual understanding of the system and change the final posterior parameter probability distributions. The sensitivity analysis (Section 2.6.2.7.3) indicated that groundwater levels are most sensitive to the depth of incision of the riverbed, while the change in groundwater level predictions is most sensitive to the hydraulic properties. A greater density of high quality observations close to the river network will reduce the uncertainty in the drainage level, which in turn will allow for the groundwater level observation to better constrain the hydraulic properties of the system.
2.6.2.8.2.11 Constraining parameters with streamflow observations
The 20th percentile of the total observed historical streamflow is used to constrain the surface water – groundwater flux. By specifying that the average simulated historical surface water –
2.6.2.8 Uncertainty analysis
Groundwater numerical modelling for the Namoi subregion | 121
Component 2: M
odel-data analysis for the Nam
oi subregion
groundwater flux needs to be less than this threshold, parameter combinations that give rise to large fluxes of groundwater to surface water are excluded, as this is not in accordance with the hydrological understanding of the Namoi river system.
Surface water – groundwater interactions are intensely studied in the Namoi subregion (see Section 2.1.5 of companion product 2.1-2.2 for the Namoi subregion (Aryal et al., 2018a)). The connection status is, however, time-varying and dependent on the level of pumping for agriculture, river regulation and the occurrence of floods. A more detailed constraining of the surface water – groundwater flux therefore requires not only data with a spatial and temporal resolution, it also requires additional resources to integrate that information in the groundwater model and subsequent uncertainty analysis. These attributes are therefore scored ‘high’ and ‘medium’, respectively. The technical attribute is scored ‘low’ as there are few technical issues associated with implementing more detailed surface water – groundwater interactions.
The effect on predictions is deemed to be ‘medium’. The surface water – groundwater flux is most sensitive to the depth of incision of the streambed and, to a lesser extent, the hydraulic properties of the groundwater system, while drawdown predictions, however, are most sensitive to hydraulic properties.
As with the groundwater level observation, narrowing the bounds on the surface water – groundwater flux can better constrain the depth of incision of the streambed. When this parameter is better constrained, there is more potential for the groundwater level observations to constrain the hydraulic properties. This in turn will further constrain the predictions of drawdown due to additional coal resource development (i.e. the difference in drawdown between CRDP and baseline).
2.6.2.8.2.12 Zonal recharge from chloride mass balance
Groundwater recharge is implemented using a spatially varying correction factor to the temporal recharge signal obtained from the surface water model output. The correction factor is based on measurements of chloride in groundwater and rainfall with the chloride mass balance method (see Section 2.1.3 of companion product 2.1-2.2 for the Namoi subregion (Aryal et al., 2018a)). The spatial coverage of bedrock groundwater chloride measurements in the Namoi subregion is variable. Other reliable and representative measurements of diffuse recharge outside the alluvium, such as from environmental tracers, are not available in the subregion either.
More evenly distributed chloride measurements in groundwater observations across the outcropping geological units or other estimates of diffuse recharge will undoubtedly improve the parameterisation of groundwater recharge. For this reason, a ‘high’ score is attributed to the data column. It is unlikely that additional resources or different techniques will improve the recharge estimates based on the currently available data. Both these columns are therefore given a ‘low’ score.
Recharge estimates with reduced uncertainty will reduce uncertainty in groundwater level predictions; however, as the change in groundwater level is not very sensitive to recharge, it will minimally affect changes in dmax predictions. The effect on the predictions attribute is therefore rated ‘low’.

2.6.2.8 Uncertainty analysis
122 | Groundwater numerical modelling for the Namoi subregion
Com
pone
nt 2
: Mod
el-d
ata
anal
ysis
for t
he N
amoi
subr
egio
n 2.6.2.8.2.13 Simulation period from 2012 to 2102
The simulation period for all BAs is 2012 to 2102 (see companion submethodology M06 (as listed in Table 1) for surface water modelling (Viney, 2016) and companion submethodology M07 (as listed in Table 1) for groundwater modelling (Crosbie et al., 2016)). For some parameter combinations and some model nodes this means that the dmax is not realised within the simulation period, as shown in Figure 30.
Extending the simulation period is not limited by data as it is about the future, hence the score is rated ‘low’. The resources attribute, however, is rated ‘high’. To ensure that the dmax is realised at all model nodes for all parameter combinations would require extending the simulation period with hundreds to even thousands of years. This would impose a sizeable increase in the computational demand and therefore compromise the comprehensive probabilistic assessment of predictions. The technical attribute is rated ‘medium’. It is trivial to extend the length of the simulation in the groundwater model. The climate scaling factors used to specify future rainfall and therefore recharge are not available beyond 2100. It is therefore a technical issue in devising a justifiable future climate to assign to the modelling.
The effect on predictions, however, is rated ‘low’. The theoretical assessment of the relationship between dmax and tmax, presented in submethodology M07 (as listed in Table 1) for groundwater modelling (Crosbie et al., 2016), shows that any dmax realised after 2102 will always be smaller than the dmax realised before 2102. Since dmax was reached before 2102 at all points within the zone of potential hydrological change, limiting the simulation period does not underestimate the hydrological change.
2.6.2.8.2.14 Non-mining groundwater extraction rates
Groundwater extractions for non-mining uses across the subregion were based on licensed entitlements.
Historical data are generally not available on a bore-by-bore basis to define historical rates of extraction from licensed bores. The data attribute is rated ‘low’ since actual extraction rates would only apply to the 1983 to 2012 reporting period and assumptions would still need to be made about rates of extraction into the future. The resources and technical attributes are rated ‘low’ as it is trivial to model different extraction rates.
Effect on predictions is also ‘low’, as the same rates of extraction are used in both baseline and CRDP and their impacts largely cancel out in calculating the difference between the modelled results under baseline and CRDP. It has to be noted, however, that time series of actual water extraction rates would help to constrain the model parameters and that unrealistically high water extraction rates may cause model stability issues.
2.6.2.8.2.15 Aggregating hydrostratigraphic units
In the parameterisation of the subsurface, several hydrostratigraphic units that are present between the target coal seams and the shallower Pilliga Sandstone and alluvium are aggregated in the model. The aggregated unit hydraulic properties no longer represent the hydraulic properties

2.6.2.8 Uncertainty analysis
Groundwater numerical modelling for the Namoi subregion | 123
Component 2: M
odel-data analysis for the Nam
oi subregion
of an individual hydrostratigraphic unit, but are the equivalent hydraulic properties of the entire sedimentary column that is aggregated.
Representing the hydrostratigraphic units as separate units in the model necessitates defining both the geometry of each unit as well as establishing prior parameter distributions for each unit. While geometry information is available, the stratigraphic resolution of the hydraulic information in the sedimentary basin is insufficient to inform prior parameter distributions. The data attribute is therefore scored ‘high’. The resources attribute is also scored ‘high’ as increasing the number of model layers will increase the number of model cells and thus the run-time. The technical attribute is scored ‘low’ as there are no technical impediments to implementing the hydrostratigraphic units individually.
The impact on predictions is scored ‘low’. The change in groundwater pressure in these hydrostratigraphic units is not an objective of this modelling exercise. The model therefore does not require the vertical resolution to simulate groundwater levels and fluxes in these units. In the model, these units do separate the potentially stressed coal seams from the aquifers for which the potential hydrological impact is of interest. To estimate the propagation of drawdown, it is sufficient to know the equivalent hydraulic properties of the aggregated units. In such up-scaling, the equivalent properties will be bounded by harmonic and geometric mean of the units (Renard and de Marsily, 1997). The wide range specified for these equivalent hydraulic properties means that a very large range of combinations of individual hydrostratigraphic units is implicitly captured in the parameterisation. The extreme low end of the prior parameters would represent a situation with most aquitard units being continuous and having a very low hydraulic conductivity. The extreme high end of the prior parameters would represent a situation where aquitards have higher permeability and are not continuous.
References
Aryal SK, Northey J, Slatter E, Ivkovic K, Crosbie R, Janardhanan S, Peña-Arancibia J and Bell J (2018a) Observations analysis, statistical analysis and interpolation for the Namoi subregion. Product 2.1-2.2 for the Namoi subregion from the Northern Inland Catchments Bioregional Assessment. Department of the Environment and Energy, Bureau of Meteorology, CSIRO and Geoscience Australia, Australia. http://data.bioregionalassessments.gov.au/product/NIC/NAM/2.1-2.2.
Aryal SK, Peña-Arancibia J, Viney N, Yang A, Wang B, Hughes J, Merrin LE, Marvanek S, Davies P, Bell J, Zhang Y, Vaze J, Singh R and Kim S (2018b) Surface water numerical modelling for the Namoi subregion. Product 2.6.1 for the Namoi subregion from the Northern Inland Catchments Bioregional Assessment. Department of the Environment and Energy, Bureau of Meteorology, CSIRO and Geoscience Australia, Australia. http://data.bioregionalassessments.gov.au/product/NIC/NAM/2.6.1.
Barnett B, Townley LR, Post V, Evans RE, Hunt RJ, Peeters L, Richardson S, Werner AD, Knapton A and Boronkay A (2012) Australian groundwater modelling guidelines, Waterlines Report Series. National Water Commission. Canberra, Australia. Viewed 19 April 2016, http://nwc.gov.au/__data/assets/pdf_file/0016/22840/Waterlines-82-Australian-groundwater-modelling-guidelines.pdf.

2.6.2.8 Uncertainty analysis
124 | Groundwater numerical modelling for the Namoi subregion
Com
pone
nt 2
: Mod
el-d
ata
anal
ysis
for t
he N
amoi
subr
egio
n Beaumont MA, Zhang W and Balding DJ (2002) Approximate Bayesian Computation in population 1175 genetics. Genetics 162, 2025–2035.
Crosbie R, Peeters L and Carey H (2016) Groundwater modelling. Submethodology M07 from the Bioregional Assessment Technical Programme. Department of the Environment and Energy, Bureau of Meteorology, CSIRO and Geoscience Australia, Australia. http://data.bioregionalassessments.gov.au/submethodology/M07.
Crosbie R, Aryal SK, Janardhanan S and Peña-Arancibia J (2018) Water balance assessment for the Namoi subregion. Product 2.5 for the Namoi subregion from the Northern Inland Catchments Bioregional Assessment. Department of the Environment and Energy, Bureau of Meteorology, CSIRO and Geoscience Australia, Australia. http://data.bioregionalassessments.gov.au/product/NIC/NAM/2.5.
Herckenrath D, Doherty J and Panday S (2015) Incorporating the effect of gas in modelling the impact of CBM extraction on regional groundwater systems. Journal of Hydrology 523, 587–601.
Herr A, Northey J, Mitchell PJ, Aryal SK, Merrin LE and Slatter E (2018) Conceptual modelling for the Namoi subregion. Product 2.3 for the Namoi subregion from the Northern Inland Catchments Bioregional Assessment. Department of the Environment and Energy, Bureau of Meteorology, CSIRO and Geoscience Australia, Australia. http://data.bioregionalassessments.gov.au/product/NIC/NAM/2.3.
Moore CR, Doherty J, Howell S and Erriah L (2015) Some challenges posed by coal bed methane regional assessment modeling. Groundwater 53, 737–747.
Peeters L, Pagendam D, Gao L, Hosack G, Jiang W and Henderson BL (2016) Propagating uncertainty through models. Submethodology M09 from the Bioregional Assessment Technical Programme. Department of the Environment and Energy, Bureau of Meteorology, CSIRO and Geoscience Australia, Australia. http://data.bioregionalassessments.gov.au/submethodology/M09.
Renard P and de Marsily G (1997) Calculating equivalent permeability: a review. Advances in Water Resources 20, 253–278.
Viney N (2016) Surface water modelling. Submethodology M06 from the Bioregional Assessment Technical Programme. Department of the Environment and Energy, Bureau of Meteorology, CSIRO and Geoscience Australia, Australia. http://data.bioregionalassessments.gov.au/submethodology/M06.
Vrugt JA and Sadegh M (2013) Toward diagnostic model calibration and evaluation: Approximate Bayesian Computation. Water Resources Research 49, 4335–4345.

2.6.2.8 Uncertainty analysis
Groundwater numerical modelling for the Namoi subregion | 125
Component 2: M
odel-data analysis for the Nam
oi subregion
Datasets
Dataset 1 Bioregional Assessment Programme (2017) Namoi groundwater drawdown grids. Bioregional Assessment Derived Dataset. Viewed 22 May 2017, http://data.bioregionalassessments.gov.au/dataset/38b6fd6e-631c-4b3c-830b-0b449ad32d62.
Dataset 2 NSW Office of Water (2014) Hydstra Groundwater Measurement Update - NSW Office of Water, Nov2013. Bioregional Assessment Source Dataset. Viewed 05 September 2016, http://data.bioregionalassessments.gov.au/dataset/08b34518-c947-4665-82e5-c144b5b24e01.

2.6.2.8 Uncertainty analysis
126 | Groundwater numerical modelling for the Namoi subregion
Com
pone
nt 2
: Mod
el-d
ata
anal
ysis
for t
he N
amoi
subr
egio
n

2.6.2.9 Limitations
Groundwater numerical modelling for the Namoi subregion | 127
Component 2: M
odel-data analysis for the Nam
oi subregion
2.6.2.9 Limitations
Summary
The Namoi subregion groundwater model is developed in MODFLOW-USG to probabilistically assess the drawdown due to additional coal resource development, and the year of maximum change, as well as to provide the change in surface water – groundwater flux as a boundary condition for the surface water modelling reported in companion product 2.6.1 for the Namoi subregion (Aryal et al., 2018).
Model results indicate that the probability of exceeding a 0.2 m drawdown close to the mine footprint areas is high, but this reduces with increasing distance from the development. The contour of 5% probability of exceeding 0.2 m drawdown is generally within 10 km of the development footprint boundary.
The year when maximum change is attained varies throughout the Namoi subregion. It is most likely to be during the decades after mining activity ceases, and it increases with increasing distance from mine tenements.
The Namoi subregion groundwater model is a stochastic regional-scale model: it has a large modelling domain and a relatively coarse model resolution. As such, it does not provide a deterministic result and it does not incorporate the level of lithological and hydrogeological information that is represented in local-scale groundwater models that have been built for small areas within the Namoi subregion.
Opportunities to improve the model can be directed to better constraining the assumptions that have the most influence on model results. Generally, the magnitude of drawdown due to additional coal resource development, which is the difference in drawdown between the coal resource development pathway and baseline, is most sensitive to the hydraulic properties of the interburden and coal-bearing formations.
2.6.2.9.1 Data gaps and opportunities to reduce predictive uncertainty
An important outcome from the Assessment is identifying the main sources of uncertainty and the opportunities for improving regional-scale groundwater modelling in the Namoi subregion. The qualitative uncertainty analysis in Section 2.6.2.8 highlighted several model choices and assumptions that have a high potential impact on the predictions. The implementation of the coal resource development pathway (CRDP) has the highest potential to impact the predictions, particularly in situations where the CRDP becomes out of date if identified developments do not proceed or new developments are proposed. This has occurred with one of the developments in the Namoi subregion CRDP not proceeding (Caroona Coal Project). In line with companion submethodology M04 on developing a coal resource development pathway (Lewis, 2014), once the CRDP has been accepted in a bioregional asssessment it is not revisited.
The knowledge base of hydraulic properties in the deeper geological layers of the Gunnedah Basin is limited in the Namoi subregion. The sensitivity analysis of model predictions highlighted that especially the hydraulic conductivity of the interburden has a high influence on the model

2.6.2.9 Limitations
128 | Groundwater numerical modelling for the Namoi subregion
Com
pone
nt 2
: Mod
el-d
ata
anal
ysis
for t
he N
amoi
subr
egio
n predictions. Any information that can constrain the prior distributions of these parameters, including on processes that can affect interburden integrity such as faults, will increase the predictability of the drawdown by the groundwater model.
While estimates of recharge and discharge are essential for groundwater management in the subregion, they are of lesser importance when assessing the drawdown caused by coal resource development. Additional information would undoubtedly make for a better conceptual model and a groundwater model that can reproduce historical observations more accurately, but would have very limited potential to reduce the predictive uncertainty of drawdowns and fluxes.
Related to this is the quality of the current groundwater level observations. Analysis of the metadata of the observations highlighted that the horizontal and vertical accuracy of many observation locations is insufficient to be used in formal model evaluation. While this can be addressed by additional quality control in the database in combination with field verification of observation locations, the reduction in predictive uncertainty is limited as the groundwater level observations in the alluvial aquifers cannot constrain the parameters relevant to drawdown predictions.
The depth of incision of the streambed below topography is a very influential parameter for the simulation of groundwater level in the regional watertable aquifer and the surface water – groundwater flux. It is feasible to conduct a longitudinal survey of streambed elevation to provide a measured value for this parameter in the model; being able to constrain this parameter might enable the groundwater level observations and surface water – groundwater flux estimates to be more useful in constraining the hydraulic properties within the model.
2.6.2.9.2 Limitations
The qualitative uncertainty analysis in Section 2.6.2.8.2 lists the major assumptions and model choices that form the basis of the probabilistic assessment of the impacts of coal resource development on groundwater model nodes in the Namoi subregion. Within the context of the goal of the Bioregional Assessment Programme, the Namoi subregion modelling team deemed these assumptions valid and acceptable. There is no guarantee, however, that these assumptions will hold or be acceptable to address any other water management questions in the subregion; therefore, the modelling team recommends not using these models for any other purpose without a formal assessment of the suitability of the conceptualisation, parameterisation and implementation for the changed objective.
Should these models be considered for any other purpose, there should be a formal re-evaluation of the suitability of the conceptual model and model assumptions, in line with the Australian groundwater modelling guidelines (Barnett et al., 2012). All model files and executables are available at www.bioregionalassessments.gov.au. It is recommended to contact the model development team for detailed information on the groundwater models.
The chain of models described in this product is designed to estimate impacts on a regional scale. This unfortunately means trade-offs are made in terms of local resolution of the model. Especially in the immediate vicinity of coal mines, the effect of coal mining activity will be largely dominated by local variations in geology and hydrogeology. The reliability of any predictions made by this
2.6.2.9 Limitations
Groundwater numerical modelling for the Namoi subregion | 129
Component 2: M
odel-data analysis for the Nam
oi subregion
model will be inferior to the reliability of predictions made by a local groundwater model that fully accounts for this level of detail.
The models are designed within a probabilistic framework. This implies there is not a single parameter combination that provides a ‘best fit’ to observations and a corresponding single set of predictions. Any evaluation or further use of both the parameter combinations used in the models or the predictions need to take into account the full posterior distributions reported in Section 2.6.2.8. Input data, model files, (including the pre- and post-processing scripts and executables) and results are available at www.bioregionalassessments.gov.au.
The utmost care has been devoted to ensuring the results presented are in accordance with the conceptual understanding of the system and the stresses imposed on it. This is mostly done by targeted spot checks of model outputs and visual examination of the response of model outputs to varying parameter values. While these checks minimise the risk that artefacts have gone undetected, as in any modelling exercise of this scale, there is no guarantee that there are no artefacts of modelling included in the results.
2.6.2.9.3 Conclusions
The Namoi subregion groundwater model was developed with MODFLOW-USG (Panday et al., 2013) to probabilistically assess the drawdown due to additional coal resource development, and year of maximum change (tmax), as well as provide the change in surface water – groundwater flux as a boundary condition for the surface water modelling reported in companion product 2.6.1 for the Namoi subregion (Aryal et al., 2018).
For the majority of the model domain, the median value of the simulated drawdown is less than 0.2 m. The probability of exceeding this threshold is 100% within the immediate vicinity of the mine footprint area and decreases rapidly with increasing distance from the development. One outcome of the groundwater modelling that is carried forward to the impact and risk analysis (companion product 3-4 for the Namoi subregion) is the zone of potential hydrological change; this is defined as the the contour of 5% probability of exceeding 0.2 m drawdown. The zone of potential hydrological change is generally within 10 km of the development footprint boundary. This also means that the cumulative drawdown of multiple developments can overlap when they are within 20 km of each other; this occurs in several areas of the Namoi subregion. In most cases the drawdown is attenuated at the alluvium boundary due to the high transmissivity and so the largest magnitude drawdowns occur in the consolidated rock rather than the alluvium.
Generally, the magnitude of drawdown due to additional coal resource development, which is the difference in drawdown between CRDP and baseline, is most sensitive to the hydraulic properties of the interburden. The drawdown is not sensitive to parameters such as the recharge scalers, depth of incision of the streambed or the alluvium hydraulic properties.
The tmax varies between 2012 and 2102 and thus spans the entire simulation period. It indicates that while maximum difference in drawdown (dmax) can be achieved during mining operations, it is very likely that dmax is attained in the decades after mining ceases. The tmax increases with increasing distance from mine tenements. The largest drawdowns due to additional coal resource development occur in close vicinity of the mines, within or shortly after the peak mining period

2.6.2.9 Limitations
130 | Groundwater numerical modelling for the Namoi subregion
Com
pone
nt 2
: Mod
el-d
ata
anal
ysis
for t
he N
amoi
subr
egio
n and within the simulation period. Further away from the mines, the drawdown due to additional coal resource development takes longer to reach a maximum, potentially beyond the simulation period. However, as the drawdowns are not likely to be significant and are increasingly uncertain, there is little to be gained through extending the simulation period to provide a more precise estimate of tmax.
The simulated changes in surface water – groundwater flux are integrated into the surface water modelling, reported in companion product 2.6.1 for the Namoi subregion (Aryal et al., 2018). Additional coal resource development may increase baseflow for some parameter combinations. The possibility of baseflow increases is consistent with the understanding of the dynamics of the groundwater system during and after mining as well as with the conceptualisation of the groundwater model, although observations of mine-induced baseflow increases have not been reported in the literature.
The probabilistic estimates of dmax are constrained by a distance-based weighting of groundwater level observations, estimates of total streamflow and by estimates of mine water makes. The groundwater level and streamflow observations mostly constrained the depth of incision of the streambed assigned to river nodes in the model and to a lesser extent the scaler on diffuse recharge. The predictions of dmax were not sensitive to the depth of incision of the streambed or the scaler on diffuse recharge, giving limited value to these observations. The simulation of mine water makes were sensitive to the hydraulic properties of the coal-bearing formations and the interburden. Data on mine water makes are useful for constraining predictions of dmax.
The probabilistic hydrological changes presented in this product will form the basis of the further receptor impact modelling reported in companion product 2.7 and impact and risk analysis reported in companion product 3-4 for the Namoi subregion.
Input data, model files (including pre- and post-processing scripts and executables) and results are available at www.bioregionalassessments.gov.au.
References
Aryal SK, Peña-Arancibia J, Viney N, Yang A, Wang B, Hughes J, Merrin LE, Marvanek S, Davies P, Bell J, Zhang Y, Vaze J, Singh R and Kim S (2018) Surface water numerical modelling for the Namoi subregion. Product 2.6.1 for the Namoi subregion from the Northern Inland Catchments Bioregional Assessment. Department of the Environment and Energy, Bureau of Meteorology, CSIRO and Geoscience Australia, Australia. http://data.bioregionalassessments.gov.au/product/NIC/NAM/2.6.1.
Barnett B, Townley LR, Post V, Evans RE, Hunt RJ, Peeters L, Richardson S, Werner AD, Knapton A and Boronkay A (2012) Australian groundwater modelling guidelines, Waterlines Report Series. National Water Commission. Canberra, Australia. Viewed 19 April 2016, http://nwc.gov.au/__data/assets/pdf_file/0016/22840/Waterlines-82-Australian-groundwater-modelling-guidelines.pdf.

2.6.2.9 Limitations
Groundwater numerical modelling for the Namoi subregion | 131
Component 2: M
odel-data analysis for the Nam
oi subregion
Lewis S (2014) Developing a coal resource development pathway. A submethodology from the Bioregional Assessment Technical Programme. Department of the Environment, Bureau of Meteorology, CSIRO and Geoscience Australia, Australia. Viewed 30 May 2017, http://data.bioregionalassessments.gov.au/submethodology/M04.
Panday S, Langevin CD, Niswonger RG, Ibaraki M and Hughes JD (2013) MODFLOW–USG version 1: an unstructured grid version of MODFLOW for simulating groundwater flow and tightly coupled processes using a control volume finite-difference formulation (No. 6-A45). US Geological Survey.

Glossary
132 | Groundwater numerical modelling for the Namoi subregion
Com
pone
nt 2
: Mod
el-d
ata
anal
ysis
for t
he N
amoi
subr
egio
n Glossary The register of terms and definitions used in the Bioregional Assessment Programme is available online at http://environment.data.gov.au/def/ba/glossary (note that terms and definitions are respectively listed under the 'Name' and 'Description' columns in this register). This register is a list of terms, which are the preferred descriptors for concepts. Other properties are included for each term, including licence information, source of definition and date of approval. Semantic relationships (such as hierarchical relationships) are formalised for some terms, as well as linkages to other terms in related vocabularies.
activity: for the purposes of Impact Modes and Effects Analysis (IMEA), a planned event associated with a coal seam gas (CSG) operation or coal mine. For example, activities during the production life-cycle stage in a CSG operation include drilling and coring, ground-based geophysics and surface core testing. Activities are grouped into components, which are grouped into life-cycle stages.
additional coal resource development: all coal mines and coal seam gas (CSG) fields, including expansions of baseline operations, that are expected to begin commercial production after December 2012
additional drawdown: the maximum difference in drawdown (dmax) between the coal resource development pathway (CRDP) and baseline, due to additional coal resource development
analysis extent: the geographic area that encompasses all the possible areas that may be reported in the impact analysis of a bioregional assessment (BA), typically including the bioregion or subregion, the preliminary assessment extent (PAE) and the relevant groundwater and surface water model domains
aquifer: rock or sediment in a formation, group of formations, or part of a formation that is saturated and sufficiently permeable to transmit quantities of water to bores and springs
aquitard: a saturated geological unit that is less permeable than an aquifer, and incapable of transmitting useful quantities of water. Aquitards often form a confining layer over an artesian aquifer.
assessment extent: the geographic area associated with a subregion or bioregion in which the potential water-related impact of coal resource development on assets is assessed. The assessment extent is created by revising the preliminary assessment extent on the basis of information from Component 1: Contextual information and Component 2: Model-data analysis.
asset: an entity that has value to the community and, for bioregional assessment purposes, is associated with a subregion or bioregion. Technically, an asset is a store of value and may be managed and/or used to maintain and/or produce further value. Each asset will have many values associated with it and they can be measured from a range of perspectives; for example, the values of a wetland can be measured from ecological, sociocultural and economic perspectives.
baseflow: the portion of streamflow that comes from shallow and deep subsurface flow, and is an important part of the groundwater system

Glossary
Groundwater numerical modelling for the Namoi subregion | 133
Component 2: M
odel-data analysis for the Nam
oi subregion
baseline coal resource development: a future that includes all coal mines and coal seam gas (CSG) fields that are commercially producing as of December 2012
basement: the crust below the rocks of interest. In hydrogeology it means non-prospective rocks below accessible groundwater. Commonly refers to igneous and metamorphic rocks which are unconformably overlain by sedimentary beds or cover material, and sometimes used to indicate 'bedrock' (i.e. underlying or encasing palaeovalley sediments).
bioregion: a geographic land area within which coal seam gas (CSG) and/or coal mining developments are taking place, or could take place, and for which bioregional assessments (BAs) are conducted
bioregional assessment: a scientific analysis of the ecology, hydrology, geology and hydrogeology of a bioregion, with explicit assessment of the potential direct, indirect and cumulative impacts of coal seam gas and coal mining development on water resources. The central purpose of bioregional assessments is to analyse the impacts and risks associated with changes to water-dependent assets that arise in response to current and future pathways of coal seam gas and coal mining development.
bore: a narrow, artificially constructed hole or cavity used to intercept, collect or store water from an aquifer, or to passively observe or collect groundwater information. Also known as a borehole or piezometer.
causal pathway: for the purposes of bioregional assessments, the logical chain of events – either planned or unplanned – that link coal resource development and potential impacts on water resources and water-dependent assets
coal resource development pathway: a future that includes all coal mines and coal seam gas (CSG) fields that are in the baseline as well as those that are expected to begin commercial production after December 2012
component: for the purposes of Impact Modes and Effects Analysis (IMEA), a group of activities associated with a coal seam gas (CSG) operation or coal mine. For example, components during the development life-cycle stage of a coal mine include developing the mine infrastructure, the open pit, surface facilities and underground facilities. Components are grouped into life-cycle stages.
conceptual model: abstraction or simplification of reality
confined aquifer: an aquifer saturated with confining layers of low-permeability rock or sediment both above and below it. It is under pressure so that when the aquifer is penetrated by a bore, the water will rise above the top of the aquifer.
connectivity: a descriptive measure of the interaction between water bodies (groundwater and/or surface water)
consequence: synonym of impact
context: the circumstances that form the setting for an event, statement or idea

Glossary
134 | Groundwater numerical modelling for the Namoi subregion
Com
pone
nt 2
: Mod
el-d
ata
anal
ysis
for t
he N
amoi
subr
egio
n cumulative impact: for the purposes of bioregional assessments, the total change in water resources and water-dependent assets resulting from coal seam gas and coal mining developments when all past, present and reasonably foreseeable actions that are likely to impact on water resources are considered
dataset: a collection of data in files, in databases or delivered by services that comprise a related set of information. Datasets may be spatial (e.g. a shape file or geodatabase or a Web Feature Service) or aspatial (e.g. an Access database, a list of people or a model configuration file).
depressurisation: in the context of coal seam gas operations, depressurisation is the process whereby the hydrostatic (water) pressure within a coal seam is reduced (through pumping) such that natural gas desorbs from within the coal matrix, enabling the gas (and associated water) to flow to surface
dewatering: the process of controlling groundwater flow within and around mining operations that occur below the watertable. In such operations, mine dewatering plans are important to provide more efficient work conditions, improve stability and safety, and enhance economic viability of operations. There are various dewatering methods, such as direct pumping of water from within a mine, installation of dewatering wells around the mine perimeter, and pit slope drains.
discharge: water that moves from a groundwater body to the ground surface or surface water body (e.g. a river or lake)
diversion: see extraction
dmax: maximum difference in drawdown, obtained by choosing the maximum of the time series of differences between two futures. For example, to calculate the difference in drawdown between the coal resource development pathway (CRDP) and baseline, use the equations dmax = max (dCRDP(t) – dbaseline(t)) where d is drawdown, or dmax = max (hbaseline(t) – hCRDP(t)) where h is groundwater level and t is time.
drawdown: a lowering of the groundwater level (caused, for example, by pumping). In the bioregional assessment (BA) context this is reported as the difference in groundwater level between two potential futures considered in BAs: baseline coal resource development (baseline) and the coal resource development pathway (CRDP). The difference in drawdown between CRDP and baseline is due to the additional coal resource development (ACRD). Drawdown under the baseline is relative to drawdown with no coal resource development; likewise, drawdown under the CRDP is relative to drawdown with no coal resource development.
effect: for the purposes of Impact Modes and Effects Analysis (IMEA), change in the quantity and/or quality of surface water or groundwater. An effect is a specific type of an impact (any change resulting from prior events).
extraction: the removal of water for use from waterways or aquifers (including storages) by pumping or gravity channels
formation: rock layers that have common physical characteristics (lithology) deposited during a specific period of geological time

Glossary
Groundwater numerical modelling for the Namoi subregion | 135
Component 2: M
odel-data analysis for the Nam
oi subregion
geological formation: stratigraphic unit with distinct rock types, which is able to mapped at surface or in the subsurface, and which formed at a specific period of geological time
goaf: That part of a mine from which the coal has been partially or wholly removed; the waste left in old workings.
groundwater: water occurring naturally below ground level (whether stored in or flowing through aquifers or within low-permeability aquitards), or water occurring at a place below ground that has been pumped, diverted or released to that place for storage there. This does not include water held in underground tanks, pipes or other works.
groundwater recharge: replenishment of groundwater by natural infiltration of surface water (precipitation, runoff), or artificially via infiltration lakes or injection
groundwater system: see water system
hazard: an event, or chain of events, that might result in an effect (change in the quality and/or quantity of surface water or groundwater)
Hunter subregion: Along the coast, the Hunter subregion extends north from the northern edge of Broken Bay on the New South Wales Central Coast to just north of Newcastle. The subregion is bordered in the west and north–west by the Great Dividing Range and in the north by the towns of Scone and Muswellbrook. The Hunter River is the major river in the subregion, rising in the Barrington Tops and Liverpool Ranges and draining south‑west to Lake Glenbawn before heading east where it enters the Tasman Sea at Newcastle. The subregion also includes smaller catchments along the central coast, including the Macquarie and Tuggerah lakes catchments.
hydrogeology: the study of groundwater, including flow in aquifers, groundwater resource evaluation, and the chemistry of interactions between water and rock
hydrological response variable: a hydrological characteristic of the system that potentially changes due to coal resource development (for example, drawdown or the annual flow volume)
impact: a change resulting from prior events, at any stage in a chain of events or a causal pathway. An impact might be equivalent to an effect (change in the quality and/or quantity of surface water or groundwater), or it might be a change resulting from those effects (for example, ecological changes that result from hydrological changes).
impact mode: the manner in which a hazardous chain of events (initiated by an impact cause) could result in an effect (change in the quality and/or quantity of surface water or groundwater). There might be multiple impact modes for each activity or chain of events.
inflow: surface water runoff and deep drainage to groundwater (groundwater recharge) and transfers into the water system (both surface water and groundwater) for a defined area
Glossary
136 | Groundwater numerical modelling for the Namoi subregion
Com
pone
nt 2
: Mod
el-d
ata
anal
ysis
for t
he N
amoi
subr
egio
n landscape class: for bioregional assessment (BA) purposes, an ecosystem with characteristics that are expected to respond similarly to changes in groundwater and/or surface water due to coal resource development. Note that there is expected to be less heterogeneity in the response within a landscape class than between landscape classes. They are present on the landscape across the entire BA subregion or bioregion and their spatial coverage is exhaustive and non-overlapping. Conceptually, landscape classes can be considered as types of ecosystem assets.
likelihood: probability that something might happen
material: pertinent or relevant
model chain: a series of linked models where the output of one model becomes an input to another
model node: a point in the landscape where hydrological changes (and their uncertainty) are assessed. Hydrological changes at points other than model nodes are obtained by interpolation.
Namoi subregion: The Namoi subregion is located within the Murray–Darling Basin in central New South Wales. The subregion lies within the Namoi river basin, which includes the Namoi, Peel and Manilla rivers. However, the subregion being assessed is smaller than the Namoi river basin because the eastern part of the river basin does not overlie a coal-bearing geological basin. The largest towns in the subregion are Gunnedah, Narrabri and Walgett. The main surface water resource of the Namoi subregion is the Namoi River. There are three large dams that supply water to the subregion, of which Keepit Dam is the main water storage. More than half of the water released from Keepit Dam and river inflow may be extracted for use for agriculture, towns and households. Of this, the great majority is used for agricultural irrigation. The landscape has been considerably altered since European settlement for agriculture. Significant volumes of groundwater are also used for agriculture (cropping). Across the subregion there are a number of water-dependent ecological communities, and plant and animal species that are listed as threatened under either Commonwealth or New South Wales legislation. The subregion also contains Lake Goran, a wetland of national importance, and sites of international importance for bird conservation.
percentile: a specific type of quantile where the range of a distribution or set of runs is divided into 100 contiguous intervals, each with probability 0.01. An individual percentile may be used to indicate the value below which a given percentage or proportion of observations in a group of observations fall. For example, the 95th percentile is the value below which 95% of the observations may be found.
permeability: the measure of the ability of a rock, soil or sediment to yield or transmit a fluid. The magnitude of permeability depends largely on the porosity and the interconnectivity of pores and spaces in the ground.
piezometric surface: a theoretical surface representing the pressure of groundwater in an aquifer. It is defined by the level that water is measured in the bore that penetrates the aquifer.

Glossary
Groundwater numerical modelling for the Namoi subregion | 137
Component 2: M
odel-data analysis for the Nam
oi subregion
preliminary assessment extent: the geographic area associated with a subregion or bioregion in which the potential water-related impact of coal resource development on assets is assessed. The PAE is estimated at the beginning of a bioregional assessment, and is updated to the ‘assessment extent’ on the basis of information from Component 1: Contextual information and Component 2: Model-data analysis.
probability distribution: the probability distribution of a random variable specifies the chance that the variable takes a value in any subset of the real numbers. It allows statements such as 'There is a probability of x that the variable is between a and b'.
receptor: a point in the landscape where water-related impacts on assets are assessed
receptor impact model: a function that translates hydrological changes into the distribution or range of potential ecosystem outcomes that may arise from those changes. Within bioregional assessments, hydrological changes are described by hydrological response variables, ecosystem outcomes are described by receptor impact variables, and a receptor impact model determines the relationship between a particular receptor impact variable and one or more hydrological response variables. Receptor impact models are relevant to specific landscape classes, and play a crucial role in quantifying potential impacts for ecological water-dependent assets that are within the landscape class. In the broader scientific literature receptor impact models are often known as ‘ecological response functions’.
recharge: see groundwater recharge
risk: the effect of uncertainty on objectives
riverbed conductance: a parameter used in the river package of MODFLOW. It is defined as the result of the product of hydraulic conductivity of the riverbed materials and the area (width times the length) of the river in the cell, divided by the vertical thickness of the riverbed materials.
runoff: rainfall that does not infiltrate the ground or evaporate to the atmosphere. This water flows down a slope and enters surface water systems.
sensitivity: the degree to which the output of a model (numerical or otherwise) responds to uncertainty in a model input
source dataset: a pre-existing dataset sourced from outside the Bioregional Assessment Programme (including from Programme partner organisations) or a dataset created by the Programme based on analyses conducted by the Programme for use in the bioregional assessments (BAs)
stratigraphy: stratified (layered) rocks
subregion: an identified area wholly contained within a bioregion that enables convenient presentation of outputs of a bioregional assessment (BA)
subsidence: localised lowering of the land surface. It occurs when underground voids or cavities collapse, or when soil or geological formations (including coal seams, sandstone and other sedimentary strata) compact due to reduction in moisture content and pressure within the ground.
Glossary
138 | Groundwater numerical modelling for the Namoi subregion
Com
pone
nt 2
: Mod
el-d
ata
anal
ysis
for t
he N
amoi
subr
egio
n surface water: water that flows over land and in watercourses or artificial channels and can be captured, stored and supplemented from dams and reservoirs
tenement: a defined area of land granted by a relevant government authority under prescribed legislative conditions to permit various activities associated with the exploration, development and mining of a specific mineral or energy resource, such as coal. Administration and granting of tenements is usually undertaken by state and territory governments, with various types related to the expected level and style of exploration and mining. Tenements are important mechanisms to maintain standards and safeguards relating to environmental factors and other land uses, including native title.
tmax: year of maximum change
transmissivity: A parameter indicating the ease of groundwater flow through a metre width of aquifer section (taken perpendicular to the direction of flow).
transparency: a key requirement for the Bioregional Assessment Programme, achieved by providing the methods and unencumbered models, data and software to the public so that experts outside of the Assessment team can understand how a bioregional assessment was undertaken and update it using different models, data or software
uncertainty: the state, even partial, of deficiency of information related to understanding or knowledge of an event, its consequence, or likelihood. For the purposes of bioregional assessments, uncertainty includes: the variation caused by natural fluctuations or heterogeneity; the incomplete knowledge or understanding of the system under consideration; and the simplification or abstraction of the system in the conceptual and numerical models.
unconfined aquifer: an aquifer whose upper water surface (watertable) is at atmospheric pressure and does not have a confining layer of low-permeability rock or sediment above it
water-dependent asset: an asset potentially impacted, either positively or negatively, by changes in the groundwater and/or surface water regime due to coal resource development
water make: the groundwater extracted for dewatering mines
water system: a system that is hydrologically connected and described at the level desired for management purposes (e.g. subcatchment, catchment, basin or drainage division, or groundwater management unit, subaquifer, aquifer, groundwater basin)
water use: the volume of water diverted from a stream, extracted from groundwater, or transferred to another area for use. It is not representative of 'on-farm' or 'town' use; rather it represents the volume taken from the environment.
watertable: the upper surface of a body of groundwater occurring in an unconfined aquifer. At the watertable, pore water pressure equals atmospheric pressure.
well: typically a narrow diameter hole drilled into the earth for the purposes of exploring, evaluating or recovering various natural resources, such as hydrocarbons (oil and gas) or water. As part of the drilling and construction process the well can be encased by materials such as steel and cement, or it may be uncased. Wells are sometimes known as a ‘wellbore’.

Glossary
Groundwater numerical modelling for the Namoi subregion | 139
www.bioregionalassessments.gov.au