
PAK BENG HYDROPOWER PROJECT - Mekong River ...
289
PAK BENG HYDROPOWER PROJECT Engineering-Status-Report September 2015
-
Upload
khangminh22 -
Category
Documents
-
view
0 -
download
0
Transcript of PAK BENG HYDROPOWER PROJECT - Mekong River ...

PAK BENG HYDROPOWER PROJECT
Engineering-Status-Report
September 2015


Engineering-Status-Report
I
ABBREVIATIONS AND MEASURES
LAO PDR ORGANISATIONS
EDL Electricity du Lao
LAO PDR Government of Lao People’s Democratic Republic
INTERNATIONAL ORGANISATIONS
EGAT Electricity Generating Authority of Thailand
GMS Greater Mekong Subregion
KHIDI Kunming Hydropower Investigation, Design & Research Institute
MRC Mekong River Commission
OTHER ABBREVIATIONS
Co., Ltd Company Limited
FS Feasibility Study
HPP Hydroelectric Power Project
LMB Lower Mekong Basin
MOU Memorandum of Understanding
U/S Upstream
D/S Downstream
W×H Width×Height
L×W×H Lenght×Width×Height
H:V Vertical height : Horizontal distance
HS Hydrological station
ASHDCT The Automatic System of Hydrologic Data Collection and

Engineering-Status-Report
II
Transmission
MEASURES
Dimension
km Kilometer
m Meter
mm Millimeter.
OD Outside Diameter
Volume
m3 Cubic Meter
m3/s Cubic Meter Per Second
m3/month Cubic meter per month
m3/min Cubic meter per minute
Area
ha Hectare
km2 Square Kilometer
m2 Square Meter
Time
h Hour
yr Year
s Second
Money
USD US Dollar
Engineering-Status-Report
III
Weight
t Metric Ton or Tonne
t/yr Tonne per year
t/h Tonne per hour
Electrical Units
MW Megawatt
GIS Gas Insulated Switchgear
kV Kilovolt
kW Kilowatt
kVA Kilovolt-ampere
HP Horsepower
kWh Kilowatt hour
Other Measures
% Percent
℃ Degree Centigrade
EL Elevation
Lu Lugeon
NE North East
NW North West
SE South East
SW South West
% Per cent

Engineering-Status-Report
IV
℃ Degree centigrade
r/min Revolution per minute
t·m2 Ton multiply square meter
GD2 Moment of inertia
MPa Mega Pascal
ф Diameter
∑LV Summation of length multiply flow rate
Hr Rated head
nr Rated revolution
Lk Length of span
km Kilometer
ACSR Steel core aluminum stranded wire
HV High voltage
LV Low voltage
MVA Mega volt ampere
A Ampere
Hz Hertz
SF6 Sulfur hexafluoride
OFWF Forced oil circulation water cooling
kA Kilo-ampere
kVA Kilovolt-ampere
AGC Automatic Generation Control

Engineering-Status-Report
V
AVC Automatic Voltage Control
TV Television
I/O Input/Output
LCU Local Control Unit
UPS Uninterrupted Power Supply
AC Alternating Current
DC Direct Current
PLC Programmable Logic Controller
SCR Silicon Controlled Rectifier
PID Proportion Integration Differentiation
PSS Power System Stablizer
GIS Gas Isolated Switchgear
OPGW Optical power ground wire
SDH Fiber optic transmitter/receiver
PABX Private automatic branching exchange
Ah Ampere hour
KN Kilonewton

Engineering-Status-Report
i
CONTENTS
Page
1 GENEARL DESCRIPTION ..................................................................................... 1-1
1.1 HYDROPOWER DEVELOPMENT PLANNING FOR MEKONG
RIVER ...................................................................................................... 1-1
1.2 PROJECT LAYOUT ................................................................................. 1-1
1.3 POWER PURCHASE AND EXPORT ....................................................... 1-2
1.4 DESIGN STANDARD .............................................................................. 1-3
1.4.1 Design Code ........................................................................................ 1-3
1.4.2 Design Standard for Flood .................................................................. 1-3
1.4.3 Aseismic Design Criteria .................................................................... 1-4
1.4.4 Ship Lock Design Criteria .................................................................. 1-4
2 GEOLOGY AND GEOTECHNICAL INVESTIGATION ....................................... 2-1
2.1 INTRODUCTION ..................................................................................... 2-1
2.2 GENERAL GEOLOGY AND GEOMORPHOLOGY ................................. 2-6
2.3 REGIONAL GEOLOGY AND EARTHQUAKE ....................................... 2-7
2.4 RESERVOIR GEOLOGY ........................................................................ 2-10
2.5 POWERHOUSE FOUNDATION ............................................................ 2-10
2.6 DISCHARGE SLUICES FOUNDATION ................................................ 2-11
2.7 SHIP LOCK AND CHANNEL FOUNDATION ...................................... 2-11
2.8 GRAVITY DAM FOUNDATION ........................................................... 2-12
2.9 GEOLOGY CONDITION OF FISH WAY ............................................... 2-12
2.10 GEOLOGICAL CONDITIONS OF THE COFFERDAMS ....................... 2-12
2.11 CONSTRUCTION MATERIALS ............................................................ 2-13
3 TOPOGRAPHICAL MAPPING ............................................................................... 3-1
3.1 SCOPE OF WORK .................................................................................... 3-1
3.2 GEODETIC SURVEYING SYSTEM ........................................................ 3-1
3.3 GPS SURVEY ........................................................................................... 3-2
Engineering-Status-Report
ii
3.3.1 Method and Approach ......................................................................... 3-2
3.3.2 GPS Observation and Data Processing ............................................... 3-2
3.4 ELEVATION SURVEY ............................................................................ 3-4
3.4.1 General ................................................................................................ 3-4
3.4.2 Field Observation ................................................................................ 3-4
3.4.3 Indoor Data Processing ....................................................................... 3-4
3.5 TOPOGRAPHIC MAPPING ..................................................................... 3-5
3.5.1 Mapping Method ................................................................................. 3-5
3.5.2 Cartographic mapping ......................................................................... 3-5
3.5.3 Annotations on Topographic Map ...................................................... 3-6
3.5.4 Survey of the River Channel Cross Section ........................................ 3-7
3.5.5 Survey of the River Channel Profile ................................................... 3-8
3.6 SUMMARY OF MAPPING DATA ........................................................... 3-9
3.7 SUBMITTAL OF DOCUMENTS .............................................................. 3-9
3.8 INDEX MAP OF TOPOGRAPHIC MAP .................................................. 3-9
4 HYDROLOGY AND SEDIMENT ........................................................................... 4-1
4.1 GENERAL ................................................................................................ 4-1
4.1.1 General Description of Natural Geography ........................................ 4-1
4.1.2 Meteorological Conditions ................................................................. 4-4
4.2 HYDROLOGIC DATA COLLECTED ...................................................... 4-6
4.2.1 Distribution of Station Network ......................................................... 4-6
4.2.2 Hydrological Data Collected .............................................................. 4-6
4.3 RUNOFF ................................................................................................... 4-9
4.3.1 Runoff Properties ................................................................................ 4-9
4.3.2 Natural Runoff at Dam Site .............................................................. 4-10
4.3.3 Runoff Influenced by the Upstream Power stations ......................... 4-13
4.4 FLOOD ................................................................................................... 4-17
4.4.1 Properties of Storm ........................................................................... 4-17
4.4.2 Properties of Flood ............................................................................ 4-18
4.4.3 Flood Frequency Analysis about Hydrological Station .................... 4-19
4.4.4 Design Flood of the Dam Site ........................................................... 4-22
4.4.5 Construction Design Flow in Dry Season ......................................... 4-23

Engineering-Status-Report
iii
4.5 SEDIMENT ............................................................................................. 4-27
4.5.1 Sediment Investigation ..................................................................... 4-27
4.5.2 Sediment Transport in Hydrological Stations ................................... 4-31
4.5.3 Natural Sediment Transport at the Dam Site .................................... 4-39
4.5.4 Sediment Transport after Considering Sediment-Retaining
Impact of Cascades in the Upstream ................................................. 4-42
4.5.5 Sediment Grading ............................................................................. 4-42
4.6 RATING CURVE .................................................................................... 4-45
4.7 EXPECTED FUTURE HYDROLOGY .................................................... 4-48
4.8 SUMMARY OF EFFECTS OF PAK BENG ON MEKONG RIVER
HYDRAULIC ......................................................................................... 4-49
4.9 PLANNING FOR AUTOMATIC SYSTEM OF HYDROLOGIC
DATA COLLECTION AND TRANSMISSION ...................................... 4-50
4.9.1 Necessity of the System construction ............................................... 4-50
4.9.2 Condition of the existing station networks ....................................... 4-51
4.9.3 System covering range ...................................................................... 4-52
4.9.4 Forecasting scheme and Station network layout ............................... 4-53
4.9.5 Primary selection of the communication mode and work system ....... 4-60
4.9.6 Investment estimation ....................................................................... 4-61
4.10 PLAINNINGFOR SEDIMENTMONITORING STATION
NETWORK ............................................................................................. 4-62
4.10.1 Purpose of Observation ..................................................................... 4-62
4.10.2 Observation Items ............................................................................. 4-62
4.10.3 Main Observation Results ................................................................. 4-63
4.10.4 Estimated Cost .................................................................................. 4-63
5 PROJECT PLANNING ............................................................................................ 5-1
5.1 INTRODUCTION ..................................................................................... 5-1
5.2 PROJECT DEVELOPMENT TASK .......................................................... 5-1
5.2.1 Power Generation ............................................................................... 5-1
5.2.2 Navigation ........................................................................................... 5-1
5.2.3 Tourism ............................................................................................... 5-2
5.2.4 Promotion of Local Economic and Social Development .................... 5-2
Engineering-Status-Report
iv
5.3 NAVIGATION SCALE ............................................................................. 5-3
5.3.1 Current Status of Navigation Channel ................................................ 5-3
5.3.2 Planning for Navigation Channel ....................................................... 5-3
5.3.3 Navigation Scale and Navigation during Construction ...................... 5-5
5.4 PRELIMINARY ANALYSIS OF THE POWER SUPPLY AREA
AND ELECTRICITY MARKET ............................................................... 5-6
5.5 RUNOFF AND HYDROPOWER CALCULATION .................................. 5-7
5.5.1 Precondition for Project Scale Argumentation ................................... 5-7
5.5.2 Runoff Compensative Regulation ....................................................... 5-8
5.5.3 Calculation of Flood Regulation ....................................................... 5-13
5.6 NORMAL WATER LEVEL .................................................................... 5-15
5.6.1 Planning Result ................................................................................. 5-15
5.6.2 Progress Status of relevant Work ...................................................... 5-15
5.6.3 Study on Normal Water Level .......................................................... 5-16
5.7 DEAD WATER LEVEL .......................................................................... 5-35
5.8 CHARACTERISTIC WATER LEVEL FOR FLOOD CONTROL ........... 5-36
5.9 INSTALLED CAPACITY ....................................................................... 5-36
5.9.1 Main Factors Affecting Selection of Installed Capacity ................... 5-36
5.9.2 Scheme Formulation of Installed Capacity ....................................... 5-36
5.9.3 Rated Head and Model of Generating Unit ...................................... 5-41
5.10 RESERVOIR OPERATION MODEL AND ENERGY INDEX ................ 5-42
5.10.1 Reservoir Operation Mode ................................................................ 5-42
5.10.2 Energy Index ..................................................................................... 5-50
6 PROJECT LAYOUT ................................................................................................ 6-1
6.1 PROJECT LAYOUT ................................................................................. 6-1
6.2 WATER RETAINING STRUCTURES ...................................................... 6-4
6.3 FLOOD RELEASE STRUCTURES .......................................................... 6-4
6.4 POWERHOUSE STRUCTURES ............................................................... 6-4
6.5 NAVIGATION STRUCTURES ................................................................. 6-5
6.6 FISHWAY STRUCTURES ....................................................................... 6-5
7 GRAVITY DAM ...................................................................................................... 7-1

Engineering-Status-Report
v
7.1 GRAVITY DAM ON RIGHT BANK ........................................................ 7-1
7.2 GRAVITY DAM ON LEFT BANK ........................................................... 7-2
8 POWERHOUSE ....................................................................................................... 8-1
8.1 INTRODUCTION ..................................................................................... 8-1
8.2 POWERHOUSE STRUCTURES ............................................................... 8-1
8.2.1 Layout of Power Intake and Tailrace Outlet ....................................... 8-1
8.2.2 Layout of Powerhouse ........................................................................ 8-1
9 WATER RELEASE STRUCTURES ........................................................................ 9-1
9.1 INTRODUCTION ..................................................................................... 9-1
9.1.1 Flood Design Criteria .......................................................................... 9-1
9.1.2 Basic Data ........................................................................................... 9-1
9.1.3 Complex Layout ................................................................................. 9-2
9.2 BOTTOM OUTLETS ................................................................................ 9-2
9.3 DISCHARGING SLUICES ....................................................................... 9-3
9.4 DISCHARGE CAPACITY ........................................................................ 9-5
9.4.1 Discharge Capacity for Normal Condition ......................................... 9-5
9.4.2 Analysis for Safe Passage for Extreme Condition .............................. 9-6
9.5 DESIGN OF ENERGY DISSIPATION ..................................................... 9-8
10 SHIP LOCK AND CHANNEL .............................................................................. 10-1
10.1 INTRODUCTION ................................................................................... 10-1
10.2 SHIP LOCK ............................................................................................ 10-1
10.2.1 Upper Lock Head .............................................................................. 10-1
10.2.2 Lock Chamber ................................................................................... 10-1
10.2.3 Lower lock Head ............................................................................... 10-1
10.3 UPSTREAM AND DOWNSTREAM APPROACH CHANNEL .............. 10-2
10.3.1 Width of Approach Channel ............................................................. 10-2
10.3.2 Floor Elevation of Approach Channel .............................................. 10-2
10.3.3 Straight Line Length of Approach Channel and Bend Radius .......... 10-2
10.3.4 Berthing Space .................................................................................. 10-3
11 FISH PASSAGE FACILITIES ............................................................................... 11-1
Engineering-Status-Report
vi
11.1 INTRODUCTION ................................................................................... 11-1
11.1.1 Background ....................................................................................... 11-1
11.1.2 Reference .......................................................................................... 11-1
11.2 ANALYSIS OF IMPACT BY PROJECT CONSTRUCTION ON FISH
RESOURCES .......................................................................................... 11-2
11.2.1 Fish Investigation .............................................................................. 11-2
11.2.2 Impact Assessment ............................................................................ 11-7
11.2.3 Fish Protection Measures .................................................................. 11-9
11.2.4 Proposed major Fish Passage Objects .............................................. 11-9
11.3 COMPARISON AND SELECTION OF OPTIONS ............................... 11-10
11.3.1 Comparison ..................................................................................... 11-10
11.3.2 Selection ........................................................................................... 11-11
11.4 BASIC PARAMETERS FOR DESIGN OF FISHWAY ......................... 11-11
11.4.1 Selection of Operation Water Level ................................................. 11-11
11.4.2 Designed Flow Rate of Fish way .................................................... 11-12
11.4.3 Determination of Elevation of Baseboard of Fish way Inlet and
Outlet .............................................................................................. 11-12
11.4.4 Basic Parameters ............................................................................. 11-12
11.5 OPERATION MANAGEMENT AND MONITORING
EVALUATION ..................................................................................... 11-14
11.6 CONCLUSION ..................................................................................... 11-14
12 DAM SAFETY ....................................................................................................... 12-1
12.1 RESERVOIR OPERATION MODE ........................................................ 12-1
12.2 EMERGENCY PREPAREDNESS PLAN ................................................ 12-7
12.3 DAM SAFETY MANAFEMENT SYSTEM ............................................ 12-8
12.3.1 Dam Observation Planning ............................................................... 12-8
12.3.2 Management of Dam Safety Monitoring ........................................ 12-10
12.3.3 Maintenance and Management of Hydraulic Structure
Operation ........................................................................................ 12-10
12.3.4 Dam Safety Inspection .................................................................... 12-12
12.3.5 Management of the Defect of Hydraulic Structures ....................... 12-13
12.3.6 Dam Data Management .................................................................. 12-14

Engineering-Status-Report
vii
12.3.7 Management of prohibited dam zone ............................................. 12-14
13 MECHANICAL AND ELECTRICAL EQUIPMENT AND STEEL
STRUCTURE ......................................................................................................... 13-1
13.1 HYDRAULIC MACHINERY .................................................................. 13-1
13.1.1 Preliminary Selection of Turbine-Generator Unit and Auxiliary
Equipment ......................................................................................... 13-1
13.1.2 Regulating Guarantee ....................................................................... 13-3
13.1.3 Transport of Heavy and Large Pieces ............................................... 13-3
13.1.4 Main Equipment of Hydraulic Machinery ........................................ 13-3
13.2 ELECTRICAL ......................................................................................... 13-4
13.2.1 Connecting to System ....................................................................... 13-4
13.2.2 Main Single Line Design .................................................................. 13-4
13.2.3 Station-Service Power Supply .......................................................... 13-7
13.2.4 Selection of Main Electrical Equipment ........................................... 13-8
13.3 CONTROL PROTECTION AND COMMUNICATION ........................ 13-12
13.3.1 Monitoring System of Whole Station ............................................. 13-12
13.3.2 Excitation System ........................................................................... 13-13
13.3.3 DC System ...................................................................................... 13-13
13.3.4 Relay Protection and Safe and Automatic Configuration ............... 13-13
13.3.5 Measurement ................................................................................... 13-14
13.3.6 Communications ............................................................................. 13-14
13.3.7 Main Equipment of Control Protection and Communication ......... 13-14
13.4 LAYOUT OF ELECTROMECHANICAL EQUIPMENT ...................... 13-15
13.4.1 Preliminary Selection of Main Powerhouse Control Dimensions
and Elevations ................................................................................. 13-15
13.4.2 D/S Auxiliary Powerhouse.............................................................. 13-16
13.5 HYDRAULIC STEEL STRUCTURES .................................................. 13-17
13.5.1 General ............................................................................................ 13-17
13.5.2 Equipment of Headrace System ...................................................... 13-18
13.5.3 Equipment of Flood Release and Sand-Flushing System ............... 13-19
13.5.4 Equipment of Ship Lock System .................................................... 13-22
13.5.5 Equipment of Fish way System ...................................................... 13-25
13.5.6 Steel Structural Equipment ............................................................. 13-25

Engineering-Status-Report
viii
14 SWITCHYARD TRANSMISSION ........................................................................ 14-1
14.1 INTRODUCTION ................................................................................... 14-1
14.2 TRANSMISSION .................................................................................... 14-1
14.3 SWITCHYARD PRELIMINARY DESIGN ............................................. 14-1
14.4 TRANSMISSION PRELIMINARY DESIGN .......................................... 14-2
14.4.1 Transmission Line Supply to Laos ................................................... 14-2
14.4.2 Transmission Line Supplying power to Thailand ............................. 14-3
15 CONSTRUCTION PLAN AND SCHEDULING ................................................... 15-1
15.1 CONSTRUCTION DIVERSION ............................................................. 15-1
15.1.1 Means of Diversion ........................................................................... 15-1
15.1.2 Ranks of Diversion Structure ............................................................ 15-1
15.1.3 Standards of Diversion Structure ...................................................... 15-1
15.1.4 Diversion Procedure ......................................................................... 15-1
15.1.5 Standards of Diversion Structure ...................................................... 15-3
15.1.6 River Closure .................................................................................... 15-4
15.1.7 Initial Water Impounding Plan and Water Supply to
Downstream during Construction Period ......................................... 15-5
15.1.8 Navigation Suspension during Construction and Measures for
Passengers and Cargos to Cross the Dam ......................................... 15-6
15.2 CONSTRUCTION MATERIALS ............................................................ 15-7
15.2.1 Sources of Main Construction Materials, Water and Electricity ...... 15-7
15.2.2 source of Concrete aggregate ............................................................ 15-8
15.3 CONSTRUCTION METHODOLOGY .................................................. 15-11
15.3.1 Construction of Diversion Works ................................................... 15-11
15.3.2 Construction of Dam ....................................................................... 15-12
15.3.3 Construction of Headrace/Power Generation System .................... 15-13
15.3.4 Construction of Navigation Structures ........................................... 15-13
15.4 ACCESS TO THE PROJECT SITE ....................................................... 15-13
15.5 INTERNAL (IN-SITE) TRANSPORTATION ....................................... 15-19
15.6 GENERAL CONSTRUCTION LAYOUT AND ZONED PLANNING ..... 15-21
15.7 CONSTRUCTION PLANT AND FACILITIES ..................................... 15-22
15.8 DISPOSAL AREA PLANNING ............................................................ 15-25
Engineering-Status-Report
ix
15.9 MASTER CONSTRUCTION PROGRESS ............................................ 15-26
15.9.1 Progress Schedule in Organizational/Establishment Period ........... 15-26
15.9.2 Progress Schedule in Preparatory Period ........................................ 15-27
15.9.3 Construction Progress Schedule of Principal Work ........................ 15-28
15.9.4 Construction Progress Schedule for Completion Period ................ 15-29
15.9.5 Construction Critical Path ............................................................... 15-29
15.9.6 Main Construction Indicators ......................................................... 15-29
15.9.7 Supply of Construction Resources .................................................. 15-31
16 TOTAL ESTIMATED COST ................................................................................. 16-1
17 APPENDIX ............................................................................................................ 17-1
Engineering-Status-Report
x
LIST OF TABLES
Table Title Page
Table 2.1-1 Summary Quantity of Exploratory and Test Work ................................. 2-3
Table 2.3-1 Catalogue of Strong Earthquakes with Intensity ≥V Degree
Occurred in the Project Area ................................................................... 2-8
Table 2.3-2 Seismic Dynamic Parameter Values of Bed rock in the Project Area ....... 2-10
Table 3.3-1 The specific provisions for GPS Observation in field ............................ 3-2
Table 3.6-1 The collected mapping data at the current stage ..................................... 3-9
Table 4.1-1 Characteristic Values in the Mekong River Countries ............................ 4-1
Table 4.1-2 Statistics of Meteorological Elements of Laungprabang
Meteorological Station ............................................................................ 4-5
Table 4.2-1 Main Hydrological Stations on Mainstream Mekong River ................... 4-6
Table 4.2-2 Location Relationships between Hydrological Stations and Pak Beng
HPP ......................................................................................................... 4-6
Table 4.2-3 List of Hydrological Information Collected ........................................... 4-7
Table 4.3-1 Monthly Mean Flow Results of Pak Beng Dam Site ............................ 4-10
Table 4.3-2 The Annual Monthly Mean Flow Results at Certain Sections.............. 4-13
Table 4.3-3 Table for results comparison of monthly average flow of Pak Beng
HPP under different operating conditions ............................................. 4-16
Table 4.3-4 Table for change results of dam site runoff of Pak Beng HPP subject
to considering the impact of upstream regulating reservoirs ................ 4-16
Table 4.3-5 Table for results of monthly average flow at Dam Site of Pak Beng
HPP ....................................................................................................... 4-17
Table 4.4-1 Annual Occurrence Frequency of Maximum Discharge at Chiang
Saen and Laungprabang ........................................................................ 4-19
Table 4.4-2 The Statistical Parameters of Frequency Flood of Chiang Saen
Station and Laungprabang Station ........................................................ 4-21
Engineering-Status-Report
xi
Table 4.4-3 The Main Frequency Flood of Chiang SaenHS and Laungprabang
HS ......................................................................................................... 4-22
Table 4.5-1 List of Sediment Measuring of Hydrological Stations in Lancang
River Basin ........................................................................................... 4-31
Table 4.5-2 List of Sediment Measuring of Hydrological Stations in Mekong
River Basin ........................................................................................... 4-31
Table 4.5-3 Suspended Load at Yun Jinghong and Chiang Sean Hydrological
Station ................................................................................................... 4-37
Table 4.5-4 Yearly Distribution of Suspended Load at Yunjinghong Hydrologic
Station ................................................................................................... 4-39
Table 4.5-5 Yearly Distribution of Suspended Load at Pak Beng Dam Site ........... 4-40
Table 4.5-6 Analysis Table of the Sediment Yield in Lancang-Mekong River
Basin ..................................................................................................... 4-40
Table4.5-7 Grain Size Distribution of Suspended Load(by CNR at Luang
Prabang) ................................................................................................ 4-44
Table4.5-8 Grain Size Distribution of Bed-Load(by CNR at Luang Prabang) ....... 4-45
Table 4.6-1 The result of the Rating Curve at Pak Beng Dam Site ......................... 4-47
Table 4.9-1 Station networks layout of the hydrologic data acquisition and
transmission of Pak Beng HPP ............................................................. 4-58
Table 4.9-2 Construction budget estimate of hydrological information telemetry
system of Pak Beng HPP ...................................................................... 4-62
Table 4.10-1 Estimated Construction Cost of Sediment Monitoring Station
Network ................................................................................................ 4-64
Table 5.5-1 The comparison results of monthly average flow of Pak Beng HPP
under different operating conditions ..................................................... 5-10
Table 5.5-2 The change results of dam site runoff of Pak Beng HPP subject to
considering the impact of upstream regulating reservoirs .................... 5-10
Table 5.5-3 Expected Output of Pak Beng HPP ...................................................... 5-13
Table 5.5-4 Results of Design Flood at Dam Site of Pak Beng HPP ....................... 5-13
Table 5.5-5 Flood Standard and Peak Flow ............................................................. 5-14

Engineering-Status-Report
xii
Table 5.5-6 Calculation Results of Discharge Capacity of Water Release
Structure ................................................................................................ 5-14
Table 5.6-1 Monthly Water Level in Keng Pha Dai (Prior to Formation of Pak
Beng Reservoir) .................................................................................... 5-22
Table 5.6-2 Variations of Water Level in Keng Pha Dai before and after
Formation of Pak Beng Reservoir ........................................................ 5-24
Table 5.6-3 Variations of Water Level in Keng Pha Dai before and after
Reservoir Formation (at frequency flood) ............................................ 5-28
Table 5.10-1 Summary of Energy Index of Pak Beng HPP ....................................... 5-51
Table 9.1-1 Design Standard for Flood ...................................................................... 9-1
Table 9.1-2 Flood at Dam Site ................................................................................... 9-1
Table 9.1-3 Water Level – Discharge Relation at Dam Site ...................................... 9-2
Table 9.4-1 Discharge Capacity for all Water Release Structures ............................. 9-6
Table 9.4-2 Discharge Capacity for 14 Discharging Sluices and 6 sand outlets ........ 9-7
Table 9.4-3 Discharge Capacity for 13 Discharging Sluices and 8 sand outlets ........ 9-7
Table 9.4-4 Freeboard of Dam Crest for Extreme Conditions ................................... 9-7
Table 9.5-1 Calculated Results of Energy Dissipation for Discharging Sluices ........ 9-8
Table 13.1-1 Main Parameters of Turbine-Generator Unit ........................................ 13-2
Table 13.1-2 Main Parameters of Hydraulic Machinery ............................................ 13-4
Table 13.2-1 500kV Main Transformer Parameter .................................................... 13-9
Table 13.2-2 500kV Main Transformer Parameter .................................................. 13-10
Table 13.2-3 Circuit Breaker Parameter .................................................................. 13-11
Table 13.2-4 Main Electrical equipment .................................................................. 13-11
Table 13.3-1 Main Equipment of Control Protection and Communication ............. 13-15
Table 13.5-1 List of Main Hydraulic Steel Structural equipment ............................ 13-26
Table 15.1-1 Calculation Results of Water Level-Flow Relation at Dam axis .................... 15-2
Table 15.1-2 Construction Diversion Procedures ...................................................... 15-3
Table 15.1-3 Main Quantity of Work for Diversion Structures ................................. 15-5
Table 15.1-4 Initial water impounding plan of Pak Beng HPP .................................. 15-6

Engineering-Status-Report
xiii
Table 15.2-1 The Results of Accelerating Mortar-bar Method for AAR ............................ 15-8
Table 15.2-2 The Results of Mortar Bar Length Test Method for AAR ............................. 15-9
Table 15.2-3 The Results of Rock Column Method for AAR ................................... 15-9
Table 15.2-4 The rock physical mechanics test results of R/B Quarry .................... 15-10
Table 15.4-1 List of Weights and Main Sizes of the Heavy and Large Pieces of
Pak Beng HPP ..................................................................................... 15-17
Table 15.4-2 Transport Parameters of Heavy and Large Pieces of Hydraulic
Turbines, Generators and Hydraulic Machinery ................................. 15-18
Table 15.4-3 Main Electrical equipment for Jinghong Hydropower Project ...................... 15-18
Table 15.5-1 In-Site Road Properties ....................................................................... 15-20
Table 15.6-1 List of Building/Structures for Construction ...................................... 15-22
Table 15.8-1 Properties of Disposal Areas ............................................................... 15-25
Table 15.9-1 Summary Quantities of Work ............................................................. 15-26
Table 15.9-2 Main Construction Indicators ............................................................. 15-30
Table 15.9-3 Main Labor Force Demand by Year .................................................... 15-30
Table 15.9-4 Main Labor Force Demand by Year .................................................... 15-31
Table 15.9-5 Supply of Materials by Year ............................................................... 15-31
Table 15.9-6 Main Construction Equipment ............................................................ 15-32
Table 16-1 Total Estimated Cost ............................................................................. 16-1

Engineering-Status-Report
xiv
LIST OF FIGURES
Figure Title Page
Fig.2.1-1 Working photographs .............................................................................. 2-1
Fig.2.1-2 Field test and investigation photographs ................................................ 2-2
Fig.2.1-3 Adit photographs ..................................................................................... 2-2
Fig.2.1-4 Core photographs of ZK101-1 ................................................................ 2-4
Fig.2.1-5 Core photographs of ZK101-2 ................................................................ 2-5
Fig.2.1-6 Core photographs of ZK306-1 ................................................................ 2-5
Fig.2.1-7 Core photographs of ZK306-2 ................................................................ 2-6
Fig.2.3-1 Distribution of the Regional Pleistoseismic (M≥4.7) in Pak Beng
HPP ......................................................................................................... 2-9
Fig.3.8-1 Index Map of Topographic Map (1:2000) of the Complex Area of
Pak Beng HPP ....................................................................................... 3-10
Fig.3.8-2 Index Map of Topographic Map (1:5000) of the Complex Area of
Pak Beng HPP ....................................................................................... 3-10
Fig.3.8-3 Index Map of Topographic Map (1:5000) of the Reservoir Area of
Pak Beng HPP ....................................................................................... 3-11
Fig. 4.1-1 Schematic Diagram of Mekong Basin .................................................... 4-3
Fig. 4.2-1 Gauge stations at Pak Beng HPP ............................................................ 4-7
Fig. 4.2-2 Discharge and sediment concentration measurements at Pak Beng .......... 4-8
Fig. 4.2-3 Discharge measurements at Pak Beng in Different Year ........................ 4-9
Fig. 4.3-1 Chart for results comparison of monthly average flow of Pak Beng
HPP under different operating conditions ............................................. 4-17
Fig. 4.4-1 Annual Flood Peak Flow Frequency Curve of Chiang Saen HS .......... 4-21
Fig. 4.4-2 Annual Flood Peak Flow Frequency Curve of Laungprabang HS ....... 4-22
Fig. 4.4-3 Discharge Scatter at Chiang Sean Station ............................................. 4-24
Fig. 4.5-4 Discharge Scatter at Luang prabang Station ......................................... 4-24

Engineering-Status-Report
xv
Fig. 4.4-5 Peak Flow in Dry Season Frequency Curve of Interzone from
Jinghong to Chiang Saen ...................................................................... 4-26
Fig. 4.5-1 River course diagram for area between Yunjinghong District and
Luang Prabang District ......................................................................... 4-30
Fig. 4.5-2 Photo of Yunjinghong hydrologic station ............................................. 4-33
Fig. 4.5-3 The Testing Cross Section of Yunjinghong Station .............................. 4-33
Fig. 4.5-4 Process of Daily Sediment discharge Rate(1963) ................................. 4-34
Fig. 4.5-5 Process of Daily Sediment Discharge Rate (1971) ............................... 4-34
Fig. 4.5-6 Process of Daily Sediment Discharge Rate (1972) ............................... 4-35
Fig. 4.5-7 Process of Daily Sediment Discharge Rate (1973) ............................... 4-35
Fig. 4.5-8 Process of Daily Sediment Discharge Rate (1974) ............................... 4-36
Fig. 4.5-9 Correlation Diagram of Water and Sediment of Chiang Sean
Hydrological Station ............................................................................. 4-36
Fig. 4.5-10 Photo of suspended load sampling by KHIDI (25 June 2015) ............. 4-43
Fig. 4.5-11 Suspended Load Grading Curve of Pak Beng HPP .............................. 4-44
Fig. 4.5-12 Bed Load Grading Curve of Pak Beng HPP ......................................... 4-45
Fig. 4.6-1 Rating Curve at Pak Beng HS ............................................................... 4-46
Fig. 4.6-2 Rating Curve at Pak Beng Dam Site ..................................................... 4-47
Fig. 4.9-1 Network of Hydro-meteorological Stations Between Jinghong and
Pak Beng ............................................................................................... 4-52
Fig. 4.9-2 The Network of the Stations of Pak Beng HPP ASHDCT ................... 4-59
Fig. 5.5-1 The results comparison of monthly average flow of HPP under
different operating conditions ............................................................... 5-11
Fig. 5.5-2 Stage-Discharge Relation Curve at Power House Site of Pak Beng
HPP ....................................................................................................... 5-12
Fig. 5.6-1 Situation of Keng Pha Dai in Dry Season............................................. 5-17
Fig. 5.6-2 Situation of Keng Pha Dai in Larger Flow in Flood Season ................ 5-17
Fig. 5.6-3 Situation of Keng Pha Dai in Normal Water Period ............................. 5-18
Fig. 5.6-4 Keng Pha Dai Tourist Holiday Zone ..................................................... 5-18
Engineering-Status-Report
xvi
Fig. 5.6-5 Sketch of Reef Distribution at Keng Pha Dai ....................................... 5-20
Fig. 5.6-6 Sketch of Reef Exposure at Different Water Levels in Keng Pha Dai ....... 5-21
Fig. 5.6-7 Sketch of Reef Exposure at Different Water Levels in Keng Pha
Dai(Zone D) .......................................................................................... 5-22
Fig. 5.6-8 Variations of Water Level in Keng Pha Dai before and After
Formation of Pak Beng Reservoir ........................................................ 5-24
Fig. 5.6-9 Sketch of Reef Exposure (in Zone D) of Keng Pha Dai after
Formation of Pak Beng Reservoir (at mean water level in flood
season) .................................................................................................. 5-26
Fig. 5.6-10 Sketch of Reef Exposure (in Zone D) of Keng Pha Dai after
Formation of Pak Beng Reservoir (at mean water level in dry season) ...... 5-27
Fig. 5.6-11 General Information about mouth of Nam Ngao and Nam Ing River
and Chiang Khong ................................................................................ 5-30
Fig. 5.6-12 Variations of Water Level at Mouth of Nam Ngao River (CR34)
before and after Reservoir Formation ................................................... 5-32
Fig. 5.6-13 Variations of Water Level at Mouth of Nam Ing River (CR23) before
and after Reservoir Formation .............................................................. 5-32
Fig. 5.6-14 Variations of Water Level around Chiang Khong (CR13) before and
after Reservoir Formation ..................................................................... 5-33
Fig. 5.9-1 Relationship among Flow, Head and Output ........................................ 5-38
Fig. 5.10-1 Diagram of reef exposing condition in Zone D of Keng Pha Dai ........ 5-44
Fig. 5.10-2 Diagram of flood process at the dam site of Pak Beng HPP ................ 5-46
Fig. 5.10-3 Diagram of process of operation level- reservoir inflow of Pak Beng
HPP ....................................................................................................... 5-49
Fig. 6.1-1 Project Layout ......................................................................................... 6-2
Fig. 6.1-2 Upstream Elevation ................................................................................. 6-3
Fig. 7.1-1 Right Gravity Dam Layout ..................................................................... 7-1
Fig. 7.1-2 Upstream Elevation of Right Gravity Dam ............................................ 7-2
Fig. 7.1-3 Profile of Right Gravity Dam ................................................................. 7-2
Fig. 7.2-1 Left Gravity Dam Layout ....................................................................... 7-3

Engineering-Status-Report
xvii
Fig. 7.2-2 Profile of Platform along Rive Flow ....................................................... 7-4
Fig. 7.2-3 Profile of Platform along Dam Axis ....................................................... 7-4
Fig. 9.2-1 Sand Outlet Layout ................................................................................. 9-3
Fig. 9.2-2 Sand Outlet Profile .................................................................................. 9-3
Fig. 9.3 1 Discharge Sluices Layout ....................................................................... 9-4
Fig. 9.3-2 Discharge Sluice Profile ......................................................................... 9-5
Fig. 9.3-3 Navigation Discharge Sluice Profile ....................................................... 9-5
Fig. 12.-1 Sketch of Reef Exposure at Different Water Levels in Keng Pha Dai
(Zone D) ................................................................................................ 12-2
Fig. 12.4-2 Diagram of flood process at the dam site of Pak Beng Hydropower
Station ................................................................................................... 12-4
Fig. 12.4-3 Diagram of process of operation level- reservoir inflow of Pak
Beng HPP .............................................................................................. 12-7
Fig.14.4-1 One Line Diagram of the Pak Beng HPP Supply to Thailand .............. 14-4
Fig.14.4-2 Power Flow Diagram for N Security under Peak Load ........................ 14-5
Fig.14.4-3 Power Flow Diagram for N-1 Security under Peak Load ..................... 14-6
Engineering-Status-Report
1-1
1 GENEARL DESCRIPTION
1.1 HYDROPOWER DEVELOPMENT PLANNING FOR MEKONG RIVER
The Lancang River sources from Tangula Mountain in the Qinghai-Tibet Plateau, and flows
out of China at the confluence with Nanla River, a tributary on the left bank, in Mengla
District of Xishuangbanna Dai Autonomous Prefecture. The section out of China is called the
Mekong River. As a well-known international river in Southeast Asia, it flows through China,
Laos, Myanmar, Thailand, Cambodia, and Vietnam, and feeds into the South China Sea in the
proximity of Ho Chi Ming City.
The Mekong River extends as long as approximately 2,639km from the estuary of Nanla
River to the seas with a fall of 491m. Its hydroelectric potential is 32,110MW, of which 51%
is in Laos while 33% is in Cambodia.
The Secretariat of the Mekong River Commission completed MEKONG MAINSTREAM
RUN-OF-RIVER HYDROPOWER in December 1994, and proposed a 9-cascade development
planning for the Mekong River Mainstream. A run-of-river development mode was planned
for cascades with an installed capacity of 13,350MW, namely Pak Beng, Luang Prabang,
Sayaburi, and Pak Lay in Laos; Pamong and Ban Koum on Lao-Thai border; Don Sahong on
Lao-Cambodian border, and Stung Treng and Sambor in Cambodia. At the same time, an
11-cascade development planning was studied, in which Sanakham and Tonle Sap were added
on the basis of the 9-cascade development planning. According to the latest research result of
cascade development scheme of the Mekong River, the main stream of the Mekong River is
planned in ten cascades which are (from upstream to downstream) Pak Beng, Luang Prabang,
Sayaburi, Pak Lay, Sanakham, Pamong, Ban Koum, Don Sahong, Stung Treng, and Sambor.
The location of Pak Beng HPP can refer to Drawing ND62-KM0933-0922(E)-2-2 for
geographical map of cascade hydropower projects on the mainstream of the Mekong River,
Drawing ND62-KM0933-0922(E)-2-3 for their longitudinal sections.
At present, preparations for these projects are under way.
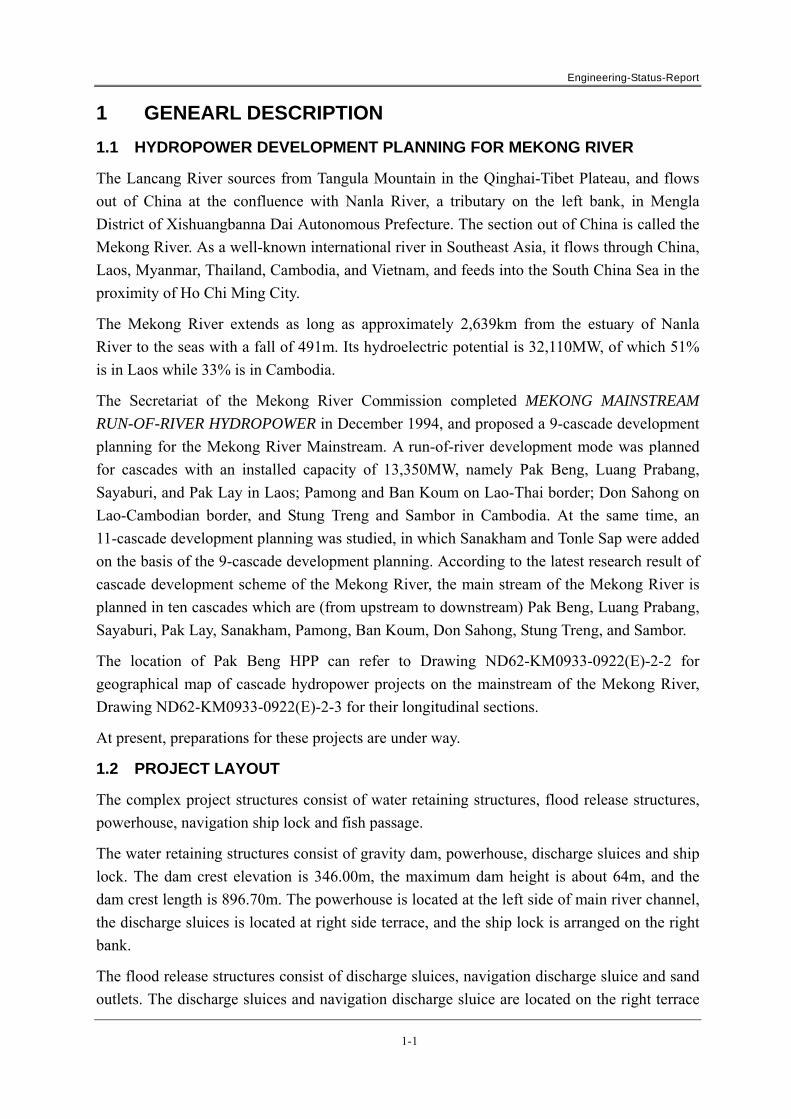
1.2 PROJECT LAYOUT
The complex project structures consist of water retaining structures, flood release structures,
powerhouse, navigation ship lock and fish passage.
The water retaining structures consist of gravity dam, powerhouse, discharge sluices and ship
lock. The dam crest elevation is 346.00m, the maximum dam height is about 64m, and the
dam crest length is 896.70m. The powerhouse is located at the left side of main river channel,
the discharge sluices is located at right side terrace, and the ship lock is arranged on the right
bank.
The flood release structures consist of discharge sluices, navigation discharge sluice and sand
outlets. The discharge sluices and navigation discharge sluice are located on the right terrace
Engineering-Status-Report
1-2
with fourteen 15m×23m (W×H) openings. A stilling basin with energy dissipation by
hydraulic jump is designed behind the sluices. The sand outlets are designed on the
powerhouse section, and sand outlets with the opening dimension of 2.5m×5m (W×H) are
arranged between at every two generating units.
The powerhouse consisting of sixteen bulb turbines is designed on the main river channel on
the left side of the riverbed. The powerhouse section is 82.5m long along the water flow
direction and 410m in total along dam axis. The main powerhouse spans 21m, and the spacing
of generating unit section is 20.5m. An erection bay is arranged both side, and the auxiliary
powerhouse is located on the downstream side of the main powerhouse while the outgoing
transmission line platform is situated on the top of the auxiliary powerhouse.
The navigation structure is a one-line one-step ship lock, and the space for the ship lock for
future upgrading into a double-line lock is reserved. The one-line lock is being designed at the
present time.
The fish passage facility is designed to be bypass channel fish way on the left bank of the
dam.
1.3 POWER PURCHASE AND EXPORT
Pak Beng HPP is the first level of the cascade development project on the mainstream of
Mekong River. The probable supply area includes Laos and Thailand.
(1) Laos
The Laotian Power Grid mainly includes three regional power grids: the northern
power grid, the central power grid and the southern power grid. Currently, all the
three regional power grids have been interconnected, and formed a uniform national
power grid. The highest voltage in Laos Power Grid is 230kV. Electric power
transaction with the neighboring countries is an important characteristic of the Laos
Power Grid. Some power station supply power to Thailand by 230kV transmission
line directly; Moreover, Lao PDR has electrical connection of 115kV and below
voltage with Thailand, China, Vietnam and Cambodia, and realizes a little power
exchange.
Currently, the power coverage rate of Laos northern power grid in is relative low.
Laos Government have pledged to achieve 90% of household electricity rates till
2020, household electricity rate increase will drive the rapid growth of the load. Thus,
though most of construction of medium and large power projects in Laos mainly
transmit to foreign markets, with the economic development and growth of residential
electricity consumption, Laos will have certain local power shortage, there will be a
certain space of market demand. Pak Beng HPP can supply a small part of the power
to the Lao domestic.

Engineering-Status-Report
1-3
(2) Thailand
Thailand power grid consist of 500kV, 230kV, 132kV, 115kV and 69kV voltage
levels, which responsible for operated by EGAT.
Thailand is in poor energy resources,, coal of thermal power station are imported
from Australia, South Africa and Indonesia, meanwhile a large number of natural gas
is imported from Malaysia, Myanmar and Vietnam. Even so, electricity supply in
Thailand is still hard pressed, in order to seek follow-up power supply, the Thai
government has advanced definitely to import electricity from abroad. According to
the preliminary intention,in the future, Thailand will mainly consider purchasing
electricity from Laos, Myanmar and Yunnan, China. The distance from the Thailand
border to Pak Beng HPP is about 20km, Pak Beng HPP consider that most of
generator units export power to the Thailand.
Currently, the Project Development Agreement provides for up to 10% of the power
produced by the Project to be made available to EDL, the surplus power will supply
to Thailand. Meanwhile, The type, selection and number of generating units,
switchyard configuration and associated equipment are standardized to suit the entire
output capacity.
1.4 DESIGN STANDARD
1.4.1 Design Code
At the feasibility study stage, the following standards are used or referenced:
Preliminary Design Guidance for Proposed Mainstream Dams in the Lower Mekong
Basin
Lao Electric Power Technical Standards
ICOLD, Bulletin on Dam Safety Management, 2005
ICOLD, Bulletin 59, Dam Safety -Guidelines, 1987
ICOLD, Bulletin 130, on Risk Assessment in Dam Safety Management: A
Reconnaissance of Benefits, Methods and Current Applications, 2005
World Bank, Operational Policy 4.37
China Power Industry Standard
1.4.2 Design Standard for Flood
In accordance with requirements of Lao Electric Power Technical Standards and by reference
to design experience of similar projects, the maximum flood of water retaining hydraulic
structures are based upon 2,000-year frequency floods, the proposed maximum navigational
water level for navigation structures is based on 3-year frequency floods.

Engineering-Status-Report
1-4
1.4.3 Aseismic Design Criteria
In accordance with the results of the site earthquake safety evaluation for Pak Beng HPP and
design experience of similar projects, the horizontal seismic peak ground acceleration for
standard of design and check are 0.157g and 0.372g respectively.
1.4.4 Ship Lock Design Criteria
In accordance with requirements specified in Preliminary Design Guidance for Proposed
Mainstream Dams in the Lower Mekong Basin published by the MRC (Mekong River
Commission), the ship lock of this project is based upon the design standard for navigation of
500t ships, and the effective dimension of the ship lock chamber is 120m×12m×4m
(L×W×Water depth above sill)

Engineering-Status-Report
2-1
2 GEOLOGY AND GEOTECHNICAL INVESTIGATION
2.1 INTRODUCTION
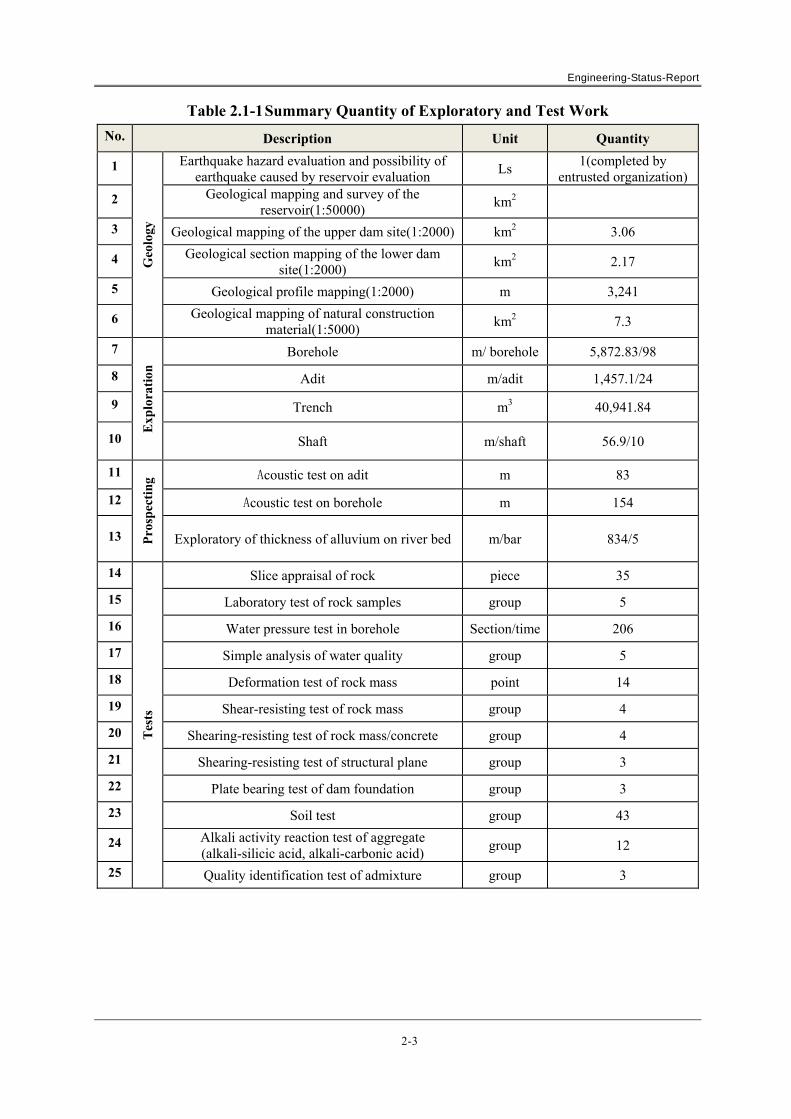
The field geological work on Pak Beng HPP was commenced in November 2007, and was
completed in June 2008. The main quantity of exploratory and test work completed is shown
in Table 2.1-1. A special report concerning the dam site selection and the layout of
hydropower was worked out in March 2008, and A Feasibility Study Report on Lao
Hydropower Project was completed in September 2008.
Part of field work and drilling photo of field exploration shows as follows:
Geologic engineer survey of cores Geologic engineer survey of cores
Geologic engineer at work Geologic engineer at work
Fig.2.1-1 Working photographs

Engineering-Status-Report
2-2
Experts survey of experimental modules Experts survey of experimental pits
Drilling machine Drilling machine at work
Fig.2.1-2 Field test and investigation photographs
Adit of PD103 Adit of PD302
Fig.2.1-3 Adit photographs
Engineering-Status-Report
2-3
Table 2.1-1 Summary Quantity of Exploratory and Test Work
No. Description Unit Quantity
1
Geo
logy
Earthquake hazard evaluation and possibility of
earthquake caused by reservoir evaluation Ls
1(completed by entrusted organization)
2 Geological mapping and survey of the reservoir(1:50000)
km2
3 Geological mapping of the upper dam site(1:2000) km2 3.06
4 Geological section mapping of the lower dam site(1:2000)
km2 2.17
5 Geological profile mapping(1:2000) m 3,241
6 Geological mapping of natural construction material(1:5000)
km2 7.3
7
Exp
lora
tion
Borehole m/ borehole 5,872.83/98
8 Adit m/adit 1,457.1/24
9 Trench m3 40,941.84
10 Shaft m/shaft 56.9/10
11
Pro
spec
ting
Acoustic test on adit m 83
12 Acoustic test on borehole m 154
13 Exploratory of thickness of alluvium on river bed m/bar 834/5
14
Tes
ts
Slice appraisal of rock piece 35
15 Laboratory test of rock samples group 5
16 Water pressure test in borehole Section/time 206
17 Simple analysis of water quality group 5
18 Deformation test of rock mass point 14
19 Shear-resisting test of rock mass group 4
20 Shearing-resisting test of rock mass/concrete group 4
21 Shearing-resisting test of structural plane group 3
22 Plate bearing test of dam foundation group 3
23 Soil test group 43
24 Alkali activity reaction test of aggregate (alkali-silicic acid, alkali-carbonic acid)
group 12
25 Quality identification test of admixture group 3
Engineering-Status-Report
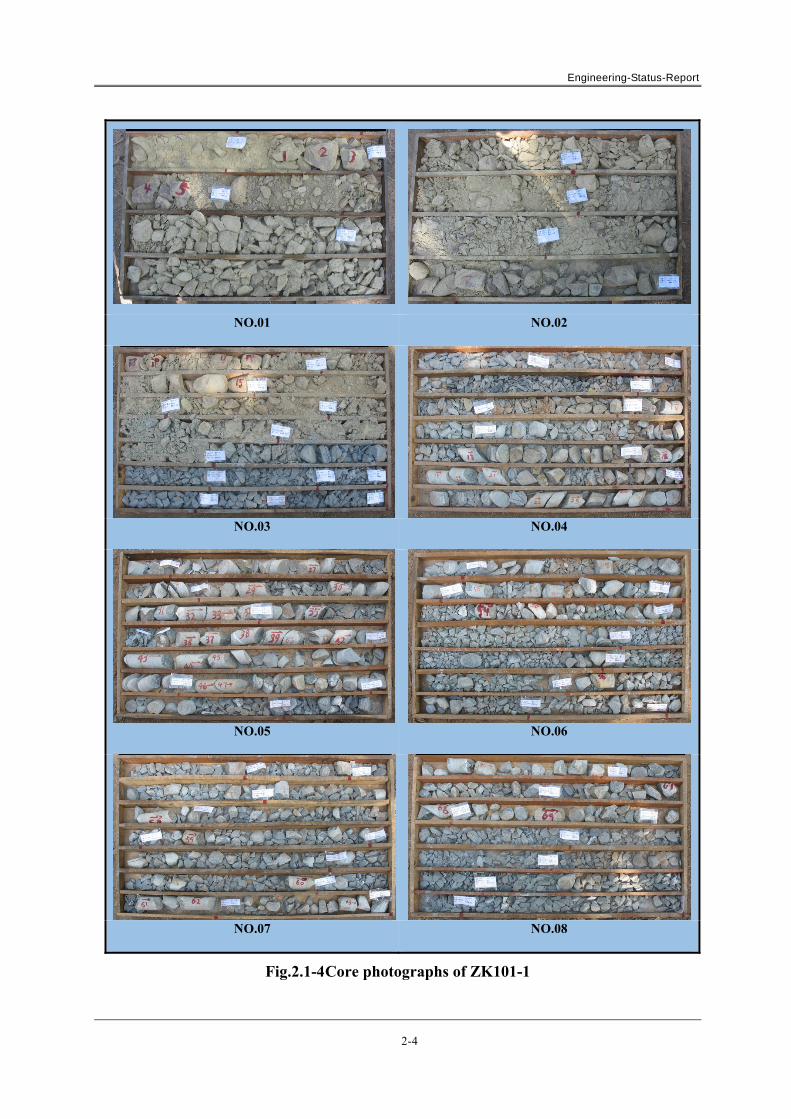
2-4
NO.01 NO.02
NO.03 NO.04
NO.05 NO.06
NO.07 NO.08
Fig.2.1-4 Core photographs of ZK101-1

Engineering-Status-Report
2-5
NO.09 NO.10
NO.11 NO.12
Fig.2.1-5 Core photographs of ZK101-2
NO.01 NO.02
Fig.2.1-6 Core photographs of ZK306-1
Engineering-Status-Report
2-6
NO.03 NO.04
NO.05 NO.06
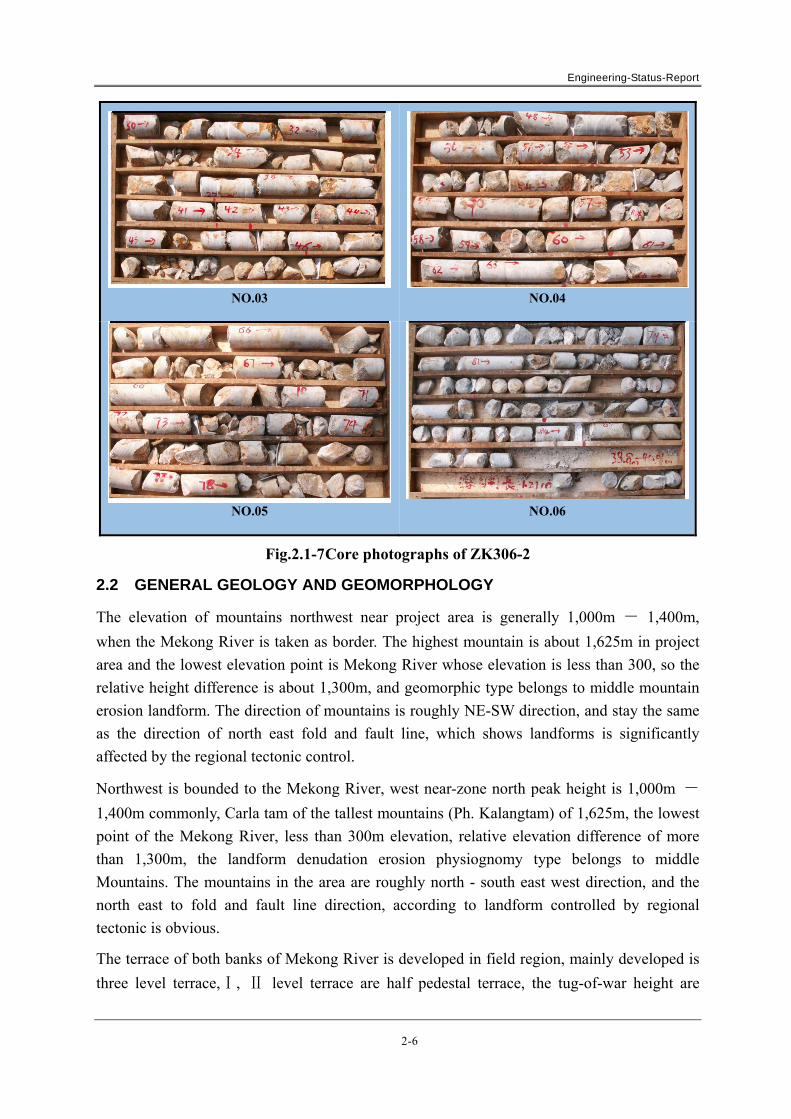
Fig.2.1-7 Core photographs of ZK306-2
2.2 GENERAL GEOLOGY AND GEOMORPHOLOGY
The elevation of mountains northwest near project area is generally 1,000m - 1,400m,
when the Mekong River is taken as border. The highest mountain is about 1,625m in project
area and the lowest elevation point is Mekong River whose elevation is less than 300, so the
relative height difference is about 1,300m, and geomorphic type belongs to middle mountain
erosion landform. The direction of mountains is roughly NE-SW direction, and stay the same
as the direction of north east fold and fault line, which shows landforms is significantly
affected by the regional tectonic control.
Northwest is bounded to the Mekong River, west near-zone north peak height is 1,000m -
1,400m commonly, Carla tam of the tallest mountains (Ph. Kalangtam) of 1,625m, the lowest
point of the Mekong River, less than 300m elevation, relative elevation difference of more
than 1,300m, the landform denudation erosion physiognomy type belongs to middle
Mountains. The mountains in the area are roughly north - south east west direction, and the
north east to fold and fault line direction, according to landform controlled by regional
tectonic is obvious.
The terrace of both banks of Mekong River is developed in field region, mainly developed is
three level terrace,Ⅰ, Ⅱ level terrace are half pedestal terrace, the tug-of-war height are

Engineering-Status-Report
2-7
respectively 15m to 20m and 30m to 40m, composition material of Ⅰ, Ⅱ level terrace
includes clay, sand and gravel with dual structure. Ⅲ level terrace belongs to erosion terrace
whose tug-of-war height is about 100m, and the surface is covered by colluvia.
2.3 REGIONAL GEOLOGY AND EARTHQUAKE
The study area belongs to the extending part in the south of Yunnan Plateau. The topography
is higher in the northwest and lower in the southeast. The strike of the mountain chain in the
area is generally in NE — SW direction, and basically accords with the direction of NE faults.
Neotectonic movement presents as build-up on the whole, and the differential movement is
not obvious, and the magmatism is not intense. There are mainly three southeast faults in this
area( Please refer to Drawing ND62-KM0933-0922(E)-3-01 for details), of which
M.Xayfault(F1) shows intense activity, and which had been moved at the Late quaternary and
occurred earthquake six times along the fault. The distribution and activity of structure as
followed:
(1) M.Xay Fault (F1)
The southwest end of M.Xay fault originates from the southwest of B.Bokham,
extends in the northeast, and goes through B.Konpok, M.Beng, M.Xay and disappears
in the north of B.Kokphao. The strike is N45°E,SE∠70°, the length is about
200km and it is some 7km away from the project site.
Two earthquakes with M=6.0 (in 1934 and 1937) and a number of earthquakes with
M=5.0 occurred along M.Xay fault in history. According to the satellite image and the
geomorphy of fault, based on the phenomena of Late Cenozoic basin controlled by
the fault and the result of the latest activity time of thermoluminescence
dating(50.66±5.57ka), it is concluded that the fault belongs to the late Pleistocene
active fault.
(2) Pak Beng Fault (F2)
The southwest end of Pak Beng fault originates from the southwest of Ph.Kandai,
extends in the northeast, and goes through B.Manphing, B.Pak Beng county seat, and
disappears on the northeast side of B.Donna. The trending strike is NE direction,
inclines to NW or SE, and dip angle is 60°-80°. The trace length of the fault is
about 35km, and it is some 6km away from the project site.
The outcrop of breccia and mylonite appears along the fault. The control effect of the
fault landform is not obvious. The latest activity time of thermoluminescence dating
(method) is 145.47±12.36ka and the fault is an active fault originated from Early
Quaternary Period. There has not been fault activity evidence since Late Pleistocene.
(3) Phadek Fault (F3)
Engineering-Status-Report
2-8
The southwest end of Ph.Phadek fault originates near B.Moy, goes through
Ph.Phadek, B.Tasong village, and disappears near B.Phoulang. The trace length of the
fault is about 80km and it is some 14km away from the project site. The attitude of
the fault is N70°E, SE∠60°~65°. The fault zone mainly contains fault breccia
with a thickness of 0.5cm-1.5cm fault gouge which shows a half cementation shape.
0.5cm-1.5cm. The results of thermoluminescence dating (method) for overlying
accumulative formation of faults is 92.18±7.83ka, and the fault is an active fault
originated from Middle Pleistocene. There has not been fault activity evidence since
Late Pleistocene.
The valley of Mekong River is wide. The relative elevation difference of mountain
chains along both banks is generally 50m-200m. The slope gradient is generally
20°-30°. Landslide is rarely seen. The rock fall with a small volume distributes
under a steep cliff which consists of limestone. Its elevation is higher than the
impounded water level in the reservoir, and the stability is good in natural state.
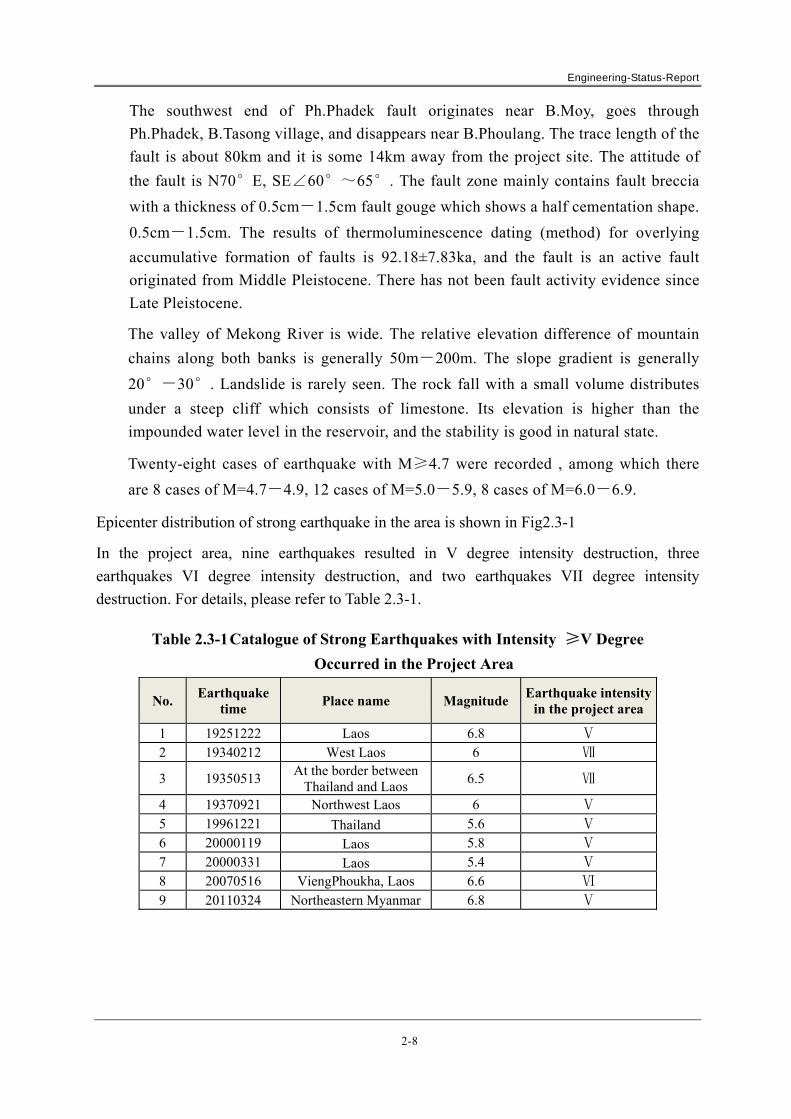
Twenty-eight cases of earthquake with M≥4.7 were recorded , among which there
are 8 cases of M=4.7-4.9, 12 cases of M=5.0-5.9, 8 cases of M=6.0-6.9.
Epicenter distribution of strong earthquake in the area is shown in Fig2.3-1
In the project area, nine earthquakes resulted in V degree intensity destruction, three
earthquakes VI degree intensity destruction, and two earthquakes VII degree intensity
destruction. For details, please refer to Table 2.3-1.
Table 2.3-1 Catalogue of Strong Earthquakes with Intensity ≥V Degree
Occurred in the Project Area
No. Earthquake
time Place name Magnitude
Earthquake intensity in the project area
1 19251222 Laos 6.8 Ⅴ 2 19340212 West Laos 6 Ⅶ
3 19350513 At the border between
Thailand and Laos 6.5 Ⅶ
4 19370921 Northwest Laos 6 Ⅴ 5 19961221 Thailand 5.6 Ⅴ 6 20000119 Laos 5.8 Ⅴ 7 20000331 Laos 5.4 Ⅴ 8 20070516 ViengPhoukha, Laos 6.6 Ⅵ 9 20110324 Northeastern Myanmar 6.8 Ⅴ

Engineering-Status-Report
2-9
Fig.2.3-1 Distribution of the Regional Pleistoseismic (M≥4.7) in Pak Beng HPP
According to seismic risk assessment of Yunnan Provincial Seismological Bureau on project
site of Pak Beng HPP, the results show that the basic earthquake intensity in the project area
of Pak Beng HPP is VII degree. The details on corresponding earthquake dynamic parameters
of bedrock in the area are shown in Table 2.3-2.
Engineering-Status-Report
2-10
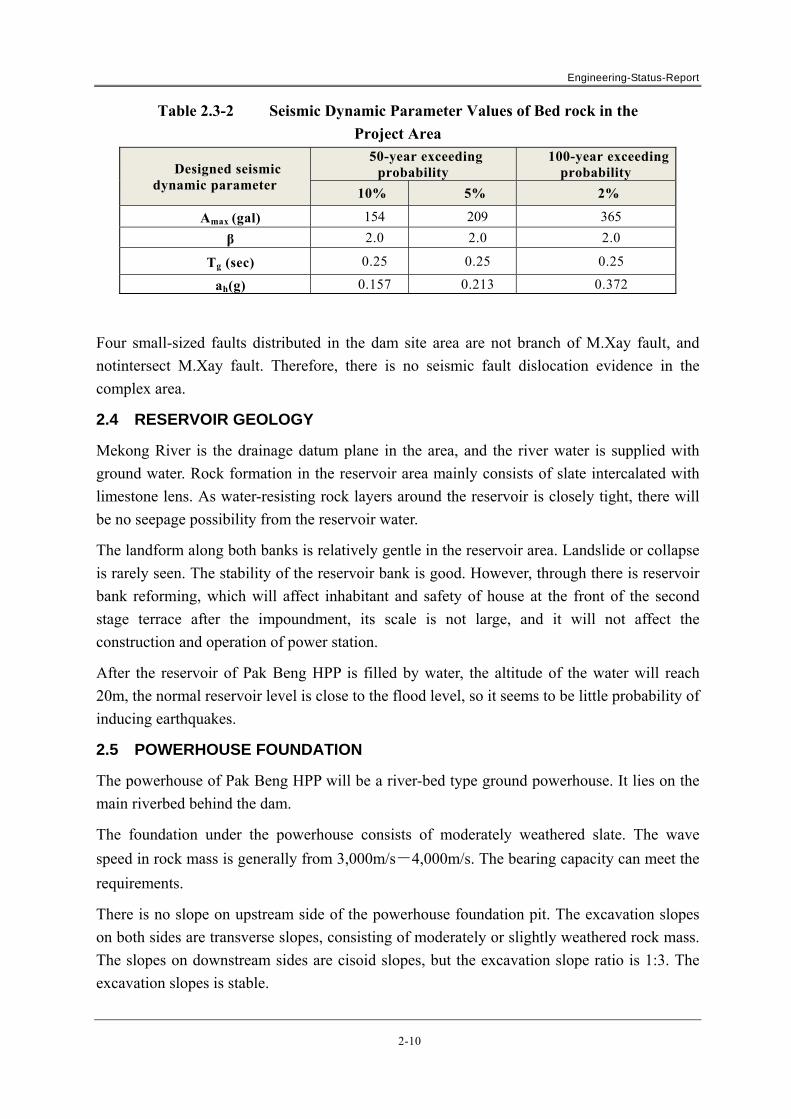
Table 2.3-2 Seismic Dynamic Parameter Values of Bed rock in the
Project Area
Designed seismic dynamic parameter
50-year exceeding probability
100-year exceeding probability
10% 5% 2%
Amax (gal) 154 209 365
β 2.0 2.0 2.0
Tg (sec) 0.25 0.25 0.25
ah(g) 0.157 0.213 0.372
Four small-sized faults distributed in the dam site area are not branch of M.Xay fault, and
notintersect M.Xay fault. Therefore, there is no seismic fault dislocation evidence in the
complex area.
2.4 RESERVOIR GEOLOGY
Mekong River is the drainage datum plane in the area, and the river water is supplied with
ground water. Rock formation in the reservoir area mainly consists of slate intercalated with
limestone lens. As water-resisting rock layers around the reservoir is closely tight, there will
be no seepage possibility from the reservoir water.
The landform along both banks is relatively gentle in the reservoir area. Landslide or collapse
is rarely seen. The stability of the reservoir bank is good. However, through there is reservoir
bank reforming, which will affect inhabitant and safety of house at the front of the second
stage terrace after the impoundment, its scale is not large, and it will not affect the
construction and operation of power station.
After the reservoir of Pak Beng HPP is filled by water, the altitude of the water will reach
20m, the normal reservoir level is close to the flood level, so it seems to be little probability of
inducing earthquakes.
2.5 POWERHOUSE FOUNDATION
The powerhouse of Pak Beng HPP will be a river-bed type ground powerhouse. It lies on the
main riverbed behind the dam.
The foundation under the powerhouse consists of moderately weathered slate. The wave
speed in rock mass is generally from 3,000m/s-4,000m/s. The bearing capacity can meet the
requirements.
There is no slope on upstream side of the powerhouse foundation pit. The excavation slopes
on both sides are transverse slopes, consisting of moderately or slightly weathered rock mass.
The slopes on downstream sides are cisoid slopes, but the excavation slope ratio is 1:3. The
excavation slopes is stable.

Engineering-Status-Report
2-11
The excavation slope on left side for the powerhouse erection bay consists of completely or
highly weathered rock mass. The rock mass is fractured and weathered completely. The
stability of the excavation slope is bad. It is necessary to take effective
reinforcement/treatment measures.
2.6 DISCHARGE SLUICES FOUNDATION
The foundation and excavation slope of Discharge Sluices is composed of moderately
weathered slate and the strength of foundation can satisfy the requirements of Discharge
Sluices. However, the rock is weak and the bedding plane is developed, particular attention
shall be given to the design of fixing concrete slab.
The water-release and scouring slope at the outlet of Discharge Sluices is diluvial layers and
alluvial -pluvial layers. The earth surface is covered with slope wash deposit with a thickness
of 2m-5m generally. The bedrock exposes oneself to the river bank, lithology mainly consist
of slate and calcareous slate, calcareous slate possess karst erode and develop karst cave.
Completely and highly weathered rock mass with a thickness of 8m-11m.The anti-swash
speed of slope wash deposit, alluvium, diluvium, completely and highly weathered rock mass
is generally 1m-2.5m/s while that of moderately weathered bedrock is about 5m/s.
After energy dissipation of the stilling basin, the flow speed at the slope section is about 4m/s.
The slope wash deposit, alluvium, diluvium, moderately and highly weathered rock mass at
the water-release scouring location may been eroded, which may result in the slope instability
at the upper section. It is recommended that effective measures should be taken for protection.
2.7 SHIP LOCK AND CHANNEL FOUNDATION
The foundation of Ship-Lock is composed of moderately weathered slate and the strength of
foundation can satisfy the requirements of Ship-Lock. However, the rock is weak and the
bedding plane is developed, particular attention shall be given to the design of fixing concrete
slab.
The approach channel lies on R/B. The earth surface is covered with sand and cobble gravel
layer with a thickness of 3m-16m,maximum is 40m. The bedrock mainly consists of slate
interbedded with sandy slate.
The side wall foundation on both sides of the approach channel mainly consists of moderately
or slightly weathered rock mass, which can meet the requirements. However, the wall
foundation and slope on left side at No.14 gully section consist of alluvium and diluvium. It is
necessary to take effective treatment measures.
The excavation slope on left side of the approach channel is low and relatively stable.
The excavation slope on right side of the approach channel is transverse slope or reverse slope.
The rock mass at the shallow section of mountains is fracture. The horizontal thickness of

Engineering-Status-Report
2-12
completely or highly weathered rock mass is 23m~30m. The excavation slope in completely
and highly weathered rock mass is unstable. It is necessary to take reinforcement/treatment
measures.
2.8 GRAVITY DAM FOUNDATION
The dam foundation mainly consists of moderately or slightly weathered slate. The wave
speed in rock mass is generally among 3,000m/s-4,000m/s. The shear strength and bearing
capacity of rock mass under the dam foundation can meet the requirements of hydraulic
structures. There is no disadvantageous discontinuity plane combination which may affect
anti-slip stability of the dam foundation at the dam foundation section. The deep anti-slip
stability problem under the dam is not outstanding. The permeability in rock mass is weak.
The normal impervious measures can be taken for treatment of the dam foundation.
Considering the project scale and engineering geological conditions of dam foundation,
unloading loose rock mass on the surface shall be removed prior to(on) dam foundation
excavation. The middle and lower part of moderately weathered rock mass shall be fully used
as the dam foundation. Partial deep excavation and backfilling treatment are needed for
fractured rock mass and strongly weathered rock mass within the dam foundation, and
systematic reinforcement is needed for superficial rock mass in the dam foundation.
Rock mass at dam abutments along both banks is broken. The highly weathering is deeper. If
the lower layer of highly weathered rock mass is used as a dam foundation, there may exist
the deformation or anti-slip problem of the dam foundation. It is necessary to take effective
reinforcement measures for the dam foundation. It is recommended that concrete cutoff walls
or “soft joints” should be built to reduce the excavation volume.
The stability of excavating slope at the dam abutments is poor, and the support measures
should be taken after the slope excavated.
2.9 GEOLOGY CONDITION OF FISH WAY
The fishway lies at the dam end on L/B. The earth surface is covered with slope wash deposit
and alluvium with a thickness of 2m-5m and the bedrock consists of slate. After the fishway
excavation, the wall foundation and slope on both sides mainly consist of completely
weathered rock mass. The surface layer consists of loose slope wash deposit and alluvium. It
is necessary to take reinforcement/ treatment measures for instability of the excavation slope.
2.10 GEOLOGICAL CONDITIONS OF THE COFFERDAMS
The staged diversion is applied in cofferdam design. The cofferdams mainly consist of
longitudinal cofferdam, first-stage upstream cofferdam, first-stage downstream cofferdam,
second-stage upstream cofferdam and second-stage downstream cofferdam.
(1) Longitudinal cofferdam

Engineering-Status-Report
2-13
The longitudinal cofferdam lies on the flood land on R/B. The bedrock appears
mostly on the earth surface at the dam foundation, and mainly consists of moderately
weathered slate. The alluvium with 3m-11m thick distributes in the upstream. After
removing the loose layers, the ground foundation of the longitudinal cofferdam lies
on the moderately weathered rock mass. The bearing capacity of the ground
foundation can meet the requirements. The permeability of bedrock is weak. The
bedrock is weakly permeable.
(2) First-stage upstream cofferdam
The first-stage upstream cofferdam lies on the flood land on R/B. The alluvium
widely distributes on the earth surface. The alluvium thickness is generally 3m-
15m. The surface layer of the alluvium mainly consists of silty sand and cobble
gravel. The permeability is better. Impervious treatment measures should be taken.
The bedrock mainly consists of moderately weathered slate with weak permeability.
(3) First-stage downstream cofferdam
The first-stage downstream cofferdam lies on the flood land on R/B. The earth
surface is covered with 3m-7m thick alluvium generally. The surface layer of
alluvium mainly consists of silty sand and cobble gravel. The permeability is better.
Impervious treatment measures should be taken. The bedrock mainly consists of
moderately weathered slate with weak permeability.
(4) Second-stage upstream cofferdam
The second-stage upstream cofferdam lies on the main river section near
Reconnaissance Line I. The alluvium widely distributed on the earth surface. The
alluvium thickness is generally 4m-12m. The alluvium mainly consists of silty sand
and cobble gravel, and the permeability is better. It is medium-strong permeability.
Impervious treatment measures should be taken. The bedrock mainly consists of
moderately weathered slate with weak permeability.
(5) Second-stage downstream cofferdam
There is bedrock along both banks at the downstream cofferdam section at the second
phase. The alluvium thickness on the riverbed is 6m-8m. The alluvium mainly
consists of silty sand and cobble gravel. The permeability is better. Impervious
treatment measures should be taken. The bedrock mainly consists of moderately
weathering slate with sandy slate with weak permeability.
2.11 CONSTRUCTION MATERIALS
The natural sand and gravel material is short in the complex area and within 20km range.
Artificial aggregate from rock material should be made for concrete. According to preliminary

Engineering-Status-Report
2-14
layout scheme of the complex area, it is estimated that the project will need about
3800×103m3 concrete aggregate.
The L/B and R/B rock quarries are selected for exploration at current stage. The locations of
the rock quarries are shown on Drawing ND62-KM0933-0922(E)-3-09.
(1) Rock Material
a The L/B Rock Quarry
The rock quarry is located on L/B of the upper dam site, 1km-3km away from the
site in the upstream. The slope gradient of the rock quarry is generally 35°-45°.
Rock layers in the quarry consist of limestone interbedded with little calcareous slate
of Trisasic System. The limestone consists of medium to thick layer structures. The
attitude of rock layer is N80°-85°W, SW∠40°-45°. The total thickness of
limestone is more than 130m. The calcareous slate generally distributes in limestone
in layer-shaped or cancellate-shaped structures. The thickness of single layer is
0.5m-1.3m.
For rock quarry, alkaline-activity tests with three groups of aggregate samples and
physical-mechanical tests with four groups of rock samples were made.
b The R/B Rock Quarry
The rock quarry is located on R/B of the upper dam site, 5km-8km away from the
site in the upstream. Its lithology, attitude, thickness and rock quality are similar to
those of the L/B rock quarry. For the R/B quarry, ten boreholes and four adits were
arranged in the rock quarry.
For R/B rock quarry, physical-mechanical tests with one group of rock sample and
alkaline-activity tests with three groups of aggregate samples were made.
The quality and reserves of the L/B or R/B rock quarries can meet the requirements of
relevant specification.
(2) Earth Material
The earth material of the project will be used as impervious earth material for the
cofferdams. The slope wash deposit and fully-weathered layer along both banks at the
dam site are thicker. They can be excavated and used as impervious earth material.
Therefore, hillsides at the dam abutments of the upper dam site along both banks will
be used as borrow.
The earth material on the terrace along left bank mainly consists of alluvial clay, and
that on slopes along both banks consists of slope wash deposit and eluvial deposit,
which contain detritus clay, silty earth and clay gravel.

Engineering-Status-Report
2-15
The quality indexes of earth material from the borrow at the left/right dam abutments
along both banks can meet the quality requirements of impervious earth material. The
exploitation and transportation conditions are good. The earth material can be used as
impervious earth material for the cofferdams of the project.
(3) Natural Admixture for Concrete
Natural admixture for concrete has been investigated near the dam site. The tuff is
discovered on left bank of Nam Ngeun, about 30km away from the dam site in the
downstream. We designed 9 drilled holes and 1 adit in the detailed geotechnical
investigation.
The tuff can be used as natural admixture source for concrete. The tuff mainly
consists of crystallinoclastic limestone and tuffaceous slate. The quality appraisal
tests of three groups of rock samples were carried out.
The text shows the quality of rock samples basically matches the technical
requirement of standards and regulations. Only the 28d's compressive strength ratio
of cement colloidal mortar is relatively small, according to the analogy of project
experiences, the tuff in Nam Ngeun is capable to become the orgin of natural
concrete admixture.

Engineering-Status-Report
3-1
3 TOPOGRAPHICAL MAPPING
3.1 SCOPE OF WORK
The topographic survey (1:2,000) scope of complex area for Pak Beng HPP is extended from
the 4km downstream of the lower dam site to the 3km upstream of the upper dam site. The
mapping width is about 1.5km along both banks of MekongRiver. In addition, the topographic
survey (1:5,000) is supplemented in the periphery of the mapping scope of the topographic
map (1:2,000) in the complex area.
The survey scope of the belt-shaped topographic map (1:5,000) of the reservoir area is from
the complex area to the place which is 6km away from the estuary of NamTha River, a
tributary in the upstream. The elevation is controlled below 360m (including underwater
topography), including the scope of NamTha River below 360m. The longitudinal section and
cross section along the river in the above scope are surveyed at the same time.
In order to meet the above mapping requirements, Class III and Class IV GPS control points
are arranged in the wholly surveyed area, and used as the geodesic plane benchmarks.
Moreover, Class III benchmarks and Class IV triangulation elevations are surveyed from the
complex area to NamTha River, and used as the geodesic elevation benchmarks.
It is the border area from the main stream location in the upstream (where it is 6km away
from the catchment estuary of NamTha River, a tributary) to El.360m closed area, where Laos
borders upon Thailand. Chinese mapping personnel are not allowed to enter into the border
area for mapping. The negotiation for the mapping work has being carried out.
3.2 GEODETIC SURVEYING SYSTEM
The same plane and elevation coordinate systems are used for the surveying of the complex
area and the reservoir area, namely, Laos National Coordinate System and Laos National
Elevation System.
The Plane Coordinate System is Laos National Coordinate System (Laos National Datum
1997) .
The Elevation Coordinate System is Laos National Vertical Datum 1981 (Mean Sea Level of
Hondau in Vietnam).
The Reference Ellipsoid is Krassovsky ellipsoid (Krassovsky 1940) . The longer radius is
6,378,245m, and the oblateness is 1:298.3.
The ground projection manner is UTM projection.
The longitude of the central meridian is 99°.
The scale ratio of the central meridian is 0.9996.

Engineering-Status-Report
3-2
3.3 GPS SURVEY
3.3.1 Method and Approach
The static observation method is used to get the coordinates of each GPS control point. A GPS
control network may be a triangle structured with three sides, a quadrilateral structured with
four sides, or a polygon with many sides. The structure of each GPS network is very firm.
The existing control points include Class III benchmarks (Nevel.127, Nevel.069) and Class III
GPS control points (GPS102 & GPS053) near Pak Beng District seat and at the reservoir
head.
3.3.2 GPS Observation and Data Processing
(1) Executive Standards
a Survey Specification for Water Conservancy & Hydropower Projects (at the planning
& design stage);
b Survey Specification for Global Positioning System (GPS).
(2) GPS Observation
Laos National Surveying & Mapping Bureau once used five TRIMBLE 5700 dual-
frequency GPS receivers to carry out the survey of Class III GPS framework
networks in the complex area and the reservoir area.
Eight sets of Nanfang Lingrui S82 dual-frequency GPS receivers were used to carry
out the static observation of the control networks in the reservoir area and the
complex area. Their nominal accuracy is ±(5mm+1ppm). After inspection, the
instruments are qualified.
The relevant technical requirements were executed according to Class E requirements
specified in Survey Specification for Global Positioning System (GPS) (GB/T
18314-2001). The specific provisions are shown in the following table 3.3-1:
Table 3.3-1 The specific provisions for GPS Observation in field
Item Value
Satellite cut-off altitude angle (degree) 15
Number of available satellites for simultaneous observation ≥4
Total number of available satellites for effective observation ≥4
Length of time period (min) ≥60
Sampling interval (s) 15
Available observation time of each satellite during the time period (min) ≥15

Engineering-Status-Report
3-3
(3) Data Processing
a Base Line Processing
TG Office1.62 processing software is used to process the baseline sides. The baseline
processing results are the fixed solutions with double errors.
b Verification of Loop Closure Error and Repeated Survey of Poor Baseline
After the field observation for GPS networks completed, the observation results were
verified to ensure the observation result quality. The verified results are shown as
follows:
The maximum closure errors of the complex area shall meet plane closure error
( 0.021m) and the vertical closure error (0.047m).
The maximum closure errors of the reservoir area shall meet plane closing error
( 0.085m) and the vertical closure error (0.082m).
c Three Dimensional Non-constraint Adjustment
TG Office1.62 After-treatment Processing Software is used to process the data
adjustment. Firstly, the three dimensional Non-constraint adjustment is verified
through WGS84 ellipsoid. After passing the verification, the two-dimensional plane
constraint adjustment and the elevation fitting adjustment are computed.
When the adjustment is computed, the adjustment of the complex area and reservoir
area are computed respectively. The plane coordinates and the initial elevation
numerical data are provided by Laos National Surveying and Mapping Bureau.
The fixed points used for the surveying of the complex area are shown as follows:
The three plane points are GPS102, PG14 and PG15.
The seven elevation points are V013, V017, V021, PE04, V032, GPS2 and V039.
After the adjustment is processed, the minimum quadratic error of the comparative
side length is 1/59,000.
The fixed points used for the surveying of the reservoir area are shown as follows:
The eight plane points are PG01, PG02, PG03, PG05, PG06, PG09, PG10 and PG11.
The twelve elevation points are GP21, GP22, GP23, V120, V129, V135, V139,
V052, V075, V084, V095 and V115.
After the adjustment is processed, the minimum quadratic error of the comparative
side length is 1/32,000.
Engineering-Status-Report
3-4
3.4 ELEVATION SURVEY
3.4.1 General
Laos National Surveying and Mapping Bureau respectively carried out the surveying of two
Class III benchmark branch lines from Neve l.127 to the complex area and from Neve l.069 to
the reservoir head. The two benchmark branch lines were used as the initial triangulation
elevation numerical data of Class IV electromagnetic distance measurement.
Under the normal circumstance, the fitting elevation with a GPS control network is difficult to
meet the requirements. So the triangulation elevation of Class IV electromagnetic distance
measurement was used for the basic elevation control of the project area. The triangulation
elevation network points of Class IV electromagnetic distance measurement and GPS network
points were used together.
3.4.2 Field Observation
Leica TC402 total station was used for the field observation. Its angle measurement accuracy
is 2″, and distance measurement accuracy is ±(2mm+2ppm).
(1) The reciprocal observation with the central hair method was used for each zenith
distance. Each zenith distance was observed three times. The index error is≤8 seconds.
The survey error is ≤8 seconds.
(2) The reciprocal observation was used for length of each side. Each side length was
observed three times. The reading error is ≤10mm and the survey error is ≤15mm.
3.4.3 Indoor Data Processing
(1) Field Verification
Verification of Closure Error:
a The initial triangulation elevation points of Class IV electromagnetic distance
measurement in the project area are Nevel.127, PE03, PE04 and PE06 which are
provided by Laos National Surveying and Mapping Bureau.
Three closure loops for triangulation elevation were surveyed in the complex area. The
closure error of each closure loop is shown as follows:
The first closure loop from Neve l.127 to PE3 is 12.8 km, the closure error is 56.0 mm,
and the constraint error is ±71.4mm
The second closure loop from PE03 to PE04 is 1.6 km, the closure error is 15.3 mm,
the constraint error is ±25.3mm.
The third closure loop from PE04 to PE06 is 5.3 km, the closure error is9.0mm, the
constraint error is ± 46.0mm.

Engineering-Status-Report
3-5
b The initial points of Class IV infrared triangle elevation measuring in the reservoir
area are PE06 in the complex area, and PE07 at the reservoir head. The closure loop is
94.97km, the closure error is-194.4mm, the constraint error is ±194.9mm.
NamThaRiver is a branch line.
(2) Adjustment Calculation
The indirect adjustment method of the least square method principle is used for data
processing and rigorous adjustment. The weight number of triangle elevation with the
electromagnetic distance measurement is P=1/S². The adjustment results are shown as
follows:
The initial points are Nevel.127, PE03, PE04, PE06 and PE07.
As a result, the quadratic error of height difference/km (unit weight number) is
±14.9mm, and that of the elevation at the poor point is (V160) ±75.4mm.
3.5 TOPOGRAPHIC MAPPING
3.5.1 Mapping Method
Four total stations (Leica TC402 and Topcon GTS-102N), GPS RTK equipment and other
devices were used for the field mapping of landform and physiognomy.
Nanfang Lingrui S82 dual-frequency GPS receivers were used for the mapping of underwater
topography to achieve the real-time dynamic positioning measurement. At the same time,
Zhonghaida HD-27 navigation numeral fathometers were also used for the mapping. And the
corresponding control software was used to carry out the surveying of plane position and
elevation at each observation point synchronously, rapidly and accurately. The automatic
positioning, automatic measurement and autographic record were achieved.
The digital mapping method was used for the topographic mapping. The data at observation
points of landform and physiognomy were collected and the corresponding sketches were
plotted during the field survey. The composite mapping work of topographic maps was
finished with a computer.
3.5.2 Cartographic mapping
The topographic mapping adopts South CASS9.1 Digital Mapping Software to carry out the
indoor work of the topographic map.
The form and legend of the topographic map are executed according to specification of Form
& Legend of Topographic Map (1:500, 1:1000 & 1:2000) and Form & Legend of Topographic
Map (1:5000 & 1:10000).
The mapping flow chart of the digitized map is shown as follows:
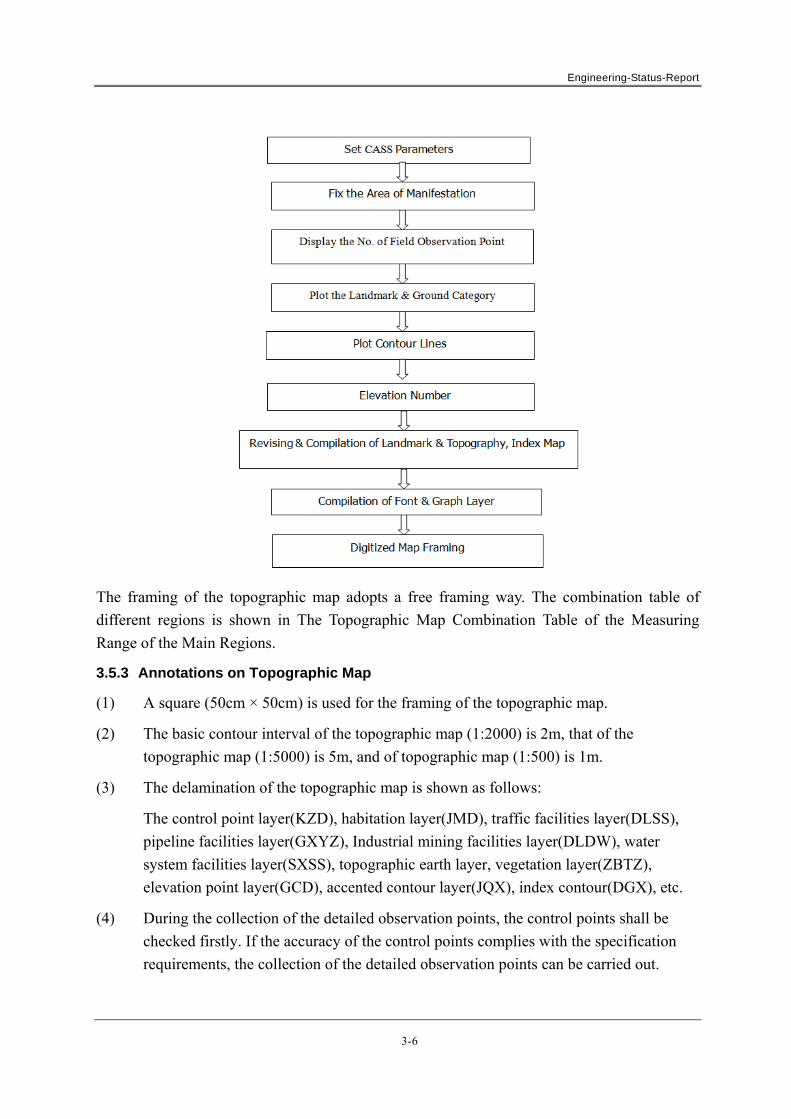
Engineering-Status-Report
3-6
The framing of the topographic map adopts a free framing way. The combination table of
different regions is shown in The Topographic Map Combination Table of the Measuring
Range of the Main Regions.
3.5.3 Annotations on Topographic Map
(1) A square (50cm × 50cm) is used for the framing of the topographic map.
(2) The basic contour interval of the topographic map (1:2000) is 2m, that of the
topographic map (1:5000) is 5m, and of topographic map (1:500) is 1m.
(3) The delamination of the topographic map is shown as follows:
The control point layer(KZD), habitation layer(JMD), traffic facilities layer(DLSS),
pipeline facilities layer(GXYZ), Industrial mining facilities layer(DLDW), water
system facilities layer(SXSS), topographic earth layer, vegetation layer(ZBTZ),
elevation point layer(GCD), accented contour layer(JQX), index contour(DGX), etc.
(4) During the collection of the detailed observation points, the control points shall be
checked firstly. If the accuracy of the control points complies with the specification
requirements, the collection of the detailed observation points can be carried out.

Engineering-Status-Report
3-7
In order to ensure the collection accuracy of the detailed points, not only the
observation stations and the orientation points, but also the neighboring ground
objects, topographic points and relative points are checked.
(5) Mapping of habitations
The disperse houses are surveyed one by one. As for dense houses, their peripherial
outline and main roadways are surveyed, and the internal houses are surveyed
selectively.
(6) The roads, rivers, ponds, ditches, wells and other water conservancy facilities in the
surveyed area are all surveyed and plotted and expressed accurately, whose
corresponding names are noted.
(7) Mapping of the power lines, communication lines, pipelines in the surveyed area: The
positions of the power lines and communication lines are determined. Moreover, the
number (3 or 5) of the power lines, and the names of the lines annotated.
(8) Vegetation Mapping
The dry land, vegetable land, forest land and wasteland were mapped with topographic
category boundaries and corresponding expression symbols, which can reflect the
vegetation types, characteristics and distribution range.
(9) Elevation point
Enough elevation points in the paddy field and dry land were measured and noted. The
elevation points between the paddy field and dry land are uniformly noted in the field
or in the land.
(10) Slopes and Escarps
All natural and artificial slopes and escarps with gradient 70 ° are expressed as
escarps, with less than 70 ° as slopes. Those sections such as rain gullies, gullies,
landslide and collapse are measured thoroughly and shown on the map with correct
symbols.
(11) The altitude lettering points on the map are more than 15 points per square decimeter.
Their positions are expressed at a mountaintop, bifurcation, a valley bottom or a road
intersection. The accented contour is noted with elevation number.
(12) The topographic map is a three-dimensional electronic one (The contour lines are
accompanied with their elevation values, and elevation points are with their character
description). The final topographic map is a DWG format.
3.5.4 Survey of the River Channel Cross Section
The polar coordinate method is used for the survey of cross section.
Engineering-Status-Report
3-8
(1) The survey scale is 1:2000, and the surveyed cross section is basically vertical to the
river strike in the river reach.
(2) The measuring points on the cross section basically control all the changes of the
landform and landmarks. There are measuring points at the upper and lower parts of
each escarp with 0.5m height. Besides the points at the waterside, the underwater
topographic points on the cross section (1:500) are not less than 20, while those on the
cross section (1:1000) are not less than 10. And the lowest point on the river bed is
also measured.
(3) The features of landmarks at the measuring points on the sections are noted, including
paddy field, dry land, ground category, escarp, cliff, highway, village, waterside and
underwater, etc. The measuring date is noted on each section.
3.5.5 Survey of the River Channel Profile
The measuring range is from the estuary of NamBeng River near Pak Beng District seat to the
Lao-Thai border, including Nam Tha river (a tributary). The main technical requirements for
the longitudinal profile survey are shown as follows:
(1) The survey scale is 1:2000. The waterside line and the perennial flood level are
measured. At some characteristic positions such as a river channel cross section,
bridge, dam site or powerhouse site of a power station, confluence point of tributaries
or water gauge, measuring points are arranged and noted. When meeting the rapid,
waterfall, bend or bifurcation, the measuring points are densified according to the
principle of controlling the longitudinal change of the river channel.
(2) When a measuring point meets a significant characteristic landform or landmark,
which is noted, including a village, bridge, confluence point of tributary (ditch), (left
bank or right bank), rapid, waterfall, bend, beach, the dam site of a power station,
factory or mine. The characteristic elevation of the power station (powerhouse ground
and the tail water), the factory or the mine (water intake and discharge outlet) is noted.
(3) The identified historical flood mark position and elevation, cross section along a river,
bridge on a river, water intake, ferry and permanent water retaining structure are all
arranged with measuring points. The elevation of the bridge floor and that of the
permanent water retaining structure are measured.
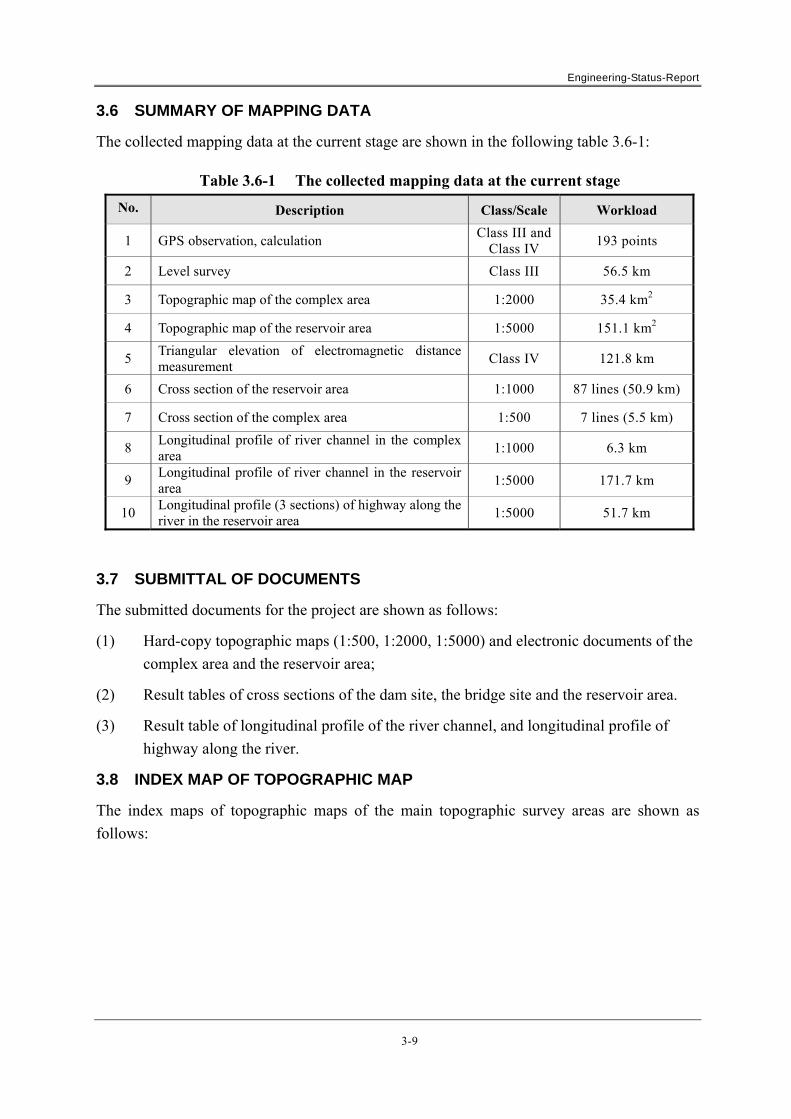
Engineering-Status-Report
3-9
3.6 SUMMARY OF MAPPING DATA
The collected mapping data at the current stage are shown in the following table 3.6-1:
Table 3.6-1 The collected mapping data at the current stage
No. Description Class/Scale Workload
1 GPS observation, calculation Class III and
Class IV 193 points
2 Level survey Class III 56.5 km
3 Topographic map of the complex area 1:2000 35.4 km2
4 Topographic map of the reservoir area 1:5000 151.1 km2
5 Triangular elevation of electromagnetic distance measurement
Class IV 121.8 km
6 Cross section of the reservoir area 1:1000 87 lines (50.9 km)
7 Cross section of the complex area 1:500 7 lines (5.5 km)
8 Longitudinal profile of river channel in the complex area
1:1000 6.3 km
9 Longitudinal profile of river channel in the reservoir area
1:5000 171.7 km
10 Longitudinal profile (3 sections) of highway along the river in the reservoir area
1:5000 51.7 km
3.7 SUBMITTAL OF DOCUMENTS
The submitted documents for the project are shown as follows:
(1) Hard-copy topographic maps (1:500, 1:2000, 1:5000) and electronic documents of the
complex area and the reservoir area;
(2) Result tables of cross sections of the dam site, the bridge site and the reservoir area.
(3) Result table of longitudinal profile of the river channel, and longitudinal profile of
highway along the river.
3.8 INDEX MAP OF TOPOGRAPHIC MAP
The index maps of topographic maps of the main topographic survey areas are shown as
follows:

Engineering-Status-Report
3-10
X 2194000.0Y 708000.0 X 2194000.0
Y 718000.0
X 2198000.0Y 718000.0
X 2198000.0Y 708000.0
X 2198000.0Y 713000.0
X 2193000.0
Y 713000.0
Fig.3.8-1 Index Map of Topographic Map (1:2000) of the Complex Area of Pak
Beng HPP
X 2197500.0
Y 705000.0
X 2200000.0
Y 710000.0
X 2200000.0
Y 720000.0
X 2192500.0
Y 720000.0
X 2192500.0
Y 705000.0
Fig.3.8-2 Index Map of Topographic Map (1:5000) of the Complex Area of Pak
Beng HPP

Engineering-Status-Report
3-11
X 2240000.0Y 682500.0
X 2222500.0Y 682500.0
X 2232500.0Y 667500.0
X 2212500.0Y 667500.0
X 2205000.0Y 662000.0
X 2185000.0Y 668000.0
X 2197500.0Y 687500.0
X 2199500.0Y 707500.0
Fig.3.8-3 Index Map of Topographic Map (1:5000) of the Reservoir Area of Pak
Beng HPP

Engineering-Status-Report
4-1
4 HYDROLOGY AND SEDIMENT
4.1 GENERAL
4.1.1 General Description of Natural Geography
The Lancang - Mekong River is an international river, and it is originated from the end of
glacier at the southern foot of Mt. Lasaigongma (EL.5,160m) in southern part of Qinghai
Province, China. It flows from Tibet into Yunnan, and leaves China in Mengla County,
southwest Yunnan, and it is not referred to as the Mekong River until after leaving the
Chinese territory. The Mekong River successively flows across Myanmar, Laos, Thailand,
Cambodia and Vietnam, and joins South China Sea at Saigon (Ho Chi Minh City), Vietnam.
Based on relevant information, the mainstream length of Lancang River in the Chinese
territory is 2,130km, the Sino-Myanmar border river 31km, the Lao-Myanmar border river
234km, the Lao-Thai border river 976km, the section in the Lao territory 789km, the section
in Cambodia 490km, and the section in Vietnam 230km. The full length is about 4,880km,
and the basin area is about 0.795 million km2. The characteristic values of basins in the
countries that the Mekong River flows across may be referred to Table 4.1-1.
Table 4.1-1 Characteristic Values in the Mekong River Countries
Items China Myanmar Laos Thailand Cambodia Vietnam Total
Basin Area (km2) 165,000 24,000 202,000 184,000 155,000 65,000 795,000
Percentage of Basin Area (%)
21 3 25 23 20 8 100
Percentage of Water Volume (%)
16 2 35 18 18 11 100
Note: The source of information is Overview of the Hydrology of the Mekong Basin
published by the MRC in 2005.
The shape of the Lancang – Mekong Basin is approximately a ribbon, which is narrow on the
upper part and wide on the lower part. It spans 25 degrees of latitude, with great differences in
natural geographic conditions in the basin. According to the classification of the MRC, The
Mekong River could be classified as the Upper Mekong River and the Lower Mekong River.
the Upper Mekong River refers to Lancang River in the Chinese territory and the section of
the Mekong River in Myanmar, while the Lower Mekong River refers to the section of the
Mekong River in the territories of Laos, Thailand, Cambodia and Vietnam. The Upper
Mekong River and the Lower Mekong River are approximately divided by Chiang Saen
Hydrological Station. For the convenience of description, the Lower Mekong River is called
the Mekong River hereinafter if not specific reference.
The water system of the Lancang - Mekong River is developed, and the tributaries are
generally short, without long and large tributaries. In the section from Jinghong to Pak Beng
HPP, the main tributaries in the Chinese territory is Nanban River, while the main tributary in
Engineering-Status-Report
4-2
the Myanmar territory is Nam Lwe River, the main tributary in the Thai territory is Nam Mae
Kok River, and the main tributaries in Lao territory are Nam Tha River and Nam Ou River,
etc.
There are good vegetation covers in the Lancang - Mekong Basin, with relatively limited
cultivated land. Except a few areas in the Chinese territory, the soil and water erosion of the
Upper Mekong Basin is not serious yet. The middle and upper reaches of the Lower Mekong
Basin are covered with thick tropical rainforests, and its downstream is hilly country and
alluvial plain.
The section of the Lancang - Mekong River from Jinghong, China to Laungprabang, Laos is
about 700km long, and the majority of elevations of the areas it flows across are
200m-1,500m. The topographic changes are great, hindered by the mountains along the way.
The river channel bends several times, with wide and narrow valleys alternating each other,
and the river bed falling gradient is relatively steep, with many torrents and riffles.
According to the Mekong Mainstream Run-of-River Hydropower in 1994, Pak Beng HPP will
be the Cascade 1 of the planned cascades. The Dam Site is located on the mainstream of the
Mekong River upstream of Pak Beng County in Oudomxai Province, northern Laos, which is
about 525km away from Jinghong, China in the upstream, about 180km away from Chiang
Saen, Thailand, and about 174km away from Laungprabang in the downstream. The basin
area is 0.218 million km2. In terms of topographic classification, Pak Beng HPP is located in
the Northern Plateau; In terms of classification by upstream and downstream of the river, Pak
Beng HPP is located in the upstream section of the Lower Mekong Basin; In terms of
classification by hydrologic characteristics, it is the second river section of the Lancang -
Mekong River – the section from Chiang Saen to Vientiane, where most of the areas are
mountainous, and most of the agricultural activities are slash-and-burn agriculture, without
extensive agricultural development, and the basin is basically covered with natural forests.
The hydrologic properties of this section are greatly different from those of the downstream
section of the Lower Mekong River, and they are closer to those of the Jinghong - Chiang
Saen section in the upstream. The schematic diagram of Mekong Basin may be referred to
Figure 4.1-1.

Engineering-Status-Report
4-3
Fig. 4.1-1 Schematic Diagram of Mekong Basin

Engineering-Status-Report
4-4
4.1.2 Meteorological Conditions
Due to impacts of the monsoon climate, the Mekong Basin mainly has two seasons: the dry
season and the rainy season. Generally speaking, the dry season lasts from November to the
next May, is mainly subject to impacts of the northeast monsoon, and the air temperature is
relatively low. Due to impacts of Annamite Mountains and the Central Plateau, the rainfall
during this period normally occurs in the Vietnamese territory, and the rainfall amount is
relatively small. The rainy season generally starts from June and even May, and lasts till
October, which is mainly subject to impacts of southwest monsoon climate. August –
September and even October are the months with the largest amount of rainfall.
The air temperature of the Mekong Basin varies accordingly with the changes of terrain and
altitude in the basin. In every March to October, the air temperature from Phnum Penh,
Cambodia to Laungprabang, Laos, even to Chiang Rai, Thailand, basically has not much
change, being about 26℃-27℃. However, in the areas with elevation higher than 500m
(MASL–mean above sea level) in the basin, the mean temperature of the basin will be
lowered by 2℃-3℃. According to the statistics of relevant information, the mean temperature
of Jinghong in the summer is only 2℃-3℃ lower than that of Chiang Rai, but the air
temperature will be 5℃-6℃ lower than that of Chiang Rai in the winter.
As the Lancang-Mekong River Basin crosses more latitudes, the river basin has a greater
regional variation in the precipitation. The amplitude of annual average precipitation in the
upstream of Lancang River Basin is 494.7mm-1596.2mm . The mean annual evaporation of
the Mekong Basin is changing between 1,000mm and 2,000mm, with little yearly variation.
The mean annual evaporation in Cambodia and Vietnam in the southern part of the basin is
between 1,500mm and 1,700mm, while the mean annual evaporation in Chiang Rai in the
northern part of the basin is about 1,400mm. Generally speaking, in the areas with mean
elevation being lower than 500m (MASL), the mean annual evaporation is above 1,000mm.
Due to the abrupt changes of terrain and elevation of Lancang Basin, the changes of
evaporation are complicated, and the mean annual evaporation is between 1,300mm and
2,300mm.
Since the meteorological information of Pak Beng Dam Site has not been collected, we
mainly referred to the meteorological elements of Laungprabang Meteorological Station,
which is about 174km away from Pak Beng and with an elevation of 305m. During the dry
season, the low water surface elevation of the river at Pak Beng Dam Site is 310m, almost
same with Luangprabang Meteorological Station. And the climatic conditions are basically
similar, without much change in the meteorological elements. Presently, we have collected 36
years of meteorological information from 1971 to 2006. Statistics of meteorological elements
of Laungprabang meteorological station may be referred to Table 4.1-2.
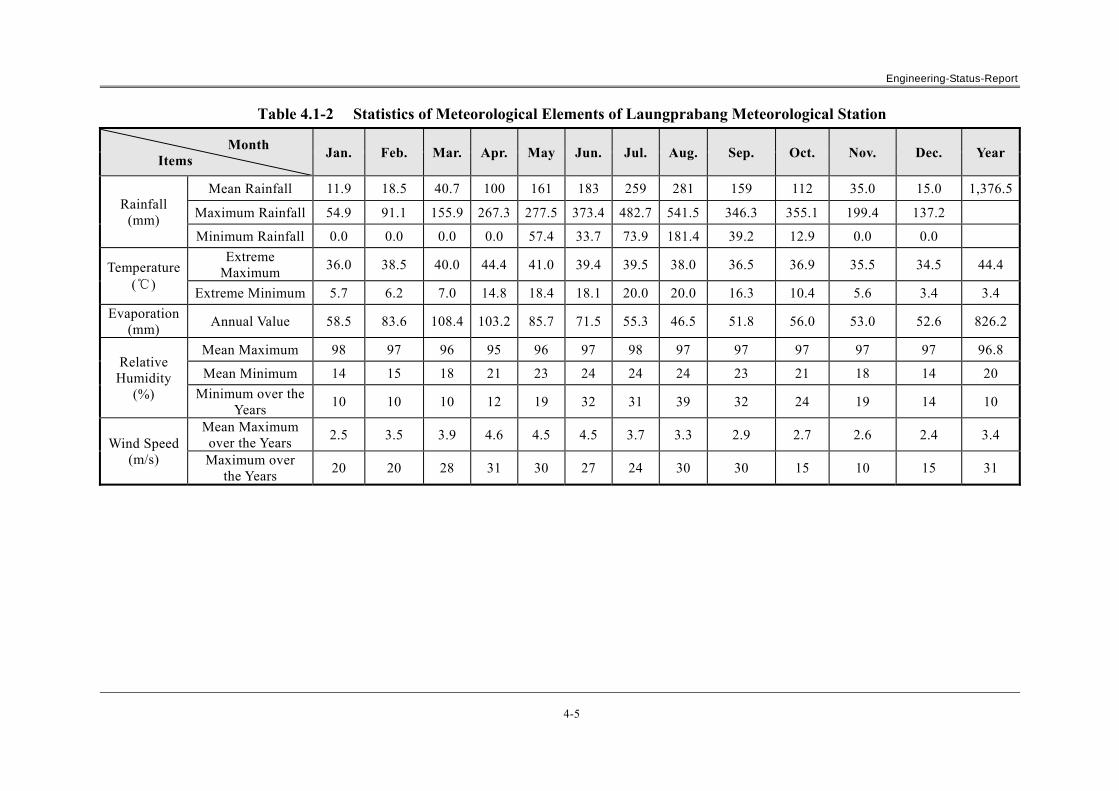
Engineering-Status-Report
4-5
Table 4.1-2 Statistics of Meteorological Elements of Laungprabang Meteorological Station
Month Items
Jan. Feb. Mar. Apr. May Jun. Jul. Aug. Sep. Oct. Nov. Dec. Year
Rainfall (mm)
Mean Rainfall 11.9 18.5 40.7 100 161 183 259 281 159 112 35.0 15.0 1,376.5
Maximum Rainfall 54.9 91.1 155.9 267.3 277.5 373.4 482.7 541.5 346.3 355.1 199.4 137.2
Minimum Rainfall 0.0 0.0 0.0 0.0 57.4 33.7 73.9 181.4 39.2 12.9 0.0 0.0
Temperature (℃)
Extreme Maximum
36.0 38.5 40.0 44.4 41.0 39.4 39.5 38.0 36.5 36.9 35.5 34.5 44.4
Extreme Minimum 5.7 6.2 7.0 14.8 18.4 18.1 20.0 20.0 16.3 10.4 5.6 3.4 3.4
Evaporation (mm)
Annual Value 58.5 83.6 108.4 103.2 85.7 71.5 55.3 46.5 51.8 56.0 53.0 52.6 826.2
Relative Humidity
(%)
Mean Maximum 98 97 96 95 96 97 98 97 97 97 97 97 96.8
Mean Minimum 14 15 18 21 23 24 24 24 23 21 18 14 20
Minimum over the Years
10 10 10 12 19 32 31 39 32 24 19 14 10
Wind Speed (m/s)
Mean Maximum over the Years
2.5 3.5 3.9 4.6 4.5 4.5 3.7 3.3 2.9 2.7 2.6 2.4 3.4
Maximum over the Years
20 20 28 31 30 27 24 30 30 15 10 15 31
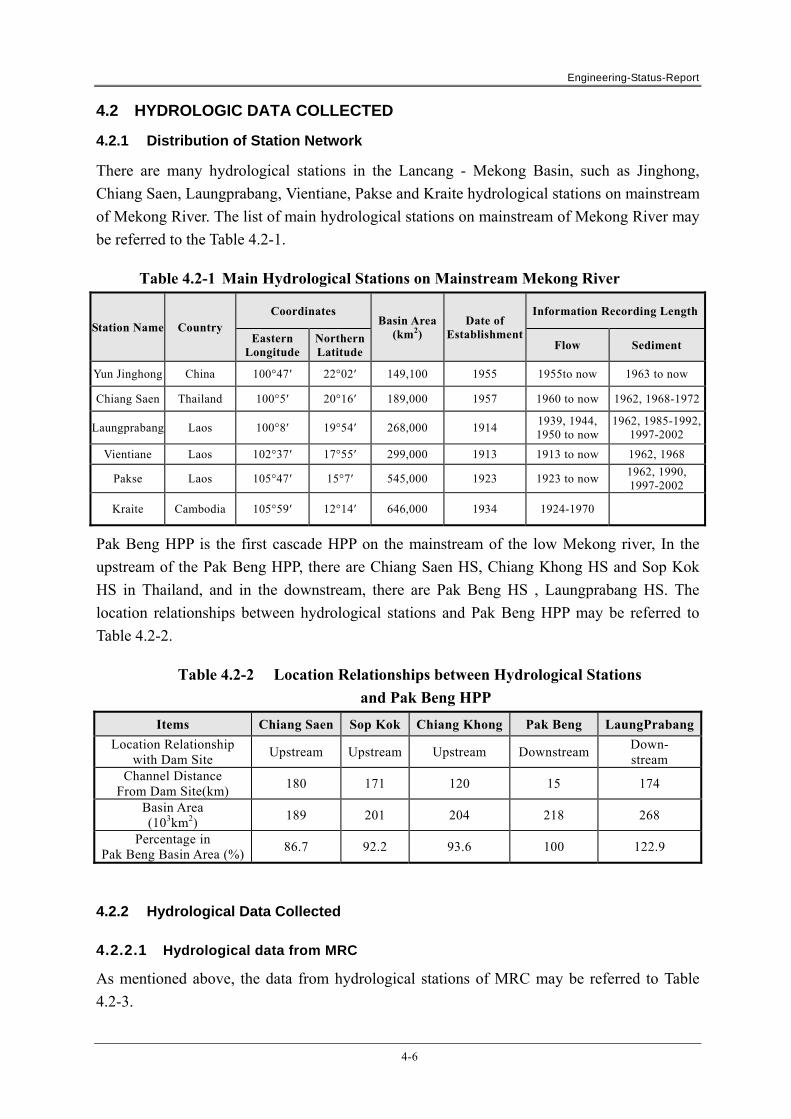
Engineering-Status-Report
4-6
4.2 HYDROLOGIC DATA COLLECTED
4.2.1 Distribution of Station Network
There are many hydrological stations in the Lancang - Mekong Basin, such as Jinghong,
Chiang Saen, Laungprabang, Vientiane, Pakse and Kraite hydrological stations on mainstream
of Mekong River. The list of main hydrological stations on mainstream of Mekong River may
be referred to the Table 4.2-1.
Table 4.2-1 Main Hydrological Stations on Mainstream Mekong River
Station Name Country Coordinates
Basin Area (km2)
Date of Establishment
Information Recording Length
Eastern Longitude
Northern Latitude
Flow Sediment
Yun Jinghong China 100°47′ 22°02′ 149,100 1955 1955to now 1963 to now
Chiang Saen Thailand 100°5′ 20°16′ 189,000 1957 1960 to now 1962, 1968-1972
Laungprabang Laos 100°8′ 19°54′ 268,000 1914 1939, 1944, 1950 to now
1962, 1985-1992,1997-2002
Vientiane Laos 102°37′ 17°55′ 299,000 1913 1913 to now 1962, 1968
Pakse Laos 105°47′ 15°7′ 545,000 1923 1923 to now 1962, 1990, 1997-2002
Kraite Cambodia 105°59′ 12°14′ 646,000 1934 1924-1970
Pak Beng HPP is the first cascade HPP on the mainstream of the low Mekong river, In the
upstream of the Pak Beng HPP, there are Chiang Saen HS, Chiang Khong HS and Sop Kok
HS in Thailand, and in the downstream, there are Pak Beng HS , Laungprabang HS. The
location relationships between hydrological stations and Pak Beng HPP may be referred to
Table 4.2-2.
Table 4.2-2 Location Relationships between Hydrological Stations
and Pak Beng HPP
Items Chiang Saen Sop Kok Chiang Khong Pak Beng LaungPrabang
Location Relationship with Dam Site
Upstream Upstream Upstream Downstream Down- stream
Channel Distance From Dam Site(km)
180 171 120 15 174
Basin Area (103km2)
189 201 204 218 268
Percentage in Pak Beng Basin Area (%)
86.7 92.2 93.6 100 122.9
4.2.2 Hydrological Data Collected
4.2.2.1 Hydrological data from MRC
As mentioned above, the data from hydrological stations of MRC may be referred to Table
4.2-3.
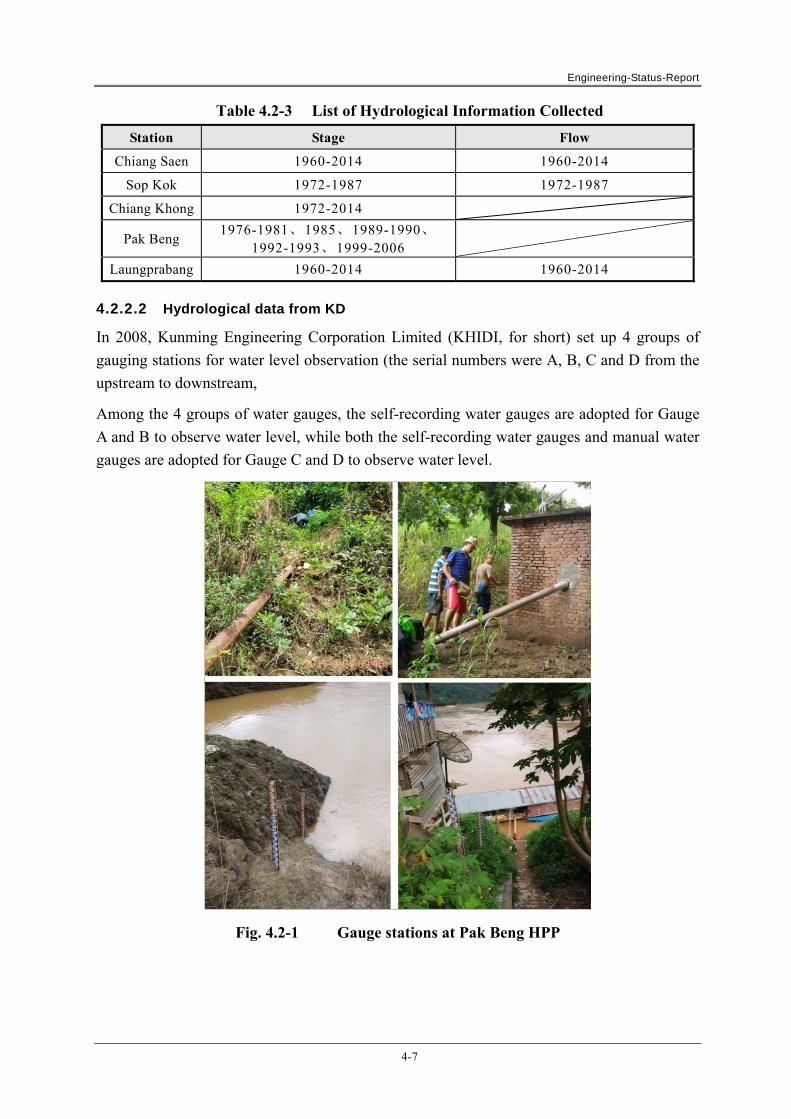
Engineering-Status-Report
4-7
Table 4.2-3 List of Hydrological Information Collected
Station Stage Flow
Chiang Saen 1960-2014 1960-2014
Sop Kok 1972-1987 1972-1987
Chiang Khong 1972-2014
Pak Beng 1976-1981、1985、1989-1990、
1992-1993、1999-2006
Laungprabang 1960-2014 1960-2014
4.2.2.2 Hydrological data from KD
In 2008, Kunming Engineering Corporation Limited (KHIDI, for short) set up 4 groups of
gauging stations for water level observation (the serial numbers were A, B, C and D from the
upstream to downstream,
Among the 4 groups of water gauges, the self-recording water gauges are adopted for Gauge
A and B to observe water level, while both the self-recording water gauges and manual water
gauges are adopted for Gauge C and D to observe water level.
Fig. 4.2-1 Gauge stations at Pak Beng HPP
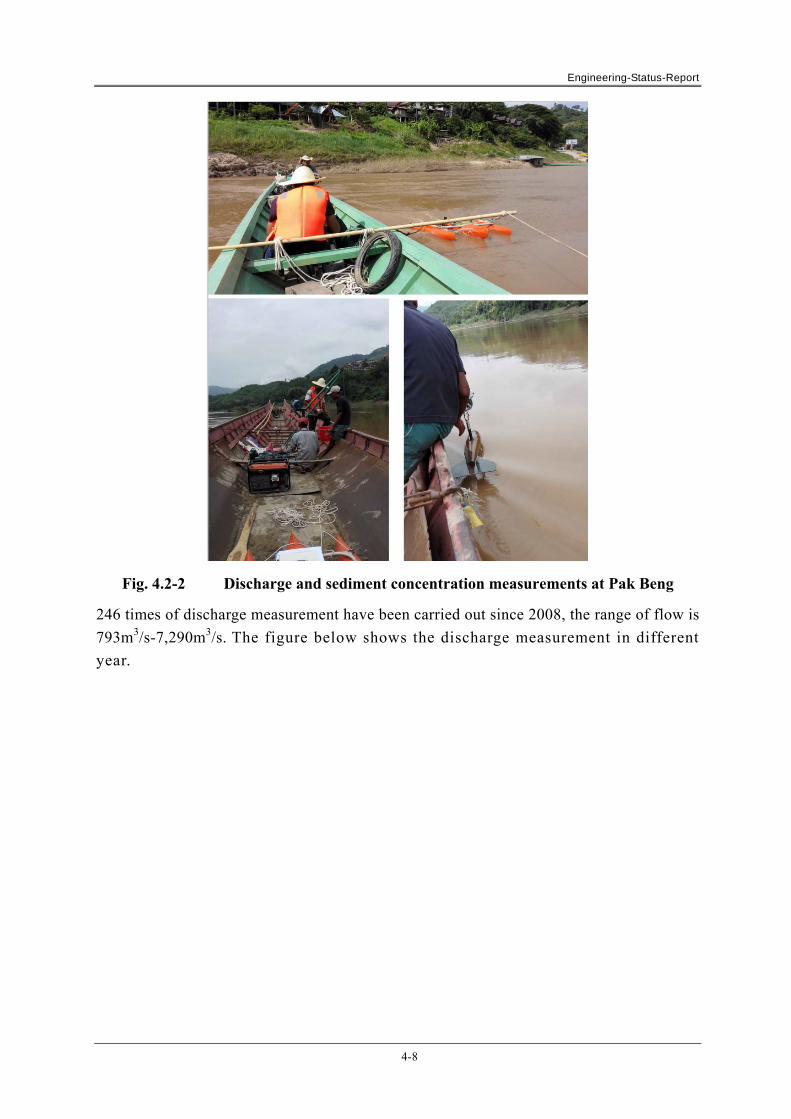
Engineering-Status-Report
4-8
Fig. 4.2-2 Discharge and sediment concentration measurements at Pak Beng
246 times of discharge measurement have been carried out since 2008, the range of flow is
793m3/s-7,290m3/s. The figure below shows the discharge measurement in different
year.

Engineering-Status-Report
4-9
300
305
310
315
320
325
0 1000 2000 3000 4000 5000 6000 7000 8000
H(m)
Discharge(m3/s)
Dischareg Measured in 2008
Discharge Measured in 2009
Discharge Measured in 2010
Discharge Measured in 2011
Dischareg Measured in 2012
Discharge Measured in 2013
Discharge Measured in 2014
Fig. 4.2-3 Discharge measurements at Pak Beng in Different Year
And the hydrological data at Pak Beng station collected from 2008 to 2014, including the
daily discharge, daily water level, sediment concentration.
4.3 RUNOFF
4.3.1 Runoff Properties
The Lancang–Mekong River Basin has large area, and spans much latitude. And the runoff
characteristics of the Mekong Basin are consistent with precipitation distribution changes.
Precipitation tends to increment from north to south, and the runoff depth also gradually
increases nearly from north to south. With the increase of basin area, the runoff percentage of
each control section in the entire basin gradually tends to be consistent with the percentage of
each control section basin area in the entire basin area. That is due to increase of rainfall and
large tributaries.
The runoff of the Lancang-Mekong Basin is mainly concentrated in June -December while the
entire basin enters the rainy season. Due to precipitation recharge, the amount of water in the
Upper Mekong Basin accounts for an insignificant percentage in the amount of water in the
Lower Mekong Basin. However, once it enters the dry season, the percentage increases
quickly. According to the information published by the MRC, with Chiang Saen HS as the
control section, the water amount of Upper Mekong Basin accounts for about 20% of whole
section during the rainy season. However, once it enters the dry season, it accounts for almost
30% of the water amount.
The runoff from Chiang Sean to Laungprabang is mainly recharged by precipitation. Similar
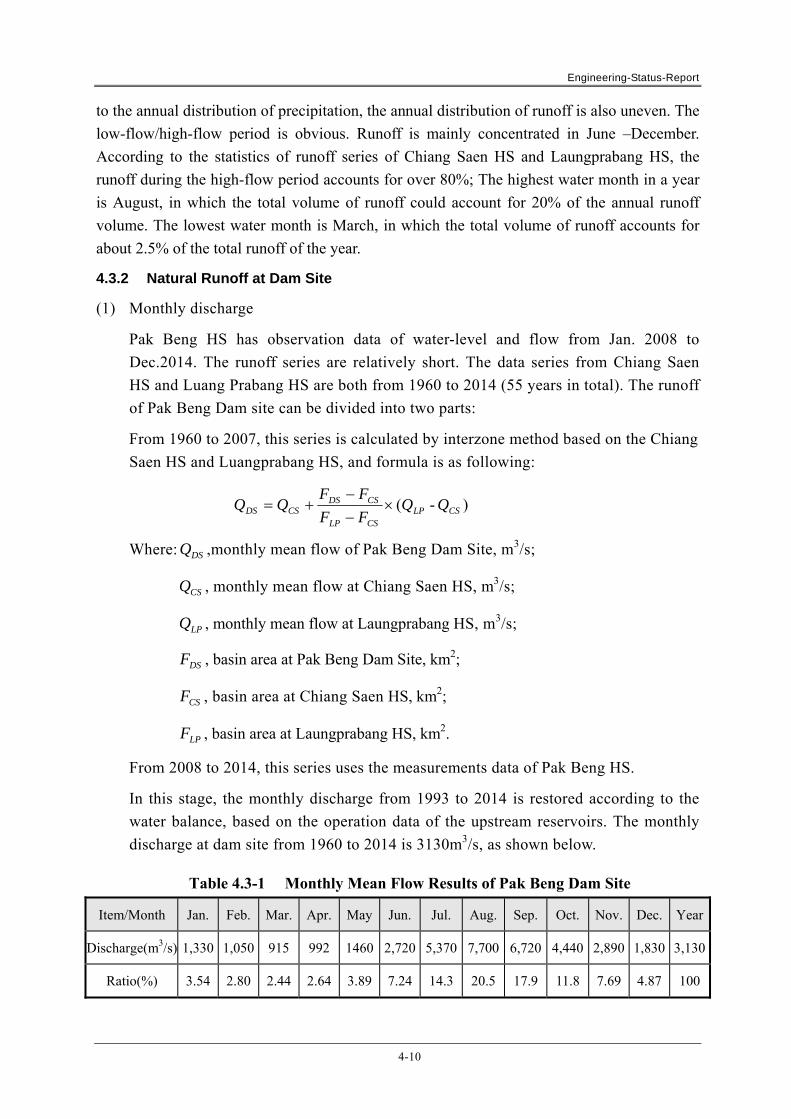
Engineering-Status-Report
4-10
to the annual distribution of precipitation, the annual distribution of runoff is also uneven. The
low-flow/high-flow period is obvious. Runoff is mainly concentrated in June –December.
According to the statistics of runoff series of Chiang Saen HS and Laungprabang HS, the
runoff during the high-flow period accounts for over 80%; The highest water month in a year
is August, in which the total volume of runoff could account for 20% of the annual runoff
volume. The lowest water month is March, in which the total volume of runoff accounts for
about 2.5% of the total runoff of the year.
4.3.2 Natural Runoff at Dam Site
(1) Monthly discharge
Pak Beng HS has observation data of water-level and flow from Jan. 2008 to
Dec.2014. The runoff series are relatively short. The data series from Chiang Saen
HS and Luang Prabang HS are both from 1960 to 2014 (55 years in total). The runoff
of Pak Beng Dam site can be divided into two parts:
From 1960 to 2007, this series is calculated by interzone method based on the Chiang
Saen HS and Luangprabang HS, and formula is as following:
)-( CSLPCSLP
CSDSCSDS QQ
FF
FFQQ
Where: DSQ ,monthly mean flow of Pak Beng Dam Site, m3/s;
CSQ , monthly mean flow at Chiang Saen HS, m3/s;
LPQ , monthly mean flow at Laungprabang HS, m3/s;
DSF , basin area at Pak Beng Dam Site, km2;
CSF , basin area at Chiang Saen HS, km2;
LPF , basin area at Laungprabang HS, km2.
From 2008 to 2014, this series uses the measurements data of Pak Beng HS.
In this stage, the monthly discharge from 1993 to 2014 is restored according to the
water balance, based on the operation data of the upstream reservoirs. The monthly
discharge at dam site from 1960 to 2014 is 3130m3/s, as shown below.
Table 4.3-1 Monthly Mean Flow Results of Pak Beng Dam Site
Item/Month Jan. Feb. Mar. Apr. May Jun. Jul. Aug. Sep. Oct. Nov. Dec. Year
Discharge(m3/s) 1,330 1,050 915 992 1460 2,720 5,370 7,700 6,720 4,440 2,890 1,830 3,130
Ratio(%) 3.54 2.80 2.44 2.64 3.89 7.24 14.3 20.5 17.9 11.8 7.69 4.87 100
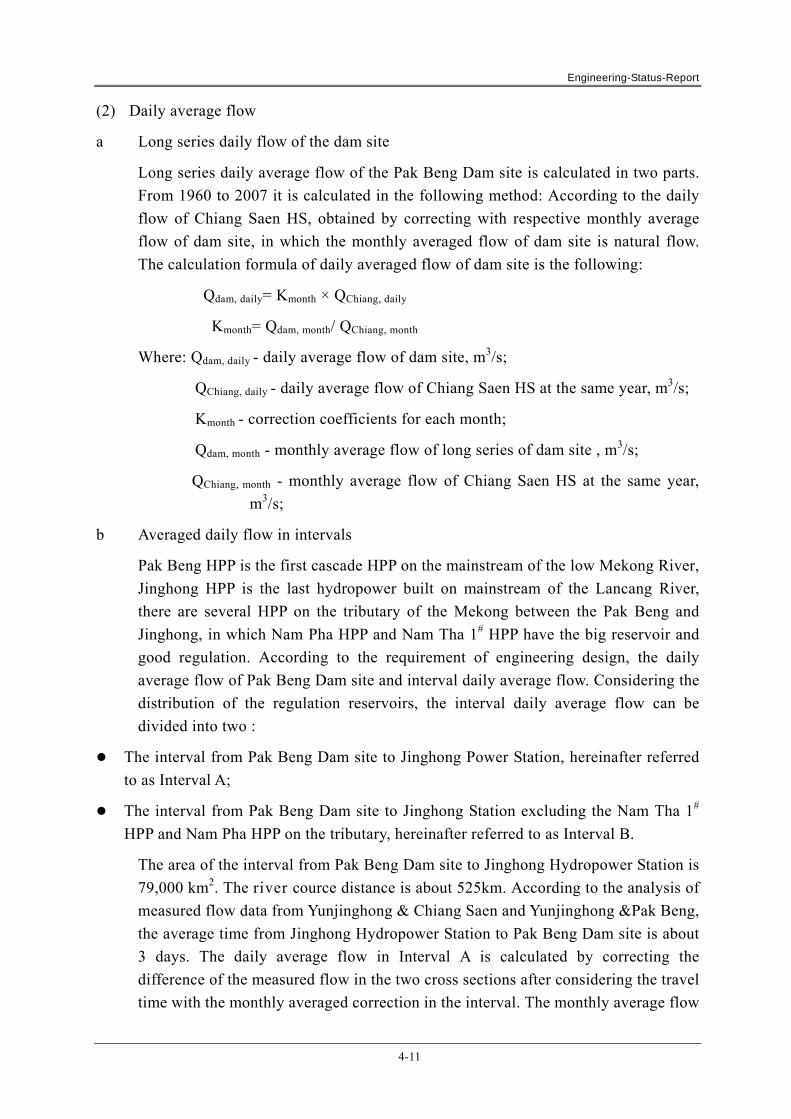
Engineering-Status-Report
4-11
(2) Daily average flow
a Long series daily flow of the dam site
Long series daily average flow of the Pak Beng Dam site is calculated in two parts.
From 1960 to 2007 it is calculated in the following method: According to the daily
flow of Chiang Saen HS, obtained by correcting with respective monthly average
flow of dam site, in which the monthly averaged flow of dam site is natural flow.
The calculation formula of daily averaged flow of dam site is the following:
Qdam, daily= Kmonth × QChiang, daily
Kmonth= Qdam, month/ QChiang, month
Where: Qdam, daily - daily average flow of dam site, m3/s;
QChiang, daily - daily average flow of Chiang Saen HS at the same year, m3/s;
Kmonth - correction coefficients for each month;
Qdam, month - monthly average flow of long series of dam site , m3/s;
QChiang, month - monthly average flow of Chiang Saen HS at the same year,
m3/s;
b Averaged daily flow in intervals
Pak Beng HPP is the first cascade HPP on the mainstream of the low Mekong River,
Jinghong HPP is the last hydropower built on mainstream of the Lancang River,
there are several HPP on the tributary of the Mekong between the Pak Beng and
Jinghong, in which Nam Pha HPP and Nam Tha 1# HPP have the big reservoir and
good regulation. According to the requirement of engineering design, the daily
average flow of Pak Beng Dam site and interval daily average flow. Considering the
distribution of the regulation reservoirs, the interval daily average flow can be
divided into two :
The interval from Pak Beng Dam site to Jinghong Power Station, hereinafter referred
to as Interval A;
The interval from Pak Beng Dam site to Jinghong Station excluding the Nam Tha 1#
HPP and Nam Pha HPP on the tributary, hereinafter referred to as Interval B.
The area of the interval from Pak Beng Dam site to Jinghong Hydropower Station is
79,000 km2. The river cource distance is about 525km. According to the analysis of
measured flow data from Yunjinghong & Chiang Saen and Yunjinghong &Pak Beng,
the average time from Jinghong Hydropower Station to Pak Beng Dam site is about
3 days. The daily average flow in Interval A is calculated by correcting the
difference of the measured flow in the two cross sections after considering the travel
time with the monthly averaged correction in the interval. The monthly average flow
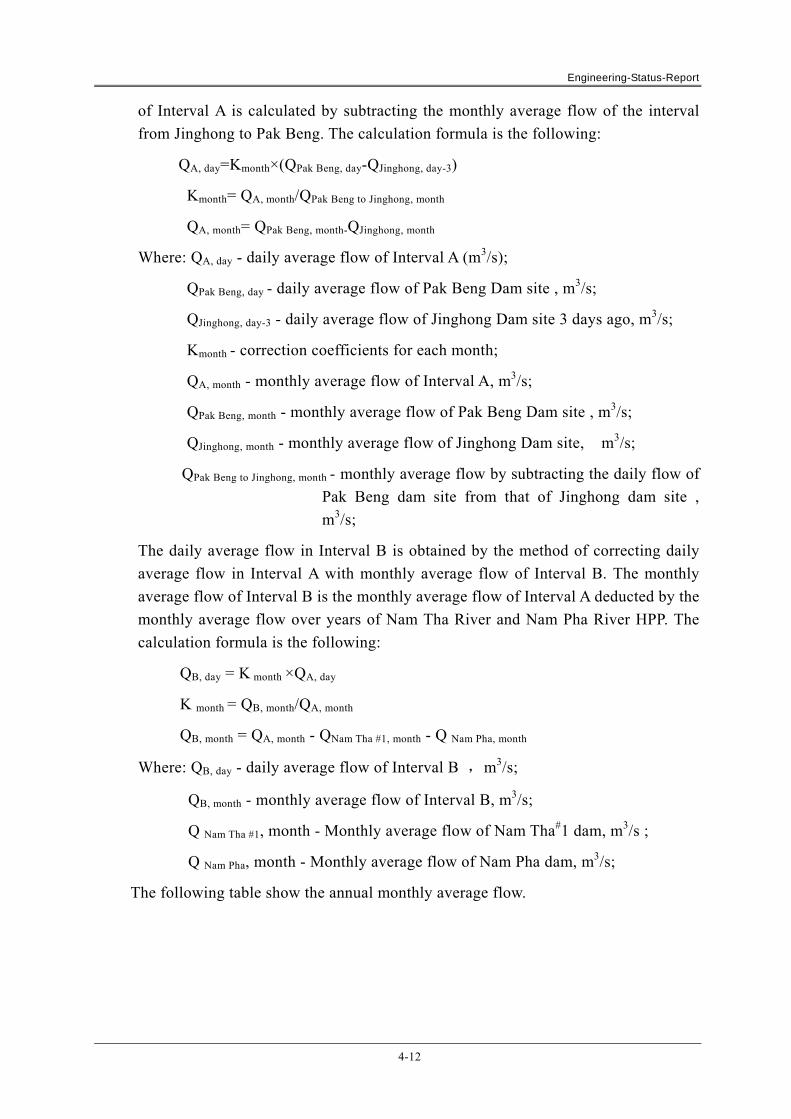
Engineering-Status-Report
4-12
of Interval A is calculated by subtracting the monthly average flow of the interval
from Jinghong to Pak Beng. The calculation formula is the following:
QA, day=Kmonth×(QPak Beng, day-QJinghong, day-3)
Kmonth= QA, month/QPak Beng to Jinghong, month
QA, month= QPak Beng, month-QJinghong, month
Where: QA, day - daily average flow of Interval A (m3/s);
QPak Beng, day - daily average flow of Pak Beng Dam site , m3/s;
QJinghong, day-3 - daily average flow of Jinghong Dam site 3 days ago, m3/s;
Kmonth - correction coefficients for each month;
QA, month - monthly average flow of Interval A, m3/s;
QPak Beng, month - monthly average flow of Pak Beng Dam site , m3/s;
QJinghong, month - monthly average flow of Jinghong Dam site, m3/s;
QPak Beng to Jinghong, month - monthly average flow by subtracting the daily flow of
Pak Beng dam site from that of Jinghong dam site ,
m3/s;
The daily average flow in Interval B is obtained by the method of correcting daily
average flow in Interval A with monthly average flow of Interval B. The monthly
average flow of Interval B is the monthly average flow of Interval A deducted by the
monthly average flow over years of Nam Tha River and Nam Pha River HPP. The
calculation formula is the following:
QB, day = K month ×QA, day
K month = QB, month/QA, month
QB, month = QA, month - QNam Tha #1, month - Q Nam Pha, month
Where: QB, day - daily average flow of Interval B ,m3/s;
QB, month - monthly average flow of Interval B, m3/s;
Q Nam Tha #1, month - Monthly average flow of Nam Tha#1 dam, m3/s ;
Q Nam Pha, month - Monthly average flow of Nam Pha dam, m3/s;
The following table show the annual monthly average flow.
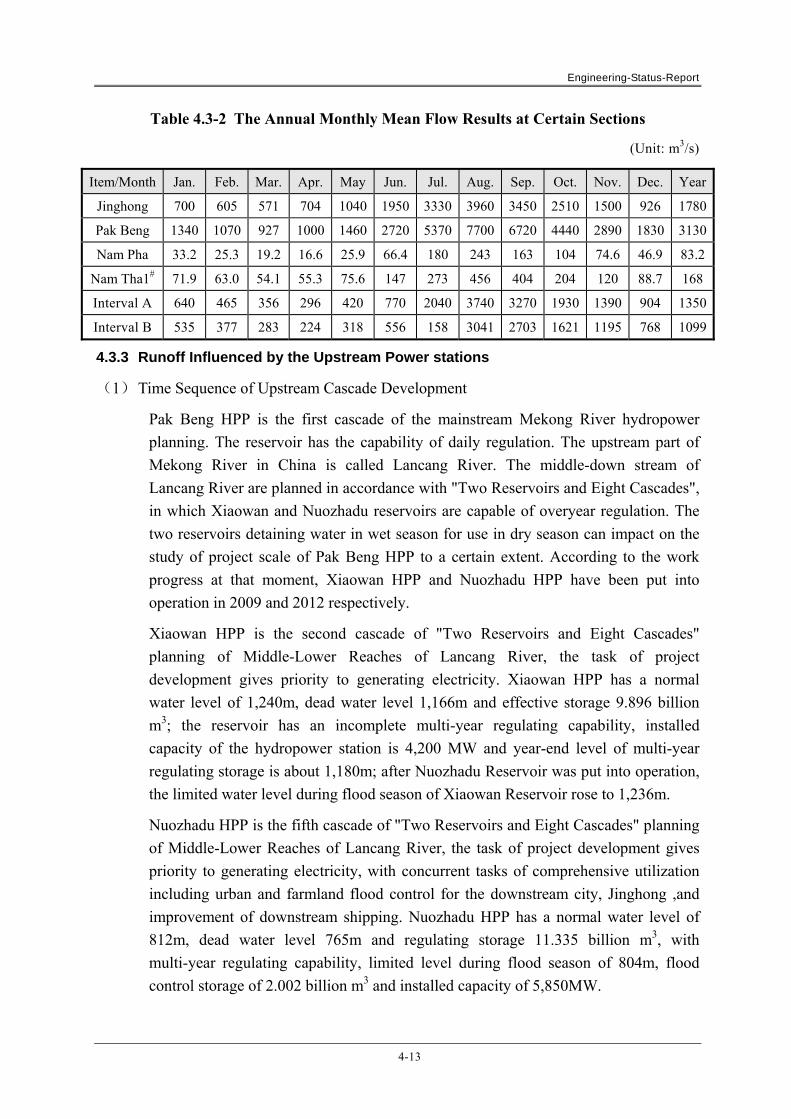
Engineering-Status-Report
4-13
Table 4.3-2 The Annual Monthly Mean Flow Results at Certain Sections
(Unit: m3/s)
Item/Month Jan. Feb. Mar. Apr. May Jun. Jul. Aug. Sep. Oct. Nov. Dec. Year
Jinghong 700 605 571 704 1040 1950 3330 3960 3450 2510 1500 926 1780
Pak Beng 1340 1070 927 1000 1460 2720 5370 7700 6720 4440 2890 1830 3130
Nam Pha 33.2 25.3 19.2 16.6 25.9 66.4 180 243 163 104 74.6 46.9 83.2
Nam Tha1# 71.9 63.0 54.1 55.3 75.6 147 273 456 404 204 120 88.7 168
Interval A 640 465 356 296 420 770 2040 3740 3270 1930 1390 904 1350
Interval B 535 377 283 224 318 556 158 3041 2703 1621 1195 768 1099
4.3.3 Runoff Influenced by the Upstream Power stations
(1) Time Sequence of Upstream Cascade Development
Pak Beng HPP is the first cascade of the mainstream Mekong River hydropower
planning. The reservoir has the capability of daily regulation. The upstream part of
Mekong River in China is called Lancang River. The middle-down stream of
Lancang River are planned in accordance with "Two Reservoirs and Eight Cascades",
in which Xiaowan and Nuozhadu reservoirs are capable of overyear regulation. The
two reservoirs detaining water in wet season for use in dry season can impact on the
study of project scale of Pak Beng HPP to a certain extent. According to the work
progress at that moment, Xiaowan HPP and Nuozhadu HPP have been put into
operation in 2009 and 2012 respectively.
Xiaowan HPP is the second cascade of "Two Reservoirs and Eight Cascades"
planning of Middle-Lower Reaches of Lancang River, the task of project
development gives priority to generating electricity. Xiaowan HPP has a normal
water level of 1,240m, dead water level 1,166m and effective storage 9.896 billion
m3; the reservoir has an incomplete multi-year regulating capability, installed
capacity of the hydropower station is 4,200 MW and year-end level of multi-year
regulating storage is about 1,180m; after Nuozhadu Reservoir was put into operation,
the limited water level during flood season of Xiaowan Reservoir rose to 1,236m.
Nuozhadu HPP is the fifth cascade of "Two Reservoirs and Eight Cascades" planning
of Middle-Lower Reaches of Lancang River, the task of project development gives
priority to generating electricity, with concurrent tasks of comprehensive utilization
including urban and farmland flood control for the downstream city, Jinghong ,and
improvement of downstream shipping. Nuozhadu HPP has a normal water level of
812m, dead water level 765m and regulating storage 11.335 billion m3, with
multi-year regulating capability, limited level during flood season of 804m, flood
control storage of 2.002 billion m3 and installed capacity of 5,850MW.
Engineering-Status-Report
4-14
According to relevant data collected in this stage, Nam Tha 1# HPP and Nam Pha
HPP planned in Nam Tha River and Nam Pha River, the main tributaries of Mekong
River in Laos at upstream of Pak Beng HPP, the two HPP have respectively year and
overyear regulatingcapabilities,detaining water in wet season for use in dry season
operation of both reservoirs will also have a certain impact on project scale
argumentation of Pak Beng HPP. According to the current work progress, the Nam
Tha 1# HPP has completed feasibility study design, expected to be completed and put
into operation in 2018; and Nam Pha HPP is conducting supplementary
argumentation for feasibility study.
According to the Feasibility Study Report for the Nam Tha 1# HPP in Laos (2013.3),
the dam site of the Nam Tha 1# HPP is located in the lower reach of Nam Tha River,
a tributary of Mekong River, about 62 km from the junction with Mekong River.
Development task of the HPP is to generate electricity to provide electricity export
for Laos, promoting local economic development. The HPP has a normal water level
of 455m, dead water level 442.5m and regulating storage 676 million m3, with annual
regulating capability, and an installed capacity of the HPP is 168MW. The Nam Tha
1# HPP is expected to be completed and put into production in 2018.
According to the Supplementing Feasibility Study Report for the Nam Pha
Hydropower Station in Laos (2013.7), the Nam Pha Hydropower Station is located in
the Nam Pha River, the main tributary of Mekong River, and the dam site of the
Hydropower Project is located at about 2.8km from the junction of Nam Pha River
and Mekong River. The Nam Pha HPP gives priority to generating electricity, with
normal water level 535m, dead water level 515m and regulating storage 1.139 billion
m3, the reservoir has multi-year regulating capability, and installed capacity of the
HPP is 180MW.
According to the preliminary work and project progress, the Pak Beng HPP is
expected to complete and generate electricity in 2023. Therefore, the impacts of
Xiaowan, Nuozhadu Reservoirs in middle-down stream of Lancang River as well as
Nam Tha 1# and Nan Pha HPP in Laos need to be taken into consideration in the scale
demonstration of Pak Beng HPP.
(2) Principle and Method for Runoff Regulation
The Pak Beng HPP only has the capability of daily regulation, with relatively small
reservoir storage, without the capability of detaining water in wet season for use in
dry season, so it will not impact the intra-annual /intra-daily distribution of inflow,
i.e., the HPP can only generate power based on the inflow, with the outflow being
equal to the inflow. The upper reach of the Mekong River in China is called Lancang
River, and the middle and lower reaches of the Lancang River are planned in
accordance with "Two Reservoirs and Eight Cascades", in which Xiaowan and
Engineering-Status-Report
4-15
Nuozhadu reservoirs are capable of overyear regulation. Since all cascade HPP of
middle - lower reaches of Lancang River have been put into operation at the same
time of investment of Pak Beng HPP, in addition, considered the impact of regulating
reservoirs Nam Tha 1# HPP and Nam Pha HPP in Laos, at the time of runoff
regulation of Pak Beng HPP, firstly, the runoff regulation calculation is carried out
for cascade HPP of middle - lower reaches of Lancang River, Nam Tha 1# HPP and
Nam Pha HPP, obtained the reservoir outflow process of Jinghong Hydropower
Station, Nam Tha 1# HPP and Nam Pha Hydropower Station, and then plus interval
daily discharge from the three HPPs to the dam site of Pak Beng HPP, obtained the
dam site daily runoff series of Pak Beng HPP subject to considering reservoir
regulation impact of upstream Xiaowan, Nuozhadu, Nam Tha 1# and Nam Pha
reservoirs, and on the basis of all above, single reservoir runoff regulation is
calculated for Pak Beng HPP.
(3) Basic Data
Since all regulating reservoirs in upstream Yunnan Province and Laos had been put
into operation basically when Pak Beng HPP was completed and put into operation,
runoff series of the dam site of Pak Beng HPP are analyzed as per following three
different operating conditions: natural runoff series of the dam site, the dam site
runoff series only considering the impact of regulating reservoirs in Yunnan and dam
site runoff series considering the impact of regulating reservoirs in both Yunnan and
Laos. The daily runoff series from June 1960 to May 2014 are used for all dam site
runoff series with three different operating conditions in this stage.
The comparison of dam site runoff series of Pak Beng HPP under three different
operating conditions is shown in Table 4.3-3, Table 4.3-4 and Fig. 4.3-1. It can be
seen from Table 4.3-5 that, subject to considering the impact of upstream regulating
reservoirs, average annual discharge of dam site runoff of Pak Beng HPP reduces to
some extent, reducing about 73m3/s, this is mainly because the increased loss of
evaporation after construction of upstream reservoirs, meanwhile, considering that the
comprehensive utilization of water including agricultural irrigation and urban
domestic water results reduction of dam site discharge of Pak Beng HPP. It can be
seen from tables and figures that, subject to considering upstream regulating
reservoirs, there is change of distribution of dam site runoff of Pak Beng HPP in
flood season and dry season in a certain extent, discharge decreases to some extent in
flood season and increases in dry season. Considered only regulating reservoirs in
Yunnan Province, discharge in flood season (June to November) decreases about
17.76% compared to natural condition, and the one in dry season (December - May of
next year) increases about 59.14%; considered both regulating reservoirs in Yunnan
Province and Laos, discharge in flood season decreases about 18.92% compared to
natural condition, and the one in dry season increases about 63.74%.

Engineering-Status-Report
4-16
Table 4.3-3 Table for results comparison of monthly average flow of Pak Beng HPP under different operating conditions
Unit: m3/s
Month /Working condition
1 2 3 4 5 6 7 8 9 10 11 12
Natural 1,340 1,070 927 1,000 1,460 2,720 5,370 7,700 6,720 4,440 2,890 1,830
Considering the impact of
reservoirs in Yunnan
2,123 2,015 1,903 1,815 1,872 2,319 3,805 6,127 5,688 3,640 2,961 2,410
Considering the impact of
reservoirs in Yunnan and
Laos
2,159 2,068 1,968 1,887 1,955 2,275 3,675 5,966 5,653 3,633 2,994 2,452
Table 4.3-4 Table for change results of dam site runoff of Pak Beng HPP subject to considering the impact of upstream regulating reservoirs
Unit: m3/s
Operating condition\index Averaged in flood
season Averaged in dry season Multi-year average
○1 Natural 4,973 1,271 3,130
○2 Considering the impact of reservoirs in Yunnan
4,090 2,023 3,057
○2 -○1 Difference value -883 752 -73
Amplitude(%) -17.76 59.14 -2.33
○3 Considering the impact of reservoirs in Yunnan
and Laos 4,033 2,081 3,057
○3 -○1 Difference value -941 810 -73
Amplitude(%) -18.92 63.74 -2.33

Engineering-Status-Report
4-17
Fig. 4.3-1 Chart for results comparison of monthly average flow of Pak Beng
HPP under different operating conditions
Subject to considering the impact of upstream regulating reservoirs, distribution in flood
season and dry season of Pak Beng HPP has some change, the discharge increases in dry
season and decreases in flood season, which is favor of making full use of water to some
extent for the HPP, and annual average energy of the HPP increases a little. Since all
upstream regulating reservoirs had been put into operation when Pak Beng HPP is completed
and put into operation, the daily runoff series used for runoff regulation calculation in this
stage are from June 1960 - May 2014 subject to considering the impact of Xiaowan,
Nuozhadu, Nam Tha 1# and Nam Pha reservoirs, with the average annual discharge of dam
site of 3,057m3/s, and monthly average flow is shown in Table 4.3-5.
Table 4.3-5 Table for results of monthly average flow at Dam Site of Pak Beng HPP
Unit: m3/s
Month 1 2 3 4 5 6 7 8 9 10 11 12 Average
Discharge 2,159 2,068 1,968 1,887 1,955 2,275 3,675 5,966 5,653 3,633 2,994 2,452 3,057
4.4 FLOOD
4.4.1 Properties of Storm
Since the Lancang - Mekong Basin spans great latitudes, and the geographic features of the
Engineering-Status-Report
4-18
entire basin also vary greatly. The reasons for the storm are also different.
The water vapor transport of storm process in Lancang River mainly comes from the
southwest warm-wet air from Bangladesh Bay, and secondly from South China Sea. Storm
mainly occurs in June–September, and rainfall increases with the lowering of latitude from
north to south. Since the topography of middle and lower reaches is complicated, with great
elevation differences and obvious differences in dynamic forces and heat power functions, the
storm is distributed in multi-center .On the macro view, the storm distributed very unevenly,
and mainly in the middle and lower reaches.
The storm in the Lower Mekong Basin is mainly formed by the tropical storms from South
China Sea. Subject to the impacts of tropical storm and cyclone, during the rainy seasons of
the Lower Mekong River in the wet years the storm type appears in double peaks. Generally
speaking, July – September is the period with the greatest rainfall in the entire basin. Due to
impacts of Annamite Mountains and Central Plateau, the storm is distributed in multiple
centers.
Based on the factors, hydrological feature, geography characteristic and land using, of
Lancang – Mekong Basin, the MRC divides the Lancang-Mekong Basin into 6 areas. And Pak
Beng Dam Site is located in the Chiang Saen to Vientiane and Nongkhai area. In this area, the
hydrological feature, geography characteristic and the impacts of weather system are basically
same, especially in the upper basin of the Luang Prabang. Pak Beng Dam Site is located
between Chiang Saen HS and Luang Prabang HS. Its storm properties are close to the
properties of those two hydrological stations.
4.4.2 Properties of Flood
The Lancang River-Mekong River Basin is divided into six regions according to the factors of
hydrologic situation, natural geograghy, land utilization by MRC. According to the division,
the Pak Beng Dam site is in the section from Chiang Saen to Vientiane and Nong Khai. This
reach, especially the part upstream of Luang Prabang, is similar in hydrologic situation and
natural geography. The impact of climate system is generally uniform.
The floods in the Lancang-Mekong River Basin are formed by the heavy rains, and floods in
the basin are corresponding to the heavy rainfalls distributed within the year. Since Lancang
River - Mekong River Basin runs across a large span of latitude, and there are different
reasons for heavy rain. There are multiple heavy rain centers. The flood characters in different
control cross sections are different. There are basin-wide floods and regional floods.
Therefore the flood orders are not exactly the same. For example, the 1966 flood is the largest
measured flood from Liutongjiang HS on Lancang River through Vientiane HS; While the
2008 flood is the fourth largest measured flood in Chiang Saen Station (only after 1966, 1970
and 1971 floods, peak flow 13,300m3/s) and the second largest measured flood in Luang
Prabang HS (only after the 1966 flood, peak flow 23,100m3/s).
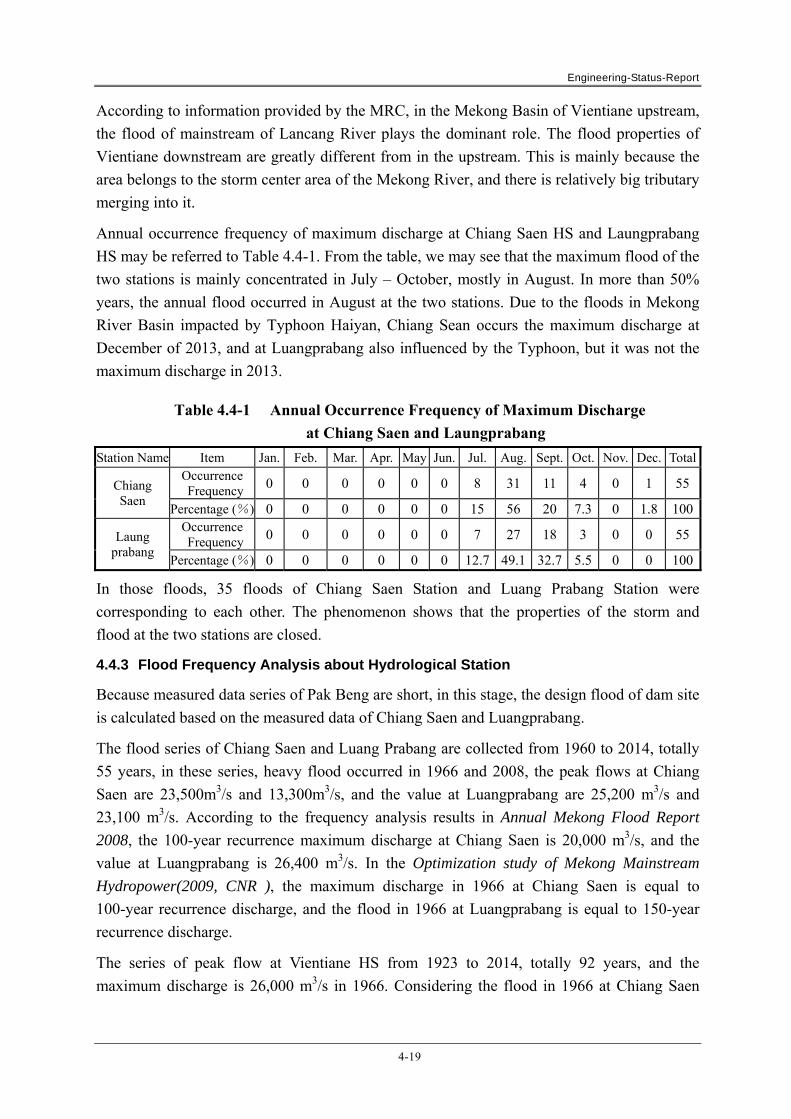
Engineering-Status-Report
4-19
According to information provided by the MRC, in the Mekong Basin of Vientiane upstream,
the flood of mainstream of Lancang River plays the dominant role. The flood properties of
Vientiane downstream are greatly different from in the upstream. This is mainly because the
area belongs to the storm center area of the Mekong River, and there is relatively big tributary
merging into it.
Annual occurrence frequency of maximum discharge at Chiang Saen HS and Laungprabang
HS may be referred to Table 4.4-1. From the table, we may see that the maximum flood of the
two stations is mainly concentrated in July – October, mostly in August. In more than 50%
years, the annual flood occurred in August at the two stations. Due to the floods in Mekong
River Basin impacted by Typhoon Haiyan, Chiang Sean occurs the maximum discharge at
December of 2013, and at Luangprabang also influenced by the Typhoon, but it was not the
maximum discharge in 2013.
Table 4.4-1 Annual Occurrence Frequency of Maximum Discharge
at Chiang Saen and Laungprabang
Station Name Item Jan. Feb. Mar. Apr. May Jun. Jul. Aug. Sept. Oct. Nov. Dec. Total
Chiang Saen
Occurrence Frequency 0 0 0 0 0 0 8 31 11 4 0 1 55
Percentage (%) 0 0 0 0 0 0 15 56 20 7.3 0 1.8 100
Laung prabang
Occurrence Frequency 0 0 0 0 0 0 7 27 18 3 0 0 55
Percentage (%) 0 0 0 0 0 0 12.7 49.1 32.7 5.5 0 0 100
In those floods, 35 floods of Chiang Saen Station and Luang Prabang Station were
corresponding to each other. The phenomenon shows that the properties of the storm and
flood at the two stations are closed.
4.4.3 Flood Frequency Analysis about Hydrological Station
Because measured data series of Pak Beng are short, in this stage, the design flood of dam site
is calculated based on the measured data of Chiang Saen and Luangprabang.
The flood series of Chiang Saen and Luang Prabang are collected from 1960 to 2014, totally
55 years, in these series, heavy flood occurred in 1966 and 2008, the peak flows at Chiang
Saen are 23,500m3/s and 13,300m3/s, and the value at Luangprabang are 25,200 m3/s and
23,100 m3/s. According to the frequency analysis results in Annual Mekong Flood Report
2008, the 100-year recurrence maximum discharge at Chiang Saen is 20,000 m3/s, and the
value at Luangprabang is 26,400 m3/s. In the Optimization study of Mekong Mainstream
Hydropower(2009, CNR ), the maximum discharge in 1966 at Chiang Saen is equal to
100-year recurrence discharge, and the flood in 1966 at Luangprabang is equal to 150-year
recurrence discharge.
The series of peak flow at Vientiane HS from 1923 to 2014, totally 92 years, and the
maximum discharge is 26,000 m3/s in 1966. Considering the flood in 1966 at Chiang Saen
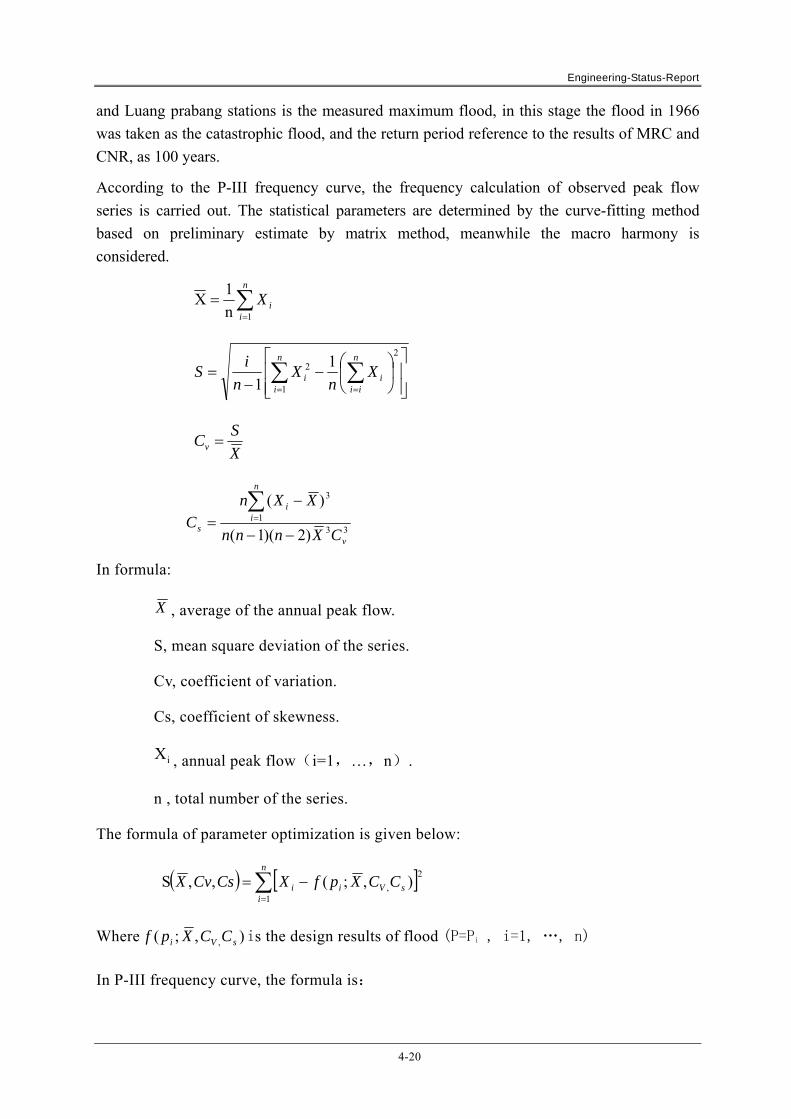
Engineering-Status-Report
4-20
and Luang prabang stations is the measured maximum flood, in this stage the flood in 1966
was taken as the catastrophic flood, and the return period reference to the results of MRC and
CNR, as 100 years.
According to the P-III frequency curve, the frequency calculation of observed peak flow
series is carried out. The statistical parameters are determined by the curve-fitting method
based on preliminary estimate by matrix method, meanwhile the macro harmony is
considered.
n
iiX
1n
1X
n
i
n
iiii X
nX
n
iS
1
2
2 1
1
X
SCv
331
3
)2)(1(
)(
v
n
ii
s CXnnn
XXnC
In formula:
X , average of the annual peak flow.
S, mean square deviation of the series.
Cv, coefficient of variation.
Cs, coefficient of skewness.
iX , annual peak flow(i=1,…,n).
n , total number of the series.
The formula of parameter optimization is given below:
n
isVii CCXpfXCsCvX
1
2
, ),;(,,S
Where ),;( , sVi CCXpf is the design results of flood (P=Pi , i=1, …, n)
In P-III frequency curve, the formula is:

Engineering-Status-Report
4-21
)];(1[),,;( sivsvi CpCXCCXpf
——coefficients of deviation from mean.
Annual flood peak flow frequency curve of Chiang Saen hydrological station and
Laungprabang hydrological station may be referred to Fig. 4.4-1 and Fig. 4.4-2. and the main
frequency flood results of Chiang Saen and Laungprabang Station may be referred to Table
4.4-2.
Table 4.4-2 The Statistical Parameters of Frequency Flood of
Chiang Saen Station and Laungprabang Station
Station Mean Peak Flow
(m3/s) Variation Coefficient Cv Skewness Coefficient Cs
Chiang Saen 10,200 0.35 3.5Cv
Laungprabang 14,900 0.24 3.5Cv
Fig. 4.4-1 Annual Flood Peak Flow Frequency Curve of Chiang Saen HS

Engineering-Status-Report
4-22
Fig. 4.4-2 Annual Flood Peak Flow Frequency Curve of Laungprabang HS
Table 4.4-3 The Main Frequency Flood of Chiang SaenHS and
Laungprabang HS
P(%) QP,Chiang saen (m3/s)
QP,LuangPrabang (m3/s)
P(%) QP,Chiang saen (m3/s)
QP,LuangPrabang
(m3/s)
0.05 29,300 31,700 2 19,600 23,700
0.1 27,500 30,300 5 17,000 21,500
0.2 25,700 28,800 10 15,000 19,700
0.5 23,300 26,900 20 12,800 17,700
1 21,500 25,300 50 9,490 14,400
4.4.4 Design Flood of the Dam Site
The Pak Beng dam site is located between Chiang Saen HS and Luang Prabang HS. The
designed flood is calculated by interzone method based on the hydrological data from
Chiang Saen HS and Luang Prabang HS, The formula is below:
)-(SS CSLP
CSLP
CSDCDS QQ
FF
FFQQ
Where: DSQ , design peak flow at all frequencies of the dam site, m3/s;
CSQ , design peak flow at all frequencies of Chiang Seam HS, m3/s;
LPQ , design peak flow at all frequencies of Laungprabang HS, m3/s;
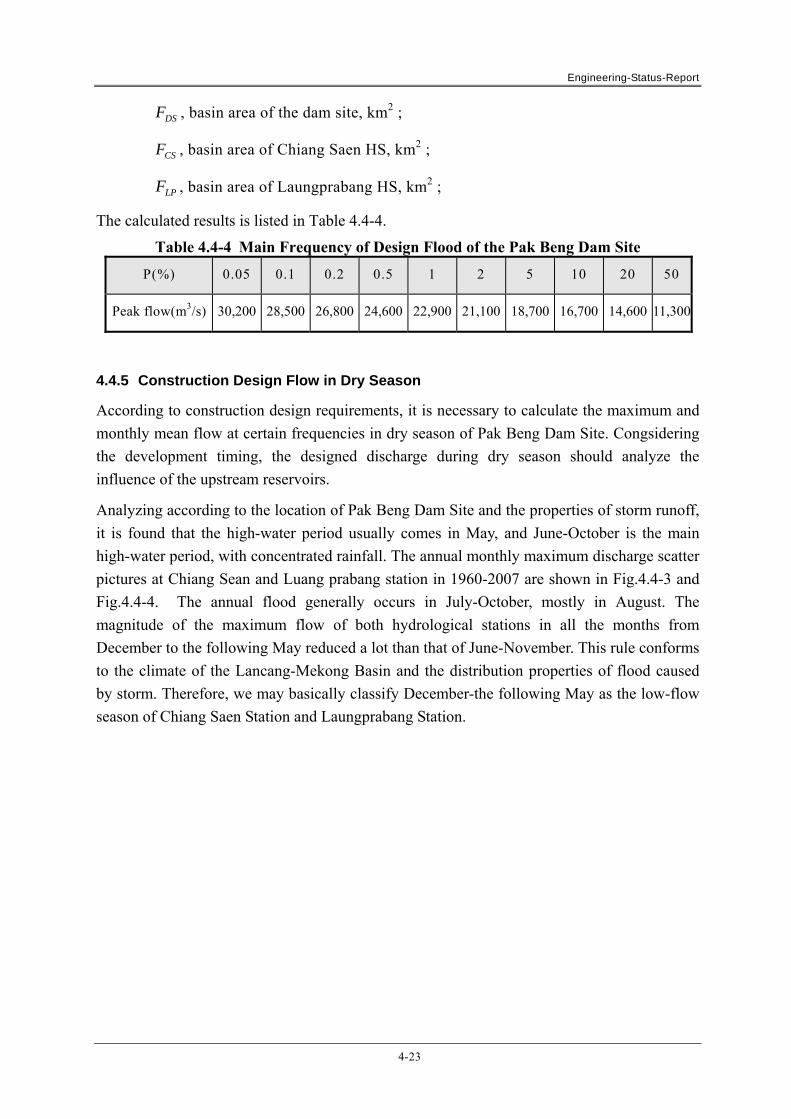
Engineering-Status-Report
4-23
DSF , basin area of the dam site, km2 ;
CSF , basin area of Chiang Saen HS, km2 ;
LPF , basin area of Laungprabang HS, km2 ;
The calculated results is listed in Table 4.4-4.
Table 4.4-4 Main Frequency of Design Flood of the Pak Beng Dam Site
P(%) 0.05 0.1 0.2 0.5 1 2 5 10 20 50
Peak flow(m3/s) 30,200 28,500 26,800 24,600 22,900 21,100 18,700 16,700 14,600 11,300
4.4.5 Construction Design Flow in Dry Season
According to construction design requirements, it is necessary to calculate the maximum and
monthly mean flow at certain frequencies in dry season of Pak Beng Dam Site. Congsidering
the development timing, the designed discharge during dry season should analyze the
influence of the upstream reservoirs.
Analyzing according to the location of Pak Beng Dam Site and the properties of storm runoff,
it is found that the high-water period usually comes in May, and June-October is the main
high-water period, with concentrated rainfall. The annual monthly maximum discharge scatter
pictures at Chiang Sean and Luang prabang station in 1960-2007 are shown in Fig.4.4-3 and
Fig.4.4-4. The annual flood generally occurs in July-October, mostly in August. The
magnitude of the maximum flow of both hydrological stations in all the months from
December to the following May reduced a lot than that of June-November. This rule conforms
to the climate of the Lancang-Mekong Basin and the distribution properties of flood caused
by storm. Therefore, we may basically classify December-the following May as the low-flow
season of Chiang Saen Station and Laungprabang Station.

Engineering-Status-Report
4-24
Fig. 4.4-3 Discharge Scatter at Chiang Sean Station
Fig. 4.5-4 Discharge Scatter at Luang prabang Station
Engineering-Status-Report
4-25
(1) Diversion discharge in dry season
According to the diversion schedule, in the first-stage diversion it is to construct
permanent Ship Lock, upstream and downstream approach channels, concrete
longitudinal cofferdam and first-stage upstream and downstream all-year-round
cofferdam. The standard of the diversion discharge in the dry season is 10-year
recurrence of maximum discharge from December to May in next year.
a Natural maximum discharge
The maximum dischargeduring the dry season is calculated according to the observed
flow data at Chiang Saen HS and Laungprabang HS in the period of 1960 – 2007, and
the maximum flow series is composed by the maximum discharge during the
December to May in each hydrological year, totally 48 years at both stations. And the
10-year recurrence discharge at Chiang Saen is 3790m3/s, which is 4780m3/s at
Laungprabang. Same as the design flood calculation method of the Dam Site, and the
natural diversion discharge in the dry season is 4150m3/s at Pak Beng dam site.
b Considering the influence of the upstream dam
There are some dams existing upstream, in dry season the average discharge will
increase because of the regulation of the upstream reservoirs. And the discharge at the
dam site composes two parts: the outlet from Jinghong dam and the discharge in the
interzone from Jinghong to Pak Beng.
The interzone flood is calculated base on the average daily data at Yunjinghong HS
and Pak Beng from 1960 to 2014, and the maximum discharge series is composed
by the maximum average dailydischarge multiply 1.2 during the December to May in
each hydrological year. And figure below presents the frequency curve of the
maximum discharge of the interzone from Jingjhong to Pak Beng. The 10-year
recurrence peak flow is 2750m3/s.

Engineering-Status-Report
4-26
Fig. 4.4-5 Peak Flow in Dry Season Frequency Curve of Interzone from
Jinghong to Chiang Saen
Jinghong HPP is the last cascade HPP built on the mainstream of the Langcang River,
and the maximum turbine discharge is 3,330m3/s (5×666m3/s). During the dry
season, all the discharge through the turbine, so the maximum outlet of the upstream
is 3,330m3/s.
The interzone peak discharge is uncontrollable, and the outlet of the upstream dam is
controllable by regulation of reservoirs. So there may be some combinations of peak
flow at dam site.
One turbine operation, the10-year recurrence peak flow at the dam site is 3,420m3/s.
Two turbine operation, the10-year recurrence peak flow at the dam site is 4,080m3/s.
Three turbine operation, the10-year recurrence peak flow at the dam site is 4,750m3/s.
Four turbine operation, the10-year recurrence peak flow at the dam site is 5,410m3/s
Five turbine operation, the10-year recurrence peak flow at the dam site is 6,080m3/s
According to the operation data of the cascade HPP of the Langcang river, during the
dry season, the maximum outlet of Jinghong HPP is 2,180m3/s from 2010-2014.
During 2014 in order to empty the storagecapacity, the releasing discharge of
Xiaowan and Nuozhadu HPP during dry season is very big, the maximum outlet of
Jinghong HPP is just 2,670m3/s, not reach the 3,330m3/s. And also considering the
Engineering-Status-Report
4-27
function of the Jinghong HPP in the cascade of the Langcang River, anti-regulation,
navigation, doesn't have ability of load regulation of peak load unit, so the out-let will
be relatively stable, according to the long term streamflow regulation of the cascade,
the monthly average outlet rarely exceed 2000m3/s, considering the using of the dry
season cofferdam is not long, only from the December in the first year to the May in
the second year, and considering the safety of the construction and frequency of the
maximum outlet of Jinghong HPP, the recommended 10-year recurrence discharge
during the dry season is 5,410m3/s, that is 4 turbines operate at Jinghong HPP.
And also we believe that Jinghong outlet in the dry season can reach 3,330m3/s in
certain conditions, so some safety measures should be done before the construction:
Establish the automatic hydrological system and forecasting the discharge at certain
section.
Establish good communication and coordination mechanism with the Lancang River
Hydropower Development Co., Ltd.
Some planning should be made to deal with the flood above the standards
(2) Closure discharge in dry season
According to the diversion schedule, in the second-stage cofferdam river closure in
December and the criterion of discharge is 10-year recurrence of the monthly average
discharge.
The runoff at dam site is influenced by the upstream dam, and it composes two parts,
upstream outlet and interzone flow. Average monthly discharge in December is
2,350m3/s from 1960 to 2014, and 10-year recurrence average monthly discharge is
2,880m3/s.
4.5 SEDIMENT
4.5.1 Sediment Investigation
The area above Liutong River in the drainage basin of Lancang River belongs to
Qinghai-Tibet Plateau, it is small in topographic relief, broad in valley, weak capacity in flow
scouring, relatively small in influence of human activities and low river sediment
concentration.
The topography is complicated between Liutong River and Gajiu District with topographic
relief and large difference in elevation, valleys are formed on two banks due to fast flowing
rivers. On two banks, there are exposed bedrocks, poor vegetation and frequent human
activities, combined with strong geological structure and metamorphism, mechanical and
chemical weathering as well as strong scouring and transporting capacity of slope, all of
which leads to fast growth of river sediment concentration.
For the area between lower Gajiu District and Yunjinghong District, despite of good

Engineering-Status-Report
4-28
vegetation, however, frequent human activities and abundant water vapor leads to large
amount of storm rainfall, and the soil erosion type is mainly water erosion.
River course diagram for area between Yunjinghong District and Luang Prabang District is
shown in Fig. 4.5-1.
For area between Yunjinghong District and Chiang Saen District, the majority is mountainous
river course except Jinghong City and big Ganlanba (Menghan County), which has rock bed,
high mountains and steep slopes on two banks as well as deep-cutting valleys, tributary by
name of Nanban River, Nanlei River and so on are major rivers to flow into this area. The
river reach between Chiang Saen District and Keng Pha Dai is the alluvial plain river with
broad river course, especially the river reach of mouth of Nanmeiying River and Nanmeiguo
Rover, the water flow in river course is dispersed with low flowing speed, a large of amount
of sediment is deposited, and the river is broad and water is shallow, all of which leads to the
formation of sandbank and shoal, and vast tracts of farmlands are distributed on two banks.
Mekong River enters Laos at Keng Pha Dai, where the river course above dam site is mainly
mountainous river, the river is generally 100m to 200m in the withered water period except
few broad river reaches.
The drainage basin in the downstream in Yunjinghong District of Lancang River belongs to
light and moderate erosion area. According to the Remote Sensing Survey Report on Soil
Erosion in Yunnan Province in 2000, the mired erosion area in Xishuangbanna (Menghai,
Mengla and Jinghong) accounts for 73.53%, the mild erosion area accounts for 19.64%, and
the slight erosion area accounts for 93.17%, showing that the soil erosion is slight. Nanban
River is the main tributary in the area between Yunjinghong Hydrometric Station and frontier
area of Lancang River with the controlled drainage area of 7,679km2, the sediment transport
modulus is about 747t/km2•a by calculating the measured data from Man'an Hydrometric
Station located on Nanban River (the controlled drainage area of 6,609km2), showing that this
area belongs to slight soil loss region.
Lancang River is called Mekong River after going out of China's border, Mekong River above
Pak Beng HPP flows through Myanmar, Thailand and northern Laos, the average gradient of
river course is about 0.382‰, it features low gradient of river course, flat water and weak
capacity in flow scouring. Most areas through which Mekong River flows have the altitude
ranging from 200m to 1,500m with large topographic relief, the river course bends many
times and river valley alternately repeats in width for it is blocked by mountains during the
flowing course. This area has a large amount of precipitation with the multi-year average
precipitation amount of about 1700m. Restricted by terrain conditions, rotating agricultural
crops in the low terrace or mountainous area are adopted, although the majority is
slash-and-burn cultivation for agriculture, a large amount of rainfall promotes fast vegetation
restoration, and the vegetation cover is good in the drainage basin with forest and woodland
as its main cover. Only a small percentage of large-scale agricultural development does not
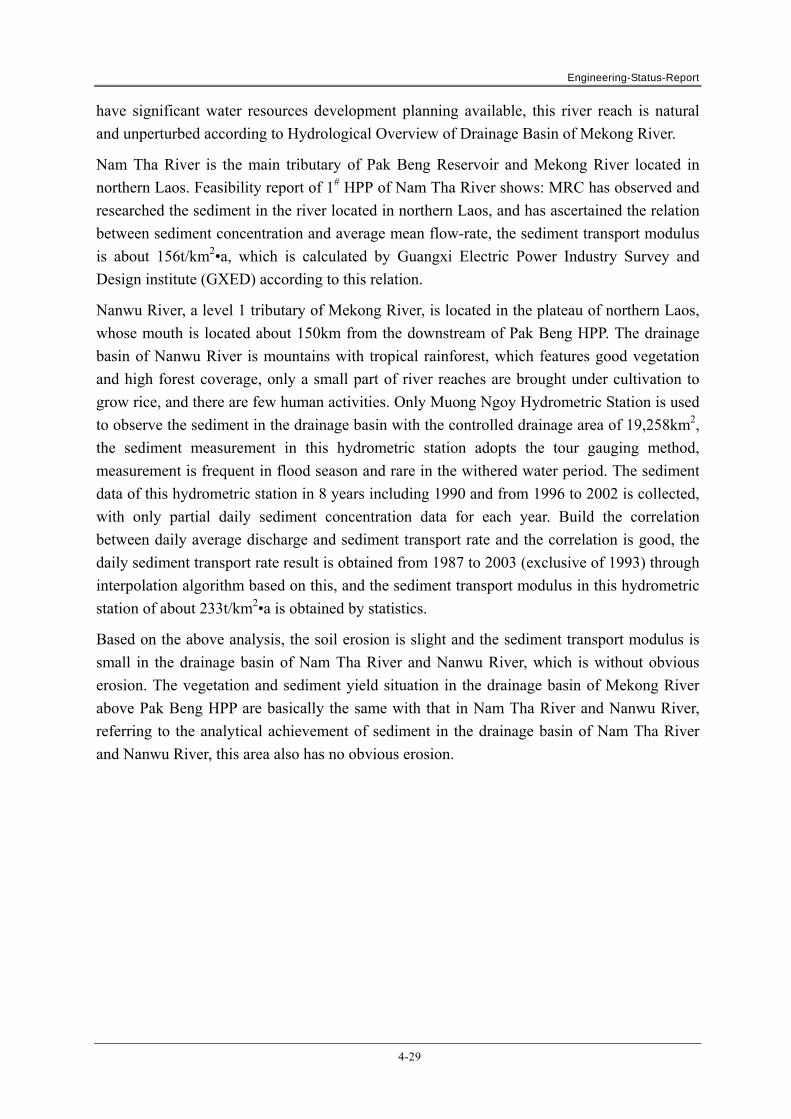
Engineering-Status-Report
4-29
have significant water resources development planning available, this river reach is natural
and unperturbed according to Hydrological Overview of Drainage Basin of Mekong River.
Nam Tha River is the main tributary of Pak Beng Reservoir and Mekong River located in
northern Laos. Feasibility report of 1# HPP of Nam Tha River shows: MRC has observed and
researched the sediment in the river located in northern Laos, and has ascertained the relation
between sediment concentration and average mean flow-rate, the sediment transport modulus
is about 156t/km2•a, which is calculated by Guangxi Electric Power Industry Survey and
Design institute (GXED) according to this relation.
Nanwu River, a level 1 tributary of Mekong River, is located in the plateau of northern Laos,
whose mouth is located about 150km from the downstream of Pak Beng HPP. The drainage
basin of Nanwu River is mountains with tropical rainforest, which features good vegetation
and high forest coverage, only a small part of river reaches are brought under cultivation to
grow rice, and there are few human activities. Only Muong Ngoy Hydrometric Station is used
to observe the sediment in the drainage basin with the controlled drainage area of 19,258km2,
the sediment measurement in this hydrometric station adopts the tour gauging method,
measurement is frequent in flood season and rare in the withered water period. The sediment
data of this hydrometric station in 8 years including 1990 and from 1996 to 2002 is collected,
with only partial daily sediment concentration data for each year. Build the correlation
between daily average discharge and sediment transport rate and the correlation is good, the
daily sediment transport rate result is obtained from 1987 to 2003 (exclusive of 1993) through
interpolation algorithm based on this, and the sediment transport modulus in this hydrometric
station of about 233t/km2•a is obtained by statistics.
Based on the above analysis, the soil erosion is slight and the sediment transport modulus is
small in the drainage basin of Nam Tha River and Nanwu River, which is without obvious
erosion. The vegetation and sediment yield situation in the drainage basin of Mekong River
above Pak Beng HPP are basically the same with that in Nam Tha River and Nanwu River,
referring to the analytical achievement of sediment in the drainage basin of Nam Tha River
and Nanwu River, this area also has no obvious erosion.

Engineering-Status-Report
4-30
Fig. 4.5-1 River course diagram for area between Yunjinghong District and Luang Prabang District

Engineering-Status-Report
4-31
4.5.2 Sediment Transport in Hydrological Stations
Sediment measuring of the hydrological stations on mainstream of Lancang - Mekong River
may be referred to Table 4.5-1 and Table 4.5-2.
Table 4.5-1 List of Sediment Measuring of Hydrological Stations in
Lancang River Basin
Hydrological Stations
Drainage Area (km2)
Time of Establishment (Year / Month)
Data of Recording Length
Discharge Sediment
Liutongjiang 83,700 1959/12 1961/1–1965/12
1986/5– Now 1961/1–1965/7
Jiuzhou 94,100 1954/4 1954/4– Now 1957/9– Now
Gajiu 114,600 1957/1 1957/1– Now 1963/8– Now
Yunjinghong 149,100 1955/6 1955/6– Now 1963– Now
Guanlei 163,000 2006 2006/11– Now 2007– Now
Table 4.5-2 List of Sediment Measuring of Hydrological Stations in
Mekong River Basin
Hydrological Stations
Drainage Area(km2)
Sediment Data Times of Daily Sediment
discharge Rate
Chiang Saen 189,000 1960 (Only Aug – Dec), 1962 (Only Apr), 1963 (Only Feb – Mar), 1971 (Only Apr – Dec), 1972, 1973, 1974 (Only Jan – Mar)
161
Sop Kok 201,000 1972, 1973 108
Chiang Khong 204,000 1971 (Only January, April – December) 34
Luang Prabang 268,000 1960 (Only September and December), 1962
(Only January – April, July – December) 35
There are many sediment observing stations in Lancang River Basin, with survey accuracy
being high. Except that Guanlei Station is a new one, data of the others have been collected
completely. The Yunjinghong Station controls an area of 149,100km2, and it is the main
station on the Lancang River before outflowing China. The observed sediment series is 40
years, and by supplementing, extending and reducing, the data series is 1953 – 2002. In which
the reducing calculation of 1993 – 2002, sediment-retaining impact of Manwan and
Dachaoshan Reservoirs was taken into account.
After the Lancang River outflowing China, the main sediment observing stations on the
Mekong River include: Chiang Sean, Chiang Khong, Sop Kok, and Laungprabang, ect. While
tour gauging is conducted to sediment measuring of the stations, and the measuring series is
short. Until now, few years of data have been collected, however, only some daily sediment

Engineering-Status-Report
4-32
concentration data in one year. There are slightly more data in Chiang Sean station, and
presently, some daily sediment concentration and corresponding flow data in 1962, 1971 –
1974, totally 161 days, are collected. In which data of 63 days are imbalance with that of
Yunjinghong Station, accounting for 39%. There are 94 days of sediment information in flood
season, however, 48 days have occurred imbalance, which accounting for 51%. The Sop Kok
Station is located about 9km downstream Chiang Sean Station, with 70 days of sediment data
in same period as Chiang Sean Station, while there are 13 days with imbalanced amount of
sediment, accounting for 19%. Process of Daily Sediment discharge Rate of the three
hydrologic stations are Shown in Fig. 4.5-4-4.5-8.
According to the relationship of discharge-sediment discharge rate of Chiang Sean, shows in
Fig. 4.5-9, extend the sediment data of Chiang Sean from 1972 - 1998, The annual average
amount of suspended load at Yun Jinghong and Chiang Sean hydrologic station in table 4.6-3.
From 1972 - 1998, sediment quantity of suspended load at Yun Jinghong is much more than
Chiang Sean, The results are unreasonable. The main reason is that gauging stations on the
Mekong River adopt tour sediment measuring, with few measuring times, which may miss the
peak of sediment, Sediment test results may smaller than the actual situation.
By the above analyzing, since the above mentioned gauging stations on the Mekong River
adopt tour sediment measuring, with few measuring times and low reliability of data, these
data cannot serve as the basis for sediment design of Pak Beng HPP. While the Yunjinghong
station is a basic hydrologic station in China, it is the control station of Lancang River, with a
long history of sediment measuring, data surveying and compiling conform to the
specifications. Yunjinghong station Located in Jinghong, Xishuangbanna, the photo of the
station are shown in Fig.4.5-2. The testing river is straight, riverbed is composed of fine sand
and pebble, testing cross section is ‘U’ shape, refer to Fig.4.5-3. Station set up water level,
water temperature, discharge, sediment(sediment concentration and Sediment discharge), water
quality, rainfall, evaporation, etc. observation project, sediment concentration test is around
300 times every year, The sampling device is Horizontal type sampler (similar to Van Dorn or
Niskin water trap bottle).
Therefore, sediment design of Pak Beng HPP is mainly based on the data of Yunjinghong
Station, while data in Chiang Sean Station serve as reference.
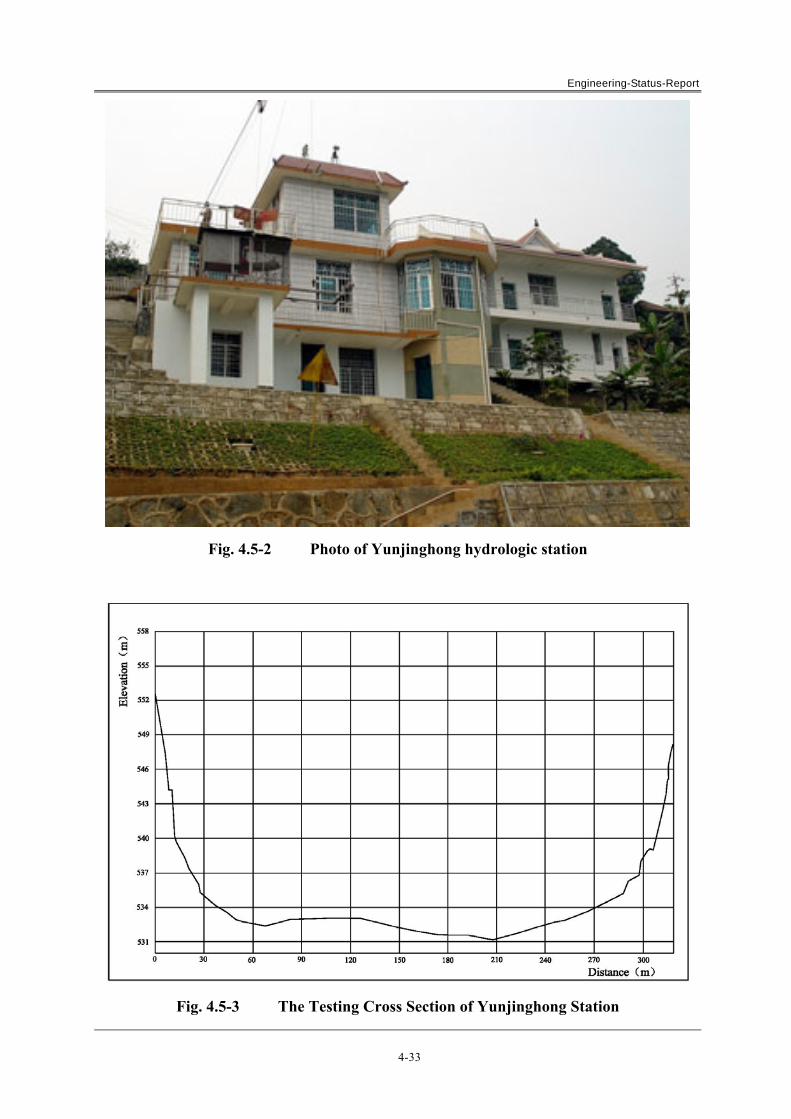
Engineering-Status-Report
4-33
Fig. 4.5-2 Photo of Yunjinghong hydrologic station
Fig. 4.5-3 The Testing Cross Section of Yunjinghong Station
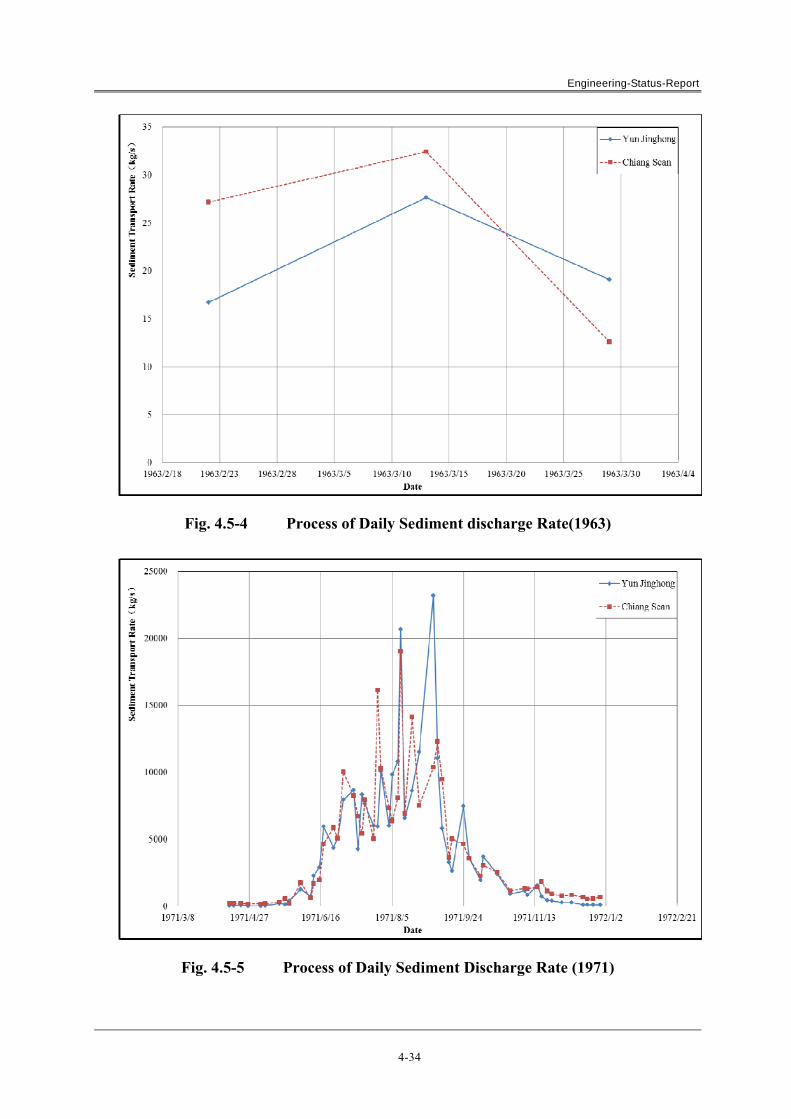
Engineering-Status-Report
4-34
Fig. 4.5-4 Process of Daily Sediment discharge Rate(1963)
Fig. 4.5-5 Process of Daily Sediment Discharge Rate (1971)
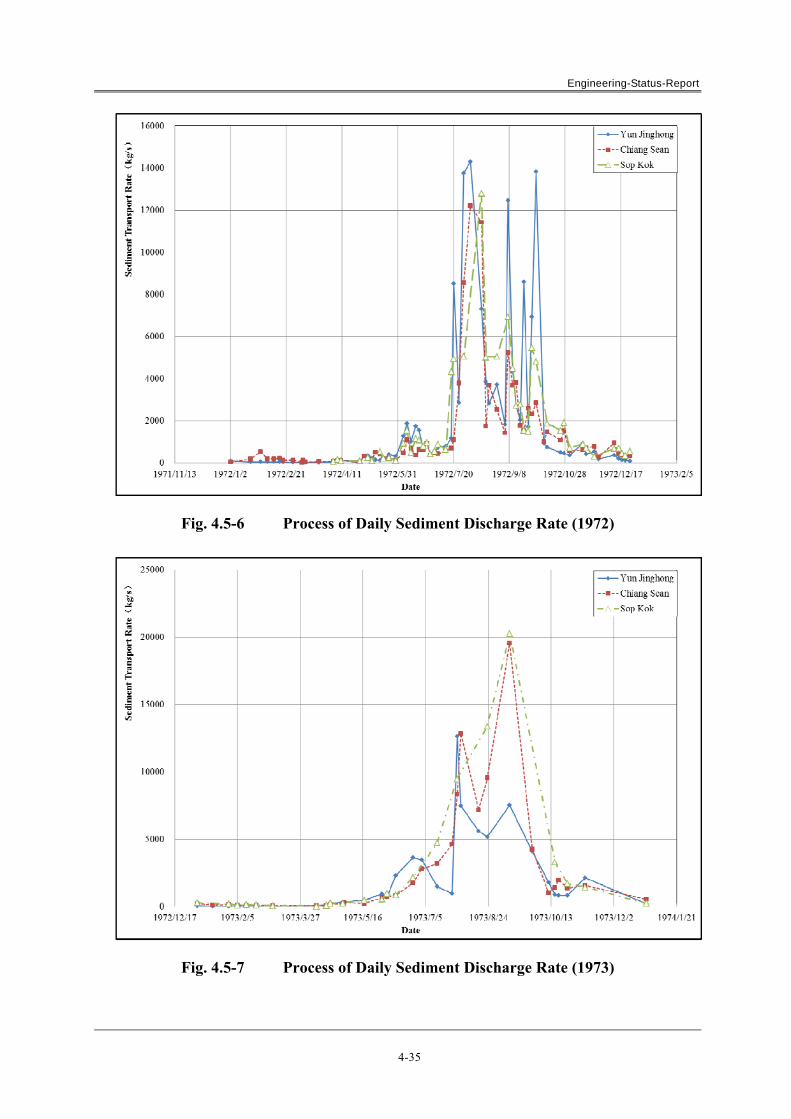
Engineering-Status-Report
4-35
Fig. 4.5-6 Process of Daily Sediment Discharge Rate (1972)
Fig. 4.5-7 Process of Daily Sediment Discharge Rate (1973)

Engineering-Status-Report
4-36
Fig. 4.5-8 Process of Daily Sediment Discharge Rate (1974)
Fig. 4.5-9 Correlation Diagram of Water and Sediment of Chiang Sean
Hydrological Station
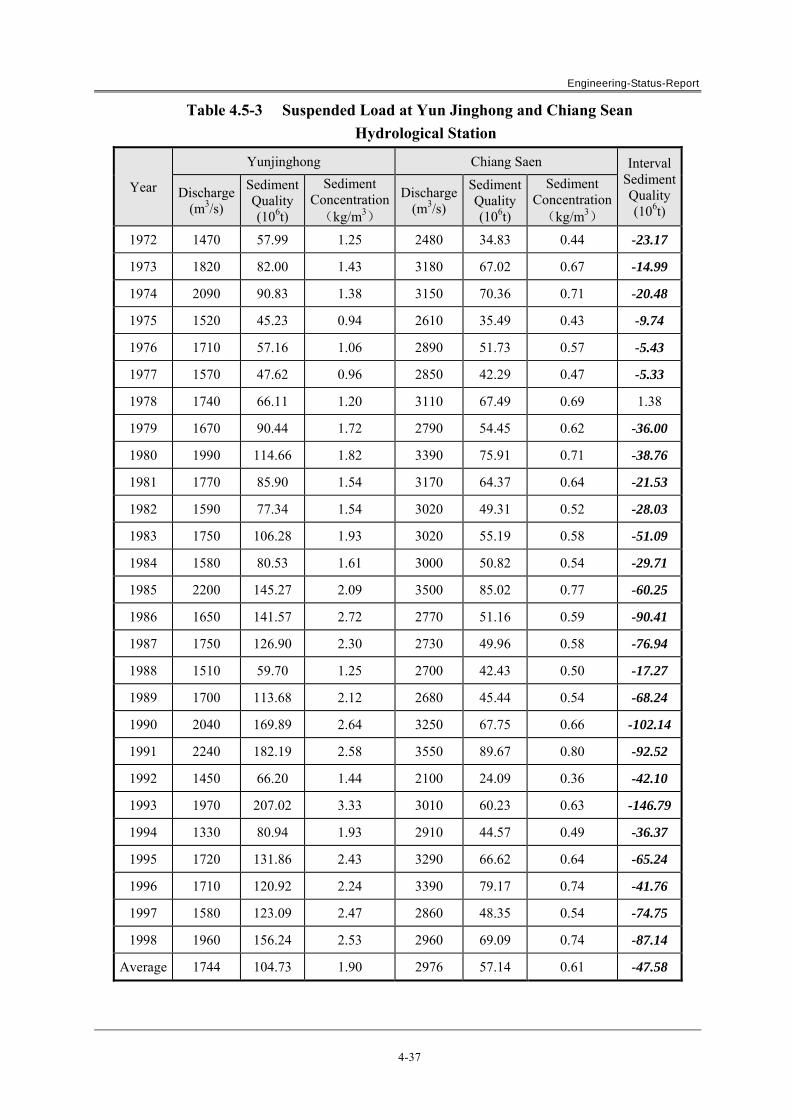
Engineering-Status-Report
4-37
Table 4.5-3 Suspended Load at Yun Jinghong and Chiang Sean
Hydrological Station
Year
Yunjinghong Chiang Saen IntervalSedimentQuality(106t)
Discharge(m3/s)
Sediment Quality (106t)
Sediment Concentration(kg/m3)
Discharge(m3/s)
SedimentQuality(106t)
Sediment Concentration (kg/m3)
1972 1470 57.99 1.25 2480 34.83 0.44 -23.17
1973 1820 82.00 1.43 3180 67.02 0.67 -14.99
1974 2090 90.83 1.38 3150 70.36 0.71 -20.48
1975 1520 45.23 0.94 2610 35.49 0.43 -9.74
1976 1710 57.16 1.06 2890 51.73 0.57 -5.43
1977 1570 47.62 0.96 2850 42.29 0.47 -5.33
1978 1740 66.11 1.20 3110 67.49 0.69 1.38
1979 1670 90.44 1.72 2790 54.45 0.62 -36.00
1980 1990 114.66 1.82 3390 75.91 0.71 -38.76
1981 1770 85.90 1.54 3170 64.37 0.64 -21.53
1982 1590 77.34 1.54 3020 49.31 0.52 -28.03
1983 1750 106.28 1.93 3020 55.19 0.58 -51.09
1984 1580 80.53 1.61 3000 50.82 0.54 -29.71
1985 2200 145.27 2.09 3500 85.02 0.77 -60.25
1986 1650 141.57 2.72 2770 51.16 0.59 -90.41
1987 1750 126.90 2.30 2730 49.96 0.58 -76.94
1988 1510 59.70 1.25 2700 42.43 0.50 -17.27
1989 1700 113.68 2.12 2680 45.44 0.54 -68.24
1990 2040 169.89 2.64 3250 67.75 0.66 -102.14
1991 2240 182.19 2.58 3550 89.67 0.80 -92.52
1992 1450 66.20 1.44 2100 24.09 0.36 -42.10
1993 1970 207.02 3.33 3010 60.23 0.63 -146.79
1994 1330 80.94 1.93 2910 44.57 0.49 -36.37
1995 1720 131.86 2.43 3290 66.62 0.64 -65.24
1996 1710 120.92 2.24 3390 79.17 0.74 -41.76
1997 1580 123.09 2.47 2860 48.35 0.54 -74.75
1998 1960 156.24 2.53 2960 69.09 0.74 -87.14
Average 1744 104.73 1.90 2976 57.14 0.61 -47.58
Engineering-Status-Report
4-38
Yunjinghong hydrological station started flow testing at June 1955, sediment testing at
January 1963. The measured maximum annual sediment runoff is 182.19×10⁶(1991), and the
minimum is 45.23×10⁶(1975). The maximum sediment concentration is 19.4kg/m3(27 July
1986), Jiajiu station downstream of Manwan hydropower station started flow testing in June
1957, sediment testing in April 1963. At present, the sediment data of Jiajiu and Yunjinghong
hydrological station have been collected until 2012.
Manwan and Xiaowan hydropower station of the upstream of Jiajiu hydrological station were
put into operation in 1993 and September 2009 respectively, Dachaoshan and Nuozhadu
hydropower station are located between Jiajiu and Yunjinghong station, which were put into
operation in December 2001 and August 2012 respectively, Jinghong hydropower station
downstream of Yunjinghong station was put into operation at May 2008
During the design of Xiaowan and Nuozhadu hydropower station, the data of Jiajiu and
Yunjinghong station from 1953 - 1963 had been extended.
Manwan hydropower station started filling at April 1993, Yunjinghong station was influenced
by the impoundment and sediment retaining, the discharge and sediment data after 1993 need
to be restored. During the design of Nuozhadu hydropower station, sediment runoff of Jiajiu
and Yunjinghong station was obviously influenced by Manwan hydropower station, but
different value of sediment runoff between Jiajiu and Yunjinghong station can represent the
natural sediment situation of this area. So the restored sediment runoff of Yunjinghong station
from 1993 - 2001 can be explicated by the following formula:
)( sJiasJingRsJiaRsJing WWWW
Where: RsJingW = restored sediment runoff at Jinghong Station
JiaRsW = restored sediment runoff at Jiajiu Station
JingsW = measured sediment runoff at Jinghong Station
JiasW = measured sediment runoff at Jiajiu Station
After Dachaoshan and Nuozhadu hydropower stations had put into operation in 2001,
sediment runoff of Yunjinghong station can not be restored.
Through restore calculation, annual average sediment runoff of Yunjinghong hydrologic from
1953 - 2001 is 108.23×10⁶t。

Engineering-Status-Report
4-39
Table 4.5-4 Yearly Distribution of Suspended Load at Yunjinghong
Hydrologic Station
Items Jan. Feb. Mar. Apr. May Jun. Jul. Aug. Sep. Oct. Nov. Dec. Mean
Sediment discharge
(kg/s) 102 63.2 106 223 736 3404 9000 13190 8025 4265 1425 297 3432
Sediment Runoff(106t)
0.274 0.153 0.285 0.577 1.97 8.82 24.11 35.33 20.80 11.42 3.69 0.794 108.23
Discharge (m3/s)
710 591 557 679 1040 1950 3450 4210 3490 2620 1600 967 1830
Sediment Concentration
(kg/m3) 0.14 0.11 0.19 0.33 0.71 1.75 2.61 3.13 2.30 1.63 0.89 0.31 1.88
4.5.3 Natural Sediment Transport at the Dam Site
The Dam Site of Pak Beng HPP controls an area of 218,000km2. while Yunjinghong Station
controls149,100km2, accounting for 68.3% of that in Pak Beng Dam Site. Sediment quantity
of Pak Beng Dam Site can be calculated by the following formula:
ssJingsDam AMWW (3.6-1)
Where: sDamW = volume of suspended load at Pak Beng dam site
JingsW = volume of suspended load in Yunjinghong Station
A = interval drainage area between Yunjinghong and Pak Beng dam site
sM = modulus of sediment transport between Yunjinghong and Pak Beng dam
site
The uncontrolled area between Yunjinghong and Pak Beng belongs to unobvious erosion,
according to sediment production condition. The modulus of sediment transport is estimated
as 500t/km2•a, which is the upper limit in regions of unobvious erosion. In this way, mean
natural sediment quantity of suspended load comes to 142.68×10⁶t at the dam site. And
sediment distribution in a year may be referring to Yunjinghong Station, the results may be
referred to Table 4.5-5.

Engineering-Status-Report
4-40
Table 4.5-5 Yearly Distribution of Suspended Load at Pak Beng Dam Site
Items Jan. Feb. Mar. Apr. May Jun. Jul. Aug. Sep. Oct. Nov. Dec. MeanJun. –Oct.
Sediment Runoff (106t)
0.36 0.20 0.38 0.76 2.60 11.63 31.78 46.57 27.42 15.06 4.87 1.05 142.68132.47
Sediment discharge
(kg/s) 134.9 83.3 140.3 293.5 970.34,48811,86517,38810,5805,6231,879 390.9 4,524 10,021
Discharge (m3/s)
1,330 1,050 966 1,080 1,6103,010 5,640 7,690 6,350 4,4602,910 1,790 3,160 5,430
Sediment Concentration
(kg/m3) 0.10 0.08 0.15 0.27 0.60 1.49 2.10 2.26 1.67 1.26 0.65 0.22 1.43 1.85
Table 4.5-6 Analysis Table of the Sediment Yield in
Lancang-Mekong River Basin
Mainstreams Branches Drainage area
(km2)
Referenced sediment transport modulus (t/km2•a)
Adopted sediment transportmodulus
(t/km2•a)
Yunjinghong -Pak Beng
Intervals of Dam Site (t/km2.a)
Yunjinghong 149,100 726 726
750
350
Nanban River 7,679 747
Exit of Lancang River
(Guanlei) 163,000
250
Chiang Saen 189,000 300-500
Nam Ing
River 9,750 53
Nam Tha
River 8,990 156
Pak Beng dam site
218,000
Nam OU River
(Muong Ngoy)
19,258 233
Shown in Table 4.5-6:
Yunjinghong Hydrologic Station has the controlled drainage area of 149,100km2, while
Nanban River has the drainage area of 7679km2. Both of them control more than 95% of the
basin area of Lancang at leave-boundary section (Guanlei). Therefore, the sediment discharge
of Lancang at leave-boundary section is mainly affected by the sediment discharge of
Yunjinghong Hydrologic Station and Nanban River. The sediment transport modulus of
drainage basin above Yunjinghong Hydrologic Station is about 726t/km2•a, while that of
Nanban River is about 747t/km2•a. Therefore, the sediment transport modulus of drainage

Engineering-Status-Report
4-41
basin between Yunjinghong Hydrologic Station and frontier area of Lancang River should be
around 700t/km2•a, which can be 750t/km2•a.
There are some data of daily sediment concentration in Chiang Saen Hydrologic Station to
show that the site traffic is related to transport rate, and Chiang Saen is related to Yunjinghong
transport rate. The interpolated sediment discharge of Chiang Saen Station is less than that of
the upstream Yunjinghong Station. The sediment transport modulus of basins above
hydrologic station is between 300t/t/km2•a to 500t/km2•a. The main reason is that this station
made the sediment measurement by tour gauging with fewer measurements, which is missing
in sediment peak(especially in flood season); in the other hand, it also reflects that there is less
sediment yield in river basin from Yunjinghong to Chiang Saen. Mekong River Basin, above
Pak Beng dam site, is located in the mountains of northern Laos with Nam Tha River and
Nanwu River. They have the similar vegetation conditions and basically the same sediment
yield. According to the sediment analysis result of Nam Tha River and Nanwu River, there is
no obvious erosion in this area. The referenced sediment transport modulus of Nam Tha River
and Nanwu River respectively are about 150t/km2•a and 233t/km2•a.The sediment transport
modulus of Mekong River Basin above Pak Beng Power Station is taken 250t/km2•a for
consideration.
According to the above analysis, we can get the weighted result of sediment transport
modulus from Yunjinghong to Pak Beng dam site, which is about 350t/km2•a.
In consideration of the sediment yield in river basin from Yunjinghong to Pak Beng, there is
mild or no obvious erosion in this area. So the sediment transport modulus in the sediment
calculation of Pak Beng dam site should be below 500t/km2•a according to the grading
standard of soil erosion intensity in China. The upper limit sediment transport modulus of the
area from Yunjinghong Hydrologic Station to Power Station dam site should be 500t/km2•a,
the maximum number of no obvious erosion, and the result is basically reasonable and partial
to safety.
There are no measured sediment load data in Lancang hydrologic stations of mainstream of
Mekong River. In the preliminary design of upstream Manwan Hydropower Station, we
adopted the formulas of bed load proposed by comrade Du Guohan etc. from Beijing Institute
of Water Resources and Hydropower Research in the research of Dujiangyan reconstruction.
This formula is more suitable for mountain pebble river bed. We calculated the bedload
sediment of good year, average year and dry year in hydrologic station. The bedload sediment
of Manwan dam site is 1.5 million tons, accounting for about 3% of suspended load sediment.
During the year of 1990 and 1991, Kunming scientific research institute specifically carried
out a flume simulation experiment on the bedload sediment discharge of Manwan dam site.
The result shows that it is feasible to adopt 3% ratio of bed-suspended load to calculate the
bed load sediment. In the feasible design of Yunjinghong Hydropower Station, we adopted
Meyer-Peter Formula to Fig. out the bed-load transport rate of the river reach of Yunjinghong
Hydrologic Station. We also used 3% ratio of bed-suspended load to calculate the bed load

Engineering-Status-Report
4-42
sediment. The sediment quantity of bed load at Pak Beng Dam Site is 4.28×10⁶t.
4.5.4 Sediment Transport after Considering Sediment-Retaining Impact of Cascades
in the Upstream
On Lancang River in the upstream, Manwan(1993), Dachaoshan(2001), Jinghong(2008),
Xiaowan(2009) and Nuozadu(2012) Hydropower Projects have put into operation,
Considering the sediment-retaining impacts of cascades on Lancang River, after upstream
sediment retained by Xiaowan, Manwan, Dachaoshan, and Nuozhadu all considered,
sediment at the dam site of Jinghong Hydropower Station is 11.79×10⁶t, sediment outflow
ratio is 30% which is 3.54×10⁶t, and sediment between Jinghong and Pak Beng is 34.45×
106t, so we can find that suspended loan sediment at Pak Beng dam site is 37.99×10⁶t which
accounts for 26.6% of natural situations.
The amount of bed-load sediment upstream Jinghong Dam Site have been entirely retained,
and the amount of bed load of Pak Beng Dam Site comes only from the uncontrolled area
between Jinghong and Pak Beng Dam Site. Estimating by 3% of amount of uncontrolled
suspended load sediment, it will be 1.034×10⁶t, accounting for 24.2% of the natural volume.
4.5.5 Sediment Grading
(1) Grading of Suspended Load
KHIDI sampled the sediment at Pak Beng Dam Site during June 13 and June 17
2008, once a day, totally took 5 samples, and one-point method at water surface is
adopted to take sample at the three vertical lines on beside the L/B and R/B and in
the middle river, while the analytical method is transfer pipette method. The
comprehensive analytical results of 5 groups of sediment samples are: median
particle diameter d50=0.0077mm, mean particle diameter dm=0.0224mm, the
maximum diameter 2.45mm. The grading curve of suspended load is shown in Fig.
4.5-9.
This result may be finer, but after upstream power station put into operation, most of
the coarse sediment will be retained in the reservoir, grading of suspended load will
become fine. For example, according to the suspended-load sampling of
Yunjinghong hydrologic station downstream of Jinghong hydropower station, before
and after Jinghong put into operation, median particle diameter are d50=0.025mm
and d50=0.0033mm respectively.
After independent evaluation by CNR, according to the expert’s opinion, Suspended
load sampling was carried out at Pak Beng hydrologic station during 25 June
2015(while discharge is 1890m3/s and sediment concentration is 0.13kg/m3), during
the sampling the width of sampling position is about 155m, vertical line of sampling
are 36.0m, 73.0m and 110mrespectively from the river bank. Three sampling that are
0.2, 0.6, and 0.8depth of the water were made at each vertical line. The sampling
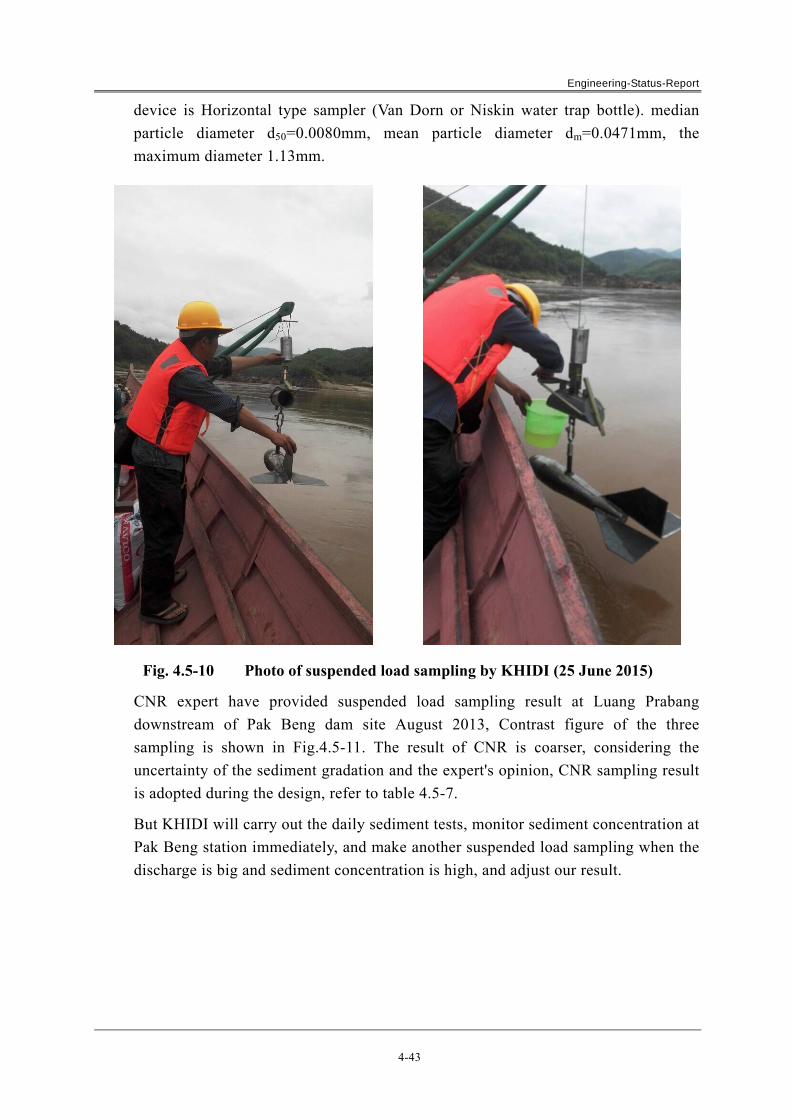
Engineering-Status-Report
4-43
device is Horizontal type sampler (Van Dorn or Niskin water trap bottle). median
particle diameter d50=0.0080mm, mean particle diameter dm=0.0471mm, the
maximum diameter 1.13mm.
Fig. 4.5-10 Photo of suspended load sampling by KHIDI (25 June 2015)
CNR expert have provided suspended load sampling result at Luang Prabang
downstream of Pak Beng dam site August 2013, Contrast figure of the three
sampling is shown in Fig.4.5-11. The result of CNR is coarser, considering the
uncertainty of the sediment gradation and the expert's opinion, CNR sampling result
is adopted during the design, refer to table 4.5-7.
But KHIDI will carry out the daily sediment tests, monitor sediment concentration at
Pak Beng station immediately, and make another suspended load sampling when the
discharge is big and sediment concentration is high, and adjust our result.

Engineering-Status-Report
4-44
Fig. 4.5-11 Suspended Load Grading Curve of Pak Beng HPP
Table4.5-7 Grain Size Distribution of Suspended Load(by CNR at Luang Prabang)
Diameter (mm) 10 2 1 0.5 0.2 0.1 0.05
Percentage of sediment weight that smaller than certain diameter (%)
100 99.9 99.7 95.3 70.7 66.9 66
Diameter (mm) 0.0295 0.0152 0.0109 0.0056 0.0034 0.0021
Percentage of sediment weight that smaller than certain diameter (%)
61.6 48.3 36.8 15.5 4.5 0.7
(2) Grading of Bed Load
There are no observed bed-load data in the hydrologic stations on Lancang - Mekong
River Basin, and river-bed load grading is used to substitute bed-load grading.
KHIDI sampled two groups at the Nam Tha River estuary and the powerhouse
complex area in the reservoir area of Pak Beng HPP, for each group of sediment
samples, it is to take a sample each from the upper part and the lower part in the
center of the sand beach for comparative analysis, by weighing and screening, it is to
finally take analytical results of two sediment samples as the analytical results. The
analytical results are as follows: median particle diameter D50=16.9mm, mean
particle diameter Dm=28.0mm, the maximum diameter 180mm. The grading curve of
bed load may be referred to Fig. 4.5-12.
Suspended load and bed load will transform during different flow condition, so it is
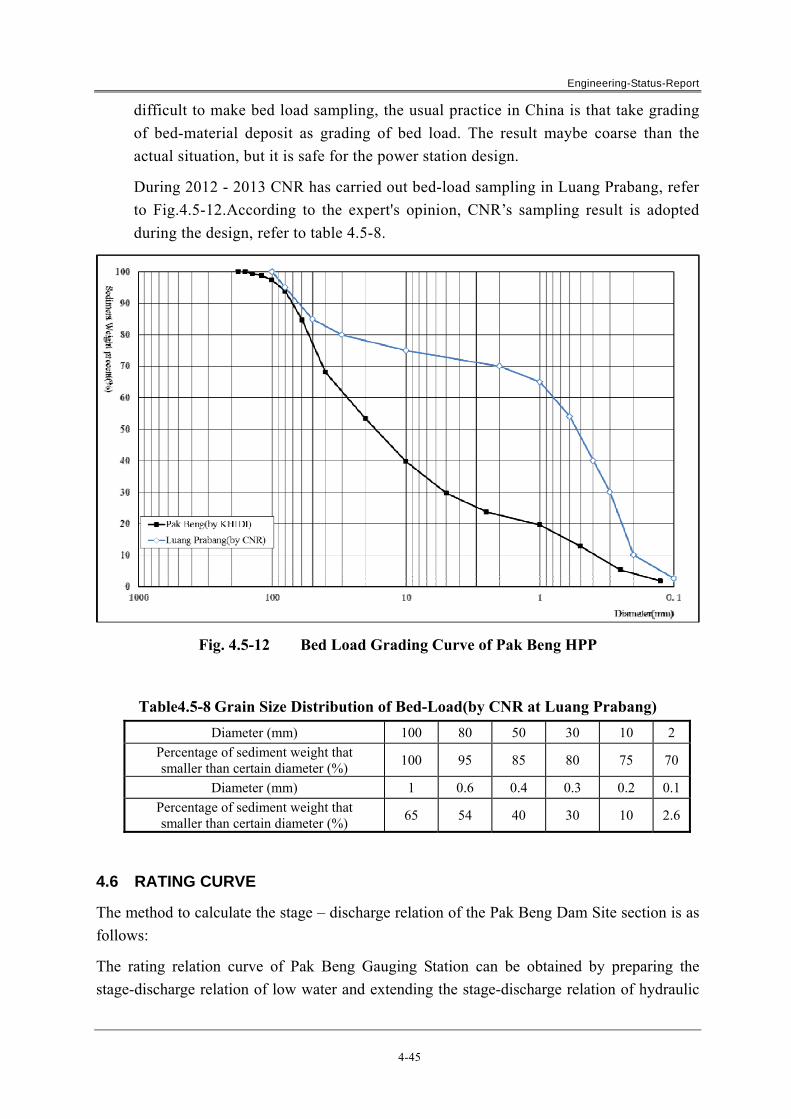
Engineering-Status-Report
4-45
difficult to make bed load sampling, the usual practice in China is that take grading
of bed-material deposit as grading of bed load. The result maybe coarse than the
actual situation, but it is safe for the power station design.
During 2012 - 2013 CNR has carried out bed-load sampling in Luang Prabang, refer
to Fig.4.5-12.According to the expert's opinion, CNR’s sampling result is adopted
during the design, refer to table 4.5-8.
Fig. 4.5-12 Bed Load Grading Curve of Pak Beng HPP
Table4.5-8 Grain Size Distribution of Bed-Load(by CNR at Luang Prabang)
Diameter (mm) 100 80 50 30 10 2
Percentage of sediment weight that smaller than certain diameter (%)
100 95 85 80 75 70
Diameter (mm) 1 0.6 0.4 0.3 0.2 0.1
Percentage of sediment weight that smaller than certain diameter (%)
65 54 40 30 10 2.6
4.6 RATING CURVE
The method to calculate the stage – discharge relation of the Pak Beng Dam Site section is as
follows:
The rating relation curve of Pak Beng Gauging Station can be obtained by preparing the
stage-discharge relation of low water and extending the stage-discharge relation of hydraulic

Engineering-Status-Report
4-46
formula( RQ A~ ) of high water according to the achievement data of measured vertical and
horizontal profiles of Pak Beng Gauging Station. See Fig.4.6-2 for actual measured
stage-discharge point data and the comparison figure of the stage-discharge relation of Pak
Beng HS, and actual measured points generally scatters at both sides of calculated
stage-discharge relation curve averagely that indicates inquiring into stage-discharge relation
of Pak Beng Gauging Station conforms to the actual situation.
295
300
305
310
315
320
325
330
335
340
345
0 5000 10000 15000 20000 25000 30000 35000
H(m)
Discharge(m3/s)
Rating Curve at D Gauge Station
Discharge Measured in 2008
Discharge Measured in 2009
Discharge Measure in 2010
Discharge Measured in 2011
Discharge Measured in 2012
Discharge Measured in 2013
Discharge Measured in 2014
Fig. 4.6-1 Rating Curve at Pak Beng HS
The method to calculate the rating curve of the Pak Beng Dam Site are as follows:
According to the same period observation of stage, establish the same period stage correlation
between the 4 groups of stage gauges and Pak Beng Stage Gauging Station, so as to get the
stage of the 4 groups of stage gauges. By water level interpolation method, we can get the
stage – discharge relation of the Pak Beng Dam Site with the stage – discharge relation of the
two groups of stage gauges, which are right upstream and downstream.
The stage – flow relation results of all the dam axis of Pak Beng HPP may be referred to
Table 4.6-1, and the stage – flow relation graph may be referred to Fig. 4.6-2.

Engineering-Status-Report
4-47
300
305
310
315
320
325
330
335
340
345
0 5000 10000 15000 20000 25000 30000 35000
H(m
)
Q(m3/s)
Fig. 4.6-2 Rating Curve at Pak Beng Dam Site
Table 4.6-1 The result of the Rating Curve at Pak Beng Dam Site
Discharge (m3/s)
Stage (m)
Discharge (m3/s)
Stage (m)
Discharge (m3/s)
Stage (m)
496 304.15 4,070 316.96 13,700 330.8
660 305.11 4,470 317.91 14,800 331.85
840 306.1 4,880 318.92 16,100 332.89
1,020 307.02 5,320 319.85 17,400 333.86
1,200 307.98 5,540 320.26 18,700 334.82
1,410 308.98 6,040 321.14 20,100 335.84
1,620 309.9 6,630 322.13 21,500 336.86
1,860 310.86 7,270 323.17 23,000 337.95
1,990 311.34 7,960 324.25 24,400 338.95
2,250 312.3 8,700 325.27 25,800 339.91
2,490 312.98 9,530 326.33 27,200 340.86
2,750 313.67 10,400 327.35 27,900 341.33
3,020 314.33 11,200 328.19 29,200 342.2
3,330 315.09 12,100 329.14 30,500 343.05
3,680 316.01 13,200 330.29
Engineering-Status-Report
4-48
4.7 EXPECTED FUTURE HYDROLOGY
According to the Strategic Environmental Assessment on Hydropower Development of
Mekong River Mainstream (final report),the climate change has started to influence the
ecosystem, people's livelihood and development of drainage basin of Mekong River Basin by
changing the conventional climate - i.e. daily, quarterly or yearly climate patterns - and
unconventional extreme events. The records show that the multi-annual average temperature
of Mekong River Basin is on the rise in the past 30 - 50 years; As for trend of rainfall, Laos
and Cambodia have less rain, increasing variability between rainy season and dry season and
a larger number of extreme events; Thailand has less rain; Most of the northern areas of
Vietnam have less rain, while most of the southern areas have more annual rainfall.
It is expected that the average temperature in drainage basin will rise steadily by 0.8℃ by
2030, the northern areas will have higher temperature rise, and Yunnan Province will increase
by 1.4℃; The annual rainfall will increase by 13.5%(200mm), which is largely attributed to
by rainfall in rainy season, the rainfall in dry season in northern areas will increase, which
will decrease in southern areas.
The climatic changes increase the risk and uncertainty for the long-term planning, which also
have positive and negative influence on the development of Mekong River Basin. The
predictable maximum influence of hydroelectric development is hydrological regime, all
kinds of climate change predictions believe that substantive change will take place in the
runoff, flow and flooding of Mekong River Basin by 2050:
The annual runoff of Mekong River Basin varies depending on the change of runoff of
drainage basin, increasing by 15% - 23%.
Considering the role of upstream and downstream mainstreams of downstream Mekong
River Basin and dam of tributary of Mekong River Basin, the flow of Mekong River
Basin will increase by 9% - 22%.
The occurrence rate, scope and time of duration of extreme flood events increase;
meanwhile, the overall differences between rainy seasons and dry seasons shall also
increase.
The increased flow resulted from climatic changes shall benefit the hydropower industry. The
increase of the rainfall capacity, the runoff and flow above Pak Beng dam site shall improve
the potential of hydroelectric generation, and the annual runoff shall increase by about 23%
according to relevant prediction. The storage and adjustment function of the upstream cascade
power stations in the drainage basin of Lancang River shall cut the differences between flood
seasons and dry seasons resulted from climatic changes in Pak Beng dam site.
Meanwhile, the occurrence rate of extreme events resulted from climate change shall increase,
and the hydropower project shall also face with the increasingly complicated and serious risks.
Due to the influences of climate change, the occurrence rate of extreme events (such as
Engineering-Status-Report
4-49
10,000-year return period flood) shall increase during the project's lifetime of 100 years. The
increased river discharge caused by climatic changes and the polarization between rainy
seasons and dry seasons shall both change the occurrence rate of extreme events, during the
project's lifetime of 100 years:
For the dams designed in line with the standard of 10,000-year return period floods, the
occurrence probability of these events shall increase from 1% to 10% during the designed
lifetime.
For the dams designed in line with the standard of 1000-year return period floods, the
occurrence probability of these events shall increase from 10% to 63% during the
designed lifetime.
Due to the climatic changes, each dam shall almost certainly meet a 100-year return
period flood.
Climate change will result in the increase of the occurrence rate of extreme events, which
shall increase the accidental risks of the dam and its key hydraulic structures.
4.8 SUMMARY OF EFFECTS OF PAK BENG ON MEKONG RIVER HYDRAULIC
According to the operating mode of formulated, in operation process of Pak Beng HPP, in
order to avoid submerging impact on upstream reservoir tail Keng Pha Dai district, reservoir
water level shall run as per 335m in the case of that reservoir inflow is lower than 2,200m3/s,
which is able to maintain the boundary function of this district. In the case of that the
reservoir inflow has exceeded 2,200m3 and increased gradually, even if reservoir water level
runs maintaining 335m, reefs in Zone D also will be gradually submerged, and the function of
Keng Pha Dai as Laos- Thailand boundary is losing gradually in the case of that the reservoir
inflow reaches 3,000 m3/s, and in the case of that the water level nearby reefs in Zone D is
338m, the function is basically lost. Therefore, from the point of view of preserving the
function of Keng Pha Dai District, combined with the reservoir inflow of Pak Beng HPP, the
reservoir water level shall run as per 335m in the case of that the reservoir inflow of Pak Beng
HPP is not higher than 2,200m3/s; When the reservoir inflow has exceeded 2,200m3/s, the
reservoir water level rises gradually, and in the case of that the inflow increases to 3,000 m3/s,
the reservoir water level rises to 340m to run. The operation mode will not cause any impact
on boundary function of reservoir tail Keng Pha Dai District. In order to minimize the
sediment deposition in reservoir area and reduce the impact of reservoir backwater, in the case
of that the reservoir inflow has exceeded 10,000 m3/s, reservoir water level starts to drop from
340m gradually, and in the case of flood peak discharge 14,600m3/s of 5-year return period
flood, gates of flood discharge facilities are opened fully for "open discharge" operation. The
daily range of the reservoir water level of about 1m will not impact basically the stability of
upstream reservoir bank slope.
Because operating as per the run-of-river power station, Pak Beng HPP will not change the
intra-annual /intra-daily distribution of reservoir inflow, so the reservoir outflow is the

Engineering-Status-Report
4-50
reservoir inflow. Meanwhile, in the reservoir operation process, requirements on the stability
of downstream reservoir bank slope has been fully considered in the change of reservoir water
level, therefore, the Pak Beng HPP will not change hydrological conditions of lower reach,
and not impact the stability of reservoir bank slope of lower reach after putting into operation.
Pak Beng HPP is located in the north plateau area of Lower Mekong, because of high gradient,
river flows fast in natural conditions. From the analysis of daily flow data at ChiangSaen
hydrological station and Luangprabang hydrological station, transmission time from
ChiangSaen to Luangprabang is about two days, average velocity is 2m/s. Discharge at Pak
Beng ranges from 793m3/s to 7,290m3/s based on the measured results at Pak Beng
hydrological Station, average velocity ranges from 1.19m/s to 1.79m/s. Velocity will increase
with increasing discharge, so, flood transmission time in flood season is shorter than that in
dry season. Reservoir water level will rise after Pak Beng HPP come into use, according to
the operation model for Pak Beng HPP, velocity in the reservoirarea will slow down when
small inflow in dry season. As water depth in the reservoir area is bigger than that in natural
conditions, if once-in-5-years flood happen, wave profile will change significantly, velocity is
bigger than that in natural conditions. The sluice gate will open absolutely when flood with
return period over 5 years, water level in the reservoir is similar to that in natural conditions,
and velocity differs little from that in natural conditions.
4.9 PLANNING FOR AUTOMATIC SYSTEM OF HYDROLOGIC DATA
COLLECTION AND TRANSMISSION
4.9.1 Necessity of the System construction
The Automatic System of Hydrologic Data Collection and Transmission(ASHDCT) is a
technical support system to collect and process information of water regime and rain regime
in real-time with telemetering, communication and computer techniques and conduct
hydrological information forecast in order to achieve the optimized dispatching of flood
control, power generation and water supply of water resources and hydropower projects,
giving full play to the project benefit.
The necessity of the system construction is mainly reflected in the following aspects:
(1) Ensure construction safety of the project and collect hydrologic data
The Pak Beng HPP is the first cascade of Mekong River cascade development, of
which the construction period is up to 6 years, with a long period. The dam site is
about 631km from the Nuozhadu HPP at upstream of Lancang River with multi-year
regulation performance, with an interval area of about 73,300km2; about 453km from
Guanlei HS, Lancang River boundary control station of China, with an interval area
of about 55,000km2; the interval area is very large and the rainfall is very abundant,
and the flood formed has a great magnitude and a long lasting time, with great impact
on safety spending flood in construction period. To establish the ASHDCT of Pak
Beng HPP and conduct flood forecasting in construction period can master fully and
Engineering-Status-Report
4-51
timely rain regime, river regime and flood development trend of the river basin above
the construction area, to provide the basis helpful for correct decision-making for
construction and management, being an important means to ensure safety
construction, and is the construction safety and safety spending flood and guarantee
the duration.
(2) Ensure safety operation of the project and enhance flood control capability of the
hydropower project
Since the flood magnitude of Mekong River mainstream is very great, to construct
ASHDCT of Pak Beng HPP for operation period can obtain very accurate
hydrological information through hydrological regimen monitoring and forecasting,
to arrange real-time and reasonable flood control dispatching measures, enhance
flood control capacity of the hydropower project and reduce upstream submergence
loss, ensuring safety operation of the hydropower project.
(3) Monitor backwater and reduce impact on national boundary
The backwater of Pak Beng HPP is very long and involves sensitive international
issues, and the water level change is quite sensitive to submerging range of the
reservoir area. To construct ASHDCT for operation period can monitor conditions of
real-time upstream inflow and backwater of reservoir tailrace, to reduce the
backwater impact on the national boundary.
In addition, current acquisition, receiving, processing of hydrological data and
hydrological forecasting system and corresponding computer software technology are
very mature, applied widely in many domestic and overseas large and medium-sized
HPP and water resources systems and obtained good economic and social benefits.
In summary, it is very necessary and feasible to establish of the ASHDCT for construction and
operation periods of Pak Beng HPP.
4.9.2 Condition of the existing station networks
In order to grasp the water regime of each control cross interval in Mekong River, the
Secretariat of the MRC has set a forecasting station network covering 23 hydrological
stations in Mekong River to monitor the river level and forecast the flood, which can forecast
the water level of each station in the next five days, the flow in the coming five days shall be
calculated by checking the stage-discharge relationship between each hydrological station, the
forecast result shall be published on the website of the Secretariat of the MRC and updated
daily. Of all forecasting station networks, only Qingsheng Gauging Station is located in the
upstream of Pak Beng dam site, the area between Qingsheng Water Level Station and Pak
Beng dam site is 29,000km2, so only one hydrological station site is far from meeting the
requirements of water regime telemetry during construction period and operation period of
Pak Beng dam site.
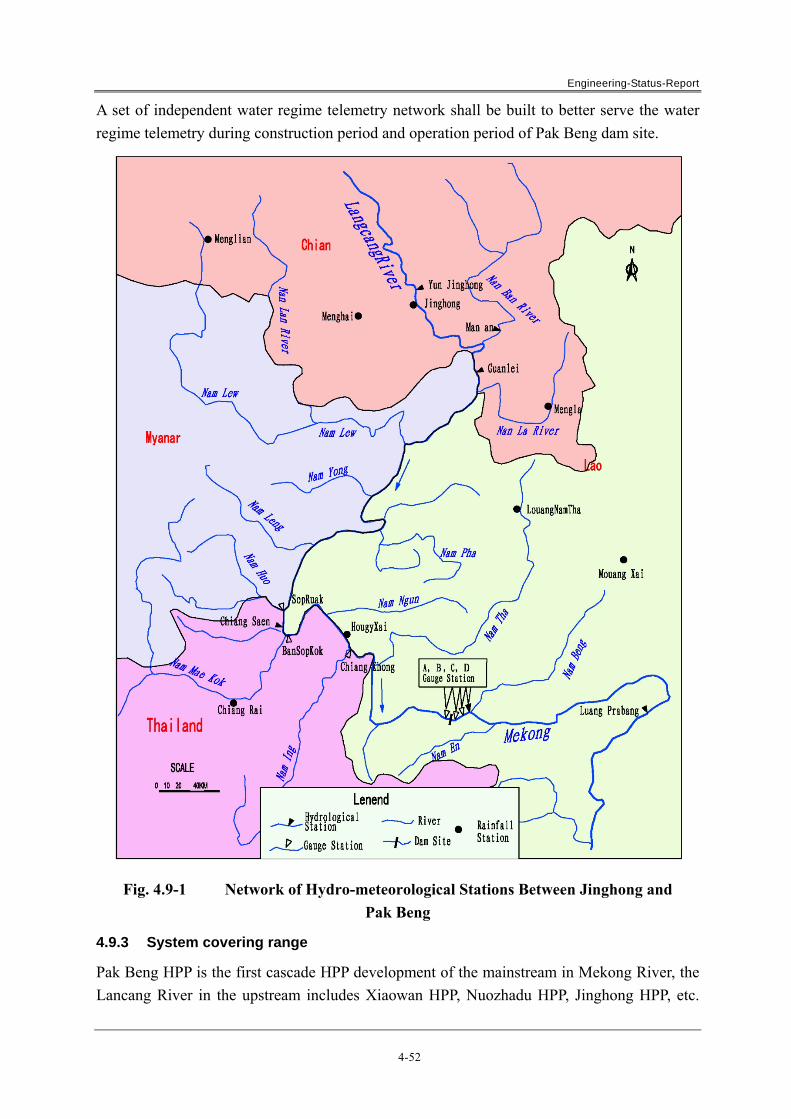
Engineering-Status-Report
4-52
A set of independent water regime telemetry network shall be built to better serve the water
regime telemetry during construction period and operation period of Pak Beng dam site.
Fig. 4.9-1 Network of Hydro-meteorological Stations Between Jinghong and
Pak Beng
4.9.3 System covering range
Pak Beng HPP is the first cascade HPP development of the mainstream in Mekong River, the
Lancang River in the upstream includes Xiaowan HPP, Nuozhadu HPP, Jinghong HPP, etc.

Engineering-Status-Report
4-53
The cascade power stations in Lancang River basin have built a completed hydrologic data
acquisition and transmission system. Main hydrological station sites above Pak Beng dam site
includes Jinghong, Guanlei, Chiang Saen, Sop Kok, Chiang Khong, etc., of which, the
Guanlei HS is the exit control station both for Lancang River and the cascade power stations
in Lancang River. As an boundary control station in the Lancang River, Guanlei HS has
controlled 95% of the basin area of Pak Beng dam site and 67% of the inflow, the forecast
lead time is 45h; Chiang Saen HS is an important hydrological station of the mainstream of
Mekong River with a controlled drainage area of 86.7% of the Pak Beng dam site, a
controlled inflow of 85.4% of the Pak Beng dam site, and a forecast lead time of 18h. The
forecast range during construction period of Pak Beng dam site is planned to be set between
Guanlei HS and Pak Beng dam site interval according to the characteristics of runoff and
flood above Pak Beng dam site as well as the characteristics of hydrological station site and
engineering, etc. The area is 55,000 km2 with a large amount of rainfall in this drainage basin
and more extending branches, of which the larger branches are Namlwe River (Myanmar),
Nam IngRiver (Thailand), Nam Ngao River (Thailand) and Nam Tha River (Laos), Nam
NgumRiver (Laos).
4.9.4 Forecasting scheme and Station network layout
Since the hydrological station in the upstream has controlled most of the drainage areas above
Pak Beng dam site, and the Mekong River which was once the boundary river between
Myanmar - Laos and Thailand - Laos runs across most of the sparsely populated and thickly
forested mountains, the traffic is very inconvenient, the construction and operation
maintenance of the precipitation is difficult which also involves complex international
problems, besides, Myanmar and Thailand at the right bank are located in the semi-humid and
semi-arid region of the Mekong River basin with a relatively flat terrain and a lower interval
runoff, but the left bank is located in Laos which is near to the rainstorm center in Mekong
River basin with a bigger interval runoff, so the water regime forecasting scheme and station
network layout planning shall be in accordance with the following basic principles:
Meet the requirements of engineering construction;
The river system forecast shall be mainly adopted for forecasting scheme, while the rainfall
runoff forecasting scheme shall be adopted for larger branches.
The hydrological station sites shall be located within Laos as possible for the convenience
of management and maintenance.
(1) Forecasting scheme
a Overall configuration of forecasting scheme
According to requirements of Pak Beng HPP in different construction period, the
ASHDCT of Pak Beng HPP is divided into construction period ASHDCT and
operation period ASHDCT, of which stations and sites shall be updated or
Engineering-Status-Report
4-54
supplemented for the station network arrangement of operation period ASHDCT
based on the station network arrangement of construction period; and scheme
configuration of operation period forecast shall be based on the forecast scheme of
construction period and model parameters shall be calibrated and corrected according
to data accumulation in construction period.
Considered synthetically engineering location of the HPP, characteristics of rainfall
runoff of the drainage basin and distribution characteristics of precipitation stations
and hydrological stations in the drainage basin, the ASHDCT of Pak Beng HPP is
proposed preliminarily to be composed of the river system forecasting based on
hydrological stations in Lancang - Mekong River mainstream and rainfall runoff
forecasting based on interval precipitation stations.
River system forecasting: River system forecasting is a forecasting method to
forecast water level and discharge of downstream cross section according to ones of
upstream section, used mostly in the drainage basin with larger catchment area. River
system forecasting mainly includes corresponding water level (discharge)
forecasting, combined discharge forecast method and flow algorithms method.
Corresponding water level (discharge) forecasting is mainly applicable to the
tributary-free river reach or the reach with tributaries with small water volume, and
combined discharge forecast method and flow algorithms method are mainly
applicable to the reach with tributaries with great inflow. The parameter calibration
shall be calculated according to the historical materials of hydrological station in
Lancang River-Mekong River (such as Yunjinghong, Chiang Saen, Ban Sop Kok, Pak
Beng) in the early operation period of this system,
Rainfall runoff forecasting: Forecasting runoff processes of the river course and
reservoir station according to the rainfall in the drainage basin, the rainfall runoff
forecasting is mainly used to control the flood forecasting in the hydrological station
interval. Based on the existing experience and cases of KHIDI, the P-Pa-R
forecasting scheme of rainfall runoff (rainfall runoff production forecasting and
conflux forecasting) and Xin'anjiang model shall be adopted for the forecast. The
above two forecasting schemes have been successfully carried out in the similar river
basins in Nam Ou River.
b Forecasting scheme of the ASHDCT during construction period
Hydrological forecasting objects of Pak Beng HPP during construction period are water
level and discharge of inlet and the outlet of diversion tunnel, to meet the demand of
forecasting, dispatching and decision-making for construction flood control; for flood
forecasting, the effective forecast period shall be increased as far as possible to achieve
the initiative for flood control work; and forecasting results shall be inspected compared
Engineering-Status-Report
4-55
to measured data, to perfect continuously in implementation process, improving forecast
accuracy.
According to arrangement of station network in Lancang -Mekong River Basin, different
hydrological stations are taken as the forecasting inflow control stations, which can
provide discharge forecasting in flood and dry seasons with different forecast periods for
Pak Beng HPP.
Discharge forecasting scheme with a forecast period of about 45h
Taking Guanlei Station as the forecasting inflow control station, the forecast period for
this forecast is about 45h; the forecast period of this forecasting scheme is very long, and
forecast results can be corrected through hydrologic (gauging) stations established in the
middle of the reach level by level, to improve the forecasting accuracy.
Catchment area of Guanlei Hydrological Station is 163,000km2, accounting for 74.8% of
the basin area (F=218,000km2) controlled by the dam site, and average annual discharge
accounts for 67.4%; Guanlei Hydrological Station is taken as the forecasting inflow
control station and Pak Beng Hydrological Station as the outflow control station, and the
river system forecasting scheme is used to forecast the discharge of Pak Beng dam site.
The forecasting relation is: Q Pak Beng t+τ =f (Q Guanlei t)
Where: Q Pak Beng t+τ —Pak Beng t+τ + time discharge, m3/s;
Q Guanlei t —Guanlei Station t discharge value, m3/s;
τ— Flood propagation time, h.
For this system, tour gauging stations including Ban Xieng Kok Gauging Station, Ban
Don Station (the opposite bank of Chiang Saen Hydrological Station, at Laos side) and
Houei Sai Station (the opposite bank of Chiang Khong Gauging Station, at Laos side) are
proposed to construct in the interval between Guanlei Station and Pak Beng dam site,
and these stations can be used to correct forecasting results level by level, to achieve the
goal of improving the accuracy of dam site discharge forecasting.
Discharge forecasting scheme with a forecast period of about 18h-12h
Water level and discharge at Pak Beng dam site are forecast with the discharge of Houei
Sai plus discharged flows of dam sites of Cascade I HPP of Mae Nam Kok River, Mae
Nam Yam River, Nam Ngam River and Nam Tha River, forecast periods of this forecast
scheme are respectively 18h and 12h, the accuracy of this forecast scheme is relatively
high. For Mae Nam Yam River, Mae Nam Kok River, Nam Ngam River Ngam and Nam
Tha River and Nam Ngam River Basin, the discharge of own tributary is forecast with
rainfall runoff, combined with mainstream forecast results, to forecast discharge and
water level of design section.
The forecasting relation is:
Engineering-Status-Report
4-56
Q PBt+τ = f (Q hs, t) + f (Q NN, t1, Q MNK, t2, Q MNY,t3 , Q Nt,t4) + f (P zone, E zone,...)
Where: Q PB,t+τ —Pak Beng t+τ + time discharge, m3/s;
Q hs, t —t time discharge value of Ban Don Station or Houei Sai Station, m3/s;
QXX tn — Discharge of XX River when combining discharge with mainstream
at t time, m3/s;
P Zone —Interval precipitation, mm;
E Zone —Evaporation of uncontrolled interval, mm;
τ— Flood propagation time, h.
According to the experience of KHIDI and hydropower construction units of China,
when over-level flood occurs, a 2h forecast period can meet the need of safe
evacuation of personnel, 6-hour one can meet the need of safe evacuation of
important machinery and equipment and 12-hour one can meet the need of
transferring important construction material, so forecast periods of both two schemes
mentioned above can meet evacuation and transfer of personnel, important machinery
and equipment and construction materials when over-level flood occurs.
The forecast range of ASHDCT of middle /downstream of Lancang River is the
interval between Changdu and Jinghong, if necessary, the discharge of Guanlei
Station or Yunjinghong Station in Lancang River ASHDCT can access the ASHDCT
of Pak Beng HPP to lengthen the forecast period further.
Because the flood in Mekong River is huge, and also in the dry season, in order to
guarantee the safety in the construction period, some safety measures should be done
before the construction:
Establish the automatic hydrological system and forecasting the discharge at certain
section as early as possible, which can collected real time data to calibrate the
parameters of the model.
Establish good communication and coordination mechanism with the Lancang River
Hydropower Development Co., Ltd, which can obtain the hydrology regime and
operation regulation of the upstream HPP.
Some planning should be made to deal with the flood above the standards, which can
guarantee the important equipment and building avoiding destroying.
c Forecasting scheme of ASHDCT during operation period
The reservoir tail area of Pak Beng HPP involves very sensitive objects, in order to
reduce the backwater impact of Pak Beng HPP on Keng Pha Dai, real-time monitoring
of tailrace of reservoir tail is required; meanwhile, according to the operation
dispatching and analysis on the impact on downstream, the dam front water level and

Engineering-Status-Report
4-57
dam downstream water level are required to forecast.
For operation of Pak Beng HPP, main forecast is the level of reservoir tail Keng Pha
Dai, reservoir inflow, dam front water level, and monitoring of approach channel level
and water level under the dam. The flood propagation time is shortened because the
characteristics of channel in reservoir area of the HPP have some change when Pak
Beng HPP is operating. However, Pak Beng HPP is a river course type reservoir,
reservoir will not bring great change to runoff producing and concentration conditions
of drainage basin after storing water, the forecast scheme for construction period can be
used basically, but considering the forecast period of ASHDCT in operation period is
shorter than that in construction period, the HPP operation dispatching demand and
requirements to provide hydrological information for downstream, it is required to
conduct parameters correction of forecast scheme according to data of operation period
to improve forecast accuracy, and the forecast scheme of operation period shall be
reprepared if necessary.
(3) Layout of station networks
The layout of station networks shall comply with the following principles:
a Use the existing station sites as much as possible to ensure the continuity of water
regimen, rain regimen and reduce investment;
b The stations layout shall be converted into permanent water regime telemetry sites in
operation period;
c The designed station networks shall basically meet the requirements of the forecasting
scheme and accuracy;
d The layout of station networks shall basically control the water regime changes in certain
areas.
e The layout of station networks shall also take the convenience of civil construction and
operation maintenance and other factors into consideration.
Based on the above principles and in line with the requirements of forecasting scheme,
the station networks layout of the water regime telemetry during construction period
and operation period is shown in Table 4.9-1.
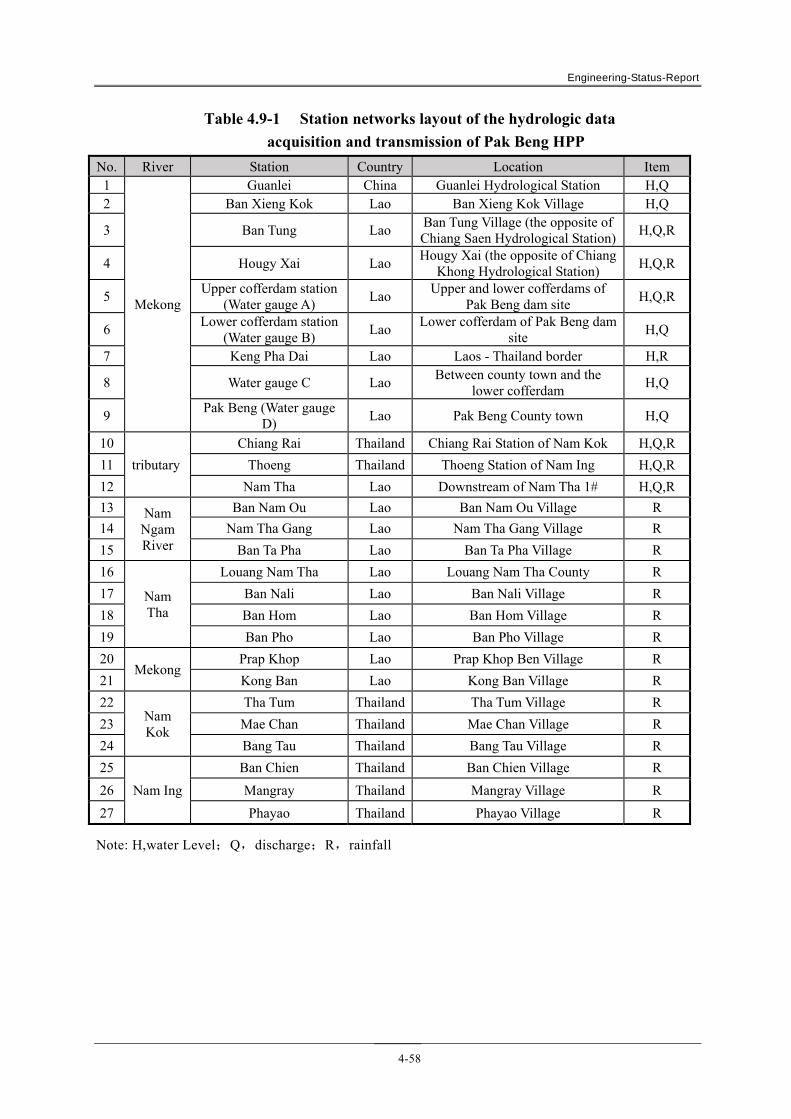
Engineering-Status-Report
4-58
Table 4.9-1 Station networks layout of the hydrologic data
acquisition and transmission of Pak Beng HPP
No. River Station Country Location Item 1
Mekong
Guanlei China Guanlei Hydrological Station H,Q 2 Ban Xieng Kok Lao Ban Xieng Kok Village H,Q
3 Ban Tung Lao Ban Tung Village (the opposite of Chiang Saen Hydrological Station)
H,Q,R
4 Hougy Xai Lao Hougy Xai (the opposite of Chiang
Khong Hydrological Station) H,Q,R
5 Upper cofferdam station
(Water gauge A) Lao
Upper and lower cofferdams of Pak Beng dam site
H,Q,R
6 Lower cofferdam station
(Water gauge B) Lao
Lower cofferdam of Pak Beng dam site
H,Q
7 Keng Pha Dai Lao Laos - Thailand border H,R
8 Water gauge C Lao Between county town and the
lower cofferdam H,Q
9 Pak Beng (Water gauge
D) Lao Pak Beng County town H,Q
10
tributary
Chiang Rai Thailand Chiang Rai Station of Nam Kok H,Q,R
11 Thoeng Thailand Thoeng Station of Nam Ing H,Q,R
12 Nam Tha Lao Downstream of Nam Tha 1# H,Q,R
13 Nam Ngam River
Ban Nam Ou Lao Ban Nam Ou Village R
14 Nam Tha Gang Lao Nam Tha Gang Village R
15 Ban Ta Pha Lao Ban Ta Pha Village R
16
Nam Tha
Louang Nam Tha Lao Louang Nam Tha County R
17 Ban Nali Lao Ban Nali Village R
18 Ban Hom Lao Ban Hom Village R
19 Ban Pho Lao Ban Pho Village R
20 Mekong
Prap Khop Lao Prap Khop Ben Village R
21 Kong Ban Lao Kong Ban Village R
22 Nam Kok
Tha Tum Thailand Tha Tum Village R
23 Mae Chan Thailand Mae Chan Village R
24 Bang Tau Thailand Bang Tau Village R
25
Nam Ing
Ban Chien Thailand Ban Chien Village R
26 Mangray Thailand Mangray Village R
27 Phayao Thailand Phayao Village R
Note: H,water Level;Q,discharge;R,rainfall

Engineering-Status-Report
4-59
Fig. 4.9-2 The Network of the Stations of Pak Beng HPP ASHDCT
Among stations above, the Guanlei HS, Ban Xieng Kok HS, Ban Don HS, Houei Sai HS and
Pak Beng HS forecast mainly the water level and discharge of mainstream; in the river system
forecasting scheme, the Guanlei HS acts as the inflow control station, the water level and
discharge of Pak Beng HS (4 groups of water gauges) are forecast objects, and forecasting
results are conducted real-time correction with measured the discharge of rest stations. As
Engineering-Status-Report
4-60
tributary forecast stations, Chiang Rai HS, Thoeng HS and Nam Tha HS forecast mainly the
discharge of Nam Ing, Nam Kok and Nam Tha. Precipitation stations in each tributary are
mainly used for monitoring precipitation of tributaries; the precipitation runoff forecast model
is used to forecast discharge of the tributary, where there is no hydrological station arranged in
the Nam Ngam River, so parameters of Nam Tha River forecast model can be used as
parameters of rainfall runoff model of this drainage basin.
According to forecast demand, discharge measurement is required to conduct at Ban Xieng
Kok HS, Chiang Rai HS, Thoeng HS, Ban Tung HS, Hougy Xai HS, Nam Tha HS and Water
Gauge D to calibrate stage-discharge relation, forecasting the discharge of design section.
Among stations above, the Guanlei HS, Chiang Rai HS and Thoeng HS are existing ones,
needing to improve or increase equipment; there have been four groups of water gauges as
existing sites, being able to directly incorporate into this system; and the rest of stations and
sites are currently considered as ones established newly.
For stations and sites above, in additioin to that the upper cofferdam station has no function
due to water storage in operation period, basically, all the rest can be used continuously in
operation period, of which the lower cofferdam station can act as an outlet one flowing out of
the reservoir, and water gauge C and D can be used to monitor water level amplitude at the
downstream gauging station in operation period; according to demand, on the basis of stations
and sites above during operation period, gauging stations on the dam and at the entrance and
exit of the approach channel are also required to construct to monitor the water level at the
dam and approach channel.
The rainfall runoff forecast model in this design is mainly used in the interval between Chiang
Saen and Pak Beng, with an interval area of 29,000 km2; considered the sparsely populated
interval with inconvenient traffic, there are only 22 precipitation stations arranged in this
system (including hydrological station, measuring precipitation concurrently), with a low
density of stations and sites, average 1,318km2/station. In late stage, stations and sites can
supplemented appropriately if needed to meet the demand of forecasting.
4.9.5 Primary selection of the communication mode and work system
Main communication modes adopted in the ASHDCT are: Shortwave, ultrashort wave,
satellite communication, wire communications and digital mobile communication, etc., of
which the mobile communication (GSM and GPRS communication) and satellite
communication are generally adopted in domestic. In accordance with the physical
geographical conditions in the basin of this system and refer to the practical experience of the
existing water regime automatic telemetry systems in the Lancang River and Jinsha River as
well as the development trend of the present communication and network technology,
meanwhile, consider the convenience of the system's operation, management, maintenance
after its completion and ensure the smoothness, validity and reliability of the system
Engineering-Status-Report
4-61
information to satisfy the requirements of forecasting and regulation system in regard to
information transmission during the HPP's construction and operation period. The hybrid
networking mode of GSM short message and satellite communication shall be adopted for this
station's telemetry system.
The self-reporting work system is adopted for GSM short message communications and
satellite communications.
4.9.6 Investment estimation
(1) Compiling instructions
The budget estimate project of telemetry system includes civil engineering fee,
equipment purchasing and installation fee, development fee of forecast software and
other fees.
The price of hardware and software equipment mainly considers the quotation from
research & development unit, including freight and miscellaneous charges and fees for
installation, commissioning and pilot run, and it is determined by also referring to the
tender offers of tender of hydrological information automatic telemetry system of
relevant HPP. The water gauge shall adopt the bubble type water gage, and other main
equipment shall adopts those produced in China;
The investment of civil engineering shall be calculated by referring to the similar
engineerings recently;
Since the equipment of hydrological information automatic telemetry system has unique
characteristics, so calculate related costs according to actual situation;
The construction expense estimate is only limited to the price level in the first quarter of
2015.
(2) Investment estimation
The total investment for construction of hydrological information telemetry system of
Pak Beng HPP is $1,267,680.6, including $648,462.1 for equipment and installation,
$205,161.3 for civil engineering fee and $298,813.5 for other items (mainly including
design fee, construction and management fee, supervision fee, staff training cost and
site service expense, etc.), the basic reserve fund is$115,243.7, and the operating cost
during operation period is $590,662.3 per year. The construction budget estimate of
hydrologic data collection and transmission system of Pak Beng HPP is shown in Table
4.9-2.
It's important to note that the survey station of the project is located in Laos and
Thailand, partial areas have relatively difficult conditions, insufficient building
materials and inconvenient transportation, the investment of the hydrological
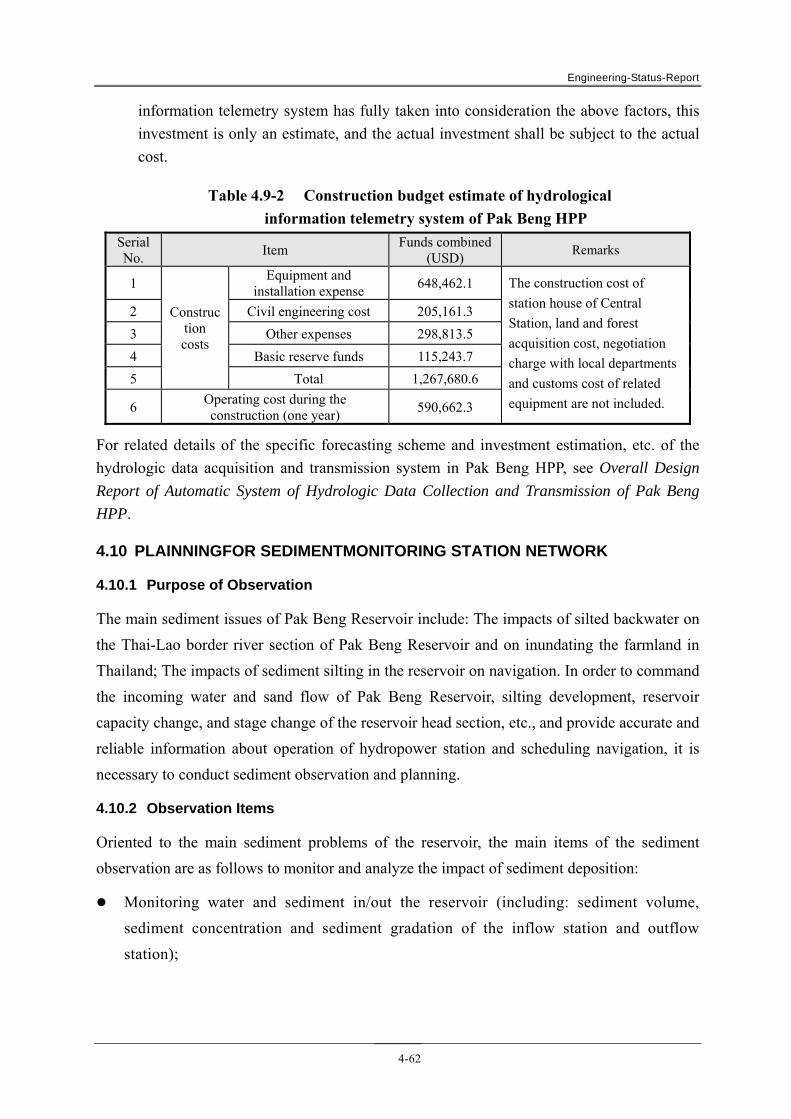
Engineering-Status-Report
4-62
information telemetry system has fully taken into consideration the above factors, this
investment is only an estimate, and the actual investment shall be subject to the actual
cost.
Table 4.9-2 Construction budget estimate of hydrological
information telemetry system of Pak Beng HPP
Serial No.
Item Funds combined
(USD) Remarks
1
Construction costs
Equipment and installation expense
648,462.1 The construction cost of
station house of Central
Station, land and forest
acquisition cost, negotiation
charge with local departments
and customs cost of related
equipment are not included.
2 Civil engineering cost 205,161.3
3 Other expenses 298,813.5
4 Basic reserve funds 115,243.7
5 Total 1,267,680.6
6 Operating cost during the construction (one year)
590,662.3
For related details of the specific forecasting scheme and investment estimation, etc. of the
hydrologic data acquisition and transmission system in Pak Beng HPP, see Overall Design
Report of Automatic System of Hydrologic Data Collection and Transmission of Pak Beng
HPP.
4.10 PLAINNINGFOR SEDIMENTMONITORING STATION NETWORK
4.10.1 Purpose of Observation
The main sediment issues of Pak Beng Reservoir include: The impacts of silted backwater on
the Thai-Lao border river section of Pak Beng Reservoir and on inundating the farmland in
Thailand; The impacts of sediment silting in the reservoir on navigation. In order to command
the incoming water and sand flow of Pak Beng Reservoir, silting development, reservoir
capacity change, and stage change of the reservoir head section, etc., and provide accurate and
reliable information about operation of hydropower station and scheduling navigation, it is
necessary to conduct sediment observation and planning.
4.10.2 Observation Items
Oriented to the main sediment problems of the reservoir, the main items of the sediment
observation are as follows to monitor and analyze the impact of sediment deposition:
Monitoring water and sediment in/out the reservoir (including: sediment volume,
sediment concentration and sediment gradation of the inflow station and outflow
station);
Engineering-Status-Report
4-63
Monitoring of water surface line in front of the dam and at the tail section of the
reservoir;
Monitoring of sediment deposition in the reservoir area;
Monitoring of sediment deposition in the project area;
Monitoring of downstream river course;
Monitoring of bank deformation in the reservoir area.
4.10.3 Main Observation Results
The observation data shall be summarized and compiled according to relevant specifications.
The main results shall include:
The loss of total reservoir capacity and regulating reservoir capacity, and the corrected
reservoir capacity curve.
Water surface profile of the reservoir area;
Distribution of sediment silting;
Incoming sediment results and trends of change of the station at the entrance of
reservoir on the mainstream;
Volume, content and grading of sediment of the station on the outlet of the reservoir.
4.10.4 Estimated Cost
The total expense for sediment observation will be $523,511. To be specific, the cost of
sediment observation equipment and installation for the hydrological station will be $129,032,
and the survey cost will be $260,332 one time (with the exception of the coast of Traverse
Network of Bench Mark$102,500). Based on the water regimen reporting system, the
estimated sediment observation cost may be referred to Table 4.10-1.
The detailed design of sediment monitoring program include in The overall design report of
sediment monitoring.

Engineering-Status-Report
4-64
Table 4.10-1 Estimated Construction Cost of Sediment Monitoring
Station Network
No. Items Unit Quantity
Unit Price TotalNote
(USD) (USD)
(1) Construction Engineering 76,770
1 New Stage Gauging station before the dam Nr. 1
The costs are included in the flood regimen reporting budget
2 Stage Gauging Station
at the Reservoir Head Nr. 5 9,836 49,180
3 Central Station Nr. 1
The costs are included in
the flood regimen
reporting budget
4
Endpoint Stake Nr. 180 98 17,705 Including precasting,
transportation,
construction embedded
costs and the construction
cost after impoundment of
reservoir.
Notice board Nr. 90 82 7,377
Administrative expense % 10 2,508
(2) Equipment and Installation Works 129,032
5
Sediment Observation
and Analytical
Instruments and
Installation, etc.
Nr. 2 64,516 129,032 For the Inlet and Outlet
Station
(3) Survey 260,332
6 Traverse Network of
Bench Mark km 125 820 102,500 Class IV
7
Cross Section
Measurement in the
Reservoir Area
Times 1 65,574 65,574
It is to measure the entire
reservoir once before
impounding the reservoir.
8 Survey of Hub area Times 1 32,258 32,258 It is to measure Water
inlet and ship channel
9 Purchase and Analysis
of satellite imagery km2 200 300 60,000
include satellite imagery
purchase and analysis
(4) Miscellaneous Expenses 57,377
10 Investigation/Survey
and Design Cost 24,590
11 Technical Consultation
and Personnel Training 16,393
12 Contingency cost 8,197
13 Information Cost of
Chiang Saen Station 8,197 Estimated
Total 523,511

Engineering-Status-Report
5-1
5 PROJECT PLANNING
5.1 INTRODUCTION
Pak Beng HPP is the first cascade HPP on the mainstream of Mekong River. The
development tasks of the cascades are power generation, navigation, and provide convenience
to improve the navigation in the future.
Pak Beng HPP is operated as run-of-river power station, so the outflow is equal to the inflow.
The normal water level of Pak Beng HPP is 340m, and the installed capacity is 912MW. The
annual average energy is 4,765GW·h while the annual utilization hours are 5,225h.
5.2 PROJECT DEVELOPMENT TASK
According to the development guidelines of Mekong River and in integration with analysis of
specific situations of Pak Beng HPP, the development task is stated as follows.
5.2.1 Power Generation
After the completion of Pak Beng HPP, its electricity can be exported to Thailand to gain
foreign exchange (the straight-line distance to the border between Laos and Thailand is 20km
only) except to satisfy the electricity demand of neighboring regions. The project construction
can also promote the economic development of the project area.
5.2.2 Navigation
Mekong River is an important international river in Southeast Asia. At present, economic
cooperation among GMS countries is progressing in a stable manner, and Convention for
Navigation of Mercantile Ship on Lancang River-Mekong and Guidelines for Maintenance
and Improvement of Navigation Channel of Lancang River-Mekong were signed in April 2004
among China, Laos, Myanmar and Thailand to promote and guarantee the development of
navigation on the river.
In accordance with the General Planning for Waterway Development of Nine Northern
Provinces in Laos, in combination with demand for transportation development, navigation
channel conditions and construction conditions, the navigation channel is planned as follows:
(1) From 2008 to 2010, the 600.5km long navigation channel from the No.244 border
marker to Luang Prabang shall be improved, and the 475.6km long navigation channel
from Luang Prabang to Vientiane. The whole treatment work shall be aimed at
navigation of 300t ships.
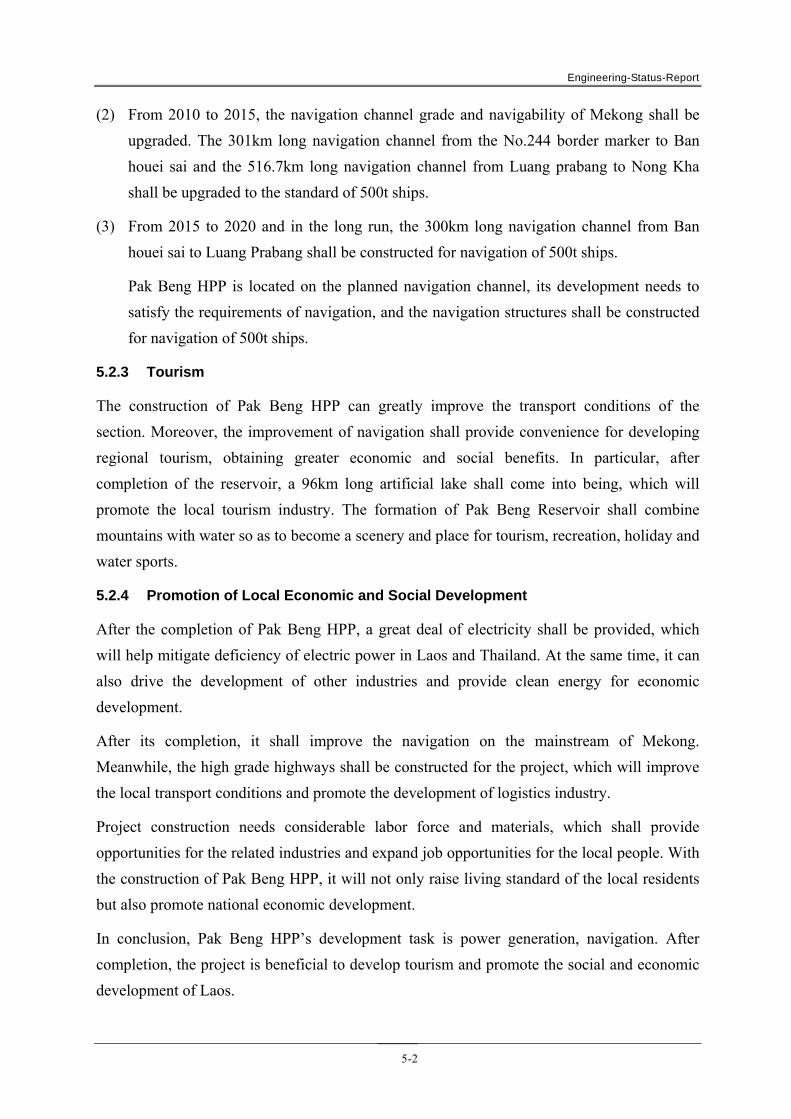
Engineering-Status-Report
5-2
(2) From 2010 to 2015, the navigation channel grade and navigability of Mekong shall be
upgraded. The 301km long navigation channel from the No.244 border marker to Ban
houei sai and the 516.7km long navigation channel from Luang prabang to Nong Kha
shall be upgraded to the standard of 500t ships.
(3) From 2015 to 2020 and in the long run, the 300km long navigation channel from Ban
houei sai to Luang Prabang shall be constructed for navigation of 500t ships.
Pak Beng HPP is located on the planned navigation channel, its development needs to
satisfy the requirements of navigation, and the navigation structures shall be constructed
for navigation of 500t ships.
5.2.3 Tourism
The construction of Pak Beng HPP can greatly improve the transport conditions of the
section. Moreover, the improvement of navigation shall provide convenience for developing
regional tourism, obtaining greater economic and social benefits. In particular, after
completion of the reservoir, a 96km long artificial lake shall come into being, which will
promote the local tourism industry. The formation of Pak Beng Reservoir shall combine
mountains with water so as to become a scenery and place for tourism, recreation, holiday and
water sports.
5.2.4 Promotion of Local Economic and Social Development
After the completion of Pak Beng HPP, a great deal of electricity shall be provided, which
will help mitigate deficiency of electric power in Laos and Thailand. At the same time, it can
also drive the development of other industries and provide clean energy for economic
development.
After its completion, it shall improve the navigation on the mainstream of Mekong.
Meanwhile, the high grade highways shall be constructed for the project, which will improve
the local transport conditions and promote the development of logistics industry.
Project construction needs considerable labor force and materials, which shall provide
opportunities for the related industries and expand job opportunities for the local people. With
the construction of Pak Beng HPP, it will not only raise living standard of the local residents
but also promote national economic development.
In conclusion, Pak Beng HPP’s development task is power generation, navigation. After
completion, the project is beneficial to develop tourism and promote the social and economic
development of Laos.

Engineering-Status-Report
5-3
5.3 NAVIGATION SCALE
At present, economic cooperation among GMS countries is stably developing and
progressing. Convention for Navigation of Mercantile Ship on Lancang River - Mekong and
Guidelines for Maintenance and Improvement of Navigation channel of Lancang River -
Mekong were signed in April 2004 among China, Laos, Myanmar and Thailand to promote
and guarantee the development of navigation on the River. Starting from June 26, 2001,
Lancang - Mekong River was officially open to mercantile ships of the four countries.
5.3.1 Current Status of Navigation Channel
Mekong River originates from China, and flows out of China at Nanla River estuary into Laos
on the left bank and Myanmar on the right bank. Its border section between Laos and
Thailand is located at 28km downstream of Ban houei sai, the capital of Bokeo in Laos,
Thailand is on the right bank; after Mekong completely flows into Laos, its right bank is
Sayaburi while the left bank is Luang Prabang, and Mekong River becomes again the border
between Laos and Thailand at estuary of Nam hiang River; subsequently it flows into
Cambodia near Khone Falls.
The 242km long navigation channel of Mekong from Nanla River estuary to Dong Peng in
Nam Tha and Bokeo was improved jointly by the four countries under financial support of
China between 2002 and 2004, so that the navigation channel can be open to 150t ships all the
year round and 200t ships or above in seasonal manner; The 358km long navigation channel
from Dong Peng to Luang Prabang and the 150km long navigation channel from Luang
Prabang to Ban Nasa in Xayaburi and Vientiane can basically be open to 50t ships all the year
round and 150t-300t ships in a seasonal manner. It is stipulated in the Convention that the
water area from Nanla River estuary to Luang Prabang is open to other countries by Laos,
Wan sai, Ban xieng kok, Maung mo, Wan pak len, Ban houei sai, and Luang Prabang along
the river are open to these countries.
5.3.2 Planning for Navigation Channel
(1) Navigation Scale
Lancang River - Mekong extends as long as 4,800km and flows through China, Laos,
Myanmar, Thailand, Cambodia and Vietnam. It flows 1,987km through 14 provinces of
Laos, and constitutes the economic lifeline of Laos. The length of Mekong in the nine
northern provinces is 1,012km as the important transportation line. It is estimated that by
2010 and 2020, the waterway passenger volume and freight volume shall have reached
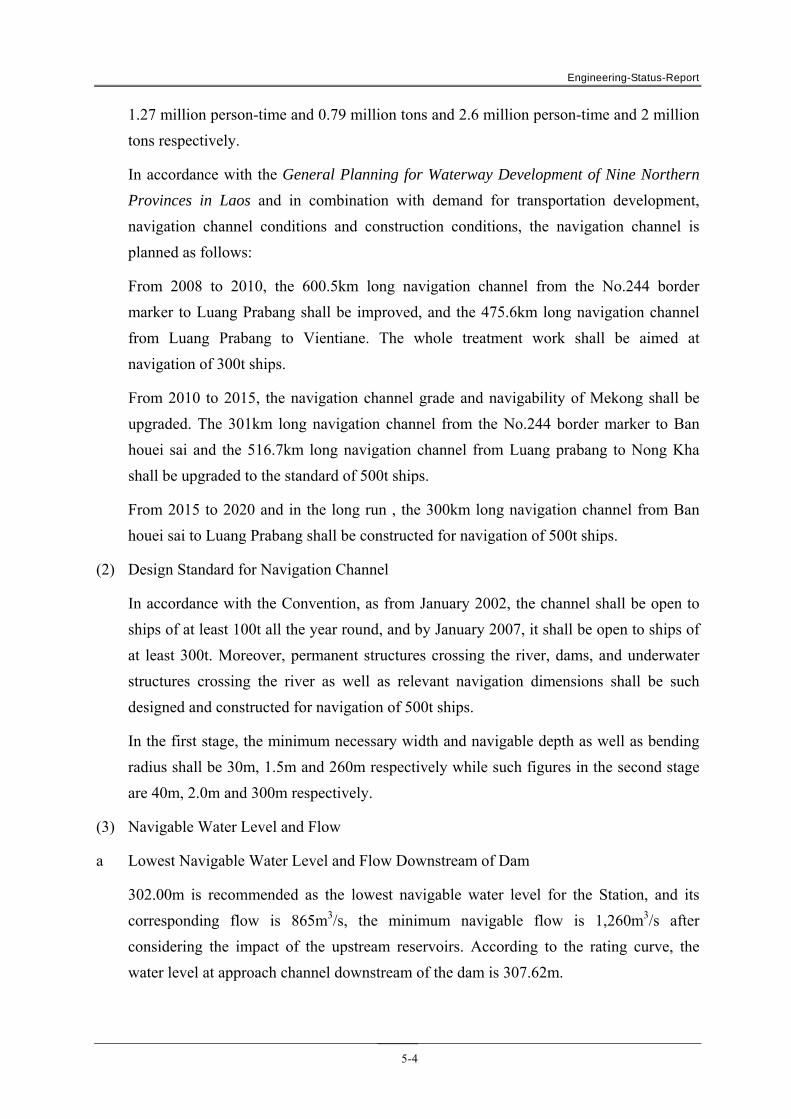
Engineering-Status-Report
5-4
1.27 million person-time and 0.79 million tons and 2.6 million person-time and 2 million
tons respectively.
In accordance with the General Planning for Waterway Development of Nine Northern
Provinces in Laos and in combination with demand for transportation development,
navigation channel conditions and construction conditions, the navigation channel is
planned as follows:
From 2008 to 2010, the 600.5km long navigation channel from the No.244 border
marker to Luang Prabang shall be improved, and the 475.6km long navigation channel
from Luang Prabang to Vientiane. The whole treatment work shall be aimed at
navigation of 300t ships.
From 2010 to 2015, the navigation channel grade and navigability of Mekong shall be
upgraded. The 301km long navigation channel from the No.244 border marker to Ban
houei sai and the 516.7km long navigation channel from Luang prabang to Nong Kha
shall be upgraded to the standard of 500t ships.
From 2015 to 2020 and in the long run , the 300km long navigation channel from Ban
houei sai to Luang Prabang shall be constructed for navigation of 500t ships.
(2) Design Standard for Navigation Channel
In accordance with the Convention, as from January 2002, the channel shall be open to
ships of at least 100t all the year round, and by January 2007, it shall be open to ships of
at least 300t. Moreover, permanent structures crossing the river, dams, and underwater
structures crossing the river as well as relevant navigation dimensions shall be such
designed and constructed for navigation of 500t ships.
In the first stage, the minimum necessary width and navigable depth as well as bending
radius shall be 30m, 1.5m and 260m respectively while such figures in the second stage
are 40m, 2.0m and 300m respectively.
(3) Navigable Water Level and Flow
a Lowest Navigable Water Level and Flow Downstream of Dam
302.00m is recommended as the lowest navigable water level for the Station, and its
corresponding flow is 865m3/s, the minimum navigable flow is 1,260m3/s after
considering the impact of the upstream reservoirs. According to the rating curve, the
water level at approach channel downstream of the dam is 307.62m.
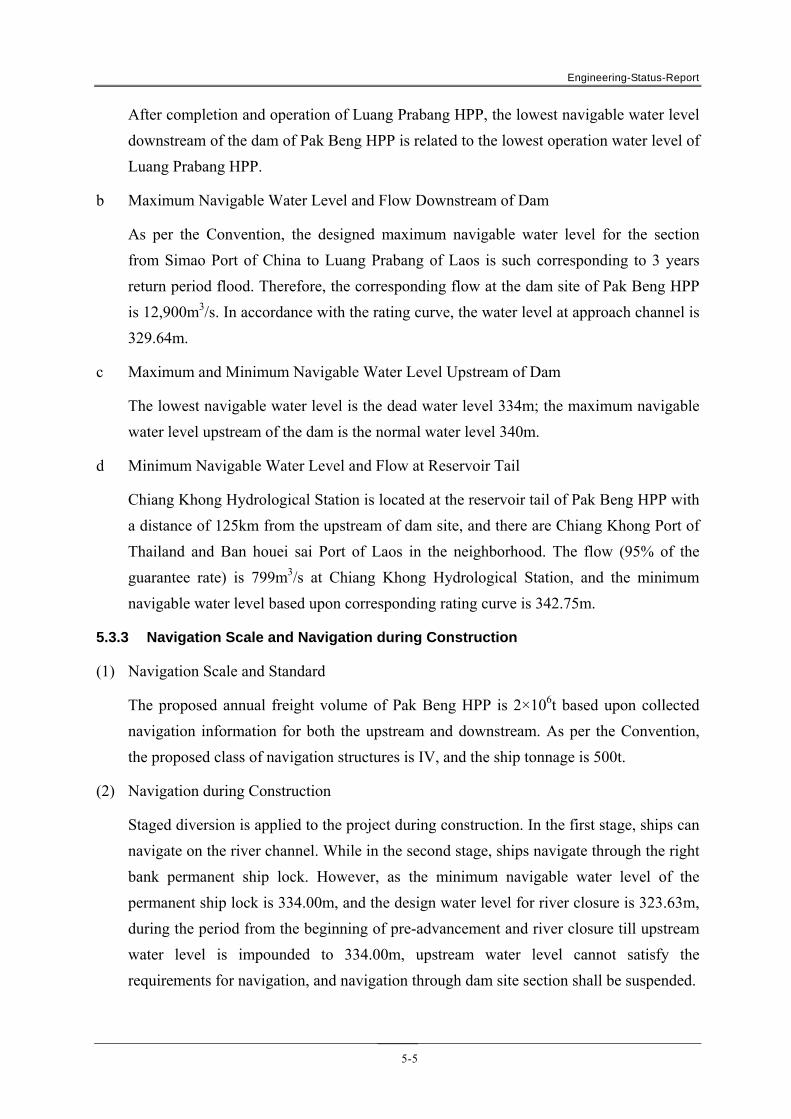
Engineering-Status-Report
5-5
After completion and operation of Luang Prabang HPP, the lowest navigable water level
downstream of the dam of Pak Beng HPP is related to the lowest operation water level of
Luang Prabang HPP.
b Maximum Navigable Water Level and Flow Downstream of Dam
As per the Convention, the designed maximum navigable water level for the section
from Simao Port of China to Luang Prabang of Laos is such corresponding to 3 years
return period flood. Therefore, the corresponding flow at the dam site of Pak Beng HPP
is 12,900m3/s. In accordance with the rating curve, the water level at approach channel is
329.64m.
c Maximum and Minimum Navigable Water Level Upstream of Dam
The lowest navigable water level is the dead water level 334m; the maximum navigable
water level upstream of the dam is the normal water level 340m.
d Minimum Navigable Water Level and Flow at Reservoir Tail
Chiang Khong Hydrological Station is located at the reservoir tail of Pak Beng HPP with
a distance of 125km from the upstream of dam site, and there are Chiang Khong Port of
Thailand and Ban houei sai Port of Laos in the neighborhood. The flow (95% of the
guarantee rate) is 799m3/s at Chiang Khong Hydrological Station, and the minimum
navigable water level based upon corresponding rating curve is 342.75m.
5.3.3 Navigation Scale and Navigation during Construction
(1) Navigation Scale and Standard
The proposed annual freight volume of Pak Beng HPP is 2×10⁶t based upon collected
navigation information for both the upstream and downstream. As per the Convention,
the proposed class of navigation structures is IV, and the ship tonnage is 500t.
(2) Navigation during Construction
Staged diversion is applied to the project during construction. In the first stage, ships can
navigate on the river channel. While in the second stage, ships navigate through the right
bank permanent ship lock. However, as the minimum navigable water level of the
permanent ship lock is 334.00m, and the design water level for river closure is 323.63m,
during the period from the beginning of pre-advancement and river closure till upstream
water level is impounded to 334.00m, upstream water level cannot satisfy the
requirements for navigation, and navigation through dam site section shall be suspended.

Engineering-Status-Report
5-6
During construction, consideration is given to stop navigation rather than stop of traffic.
During navigation suspension, passengers and freight shall debark and transfer by
vehicles. For this sake, one transfer dock is designed for both upstream and downstream
sides of the dam site.
5.4 PRELIMINARY ANALYSIS OF THE POWER SUPPLY AREA AND
ELECTRICITY MARKET
In accordance with relevant documents, the theoretic hydropower reserve of Mekong River is
58,000MW, of which 37,000MW can be developed, annual average output is 180,000GW·h,
and 51% of share in Laos. At present, with only 1% of the hydropower reserve is developed,
Mekong River has great potential of development.
Pak Beng HPP is the first cascade on the mainstream of Mekong River. The installed capacity
is 912MW, firm output is 360MW, average annual energy output is 4,765GW·h, and annual
operation hours are 5,225h. The project has convenient construction and traffic conditions.
The first unit plans to begin generating at 2023, its design year is 2030. The probable supply
area includes Laos, Thailand and China Southern Power Grid Company(CSG).
According to the load forecast, the maximum national load of Laos will be 3,488MW in 2020
and 5,680MW in 2030 respectively. Allowing for reserve capacity necessary in the electric
power system, installed capacity about 5,200MW and 8,000MW shall be required in the
system respectively by 2020 and 2030. Based on relevant power supply plans, installed
capacity supply in Laos will reach 5,176MW by 2020, which means it shall add new
hydropower capacity for domestic supply according to load increase. Furthermore, Laos is
abundant in hydropower resources, and power export constitutes one of sources for Laos to
gain foreign exchange. In particular, larger installed capacity of cascades on mainstream of
Mekong has advantage of power export. Therefore, priority shall be given to the development
of these cascades. Not only to promote domestic economic development, but also gain foreign
exchange by power export.
According to the forecast of EGAT (Electricity Generating Authority of Thailand), the peak
power load of Thailand come to 52,256MW in 2030. Because of the shortage of power
resource, Thailand needs to import large quantities of electricity from neighboring countries
in a long period of future. At present, Thailand government has planned to add new imported
power of 6,572MW from 2012 to 2030. Therefore, Thailand has certain electric market to
consume electricity imported from Laos.

Engineering-Status-Report
5-7
With load distribution situation of the China Southern Power Company (CSG for short), load
mainly concentrated upon the eastern area (Guangdong province) which need to import great
deal of electricity from other province or neighboring countries to meet the increasing load
demand. Reference to the idea, during 2020 to 2030, the Guangdong Province of the CSG still
have the ability to absorb some electric power from Laos or Myanmar, on the basis of it has
absorbed the electric power from Yunnan and Guizhou. Therefore, the CSG has the potential
electricity market of the Lao power.
Pak Beng HPP is situated on the mainstream of Mekong 14km upstream of Pak Beng country
in northern P. Oudomxai of Laos. The HPP site is 140km apart from the capital of P.
Oudomxai, and has a straight-line distance of 270km from Vientiane and 190km and 20km
from the border with China and Thailand respectively. After completion, it can be connected
into the 500kV power grid of neighboring countries to export electricity to these countries so
as to gain foreign exchange. Meanwhile, as a result of economic development and increase of
domestic load, Pak Beng HPP can provide partial electricity for the locality.
5.5 RUNOFF AND HYDROPOWER CALCULATION
5.5.1 Precondition for Project Scale Argumentation
(1) Time Sequence of Upstream Cascade Development
Pak Beng HPP is the first cascade of the mainstream Mekong River . The reservoir has
the capability of daily regulation. The upstream part of Mekong River in China is called
Lancang River. The middle-down stream of Lancang River is planned in accordance
with "Two Reservoirs and Eight Cascades", in which Xiaowan and Nuozhadu reservoirs
are capable of over year regulation. The two reservoirs detaining water in wet season for
use in dry season can impact on the study of project scale of Pak Beng HPP. According
to the work progress at that moment, Xiaowan HPP and Nuozhadu HPP have been put
into operation.
According to relevant data collected in this stage, Nam Tha 1# HPP and Nam Pha HPP
planned in Nam Tha River and Nam Pha River, the main tributaries of Mekong River in
Laos at upstream of Pak Beng HPP, two HPPs have respectively year and over year
regulating capabilities, both reservoirs will also have a certain impact on project scale
argumentation of Pak Beng HPP. According to the current work progress, the Nam Tha
1# HPP has completed feasibility study design, expected to be completed and put into
operation in 2018; and Nam Pha HPP is conducting supplementary argumentation for
feasibility study.
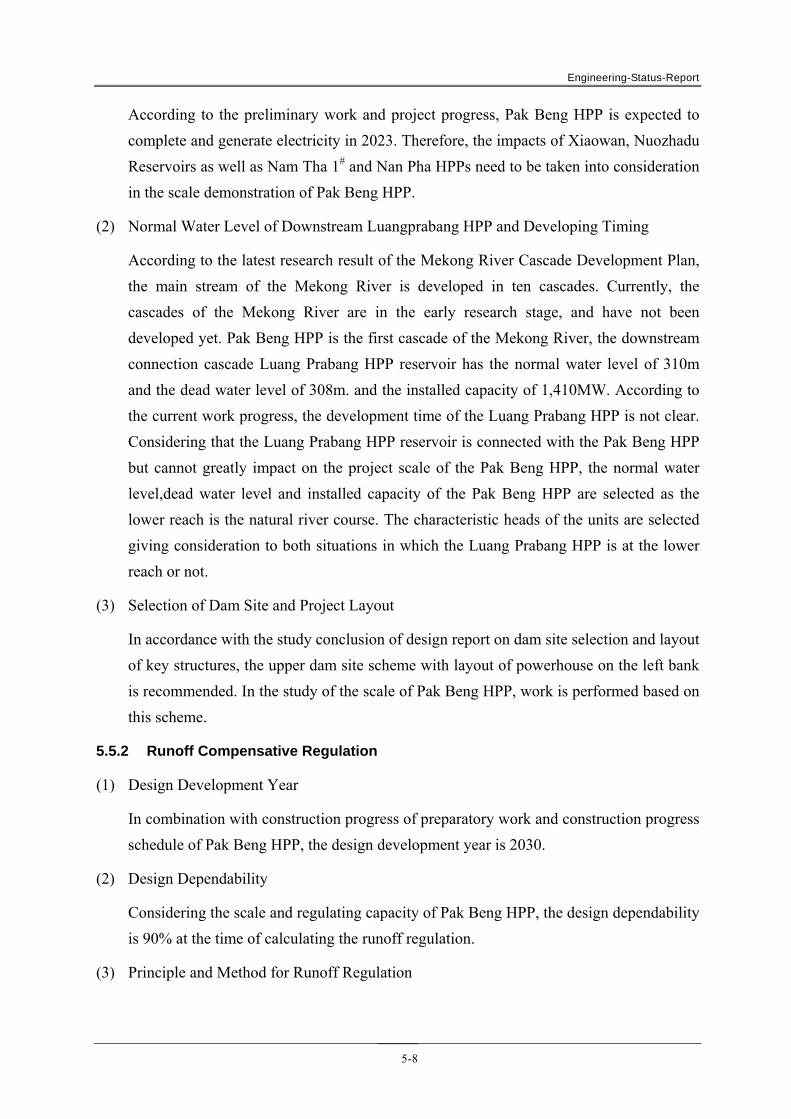
Engineering-Status-Report
5-8
According to the preliminary work and project progress, Pak Beng HPP is expected to
complete and generate electricity in 2023. Therefore, the impacts of Xiaowan, Nuozhadu
Reservoirs as well as Nam Tha 1# and Nan Pha HPPs need to be taken into consideration
in the scale demonstration of Pak Beng HPP.
(2) Normal Water Level of Downstream Luangprabang HPP and Developing Timing
According to the latest research result of the Mekong River Cascade Development Plan,
the main stream of the Mekong River is developed in ten cascades. Currently, the
cascades of the Mekong River are in the early research stage, and have not been
developed yet. Pak Beng HPP is the first cascade of the Mekong River, the downstream
connection cascade Luang Prabang HPP reservoir has the normal water level of 310m
and the dead water level of 308m. and the installed capacity of 1,410MW. According to
the current work progress, the development time of the Luang Prabang HPP is not clear.
Considering that the Luang Prabang HPP reservoir is connected with the Pak Beng HPP
but cannot greatly impact on the project scale of the Pak Beng HPP, the normal water
level,dead water level and installed capacity of the Pak Beng HPP are selected as the
lower reach is the natural river course. The characteristic heads of the units are selected
giving consideration to both situations in which the Luang Prabang HPP is at the lower
reach or not.
(3) Selection of Dam Site and Project Layout
In accordance with the study conclusion of design report on dam site selection and layout
of key structures, the upper dam site scheme with layout of powerhouse on the left bank
is recommended. In the study of the scale of Pak Beng HPP, work is performed based on
this scheme.
5.5.2 Runoff Compensative Regulation
(1) Design Development Year
In combination with construction progress of preparatory work and construction progress
schedule of Pak Beng HPP, the design development year is 2030.
(2) Design Dependability
Considering the scale and regulating capacity of Pak Beng HPP, the design dependability
is 90% at the time of calculating the runoff regulation.
(3) Principle and Method for Runoff Regulation
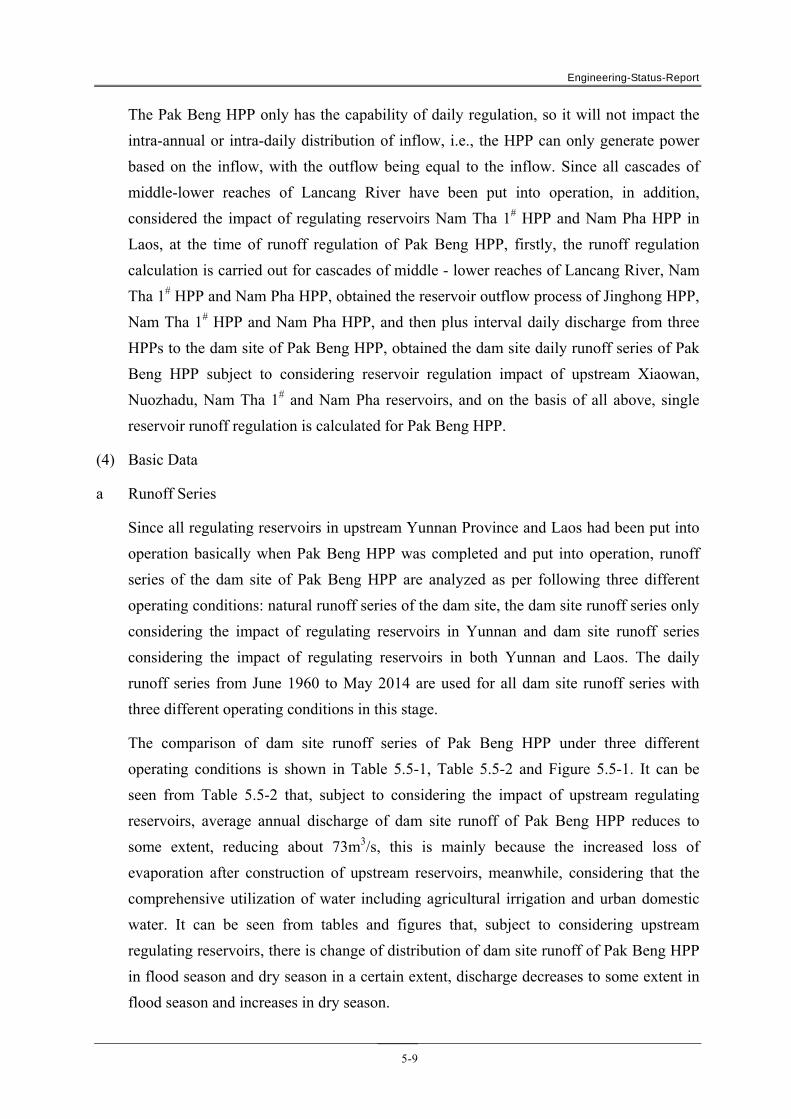
Engineering-Status-Report
5-9
The Pak Beng HPP only has the capability of daily regulation, so it will not impact the
intra-annual or intra-daily distribution of inflow, i.e., the HPP can only generate power
based on the inflow, with the outflow being equal to the inflow. Since all cascades of
middle-lower reaches of Lancang River have been put into operation, in addition,
considered the impact of regulating reservoirs Nam Tha 1# HPP and Nam Pha HPP in
Laos, at the time of runoff regulation of Pak Beng HPP, firstly, the runoff regulation
calculation is carried out for cascades of middle - lower reaches of Lancang River, Nam
Tha 1# HPP and Nam Pha HPP, obtained the reservoir outflow process of Jinghong HPP,
Nam Tha 1# HPP and Nam Pha HPP, and then plus interval daily discharge from three
HPPs to the dam site of Pak Beng HPP, obtained the dam site daily runoff series of Pak
Beng HPP subject to considering reservoir regulation impact of upstream Xiaowan,
Nuozhadu, Nam Tha 1# and Nam Pha reservoirs, and on the basis of all above, single
reservoir runoff regulation is calculated for Pak Beng HPP.
(4) Basic Data
a Runoff Series
Since all regulating reservoirs in upstream Yunnan Province and Laos had been put into
operation basically when Pak Beng HPP was completed and put into operation, runoff
series of the dam site of Pak Beng HPP are analyzed as per following three different
operating conditions: natural runoff series of the dam site, the dam site runoff series only
considering the impact of regulating reservoirs in Yunnan and dam site runoff series
considering the impact of regulating reservoirs in both Yunnan and Laos. The daily
runoff series from June 1960 to May 2014 are used for all dam site runoff series with
three different operating conditions in this stage.
The comparison of dam site runoff series of Pak Beng HPP under three different
operating conditions is shown in Table 5.5-1, Table 5.5-2 and Figure 5.5-1. It can be
seen from Table 5.5-2 that, subject to considering the impact of upstream regulating
reservoirs, average annual discharge of dam site runoff of Pak Beng HPP reduces to
some extent, reducing about 73m3/s, this is mainly because the increased loss of
evaporation after construction of upstream reservoirs, meanwhile, considering that the
comprehensive utilization of water including agricultural irrigation and urban domestic
water. It can be seen from tables and figures that, subject to considering upstream
regulating reservoirs, there is change of distribution of dam site runoff of Pak Beng HPP
in flood season and dry season in a certain extent, discharge decreases to some extent in
flood season and increases in dry season.

Engineering-Status-Report
5-10
Table 5.5-1 The comparison results of monthly average flow of Pak Beng
HPP under different operating conditions
Unit: m3/s
Month /Working condition
1 2 3 4 5 6 7 8 9 10 11 12
Natural 1340 1070 927 1000 1460 2720 5370 7700 6720 4440 2890 1830
Considering the impact of reservoirs in
Yunnan
2123 2015 1903 1815 1872 2319 3805 6127 5688 3640 2961 2410
Considering the impact of reservoirs in Yunnan and
Laos
2159 2068 1968 1887 1955 2275 3675 5966 5653 3633 2994 2452
Table 5.5-2 The change results of dam site runoff of Pak Beng HPP subject
to considering the impact of upstream regulating reservoirs
Unit: m3/s
Operating condition\index
Averaged in flood season
Averaged in dry season Multi-year average
○1 Natural 4973 1271 3130
○2 Considering the
impact of reservoirs in Yunnan
4090 2023 3057
○2 -○1 Difference value -883 752 -73
Amplitude(%) -17.76 59.14 -2.33
○3 Considering the
impact of reservoirs in Yunnan and Laos
4033 2081 3057
○3 -○1 Difference value -941 810 -73
Amplitude(%) -18.92 63.74 -2.33
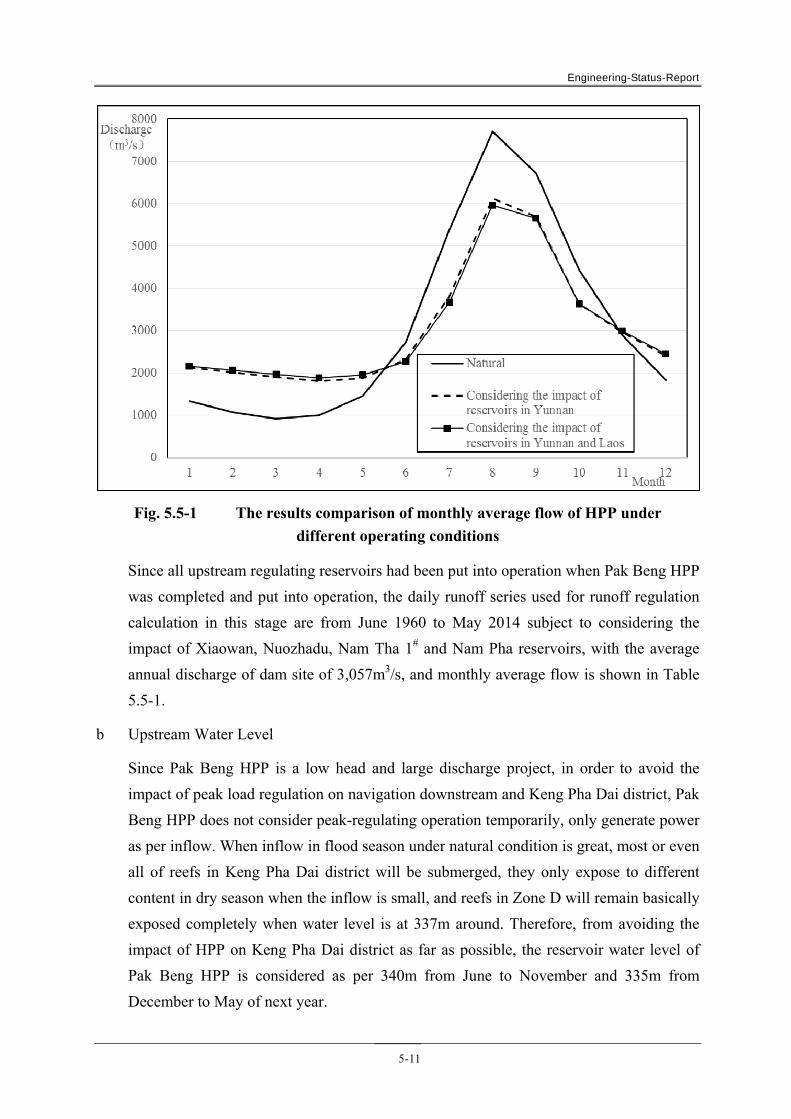
Engineering-Status-Report
5-11
Fig. 5.5-1 The results comparison of monthly average flow of HPP under
different operating conditions
Since all upstream regulating reservoirs had been put into operation when Pak Beng HPP
was completed and put into operation, the daily runoff series used for runoff regulation
calculation in this stage are from June 1960 to May 2014 subject to considering the
impact of Xiaowan, Nuozhadu, Nam Tha 1# and Nam Pha reservoirs, with the average
annual discharge of dam site of 3,057m3/s, and monthly average flow is shown in Table
5.5-1.
b Upstream Water Level
Since Pak Beng HPP is a low head and large discharge project, in order to avoid the
impact of peak load regulation on navigation downstream and Keng Pha Dai district, Pak
Beng HPP does not consider peak-regulating operation temporarily, only generate power
as per inflow. When inflow in flood season under natural condition is great, most or even
all of reefs in Keng Pha Dai district will be submerged, they only expose to different
content in dry season when the inflow is small, and reefs in Zone D will remain basically
exposed completely when water level is at 337m around. Therefore, from avoiding the
impact of HPP on Keng Pha Dai district as far as possible, the reservoir water level of
Pak Beng HPP is considered as per 340m from June to November and 335m from
December to May of next year.
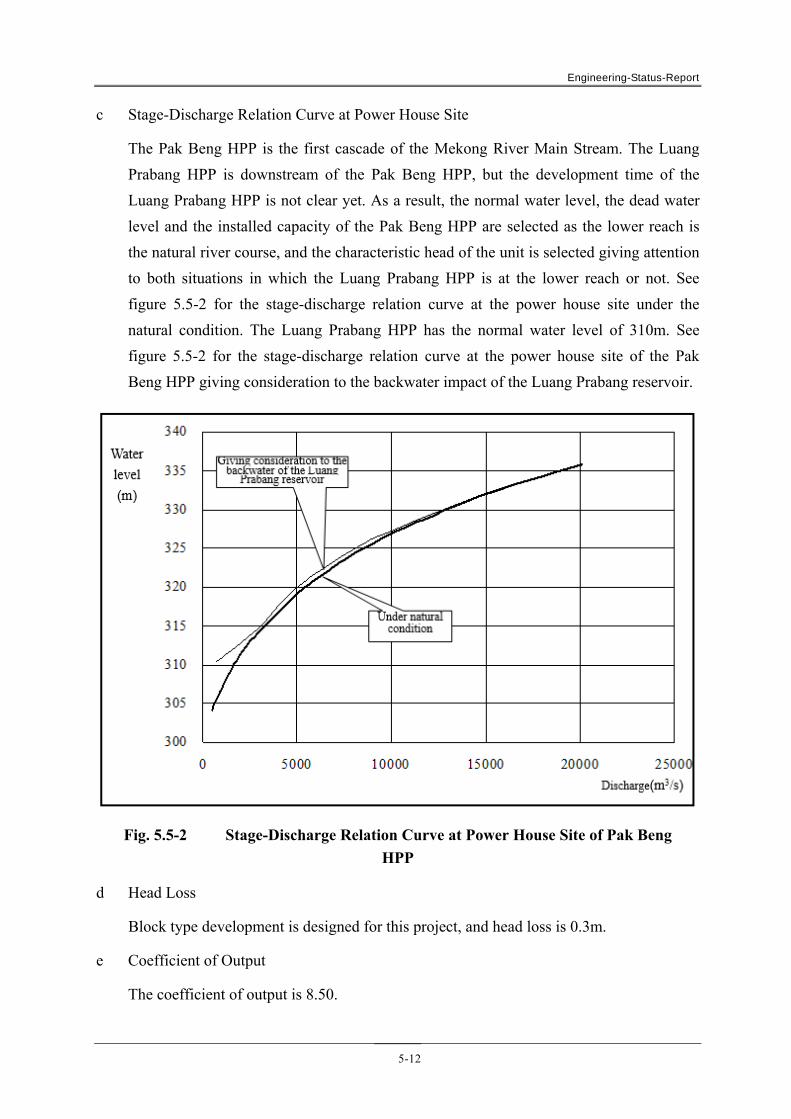
Engineering-Status-Report
5-12
c Stage-Discharge Relation Curve at Power House Site
The Pak Beng HPP is the first cascade of the Mekong River Main Stream. The Luang
Prabang HPP is downstream of the Pak Beng HPP, but the development time of the
Luang Prabang HPP is not clear yet. As a result, the normal water level, the dead water
level and the installed capacity of the Pak Beng HPP are selected as the lower reach is
the natural river course, and the characteristic head of the unit is selected giving attention
to both situations in which the Luang Prabang HPP is at the lower reach or not. See
figure 5.5-2 for the stage-discharge relation curve at the power house site under the
natural condition. The Luang Prabang HPP has the normal water level of 310m. See
figure 5.5-2 for the stage-discharge relation curve at the power house site of the Pak
Beng HPP giving consideration to the backwater impact of the Luang Prabang reservoir.
Fig. 5.5-2 Stage-Discharge Relation Curve at Power House Site of Pak Beng
HPP
d Head Loss
Block type development is designed for this project, and head loss is 0.3m.
e Coefficient of Output
The coefficient of output is 8.50.
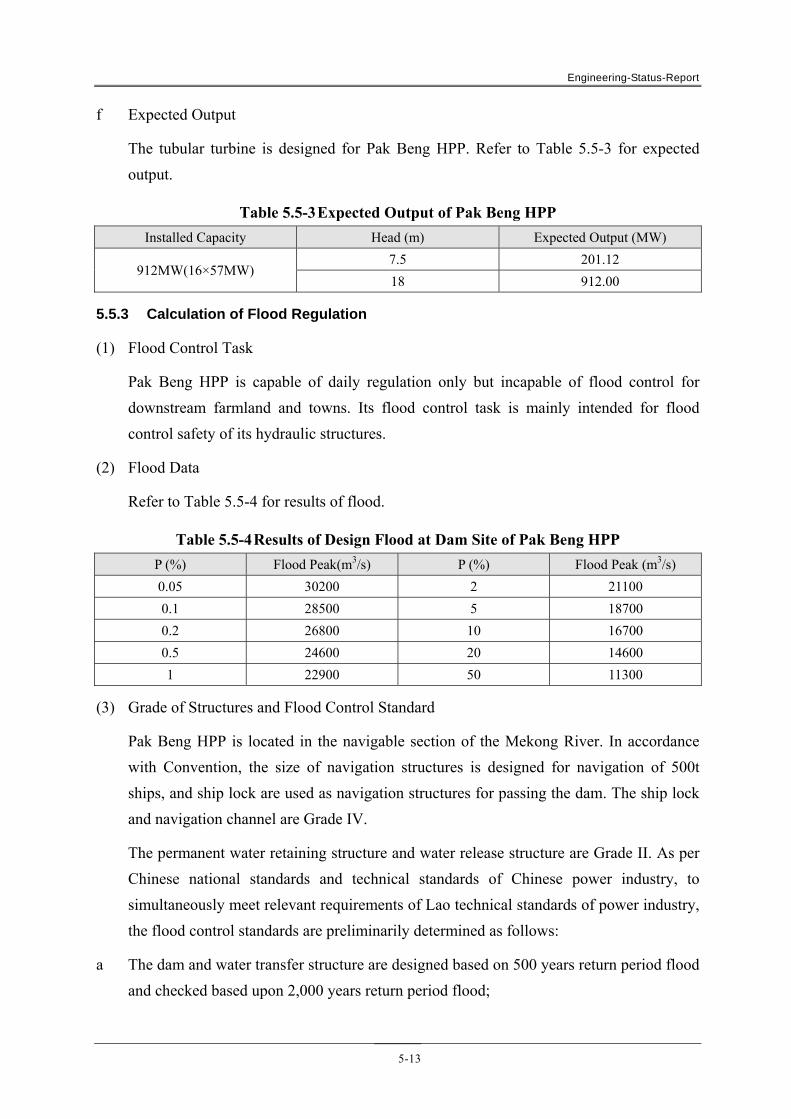
Engineering-Status-Report
5-13
f Expected Output
The tubular turbine is designed for Pak Beng HPP. Refer to Table 5.5-3 for expected
output.
Table 5.5-3 Expected Output of Pak Beng HPP
Installed Capacity Head (m) Expected Output (MW)
912MW(16×57MW) 7.5 201.12
18 912.00
5.5.3 Calculation of Flood Regulation
(1) Flood Control Task
Pak Beng HPP is capable of daily regulation only but incapable of flood control for
downstream farmland and towns. Its flood control task is mainly intended for flood
control safety of its hydraulic structures.
(2) Flood Data
Refer to Table 5.5-4 for results of flood.
Table 5.5-4 Results of Design Flood at Dam Site of Pak Beng HPP
P (%) Flood Peak(m3/s) P (%) Flood Peak (m3/s)
0.05 30200 2 21100 0.1 28500 5 18700 0.2 26800 10 16700 0.5 24600 20 14600 1 22900 50 11300
(3) Grade of Structures and Flood Control Standard
Pak Beng HPP is located in the navigable section of the Mekong River. In accordance
with Convention, the size of navigation structures is designed for navigation of 500t
ships, and ship lock are used as navigation structures for passing the dam. The ship lock
and navigation channel are Grade IV.
The permanent water retaining structure and water release structure are Grade II. As per
Chinese national standards and technical standards of Chinese power industry, to
simultaneously meet relevant requirements of Lao technical standards of power industry,
the flood control standards are preliminarily determined as follows:
a The dam and water transfer structure are designed based on 500 years return period flood
and checked based upon 2,000 years return period flood;

Engineering-Status-Report
5-14
b Structures for energy dissipation and protection are designed based on 50 years return
period flood.
Refer to Table 5.5-5 for flood standard and its flow peak.
Table 5.5-5 Flood Standard and Peak Flow
Dam Type Working
Condition Item Unit Dam Powerhouse
Structures for energy dissipation and protection
Gravity Dam
Design flood
Period of return
Year 500 500 50
Peak flow
m3/s 26800 26800 21100
Check flood
Period of return
Year 2000 2000
Peak flow
m3/s 30200 30200
(4) Layout of Water Release Structures
The water release structures consist of flood-discharging and sand-sluicing gate,
sand-sluicing gate in Navigation Channel, sediment discharge bottom outlet. Refer to
Table 5.5-6 for discharge capacity.
Table 5.5-6 Calculation Results of Discharge Capacity of Water Release
Structure
Flood Frequency
%
Upstream Water
Level (m)
Downstream Water Level
(m)
Discharge Volume of
flood-discharging and sand-sluicing
gate(m3/s)
Discharge Volume of
sand-sluicing gate in
Navigation Channel (m3/s)
Discharge of sediment discharge bottom
outlet(m3/s)
Total Discharge Volume(m3/s)
0.05 343.74 342.86 2141 27829 243 30213
0.1 342.37 341.73 2027 26348 208 28583
0.2 341.20 340.59 1903 24743 203 26849
0.5 339.66 339.09 1744 22672 196 24612
1 338.43 337.88 1627 21147 192 22966
2 337.09 336.57 1497 19459 187 21143
5 335.30 334.82 1328 17268 180 18776
10 333.77 333.34 1182 15360 170 16712
20 332.06 331.66 1035 13452 164 14651
33.33 334.00 329.99 12380 520 12900
50 337.00 328.30 10535 765 11300
Considered the stability of bank slope of reservoir, combined with process of reservoir
inflow flood and discharge capacity of Pak Beng HPP, when reservoir inflow is greater

Engineering-Status-Report
5-15
than 10,000m3/s, reservoir water level starts to decrease from 340m, passing flow
through flood-discharging and sand-sluicing gate , sediment discharge bottom outlet and
the units; When the reservoir inflow is close to 12,900m3/s, considering shipping
requirements, the reservoir shall maintain operation at a water level 334m as far as
possible, passing flow through flood-discharging and sand-sluicing gate, sediment
discharge bottom outlet; When the reservoir inflow is greater than 14,600m3/s, gates of
flood discharge facilities are opened fully, and the reservoir operates by "open discharge"
through the flood-discharging and sand-sluicing gate, sand-sluicing gate in navigation
channel , sediment discharge bottom outlet.
(5) Principle and Calculation Method for Flood Regulation
On account of rather small storage capacity and inability for flood regulation of Pak
Beng HPP, corresponding peak flood, size of water release structures and relevant
discharge curve are applied to determine the design flood level and check flood level.
5.6 NORMAL WATER LEVEL
5.6.1 Planning Result
In accordance with The Mekong Mainstream Run-of-river Hydropower published by MRC in
1994, the Normal Water Level of Pak Beng HPP is 345m.
5.6.2 Progress Status of relevant Work
In December 2008, Feasibility Study Report and TOR (Draft) of IEE and ESIA were
submitted to GOL.
On April 4, 2009, Ministry Of Energy And Mines put forward reviews on the Feasibility
Study Report.
In early July 2009, CNR submitted Optimization Study of Mekong Mainstream Hydropower
(Final Report Draft) for the five cascade projects. On July 15, 2009, the Secretariat of Lao
premier house issued Document No. 1200, stating:
(1) Consent to execution of water level of Xayaboury project as per provisions signed in
PDA agreement;
(2) No inundation of Keng Pha Dai during operation of Pak Beng HPP;
(3) Discussion upon submission of report on other projects by Ministry of Energy and Mines
to GOL following further detailed calculation.
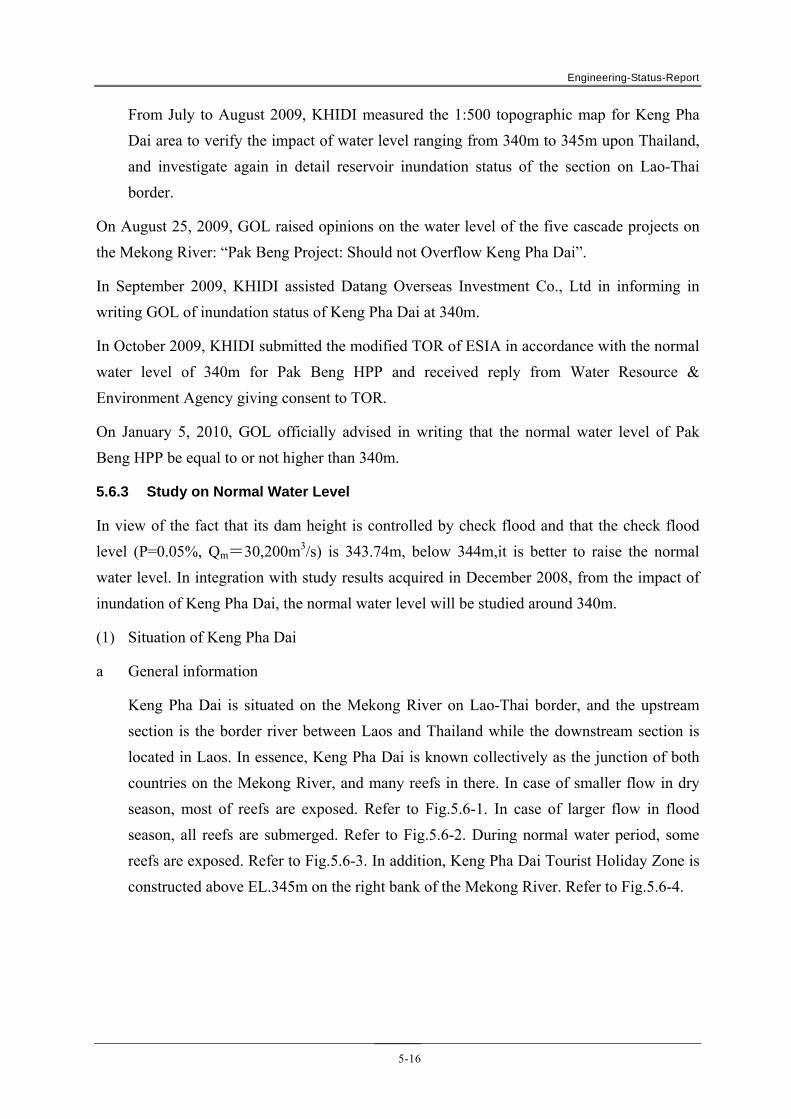
Engineering-Status-Report
5-16
From July to August 2009, KHIDI measured the 1:500 topographic map for Keng Pha
Dai area to verify the impact of water level ranging from 340m to 345m upon Thailand,
and investigate again in detail reservoir inundation status of the section on Lao-Thai
border.
On August 25, 2009, GOL raised opinions on the water level of the five cascade projects on
the Mekong River: “Pak Beng Project: Should not Overflow Keng Pha Dai”.
In September 2009, KHIDI assisted Datang Overseas Investment Co., Ltd in informing in
writing GOL of inundation status of Keng Pha Dai at 340m.
In October 2009, KHIDI submitted the modified TOR of ESIA in accordance with the normal
water level of 340m for Pak Beng HPP and received reply from Water Resource &
Environment Agency giving consent to TOR.
On January 5, 2010, GOL officially advised in writing that the normal water level of Pak
Beng HPP be equal to or not higher than 340m.
5.6.3 Study on Normal Water Level
In view of the fact that its dam height is controlled by check flood and that the check flood
level (P=0.05%, Qm=30,200m3/s) is 343.74m, below 344m,it is better to raise the normal
water level. In integration with study results acquired in December 2008, from the impact of
inundation of Keng Pha Dai, the normal water level will be studied around 340m.
(1) Situation of Keng Pha Dai
a General information
Keng Pha Dai is situated on the Mekong River on Lao-Thai border, and the upstream
section is the border river between Laos and Thailand while the downstream section is
located in Laos. In essence, Keng Pha Dai is known collectively as the junction of both
countries on the Mekong River, and many reefs in there. In case of smaller flow in dry
season, most of reefs are exposed. Refer to Fig.5.6-1. In case of larger flow in flood
season, all reefs are submerged. Refer to Fig.5.6-2. During normal water period, some
reefs are exposed. Refer to Fig.5.6-3. In addition, Keng Pha Dai Tourist Holiday Zone is
constructed above EL.345m on the right bank of the Mekong River. Refer to Fig.5.6-4.
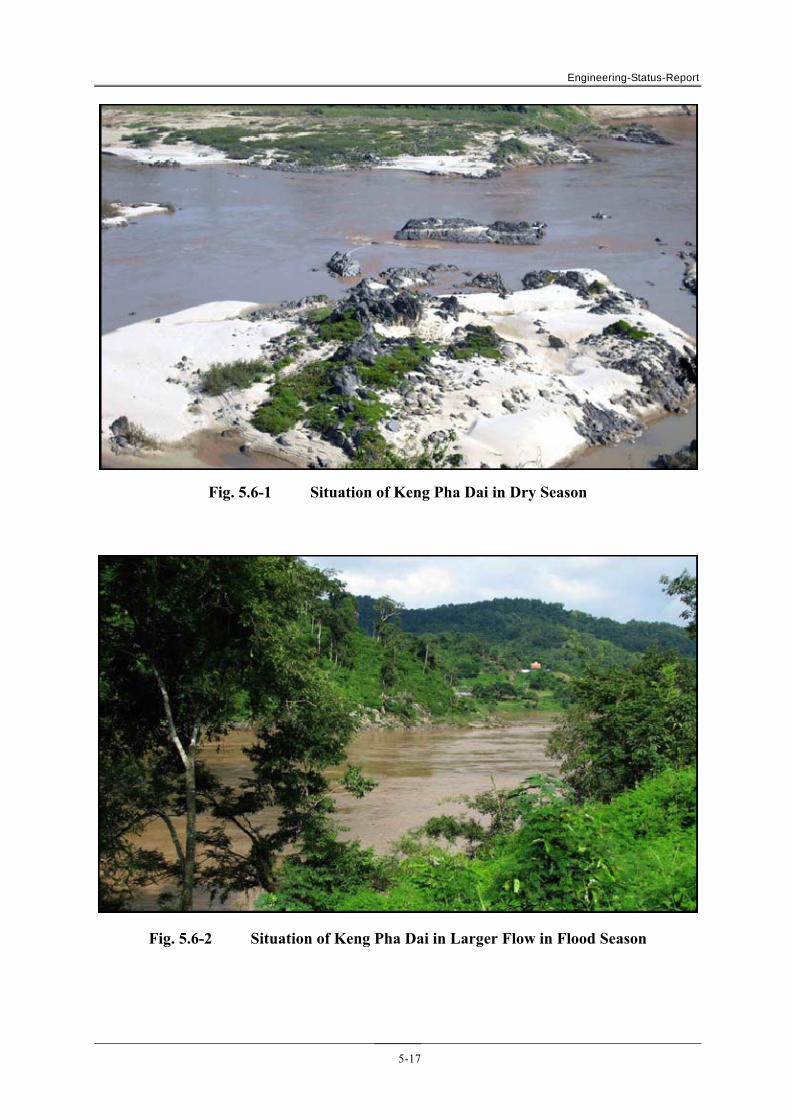
Engineering-Status-Report
5-17
Fig. 5.6-1 Situation of Keng Pha Dai in Dry Season
Fig. 5.6-2 Situation of Keng Pha Dai in Larger Flow in Flood Season

Engineering-Status-Report
5-18
Fig. 5.6-3 Situation of Keng Pha Dai in Normal Water Period
Fig. 5.6-4 Keng Pha Dai Tourist Holiday Zone

Engineering-Status-Report
5-19
Reefs at Keng Pha Dai are not only landmark surface features on the border of both
countries, but also an important component of Keng Pha Dai Tourist Holiday Zone. In
order to maintain the border, prevent land disputes and reserve the landscape, when the
normal water level is chosen, this factor shall be fully considered so as to study a
reasonable water level and reserve the functions of Keng Pha Dai.
b Elevation and Distribution Status of Reefs
The corresponding water level of average flow of years in Keng Pha Dai is about 337m,
the water level corresponding to average flow of flood season and dry season is 339m
and 335m respectively. In accordance with the 1:500 topographic map of Keng Pha Dai,
most areas above EL.340m are neat river banks, according to the analysis of reef
distribution within the river channel on EL.340m. Refer to Fig.5.6-5 for distribution
status of reefs above EL.335m. As can be seen from this graph, five larger reefs are
located above EL.335m, while others are smaller. One is distributed on the right bank
(Zone A) and one in the middle of river channel (Zone B), while other three are located
in Zone C, Zone D and Zone E on the left bank from downstream to upstream.
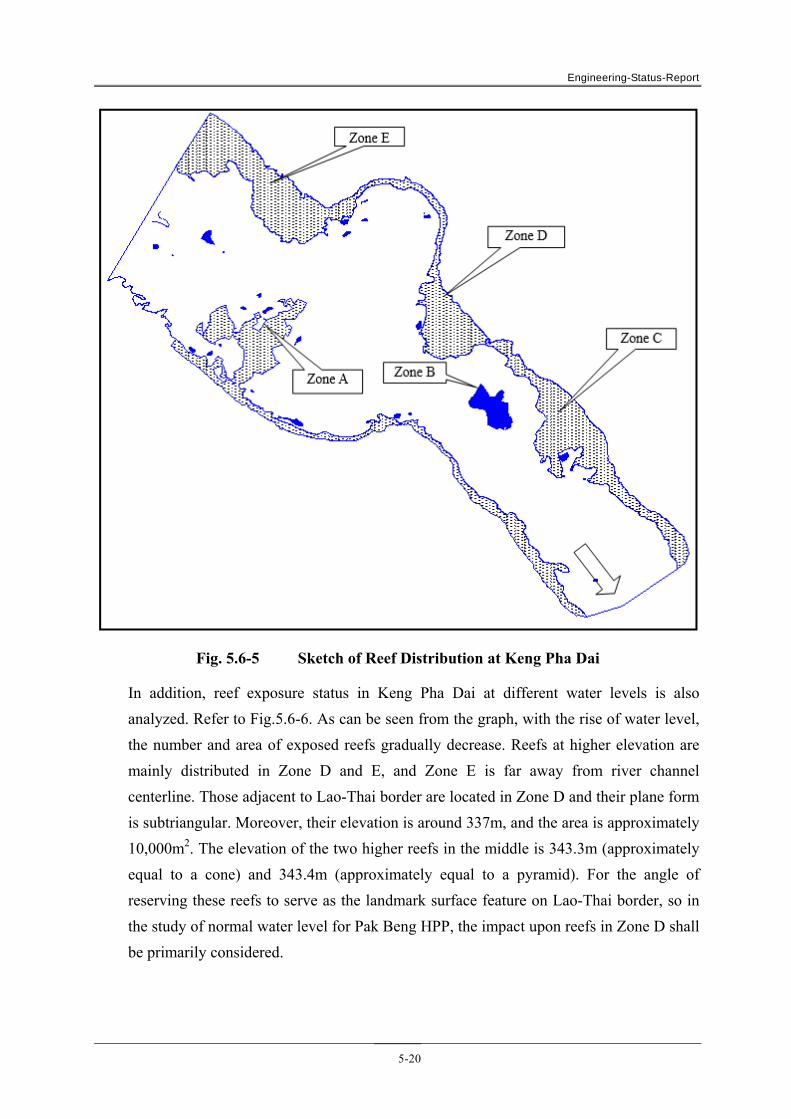
Engineering-Status-Report
5-20
Fig. 5.6-5 Sketch of Reef Distribution at Keng Pha Dai
In addition, reef exposure status in Keng Pha Dai at different water levels is also
analyzed. Refer to Fig.5.6-6. As can be seen from the graph, with the rise of water level,
the number and area of exposed reefs gradually decrease. Reefs at higher elevation are
mainly distributed in Zone D and E, and Zone E is far away from river channel
centerline. Those adjacent to Lao-Thai border are located in Zone D and their plane form
is subtriangular. Moreover, their elevation is around 337m, and the area is approximately
10,000m2. The elevation of the two higher reefs in the middle is 343.3m (approximately
equal to a cone) and 343.4m (approximately equal to a pyramid). For the angle of
reserving these reefs to serve as the landmark surface feature on Lao-Thai border, so in
the study of normal water level for Pak Beng HPP, the impact upon reefs in Zone D shall
be primarily considered.

Engineering-Status-Report
5-21
Fig. 5.6-6 Sketch of Reef Exposure at Different Water Levels in Keng Pha Dai

Engineering-Status-Report
5-22
c Reef Exposure in Different Months
Prior to formation of Pak Beng reservoir, flow and water level in Keng Pha Dai are
summarized in Table 5.6-1.
Table 5.6-1 Monthly Water Level in Keng Pha Dai (Prior to
Formation of Pak Beng Reservoir)
Item 1 2 3 4 5 6 7 8 9 10 11 12
Flow (m3/s)
2159 2068 1968 1887 1955 2275 3675 5966 5653 3633 2994 2452
Mean flow from June to November: 4,033m3/s Mean flow from December to May: 2,081 m3/s
Natural Water
Level (m)
335.29 335.09 334.87 334.65 334.84 335.74 338.06 340.72 340.38 338.01 337.10 336.10
Corresponding water level at mean flow from June to November: 338.51m Corresponding water level at mean flow from December to May: 335.12m
Refer to Fig. 5.6-7 for exposure of reefs in Zone D at different flow and water levels.
Fig. 5.6-7 Sketch of Reef Exposure at Different Water Levels in Keng Pha
Dai(Zone D)

Engineering-Status-Report
5-23
As can be seen from Table 5.6-1 and Fig. 5.6-7, most reefs in Zone D are exposed when
inflows are smaller from November to June, while most of them are submerged and only
a small part of them is exposed when inflows are larger from July to October.
(2) Scheme Formulation
a Proposing Scheme
As dam crest elevation is controlled by check flood level, and the check flood level is
343.74m, so it is favorable to raise the normal water level below 344m. However, in
accordance with opinions of GOL, the construction of Pak Beng HPP cannot inundate
Keng Pha Dai, and its normal water level cannot exceed 340m. In case of larger inflows
during flood season under natural conditions, most or even all reefs in Keng Pha Dai are
submerged, and in case of smaller inflows in dry season, some reefs are exposed by
degrees. When the water level remains at around 337m, reefs in Zone D can be basically
entirely exposed. Therefore, in combination with exposure status of reefs in Keng Pha
Dai, with a view to reducing the impact on Keng Pha Dai and reserving its function, we
proposed the scheme that the reservoir operates at 340m in flood season (from June to
November) and 335m in dry season (from December to May).
b Analysis of Impact on Keng Pha Dai
Monthly Average Water Level
Refer to Table 5.6-2 and Fig.5.6-8 for variations of water level in Keng Pha Dai before
and after the formation of Pak Beng reservoir based on calculation results of siltation and
backwater.

Engineering-Status-Report
5-24
Table 5.6-2 Variations of Water Level in Keng Pha Dai before and after
Formation of Pak Beng Reservoir
Month 1 2 3 4 5 6 7 8 9 10 11 12
Flow (m3/s)
2159 2068 1968 1887 1955 2275 3675 5966 5653 3633 2994 2452
Mean flow from June to November: 4,033m3/s Mean flow from December to May: 2,081 m3/s
Water Level before
Formation of Pak Beng
Reservoir (m)
335.29 335.09 334.87 334.65 334.84 335.74 338.06 340.72 340.38 338.01 337.10 336.10
Corresponding water level at mean flow from June to November: 338.51m Corresponding water level at mean flow from December to May: 335.12m
Water Level after Formation
of Pak Beng
Reservoir (m)
336.96 336.84 336.71 336.61 336.69 340.57 341.39 342.99 342.77 341.36 340.97 337.33
Corresponding water level at mean flow from June to November: 341.62m Corresponding water level at mean flow from December to May: 336.85m
Water Rise (m)
1.67 1.75 1.84 1.96 1.85 4.83 3.33 2.27 2.38 3.36 3.87 1.23
Corresponding water rise at mean flow in dry season from June to November:3.11m Corresponding water rise at mean flow in dry season from December to May: 1.73m
Fig. 5.6-8 Variations of Water Level in Keng Pha Dai before and After
Formation of Pak Beng Reservoir
Engineering-Status-Report
5-25
After formation of the reservoir, water rise in Keng Pha Dai in flood season (from June
to November) and dry season (from December to May) ranges from 2.27m to 4.83m and
from 1.23m to 1.96m respectively. Corresponding water level at mean flow in the same
period rises from 338.51m to 341.62m, indicating a rise of 3.11m, and from 335.12m to
336.85m, indicating a rise of 1.73m.
In terms of inundation status of Keng Pha Dai following reservoir formation,
corresponding water level at mean flow in flood season (from June to November) is
341.62m, a rise of 3.11m. Refer to Fig.5.6-9 for inundation status of Zone D in Keng Pha
Dai. As can be seen from this graph, following reservoir formation, corresponding water
level at mean flow in flood season (from June to November) is around 341.62m, and in
this case, most reefs in Zone D of Keng Pha Dai are submerged. However, there are still
reefs in four higher posistions exposed. As reefs in this zone are submerged when larger
inflows come in flood season before reservoir formation, its operation at 340m in flood
season can basically reserve the expected functions of these landmark surface features on
Lao-Thai border.

Engineering-Status-Report
5-26
Fig. 5.6-9 Sketch of Reef Exposure (in Zone D) of Keng Pha Dai after
Formation of Pak Beng Reservoir (at mean water level in flood season)
After formation of the reservoir, corresponding water level in Keng Pha Dai at mean
flow in dry season is 336.85m, a rise of 1.73m. Refer to Fig.5.6-10 for inundation status
in Zone D of Keng Pha Dai. As can be seen from this graph, following reservoir
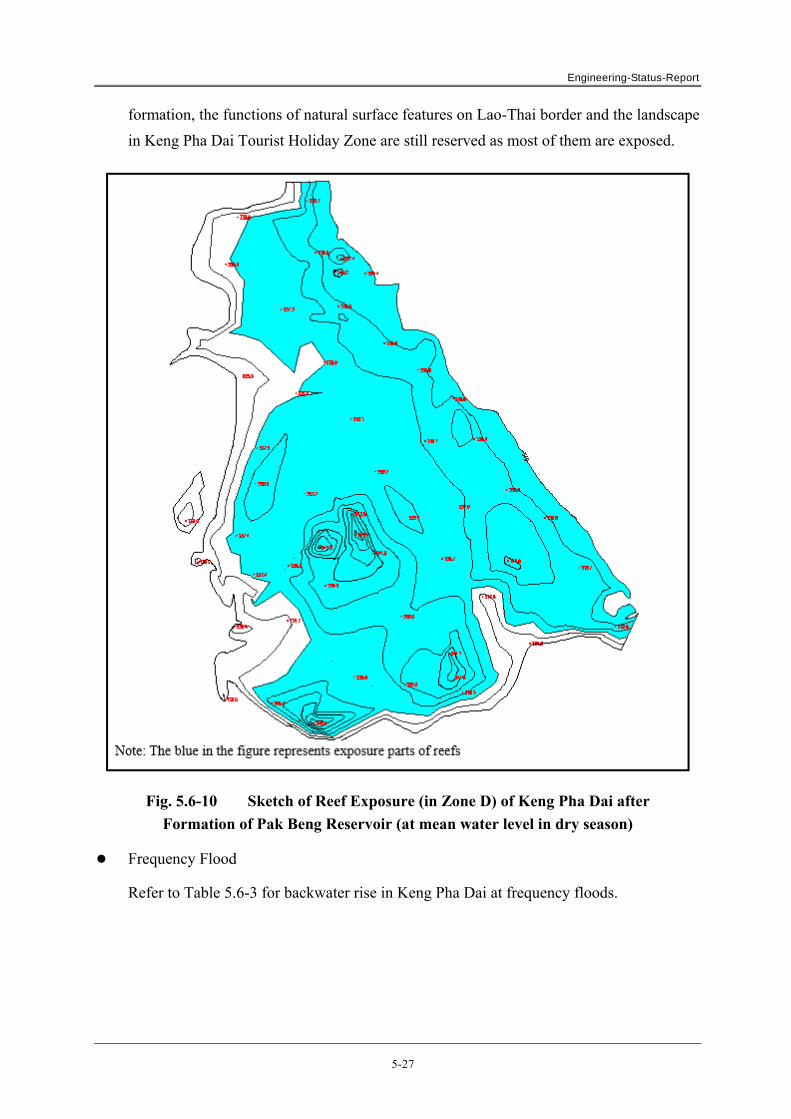
Engineering-Status-Report
5-27
formation, the functions of natural surface features on Lao-Thai border and the landscape
in Keng Pha Dai Tourist Holiday Zone are still reserved as most of them are exposed.
Fig. 5.6-10 Sketch of Reef Exposure (in Zone D) of Keng Pha Dai after
Formation of Pak Beng Reservoir (at mean water level in dry season)
Frequency Flood
Refer to Table 5.6-3 for backwater rise in Keng Pha Dai at frequency floods.
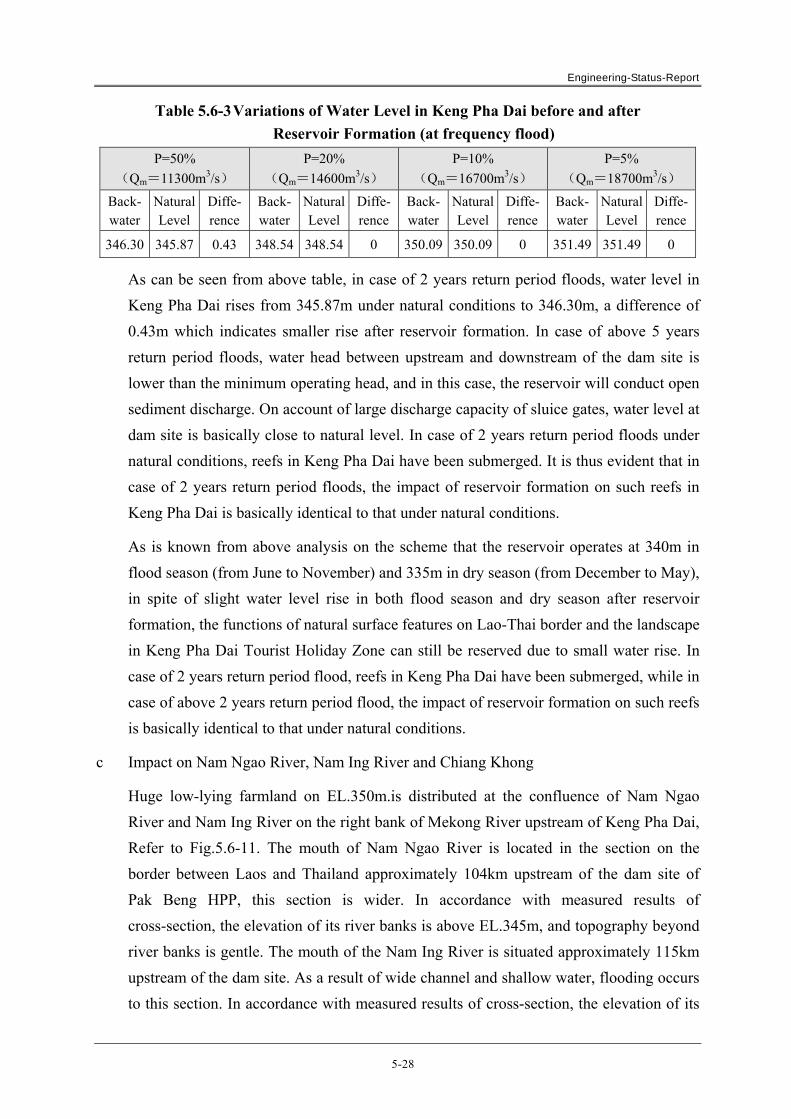
Engineering-Status-Report
5-28
Table 5.6-3 Variations of Water Level in Keng Pha Dai before and after
Reservoir Formation (at frequency flood)
P=50%
(Qm=11300m3/s)
P=20%
(Qm=14600m3/s)
P=10%
(Qm=16700m3/s)
P=5%
(Qm=18700m3/s)
Back- water
Natural Level
Diffe-rence
Back- water
Natural Level
Diffe-rence
Back-water
Natural Level
Diffe-rence
Back- water
Natural Level
Diffe-rence
346.30 345.87 0.43 348.54 348.54 0 350.09 350.09 0 351.49 351.49 0
As can be seen from above table, in case of 2 years return period floods, water level in
Keng Pha Dai rises from 345.87m under natural conditions to 346.30m, a difference of
0.43m which indicates smaller rise after reservoir formation. In case of above 5 years
return period floods, water head between upstream and downstream of the dam site is
lower than the minimum operating head, and in this case, the reservoir will conduct open
sediment discharge. On account of large discharge capacity of sluice gates, water level at
dam site is basically close to natural level. In case of 2 years return period floods under
natural conditions, reefs in Keng Pha Dai have been submerged. It is thus evident that in
case of 2 years return period floods, the impact of reservoir formation on such reefs in
Keng Pha Dai is basically identical to that under natural conditions.
As is known from above analysis on the scheme that the reservoir operates at 340m in
flood season (from June to November) and 335m in dry season (from December to May),
in spite of slight water level rise in both flood season and dry season after reservoir
formation, the functions of natural surface features on Lao-Thai border and the landscape
in Keng Pha Dai Tourist Holiday Zone can still be reserved due to small water rise. In
case of 2 years return period flood, reefs in Keng Pha Dai have been submerged, while in
case of above 2 years return period flood, the impact of reservoir formation on such reefs
is basically identical to that under natural conditions.
c Impact on Nam Ngao River, Nam Ing River and Chiang Khong
Huge low-lying farmland on EL.350m.is distributed at the confluence of Nam Ngao
River and Nam Ing River on the right bank of Mekong River upstream of Keng Pha Dai,
Refer to Fig.5.6-11. The mouth of Nam Ngao River is located in the section on the
border between Laos and Thailand approximately 104km upstream of the dam site of
Pak Beng HPP, this section is wider. In accordance with measured results of
cross-section, the elevation of its river banks is above EL.345m, and topography beyond
river banks is gentle. The mouth of the Nam Ing River is situated approximately 115km
upstream of the dam site. As a result of wide channel and shallow water, flooding occurs
to this section. In accordance with measured results of cross-section, the elevation of its

Engineering-Status-Report
5-29
river banks are above EL.351m, and huge farmland is distributed (above EL.350m)
beyond the banks. Chiang Khong is an important city of Thailand, and plays a significant
role in its socio-economic development. Refer to Fig.5.6-11. Therefore, in addition to
Keng Pha Dai, the impact of reservoir backwater on Nam Ngao River, Nam Ing River
and Chiang Khong is also analyzed.
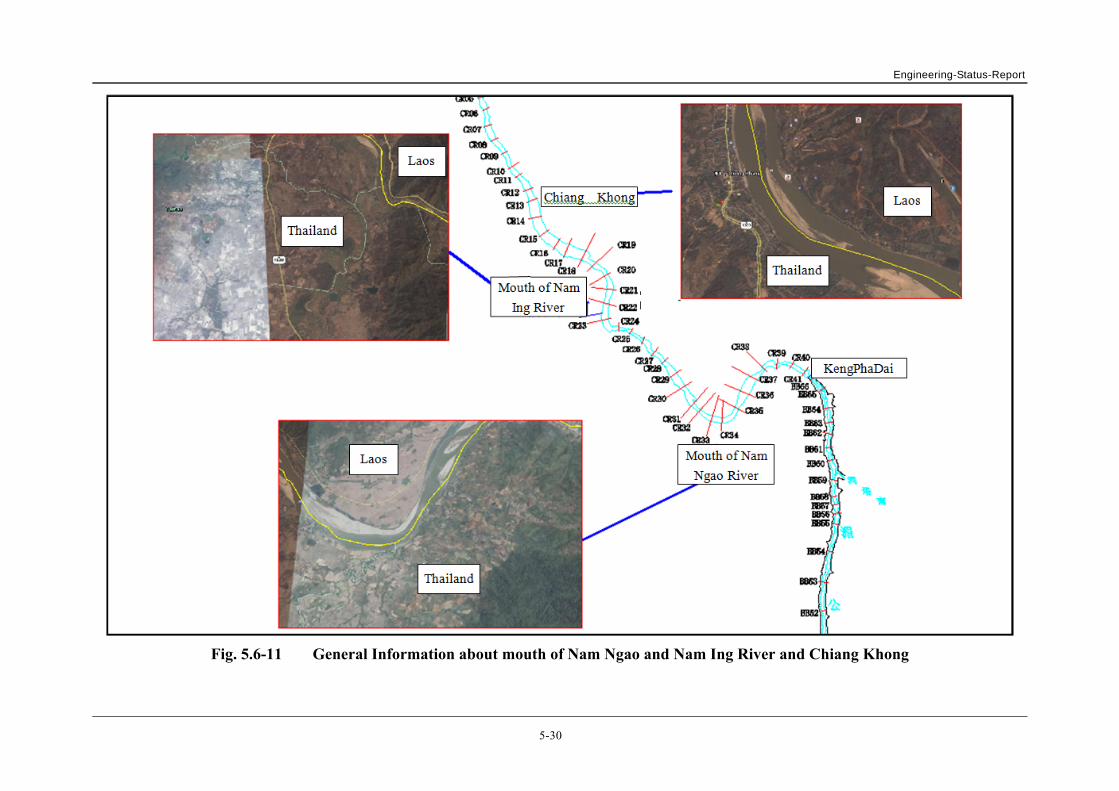
Engineering-Status-Report
5-30
Fig. 5.6-11 General Information about mouth of Nam Ngao and Nam Ing River and Chiang Khong
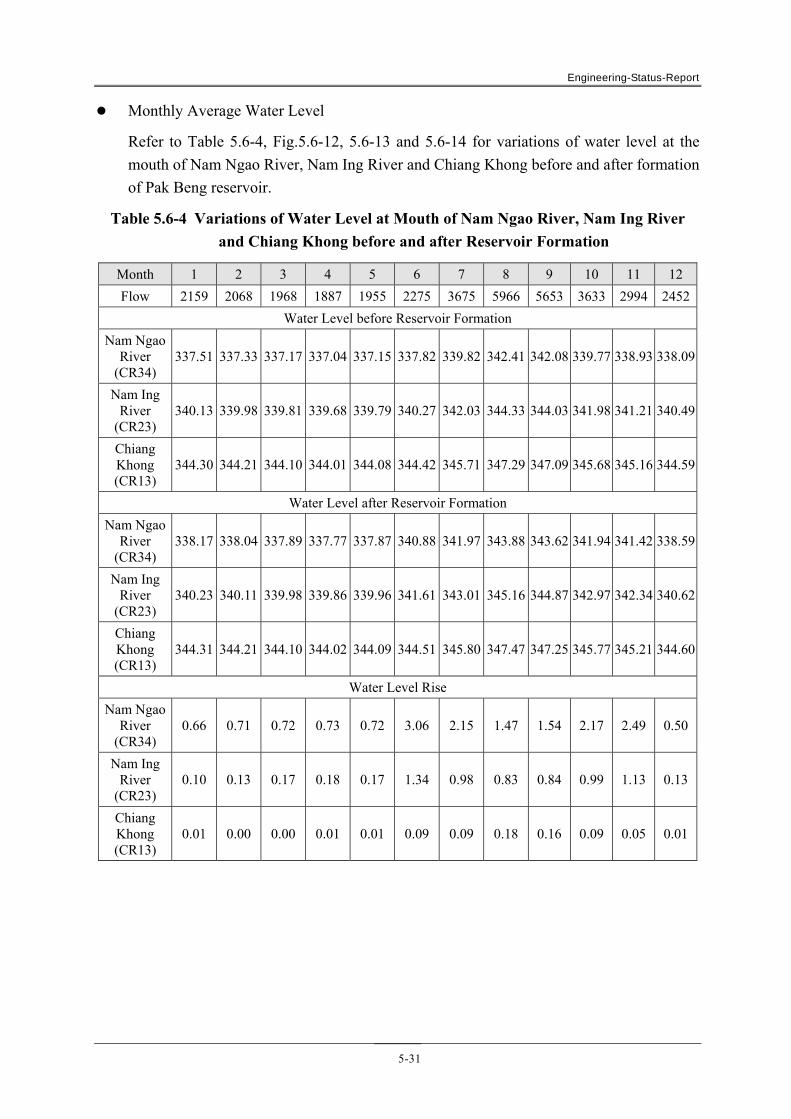
Engineering-Status-Report
5-31
Monthly Average Water Level
Refer to Table 5.6-4, Fig.5.6-12, 5.6-13 and 5.6-14 for variations of water level at the
mouth of Nam Ngao River, Nam Ing River and Chiang Khong before and after formation
of Pak Beng reservoir.
Table 5.6-4 Variations of Water Level at Mouth of Nam Ngao River, Nam Ing River
and Chiang Khong before and after Reservoir Formation
Month 1 2 3 4 5 6 7 8 9 10 11 12
Flow 2159 2068 1968 1887 1955 2275 3675 5966 5653 3633 2994 2452
Water Level before Reservoir Formation
Nam Ngao River
(CR34) 337.51 337.33 337.17 337.04 337.15 337.82 339.82 342.41 342.08 339.77 338.93 338.09
Nam Ing River
(CR23) 340.13 339.98 339.81 339.68 339.79 340.27 342.03 344.33 344.03 341.98 341.21 340.49
Chiang Khong (CR13)
344.30 344.21 344.10 344.01 344.08 344.42 345.71 347.29 347.09 345.68 345.16 344.59
Water Level after Reservoir Formation
Nam Ngao River
(CR34) 338.17 338.04 337.89 337.77 337.87 340.88 341.97 343.88 343.62 341.94 341.42 338.59
Nam Ing River
(CR23) 340.23 340.11 339.98 339.86 339.96 341.61 343.01 345.16 344.87 342.97 342.34 340.62
Chiang Khong (CR13)
344.31 344.21 344.10 344.02 344.09 344.51 345.80 347.47 347.25 345.77 345.21 344.60
Water Level Rise
Nam Ngao River
(CR34) 0.66 0.71 0.72 0.73 0.72 3.06 2.15 1.47 1.54 2.17 2.49 0.50
Nam Ing River
(CR23) 0.10 0.13 0.17 0.18 0.17 1.34 0.98 0.83 0.84 0.99 1.13 0.13
Chiang Khong (CR13)
0.01 0.00 0.00 0.01 0.01 0.09 0.09 0.18 0.16 0.09 0.05 0.01

Engineering-Status-Report
5-32
Fig. 5.6-12 Variations of Water Level at Mouth of Nam Ngao River (CR34)
before and after Reservoir Formation
Fig. 5.6-13 Variations of Water Level at Mouth of Nam Ing River (CR23)
before and after Reservoir Formation

Engineering-Status-Report
5-33
Fig. 5.6-14 Variations of Water Level around Chiang Khong (CR13) before
and after Reservoir Formation
As can be seen from the calculation results, following reservoir formation, water level at
the mouth of Nam Ngao River (CR34) ranges from 337.77m to 343.88m, rising
1.47m-3.06m in flood season (from June to November) and 0.50m-0.73m in dry season
(from December to May). However, as the river banks are around EL.345m and river
water is still under the control of river banks, no overtopping will take place.
Water level at the mouth of the Nam Ing River (CR23) varies from 339.86m to 345.16m,
rising 0.83m-1.34m in flood season (from June to November) and 0.10m-0.18m in dry
season (from December to May). However, as the river banks are around EL.351m and
river water is still controlled by river banks, no overtopping shall occur.
Water level around Chiang Khong (CR13) ranges from 344.02m to 347.47m, rising
0.05m-0.18m in flood season (from June to November) and 0.01m in dry season (from
December to May), which basically returns to the natural level.
Frequency Flood
Refer to Table 5.6-5 for backwater rise of different frequency floods at mouth of Nam
Ngao River and Nam Ing River and around Chiang Khong.

Engineering-Status-Report
5-34
Table 5.6-5 Variations of Water Level at Mouth of Nam Ngao River and Nam Ing River
and around Chiang Khong before and after Reservoir Formation
Item
P=50%
(Qm=11,300m3/s)
P=20%
(Qm=14,600m3/s)
P=10%
(Qm=16,700m3/s)
P=5%
(Qm=18,700m3/s)
Back-water
Natural Level
Diffe- rence
Back-water
Natural Level
Diffe-rence
Back-water
Natural Level
Diffe- rence
Back- water
Natural Level
Diffe-rence
Nam Ngao River (CR34)
347.74 347.49 0.25 350.25 350.25 0 351.72 351.72 0 353.03 353.03 0
Nam Ing River (CR23)
349.54 349.38 0.16 352.00 352.00 0 353.52 353.52 0 354.79 354.79 0
Chiang Khong (CR13)
351.23 351.15 0.08 353.45 353.45 0 354.97 354.97 0 356.22 356.22 0
As can be seen from above table, in case of 2 years return period floods, water level of
Nam Ngao River rises 0.25m, and in case of 5 years return period floods, as water head
between upstream and downstream of the dam site is lower than the minimum operating
head, the reservoir conducts open sediment discharge. On account of large discharge
capacity of sluice gates, the water level at dam site is basically at the natural level. In
view of the fact that the elevation of river banks at the mouth of Nam Ngao River is
around 345m, water shall overflow in case of 2 years return period floods under natural
conditions. It is thus obvious that in case of 2 years return period floods, the impact of
reservoir formation at the mouth of Nam Ngao River is basically equal to that under
natural conditions.
As can be seen from above table, in case of 2 years return period floods, water level at
the mouth of Nam Ing River and around Chiang Khong rises 0.16m and 0.08m
respectively, which basically returns to the natural level. In case of 5 years return period
floods, water head between upstream and downstream of the dam site is lower than the
minimum operating head. In this case, the reservoir carries out open sediment discharge.
On account of large discharge capacity of sluice gates, the water level at dam site is
basically at the natural level. It is thus evident that in case of 2 years return period floods,
the impact of reservoir formation on the mouth of Nam Ing River and around Chiang
Khong is identical to that under natural conditions.
It is also evident that following reservoir formation, certain water rise is seen at the
mouth of Nam Ngao River (CR34) in both flood season and dry season, certain water
rise is seen at the mouth of Nam Ing River in flood season and basically without impact
generated in dry season. River water at the mouth of Nam Ngao River and Nam Ing
River is still controlled by river banks without overtopping, while that around Chiang
Khong (CR13) basically returns to the natural level. In case of 2 years return period
flood, the impact of reservoir formation on the mouth of Nam Ngao River, Nam Ing
River and around Chiang Khong is basically equal to that under natural conditions.
Engineering-Status-Report
5-35
(3) Comprehensive Comparison and Recommendation Opinions
In conclusion, in accordance with the study results and changes of border conditions, for
the purpose of protecting Lao-Thai border and reef landscape in Keng Pha Dai Tourism
Holiday Zone, incorporating with the opinions of GOL that the normal water level of Pak
Beng is equal to or not higher than 340m, the proposed normal water level is 340m, and
the reservoir operates at 340m in flood season (from June to November) and 335m in dry
season (from December to May).
5.7 DEAD WATER LEVEL
Pak Beng HPP is a low-head and large-discharge hydropower plant. The backwater level of
the dam is low. To mitigate the impact of sedimentation and backwater on Keng Pha Dai
district, in case of 5-year return flood, gates of flood discharge facilities are opened fully for
“open discharge” operation, most of the sediment in the reservoir will be discharged out the
reservoir, the sedimentation in front of the dam will not be prominent, and the selection of
dead water level will be based on the generation mode and operation mode, requirements of
layout of hydraulic structures, operation characteristics of generator units, shipping, etc.
However, considering water intake of the HPP, the dead water level should not be below
317m. Higher dead water level is favorable for sedimentation prevention and sediment
flushing, and improvement of shipping conditions of the reservoir area. Bulb-type
through-flow hydraulic turbines used in the HPP can well adapt to the head change. The
operation requirements of turbines do not represents themselves as restrictive factors for the
selection of dead water level. However, higher dead water level can facilitate the reduction in
disabled capacity of the turbines.
From the perspective of exemption of international disputes and avoidance of unfavorable
impact on shipping, it is not preferable that Pak Beng HPP be subject to peak regulation
operation. Besides, during this stage, inflow regulation will not be considered in this design.
However, in order to reserve certain storage for creation of more power generation benefits by
the operation of this HPP. The dead water level should not be higher than 334m.
Therefore, based on all above-mentioned factors, under the premise that requirements for
water intake are satisfied, and from the perspective of improving the sedimentation prevention
and sediment flushing capacity and shipping conditions of the reservoir area, decreasing the
disabled capacity of the turbines, and optimizing operation and dispatching of the HPP, the
dead water level of Pak Beng HPP during this stage should be 1 m lower than the operating
water level (335m) during low-flow period, Pak Beng HPP should be with a dead water level
of 334m and a corresponding dead storage of 363 million m3. During low-flow period, the
storage difference between operating water level (335m) and dead water level (334m) is 29
million m3, while that between normal water level (340m) and dead water level (334m) is 196
million m3. The reservoir is capable of daily regulation.

Engineering-Status-Report
5-36
5.8 CHARACTERISTIC WATER LEVEL FOR FLOOD CONTROL
As the storage capacity of Pak Beng HPP is rather small, the reservoir is incapable of flood
control of downstream farmland and towns, and its main task of flood control is to protect its
own key hydraulic structures. Design flood level and check flood level are determined based
upon flood peak at corresponding frequency, size of flood release structures and
corresponding discharge curves. Refer to Table 5.8-1 for corresponding reservoir water levels
of floods at different frequencies.
Table 5.8-1 Corresponding Reservoir Water Levels of Different Frequency Floods
Floods with Different Frequencies (%)
0.05 (check standard)
0.2 (design standard)
Flood Peak(m3/s) 30,200 26,800
Maximum Water Level (m) 343.74 341.20
5.9 INSTALLED CAPACITY
5.9.1 Main Factors Affecting Selection of Installed Capacity
The normal water level and installed capacity proposed for Pak Beng HPP in Mekong
Mainstream Run-of-river Hydropower published by MRC in 1994 were 345m and 1,230MW.
In December 2008, KHIDI recommended the installed capacity in its feasibility study report
for the 345m scheme as 1,230MW.
Pak Beng HPP is the first cascade of the Mekong Mainstream which the head is lower and the
flow is big, In accordance with concrete conditions of Pak Beng HPP, main factors affecting
the installed capacity are as follows:
(1) The type of water turbine, the capacity of generating unit, manufacturing level and
transportation conditions;
(2) The characteristics of the output;
(3) Power supply market and load characteristics of supply area;
(4) Topographical and geological conditions and layout of hydraulic structures;
(5) Index of hydropower energy of project;
(6) Economic.
5.9.2 Scheme Formulation of Installed Capacity
(1) The Type of Water Turbine and the Capacity of Generating Unit
a Selection of Water Turbine Type
The operating head of the Pak Beng HPP is 28m. According to the head parameters of
the Pak Beng HPP, the turbine can be bulb through-flow type hydraulic turbine or
axial-flow Kaplan type hydraulic turbine within the range. The single unit capacity is

Engineering-Status-Report
5-37
within the range of manufacturing capability of the manufacturer in China. The
dimensions of main parts of the unit are as large as possible to meet the road
transportation conditions in China and foreign countries. The bulb through-flow type
hydraulic turbine and the axial-flow Kaplan type hydraulic turbine are preliminarily
proposed for comparison and selection.
The comparison and selection result indicates that the bulb through-flow type hydraulic
turbine has the advantages of small dimension, light weight, large passing flow, high
efficiency, wide scope of application, small dimension of power house and low
excavation quantity than the axial-flow Kaplan type hydraulic turbine. In addition, the
bulb through-flow type hydraulic turbine has obvious economical advantages than the
axial-flow Kaplan type hydraulic turbine. As a result, it is recommended that the bulb
through-flow type hydraulic turbine is preferred for the Pak Beng HPP.
b Selection of the Capacity of Generating Unit
In accordance with the operation flexibility of the unit, the manufacturing difficulty of
mechanical and electrical equipment and transportation condition in combination with
the factors such as hydraulic layout, three single unit capacities of 60.8MW, 57MW and
53.65MW are preliminarily proposed in this stage for comparison and selection.
The selection and comparison result indicates that the three single unit capacities of
60.8MW, 57MW and 53.65MW of the hydropower plant are all available. According to
the Qiaogong HPP which has been put into operation in China so far, the bulb
through-flow type hydraulic turbine adopted has the head range of 5.5-24.6m, the single
unit capacity of 57MW and the runner diameter of 7.5m, in which the head range is close
to that of the Pak Beng HPP, the runner diameter is close to that of the Pak Beng HPP
and the single unit capacity is equal to that of the Pak Beng HPP. And according to the
Hongjiang HPP which has been put into operation in China, the bulb through-flow type
hydraulic turbine adopted has the maximum head of 27.3m and the single unit capacity
of 45MW for operation. Considering that the Pak Beng HPP has a high operating head
and there is no practical manufacturing and operating experience of the large-capacity
through-flow type hydraulic turbine with the maximum head up to 28m with the single
unit capacity of 60.8MW, the unit is relatively difficult to manufacture. The 57MW and
53.65MW units are already in the advanced level. As a result, the comparison and
selection of the installed capacity is on the basis of the 57MW bulb through-flow type
hydraulic turbine.
(2) Characteristics of Hydropower Output
The Pak Beng HPP has relatively low drop and low head in large discharge in which the
Pak Beng HPP cannot even operate, namely, as the discharge increases, the water output
shows the trend of increasing first and reducing later due to the reduction of the head.
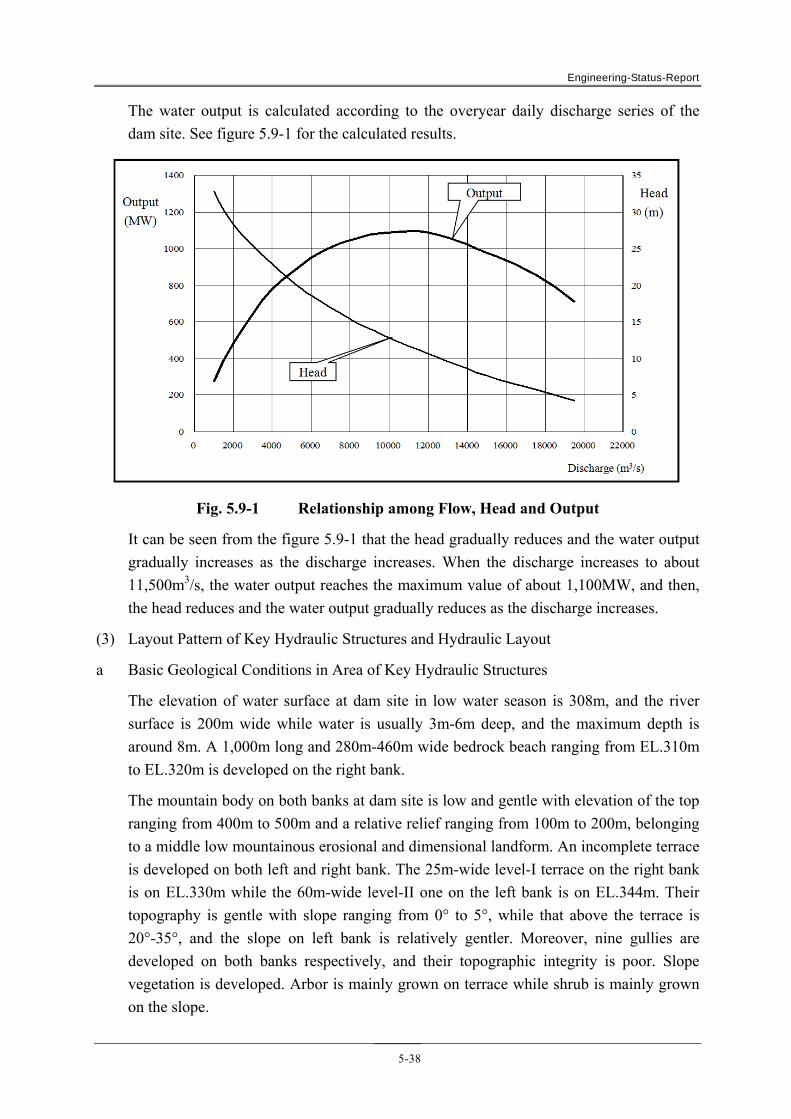
Engineering-Status-Report
5-38
The water output is calculated according to the overyear daily discharge series of the
dam site. See figure 5.9-1 for the calculated results.
Fig. 5.9-1 Relationship among Flow, Head and Output
It can be seen from the figure 5.9-1 that the head gradually reduces and the water output
gradually increases as the discharge increases. When the discharge increases to about
11,500m3/s, the water output reaches the maximum value of about 1,100MW, and then,
the head reduces and the water output gradually reduces as the discharge increases.
(3) Layout Pattern of Key Hydraulic Structures and Hydraulic Layout
a Basic Geological Conditions in Area of Key Hydraulic Structures
The elevation of water surface at dam site in low water season is 308m, and the river
surface is 200m wide while water is usually 3m-6m deep, and the maximum depth is
around 8m. A 1,000m long and 280m-460m wide bedrock beach ranging from EL.310m
to EL.320m is developed on the right bank.
The mountain body on both banks at dam site is low and gentle with elevation of the top
ranging from 400m to 500m and a relative relief ranging from 100m to 200m, belonging
to a middle low mountainous erosional and dimensional landform. An incomplete terrace
is developed on both left and right bank. The 25m-wide level-I terrace on the right bank
is on EL.330m while the 60m-wide level-II one on the left bank is on EL.344m. Their
topography is gentle with slope ranging from 0° to 5°, while that above the terrace is
20°-35°, and the slope on left bank is relatively gentler. Moreover, nine gullies are
developed on both banks respectively, and their topographic integrity is poor. Slope
vegetation is developed. Arbor is mainly grown on terrace while shrub is mainly grown
on the slope.

Engineering-Status-Report
5-39
Strata of upper Triassic (T31) and Quaternary (Q) metamorphosed rock series are
distributed at the dam site, and the lithology is mainly slate interbedded with less sandy
slate. Quaternary (Q) strata, including alluvium(Qal), talus accumulation (Qdl), and
colluvium (Qcol) are widely distributed in the dam site area.
Dam site strata are generally a monoclinal structure with sharp variation of occurrence of
N60°- 85°W, SW∠30°- 50°. Strata strike direction intersects with the river in a large
angle towards the upstream. Plastic deformation with strong distortion mainly occurs to
the rock mass, and interlayer folds are much developed to form compact folds in partial
places.
Fault structures are not developed at the dam site, and their scale is usually small. No
Class I and II structural planes are distributed in the dam site area, and only two Class III
structural planes are developed on the left bank while others belong to Class IV and V
structural planes.
The physical geological appearance in the dam site area is mainly shown as weathering.
Vertical burial depth of strong rock mass weathering on the left bank usually ranges from
40m to 50m while that on the right bank is 20m-30m. Interlayer weathering is seen in
partial areas, and rock mass weathering degree deepens in faults and strongly
compressive belts, mostly in fully weathered soil. Rock mass weathering on riverbed,
beach and terrace is shallower, and bedrock below overburden is weakly weathered rock
mass.
Groundwater burial depth on both banks is shallower, usually ranging from 20m to 40m,
and burial depth of top boundary of relatively impervious (q<3Lu) rock mass is usually
50m-70m.
b Impact of Geological Conditions on Selection of Installed Capacity
Wide topography at dam site is beneficial to layout of key hydraulic structures in diverse
schemes of installed capacity. The powerhouse is located in the main channel close to the
left bank and left bank slope. On account of wider river channel and gentle bank slope,
increased generating units will not lead to acute increase of excavation volume and a
high slope. The bearing capacity of riverbed and bank slope satisfies the requirements,
and there are no combinations of structural planes unfavorable to stability against sliding
in the foundation. Therefore, the engineering geological conditions in the dam site area
do not restrict the selection of installed capacity.
c Impact of Layout of Key Hydraulic Structures on Selection of Installed Capacity
In accordance with project development pattern, topographic and geological conditions
of the dam site, and characteristics of key hydraulic structures, the layout pattern of
“right bank ship lock + right bank flood discharge and sand scouring gate + left bank
Engineering-Status-Report
5-40
powerhouse” is applied to all proposed installed capacity schemes. A water retaining
powerhouse and bulb type generating units are designed.
Considering requirements for layout of construction diversion structures, in particular
layout of longitudinal cofferdam on the left edge along the beach, the layout of flood
discharge and sand scouring gates and ship lock on the right side of powerhouse and
non-overflow dam blocks on the right bank is identical in all installed capacity schemes.
The major difference lies in the length of dam blocks in powerhouse section and left
bank non-overflow dam blocks. Therefore, the layout of key hydraulic structures in all
installed capacity schemes is similar, and its main impact on selection of installed
capacity is shown as different quantities of dam blocks in powerhouse section and left
bank non-overflow dam blocks.
(4) Transmission Patterns and Transmission Work
Based on analysis of power supply scope, after completion, electricity generated in Pak
Beng HPP is mainly exported to Thailand in addition to satisfying the demand of its
neighboring regions, which will not only gain benefit but also promote economic
development of these regions. The electricity is proposed to transmit out through 500kV,
In accordance with the load demand and power grid development status, 230kV outgoing
lines are considered for electric power exchange with the local power grid. The specific
scheme is: double circuit of 500kV outgoing lines is used to transmit to Thailand; double
circuit of 230kV outgoing lines is used to transmit to Laos.
The same transmission mode, voltage class and outgoing circuits are applied when the
installed capacity ranges from 741MW to 1,026MW, and the scheme and cost for the
transmission work to substations in Thailand and Laos are basically identical.
(5) Scheme Formulation of Installed Capacity
Bulb type generating units with capacity of 57MW each are preferred for this project,
and the installed capacity schemes are compared on this basis.
The maximum possible output of the Pak Beng HPP is about 1,040MW. With the single
unit capacity of 57MW, there should be not more than 18 units.
Wide topography at dam site is beneficial to layout of key hydraulic structures in diverse
schemes of installed capacity. The powerhouse is located in the main channel close to the
left bank and left bank slope. On account of wider river channel and gentle bank slope,
increased generating units will not lead to acute increase of excavation volume and a
high slope. The topographic and geological conditions and layout of key hydraulic
structures do not restrict the layout of some 18 generating units.
Such cascades in its upstream area in China as Xiaowan and Nuozhadu are capable of
over year regulating capacity. In accordance with power supply scope and consumption

Engineering-Status-Report
5-41
and considering the economic benefit of Chinese enterprises’s investment into
international projects, the annual utilization hours are preferably 5,000-6,000.
In view of above analysis, the proposed installed capacity should be in the range of
741MW to 1,026MW.
(6) Selection of Installed Capacity
Utilization ratio of water resources of installed capacity options is between
90.70%-97.76% which is within reasonable range in analysis for utilization of water
resources.
Since the additional operating hours of options above 912 MW is much less than 1000h,
it is proper to set installed capacity within 855MW-912MW with consideration of
economic and reasonable utilization of water resources.
Thailand has relatively large market space for consumption of power from Laos, and the
energy output of installed options might be made relatively fully use.
It is feasible in both unit manufacture and transportation, and there is mature experience
of manufacture and operation.
The geographical and geological conditions in dam site area of Pak Beng HPP, layout of
hydraulic structures and bill of quantities exert no restriction on selection of installed
capacity of Pak Beng HPP.
The same transmission mode, voltage class and outgoing circuits might be employed in
installed capacity options; the proposal and investment of transmission works to
substation in Thailand and Laos are generally the same.
The investment increase among options is nearly the same without large sudden change
from the perspective of project investment.
As it is compared in economy, the option of 741MW,798MW and 1,026MW is relatively
unfavorable, while the option of 855MW, 912MW and 969MW is relatively good and
the option of 912 MW is favorable.
To sum up above optional factors, the installed capacity of 912MW is recommended for
HPP in this stage with single unit capacity of 57MW and unit number of 16.
5.9.3 Rated Head and Model of Generating Unit
The Pak Beng HPP is the first cascade of the Mekong River. The Luang Prabang HPP is
downstream of the Pak Beng HPP, but the development time of the Luang Prabang HPP is not
clear yet. In order to provide generator units with relatively good adaptability before and after
completion of Luang Prabang HPP, rated head selection of unit is analyzed and considered
according to both situations with Luang Prabang HPP or not.
Engineering-Status-Report
5-42
When the rated head is higher than 19.50m, Pak Beng HPP cannot generate power at its full
capacity under natural conditions; when the rated head is higher than 18.50m, Pak Beng HPP
cannot generate power at its full capacity under the condition with consideration of the
backwater impact of downstream Luang Prabang Reservoir. With consideration of the
operation conditions of Pak Beng HPP before and after the construction completion of the
downstream Luang Prabang HPP, the rated head of the units of Pak Beng HPP is
recommended as 18 m in this stage based on the economic analysis results and disabled
capacity of the units and left with a proper margin. Besides, the maximum water head is 28m
and the minimum is 7.50m.
As per water head change scope and capacity of a single generating unit and in integration
with the manufacturing level, operation conditions and index of dynamic energy, on the basis
of technical and economic analysis, bulb type generating units with capacity of 57MW each is
recommended, and the proposed model of water turbines is GZ698-WP-650, and the rated
flow of a single generating unit is 360.7m3/s; the model of generators is SFWG57-56/710
with a rated output of 57MW.
5.10 RESERVOIR OPERATION MODEL AND ENERGY INDEX
5.10.1 Reservoir Operation Mode
The development task of Pak Beng HPP is power generation, with the navigation
concurrently. The normal water level of the reservoir is 340m, dead water level 334m and
regulating storage 196 million m3, with daily regulating capability. For operation mode of Pak
Beng Reservoir, it is mainly considered comprehensively to meet requirements on power
generation, navigation and minimize the impact on reservoir tail Keng Pha Dai district.
(1) Requirements on units power generation
According to selection requirements on the units in this stage, maximum power head of
the generating units is 28m, rated one is 18m and minimum one is 7.5m.
(2) Navigation requirements
Pak Beng HPP is located in the navigable channel of Mekong River, of which the project
complex is provided the navigation structure on dam, and the navigation standard is
determined as Class IV according to China standard. Operation of the HPP shall meet
requirements on the navigation river width and navigation depth, fluctuation range of
water level and maximum velocity of flow for shipping. Corresponding to requirements
of navigation width and navigation depth for shipping, requirements on HPP operation is
to provide minimum navigable discharge (In the case of that the navigation standard of
the lower reach is Level IV, minimum navigable discharge is 1,260m3/s). Therefore, the
HPP shall provide certain navigation base-load to meet requirements on navigation width
and navigation depth for shipping. Maximum upper reach navigable water level of ship

Engineering-Status-Report
5-43
lock operation of Pak Beng HPP is 340m, minimum operating navigable water level is
334m, and maximum navigable discharge is 12,900m3/s.
When the HPP is undertaking the task of peak regulation for power system, the power
output and corresponding release discharge of the HPP will change greatly in a short
period, of which the unsteady flow caused will make the water level, flow velocity and
surface gradient of downstream to generate change and fluctuation, thus resulting in
impact on steady operation of ships. Therefore, although Pak Beng HPP has the daily
regulation capacity, the peak regulating operation is not considered for the HPP
temporarily considering the downstream navigation condition, the HPP will generate
electricity mainly based on inflow, running as per the run-of-river HPP, not changing the
intra-annual or intra-daily distributions of the inflow, and outflow of the reservoir is
equal to the inflow.
(3) Impact in Keng Pha Dai District
In the section normal water level researching of Pak Beng HPP, basic information of
Keng Pha Dai district has been analyzed and researched; when inflow under natural
condition is great, most or even all of reefs in Keng Pha Dai District will be submerged,
they only expose to different content when inflow is small, and reefs in Zone D will
remain basically exposed completely when water level is at 337m around; and reef
exposing condition in Zone D of Keng Pha Dai is shown in Figure 5.10-1. After putting
into operation of Pak Beng HPP, water level elevation of Keng Pha Dai region is related
to operating level and reservoir inflow of Pak Beng HPP, therefore, the operation mode
of Pak Beng HPP shall be researched combined with the inflow of reservoir and the
impact on Keng Pha Dai.

Engineering-Status-Report
5-44
Fig. 5.10-1 Diagram of reef exposing condition in Zone D of Keng Pha Dai
According to preliminary research results, reefs in Keng Pha Dai region with an
elevation greater than 335m and with large area are mainly five, of which reefs closely
related to Laos -Thailand boundary are mainly located in Zone D, shown in Figure 5.6-5.
The flat shape of reefs in Zone D is similar to the triangle, with an elevation of about
337m and area of about 10,000 m2, where there are two higher reefs in the middle of this
reef area, with elevations respectively 343.3m (approximate the cone) and 343.4m
(approximate the triangle pyramid). From retaining reefs in Keng Pha Dai region as the
land mark of Laos- Thailand boundary and combined with preliminary research
achievements of normal water level, the impact on reefs in Zone D is mainly considered
in the research of operation mode of Pak Beng Reservoir. It can be seen from Figure
5.10-1 that, when the water level nearby Zone D is not higher than 337m, reefs in Zone
D can remain exposed completely, but when the water level nearby Zone D is 338m, so
most of reefs in Zone D will be submerged. Analyze based on this, in the process of
water level here rising from 337m to 338m gradually, the function of reefs in Zone D as
the land mark of Laos- Thailand boundary will lose gradually, and the function will lose
basically after the water level is higher than 338m.
Engineering-Status-Report
5-45
Based on calculation results of sediment deposition and backwater, in the case of
operation water level of Pak Beng HPP is 335m, when the reservoir inflow is 2,200m3/s,
the water level in Keng Pha Dai district is 337.02m; and the water level in Keng Pha Dai
district will be 338.00m when the reservoir inflow is 3,000m3/s. From retaining regional
function of Keng Pha Dai, when the reservoir inflow is not higher than 2,200m3/s, the
reservoir water level runs as per 355m, the function of Keng Pha Dai District can be
maintained; when the reservoir inflow exceeds 2,200m3/s and increases gradually, even
though the reservoir water level runs to maintain 335m, reefs in Zone D also will be
gradually submerged at this time, the function of Keng Pha Dai as Laos-Thailand
boundary will lose gradually, when the reservoir inflow reaches 3,000m3/s, the water
level nearby reefs in Zone D is 338m, the function is basically lost. Therefore, from the
point of view of preserving the function of Keng Pha Dai District, combined with the
reservoir inflow of Pak Beng HPP, the reservoir water level shall run as per 335m in the
case of that the reservoir inflow of Pak Beng HPP is not higher than 2,200m3/s; When
the reservoir inflow has exceeded 2,200m3/s, the reservoir water level rises gradually,
and in the case of that the discharge increases to 3,000m3/s, the reservoir water level rises
to 340m to run.
(4) Flood control operation
The flood control operation is mainly considered combined with requirements on
navigation, the stability of upstream or downstream reservoir bank slope as well as
minimizing reservoir sediment deposition and reducing the impact of backwater
submerging.
When flood comes in flood season, the reservoir water level of Pak Beng HPP runs
generally at 340m, according to requirements on navigation, maximum navigable
discharge of Pak Beng HPP is 12,900m3/s (the discharge of 3-year return period flood),
and minimum navigable water level is the dead water level 334m, according to this
requirement, in the case of flood peak discharge of the HPP of 3-year return period flood,
12,900m3/s, the reservoir water level will not run lower than 334m, being able to meet
the requirement on navigation.
For ensuring dam complex safety , minimize reservoir sediment deposition and reduce
the impact of reservoir backwater submerging, Pak Beng HPP should operate decreasing
reservoir water level as far as possible in flood season in case of flood. Considered the
impact of water level fluctuating on stability of reservoir bank slope, the daily range of
water level fluctuating of Pak Beng HPP in case of flood in the flood season shall be
controlled as per 1m. Combined with the frequency flood process of reservoir inflow of
Pak Beng HPP dam site, as shown in Figure 5.10-2, in the case of 3-year return period
flood, analyzed based on the reservoir water level 334m corresponding to the flood peak
discharge 12,900m3/s, the fluctuating from 340m to 334m considered as per daily 1m,

Engineering-Status-Report
5-46
the fluctuating needs 6 days, and analyzed based on the process of reservoir inflow in the
case of 3-year return period flood, when the reservoir inflow is about 10,000m3/s, the
reservoir water level of Pak Beng HPP shall drop slowly from 340m.
Fig. 5.10-2 Diagram of flood process at the dam site of Pak Beng HPP
When the reservoir inflow flood is greater than the flood peak discharge 12,900m3/s of
3-year return period flood, navigation shall be stopped, the reservoir water level of Pak
Beng HPP may drop gradually from 334m; based on the analysis on discharge capacity
of flood release structure of Pak Beng HPP, when gates of flood discharge facilities are
opened fully in the case of 5-year return period flood for "open discharge", the reservoir
water level is 332.06m. Meanwhile, analyzed preliminarily combined with reservoir
inflow flood process of 5-year return period flood at the dam site, it takes 2 days that
reservoir inflow flood increases from 12,900m3/s to 14,600m3/s; if the reservoir water
level begins to fluctuate gradually from 334m in the case of 12,900m3/s, gates of flood
discharge facilities are opened fully in the case of 14,600m3/s for "open discharge"
operation, the water level will fluctuate to 332.06m, with a daily water level fluctuating
drop amplitude of about 0.97m, meeting the requirement on daily range of fluctuating of
water level.
From what has been discussed above, when Pak Beng HPP conducts flood control
operation in flood season, it runs by dropping water level from 340m in the case of
reservoir inflow of 10,000m3/s, and the reservoir water level runs as per 334m in the case
of reservoir inflow of 12,900m3/s; in the process of reservoir water level fluctuating, if
units power head is higher than 7.5m, the release discharge passes through
flood-discharging and sand-sluicing gate, sand-sluicing gate , sediment discharge bottom
outlet and the units; and if the units power head is lower than 7.5m, the release discharge

Engineering-Status-Report
5-47
passes through flood-discharging and sand-sluicing gate, sand-sluicing gate , sediment
discharge bottom outlet, and the units stop power generation; When reservoir inflow is
greater than 12,900m3/s, navigation shall be stopped, and reservoir water level drops
continuously from 334m; in the case of peak discharge of 5-year return period flood,
14,600m3/s, gates of flood discharge facilities are opened fully for "open discharge"
operation, the discharge releases through flood-discharging and sand-sluicing gate,
sand-sluicing gate , sediment discharge bottom outlet and sand-sluicing gate in
navigation channel.
(5) Sediment management
Pak Beng HPP operates as per run-of-river power station; according to the sediment
characteristics of Mekong River, sediment load concentrates mainly in the flood season,
particularly when large flood in the river course. According to the proposed reservoir
regulation operation mode, when reservoir inflow of the power station is greater than
3,000m3/s, the reservoir water level runs at 340m; when reservoir inflow is greater than
5,771m3/s, the rated flow of power station, Pak Beng HPP wastes water , the excess
water will be discharged through flood-discharging and sand-sluicing gate, sediment
discharge bottom outlet, to maintain reservoir water level to run as per 340m; When
reservoir inflow is greater than 10,000m3/s, the inflow will be discharged through
flood-discharging and sand-sluicing gate, sediment discharge bottom outlet to lower the
water level in front of the dam; In the case of discharge 12,900m3/s (3-year return period
flood), in order to ensure the navigation, water level in front of dam shall be maintained
at 334m; in the case of discharge 14,600m3/s (5-year return period flood), gates of flood
discharge facilities are opened fully for "open discharge" operation, to allow flood
release and sediment sluicing to be close to a natural river to prevent sediment from
depositing in the reservoir while carry some silt deposit in reservoir. In the case of
sediment sluicing operation of Pak Beng HPP, priority shall be given to opening
sediment discharge bottom outlets in the dam section of powerhouse, to prevent the
coarser sediment particles into the turbine , then opening the flood-discharging and
sand-sluicing gate nearby the dam section of powerhouse, to be favor of increasing the
passing of bed-load sediment to release sediment nearby the sand trap and the
flood-discharging and sand-sluicing gate.
In order to ensure the safety of Pak Beng HPP’s intake and to ensure "clean-before-gate",
Pak Beng HPP should regularly open the flood-discharging and sand-sluicing gate,
sand-sluicing gate and sediment discharge bottom outlet to conduct sediment scouring
operation according to the sediment monitoring. Fish spawning period (usually from
March to June) shall be avoided as sluicing sediment, to avoiding the impact of reservoir
sediment sluicing on fish spawning in downstream river course. The reservoir sediment
scouring time interval with certain water level difference between upstream and
downstream, low sediment content and rich water volume shall be selected according to

Engineering-Status-Report
5-48
monitoring results of sediment, to avoid causing adverse impact to navigation and river
dwellers. Gate may be opened gradually to flushing sediment according to the situations,
thus avoiding the sudden increase of the sediment content in a short time. the sediment
content shall be monitored during flushing, and the impact on the downstream channel
and fish shall also be monitored and investigated, which accumulate information and
experience gradually in determining the reasonable flowing-out sediment content.
(6) Summary on operation mode of reservoir
Considering synthetically all requirements on power generation, navigation, flood
control, sediment, stability of upstream or downstream reservoir bank slope of Pak Beng
HPP and minimizing the impact on reservoir tail Keng Pha Dai region, and on the basis
of previous research, the operation mode of Pak Beng HPP is formulated as follows, and
the reservoir water level - reservoir inflow process is as shown in Figure 5.10-3:
a When the reservoir inflow has not exceeded 2,200m3/s, the reservoir water level runs as
per 335m, to maintain the function of Keng Pha Dai region;
b When the reservoir inflow has exceeded 2,200m3/s, the reservoir water level rises with
increasing of reservoir inflow, and in the case of reservoir inflow reaches 3,000m3/s, the
reservoir water level rises to 340m to run;
c When the reservoir inflow has exceeded 3,000m3/s but not greater than 10,000m3/s, the
reservoir water level runs as per 340m, and for power waste water, if any, excess water
will release through flood release facilities;
d When the reservoir inflow has exceeded 10,000m3/s but not greater than 12,900m3/s, on
the basis of ensuring navigation requirements and considering stability of upstream or
downstream reservoir bank slope, the water reservoir level shall drop gradually to run,
however, reservoir level shall be controlled not below 334m to meet operation
requirements of navigation structures; during the water level dropping process, if power
head turns lower than 7.5m, the units stops power generation;
e When the reservoir inflow has exceeded 12,900m3/s, navigation shall be stopped, and
gates of all flood discharge facilities shall be opened up gradually, the reservoir water
level declines slowly; in the case of reservoir inflow reaches 5-year return period flood,
14,600m3/s, gates of flood discharge facilities are opened fully for “open discharge”
operation, flood discharging and sediment sluicing;

Engineering-Status-Report
5-49
Fig. 5.10-3 Diagram of process of operation level- reservoir inflow of Pak
Beng HPP
(7) Analysis on impact of operation mode on upstream and downstream of Pak Beng HPP
According to the operating mode of formulated, in operation process of Pak Beng HPP,
in order to avoid submerging impact on upstream reservoir tail Keng Pha Dai District,
reservoir water level shall run as per 335m in the case of that reservoir inflow is lower
than 2,200m3/s, which is able to maintain the boundary function of this district. In the
case of that the reservoir inflow has exceeded 2,200m3 and increased gradually, even if
reservoir water level runs maintaining 335m, reefs in Zone D also will be gradually
submerged, and the function of Keng Pha Dai as Laos- Thailand boundary is losing
gradually in the case of that the reservoir inflow reaches 3,000m3/s, and in the case of
that the water level nearby reefs in Zone D is 338m, the function is basically lost.
Therefore, from the point of view of preserving the function of Keng Pha Dai District,
combined with the reservoir inflow of Pak Beng HPP, the reservoir water level shall run
as per 335m in the case of that the reservoir inflow of Pak Beng HPP is not higher than
2,200m3/s; When the reservoir inflow has exceeded 2,200m3/s, the reservoir water level
rises gradually, and in the case of that the inflow increases to 3,000m3/s, the reservoir
water level rises to 340m to run. The operation mode will not cause any impact on
boundary function of reservoir tail Keng Pha Dai District. In order to minimize the
sediment deposition in reservoir area and reduce the impact of reservoir backwater, in
the case of that the reservoir inflow has exceeded 10,000m3/s, reservoir water level starts
to drop from 340m gradually, and in the case of flood peak discharge 14,600m3/s of

Engineering-Status-Report
5-50
5-year return period flood, gates of flood discharge facilities are opened fully for "open
discharge" operation. The daily range of the reservoir water level of about 1m will not
impact basically the stability of upstream reservoir bank slope.
Because operating as per the run-of-river power station, Pak Beng HPP will not change
the intra-annual or intra-daily distribution of reservoir inflow, so the reservoir outflow is
equal to the inflow. Meanwhile, in the reservoir operation process, requirements on the
stability of downstream reservoir bank slope has been fully considered in the change of
reservoir water level, therefore, the Pak Beng HPP will not change hydrological
conditions of lower reach, and not impact the stability of reservoir bank slope of lower
reach after putting into operation.
Pak Beng HPP is located in the north plateau area of Lower Mekong, because of high
gradient, river flows fast in natural conditions. From the analysis of daily flow data at
ChiangSaen hydrological station and Luang Prabang hydrological station, transmission
time from ChiangSaen to Luangprabang is about two days, average velocity is 2m/s.
Discharge at Pak Beng HPP ranges from 793m3/s to 7,290m3/s based on the measured
results at Pak Beng hydrological Station, average velocity ranges from 1.19m/s to
1.79m/s. Velocity will increase with increasing discharge, so, flood transmission time in
flood season is shorter than that in dry season. Reservoir water level will rise after Pak
Beng HPP come into use, according to the operation model for Pak Beng HPP, velocity
in the reservoir area will slow down when small inflow in dry season. As water depth in
the reservoir area is bigger than that in natural conditions, if once-in-5-years flood
happen, wave profile will change significantly, velocity is bigger than that in natural
conditions. The sluice gate will open absolutely when flood with return period over 5
years, water level in the reservoir is similar to that in natural conditions, and velocity
differs little from that in natural conditions.
5.10.2 Energy Index
Pak Beng HPP has a normal water level of 340m (reduced to 335m for operation in dry
seasons) and a dead water level of 334m. The storage corresponding to the normal water level
is 559 million m3. The dead storage is 363 million m3 while the regulation storage is 196
million m3, with a storage factor of 0.002.
The reservoir is capable of daily regulation. Considering Pak Beng HPP is a “low head large
flow” HPP, with the navigation requirements, Pak Beng HPP should operate as a run-of-river
station, the outflow is the inflow.
Pak Beng HPP is designed with 16 units and the installed capacity is 912MW, with a unit
capacity of 57MW. In terms of water head, the rated head is 18m, the maximum head is 28 m
and the minimum head is 7.5m.

Engineering-Status-Report
5-51
The energy indices of Pak Beng HPP are carried out based on the parameters , the operation
mode above and the basic data (Refer to Section 5.5.2 above) , with the consideration of daily
water discharge at the navigation lock (about 8m3/s) and daily water discharge at the fishway
(15m3/s). Pak Beng HPP has a firm output of 360MW (P=90%), an average annual energy
output of 4,765GW·h and the annual utilization hours are 5,225h.
Table 5.10-1 Summary of Energy Index of Pak Beng HPP
Item Unit Index Remark
1. Hydrological data
Catchment area 103km2 218
Annual Average flow at dam site m3/s 3,130/3,057 Natural Condition/
consideration of reservoirs upstream
Runoff series June 1960-May 2014
2. Project parameters
Normal water level m 340 Operating at 335m in dry
season
Corresponding storage capacity 106m3 559
Dead water level m 334
Dead storage capacity 106m3 363
Effective storage capacity 106m3 196
Storage factor 0.002
Installed capacity MW 912
Number of generating units 16
Maximum water head m 28.00
Minimum water head m 7.50 Minimum water head for
safe operation of generating units
Rated head m 18.00
Rated flow m3/s 5,771
3. Energy index
Firm output MW 187/350/360
P=90%, Natural Condition/ consideration of Yunnan
reservoirs upstream/ consideration of Yunnan
and Laos reservoirs upstream
Annual Average energy GW·h 4,140/4,714/4,765
Including: energy in flood season (from June to November)
GW·h 2,995/2,940/2,947
Energy in dry season (from December to May)
GW·h 1,145/1,774/1,818
Utilization hours h 4,539/5,169/5,225
Utilization ratio of water resource % 84.52/93.54/94.24
Weighted average water head m 22.25/22.61/22.63

Engineering-Status-Report
6-1
6 PROJECT LAYOUT
6.1 PROJECT LAYOUT
Run-of-River type development is applied to this project, while a water retaining powerhouse
is adopted. The complex structures consist of water retaining structures, flood release
structures, powerhouse, navigation ship lock and fish passage.
The water retaining structures consist of gravity dam, powerhouse, discharge sluices and ship
lock. The dam crest elevation is 346m, the maximum dam height is about 64m, and the dam
crest length is 896.70m. The powerhouse is located at the left side of main river channel, the
discharge sluices is located at right terrace, and the ship lock is arranged on the right bank.
The flood release structures consist of discharging sluices and sand outlets. The discharging
sluice is located on the right floodland with fourteen 15m×23m (W×H) openings. A stilling
basin with energy dissipation is designed behind the sluices. The sand outlets are designed on
the powerhouse section, and a sand outlet with the opening dimension of 2.5m×5m (W×H) is
constructed between every two generating units, and eight sand outlets are arranged.
The powerhouse consisting of sixteen bulb turbines is designed on the main river channel on
the left side of the riverbed. The powerhouse section is 82.5m long along the water flow
direction and 410m in total along dam axis. The main powerhouse spans 21m, and the spacing
of generating unit section is 20.5m. An erection bay is constructed on its both ends, and the
auxiliary powerhouse is located on the downstream side of the main powerhouse while the
outgoing transmission line platform is situated on the top of the auxiliary powerhouse.
The navigation structure is a one-way one-step ship lock, and the space for the ship lock for
upgrading into a double-way lock is reserved. The one-line lock is being designed at the
present time.
The channel bypass fish passage is arranged on the left bank of the dam.
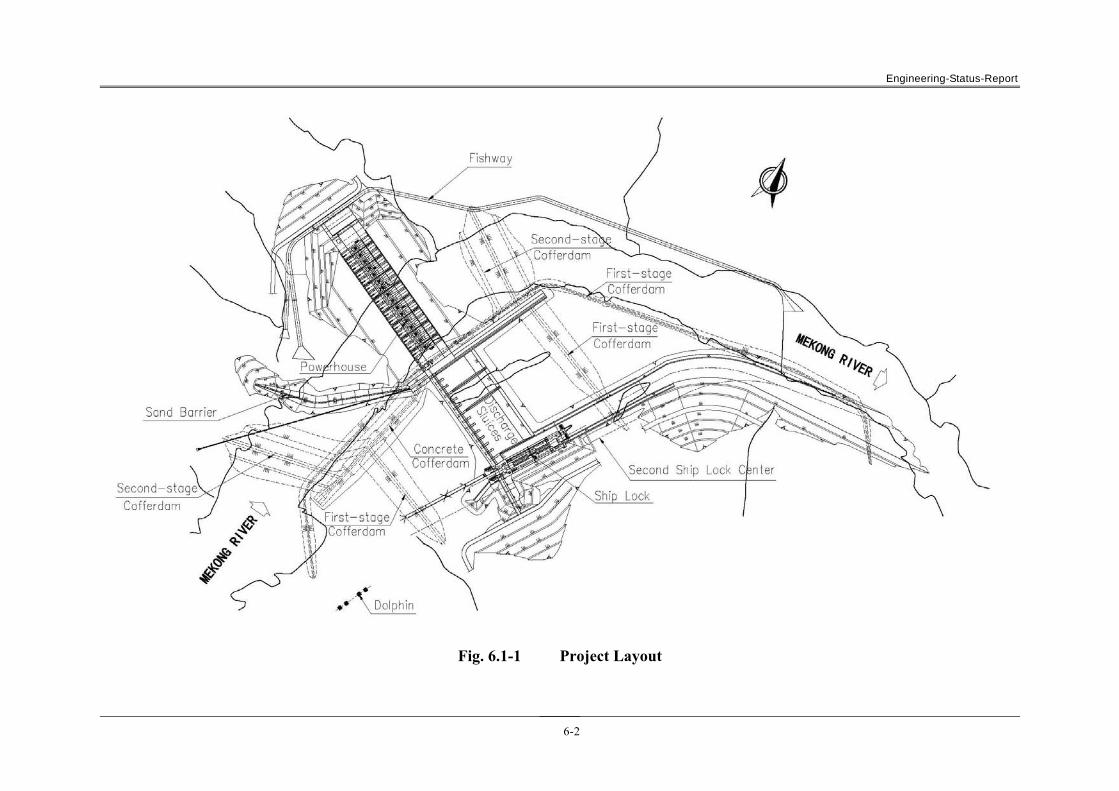
Engineering-Status-Report
6-2
Fig. 6.1-1 Project Layout

Engineering-Status-Report
6-3
Fig. 6.1-2 Upstream Elevation
Engineering-Status-Report
6-4
6.2 WATER RETAINING STRUCTURES
The water retaining structures consist of gravity dam, powerhouse, discharge sluices and ship
lock. The dam crest elevation is 346m, the maximum dam height is 64m, and the dam crest
length is 896.70m.
Non-overflow dam sections with the length of 47m is designed on the left bank, while 100m
long non-overflow dam sections is set on the right bank..
Ten powerhouse dam sections with a total length of 410m are designed on the main river
channel, and the maximum height of powerhouse is 64m.
The discharging sluice sections consist of fourteen blocks with a total length of 299.5m. The
foundation ranges from EL.304m to EL.307.5m, and the maximum dam height is 42m.
The ship lock section is 42m wide, and the foundation plane of its upper head is located on
EL.290m~304m, and the maximum dam height is 56m.
6.3 FLOOD RELEASE STRUCTURES
Flood release structures consist of discharge sluices and sand outlets. Discharge sluices
located on the right bottomland are major flood release structures of the complex.
In order to prevent sediment from entering power intakes, a sand barrier is arranged before the
powerhouse section with a view to diverting sediment into the discharge sluices to pass dam
and go downstream.
Sand outlets are situated in the powerhouse section, mainly for discharging sediment in
suspension accumulated before the power intakes.
6.4 POWERHOUSE STRUCTURES
Now that the power intake is lower than the river bed, an approach with a proposed slope of
1:4 (V:H) needs to be excavated before power intakes to link the river channel. As the bottom
of the approach is mostly alluvium, concrete slab is proposed for protection with a view to
prevent the channel bottom from being eroded.
To prevent sediment from entering power intakes, a debris barrier with the crest elevation
297.4m is arranged before intakes, and 8.9m higher than the inlet slab of sand outlets.
A vertical trash rack is designed for the power intake. A two-opening trash rack with
5.65m×38.6m dimension and a 13.8m×17.2m (W×H) bulkhead gate is applied to the power
intake of each generating unit while one 13.8m×11m (W×H) emergency gate is designed for
the tailrace outlet.
The elevation of tailrace slab is 294.5m, and a tailrace channel with 1:5 (V:H) slope ratio is
connected to the downstream river channel, and the bottom is protected with a concrete slab.
Engineering-Status-Report
6-5
Sixteen bulb turbines are designed in powerhouse. There are eight generator sections, which
are 41m long along dam axis, and each section has two generators. In order to facilitate
installation and maintenance of generating units, a 41m-lomg erection bay is constructed on
both ends of the generator section.
The span of main powerhouse is 21m. The installation elevation of generating units is on
300.00m while the elevation of generator floor is on 321.30m, and the clear height of
powerhouse above the generator floor is 26.2m. The roof of main powerhouse is constructed
of light steel structures.
The auxiliary powerhouse is located downstream of the main powerhouse, and water supply
equipment room, auxiliary power equipment room, main transformer chamber, cable layer are
arranged in turn from down to up. The outgoing line platform is located on the top of the
auxiliary powerhouse, and the tailrace platform which is situated at the downstream side of
the outgoing line platform is used for layout of gantry cranes for hoisting the tailrace gate and
bulkhead gate and roadway. The sump well for powerhouse drainage is located below the
erection bay on the left of the powerhouse.
Both the upstream side and downstream side of the powerhouse are a water retaining structure.
The power intake platform and tailrace platform are located on the elevation of 346m and
344m respectively.
6.5 NAVIGATION STRUCTURES
The navigation ship lock is composed by head bay, lock chamber, tail bay and the water
conveyance system. The maximum working head of navigation lock is 32.38m, effective size
of lock chamber is 120m×12m×4m. The head bay and the lock chamber adopt integral
structure.
It is designed to be one way and one step lock, and the passing time of ship can be guaranteed
not to exceed 30min.
6.6 FISHWAY STRUCTURES
Bypass channel fish passage is arranged in the left bank, it is approximately 1.6km long and
10m wide. The slope of it is about 1.85%. And the fish passage allows fish migrate upstream
and downstream, two exits are designed for it, so it can operate between EL.340m (normal
operation water level of flood season) and El.335m (normal operation water level of dry
season). When the next cascade project comes into commission downstream water level will
be EL.310m.
The minimum downstream water level will be 310m when the Luang Prabang is
commissioned, so the entrance of fish passage is set to EL.308m. In order to guide the fishes
to find the entrance barrier screens is designed from entrance side to the opposite bank.
In order to allow the operation under different upstream water level, the fish passage includes
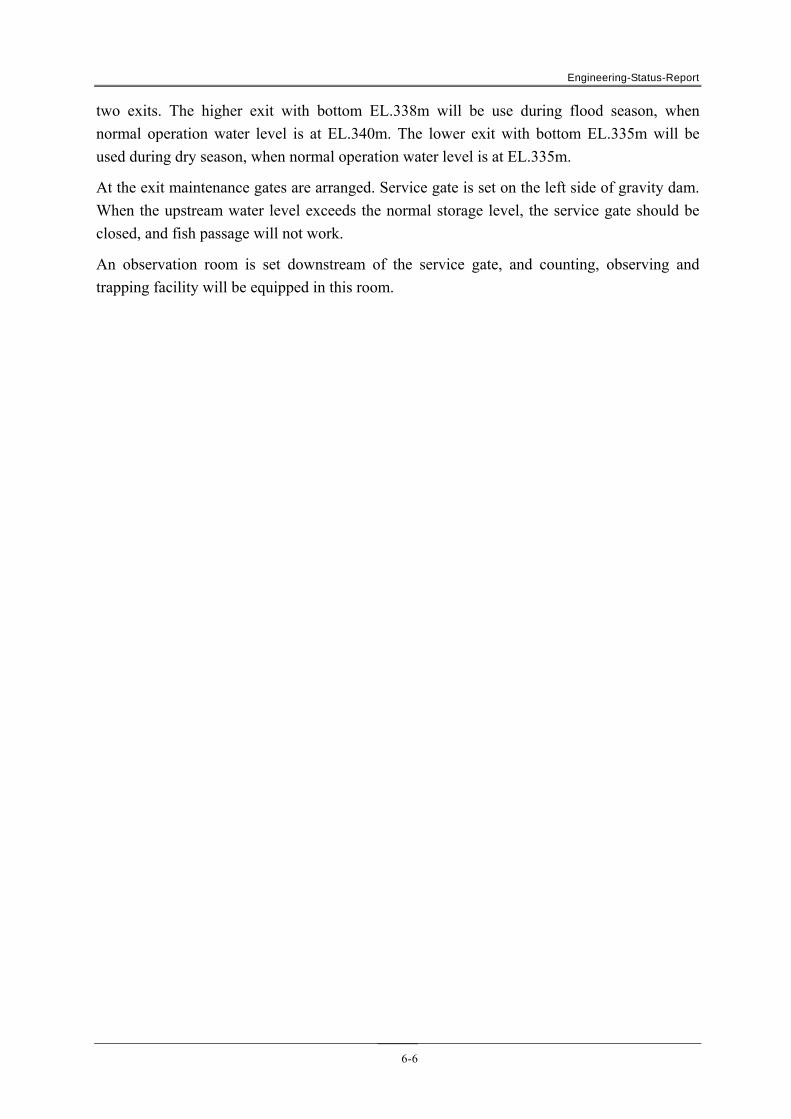
Engineering-Status-Report
6-6
two exits. The higher exit with bottom EL.338m will be use during flood season, when
normal operation water level is at EL.340m. The lower exit with bottom EL.335m will be
used during dry season, when normal operation water level is at EL.335m.
At the exit maintenance gates are arranged. Service gate is set on the left side of gravity dam.
When the upstream water level exceeds the normal storage level, the service gate should be
closed, and fish passage will not work.
An observation room is set downstream of the service gate, and counting, observing and
trapping facility will be equipped in this room.
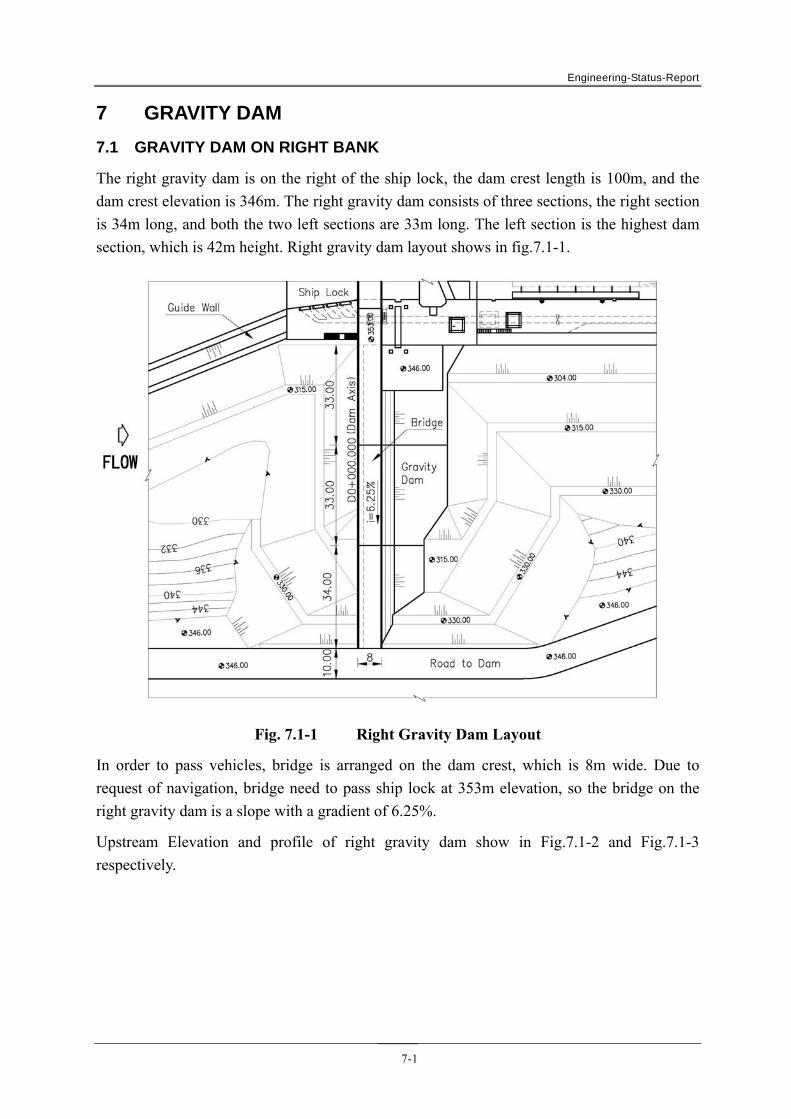
Engineering-Status-Report
7-1
7 GRAVITY DAM
7.1 GRAVITY DAM ON RIGHT BANK
The right gravity dam is on the right of the ship lock, the dam crest length is 100m, and the
dam crest elevation is 346m. The right gravity dam consists of three sections, the right section
is 34m long, and both the two left sections are 33m long. The left section is the highest dam
section, which is 42m height. Right gravity dam layout shows in fig.7.1-1.
Fig. 7.1-1 Right Gravity Dam Layout
In order to pass vehicles, bridge is arranged on the dam crest, which is 8m wide. Due to
request of navigation, bridge need to pass ship lock at 353m elevation, so the bridge on the
right gravity dam is a slope with a gradient of 6.25%.
Upstream Elevation and profile of right gravity dam show in Fig.7.1-2 and Fig.7.1-3
respectively.

Engineering-Status-Report
7-2
Fig. 7.1-2 Upstream Elevation of Right Gravity Dam
Fig. 7.1-3 Profile of Right Gravity Dam
7.2 GRAVITY DAM ON LEFT BANK
The Left gravity dam is on the left of the powerhouse, the dam crest length is 48m, and the
dam crest elevation is 346m. The left gravity dam consists of two sections, the right section is
25m long, and the left section is 23m long. The right section is the highest dam section, which
is 26m height.
Left gravity dam layout shows in Fig.7.2-1.
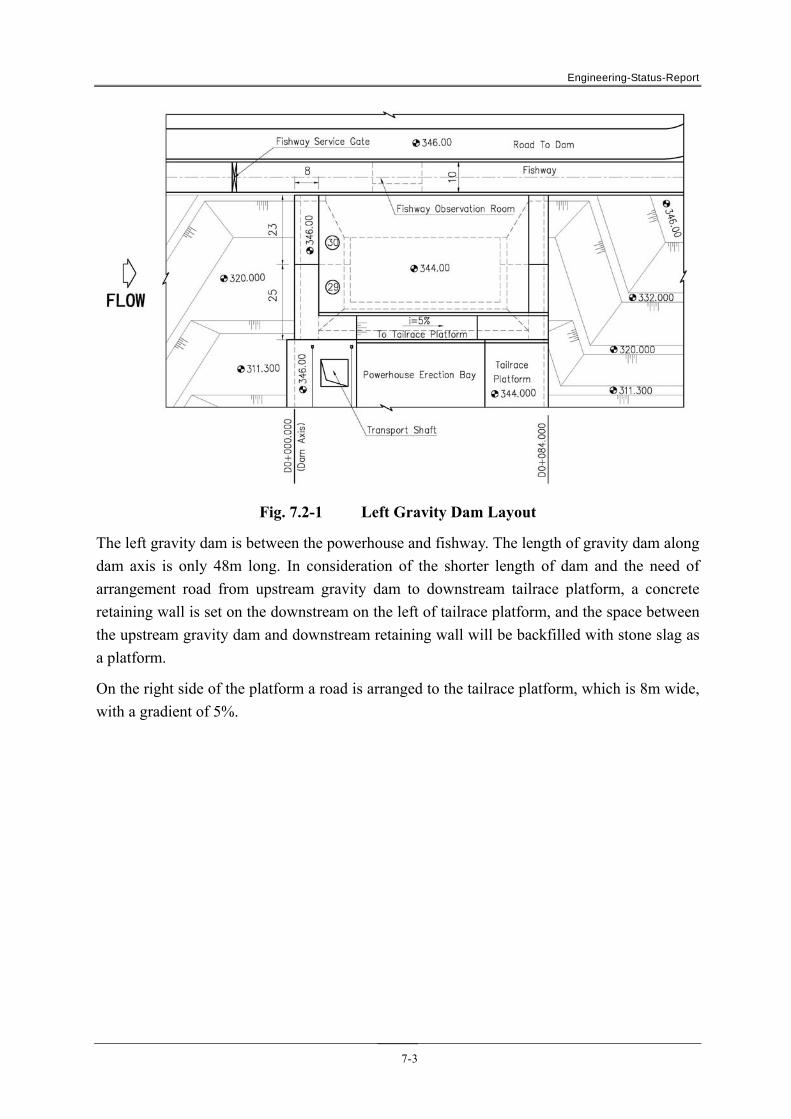
Engineering-Status-Report
7-3
Fig. 7.2-1 Left Gravity Dam Layout
The left gravity dam is between the powerhouse and fishway. The length of gravity dam along
dam axis is only 48m long. In consideration of the shorter length of dam and the need of
arrangement road from upstream gravity dam to downstream tailrace platform, a concrete
retaining wall is set on the downstream on the left of tailrace platform, and the space between
the upstream gravity dam and downstream retaining wall will be backfilled with stone slag as
a platform.
On the right side of the platform a road is arranged to the tailrace platform, which is 8m wide,
with a gradient of 5%.
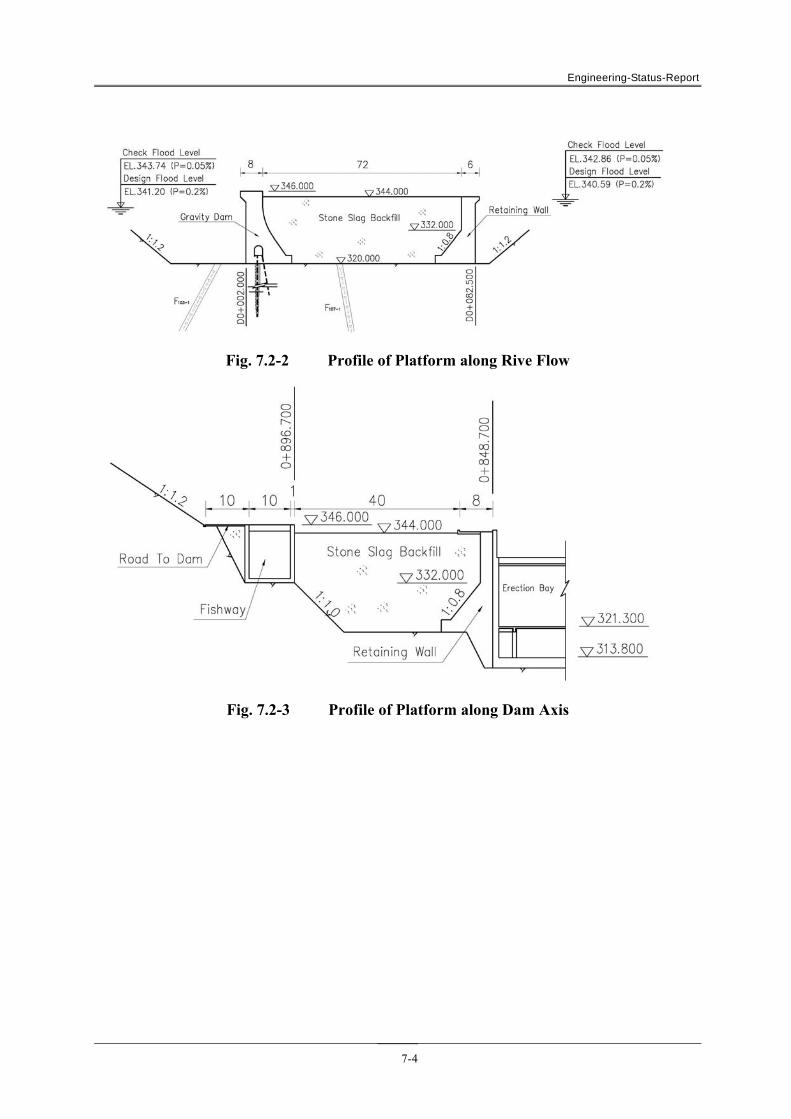
Engineering-Status-Report
7-4
Fig. 7.2-2 Profile of Platform along Rive Flow
Fig. 7.2-3 Profile of Platform along Dam Axis
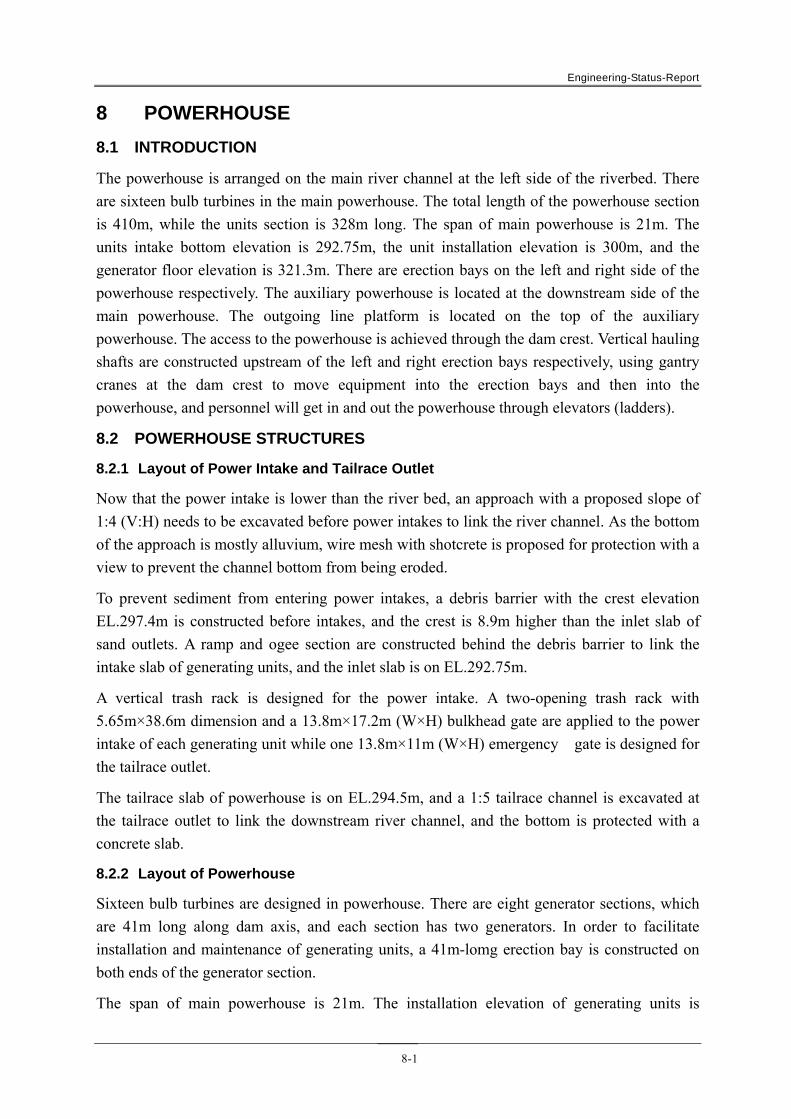
Engineering-Status-Report
8-1
8 POWERHOUSE
8.1 INTRODUCTION
The powerhouse is arranged on the main river channel at the left side of the riverbed. There
are sixteen bulb turbines in the main powerhouse. The total length of the powerhouse section
is 410m, while the units section is 328m long. The span of main powerhouse is 21m. The
units intake bottom elevation is 292.75m, the unit installation elevation is 300m, and the
generator floor elevation is 321.3m. There are erection bays on the left and right side of the
powerhouse respectively. The auxiliary powerhouse is located at the downstream side of the
main powerhouse. The outgoing line platform is located on the top of the auxiliary
powerhouse. The access to the powerhouse is achieved through the dam crest. Vertical hauling
shafts are constructed upstream of the left and right erection bays respectively, using gantry
cranes at the dam crest to move equipment into the erection bays and then into the
powerhouse, and personnel will get in and out the powerhouse through elevators (ladders).
8.2 POWERHOUSE STRUCTURES
8.2.1 Layout of Power Intake and Tailrace Outlet
Now that the power intake is lower than the river bed, an approach with a proposed slope of
1:4 (V:H) needs to be excavated before power intakes to link the river channel. As the bottom
of the approach is mostly alluvium, wire mesh with shotcrete is proposed for protection with a
view to prevent the channel bottom from being eroded.
To prevent sediment from entering power intakes, a debris barrier with the crest elevation
EL.297.4m is constructed before intakes, and the crest is 8.9m higher than the inlet slab of
sand outlets. A ramp and ogee section are constructed behind the debris barrier to link the
intake slab of generating units, and the inlet slab is on EL.292.75m.
A vertical trash rack is designed for the power intake. A two-opening trash rack with
5.65m×38.6m dimension and a 13.8m×17.2m (W×H) bulkhead gate are applied to the power
intake of each generating unit while one 13.8m×11m (W×H) emergency gate is designed for
the tailrace outlet.
The tailrace slab of powerhouse is on EL.294.5m, and a 1:5 tailrace channel is excavated at
the tailrace outlet to link the downstream river channel, and the bottom is protected with a
concrete slab.
8.2.2 Layout of Powerhouse
Sixteen bulb turbines are designed in powerhouse. There are eight generator sections, which
are 41m long along dam axis, and each section has two generators. In order to facilitate
installation and maintenance of generating units, a 41m-lomg erection bay is constructed on
both ends of the generator section.
The span of main powerhouse is 21m. The installation elevation of generating units is
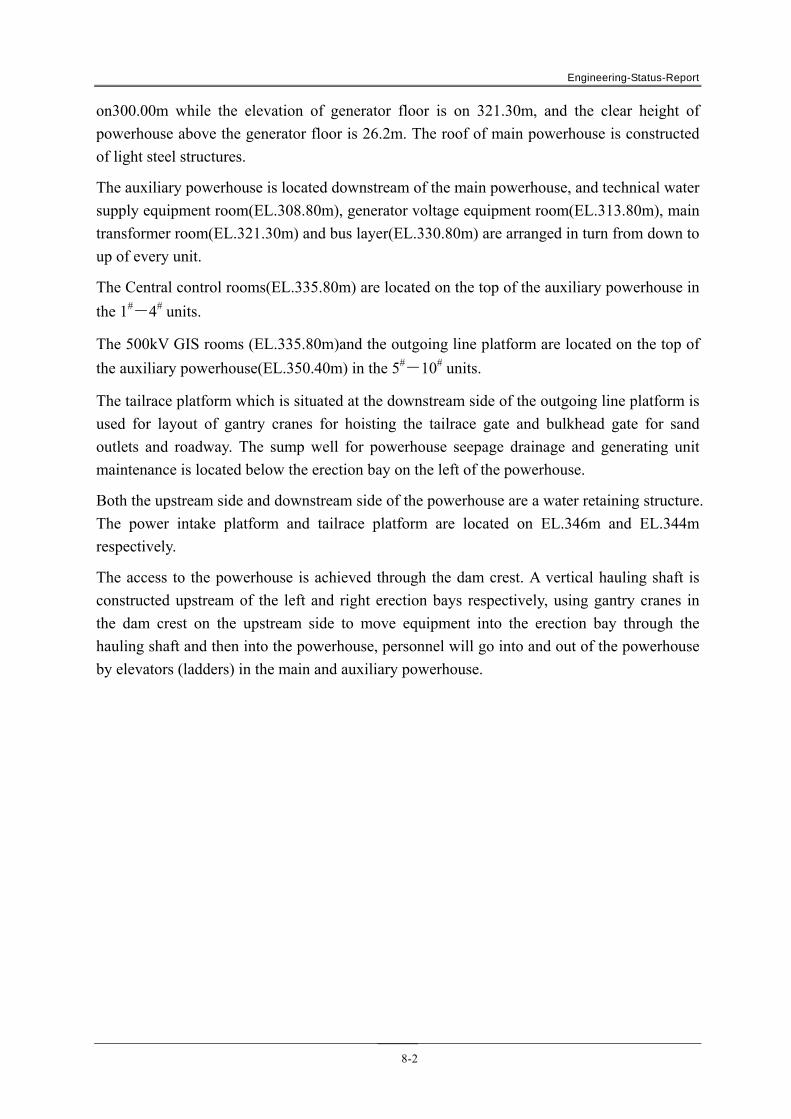
Engineering-Status-Report
8-2
on300.00m while the elevation of generator floor is on 321.30m, and the clear height of
powerhouse above the generator floor is 26.2m. The roof of main powerhouse is constructed
of light steel structures.
The auxiliary powerhouse is located downstream of the main powerhouse, and technical water
supply equipment room(EL.308.80m), generator voltage equipment room(EL.313.80m), main
transformer room(EL.321.30m) and bus layer(EL.330.80m) are arranged in turn from down to
up of every unit.
The Central control rooms(EL.335.80m) are located on the top of the auxiliary powerhouse in
the 1#-4# units.
The 500kV GIS rooms (EL.335.80m)and the outgoing line platform are located on the top of
the auxiliary powerhouse(EL.350.40m) in the 5#-10# units.
The tailrace platform which is situated at the downstream side of the outgoing line platform is
used for layout of gantry cranes for hoisting the tailrace gate and bulkhead gate for sand
outlets and roadway. The sump well for powerhouse seepage drainage and generating unit
maintenance is located below the erection bay on the left of the powerhouse.
Both the upstream side and downstream side of the powerhouse are a water retaining structure.
The power intake platform and tailrace platform are located on EL.346m and EL.344m
respectively.
The access to the powerhouse is achieved through the dam crest. A vertical hauling shaft is
constructed upstream of the left and right erection bays respectively, using gantry cranes in
the dam crest on the upstream side to move equipment into the erection bay through the
hauling shaft and then into the powerhouse, personnel will go into and out of the powerhouse
by elevators (ladders) in the main and auxiliary powerhouse.

Engineering-Status-Report
9-1
9 WATER RELEASE STRUCTURES
9.1 INTRODUCTION
9.1.1 Flood Design Criteria
The dam of this project is a concrete gated dam with a maximum height of 64m. The
possibility of dam failure is extremely slight, and the impact on the downstream area remains
small even in case of such disasters. In accordance with the preliminary analysis results of
dam disasters, dam break floods at 2km downstream of the dam have developed into a natural
state, and constitute unobvious impacts on the downstream area. In accordance with
requirements of Lao Electric Power Technical Standards and by reference to design
experience of similar projects, the maximum flood of key hydraulic structures is based upon
2,000-year frequency floods.
In accordance with navigation conditions of the river section on which the key hydraulic
structures are located, the proposed maximum navigational water level for navigation
structures is based on 3-year frequency floods.
Refer to Table 9.1-1 for flood design criteria for key hydraulic structures.
Table 9.1-1 Design Standard for Flood
Design Criteria
Item Unit Dam PowerhouseShip lock
Lock approach channel
Energy dissipater
Design Flood
Return period Year 500 500 500 3 50
Flood discharge
m3/s 26800 26800 26800 12900 21100
Check Flood
Return period Year 2000 2000 2000
Flood discharge
m3/s 30200 30200 30200
9.1.2 Basic Data
(1) Flood
Refer to Table 9.1-2 for flood at dam site.
Table 9.1-2 Flood at Dam Site
Flood frequency (%) 50 33.33 20 10 5 3.33 2
Return period (year) 2 3 5 10 20 30 50
Peak discharge (m3/s) 11300 12900 14600 16700 18700 19800 21100
Flood frequency (%) 1 0.5 0.33 0.2 0.1 0.05
Return period (year) 100 200 300 500 1000 2000
Peak discharge (m3/s) 22900 24600 25600 26800 28500 30200
(2) Rating Curve at Dam Site

Engineering-Status-Report
9-2
Rating curve at dam site refers to Table 9.1-3.
Table 9.1-3 Water Level – Discharge Relation at Dam Site
Water Level
(m)
Discharge
(m3/s)
Water Level
(m)
Discharge
(m3/s)
Water Level
(m)
Discharge
(m3/s)
304.15 496 316.46 3870 330.29 13200
305.11 660 317.46 4270 331.28 14200
306.10 840 318.39 4670 332.43 15500
307.02 1020 319.40 5100 333.34 16700
307.98 1200 320.26 5540 334.38 18100
308.98 1410 321.14 6040 335.33 19400
309.90 1620 322.13 6630 336.35 20800
310.86 1860 323.17 7270 337.37 22200
311.82 2120 324.25 7960 338.45 23700
312.67 2380 325.27 8700 339.43 25100
313.33 2620 326.33 9530 340.39 26500
313.99 2880 327.35 10400 341.33 27900
314.67 3160 328.19 11200 342.20 29200
315.51 3500 329.14 12100 343.05 30500
9.1.3 Complex Layout
The flood release structures consist of discharge sluices and sand outlets. The discharge
sluices are located on the right floodland with fourteen 15m×23m(W×H) openings. A stilling
basin with energy dissipation by hydraulic jump is designed behind the sluices. The sand
outlets are designed on the powerhouse section, and a sand outlet with the opening dimension
of 2.5m×5m (W×H) is constructed between every two generating units, and eight sand outlets
are designed.
9.2 BOTTOM OUTLETS
In order to prevent siltation before the power intake and assure clear water entering into the
intakes, eight 2.5m×5m(W×H) sand outlets are designed in the powerhouse section with one
for every two generating units passing through the bottom of the powerhouse. The bottom
elevation of the inlet and outlet is 288.5m and 300m respectively. In addition, a bulkhead gate
is designed for the inlet and outlet respectively, while a plain service gate is designed for the
outlet.
Sand outlet layout and profile refer to fig.9.2-1 and fig.9.2-2 respectively.
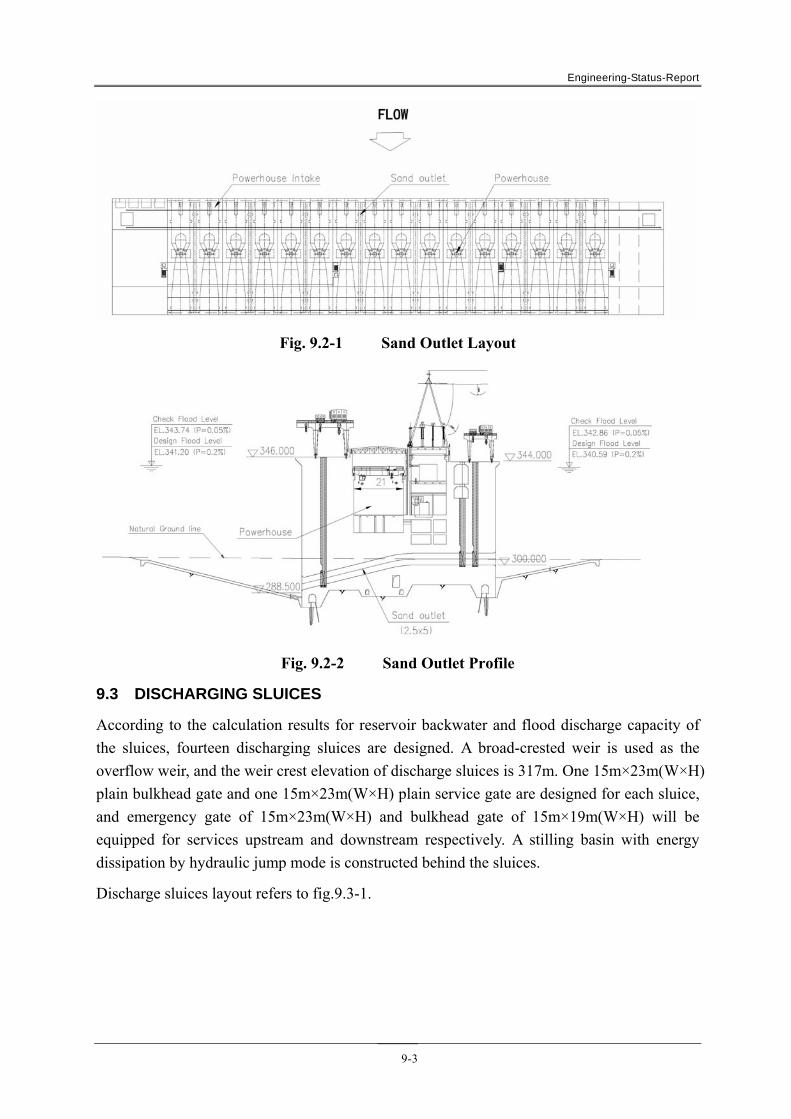
Engineering-Status-Report
9-3
Fig. 9.2-1 Sand Outlet Layout
Fig. 9.2-2 Sand Outlet Profile
9.3 DISCHARGING SLUICES
According to the calculation results for reservoir backwater and flood discharge capacity of
the sluices, fourteen discharging sluices are designed. A broad-crested weir is used as the
overflow weir, and the weir crest elevation of discharge sluices is 317m. One 15m×23m(W×H)
plain bulkhead gate and one 15m×23m(W×H) plain service gate are designed for each sluice,
and emergency gate of 15m×23m(W×H) and bulkhead gate of 15m×19m(W×H) will be
equipped for services upstream and downstream respectively. A stilling basin with energy
dissipation by hydraulic jump mode is constructed behind the sluices.
Discharge sluices layout refers to fig.9.3-1.

Engineering-Status-Report
9-4
Fig. 9.3 1 Discharge Sluices Layout
1#discharging sluice is located at left side of ship lock, its main function is to flush the
sediment deposited on access channel, and it can be used as discharge sluice when ship lock is
closed, and it was named as navigation discharge sluice.
2# to 14# discharge sluices are the main discharging sluices of spillway, which are named as
discharge sluices, and divided into three zones as follows. Zone 1 is on the left, it consisted of
three sluices (12# to 14#). Zone 2 is on the right side of zone 1, it consisted of three sluices
also (9# to 11#). Zone 3 is on the right side of zone 2, and it consisted of seven sluices (2# to
8#). All the bottom elevation of the stilling basin of zone 1, zone 2 and zone 3 are 312.5m.
Sluices of zone 1 and 2 are chiefly opened for frequent flood discharge, when floods are
larger all discharge sluices will open for discharging.
Discharge sluice and navigation discharge sluice profile refer to Fig.9.3-2 and Fig.9.3-3
respectively.

Engineering-Status-Report
9-5
Fig. 9.3-2 Discharge Sluice Profile
Fig. 9.3-3 Navigation Discharge Sluice Profile
9.4 DISCHARGE CAPACITY
9.4.1 Discharge Capacity for Normal Condition
Table 9.4-1 shows discharge capacity for normal condition, all flood release structures are
working well in this case.
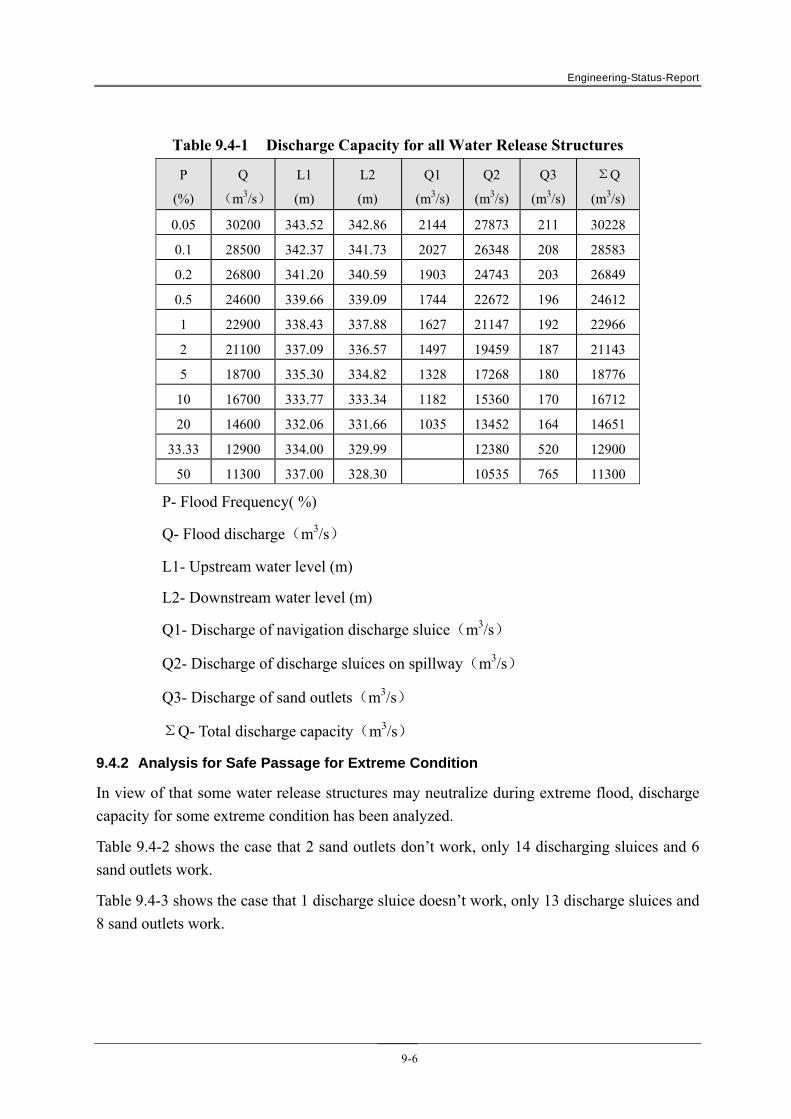
Engineering-Status-Report
9-6
Table 9.4-1 Discharge Capacity for all Water Release Structures
P
(%)
Q
(m3/s)
L1
(m)
L2
(m)
Q1
(m3/s)
Q2
(m3/s)
Q3
(m3/s)
ΣQ
(m3/s)
0.05 30200 343.52 342.86 2144 27873 211 30228
0.1 28500 342.37 341.73 2027 26348 208 28583
0.2 26800 341.20 340.59 1903 24743 203 26849
0.5 24600 339.66 339.09 1744 22672 196 24612
1 22900 338.43 337.88 1627 21147 192 22966
2 21100 337.09 336.57 1497 19459 187 21143
5 18700 335.30 334.82 1328 17268 180 18776
10 16700 333.77 333.34 1182 15360 170 16712
20 14600 332.06 331.66 1035 13452 164 14651
33.33 12900 334.00 329.99 12380 520 12900
50 11300 337.00 328.30 10535 765 11300
P- Flood Frequency( %)
Q- Flood discharge(m3/s)
L1- Upstream water level (m)
L2- Downstream water level (m)
Q1- Discharge of navigation discharge sluice(m3/s)
Q2- Discharge of discharge sluices on spillway(m3/s)
Q3- Discharge of sand outlets(m3/s)
ΣQ- Total discharge capacity(m3/s)
9.4.2 Analysis for Safe Passage for Extreme Condition
In view of that some water release structures may neutralize during extreme flood, discharge
capacity for some extreme condition has been analyzed.
Table 9.4-2 shows the case that 2 sand outlets don’t work, only 14 discharging sluices and 6
sand outlets work.
Table 9.4-3 shows the case that 1 discharge sluice doesn’t work, only 13 discharge sluices and
8 sand outlets work.
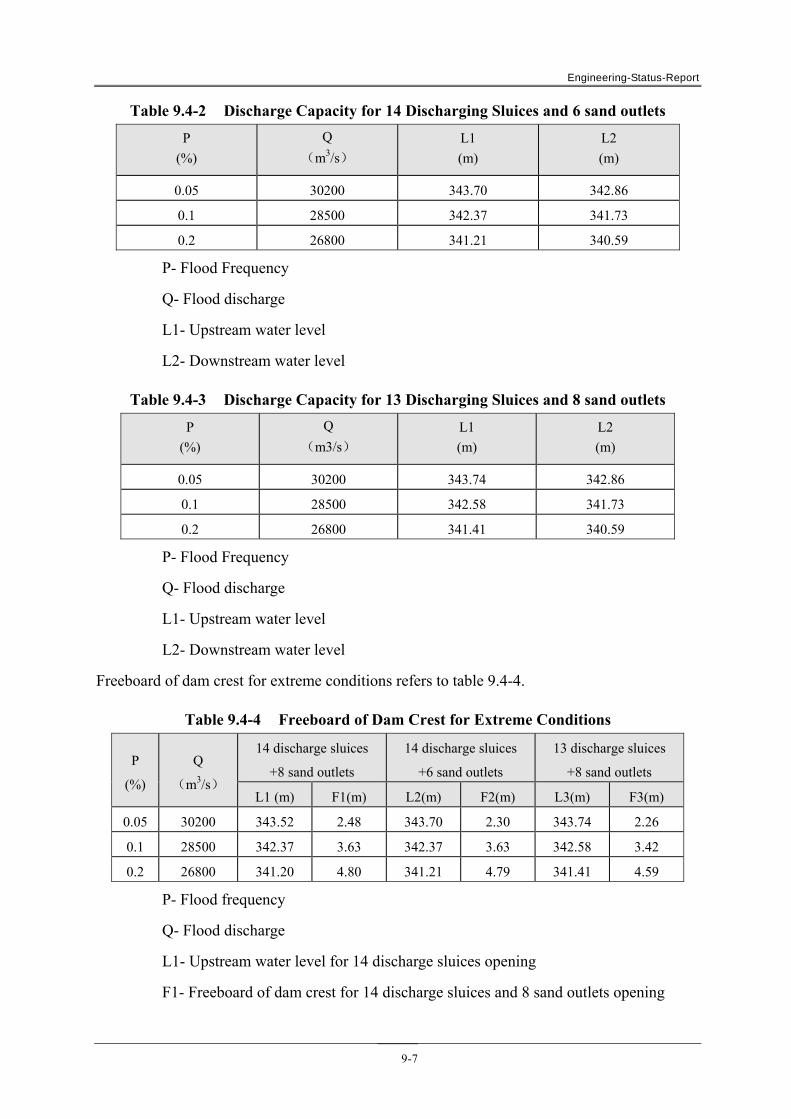
Engineering-Status-Report
9-7
Table 9.4-2 Discharge Capacity for 14 Discharging Sluices and 6 sand outlets
P
(%)
Q
(m3/s)
L1
(m)
L2
(m)
0.05 30200 343.70 342.86
0.1 28500 342.37 341.73
0.2 26800 341.21 340.59
P- Flood Frequency
Q- Flood discharge
L1- Upstream water level
L2- Downstream water level
Table 9.4-3 Discharge Capacity for 13 Discharging Sluices and 8 sand outlets
P
(%)
Q
(m3/s)
L1
(m)
L2
(m)
0.05 30200 343.74 342.86
0.1 28500 342.58 341.73
0.2 26800 341.41 340.59
P- Flood Frequency
Q- Flood discharge
L1- Upstream water level
L2- Downstream water level
Freeboard of dam crest for extreme conditions refers to table 9.4-4.
Table 9.4-4 Freeboard of Dam Crest for Extreme Conditions
P
(%)
Q
(m3/s)
14 discharge sluices
+8 sand outlets
14 discharge sluices
+6 sand outlets
13 discharge sluices
+8 sand outlets
L1 (m) F1(m) L2(m) F2(m) L3(m) F3(m)
0.05 30200 343.52 2.48 343.70 2.30 343.74 2.26
0.1 28500 342.37 3.63 342.37 3.63 342.58 3.42
0.2 26800 341.20 4.80 341.21 4.79 341.41 4.59
P- Flood frequency
Q- Flood discharge
L1- Upstream water level for 14 discharge sluices opening
F1- Freeboard of dam crest for 14 discharge sluices and 8 sand outlets opening
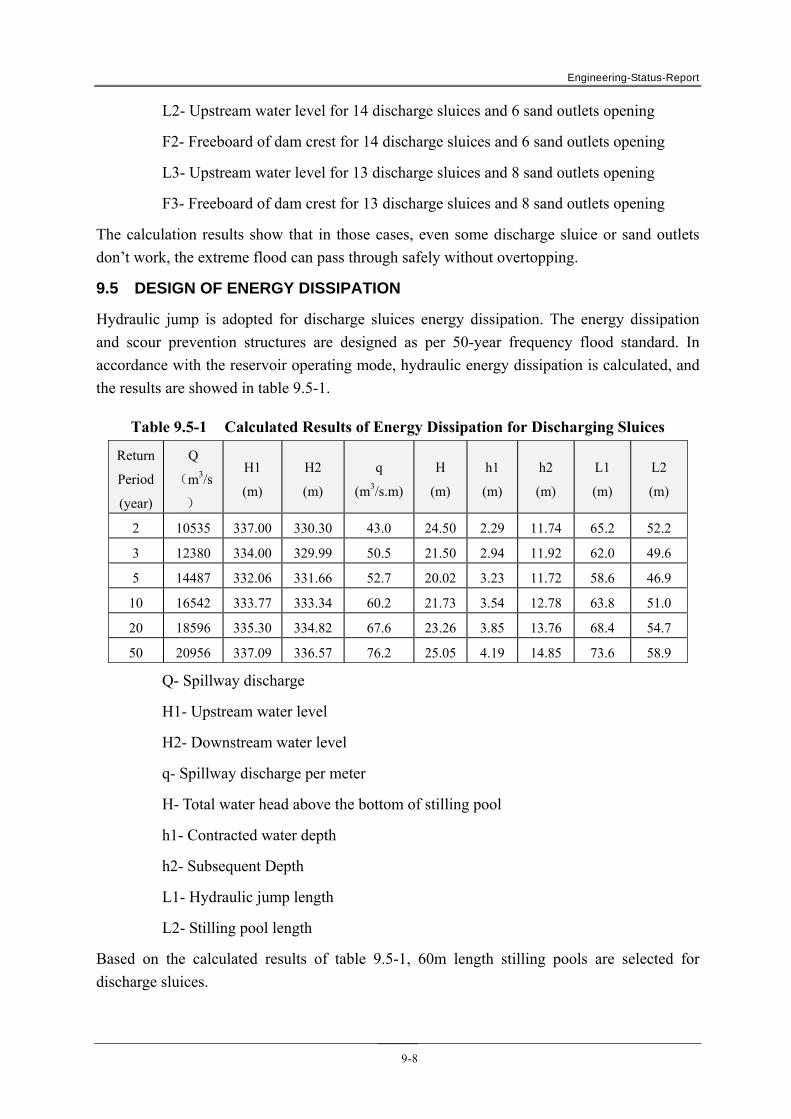
Engineering-Status-Report
9-8
L2- Upstream water level for 14 discharge sluices and 6 sand outlets opening
F2- Freeboard of dam crest for 14 discharge sluices and 6 sand outlets opening
L3- Upstream water level for 13 discharge sluices and 8 sand outlets opening
F3- Freeboard of dam crest for 13 discharge sluices and 8 sand outlets opening
The calculation results show that in those cases, even some discharge sluice or sand outlets
don’t work, the extreme flood can pass through safely without overtopping.
9.5 DESIGN OF ENERGY DISSIPATION
Hydraulic jump is adopted for discharge sluices energy dissipation. The energy dissipation
and scour prevention structures are designed as per 50-year frequency flood standard. In
accordance with the reservoir operating mode, hydraulic energy dissipation is calculated, and
the results are showed in table 9.5-1.
Table 9.5-1 Calculated Results of Energy Dissipation for Discharging Sluices
Return
Period
(year)
Q
(m3/s
)
H1
(m)
H2
(m)
q
(m3/s.m)
H
(m)
h1
(m)
h2
(m)
L1
(m)
L2
(m)
2 10535 337.00 330.30 43.0 24.50 2.29 11.74 65.2 52.2
3 12380 334.00 329.99 50.5 21.50 2.94 11.92 62.0 49.6
5 14487 332.06 331.66 52.7 20.02 3.23 11.72 58.6 46.9
10 16542 333.77 333.34 60.2 21.73 3.54 12.78 63.8 51.0
20 18596 335.30 334.82 67.6 23.26 3.85 13.76 68.4 54.7
50 20956 337.09 336.57 76.2 25.05 4.19 14.85 73.6 58.9
Q- Spillway discharge
H1- Upstream water level
H2- Downstream water level
q- Spillway discharge per meter
H- Total water head above the bottom of stilling pool
h1- Contracted water depth
h2- Subsequent Depth
L1- Hydraulic jump length
L2- Stilling pool length
Based on the calculated results of table 9.5-1, 60m length stilling pools are selected for
discharge sluices.

Engineering-Status-Report
10-1
10 SHIP LOCK AND CHANNEL
10.1 INTRODUCTION
The navigation structures are arranged on right bank bottomland and right side of discharging
sluice, which consist of ship lock and access channel. The working head of lock is as high as
32.38m, based on the physical model study (see special reports) of navigation lock and design
experience of locks whose water head exceeding 30m in the world, Pak Beng navigation lock
is designed to be one-step ship lock, and when the next cascade project comes into
commission the water head will be less than 30m, so one step navigation lock can operate
safely. Water conveyance galleries are set along both side walls, and a decentralized water
conveyance system is constructed on the bottom of bay. Annual total gross weight of ships for
one-way to pass through the ship lock is about 1.5×10⁶t.
10.2 SHIP LOCK
Main body structures of ship lock include upper lock head, lock chamber and lower lock head.
10.2.1 Upper Lock Head
The upper lock head is part of water retaining structure, and consists of curtain wall and side
walls on both sides. The top elevation of the side wall is 346m, the proposed width of right
and left side wall at dam axis are 15m and 13.2m respectively, and a water conveyance gallery
and bulkhead gate are arranged inside. A 12m-wide navigation channel with bottom elevation
of 330m is designed on the top of curtain wall. A 13.54m-high miter gate and a 13.54m-high
bulkhead gate are constructed in the navigation channel.
10.2.2 Lock Chamber
Lock chamber structure is 120m long, and the foundation elevation is 287.00m-293.00m. The
top elevation of the lock chamber wall is 342m, and the bottom elevation of the lock chamber
is 302.62m. Water conveyance galleries are set along both side walls, and a decentralized
water conveyance system is constructed on the bottom of chamber.
Floating bollard and wall ladder are set on the lateral wall. And enough safety margin of the
important parts in chamber is concerned in design.
10.2.3 Lower lock Head
The 41m-long and 42m-wide lower lock head is an integral structure consisting of both side
walls and slabs. The elevationof side wall top and lock sill top are 342m and 303.62m
respectively. A water conveyance gallery and a bulkhead gate are designed in the side wall. A
12m-wide navigation channel is constructed between both side walls, and a 37.38m-high gate
and a 6.63m-high bulkhead gate are constructed in the navigation channel.

Engineering-Status-Report
10-2
10.3 UPSTREAM AND DOWNSTREAM APPROACH CHANNEL
10.3.1 Width of Approach Channel
Pak Beng navigation lock is single line, approach channel adopts asymmetric arrangement.
According to specification, the approach channel’s width is 3.5 times of maximum design ship
width, and maximum design ship width is 10.8m, so minimum width of approach channel is
37.8m. And width of entrance zone is 1.5 times of approach channel calculation width, it’s
56.7m. Turning circles radius of bend is 330m, bend widens 6.5m, 50m width is adopted in
considering the future improvement, and it also meets the requirements of bend widening, so
entrance zone width is designed to be 65m.
Entrance zone’s length of approach channel is designed as 2.0-2.5 times of maximum design
ship length, maximum design ship length is 67.5m. So length of entrance zone is
135m-168.75m, and 160m is adopted.
10.3.2 Floor Elevation of Approach Channel
Design maximum ship and fleet loaded with draft is 2m, according to Preliminary Design
Guidance for Proposed Mainstream Dams in the Lower Mekong Basin and in consideration of
1m bed incision the minimum level of approach channel is 3m; minimum water level of
downstream approach channel is 4m, so upstream approach channel floor elevation is
EL.330.0m, downstream approach channel elevation is 302.62m and the elevation of sill
chamber is 303.62m. And when the downstream plant is in operation the downstream water
level will be EL.310m, so the water level on lock sill will be 6.38m, it’s safe for the ship draft.
10.3.3 Straight Line Length of Approach Channel and Bend Radius
Mekong River Navigation Channel Maintenance and Improvement Guideline stipulates: it is
expected that minimum width of navigation channel is 30m, minimum navigable depth is
1.5m and minimum bending radius is 260m in the first phase; and in the second phase the
minimum width of navigation channel is 40m, minimum navigable depth is 2.0m and
minimum bending radius is 300m.
And also referring to design specification: the minimum length of approach channel’s
straight line segment is 3.5Lc(ship length), ship length is 67.5m, according to calculation
straight line segment’s length of approach channel is 236.25m. and the minimum bend radius
of 500t class ship and Ⅳ class limit line channel is 330m.Preliminary Design Guidance for
Proposed Mainstream Dams in the Lower Mekong Basin stipulates: both sides of navigation
should have at least 250 m long alignment, so the ships can pass in and out. According to
project layout upstream approach channel length is 250m which includes 23.5m of fixed
guide wall and 230m of floating guide wall.
The bottom plate elevation of lower approach channel is 302.62m, and the width widens from
42m to 50m. And the total length of downstream channel straight line is 320m, the circular arc

Engineering-Status-Report
10-3
of the central angle is 38.37°, it is connected with the natural channel by 639m long straight
line.
The downstream access channel is connected with the lower lock head with a bottom width of
42m, it gradually widens along downstream, and it is 50m wide at the curved section. The left
guide wall is connected with the stilling basin wall, and it’s approximately 780m long. The
right guide wall is connected with the right wall of the lower lock head. The guide wall is
constructed of a gravity concrete structure with the top elevation is 331.64m, the elevation of
channel bottom is 302.62m and the guide wall is about 31m high.
According to the design width of access channel the access channel can govern two standard
vessel (500t) whose width is 10.8m, so it’s designed to be two-way circulation.
10.3.4 Berthing Space
The main function of berthing space is to form passing ships berthing into columns, upstream
berthing space locates in the right bank, the straight-line distance to dam axis is about 450m,
total length of berthing space is about 100m, berthing space composes 4 independent
breasting dolphins, space between these two in middle is 40m, the others’ space is 20m. Every
breasting dolphin’s top elevation is 3m higher than maximum navigation level, its elevation is
343m. Downstream berthing space locates in the back segment of downstream approach
channel’s right guide wall, and it is also at the end of the bend.
Engineering-Status-Report
11-1
11 FISH PASSAGE FACILITIES
11.1 INTRODUCTION
11.1.1 Background
Mekong River extends as long as approximately 2,639km from the estuary of Nanla River to
the sea with a fall of 491m. Pak Beng Hydropower Project is the first cascade of the
hydropower development scheme for Mekong River, and its planned installed capacity and
normal water level are 912MW and 340m. It is located in the upper reaches of Mekong River
in Pak Beng District, Oudomxay Province of northern Laos, and the geographical coordinates
of its dam site are E 101°01′12″ and N 19°50′45″.
The water retaining structures consist of left bank non-overflow section, powerhouse section,
discharging sluice section, navigation lock section and right bank non-overflow section. The
dam crest elevation is 346m, the maximum dam height is about 64m, and the dam crest length
is 896.5m.
The building of the project will affect the aquatic ecosystem especially fishes. The impacts
mainly include the cutting off the migration way of fishes. So it is necessary to build the fish
way.
According to the survey result, fifty four species belonging to 14 families were found in the
samples collected from the six sampling stations during the wet and dry seasons sampling and
survey. Sixteen fish species were found at the Pak Beng morning market which were caught
in Mekong River, one species was from the Beng River was Pa Mood (Gyrinocheilus
aymonier). Other fishery activities were observed and discussed with local people in the
vicinities of the sampling stations and village nearby. Fishing activities along Mekong River
at the Pak Beng area reach the peak during the transition of dry season and early rainy
season, which is the time when fish migrations in the mainstream and its tributaries. The most
important period for fishing takes place during May, June, July and extends to August
depending on the hydrological condition of Mekong River.
Based on the investigation of fishes, many kinds of fish pass facilities are compared and the
bypass fish way is chosen. And its design is introduced through the following report.
11.1.2 Reference
(1) Laws and Regulation
a The Lao Environmental Protection Law (1999)
b The Decree on Environmental Assessment No. 112/PM (2010)
c The Lao Amended Forestry Law (No. 06/NA-Dec.2007)
d The Lao Wildlife and Aquatics Law (No. 07/NA-Dec.2007)
e The Lao Water Law (1996)
Engineering-Status-Report
11-2
f The Lao Amended Land Law (No. 04/NA-Oct.2003)
g Regulation on Environment Assessment (No. 1770/WREA/2000)
(2) Technical standards and specifications
a Preliminary Design Guidance for Proposed Mainstream Dams in the Lower Mekong
Basin, Mekong River Commission, 2009;
b Specifications for Design of Fish Passage Facilities for Hydropower Projects (draft
for review), industrial standard issued by Ministry of Electricity of the People’s
Republic of China;
c Design Guidelines for Fish Passage Facilities of Hydropower Projects (draft for
review), industrial standard issued by Ministry of Water Resources of the People’s
Republic of China.
11.2 ANALYSIS OF IMPACT BY PROJECT CONSTRUCTION ON FISH
RESOURCES
11.2.1 Fish Investigation
(1) Investigation methods
a Secondary data from literature and related documents was reviewed.
b Wet and dry season field surveys as well as the collection of aquatic organisms was
performed at the six sampling stations.
c Samples were collected of the following aquatics: fish, plankton, benthic invertebrate
and aquatic plants. All samples were collected, particularly fish, and were identified,
weighed and counted. As for plankton and the benthic invertebrate, density as
cells/m3 and number of animals/m2 are evaluated.
d Fishery activities were observed and recorded.
Freshwater Plankton Sampling
Thirty liters of water were collected from the river with depth of 0 to 30 cm using a
plankton net. The sampled water was passed through plankton net of 59 microns mesh
size in order to separate the aquatic life from the water. The sample of aquatic life was
then preserved with 5% formalin solution for further laboratory analysis.
Freshwater Benthos Sampling
The sediment at the bed was collected with the help of Ekman dredge sampler. The
collected samples (prepared by 5 composite grab samples) were then sorted out through a
series of sieves to separate benthic macro-invertebrate organisms. Retained organisms
were preserved with 7% formalin solution for further laboratory analysis.
Freshwater Fish Sampling and Survey
Engineering-Status-Report
11-3
Secondary data from literature and related documents was reviewed.
All samples were collected, identified, weighed and counted.
Fishery activities were observed and recorded.
The freshwater fish sampling was carried out at same station as the water sampling by
using suitable gears such as beach seine, gill net or cast net depend on the characteristics
of study areas. The nets for beach seine were of about 1-3 cm mesh size and 30-100m
long to cover the water surface area and then the samples will be collected.
Data on fishery activities, available markets, the amount of harvested fish and processing
procedures was collected through interviews with local people.
Indirect sampling was performed by making observations at a fish market on the kinds
and quantities of fishery products.
Fishermen interviewed on type and quantity of fishery products they harvest.
Data analysis
Identified, described and mapped the various aquatic habitats found in the upstream tail
water area.
Assess potential impacts of the project development in construction phase and operation
phase on fishery resources.
Identify fish and other aquatic animals according to family, genus and to species, mainly
type, density, and diversity of fish in the concerned waterways.
Separate fish into migratory and non-migratory fish. Describe all fish species, identified
with regard to migration requirements, food and breeding requirement.
Fishery and other aquatic animal’s production - assess the value of the resource.
Study fishing methods and importance of fishery activities in the nutrition and livelihood
requirements of affected communities.
Sampling time and location
The fishery, plankton organisms, benthic invertebrate animals, and aquatic plants were
studied. In order to get accurate data, sampling was performed in both the dry and rainy
seasons, January 2011 and July 2011 respectively.
The location includes Ban Hom Xai, Keng Lae, Ban Luan Tong, Ban Pak Ngua, Ban Pak
Kan and Pak Beng town.
(2) Investigation results
a Fish species
The investigation results shows that Fifty four species belonging to 14 families were

Engineering-Status-Report
11-4
found in the samples collected from the six sampling stations during the wet and dry
seasons sampling and survey. Sixteen fish species were found at the Pak Beng morning
market which were caught in Mekong River, one species was from the Beng River was
Pa Mood (Gyrinocheilus aymonier). Other fishery activities were observed and discussed
with local people in the vicinities of the sampling stations and village nearby. Fishery
activities along Mekong River at the Pak Beng area reach the peak during the transition
of dry season and early rainy season which is the time when fish migrations in the
mainstream and its tributaries. The most important period for fishing takes place during
May, June, July and extends to August depending on the hydrological condition of
Mekong River.
Station 1 (Ban Hom Xai, upstream from dam site) - Eight species were found in Station 1
where the fishing area is a calm area near the shore and there is also a ripple area nearby.
Many valuable fish species were found such as Pa Kod-Hemibagrus nemurus,
Hemibagrus wyckioides and Hemibagrus wyckii. This area is known as the spawning
area of Bagrids catfish in early winter, November to December. These benthic
carnivorous fish were living in rocky substrate and feeding on shellfish and other fish.
Station 2 (at Keng Lae) – Ten fish species were found. Fish from this area are very
abundant and mostly fetch a high price at the market. The herbivorous and plankton
feeding fish found at this area included Pa Kod- Barbonymus gonionotus, Henicorhychus
lobatus, Sikukia stejnegeri, and the carnivorous fish - Hemibagrus nemurus.
Station 3 (Ban Luan Tong) - There were 11 fish species found at from three families,
Cyprinidae, Cobitidae and Siluridae. Fishes at this station were of very small size.
Station 4 (Ban Pak Ngua) - Eight fish species were found at. The most numerous are
Barbonymus gonionotus and Mystacoleucus marginatus.
Station 5 (Ban Pak Kan) - They were of small to medium size of the Cobitidae family
and Cyprinidae were the dominant group. Many fish of economic value fish were also
found including Bagarius yarelli, Hemibagrus filamentus, Cyclocheilichthys furcatus and
Pa nang (Micronema bleekeri).
Station 6 (Pak Beng town) - Four species were found. Pa koeb or Kang Buan -
Belodonichthys truncates was found of small size, with length of 22 cm length, weight
of 13 km This kind of carnivorous fish can reach 80 cm in length.
b Commercially or socially important species and habitats
Significance of ecosystem services for Mekong River system on food production of fish
is very significant. Mekong river basin provides over 2 million tons of freshwater fish
and aquatic products per year which is the one of the most productive freshwater
fisheries in the world.
Various stream flow types (riffles, rapids and run) are the characteristic of Mekong River.
Engineering-Status-Report
11-5
River morphological, such as narrow, mid-stream rock and island, constitute important
habitats and contribute to the biological diversity of the Mekong. Fish typically migrate
upstream to spawning ground when the water level start to increase, spawning while the
water level is still increasing to ensure that the current brings eggs and larvae into
nursery areas on the flood plain further downstream.
The commercial fish species found in this area are Pa nang (Micronema bleekeri, and M.
hexapterus), these two species of genus Micronema found mainly in large river with
turbid water and adjacent streams and also in lakes as well as impoundment. Spawning
habitats of these fish are believed to spawn in flood plain lateral migration from Mekong
River. These two species are important, high value fish in the fisheries throughout their
range and were caught in the upstream sector, Houay Kan up to Don Thek, Ban Pak
Ngue of the study area during dry season period.
c Rare, endangered or protected species and habitats
The project areas stretch upstream from the Pak Beng town into the upper basin. The
section of Mekong River in the project area is characterized by a smaller flood plain area
and fewer major tributaries. The migratory fishes inhabit in the main stream during dry
seasn, and move to upstream tributaries during flood season. The most well-known
member of this migration system is the Mekong giant catfish Pangasianodon gigas.
Migratory fish species use this stretch of river, most notably the Mekong Giant catfish,
which supports a culturally important fishery around Chiang Klong, and which is known
to breed nearby. The gravel beds and riffles, and the vegetation in the in-channel
wetlands are favored places for fish breeding.
MRC (2009) using an environmental guild framework and data collected under catch
monitoring programs, 58 highly migratory LMB species threatened by mainstream dam
development have been identified. These include 5 of 11 species threatened by extinction
according to the IUCN “Red List”. the Mekong giant catfish (Pangasianodon gigas), the
Mekong stingray (Dasyatis laoensis), Jullien ‘s barb (Probarbus jullieni), the Laotian
shad (Tenualosa thibaudeaui) and the Thicklip barb (Probarbus labeamajor). The 58
species contributed to 38.5%of the total weight of all 233 species recorded in the MRC
sponsored catch surveys with an estimated first scale value in exceed of USD 1,000
million per year. (Halls, A and M. Kshatriya, 2009.)
Among the list of migratory fishes, Pa nang (Micronema apogon, M. bleekeri, and M.
hexapterus) and Probarbus species were important fish found in this area but have
declined greatly in abundance. Probarbus spp. are not in the list of fish caught from six
sampling station during dry season, January 2011.
Pa earn ta daeng or Pa yee sok thong (Probarbus jullieni) is included in the IUCN List of
Endangered Animals as endangered status, EN). Probarbus jullieni is one of the most
esteemed species of the Mekong, occurs in the Mekong, Chao Phraya System, Thailand

Engineering-Status-Report
11-6
and in Pahang and Perak, Malaysia. Several specific spawning grounds have been
identified in Mekong River, northern Lao PDR. Loei province (Thailand) at a site named
Bung Ghang, Amphoe Sang Khom, Nong Khai province. Large mature adults migrate
upstream to their spawning ground, where they spawn during December-January. Eggs,
larvae and small juveniles drift to downstream to their nursery habitats, which are
shallow, sandy reach of the river.
Almost all of the fish species from Mekong River at Pak Beng HPP are widely
distributed in the middle Mekong main river and in the lower reaches of its tributaries.
There is no specific endemic species or restricted to Mekong river of fast running waters
but require specific habitat for their migration purpose. Fish migration in the Mekong is
primarily for breeding and feeding. Because the river's annual hydrological cycle
involves large floods (with a 30-fold difference between high and low season discharge),
fish migrate upstream to breed, after which their eggs and larvae are carried downstream
to the floodplains where they feed and grow. Fish also migrate to feed, normally moving
from the main course of the river onto the highly productive floodplains at the beginning
of the rainy season. In the Mekong River, most species combine feeding and breeding
migrations. But upstream migrations are dominated by larger adult fish moving up river
to breed while downstream migrations are mainly feeding migrations undertaken by
young fish and adults returning from the breeding areas. Movements also include lateral
migrations between the mainstream or tributaries and floodplains.
d Fish migration of the lower Mekong River Basin
The most important aquatic species will be on the long-distance migrants that move up
the Mekong mainstream to breed, some as far as China. It has been estimated that more
than 70% of the total fish catch in the Mekong Basin (i.e. more than 1.8 million tons
worth US$1.4 billion at first sale) is dependent on these long distance migrants. The
effect of dams on fisheries production is also highly dependent on the location, design
and operation of the dams. The mainstream Mekong is a corridor for most long-distance
migrations and most of the production originates from floodplains in the middle and
lower part of the Basin. Thus dams building on the mainstream will have more impact
than dams built on tributaries, while those located in the middle and lower part of the
LMB will have a greater impact on fish production than dams located in the upper part of
the basin.
Not all species of fish caught in the Lower Mekong Basin are threatened by mainstream
dams. Some have only limited migrations over short ranges which may not be impaired.
Others may adapt easily to changes in habitat. The species most likely to be affected are
those that migrate long distances between critical spawning, feeding and refuge
habitats-either to complete their life cycles or to exploit seasonal variations in habitats.
Engineering-Status-Report
11-7
11.2.2 Impact Assessment
(1) Construction phase
It is assumed that seasonal siltation (draining of water from the catchment area, and
agricultural zones during the rainy season) and long term degradation (deforestation of
catchment areas) will have negative impacts on the aquatic environment. During the
construction period, the water quality in the river will be affected by the construction
work in the project area. Increased turbidity is expected to be generated which will affect
the living conditions of plankton and benthic organisms. At the downstream site, there
are confluences with tributaries; the fisheries here need to be managed properly to
prevent incorrect exploitation and promote sustained fishing practices.
Different species should be affected at different degrees and different trophic levels, with
those directly feeding on plankton among the most affected. According to the fish
species survey, the majority of fish found abundantly in the Mekong Pak Beng HPP area
of the rheophilic type which feed mainly on plankton and bottom sediment. The
reduction of plankton and benthic fauna during construction period is believed to be
insignificant since the level of plankton density is already low and the effect of siltation
and water turbidity will only occur during the construction period; the aquatic organisms
will recover in the short time.
With regards to fish populations, the study on species composition and their abundance
in the project area indicated that the fish populations in this stretch of river are already
low and the number of species is relatively small, the change in hydrological conditions
will not affect resident species that are able to live in impounded condition. Fish species
with long distance migration patterns and those that spawn in rapids or submerged
vegetation are likely to be affected. The study used six sampling stations; the majority of
families except Cyprinidae were represented by only 1-3 species.
Transformation of the habitat from a river with rapids to standing ecosystem due to
impoundment will not occur for Mekong Pak Beng HPP because of the run-of-river
design. Fish species which live a running water habitat will not be negatively impacted to
the new conditions. In Mekong River, there are number of species that form in schools
such as Henicorhynchus spp., Cirrhinus spp. that have a short life span and a fast rate of
reproduction; normally their abundance in the catch appears to follows the level of flood
from the upstream.
The creation of a barrage without any reservoir stagnant effects will improve the overall
natural fish production capacity in Mekong River in the project area, especially in the dry
season. Based on the information of the water quality and the existing aquatic organisms,
species diversity and their quantities, a positive impact on fish biomass will occur after
impoundment.
Engineering-Status-Report
11-8
The increasing volume and regulation of the water level would be a benefit for the
aquatic living organisms. After impoundment, fisheries activities would have to adapt to
using the new fishing methods and gear.
In sum, this may be an effect of high importance and medium to high magnitude, leading
to a significant impact. The potential impact will be negative at a moderate level during
construction period.
(2) Operation phase
The dam will impede upstream fish migration, downstream conditions will not change
significantly. However, the lotic conditions will be changed to lentic conditions (flowing
to static). The following issues may have an impact on aquatic biodiversity.
After a number of years of operation and because the upstream fish migration route has
been blocked (migration cycle links cut), fish will return in far fewer numbers on an
annual basis. If tail waters are available as spawning habitat, and fish are releasing
buoyant or semi-buoyant eggs/larvae, these will pass through the dam’s turbines.
Hydraulic shear pressures created internally within the turbine housing will result in very
high mortality rates for eggs and larvae and result in very poor recruitment to
downstream fish populations beyond the Mekong Pak Beng HPP.
Almost all species are exploited to one degree or another, and at various stages of their
life-cycle. Some “white fish” species are short-lived, and because they can complete.
Their life-cycle within at least one calendar year, they can take high levels of fishing
pressure and their populations, perhaps as isolated genetic stocks, will always survive.
Disturbance to aquatic habitats by hydropower dams represent a risk to the long-term
sustainability of fisheries. Long-lived, late maturing larger “white fish” species are
potentially at far greater risk than the smaller short-lived, early maturing “white fish”
species.
The most important impact of dams on the Mekong will be on long distance migrants
that move up the Mekong to breed, some as far as China. The Mekong giant catfish
(Pangasianodon gigas) is believed to be a long distance migratory fish. Research has
found that there are different and isolated stocks of this fish such as those found in Tonle
Sap and other deep pools in Mekong River. This fish has succeeded as a cultured fish in
Thailand by using the brood-stock from an upstream pond, but it still is in the list of
CITES.
Therefore, the negative impacts that the Mekong Pak Beng HPP will have on Fisheries
and Aquatic Resources (FAR) will depend on many factors and variables. Not least of
these will be the construction sequence of the 5-dam cascade projects are to proceed.
Mekong Pak Beng HPP will be the first dam built so it will cause the greatest impacts to
FAR since it will disrupt the bi-directional movements of migratory fish populations that

Engineering-Status-Report
11-9
rely on seasonal movements up and down Mekong River and its tributaries for their
existence. Dams disrupt the continuity and linearity of riverine systems, and greatly
impact migratory fish populations in a negative way. Without seasonal fish migrations,
and the fisheries that rely on them, livelihoods and food security for riparian
communities will be compromised to various degrees, and depending on circumstances
may be serious.
As the upstream pond will be created with different flow condition, the following impact
may occur to aquatic biodiversity.
11.2.3 Fish Protection Measures
The most obvious effects from dams building on rivers result from formation of new lentic or
semi-lentic environments upstream from the dam, and tail water environments downstream
from the dam. The construction of a dam on a river can block or delay upstream fish
migration and thus contribute to the decline and even the extinction of species that depend on
longitudinal movements along the stream continuum during certain phases of their life cycle.
In order to maintain the diversity of aquatic organisms and the resources in Mekong River, it
is necessary to comprehensively and systematically study the fish passage facilities. And for
Pak Beng HPP, it is necessary to research into the upstream measures and downstream
measures for fishes. The upstream measures and downstream measures of fishes mainly
include the bypass fish way, fishery research station and tributaries protection and so on.
11.2.4 Proposed major Fish Passage Objects
There are mainly 15 species of fishes with the body length exceeding 50cm in the reach
investigated, of which 8 species are Siluriformes fishes, 4 Cypriniformes, 1 Synbranchiformes,
1 Osteoglossiformes and 1 Perciformes. Among them the biggest is Hemibagrus wyckioides,
of which the body length of the biggest individual is 130cm, and maximum weight reaches
86kg; however, for fish way design, the fish pass object is not applicable to the biggest
individual, because and fish way is not designed to allow all fishes to pass, but to ensure most
of existing individuals of sexual maturity to pass, to solve their reproduction problem;
according to historical data, even if the biggest fish like Hemibagrus wyckioides with the
general body length of individual of 50cm has already reached sexual maturity at this time. In
addition, current situation of resources is also needed to consider; according to the on-scene
investigation of EIA, the largest individual among the catch is only 35.6cm, mainly are
Bagarius yarelli, Micronema bleekeri and Hemibagrus wyckii. In addition, although four
species of white fishes have migratory habit, their bodies are small, generally not exceeding
30cm, therefore, fish pass objects of the fish way are determined preliminarily as: Bagarius
yarelli, Micronema bleekeri, Hemibagrus wyckii, Cyclocheilichthys enoplos, Henicorhynchus
(Cirrhinus) lobatus, Henicorhynchus siamensis and Pangasius hypophthalmus. Individual size
is designed as 50cm-60cm.
Engineering-Status-Report
11-10
11.3 COMPARISON AND SELECTION OF OPTIONS
11.3.1 Comparison
Major types of fish pass structures nowadays include the vertical-slot fish way, bypass fish
way, fish lock, fish collection and transport system and fish lift. Its main characteristics and
application condition are as follows:
(1) Vertical-slot fish way
The fish way is a channel-type fish pass structure showing a continuous stairs, consisting
of the entrance, channel body, exit and fish luring and water charging system. The
entrance is mostly arranged nearby the bank with steady flow and with a certain depth or
overflow dam outlet. It can be applicable to most fishes, without high requirements on
migration capability of the fish, and fishes will not be hurt when they swim upstream
through the fish way.
The main disadvantage is that it has a poor applicability to high-head dam, be not
applicable to the project with a head difference between upper and lower reaches over
40m generally, and, it is required to be arranged combined with the hydropower station
complex, which has a certain impact on the main project and scheduling and operating.
(2) Bypass fish way
It is a small stream which is similar to natural river excavated in the bank artificially. The
goal to dissipate energy and slow down the flow velocity is realized through the friction
due to obstacles formed by stacking stone blocks on stream bottom and along the bank.
It requires sufficient space, is generally applied to gentle hill and low mountain terrain, is
not applicable to the dam with too high head, nor to alpine and gorge region, in addition,
it shall evade the densely-populated areas to reduce the interference to fish.
(3) Fish lock
The fish lock has a design principle similar to the navigation lock and is composed of the
lower water channel, lock chamber and upper channel. Fish pass is realized through the
change of water level in the lock chamber regulated with upper and lower gates. The fish
lock is generally applied to hydropower projects with low-medium head, where fishes
can pass the fish lock without any hard effort, being particularly applicable to fishes with
poor swimming capability.
Its main disadvantage is that it has a certain impact on the layout of complex, the fish
pass is not continuous, and operation and maintenance is complicated.
(4) Fish lift
Its principle is similar to an elevator and is composed of three major parts of the fish-in
channel, shaft and fish-out channel. Guide water into the fish-in channel, lure fishes

Engineering-Status-Report
11-11
downstream into the fish-in channel, then drive fishes into the shaft with the driving fish
grille, lift the shaft to upstream level and open the fish-out channel to drive fishes into
upstream water area. The fish lift can be applied to the dam with medium-high head,
with small disturbance to complex structure.
The main disadvantage is that operation and maintenance are very complicated, and a
certain number of management personnel are required.
(5) Fish collection and transport system
It is divided into fish collection and fish transport, to collect fishes downstream into the
vessel or container through a certain means of fish luring, and then transport fishes to
appropriate water area with the vessel or automobile, so as to achieve the purpose of
passing the dam. The fish collection and transport system can be applied to the dam with
high head, with no disturbance to complex structure.
The main disadvantage is that it is restricted much with the effect of fish luring, the range
of fish collection is small, and there are mechanical noise and vibration as operating, etc.,
influencing the effect of fish collection.
(6) Other fish pass methods
There is other type of fish pass system, of which the fish lift (shaft) is used under the
dam for fish collection and the fish transport vehicle is used to transport fishes, being
similar to the combination of the fish lift with the fish transport system.
11.3.2 Selection
Because it is a low water head dam, belonging to the low dam hydropower project, combined
with the comparison of various fish pass methods and main fish pass objects and fish
ecological habit, it is preliminarily determined to consider to adopt the vertical-slot fish way
and bypass fish way as the fish pass structure of this project, both of which are able to use for
continuous fish pass and communicate ecological habitats of upper and lower reaches, with
good fish pass effect. The bypass fish way scheme has a very good fish pass effect, being able
to communicate ecological habitats of upper and lower reaches, of which the layout condition
exists basically in the site nearby the dam site. Therefore, planning and designing the bypass
fish way as the fish pass structure of this project in this stage. As generating units of Pak Beng
HPP are mainly arranged on the right bank, considered from the perspective of layout of
project space, it is preliminarily designed to construct the bypass fish way on the left bank.
11.4 BASIC PARAMETERS FOR DESIGN OF FISHWAY
11.4.1 Selection of Operation Water Level
The migratory season for fishes in Mekong Pak Beng area is from April to October every year.
Therefore, the main fish passage season of Pak Beng fish way is determined as April -
October in every year. The multi-year average minimum water level during April – October is

Engineering-Status-Report
11-12
334m (The regulating capacity of reservoir at upper reach is considered). Water level at upper
reach of fish way is 340m as maximum level and 335m as the minimum level. Two outlets
designed for water level variation.
11.4.2 Designed Flow Rate of Fish way
According to the results of feasibility study stage, the flow rate of fish way is set as 14.4m3/s
for calculation of runoff regulation. The cross section of fish way shall be selected in light of
the factors such as the kinds of fishes in Mekong River and the living habits of such fishes,
and the economic benefits of power plant shall also be considered. While the fishes’ needs on
spawning migration are satisfied, the sectional size shall be properly controlled.
11.4.3 Determination of Elevation of Baseboard of Fish way Inlet and Outlet
The minimum downstream water level will be 310m when the Luang Prabang is
commissioned, so the entrance of fish passage is set to EL308m. Since the entrance of fish
passage is selected at the downstream of dam, it’s about 0.95km away from dam downstream.
In order to guide the fishes to find the entrance barrier screens is designed from entrance side
to the opposite bank. And the screens must be sized to ensure that fish cannot pass through or
become trapped within the mesh. And other inducing equipment such as electricity, light,
sound, and color can be used to attract fish to the entrance vicinity too. And the bottom plate
should be connected to the river bed by rocks, in this way different layers’ fish can get into the
fish passage.
In order to achieve operation under different upstream water level, the fish passage includes
two exits:
(1) When the upstream water level is normal operation water level 340m of flood season
the exit of bottom EL.338m will be working.
(2) When the upstream water level is above normal operation water level 335m of dry
season and less than normal operation water level 340m of flood season the exit of
bottom EL.338m will be working.
11.4.4 Basic Parameters
(1) Layout of fish way inlet
In light of the geomorphological conditions of Pak Beng and the layout of hydraulic
complex, the bypass fish way will be located on terrace on left bank. The fish way will
be excavated on the terrace, and it will be composed of fish inlet section and fish outlet
section.
A total of two fish way outlets will be set up. One fish way inlet will be set up at the
outside of river bend, and it is preliminarily planned that the elevation of inlet baseboard
will be 308.00m. Outlets will be equipped with lock chamber, maintenance gate is set on
the each branch of outlet, and the top platform of lock chamber will be 346.0m. The

Engineering-Status-Report
11-13
service gate is set on the side of non-overflow dam section, and the top platform of lock
chamber will be 346.0m too. The lock gate will be opened and closed by a fixed winch,
and the winch will be mounted on the platform at the elevation of 346.0m and will be
used to lift up the service gate. And also we try to set up an automatic system to control
the opening of gate with the change water level. The specific location of fish inlet shall
be determined through analog calculation, so as to select an area with appropriate flow
velocity. The overall U-type design will be adopted for fish inlet; the total width of this
structure will be 10m.
(2) Layout of Fish way Body
The inlet will be connected with the imitated primitive section of which the total length
will be about 1600m. The natural-like section will be excavated in terrace on left bank.
The trapezoidal cross section will be adopted, of which the bottom width will be 10m,
and the top width will be 17.2m. The bottom slope of fish way will be about 1.85%.
Several pools will be set up in the fish way and serve as the rest pools for fish. In
addition, an observation chamber will be set up near the service gate chamber, and will
be equipped with observation window and fish passage counter. The observation window
will be located at the upstream face of imitated natural fish passage facility, aligned with
the slot wall. Its bottom will be at the same elevation as the bottom of fish way, and its
top will be aligned with the water surface in fish way.
(3) Layout of Fish way Outlet
The normal water level at upper reach is 340m (wet season) and 335m (dry season), and
in order to ensure that the water depth at fish outlet reaches 2m, it is preliminarily
determined that the elevation of baseboard of water outlet shall be 338m and 333m. The
fish outlet will be set up in an area with appropriate flow velocity, will be on left side at
upper reach of dam, and will be at least 200m away from the dam. The overall U-type
design will be adopted for fish outlet; the total width of this structure will be 10m.
(4) Structural Type of Fish way
The inlet and outlet sections of fish way will be of concrete structure at the early stage.
At the late stage, by laying the cobble and vegetation on bottom and both sides, the
concrete channel will be converted into the primitive passage suitable for fishes, so as to
form the bypass fish way.
In the area where the fish inlet is located, some artificial fish reefs will be set up
appropriately and linked with the fish inlet, so as to form the ecological environment for
gathering of fishes at lower reach of dam. The jet flow will be set up in fish inlet for
attracting the fishes into fish way, and the micro-ecological environment which is similar
to the natural brooks and trenches and suitable for living of fishes may be set up in the
natural-like fish passage, so as to meet the requirements of upstream migration of fishes.

Engineering-Status-Report
11-14
On the revetment at upper and lower reaches of imitated natural fish way, some
evergreen vine will be planted about 1m-2m above the highest water surface line, and
some evergreen trees with underdeveloped root will be planted about 5m-6m above the
water surface line, so as to imitate the natural environment.
(5) Arrangement of electric fish blocking screen
In order to better guide the fishes into the fish way inlet, the electric fish shall be set up
in lower reach of Pak Beng HPP. One end of the electric screen will be located on left
bank and about 10m at reach upper of bypass fish way inlet, and the other end is fixed on
the guide wall of navigation lock.
11.5 OPERATION MANAGEMENT AND MONITORING EVALUATION
The main contents include operation management, operation monitoring, safety monitoring,
survey evaluation and continuous improvement. In the maximum actual working scope, the
fish way shall meet the biological and hydrographical requirements, and shall be able to
operate under the minimum seasonal flow rate and once-in-20-year flood level.
The provisions on fish way monitoring facilities will be integrated with the design and
operation stage for environmental management & monitoring plan. This includes the ability to
safely obtain the fish sample from fish way, and also includes the ability to monitor the
movement of fishes and the quality of water.
It is necessary to establish the monitoring plan which can quantify the efficiency of fish way.
The efficiency of fish way can be determined by sampling at upper reach of dam and lower
reach of dam, and the quantity and proportion of fishes smoothly passing the fish way can be
determined by using the data.
11.6 CONCLUSION
Bypass fish way and navigation lock are applied to the upstream fish passage through the
basis of the analysis and discussion on fish passage options. Bypass fish way & navigation
lock in combination with spillway and turbine is applied to the downstream fish passage for
Pak Beng HPP. In light of the geomorphological conditions on left/right bank and the layout
of hydraulic complex, it is advised to locate the bypass fish way on left bank. The fish way
will be provided with one inlet and two outlets. The bypass section following the inlets is
1600m in total length, excavated on the left bank terrace, with a trapezoidal cross section with
bottom width of 10m and top width of 17.2m. The average bottom slope of the fish way is
about 1.85%. Several pools will be set along the fish way and serve as the rest pools of fish.
The fish outlets will be set in an open area at least 200m away from the dam. It is appropriate
to adopt the bypass fish way as fish passage facilities. After constructing the bypass fish way,
the connectivity of river can be resumed, the impacts by construction of dam can be reduced,
and the continuous fish passage can be achieved.

Engineering-Status-Report
12-1
12 DAM SAFETY
12.1 RESERVOIR OPERATION MODE
The development task of Pak Beng Hydropower Station is power generation, with the
navigation concurrently. The normal water level of the reservoir is 340m, dead water level
334m and regulating storage 196×106m3, with daily regulating capability. For operation mode
of Pak Beng Reservoir, it is mainly considered comprehensively to meet requirements on
power generation, navigation and to minimize the impact on reservoir tail Keng Pha Dai
district.
(1) Requirements on units power generation
According to selection requirements on the units in this stage, maximum power head
of the generating units is 28m, rated one is 18m and minimum one is 7.5m.
(2) Navigation requirements
Pak Beng Hydropower Station is located in the navigable channel of Mekong River,
of which the project complex is provided the navigation structure on dam, and the
navigation standard is determined as Level IV waterway standard (China standard).
Operation of the hydropower station shall meet requirements on the navigation river
width and navigation depth, fluctuation range of water level and maximum velocity
of flow for shipping. Corresponding to requirements of navigation width and
navigation depth for shipping, requirements on hydropower station operation is to
provide minimum navigable discharge (In the case of that the navigation standard of
the lower reach is Level IV, minimum navigable discharge is 1,260m3/s). Therefore,
the hydropower station shall provide certain navigation base-load to meet
requirements on navigation width and navigation depth for shipping. Maximum upper
reach navigable water level of ship lock operation of Pak Beng Hydropower Station
is 340m, minimum operating navigable water level is 334m, and maximum navigable
discharge is 12,900m3/s.
When the hydropower station is undertaking the task of peak regulation for power
system, the power output and corresponding release discharge of the hydropower
station will change greatly in a short period, of which the unsteady flow caused will
make the river course water level, flow velocity and surface gradient of downstream
to generate change and fluctuation, thus resulting in impact on steady operation of
ships. Therefore, although Pak Beng Hydropower Station has the daily regulation
capacity, the peak regulating operation is not considered for the hydropower station
temporarily considering the downstream navigation condition, the hydropower station
will generate electricity mainly based on inflow, running as per the run-of-river
hydropower station, not changing the intra-annual/intra-daily distributions of the
inflow, and outflow of the reservoir is the inflow.

Engineering-Status-Report
12-2
(3) Impact in Keng Pha Dai district
In the section normal water level researching of Pak Beng HPP, basic information of
Keng Pha Dai district has been analyzed and researched; when inflow under natural
condition is great, most or even all of reefs in Keng Pha Dai district will be
submerged, they only expose to different content when inflow is small, and reefs in
Zone D will remain basically exposed completely when water level is at 337m
around; and reef exposing condition in Zone D of Keng Pha Dai is shown in Fig.
5.10-1. After putting into operation of Pak Beng HPP, water level elevation of Keng
Pha Dai region is related to operating level and reservoir inflow of Pak Beng HPP,
therefore, the operation mode of Pak Beng HPP shall be researched further combined
with the inflow of reservoir and the impact on Keng Pha Dai.
Fig. 12.-1 Sketch of Reef Exposure at Different Water Levels in Keng Pha
Dai (Zone D)
According to preliminary research results, reefs in Keng Pha Dai region with an
elevation greater than 335m and with large area are mainly five, of which reefs
closely related to Laos -Thailand boundary are mainly located in Zone D, shown in
Engineering-Status-Report
12-3
Figure 5.6-5. The flat shape of reefs in Zone D is similar to the triangle, with an
elevation of about 337m and area of about 10,000 square meters, where there are two
higher reefs in the middle of this reef area, with elevations respectively 343.3m
(approximate the cone) and 343.4m (approximate the triangle pyramid). From
retaining reefs in Keng Pha Dai region as the land mark of Laos- Thailand boundary
and combined with preliminary research achievements of normal water level, the
impact on reefs in Zone D is mainly considered in the research of operation mode of
Pak Beng Reservoir. It can be seen from Figure 5.10-1 that, when the water level
nearby Zone D is not higher than 337m, reefs in Zone D can remain exposed
completely, but when the water level nearby Zone D is 338m, so most of reefs in
Zone D will be submerged. Analyze based on this, in the process of water level here
rising from 337m to 338m gradually, the function of reefs in Zone D as the land mark
of Laos- Thailand boundary will lose gradually, and the function will lose basically
after the water level is higher than 338m.
Based on calculation results of sediment deposition and backwater, in the case of
operation water level of Pak Beng HPP is 335m, when the reservoir inflow is
2,200m3/s, the water level in Keng Pha Dai district is 337.02m; and the water level in
Keng Pha Dai district will be 338.00m when the reservoir inflow is 3,000 m3/s. From
retaining regional function of Keng Pha Dai, when the reservoir inflow is not higher
than 2,200m3/s, the reservoir water level runs as per 355m, the function of Keng Pha
Dai district can be maintained; when the reservoir inflow exceeds 2,200m3/s and
increases gradually, even though the reservoir water level runs to maintain 335m,
reefs in Zone D also will be gradually submerged at this time, the function of Keng
Pha Dai as Laos- Thailand boundary will lose gradually, and, when the reservoir
inflow reaches 3,000m3/s, the water level nearby reefs in Zone D is 338m, the
function is basically lost. Therefore, from the point of view of preserving the function
of Keng Pha Dai district, combined with the reservoir inflow of Pak Beng HPP, the
reservoir water level shall run as per 335m in the case of that the reservoir inflow of
Pak Beng HPP is not higher than 2,200m3/s; When the reservoir inflow has exceeded
2,200m3/s, the reservoir water level rises gradually, and in the case of that the
discharge increases to 3,000m3/s, the reservoir water level rises to 340m to run.
(4) Flood control operation
The flood control operation is mainly considered combined with requirements on
navigation, the stability of upstream/downstream reservoir bank slope as well as
minimizing reservoir sediment deposition and reducing the impact of backwater
submerging.
When flood comes in flood season, the reservoir water level of Pak Beng HPP runs
generally at 340m, according to requirements on navigation, maximum navigable

Engineering-Status-Report
12-4
discharge of Pak Beng Hydropower Station is 12,900m3/s (the discharge of 3-year
return period flood), and minimum navigable water level is the dead water level
334m, according to this requirement, in the case of flood peak discharge of the
hydropower station of 3-year return period flood, 12,900m3/s, the reservoir water
level will not run lower than 334m, being able to meet the requirement on navigation.
For ensuring dam complex safety, minimize reservoir sediment deposition and reduce
the impact of reservoir backwater submerging, Pak Beng HPP should operate
decreasing reservoir water level as far as possible in flood season in case of flood.
Considered the impact of water level fluctuating on stability of reservoir bank slope,
the daily range of water level fluctuating of Pak Beng HPP in case of flood in the
flood season shall be controlled as per 1m. Combined with the frequency flood
process of reservoir inflow of Pak Beng Hydropower Station dam site, as shown in
Fig. 5.10-2, in the case of 3-year return period flood, analyzed based on the reservoir
water level 334m corresponding to the flood peak discharge 12,900m3/s, the
fluctuating from 340m to 334m considered as per daily 1m, the fluctuating needs 6
days, and analyzed based on the process of reservoir inflow in the case of 3-year
return period flood, when the reservoir inflow is about 10,000m3/s, the reservoir
water level of Pak Beng HPP shall drop slowly from 340m.
Fig. 12.4-2 Diagram of flood process at the dam site of Pak Beng Hydropower
Station
When the reservoir inflow flood is greater than the flood peak discharge 12,900m3/s
of 3-year return period flood, navigation shall be stopped, the reservoir water level of
Pak Beng HPP may drop gradually from 334m; based on the analysis on discharge
capacity of flood release structure of Pak Beng HPP, when gates of flood discharge
Engineering-Status-Report
12-5
facilities are opened fully in the case of 5-year return period flood for "open
discharge", the reservoir water level is 332.06m. Meanwhile, analyzed preliminarily
combined with reservoir inflow flood process of 5-year return period flood at the dam
site, it takes 2 days that reservoir inflow flood increases from 12,900m3/s to
14,600m3/s; if the reservoir water level begins to fluctuate gradually from 334m in
the case of 12,900m3/s, gates of flood discharge facilities are opened fully in the case
of 14,600m3/s for "open discharge" operation, the water level will fluctuate to
332.06m, with a daily water level fluctuating drop amplitude of about 0.97m, meeting
the requirement on daily range of fluctuating of water level.
From what has been discussed above, when Pak Beng Hydropower Station conducts
flood control operation in flood season, it runs by dropping water level from 340m in
the case of reservoir inflow of 10,000m3/s, and the reservoir water level runs as per
334m in the case of reservoir inflow of 12,900m3/s; in the process of reservoir water
level fluctuating, if units power head is higher than 7.5m, the release discharge passes
through flood-discharging and sand-sluicing gate, sand-sluicing gate, sediment
discharge bottom outlet and the units; and if the units power head is lower than 7.5m,
the release discharge passes through flood-discharging and sand-sluicing gate,
sand-sluicing gate, sediment discharge bottom outlet, and the units stop power
generation; When reservoir inflow is greater than 12,900m3/s, navigation shall be
stopped, and reservoir water level drops continuously from 334m; in the case of peak
discharge of 5-year return period flood, 14,600m3/s, gates of flood discharge facilities
are opened fully for "open discharge" operation, the discharge releases through
flood-discharging and sand-sluicing gate, sand-sluicing gate , sediment discharge
bottom outlet and sand-sluicing gate in navigation channel.
(5) Sediment management
Pak Beng Hydropower Station operates as per run-of-river power station; according
to the sediment characteristics of Mekong River, sediment load concentrates mainly
in the flood season, particularly when large flood in the river course. According to the
proposed reservoir regulation operation mode, when reservoir inflow of the power
station is greater than 3,000m3/s, the reservoir water level runs at 340m; when
reservoir inflow is greater than 5,771m3/s, the rated flow of power station, Pak Beng
HPP wastes water, the excess water will be discharged through flood-discharging and
sand-sluicing gate, sediment discharge bottom outlet, to maintain reservoir water
level to run as per 340m; When reservoir inflow is greater than 10,000m3/s, the
inflow will be discharged through flood-discharging and sand-sluicing gate, sediment
discharge bottom outlet to lower the water level in front of the dam; In the case of
discharge 12,900m3/s (3-year return period flood), in order to ensure the navigation,
water level in front of dam shall be maintained at 334m; in the case of discharge

Engineering-Status-Report
12-6
14,600m3/s (5-year return period flood), gates of flood discharge facilities are opened
fully for "open discharge" operation, to allow flood release and sediment sluicing to
be close to a natural river to prevent sediment from depositing in the reservoir while
carry some silt deposit in reservoir. In the case of sediment sluicing operation of Pak
Beng HPP, priority shall be given to opening sediment discharge bottom outlets in the
dam section of powerhouse, to prevent the coarser sediment particles into the turbine,
then opening the flood-discharging and sand-sluicing gate nearby the dam section of
powerhouse, to be favor of increasing the passing of bed-load sediment to release
sediment nearby the sand trap and the flood-discharging and sand-sluicing gate.
In order to ensure the safety of Pak Beng HPP’s intake and to ensure
"clean-before-gate", Pak Beng HPP should regularly open the flood-discharging and
sand-sluicing gate, sand-sluicing gate and sediment discharge bottom outlet to
conduct sediment scouring operation according to the sediment monitoring. Fish
spawning period (usually from March to June) shall be avoided as sluicing sediment,
to avoiding the impact of reservoir sediment sluicing on fish spawning in downstream
river course. The time interval with certain water level difference between upstream
and downstream, low sediment content and rich water volume shall be selected
according to monitoring results of sediment in front of the dam, to avoid remarkable
water level fluctuation in upstream and downstream reaches due to reservoir sediment
scouring, causing adverse impact to navigation and river dwellers. Gate may be
opened gradually to flushing sediment according to the situations, thus avoiding the
sudden increase of the sediment content in a short time. the sediment content shall be
monitored during flushing, and the impact on the downstream channel and fish shall
also be monitored and investigated, which accumulate information and experience
gradually in determining the reasonable flowing-out sediment content.
(6) Summary on operation mode of reservoir
Considering synthetically all requirements on power generation, navigation, flood
control, sediment, stability of upstream/downstream reservoir bank slope of Pak Beng
Hydropower Station and minimizing the impact on reservoir tail Keng Pha Dai
region, and on the basis of previous research, the operation mode of Pak Beng
Hydropower Station is formulated as follows, and the reservoir water level - reservoir
inflow process is as shown in Fig. 5.10-3:
a When the reservoir inflow has not exceeded 2,200m3/s, the reservoir water level runs
as per 335m, to maintain the function of Keng Pha Dai region;
b When the reservoir inflow has exceeded 2,200m3/s, the reservoir water level rises
with increasing of reservoir inflow, and in the case of reservoir inflow reaches
3,000m3/s, the reservoir water level rises to 340m to run;
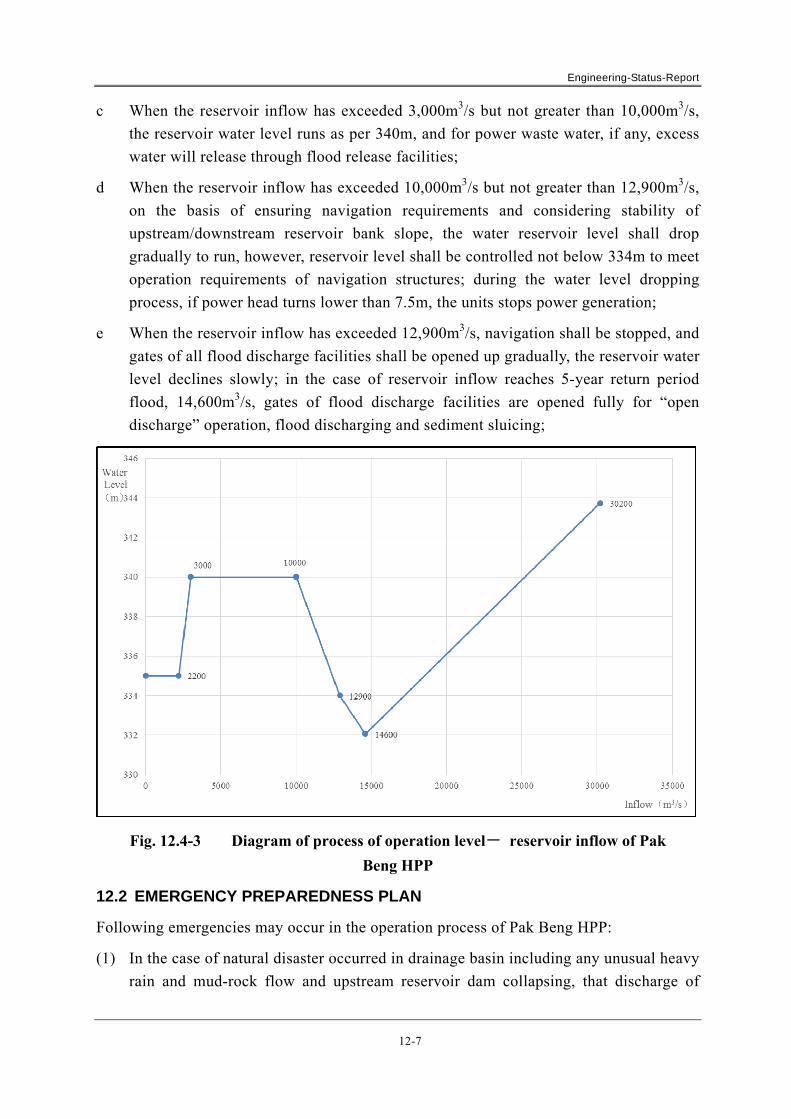
Engineering-Status-Report
12-7
c When the reservoir inflow has exceeded 3,000m3/s but not greater than 10,000m3/s,
the reservoir water level runs as per 340m, and for power waste water, if any, excess
water will release through flood release facilities;
d When the reservoir inflow has exceeded 10,000m3/s but not greater than 12,900m3/s,
on the basis of ensuring navigation requirements and considering stability of
upstream/downstream reservoir bank slope, the water reservoir level shall drop
gradually to run, however, reservoir level shall be controlled not below 334m to meet
operation requirements of navigation structures; during the water level dropping
process, if power head turns lower than 7.5m, the units stops power generation;
e When the reservoir inflow has exceeded 12,900m3/s, navigation shall be stopped, and
gates of all flood discharge facilities shall be opened up gradually, the reservoir water
level declines slowly; in the case of reservoir inflow reaches 5-year return period
flood, 14,600m3/s, gates of flood discharge facilities are opened fully for “open
discharge” operation, flood discharging and sediment sluicing;
Fig. 12.4-3 Diagram of process of operation level- reservoir inflow of Pak
Beng HPP
12.2 EMERGENCY PREPAREDNESS PLAN
Following emergencies may occur in the operation process of Pak Beng HPP:
(1) In the case of natural disaster occurred in drainage basin including any unusual heavy
rain and mud-rock flow and upstream reservoir dam collapsing, that discharge of
Engineering-Status-Report
12-8
reservoir inflow exceeds the design standard or any sudden siltation occurs in the
reservoir will lead to abnormal rise of reservoir level to destroy the dam stability and
flood overtopping and other consequences, or flooding roads causes traffic disruption
to impact seriously normal power production and lives of workers.
(2) In the case of the power failure of whole station caused due to the power failure of
the powerhouse, dam drainage system (equipment) or service power, the grid failure
or other reasons, failing to open in time of the flood discharging gate will lead to
abnormal rising of reservoir level, destroying the dam stability and even dam
overtopping, etc.
(3) In the case of any abnormal rainstorm in the river basin, the large size floating debris
flushed into the reservoir or any ship out of control that fail to be treated in time in
the reservoir area may damage the dam stability and so on.
(4) The seism nearby the dam with an intensity exceeding VI may cause damage or
collapse of the dam.
(5) Any war, terrorist incident or man-made destruction will cause damage to the dam.
For this reason, establish and perfect the disaster prevention and mitigation system, establish
emergency response management agency, formulate schemes of emergency management,
command, rescue plan, etc., establish emergency organizing, managing and commanding
system, emergency engineering rescue and support system, support supply system for overall
disaster preparedness and rescue team for synthetically emergency response, prepare
comprehensive documents related to basic requirements and procedures for emergency
actions, measures and supports, and implement funds and supplies required for emergency
treatment of flood control, water regime and meteorological disaster in processes of power
station operation and management; and various materials and funds shall be in place
according to the plan, achieving special funds and supplies for special purpose. Standardize
emergency rescue works according to law. Use advanced rescue equipment and technology,
strengthen forecasting and rapid response capabilities, complete disaster emergency response
countermeasures and contingency plans, enhance the capability of emergency rescue, enhance
the capability of disaster relief and reconstruction and make decisions scientifically, to ensure
conducting emergency rescues rapidly, orderly and effectively, reducing the loss of
emergencies to safeguard the personal safety and property.
12.3 DAM SAFETY MANAFEMENT SYSTEM
12.3.1 Dam Observation Planning
The monitoring scope of the Pak Beng Hydropower Station project: Water retaining structures
(Concrete gate dam), water release & energy-dissipating structures (Including
flood-discharging & sand-sluicing gates and sand-sluicing bottom outlets), water diversion
and power generation structures (powerhouses), navigation structures (Level 1 ship locks),

Engineering-Status-Report
12-9
large scale temporary structures, side slopes near the dam area and with safety impact on the
project.
Main content of the monitoring is:
(1) External deformation monitoring network
The external deformation monitoring network of the project area includes the
horizontal displacement monitoring network and the vertical displacement
monitoring network, and the purpose and significance of the establishment of the
external deformation monitoring network are as follows: 1) To provide base points of
working for the external deformation monitoring of the project structures (Gate dam,
riverbed type powerhouse, navigation structure, slope, etc.); 2) To monitor the
surface deformation of rock mass near the dam area; 3) To obtain three-dimensional
deformation of main hydraulic structures such as dam and rock mass near the dam
area through the regular observation and strict data processing method.
(2) Safety monitoring of water retaining structures
Mainly include the monitoring and patrol inspection of deformation, seepage, stress
strain and temperature, seismic response of concrete gate dams.
(3) Safety monitoring of water release structures
Mainly include the structure and hydraulics monitoring of flood-discharging and
sand-sluicing gates and sand-sluicing bottom outlets, and the hydraulics monitoring
and patrol inspection of deformation, seepage of the downstream bank protection.
(4) Safety monitoring of water diversion and power generation structures
Mainly include the monitoring and patrol inspection of deformation, seepage, stress
strain and temperature, seismic response of concrete gate dams.
(5) Navigation structure
Mainly include the hydraulics monitoring and patrol inspection of deformation, stress
strain, temperature, and seepage of ship locks.
(6) Monitoring of the slopes near the dam area
Mainly include the monitoring and patrol inspection of deformation, supporting load
and seepage (underground water level) of the side slops of left and right abutments,
upstream and downstream side slopes of the non-overflow dam on both banks of the
barrage, side slopes of the downstream navigation approach channel, and other
engineering parts.
(7) Automatic monitoring system
Engineering-Status-Report
12-10
The structure, function and basic technical requirements of the automatic system are
put forward and the automatic monitoring system of the project area is also planned
preliminarily according to the characteristics and scale of Pak Beng Hydropower
Station.
12.3.2 Management of Dam Safety Monitoring
(1) After the hydraulic structure is put into operation, the Hydraulic Management
Department is responsible for the operation management of monitoring system.
Develop the safety monitoring and management system and operation regulations for
the hydraulic structure, and establish the technical archive of safety monitoring of
hydraulic structures.
(2) Collate and analyze monitoring data timely, and complete the compilation of
monitoring data of last year before the end of March every year.
(3) Strengthen daily patrol, annual detailed inspection and regular inspection on the
monitoring system. The regular inspection for the monitoring system is generally
once every five years, and can also be conducted combined with the regular
inspection for dam safety.
(4) Carry out the analysis on monitoring data combined with the regular inspection for
dam safety. The trend analysis and diagnosis on abnormal phenomenon shall
highlighted in monitoring data analysis, and the operation warning value shall be
proposed for key monitoring items of the dam.
(5) The monitoring information on hydraulic structure safety shall be submitted to
relevant units including the Engineering Management Department of the Oversea
Company in accordance with requirements.
(6) Sealing up for safekeeping and scrapping of monitoring equipment and the
adjustment of monitoring items, monitoring points, frequency and duration shall be
proposed by Pak Beng Hydropower Station, reviewed by competent units and
implemented subject to the Engineering Management Department of the Oversea
Company.
12.3.3 Maintenance and Management of Hydraulic Structure Operation
(1) The company organizes to prepare technical standards and management standards for
maintenance and management of hydraulic structure operation, implemented strictly.
Organize to prepare the hydraulic technical transformation report, maintenance
report, project establishment report for technical projects and feasibility study report,
and organize to implement;
(2) Formulate and perfect flood control standards, systems and contingency plans
according to the flood control organization, and implement post responsibility system
Engineering-Status-Report
12-11
for flood control and related works of on-site inspection of pre-flood, in-flood and
post-flood.
(3) Conduct safety monitoring of hydraulic structure according to the frequency
specified, collate and analyze timely observation data, submit monitoring half-month
report, monthly report, annual report and special reports and judge timely operation
behavior of the structure, as the important basis for operation and maintenance of the
hydraulic structure.
(4) Complete the major safety inspection before the flood season in April every year and
complete rectification of the project in June every year, to ensure that the perfectness
ratio of flood control facilities reaches 100%.
(5) Conduct patrol inspection of hydraulic structure according to the frequency specified
(once / week in flood season and twice/ month in dry season) and make records, any
problem found shall be immediately reported; hydraulic structures shall be performed
timely defect elimination, maintenance, reinforcement and reconstruction, to ensure
safe operation of hydraulic structures.
(6) Major hazard sources of hydraulic structures shall be analyzed and assessed in the
first quarter every year to reduce potential safety hazards, ensuring safe and normal
operation of hydraulic structures.
(7) Prepare the monthly report and annual report of hydraulic technical supervision,
benchmarking and tabling against corresponding assessment indexes, continuing to
improve the management of safety and reliability of hydraulic structures.
(8) Establish and perfect the equipment ledger for operation and maintenance of
hydraulic structures, to provide accumulated data for subsequent continued safety
management of hydraulic structures.
(9) After the end of the flood season, the major safety inspection after the flood season
shall be carried out immediately, to formulate corresponding rectification measures
and organize to implement in view of problems existing.
(10) One equipment rating for hydraulic structures shall be conducted quarterly, in
mid-year and year-end according to the "standard for structure rating of hydropower
station".
(11) Complete the preparation of annual detailed inspection report on the operation of
hydraulic structures in February next year, summarize the operation, technological
renovation, maintenance and defect eliminating of hydraulic structures and propose
the operation and maintenance plan next year.
(12) Submit the technological renovation, maintenance, technological projects and dam
maintenance / reinforcement plans for next year in August every year.
Engineering-Status-Report
12-12
12.3.4 Dam Safety Inspection
Dam safety inspection is divided into the daily patrol inspection, annual detailed inspection,
regular inspection and special inspection, and the daily patrol inspection and annual detailed
inspection shall be organized by the hydropower station. The regular inspection shall be
organized by the Dam Center, and the Dam Center can entrust a company to implement
according to the need; Special inspection shall be proposed by the hydropower station,
approved by the Group, submitted to the Ministry of Energy and Mines of Laos for filing and
entrusting the Dam Center of National Energy Administration of China.
(1) Management of daily patrol inspection
a Professional personnel for hydraulic structures maintenance and safety monitoring
shall conduct the patrol inspection of hydraulic structures, and make the daily patrol
inspection records of hydraulic structures.
b For hydraulic structure maintenance, patrol inspection cycle shall be determined for
various hydraulic structures, once a month in dry seasons, season twice a month in
flood seasons, and inspection and monitoring times shall be increased if any unusual
circumstances are found.
c The patrol inspection cycle table shall not be changed at will once established.
(2) Management of annual detailed inspection
a Before the flood season every year, Pak Beng Hydropower Station organizes the
overall inspection for hydraulic structures, flood discharge facilities, flood control
power supply, hydrologic data acquisition and transmission system, communication
system and drainage system, inspects emphatically the treatment of problems found
in the inspection of last year after flood season, the preparation of flood control,
maintenance of flood discharge facilities, and intact status of dam safety monitoring
system and hydrologic data acquisition and transmission system in good condition,
and prepares and submits the report of inspection before the flood season according
to the Standard for Flood Control Management.
b After the flood season every year, Pak Beng Hydropower Station organizes
professional personnel to conduct overall inspection for hydraulic structures and
metal structure, to inspect emphatically parts under water, reservoir bank slope, flood
discharge facilities of hydraulic structures, and analyze and edit monitoring data.
Prepare and submit the report of flood control summary according to the Standard for
Flood Control Management.
c From December to next January every year, Pak Beng Hydropower Station organizes
to conduct annual detailed inspection for hydraulic structures, preparing the report of
annual detailed inspection.
Engineering-Status-Report
12-13
(3) Regular inspection and special inspection
The regular inspection and special inspection for the safety management of hydraulic
structures shall be carried out in accordance with relevant provisions of the Ministry
of Energy and Mines of Laos, for which the Dam Center of National Energy
Administration of China can be entrusted to organize to implement.
12.3.5 Management of the Defect of Hydraulic Structures
(1) Specific responsibility personnel of hydraulic structures and specific responsibility
personnel of monitoring shall report promptly any defect found in the patrol
inspection to the director of hydraulic structures, and input the content of the defect
or abnormal condition (equipment name, number, location and phenomenon)
normatively the information system of operation and management of production; the
defect subject shall be concise, and defect description shall be accurate and specific,
using normative terminology.
(2) In the case of carrying out defect treatment of hydraulic structures, when handling
work ending up formality, the person in charge of the work must explain and report
defect elimination and the new problem found in the work and the treatment to the
director, and the director of hydraulic structures report to the higher authority
uniformly, and the responsibility of the violator shall be investigated.
(3) The "two-sheet" system must be strictly implemented for defect treatment. For any
defect that the local or emergency treatment has been performed but the defect itself
has not been eliminated thoroughly, the management department shall formulate and
implement effective preventive measures, complete the record not eliminating the
defect, making the affirmation of treatment delay or being included in the
maintenance or technical innovation in accordance with the examination and approval
procedures; and supplementary arrangement explanation shall be made after the
defect is eliminated, to form a closed loop management.
(4) The principle of acceptance by level shall be implemented for the result acceptance of
hydraulic defect treatment, of which the level I acceptance shall be organized by
hydraulic discipline, the level II acceptance shall be organized by the Hydraulic
Structure Management Department and the level III acceptance shall be organized by
the plant headquarters. The acceptance for defects of Class I and II shall be organized
by the plant headquarters, and the work shall not be ended up before being qualified.
The acceptance for defects of Class I II shall be organized by the Hydraulic Structure
Management Department, and the work shall not be ended up before being qualified.
(5) Defects that have occurred shall be analyzed conscientiously, it is required to realize
that, it shall not be passed that the cause to generate the defect has not been analyzed
clear, it shall not be passed that the hazard possible to be brought to hydraulic
Engineering-Status-Report
12-14
structures and systems has not been analyzed clear and it shall not be passed that
similar defects whether to exist in other equipment or system have not been analyzed
clear, preventing defects from occurring repeatedly.
(6) When the defect eliminating is involved in two departments or two disciplines, the
person in charge of the work has the right to inform relevant departments or teams
and groups to arrive at the scene to conduct analysis and diagnosis subject to
reporting to the department and being agreed, to realize mutual cooperation,
eliminating the defect jointly.
(7) Requirements and provisions for the nature and class determination of the
hydropower station shall be strictly followed for the eliminating time of defects of
hydraulic structures, completed on time.
12.3.6 Dam Data Management
(1) The General Manager Department is responsible for collating and cataloguing
audio-visual document materials and photos formed in business activities by page,
recording and video tapes, handing over along with paper archives in the first quarter
of next year. Audio-visual object archives like underwater video every year shall be
handed over to archive personnel for archiving within a week after obtaining object
archives.
(2) Electronic archives, including the electronic ledger, must be with paper archives
according to requirements of the Standard for Electronic Document Archiving and
Managing, archived at the same time file.
(3) For project qualification data like the reinforcement and strengthening scheme,
budget and technical transformation and so on, the original and electronic version
shall be kept in the archive room subject to approval, and the branch can only keep
photocopies of them.
(4) All data like monthly report, annual report and the certificate of dame registration
shall be kept in the archive room of the hydropower station.
12.3.7 Management of prohibited dam zone
(1) Definition of prohibited dam zone
The upstream prohibited zones are all water areas (including the area in front of the trash
rack) from the dam to the exit of the navigation bank. The downstream prohibited zones
are all water areas from the dam to the exit of the downstream approach channel of the
ship lock and the bank slope, including left stilling pool, right stilling pool, tail water of
the units and downstream approach channel of the ship lock and so on.
(2) Requirements for management during the period of flood discharge

Engineering-Status-Report
12-15
a One hour before operation of the sluice gate, operation personnel of the sluice gate
shall be responsible for patrol inspection of upstream and downstream water areas of
the prohibited dam zone, sounding the flood discharge alarm and switching on
warning sign lamps indicating "flood discharging". The sluice gate shall not be
operated until it is determined once more that there is no ship or object impeding the
operation in water areas of upstream and downstream prohibited dam zone before the
operation.
b Before or during the operation of the sluice gate, any ship found staying in the
prohibited dam zone shall be immediately reported to the cascaded dispatch office of
the company, and the local public security organ shall be notified for driving away
the ship staying; and the sluice gate shall not be continued to operate until the staying
ship is determined to leave away safely from the prohibited dam zone.
c During the sluice gate opening for flood discharge, sluice gate operation personnel
shall be responsible for the patrol in water areas of downstream prohibited dam zone.
In any vessel is found to break into the prohibited dam zone, the local public security
organ or maritime department shall be immediately notified for driving away the
vessel broken into.
d Maintenance of warning signs and facilities in the prohibited dam zone
The patrol inspection and regular maintenance for warning signs and facilities in the
prohibited dam zone shall be conducted by appointed personnel arranged by the
branch of hydraulic structures.
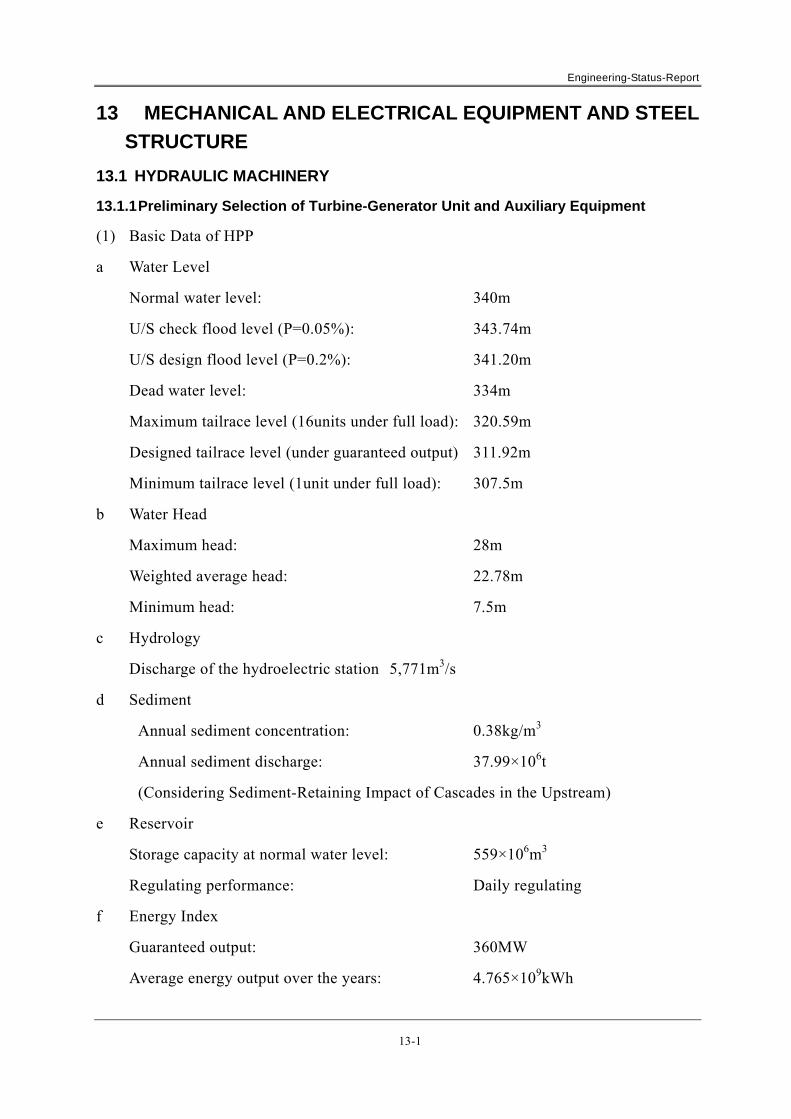
Engineering-Status-Report
13-1
13 MECHANICAL AND ELECTRICAL EQUIPMENT AND STEEL
STRUCTURE
13.1 HYDRAULIC MACHINERY
13.1.1 Preliminary Selection of Turbine-Generator Unit and Auxiliary Equipment
(1) Basic Data of HPP
a Water Level
Normal water level: 340m
U/S check flood level (P=0.05%): 343.74m
U/S design flood level (P=0.2%): 341.20m
Dead water level: 334m
Maximum tailrace level (16units under full load): 320.59m
Designed tailrace level (under guaranteed output) 311.92m
Minimum tailrace level (1unit under full load): 307.5m
b Water Head
Maximum head: 28m
Weighted average head: 22.78m
Minimum head: 7.5m
c Hydrology
Discharge of the hydroelectric station 5,771m3/s
d Sediment
Annual sediment concentration: 0.38kg/m3
Annual sediment discharge: 37.99×10⁶t
(Considering Sediment-Retaining Impact of Cascades in the Upstream)
e Reservoir
Storage capacity at normal water level: 559×106m3
Regulating performance: Daily regulating
f Energy Index
Guaranteed output: 360MW
Average energy output over the years: 4.765×10⁹kWh
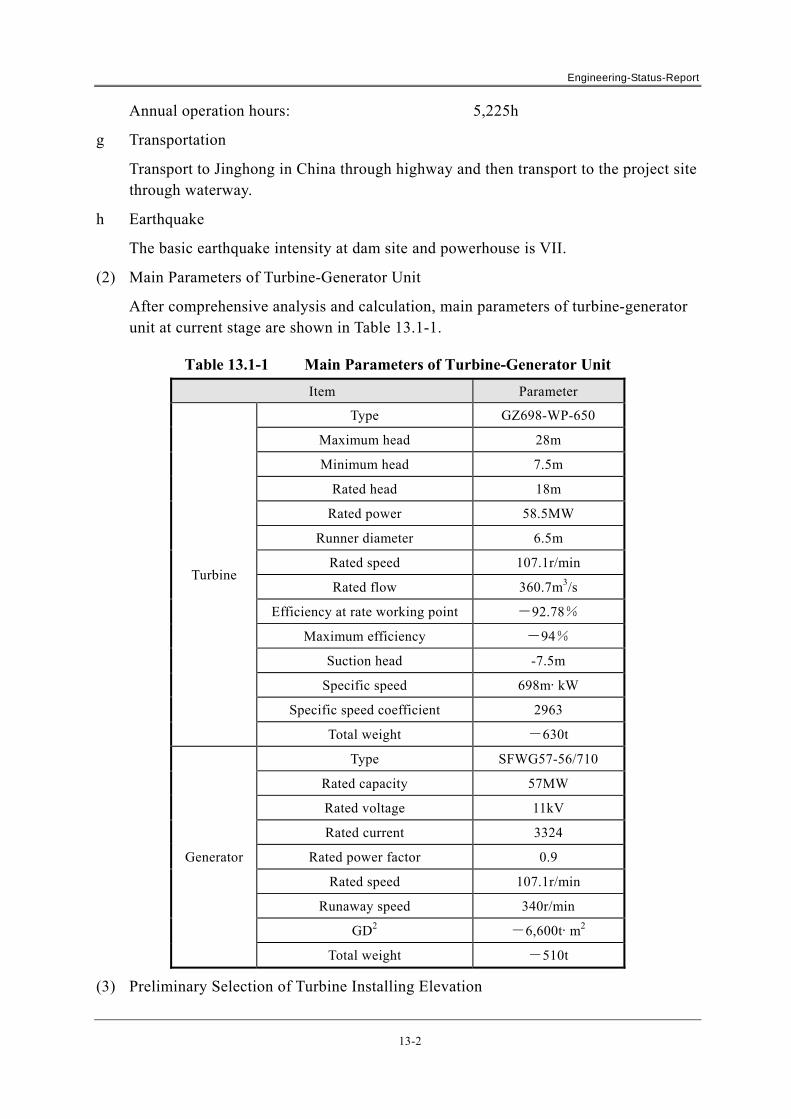
Engineering-Status-Report
13-2
Annual operation hours: 5,225h
g Transportation
Transport to Jinghong in China through highway and then transport to the project site through waterway.
h Earthquake
The basic earthquake intensity at dam site and powerhouse is VII.
(2) Main Parameters of Turbine-Generator Unit
After comprehensive analysis and calculation, main parameters of turbine-generator unit at current stage are shown in Table 13.1-1.
Table 13.1-1 Main Parameters of Turbine-Generator Unit
Item Parameter
Turbine
Type GZ698-WP-650
Maximum head 28m
Minimum head 7.5m
Rated head 18m
Rated power 58.5MW
Runner diameter 6.5m
Rated speed 107.1r/min
Rated flow 360.7m3/s
Efficiency at rate working point -92.78%
Maximum efficiency -94%
Suction head -7.5m
Specific speed 698m·kW
Specific speed coefficient 2963
Total weight -630t
Generator
Type SFWG57-56/710
Rated capacity 57MW
Rated voltage 11kV
Rated current 3324
Rated power factor 0.9
Rated speed 107.1r/min
Runaway speed 340r/min
GD2 -6,600t·m2
Total weight -510t
(3) Preliminary Selection of Turbine Installing Elevation

Engineering-Status-Report
13-3
Through above analysis and calculation of turbine cavitation coefficient and suction
head, the turbine suction head at current stage is selected as -4.17m. After
comprehensive comparison of excavation requirements and based on the number of
the units, the designed tailrace level at current stage is calculated as 311.918m based
on guaranteed output of the project. The distance between the runner blade top and
guide vane center is 3.25m, and the turbine installing elevation is determined as 300m
(central elevation of the unit).
(4) Preliminary Selection of Auxiliary Equipment
a Bridge Crane of Main Powerhouse
The heaviest piece to be lifted at the power plant is the generator rotor, and the
preliminarily-calculated weight of generator rotor together with lifting device is about
160t. Two200t/50telectric bridge cranes with dual-trolley are chosen for installation
and maintenance of the turbine-generator units. The crane span is 21m.
b Speed Governing System
Each turbine is equipped with a digital microcomputer governor with PID regulating
mode. The preliminarily-selected main control valve diameter of governor is
ф150mm, and rated operating oil pressure is 6.3MPa.
The type of governor oil pressure device is HZ-12.5-6.3.
13.1.2 Regulating Guarantee
The low head river-bed powerhouse with unit water conveyance mode is adopted for this
project. The headrace system ∑LV is 359m2/s (including spiral case and draft tube) at rated
discharge, and the unit moment of inertia is 6,600t·m2. After calculation, the effective unit
stop time is 5s with linear stopping mode, and when the unit rejects the rated load under
maximum head, the maximum pressure rise before the guide vane is 6.9%, and the pressure
before the guide vane is 29.94m (ΔH=1.94); when the unit rejects the rated load under rated
head, the unit speed rise is 62.5%, and the vacuum in the draft tube is 5.93m. All of these
satisfy the requirements of relevant specifications.
13.1.3 Transport of Heavy and Large Pieces
The heavy/large pieces of turbine-generator unit mainly include the stay column, runner
chamber and stator, whose transport dimensions all exceed transportation limit by railway. In
this case, the said pieces can be transported in segments. In all heavy transporting pieces,
main transformer is the heaviest, reaching 100t. In accordance with site conditions, the
transport of heavy/large pieces shall have no problems.
13.1.4 Main Equipment of Hydraulic Machinery
Refer to Table 13.1-2 for main equipment.

Engineering-Status-Report
13-4
Table 13.1-2 Main Parameters of Hydraulic Machinery
No. Name Main parameter Quantity Remark
1 Turbine GZ698-WP-650,
Hr=18m,nr=107.1r/minsets 16
2 Generator SFWG57-56/710,
cosφ=0.9, 57MW, 11kVsets 16
3 Bridge crane 200/50t, Lk=21m sets 2
4 Governor WDST-150-6.3 sets 16
5 Oil pressure device
HZ-12.5-6.3 sets 16
13.2 ELECTRICAL
13.2.1 Connecting to System
In accordance with the analysis of power supply range, Pak Beng HPP will supply Thailand
with 14 units of 57 MW generating sets, connecting to 500kV Tha Wang Pha Substation
using 500kV double-circuit 4×795MCM ACSR conductor. The rest 2 units of 57MW
generating sets will supply power to Laos, connecting to 230kV Oudom Xai Substation,
through 230kV double-circuit on same tower transmission line, but line only installed on one
side of tower, another circuit reserved, the length of the line is about 150km, the conductor
type is ACSR-630/45.
13.2.2 Main Single Line Design
(1) Design Principle of Main Single line Design
16 sets of 57MW generator units will be installed for Pak Beng HPP with a total
capacity of 912MW. At the time when the main Single line drawing is designed,
such comprehensive factors as the kinetic energy characteristics of this project,
capacity, requirements of connecting with system, layout of the hydraulic structures,
arrangement of the powerhouse and power distribution equipment, topography,
transport conditions and the equipment characteristics have been fully considered, and
the principles of reliable power supply, flexible operation, convenient maintenance,
concise connection, clear-realizing automation and saving cost have been followed.
The following main design principles are complied with in the main single line design
of the power plant:
a Satisfying the Requirements on Connecting with Power System
The single line shall be of highly reliable and flexible to meet the requirements of
power transmission to power System of both countries. The maintenance of any circuit
breaker or bus at HV side will not affect the continuous power supply; in case of
maintenance together with fault or multiple faults, the number of generating units out
of service or power transmission circuits out of service shall be reduced as much as
possible.
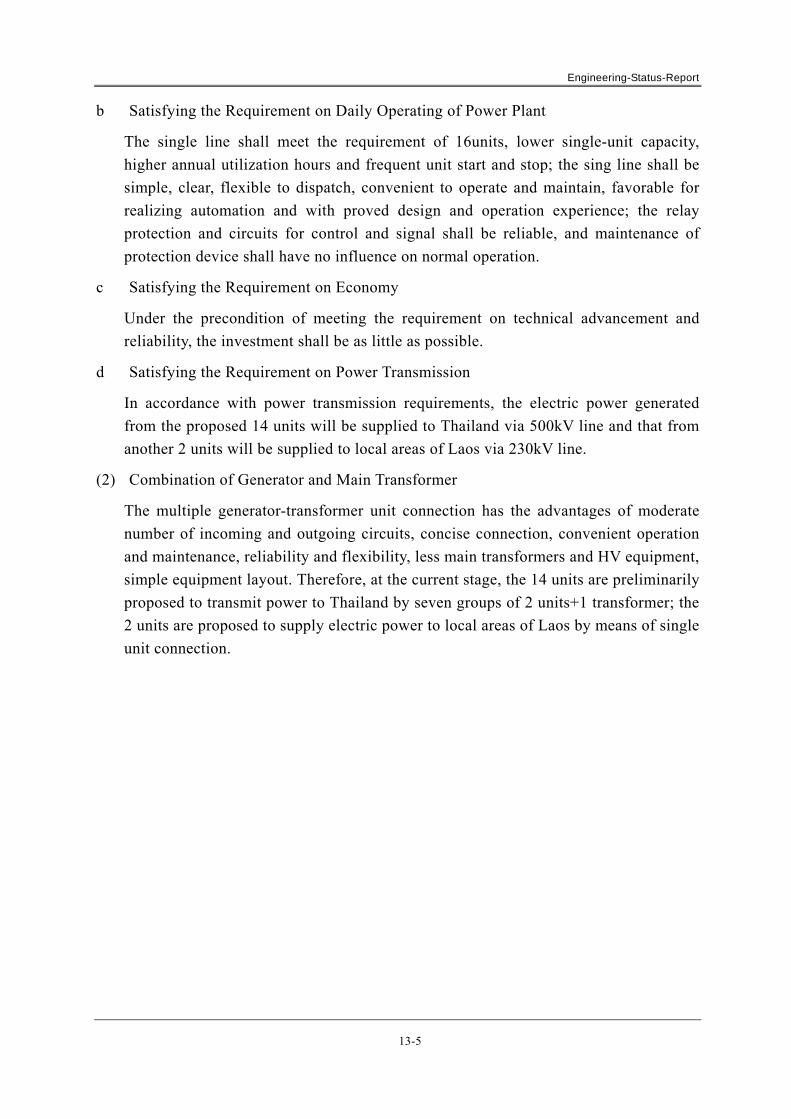
Engineering-Status-Report
13-5
b Satisfying the Requirement on Daily Operating of Power Plant
The single line shall meet the requirement of 16units, lower single-unit capacity,
higher annual utilization hours and frequent unit start and stop; the sing line shall be
simple, clear, flexible to dispatch, convenient to operate and maintain, favorable for
realizing automation and with proved design and operation experience; the relay
protection and circuits for control and signal shall be reliable, and maintenance of
protection device shall have no influence on normal operation.
c Satisfying the Requirement on Economy
Under the precondition of meeting the requirement on technical advancement and
reliability, the investment shall be as little as possible.
d Satisfying the Requirement on Power Transmission
In accordance with power transmission requirements, the electric power generated
from the proposed 14 units will be supplied to Thailand via 500kV line and that from
another 2 units will be supplied to local areas of Laos via 230kV line.
(2) Combination of Generator and Main Transformer
The multiple generator-transformer unit connection has the advantages of moderate
number of incoming and outgoing circuits, concise connection, convenient operation
and maintenance, reliability and flexibility, less main transformers and HV equipment,
simple equipment layout. Therefore, at the current stage, the 14 units are preliminarily
proposed to transmit power to Thailand by seven groups of 2 units+1 transformer; the
2 units are proposed to supply electric power to local areas of Laos by means of single
unit connection.
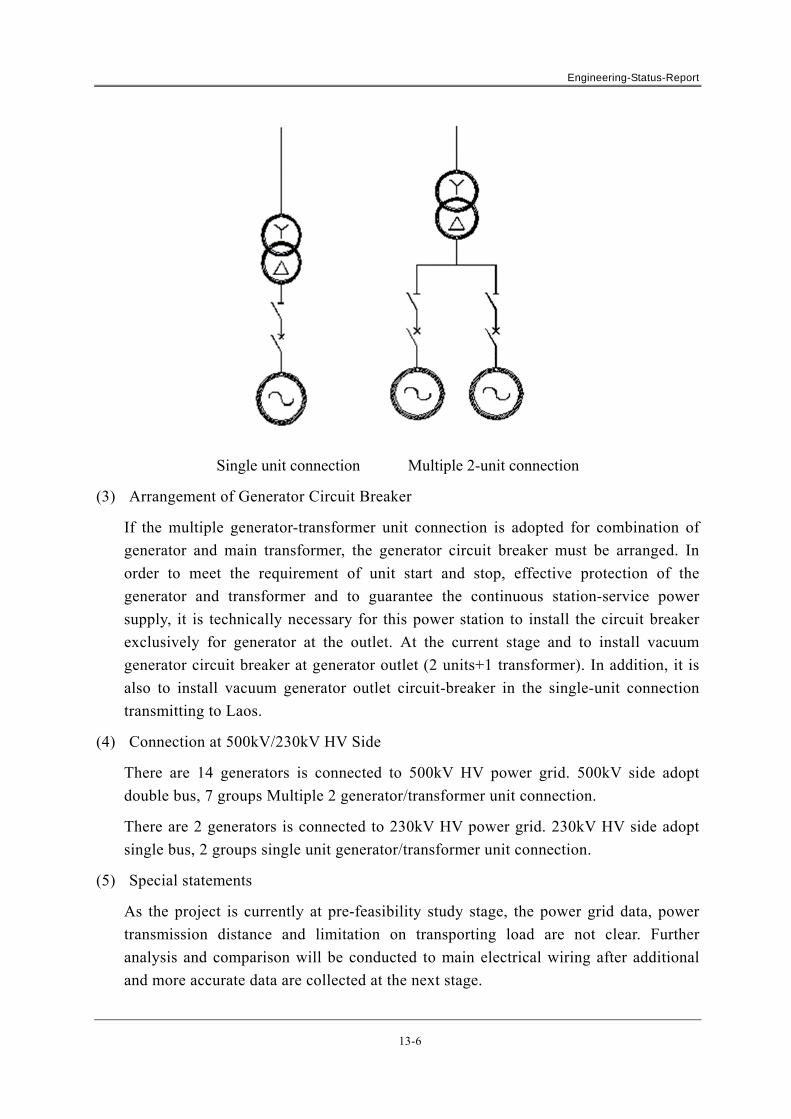
Engineering-Status-Report
13-6
Single unit connection Multiple 2-unit connection
(3) Arrangement of Generator Circuit Breaker
If the multiple generator-transformer unit connection is adopted for combination of
generator and main transformer, the generator circuit breaker must be arranged. In
order to meet the requirement of unit start and stop, effective protection of the
generator and transformer and to guarantee the continuous station-service power
supply, it is technically necessary for this power station to install the circuit breaker
exclusively for generator at the outlet. At the current stage and to install vacuum
generator circuit breaker at generator outlet (2 units+1 transformer). In addition, it is
also to install vacuum generator outlet circuit-breaker in the single-unit connection
transmitting to Laos.
(4) Connection at 500kV/230kV HV Side
There are 14 generators is connected to 500kV HV power grid. 500kV side adopt
double bus, 7 groups Multiple 2 generator/transformer unit connection.
There are 2 generators is connected to 230kV HV power grid. 230kV HV side adopt
single bus, 2 groups single unit generator/transformer unit connection.
(5) Special statements
As the project is currently at pre-feasibility study stage, the power grid data, power
transmission distance and limitation on transporting load are not clear. Further
analysis and comparison will be conducted to main electrical wiring after additional
and more accurate data are collected at the next stage.
Engineering-Status-Report
13-7
13.2.3 Station-Service Power Supply
The multiple generator-transformer unit connection is adopted for Pak Beng HPP. In order to
guarantee the reliability of the station-service power supply, the continuous power supply
shall be ensured for station service, and the turbine-generator units shall not be stopped due to
the fault of station-service power supply.
Therefore, the design of station-service power supply shall comply with the following
principles: when all turbine-generator units of the power plant are under normal operation,
there shall be at least 3 station-service power supplies; when partial turbine-generator units of
the power plant are under normal operation, there shall be at least 2 station-service power
supplies; when all turbine-generator units of the power plant are stopped, there shall be 2
station-service power supplies, but one station-service power supply is allowed standby.
To guarantee at least 3 separate station-service power supplies to ensure safe and continuous
operation of the power station, in accordance with actual conditions of Pak Beng HPP and the
recommended main electrical wiring scheme at current design stage, the station-service power
sources are as follows after analysis and comparison:
Power source 1: station-service power will come from the branches of generator voltage bus
of each multiple generator-transformer unit connections to be transmitted to Thailand;
Power source 2: station-service power will come from voltage bus of two generators in Laos;
Power source 3: station-service power will come from power grid through main transformer;
Power source 4: station-service power will come from the construction substation reserved;
Power source 5: the diesel generator will be used for station-service power.
The modes of above multiple power sources may guarantee the reliability of station-service
power.
When the units are under normal operation, the first station-service power will come from the
HV station-service transformer of generator voltage bus, and the station-service bus of each
multiple generator-transformer units back up one another. The second station-service power
will come from power grid through main transformer, and the third station-service power will
come from 10kV construction substation. In addition, one diesel generator is arranged as
emergency station-service power source.
Pak Beng HPP belongs to a large-sized hydropower station. Although the hydraulic structures
are concentrated, some loads at dam site are beyond the economic power supply range of
380V LV power grid. After considering the techno-economic rationality of the power supply
system for whole power station, two voltage ratings of 11kV and 0.4kV are preliminarily
adopted for power supply at current stage.
It is preliminarily considered to supply power separately to the units transmitting to Thailand
Engineering-Status-Report
13-8
and Laos.
13.2.4 Selection of Main Electrical Equipment
In accordance with preliminarily-selected main electrical wiring scheme, the
preliminarily-selected main electrical equipment is as follows:
(1) Turbine-Generator
Due to a number of turbine-generator units, the installed capacity of Pak Beng HPP is
relatively large. The total installed capacity of the power station will have a certain
proportion in the electric power system, and the generator cost will account for a large
proportion in the total cost. Therefore, selection of generator’s main parameters and
structures will have close relation with safe and smooth operation of the electric
power system and the power station cost as well as involving such problems as unit
manufacturing, materials and technology (workmanship). The selection of generator’s
main parameters is a process to determine the general parameter level, meet the
requirement of safe and reliable operation, approach the advanced technical level in
the world currently, and possess a certain economic rationality.
a Cooling Method of Generator
Because of the advantages of less manufacturing difficulty, simple operation and
maintenance, rich operating experience and higher utilization rate of the unit, the total
air-cooling mode shall be adopted in case the unit cooling requirements are satisfied.
It is feasible for Pak Beng HPP to employ the total air cooling mode since the
single-unit capacity is57MWbulktubular turbine. Therefore, the preliminarily-selected
cooling method for generator of Pak Beng HPP at current stage is the total air-cooling
mode. Further study will be made at the next stage if the forced draft cooling will be
required.
b Selection of Generator Rated Voltage
According to the generator capacity and local standard voltage, the rated voltage of
the generator is preliminarily selected as 11kV.
c Selection of Generator Rated Power Factor
The power factor will directly affect the generator cost. As the power factor rises, the
cost will be decreased. When the rated active power of the generator remains
unchanged, higher power factor will result in lower apparent power, and less effective
material will be consumed. At current design stage, the rated power factor of Pak
Beng HPP is preliminarily selected as 0.9 (lag).
d Selection of Generator Rated Power Factor
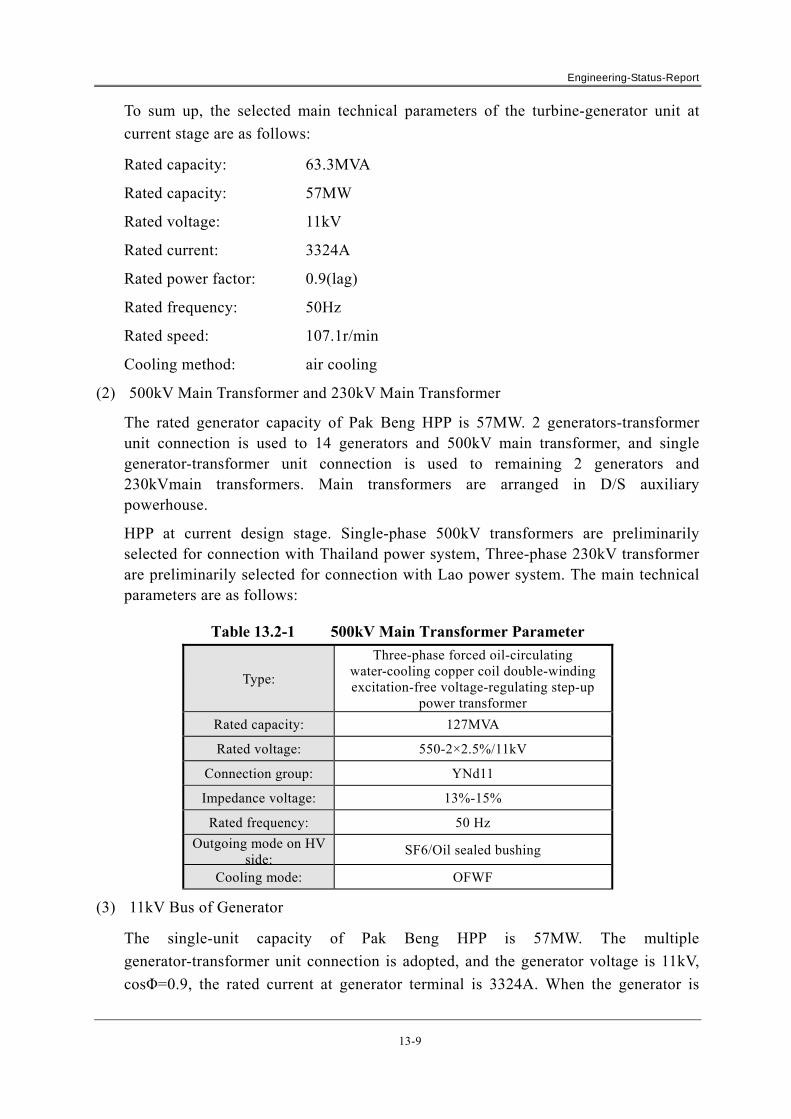
Engineering-Status-Report
13-9
To sum up, the selected main technical parameters of the turbine-generator unit at
current stage are as follows:
Rated capacity: 63.3MVA
Rated capacity: 57MW
Rated voltage: 11kV
Rated current: 3324A
Rated power factor: 0.9(lag)
Rated frequency: 50Hz
Rated speed: 107.1r/min
Cooling method: air cooling
(2) 500kV Main Transformer and 230kV Main Transformer
The rated generator capacity of Pak Beng HPP is 57MW. 2 generators-transformer unit connection is used to 14 generators and 500kV main transformer, and single generator-transformer unit connection is used to remaining 2 generators and 230kVmain transformers. Main transformers are arranged in D/S auxiliary powerhouse.
HPP at current design stage. Single-phase 500kV transformers are preliminarily selected for connection with Thailand power system, Three-phase 230kV transformer are preliminarily selected for connection with Lao power system. The main technical parameters are as follows:
Table 13.2-1 500kV Main Transformer Parameter
Type:
Three-phase forced oil-circulating water-cooling copper coil double-winding excitation-free voltage-regulating step-up
power transformer
Rated capacity: 127MVA
Rated voltage: 550-2×2.5%/11kV
Connection group: YNd11
Impedance voltage: 13%-15%
Rated frequency: 50 Hz
Outgoing mode on HV side:
SF6/Oil sealed bushing
Cooling mode: OFWF
(3) 11kV Bus of Generator
The single-unit capacity of Pak Beng HPP is 57MW. The multiple
generator-transformer unit connection is adopted, and the generator voltage is 11kV,
cosΦ=0.9, the rated current at generator terminal is 3324A. When the generator is
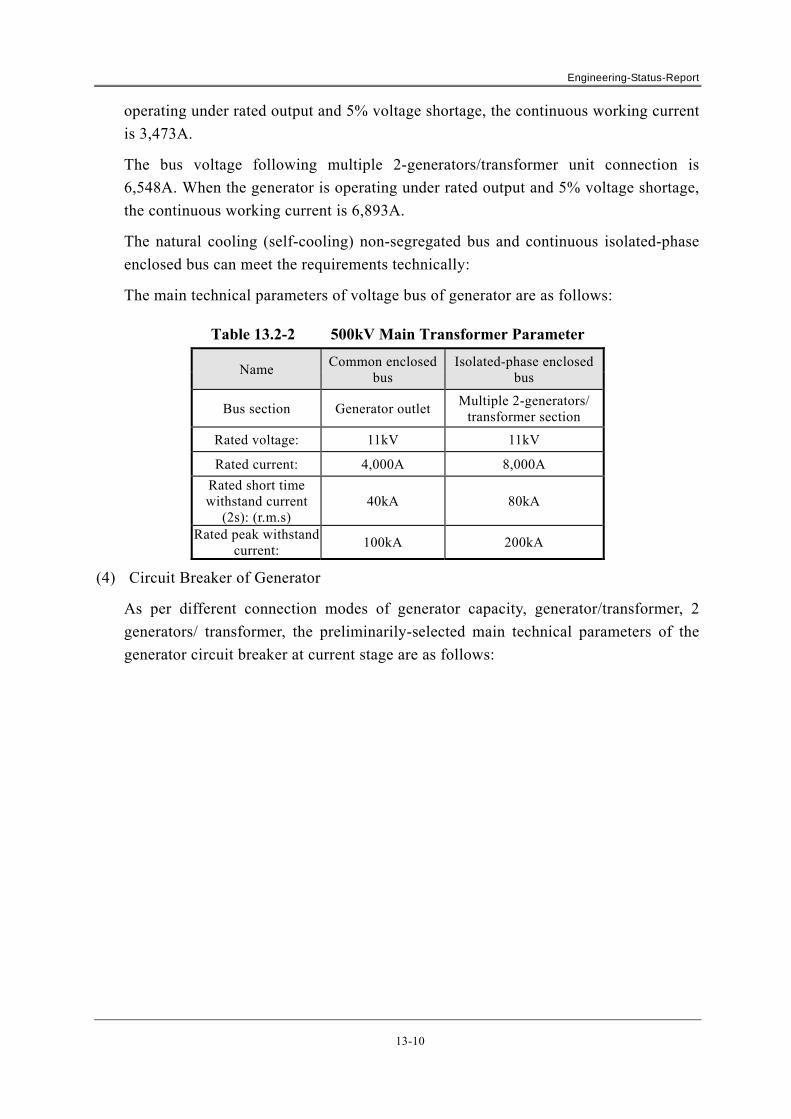
Engineering-Status-Report
13-10
operating under rated output and 5% voltage shortage, the continuous working current
is 3,473A.
The bus voltage following multiple 2-generators/transformer unit connection is
6,548A. When the generator is operating under rated output and 5% voltage shortage,
the continuous working current is 6,893A.
The natural cooling (self-cooling) non-segregated bus and continuous isolated-phase
enclosed bus can meet the requirements technically:
The main technical parameters of voltage bus of generator are as follows:
Table 13.2-2 500kV Main Transformer Parameter
Name Common enclosed
bus Isolated-phase enclosed
bus
Bus section Generator outlet Multiple 2-generators/
transformer section
Rated voltage: 11kV 11kV
Rated current: 4,000A 8,000A
Rated short time withstand current
(2s): (r.m.s) 40kA 80kA
Rated peak withstand current:
100kA 200kA
(4) Circuit Breaker of Generator
As per different connection modes of generator capacity, generator/transformer, 2
generators/ transformer, the preliminarily-selected main technical parameters of the
generator circuit breaker at current stage are as follows:

Engineering-Status-Report
13-11
Table 13.2-3 Circuit Breaker Parameter
Unit transformer connect 1 generator/ transformer
2generators/ transformer
Type of circuit breaker Self-cooled
vacuum i i b k
Forced air-cooled vacuum circuit breaker
Rated voltage: 12kV 12kV
Rated current: 4000A 4000A
Effective value of AC component of rated short-circuit breaking
current: 40kA 63kA
Insulating medium: vacuum vacuum
Cooling mode: Natural cooling Forced cooling
(5) Main Electrical Equipment’s
Table 13.2-4 Main Electrical equipment
No. Name Type and Specification Unit Sty Remark
1 Turbine-generator unit SFWG57-56/710, 57MW, 50Hz
cosφ=0.9, 57MW, 11kV set 16
2 500kV main transformer SSP-127/500, 127MVA,
Ud=13%-15%,550-2×2.5%/11kVset 7
3 230kV main transformer SSP-64/242, 64MVA, Ud=13%-15%,242±
2×2.5%/11kVset 2
4 500kV circuit breaker GIS equipment, 2000A, breaking
50kA bay 10
5 230kV circuit breaker GIS equipment, 1600A, breaking
40kA bay 4
6 Vacuum circuit breaker
of generator 12kV 4,000Abreaking 40kA set 2
7 Vacuum circuit breaker
of generator 12kV 4,000Abreaking 63kA set 14
8 Station-service
transformer DC-1,500kVA/11, 1,500kVA , set 12+1
Dry type, single phase,
one for standby
9 Station-service
transformer SC9-2,000/11kV, 2,000kVA , set 2
Dry type, three phase,
10 Excitation transformer set 16+1 Dry type
three-phase,one for standby
11 Common enclosed bus 11kV, 4,000A 3-phase meter
850
12 Isolated-phase enclosed bus
11kV, 8,000A Single phase
460
13 12kV switchgear panel 12kV, 4,000A set 41
Engineering-Status-Report
13-12
13.3 CONTROL PROTECTION AND COMMUNICATION
13.3.1 Monitoring System of Whole Station
The computer supervision and control system is employed for power station control and
monitoring. The control mode of the power station is designed based on the principle of
“unattended operations (few people on duty)”. The communication interface for superior
dispatch is reserved.
The computer supervision and control systems is to adopt hierarchical distributed open system
structure, and the system functions are configured by layers, Distribution system
configuration shall adopt dual equipment for redundancy . And the computer network
connection is to adopt fiber Ethernet. The project system shall be separated into plant control
and local control level. Plant control level is to be responsible for monitoring, controlling and
regulating the entire HPP. It is to complete data acquisition from all the local control level and
external sub-systems, data filing, event recording and filing, production reports, trend curves
and voice alarming, and realize AGC and AVC functions of the HPP. Simultaneously, it is also
communication with the superior dispatch. Plant control level is to establish two sets of
operator workstation; two host computers are hot backup of each other, which may be
automatically or manually switched. It is to establish two communication workstation to
undertake the communication tasks between the HPP and the superior dispatch center. It is to
establish an in-station communication server to realize communication between the unit
online detection system、 regime measuring and reporting and reservoir scheduling
sub-system, fire alarming system and industrial TV system, etc. It is to establish an engineer
workstation for HPP monitoring system maintenance, software development and personnel
training, etc. It is to establish an on-call server for voice/telephone alarming, telephone inquiry,
etc., and also conduct such work as making reports, etc.
All the local control level shall be able to conduct complete monitoring to the production
process they govern, they interconnect with the production process via the input and output
interfaces, all the local control level directly link with Ethernet, exchange information with
the HPP level. The internal network will be redundant bus network, and otherwise establish a
touch panel as the local man-machine interface. Except transmitting via digital means of
communication, Local control level also reserve conventional I/O hard wiring means of
transmission for such important information as accident, faults, regulation and control, etc.
Local control level is to respectively establish LCUs of all the generator units, LCU of the
switchyard, LCU of common equipment and LCUs of dam area equipment to collect and
upload the monitoring, data or information of all the generator units, common, switchyard and
dam area equipment to the host computer.
Two uninterruptible power systems (UPS) is employed for the plant control level, Supplying
power resource of UPS equipment is from one AC power and one DC power resources at

Engineering-Status-Report
13-13
plant. All the LCUs will be supplied power from 400V station-use AC and 220V DC system,
so as to guarantee uninterrupted power supply. The control of power station common utilities
and unit auxiliary equipment will be realized through PLC-based intelligent local control unit.
All the systems are established local control cabinet (box) to realize automatic control and
local manual control of all the equipment. Computer supervision and control system is to
realize monitoring and control of all the local equipment by the digital variable and serial
communication.
13.3.2 Excitation System
The self-shunt SCR static excitation mode is used for the generator. The microcomputer
excitation regulator is adopted. Double-automatic regulating channel and manually regulating
channel work as hot spare each other, and it has PID regulating law with PSS function.9.3.3
DC System.
The power station DC control power supply system is 220V, and seven groups of
maintenance-free lead-acid accumulator are equipped to be served as the power source for
whole station control, protection, circuit breaker switching off, unit standby excitation
initiating. There is no separate DC24V power supply for firefighting of the power station.
13.3.3 DC System
The power station DC control power supply system is 220V, and seven groups of
maintenance-free lead-acid accumulator are equipped to be served as the power source for
whole station control, protection, circuit breaker switching off, unit standby excitation
initiating. There is no separate DC24V power supply for fire fighting of the power station.
13.3.4 Relay Protection and Safe and Automatic Configuration
The relay protection and safe automatic equipment shall be designed and arranged in
accordance with Technical code for relaying protection and security automatic
equipmentGB14285 and Implementing Rules on Relay Protection for Twenty-Five Important
Measures to Prevent Electric Power Production from Grave Accidents.
(1) Microcomputer-based relay protection device shall be selected for power station relay
protection system
(2) Generator protection
(3) Main transformer protection (double configuration)
(4) 500kVbusbar protection (double configuration)
(5) 500kV circuit breaker protection (configuration based on circuit breaker)
(6) 230kV circuit breaker protection (configuration based on circuit breaker)
500kV line protection, 230kV line and final configuration of safe automatic equipment will be
determined as per system design.
Engineering-Status-Report
13-14
13.3.5 Measurement
The measuring and monitoring equipment of equipment operating status for this project shall
be configured in accordance with Technical Provisions for Technical code for designing
electrical measuring and energy metering device DL/T 5137-2001.
13.3.6 Communications
According to main wiring diagram and power station layout of feasibility study for Pak Beng
HPP, the proposed communication system of Pak Beng HPP consists of the system
communication, the production dispatch communication and the administrative management
communication system within the power station.
Due to lack of communication planning documents of power station connecting system, the
system communication design is temporarily considered as power line carrier and optical
cable communication mode, and the modification will be carried out as per system planning
after the approved communication documents of the connecting system are available.
Two OPGW optical cables will be laid to the other end respectively on double-circuit 550kV
and 230kV outgoing lines of Pak Beng HPP to function as main mode of system
communication and transmission line protection channel, and SDH optical transmission
equipment will be arranged at both ends with a transmission rate of STM-16.
Phase to phase combined power line carrier channels are to be arranged to be other end on
double-circuit 500kV and 230kV outgoing lines of Pak Beng HPP to transmit system dispatch
telephone, line protection and remote control signals and to serve as standby communication
mode of system communication.
A PABX with 100 lines, and a PABX with 400 lines and auxiliary equipment will be arranged
within the power station for communication of production dispatch and administrative
management.
A set of -48V/150A communication power supply together with two groups of 200Ah
maintenance-free lead-acid batteries will be arranged to provide stable and reliable electric
power for communication equipment within the power station.
13.3.7 Main Equipment of Control Protection and Communication
Refer to Table 13.3-1 for main equipment of control protection and communication.

Engineering-Status-Report
13-15
Table 13.3-1 Main Equipment of Control Protection and Communication
No. Name Type Unit Quantity Remark
1 Computer monitoring system Set 1
2 Relay protection system Set 1
3 220V DC system Set 4 Double-set
accumulator
4 Excitation system Set 16
5 Communication equipment Set 1
6 Industrial television Set 1
7 Other auxiliary control equipment Set 1
13.4 LAYOUT OF ELECTROMECHANICAL EQUIPMENT
The behind dam powerhouse of this project is arranged behind the dam and parallel with the
dam. According to selected electromechanical equipment and layout of hydraulic structures at
current stage, main equipment in main and auxiliary powerhouses as well as switchyard is
preliminarily arranged.
13.4.1 Preliminary Selection of Main Powerhouse Control Dimensions and Elevations
(1) Every Floor Elevation of Main Powerhouse
In accordance with preliminarily-selected turbine flow channel, the bottom slab
elevation of the draft tube is determined as 294.5m; according to unit dimensions,
electromechanical equipment layout and the structural requirements of the civil works,
the elevations of operation floor and equipment floor are preliminarily determined as
290.5m and 313.8m respectively; according to access road and flood control
requirement at D/S side of the powerhouse, the preliminarily- selected powerhouse
access mode is different elevations of unloading platform and generator floor, and the
elevation of the unloading floor is 321.3m. According to the lifting requirement on the
highest lifting equipment of the turbine-generator unit, the rail top elevation of the
bridge crane is determined as 338.3m.
(2) Length of Main Powerhouse
According to the layout requirement of the unit and other main equipment as well as
the structural requirement of powerhouse civil works, the distance between the units is
preliminarily determined as 20.5m; as per the requirement to ensure the layout of main
components of a unit during enlarged maintenance and more units in the powerhouse,
two erection bays are arranged on both sides of the powerhouse, the length of left
Engineering-Status-Report
13-16
erection bay being 41m, and that of right erection bay being 41m, and the total length
of main powerhouse is 410m.
(3) Width of Main Powerhouse
According to the structural demand and layout requirement on electromechanical
equipment, the width at U/S side of the powerhouse is preliminarily determined as
10.5m, the width at D/S side of the powerhouse 10.5m, the total width of the
powerhouse 21m, and the rail distance of bridge crane 21m.
(4) Equipment Arrangement of Main Powerhouse
16 sets of 57MW bulb turbine unit will be arranged in the main powerhouse. The
erection bay and unit section are arranged from left to right (flow direction).
There are three floors for unit section, namely, unloading floor, equipment floor and
operation floor..
It is to arrange seepage/drain collecting well, unit overhaul collecting well, turbine oil
tank and oil treatment room below erection bay on left side of the powerhouse at El.
321.3m.
It is to arrange regulator oil-pressure device, scavenge box and control cabinet on
unloading floor at EL.321.3m.
13.4.2 D/S Auxiliary Powerhouse
(1) Dimensions of Auxiliary Powerhouse
For the purpose of facilitating equipment arrangement, the D/S auxiliary powerhouse
with six equipment arrangement floors is preliminarily arranged, and its length,
width and height are 328m, 18m and 41.6m respectively.
(2) Electromechanical Equipment Arrangement of Auxiliary Powerhouse
The D/S auxiliary powerhouse mainly serves as technical water supply chamber and
electrical auxiliary powerhouse to be arranged at D/S side of main powerhouse, and
six floors from bottom to top are as follows:
The first floor is technical water supply equipment floor, whose elevation is 308.8m
and it is to be arranged as per each unit section;
The second floor is generating voltage equipment floor, whose elevation is 313.8m,
and it is intended for arrangement of generator voltage equipment, service
transformer, common enclosured bus, separated-phase enclosed bus and
station-service transformer;
The third floor is transformer floor, elevation is 321.3m, and it is intended for
arrangement of 500kV and 230kV transformers;
Engineering-Status-Report
13-17
The fourth floor is bus and cable clamp floor, whose elevation is 330.8m, and it is
arranged for connection of bushing with main transformer, GIS equipment and cable
bridge;
The fifth floor is GIS floor, whose elevation is 335.8m, and it is intended for
arrangement of 500kV GIS and 230kV GIS equipment on one side and central control
room and relay protection cubicle room on the other side adjacent to main erection
bay;
The sixth floor is roof line-outgoing floor, whose elevation is 350.4m, and it is used
for arrangement of 500kVand 230kV outdoor line-outgoing equipment.
13.5 HYDRAULIC STEEL STRUCTURES
13.5.1 General
Located on the upper reaches of Mekong River in Pak Beng, Oudomxay, Lao PDR, Pak Beng
HPP is the first power station planned on the Mekong River. This is a run-off-river power
station, and has comprehensive utilization requirements as power generation, navigation, fish
passing and tourism. The installed capacity is preliminarily determined as 912MW.
At current stage, the type selection and layout design of the steel structural equipment for
various layout schemes of the hydraulic structures are carried out, and the following is the
type selection and layout of the steel structural equipment for recommended layout scheme of
the hydraulic structures.
The main characteristics and difficulties of layout design of steel structural equipment for this
project are as follows: wide Mekong River, big flow, heavy task of the gates in the flood
release and sand flushing system, high requirement on gate safety and reliability, big opening
dimension of the flood release and sand flushing gate, and large capacity of hoisting
equipment; the Project has the tasks of navigation and fish passing, thus such facilities as the
ship lock and fish way shall be arranged. The ship lock size is big, and high head miter gates
at the upper and lower lock heads are difficult to design; the quantities of the steel structural
equipment are numerous, and the design is tough and the design work quantity is heavy.
In light of foregoing characteristics and difficulties, not only the manufacturing and installing
requirements shall be taken into account for design of the steel structural equipment at current
stage, but also how advanced the equipment will be , especially the safety and reliability shall
be fully considered.
The design working life of navigation lock is 100 years. For those components whose
working lives are shorter than 100 years, the design has taken convertibility into consideration.
The shortest working life of main components meet the following demands ( in years):
Hydraulic metal structure: 50
Hydraulic jack: 15
Engineering-Status-Report
13-18
Ball bearing and pulley: 25
Cable: 10
Electrical equipment: 30
The fund for maintenance and equipment replacement should be included in the cost for the
operation and maintenance of hydropower station.
The pattern for the monitoring system for the navigation lock will be ‘one man operation and
a few on duty’, and a central control room will be established for monitoring the operation of
navigation lock. The supervisory computer control system embraces two layers, namely
monitoring layer and stratum. The fundamental function of monitoring and controlling for the
operation of navigation lock can still be accomplished by some simple devices independent of
the supervisory computer control system in case that it breaks down.
The telecom information collected by the supervisory computer control system for navigation
lock will be straightly delivered to the control center of Mekong, and the system takes order
from it.
The communication system has set up a dispatching desk and a sub-control center of
industrial television in the control room for navigation lock. Dispatching telephone subset and
probe for video surveillance are allocated in hoist chamber and other significant locations of
navigation lock.
The recommended steel structural equipment at the dam site based on the layout of the
hydraulic structures can be divided into four parts: headrace system, flood release and sand
flushing system, ship lock system and fish way system. Diversion by open channel is applied
to this project. The whole power station has 207 openings and 138 pieces of trash racks and
gates (of which, 72 openings and 40 pieces of trash racks, 116 openings and 79 pieces of plain
gates, 4 openings and 4 pieces of radial gates, 1 opening and 1 piece of miter gate, 1 opening
and 1 piece of single leaf swing gate, 12 pieces of floating bollards, 1 piece of protection
device), 207 sets of embedded parts for gate slots and trash rack slots, 56 sets of various
hoists. Total quantities of the steel structural equipment is about 30,523t (refer to the list of the
equipment). Brief description of steel structural equipment is as follows.
13.5.2 Equipment of Headrace System
The power station headrace system consists of 16 headrace pipelines. The trash rack,
maintenance gate are arranged at inlet of each pipeline, and the tailrace emergency gate is
arranged at the outlet.
(1) Intake Trash Rack and Hoist Equipment
There are 32 openings and32 pieces of the vertical trash racks for the intake, with the
opening dimension being 5.65m×38.6m (W×H), the designed bottom sill elevation of
trash rack being 297.4m, the designed head of trash rack being 4m, and the designed

Engineering-Status-Report
13-19
head of frame being 10m. There are 32 openings of trash rack cleaner slots, and the
support type is the fixed roller. At the current stage, it is considered to trash rack
cleaner for cleaning. 3000/1000kN double-trolley gantry crane is used on dam crest
for hoisting.
(2) Intake Maintenance Gate and Hoist Equipment
There are 16 openings and 16 pieces of plain maintenance gates after intake trash
rack, with the opening dimension being 13.8m×17.2m (W×H), bottom sill elevation
of the gate being 292.7m, the designed water level being 340m,and the designed
head being 47.3m. The plain gate is the welded steel gate, and the support type is the
slide support. The operating condition is open and close in static water. The gate water
seal is arranged at the D/S side, and main trolley of 3000/1000kN double-trolley
gantry crane is used on dam crest for hoisting gate.
(3) Tail water Emergency Gate and Hoist Equipment
There are 16 openings and 16 pieces of plain emergency gates for the tail water outlet,
with the opening dimension being 13.8m×11m(W×H), bottom sill elevation of the
gate being 294.5m, normal tail water level being 320.16m, maximum tail water level
being 342.94m. In order to guarantee safety, it is to take 342.94m as the designed
water level and 48.44m as the designed head. The plain gate is the welded steel gate,
and the support type is the rolling wheel. The operating condition is to close gate in
dynamic water and to hoist the gate in static water. The gate water seal is arranged at
the U/S side, and 2 × 2,000kN two-way gantry cranes are used on tail water platform
for hoisting gate.
13.5.3 Equipment of Flood Release and Sand-Flushing System
The steel structural equipment of flood release and sand-flushing system includes 13 openings
of flood-release and sand-flushing sluices, 8 sand-flushing bottom outlets, 1 navigation
channel sand-flushing sluice and 1 openings of trash sluice. The U/S emergency gate, service
gate and D/S maintenance gate are arranged for flood-release and sand-flushing sluice,
sand-flushing sluices, sand-flushing bottom outlets and navigation channel sand-flushing
sluice.
Because of the importance of flood release and sand flushing system for dam safety, some
measures have been adopted to ensure that gate can be successfully opened and closed. These
measures include following points such as enough strength and rigidity are considered when
gate is designed, spare hoisting capacity is considered, a backup power which can be used to
maintain dam safety and flood discharging when main power doesn't work is set for working
and emergency gate, reliability and maintainability of components are considered in the
process of gates and hoists design which are equipped with necessary spare parts for
convenient maintenance.
Engineering-Status-Report
13-20
(1) U/S Emergency Gate and Hoist Equipment of Flood-Release and Sand-Flushing
Sluice
There are 13 openings and 2 pieces of U/S emergency gates with the opening
dimension being 15m×23m (W×H), the bottom sill elevation of gate being 317m, the
designed water level being 340m and the designed head being 23m. The plain gate is
the welded steel gate, and the support type is the fixed roller. The operating condition
is open in static water and close in dynamic water. The gate water seal is arranged at
the U/S side, and 2×2,000kN one-way gantry crane with beam-grabbing are used for
operating gate.
(2) Service Gate and Hoist Equipment of Flood-Release and Sand-Flushing Sluice
There are 13 openings and 13 pieces of service gates for flood-release and
sand-flushing sluice, with the opening dimension being 15m×23m (W×H), the bottom
sill elevation of gate being 317.0m, the designed water level being 340m and the
designed head 23m. The gate is the plain welded steel gate, and the support type is the
fixed roller. The operating condition is open and close in dynamic water. The gate
water seal is arranged at the U/S side, and 2×3,200kN fixed windlass is employed for
hoisting gate.
(3) D/S Maintenance Gate and Hoist Equipment of Flood-Release and Sand-Flushing
Sluice
There are 13 openings and 2 pieces of D/S maintenance stop log gates after
flood-release and sand-flushing service gate, with the opening dimension being
15m×14m (W×H), the bottom sill elevation of gate being 317m, the designed water
level being 330.29m and the designed head being 13.29m. The operating condition is
close and open in static water. The gate water seal is arranged at the U/S side, and
2×300kN electric hoist will be used for operation.
(4) U/S Emergency Gate and Hoist Equipment of Sand-Flushing Bottom Outlet
There are 8 openings and 2 piece of emergency gates for U/S sand-flushing bottom
outlet, with the opening dimension being 2.5m×5.34m (W×H), the bottom sill
elevation of gate being 291.281m, the designed water level being 340m and the
designed head being 48.719m. The gate is plain welded steel gate, and the support
type is the rolling wheel. The operating condition is open in static water and close in
dynamic water. The gate water seal is arranged at the U/S side with counterweight,
and 3000/1000kN double-trolley gantry crane on dam crest is used for operation.
(5) Service Gate and Hoist Equipment of Sand-Flushing Bottom Outlet
There are 8 openings and 8 pieces of service gates after sand-flushing bottom outlet
U/S emergency gate, with the opening dimension being 2.5m×5m (W×H), the bottom
Engineering-Status-Report
13-21
sill elevation of gate being 300m, the designed water level being 340m and the
designed head being 40m. The gate is plain welded steel gate, and the support type is
the rolling wheel. The operating condition is open and close in dynamic water. The
gate water seal is arranged at the U/S side with counterweight, and 1,000kN hydraulic
hoist is used for operation.
(6) D/S Maintenance Gate and Hoist Equipment of Sand-Flushing Bottom Outlet
There are 8 openings and 1 piece of plain maintenance gate after sand-flushing bottom
outlet service gate, with the opening dimension being 2.5m×5m (W×H), the bottom
sill elevation of gate being 300m, the designed water level being 320.59m and the
designed head being 20.59m. The gate is plain welded steel gate, and the support type
is the slide support. The operating condition is open and close in static water. The gate
water seal is arranged at the U/S side, and the tailrace 2×2000kN two-way gantry
cranes will be employed for operation.
(7) U/S Emergency Gate and Hoist Equipment of Navigation Channel Sand-Flushing
Sluice
There are 1 openings and 1 piece of emergency gate for navigation channel
sand-flushing sluice, with the opening dimension being 15m×23m (W×H), the bottom
sill elevation of gate being 317m, the designed water level being 340m and the
designed head being 23m. The gate is plain welded steel gate, and the support type is
fixed roller. The operating condition is open in static water and close in dynamic
water. The gate water seal is arranged at the U/S side, and 2×2,000kN one-way gantry
crane will be employed for operation.
(8) Service Gate and Hoist Equipment of Navigation Channel Sand-Flushing Sluice
There are 1 openings and 1 piece of service gate after navigation channel
sand-flushing sluice U/S emergency gate, with the opening dimension being
15m×23m (W×H), the bottom sill elevation of gate being 317m, the designed water
level being 340m and the designed head being 23m. The gate is plain welded steel
gate, and the support type is the rolling wheel. The gate water seal is arranged at the
U/S side. The operating condition is open and close in dynamic water, and 2×3,200kN
fixed hoist will be employed for operation.
(9) D/S Maintenance Gate Slot and Hoist Equipment of Navigation Channel
Sand-Flushing Sluice
There are 1 maintenance gate slot after navigation channel sand-flushing sluice
service gate, with the opening dimension being 15m×14m (W×H), the bottom sill
elevation of gate being 317m, the designed water level being 330.29m and the
designed head being 13.29m. The gate is common with the D/S maintenance gate of
Flood-Release and Sand-Flushing Sluice. The gate is plain welded steel gate, and the
Engineering-Status-Report
13-22
support type is the slide support. The operating condition is open and close in static
water. The gate water seal is arranged at the U/S side, and temporary equipment will
be employed for operation.
(10) Emergency Gate and Hoist Equipment of trash sluice
There are 1 openings and 1 piece of emergency gate for trash sluice, with the opening
dimension being 5m×3m (W×H), the bottom sill elevation of gate being 337m, the
designed water level being 340m and the designed head being 3m. The gate is plain
welded steel gate, and the support type is fixed roller. The operating condition is open
in static water and close in dynamic water. The gate water seal is arranged at the U/S
side, and 2 × 2000kN one-way gantry crane are used for operation.
(11) Service Gate and Hoist Equipment of trash sluice
There are 1 openings and 1 piece of service gate after emergency gate for trash
sluice, with the opening dimension being 5m×3m (W×H), the bottom sill elevation of
gate being 337m, the designed water level being 343.54m and the designed head being
6.54m. The gate is plain welded steel gate, and the support type is the rolling wheel.
The gate water seal is arranged at the U/S side. The operating condition is open and
close in dynamic water, and 2×125kN fixed hoist will be employed for operation.
13.5.4 Equipment of Ship Lock System
In accordance with the provisions of Navigational Agreements on Lancang-Mekong River
jointly signed by the Governments of PRC, Lao PDR, Myanmar and Thailand, the ranking of
navigation structure is determined as Ⅳ, and the navigating ship tonnage is 500t. The
navigation structure of Pak Beng HPP is a single-line ship lock. The steel structural equipment
includes the water-release system, water conveyance system, head bay and tail bay, etc. The
intake trash rack, U/S maintenance gate, service gate and D/S maintenance gate are arranged
for water conveyance system The U/S emergency maintenance gate, service gate and D/S
maintenance gate are arranged for the water-release system while the head bay emergency
maintenance gate, head bay service gate, tail bay maintenance gate and tail bay service gate
are arranged for head and tail bays.
(1) Intake Trash Rack and Hoist Equipment of Flood-Release and Sand-Flushing Sluice
of Ship Lock Water-Conveyance System
There are 8 openings and 8 pieces of trash rack for U/S intake of ship lock
water-conveyance system, with the opening dimension being 3m×3.3m(W×H), the
bottom sill elevation of trash rack being 303.62m, the U/S maximum navigation water
level being 340m. In accordance with relevant engineering experiences and for the
sake of engineering safety, the trash rack of ship lock water-conveyance system is
suitable to improve the designed head. Therefore, it is to take 5mas designed head
difference of trash rack at the current stage and to take designed head difference of
Engineering-Status-Report
13-23
frame as 10m. The support type is slide support. It is to take temporary equipment to
lift for cleaning purpose.
(2) U/S Maintenance Gate and Hoist Equipment of Ship Lock Water-Conveyance System
There are 2 openings and 2 pieces of maintenance gates after ship lock
water-conveyance system U/S trash rack, the bottom sill elevation of gate being
317.0m, the designed water level being 340m, opening dimension being
2.2m×3.3m(W×H), the designed head being 23m. The gate is the welded plain steel
gate, and the support type is slide support. The operating condition is open and close
in static water. The gate water seal is arranged at the D/S side and the 250kN electric
hoist is used for operation.
(3) Service Gate and Hoist Equipment of Ship Lock Water-Conveyance System
There are 2 openings and 2 pieces of reverse radial service gates for ship lock
water-conveyance system, with the opening dimension being 2.2m×2.6m(W×H), the
bottom sill elevation of gate being 292.02m, the designed water level being 340m, the
designed head being 47.98m. The gate is the reverse radial welded steel gate with
straight arm and cylinder trunnion. The operating condition is open and close in
dynamic water. The 1,500kN hydraulic hoist is used for operation.
(4) D/S Maintenance Gate and Hoist Equipment of Ship Lock Water-Conveyance System
There are 2 openings and 2 pieces of maintenance gates for D/S ship lock
water-conveyance system, with the opening dimension being 2.2m×3.3m(W×H), the
bottom sill elevation of gate being 293.52m, the designed water level being 340m, the
designed head being 46.48m. The gate is the plain welded steel gate and support type
is slide support The operating condition is open and close in static water. The gate
water seal is arranged at the U/S side and the 250kN electric hoist is used for
operation.
(5) U/S Maintenance Gate and Hoist Equipment of Ship Lock Water-Release System
There are 2 openings and 2 pieces of maintenance gates for U/S ship lock
water-release system, with the opening dimension being 2.2m×3.3m(W×H), the
bottom sill elevation of gate being 292.02m, the designed water level being 340m, the
designed head being 47.98m. The gate is the plain welded steel gate and support type
is slide support. The operating condition is open and close in static water. The gate
water seal is arranged at the U/S side and the 250kN electric hoist is used for
operation.
(6) Service Gate and Hoist Equipment of Ship Lock Water-Release System
There are 2 openings and 2 pieces of reverse radial service gates for ship lock water-
Release system, with the opening dimension being 2.2m×2.6m(W×H), the bottom sill
Engineering-Status-Report
13-24
elevation of gate being 292.02m, the designed water level being 340m, the designed
head being 47.98m. The gate is the reverse radial welded steel gate with straight arm
and cylinder trunnion. The operating condition is open and close in dynamic water.
The 1500kN hydraulic hoist is used for operation.
(7) D/S Maintenance Gate and Hoist Equipment of Ship Lock Water-Release System
There are 2 openings and 2 pieces of maintenance gates for D/S ship lock
water-release system, with the opening dimension being 2.2m×3.3m(W×H), the
bottom sill elevation of gate being 293.52m, the designed water level being 340m, the
designed head being 46.48m. The gate is the plain welded steel gate and the support
type is the slide support. The operating condition is open and close in static water. The
gate water seal is arranged at the U/S side and the 250kN electric hoist is used for
operation.
(8) Maintenance Gate and Hoist Equipment of Ship Lock Head Bay
There is 1 opening and 1 piece of maintenance gates for ship lock head bay, with the
opening dimension being 12m×13.54m(W×H), the bottom sill elevation of gate being
330m, the U/S maximum water level being 343.54m, the designed head being 13.54m.
The gate is the plain welded steel gate and the support type is slide support. The
operating condition is open and close in static water. The gate water seal is arranged at
the D/S side, and the 2×500kN trolley is used for operation.
(9) Service Gate and Hoist Equipment of Ship Lock Head Bay
There is 1 opening and 1 piece of miter service gate for ship lock head bay, with the
opening dimension being 12m×13.54m(W×H), the bottom sill elevation of gate being
330m, the designed water level being 343.54m, the designed head being 13.54m. The
gate is the miter welded steel gate and the steel sleeper is employed as support. The
operating condition is open and close in static water. Two 1×800kN hydraulic hoists
are used for operation.
(10) Maintenance Gate and Hoist Equipment of Ship Lock Tail Bay
There is 1 opening and 1 piece of maintenance gates for ship lock tail bay, with the
opening dimension being 12m×6.63m(W×H), the bottom sill elevation of gate being
303.62m, the designed water level being 310.25m, the designed head being 6.63m.
The gate is the plain welded steel gate, and the support type is the slide support. The
operating condition is open and close in static water. The gate water seal is arranged at
the D/S side, and the 2×300kN trolley is used for operation.
(11) Service Gate and Hoist Equipment of Ship Lock Tail Bay
There is 1 opening and 1 piece of service gate for ship lock tail bay, with the opening
dimension being 12m×37.38m(W×H), the bottom sill elevation of gate being
Engineering-Status-Report
13-25
302.62m, the designed water level being 340.0m, the designed head being 37.38m.
The gate is the single leaf swing gate and welded steel gate. The operating condition is
open and close in static water. The 1×2500kN hydraulic hoist is used for operation.
The designed head of this gate is as high as 37.38m due to the layout of the hydraulic
structures. Therefore, a special study will be carried out at the next stage.
(12) Floating Bollard
There are 12 floating bollards on two side walls of lock chamber. Each side has 6, as
to fasten the ships. The bottom sill elevation of bollard slot is 306.58m and the
platform elevation is 342m.
(13) Service Gate Protection Devices of Ship Lock
In order to protect gates and prevent the ships crashing on the gate when the ships
passing the lock, the wire rope protection device is set on both sides of upper lock
head service gate and downstream lock head service gate. The protection device which
is operated by the fixed hoist can be lifted with the water level, it is lifted up when
ships get in and out of chamber and dropped down when ships get out of chamber
13.5.5 Equipment of Fish way System
The migration is a common and important feature of the fish ecology in Mekong River Basin.
In an attempt to protect wild precious and rare fishes in the main stream of Mekong River,
maintain the natural link of the natural water system, and ensure natural reproduction of the
fishes, the fish way system is arranged for this project, and the steel structural equipment of
the fish way system consists of maintenance gate, service gate for the fish way system.
(1) Fish way Maintenance Gate and Hoist Equipment
There are 4 opening and 4 piece of U/S maintenance gate to be arranged at the fish
way intake, with the opening dimensions being 4m×3m(W×H), the designed heads
being 3m. The gate is welded steel plain gate, and the support type is the slide support.
The operating condition is open and close in static water. The gate water seal is
arranged at the D/S side, 2×100kN electric hoist is used for operation.
(2) Fish way Service Gate and Hoist Equipment
There are 2 opening and 2 piece of service gate to be arranged after the fish way
emergency gate, with the opening dimension being 4m×3m(W×H), the designed head
being 3m. The gate is welded steel plain gate, and the support type is the rolling
wheel. The operating condition is open and close in dynamic water. The gate water
seal is arranged at the U/S side and the 2×160kN electric hoist is used for operation.
13.5.6 Steel Structural Equipment
Refer to Table 13.5-1 List of Steel Structural Equipment’s for Pak Beng HPP.

Engineering-Status-Report
13-26
Table 13.5-1 List of Main Hydraulic Steel Structural equipment
No. Item Gate type
Opening dimension (W
×H, m×m)
Gate number
Opening number
Designed
Head (m)
Support type
Single weight for gate
(t)
Total weight for gate
(t)
Single weight for gate slot (t)
Total weight for gate slot (t)
Balanced weight
(t)
Grabbing beam
rod weight
(t)
Locking device
(t)
Operation mode
Hoist type Capacity
(kN) Lift (m)
Number (Set)
Single weight for
hoist (t)
Total weight
for hoist (t)
Rail and other (t)
Remark
1 Intake trash rack Straight rack 5.65×38.6 32 32 10/4 Slide block 65 2080 35 1120 96 48 Trash rack
cleaner cleanTrash rack
cleaner 50 50 2 18 36 60
2 Slot of Trash rack
cleaner Straight rack 5.65×38.6 32 15 480
3 Intake maintenance
gate Plain slide
gate 13.8×17.2 16 16 47.3 Slide block
260 4160 60 960 15 48 Static up and
down
Dam crest double-trolley gantry crane
3000/1000 60 1 650 650 110
4 Tailrace emergency
gate Plain rolling wheel gate 13.8×11.0 16 16 48.44
Rolling wheel
265 4240 80 1280 15 64 Dynamic down and static up
Tailrace two-way
gantry crane2×2000 55 2 550 1100 120
5 U/S emergency gate of sand-flushing bottom
outlet
Plain rolling wheel gate
2.5×5.34 2 8 48.719 Rolling wheel
22 44 28 224 25 5 2 Dynamic down and static up
Dam crest double-trolley gantry crane
(3000 /1000)
(60) Common
use
6 Service gate of
sand-flushing bottom outlet
Plain rolling wheel gate 2.5×5 8 8 40
Rolling wheel
20 160 25 200 120 64 8 Dynamic up
and downHydraulic hoist 1000 5.6 8 18 144
7 D/S maintenance gate
of sand-flushing bottom outlet
Plain slide gate 2.5×5 1 8 20.59
Slide block
15 15 12 96 6 1 Static up and
down
Tailrace two-way
gantry crane
(2×2000)
(55) Common
use
8 U/S emergency gate of
flood-release sand-flushing sluice
Plain rolling wheel gate
15×23 2 13 23 Rolling wheel
295 590 60 780 12 8 Dynamic down and static up
One-way gantry crane
2×2000 40 1 350 350 150 Gate
storage slot 1x15
9 Service gate of flood-release
sand-flushing sluice
Plain rolling wheel gate 15×23 13 13 23
Rolling wheel
320 4160 60 780 52 Dynamic up
and downFixed windlass 2×3200 35 13 145 1885
10 D/S maintenance gate
of flood-release sand-flushing sluice
Plain slide gate 15×14 2 13 13.29
Slide block
180 360 35 455 10 Static up and
down Electric hoist 2×300 35 1 30 30 30
Gate storage
slot 1x15
11 U/S emergency gate of
navigation channel sand-flushing sluice
Plain rolling wheel gate
15×23 1 1 23 Rolling wheel
295 295 60 60 12 8 Dynamic down and static up
One-way gantry crane
(2×2000)
(35) Gate
storage slot 1x15
12 Service gate of
navigation channel sand-flushing sluice
Plain rolling wheel gate 15×23 1 1 23
Rolling wheel
320 320 60 60 10 Dynamic up
and downFixed windlass 2×3200 40 1 145 145
13 D/S maintenance gate
slot of navigation channel sand-flushing
l i
Plain slide gate 15×14 1 1 13.29
Slide block
35 35 4 Static up and
down Temporary equipment
14 Intake trash rack of
ship lock water conveyance system
Straight rack 3×3.3 8 8 10/5 Slide block
4 32 8 64 0.2 Rack lifting and cleaning
Temporary equipment
15 U/S maintenance gate
of ship lock water conveyance system
Plain slide gate 2.2×3.3 2 2 23
Slide block
5 10 8 16 5 1 Static up and
down Electric hoist 250 10 2 4 8
16 Service gate of ship
lock water-conveyance system
Reverse radial gate 2.2×2.6 2 2 47.98
Cylindrical hinge
35 70 40 80 25 Dynamic up
and downHydraulic hoist 1500 3.5 2 18 36

Engineering-Status-Report
13-27
No. Item Gate type
Opening dimension (W
×H, m×m)
Gate number
Opening number
Designed
Head (m)
Support type
Single weight for gate
(t)
Total weight for gate
(t)
Single weight for gate slot (t)
Total weight for gate slot (t)
Balanced weight
(t)
Grabbing beam
rod weight
(t)
Locking device
(t)
Operation mode
Hoist type Capacity
(kN) Lift (m)
Number (Set)
Single weight for
hoist (t)
Total weight
for hoist (t)
Rail and other (t)
Remark
17
D/S maintenance gate of ship lock
water-conveyance system
Plain slide gate 2.2×3.3 2 2 46.48
Slide block
8 16 12 24 5 1 Static up and
down Electric hoist 250 10 2 4 8
18 U/S maintenance gate
of ship lock water-release system
Plain slide gate
2.2×3.3 2 2 47.98 Slide block
8 16 12 24 5 1 Static up and
down Electric hoist 250 10 2 4 8
19 Service gate of ship lock water-release
system
Reverse radial gate 2.2×2.6 2 2 47.98
Cylindrical hinge
35 70 40 80 25 Hydraulic hoist 1500 3.5 2 18 36
20 D/S maintenance gate
of ship lock water-release system
Plain slide gate 2.2×3.3 2 2 46.48
Slide block
8 16 12 24 5 1 Static up and
down Electric hoist 250 10 2 4 8
21 Maintenance gate of ship lock head bay
Plain slide gate
12×13.54 1 1 13.54 Slide block
100 100 35 35 10 2 Static up and
down Trolley 2×500 50 1 55 55 15
Gate storage
slot 1x15
22 Service gate of ship
lock head bay Miter gate 12×13.54 1 1 13.54
Steel sleeper
280 280 70 70 Static up and
down Hydraulic hoist 800 2.8 2 25 50
23 Maintenance gate of
ship lock tail bay Plain slide
gate 12×6.63 1 1 6.63 Slide block
80 80 35 35 10 1 Static up and
down Trolley 2×300 50 1 50 50 15
Gate storage
slot 1x15
24 Service gate of ship
lock tail bay Single leaf swing gate
12×37.38 1 1 37.38 Steel
sleeper 480 480 85 85
Static up and down
Hydraulic hoist 2800 6.4 1 80 80
25 Floating Bollard 12 12 4 48 25 300
26 Service gate protection devices of Ship Lock
1 1 20 20 30 30 Fixed windlass 100 50 4 5 20
27 Emergency gate of
trash sluice Plain rolling wheel gate
5×3 1 1 3 Rolling wheel
4 4 5 5 2 0.2 Dynamic down and static up
One-way gantry crane
(2×2000)
(35)
28 Service gate of trash
sluice Plain rolling wheel gate 5×3 1 1 6.54
Rolling wheel
5.5 5.5 6 6 0.2 Dynamic up
and downElectric hoist 2×125 8 1 5 5
29 Maintenance gate of
fish way Plain slide
gate 4×3 4 4 3 Slide block
6 24 5 20 0.2 Static up and
down Electric hoist 2×100 10 1 5 5
30 Service gate of fish
way Plain rolling wheel gate
4×3 2 2 3.3 Rolling wheel
7 14 5 10 2 3.5 0.4 Dynamic up
and downElectric hoist 2×160 10 2 5.5 11
Total 17145 7293 149 318.5 268.4 4714.5 560 75
Total: 30523 t

Engineering-Status-Report
14-1
14 SWITCHYARD TRANSMISSION
14.1 INTRODUCTION
Currently, according to the Project Development Agreement, the most power generated by
Pak Beng HPP will supply to Thailand, and only 10% supply to Laos. Then, basis on related
analysis, the voltage grade of transmission line to Thailand would be 500kV, and the line to
Laos would be 230kV.The double bus apposed operation mode is used by 500kV electric
equipment, and the single bus apposed operation mode is used by 230kV electric equipment.
The GIS(gas insulated switchgear)equipment is adopted for the 500kV and 230kV electric
equipment.
14.2 TRANSMISSION
For the initial intention of Pak Beng HPP connect to system, the two report of OUDOM
XAI-PAK BENG HPP 230KV TRANSMISSION LINE & SUBSTATION PROJECT
FEASIBILITY STUDY DESIGN SPECIFICATION and POWER SYSTEM STUDY FOR
PAK BENG HYDROELECTRIC POWER PLANT PROJECT have been performed, and the
initial scheme are as follows:
Pak Beng HPP consists of 16 units of 57 MW hydroelectric power generating sets, of which,
14 units of 57 MW hydroelectric power generating sets will supply power to Thailand
connected to 500kV Tha Wang Pha Substation (new substation) to sell electric power to
Electricity Generating Authority of Thailand (EGAT), using 500kV double-circuit
4×795MCM ACSR conductor.
The rest 2 units of 57MW hydroelectric power generating sets will supply power to EDL,
connecting to 230kV Oudomxay Substation (updated from 115kV Oudomxay Substation),
through 230kV double-circuit in one tower (line only installed on one side, and the line on the
other side will be installed by EDL in the future), the length of the line is about 150km, the
conductor type is ACSR-630/45.
14.3 SWITCHYARD PRELIMINARY DESIGN
The powerhouse is located behind the dam. The double bues with bus circuit breakers
connection are adopted at 500kV HV side, and single bus is used at 230kV side. If outdoor
switchyard is adopted, it will occupy wide land, and furthermore it is far away from
powerhouse, unfavorable to operation management.
Due to structural characteristics and compared with conventional outdoor electrical equipment,
GIS equipment has the following advantages:
(1) Small arrangement area and occupation space;
(2) Safe and reliable operation;
(3) Short installation period;
Engineering-Status-Report
14-2
(4) Little maintenance work and long maintenance period;
(5) GIS equipment can be arranged together with D/S auxiliary powerhouse, and the
concentrated equipment arrangement is favorable for “unattended operation” (few
person operations);
(6) It is favorable for environmental protection since outdoor switchyard requiring a
great deal of excavation and backfill could be avoided.
Therefore, GIS equipment is preliminarily selected for 500kV and 230kV switchyards of Pak
Beng Hydropower Project, and the switchyard is arranged on the D/S side of main
powerhouse.
The main technical parameters of 500kV SF6fully-enclosed electrical circuit breaker are as
follows:
Rated voltage: 550 kV
Rated current: 2000 A
Rated frequency: 50 Hz
Rated short-time withstand current: 50 kA
Rated peak withstand current: 125 kA
Rated duration of short circuit: 2 s
The main technical parameters of 230kV SF6fully-enclosed electrical circuit breaker are as
follows:
Rated voltage: 252 kV
Rated current: 1600 A
Rated frequency: 50 Hz
Rated short-time withstand current: 40 kA
Rated peak withstand current: 100 kA
Rated duration of short circuit: 2 s
14.4 TRANSMISSION PRELIMINARY DESIGN
14.4.1 Transmission Line Supply to Laos
For the line supply to Laos, each phase shall use one 630mm2 ACSR, and ACSR-630/45 is
recommended for the project. The manufacturing and inspection shall conform to GB1179-83.
Two ground wires shall be built in this project according to the requirement of
telecommunication: One is OPGW (36-core) and the other is designed as branching line,
which shall meet the requirements that the net clearance of conductor at the center of span
Engineering-Status-Report
14-3
(any span) shall not be smaller than 0.012L+1m (L is the span length) and that the sag of the
two ground wires shall not be bigger than 80% of the conductor sag and that the sag of the
two ground wires shall be basically the same at the annual mean temperature.
The tower design shall be based on the electrical plan, the actual topographical, geological,
transport conditions in the principle of “economical and reasonable, safe and reliable”. In
addition, the design shall take into account the construction schedule with the help of good
experience so as to achieve the balance among quality, schedule, and cost.
The tower shall be self-supported with members composed of equal-leg angle sections, which
are bolted together on site. All members shall be hot-dip galvanized for erosion protection.
The double-circuit tower can be umbrella, drum or T type. According to the selected line route,
it is recommended to use the umbrella tower, which has been widely used in the 230kV
double-circuit lines in Laos and has mature design, construction and running experience.
14.4.2 Transmission Line Supplying power to Thailand
The single line diagram of the Pak Beng HPP supply to Thailand is shown in Figure 14.4-1.
Power flow calculations were carried out to identify an appropriate system interconnection
and configuration to transmit the generated power from Pak Beng Hydroelectric Power Plant
Project, and results are shown in Figure 14.4-2 and Figure 14.4-3. It can be seen in the two
figures that the power flow was reasonable and the system was stable after Pak Beng HPP
connect to the system

Engineering-Status-Report
14-4
Thailand.
Fig.14.4-1 One Line Diagram of the Pak Beng HPP Supply to Thailand

Engineering-Status-Report
14-5
Fig.14.4-2 Power Flow Diagram for N Security under Peak Load
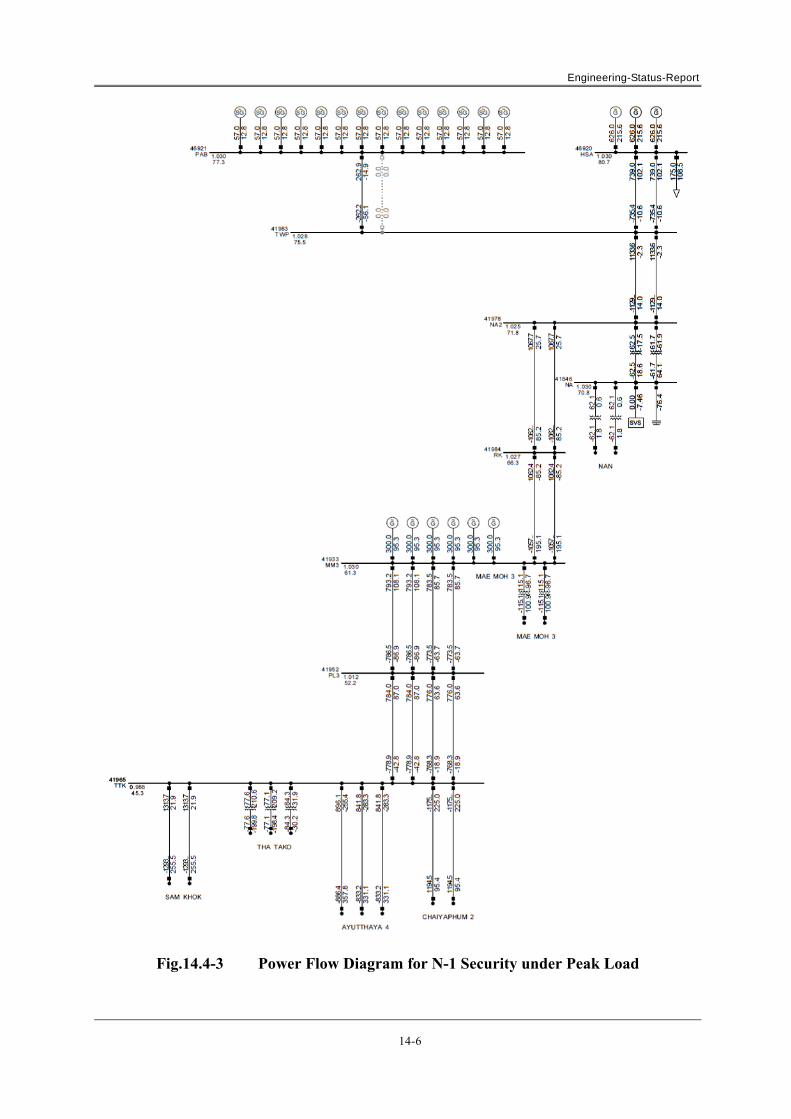
Engineering-Status-Report
14-6
Fig.14.4-3 Power Flow Diagram for N-1 Security under Peak Load

Engineering-Status-Report
15-1
15 CONSTRUCTION PLAN AND SCHEDULING
15.1 CONSTRUCTION DIVERSION
15.1.1 Means of Diversion
It is preliminarily determined to adopt the staged means of diversion.
15.1.2 Ranks of Diversion Structure
(1) First-Stage Diversion Structures include first-stage longitudinal concrete cofferdam
and upstream and downstream transversal cofferdams, the classes of which will be
Class IV.
(2) Second-Stage Diversion Structures include second-stage upstream and downstream
transversal cofferdams and longitudinal cofferdam, the classes of which will be Class
IV.
15.1.3 Standards of Diversion Structure
It is preliminarily planned for protection against 20 years frequency flood in the first-stage
and second-stage diversion criteria, and the corresponding designed flow will be 18,700m3/s,
and planed for the temporary retaining dam with a 50-year frequency flood in the late-stage,
with flow of 21,100m3 / s.
15.1.4 Diversion Procedure
(1) First-Stage Diversion
a In the dry period, it is to retain water with cofferdams along the river, narrow the flow
of the river bed, and navigate with the original river channel.
The riverbed narrow effect have been taken in considered in the upstream water level
calculation results of R/B and L/B cofferdam. The calculation results of water
level-flow relation at dam axis are as follows.

Engineering-Status-Report
15-2
Table 15.1-1 Calculation Results of Water Level-Flow Relation at Dam axis
Flow (m3/s)
Water Level at Dam axis (m)
Natural riverbed condition narrowed riverbed condition
700 307.40 307.40
1,000 308.17 308.23
3,000 313.42 313.51
5,000 318.57 318.67
8,000 323.73 323.90
10,000 326.26 326.47
15,000 331.43 331.68
20,000 335.37 335.86
24,000 338.98 339.21
In the dry period of December of the first year to May of the third year, it is to retain
water with cofferdams along the river, and narrow the flow of the river bed. It is to
construct permanent Ship lock, upstream and downstream approach channels,
concrete longitudinal cofferdam and first-stage upstream and downstream
all-year-round cofferdam, the diversion criteria shall be P=10%, Q=5,410m3/s, and
the water level before the cofferdam shall be 319.62m.
b It is to retain water with upstream and downstream all-year-round cofferdam and
longitudinal cofferdam, discharge with narrowed the river bed, and navigate with the
original river bed.
From June of the third year to November of the fourth year, it is to retain water with
upstream and downstream all-year-round cofferdam and longitudinal cofferdam,
discharge with narrowed the river bed. It is to construct the R/B foundation pit all
year round, the diversion criteria shall be P=5%, Q=18,700m3/s, and the water level
before the cofferdam shall be 335.42m.
During the first-stage diversion period, it is to construct the R/B works first, with
insignificant level of narrowing the original river bed, which will basically not affect
the navigation of the original river bed.
(2) Second-Stage Diversion
From December of the fourth year to May of the sixth year, the diversion criteria
shall be P=5% (all year round), Q=18,700m3/s, and the water level before the
cofferdam in the upstream shall be 335.30m.
During second-stage diversion, it is to flow with the flood-release and sand-flushing
outlets, and from the time the main river bed being closed to that the cofferdam being

Engineering-Status-Report
15-3
completed for retaining water, it will be impossible for navigation, so it will be
necessary to take measures to satisfy the cross-dam transportation requirements. After
the cofferdam has complete conditions for retaining water, it is to navigate with the
permanent Ship Lock.
Details of construction diversion procedure may be referred to Table 15.1-2.
Table 15.1-2 Construction Diversion Procedures Diversion Periods ( Year, Month Date - Year,
Month Date)
Design Criteria
Designed Flow
Retaining Structure and
Its Crest Elevation
Designed Water Level
Discharge Flow of Water-Release Structures
(m3/s) Remarks
% m3/s m m Narrowed
River Bed
Flood-Release and Sand-Flushing
Outlet EL.322m
3.1.1~3.5.31
10 5,410
(Dec.~May)
Dry season cofferdam
321 319.62 5,410
It is to discharge with narrowed river bed, navigate with the original river bed, construct longitudinal cofferdam, first-stage all-year-round cofferdam and R/B Foundation Pit
3.6.1~4.11.30
5 18,700
First-stage all-year-round cofferdam
337.00
335.42 18,700
It is to discharge with narrowed river bed, navigate with the original river bed, and construct R/B all year round
First ten days of
4.12 10
2,880 (Average Monthly)
Embankment 323
321.10 2,880 Second-stage cofferdam river closure
4.12.11~5.5.31
10 5,410 Cofferdam
325 323.47 5,410
River is unnavigable. It is to flow with the Flood-Release, fill second-stage cofferdam, and excavate L/B Foundation Pit
5.6.1~6.5.31
5 18,700 Cofferdam
339 335.30 18,700
It is to flow with Flood-Release and Sand-Flushing Gate, navigate with permanent Ship lock, and construct L/B Foundation Pit all year round
6.6.1~6.12.31
2 21,100 (Dam) 346.00
337.09 21,100
After 7.1.1
(Dam) 346.00
Permanent Water-Release Structure to discharge flood normally
Works complete
15.1.5 Standards of Diversion Structure
For this work, it is to use Flood-Release and Sand-Flushing Outlets as the diversion and
discharge structure, and the diversion retaining structure will mainly be First-Stage Cofferdam,
Second-Stage Cofferdam, Longitudinal Cofferdam and Temporary Cofferdam.
Layout of diversion structures may be referred to Layout of River Diversion (1/5-5/5).
(1) First-Stage Cofferdam
First-stage upstream and downstream cofferdam will adopt earth-rock cofferdams,
and both the cofferdam foundation and cofferdam body will adopt rock fill with
geomembrane core for anti-seepage.

Engineering-Status-Report
15-4
The crest elevation of first-stage upstream and downstream cofferdam will be 337m
and 336m respectively, and the maximum cofferdam height will be 25m and 28m
respectively.
(2) Second-Stage Cofferdam
It is to adopt earth-rock cofferdam for second-stage upstream and downstream
cofferdam, the cofferdam foundation is preliminarily planned to adopt concrete cutoff
wall for seepage protection, and the above-water cofferdam is to prevent seepage
with geomembrane core.
The crest elevation of second-stage upstream and downstream cofferdam is 339m and
338m respectively, and the maximum cofferdam height is 37m and 40m respectively.
(3) Longitudinal Cofferdam
Longitudinal cofferdam is to adopt RCC cofferdam. The elevations of the upstream
longitudinal cofferdam crest is 339m, and the maximum cofferdam height is 41m.
The floating removal chute will be used as the downstream longitudinal cofferdam.
(4) Dry Period Cofferdam
Dry cofferdam is to protect construction of longitudinal concrete cofferdam; Dry
cofferdam is to be filled with mixed material of earth and rock, and prevent seepage
with high-pressure grouting cutoff wall. The cofferdam crest elevation is 321m, and
the maximum cofferdam height is 17m.
Main quantity of diversion works are shown in Table 15.1-3.
15.1.6 River Closure
Closure of the main river bed is arranged in early December of the fourth year, the river
closure criteria is P=10% (average flow in December), Q=2,880m3/s. It is preliminarily
planned to adopt the means of river closure by protecting the bottom with barge, and then
conduct one-way occupation with double embankments. It is to occupy from L/B to R/B,
leave an outlet at the right side close to the river bed, and the embankment crest elevation is
323m.
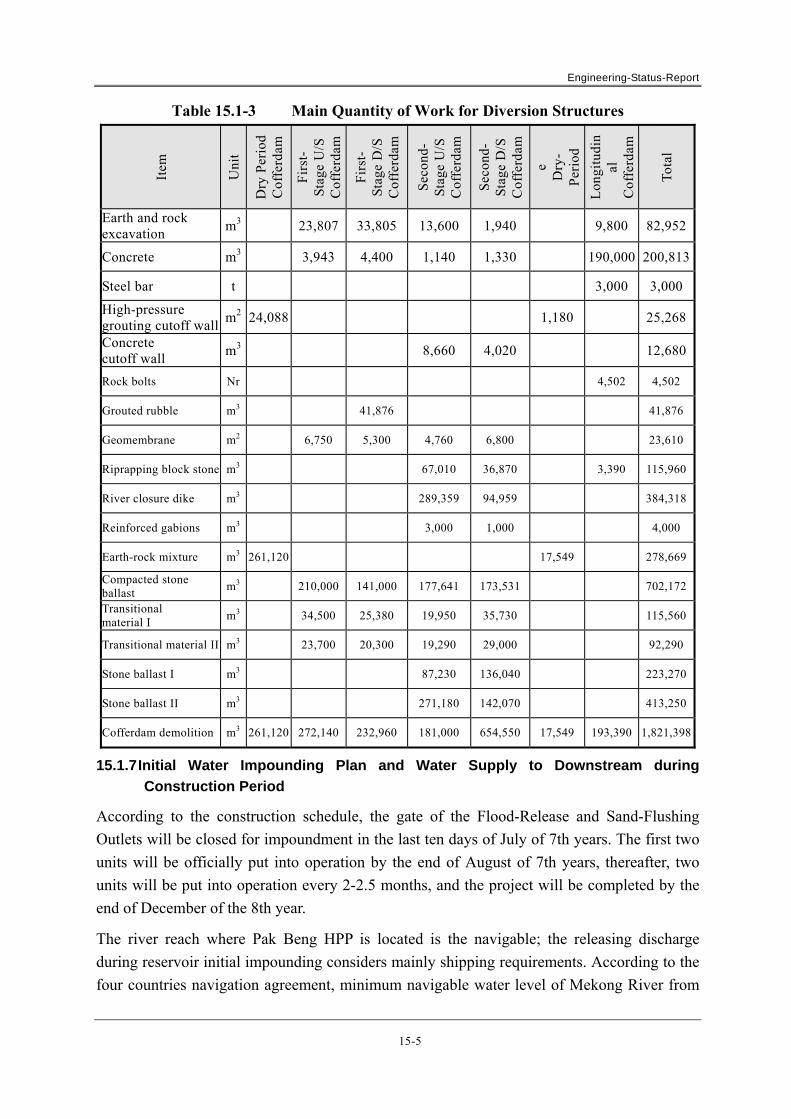
Engineering-Status-Report
15-5
Table 15.1-3 Main Quantity of Work for Diversion Structures
Item
Uni
t
Dry
Per
iod
Cof
ferd
am
Fir
st-
Sta
ge U
/S
Cof
ferd
am
Fir
st-
Sta
ge D
/S
Cof
ferd
am
Sec
ond-
S
tage
U/S
C
offe
rdam
Sec
ond-
S
tage
D/S
C
offe
rdam
e
Dry
- P
erio
d
Lon
gitu
din
al
Cof
ferd
am
Tot
al
Earth and rock excavation
m3 23,807 33,805 13,600 1,940 9,800 82,952
Concrete m3 3,943 4,400 1,140 1,330 190,000 200,813
Steel bar t 3,000 3,000
High-pressure grouting cutoff wall
m2 24,088 1,180 25,268
Concrete cutoff wall
m3 8,660 4,020 12,680
Rock bolts Nr 4,502 4,502
Grouted rubble m3 41,876 41,876
Geomembrane m2 6,750 5,300 4,760 6,800 23,610
Riprapping block stone m3 67,010 36,870 3,390 115,960
River closure dike m3 289,359 94,959 384,318
Reinforced gabions m3 3,000 1,000 4,000
Earth-rock mixture m3 261,120 17,549 278,669
Compacted stone ballast
m3 210,000 141,000 177,641 173,531 702,172
Transitional material I
m3 34,500 25,380 19,950 35,730 115,560
Transitional material II m3 23,700 20,300 19,290 29,000 92,290
Stone ballast I m3 87,230 136,040 223,270
Stone ballast II m3 271,180 142,070 413,250
Cofferdam demolition m3 261,120 272,140 232,960 181,000 654,550 17,549 193,390 1,821,398
15.1.7 Initial Water Impounding Plan and Water Supply to Downstream during
Construction Period
According to the construction schedule, the gate of the Flood-Release and Sand-Flushing
Outlets will be closed for impoundment in the last ten days of July of 7th years. The first two
units will be officially put into operation by the end of August of 7th years, thereafter, two
units will be put into operation every 2-2.5 months, and the project will be completed by the
end of December of the 8th year.
The river reach where Pak Beng HPP is located is the navigable; the releasing discharge
during reservoir initial impounding considers mainly shipping requirements. According to the
four countries navigation agreement, minimum navigable water level of Mekong River from
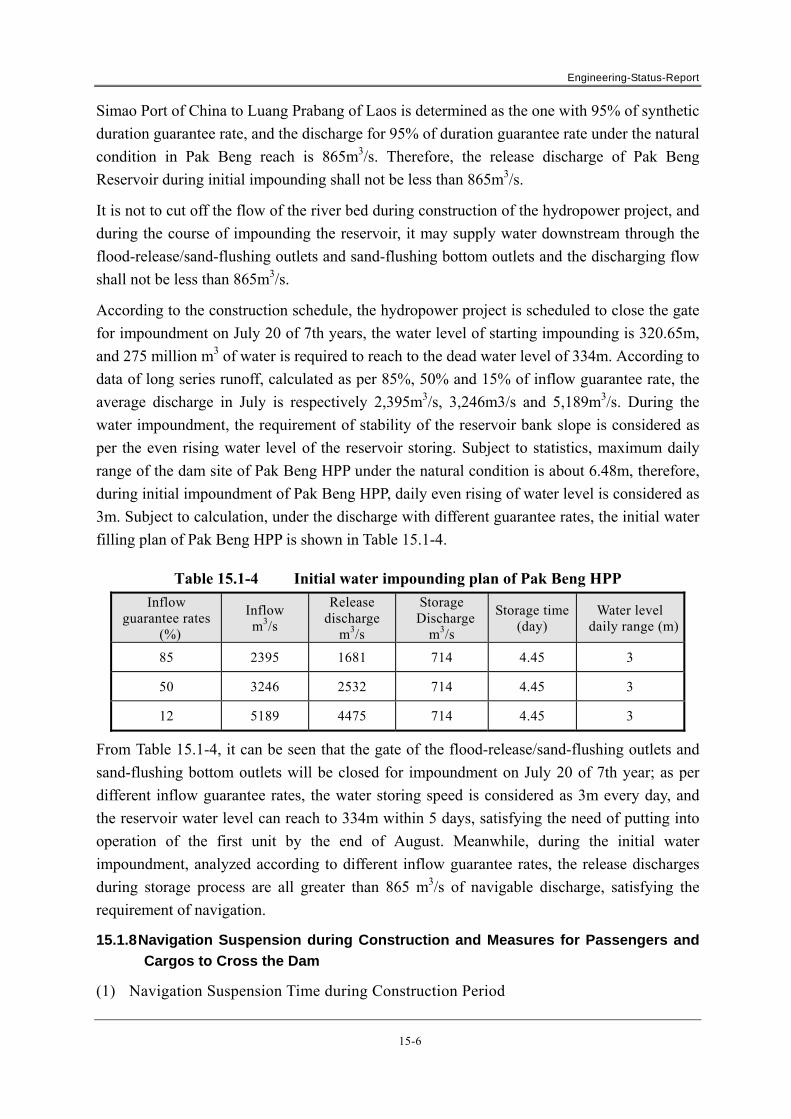
Engineering-Status-Report
15-6
Simao Port of China to Luang Prabang of Laos is determined as the one with 95% of synthetic
duration guarantee rate, and the discharge for 95% of duration guarantee rate under the natural
condition in Pak Beng reach is 865m3/s. Therefore, the release discharge of Pak Beng
Reservoir during initial impounding shall not be less than 865m3/s.
It is not to cut off the flow of the river bed during construction of the hydropower project, and
during the course of impounding the reservoir, it may supply water downstream through the
flood-release/sand-flushing outlets and sand-flushing bottom outlets and the discharging flow
shall not be less than 865m3/s.
According to the construction schedule, the hydropower project is scheduled to close the gate
for impoundment on July 20 of 7th years, the water level of starting impounding is 320.65m,
and 275 million m3 of water is required to reach to the dead water level of 334m. According to
data of long series runoff, calculated as per 85%, 50% and 15% of inflow guarantee rate, the
average discharge in July is respectively 2,395m3/s, 3,246m3/s and 5,189m3/s. During the
water impoundment, the requirement of stability of the reservoir bank slope is considered as
per the even rising water level of the reservoir storing. Subject to statistics, maximum daily
range of the dam site of Pak Beng HPP under the natural condition is about 6.48m, therefore,
during initial impoundment of Pak Beng HPP, daily even rising of water level is considered as
3m. Subject to calculation, under the discharge with different guarantee rates, the initial water
filling plan of Pak Beng HPP is shown in Table 15.1-4.
Table 15.1-4 Initial water impounding plan of Pak Beng HPP
Inflow guarantee rates
(%)
Inflow m3/s
Release discharge
m3/s
Storage Discharge
m3/s
Storage time (day)
Water level daily range (m)
85 2395 1681 714 4.45 3
50 3246 2532 714 4.45 3
12 5189 4475 714 4.45 3
From Table 15.1-4, it can be seen that the gate of the flood-release/sand-flushing outlets and
sand-flushing bottom outlets will be closed for impoundment on July 20 of 7th year; as per
different inflow guarantee rates, the water storing speed is considered as 3m every day, and
the reservoir water level can reach to 334m within 5 days, satisfying the need of putting into
operation of the first unit by the end of August. Meanwhile, during the initial water
impoundment, analyzed according to different inflow guarantee rates, the release discharges
during storage process are all greater than 865 m3/s of navigable discharge, satisfying the
requirement of navigation.
15.1.8 Navigation Suspension during Construction and Measures for Passengers and
Cargos to Cross the Dam
(1) Navigation Suspension Time during Construction Period

Engineering-Status-Report
15-7
Construction of the hydropower station is to adopt staged means of diversion.
In first-stage, it is to construct the R/B Permanent Ship Lock, Approach Channel and
Flood-Release and Sand-Flushing Gate, and the L/B original river channel will be
navigable.
The designed water level of main riverbed closure in second-stage will be 321.10m,
the sill bottom elevation of ship lock head bay will be 330m, and the upstream
minimum navigable water level will be 334m. Therefore, since it is to start
occupation, close river and fill cofferdam for the main river bed, till the time when
the upstream water level is impounded to 334m, the upstream water level will not be
able to satisfy the requirements for navigation of the Ship Lock, and the river section
at the dam site will suspend navigation. According to preliminary analysis, the
navigation suspension time will be from November of the fourth year to May of the
fifth year, totally about 7 months.
(2) Passage facilities across the dam in time of interruption of navigation
In time of interruption of navigation, passengers and goods are transported by being
shifted to land transport in the dam site river section. A goods and passengers transfer
wharf is respectively set up on both upstream and downstream side of dam site.
The transit scale of the transit dock will be designed as 0.79×10⁶t/year (cargo
transportation volume of 2010 Level Year), and it is preliminarily to consider
designing 120t berthing capacity, and 5 berths each by high and low water levels in
the upstream and downstream respectively. The transit docks will be finished before
commencement of river closure, with conditions available for operation.
15.2 CONSTRUCTION MATERIALS
15.2.1 Sources of Main Construction Materials, Water and Electricity
It is to preliminarily select Xishuangbanna Hongta Cement Factory in China as the main
cement supplying factory, and Pu’er Jianfeng Cement Factory as the supplementary cement
supplying factory.
As to selection of mixtures (admixtures), it is tentatively to consider adopting the plan of
blending iron-ore slag with limestone powder. Water quenched slag of Yuxi Xinxing Iron and
Steel Co., Ltd. is to be transported to the job site for grinding; Limestone aggregate on L/B in
the upstream of the project is to be ground.
It is to consider supplying steel from Kunming, China; Timber is to be supplied locally;
Explosive materials are to be supplied from Pak Beng, Laos; Oil are to be sourced from the
Thai market; Water supply for construction purpose and domestic consumption will be drawn
from Mekong River, while the water for domestic consumption shall be purified before use.
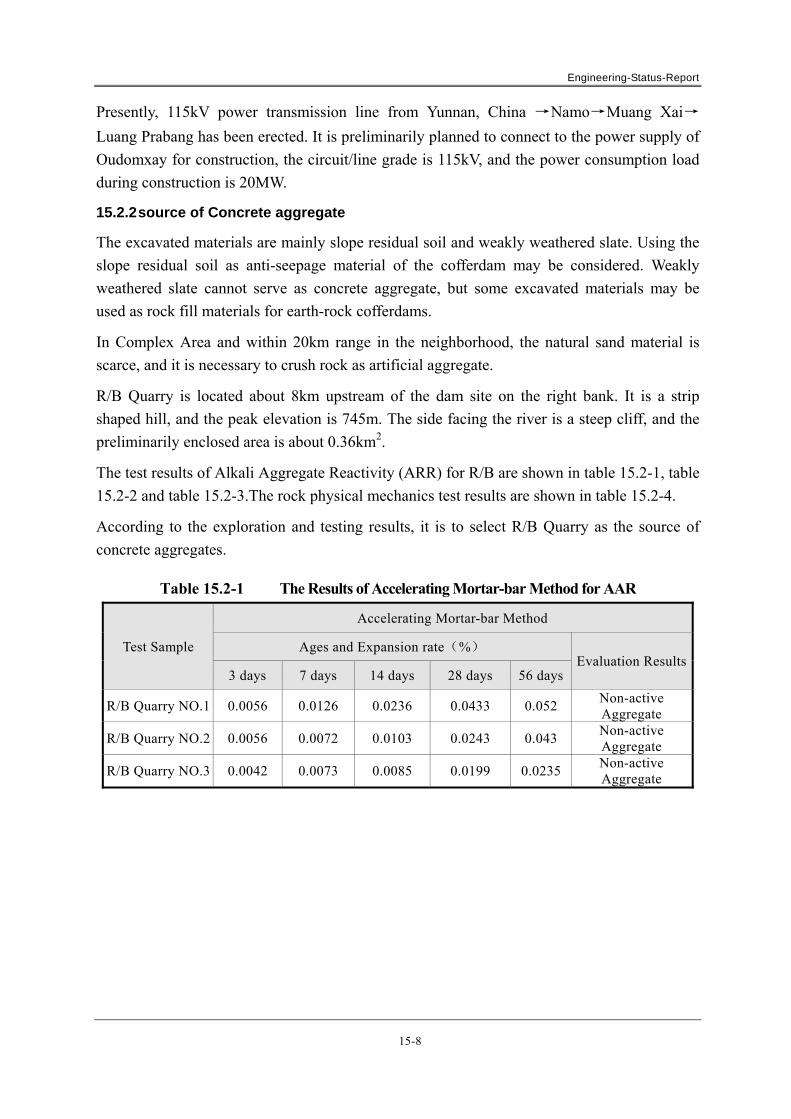
Engineering-Status-Report
15-8
Presently, 115kV power transmission line from Yunnan, China →Namo→Muang Xai→
Luang Prabang has been erected. It is preliminarily planned to connect to the power supply of
Oudomxay for construction, the circuit/line grade is 115kV, and the power consumption load
during construction is 20MW.
15.2.2 source of Concrete aggregate
The excavated materials are mainly slope residual soil and weakly weathered slate. Using the
slope residual soil as anti-seepage material of the cofferdam may be considered. Weakly
weathered slate cannot serve as concrete aggregate, but some excavated materials may be
used as rock fill materials for earth-rock cofferdams.
In Complex Area and within 20km range in the neighborhood, the natural sand material is
scarce, and it is necessary to crush rock as artificial aggregate.
R/B Quarry is located about 8km upstream of the dam site on the right bank. It is a strip
shaped hill, and the peak elevation is 745m. The side facing the river is a steep cliff, and the
preliminarily enclosed area is about 0.36km2.
The test results of Alkali Aggregate Reactivity (ARR) for R/B are shown in table 15.2-1, table
15.2-2 and table 15.2-3.The rock physical mechanics test results are shown in table 15.2-4.
According to the exploration and testing results, it is to select R/B Quarry as the source of
concrete aggregates.
Table 15.2-1 The Results of Accelerating Mortar-bar Method for AAR
Test Sample
Accelerating Mortar-bar Method
Ages and Expansion rate(%) Evaluation Results
3 days 7 days 14 days 28 days 56 days
R/B Quarry NO.1 0.0056 0.0126 0.0236 0.0433 0.052 Non-active Aggregate
R/B Quarry NO.2 0.0056 0.0072 0.0103 0.0243 0.043 Non-active Aggregate
R/B Quarry NO.3 0.0042 0.0073 0.0085 0.0199 0.0235 Non-active Aggregate

Engineering-Status-Report
15-9
Table 15.2-2 The Results of Mortar Bar Length Test Method for AAR
Test Sample
Mortar bar length test Method
Ages and Expansion rate(%) Evaluation Results
14 days 1 month 2 months 3 months 6 months
R/B Quarry NO.1 0.0087 0.0100 0.0125 0.0122 0.0129 Non-active Aggregate
R/B Quarry NO.2 0.0078 0.0097 0.0120 0.0120 0.0133 Non-active Aggregate
R/B Quarry NO.3 0.0083 0.0081 0.0094 0.0103 0.0106 Non-active Aggregate
Table 15.2-3 The Results of Rock Column Method for AAR
Test Sample
Accelerating Mortar-bar Method
Ages and Expansion rate(%) Evaluation Results
7 days 14 days 21days 28 days 56 days 84 days
R/B Quarry NO.1 0.0026 0.0055 0.0055 0.0082 0.0082 0.0110 Non-active Aggregate
R/B Quarry NO.2 0.0053 0.0080 0.0080 0.0108 0.0135 0.0162 Non-active Aggregate
R/B Quarry NO.3 0.0028 0.0056 0.0056 0.0084 0.0112 0.0139 Non-active Aggregate
The concrete volume of the works will totally be about 2,939.3×103m3 (including 2,533.7×
103m3 of the complex works, about 248.4×10³ m3 of diversion works, and about 157.2×10³
m3 of other temporary works). The transitional material of the cofferdam is about 247.42×
103 m3.
Through calculation, it is to exploit about 3.59×10⁶m3 of useful materials from the quarry as
concrete aggregate, and considering 1.35 times of planning coefficient, the planned exploiting
volume of the quarry will be about 4.846×10⁶m3.
It is preliminarily planned to exploit by benches per the slope ratio of 1:0.5 or 1:0.3, each
bench is to be 15m high, the berm is 3m wide. Elevation of the maximum point of the cutting
line of the quarry slope shall be 657m, elevation of the terminal exploiting platform will be
415m, and the total exploiting volume will be about 5.526×10⁶m3 , including 4.846×10⁶m3
of useful materials and 0.68×10⁶m3 of useless materials.
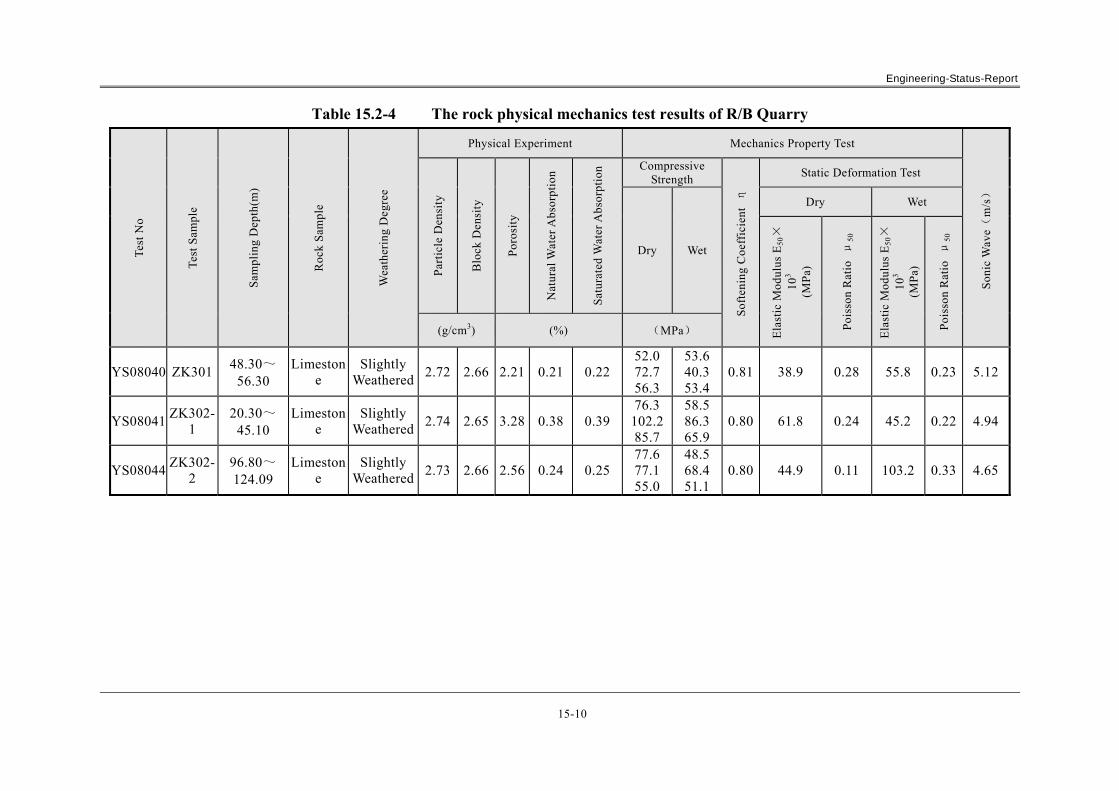
Engineering-Status-Report
15-10
Table 15.2-4 The rock physical mechanics test results of R/B Quarry
Tes
t N
o
Tes
t S
ampl
e
Sam
plin
g D
epth
(m)
Roc
k S
ampl
e
Wea
ther
ing
Deg
ree
Physical Experiment Mechanics Property Test
Son
ic W
ave(
m/s)
Par
ticl
e D
ensi
ty
Blo
ck D
ensi
ty
Por
osit
y
Nat
ural
Wat
er A
bsor
ptio
n
Sat
urat
ed W
ater
Abs
orpt
ion Compressive
Strength
Sof
teni
ng C
oeff
icie
nt η
Static Deformation Test
Dry Wet
Dry Wet
Ela
stic
Mod
ulus
E50×
103
(MP
a)
Poi
sson
Rat
io μ
50
Ela
stic
Mod
ulus
E50×
103
(MP
a)
Poi
sson
Rat
io μ
50
(g/cm3) (%) (MPa)
YS08040 ZK30148.30~
56.30 Limeston
e Slightly
Weathered2.72 2.66 2.21 0.21 0.22
52.072.756.3
53.640.353.4
0.81 38.9 0.28 55.8 0.23 5.12
YS08041ZK302-
1 20.30~
45.10 Limeston
e Slightly
Weathered2.74 2.65 3.28 0.38 0.39
76.3102.285.7
58.586.365.9
0.80 61.8 0.24 45.2 0.22 4.94
YS08044ZK302-
2 96.80~124.09
Limestone
Slightly Weathered
2.73 2.66 2.56 0.24 0.2577.677.155.0
48.568.451.1
0.80 44.9 0.11 103.2 0.33 4.65

Engineering-Status-Report
15-11
15.3 CONSTRUCTION METHODOLOGY
15.3.1 Construction of Diversion Works
First-stage upstream cofferdam filling volume will be 0.27×10⁶m3, and the downstream
cofferdam filling volume will be 0.213×10⁶m3 whereas second-Stage upstream cofferdam
filling volume will be 1.093×10⁶m3, and the downstream cofferdam filling volume will be
0.705×10⁶m3.
Constructing bottom protection of the underwater filling material will adopt bottom-open
barge, river closure will adopt 25t-32t dump truck, and directly dump into water,
supplemented with 235kW bulldozer to push materials into water, and the leveled cofferdam
crest shall facilitate occupation by trucks.
Filling part above water shall prioritize filling the cutoff wall construction platform, and after
the platform is completely formed, it is to fill the cofferdam shell on both sides of the
platform. Fillers shall be transported with 32t dump truck, leveled with 235kW bulldozers
after discharging, and compacted with 19t vibration rollers. Filler for first-stage cofferdam
will be taken from R/B Disposal Area, and stone ballasts and slope protection block stones
will be taken from L/B 1# Disposal Area. The filter material will be taken from the R/B
Aggregate Processing System.
Longitudinal cofferdam is concrete cofferdam, and the volume of concrete will be about 0.19
×106m3. It is to transport with dump truck from right concrete mixing system to the pouring
site, directly put into the place from the bottom, rotating with a 3m3 horizontal tank, and
hauled to the place with crawler crane.
The R/B temporary Sub-Cofferdam filling volume will be about 0.263×10⁶m3. Anti-seepage
of temporary sub-cofferdam and powerhouse cofferdam will adopt high-pressure jet grouting,
and cofferdam filling material will mainly use dam abutment and dam foundation excavation
materials.
High-pressure jet grouting will adopt CZ22 hydraulic crawler drill to make holes, consolidate
the walls with hole-protecting mud. High-pressure jet grouting will adopt GS500-4
high-pressure jet grouting machine, while grouting pump will adopt BW250 model.
High-pressure jet grouting will be mono-row holes, to be constructed by double-sequence
method, i.e., construct Sequence-I holes first, and then Sequence-II holes. High-pressure jet
grouting will adopt jetting/spraying from bottom upward.
It is to adopt percussion drill to make holes and channels for construction of concrete cutoff
walls, consolidate walls with mud, and pour concrete as walls with bottom conduit in the mud
channel.
Upstream and downstream cofferdams and longitudinal cofferdams in first-stage and
second-stage must be entirely removed. Concrete longitudinal cofferdam must adopt
Engineering-Status-Report
15-12
controlled blasting, it is required that the blasted blocks shall be easy for excavation. It is to
adopt 3m3 hydraulic backhoe to excavate cofferdam, and transport to Disposal Area with
32t-25t dump trucks.
15.3.2 Construction of Dam
Concrete gravity dam, maximum dam height is about 65m, the Dam Abutment and dam
foundation excavation volume is about 7.53×10⁶m3, and the concrete pouring volume of the
principal works will be about 1912.5×103m3, to be constructed by two stages: In first-stage,
it is to construct the R/B Flood-Release and Sand-Flushing Gate Dam Block, Permanent Ship
Lock, Approach Channel and Non-spillway Section, as well as excavate the above-water
section on the left bank; In second-stage, it is to construct the L/B Non-spillway Section,
Powerhouse Section, Sand-Flushing Bottom Outlets and Fish way.
(1) Excavation of Dam Foundation
Excavation of Dam Abutment: The overburden is to be drilled with hand drill,
loosened and blasted with shallow holes, and collected with 235kW bulldozer. Bed
rocks are to be drilled holes with ROC712 down-hole drill supplemented with hand
drill, squeezed blasting with elementary errors by sections from top to bottom, the
bench height is 10m, collected mucks with 235kW bulldozer, and transported to the
disposal area with 25t-32t dump truck loading with 3m3-4m3 excavators.
Excavation of Dam Foundation: Overburden of dam foundation is to be loosened
earth with 235kW bulldozer with earth crackers, and transported to the disposal area
with 25t–32t dump truck loading with 3m3~4m3 excavators. The rocks are drilled
holes with ROC712 drills, supplemented with hand drills, blasted by layers and
benches, collected mucks with bulldozers, and transported to the disposal area with
25t-32t dump truck loading with 3m3-4m3 excavators.
(2) Dam Body Concrete Pouring
In first-stage, it is to allocate 2 MQ2000 Portal Cranes and 2 M900 Tower Cranes
each in the upstream and downstream of the Flood-Release and Sand-Flushing Gate,
and pour into place with 3m3-6m3 concrete horizontal tanks.
Concrete pouring intensity of second-stage dam is high, and the lower mass concrete
will mainly be directly dumped into the place with dump trucks, while the upper
structure will be constructed with Portal crane and Tower Crane supplemented with
crawler crane.

Engineering-Status-Report
15-13
Concrete is to be poured by thin-lift concrete placing method. Concrete will be
horizontally compacted with vibrator, and the edge part shall be supplemented with
plug-in vibrators for vibration.
(3) Installation of Steel Structures of the Dam Body
Gate leaf, outriggers and other large pieces shall be hauled with trailers from the
assembly plant to the dam crest with bridge crane or rubber-tyred gantry crane, where
it is to be lifted with bridge crane, rubber-tyred Portal crane and crawler crane.
Embedded parts, water seal and connecting pieces and other small pieces shall be
lifted with rubber-tyred gantry crane from the assembly plant by the trucks and
transported to the installation site. Installation of embedded parts shall be conducted
in parallel or alternatively with the concrete pouring.
15.3.3 Construction of Headrace/Power Generation System
Powerhouse foundation excavation shall be conducted after river closure and simultaneously
with the dam foundation. Before closure of second-stage cofferdam, it is firstly to excavate
L/B 20#-23# Dam Blocks, After Dam Unit Block and Erection Bay, and protecting the
cofferdam before the dry season, so as to facilitate installation of Powerhouse Bridge Crane as
early as possible.
For Powerhouse concrete pouring is to be transported to the working face with 6m3 concrete
truck, the 6m3 tank shall then be hauled to the place with overhead gantry crane, constructed
with steel forms or slipforms, and poured lift by lift from bottom upward.
Lifting of all parts of water turbine shall be conducted with bridge cranes. Installation of
electrical equipment that is matched with water turbine-generator units shall be conducted
simultaneously with the embedded parts and units.
15.3.4 Construction of Navigation Structures
Upper lock head (head bay), lower lock head (tail bay) and upstream and downstream
approach channels shall be constructed by sections. Concrete shall be transported with 20t
dump truck, upper lock head, gate chamber and lower lock head will be lifted into place with
MQ2000 portal crane, and the approach channel concrete will be lifted to the place with
DMQ540/30B portal crane or W200A crawler crane, and partially poured into place with
chute. Downstream approach channel will be constructed during the dry period.
15.4 ACCESS TO THE PROJECT SITE
At the current stage, the combined transportation of waterway and highway is considered for
the external communication.
(1) Roads
Engineering-Status-Report
15-14
Lao No. 13 national road starts from Vientiane, runs across North Laos, and connects
with Mohan Town, China via Muang Xai. It is asphalt concrete pavement, being
6.5m-7.0m wide, the general road condition is relatively good, with small traffic
flow. Except the section of Luang Prabang to Muang Xai has stiff slopes and multiple
bends, the remaining sections are mostly flat and straight.
There is a provincial highway from Muang Xai to Pak Beng in Laos, and the
pavement is about 6m wide, being asphalt concrete pavement, with relatively good
road conditions.
There is a high-class highway from Chiang Saen to Bangkok in Thailand upstream of
Pak Beng Port.
The high-class highway from Jinghong to Mohan in China, which is a section of
Kunming – Bangkok Great International Passageway, has been open to traffic. The
road from Jinghong to Kunming is a high-class road, with relatively good road
condition.
Presently, the road from Pak Beng to Muang Ngeun have been built. The access road
of the Hydropower Station will be connected from it about 6km far from the dam site.
(2) Railway
Presently, Laos does not have railway.
In the Chinese territory, Kunming railway complex is connected with the national
railway network, and the main standard-gauge railways include Chengdu-Kunming
Railway, Guiyang-Kunming Railway, Neijiang-Kunming Railway and
Nanning-Kunming Railway. All these four railways are National Grade I railways,
normally allows throughput of Grade II pieces exceeding limits, and the designed
axial load is 23 tons. To be specific, the transportation weight of Chengdu-Kunming
Railway is 200t, while that of Nanning-Kunming and Neijiang-Kunming Railway is
250t. There is still no railway from Kunming to Laos via Jinghong and Mohan Port.
(3) Waterway
This Hydropower Station is accessible by waterway from either Vientiane in the
downstream or Simao Port in the upstream.
The waterway from Simao Port to Jinghong Port has been greatly improved after
impounding of Jinghong Hydropower Station, and the maximum allowable load is
300t. However, the navigation structures of Jinghong Hydropower Station still do not
have condition for navigation until the end of 2010.
The relevant waterways of Lancang-Mekong River from Jinghong, China to
Vientiane may be described as follows.
Engineering-Status-Report
15-15
a The section from Jinghong Port, China to Chiang Saen Port, Thailand is an
international inland waterway, being 344km long, where every January to May is dry
season, June to October is high-water season, and October to December is medium-
water season. To be specific, during the dry season, the water depth of the section
from Dashaba to Ganlanba is but 1.5m, and vessels carrying heavy cargos cannot pass
until the upstream hydropower station discharges water and raises the water level. At
the border between China, Laos and Myanmar on the Mekong River, there is a rapid
with swift flow. There are over 100 bulk cargo vessels on the waterway, and the
loading capacities are between 100t and 250t.
b The section from Chiang Saen Port to Chiang Khong Port (on the opposite bank of
Houayxay Port) is an original inland waterway being dredged, and the entire length is
58km, with multiple hidden reefs and rapids. Every January to May is dry season,
June to October is high-water season, and October to December is medium-water
season. During the dry season, the maximum loading capacity of the passable vessels
is 60t, while the maximum loading capacity of the passable vessels is 250t in the
high-water season.
c The section from Chiang Khong Port to Pak Beng Port is an original inland waterway,
and the entire length is 126km. Every January to May is dry season, June to October
is high-water season, and October to December is medium-water season. There are
multiple hidden reefs and rapids. The waterway allows access of 50t vessels all year
round, and seasonally allows access of 150t-300t vessels.
d The section from Pak Beng Port to Luang Prabang Port is an inland waterway of
Laos, and the entire length is 162.5km. It basically allows access of 50t vessels all
year round, and 300t passenger vessels during the high-water season.
e There are passenger transportation services on Mekong River from Luang Prabang to
Vientiane. In the waters from Vientiane southward to Savannakhet, it allows access of
50t vessels during the dry season, and 100t vessels during the rainy season.
The Mekong River Waterway is planned as follows.
From 2008 to 2010, relying on Joint Committee on Coordination of Commercial
Navigation on the Lancang-Mekong River (JCCCN) among China, Laos, Myanmar
and Thailand, it is to further improve 600.5km waterways from No. 244 boundary
tablet on Mekong River amongst China, Laos and Myanmar to the navigable section
agreed by the four countries, and try to get internal aids to dredge the 475.6km
waterway from Luang Prabang to Vientiane. The dredging project will be based on
the standard of allowing access of 300t vessels, and by the means of blasting and
pell-mell (riprap), so as to improve the waterway and protection the shoreline.
Engineering-Status-Report
15-16
In terms of port planning, from 2008 to 2010, it is to construct three ports: Ban
Phonkeo, Houayxay and Luang Prabang, as the main hub ports connecting with
Mekong River. From 2010 to 2015, it is to construct Pak Beng Port, Muang Tad and
other ports.
In the Chinese territory on the upstream of Mekong River, the main opening ports are
Jinghong Port and Guanlei Port. From every mid-December to the end of the
following May, it is the dry season. During this period, the waterway from Jinghong
Port to Chiang Saen Port allows access of 100t flatboats (cargo weight), and in the
other periods, 250t vessels carrying large pieces may be navigable. The port handling
capacity is 50t (wheeled crane), and there is a special berth for large pieces of
Jinghong Hydropower Station, and the operation capacity could be as high as about
150t.
(4) Marine Transportation
Since the middle section of Mekong River is not navigable, if materials are
transported by marine transportation, it will be necessary to be transported to the
other ports and transferred to the hydropower station by land transportation.
The seaport relatively close to the hydropower station is Bangkok Port and the
maximum mobile crane lifting capacity is 500t. It has about 0.13×10⁶ m2 of
warehouse, and 0.31×10⁶ m2 of open storage yard and 4 container yards. Since the
water at the berths is shallow, the seaport could but berth vessels of 10,000 dead
weight and container vessels of 500TEU.
Laem Charbang Port is located on the northern beach of Gulf of Thailand, 110km
south of Bangkok, Thailand, and it may berth container vessels, bulk dry cargo
vessels, automobile transportation vessels and large passenger vessels. Presently,
there are 11 handling berths in operation, including 5 container berths. Presently,
Laem Charbang Port is closely connected with the Thai expressway network and
railway network. Highway transportation will not necessarily go through downtown
or suburbs of Bangkok with heavy traffic. Instead, four national highways, i.e., No. 7,
No. 3, No. 34 and No. 304 may link Laem Charbang Port closely with North
Thailand. International cargo vessels arriving at Thailand normally berth at Laem
Charbang Port.
(5) Transportation of Heavy and Large Articles
The single weight and main size of heavy and large pieces for this project are shown
in Table 15.4-1, which shall be supplied from China, Japan, Europe and America.

Engineering-Status-Report
15-17
Table 15.4-1 List of Weights and Main Sizes of the Heavy and Large
Pieces of Pak Beng HPP
No. Name of Heavy and Large Pieces Weight of Single Piece (t) Main Size (L×W×H)
1 Main Transformer 130 7.5m×3.5m×4.0m
2 Sand-Flushing Gate Leaf of Spillway 55 16.8m×3.3m×2.25m
3 1/2 Tubular Seat 30 7.9m×4.35m×3.24m
4 Rotor Spider 57 φ6.4m×1.75m
5 Turbine Hub 70 φ2.0m×7.7m
6 Rotor Hub 54 φ2.7m×3.7m
7 Beam/Girder of Bridge Crane in Main
Powerhouse 60 23.5m×3.0m×2.5m
8 Intake Bulkhead Gate 50 15.0m×3.2m×2.2m
9 Tailrace emergency gate 55 15.0m×3.2m×2.2m
10 Ship Lock Gate 50 15.0m×3.2m×2.2m
If the heavy and large pieces of equipment come from Japan, Europe or America, it is
to be transported by sea to Laem Charbang Port, Thailand, transited to the
hydropower station by road.
If the heavy and large pieces of equipment are to be manufactured in China, there will
be two options of transportation.
a It is to transport from the manufacturer’s place to Kunming City, Yunnan Province
by railway or road, transit to Jinhong Port, Yunnan Province, and transport to the
Hydropower Station by trucks
b From the manufacturer’s factory, it is to transport to the port closest to the
manufacturer and can also satisfy the requirements for lifting and transporting the
heavy and large pieces of equipment, ship to Laem Charbang Port by sea, transit to
Pak Beng by road.
The parameters of heavy and large pieces for Jinghong Hydropower Project are
shown in Table 15.4-2 and Table 15.4-3.
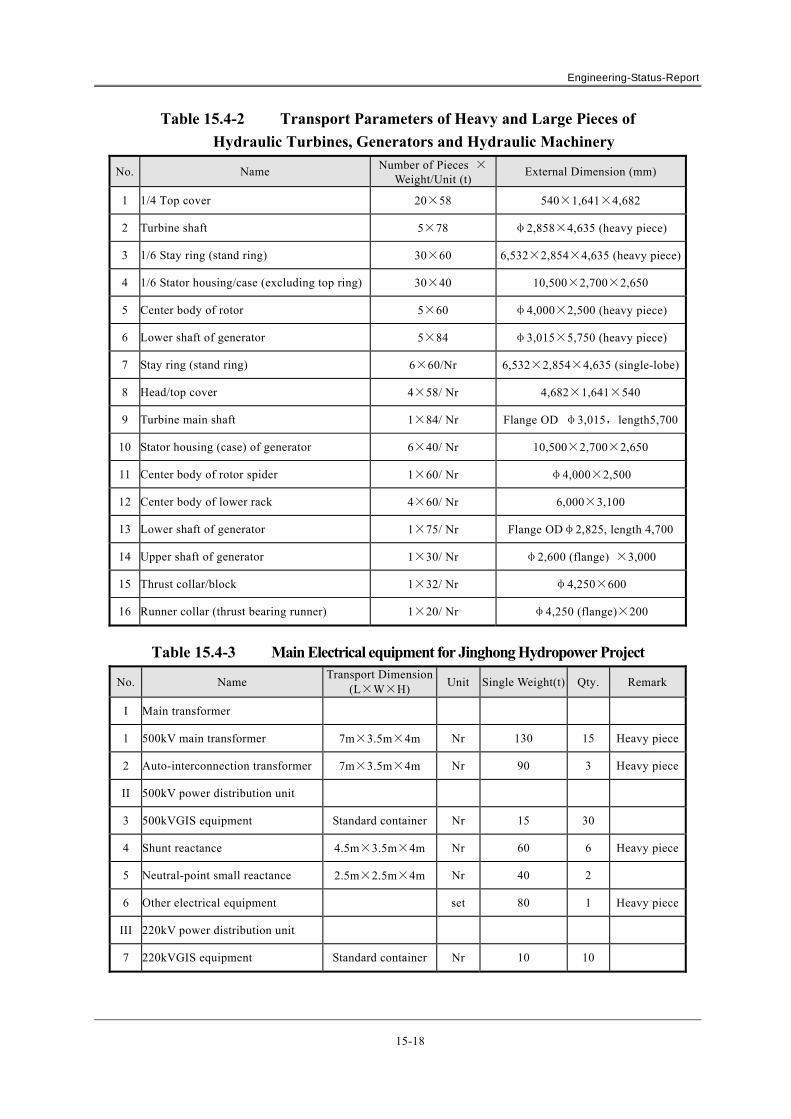
Engineering-Status-Report
15-18
Table 15.4-2 Transport Parameters of Heavy and Large Pieces of
Hydraulic Turbines, Generators and Hydraulic Machinery
No. Name Number of Pieces × Weight/Unit (t)
External Dimension (mm)
1 1/4 Top cover 20×58 540×1,641×4,682
2 Turbine shaft 5×78 φ2,858×4,635 (heavy piece)
3 1/6 Stay ring (stand ring) 30×60 6,532×2,854×4,635 (heavy piece)
4 1/6 Stator housing/case (excluding top ring) 30×40 10,500×2,700×2,650
5 Center body of rotor 5×60 φ4,000×2,500 (heavy piece)
6 Lower shaft of generator 5×84 φ3,015×5,750 (heavy piece)
7 Stay ring (stand ring) 6×60/Nr 6,532×2,854×4,635 (single-lobe)
8 Head/top cover 4×58/ Nr 4,682×1,641×540
9 Turbine main shaft 1×84/ Nr Flange OD φ3,015,length5,700
10 Stator housing (case) of generator 6×40/ Nr 10,500×2,700×2,650
11 Center body of rotor spider 1×60/ Nr φ4,000×2,500
12 Center body of lower rack 4×60/ Nr 6,000×3,100
13 Lower shaft of generator 1×75/ Nr Flange ODφ2,825, length 4,700
14 Upper shaft of generator 1×30/ Nr φ2,600 (flange) ×3,000
15 Thrust collar/block 1×32/ Nr φ4,250×600
16 Runner collar (thrust bearing runner) 1×20/ Nr φ4,250 (flange)×200
Table 15.4-3 Main Electrical equipment for Jinghong Hydropower Project
No. Name Transport Dimension
(L×W×H) Unit Single Weight(t) Qty. Remark
I Main transformer
1 500kV main transformer 7m×3.5m×4m Nr 130 15 Heavy piece
2 Auto-interconnection transformer 7m×3.5m×4m Nr 90 3 Heavy piece
II 500kV power distribution unit
3 500kVGIS equipment Standard container Nr 15 30
4 Shunt reactance 4.5m×3.5m×4m Nr 60 6 Heavy piece
5 Neutral-point small reactance 2.5m×2.5m×4m Nr 40 2
6 Other electrical equipment set 80 1 Heavy piece
III 220kV power distribution unit
7 220kVGIS equipment Standard container Nr 10 10
Engineering-Status-Report
15-19
15.5 INTERNAL (IN-SITE) TRANSPORTATION
Access road will be adopted for internal/in-site transportation.
The L/B Dam Crest Road will be the main road for L/B internal transportation, which is
forked with branches to Disposal Areas, Production Areas and all the construction working
faces. The R/B Dam Crest Access will be the main road for R/B internal transportation, which
is forked with branches to the Rock Quarries, the Disposal Area, Production Area and all the
construction working faces.
The standard of the main road will be grade Ⅲ road for hydropower project, the pavement
will be 9.0m wide, the road subgrade will be 10m wide, and the driving speed will be 20km/h.
Early predominant mode of transport to cross river is ferry. Later mode of transport is truck.
The transport path is the R/B dam crest Road, longitudinal cofferdam, D/S partition wall,
second-stage U/S and D/S cofferdam. The cross-river bridge built by Laos in the downstream
can be used for construction.
Heavy and large pieces will be transported by road, and it is to establish a special warehouse
to receive the cargo in the downstream on the left bank, and transported to the installation site
or storage yard with trucks.
In the construction period, at the times before and after closure of main river bed till the
upstream cofferdam has the conditions for retaining water, the dam site must suspend
navigation. Therefore, it is necessary to adopt cross-dam transshipment, and it is to establish a
temporary dock respectively at the upstream and downstream dam axis on right bank, which
will be shore-style dock.
Properties of the main in-site roads may be referred to Table 15.5-1.
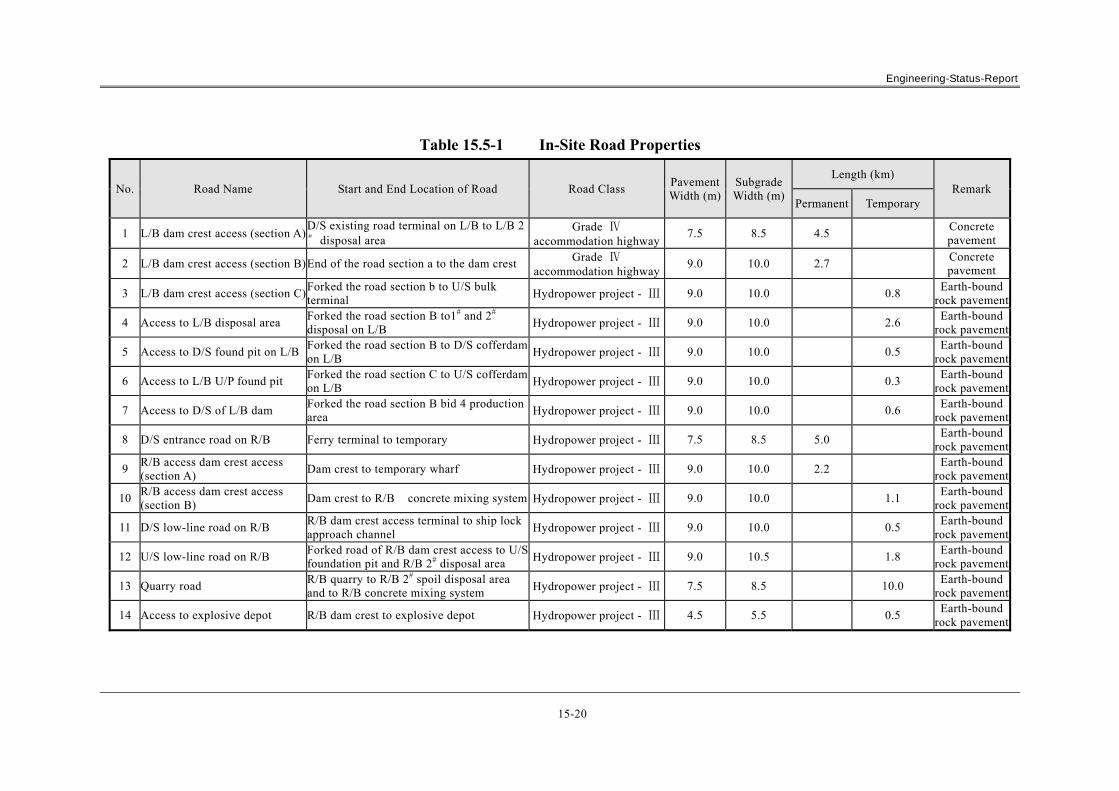
Engineering-Status-Report
15-20
Table 15.5-1 In-Site Road Properties
No. Road Name Start and End Location of Road Road Class Pavement Width (m)
Subgrade Width (m)
Length (km) Remark
Permanent Temporary
1 L/B dam crest access (section A)D/S existing road terminal on L/B to L/B 2# disposal area
Grade Ⅳ accommodation highway
7.5 8.5 4.5 Concrete pavement
2 L/B dam crest access (section B)End of the road section a to the dam crest Grade Ⅳ accommodation highway
9.0 10.0 2.7 Concrete pavement
3 L/B dam crest access (section C)Forked the road section b to U/S bulk terminal Hydropower project - Ⅲ 9.0 10.0 0.8
Earth-bound rock pavement
4 Access to L/B disposal area Forked the road section B to1# and 2# disposal on L/B Hydropower project - Ⅲ 9.0 10.0 2.6
Earth-bound rock pavement
5 Access to D/S found pit on L/B Forked the road section B to D/S cofferdam on L/B
Hydropower project - Ⅲ 9.0 10.0 0.5 Earth-bound
rock pavement
6 Access to L/B U/P found pit Forked the road section C to U/S cofferdam on L/B Hydropower project - Ⅲ 9.0 10.0 0.3
Earth-bound rock pavement
7 Access to D/S of L/B dam Forked the road section B bid 4 production area Hydropower project - Ⅲ 9.0 10.0 0.6
Earth-bound rock pavement
8 D/S entrance road on R/B Ferry terminal to temporary Hydropower project - Ⅲ 7.5 8.5 5.0 Earth-bound
rock pavement
9 R/B access dam crest access (section A)
Dam crest to temporary wharf Hydropower project - Ⅲ 9.0 10.0 2.2 Earth-bound
rock pavement
10 R/B access dam crest access (section B)
Dam crest to R/B concrete mixing system Hydropower project - Ⅲ 9.0 10.0 1.1 Earth-bound
rock pavement
11 D/S low-line road on R/B R/B dam crest access terminal to ship lock approach channel
Hydropower project - Ⅲ 9.0 10.0 0.5 Earth-bound
rock pavement
12 U/S low-line road on R/B Forked road of R/B dam crest access to U/S foundation pit and R/B 2# disposal area Hydropower project - Ⅲ 9.0 10.5 1.8
Earth-bound rock pavement
13 Quarry road R/B quarry to R/B 2# spoil disposal area and to R/B concrete mixing system Hydropower project - Ⅲ 7.5 8.5 10.0
Earth-bound rock pavement
14 Access to explosive depot R/B dam crest to explosive depot Hydropower project - Ⅲ 4.5 5.5 0.5 Earth-bound
rock pavement

Engineering-Status-Report
15-21
15.6 GENERAL CONSTRUCTION LAYOUT AND ZONED PLANNING
According to the topographic, geological condition and complex layout characteristics,
construction layout is to focus on the downstream on L/B and R/B, with the upstream as the
auxiliary.
The Employers camp is laid out on the slow slope about 2.5km away from the starting point
of access road. The oil storage is to be established on the slow slope about 1.1km away from
the upstream, while the central warehouse will be established on the slow slope near the
upstream construction bridge end.
The Contractor’s camp is to be independently built on L/B and R/B, the L/B Contractor’s
camp is to be arranged at a slow slope about 2.5km away from the starting point of access
road, while the R/B Contractor’s camp is to be arranged at a flat platform about 300m
upstream of the downstream temporary dock. L/B production zone is arranged in the
backfilling gully downstream of the Powerhouse and on both sides of the dam crest access,
which mainly includes Electromechanical Equipment Warehouse, Steel Structure Assembly
Yard, Runner Processing Plant, Equipment Maintenance and Parking Lot, and L/B
Non-spillway Section Production Area, and Powerhouse Production Area, etc. The R/B
Production Area mainly include R/B Dam Production Area and Ship Lock Production Area.
According to the production needs of all the service objectives, it is to establish Rebar
Processing Factory, Timber Processing Plant, Equipment Maintenance and Parking Lot, as
well as material storage and temporary warehouse of the working area, etc. It is to rely on the
R/B Dam Crest Access layout, and distribute on the platforms and slow slopes on both sides
of Dam Crest Access between the temporary transportation docks crossing the dam from the
cross-river bridge to R/B in the downstream.
According to the planning of quarry and in-site road, it is to establish an Aggregate Processing
System near the R/B Quarry, to be used for providing the aggregate required for concrete of
the works and transitional materials of the cofferdam. It is to establish a concrete system in
proximity of the upstream bridge for preparing the concrete required for the works.
The flood control standard of the construction site will be against the worst flood in 20 years.
Planning areas for production and living buildings may be referred to Table 15.6-1.
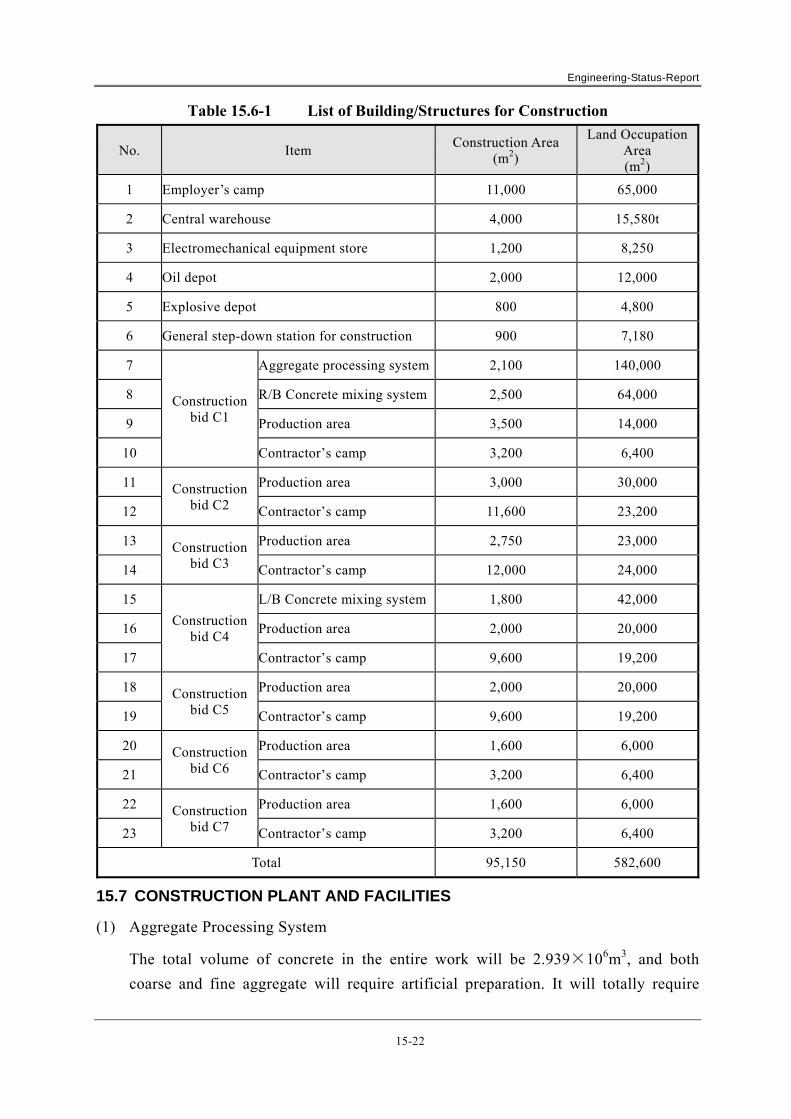
Engineering-Status-Report
15-22
Table 15.6-1 List of Building/Structures for Construction
No. Item Construction Area
(m2)
Land Occupation Area (m2)
1 Employer’s camp 11,000 65,000
2 Central warehouse 4,000 15,580t
3 Electromechanical equipment store 1,200 8,250
4 Oil depot 2,000 12,000
5 Explosive depot 800 4,800
6 General step-down station for construction 900 7,180
7
Construction bid C1
Aggregate processing system 2,100 140,000
8 R/B Concrete mixing system 2,500 64,000
9 Production area 3,500 14,000
10 Contractor’s camp 3,200 6,400
11 Construction bid C2
Production area 3,000 30,000
12 Contractor’s camp 11,600 23,200
13 Construction bid C3
Production area 2,750 23,000
14 Contractor’s camp 12,000 24,000
15
Construction bid C4
L/B Concrete mixing system 1,800 42,000
16 Production area 2,000 20,000
17 Contractor’s camp 9,600 19,200
18 Construction bid C5
Production area 2,000 20,000
19 Contractor’s camp 9,600 19,200
20 Construction bid C6
Production area 1,600 6,000
21 Contractor’s camp 3,200 6,400
22 Construction bid C7
Production area 1,600 6,000
23 Contractor’s camp 3,200 6,400
Total 95,150 582,600
15.7 CONSTRUCTION PLANT AND FACILITIES
(1) Aggregate Processing System
The total volume of concrete in the entire work will be 2.939×10⁶m3, and both
coarse and fine aggregate will require artificial preparation. It will totally require

Engineering-Status-Report
15-23
4.18×10⁶t coarse aggregate, and 2.41×10⁶t fine aggregate. All materials shall be
obtained from the R/B Quarry.
According to the characteristics of the Quarry and distribution of material sources, in
light of the general construction layout, it is to collectively establish an artificial
aggregate processing system, and the designed scale shall be determined by the peak
monthly concrete pouring intensity of 110×103m3/month. The coarse crushing
capacity of the system shall be 900t/h, and the production capacity of the finished
product shall be 760t/h.
The system is arranged at downstream of R/B Quarry.
(2) Concrete Production System
The total volume of concrete for the entire work will be 2.939×10⁶m3.According to
the sources of aggregate and distribution characteristics of concrete pouring
locations, and in light of the general construction layout of the works, it is to
establish two concrete production system in the entire works.
R/B Concrete Production system will be determined by the peak monthly concrete
pouring intensity of 0.11×10⁶m3/month, the normal temperature production capacity
will be 400m3/h, the pre-cooled concrete production capacity will be 330m3/h, and
the outlet temperature will be 10℃. It is to select 2 HL240-4F3000 batching plants,
which are equipped with aggregate air cooling, ice-making and water-cooling
facilities. The System is located in the upstream on the right bank of the dam,
neighboring with the first stage U/S earth-rock cofferdam.
L/B Concrete Production System will be configured according to 50% of the peak
monthly concrete pouring intensity of 0.11×10⁶m3/m, the normal temperature
production capacity will be 200m3/h, the pre-cooled concrete production capacity
will be 170m3/h, and the outlet temperature will be 10℃ . It is to select 1
HL240-4F3000L batching plants, which are equipped with aggregate air cooling,
ice-making and water-cooling facilities. The System is located in the upstream on the
left bank of the dam, neighboring with the second stage U/S earth-rock cofferdam.
(3) Supply of Compressed Air, Water and Electricity
a Air Supply System for construction
According to the compressed air consumption requirements of construction areas in
all the systems, it is to mainly adopt concentrated supply of compressed air for the
construction air supply system, and be supplemented with mobile air supply. The
entire work is to establish 3 compressed air stations, which will be Left Dam Head
Compressed Air Station, Right Dam Head Compressed Air Station and Quarry

Engineering-Status-Report
15-24
Compressed Air Station respectively, and the total compressed air supply volume will
be 640m3/min.
Left Dam Head Compressed Air Station: with 280m3/min of compressed air supply, is
mainly to supply compressed air for excavation of Left Dam Abutment and Left Dam
Foundation; Right Dam Head Compressed Air Station, with 220m3/min of
compressed air supply, is mainly to supply compressed air for excavation of Right
Dam Abutment and Right Dam Foundation; Quarry Compressed Air Station, with
140m3/min of compressed air supply, is mainly to supply compressed air for
exploiting the quarry.
b Water Supply System for construction
The entire work is established with 3 water supply systems.
Water Supply System for Aggregate Processing System: The water source will be
river water from Mekong River, and the total water supply volume will be 800m3/h,
which is to supply water for Aggregate Processing System and the quarry mining.
R/B Upstream Water Supply System: the water source will be river water of Mekong
River, the total water supply volume will be about 1,400m3/h, which is to supply
water to L/B Concrete Mixing System, Dam Area Construction, production and living
quarter of the entire works. Water Supply System for Employer’s Camp: The water
source will be river water from Mekong River, and the total water supply volume will
be 200m3/h, which is to supply water for domestic consumption of the Employer’s
Camp and the L/B Contractor’s Camp. In order to satisfy the water quality
requirements, all the water supply systems of the works will need to purify the water
according to the water quality requirements of different users.
c Construction Power Supply System
The peak power consumption load for construction will be about 32,400kW.
It is preliminarily planned to supply power by the 115kV grid from Yunnan province,
China →Namo→Muang Xai→Luang Prabang, and it is to erect 110kV overhead
transmission line from Oudomxay to Pak Beng as the power source for this works.
It is planned to build General Step-Down Substation for Construction on the upstream
on L/B, the volume of the Main Transformer will be 2×16,000kVA, the voltage will
be 110/10kV, leading out 12 circuits of 10kV overhead lines (LGJ90-150 mm2) to the
substations of all the construction areas, and the line length is about 42km.
Additionally, a 4×400kW diesel generator unit will be installed near the dam site as
supplementary and emergency backup power supply for the works.

Engineering-Status-Report
15-25
15.8 DISPOSAL AREA PLANNING
The earth-rock excavation volumes of the Principal Works, Diversion Works, the
overburden/stripped material of the Quarry ,and other facilities will be about 10,445.4×
103m3.The cofferdam is to be filled with excavated materials, which still needs to be piled in
the Disposal Area after removal. Therefore, all the excavated materials will be discarded, and
the total volume will be 10,445.4×103m3; the spoil materials from in-site road construction
and leveling site will be disposed locally, without entering the balance of earth and rocks.
L/B excavated materials will be transported to L/B 1#-2# Disposal Area, and the R/B
excavated material will be transported to the R/B 1#-2# Disposal Area for piling.
The quantity of spoiled material is 10,445.4×103m3 while the capacity of disposal area shall
not be less than 15,700×103m3. In accordance with topographical conditions on both banks,
two disposal areas are arranged on L/B and two on R/B. The volume of L/B 1# disposal area is
5,800×103m3; The volume of L/B 2# disposal area is 2,000×103m3; the volume of R/B 1#
disposal area is 7,500×103m3, the volume of R/B 2# disposal area is 2,500×103m3,the total
volume of the disposal area is 17,800×103m3, which can satisfy the needs for piling muck.
The quantity of spoiled material is 10.45×10⁶m3 while the capacity of disposal area shall not
be less than 15.70×10⁶m3. In accordance with topographical conditions on both banks, two
disposal areas are arranged on L/B and two on R/B. The properties of disposal area are shown
in Table 15.8-1.
Table 15.8-1 Properties of Disposal Areas Name of Disposal
Area Muck Height
Volume of Disposal
Area (103m3)
Planned Muck Quantity (103m3)
Natural/loose volume Source of Muck/Spoil
L/B 1# disposal area 320m~400m 5,800 3,934/5,752
Excavated earth-rock of second stage works on L/B and stripped material of rock quarry
L/B 2# disposal area
340m~410m 2,000 1,313/1,970 Excavated earth-rock of the L/B road and powerhouse pit
R/B 1# disposal area 320m~380m 7,500 4,329/6,493
Excavated materials of first-stage works on R/B
R/B 2# disposal area 375m~425m 2,500 1580/2,370
Excavated earth-rock of aggregate production system ,road to quarry and stripped material transferred from R/B 1#
disposal area
Flood control standard at upstream and downstream dam axis is 20-year frequency.
The general principles on protective measures of disposal area are as follows: the stone
gabions are adopted as spoil/debris retaining dam at the bottom of divergent gully disposal
area, with dam height 3~4m, while the grouted rubble or concrete spoil/debris retaining dam
is adopted at the bottom of contractive gully disposal area. If the stockpiled spoil in reservoir
area is higher than normal water level, the dry stone pitching will be built within water level
amplitude of variation and no support will be made to the rest slope surface. For these
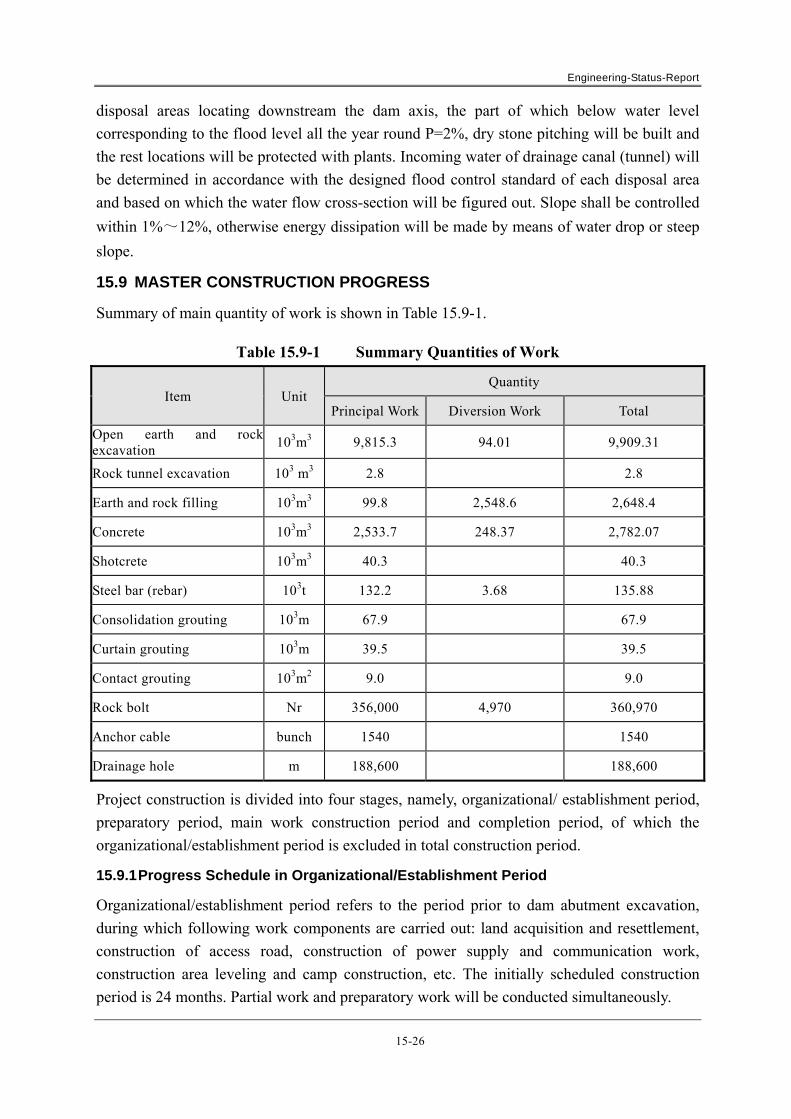
Engineering-Status-Report
15-26
disposal areas locating downstream the dam axis, the part of which below water level
corresponding to the flood level all the year round P=2%, dry stone pitching will be built and
the rest locations will be protected with plants. Incoming water of drainage canal (tunnel) will
be determined in accordance with the designed flood control standard of each disposal area
and based on which the water flow cross-section will be figured out. Slope shall be controlled
within 1%~12%, otherwise energy dissipation will be made by means of water drop or steep
slope.
15.9 MASTER CONSTRUCTION PROGRESS
Summary of main quantity of work is shown in Table 15.9-1.
Table 15.9-1 Summary Quantities of Work
Item Unit Quantity
Principal Work Diversion Work Total
Open earth and rockexcavation
103m3 9,815.3 94.01 9,909.31
Rock tunnel excavation 103 m3 2.8 2.8
Earth and rock filling 103m3 99.8 2,548.6 2,648.4
Concrete 103m3 2,533.7 248.37 2,782.07
Shotcrete 103m3 40.3 40.3
Steel bar (rebar) 103t 132.2 3.68 135.88
Consolidation grouting 103m 67.9 67.9
Curtain grouting 103m 39.5 39.5
Contact grouting 103m2 9.0 9.0
Rock bolt Nr 356,000 4,970 360,970
Anchor cable bunch 1540 1540
Drainage hole m 188,600 188,600
Project construction is divided into four stages, namely, organizational/ establishment period,
preparatory period, main work construction period and completion period, of which the
organizational/establishment period is excluded in total construction period.
15.9.1 Progress Schedule in Organizational/Establishment Period
Organizational/establishment period refers to the period prior to dam abutment excavation,
during which following work components are carried out: land acquisition and resettlement,
construction of access road, construction of power supply and communication work,
construction area leveling and camp construction, etc. The initially scheduled construction
period is 24 months. Partial work and preparatory work will be conducted simultaneously.
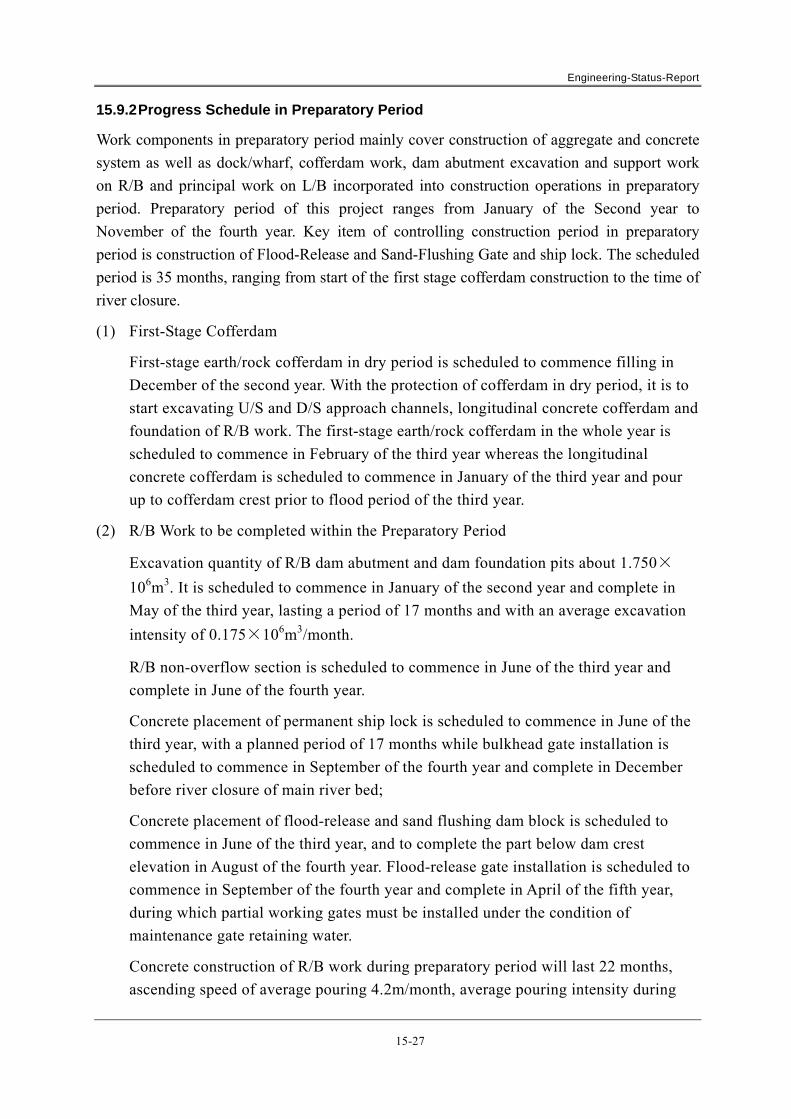
Engineering-Status-Report
15-27
15.9.2 Progress Schedule in Preparatory Period
Work components in preparatory period mainly cover construction of aggregate and concrete
system as well as dock/wharf, cofferdam work, dam abutment excavation and support work
on R/B and principal work on L/B incorporated into construction operations in preparatory
period. Preparatory period of this project ranges from January of the Second year to
November of the fourth year. Key item of controlling construction period in preparatory
period is construction of Flood-Release and Sand-Flushing Gate and ship lock. The scheduled
period is 35 months, ranging from start of the first stage cofferdam construction to the time of
river closure.
(1) First-Stage Cofferdam
First-stage earth/rock cofferdam in dry period is scheduled to commence filling in
December of the second year. With the protection of cofferdam in dry period, it is to
start excavating U/S and D/S approach channels, longitudinal concrete cofferdam and
foundation of R/B work. The first-stage earth/rock cofferdam in the whole year is
scheduled to commence in February of the third year whereas the longitudinal
concrete cofferdam is scheduled to commence in January of the third year and pour
up to cofferdam crest prior to flood period of the third year.
(2) R/B Work to be completed within the Preparatory Period
Excavation quantity of R/B dam abutment and dam foundation pits about 1.750×
106m3. It is scheduled to commence in January of the second year and complete in
May of the third year, lasting a period of 17 months and with an average excavation
intensity of 0.175×10⁶m3/month.
R/B non-overflow section is scheduled to commence in June of the third year and
complete in June of the fourth year.
Concrete placement of permanent ship lock is scheduled to commence in June of the
third year, with a planned period of 17 months while bulkhead gate installation is
scheduled to commence in September of the fourth year and complete in December
before river closure of main river bed;
Concrete placement of flood-release and sand flushing dam block is scheduled to
commence in June of the third year, and to complete the part below dam crest
elevation in August of the fourth year. Flood-release gate installation is scheduled to
commence in September of the fourth year and complete in April of the fifth year,
during which partial working gates must be installed under the condition of
maintenance gate retaining water.
Concrete construction of R/B work during preparatory period will last 22 months,
ascending speed of average pouring 4.2m/month, average pouring intensity during

Engineering-Status-Report
15-28
preparatory period is 60×103m3/month, and average pouring intensity during peak
time intervals is 81×103m3/month.
15.9.3 Construction Progress Schedule of Principal Work
Construction period of principal work is 33 months, ranging from December of the fourth
year to July of the seventh year. Components of principal work include second-stage
cofferdam work, L/B dam work, powerhouse work and fish way work, etc.
(1) Second-Stage Cofferdam Work
For this work, it is scheduled to carry out river closure in the first ten days of
December of the fourth year, complete construction of cutoff wall for upstream and
downstream cofferdams in February of the fifth year and dewater the foundation pit
in the first ten days of March of the fifth year.
(2) L/B Dam Work
The excavation of dam blocks on left of 1#-16# generating unit will be commenced
after completing foundation pit dewatering and complete in June of the fifth year,
with a planned period of 3.5 months.
Concrete placement the non-overflow Dam construction on L/B will be commenced
in July of the fifth year and ended at the end of April of the sixth year, with a planned
period of 10 months.
The excavation of fish way will be commenced in December of the fourth year, and
complete in January of the fifth year. Concrete placement of fish way will be
commenced in November of the fifth year and ended at the end of September of the
sixth year.
(3) Powerhouse Work
Concrete placement is scheduled to start in June of the fifth year and end in
September of the sixth year. Installation of bridge crane is planned in the time period
between July and August of the sixth year.
Installation of bridge crane is planned in the time period between July and August of
the sixth year, while Installation of the 15#and 16#generating units are scheduled to
commence in December of the sixth year and complete in August of the seventh year
firstly. Installation of tailrace gates are scheduled to commence in October of the
sixth year and complete in March of the seventh year.
The first generating unit is scheduled to generate power by the end of August of the
seventh year.

Engineering-Status-Report
15-29
Dam concrete construction on L/B will last a period of 15 months, with an average
concrete placement ascending speed of 3.82 m/month, average concrete placement
intensity of 58×103m3/month, and average concrete placement intensity at peak time
intervals of 82×103m3/month.
15.9.4 Construction Progress Schedule for Completion Period
Completion period is 16 months, during which the installation and debugging of subsequent
units are mainly conducted. Following the first generating units (16# and 15#generating unit)
putting into operation at the end of August in the seventh year, 14#and 13#generating units is
of conditions to generate power at the end of November in the seventh year, 12# and 11#
generating units is of conditions to generate power at the middle of February in the eighth
year. Hereafter, every two generating units are of conditions to generate power every two
months. By the end of December in the eighth year, all the units will be put into production
and the project is completed.
15.9.5 Construction Critical Path
Construction critical path of this project: dam foundation excavation on R/B→construction of
R/B dam→river closure→construction of cofferdam cutoff wall→foundation pit dewatering
→excavation of main riverbed dam foundation and powerhouse foundation→construction of
main riverbed dam block and power house→installation of electrical equipment→power
generation of the first two units.
15.9.6 Main Construction Indicators
(1) Construction Intensity Indicators for Main Items
Controlling construction periods and main construction intensity indicators of the
project are shown in Table 15.9-2.

Engineering-Status-Report
15-30
Table 15.9-2 Main Construction Indicators
Item Unit Qty. C
onst
ruct
ion
Per
iod
Employer's preparatory period Month 24
Construction period
Construction Preparatory period Month 35
Construction period for principal work Month 33
Completion period Month 16
Total construction period Month 84
Controlled construction
period
Commencement time January of the second year
River closure time December of the fourth year
Commencement time for dam foundation excavation of main river bed
Middle March of the fifth year
Commencement time for concrete placement of power house
July of the fifth year
Power generation time of the first unit August of the seventh year
Power generation time of the last unit December of the eighth year
Average ascending speed of dam body m/ month 5
Con
stru
ctio
n In
tens
ity
Open earth and rock
excavation
Average 103m3/ month 250
Average at peak time intervals 103m3/ month 327
Concrete placement
Average 103m3/ month 58
Average at peak time intervals 103m3/ month 82
Earth and rock filling
Average 103m3/ month 216
Average at peak time intervals 103m3/ month 586
(2) Supply of Labor Force
Labor force demand by Year is shown in Table 15.9-3.
Table 15.9-3 Main Labor Force Demand by Year
Item Unit Demand by Year
Total 1st
Year 2nd Year
3rd Year
4th Year
5th Year
6th Year
7th Year
8th Year
Labor force 103 man-day 126.65 1,222.88 764.94 886.44 832.37 180.00 75.00 75.00 4,163,28
Peak number 844 4076 2550 2955 2775 600 500 500
(3) Main Quantity of Work Scheduled to Complete by Year
Main construction quantity of work scheduled to complete by Year is shown in Table
15.9-4.
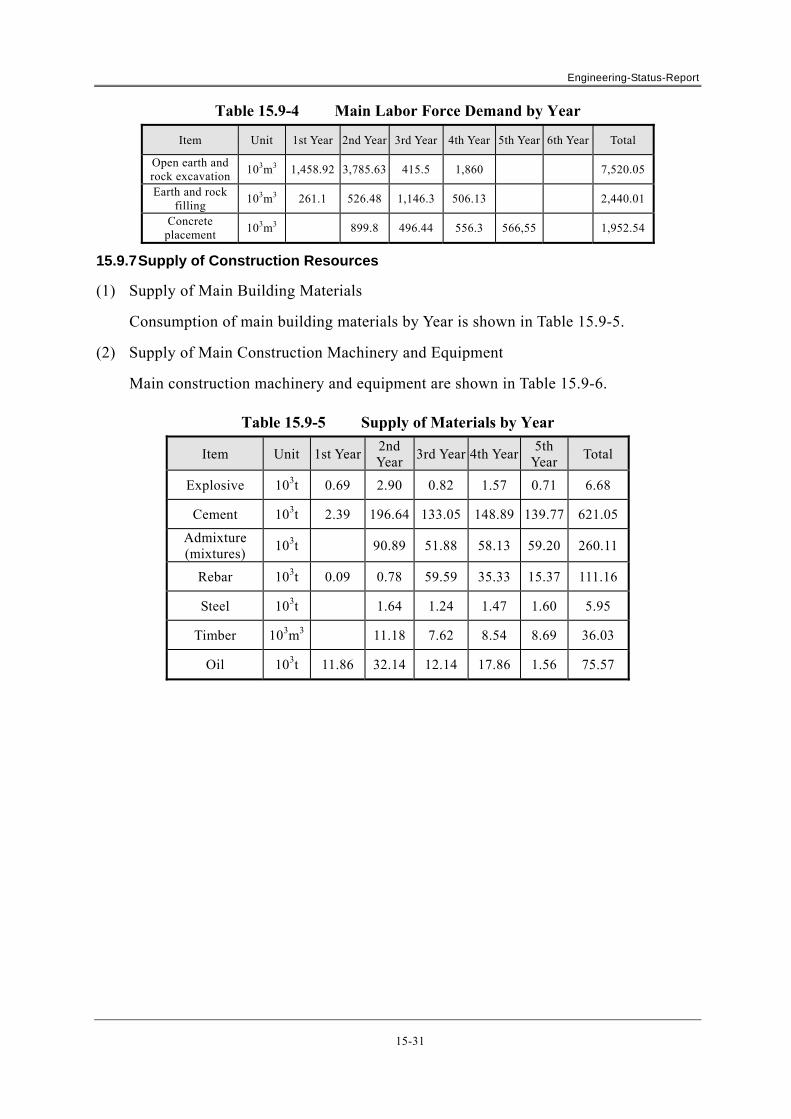
Engineering-Status-Report
15-31
Table 15.9-4 Main Labor Force Demand by Year
Item Unit 1st Year 2nd Year 3rd Year 4th Year 5th Year 6th Year Total
Open earth and rock excavation
103m3 1,458.92 3,785.63 415.5 1,860 7,520.05
Earth and rock filling
103m3 261.1 526.48 1,146.3 506.13 2,440.01
Concrete placement
103m3 899.8 496.44 556.3 566,55 1,952.54
15.9.7 Supply of Construction Resources
(1) Supply of Main Building Materials
Consumption of main building materials by Year is shown in Table 15.9-5.
(2) Supply of Main Construction Machinery and Equipment
Main construction machinery and equipment are shown in Table 15.9-6.
Table 15.9-5 Supply of Materials by Year
Item Unit 1st Year2nd Year
3rd Year 4th Year5th
YearTotal
Explosive 103t 0.69 2.90 0.82 1.57 0.71 6.68
Cement 103t 2.39 196.64 133.05 148.89 139.77 621.05
Admixture (mixtures)
103t 90.89 51.88 58.13 59.20 260.11
Rebar 103t 0.09 0.78 59.59 35.33 15.37 111.16
Steel 103t 1.64 1.24 1.47 1.60 5.95
Timber 103m3 11.18 7.62 8.54 8.69 36.03
Oil 103t 11.86 32.14 12.14 17.86 1.56 75.57

Engineering-Status-Report
15-32
Table 15.9-6 Main Construction Equipment
No. Equipment Specification Unit Qty.
1 Gantry crane MQ2000 Nr 3
2 Gantry crane DMQ540/30B Nr 3
3 Gantry crane MQ1000 Nr 2
4 Power crane M900 Nr 3
5 Crawler crane QUY50 Nr 3
6 Crawler crane W200A Nr 4
7 Leveling machine D38-8 Nr 4
8 Dump truck 10t-15t Nr 20
9 Dump truck 20t-32t Nr 60
10 Concrete mixer
truck 3m3-6m3 Nr 15
11 Down-hole drill ROC712 Nr 20
12 Excavator 2m3 Nr 6
13 Excavator 3m3 Nr 8
14 Excavator 4m3 Nr 8
15 Bulldozer 320HP Nr 6
16 Bulldozer 220HP Nr 4
17 Bulldozer 180HP Nr 2
18 Loader 3.5m3-5 m3 Nr 8
19 Hydraulic drill φ64-φ120 Nr 12
20 Rotary drilling
machine SGZ-Ⅰ Nr 20
21 Rotary drilling
machine SGZ-Ⅲ Nr 12
22 Grouting pump BW250/50 Nr 30
23 Smooth drum
vibrating roller19t-21t Nr 2
24 Double-deck vertical mixer
200L Nr 15
25 Bottom-open
barge 130m3 Nr 6

Engineering-Status-Report
16-1
16 TOTAL ESTIMATED COST
Table 16-1 Total Estimated Cost
No Item Cost
(106USD) Proportion in Total Cost
(%)
1 2 3 4
Ⅰ Hydropower Project 2,272.53 95.82
1 Complex Work 1,209.43 50.99
Auxiliary Construction Work 176.80 7.45
Construction Work 534.84 22.55
Environmental Protection and Water/Soil Conservation Work
33.99 1.43
Electromechanical Equipment and
Installation Work 362.25 15.27
Steel Structure/Equipment and
Installation Work 101.55 4.28
2 Compensation for Construction Land
Acquisition and Resettlement 33.19 1.40
3 Independent Cost 352.38 14.86
Project Construction Overhead 163.98 6.91
Production Preparatory Cost 8.36 0.35
Scientific Research,
Investigation/Survey and Design Cost 100.17 4.22
Other Taxes 79.86 3.37
Total of PartsⅠ, Ⅱand Ⅲ 1,595.00 67.25
Basic Contingency Cost 126.60 5.34
Static Cost for the Project 1,721.60 72.59
Contingency Cost for Price Difference 202.23 8.53
Interest during Construction Period 348.70 14.70
Total Cost 2,272.53 95.82
Ⅱ Power Transmission Work 99.21 4.18
500KV-Power Transmission Line
2-circuit 50KM 23.81 1.00
230KV-Power Transmission Line
2-circuit 150KM 41.91 1.77
Power Transmission Work 65.72 2.77
Basic Contingency Cost 5.26 0.22
Static Cost for the Project 70.97 2.99

Engineering-Status-Report
16-2
No Item Cost
(106USD) Proportion in Total Cost
(%)
Contingency Cost for Price Difference 13.79 0.58
Interest during Construction Period 14.45 0.61
Total Cost 99.21 4.18
Ⅲ Total Cost 2,371.75 100.00
Static Cost for the Project 1,792.58 75.58
Contingency Cost for Price Difference 216.02 9.11
Interest during Construction Period 363.15 15.31
Total Cost 2,371.75 100.00

Engineering-Status-Report
17-1
17 APPENDIX
Compliance with MRC Preliminary Design Guidance