
MICRO HYDROPOWER SYSTEM DESIGN GUIDELINES
72
MICRO HYDROPOWER SYSTEM DESIGN GUIDELINES
-
Upload
khangminh22 -
Category
Documents
-
view
5 -
download
0
Transcript of MICRO HYDROPOWER SYSTEM DESIGN GUIDELINES

MICRO HYDROPOWER SYSTEM DESIGN
GUIDELINES

Acknowledgement
The development of this guideline was funded through the Sustainable Energy Industry Development Proj-ect (SEIDP). The World Bank through Scaling Up Renewable Energy for Low-Income Countries (SREP) and the Small Island Developing States (SIDSDOCK) provided funding to the PPA as the Project Implementation Agency for the SEIDP. The guidelines have been developed by Global Sustainable Energy Solutions and reviewed by PPA and SEIAPI Technical Committees.
These guidelines have been developed for The Pacific Power Association (PPA) and the Sustainable Energy Industry Association of the Pacific Islands (SEIAPI).
They represent latest industry BEST PRACTICE for Design of Micro Hydropower Systems.© Copyright 2020
While all care has been taken to ensure this guideline is free from omission and error, no responsibility can be taken for the use of this information in the design of micro hydropower system.

Table of Contents
1. Introduction .......................................................................................................................................................................... 1
2. Hydro Principles .......................................................................................................................................................2
3. Preliminary Studies .................................................................................................................................................4
3.1 Topographic and Geological Survey ...........................................................................................................6
3.2 Hydrological Survey .......................................................................................................................................6
3.2.1 Comparison of Catchment Areas ....................................................................................................6
3.2.2 Finding the average daily flow (ADF) ............................................................................................7
3.2.3 Absence of local rainfall data ...........................................................................................................8
3.2.4 Isohyet Maps ........................................................................................................................................8
3.2.5 Household, Agricultural and Industrial Water Use Planning and Net Flow.........................9
3.2.6 Seasonal flow variation ......................................................................................................................9
3.3 Head Measurements ......................................................................................................................................11
3.3.1 Dumpy levels and theodolites ..........................................................................................................12
3.3.2 Sighting Meters ....................................................................................................................................12
3.3.3 Water-filled tube and pressure gauge ...........................................................................................13
3.3.4 Water-filled tube and rod ..................................................................................................................14
3.3.5 Spirit level and Plank ..........................................................................................................................14
3.3.6 Contour Maps .......................................................................................................................................15
3.3.7 Altimeters ..............................................................................................................................................15
3.4 On-site Flow Measurement ..........................................................................................................................15
3.4.1 Weir Method .........................................................................................................................................15
3.4.2 Stage-discharge Method ...................................................................................................................16
3.4.3 Salt gulp Method .................................................................................................................................17
3.4.4 Bucket Method .....................................................................................................................................17
3.4.5 Float Method ........................................................................................................................................17
3.4.6 Current Meter .......................................................................................................................................18
4. Site Selection ............................................................................................................................................................18
5. General Design Strategy ........................................................................................................................................18
5.1 System Layout .................................................................................................................................................18
5.1.1 Short Penstock Route ........................................................................................................................19
5.1.2 Mid-length Penstock ..........................................................................................................................20
5.1.3 Long Penstock ......................................................................................................................................21
5.2 Low Head Installations ..................................................................................................................................21
6. Civil Work Components .........................................................................................................................................22
6.1 Weir Design ......................................................................................................................................................22

6.2 Intake Design.................................................................................................................................................... 24
6.3 Spillways Layout ............................................................................................................................................. 25
6.4 Settling Basins and Forebay Tanks ............................................................................................................ 26
6.5 Channels or Canals ......................................................................................................................................... 26
7. Penstock sizing ........................................................................................................................................................ 27
7.1 Penstock sizing procedure ............................................................................................................................ 27
7.2 Types of Materials used for Penstock ........................................................................................................ 29
7.2.1 Mild Steel ............................................................................................................................................... 29
7.2.2 uPVC ....................................................................................................................................................... 30
7.2.3 HDPE ...................................................................................................................................................... 30
7.3 Penstock Jointing ............................................................................................................................................. 30
7.4 Valves ................................................................................................................................................................. 30
7.5 Penstock Sizing ............................................................................................................................................... 30
7.5.1 Selecting the pipe diameter .............................................................................................................. 30
7.5.2 Calculation of friction loss (pipe wall losses) ............................................................................... 31
7.5.3 Calculation of turbulence losses ...................................................................................................... 33
7.6 Pipe thickness and applicable surge pressures ...................................................................................... 37
8. Turbine Selection ..................................................................................................................................................... 37
8.1 Specific Speed.................................................................................................................................................. 38
8.2 Turbine Selection using Specific Speed .................................................................................................... 38
8.3 Part-flow System Efficiency ......................................................................................................................... 40
8.4 Impulse Turbines ............................................................................................................................................. 43
8.4.1 Pelton Turbines .................................................................................................................................... 43
8.4.2 Single jet and multi jet Pelton .......................................................................................................... 44
8.4.3 Turgo Turbine ....................................................................................................................................... 47
8.4.4 Crossflow Turbines ............................................................................................................................. 47
8.5 Reaction Turbines ................................................................................................................................................. 49
8.5.1 The Francis Turbine ............................................................................................................................ 50
8.5.2 The Propeller and Kaplan Turbine .................................................................................................. 51
8.5.3 Draught Tubes ..................................................................................................................................... 51
9. Governing .................................................................................................................................................................. 51
9.1 Specifying the Governor ................................................................................................................................ 52
9.2 Conventional Methods ................................................................................................................................... 52
9.2.1 Oil Pressure Governor ........................................................................................................................ 52

9.2.2 Mechanical Governors ........................................................................................................................ 52
9.2.3 Load Controller..................................................................................................................................... 53
9.2.4 Induction Generator Controller ........................................................................................................ 53
9.3 Non-conventional Governing Systems ...................................................................................................... 53
9.3.1 Constant Load ...................................................................................................................................... 53
9.3.2 Manual Load ......................................................................................................................................... 53
10. Drive System Considerations ............................................................................................................................. 53
10.1 Direct-coupled drive system ...................................................................................................................... 53
10.2 Wedge belt drive system ............................................................................................................................ 53
10.3 Wedge belt drive system with extra bearings ...................................................................................... 55
10.4 Quarter turn belt drive ................................................................................................................................. 55
10.5 Direct coupled turbine and geared motor used as an alternator ..................................................... 56
10.6 Turbine rotor mounted on generator shaft ............................................................................................. 56
11. Micro Hydro Generator Selection ...................................................................................................................... 58
Annex 1 Chart Showing Coverage of Hydro Turbines ...................................................................................... 62
Annex 2 Turbine-Generator Group Specifications - Examples ....................................................................... 63
Annex 3 Hydroelectric Generator Specifications - Example ............................................................................ 65
List of Figures
Figure 1: Typical Arrangement of a Micro-hydro System ....................................................................................2
Figure 2: Contour Map showing two potential hydro schemes .........................................................................7
Figure 3: An example of Isohyet map ...................................................................................................................... 8
Figure 4: Flow Duration Curve indicating the percentage of the year that a particular flow rate is .... exceeded ..................................................................................................................................................... .10
Figure 5: The use of dumpy levels for measuring vertical height ................................................................... 12
Figure 6: Sighting meter for measuring vertical angles ......................................................................................13
Figure 7: Water-filled tube and pressure gauge ...................................................................................................13
Figure 8: Water filled tube and rod ..........................................................................................................................14
Figure 9: Spirit level and Plank method ..................................................................................................................15
Figure 10: The Weir method ......................................................................................................................................16
Figure 11: Stage-discharge method: Graduated staff fixed at the contour section ....................................16
Figure 12: Channel Cross Section with Subsections ...........................................................................................17
Figure 13: Typical Lay-out of a Micro-hydro System ..........................................................................................19
Figure 14: Short Penstock arrangement .................................................................................................................19
Figure 15: Mid-length Penstock ................................................................................................................................20
Figure 16: Long Penstock ...........................................................................................................................................21

Figure 17: Propeller turbines ......................................................................................................................................21
Figure 18: Function of a Weir .....................................................................................................................................23
Figure 19: Weir parameters ........................................................................................................................................23
Figure 20: Weir crest shapes ......................................................................................................................................24
Figure 21: Intake methods ...........................................................................................................................................25
Figure 22: Flood spillway .............................................................................................................................................25
Figure 23: Forebay Tank ...............................................................................................................................................26
Figure 24: Different types of channels .....................................................................................................................27
Figure 25: Components of the Penstock Assembly ..............................................................................................27
Figure 26: An example of Friction loss chart in metres of head per 100m of plastic pipe/rolled steel ...31
Figure 27: Turbulence losses in penstocks .............................................................................................................34
Figure 28: A Nomogram on Selection of a turbine for a hydro site ..................................................................39
Figure 29: Estimate of approximate runner diameter of axial turbines ...........................................................40
Figure 30: Typical Part-flow efficiency of various turbines ................................................................................41
Figure 31: A single jet Pelton .....................................................................................................................................43
Figure 32: Multi-jet Pelton ...........................................................................................................................................44
Figure 33: The Turgo Turbine .....................................................................................................................................47
Figure 34: A Crossflow Turbine .................................................................................................................................48
Figure 35: The Francis Turbine ...................................................................................................................................50
Figure 36: The Kaplan Turbine ...................................................................................................................................51
Figure 37: Direct coupled drive system ....................................................................................................................54
Figure 38: Wedge belt drive system .........................................................................................................................55
Figure 39: Wedge belt drive system with extra bearings ...................................................................................55
Figure 40: Quarter turn belt drive ..............................................................................................................................56
Figure 41: Direct coupled turbine and geared motor used as an alternator...................................................56
Figure 42: Turbine rotor mounted on generator shaft ..........................................................................................57

List of Tables
Table 1: Series of Tasks involved in Preliminary Survey ......................................................................................4
Table 2: Flow Analysis Table ......................................................................................................................................11
Table 3: Basic Turbine grouping ................................................................................................................................37
Table 4: Partially Inductive Loads .............................................................................................................................61

1 | Micro Hydropower System Design Guidelines
1. IntroductionThis guideline provides the minimum knowledge on design of micro hydro systems in regional countries. A hydro system is usually classified by size (generating capacity) and the type of scheme (run-of-river, storage, etc). The classification of hydro system varies from region to region and it is believed that there is no agreed definition. The definition adopted in this guideline is consistent with IRENA definition on micro-hydro system which is classified as systems from 5kW to 100kW that provide power for a small community or rural industry in remote areas away from the grid. Overall, micro-hydro may provide an economic alternative to the grid, as independent micro-hydro schemes save on the cost of grid transmission lines and other auxiliary equipment that are expensive.
Generally, hydropower schemes can be put into the following categories:
• Run-of-river schemes divert part of the flow of a running river into a channel and pipe and then through a turbine. Micro-hydro schemes are in most circumstances run-of-river type. The disadvantage of this scheme is that water is not carried over from rainy to dry seasons of the year, thus this needs to be designed appropriately. However, the advantage of this scheme is that the scheme can be built locally at low cost and its simplicity gives rise to long term reliability. They also do not cause environmental damage through flooding.
• Storage schemes make use of a dam or reservoir to store river flow. The water is then released through turbines when power is needed. The advantage of this approach is that rainfall can accumulate during the wet parts of the year and then also utilised during drier parts of the year. Storage schemes are more complex and expensive. Although a micro hydro scheme does not have a full-scale dam, it could be sometimes designed with a small reservoir to accumulate water on a daily basis. This reservoir is an enlarged version of the forebay tank in schemes using a channel. In micro hydro schemes that do not use a channel, the reservoir can be accommodated by the weir which then acts both as a weir and as a very small dam.
The main components of a typical micro-hydro scheme are:
• Weir: a man-made barrier across the river which is built to keep the water level at that point at a constant level to maintain a continuous flow through the intake.
• Intake: the intake of a hydro power is designed to divert only a portion of the stream flow or the complete flow depending upon the flow conditions and the requirement. The intake is usually protected by a rack of metal bars which filters out water-borne debris such as grass or pieces of timber.
• Forebay: allows water to slow down sufficiently for suspended particles to settle out on the bottom. • Penstock: a cavity or pipeline that connects storage to power house. Gravity conducts the water
through the penstock to the turbine. • Turbine: The water strikes the turbine blades and turns the turbine, which is attached to a generator
by a shaft. There are a few different types of turbines, each distinct in usage based on head and flow rates.
• Generator: Converts the mechanical energy in the rotor to electrical energy through electromagnetic induction to produce alternating current (a.c.).

Micro Hydropower System Design Guidelines | 2
Figure 1 Typical Arrangement of a Micro-hydro SystemSource: IntechOpen
2. Hydro Principles The basic physical principle of hydro power is that if water can be piped from a certain level to a lower level, then the resulting water pressure can be used to do work. Hydro-turbines convert water pressure into mechanical shaft power, which can be used to drive an electricity generator. Power generation from water depends upon a combination of head and flow. Both must be available to produce electricity.
Head or water pressure is created by the difference in elevation between the water intake and the turbine. Head can be expressed as vertical distance (feet or metres), or as pressure, such as pounds per square inch (psi) or kiloPascals (kPa). Net head is the pressure available at the turbine when water is flowing, which will always be less than the pressure when the water flow is turned off (static head), due to the friction between the water and the pipe. Changes in pipeline diameter, joints and valves also have an effect on the net head.
Flow is quantity of water available, and is expressed as ‘volume per unit of time’, represented by units such as gallons per minute (gpm), cubic metres per second (m3/s), or litres per minute (lpm). Design flow is the maximum flow for which the hydro system is designed. It will likely be less than the maximum flow of the stream (especially during the rainy season), more than the minimum flow, and a compromise between potential electrical output and system cost.
The fundamental formula concerned here is the potential energy for a mass which is at a height.
Ep = m × g × Hgross
Where Ep = potential energy, g = gravitational acceleration constant (9.8 m/s2) and Hgross = vertical height in metres.
Since hydro systems relate to water (liquid), the mass of the water is a product of density (ρ) and volume (V), m = ρV. Replacing m with ρV, the potential energy formula becomes:
Ep = ρ × V × g × Hgross

3 | Micro Hydropower System Design Guidelines
Density of pure water can be taken as 1000kg/m3. Thus, this becomes:
Ep = 1000 × V × g × Hgross
Since the water enters the turbine at a certain volume flow rate Q (m3/s), the energy released can be expressed in terms of power (P = E/t ).
P =Ep
t=
1000 × V × g × Hgross
t= 1000 × V
t × g × Hgross
Further, using flow rate formula Q = V/t and replacing g with 9.81 m/s2, eventually power in watt becomes:
P (W) = 9.81 × 1000 × Q × Hgross
Or
P (W) = 9810 × Q × Hgross
The above formula gives the power available in the water (theoretical power). The theoretical power (P) available from a given head of water is in exact proportion to the head (H) and the flow rate (Q). In simple terms as head increases, the power output increases and also as flow rate increases, the power output increases. The Hgross tends to be the gross head, however, in reality the frictional losses in pipes and fittings as well as turbulence losses need to be accounted for in head calculations yielding net head.
In practice, as with other real-life concepts, hydro-turbines are not perfectly efficient in converting the energy of falling water into mechanical shaft power and nor would be the electricity generator in converting mechanical power into electricity. Therefore, in reality, there are a number of losses for a hydro scheme. They can be characterised mainly as channel and penstock efficiency ηpenstock (typically 85-90%), turbine efficiency ηturbine (80-90%), generator efficiency ηgenerator (80-90%) and electricity line transmission efficiency ηline (85-90%). Overall efficiency is given by:
ηo = ηcivil works × ηpenstock × ηturbine × ηgenerator × ηline
In the design work, the frictional losses are accounted for in the net head calculations, therefore gross head minus head losses gives us net head, this could be used instead to offset the civil works and penstock losses where known. Generally, the following formula could be used for relatively small hydro systems to provide a rough estimate of output of a micro hydro system.
P(W) = 9810 × ηturbine × ηgenerator × Q × Hnet
Worked Example 1
A site has a gross head of 50m with a mean flow of 0.1 m3/s. The head loss is estimated to be 5m. Calculate the output power if efficiency of turbine and generator are 80% and 85% respectively.
We can use the formula:
The estimated power output is 30.02kW.
P(W) = 9810 × 0.8 × 0.85 × 0.1 × (50 – 5) = 30, 019W or 30.02 kW
P(W) = 9810 × ηturbine × ηgenerator × Q × Hnet

Micro Hydropower System Design Guidelines | 4
3. Preliminary StudiesThe preliminary studies could be in the form of pre-feasibility study, a feasibility study or a design study. The pre-feasibility study generally considers a variety of alternatives and uses approximate data. The feasibility study narrows the choice down to one or two options. It attempts to look more closely at costs, time scales and requires more accurate data to be collected. A feasibility study usually is the document which is considered by donors, community organisations, management, decision makers, etc. If the proposed project is endorsed, there will then be a design study, which is the point at which specifications, orders and tender documents are prepared. For many smaller projects, the feasibility aspect and design aspects could merge together, however the pre-feasibility study tends to be the initial essential study that is always required.
For pre-feasibility studies, the most common approaches for determining head are large-scale maps for high head sites (>60m), pressure gauge and tube for medium-head sites and hand-held levels for low-head sites (<15m). Furthermore, for flow determination, the most common approaches are basic hydrological models or simple flow measurement spot checks.
The first requirement for a successful hydro scheme is to find the best possible site. It may be appropriate to have a site which is conveniently near the demand and where there is a good combination of head and flow rate so that the output is maximized.
When potential sites have been identified, it is essential to obtain contour maps and regional records of rainfall and water flows in streams and rivers (also known as hydrological records). Head and flow need to be established of which, flow rate is variable and is difficult to determine. Certain hydrological records are available from relevant meteorological/energy/environment departments. In extreme cases, simple approaches to hydrology could be used which may be site-specific.
The hydrological study is in fact the most important and also most difficult part of the hydro design process as the surface water flow varies through the year in a complex manner.
A series of tasks that may be conducted during preliminary survey covering technical, economic, social and environmental aspects are listed in the table below. However, this may depend on the type/size of the micro-hydro project that might not require all of the tasks listed below.
Table 1 Series of Tasks involved in Preliminary Survey
Initial Survey Stages
Tasks Outline
1 Selection of candidate site for electrification
Candidate site for electrification is selected on paper
2 Preliminary survey of the site A reconnaissance survey of the hydropower potential is carried out, and the existence of possible sites of demand, possibility of grid connection (where
applicable), access conditions and laws and regulations are confirmed.
3 Initial consultation with local communities
After explaining the electrification planning and the study contents for that planning, open a consultation with the community representatives as to obtain its
consent for the site study
4 Identification of development area
The suitable area is surveyed and selected considering the following condition: the area has a site suitable for small-scale hydropower near a local community and
away from an existing distribution network

5 | Micro Hydropower System Design Guidelines
Fundamental Survey Stages
5 Topographic/geological survey Basic Technical data is collected and the area is surveyed with the future structure design in mind
6 Hydrological survey Basic data is collected and the area is surveyed to determine a structure design, calculate potential
generating electric energy and assess the environmental impact
7 Marketing survey including material
Procurement method is an important item in cost estimation. As rural electrification is carried out at remote locations, in most cases each place has its own various labour market conditions, commodity market and transportation conditions, etc. Thus, at
this stage it is necessary to carry out a cost estimation survey etc.
8 Preliminary power supply plan The scale of power output is preliminarily planned.
9 Local community survey (demand survey)
Present condition of energy consumption in the target area is surveyed.
10 Social condition survey and an initial environmental study
Present condition of life style, awareness of electrification and the local industry are surveyed.
Also, an initial environmental study is carried out in relation to the plan for small-scale hydropower.
11 Forecast of power demand Power demand after electrification is estimated in consideration of the life style of the local community
and scope of electrification.
12 Determination of the scale of development
Using the results of the surveys above, power generation and distribution are planned and the
balance of supply and demand is confirmed. Project cost and operation and maintenance cost are estimated to determine a possibility of project implementation from the standpoint of finance. In
addition, the impact of the project on the social and natural environment is assessed. After verifying these
items, the scale of development is determined.
13 Formulation of implementation schedule
Arrange the procedure schedule and the detailed tasks such as financial procurement, implementation
design, procurement, construction and the generation operation opening, etc. to materialize the project.
14 Establishment of management body (preparatory)
In the future, the operation of the power plant is to be carried out mainly by the local residents. As soon as the basic plan has been determined, a management body or its preparatory organization, including those
local residents is established. This organization also serves as the local support office until project
completion.
15 Settlement on the basic plan The electrification plan is agreed on among the project participants/stakeholders
16 Legal Rural electrification is to be in accordance with the laws of the country. Regulatory matters, such as those related to the electric utility services (if applicable) and to environmental development are to be extracted and
any development to be in support of those policies.

Micro Hydropower System Design Guidelines | 6
17 Construction financing plan Unlike a case where construction is carried out with own funds, when the cost is covered by external
assistance or a loan, the approaches to the related organizations are necessary and are to be planned.
Implementation Plan Stage
18 Design of power facilities Design implementation for the procurement of facilities such as power plants and distribution lines
(detailed design) is carried out.
19 Construction schedule and procurement plan
A construction schedule and procurement method is prepared.
20 Estimation of construction and maintenance costs
Construction costs are estimated. The estimated costs of power facilities maintenance after the
commencement of operation are used to establish electricity tariff rates (if applicable).
21 Cost Allocation (if applicable) If the beneficiaries can share the costs, the rate of costs sharing is to be agreed upon among those who
are to benefit from the project.
22 Proposal of electricity tariff rates (if applicable)
Based on the construction costs, and the operation and maintenance costs, electricity tariff rates are
calculated. Depending on the regulators of the electric power sector, the proposal of electricity tariff rates may be submitted prior to construction. Also, rate
sharing is explained to the local beneficiaries before completion.
Source: JICA (Guideline and Manual for Hydropower Development Vol. 2 Small Scale Hydropower)
3.1 Topographic and Geological Survey
The main purpose of the topographic and geological survey will be to assess the best locations for proposed civil works and estimate construction and maintenance costs. Specifically, this should aim at knowing:
• Future surface movements e.g. loose rock slopes that could be disturbed by construction work.• Future sub-surface movements e.g. landslip and subsidence.• Soil and rock types e.g. for foundations of civil works. It is recommended that a qualified civil personnel is consulted for higher capacity micro hydro power systems before confirming a site.
3.2 Hydrological Survey
3.2.1 Comparison of Catchment Areas
A thorough examination of a contoured large-scale map may show possibilities for the design of micro hydro scheme. Figure 2 below shows a section of a map which is indicative of two potential schemes.

7 | Micro Hydropower System Design Guidelines
A
B1
A1
C
RiverB
Figure 2 Contour Map showing two potential hydro schemes
Scheme A has an intake site at point A, then channels it along a contour line to point A1. The overall head is large. In scheme B, point B is an alternative for an intake site. The channel feeding water to the penstock at B1 is shorter than channel A and covers ground which is less steep, the penstock is roughly half as long.
Since obtaining the maximum head is very important in a hydro scheme, an intake sited at point A could be preferable to one sited at B. However, the penstock for scheme A is longer and so more expensive. The length of channel A is also greater and because of the steep slope may be expensive to build and maintain, therefore raising the total cost.
To analyse the merits of the different options, it is necessary to further explore using a geological survey to establish whether or not problems with land slips or storm runoff will make site A unfeasible. Furthermore, the collection of rain fall data towards points A and B would be helpful as greater flow rate could compensate for the low head in site B.
3.2.2 Finding the average daily flow (ADF)
The average daily flow of the river is calculated from the yearly flow. An estimate of average yearly flow at the potential site can be made from existing records of rainfall, such as information collected at nearby rain gauges.
The average yearly streamflow at two points can be approximated as follows:
1. First the storm runoff is calculated:
Runoff (mm/yr)= Rainfall (mm/yr) – Evaporation(mm/yr) – Surface absorption (mm/yr)
2. The storm runoff is used to calculate for the annual volume flow:
Volume flow per year (m3/yr) = Runoff (mm/yr) × Catchment areas(m2) × 10-3
3. The annual volume flow is then used to calculate the average daily flow (ADF):
ADF = Volume �ow per yearNumber of seconds in a year

Micro Hydropower System Design Guidelines | 8
3.2.3 Absence of local rainfall data
If rainfall data is not available, the following alternatives may be considered:
• If there are two or more years to wait for planning and finance clearance, immediately set up and monitor at least 1-2 rain gauges in the region of interest. Correlate this data with other national/regional data such as isohyet maps. (Refer to 3.2.4)
• Consult a professional hydrologist• Use flow correlation methods, as given in texts on hydrology• If you have some years lead-in time, measure flow directly by installing a flow measuring device
such as a notched weir across the river and take regular measurements over as long as possible. 3.2.4 Isohyet Maps
Often rainfall data are available in the form of isohyet maps as shown in figure 3.
2600 2400
2000
1800
2200
Figure 3 An example of Isohyet map
Worked Example 2
The average rainfall recorded at a site is 2810mm/year. It is estimated that there are 30% evaporation losses and around 10% absorption losses. The catchment area has been estimated to cover an area of 4.88 x 10⁶ m2.
The runoff for the site can be found using:
Runoff (mm/yr) = Rainfall (mm/yr) – Evaporation(mm/yr) – Surface absorption (mm/yr) = 2810 – 0.3(2810) – 0.1(2810) = 2810 – 843 – 281 = 1686 mm/yr
Volume flow per year (m3/yr) = Runoff (mm/yr) x Catchment areas(m2) x 10-3
= 1686 x 4.88 x 106 x 10-3 = 8.23 x 10⁶ m3/yr
ADF = Volume flow per year / Number of seconds in a year = 8.23 x 10⁶ m3 / (365 x 24 x 60 x 60) = 0.26 m3/s

9 | Micro Hydropower System Design Guidelines
The black show lines of rainfall that have the same amounts over a given period over the catchment area shown in red. They should never be used as a single indication of rainfall, but are sometimes useful as a check on other indications. Use in isolation should be avoided, since in micro-hydro applications the catchments are too small for isohyets to be sufficiently accurate.
3.2.5 Household, Agricultural and Industrial Water Use Planning and Net Flow
In most locations, the water flow may be used either for household or agricultural and industrial water use. For household use, estimations could be made using rule of thumb or average usage per household and likely growth in population in the area. An essential aspect of hydro planning is to include the farmers of the region in the hydro planning process. All of these water uses are likely to reduce the amount of water available for hydro power.
Proper planning is therefore required on when and how the hydro operates to allow sufficient water for other users.
The non-hydro water use should be taken into account to work out the net flow available to hydro.
Worked Example 3
The average daily flow rate has been found as 0.26m3/s. For household/agricultural use, the flow rate required is 0.05m3/s. Thus, the net flow works out to be:
Net flow (Qnet) = ADF ‒ Qagri
= 0.26m3/s - 0.05m3/s= 0.21m3/s
3.2.6 Seasonal flow variation
River flow typically varies during the year. There are two ways of expressing the flow variation: annual hydrograph and the flow duration curve (FDC). Both of these are often analysed for important rivers from data collected by government hydrologists over many years. It is recommended that these records are taken daily/weekly for several years (5-15 years).
A hydrograph is a graph showing the rate of flow (discharge) in m3/s or ft3/s versus time at a specific point in a river, channel, or conduit carrying water.
The flow duration curve (FDC) shows how flow is distributed over a period (usually a year). The vertical axis gives the flow as a percentage of the annual average. The horizontal axis gives the percentage of the year that the flow exceeds the value given on the y-axis. So, for instance, the graph in figure 4 indicates that the average flow (100% on the y-axis) is exceeded about 33% of the time.
Flow duration curves are often very similar for a region, but can be affected by soil conditions, vegetation cover, and to a lesser extent by catchment shape.

Micro Hydropower System Design Guidelines | 10
Figure 4 Flow Duration Curve indicating the percentage of the year that a particular flow rate is exceeded
A steep flow duration curve (FDC) is not good for micro-hydro as it implies a catchment area which is subject to extremes of flash floods and droughts. Factors that may cause this are:• Rocky, shallow soil/watershed• Lack of vegetation cover• Steep, short streams• Uneven rainfall It is recommended that the design flow rate selected should have a higher percentage exceedance to ensure availability of sufficient flow for the majority of the year.
Worked Example 4
With reference to figure 4 (flow du-ration curve), it can be identified where 100% of average daily flow (ADF) falls on the FDC. It is found that 33% of the year (4 months), there will be more runoff for site than 0.26m3/s calculated in worked example 2. Using the FDC, we can list the flows obtained for 140%, 120%, 100%, 80%, 60%, 40%, 30%,
Worked Example 4
With reference to figure 4 (flow duration curve), it can be identified where 100% of average daily flow (ADF) falls on the FDC. It is found that 33% of the year (4 months), there will be more runoff for site than 0.26m3/s calculated in worked example 2. Using the FDC, we can list the flows obtained for 140%, 120%, 100%, 80%, 60%, 40%, 30%, 20%, of ADF (simply 1.4 x 0.26, 1.2 x 0.26, etc).We can make up a list of net flow Qnet values for each row on a table
Assuming overall system efficiency of 0.5 and gross head of 150m., the respective power output values can be calculated using: Pout = 9.81 x 1000 x 0.5 x Qnet x Hgross.

11 | Micro Hydropower System Design Guidelines
Table 2 Flow Analysis Table
% ADF Qnet(m3/s) Pnet(kW) Exceedance Qnumber Expressed as months per year
140 0.364 0.315 232 22% Q22 3 months
120 0.312 0.262 193 28% Q28 3 months
100 0.26 0.21 155 33% Q33 4 months
80 0.208 0.128 94 42% Q42 5 months
60 0.156 0.106 78 57% Q57 7 months
40 0.104 0.504 40 64% Q64 8 months
30 0.078 0.028 21 70% Q70 9 months
20 0.052 0.002 1.5 84% Q84 10 months A 155kW turbine will operate for four months of the year (Q33 scheme). It could also be run, at reduced power, for a further period if the turbine is specified to work on reduced flow. This large turbine will require more capital costs. A smaller turbine might be more economic as it may be used for a longer period, for instance, Q57 scheme would be used at full power for 7 months in a year and part flow for some of the remaining months. If this turbine is considered, part-load efficiency of both turbine and generator should be analysed. See section 7.3 on Part-flow System Efficiency
In reality, the results of this site could be compared with other potential sites to come to the final selection with a similar approach.
3.3 Head Measurements
The total (or gross) head available is one of the most important details required from a site survey. During pre-feasibility studies, various alternative sites could be examined by adopting a fast and brief approximate method. At the design and specification stage, more accurate and reliable techniques will be needed.
Some measurements are more suitable on low-head sites but may not be practical on high-head sites. On the other hand, some may be accurate on high-head sites whereas not that accurate on low-heads.
It is recommended to take several separate measurements of head at each site where possible. A further important factor to note is that the gross head is not strictly constant but varies with the river flow. As the river fills up, the tailwater level very often rises faster than the headwater level, thus reducing the total head available. Although this head variation is much less than the variation in flow, it can significantly affect the power available, mostly in low-head schemes where every half of a metre matter. To assess the available gross head accurately, headwater and tailwater levels need to be measured for the full range of river flows. Some of the methods commonly used for head measurements are listed below:
• Dumpy levels and theodolites• Sighting meters• Water-filled tube and pressure gauge• Water-filled tube and rod• Spirit level and plank

Micro Hydropower System Design Guidelines | 12
• Maps• Altimeters 3.3.1 Dumpy levels and theodolites
It is a conventional method for measuring head and should be used where time and funds allow. Such equipment must be operated by personnel who have been trained on the equipment and have knowledge and skills on the calibration of the equipment.
Dumpy levels are used with level staffs to measure head in a series of stages as shown in Figure 5. A dumpy level is a device which allows the operator to take a sight on a level staff held by a colleague, knowing that the line of sight is exactly horizontal. A clear un-obstructed view is needed, so wooded sites can be frustrating with this method.
Dumpy levels only allow a horizontal sight, but theodolites can also measure vertical and horizontal angles, giving greater flexibility.
It is best to use accurately calibrated surveying equipment by trained professionals to attain higher levels of accuracy. The modern equipment incorporates laser measurements and automatic electronic display to enable faster and more accurate reading.
Figure 5 The use of dumpy levels for measuring vertical height(Source: Practical Action)
3.3.2 Sighting Meters
Hand-held sighting meters measure angle of inclination of a slope (inclinometers or Abney levels). They can be accurate if used by an experienced person. It is easy to make mistakes and multiple checks are always recommended. They are small and compact, and sometimes include range finders which save the trouble of measuring linear distance.
Since this method requires the linear distance along the slope to be recorded, it can have the advantage of doubling as a measure of the length of penstock pipe needed.

13 | Micro Hydropower System Design Guidelines
Figure 6 Sighting meter for measuring vertical angles(Source: Practical Action)
3.3.3 Water-filled tube and pressure gauge
This is probably, one of the simplest methods available, but it has its own risks. The two main sources of error include improperly calibrated gauges and air bubbles in the hose. To prevent the first part, the gauge should be re-calibrated both before and after each major site survey. In the second part, a clear plastic tube should be used that allows you to see bubbles.
Calibrating the gaugeTwo or more measuredreadings will de�ne the linear relationship betweenwater head and gauge pressure.
Pressure gauge
Figure 7 Water-filled tube and pressure gauge(Source: Practical Action)
An added bonus of this technique is that the hose can be used as a measuring tape to measure the penstock length. It is best to fill the pipe with water beforehand and seal it, and check for air bubbles.
Later convert pressure in psi or kPa to static head in metres.
Pressure exerted is given by P = ρgh
where, P is in Pa, ρ is density of water, 1000 kg/m3 and h is height of fluid in metres.

Micro Hydropower System Design Guidelines | 14
3.3.4 Water-filled tube and rod
Figure 8 illustrates the principle of this method which is especially recommended for low-head sites. It is cheap, reasonably accurate and not prone to errors. In this case, if more bubbles are trapped in one rising section of the tube than the other, then the difference in vertical height of the sets of bubbles will cause an equal difference in the head being measured. Two to three attempts must be made to ensure that your final results are consistent and reliable. Additionally, the results can be cross-checked against measurements obtained from other methods. The accuracy of this method can be quite good even when a person is used as a reference height. This method could be useful to villagers/farmers in self-help hydro projects.
Head = h2 – h1
Figure 8 Water filled tube and rod(Source: Practical Action)
3.3.5 Spirit level and Plank
This method is quite similar to the principle of water-filled tube and rod method. The difference is that the horizontal sighting is attained not be water levels but a carpenter’s spirit level placed on a straight plank of wood. On gentle slopes, the method is very slow but on steep slopes, it is useful. Mark one end of plank and turn it at each reading to cancel the errors.
Worked Example 5
A pressure of 20 psi is attained with the water filled tube method. First convert psi to kPa or Pa:
Remember 1 bar = 14.6 PSI, 1 bar = 100.7 kPa and 1 bar = 100,667 Pa. Therefore, 20/14.6 = 1.37 bar.1.37 bar = 1.37 x 100,667 Pa = 137,900Pa
Using P = ρgh, h = P/ρg = 137,900/(1000 x 9.81) = 14.06 metres

15 | Micro Hydropower System Design Guidelines
Spirit level
Figure 9 Spirit level and Plank method(Source: Practical Action)
3.3.6 Contour Maps
Large-scale contour maps are very useful for approximate head values but they may be not always available and fully reliable. If the point whose elevation is to be estimated falls on a contour line, the elevation of that contour is the best estimate of the point. If the point falls between contours, however, a technique called linear interpolation may be used to arrive at the estimated elevation. For example, if the point is half way between 8 and 10 metre contour lines, then it is 9 metres.
3.3.7 Altimeters
This method can be useful for high-head pre-feasibility studies. Surveying altimeters must be handled by experienced personnel to minimize errors. Furthermore, atmospheric pressure variations need to be allowed for, however, this method cannot be generally recommended except for approximate readings.
3.4 On-site Flow Measurement
The purpose of the hydrology study is to predict the variation in the flow during the year. Since the flow varies from day to day, a one-off measurement is of limited use. In the absence of hydrological results, a long-term measuring system may be set up. Such a system is the most reliable way of determining actual flow at a site. The flow measuring techniques include:
• The weir method• Stage control method• The salt gulp method• The bucket method• The float method
It is necessary to study the pros and cons of each in order to find a suitable method for any particular site.
3.4.1 Weir Method
A weir (low wall structure) is constructed with a rectangular notch through which all the stream water flows. The flow rate can be determined from a single reading of the difference in height between the upstream water level and the bottom of notch.

Micro Hydropower System Design Guidelines | 16
Figure 10 The Weir method(Source: Practical Action)
To obtain reliable results, the crest of the weir must be kept sharp and sediment must be prevented from accumulating behind the weir. This could be achieved by using sheet metal made of brass or stainless steel. The formula to find flow rate from a rectangular notched weir is:
Q = 1.8 (L – 0.2h) h1.5
Where:Q = flow rate (m3/s)L = the notch width (m)h = the head difference (m)
Worked Example 6
Suppose, a notched weir has width of 2.2m, and the upstream water level is 34cm above the weir crest, then the flow rate works out to be:
Q = 1.8 (L – 0.2h) h1.5
Q = 1.8 (2.2 – 0.2 × 0.34) 0.341.5
Q = 0.761 m3/s (or 761 l/s)
3.4.2 Stage-discharge Method
This method is similar to the weir method, except that a physical feature of the stream is used to control the relation between stage and discharge. The term stage refers to a measured depth of water. A control section is established where for a given change in discharge (flow rate), a relatively large, measurable change in stage can be measured. A broad control section should be avoided because changes in flow will result in very small changes in stage. Note, this method is valid for comparing one flow to another, but that a reference flow must be known and related to the graduated staff in order to obtain a quantitative estimation of flow rate.
Figure 11 Stage-discharge method: Graduated staff fixed at the contour section

17 | Micro Hydropower System Design Guidelines
3.4.3 Salt gulp Method
A bucket of heavily salted water is poured into the stream. The cloud of salty water in the stream starts to spread out while travelling downstream. At a certain point downstream, it will have filled the width of the stream. The cloud will have a leading part which is weak in salt, a middle part which is strong in salt, and a lagging part which is weak again. The salinity of the water can be measured with an electrical conductivity meter. If the stream is small, it will not dilute the salt very much, so the electrical conductivity of the cloud will be high. Therefore, low flows are indicated by high conductivity and vice versa. A useful guide to salt quantity is 100g for each 0.1m3/s of expected streamflow.
3.4.4 Bucket MethodThe bucket method is a simple way of measuring flow in very small streams. The entire flow is diverted into a bucket or barrel and the time for the container to fill is recorded. The flow rate is obtained simply by dividing the volume of the container by the filling time. Flows of up to 20 l/s can be measured using a 200-litre barrel.
The disadvantage of this method is that the whole flow must be channelled into the container. This method is practical for small streams only.
3.4.5 Float Method
One way of using this principle is for the cross-sectional profile of a stream bed to be charted and an average cross section established for a known length of the stream. A series of floats, perhaps convenient pieces of wood are then timed over a measured length of the stream. Results are averaged and a flow velocity is obtained. This velocity must then be reduced slightly by a correction factor to obtain the mean velocity. By multiplying the average cross-sectional area by the averaged and corrected flow velocity, the volume flow rate Q can be estimated.
Stop watch to measure time taken (t) by �oat to travel distance L
Average velocity (Vmean)
Chart to cross-sectional area at both ends. The average cross-sectional areais Amean
Use sections or count squares to estimate the cross-sectionalarea
Flow (Q) = Amean × Vmean = Amean ×Lt
× correctional factor
Figure 12 Channel Cross Section with Subsections (Source: Practical Action)
Approximate correction factors to convert surface velocity to mean velocity are:
Concrete channel, rectangular, smooth 0.85Large slow clear stream(>10m2) 0.75Small slow clear stream (<10m2) 0.65Shallow (<0.5m) turbulent stream 0.45Very shallow (<0.2m) turbulent stream 0.25

Micro Hydropower System Design Guidelines | 18
Unless a smooth regular channel is considered, obtaining an accurate figure for the cross-sectional area of the stream will be very difficult.
3.4.6 Current Meter
In this method, the stream channel cross section is divided into numerous vertical subsections. In each subsection similar to figure 12, the area is obtained by measuring the width and depth of the subsection, and the water velocity is determined using a current meter. The discharge in each subsection is computed by multiplying the subsection area by the measured velocity. The total discharge is then computed by summing the discharge of each subsection.
4. Site SelectionWhen selecting a candidate area, a total evaluation is necessary. Based on the following preliminary survey and evaluation, a candidate site could be selected:
• A preliminary survey of hydropower potential in the form of brief topographic and geological survey, hydrological survey, head measurements, nearby precipitation observation data, etc
• Existence of a potential demand area • Confirmation of the possibility to extend the transmission and distribution lines of the electric power
system (if applicable)• Confirmation of the access conditions • Confirmation of laws and regulations
In the case of the rural electrification by micro-hydro system, the power plant needs to be located at the nearer point to the area of electric power supply. In a case where a local community does not exist within the range of about 20km around the power plant, even if hydropower potential exists, transmission/distribution line loss increases compared to the demand, and also the construction cost of the transmission line increases. When demand areas are separated into several local communities and located over a relatively wide area, sometimes it is more advantageous to construct some small-scale power stations separately than to supply electric power to all the areas by a single power plant. This approach might reduce the transmission cost, ensure ease of operation and maintenance, and reduce the overall impact of power outage, etc. When the candidate area for the electrification is a rural community, the distance between the power plant and the demand area should be within several kilometres. Even when the candidate area is a town, the distance should be within about 20km.
5. General Design Strategy
The design approach should be able to work out the best options that are technically feasible and are also economical. Upon site selection, demand-supply matching (if applicable), evaluating overall feasibility and upon considering the best system layout, the design process then would aim at the selection/sizing of principal components.For detailed information on evaluating maximum electrical demand for an area for rural electrification, please refer to JICA Guideline and Manual for Hydropower Development Vol. 2 Small Scale Hydropower. Section 11 of this guideline also contains brief information on assessing maximum electrical demand for a site and evaluation of other economic parameters such as capacity factor, load factor, etc.
The principal components that are used in the MHS (Micro Hydropower System) could be further classified into civil components, powerhouse components and transmission and distribution networks.
5.1 System Layout
A thumb rule in system layout is to keep the penstock straight, short and steeped as far as possible. Penstock pipework is usually more expensive than an open channel (canal).
A brief lay-out of a typical micro-hydro system is given below in Figure 13.

19 | Micro Hydropower System Design Guidelines
Flood spillway
Intake
Wing walls
Channel crossing
Sand trap
Channel Forebay tank
Penstock support
Penstock
Anchor
Power house
Tailrace
River �ow
Regulating gates
Spillway drain
Figure 13 Typical Lay-out of a Micro-hydro System(Source: Practical Action)
Adapted from Micro Hydro System Design by Pandey, B. (2006)
Furthermore, 3 possible penstock routes may exist. Generally, the short penstock option might be economical in certain cases but a detailed analysis on terrain, cost and output comparison will assist on the applicable penstock routes. These penstock routes have been explained below.
5.1.1 Short Penstock Route
Here the penstock is short but the channel is long. The long channel is exposed to a greater risk of blockage, or of deterioration as a result of poor maintenance. Figure 14 depicts this penstock arrangement. Though the penstock is short, installing channel across a steep slope may be difficult and expensive and, in some cases, impossible. The risk of steep slope eroding may rule out this option.
Figure 14 Short Penstock arrangement(Source: Practical Action)

Micro Hydropower System Design Guidelines | 20
5.1.2 Mid-length Penstock
In this case, the penstock could be slightly longer and thus will cost more, but the expense of constructing a channel that can safely cross a steep slope may be saved. Even if the initial purchase and construction costs are greater, this option may be preferable if there are signs of instability in the steep slope. In some cases, the soil may be particularly sandy and permeable and cause water to leak (be wasted) from the channel. This will be a wiser option.
Figure 15 Mid-length Penstock(Source: Practical Action)
It should be noted that problems such as excessive seepage loss and blockage from falling debris, can be solved by the use of closed pipes, or by lining and the channels.
5.1.3 Long Penstock
In this case, the penstock follows the river, as shown in Figure 16. If this penstock arrangement is adopted due to difficult terrain, certain precautions must be taken. An important factor is the protection of penstock from seasonal flooding. It is always essential to calculate the most economic/feasible diameter of penstock. In the case of long penstock, incorrect sizing will lead to high costs. Though not a technical aspect but it is worth noting that the penstock may run through different pieces of land that may belong to different landowners, therefore, if this issue is not resolved during the planning stage, then there could be issues encountered later on that may have impact on the final completion of the project.

21 | Micro Hydropower System Design Guidelines
Figure 16 Long Penstock(Source: Practical Action)
5.2 Low Head Installations
Output power in a hydro system is directly proportional to flow as well as head. So, for a given amount of power, a low head installation proportionately needs more water, requiring bigger conduits that can remove the need for penstock or channels. Figure 17 show such arrangements for propeller turbines. The deployment maybe specific to a location and thus will need liaison with suppliers and will also dependent on the respective affordability.
Tubeturbine
Bulbturbine
Vertical shaft, radical �ow turbine
Figure 17 Propeller turbines

Micro Hydropower System Design Guidelines | 22
6. Civil Work ComponentsThe civil components described are those major components such as the weir, intake, headrace canal, de- sanding basin, spillway, forebay tank, penstock pipes and tailrace. It is recommended for civil works, qualified and experienced civil personnel who have prior experience in micro-hydro design are engaged to aid with the design of civil components such as weir, intake, spill way, forebay, tail race and other relevant components.
6.1 Weir Design
A hydro scheme must extract water from the river in a controlled manner. The water diverted into the channel must be regulated during high and low river flows. Figure 18 (a) shows how a weir is used to raise the water level and ensure a constant supply to the intake.
Intake
(a) Weir creating an arti�cial pool
(b) Silt blocking the intake
(c) Natural weir
Figure 18 Function of a Weir(Source: Practical Action)
The pool created by the weir will tend to silt up over time, figure 18 (b) and measures must be taken to prevent the silt from burying the intake. Sometimes, it is possible to avoid the cost of building an artificial weir by using the natural features of the river, figure. 18 (c). A natural permanent pool in the river may provide the same function as a weir. Common mistakes made in weir construction are inadequate foundations resulting in undercutting of structures by the current, and incorrect choice of site.
The weir must be designed for the worst flood (Qflood) likely to be encountered for the system. The flood barrier walls therefore should be estimated and designed appropriately. A common method is presented below.
In the first step of the intake design, find the appropriate width b (Figure 19) of the weir which serves as a control device for the backwater level (Hb) in the forebay, where the diversion channel is tapped.

23 | Micro Hydropower System Design Guidelines
b
HB
Figure 19 Weir parameters
If the width b is limited, then the flooding head HB is calculated by:
=HB (2.95.μ.b)⅔
Q⅔�ood [m]
1 Adapted from Civil works for micro hydro power units by University of Applied Sciences Northwestern Switzerland

Micro Hydropower System Design Guidelines | 24
In case you want to obtain the needed width b of a certain flood Qflood and a known flooding head HB calculate the weir width according to the following formula:
=b 2.95.μ.HB
Q⅔�ood [m]
Where the width of the weir is described by b and the flooding head HB, the weir shape coefficient is µ which relates to the weir shape as in Figure 20.
A Broad, sharp edges μ = 0.49- 0.51
B Broad, round edges μ = 0.5 – 0.55
C Rounded μ = 0.75
D Sharp-edged μ = 0.64
E Roof-shaped μ = 0.79
Figure 20 Weir crest shapes
Eventually, the height of the barrier (wing wall), is the sum of weir height (Hweir) and flooding head (HB) is given by:
Hbarrier = Hweir + HB
6.2 Intake Design
The main task of the intake structure is to divert water from a river or lake into a micro hydro system via a channel, penstock, or in some cases, to have the water flow directly into the turbine chute. Since the available discharge of the water source may vary due to seasonal changes, the water level at the point of diversion must be held constant at a certain stage. Hence, the intake must have some control device like a weir or similar barrage structure. Further, the intake structure must be capable of managing the bed load, which may include solids, which is carried by the river. In a low water season, the bed load just contains silt and sand but during a flood season, the river might carry heavy boulders. In general, the steeper the river slope is, the more bed load it carries due to higher flow velocities. Both, low flow Qmin and high flow Qmax (or Qflood) must be considered when planning the weir section of the intake. Two common types of intakes which can be applied in most cases are:
• Direct intake• Side intake
Figures 21 shows typical possibilities. Consideration should be given to appropriately spaced vertical bars (racks) at the intake to avoid pipe blockage.

25 | Micro Hydropower System Design Guidelines
(a) Direct intake
(b) Side intake
Figure 21 Intake methods(Source: Practical Action)
6.3 Spillways Layout
Spillways are designed to permit controlled overflow at certain points along the channel. Figure 22 depicts a flood spillway in detail including flow control and channel emptying gates. Flood flows through the intake can be twice or higher than the normal channel flow, so the spillway must be large enough to divert this excess flow.
Figure 22 Flood spillway(Source: Practical Action)
The spillway is a flow regulator for the channel. In addition, it can be combined with control gates to provide a means of emptying the channel.

Micro Hydropower System Design Guidelines | 26
6.4 Settling Basins and Forebay Tanks
The water drawn from the river fed to the turbine will usually carry suspended particles. This sediment will be composed of hard abrasive materials such as sand which can cause expensive damage and rapid wear to turbine runners. To remove this material, the water flow must be slowed down in settling basins so that the silt particles will settle on the basin floor. The deposit formed is then periodically flushed away. It is generally necessary to settle out the sediment both at the start of the channel and at the penstock entry, i.e. the forebay tank.
Figure 23 Forebay Tank
Both basins should be designed as follows:
• They must have length and width dimensions which are large enough to slow the water sufficiently to cause settling of the sediments.
• They must allow for easy flushing out of deposits.• Water discharged from the flushing exit must be led carefully away from the installation so as to
avoid erosion of the soil surrounding and supporting the basin and penstock foundations.• They must avoid flow turbulence due to sharp area changes or bends.• Sufficient capacity must be allowed for collection of sediment.
For more information on determining the dimensions of the settling area, refer to the text Micro-Hydro Design Manual: A Guide to Small-Scale Water Power Schemes (ISBN-13: 978-1853391033) or similar.
6.5 Channels or Canals
Figure 24 shows the various types of channel sections which may be suitable for certain applications. The type of channel chosen for each part of the route is very important. Some types include:
• Simple earth excavation, no seal or lining• Earth excavation with seal (either cement or clay)• Masonry lining or concrete channels• Flumes or aqueducts made from galvanized steel sheet, wood, pipes, pipes cut in half to form
troughs, etc.

27 | Micro Hydropower System Design Guidelines
Simple earth channel
Earth channel linedwith stone and mortar
Open concrete channel
Earth channel sealed with clay or cement slurry
Capped concrete channel, shieldedagainst debris
Figure 24 Different types of channels(Source: Practical Action)
For more information on determining the dimensions of the settling area, refer to the text Micro-Hydro Design Manual: A Guide to Small-Scale Water Power Schemes (ISBN-13: 978-1853391033) or similar.
7. Penstock sizing
7.1 Penstock sizing procedure
The penstock is the pipe which conveys water under pressure to the turbine. The major components of the penstock assembly are given in Figure 25.
Valve
Pipe joint
Power house
Vent pipe
Expansion joint Penstock gate
Side blockAnchor block
Figure 25 Components of the Penstock AssemblyAdapted from Micro Hydro System Design by Pandey, B. (2006)
The penstock often constitutes a major expense in the total cost and it is therefore worthwhile optimizing the design. The trade-off is between head loss and capital cost.
The efficiency of the penstock is connected to the velocity of the water passing through the pipe. The higher the velocity, the more friction losses appear. Since the diameter of a pipe has a large influence on the velocity, the diameter of the pipe must be carefully chosen by considering its cost/performance ratio. Simply, smaller diameter pipes tend to be cheaper but will contribute to high head loss. The basic relation between flow and pipe diameter is obtained by the continuity equation:

Micro Hydropower System Design Guidelines | 28
Q = A.v =d2
4.π.v [m3/s]
Or v =4Q
d2π[m/s]
Where Q = flow [m3/s] ; A = area [m2] ; v = velocity [m/s]; d = diameter [m]; π = 3.14.
Worked Example 7
The design flow rate for a site is 0.5m3/s and flow velocity is 2.6m/s, what shall be the approximate diameter of the pipe?
Using,
Therefore, the diameter of the pipe comes out to be: 0.5 m.However, realistically, it is not that simple.
Q = A.v =d2
4.π.v [m3/s]
d = 4Qπ.v
d = 4 × 0.53.14 ×2.6
[m]
[m]

29 | Micro Hydropower System Design Guidelines
A methodical approach in the design of penstock is given in the following steps:
7.2 Types of Materials used for Penstock
The following materials can be considered for use as penstock pipes in micro-hydro schemes:
• Mild steel• Unplasticized polyvinyl chloride (uPVC)• High density polyethylene (HDPE)• Medium density polyethylene (MDPE)• Spun ductile iron• Prestressed concrete• Wood stave• Glass reinforced plastic, etc.
Mild steel, uPVC, HDPE and MDPE are the most common materials used.
7.2.1 Mild Steel
Mild steel is one of the widely used material for penstocks in micro-hydro schemes. It is relatively cheap, often available on the local market in a variety of sizes, and may be fabricated locally. It has improved friction loss characteristics provided it is well protected by paint or another surface coating. Mild steel pipes are resistant to mechanical damage and are relatively heavy, but they can be manufactured in lengths suitable for transportation. They can be joined by bolted flanges, mechanical joints or by welding on site.

Micro Hydropower System Design Guidelines | 30
7.2.2 uPVC
Unplasticized polyvinyl chloride (uPVC) pipe is another most widely used alternatives to steel in micro-hydro scheme. It is relatively cheap, widely available in a range of diameters from 25mm to over 500mm, and is suitable for high pressure use. Different pressure ratings are obtained by selecting the wall thickness of the pipe. It is light and easy to transport and lay. It has very low friction losses, does not corrode and is the easiest type of material for repair. It is relatively fragile, particularly at low temperatures and prone to mechanical damage from falling rocks or vehicles driving over if buried in a shallow trench.
7.2.3 HDPE High density polyethylene (HDPE) pipes offer a good alternative to uPVC, though at a higher price. They are usually available in diameters from 25mm to over 1m. HDPE has excellent friction loss and corrosion resistant characteristics, and does not deteriorate as much as uPVC when subject to sunlight. HDPE are generally jointed by heating the ends and fusing them under pressure. This requires special equipment, which is a disadvantage. HDPE has a coefficient of expansion ten times that of steel, so is often buried to keep the temperature steady.
7.3 Penstock Jointing
Pipes are generally supplied in standard lengths and have to be joined together on site. Methods of pipe jointing fall roughly into four categories:
• Flanged• Spigot and socket• Mechanical• Welded
For more information on jointing techniques, refer to the text Micro-Hydro Design Manual: A Guide to Small-Scale Water Power Schemes (ISBN-13: 978-1853391033) or similar.
7.4 Valves
Valves control the water flow through the penstock. It is advisable to place a valve at the entry to the turbine, to allow uncoupling of the turbine with the penstock. A valve is not usually necessary at the top of the penstock, because water can be diverted from the penstock in other ways such as by diverting from the channel by closing the mouth of the penstock with a flat board faced with rubber or by opening a sluice in the forebay tank.
Some types of valves that exist and are commonly used include:
• Gate valve• Butterfly valve• Globe valve• Ball Valve• Pilot valve
For more information, refer to the text - Micro-Hydro Design Manual: A Guide to Small-Scale Water Power Schemes (ISBN-13: 978-1853391033) or similar.
7.5 Penstock Sizing
The following section describes how to select a penstock pipe with a suitable diameter and wall thickness.
7.5.1 Selecting the pipe diameterThe two main constraints on the choice of pipe diameter are (a) the price, and (b) the head loss. The overall aim will be to find the pipe of smallest diameter (cheapest) which provides an acceptable level of head loss.

31 | Micro Hydropower System Design Guidelines
The major source of head loss is friction between the moving water and inside surface of the pipe. A second cause is turbulence. Both contribute to heat dissipation. Turbulence losses occur whenever the smooth passage of the flow is interfered with, usually at the following places: the penstock inlet, bends, valves and changes in pipe diameter. In long penstocks, these losses may be insignificant, but in short penstocks they may be greater than the friction loss.
Overall,
Total head loss = hfriction+ hturbulance
% Head loss = Total head loss hgross
× 100%
In choosing a pipe diameter, the objective is to restrict the total head loss to between 2% and 10% of the gross head. A reasonable target to aim for is 5%. For very long, high head penstocks, up to 30% head loss may be considered, especially in conjunction with multi-jet pelton wheels.
Selecting the pipe diameter is an iterative process, it involves starting with first estimate of what might be a suitable diameter, based on the sizes that are available and then adjusting that estimate depending upon head loss and the price. The procedures for calculating a) the friction loss (pipe wall losses) and b) turbulence loss are described below. Note that if this calculation is only meant to be a rough estimate, then you may ignore the turbulence losses unless the penstock is very short.
7.5.2 Calculation of friction loss (pipe wall losses)
Once the flow rate Q and the length of penstock L have been determined (or estimated), the friction loss then depends upon the diameter of the pipe D and the roughness of the pipe surface. Friction loss in pipes is a complex topic. Fortunately, a friction loss calculation can often be avoided because pipe manufacturers tend to publish graphs or tables of friction loss at different flows as shown in Figure 26. Always refer to latest version of charts and for the products that will be used.
Flow rate (L/s)
5040
302520
15
10
5
4
3
2
1.5
13 6 12 18 24 30 60 120 180 240 300
Velocity
10 m/s9 m/s8 m/s
7 m/s6 m/s
5 m/s
4 m/s3.5 m/s
3 m/s2.5 m/s
2 m/s1.8 m/s
40 m
m
50 m
m
65 m
m
80 m
m
100
mm
125
mm
150
mm
Actu
al p
ipe
bore
200
mm
250
mm
300
mm
Fric
tion
Loss
(m p
er 1
00 m
leng
th)
1.6 m/s
1.2 m/s1.0 m/s0.9 m/s
1.8 m/s
1.4 m/s
Figure 26 An example of Friction loss chart in metres of head per 100m of plastic pipe/rolled steelNote: Multiply by 1.25 for cast iron or 1.56 for rusty cast iron.

Micro Hydropower System Design Guidelines | 32
Alternatively, the friction loss can be estimated from the following websites:
• https://www.dutypoint.com/friction-head-loss• http://www.calculatoredge.com/mech/pipe%20friction.htm • https://www.nationalpump.com.au/calculators/friction-loss-calculator/
If friction loss charts are not available, the recommended alternative is to use an equation formulated by Darcy together with a chart prepared by Moody. Darcy’s equation which is as follows:
hf =f L 0.08Q2
d5
Friction loss Where:Q = flow (m3/s)L = penstock length (m)d = pipe internal diameter (m)f = friction factor (depends on surface roughness of pipe and Reynolds number)
Fortunately, if this formula is used, the friction factor can be calculated online from the following site: http://www.pneucon.co.kr/Techinform/vmd03.htm
The above formula requires determining friction factor, by referring to Moody’s chart using Reynolds number. For more information on friction factor, surface of pipe and Reynolds number, refer to text Micro-Hydro Design Manual: A Guide to Small-Scale Water Power Schemes (ISBN-13: 978-1853391033) or similar.
Worked Example 8
Assume that cast iron pipes are to be used, next estimate the friction loss for a micro hydro scheme. The flow rate is chosen as 0.006m3/s or 6 l/s. The dotted line in the chart shows that an 80mm diameter pipe carrying 6 l/s will cause a head loss of about 2m in every 100m of pipe.
On the other hand, if uPVC pipes are used, this will be about 0.8 x 2 = 1.6m of head loss for every 100m.
Worked Example 9
A new PVC penstock, 75m long and with an internal diameter of 352mm, has a design flow of 0.19 m3/s. The friction factor of PVC pipe using Moody’s chart is given as 0.013. The friction loss is found as follows:
hf =f L 0.08Q2
d5
hf =0.013 × 75 × 0.08 × 0.192
0.3525
= 0.52 mUsing the online calculator (https://www.nationalpump.com.au/calculators/friction-loss-calculator/) gives a head loss of 0.56m which is very close. It is best to compare results obtained from 2 or 3 different online sources and use a midpoint value or the higher value to be conservative.

33 | Micro Hydropower System Design Guidelines
7.5.3 Calculation of turbulence losses
The magnitude of the turbulence losses depends upon the various changes which occur in the penstock geometry and the speed with which the flow hits those changes. The overall head loss due to turbulence is generally expressed as:
hturb loss =vi
2
2g∑Ki
Where vi is the velocity of the flow after it has encountered a feature with turbulence loss coefficient Ki. Σ denotes “sum of” and this will be the sum of all Kn components that cause turbulence, g is gravitational acceleration constant (9.81m/s2)
Figure 27 shows how to determine the turbulence loss coefficients for various features, including intake profiles, angles of bend, pipe contractions, and type of valve.
Head loss coe�cients for intakes (Kentrance)
Entrance pro�le
Kentrance 1.0 0.8 0.5 0.2
The total turbulance head loss (hturb loss) is given by
hturb loss =v2
2gKentrance + Kbend + Kcontraction + Kvalve ×
d r θ
Head loss coe�cients for bends (Kbend)
Bend pro�le
r/dKbend
Kbend
Kbend
(θ = 20°)
(θ = 45°)(θ = 90°)
1 2 3 5
0.36 0.25 0.20 0.150.45 0.38 030 0.230.60 0.50 0.40 0.30

Micro Hydropower System Design Guidelines | 34
Head loss coe�cients for sudden contractions (Kcontraction)
Contraction pro�le d2
d1
d1/d2
Kcontraction
1.0 0.5 2.0 2.5 5.00 0.25 0.35 0.40 0.50
Head loss coe�cients for valves (Kvalve)Type of valve
Kvalve 0 0.1 0.3Spherical Gate Butter�y
Figure 27 Turbulence losses in penstocks

35 | Micro Hydropower System Design Guidelines
Worked Example 10
A 40 m penstock takes a flow of 0.5 m3/s. The first 30m are made of pipe diameter 50cm, and the last 10m is of diameter 40cm. There is a 45° bend of radius 1.5m in the top section. The intake is a protruding pipe and there is a gate valve at each end of the penstock. What is the head loss due to turbulence?
Flow velocity in top pipe:
v1 =4Qπ d2
v1 =4 × 0.5π × 0.52
= 2.55 m/sSimilarly, flow velocity in bottom pipe
For the 45° bend: R/d = 1.5/0.5 = 3, so Kbend with reference to Figure 27 = 0.3
For the contraction:
d1/d2 = 0.5/0.4 = 1.25, so Kcontraction with reference to Figure 27 = 0.25
Also, Kintake = 0.8 based on the intake method.
And Kvalve = 0.1 for both gate valves.
Therefore, the turbulence loss is:
hturb loss =v1
2
2gKintake + Kvalve + Kbend
v22
2g+ × × Kcontraction + Kvalve
hturb loss =2.552
2 × 9.81(0.8 + 0.1 + 0.3) × 3.982
2 × 9.81+ × (0.25 + 0.1)
hturb loss = 0.4 + 0.28 = 0.68 m
Therefore, head loss due to turbulence is 0.68m.
v2 =4 × 0.5π × 0.42
= 3.98 m/s

Micro Hydropower System Design Guidelines | 36
Worked Example 11
For the scenario in worked example 10, assuming both pipes are PVC pipe, the friction losses due to pipe wall friction are:
Pipe 1 – 50cm The friction factor is calculated online from: http://www.pneucon.co.kr/Techinform/vmd03.htm Note this will vary with different diameter of pipes and surface roughness (different materials).
This comes to 0.01126 for 50cm PVC pipe
hf =f L 0.08Q2
d5
hf =0.01126 × 30 × 0.08 × 0.52
0.55
= 0.22mOnline friction loss calculator - https://www.nationalpump.com.au/calculators/friction-loss-calculator/ yields:0.24m which is pretty close.
Pipe 2 - 40cm
The friction factor is calculated online from: http://www.pneucon.co.kr/Techinform/vmd03.htm Note this will vary with different internal diameter of pipes and surface roughness (different materials).This comes to 0.01088 for 40cm PVC pipe.
hf =f L 0.08Q2
d5
hf =0.01088 × 10 × 0.08 × 0.52
0.45
= 0.21m
Online friction loss calculator - https://www.nationalpump.com.au/calculators/friction-loss-calculator/ yields:0.2404 m which is pretty close.
The frictional losses in both pipes will be: 0.22 + 0.21 = 0.43m
Using turbulence loss from previous example:Total head loss = hfriction+ hturb loss
= 0.43 + 0.68 = 1.11m
% Head loss = Total head loss hgross
× 100%
Using trigonometry, gross head is 40 sin 45° = 28.28m
= 1.1128.28
= 3.92 %, which is acceptable
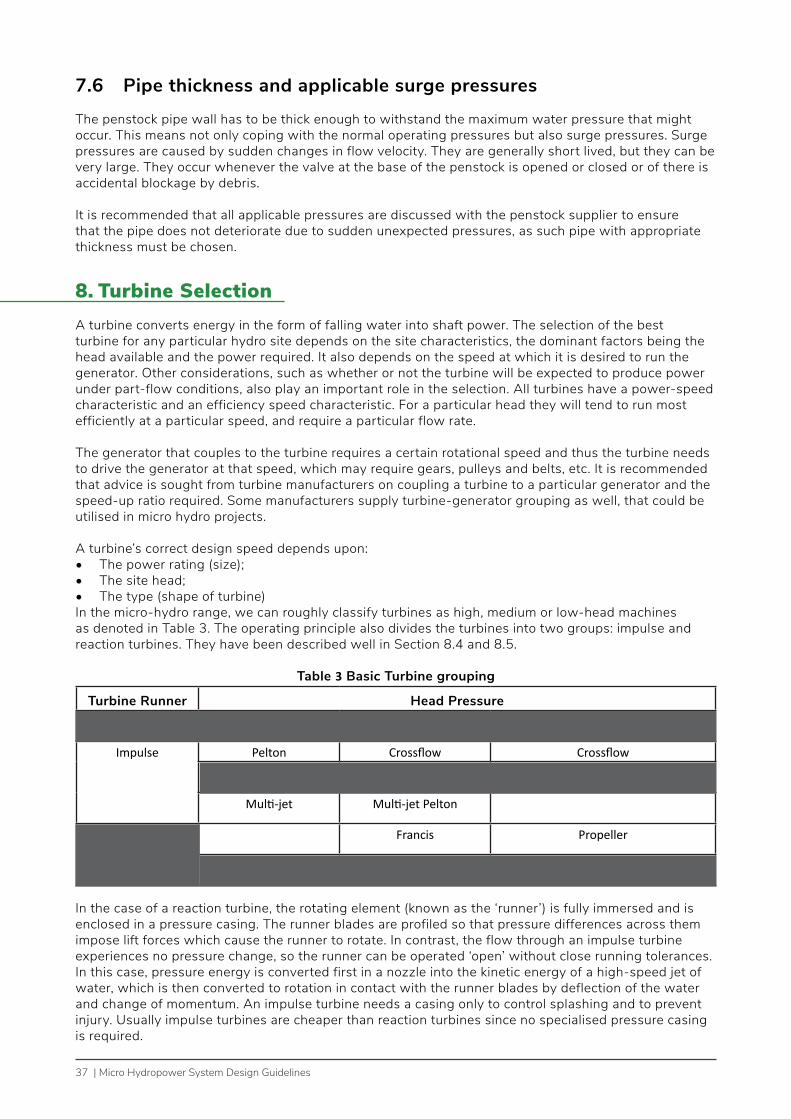
37 | Micro Hydropower System Design Guidelines
7.6 Pipe thickness and applicable surge pressures
The penstock pipe wall has to be thick enough to withstand the maximum water pressure that might occur. This means not only coping with the normal operating pressures but also surge pressures. Surge pressures are caused by sudden changes in flow velocity. They are generally short lived, but they can be very large. They occur whenever the valve at the base of the penstock is opened or closed or of there is accidental blockage by debris.
It is recommended that all applicable pressures are discussed with the penstock supplier to ensure that the pipe does not deteriorate due to sudden unexpected pressures, as such pipe with appropriate thickness must be chosen.
8. Turbine SelectionA turbine converts energy in the form of falling water into shaft power. The selection of the best turbine for any particular hydro site depends on the site characteristics, the dominant factors being the head available and the power required. It also depends on the speed at which it is desired to run the generator. Other considerations, such as whether or not the turbine will be expected to produce power under part-flow conditions, also play an important role in the selection. All turbines have a power-speed characteristic and an efficiency speed characteristic. For a particular head they will tend to run most efficiently at a particular speed, and require a particular flow rate.
The generator that couples to the turbine requires a certain rotational speed and thus the turbine needs to drive the generator at that speed, which may require gears, pulleys and belts, etc. It is recommended that advice is sought from turbine manufacturers on coupling a turbine to a particular generator and the speed-up ratio required. Some manufacturers supply turbine-generator grouping as well, that could be utilised in micro hydro projects.
A turbine’s correct design speed depends upon:• The power rating (size);• The site head;• The type (shape of turbine)In the micro-hydro range, we can roughly classify turbines as high, medium or low-head machines as denoted in Table 3. The operating principle also divides the turbines into two groups: impulse and reaction turbines. They have been described well in Section 8.4 and 8.5.
Table 3 Basic Turbine grouping
Turbine Runner Head PressureHigh Medium Low
Impulse Pelton Crossflow CrossflowTurgo Turgo
Multi-jet Multi-jet Pelton
Reaction Francis Propeller
Pump-as-turbine (PAT) Kaplan
In the case of a reaction turbine, the rotating element (known as the ‘runner’) is fully immersed and is enclosed in a pressure casing. The runner blades are profiled so that pressure differences across them impose lift forces which cause the runner to rotate. In contrast, the flow through an impulse turbine experiences no pressure change, so the runner can be operated ‘open’ without close running tolerances. In this case, pressure energy is converted first in a nozzle into the kinetic energy of a high-speed jet of water, which is then converted to rotation in contact with the runner blades by deflection of the water and change of momentum. An impulse turbine needs a casing only to control splashing and to prevent injury. Usually impulse turbines are cheaper than reaction turbines since no specialised pressure casing is required.

Micro Hydropower System Design Guidelines | 38
8.1 Specific Speed
The values of specific speed may be used to select turbines from charts. The relationship between head (H), turbine power (Pt) and actual turbine speed (Nt) is expressed by the following equation which applies to all turbines.
Where:Ns = specific speed Nt = actual turbine speed in rpmPt = turbine output power in kWH = Head in metres
Specific speed is a constant which describes a particular machine and can be supplied by the turbine manufacturer. Larger or smaller turbines of the same shape would have identical specific speed.
Care must be taken to establish which units are used in the formula. In principle, the equation allows selection of a turbine which runs exactly at the required speed. From known head and power output, the desired specific speed Ns can be calculated, and a turbine of this characteristic can be ordered from a manufacturer.
Worked Example 12
A scheme is planned with turbine output power as 3kW, head of 40m and turbine speed of 500rpm. The specific speed will thus work out to be:
Ns = ×1.2 Nt H1.25
pt0.5
Ns = 1.2 × 500 × 401.25
3 0.5
= 10.33
This value is near to the specific speed of single jet Pelton turbine.
8.2 Turbine Selection using Specific Speed
A convenient method for selecting a suitable turbine for a particular site is given in Figure 28.

39 | Micro Hydropower System Design Guidelines
Figure 28 A Nomogram on Selection of a turbine for a hydro site (Source: Practical Action)
An example is also given. Notice that use of a Pelton turbine is not always restricted to high head – if the power transmitted is low, then the Pelton will also run on low heads, although at slow rotational speed.
Figure 29 is useful in estimating the size of the runner required of a turbine for any application. In general, the smaller the runner, the less material being used and the faster it rotates, requiring less gearing, leading to lower cost.

Micro Hydropower System Design Guidelines | 40
Figure 29 Estimate of approximate runner diameter of axial turbines(Source: Practical Action)
The different turbine types are described in more detail in the sections following. An important aspect is their performance at part flow.
Small turbines designed for micro-hydro applications often will have no method of altering the flow rate of water. On larger machines, some method of altering flow is normal. For instance, a multi-jet Pelton can be run with some jets shut off. Cross flow and Francis turbines have guide vanes which alter the water flow rate.
The choice of a particular hydro turbine could be made using a chart shown in Annex 1 using effective head and discharge values for a site. Some manufacturers supply turbines as turbine-generator group, which means they are coupled as a package. A typical specification of such turbine-generator group is provided in Annex 2.
8.3 Part-flow System Efficiency
When running at part-flow there can be a reduction in the efficiency of each component, the turbine, the drive belt and the generator. These reduced inefficiencies combine together to give a low overall efficiency. Sometimes, so low that you cannot expect any significant power supply to consumers.
This situation is most common in small hydro schemes since generators of less than 5kW capacity can become inefficient when operated at low power. Bigger schemes are also affected depending on the design of the turbine.
The important thing is to know, or estimate, the part-flow performance of the turbines you are considering. If the manufacturer cannot tell you, then assume the turbine is about 20% less efficient at part-flow than similar machines made by other manufacturers.

41 | Micro Hydropower System Design Guidelines
Figure 30 Typical Part-flow efficiency of various turbines(Source: Practical Action)
In the case of electrical generators, either induction or synchronous, it is necessary to ask the manufacturer for test data at part power. Sophisticated machines of all sizes will maintain 70 or 80% efficiency at half power, and reduce to 60 to 75% at quarter power.
Drive systems often lose a fixed amount of power. That is to say, a 95% efficient drive on a 10kW scheme loses around 0.5kW. If the same drive is used to transmit 2.5kW (quarter power), it will still lose 0.5kW, and its efficiency is therefore around (2.5 – 0.5)/2.5 = 80%.

Micro Hydropower System Design Guidelines | 42
Worked Example 13
A 3kW hydro scheme is designed for a village. The turbine being considered has a full flow efficiency of 70% and the generator has an efficiency of 80% when used between half power and full power. The drive system being used has an efficiency of around 95%.
It is known that sometime of the year, there is only half the water available because of lack of rainfall, and to get some power to the village at this time would be very useful. It is also desired to get some power in the driest month when only a quarter flow is available.
It is critical to work out the power input of the turbine.
The power input required for the turbine during full flow conditions will be:
In order to get the output power of the generator at half flow, one will need the part-flow performance data for the turbine. The manufacturer will provide this. Suppose, you are told that it is 60% efficient at half flow and 25% efficient at quarter flow. You will also need to know the part-power efficiency of the generator. You already know this is 80% at half power and have found out that it is 60% at quarter power.
Half flowInput power to turbine at half flow = 0.5 x 5.6 = 2.8kWEfficiency of turbine at half power = 0.6The power lost by the drive at full power = (0.7 x 5.6) x (1 – 0.95) = 0.2kW
Efficiency of generator at half flow = 0.8
Input power to generator at half flow = (2.8kW x 0.6) – 0.2kW = 1.5kW
Output power from generator at half flow = 1.5kW x 0.8 = 1.2kW
Note that the combined efficiency has reduced from 53% at full flow to 43% (1.2/2.8) at half flow. Overall system efficiency will be this multiplied by other component efficiencies.
Quarter flowThe output power of the generator at quarter flow will be as follows:
Turbine input at quarter flow = 0.25 x 5.6 = 1.4kW
Output power = ((1.4 x 0.25) – 0.2) x 0.6 = 0.1kW
Combined efficiency has now reduced to 7% (0.1/1.4) and it would be unwise to promise the village any useful power at all during the driest part of the year. Overall efficiency will be even lower because of penstock losses and transmission losses.
Pin =output power
efficiencyoutput power
ηgen × ηdrive × ηturbine
=
30.8 × 0.95 × 0.7
= 5.6 kWPin =

43 | Micro Hydropower System Design Guidelines
8.4 Impulse Turbines
Three commonly used impulse turbines are: crossflow, Turgo and Pelton. They are more suitable for micro-hydro applications, as they have the advantages listed below. Compared to reaction turbines, impulse turbines:
• Are more tolerant of sand and other particles in the water• Allow better access to working parts• Are easier to fabricate and maintain• Are less subject to cavitation (Refer to Section 8.5)• Have flatter efficiency curves if a flow control device is built in (e.g. nozzle area change, spear valve,
change of number of jets, guide vanes, partitioning of flow).
The major disadvantage of the impulse turbines is that they are mostly unsuitable for low head-to-power ratios. Fortunately, the cross-flow, Turgo and multi-jet Pelton are impulse turbines which are suitable for medium head-power ratios. An impulse turbine can operate at low head, if the power transmitted is also low and a slow speed is acceptable.
8.4.1 Pelton Turbines
A Pelton turbine has one or more nozzles dis-charging jets of water which strike a series of buckets mounted on the periphery of a circular disc. In large hydro-power installations, Pelton turbines are normally only considered for gross heads above 150 metres. For micro hydro applications, Pelton turbines can be used at much lower heads. For instance, a small diameter Pelton rotating at high speed can be used to produce 1kW on a head of less than 20 meters. At higher power and low heads, the rotational speed becomes very low and the runner is large and unwieldy in relation to the power generated. If runner size and low speed do not pose a problem for a particular installation, then a Pelton turbine can be used with low heads.
An example of brief technical specifications of Pelton turbine is attached as Annex 2.
a b
Figure 31 A single jet Pelton
If a higher running speed and smaller runner are required, then there are two main design options open:
• Increasing the number of jets – the use of two or more jets will allow a smaller runner for a given flow of water and hence an increased rotational speed. The required power can still be attained. The part-flow efficiency of a multi-jet Pelton wheel is especially good as it can be run on a reduced number of jets.
• Twin runners – Two runners can be used side by side on the same shaft or can be placed on either side of the generator on the same shaft. This design option is unusual in micro hydro schemes, but occurs often with single jet Pelton turbines in larger hydro schemes.

Micro Hydropower System Design Guidelines | 44
8.4.2 Single jet and multi jet Pelton
Generally, micro-hydro Pelton turbines were always single jet because of the complexity and cost of flow control governing of more than one jet. With advancement in load control governing and the trend towards higher speed alternators, multi-jet turbines have become popular. Multi-jet turbines have the following advantages compared to single jet turbines:
• Higher rotational speed• Smaller runner and case• Some flow control possible without a spear valve• Less chance of blockage in most designs – reduced surge pressures.
On the contrary, the disadvantages are:
• Possibility of jet interference on incorrectly designed systems• Complexity of manifolds and manifold friction losses• Flow control becomes quite complex
Figure 32 Multi-jet Pelton
As the jets of a multi-jet Pelton are opened successively, flow increases, but manifold losses and pipe wall losses decrease net head, and optimum runner speed decreases. The manifold must therefore be designed carefully to avoid this effect causing major speed changes as well as power loss. The equations detailed below can be used to provide quick estimates of the different geometries of Pelton wheel and nozzles which would be able to give the required output at a particular site. The four main parameters are: the runner diameter, the nozzle diameter, the number of buckets and the number of nozzles.
1. Jet Speed
The jet speed vjet is fixed by the head H available at the nozzles (i.e. the gross head less the penstock losses) and is equal to:
vjet= √(2gh) cv
Where cv is the coefficient of velocity of the nozzle, typically 0.9 - 0.97.

45 | Micro Hydropower System Design Guidelines
2. Runner diameter
Runner diameter is given by the following equation:38 × √H
pelton rpmD runner =
The runtner diameter is often referred to as the pitch circle diameter or PCD.
Worked Example 14
Assuming the net head is 100 metres, the jet velocity is calculated to be:
vjet= √(2 x 9.81 x 100)0.97
vjet= 42.96 m/s
Worked Example 15
Using net head of 100 metres and shaft speed of 1500 rpm, the diameter of runner is calculated to be:
38 × √1001500
D runner =
D runner = 0.25 m or 25 cm
3. Nozzle diameter
If the flow rate is Q, then:
Q = Jet speed × Nozzle area
2gh = ×πD2
noz
4Re-arranging,
Dnoz = 0.54Q0.5
H 0.25

Micro Hydropower System Design Guidelines | 46
Worked Example 16
Given the flow rate for a site is 0.01m3/s, the nozzle diameter is calculated to be:
Dnoz = 0.540.010.5
100 0.25
= 0.017m or 17mm
4. Number of nozzles
If the flow in worked example 15 was 0.1m3/s instead, then the nozzle diameter would need to be 54mm. A jet of this size would require buckets so large that only a few could be fitted around the runner of diameter 0.25m. There is therefore a second constraint on the size of runner, which is that it must carry enough buckets for efficient operation, too few tending to waste water, too many causing interference. To match this constraint, a recommended practice is that ac acceptable ratio of runner diameter to nozzle diameter is 10, although Pelton turbines can be successfully made with ratios in the range 6 to 20.
Rather than increase the runner diameter to meet the jet size, the other option is to spread the flow by using a number of jets. If the number of nozzles is njet, then the equation for the nozzle diameter becomes:
Dnoz = 0.54√QHnet
0.25× 1
√njet
Worked Example 17
With flow rate of 0.1m3/s and net head of 100 meters, 2 jets are planned to be used.
The nozzle diameter is calculated to be:
But even 38mm nozzle diameter is too large for the runner. Fitted with 4 jets, the nozzle diameter will be 27mm.
Dnoz = 0.54√0.11000.25
× 1√4
Dnoz = 27 mm
This is now suitable for the 25cm runner rotating at 1500rpm.
Dnoz = 0.54√0.11000.25
× 1√2
Dnoz = 38 mm
5. Number of buckets
The number of buckets required for efficient operation is generally found using the following equation:
Nbuck = 0.5Drun
Dnoz
+ 15

47 | Micro Hydropower System Design Guidelines
Worked Example 18
With 4 jets, runner diameter of 25cm and nozzle diameter of 27mm, the number of buckets is calculated to be:
Nbuck = 0.5 0.250.027
+ 15
= 20 buckets
6. Bucket Width
For efficient operation, the bucket width should be at least 3 times the jet diameter.
8.4.3 Turgo Turbine
The Turgo turbine is an impulse machine similar to a Pelton turbine. However, the jet is designed to strike the plane of the runner at an angle (typically 20°). In this turbine, water enters the runner through one side and exits through the other. As a consequence of this, the flow that a Turgo runner can accept is not limited by spent fluid interfering with the incoming jet (as in the case of Pelton turbines). Hence a Turgo turbine can have a smaller diameter runner than a Pelton for an equivalent power. It therefore, runs at a higher rpm. Like the Pelton, the Turgo is efficient over a wide range of speeds and needs no seals with glands around the shaft.
The Turgo does have certain disadvantages. Firstly, it is more difficult to fabricate than a Pelton, since the buckets (or vanes) are complex in shape, overlapping, and more fragile than Pelton turbines. Secondly, the Turgo experiences a substantial axial load on its runner which must be met by providing a suitable bearing on the end of the shaft.
Figure 33 The Turgo Turbine
8.4.4 Crossflow Turbines
Cross flow turbines are also called Banki, Mitchell or Ossberger turbines. A crossflow turbine comprises a drum-shaped runner consisting of two parallel discs connected together near their rims by a series of curved blades. A crossflow turbine has its runner shaft horizontal to the ground in all cases (unlike Pelton and Turgo turbines which can have horizontal or vertical orientation). In operation, a rectangular nozzle directs the jet to the full length of the runner. The water strikes the blades and imparts most of its kinetic energy. It then passes through the runner and strikes the blades on exit, imparting a smaller amount of energy before leaving the turbine.

Micro Hydropower System Design Guidelines | 48
The effective head driving the crossflow runner can be increased by the inducement of a partial vacuum inside the casing. This is done by fitting a draught tube below the runner which remains full of tail water at all times. Any decrease in the level induces a greater vacuum which is limited by the use of an air bleed valve in the casing.
Because of the symmetry of a crossflow turbine the runner length can theoretically be increased to any value without changing the hydraulic characteristics of the turbine. Hence, doubling runner length merely doubles the power output at the same speed. The lower the head, the longer the runner becomes, and conversely on high heads the crossflow runner tends to be compact.
There are practical limits to length in both cases. If the blades are too long, they will flex leading quickly to fatigue failure at the junction of blade and disc.
Two major features of the crossflow have led to a considerable interest in this turbine. Firstly, it is a design suitable for a wide range of heads and power ratings. Secondly, it can be fabricated with relatively simple fabrication techniques with ease.
a b
Generator
Shaft
Turbine
Shaft to generator
Water input from penstock
Water outlet to tailwater through draft tube
Figure 34 A Crossflow Turbine
A brief sizing of runner diameter, jet thickness and runner length are given below with appropriate formula:
First, decide on the preferred running speed and calculate the approximate runner diameter:
Drunner = 40√Hnet
cross �ow rpm
The jet thickness is usually between one tenth and one fifth of the runner diameter. It is best to consult the manufacturer on this ratio, which also depends on whether or not a flow control vane is fitted.
tjet = 0.1 × Drunner → 0.2 × Drunner

49 | Micro Hydropower System Design Guidelines
Having estimated , the approximate runner length Lrunner can be found from the orifice discharge equation. The runner length will be equivalent to the jet width:
Q = Anozzle 2gHnet
Q = tjet × jet width × 2gHnet
Q = tjet × Lrunner × 2gHnet
Therefore:Q
tjet 2gHnet
Lrunner =
0.23Qtjet
Lrunner = Hnet
Worked Example 19
A turbine is to be specified for a site with the following characteristics:
Net head (Hnet) 26mGenerator speed 1500rpmFlow Variation from 0.2m3/s to 0.4m3/s
Pulley diameter (turbine) 500mmPulley diameter (alternator) 250mm
If a 500mm pulley is used, the speed of the crossflow turbine is used:
Gear ratio G = alternator rpm / turbine rpm = 2
Crossflow rpm = 1500/2 = 750 rpm
The diameter of the runner comes out to be:
√26750
D runner = 40 = 0.27 m
8.5 Reaction Turbines
Some commonly used reaction turbines are Francis, Propeller and Kaplan. In general, reaction turbines will rotate faster than impulse types given the same head and flow conditions. The propeller will rotate even faster than the Francis (its specific speed is higher). These high speeds imply that reaction turbines can often be directly coupled to an alternator without any speed increasing drive system. Significant savings is possible with the elimination of the drive and also maintenance of the hydro system is simpler.

Micro Hydropower System Design Guidelines | 50
Francis type is suitable for medium heads, while the propeller is more suitable for low heads.
Generally, reaction turbines require more sophisticated fabrication than impulse types, because they involve the use of larger more complicated profiled blades. The extra expense involved can be offset by higher efficiencies and the advantage of high running speeds at low heads from relatively compact machines.
Fabrication constraints make these turbines less attractive for use in micro-hydro in regional countries. Because of the importance of low head micro hydro, propeller machines are generally preferred as they are simple to construct, having non-profiled runner blades.
All reaction turbines are subject to the danger of cavitation, and tend to have poor part flow efficiency.
Cavitation
Cavitation occurs when the static pressure of the liquid falls below its vapor pressure, the liquid boils and large number of small bubbles of vapour are formed. These bubbles mainly formed on account of low pressure are carried by the stream to higher pressure zones where the vapours condense and the bubbles suddenly collapse, as the vapours are condensed to liquid again. This results in the formation of a cavity and the surrounding liquid rushes to fill it. The streams of liquid coming from all directions collide at the centre of cavity giving rise to a very high local pressure. Formation of cavity and high pressure are repeated many thousand times a second. This causes pitting on the metallic surface of runner blades or draft tube. The material then fails by fatigue, added by corrosion.
8.5.1 The Francis Turbine
In a Francis turbine, the runner blades are profiled in a complex manner and the casing is scrolled to distribute water around the entire perimeter of the runner. In operation, water enters around the periphery of the runner, passes through the guide vanes and runner blades before exiting axially from the centre of the runner. The water imparts most of its ‘pressure’ energy to the runner and leaves the turbine via a draught tube.
The Francis turbine is fitted with guide vanes as shown in Figure 35. These regulate the water flow as it enters the runner, and usually are linked to a governor system which matches flow to turbine loading, in the same way as a Pelton spear valve. As the flow is reduced, the efficiency of the turbine drops off.
Figure 35 The Francis Turbine(Source: Simscale
Source: CMCHYDRO)

51 | Micro Hydropower System Design Guidelines
8.5.2 The Propeller and Kaplan Turbine
The basic propeller turbine consists of a propeller, similar to a ship’s propeller, fitted inside a continuation of the penstock tube, its shaft taken out where the tube changes direction. Usually 3 to 6 blades are used, 3 in the case of very low head units. Water flow is regulated by the use of swivelling gates (wicket gates) just upstream of the propeller. The part-flow efficiency tends to be poor. This kind of propeller turbines is known as a ‘fixed-blade axial flow’ turbine, since the geometry of the blade does not change. Although, traditionally the propeller is profiled to optimize the effect of pressure lift forces acting on it, designs have been produced with flat section blades which offer less efficiency but are more easily fabricated. This kind of design can be considered seriously for micro-hydro applications where low cost and ease of fabrication is primary. It is also possible to consider casting the propeller casing in concrete.
Large scale hydro sites make use of more sophisticated versions of the propeller turbine. Swivelling (or varying the pitch) of the propeller blades simultaneously with wicket gate adjustment has the effect of maintaining high efficiency under part-flow conditions. Such turbines are known as ‘variable pitch’ propeller turbines or Kaplan turbines. Wicket gates are carefully profiled to induce tangential velocity or ‘whirl’ in the water.
Figure 36 The Kaplan Turbine(Source: Way2Science)
8.5.3 Draught Tubes
Reaction turbines and the partially evacuated crossflow can benefit from an enclosure below the runner known as the draught tube. One purpose of the enclosure is to maintain a column of water between the turbine outlet and the downstream water level. The second purpose is the recovery of velocity energy or kinetic energy in the water leaving the runner. Since water has to leave the turbine runner at relatively high velocity in order to exit from the turbine, it still possesses a substantial proportion of the available kinetic energy. To recover this energy efficiently, the water velocity must be reduced gradually while friction losses are minimized. If the velocity were not reduced, water would jet out of the turbine outlet into the tailrace and energy would be lost as turbulence in the tailrace.
9. GoverningGovernors are used to control the speed of turbines. Some governing or control of the turbine speed is often required to ensure proper operation of the mechanical or electrical end use machinery.
When electricity is generated at a remote site by a synchronous generator, its frequency is determined by the speed of the generator and the number of poles. For example, a four-pole generator, generates two cycles per revolution of it shaft.

Micro Hydropower System Design Guidelines | 52
To generate 50 cycles/second or 50Hz, it must run at 25 revolutions/second which is 1500 revolutions/min. If this speed increases or decreases, the frequency generated also increases or decreases. Although, most generators have voltage regulation, the voltage output is also affected somewhat by speed changes. Electrical equipment is designed to operate at a specific voltage and frequency. Operation outside these voltages/ frequencies will cause serious damage to the generator. The electric motor will run hot if the frequency is too low or may burn out if voltage is low.
The governing devices for hydro adjust the flow of water through the turbine to vary the water power input on the plant. As more power is required of the plant, the load on the generator increases, reducing speed. Through either mechanical means or electrical means, the governor senses this speed reduction and it then opens the appropriate valves to admit more water. Thus, this increases the power through the turbine to meet the increased demand. Similarly, as the demand comes down, the governor senses the increase in speed and causes the valves to reduce water flow through the turbines.
9.1 Specifying the Governor
In order to specify a governor, it is necessary to find out the tolerance of the end use machinery to variations in frequency and voltage. It is recommended that for an all-purpose electrical supply system, the voltage and frequency tolerances should be:
Voltage: +/- 7% of rated valueFrequency: up to 5% above, but not below the rated value.
In a small system, the voltage and frequency may go outside these limits when loads are switched on or off, but this does not matter so long as the fluctuations are not excessive and do not last for more than two or three seconds.
The approaches to governing may be classed in two categories:
• Conventional• Non-conventional
9.2 Conventional Methods
The older conventional governor systems, mainly mechanical and hydraulic had been later followed by electrical and electronic systems to control turbine output power. The more recent load controllers use electronic control to impose a constant electrical load on the generator.
Some conventional methods that could be used are listed below.
9.2.1 Oil Pressure Governor
Oil pressure governors are so named because oil kept under pressure by a pump is used to drive a piston/servomotor, which in turn moves the flow-control mechanisms. The cost and sophistication of oil pressure governors detract from their suitability in rural areas. They should be considered only where minimizing water flow is important such as when water storage reservoirs are available. Most micro hydro do not have storage facilities.
9.2.2 Mechanical GovernorsWith micro-hydro power turbines, the forces needed to operate guide vanes, inlet valves or jet deflectors can be quite small. In these cases, direct acting mechanical governors can be used without the need for additional hydraulic actuators. Such governors could be used mainly to move jet deflectors on Turgo and Pelton wheels. They are normally not used on crossflow or Francis machines because of the higher forces required.
Although cheaper than the oil pressure governor, the mechanical governor cannot usually control flow and has been largely superseded by electronic load control governors.

53 | Micro Hydropower System Design Guidelines
9.2.3 Load Controller
The load controller is an electronic device that maintains a constant electrical load on a generator in spite of changing user loads. This permits the use of a turbine with no flow-regulating devices and their governor control system. The flow through the turbine is set at a constant value and the load controller ensures that a constant electrical load is supplied by the generator. The turbine power output is then constant and thus its speed is constant. The load controller maintains a constant generator output by supplying a secondary ‘ballast’ load with the power not required by the main load.
Load controllers require no maintenance and have no moving parts. Load controllers alone cannot be used with schemes that have to use a limited quantity of water efficiently.
9.2.4 Induction Generator Controller
When a load controller is used to govern the speed of a turbine/generator set, an automatic voltage regulator will also normally be required to ensure a steady voltage level when the main load factor changes. Recently, the use of induction generators in place of synchronous generators has led to the development of an induction generator controller. This is designed specifically for use with induction generators and combines the functions of both a load controller and an automatic voltage regulator. It thus controls the speed of a turbine/induction generator set in a similar way to a load controller.
9.3 Non-conventional Governing Systems
Non-conventional approaches permit access to electricity with reduced cost and with reduced sophistication. In rural areas, if the demand grows and the sophistication of consumers increases, a load controller can be included with minimum or no modification to the existing system.
If a high-quality electrical supply is required for sensitive equipment, then one of the automatic methods should be used.
9.3.1 Constant Load
This approach permits only the use of fixed loads, such as village lighting and is the simplest method of ensuring constant frequency and voltage. No switches are included in the circuit. Power is switched on by opening the valve sufficiently wide to attain nominal frequency and voltage. Closing the valve when power is no longer required.
9.3.2 Manual LoadWith this approach, an operator is required to maintain a relatively constant frequency manually. This can be done by adjusting:
• The flow of water to the turbine; or• The total load imposed on the generator
It is important to note that operator does not need to make adjustments continually as small deviations from nominal frequencies might not have adverse effect on the plant.
10. Drive System Considerations Drive systems comprise the generator shaft, turbine shaft, the bearings which support those shafts, couplings to connect shafts, any extra shafts, bearings, pulleys, belts, gearboxes or other components used to change speed or orientation of the shafts. The function of the drive system is to transmit power from the turbine to the generator at the correct speed for the generator and in suitable direction.
Some commonly used arrangements of drive systems that can be used are discussed below. Irrespective of the arrangement chosen, the drive system must carry the required loads. Additionally, the turbine, generator and foundations must be able to carry the loads imposed by the drive. Common consumable components in drive systems are bearings and belts. The manufacturer’s/supplier’s catalogues must be consulted prior to use of bearings and belts.

Micro Hydropower System Design Guidelines | 54
10.1 Direct-coupled drive system
Some of the important points to this system are:
• It is compact, simple and efficiency approaches almost 100%• Drive imposes no additional loads on bearings• Both turbine and generator may be bolted to concrete foundation or rigid structure at same height• Alignment of shafts must be correct to prevent failure of coupling or bearings• Flexible in-line coupling is needed• No speed change between turbine and generator is possible
Generator
In-line coupling
Turbine runner
Turbine bearings
Figure 37 Direct coupled drive system (Source: Practical Action)
10.2 Wedge belt drive system
Some of the important points to this system are:
• An alternative arrangement could have flat belt instead of wedge belts• Generator is mounted on side rails to obtain belt tension• This drive applies loads to generator and turbine bearings• Turbine and generator may run at different speeds• Turbine and generator may be at different heights• Direction of rotation should pull on the lower part of the belts

55 | Micro Hydropower System Design Guidelines
Generator
Belts
Slide rails
Turbine runner
Figure 38 Wedge belt drive system(Source: Practical Action)
10.3 Wedge belt drive system with extra bearings
Some of the important points to this system are:
• Alternative arrangement could have flat belt instead of wedge belts• Turbine may have an extra shaft and bearings for the generator• The generator extension shaft must be removable from the bearings to enable belts to be changed• Turbine and generator may run at different speeds• Flexible in-line coupling required• Direction of rotation should pull on the lower part• Belt tensioning must be achieved with a jockey pulley
Turbine runner
Bearing
Subframe
Generator pulleySlide rails
GeneratorTurbine bearing Turbine pulley
In-line coupling
Figure 39 Wedge belt drive system with extra bearings(Source: Practical Action)
10.4 Quarter turn belt drive
Some of the important points to this system are:
• Alternative arrangement could have wedge belts in place of flat belt• Generator mounted on slide rails to obtain belt tension

Micro Hydropower System Design Guidelines | 56
• Extra bearings, shafts and couplings may be used• Turbine and generator pulleys must be aligned with care• Not always permissible – always consult manufacturer
GeneratorTurbine pulley
Slide rails
Figure 40 Quarter turn belt drive(Source: Practical Action)
10.5 Direct coupled turbine and geared motor used as an alternator
Some of the important points to this system are:
• Geared motor units are available from many manufacturers in wide ranges of powers and speed ratios. Various types of gears are used: spur gears, helical gears and bevel gears which are suited to speed increasing drives. Worms and worm wheels are not suitable because they will not run backwards.
• The cost of a geared motor unit is significantly less than cost of separate motor and gearbox• The gearbox provides the speed change between turbine and generator.
Induction motor and gearbox used as alternator
Gearbox
In-line coupling
Turbine runner
Figure 41 Direct coupled turbine and geared motor used as an alternator(Source: Practical Action)
10.6 Turbine rotor mounted on generator shaft
Some of the important points to this system are:
• The turbine and generator speed match• There has to be clearance between turbine and generator to avoid water splash interference• The bearings should be able to tolerate the side load of the turbine• Alternatively, a geared motor unit may be used as an alternator

57 | Micro Hydropower System Design Guidelines
Worked Example 20
An alternator rated at 50kW output, 1500 rpm and 70% efficiency is to be driven by a turbine running at 450rpm.
Power transmitted to alternator
This will be the power required of the drive.
Speed ratio:1500450
= = 3.33
The driving shaft rotates slower than the driven shaft, it is therefore a speed-increasing shaft.
The following list indicates which drive arrangements should be considered:
1. Direct-coupled drive system – unsuitable2. Wedge belt drive system – suitable3. Wedge belt drive system with extra bearings – suitable4. Quarter turn belt drive – suitable, however consult manufacturer.5. Direct coupled turbine and geared motor used as an alternator – suitable but expensive6. Turbine rotor mounted on generator shaft – unsuitable
The system could utilise arrangement 2 but also 3 and 4 if necessary.
Output PowerEfficiency
= = 500.7
= 71 kW
Turbine housing
Figure 42 Turbine rotor mounted on generator shaft(Source: Practical Action)

Micro Hydropower System Design Guidelines | 58
Worked Example 21
Using the information provided in worked example 20, the belt drive is to be selected.Turbine shaft speed 450rpmGenerator shaft speed 1500rpm
Therefore,
Speed ratio = 3.33 : 1 increasingGenerator output 50kWGenerator efficiency 70%
Therefore,
Power transmitted = 71kW
Using, P = Torque x (2π ω/60)Where P = power in watts and ω is angular speed in rpm
Torque = P/((2xπ x1500)/60)71000
( 2 × π × 1500)/60Torque at the generator = = 452 Nm
Further, manufacturers catalogue must be used when designing a belt drive
11. Micro Hydro Generator SelectionThe basic parameters to be considered in the selection of a suitable type of electrical generator are:i. Type of desired output: a.c. or d.c. constant frequency or variable frequency.ii. Hydraulic turbine operations mode.iii. Type of electrical load: Interconnection with the national grid, storage in batteries or an isolated system supplying variety of household or industrial loads.
For an isolated micro-hydro station supplying all the power to the load, the number and size units are chosen considering the load curve of the power system to be supplied and should represent the best compromise between the capacity factor and the load factor.
Actual energy produced or supplied in time tMaximum plant rating × t
Capacity factor =
Average loadMaximum load
& Load factor =
A key design role for micro-hydro is “Design for the highest possible capacity factor”, ideally unity or 1. Load factor should be kept high as well.
In addition to this consideration, there is the economy that can be affected by choosing hydro-units of equal size, from the point of view of hydraulic equipment, penstock, draft tube and construction details. The generator specifications for micro-hydro station include mainly the output power in Kilowatts, Kilovolt-ampere capacity, number of phases, frequency, connection of stator winding, voltage, current, power factor, speed, method of cooling, temperature rise, type of excitation, excitation voltage and machine reactance. Micro-hydro generators are low speed machines of salient-pole type, having a

59 | Micro Hydropower System Design Guidelines
large number of poles, a large diameter and a short-rotor. The power factor for which the generator is designed up to (0.95) lagging. The generator speed is limited by the turbine speed, which depends on the specific speed of the particular type of the turbine. The main dimensions of the generator are the diameter, the air-gap and the length of the stator core. The output of the generator in (kVA) depends on these main dimensions and the speed of the machine.
An a.c. system has many advantages which make it a good choice for all, mainly small and very specialized schemes. The designer of an a.c. system must first decide between 3-phase and single phase. In practice, the decision as to whether to adopt a single phase or a 3 phase depends on an estimate of the relative costs including the saving in copper and machine costs bearing in mind the degree of load balance that is likely to be achieved.
As an approximate rule, therefore, systems up to 10kW may be single phase, while systems over 5kW may be 3-phase. If a 3-phase system is adopted, it should be noted that, for safety reasons, there are limitations on the way single phase loads can be connected to achieve load balancing across the phases.
The rating and thus size of any electrical machine is defined by its volt-ampere (VA) rating – the product of its rated terminal voltage and rated (full-load current). It is essential to specify ratings in apparent power (VA) value since the generator is subject to loads with variable power factor. The apparent power is given by:
S = VI and S = True Power/power factor (single phase)S = 3VLIL (3 phase)
When a new scheme is considered, it is necessary to make a prediction of the load power factor. Always aim for a high-power factor ensuring lower system losses in the range (0.8 – 1). An example of brieftechnical specifications of hydro generator is attached as Annex 3.

Micro Hydropower System Design Guidelines | 60
Worked Example 22
A micro hydro generating system for a village of ten houses is being designed. It is estimated that each house will have an average total load, consisting of lights, radios and cooking pots, of 1kW. There is in addition a small carpenter’s workshop which has small single-phase loads giving a maximum demand of 1.5kW and also a requirement for a 0.5kW single phase induction motor. The workshop operates during the day and in the evening. The potential micro hydro power continuously available is 15kW.
It may be that all the houses will not be consuming 1kW at the same time. You may be able to predict in most occasions based on study of load consumption, in this case, it is assumed that the maximum demand is only 60% of the full installed capacity of 10 houses x 1kW each.
(Note that many village hydro schemes have diversity factors (see below) of close to 100%, so do not always use 60% as a rule of thumb)
Diversity factor = maximum demand / sum of all possible loads = 60% (Assumed for this case)
Therefore, maximum demand of the households is: 0.6 x 1kW x 10 = 6kWFor carpenter’s workshop, take into account motor losses, assume induction motor is 80% efficient (i.e. power input = 0.5/0.8 = 0.625 kWThe carpenter’s workshop thus has a maximum demand of: (1.5 + 0.625) kW = 2.125 kW
Therefore, the minimum capacity of generator = (6 + 2.125) = 8.125kW
Allowing for 25% additional capacity for growth in load and for good motor starting – 1.25 x 8.125kW = 10.2kW
Always consider load power factor in power rating calculations.
Considering power factor of 0.8, the kVA rating is given by: S = P / pf = 10.2 / 0.8 = 12.75kVa
For this capacity, a 3-phase generator is recommended, however good phase balancing is required.
A possibility is:
Red phase: Workshop loads + 2 houses = 2.125kW + 2kW = 4.125kWWhite/Yellow phase: Four houses – (4 x 1000W = 4000W = 4kW)Blue phase: Four houses – 4000W – (4 x 1000W = 4000W = 4kW)

61 | Micro Hydropower System Design Guidelines
Worked Example 23
The estimated load to be supplied by a micro-hydro generating scheme consists of 20 houses, and an associated mechanical workshop and dairy. It is expected that each house will be equipped with 3 x 9W LED lamps at power factor of 0.85 and has a 400W small appliance requirement (assuming power factor of 0.85). In addition, six of the houses have 100W rating refrigerator at power factor of 0.85. The workshop is to be equipped with two machines each driven by a 0.5kW induction motor (efficiency of 85%) at power factor of 0.8 and lighting is to be provided by 6 x 36W fluorescent tubes at power factor of 0.85. The dairy will use a 1kW induction motor/pump (efficiency of 85%) at power factor of 0.8 and a 2kW milk cooler at power factor of 0.9. In this case, lighting will be provided by 4 x 36W fluorescent tubes at power factor of 0.85. It is assumed that all the loads may be connected at once, that is, the ‘diversity’ factor is 100%.
Let’s calculate the total true power (W), the apparent power (VA) and the power factor which the overall load will impose on the generator.
There are no purely resistive loads, as all loads are partially inductive.Using: S = P/power factor, the apparent power can be calculated.
Table 4 Partially Inductive Loads
Loads True Power (W) Apparent Power (VA)
LED lamps at pf = 0.85 20 x 3 x 9W (Power factor = 0.85) = 540W
= 540/0.85 = 635VA
Small Power appliances at pf = 0.85
20 x 400 = 8000W =8000/0.85 = 9412VA
Refrigerator at pf = 0.85 6 x 100 = 600W = 600/0.85 = 706VA
Induction Motor (efficiency of 85%) at pf of 0.8
Pin = (2 x 0.5)/0.85 = 1.2kW = 1200W
True Power = 1200W
= 1200/0.8 = 1500VA
Fluorescent tubes (6 + 4 = 10) at pf of 0.85
10 x 36 = 360W = 360/0.85 = 424VA
1kW induction motor/pump (efficiency of 85%) at pf of 0.8
Pin = 1/0.85 = 1.2kW = 1200WTrue Power = 1200W
= 1200/0.8 = 1500VA
Milk Cooler at pf of 0.9 2000W = 2000/0.9 = 2222VA
Total 13,900W 16,399VA
Using the power triangle, the overall load parameters could be calculated.
Total True (Real) Power = 13,900WTotal Apparent Power = 16, 399VAOverall Power factor = P/S = 13,900/16,399 = 0.848 lagging, which is fairly good. (Power factor must be close to 1). The total apparent power determines the size of the generator: it must be rated at more than 16.4kVA. An additional 25% must be added to allow for motor starting currents and to extend the life of the alternator. Based on the resource available, provisions can also be made for load growth.
Thus, 1.25 x 16.4kVA = 20.5kVA 3 phase generator could be used. At 0.85 power factor, this is 17.43kW.
The real power load, and the generator efficiency, determine the size of the turbine. The manufacturer of generator may quote for say 85% generator efficiency. The turbine must therefore be capable of providing the input power based on this. (17.43/0.85 = 20.5kW).
The final choice should be based upon analysing the part-load efficiency curve for generator and turbine in discussion with the manufacturer and the limitations.

Micro Hydropower System Design Guidelines | 62
Annex 1 Chart Showing Coverage of Hydro Turbines
Source: JICA report

63 | Micro Hydropower System Design Guidelines
Annex 2 Turbine-Generator Group Specifications - Examples

Micro Hydropower System Design Guidelines | 64

65 | Micro Hydropower System Design Guidelines
Annex 3 Hydroelectric Generator Specifications - Example