Hydropower Technology for Sustainable Energy Generation in ...
31
water Article Hydropower Technology for Sustainable Energy Generation in Wastewater Systems: Learning from the Experience Rosa M. Llácer-Iglesias * , P. Amparo López-Jiménez and Modesto Pérez-Sánchez Citation: Llácer-Iglesias, R.M.; López-Jiménez, P.A.; Pérez-Sánchez, M. Hydropower Technology for Sustainable Energy Generation in Wastewater Systems: Learning from the Experience. Water 2021, 13, 3259. https://doi.org/10.3390/w13223259 Academic Editors: JoséÁlvarez-García, Amador Durán-Sánchez and María de la Cruz del Río-Rama Received: 20 October 2021 Accepted: 15 November 2021 Published: 17 November 2021 Publisher’s Note: MDPI stays neutral with regard to jurisdictional claims in published maps and institutional affil- iations. Copyright: © 2021 by the authors. Licensee MDPI, Basel, Switzerland. This article is an open access article distributed under the terms and conditions of the Creative Commons Attribution (CC BY) license (https:// creativecommons.org/licenses/by/ 4.0/). Hydraulic and Environmental Engineering Department, Universitat Politècnica de València, 46022 Valencia, Spain; [email protected] (P.A.L.-J.); [email protected] (M.P.-S.) * Correspondence: [email protected] Abstract: Hydropower is a well-known technology, applied worldwide for electricity generation from renewable sources. Within the current framework, some studies have started to consider its application to existing urban water systems, to harness an excess of energy that otherwise would be wasted. This research sought to determine a methodology to assess the potential of hydropower application to wastewater treatment plants (WWTPs), regarding different aspects of sustainability. Firstly, previously developed methodologies for potential assessment in this sector at a country level were analyzed. Secondly, data from existing real case studies were gathered from publicly available documents and a theoretical analysis of their actual performance was conducted to validate assumptions made in the previous methodologies. As a result, the proposed new approach suggests adapting methodologies for potential assessment at a lower level, considering possible driving factors, other than economic feasibility. To define the study area, the management model scope should be considered. The power to determine the cut-off point for a WWTP to be considered as a potential site, is proposed to be lowered according to technical feasibility. Additionally, bearing in mind the sustainability concept, social or environmental factors should also be introduced in the methodology, tailored to the region being assessed. This novel perspective could provide a closer approach to the most likely decision-making level for these kinds of strategies in the wastewater industry. Keywords: energy recovery; hydraulic machinery; hydropower; potential assessment; real application; wastewater management; wastewater treatment plants 1. Introduction The United Nations 17 Sustainable Development Goals (SDGs) establish a universal agenda to call for action and achieve sustainability in essential aspects of human life, such as hunger or health [1,2]. One of them is SDG 6 ‘Clean water and sanitation’, which includes targets that are also critical for achieving other SDGs [1,3]. At the same time, some SDGs demand actions to preserve natural resources, provide affordable and clean energy and tackle climate change [2]. Although the UN annual climate summits (known as Conference of the Parties or COPs) started almost 3 decades ago, tackling climate change has become a global priority in most recent years, particularly since the Paris Agreement (COP21) in 2015. Under this Agreement countries are being asked to significantly reduce their greenhouse gas (GHG) emissions by 2030 aiming at net zero carbon emissions by 2050 and the results from COP26 this year will be decisive to start making this Agreement operational. To achieve these goals, countries will be encouraged to implement several strategies, including investments in renewable energy generation technologies [2]. Therefore, sustainable management of water networks and treatment facilities is becoming a crucial issue for policy makers, as the needs are expected to soar in the near future [4]. Water should not be regarded just as a consumer product, but as a valuable resource that must be protected, a social responsibility [5]. As such, opportunities to improve wastewater management should not be neglected [4,6]. Water 2021, 13, 3259. https://doi.org/10.3390/w13223259 https://www.mdpi.com/journal/water
-
Upload
khangminh22 -
Category
Documents
-
view
0 -
download
0
Transcript of Hydropower Technology for Sustainable Energy Generation in ...

water
Article
Hydropower Technology for Sustainable Energy Generation inWastewater Systems: Learning from the Experience
Rosa M. Llácer-Iglesias * , P. Amparo López-Jiménez and Modesto Pérez-Sánchez
�����������������
Citation: Llácer-Iglesias, R.M.;
López-Jiménez, P.A.; Pérez-Sánchez,
M. Hydropower Technology for
Sustainable Energy Generation in
Wastewater Systems: Learning from
the Experience. Water 2021, 13, 3259.
https://doi.org/10.3390/w13223259
Academic Editors:
José Álvarez-García,
Amador Durán-Sánchez
and María de la Cruz del Río-Rama
Received: 20 October 2021
Accepted: 15 November 2021
Published: 17 November 2021
Publisher’s Note: MDPI stays neutral
with regard to jurisdictional claims in
published maps and institutional affil-
iations.
Copyright: © 2021 by the authors.
Licensee MDPI, Basel, Switzerland.
This article is an open access article
distributed under the terms and
conditions of the Creative Commons
Attribution (CC BY) license (https://
creativecommons.org/licenses/by/
4.0/).
Hydraulic and Environmental Engineering Department, Universitat Politècnica de València,46022 Valencia, Spain; [email protected] (P.A.L.-J.); [email protected] (M.P.-S.)* Correspondence: [email protected]
Abstract: Hydropower is a well-known technology, applied worldwide for electricity generationfrom renewable sources. Within the current framework, some studies have started to consider itsapplication to existing urban water systems, to harness an excess of energy that otherwise wouldbe wasted. This research sought to determine a methodology to assess the potential of hydropowerapplication to wastewater treatment plants (WWTPs), regarding different aspects of sustainability.Firstly, previously developed methodologies for potential assessment in this sector at a countrylevel were analyzed. Secondly, data from existing real case studies were gathered from publiclyavailable documents and a theoretical analysis of their actual performance was conducted to validateassumptions made in the previous methodologies. As a result, the proposed new approach suggestsadapting methodologies for potential assessment at a lower level, considering possible driving factors,other than economic feasibility. To define the study area, the management model scope should beconsidered. The power to determine the cut-off point for a WWTP to be considered as a potentialsite, is proposed to be lowered according to technical feasibility. Additionally, bearing in mind thesustainability concept, social or environmental factors should also be introduced in the methodology,tailored to the region being assessed. This novel perspective could provide a closer approach to themost likely decision-making level for these kinds of strategies in the wastewater industry.
Keywords: energy recovery; hydraulic machinery; hydropower; potential assessment; realapplication; wastewater management; wastewater treatment plants
1. Introduction
The United Nations 17 Sustainable Development Goals (SDGs) establish a universalagenda to call for action and achieve sustainability in essential aspects of human life,such as hunger or health [1,2]. One of them is SDG 6 ‘Clean water and sanitation’, whichincludes targets that are also critical for achieving other SDGs [1,3]. At the same time,some SDGs demand actions to preserve natural resources, provide affordable and cleanenergy and tackle climate change [2]. Although the UN annual climate summits (known asConference of the Parties or COPs) started almost 3 decades ago, tackling climate changehas become a global priority in most recent years, particularly since the Paris Agreement(COP21) in 2015. Under this Agreement countries are being asked to significantly reducetheir greenhouse gas (GHG) emissions by 2030 aiming at net zero carbon emissions by2050 and the results from COP26 this year will be decisive to start making this Agreementoperational. To achieve these goals, countries will be encouraged to implement severalstrategies, including investments in renewable energy generation technologies [2].
Therefore, sustainable management of water networks and treatment facilities isbecoming a crucial issue for policy makers, as the needs are expected to soar in the nearfuture [4]. Water should not be regarded just as a consumer product, but as a valuableresource that must be protected, a social responsibility [5]. As such, opportunities toimprove wastewater management should not be neglected [4,6].
Water 2021, 13, 3259. https://doi.org/10.3390/w13223259 https://www.mdpi.com/journal/water

Water 2021, 13, 3259 2 of 31
The primary purpose of wastewater treatment plants (WWTPs) is purifying collectedsewage, to achieve an effluent that can be safely discharged into receiving water bodies [7,8].As an essential service, these facilities deserve to be provided with the best availabletechnologies to protect the environment, with affordable solutions to do so in a sustainableway [4]. This implies obtaining a high-quality effluent as a first goal, whilst simultaneouslyoptimizing the use of other resources [9,10]. Since the electricity demand in wastewatertreatment is usually very high [10,11], actions are needed to deal with this environmentalaspect including both efficiency improvement and renewable energy generation [12,13].Figure 1 summarizes the global water cycle with main energy flows.
Water 2021, 13, x FOR PEER REVIEW 2 of 32
The primary purpose of wastewater treatment plants (WWTPs) is purifying collected sewage, to achieve an effluent that can be safely discharged into receiving water bodies [7,8]. As an essential service, these facilities deserve to be provided with the best available technologies to protect the environment, with affordable solutions to do so in a sustaina-ble way [4]. This implies obtaining a high-quality effluent as a first goal, whilst simulta-neously optimizing the use of other resources [9,10]. Since the electricity demand in wastewater treatment is usually very high [10,11], actions are needed to deal with this environmental aspect including both efficiency improvement and renewable energy gen-eration [12,13]. Figure 1 summarizes the global water cycle with main energy flows.
Figure 1. Water cycle diagram.
Concerning renewable energies, generation from biogas is usually the main option considered for WWTPs [14–16]. Biogas production certainly is a very profitable technol-ogy for this industry [17–19] and ongoing research is continuously improving its perfor-mance and possibilities [20–22]. Nevertheless, the still high complexity of the anaerobic processes required to generate biogas usually limits their application only to the largest plants [23,24]. For example, in [25] the number of WWTPs with generation of biogas from anaerobic digestion in USA was estimated to be around 1240 plants out of 15,000, whereas in France [26] only 97 out of almost 20,000 WWTPs applied anaerobic digestion in 2018. Many countries worldwide show a similar profile, with few large plants and a high num-ber of small ones where biogas generation is not likely [4,8,24].
In addition, even though the high number of small plants usually does not represent a very high percentage of the volume of wastewater treated in a country, the negative effects of the economy of scale is frequently observed on their energy consumption figures (as kWh energy consumed/m3 wastewater treated) [10,24]. Hence, their share in energy consumption is often larger than in volume of wastewater [8].
Therefore, the number of small WWTPs with these conditions is huge worldwide and expected to rapidly increase in upcoming years [27]. Simultaneous increasing demand of water and higher protection of the aquatic environment will require new installations too [4]. Many of them will likely be located in rural areas, as in most countries existing wastewater treatment planning has focused on larger urban agglomerations first [4,26]. Possible trends to decentralized sanitation systems would also increase the proportion of smaller plants [28–30]. Thus, other renewable energy options should also be explored to provide simpler alternatives for small plants [31]. Even, as observed in recent studies, they could be applied as complementary systems for the largest ones [32,33].
Renewable energy can be generated from external sources or recovered from the en-ergy embedded in wastewater. As mentioned, for electricity generation chemical recovery through the biogas produced in anaerobic processes is deemed to be the main option but directly depends on those processes and the facilities are complex to operate. Other ma-ture technologies that are frequently being considered at WWTPs, are solar or wind, which are external sources that do not depend on the process, but on the particular char-acteristics of the site. Their potential and performance directly depend on the site, its
Figure 1. Water cycle diagram.
Concerning renewable energies, generation from biogas is usually the main optionconsidered for WWTPs [14–16]. Biogas production certainly is a very profitable technologyfor this industry [17–19] and ongoing research is continuously improving its performanceand possibilities [20–22]. Nevertheless, the still high complexity of the anaerobic processesrequired to generate biogas usually limits their application only to the largest plants [23,24].For example, in [25] the number of WWTPs with generation of biogas from anaerobic diges-tion in USA was estimated to be around 1240 plants out of 15,000, whereas in France [26]only 97 out of almost 20,000 WWTPs applied anaerobic digestion in 2018. Many countriesworldwide show a similar profile, with few large plants and a high number of small oneswhere biogas generation is not likely [4,8,24].
In addition, even though the high number of small plants usually does not representa very high percentage of the volume of wastewater treated in a country, the negativeeffects of the economy of scale is frequently observed on their energy consumption figures(as kWh energy consumed/m3 wastewater treated) [10,24]. Hence, their share in energyconsumption is often larger than in volume of wastewater [8].
Therefore, the number of small WWTPs with these conditions is huge worldwide andexpected to rapidly increase in upcoming years [27]. Simultaneous increasing demandof water and higher protection of the aquatic environment will require new installationstoo [4]. Many of them will likely be located in rural areas, as in most countries existingwastewater treatment planning has focused on larger urban agglomerations first [4,26].Possible trends to decentralized sanitation systems would also increase the proportion ofsmaller plants [28–30]. Thus, other renewable energy options should also be explored toprovide simpler alternatives for small plants [31]. Even, as observed in recent studies, theycould be applied as complementary systems for the largest ones [32,33].
Renewable energy can be generated from external sources or recovered from the en-ergy embedded in wastewater. As mentioned, for electricity generation chemical recoverythrough the biogas produced in anaerobic processes is deemed to be the main option butdirectly depends on those processes and the facilities are complex to operate. Other maturetechnologies that are frequently being considered at WWTPs, are solar or wind, which areexternal sources that do not depend on the process, but on the particular characteristics ofthe site. Their potential and performance directly depend on the site, its surroundings and

Water 2021, 13, 3259 3 of 31
its climatic conditions. The main advantages of hydropower are simplicity, flexibility anduniversal application, without interfering in the treatment process or with the surroundingenvironment [28–31].
1.1. Management Models and Renewable Energy Strategies in the Wastewater Industry
Several stakeholders must be involved for the effective implementation of new tech-nologies to improve energy performance in the wastewater sector [5,34,35]. Global policiesand incentives are usually promoted by national governments with competences for man-agement of water services [5]. Like the pioneer plan in Korea proposed a decade ago,specifically aimed at a reduction of GHGs emissions in WWTPs [36,37] or the recentlyproposed global plan for improving efficiency in the wastewater sector in Spain [38]. How-ever, although national or even supranational plans might establish basic guidelines, theinitiative to actually identify and evaluate the most suitable options and to implementmore specific strategies often lies at lower geographical levels [5]. Examples of this can befound in a number of countries, like the study for WWTPs in Madrid region in Spain [39],for Canton de Vaud in Switzerland [40] or for Oregon in USA [41].
There is a wide range of water management models in different countries and evenin different regions within a country [5], with regional organisms, basin agencies andmunicipalities frequently playing important roles as well, the latter often grouped inmulti-municipal entities [4,35]. With that, the structure for wastewater governance can becomplex and at the same time, the number of WWTPs to manage by the same organismor organization can range from one, to several and sometimes a few hundred plants [4,5].As a result, the number of stakeholders involved and the level where the decision-makingprocess for the implementation of renewable energy technologies at a particular planttakes place, can vary significantly [42,43]. In addition to the regional examples, at privatelevel, similar initiatives from water corporations managing a group of plants from a certaingeographical area, are also arising, such as those in Portugal [44] or Spain [45].
Therefore, to assess potential application of a renewable energy technology in thissector, it can be especially relevant to identify the decision-making level for the facilitiesincluded within the study area considered.
1.2. Hydropower Technology for Energy Generation in Wastewater Systems
One of the options to consider might be hydropower, where electricity can be gener-ated from the mechanical energy provided by wastewater. In this way, some of the energyembedded in the wastewater, that otherwise would be wasted, could be harnessed [46].However, as observed by some researchers [47–49] in the urban water industry there is ageneral lack of awareness and knowledge about this possibility.
Hydropower is a well-known technology for renewable energy generation for elec-tricity supply and more recently has started to be studied at a small-scale as a possiblesolution for energy recovery at existing water systems [50–52], including WWTPs [53,54].There is no consensus about the classification of hydropower systems according to theirsize or capacity. For example, within European countries, the following ranges are usuallyconsidered [55]: (i) Large-hydro, with power over 10 MW; (ii) Small-hydro, from 1 MW upto 10 MW; (iii) Mini-hydro, from 100 kW to 1000 kW; (iv) Micro-hydro, from 5–10 kW to100 kW; (v) Pico-hydro, up to 5 kW. Meanwhile, the limit between large- and small-hydrocan be as great as 30 or 50 MW in countries such as the USA, China or India [56–58]
The mini-hydro range usually establishes the limit between the larger hydro systemsfeeding electricity grids and stand-alone systems, not connected to the grid, providingpower for self-consumption in rural or remote areas [59–61].
Previously published academic research on hydropower application to wastewatersystems, either developed and applied methodologies for global potential assessment at acountry [62,63], or multi-country level [64], or conducted individual feasibility studies ata plant level, experimental as in [65] or theoretical as in [53]. However, no methodologyhas been proposed to be applied for potential assessment at an intermediate level. None
Water 2021, 13, 3259 4 of 31
of these methodologies take into account that in the wastewater industry there could beother important decision-making stakeholders at an intermediate level between individualplant and country level. Direct application of the proposed methodologies at that levelmight not provide these stakeholders with suitable and complete information for theirdecision-making processes. Therefore, to be applied at that level a methodology with adifferent approach is needed. Neither the actual performance of existing sites has beenanalyzed so far, to be considered in the design of the methodologies.
Moreover, all these studies are usually focused on technical and economic aspectsonly and the identified global potential for this sector is usually low [64,66]. Environmentalassessment in this application has already been studied [67–69]. However, this aspect hasnot been integrated into the decision-making process yet. Only recently have some authorsstarted to suggest the introduction of additional driving factors, other than economicfeasibility, in studies of hydropower potential, with a broader perspective based on thesustainability concept [6,61,70]. In their recent work Adeyeye et al. [49] presented socialviability aspects of hydropower application in urban water systems and Llácer-Iglesiaset al. [46] also proposed a complementary approach related to energy self-sufficiency,identifying other driving factors for hydropower implementation at WWTPs.
1.3. Aim of This Study
As seen in Section 1.1, for the effective implementation of specific energy strategieswithin the wastewater sector, suitable intermediate levels between individual plant andnational levels should be considered too [42,71]. Therefore, adjustment of the assessmentmethodologies mentioned in Section 1.2, at the same level as decision-making stakeholders,could provide them with more complete technical information about their renewableenergy options [35]. With that, a forward step to real application of renewable energytechnologies, as current global targets to tackle climate change require [2,5].
In this context, the main aim of this research is to determine if hydropower technologycould contribute to improve sustainability of wastewater systems, as they are essentialservices for society. To achieve that aim, the objectives of this study are:
1. To analyze the existing framework and real experience of hydropower technologyapplication for energy recovery from wastewater, considering:
2. Previous methodologies for potential assessment proposed in academic papers (de-scribed in Section 2.1);
3. Characteristics and performance of real case studies (methods described in Section 2.2and results displayed in Sections 3.1 and 3.2).
4. To compare both—methodologies with data of the real case studies (methods de-scribed in Section 2.3 and results analyzed in Sections 3.1 and 3.2). From that com-parison, to propose the basis of a modified methodology for potential assessment,regarding, options for introducing other decision factors and adaptability to provideuseful information at a suitable decision-making level.
As a result, a first important contribution of this article is that it provides a newand more complete framework for the practical application of hydropower to wastewatersystems, considering the existing real experience in WWTPs worldwide, limited in previouspapers to a few illustrative examples with no analysis of their actual performance. Fromthe analysis of performance carried out during this study, areas to focus further research tooffer sustainable solutions for the wastewater industry are highlighted in Section 3.4. Theresults demonstrated that there is an existing experience which is not being used to exploreall the options for renewable energy generation in the wastewater sector and hydropowercould play a more important role in achieving a sustainable water management.
As another novelty, in Section 3.3 this work presents a new approach to developpotential assessment methodologies, introducing other decision factors than economicfeasibility, which is the only aspect considered in previous methodologies. In conclusion,social and environmental factors should also be introduced in the decision-making process,

Water 2021, 13, 3259 5 of 31
considering all important stakeholders involved in wastewater management and bearingin mind the whole sustainability concept, needed to reach the SDGs.
2. Materials and Methods
In the initial phase of this research the most relevant methodologies proposed in previ-ous studies for potential assessment of large geographical areas were analyzed (Section 2.1).In a second phase (Section 2.2), the existing background was completed with a search oftechnical data of existing real case studies, with the aim of gathering as much as possibleinformation about the experience of application of hydropower to wastewater systems.Finally, the results from both phases were compared as described in Section 2.3.
2.1. Methodologies for Hydropower Potential Assessment at Wastewater Treatment Plants
The approach in the analyzed studies usually consists of 2 steps that include:
• Firstly, a technical assessment of the energy generation potential, considering an initialsample of several hundreds of the existing WWTPs from the study area.
• Secondly, an economic feasibility study to determine the profitable plants from theselected potential sites in the previous step, according to several assumptions. Thissecond stage usually allows for more detailed analysis as the number of sites in thesample has been reduced significantly, considering only those with higher potential.
This approach is sketched in Figure 2 and is described throughout this section.Possible locations for hydropower schemes at wastewater systems include both,
upstream the WWTP (using raw or untreated wastewater at the inlet) or on the exit (treatedeffluent at the outlet of the plant) [50,65,72]. The potential power output is determined bythe following general expression:
p = $ g Q H η, (1)
where p is the power output in W, $ is the water density in kg/m3, g is the accelerationdue to gravity in m/s2, Q is the volume flow rate of water passing through the hydraulicmachine in m3/s, H is the available head in m and η is the overall efficiency of the system,including turbine, generator and transformer efficiencies. For an installed hydropowersystem, its general performance can be summarized and roughly assessed with yearly datato obtain the ratio:
Capacity factor (%) =Energy generated
Installed power 8760(2)
where the energy generated is the actual generation of the hydropower system per yearin kWh/year, the installed power is the capacity of the installed hydropower system inkW and 8760 are the number of working hours in hours/year, assuming 365 day/year and24 h/day [59,70].
The selection of suitable machinery is very important [50,73]. According to the work-ing conditions there is a wide range of hydraulic machines. Factors to consider include forinstance if the system is pressurized or operates at atmospheric pressure and the type ofmechanical energy to be harnessed (potential, kinetic, pressure) [50,52]. Archimedes screwsand gravity water wheels are the most frequent examples of hydraulic machinery in openchannels [56,58]. Conventional turbines can be classified into reaction (Francis, Kaplan,Deriaz, Propeller) and action or impulse turbines (Pelton, Crossflow, Turgo) [52,57,74].Later developments of hydropower technologies have also promoted the application ofadapted machines such as pumps working as turbines (PATs) or tubular propellers, suitableto the smaller scale ranges [48,52]. The machine selection will ultimately depend on thecombination of values for the water flow rate Q and the available head H in a particularcase. The hydraulic efficiency for each type of machine within the foreseen working rangemust be evaluated too, as flow rate fluctuations can significantly affect the actual energygeneration [60,75].

Water 2021, 13, 3259 6 of 31
Water 2021, 13, x FOR PEER REVIEW 6 of 32
working range must be evaluated too, as flow rate fluctuations can significantly affect the actual energy generation [60,75].
Figure 2. General approach in existing methodologies.
As mentioned, the general process followed in the existing methodologies could be represented as shown in Figure 2. This diagram summarizes the common approach alt-hough there are some differences among them. In the following paragraphs the main as-pects for each analyzed methodology are described and, finally, summarized in Table 1.
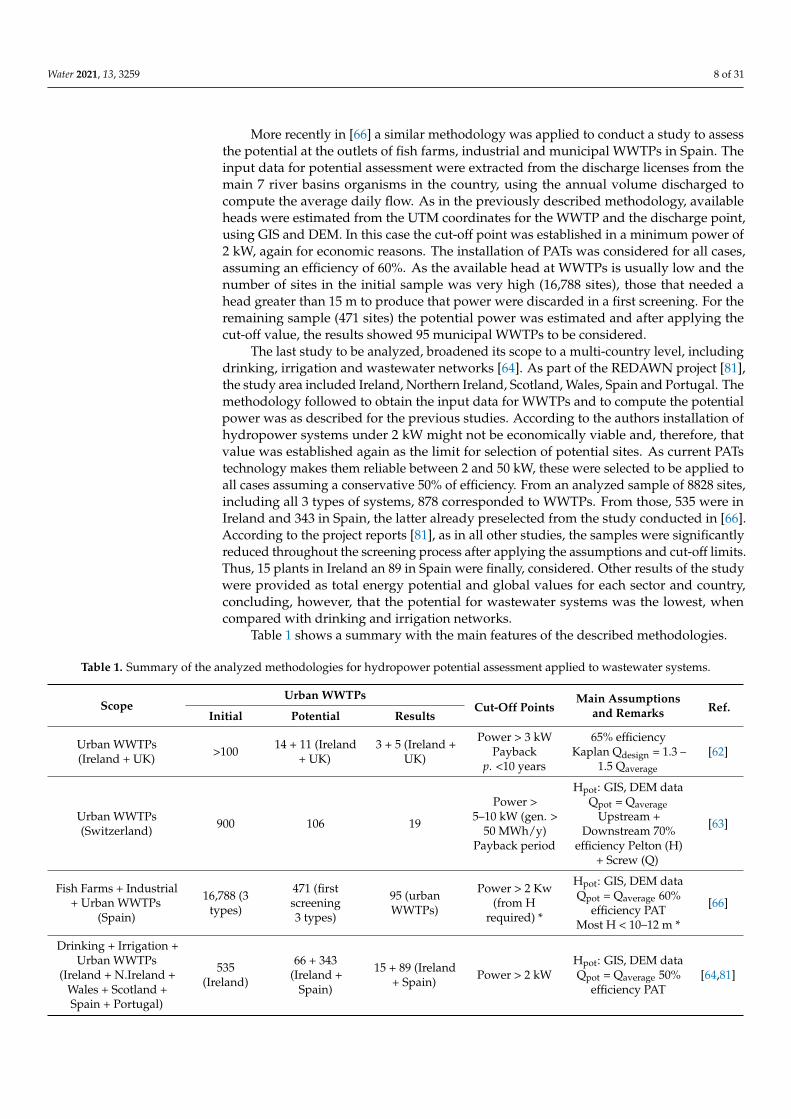
In 2014 Power et al. published the first academic paper describing a methodology specifically designed to assess the potential of hydropower technology applied to the wastewater sector at a country or multi-country level, namely for Ireland and the UK [62]. The initial sample included 100 WWTPs in Ireland, although in a second stage a few ad-ditional potential sites in the UK were also added. PATs and different types of reaction turbines were considered, Francis, Propeller and Kaplan. Because of the characteristic flow oscillations at WWTPs, Kaplan turbines were selected to be applied in all cases, as they are suitable for low heads and show high efficiency performances for a wide range of flow rates. To assess the potential power for each site the Equation (1) was used, as-suming 65% efficiency. Using data from 5 real case studies, the authors adapted equations proposed in previous articles to compute the installation costs, and hence, the economic viability. Then, based on economic criteria other assumptions were made for the selection of sites: a minimum power of 3 kW, to be considered as potential sites in the first step and, from those, a maximum payback period of 10 years, to be regarded as profitable in the second step. Thus, only 14 potential sites in Ireland and 11 additional sites in the UK were detected. After the application of all the selection criteria, the results indicated that only 8 sites could be considered as profitable (3 WWTPs in Ireland and 5 WWTPs in the UK), corresponding to the largest plants from the area of study.
Figure 2. General approach in existing methodologies.
As mentioned, the general process followed in the existing methodologies couldbe represented as shown in Figure 2. This diagram summarizes the common approachalthough there are some differences among them. In the following paragraphs the mainaspects for each analyzed methodology are described and, finally, summarized in Table 1.
In 2014 Power et al. published the first academic paper describing a methodologyspecifically designed to assess the potential of hydropower technology applied to thewastewater sector at a country or multi-country level, namely for Ireland and the UK [62].The initial sample included 100 WWTPs in Ireland, although in a second stage a fewadditional potential sites in the UK were also added. PATs and different types of reactionturbines were considered, Francis, Propeller and Kaplan. Because of the characteristic flowoscillations at WWTPs, Kaplan turbines were selected to be applied in all cases, as theyare suitable for low heads and show high efficiency performances for a wide range of flowrates. To assess the potential power for each site the Equation (1) was used, assuming 65%efficiency. Using data from 5 real case studies, the authors adapted equations proposedin previous articles to compute the installation costs, and hence, the economic viability.Then, based on economic criteria other assumptions were made for the selection of sites:a minimum power of 3 kW, to be considered as potential sites in the first step and, fromthose, a maximum payback period of 10 years, to be regarded as profitable in the secondstep. Thus, only 14 potential sites in Ireland and 11 additional sites in the UK were detected.After the application of all the selection criteria, the results indicated that only 8 sites couldbe considered as profitable (3 WWTPs in Ireland and 5 WWTPs in the UK), correspondingto the largest plants from the area of study.
Other remarkable contributions from that research included a sensitivity analysisconducted to study the influence of variations of flow rate on the results and a methodto find the optimal design flow for the hydropower system to maximize power output.Considering the influence of the ratio actual flow rate vs. design flow rate on the Kaplan

Water 2021, 13, 3259 7 of 31
turbine efficiency, the authors concluded that over-design might be more suitable. Thestudy also highlighted that allowing for possible changes in policies, including incentivesfor renewable energy generation and oscillations in energy prices, there might be significantfluctuations and that more precise results would require site specific feasibility studies.
Further work from that research group confirmed and completed the study with otherimportant considerations. In [76], Gallagher et al. similarly applied the methodology todifferent water systems in Wales and Ireland and some key issues regarding the economicfeasibility are highlighted. Hydropower can be integrated into existing water systems with-out interfering in the main purpose of those facilities, harnessing an excess of energy thatotherwise would be wasted. The main costs are related to the turbine and generator costs.Current technology challenges are related to the variations of flow rate, as they directlyaffect the efficiency and the size. The smaller the size, the less economically viable theimplementation results. However, if more efficient and affordable machinery is developedand future energy policies improve incentivization, the criteria to be applied might differand, therefore, the results might be different too. In [73], the authors studied deeply theeffects of the variations of flow rate on efficiency for 4 different machinery options (Francis,Propeller, Kaplan and PATs) and provided some estimations to determine the optimumselection and design flow for each of them. Further lines of research pointed to exploreoptions to overcome flow modulation by optimizing possible combinations of low-costPATs. Experimental and demonstration sites were also considered extremely importantto achieve that goal. In additional studies [67,77,78], the environmental perspective ofmicro-hydropower was deeply analyzed, applying Life Cycle Analysis (LCA) conceptsand methods. The results have not been integrated into the potential assessment method-ologies for WWTPs, although they demonstrated the positive environmental impacts ofapplying this technology to existing water infrastructure and provide valuable informationif environmental factors are to be considered.
In 2017, Bousquet et al. [63] carried out a similar study for Switzerland, which could beconsidered one of the leading countries, with South Korea, in the application of hydropowerto WWTPs [46,79,80]. As a framework to develop their work, that study included aninventory of 17 existing cases studies worldwide. In this article, the methodology toobtain the input data for each site to assess the potential is also described. Availablegross heads were estimated using Geographic Information Systems (GIS) and a DigitalElevation Model (DEM), from the UTM coordinates of the WWTPs and the correspondingdischarge points. To calculate potential power the average flow rate of the plant was used,assuming the net head as 90% of available gross head and overall 70% efficiency. The initialsample included 900 WWTPs in Switzerland and a distinction was made between inlet(untreated wastewater upstream) and outlet (treated effluent downstream) position forthe hydropower system. The cut-off point for this first step was established at a potentialpower of 5–10 kW, corresponding to a minimum generation of 50 MWh/year. In the secondpart of this study, several economic equations were presented to compute the costs. Tocalculate profitability more detailed calculations were carried out, taking into accountthe optimum design flow, characteristics of pipe connection to compute net head and themost suitable machinery, considering Kaplan and Pelton turbines, PATs and Archimedesscrews. The results for the outlet position (final effluent) showed 41 potential sites, 14 ofwhich were considered as profitable, whereas at the inlet position (untreated effluent)65 potential sites were detected, regarding only 5 of them profitable. From the analysisof different machinery, 2 types were considered most suitable, depending on the profile—Pelton turbines for sites with high available H and Archimedes screws for plants withhigh Q. Finally, comparing the selected sites with the preliminary inventory of 17 casestudies, for the outlet position the 6 identified sites in Switzerland were included. However,the results for the inlet position did not include the existing Swiss site in that inventory(Profay). The main conclusions were similar to the study of Power et al. [62] highlightingthat in general the results of the methodology should be considered context specific.
Water 2021, 13, 3259 8 of 31
More recently in [66] a similar methodology was applied to conduct a study to assessthe potential at the outlets of fish farms, industrial and municipal WWTPs in Spain. Theinput data for potential assessment were extracted from the discharge licenses from themain 7 river basins organisms in the country, using the annual volume discharged tocompute the average daily flow. As in the previously described methodology, availableheads were estimated from the UTM coordinates for the WWTP and the discharge point,using GIS and DEM. In this case the cut-off point was established in a minimum power of2 kW, again for economic reasons. The installation of PATs was considered for all cases,assuming an efficiency of 60%. As the available head at WWTPs is usually low and thenumber of sites in the initial sample was very high (16,788 sites), those that needed ahead greater than 15 m to produce that power were discarded in a first screening. For theremaining sample (471 sites) the potential power was estimated and after applying thecut-off value, the results showed 95 municipal WWTPs to be considered.
The last study to be analyzed, broadened its scope to a multi-country level, includingdrinking, irrigation and wastewater networks [64]. As part of the REDAWN project [81],the study area included Ireland, Northern Ireland, Scotland, Wales, Spain and Portugal. Themethodology followed to obtain the input data for WWTPs and to compute the potentialpower was as described for the previous studies. According to the authors installation ofhydropower systems under 2 kW might not be economically viable and, therefore, thatvalue was established again as the limit for selection of potential sites. As current PATstechnology makes them reliable between 2 and 50 kW, these were selected to be applied toall cases assuming a conservative 50% of efficiency. From an analyzed sample of 8828 sites,including all 3 types of systems, 878 corresponded to WWTPs. From those, 535 were inIreland and 343 in Spain, the latter already preselected from the study conducted in [66].According to the project reports [81], as in all other studies, the samples were significantlyreduced throughout the screening process after applying the assumptions and cut-off limits.Thus, 15 plants in Ireland an 89 in Spain were finally, considered. Other results of the studywere provided as total energy potential and global values for each sector and country,concluding, however, that the potential for wastewater systems was the lowest, whencompared with drinking and irrigation networks.
Table 1 shows a summary with the main features of the described methodologies.
Table 1. Summary of the analyzed methodologies for hydropower potential assessment applied to wastewater systems.
ScopeUrban WWTPs
Cut-Off PointsMain Assumptions
and Remarks Ref.Initial Potential Results
Urban WWTPs(Ireland + UK) >100 14 + 11 (Ireland
+ UK)3 + 5 (Ireland +
UK)
Power > 3 kWPayback
p. <10 years
65% efficiencyKaplan Qdesign = 1.3 –
1.5 Qaverage
[62]
Urban WWTPs(Switzerland) 900 106 19
Power >5–10 kW (gen. >
50 MWh/y)Payback period
Hpot: GIS, DEM dataQpot = Qaverage
Upstream +Downstream 70%
efficiency Pelton (H)+ Screw (Q)
[63]
Fish Farms + Industrial+ Urban WWTPs
(Spain)
16,788 (3types)
471 (firstscreening3 types)
95 (urbanWWTPs)
Power > 2 Kw(from H
required) *
Hpot: GIS, DEM dataQpot = Qaverage 60%
efficiency PATMost H < 10–12 m *
[66]
Drinking + Irrigation +Urban WWTPs
(Ireland + N.Ireland +Wales + Scotland +Spain + Portugal)
535(Ireland)
66 + 343(Ireland +
Spain)
15 + 89 (Ireland+ Spain) Power > 2 kW
Hpot: GIS, DEM dataQpot = Qaverage 50%
efficiency PAT[64,81]

Water 2021, 13, 3259 9 of 31
2.2. Real Case Studies of Hydropower Applied to Wastewater Systems
Following the methodology described in [46] and bearing in mind the main purposeof this study, a literature search with a broad approach was conducted. This is particularlyrelevant when, as in this study, the objective is to examine the state of the art of the currentapplication of a technology to real cases, with the aim of utilizing what is referred as“wisdom of practice” [61,82]. Hence, using internet search engines as well, to retrieve othertypes of documents available at websites from different stakeholders, the inventory of realcase studies presented by the authors in [46] was completed. This included private compa-nies such as turbine manufacturers, engineering contractors, water managing companies,consultancy services, energy and wastewater practitioners, etc., and also, national and localgovernment authorities, water agencies and wastewater- or energy-related institutions orassociations. When a real case study was identified, the search was extended trying toobtain the technical data and actual performance information of the hydropower system in-stalled. Thus, additional sources included specific corporate websites or plant performancereports, practitioner magazines and other press articles.
Appendix A shows all sources of public information analyzed during this research toextract the data for the 49 identified real case studies, which will be displayed in the tablesin the following Section. When different sources for a case study were found, all of themwere analyzed, the data were compared and the most recent values were preferred to beincluded in the tables.
2.3. Analysis of Methodologies and Comparison with Real Cases
All the methodologies analyzed (Table 1) have some aspects in common. On the onehand, as mentioned, they are applied to large geographical areas, namely at a country ormulti-country level. However, in some countries, for example Spain [34,38], other regionalstakeholders like regional governments also have an important role in the decision-makingprocess [5]. On the other hand, the potential assessment is solely based on economic feasi-bility, establishing some cut-off points to reduce the initial samples to the most profitablesites, according to all the technical and economic assumptions made. With that, the maindecision factor is an acceptable payback period [76] and usually this is only achieved in thelargest plants with high flow rates. Thus, the results show that most of WWTPs will notlikely present an attractive target market for hydropower technologies manufacturers asthe desired conditions of high H and high Q are not the most frequent at the majority offacilities and seldom combined. Nevertheless, as already observed in some of those studiesand more recently also mentioned in [9,46], in the current energy framework, economicfeasibility could vary significantly and, therefore, the results. These depend on a numberof parameters that nowadays are continuously changing, including policies, incentives, ormarket prices for both energy and technologies [9].
Furthermore, some of these articles include a few real case studies as examples buttheir data are only used to validate the assumptions made regarding economic issues [62,63].No further analysis of technical data or performance has been carried out to date. Thissuggests that, even though all these studies provide very valuable information for this areaof research, some aspects could be modified to adapt the methodologies to be applied infuture studies with a different approach and regarding existing real experience. The newapproach presented in this study, however, does consider a preliminary analysis of thetechnical performance of the existing hydropower systems installed. For the identifiedreal case studies the search was broadened trying to obtain the following data: Schemelocation (inlet or outlet), type of hydraulic machine, hydropower flow design Q (and, if alsoavailable, the average flow rate of the plant), available head H (gross/net), installed powercapacity P and annual electricity generation. From those data, applying Equation (2), thecapacity factors were computed to assess actual performance.
All the obtained data and results are displayed in the Tables in Sections 3.1 and 3.2,where they are also discussed in comparison with the assumptions made in the analyzedmethodologies (Table 1).

Water 2021, 13, 3259 10 of 31
3. Results and Discussion3.1. Analysis of Real Case Studies Profiles
Seeing the limitations to find publicly available data for the wastewater sector [46,83]and that there could be more existing experience than assumed, the search according tothe methodology followed in [46] was broadened further as described in Section 2.2. Thus,the results might offer a new perspective and, bearing in mind the sources of data, theiranalysis might provide a valuable basis for further research and improvement [61,82]. Allsources utilized during this research for the real case studies inventory and their dataextraction are included in Appendix A.
According to that, up to 49 existing real case studies of hydropower application towastewater systems were found, as shown in Table 2. To the best of the authors knowledge,this represents the most comprehensive inventory up to date, with almost 3 times thenumber of sites included in [63], that only considered 17 existing sites to develop theirmethodology. These results confirm the lack of awareness about this methodology in thewastewater industry, already highlighted by some authors [46,49,76] and that there mightbe valuable real experience, which has not been evaluated yet and it could be worthwhileto explore further.
Table 2 shows all the identified real case studies, with their basic data, name of theWWTP (case study), location, year of installation and installed power. An arbitrary IDnumber has been assigned to each site, to enable traceability throughout this paper. Theinstalled power is usually one of the few published data, so this allowed to classify most ofthem according to the size ranges mentioned in Section 1.
The different locations show an interest for this technology worldwide, as shown inFigure 3, with existing sites in 14 different countries. There are clearly 2 leading countriesin number of sites already applying this technology, Switzerland and South Korea, with16 and 11 case studies, respectively. Spain and Germany follow this classification with3 plants each. As concluded in the studies analyzed in Section 2.1, the potential seems tobe higher in large cities, which is related to high flow rates. However, as indicated in [46],most of these WWTPs also use biogas and other technologies such as solar or wind forenergy generation.
From the 46 cases with published data about installed power, 17 could be classifiedas micro-, 22 as mini- and 7 as small-hydropower, considering the whole system, that isaccounting for all turbines installed. None of them falls into the range of pico-hydropower,being 6.6 kW, the lowest power found (ID 10). This distribution according to the hy-dropower system size is plotted in Figure 4. This shows there is a wide range of needs andpossible combinations, reinforcing the idea that, even when a high number of plants isbeing analyzed, the methodology should allow to introduce some case-by-case considera-tions, in relative terms. Compared to the cut-off points established in the methodologiessummarized in Table 1 (2–10 kW), usually around the limit between the pico- and micro-hydro ranges (about 5 kW), all of them are well above that limit. One reason for that mightbe not only a higher potential, but also a higher accessibility to knowledge and resourcesin larger plants, usually pioneers in the implementation of new technologies, as observedin [35,42,46].

Water 2021, 13, 3259 11 of 31
Table 2. Inventory of the 49 real cases studies of hydropower application to wastewater systems found during this research.
ID 1 Case Study Location 3 Year 4 Installed HydroPower (kW) Range
1 Plobb-Seefeld 2 Seefeld Zirl-AT 2005 1192 Small2 Ebswien Vienna (Simmering)-AT 2009, 2013 400 Mini3 Chaux-de-Fonds 2 La Chaux-de-Fonds-SW 2007, 2016 1532 Small
4 Le Châble Profray Val Bagnes, Verbier(Valais)-SW 1993, 2008 350 Mini
5 La Douve 1 Aigle, Leysin (Vaud)-SW 1989, 2000 430 Mini6 La Douve 2 Aigle, Leysin (Vaud)-SW 2001 75 Micro7 L’Asse 2 Nyon (Vaud)-SW 1990 215 Mini8 Coppet-Terre Sainte (SITSE) Commugny (Vaud)-SW 2014 110 Mini9 Grächen Grächen (Valais)-SW 2011 262 Mini
10 Iseltwald Iseltwald (Berna)-SW 2014 6.6 Micro11 Engelberg Engelberg-SW 2010 55 Micro12 Morgental (Hofen) 2 Steinach (St. Gallen)-SW 1916, 2014 1260 Small13 Aïre Genève-SW before 2015 200 Mini14 Meiersboden (Rabiosa) 2 Chur-SW 2016 194 Mini15 La Saunerie Colombier (Neuchâtel)-SW 2014 15 Micro16 Schwyz 2 Seewen-SW 2011 15.5 Micro17 La Louve 2 Lausanne-SW 2006 170 Mini
18 Kuesnacht-Erlenbach-Zumikon 2 Kuesnacht-SW 2016 N/A N/A
19 Chartres Métropole 2 Mainvilliers-FR 2020 200 Mini20 Emmerich (TWE) Emmerich am Rhein-GE 2000 13 Micro21 Böhmenkirch 2 Roggental-GE 2001 40 Micro22 Buchenhofen Wuppertal-GE 1966, 2012 560 Mini23 Esholt Bradford (Yorkshire)-UK 2009 175 Mini24 La Cartuja Zaragoza-SP 2015 225 Mini25 Sur Getafe (Madrid)-SP before 2014 180 Mini26 La Gavia Madrid-SP before 2017 75 Micro27 Glina Bucharest (Ilfov County)-RO before 2019 426 Mini28 Brussels-North Brussels-BE before 2019 640 Mini
29 Namur (Lives Brumagne) Lives-sur-Meuse(Namur)-BE 2016 N/A N/A
30 North Head Sydney-AU 2010 4500 Small31 Gippsland Water Factory 2 Maryvale (Gippsland)-AU 2010 300 Mini32 As samra Amman City-JO 2008 1660 + 1614 Small33 As samra II Amman City-JO 2015 515 Mini34 Asan Chungnam asan-KR 2000 36 Micro35 Cheonan Chungnam Cheonan-KR 2002 40 Micro36 Jinhae Gyeongnam jinhae-KR 2004 10 Micro37 Shinshun Daegu-KR 2005 139 Mini38 Seoksu Gyeonggi Anyang-KR 2007 400 Mini39 Seobu Daegu-KR 2010 74 Micro40 Chungju Chungju-KR 2011 135 Mini41 Nan Ji Seoul-KR 2014 N/A N/A42 Tan Chun Seoul-KR before 2017 60 Micro43 Joong Rang Seoul-KR 2015 60 Micro44 Seo Nam Seoul-KR 2015 100 Micro45 N/A Taichung-TW before 2008 68 Micro46 Hsinchu Hsinchu-TW before 2008 11 Micro47 Deer Island Boston (Massachusetts)-US 2002 2000 Small48 Point Loma San Diego-US 2001 1350 Small49 Clarkson Mississauga-CA 2015 225 Mini
1 Identification number. All sources of data for each case study are displayed in Appendix A. 2 Particular configurations: Receiving input(inlet flow) or generated output (electricity) exchanged with other sites outside the boundary limits of the wastewater treatment plant.3 AT: Austria; SW: Switzerland; FR: France; GE: Germany; UK: United Kingdom; SP: Spain; RO: Romania; BE: Belgium; AU: Australia; JO:Jordan; KR: South Korea; TW: Taiwan; US: United States; CA: Canada 4 Year. Date first installation, date last update. “Before”: Date ofinstallation not available, the year of the first mention found as existing case has been displayed as a reference. N/A: Not Available.

Water 2021, 13, 3259 12 of 31Water 2021, 13, x FOR PEER REVIEW 12 of 32
Figure 3. Location of the analyzed case studies (number of sites).
From the 46 cases with published data about installed power, 17 could be classified as micro-, 22 as mini- and 7 as small-hydropower, considering the whole system, that is accounting for all turbines installed. None of them falls into the range of pico-hydro-power, being 6.6 kW, the lowest power found (ID 10). This distribution according to the hydropower system size is plotted in Figure 4. This shows there is a wide range of needs and possible combinations, reinforcing the idea that, even when a high number of plants is being analyzed, the methodology should allow to introduce some case-by-case consid-erations, in relative terms. Compared to the cut-off points established in the methodolo-gies summarized in Table 1 (2–10 kW), usually around the limit between the pico- and micro-hydro ranges (about 5 kW), all of them are well above that limit. One reason for that might be not only a higher potential, but also a higher accessibility to knowledge and resources in larger plants, usually pioneers in the implementation of new technologies, as observed in [35,42,46].
In addition, the conclusions in previous studies that hydropower potential for this sector certainly is not very high [62,63,66], especially when compared with other water systems [64,81], or renewable energy technologies [15,16,24], are confirmed by the abso-lute figures of installed power. However, the distribution showed in Figure 4 is also con-sistent with the idea that the installation of hydropower in wastewater systems should mainly be aimed for electricity generation for self-consumption [46]. This use on-site would be generally the case for WWTPs, as being energy producers to feed electricity grids could only be achieved in sites with very exceptional conditions [60,61]. As wastewater treatment processes are very energy intensive, to harness some of the energy embedded in the wastewater, in this case, mechanical energy, would contribute to some extent to reduce electricity consumption from the grid and with that, to increase energy independency and sustainability [46,84]. That means that, in most cases, hydropower can-not be compared to biogas [15], which clearly present a much higher potential, given that anaerobic processes take place in the plant [9,24]. The real potential of hydropower should be to become a “low-hanging fruit” technology, easy to identify and implement [46,77,85].
Figure 3. Location of the analyzed case studies (number of sites).
Water 2021, 13, x FOR PEER REVIEW 13 of 32
Figure 4. Distribution of hydropower systems size: Number of case studies per size range.
For that, the full range of technical options of pico-hydro systems might also be ex-plored [60,65,86] to provide solutions adapted to the needs of the numerous small plants worldwide. In particular, recent developments in low head applications would be of spe-cial interest to be deemed as possible options [48,57,65]. Reliable hydraulic machinery adapted to different working conditions would benefit not only the wastewater sector, but also drinking and irrigation water systems, particularly in rural or isolated areas and developing countries, where hybrid off-grid solutions could play a crucial role in the near future.
Only for two case studies (ID 45, 46), no more available public data than those dis-played in Table 2 were found . For the rest of sites, Table 3 shows all technical data found about the characteristics of the site and the hydropower system installed.
Table 3. Technical data of hydropower systems installed in real cases studies found during this research.
ID 1 Case Study Scheme 3 Q (m3/s) WWTP /Design H (m)
Net/Gross Hydraulic Machine (Number, Type) 4
1 Plobb-Seefeld 2 TE 0.089/0.250 -/625 N/A 2 Ebswien TE 6.206/6.500 -/5 1 Screw + 1 Kaplan 3 Chaux-de-Fonds 2 TE -/0.500 380/393 1 Pelton 4 Le Châble Profray RWW -/0.100 430/449 1 Pelton (V) 5 La Douve 1 N/A -/0.108 510/559 1 Pelton 6 La Douve 2 TE -/0.108 79/83 1 Pelton (V) 7 L’Asse 2 N/A -/0.290 -/94 1 PAT 8 Coppet-Terre Sainte (SITSE) TE 0.083/0.170 77/- 1 Pelton 9 Grächen N/A -/0.089 351/- 1 Pelton (H)
10 Iseltwald N/A -/0.0095 120/- 1 PAT 11 Engelberg TE 0.069/0.139 -/50 1 Pelton 12 Morgental (Hofen) 2 TE 0.174/0.840 190/- 1 Pelton (H) 13 Aïre TE 2.000/3.200 5/- 1 Kaplan 14 Meiersboden (Rabiosa) 2 SWW -/0.015 -/522 1 Pelton 15 La Saunerie N/A 0.127/0.240 4.5/- 1 Turbine 16 Schwyz 2 TE 0.242/0.250 -/7 N/A 17 La Louve 2 RWW -/0.120 -/180 1 Pelton 18 Kuesnacht-Erlenbach-Zumikon 2 SWW -/- -/180 N/A 19 Chartres Métropole 2 TE 0.400/0.800 -/- N/A 20 Emmerich (TWE) N/A 0.185/0.400 3.8/- N/A 21 Böhmenkirch 2 RWW 0.017/- -/100 1 Pelton 22 Buchenhofen N/A 1.309/10.000 7/- 1 Kaplan 23 Esholt SWW -/2.678 8.2/- 2 A.Screw
Figure 4. Distribution of hydropower systems size: Number of case studies per size range.
In addition, the conclusions in previous studies that hydropower potential for thissector certainly is not very high [62,63,66], especially when compared with other watersystems [64,81], or renewable energy technologies [15,16,24], are confirmed by the absolutefigures of installed power. However, the distribution showed in Figure 4 is also consistentwith the idea that the installation of hydropower in wastewater systems should mainlybe aimed for electricity generation for self-consumption [46]. This use on-site would begenerally the case for WWTPs, as being energy producers to feed electricity grids couldonly be achieved in sites with very exceptional conditions [60,61]. As wastewater treatmentprocesses are very energy intensive, to harness some of the energy embedded in thewastewater, in this case, mechanical energy, would contribute to some extent to reduceelectricity consumption from the grid and with that, to increase energy independency andsustainability [46,84]. That means that, in most cases, hydropower cannot be compared tobiogas [15], which clearly present a much higher potential, given that anaerobic processestake place in the plant [9,24]. The real potential of hydropower should be to become a“low-hanging fruit” technology, easy to identify and implement [46,77,85].

Water 2021, 13, 3259 13 of 31
For that, the full range of technical options of pico-hydro systems might also beexplored [60,65,86] to provide solutions adapted to the needs of the numerous small plantsworldwide. In particular, recent developments in low head applications would be of specialinterest to be deemed as possible options [48,57,65]. Reliable hydraulic machinery adaptedto different working conditions would benefit not only the wastewater sector, but alsodrinking and irrigation water systems, particularly in rural or isolated areas and developingcountries, where hybrid off-grid solutions could play a crucial role in the near future.
Only for two case studies (ID 45, 46), no more available public data than thosedisplayed in Table 2 were found. For the rest of sites, Table 3 shows all technical data foundabout the characteristics of the site and the hydropower system installed.
Concerning the hydropower scheme location, as mentioned, the options to considerare upstream the WWTP (raw or screened wastewater) or downstream (treated effluentat the outlet). Regarding this, only the methodology in [63], applied to Switzerland,considered both options, as in the upstream configuration, additional factors must be takeninto account and their design and operation might be much more complex.
As Figure 5 shows the number of existing sites with the hydropower scheme locatedat the outlet is notably higher and from the individual data in Table 3 can be seen that thisis the usual option for large plants. However, as observed in Table 3 as well, the upstreamscheme could be an interesting option to be deemed in areas with favorable topographylike Switzerland and high available heads along the sewage network. It could also be ofinterest in those cases with particular configurations (see footer number 2 in Table 3), innetworks with different municipalities sharing a WWTP.
Water 2021, 13, x FOR PEER REVIEW 15 of 32
Figure 5. Hydropower scheme location in case studies.
Concerning the Q, if both values were available, the WWTP average effluent flow rate and the design flow of the hydropower, they have been displayed together to allow for comparisons. Even though it seems that in such cases the design flow of the hydro-power is usually higher than the plant flow, only in very few cases were reliable data for both found to enable drawing further conclusions. Special mention should be made for the particular configurations (footer 2 Table 3), where no relationship between those val-ues could be established, as the flow passing through the turbine does not correspond to the total inlet or outlet flow of the plant. Similarly, when values for the gross and the net available H were found, both have been displayed. Again, the available data did not allow to draw strong conclusions. The only remarkable conclusion when considering Q and H values, is that the existing case studies clearly show two different profiles: either plants with very high available H, or large plants in big cities with significant Q, but usually low available H.
A range of types of hydraulic machines have been applied, with predominance of Pelton for heads higher than 50–100 m and Kaplan for lower heads, in coherence with conclusions in [63] and [62], respectively, summarized in Table 1. Considering the differ-ent machinery types, their share is plotted in Figure 6.
Figure 6. Hydraulic machinery types applied in case studies.
Application of PATs was only found in two sites (ID 7, 10), although most of the cases in Table 2 show power figures above the upper limit of 50 kW recommended in [64] for the consideration of these machines. Low-head solutions have been grouped, including screws (ID 2, 23) and hydrokinetic turbine (ID 31), although application of these solutions has been only observed in seven sites, four of them (ID 41–44) of unspecified type.
Figure 5. Hydropower scheme location in case studies.
Concerning the Q, if both values were available, the WWTP average effluent flow rateand the design flow of the hydropower, they have been displayed together to allow forcomparisons. Even though it seems that in such cases the design flow of the hydropower isusually higher than the plant flow, only in very few cases were reliable data for both foundto enable drawing further conclusions. Special mention should be made for the particularconfigurations (footer 2 Table 3), where no relationship between those values could beestablished, as the flow passing through the turbine does not correspond to the total inlet oroutlet flow of the plant. Similarly, when values for the gross and the net available H werefound, both have been displayed. Again, the available data did not allow to draw strongconclusions. The only remarkable conclusion when considering Q and H values, is thatthe existing case studies clearly show two different profiles: either plants with very highavailable H, or large plants in big cities with significant Q, but usually low available H.

Water 2021, 13, 3259 14 of 31
Table 3. Technical data of hydropower systems installed in real cases studies found during this research.
ID 1 Case Study Scheme 3 Q (m3/s) WWTP/Design
H (m) Net/GrossHydraulicMachine
(Number, Type) 4
1 Plobb-Seefeld 2 TE 0.089/0.250 -/625 N/A2 Ebswien TE 6.206/6.500 -/5 1 Screw + 1 Kaplan3 Chaux-de-Fonds 2 TE -/0.500 380/393 1 Pelton4 Le Châble Profray RWW -/0.100 430/449 1 Pelton (V)5 La Douve 1 N/A -/0.108 510/559 1 Pelton6 La Douve 2 TE -/0.108 79/83 1 Pelton (V)7 L’Asse 2 N/A -/0.290 -/94 1 PAT8 Coppet-Terre Sainte (SITSE) TE 0.083/0.170 77/- 1 Pelton9 Grächen N/A -/0.089 351/- 1 Pelton (H)
10 Iseltwald N/A -/0.0095 120/- 1 PAT11 Engelberg TE 0.069/0.139 -/50 1 Pelton12 Morgental (Hofen) 2 TE 0.174/0.840 190/- 1 Pelton (H)13 Aïre TE 2.000/3.200 5/- 1 Kaplan14 Meiersboden (Rabiosa) 2 SWW -/0.015 -/522 1 Pelton15 La Saunerie N/A 0.127/0.240 4.5/- 1 Turbine16 Schwyz 2 TE 0.242/0.250 -/7 N/A17 La Louve 2 RWW -/0.120 -/180 1 Pelton
18 Kuesnacht-Erlenbach-Zumikon 2 SWW -/- -/180 N/A
19 Chartres Métropole 2 TE 0.400/0.800 -/- N/A20 Emmerich (TWE) N/A 0.185/0.400 3.8/- N/A21 Böhmenkirch 2 RWW 0.017/- -/100 1 Pelton22 Buchenhofen N/A 1.309/10.000 7/- 1 Kaplan23 Esholt SWW -/2.678 8.2/- 2 A.Screw24 La Cartuja TE 1.643/- 8.5/- 1 SemiKaplan25 Sur TE 2.895/2 × 3.500 3.2/- 2 Turbines26 La Gavia TE 0.965/- -/- 1 Turbine27 Glina TE 7.851/- -/- N/A28 Brussels-North TE 3.260/- -/- N/A29 Namur (Lives Brumagne) TE 0.249/- -/6 1 Turbine30 North Head TE 3.889/3.500 -/60 2 Kaplan31 Gippsland Water Factory 2 N/A 0.405/- -/- Kinetic32 As samra (inlet) RWW 3.000/2 × 1.250 78/104 2 Pelton (V)32 As samra (outlet) TE -/2 × 2.300 41/42 2 Francis (V)33 As samra II TE 4.213/- -/- 1 Francis34 Asan TE 0.521/0.370 6.9/7.2 1 Kaplan35 Cheonan N/A -/- 2.5/- 1 Kaplan36 Jinhae N/A -/- 1.6/- 1 Kaplan37 Shinshun N/A -/- 3.7/- 1 Kaplan38 Seoksu TE 3.472/2.338 14.8/- 1 Kaplan39 Seobu N/A 6.019/- 2/- 1 Propeller40 Chungju N/A -/- 6.5/- 1 Propeller41 Nan Ji N/A 9.954/- -/- Low head (<2 m)42 Tan Chun N/A 10.417/- -/- Low head (<2 m)43 Joong Rang N/A 18.403/- -/- Low head (<2 m)44 Seo Nam N/A 18.866/- -/- Low head (<2 m)47 Deer Island TE 15.741/- 2.7/- 2 Kaplan48 Point Loma TE 6.103/- -/27.4 N/A49 Clarkson N/A 2.638/- -/5 N/A1 Identification number. All sources of data for each case study are displayed in Appendix A. 2 Particular configurations: Receiving input(inlet flow) or generated output (electricity) exchanged with other sites outside the boundary limits of the wastewater treatment plant.3 Scheme location. RWW: Raw Wastewater (WWTP inlet or upstream); SWW: Screened Wastewater (WWTP inlet or upstream); TE: TreatedEffluent (WWTP outlet); N/A: Not Available. 4 Machine type. (V): Vertical; (H): Horizontal; N/A: No data Available (neither type nornumber of turbines).

Water 2021, 13, 3259 15 of 31
A range of types of hydraulic machines have been applied, with predominance ofPelton for heads higher than 50–100 m and Kaplan for lower heads, in coherence withconclusions in [62,63], respectively, summarized in Table 1. Considering the differentmachinery types, their share is plotted in Figure 6.
Water 2021, 13, x FOR PEER REVIEW 15 of 32
Figure 5. Hydropower scheme location in case studies.
Concerning the Q, if both values were available, the WWTP average effluent flow rate and the design flow of the hydropower, they have been displayed together to allow for comparisons. Even though it seems that in such cases the design flow of the hydro-power is usually higher than the plant flow, only in very few cases were reliable data for both found to enable drawing further conclusions. Special mention should be made for the particular configurations (footer 2 Table 3), where no relationship between those val-ues could be established, as the flow passing through the turbine does not correspond to the total inlet or outlet flow of the plant. Similarly, when values for the gross and the net available H were found, both have been displayed. Again, the available data did not allow to draw strong conclusions. The only remarkable conclusion when considering Q and H values, is that the existing case studies clearly show two different profiles: either plants with very high available H, or large plants in big cities with significant Q, but usually low available H.
A range of types of hydraulic machines have been applied, with predominance of Pelton for heads higher than 50–100 m and Kaplan for lower heads, in coherence with conclusions in [63] and [62], respectively, summarized in Table 1. Considering the differ-ent machinery types, their share is plotted in Figure 6.
Figure 6. Hydraulic machinery types applied in case studies.
Application of PATs was only found in two sites (ID 7, 10), although most of the cases in Table 2 show power figures above the upper limit of 50 kW recommended in [64] for the consideration of these machines. Low-head solutions have been grouped, including screws (ID 2, 23) and hydrokinetic turbine (ID 31), although application of these solutions has been only observed in seven sites, four of them (ID 41–44) of unspecified type.
Figure 6. Hydraulic machinery types applied in case studies.
Application of PATs was only found in two sites (ID 7, 10), although most of the casesin Table 2 show power figures above the upper limit of 50 kW recommended in [64] forthe consideration of these machines. Low-head solutions have been grouped, includingscrews (ID 2, 23) and hydrokinetic turbine (ID 31), although application of these solutionshas been only observed in seven sites, four of them (ID 41–44) of unspecified type.
All this illustrates again that the pico-hydro range and the low head options havenot been fully explored in this application yet. The lowest cut-off point in the analyzedmethodologies was established at 2 kW. Nevertheless, according to some studies in smallscale hydropower, machines of only a few hundred watts have been recently developed bydifferent manufacturers worldwide [58,65,74]. Therefore, regarding the values indicated inthose studies, although economic feasibility obviously decreases with size, from a technicalpoint of view, solutions from 100 W could be considered for energy recovery. Accordingto all this, it might be of interest to deepen current knowledge about the possibilities ofapplication of low head and small-scale hydropower options for the recovery of energyin the wastewater sector, particularly at the myriad smaller plants. Experimental pilotplants and full-scale prototypes would be particularly useful to adjust the performance ofhydraulic machinery to the needs of small WWTPs and, therefore, the potential market.
3.2. Analysis of Real Case Studies Performance
In those cases where available data of annual electricity generation from the installedsystems were found, comparisons were made with the installed power to compute thecapacity factor according to expression (2). This value summarizes the actual overall effi-ciency of the hydropower system in a year, assuming continuous working for 365 day/yearand 24 h/day and regarding the maximum theoretical power generation. These results areshown in Table 4. Comparing the foreseen overall efficiency in the analyzed methodologieswith the average values of capacity factors obtained, the analysis shows that the latter arebelow the assumptions and, therefore, actual power output might be lower than expected,from the design conditions.

Water 2021, 13, 3259 16 of 31
Table 4. Electricity generation and capacity factor of hydropower systems installed in real casesstudies.
ID 1 Case Study Energy Generation(GWh per Year) Capacity Factor (%)
1 Plobb-Seefeld 5.5 52.72 Ebswien 1.8 51.44 Le Châble Profray 0.843 27.55 La Douve 1 1.85 49.16 La Douve 2 0.33 50.27 L’Asse 0.5 26.58 Coppet-Terre Sainte (SITSE) 0.338 35.19 Grächen 0.858 37.411 Engelberg 0.202 41.912 Morgental (Hofen) 3.672 33.314 Meiersboden (Rabiosa) 0.339 19.916 Schwyz 0.06 44.217 La Louve 0.46 30.921 Böhmenkirch 0.076 21.722 Buchenhofen 2.5 51.025 Sur 0.51 32.326 La Gavia 0.102 15.528 Brussels-North 2.1 37.5
41–44 4 WWTPs in Seoul 2 1.905 47.347 Deer Island 3.455 19.749 Clarkson 0.426 21.6
1 Identification number. All sources of data for each case study are displayed in Appendix A. 2 For the WWTPsin Seoul (Nan Ji, Tan Chun, Joong Rang and Seo Nam) the available data are global, considering all 4 plantsaltogether.
However, these results are probably due to the negative effect of flow rate fluctuationson efficiency, as important daily, seasonal and yearly fluctuations are usual in WWTPs.To illustrate this, for one of the case studies (ID 47) yearly data for six different years areshown in Table 5. As can be observed, for this given system, the capacity factor rangedfrom 19.7 to 33.8%. If similar data were confirmed for other cases, that would imply thatefforts should focus on improving efficiency of the hydropower systems installed in thesefacilities, regarding foreseen flow rate oscillations. Therefore, research projects in thisarea should consider gathering more robust data of current performance of existing realcase studies, involving different stakeholders, including WWTPs managing organizations,turbine manufacturers and practitioners. Endorsement of these data could provide a usefulbasis for further research and future applications, learning from the experience of existinghydropower systems.
Table 5. Annual fluctuations in electricity generation and capacity factor for one case study.
ID 1 Case Study Year Electricity Generation fromHydropower (GWh/year)
Capacity Factor(%)
47 Deer Island
201320142015201620172018
5.9165.9205.8614.2434.4493.455
33.833.833.524.225.419.7
1 Identification number. All sources of data for the case study are displayed in Appendix A.
Water 2021, 13, 3259 17 of 31
3.3. Proposed Approach to Adapt Hydropower Assessment Methodologies to theSustainability Framework
As mentioned, to tackle the energy issue at wastewater systems with a sustainableapproach aiming for the SDGs, action is needed from several perspectives, efficiencyimprovement and renewable energy generation. In the previous sections, the assumptionsincluded in the existing methodologies for hydropower assessment were compared withthe background of existing real case studies. Based on the results, in this section, a novelapproach is proposed to adapt those methodologies to the sustainability framework.
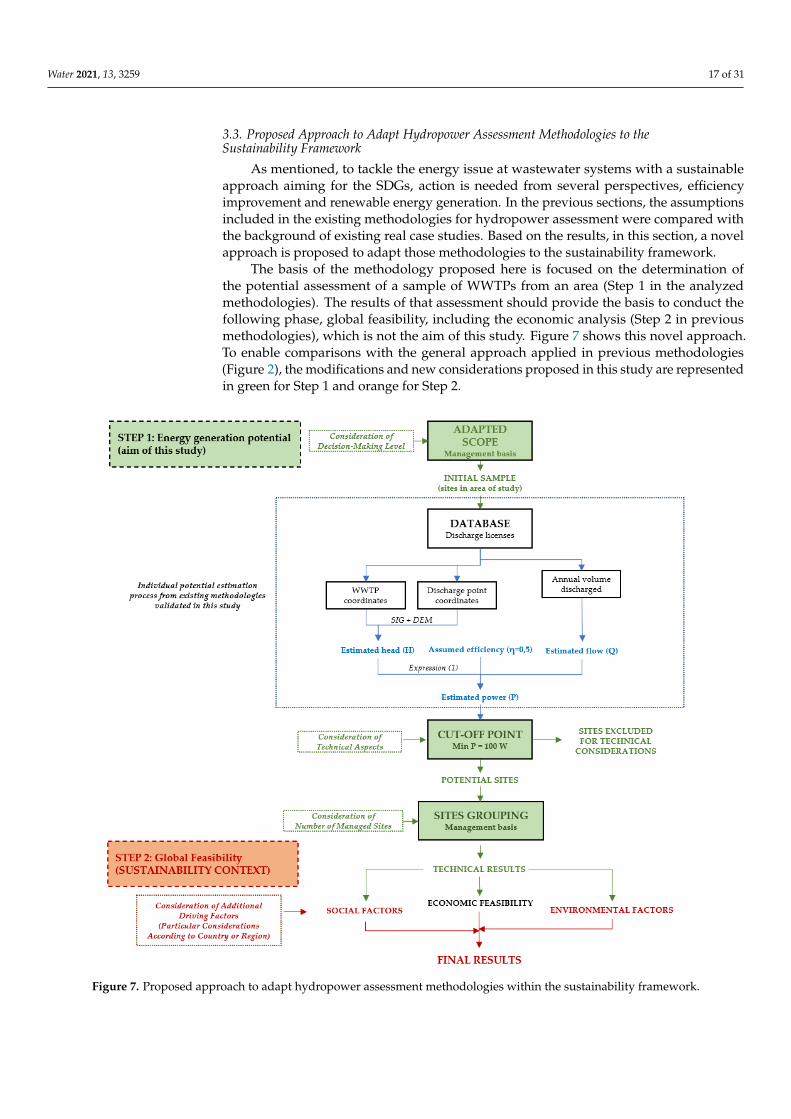
The basis of the methodology proposed here is focused on the determination ofthe potential assessment of a sample of WWTPs from an area (Step 1 in the analyzedmethodologies). The results of that assessment should provide the basis to conduct thefollowing phase, global feasibility, including the economic analysis (Step 2 in previousmethodologies), which is not the aim of this study. Figure 7 shows this novel approach.To enable comparisons with the general approach applied in previous methodologies(Figure 2), the modifications and new considerations proposed in this study are representedin green for Step 1 and orange for Step 2.
Water 2021, 13, x FOR PEER REVIEW 18 of 32
Figure 7. Proposed approach to adapt hydropower assessment methodologies within the sustainability framework.
3.3.1. Scope (Adaptation) Stakeholders at different levels have different roles in implementing strategies, from
planning and policy making to individual plant operation. In many countries, several stakeholders at various intermediate levels also take part of the decision-making process. Hence, the selection of the study area and treatment of data is crucial. Previous method-ologies proved to be valuable for estimations at a country level. However, in order to pro-vide information for an approach with a practical perspective, some modifications could be introduced in future studies at a smaller scale level. Adjusting or grouping the sample of plants to be studied to the most likely decision-making level could be useful to achieve that. This means that plants sharing management and goals should be grouped and there-fore analyzed not only individually, but also as a whole.
3.3.2. Individual Potential Estimation (Validation) As mentioned, the hydropower scheme can be located upstream or downstream. Ac-
cording to the data analyzed and regarding the main aim of this study, the scheme at the outlet of the WWTP seems to be the most suitable for a methodology to assess a group of plants in most countries. To properly assess the potential and options of the upstream scheme and possible particular configurations, many additional factors should be consid-ered and in most situations a case-by-case analysis will be needed. Therefore, the pro-posed approach is focused on the outlet position only.
Figure 7. Proposed approach to adapt hydropower assessment methodologies within the sustainability framework.

Water 2021, 13, 3259 18 of 31
3.3.1. Scope (Adaptation)
Stakeholders at different levels have different roles in implementing strategies, fromplanning and policy making to individual plant operation. In many countries, severalstakeholders at various intermediate levels also take part of the decision-making process.Hence, the selection of the study area and treatment of data is crucial. Previous methodolo-gies proved to be valuable for estimations at a country level. However, in order to provideinformation for an approach with a practical perspective, some modifications could beintroduced in future studies at a smaller scale level. Adjusting or grouping the sample ofplants to be studied to the most likely decision-making level could be useful to achieve that.This means that plants sharing management and goals should be grouped and thereforeanalyzed not only individually, but also as a whole.
3.3.2. Individual Potential Estimation (Validation)
As mentioned, the hydropower scheme can be located upstream or downstream.According to the data analyzed and regarding the main aim of this study, the schemeat the outlet of the WWTP seems to be the most suitable for a methodology to assess agroup of plants in most countries. To properly assess the potential and options of theupstream scheme and possible particular configurations, many additional factors shouldbe considered and in most situations a case-by-case analysis will be needed. Therefore, theproposed approach is focused on the outlet position only.
Concerning the obtention of the individual data for potential assessment, the methodsand assumptions made in the analyzed studies, proved to be useful as an estimation atthis first stage. The use of DEM and GIS enables us to obtain an approximate value for theavailable H from the coordinates, provided their accuracy. To obtain Q, the average flowrate of the effluent at the outlet can be estimated from annual volume discharged displayedin basin organisms’ reports, assuming 24 h/day, 365 days/year. These simplifications canbe especially useful for studies analyzing broad geographical areas with a high numberof plants and in developed countries these data are usually available. In other situations,interested stakeholders should provide those data.
To test this, a sample of the case studies was analyzed. From the webpage of theEuropean Environment Agency [87] data of annual volume and coordinates from the EUplants were obtained. The average flow rate was calculated as mentioned and using GoogleEarth, the elevation between discharge point and WWTP outlet estimated. From thesedata, potential power was computed assuming a 0.5 global efficiency proposed in the mostrecent methodologies. Some hydraulic machinery could present higher efficiencies, butthis conservative value allows for the consideration of the lower efficiencies in smallermachines and other reduction factors, such as data inaccuracies, flow fluctuations or netavailable head considering distance and head losses. In a few cases, available data enabledthe comparisons between the published data (Tables 2–4) and the potential electricitygeneration estimated with this methodology. These comparisons are shown in Table 6.
Table 6. Comparison of data from literature review for the hydropower installed and the computed values.
ID 1 Case Study Computed H (m) Computed Q(m3/s)
Potential EnergyGeneration (GWh/Year)
Real EnergyGeneration (GWh/Year)
1 Plobb -Seefeld 528 0.089 2.019 5.5
2 Ebswien 4 6.206 1.067 1.8
22 Buchenhofen 8 1.309 0.450 2.5
25 Madrid Sur 4 2.895 0.498 0.51
26 La Gavia 12 0.965 0.498 0.102
28 Brussels-North 6 3.260 0.840 2.11 Identification number. All sources of data for the case study are displayed in Appendix A.

Water 2021, 13, 3259 19 of 31
In some cases, the method could provide inaccurate results of the real options, butseeing the displayed results, they could be higher or lower. For example, the high deviationin ID 1, might be related to the fact that the real head H (see Table 3) is higher thandetected applying the methodology. In the case of ID 22, as also shown in Table 3, there is asignificant difference between flow rates Q of the WWTP and the hydropower design. Inthe case of ID 26, the difference could be due to a low efficiency of the installed system, asthe capacity factor for this plant is the lowest shown in Table 4.
Obviously in a following step more accurate data would be necessary, when designconditions for the identified potential sites of the sample have to be determined and fromthat, the economic study. However, these estimations proved to be adequate enough for thefirst stage, estimation of the potential assessment of a number of plants, aim of this study.It also reinforces the idea that establishing a strict absolute value of power as a cut-off pointmight leave out interesting sites.
3.3.3. Other Considerations (Introduction)
Bearing in mind the needs of small plants, when assessing potential of a group ofWWTPs managed by a same organization, it could be of interest to reduce the cut-offpoint to obtain a more detailed picture of the technical feasibility, before undertaking theeconomic study. The cut-off points in the analyzed methodologies were merely establishedconsidering economic feasibility in the current market conditions, with a given value ofpower, in absolute terms for an individual system. However, as indicated in [46,76], if moreaffordable hydraulic machinery was available and suitable incentives were developed,this market situation might change. This consideration could be of special interest for thewastewater sector, as the small size of a plant usually entails that electricity generationfrom biogas is an even more unlikely option. Other technologies should be developed,to provide simple and affordable solutions for at least improving energy performance atsmall plants.
During this research, it was observed that recent developments in small scale hy-dropower indicate that a suitable value to consider technical feasibility might be 100 W.Therefore, the proposed cut-off value to consider potential at a single plant could be es-tablished with that limit. In this way, the following necessary step to determine economicfeasibility would take into account not one isolated small hydropower system, but a groupof several ones. As in any other situation where economy of scale makes a big difference,not only the size, but also the number of systems should be considered, both for installationand for operation and maintenance.
Moreover, within the current energy framework, economic feasibility is crucial, but, atthe same time, a rapidly changing scenario, with different variables in different countriesinfluencing the results [8,76]. Therefore, other strategic factors tailored to the surroundingconditions should be regarded too [46,49]. No specific guidelines for that can be includedin this proposal, as decision criteria and suitable ponderation weights should be adaptedto the needs and characteristics of the sample of the studied area and, therefore, beyondthe scope of this study.
Nevertheless, some examples can be suggested. One factor could be the considerationof relative values instead of regarding absolute results. For that, the application andevaluation of suitable Key Performance Indicators (KPIs) related to SDG targets couldbe especially useful. For instance, in rural areas or in developing countries, contributionto energy independence from the grid (% of contribution to self-sufficiency) might be animportant factor to consider [84,88]. Other important factors could be pondered, such asreal possibilities to apply other renewable energy technologies. For example, hydropowermight be an option to consider in areas with very low potential for solar or wind energygeneration due to the climatic conditions. Or in regions with a confirmed high number ofWWTPs without anaerobic processes and, therefore, no possibilities for biogas generation,even as a complement for all those technologies as shown in [46] or, simply, for those plants

Water 2021, 13, 3259 20 of 31
with limited resources to tackle and implement more complex options, as lack of financingis often the main barrier for the application of any technology [4,46].
3.4. Challenges, Limitations and Further Research
From the analysis carried out in the previous sections, it is obvious that severalrenewable energy technologies should be developed, to provide simple and affordablesolutions for at least improving energy performance at small plants. Hydropower might beone of those technologies. Concerning the existing background, the main challenges andlimitations that this application faces nowadays are:
• Previous studies of potential assessment of hydropower to recover some energyembedded in wastewater have shown that certainly that potential might not be ashigh as in other technologies like CHP from biogas. However, they have shown thatsome potential exists and some energy, that otherwise would be wasted could berecovered.
• There is a low offer of affordable solutions from manufacturers within the smallestranges and low head options, whilst there could be a large potential market for those.
• Due to the lack of awareness, there is a low demand of this technology from thepotential market, in this case, most policy- and decision-makers in the wastewaterindustry.
• From the technical point of view, flow fluctuations can have a negative effect onefficiency and performance if they are not deemed in the design.
With a clear identification of those challenges, this research sought to provide a newframework for further research in this application establishing suitable connections to fillthe gaps found. Thus, further research should consider the following:
• Research projects in this area should consider gathering more robust data of currentperformance of existing real case studies, involving different stakeholders.
• Further research should also focus on optimizing efficiency performance. However,few small organizations are willing to take risks implementing new technologies andto be pioneers within their sector unless they take part of research funded projects.Therefore, projects with experimental sites to test different machinery options, con-figurations and working conditions are also needed. Experimental pilot plants andfull-scale prototypes would be particularly useful to adjust the performance of hy-draulic machinery to the needs of small WWTPs and, therefore, the potential market.
• Of special interest would be the development of affordable market solutions withinthe micro- and pico-hydropower ranges. Reliable hydraulic machinery adapted todifferent working conditions would benefit not only the wastewater sector, but alsodrinking and irrigation water systems.
• Moreover, availability of demonstration sites, real or experimental, would also beessential for disclosure within the wastewater management stakeholders, thus over-coming the current lack of awareness.
To conclude, it is expected that this study can shed light on which areas to explorewith further research, for a real and effective application of hydropower technology as a“low-hanging fruit” solution to improve sustainability at wastewater systems.
4. Conclusions
In this research, the existing background of hydropower application to wastewatersystems was examined, analyzing published methodologies for potential assessment andpublicly available data of real case studies. The analysis of methodologies concluded thateconomic feasibility is usually the only decision factor considered, although they provedto be useful for estimations at a country level. However, some modifications could beintroduced in future studies to offer a closer approach to decision-making stakeholders, ata smaller scale and regarding other driving factors too. The samples of the area of studyshould be adjusted to the most likely decision-level. To provide a complete picture of

Water 2021, 13, 3259 21 of 31
the possibilities at that level, the cut-off value to determine potential before undertakingthe economic study, should be based on technical feasibility. Nowadays, this could beestablished in an individual minimum power output of 100 W. Environmental or socialfactors such as contribution to energy self-sufficiency and real options to implement othertechnologies should be considered to ponder the results.
During this research, 49 real case studies were identified, many of them not includedin previous articles, providing then a new and more complete framework. Their technicaldata were analyzed, showing different profiles, proving that no standard solution exists.The analysis of their performance also indicated that improving machinery efficiency stillposes a major challenge, particularly regarding the fluctuations of flow rate. Despite thelimitations to obtain data, the lack of studies analyzing existing sites so far demonstratedthe need to complete this gap of knowledge to develop a better understanding of thecurrent framework before continuing with further research.
In conclusion, even though hydropower does not present the high potential of otherrenewable energy options such as biogas, with this novel approach, this technology couldcontribute to reach SDGs, increasing the offer of sustainable solutions to the wastewatersector. If affordable and suitable machinery is developed, hydropower might be consideredas a simple solution to be easily implemented in a considerable number of plants worldwide.Of particular interest would be to explore the pico- and micro- hydropower areas, withspecial focus on low head and improving efficiency, to adjust the current market to theneeds of small WWTPs and overcome the current lack of awareness. This might contributeto achieving emissions reduction targets, without facing the risks of undertaking significantmodifications of the wastewater treatment processes, facilities or affecting the surroundingenvironment. If real experience in a technology performance exists, it should be consideredas very valuable information to establish a solid framework for improvement. If there issome available energy in wastewater that can be harnessed, that should be considered veryvaluable too.
Author Contributions: Conceptualization, R.M.L.-I., P.A.L.-J., M.P.-S.; methodology, R.M.L.-I.,P.A.L.-J., M.P.-S.; writing—original draft preparation, R.M.L.-I.; writing—review and editing, P.A.L.-J.,M.P.-S. All authors have read and agreed to the published version of the manuscript.
Funding: Grant PID2020-114781RA-I00 funded by MCIN/AEI/ 10.13039/501100011033.
Institutional Review Board Statement: Not applicable.
Informed Consent Statement: Not applicable.
Data Availability Statement: Not applicable.
Conflicts of Interest: The authors declare no conflict of interest.
Appendix A
This Appendix shows all sources analyzed during this research to extract the technicaland actual performance data for the 49 identified real case studies, which have beendisplayed in the tables in Section 3.

Water 2021, 13, 3259 22 of 31
ID Case Study Sources of Data
1 References: [15,50,62,72,87]
2
References: [16,50,87]Other sources of data:
• Ebswien web page. https://www.ebswien.at/ (accessed on 12 April 2021).• EurEau—The European Federation of National Associations of Water Services. “Reducing the Energy
Footprint of the Water Sector: Possibilities, Success Stories and Bottleneck”. https://www.eureau.org/resources/briefing-notes/3890-briefing-note-on-reducing-the-energy-footprint-of-water-sector/file(accessed on 12 April 2021).
• Aqua Fluency Ltd., “Aqua Strategy review: Water utilities—what is your energy strategy?”.https://www.aquastrategy.com/article/aqua-strategy-review-water-utilities-%E2%80%93-what-your-energy-strategy (accessed on 12 April 2021).
• UNESCO, World Water Assessment Programme. World Water Development Report 2014, Water andEnergy. http://www.unesco.org/new/en/natural-sciences/environment/water/wwap/wwdr/2014-water-and-energy/ (accessed on 12 April 2021).
3
• Office fédéral de l’énergie OFEN. Confédération suisse. Programme petites centrales hydrauliques.Matthias, R. “Courant Doubs. Turbinage des eaux épurées de la Ville de la Chaux-de-Fonds. Rapporttechnique”. http://docplayer.fr/66296511-Courant-doubs-turbinage-des-eaux-epurees-de-la-ville-de-la-chaux-de-fonds.html (accessed on 12 April 2021).
• Naturelec, S.A. Turbinage des eaux épurées de la STEP de la Chaux-de-Fonds.https://www.google.es/url?sa=t&rct=j&q=&esrc=s&source=web&cd=&ved=2ahUKEwjZvubZ5ojsAhXC8-AKHR5GAGoQFjABegQIAhAB&url=https%3A%2F%2Fwww.rwbgroupe.ch%2Fdocuments%2FshowFile.asp%3FID%3D2790&usg=AOvVaw3EHBlIEqN1mDh8qH6gRsxM (accessedon 12 April 2021).
• Arcinfo. “La step de La Chaux-de-Fonds. La step obtient deux certificats de qualité et ouvre ses portes”.https://www.arcinfo.ch/articles/regions/montagnes/la-step-obtient-deux-certificats-de-qualite-et-ouvre-ses-portes-89016 (accessed on 12 April 2021).
• MHYLAB web page. http://www.mhylab.com/home.php (accessed on 12 April 2021).
4
References: [15,50,62,63,72,79]Other sources of data:
• MHYLAB web page. http://www.mhylab.com/home.php (accessed on 12 April 2021).• Independent suisse scientific web-log. http://www.entrelemanetjura.ch/BLOG_WP_351/wp-content/
uploads/2018/04/2018.04-06-RPC-publication.xlsx (accessed on 23 January 2021).• Swiss Federal Office of Energy. “Statistics of hydroelectric installations in Switzerland”.
https://www.bfe.admin.ch/bfe/en/home/supply/renewable-energy/hydropower.html (accessed on 23January 2021).
5
References: [63,79,80]Other sources of data:
• Swiss Federal Office of Energy. “Statistics of hydroelectric installations in Switzerland”.https://www.bfe.admin.ch/bfe/en/home/supply/renewable-energy/hydropower.html (accessed on 23January 2021).
6
References: [63,80]Other sources of data:
• MHYLAB web page. http://www.mhylab.com/home.php (accessed on 12 April 2021).• Swiss Federal Office of Energy. “Statistics of hydroelectric installations in Switzerland”.
https://www.bfe.admin.ch/bfe/en/home/supply/renewable-energy/hydropower.html (accessed on 23January 2021).
7 References: [15,40,50,62,63,72,79,80]

Water 2021, 13, 3259 23 of 31
ID Case Study Sources of Data
8
References: [40]Other sources of data:
• MHYLAB web page. http://www.mhylab.com/home.php (accessed on 12 April 2021).• Independent suisse scientific web-log. http://www.entrelemanetjura.ch/BLOG_WP_351/wp-content/
uploads/2018/04/2018.04-06-RPC-publication.xlsx (accessed on 23 January 2021).• Services Industriels de Terre Sainte et Environs. “Rapport de Gestion 2018”. https://docplayer.fr/156112
495-Rapport-de-gestion-2018-services-industriels-de-terre-sainte-et-environs.html (accessed on 23January 2021).
9
References: [63]Other sources of data:
• MHYLAB web page. http://www.mhylab.com/home.php (accessed on 12 April 2021). Independentsuisse scientific web-log. http://www.entrelemanetjura.ch/BLOG_WP_351/wp-content/uploads/2018/04/2018.04-06-RPC-publication.xlsx (accessed on 23 January 2021).
• HÄNY web page. https://www.haeny.com/ (accessed on 12 April 2021).
10 • HÄNY web page. https://www.haeny.com/ (accessed on 12 April 2021).
11
References: [63]Other sources of data:
• ARA Engelberg web page. https://www.gde-engelberg.ch/unterinstanzen/14952 (accessed on 23January 2021).
• Independent suisse scientific web-log. http://www.entrelemanetjura.ch/BLOG_WP_351/wp-content/uploads/2018/04/2018.04-06-RPC-publication.xlsx (accessed on 23 January 2021).
• Swisswater web page. https://www.swisswater.ch/en/references/switzerland/engelberg-wwtp(accessed on 23 January 2021).
12
References: [63,79]Other sources of data:
• ARA Morgental web page. https://www.morgental.ch/ (accessed on 23 January 2021).• Wild Armaturen web page. https://www.wildarmaturen.ch/ (accessed on 23 January 2021).
Independent suisse scientific web-log. http://www.entrelemanetjura.ch/BLOG_WP_351/wp-content/uploads/2018/04/2018.04-06-RPC-publication.xlsx (accessed on 23 January 2021).
• Swiss Federal Office of Energy. “Statistics of hydroelectric installations in Switzerland”.https://www.bfe.admin.ch/bfe/en/home/supply/renewable-energy/hydropower.html (accessed on 23January 2021).
13
References: [63]Other sources of data:
• Suisse Energie. Programme petites centrales hydrauliques. “Newsletter Petites centrales hydrauliques Nº26”. https://www.google.es/url?sa=t&rct=j&q=&esrc=s&source=web&cd=&ved=2ahUKEwjeuPvi_IPsAhUP8BQKHT4HCjIQFjACegQIARAB&url=https%3A%2F%2Fpubdb.bfe.admin.ch%2Ffr%2Fpublication%2Fdownload%2F7993&usg=AOvVaw1qi1rSsYg5IDpqmHHrimyr (accessed on 23 January2021).
• ee-news. https://www.ee-news.ch/de/article/36956/stepd-aire-produit-du-biogaz-avec-les-boues-des-stations-d-epuration-du-canton (accessed on 23 January 2021).
14
• Rabiosa Energie web page. https://www.rabiosa-energie.ch/ (accessed on 23 January 2021).• Schweizerische Arbeitsgemeinschaft für die Berggebiete (SAB), Schweizer Verband Kommunale
Infrastruktur (SVKI). “Kommunales Infrastrukturmanagement im Berggebiet”.http://www.sab.ch/fileadmin/user_upload/customers/sab/Dokumente/Publikationen_SAB/Pub_abJuli2020/Broschu__re_Kommunale_Infrastruktur_dt_.pdf (accessed on 23 January 2021).
• Independent suisse scientific web-log. http://www.entrelemanetjura.ch/BLOG_WP_351/wp-content/uploads/2018/04/2018.04-06-RPC-publication.xlsx (accessed on 23 January 2021).
15 • STEP La Saunerie web page. https://www.steplasaunerie.ch/ (accessed on 12 April 2021).

Water 2021, 13, 3259 24 of 31
ID Case Study Sources of Data
16
• ARA Schwyz web page. https://ara-schwyz.ch/ (accessed on 23 January 2021).• Ebs Energie web page.
https://www.ebs.swiss/wp/wp-content/uploads/2020/08/kraftwerke_akw-ara-schwyz.pdf(accessed on 23 January 2021).
• Bundesamt für Umwelt BAFU. “Energieeffizienz und Energieproduktion auf ARA”.https://www.bafu.admin.ch/bafu/de/home.html (accessed 10 April 2021).
17 References: [15,62,72]
18 • ARA Küsnacht-Erlenbach-Zumikon web page. https://www.kuesnacht.ch/page/189 (accessed 25January 2021).
19
References: [87]Other sources of data:
• ASCOMADE. “Valorisation des ressources issues du traitement des eaux usées”.https://ascomade.org/wp-content/uploads/2020/05/Note-de-synthese-Valorisation-des-ressources-issues-du-traitement-des-eaux-usees.pdf (accessed on 11 April 2021).
• Guide del’eau. “Chartres Métropole turbine ses eaux usées”.https://www.revue-ein.com/actualite/chartres-metropole-turbine-ses-eaux-usees (accessed on 11 April2021).
• Aqualter web page. http://www.aqualter.org/construction-traitement-des-eaux-usees-urbaines/(accessed on 11 April 2021).
20
References: [41,63,87]Other sources of data:
• Bundesministeriums für Wirtschaft und Energie. “Wasserkraft Wissenschaftlicher Bericht”.https://www.erneuerbare-energien.de/EE/Redaktion/DE/Downloads/Berichte/erfahrungsbericht-evaluierung-eeg-2014-2d.pdf?__blob=publicationFile&v=5 (accessed 25 January 2021).
21
References: [87]Other sources of data:
• Bayerisches Landesamt für Umwelt. “Energie aus Abwasser”. https://www.dwa-bw.de/files/_media/content/PDFs/LV_Baden-Wuerttemberg/Homepage/BW-Dokumente/Homepage%202013/Service/Fachdatenbank/Leitfaden%20Energie%20aus%20Abwasser.pdf (accessed on 11 April 2021).
22
References: [87]Other sources of data:
• ARA Buchenhofen web page.https://www.wupperverband.de/unsere-anlagen/klaeranlagen/klaeranlage-buchenhofen (accessedon 13 April 2021).
23
References: [62,63,87]Other sources of data:
• Water Briefing. “Yorkshire Water to build UK’s first energy-neutral sewage works”.https://waterbriefing.org/home/company-news/item/5226-yorkshire-water-to-build-uks-first-energy-neutral-sewage-works (accessed on 13 April 2021).
• Spaans Babcock Ltd. “Hydro Power using Wastewater at Esholt WwTW”.https://cms.esi.info/Media/documents/54053_1316689157666.pdf (accessed on 13 April 2021).

Water 2021, 13, 3259 25 of 31
ID Case Study Sources of Data
24
References: [87]Other sources of data:
• Ayuntamiento de Zaragoza. “Ficha EDAR Cartuja”.https://www.zaragoza.es/contenidos/Ecociudad/Ficha_Cartuja.pdf (accessed on 11 April 2021).
• EDAR 4.0. http://www.edar40.eus/aplicacion/cartuja/ (accessed on 13 April 2021). IAGUA.https://www.iagua.es/noticias/espana/ayuntamiento-zaragoza/15/03/16/mejora-eficiencia-energetica-edar-cartuja-ahorrara (accessed on 13 April 2021).
• Veolia web page. https://www.veolia.com/latamib/es/casos-estudio/depuradora-utedeza-planta-tratamiento-aguas-residuales-cartuja (accessed on 13 April 2021).
• Proyecto AQUALITRANS. “Guía de mejores practices en la operación de las EDAR”. http://blogs.xunta.gal/aqualitrans/wp-content/uploads/sites/14/2020/08/200122-libro-ES_def_calidad_media.pdf(accessed on 11 April 2021).
25
References: [39,45,87]Other sources of data:
• Veolia web page. https://www.veolia.com/en (accessed on 23 January 2021).• Madrid Subterra. “Energía a partir de las aguas residuals”.
https://www.madridsubterra.es/como-generar-energia-a-partir-de-las-aguas-residuales/ (accessedon 23 January 2021).
• IAGUA. https://www.iagua.es/noticias/usos-energeticos/14/05/22/canal-de-isabel-ii-invierte-mas-de-90-millones-de-euros-en-depuracion-y-adquisicion-de-energi (accessed on 13 April 2021).
• Canal Isabel II. “Informe Anual 2018”. https://www.canaldeisabelsegunda.es/documents/20143/4863584/Informe_Anual_2018.pdf/8e06c922-9838-f19b-3a66-ca10263ba268?t=1598524249852 (accessed on 23January 2021).
26
References: [39,45,87]Other sources of data:
• Canal Isabel II. “Informe Anual 2018”. https://www.canaldeisabelsegunda.es/documents/20143/4863584/Informe_Anual_2018.pdf/8e06c922-9838-f19b-3a66-ca10263ba268?t=1598524249852 (accessed on 23January 2021).
27
References: [87]Other sources of data:
• Veolia web page. https://www.veolia.com/en (accessed on 23 January 2021).• Veolia, Apa Nova Bucuresti. “Glina Wastewater Treatment Plant”.
https://www.veolia.ro/sites/g/files/dvc2956/files/document/2015/04/Pliant_Glina_eng.pdf(accessed on 12 April 2021).
28
References: [87]Other sources of data:
• Veolia web page. https://www.veolia.com/en (accessed on 23 January 2021).• EurEau—The European Federation of National Associations of Water Services. “Reducing the Energy
Footprint of the Water Sector: Possibilities, Success Stories and Bottleneck”. https://www.eureau.org/resources/briefing-notes/3890-briefing-note-on-reducing-the-energy-footprint-of-water-sector/file(accessed on 12 April 2021).
• Veolia, Aquiris web page “Brussels North Wastewater Treatment Plant”. https://www.aquiris.be/en(accessed on 12 April 2021).
29
References: [87]Other sources of data:
• Intercommunale Namuroise de Service Publics. “L’Assainissement des Eaus Usées en Province deNamur. Déclaration Environnementales Resultats 2018”.https://www.inasep.be/sites/default/files/rapport_emas_resultats_2018-19_light.pdf (accessed on 23January 2021).

Water 2021, 13, 3259 26 of 31
ID Case Study Sources of Data
30
References: [50,62,63]Other sources of data:
• Radcliffe J.C.,“The water energy nexus in Australia—The outcome of two crises,” Water-Energy Nexus,vol. 1, no. 1, pp. 66–85, 2018, doi: 10.1016/j.wen.2018.07.003.
• Sydney Water web page. https://www.sydneywater.com.au/SW/index.htm (accessed on 5 April 2021).• Sydney Water. “North Head Wastewater Treatment Plant technical data sheet”.
https://www.sydneywater.com.au/web/groups/publicwebcontent/documents/document/zgrf/mjiy/~edisp/dd_222134.pdf (accessed on 5 April 2021).
31
• Hodgkinson A., Daigger G. and Skeels P.M. “The Gippsland Water Factory-Recent Australian Experiencewith Industrial and Urban Ecology”. https://www.researchgate.net/publication/277361237 (accessed on13 April 2021).
• Gippsland Water web page. “Gippsland Water taking big steps to reduce carbon footprint”.https://www.gippswater.com.au/media-centre/media-releases/2019/09/gippsland-water-taking-big-steps-reduce-carbon-footprint (accessed on 13 April 2021).
32
References: [50,63]Other sources of data:
• MHYLAB web page. http://www.mhylab.com/home.php (accessed on 12 April 2021).• SUEZ’s degremont®water handbook. “As Samra wastewater treatment plant (Jordan)”.
https://www.suezwaterhandbook.com/case-studies/wastewater-treatment/As-Samra-wastewater-treatment-plant-Jordan (accessed on 13 April 2021).
• MHYLAB. “Assainissement de la ville d’Amman Royaume Hachémite de Jordanie”.http://www.mhylab.ch/images/public/images/Despro17-AS%20SAMRA.pdf (accessed on 13 April2021).
• Degrémont. “Micro-turbine hydraulique. Le Grand Amman”.http://www.mhylab.ch/images/public/images/Despro-As%20Samra-Suez.pdf (accessed on 13 April2021).
33
References: [63]Other sources of data:
• MHYLAB web page. http://www.mhylab.com/home.php (accessed on 12 April 2021).• SUEZ’s degremont®water handbook. “As Samra wastewater treatment plant (Jordan)”.
https://www.suezwaterhandbook.com/case-studies/wastewater-treatment/As-Samra-wastewater-treatment-plant-Jordan (accessed on 13 April 2021).
34
References: [37]Other sources of data:
• Dong-Hun Nah and Seung-Hwan Lee, “Feasibility Study on the Construction of Small Hydro-PowerPlants in Gumi Sewage Treatment Plant Discharge Point,” Journal of Korean Society of Water andWastewater, vol. 24, no. 2, pp. 173–181, Apr. 2010.http://www.koreascience.or.kr/article/JAKO201032059187545.page (accessed on 1 April 2021).
• Ki-Jung Kim, Park Yoo-shin, Ministry of Land, Infrastructure and Transport. Infrastructure R&D Report.R&D/14CTAP-C078605-01. Publication registration number: 11-1613000-001951-01. https://www.google.es/url?sa=t&rct=j&q=&esrc=s&source=web&cd=&ved=2ahUKEwi9j8jOr-vrAhVE1xoKHWTbAy8QFjAAegQIBhAB&url=https%3A%2F%2Fwww.konetic.or.kr%2Finclude%2FEUN_download.asp%3Fstr%3DEUN_ENV_TECH%26str2%3D2434&usg=AOvVaw11E0d5f_ZNouDDbWUxSz2- (accessedon 1 April 2021).
• K.-J. Chae et al., “Micro-Hydropower System with a Semi-Kaplan Turbine for Sewage Treatment PlantApplication: Kiheung Respia Case Study,” J. Kor. Soc. Enivron. Eng., vol. 35, no. 5, pp. 363–370, May2013. https://www.koreascience.or.kr/article/JAKO201336161060967.do (accessed on 1 April 2021).

Water 2021, 13, 3259 27 of 31
ID Case Study Sources of Data
35 • Dong-Hun Nah and Seung-Hwan Lee, “Feasibility Study on the Construction of Small Hydro-PowerPlants in Gumi Sewage Treatment Plant Discharge Point,” Journal of Korean Society of Water andWastewater, vol. 24, no. 2, pp. 173–181, Apr. 2010.http://www.koreascience.or.kr/article/JAKO201032059187545.page (accessed on 1 April 2021).
• Ki-Jung Kim, Park Yoo-shin, Ministry of Land, Infrastructure and Transport. Infrastructure R&D Report.R&D/14CTAP-C078605-01. Publication registration number: 11-1613000-001951-01. https://www.google.es/url?sa=t&rct=j&q=&esrc=s&source=web&cd=&ved=2ahUKEwi9j8jOr-vrAhVE1xoKHWTbAy8QFjAAegQIBhAB&url=https%3A%2F%2Fwww.konetic.or.kr%2Finclude%2FEUN_download.asp%3Fstr%3DEUN_ENV_TECH%26str2%3D2434&usg=AOvVaw11E0d5f_ZNouDDbWUxSz2- (accessed on 1April 2021).
• K.-J. Chae et al., “Micro-Hydropower System with a Semi-Kaplan Turbine for Sewage Treatment PlantApplication: Kiheung Respia Case Study,” J. Kor. Soc. Enivron. Eng., vol. 35, no. 5, pp. 363–370, May2013. https://www.koreascience.or.kr/article/JAKO201336161060967.do (accessed on 1 April 2021).
36
37
38
References: [37]Other sources of data:
• Dong-Hun Nah and Seung-Hwan Lee, “Feasibility Study on the Construction of Small Hydro-PowerPlants in Gumi Sewage Treatment Plant Discharge Point,” Journal of Korean Society of Water andWastewater, vol. 24, no. 2, pp. 173–181, Apr. 2010.http://www.koreascience.or.kr/article/JAKO201032059187545.page (accessed on 1 April 2021).
39
• K.-J. Chae et al., “Micro-Hydropower System with a Semi-Kaplan Turbine for Sewage Treatment PlantApplication: Kiheung Respia Case Study,” J. Kor. Soc. Enivron. Eng., vol. 35, no. 5, pp. 363–370, May2013. https://www.koreascience.or.kr/article/JAKO201336161060967.do (accessed on 1 April 2021).
• Daegu Environmental Corporation web page.http://www.dgeic.or.kr/english/business/business01.php?method=business01 (accessed on 1 April2021).
40• K.-J. Chae et al., “Micro-Hydropower System with a Semi-Kaplan Turbine for Sewage Treatment Plant
Application: Kiheung Respia Case Study,” J. Kor. Soc. Enivron. Eng., vol. 35, no. 5, pp. 363–370, May2013. https://www.koreascience.or.kr/article/JAKO201336161060967.do (accessed on 1 April 2021).
41 References: [37]
42 Other sources of data:
• Ki-Jung Kim, Park Yoo-shin, Ministry of Land, Infrastructure and Transport. Infrastructure R&D Report.R&D/14CTAP-C078605-01. Publication registration number: 11-1613000-001951-01. https://www.google.es/url?sa=t&rct=j&q=&esrc=s&source=web&cd=&ved=2ahUKEwi9j8jOr-vrAhVE1xoKHWTbAy8QFjAAegQIBhAB&url=https%3A%2F%2Fwww.konetic.or.kr%2Finclude%2FEUN_download.asp%3Fst%3DEUN_ENV_TECH%26str2%3D2434&usg=AOvVaw11E0d5f_ZNouDDbWUxSz2- (accessed on 1April 2021).
• Y. J. Choi, Seoul Solution, Water Research Institute. “Energy Generating WWTP: From Treatment toEnergy Production”.https://seoulsolution.kr/en/content/energy-generating-wwtp-treatment-energy-production(accessed on 1 April 2021).
43
44
45 References: [41,63]
46 References: [41,63]
47
References: [15,50,62,63]Other sources of data:
• M. Khalkhali and W. Mo, “The energy implication of climate change on urban wastewater systems,”Journal of Cleaner Production, vol. 267, Sep. 2020, doi: 10.1016/j.jclepro.2020.121905.Capua, M.,Dzwonkoski J., Harris, C. Plummer J.D., “Reclamation of Power in Wastewater Treatment Facilities”.https://web.wpi.edu/Pubs/E-project/Available/E-project-031014-202035/unrestricted/MQP_-_Reclamation_of_Power_in_Wastewater_Treatment_Facilities.pdf (accessed on 23 January 2021).
• Massachusetts Water Resources Authority web page. https://www.mwra.com/ (accessed on 13 April 2021).

Water 2021, 13, 3259 28 of 31
ID Case Study Sources of Data
48
References: [15,62,63]Other sources of data:
• The City of San Diego web page. https://www.sandiego.gov/public-utilities/customer-service/water-wastewater-facilities/point-loma(accessed 25 January 2021).
• NACWA, WERF, Water Environment Federation. “The Utility of the Future. A Blueprint for Action”.https://www.wef.org/globalassets/assets-wef/direct-download-library/public/03---resources/waterresourcesutilityofthefuture_blueprintforaction_final.pdf (accessed 25 January 2021).
49
• Regional Municipality of Peel Office of Climate Change and Energy Management. “The Region of PeelEnergy Conservation and Demand Management Plan in compliance with Ontario Regulation 507/18 1”.https://www.peelregion.ca/climate-energy/pdf/Energy_Conservation-and-Demand_Management_Plan.pdf (accessed on 1 April 2021).
• Regional Municipality of Peel. “Clarkson Wastewater Treatment Plant Annual Report 2019.”https://peelregion.ca/wastewater/_media/clarkson-WWTP-annual-report.pdf (accessed on 1 April2021).
References1. Delanka-Pedige, H.M.K.; Munasinghe-Arachchige, S.P.; Abeysiriwardana-Arachchige, I.S.A.; Nirmalakhandan, N. Evaluating
wastewater treatment infrastructure systems based on UN Sustainable Development Goals and targets. J. Clean. Prod. 2021, 298,126795. [CrossRef]
2. Elavarasan, R.M.; Pugazhendhi, R.; Jamal, T.; Dyduch, J.; Arif, M.T.; Kumar, N.M.; Shafiullahg, G.M.; Chopra, S.S.; Nadarajahh,M. Envisioning the UN Sustainable Development Goals (SDGs) through the lens of energy sustainability (SDG 7) in the post-COVID-19 world. Appl. Energy 2021, 292, 116665. [CrossRef]
3. Garcia, A.V.M.; López-Jiménez, P.A.; Sánchez-Romero, F.J.; Pérez-Sánchez, M. Objectives, keys and results in the water networksto reach the sustainable development goals. Water 2021, 13, 1268. [CrossRef]
4. World Water Assessment Programme (United Nations). Wastewater: The Untapped Resource: The United Nations World WaterDevelopment Report 2017. 2017. Available online: https://unesdoc.unesco.org/ark:/48223/pf0000247153 (accessed on 7 April2021).
5. EurEau—The European Federation of National Associations of Water Services, The Governance of Water Services in EUROPE2020 Edition. Brussels. 2020. Available online: https://www.eureau.org/resources/publications/eureau-s-publications/5219-the-governance-of-water-services-in-europe-2020-edition/file (accessed on 1 September 2021).
6. Kehrein, P.; van Loosdrecht, M.; Osseweijer, P.; Posada, J.; Dewulf, J. The SPPD-WRF framework: A novel and holistic methodologyfor strategical planning and process design of water resource factories. Sustainability 2020, 12, 4168. [CrossRef]
7. Guerrini, A.; Romano, G.; Ferretti, S.; Fibbi, D.; Daddi, D. A performance measurement tool leading wastewater treatment plantstoward economic efficiency and sustainability. Sustainability 2016, 8, 1250. [CrossRef]
8. García-López, M.; Melgarejo, J.; Montano, B. The financing of wastewater treatment and the balance of payments for waterservices: Evidence from municipalities in the region of Valencia. Sustainability 2021, 13, 5874. [CrossRef]
9. Kehrein, P.; van Loosdrecht, M.; Osseweijer, P.; Garfí, M.; Dewulf, J.; Posada, J. A critical review of resource recovery frommunicipal wastewater treatment plants-market supply potentials, technologies and bottlenecks. Environ. Sci. Water Res. Technol.2020, 6, 877–910. [CrossRef]
10. Capodaglio, A.G.; Olsson, G. Energy issues in sustainable urban wastewater management: Use, demand reduction and recoveryin the urban water cycle. Sustainability 2020, 12, 266. [CrossRef]
11. Revollar, S.; Meneses, M.; Vilanova, R.; Vega, P.; Francisco, M. Eco-efficiency assessment of control actions in wastewater treatmentplants. Water 2021, 13, 612. [CrossRef]
12. Zohrabian, A.; Sanders, K.T. Emitting less without curbing usage? Exploring greenhouse gas mitigation strategies in the waterindustry through load shifting. Appl. Energy 2021, 298, 117194. [CrossRef]
13. Paulu, A.; Bartácek, J.; Šerešová, M.; Kocí, V. Combining process modelling and lca to assess the environmental impacts ofwastewater treatment innovations. Water 2021, 13, 1246. [CrossRef]
14. Nakkasunchi, S.; Hewitt, N.J.; Zoppi, C.; Brandoni, C. A review of energy optimization modelling tools for the decarbonisation ofwastewater treatment plants. J. Clean. Prod. 2021, 279, 23811. [CrossRef]
15. Diaz-Elsayed, N.; Rezaei, N.; Guo, T.; Mohebbi, S.; Zhang, Q. Wastewater-based resource recovery technologies across scale:A review. Resour. Conserv. Recycl. 2019, 145, 94–112. [CrossRef]
16. Maktabifard, M.; Zaborowska, E.; Makinia, J. Achieving energy neutrality in wastewater treatment plants through energy savingsand enhancing renewable energy production. Rev. Environ. Sci. Biotechnol. 2018, 17, 655–689. [CrossRef]

Water 2021, 13, 3259 29 of 31
17. Rodriguez, D.J.; Serrano, H.A.; Delgado, A.; Nolasco, D.; Saltiel, G. From Waste to Resource Shifting Paradigms for Smarter WastewaterInterventions in Latin America and the Caribbean; Worldbank: Washington, DC, USA, 2020. [CrossRef]
18. Alvarez, V.V.; Buchauer, K. East Asia and Pacific—Wastewater to Energy Processes: A Technical Note for Utility Managers in EAPCountries: Main Report (English); World Bank Group: Washington, DC, USA, 2014. Available online: https://documents.worldbank.org/en/publication/documents-reports/documentdetail/489941468188683153/main-report (accessed on 11 April2021).
19. Campana, P.E.; Mainardis, M.; Moretti, A.; Cottes, M. 100% renewable wastewater treatment plants: Techno-economic assessmentusing a modelling and optimization approach. Energy Convers. Manag. 2021, 239, 114214. [CrossRef]
20. Wang, K.; Nakakubo, T. Strategy for introducing sewage sludge energy utilization systems at sewage treatment plants in largecities in Japan: A comparative assessment. J. Clean. Prod. 2021, 316, 128282. [CrossRef]
21. Ghimire, U.; Sarpong, G.; Gude, V.G. Transitioning wastewater treatment plants toward circular economy and energy sustainabil-ity. ACS Omega 2021, 6, 11794–11803. [CrossRef] [PubMed]
22. Baena-Moreno, F.M.; Malico, I.; Marques, I.P. Promoting sustainability: Wastewater treatment plants as a source of biomethane inregions far from a high-pressure grid. a real portuguese case study. Sustainability 2021, 13, 8933. [CrossRef]
23. Tchobanoglous, G.; Stensel, H.D.; Tsuchihashi, R.; Burton, F.; Abu-Orf, M.; Bowden, G.; Pfrang, W. Wastewater Engineering:Treatment and Resource Recovery, Fifth Edition Metcalf & Eddy I AECOM, 5th ed.; Mc Graw Hill Education: New York, NY, USA,2014.
24. Gandiglio, M.; Lanzini, A.; Soto, A.; Leone, P.; Santarelli, M. Enhancing the energy efficiency of wastewater treatment plantsthrough co-digestion and fuel cell systems. Front. Environ. Sci. 2017, 5, 70. [CrossRef]
25. Scarlat, N.; Dallemand, J.F.; Fahl, F. Biogas: Developments and perspectives in Europe. Renew. Energy 2018, 129, 457–472.[CrossRef]
26. Merlin, G.; Outin, J.; Boileau, H. Co-Digestion of Extended Aeration Sewage Sludge with Whey, Grease and Septage: Experimentaland Modeling Determination. Sustainability 2021, 13, 9199. [CrossRef]
27. Yan, P.; Qin, R.-C.; Guo, J.-S.; Yu, Q.; Li, Z.; Chen, Y.-P.; Shen, Y.; Fang, F. Net-zero-energy model for sustainable wastewatertreatment. Environ. Sci. Technol. 2017, 51, 1017–1023. [CrossRef]
28. Reifsnyder, S.; Cecconi, F.; Rosso, D. Dynamic load shifting for the abatement of GHG emissions, power demand, energy use, andcosts in metropolitan hybrid wastewater treatment systems. Water Res. 2021, 200, 117224. [CrossRef]
29. Risch, E.; Boutin, C.; Roux, P. Applying life cycle assessment to assess the environmental performance of decentralised versuscentralised wastewater systems. Water Res. 2021, 196, 116991. [CrossRef]
30. Zahediasl, A.; Bakhshipour, A.E.; Dittmer, U.; Haghighi, A. Toward decentralised sanitary sewage collection systems: A multiob-jective approach for cost-effective and resilient designs. Water 2021, 13, 1886. [CrossRef]
31. Chae, K.J.; Kim, I.S.; Ren, X.; Cheon, K.H. Reliable energy recovery in an existing municipal wastewater treatment plant with aflow-variable micro-hydropower system. Energy Convers. Manag. 2015, 101, 681–688. [CrossRef]
32. del Río-Gamero, B.; Ramos-Martín, A.; Melián-Martel, N.; Pérez-Báez, S. Water-energy nexus: A pathway of reaching the zero netcarbon in wastewater treatment plants. Sustainability 2020, 12, 9377. [CrossRef]
33. Jorge, C.; Almeida, M.D.C.; Covas, D. Performance assessment system for energy efficiency in wastewater systems. Water 2021,13, 1807. [CrossRef]
34. Rodríguez-Villanueva, P.; Sauri, D. Wastewater treatment plants in mediterranean spain: An exploration of relations betweenwater treatments, water reuse, and governance. Water 2021, 13, 1710. [CrossRef]
35. Södergren, K.; Palm, J. How organization models impact the governing of industrial symbiosis in public wastewater management.An explorative study in Sweden. Water 2021, 13, 824. [CrossRef]
36. Chae, K.J.; Kang, J. Estimating the energy independence of a municipal wastewater treatment plant incorporating green energyresources. Energy Convers. Manag. 2013, 75, 664–672. [CrossRef]
37. Republic of Korea Ministry of Environment. History of Korea’s Sewerage System Development. 2017. Available online:https://www.ib-net.org/docs/History_of_Korea’s_sewerage_system_development.pdf (accessed on 7 April 2021).
38. Dirección General del Agua—Secretaría de Estado de Medio Ambiente—Ministerio para la Transición Ecológica y el RetoDemográfico, Plan Nacional de Depuración, Saneamiento, Eficiencia, Ahorro y Reutilización PLAN DSEAR. Madrid (Spain).2021. Available online: https://www.boe.es/diario_boe/txt.php?id=BOE-B-2020-36826 (accessed on 1 September 2021).
39. Polo, J.F.; García, D.A.; Baviera, R.B.; Sevilla, J.S.; Ojeda, E.L. Huella Energética en el Ciclo Integral del Agua en la Comunidad deMadrid—Fundación Canal. 2016. Available online: http://www.madrid.org/bvirtual/BVCM019568.pdf (accessed on 13 April2021).
40. Canton de Vaud, Direction Générale de L’environnement (DGE), and Urban et Rural (DIREV) Direction de L’energie (DIREN)et Direction de L’environnement Industriel, Etat des Lieux et Perspectives Énergétiques des STEP Vaudoises. 2018. Availableonline: https://www.vd.ch/fileadmin/user_upload/themes/environnement/energie/fichiers_pdf/rapp-1803-STEP-energie-etat-lieux.pdf (accessed on 2 September 2021).
41. ACWA. Oregon Association of Clean Water Agencies and Energy Trust of Oregon, Energy Independence & Efficiency for OregonWastewater Treatment Plants Pilot Project. 2008. Available online: https://www.energytrust.org/wp-content/uploads/2016/11/080703_ACWA__IP_Report.pdf (accessed on 12 April 2021).

Water 2021, 13, 3259 30 of 31
42. Najar, N.; Persson, K.M. A sustainability index within water and wastewater management in Sweden: An evaluation of eightcase studies. Water 2021, 13, 1879. [CrossRef]
43. Prochaska, C.; Zouboulis, A. A mini-review of urban wastewater treatment in Greece: History, development and future challenges.Sustainability 2020, 12, 6133. [CrossRef]
44. Waterworld. Águas de Portugal Group Works toward 100% Renewable Power. 31 July 2020. Available online: https://www.waterworld.com/water-utility-management/energy-management/article/14180806/guas-de-portugal-group-to-go-energy-selfsustaining-with-100-renewable-power (accessed on 8 April 2021).
45. Canal de Isabel II. Informe de Sostenibilidad 2019. 2020. Available online: https://www.canaldeisabelsegunda.es/documents/20143/4132298/AF_Informe+Sostenibilidad+2019_20102020.pdf/5667a38b-0231-b651-69b4-a703a9af5d27?t=1603193297679 (ac-cessed on 8 April 2021).
46. Llácer-Iglesias, R.M.; López-Jiménez, P.A.; Pérez-Sánchez, M. Energy self-sufficiency aiming for sustainable wastewater systems:Are all options being explored? Sustainability 2021, 13, 5537. [CrossRef]
47. Kretschmer, F.; Neugebauer, G.; Stoeglehner, G.; Ertl, T. Participation as a key aspect for establishing wastewater as a source ofrenewable energy. Energies 2018, 11, 3232. [CrossRef]
48. Kougias, I.; Aggidis, G.; Avellan, F.; Deniz, S.; Lundin, U.; Moro, A.; Muntean, S.; Novara, D.; Pérez-Díaz, J.I.; Quaranta, E.; et al.Analysis of emerging technologies in the hydropower sector. Renew. Sustain. Energy Rev. 2019, 113, 109257. [CrossRef]
49. Adeyeye, K.; Gallagher, J.; McNabola, A.; Ramos, H.M.; Coughlan, P. Socio-technical viability framework for micro hydropowerin group water-energy schemes. Energies 2021, 14, 4222. [CrossRef]
50. Choulot, A.; Denis, V.; Punys, P. Integration of Small Hydro Turbines into Existing Water Infrastructures. In Hydropower—Practiceand Application; Samadi-Boroujeni, H., Ed.; IntechOpen: Rijeka, Croatia, 2012. Available online: http://www.intechopen.com/books/hydropower-practice-and-application/integration-of-small-turbines-into-water-infrastructure (accessed on 11 April2021).
51. McNabola, A.; Coughlan, P.; Williams, A.P. Energy recovery in the water industry: An assessment of the potential of micro-hydropower. Water Environ. J. 2014, 28, 294–304. [CrossRef]
52. Pérez-Sánchez, M.; Sánchez-Romero, F.J.; Ramos, H.M.; López-Jiménez, P.A. Energy recovery in existing water networks: Towardsgreater sustainability. Water 2017, 9, 97. [CrossRef]
53. Ak, M.; Kentel, E.; Kucukali, S. A fuzzy logic tool to evaluate low-head hydropower technologies at the outlet of wastewatertreatment plants. Renew. Sustain. Energy Rev. 2017, 68, 727–737. [CrossRef]
54. Bekker, A.; van Dijk, M.; Niebuhr, C.M.; Hansen, C. Framework development for the evaluation of conduit hydropower withinwater distribution systems: A South African case study. J. Clean. Prod. 2021, 283, 125326. [CrossRef]
55. Ramos, H.; de Almeida, A.B.; Portela, M.M.; de Almeida, H.P. Guideline for Design of Small Hydropower Plants; WREAN and DED:Belfast, UK, 2000.
56. Quaranta, E.; Revelli, R. Gravity water wheels as a micro hydropower energy source: A review based on historic data, designmethods, efficiencies and modern optimizations. Renew. Sustain. Energy Rev. 2018, 97, 414–427. [CrossRef]
57. Zhou, D.; Deng, Z. Ultra-low-head hydroelectric technology: A review. Renew. Sustain. Energy Rev. 2017, 78, 23–30. [CrossRef]58. YoosefDoost, A.; Lubitz, W.D. Archimedes screw turbines: A sustainable development solution for green and renewable energy
generation-a review of potential and design procedures. Sustainability 2020, 12, 7352. [CrossRef]59. BHA British Hydropower Association. The British Hydropower Association A Guide to UK Mini-Hydro; British Hydropower
Association: Dorset, UK, 2012.60. Williamson, S.J.; Stark, B.H.; Booker, J.D. Low head pico hydro turbine selection using a multi-criteria analysis. Renew. Energy
2014, 61, 43–50. [CrossRef]61. Bracken, L.J.; Bulkeley, H.A.; Maynard, C.M. Micro-hydro power in the UK: The role of communities in an emerging energy
resource. Energy Policy 2014, 68, 92–101. [CrossRef]62. Power, C.; McNabola, A.; Coughlan, P. Development of an evaluation method for hydropower energy recovery in wastewater
treatment plants: Case studies in Ireland and the UK. Sustain. Energy Technol. Assess. 2014, 7, 166–177. [CrossRef]63. Bousquet, C.; Samora, I.; Manso, P.; Rossi, L.; Heller, P.; Schleiss, A.J. Assessment of hydropower potential in wastewater systems
and application to Switzerland. Renew. Energy 2017, 113, 64–73. [CrossRef]64. Mitrovic, D.; Chacón, M.; García, A.; Morillo, J.; Diaz, J.; Ramos, H.; Adeyeye, K.; Carravetta, A.; McNabola, A. Multi-country scale
assessment of available energy recovery potential using micro-hydropower in drinking, pressurised irrigation and wastewaternetworks, covering part of the eu. Water 2021, 13, 899. [CrossRef]
65. Loots, I.; van Dijk, M.; Barta, B.; van Vuuren, S.J.; Bhagwan, J.N. A review of low head hydropower technologies and applicationsin a South African context. Renew. Sustain. Energy Rev. 2015, 50, 1254–1268. [CrossRef]
66. García, A.M.; Díaz, J.A.R.; Morillo, J.G.; McNabola, A. Energy recovery potential in industrial and municipal wastewater networksusing micro-hydropower in Spain. Water 2021, 13, 691. [CrossRef]
67. Gallagher, J.; Styles, D.; McNabola, A.; Williams, A.P. Life cycle environmental balance and greenhouse gas mitigation potentialof micro-hydropower energy recovery in the water industry. J. Clean. Prod. 2015, 99, 152–159. [CrossRef]
68. Gallagher, J.; Styles, D.; McNabola, A.; Williams, A.P. Making green technology greener: Achieving a balance between carbon andresource savings through ecodesign in hydropower systems. Resour. Conserv. Recycl. 2015, 105, 11–17. [CrossRef]

Water 2021, 13, 3259 31 of 31
69. Ueda, T.; Roberts, E.; Norton, A.; Styles, D.; Williams, A.; Ramos, H.; Gallagher, J. A life cycle assessment of the constructionphase of eleven micro-hydropower installations in the UK. J. Clean. Prod. 2019, 218, 1–9. [CrossRef]
70. Nautiyal, H.; Goel, V. Sustainability assessment of hydropower projects. J. Clean. Prod. 2020, 265, 121661. [CrossRef]71. Palma-Heredia, D.; Poch, M.; Cugueró-Escofet, M. Implementation of a decision support system for sewage sludge management.
Sustainability 2020, 12, 89. [CrossRef]72. Choulot, A.; Denis, V.; Bruno, G.S. Energy Recovery in Existing Infrastructures with Small Hydropower Plants Multipurpose
Schemes-Overview and Examples. 2010. Available online: http://www.infrawatt.ch/sites/default/files/2010_06_07_Mhylab%20&%20ESHA_Energy%20recovery%20in%20existing%20infrastructures%20with%20small%20hydropower%20plants_0.pdf (ac-cessed on 12 April 2021).
73. Power, C.; Coughlan, P.; McNabola, A. Microhydropower Energy Recovery at Wastewater-Treatment Plants: Turbine Selectionand Optimization. J. Energy Eng. 2017, 143, 1–7. [CrossRef]
74. Jawahar, C.P.; Michael, P.A. A review on turbines for micro hydro power plant. Renew. Sustain. Energy Rev. 2017, 72, 882–887.[CrossRef]
75. Delgado, J.; Ferreira, J.P.; Covas, D.I.C.; Avellan, F. Variable speed operation of centrifugal pumps running as turbines. Experi-mental investigation. Renew. Energy 2019, 142, 437–450. [CrossRef]
76. Gallagher, J.; Harris, I.M.; Packwood, A.J.; McNabola, A.; Williams, A.P. A strategic assessment of micro-hydropower in the UKand Irish water industry: Identifying technical and economic constraints. Renew. Energy 2015, 81, 808–815. [CrossRef]
77. McNabola, A.; Coughlan, P.; Corcoran, L.; Power, C.; Williams, A.P.; Harris, I.; Gallagher, J.; Styles, D. Energy recovery in thewater industry using micro-hydropower: An opportunity to improve sustainability. Water Policy 2014, 16, 168–183. [CrossRef]
78. Gallagher, J.; Basu, B.; Browne, M.; Kenna, A.; McCormack, S.; Pilla, F.; Styles, D. Adapting Stand-Alone Renewable EnergyTechnologies for the Circular Economy through Eco-Design and Recycling. J. Ind. Ecol. 2019, 23, 133–140. [CrossRef]
79. Chenal, R.; Vuillerat, C.-A.; Rouit, J. Projekteleitung DIANE, and INFOENERGIE, Elektrizität aus Abwasser-Systemen. Konzept,Realisation, Potential. DIANE 10. Petites Centrales Hydrauliques; Office fédéral de l’énergie: Berne, Switzerland, 1995.
80. MHyLab—Service de l’Environnement et de l’Energie Canton de Vaud. Cadastre Hydraulique du Canton de Vaud Eaux deSurface Eaux de Reseau. 2008. Available online: https://www.vd.ch/fileadmin/user_upload/themes/environnement/energie/fichiers_pdf/Rapport_Potentiel_Hydraulique.pdf (accessed on 2 September 2021).
81. McNabola, A.; Mitrovic, D.; Chacon, M.C.; Garcia, A.M.; Morillo, J.G.; Diaz, J.A.R. REDAWN-Reducing Energy Dependency inAtlantic Area Water Networks—Project Report WP4 Report on Micro-Hydropower Resource Assessment in the Atlantic Area.Interreg Atlantic Area. 2021. Available online: https://www.redawn.eu/sites/default/files/MHP%20Resource%20Assessment%20in%20AA_WP4_TCD_0.pdf (accessed on 2 September 2021).
82. Adams, R.; Jeanrenaud, S.; Bessant, J.; Overy, P.; Denyer, D. Innovating for Sustainability A Systematic Review of the Body of Knowledge.Network for Business Sustainability; Network for Business Sustainability: London, ON, Canada, 2012.
83. Strazzabosco, A.; Kenway, S.J.; Lant, P.A. Quantification of renewable electricity generation in the Australian water industry. J.Clean. Prod. 2020, 254, 120119. [CrossRef]
84. Ali, S.M.H.; Lenzen, M.; Sack, F.; Yousefzadeh, M. Electricity generation and demand flexibility in wastewater treatment plants:Benefits for 100% renewable electricity grids. Appl. Energy 2020, 268, 114960. [CrossRef]
85. Bergmann, A.; Rotzek, J.N.; Wetzel, M.; Guenther, E. Hang the low-hanging fruit even lower—Evidence that energy efficiencymatters for corporate financial performance. J. Clean. Prod. 2017, 147, 66–74. [CrossRef]
86. Ramos, H.M.; Simão, M.; McNabola, A.; Novara, D.; Carravetta, A. Fostering Renewable Energies and Energy Efficiency in theWater Sector Using PATs and Wheels. Proceedings 2018, 2, 1438. [CrossRef]
87. European Environment Agency. Urban Wastewater Treatment Map. 2021. Available online: https://www.eea.europa.eu/themes/water/european-waters/water-use-and-environmental-pressures/uwwtd/interactive-maps/urban-waste-water-treatment-maps-3 (accessed on 14 September 2021).
88. Capodaglio, A.G.; Bolognesi, S.; Cecconet, D. Sustainable, decentralized sanitation and reuse with hybrid nature-based systems.Water 2021, 13, 1583. [CrossRef]