Hydropower Providing Flexibility for a Renewable Energy ...
81
Hydropower Providing Flexibility for a Renewable Energy System Three European Energy Scenarios This project has received funding from the European Union’s Horizon 2020 research and innovation programme under grant agreement No 764011.
-
Upload
khangminh22 -
Category
Documents
-
view
0 -
download
0
Transcript of Hydropower Providing Flexibility for a Renewable Energy ...

Hydropower Providing Flexibility for a Renewable Energy System Three European Energy Scenarios
This project has received funding from the European Union’s Horizon 2020 research and innovation programme under grant agreement No 764011.

THREE EUROPEAN ENERGY SCENARIOS
1
Authors Marius Siemonsmeier*, RWTH Aachen University (Germany) Philipp Baumanns, RWTH Aachen University (Germany) Niklas van Bracht, RWTH Aachen University (Germany) Maik Schönefeld, RWTH Aachen University (Germany) Andrea Schönbauer, RWTH Aachen University (Germany) Albert Moser, RWTH Aachen University (Germany) Ole Gunnar Dahlhaug, NTNU Norwegian University of Science and Technology (Norway) Sara Heidenreich, NTNU Norwegian University of Science and Technology (Norway) *Corresponding author: [email protected]
December 2018
This report is a revised version of the HydroFlex Deliverable 2.1.: Baumanns, P., Siemonsmeier, M., van Bracht, N., Schönefeld, M., Schönbauer, A., Moser, A., Dahlhaug, O. & Heidenreich, S. (2018): Deliverable D2.1 Report defining three European energy scenarios. Trondheim: HydroFlex. This report reflects only the authors’ views and the Innovation and Networks Executive Agency (INEA) is not responsible for any use that may be made of the information it contains.
Suggested citation: Siemonsmeier, M., Baumanns, P., van Bracht, N., Schönefeld, M., Schönbauer, A., Moser, A., Dahlhaug, O. & Heidenreich, S. (2018): Hydropower Providing Flexibility for a Renewable Energy System: Three European Energy Scenarios. A HydroFlex report. Trondheim: HydroFlex.

THREE EUROPEAN ENERGY SCENARIOS
2
Executive Summary The Horizon 2020 Project ‘Increasing the value of Hydropower through increased Flexibility (HydroFlex)’ aims towards scientific and technological breakthroughs to enable hydropower to operate with very high flexibility in order to utilise the full power and storage capability. The project will create the environmental, social and technical basis for successful future industrial developments by performing well-focused research and innovation activities on the key bottlenecks of hydropower units that restrict their operating range and thus limit their flexibility.
One objective of the HydroFlex project is to develop a water turbine capable of doing a significant number of starts and stops per day. Work package 2 aims to investigate if there is a demand for such a turbine in the future power system, for example from an economical perspective in the power markets or from a technical perspective in terms of grid operation and short term system stability. To fulfil this task, simulations of the future European power system are needed. As the future development of the European power system is subject to uncertainty, this report defines three European energy scenarios as a framework to cover various future developments in the simulations.
At first, this report explains the status quo of electricity generation in Europe as well as fundamental knowledge related to the term flexibility. Flexibility provision needs to meet certain demands caused by different elements of power systems. This report also presents different flexibility options able to cover these demands for flexibility. Although all provide individual advantages, this report identifies hydropower, especially pumped storage hydropower, to be a very flexible, diverse option and a technology capable of facing flexibility challenges set by the increase of intermittent renewable energy sources.
Hydropower is especially common in the Nordic and Alpine countries and might provide flexibility. Assessments of future possibilities regarding this technology should therefore consider hydropower located in these countries. In order to evaluate requirements for hydropower providing flexibility, factors are described, which are essential to the future success of this possibility. As the future is subject to uncertainty, numerous outlines of the future European power system are available, designed by different parties involved in power systems. This report examines existing scenarios on possible opportunities of hydropower based on the mentioned factors.
Finally, this report defines three scenarios, the Green Hydro, Reference and Prosumer scenario, which are specifically designed as suitable input for the following computational simulations of the European power systems. To evaluate the possible profitability of hydropower and to achieve HydroFlex’s main objective, the scenarios describe different contexts for Nordic hydropower.
THREE EUROPEAN ENERGY SCENARIOS
3
Table of Contents
Executive Summary ............................................................................................. 2
Table of Contents ................................................................................................. 3
Abbreviations ........................................................................................................ 5
1. Introduction .................................................................................................. 7
1.1 Background and motivation .................................................................................... 7
1.2 Aims and structure of the report............................................................................. 8
2 Evaluation of flexibility in the light of future European power systems ... 9
2.1 The status quo of European power systems .......................................................... 9
2.2 Flexibility within European power systems .......................................................... 13
2.2.1 Demands on flexibility provision ....................................................................... 13
2.2.2 Four kinds of flexibility ...................................................................................... 19
2.2.3 Essential factors for flexibility .......................................................................... 31
3 IAEW toolchain – power system simulation ............................................ 33
3.1 Market .................................................................................................................... 33
3.2 Grid operation ........................................................................................................ 34
3.3 Stability .................................................................................................................. 34
4 Scenario development with regard to subsequent simulations .............. 36
5 ENTSO-E’s scenarios of future European power systems ....................... 38
5.1 Storylines ............................................................................................................... 38
5.1.1 Sustainable Transition ...................................................................................... 38
5.1.2 Global Climate Action ........................................................................................ 39
5.1.3 Distributed Generation ...................................................................................... 39
5.2 Meta-analysis of ENTSO-E’s scenarios with respect to flexibility and hydropower ............................................................................................................................ 40
5.2.1 IRES shares ........................................................................................................ 40
5.2.2 Distribution ratio ................................................................................................ 42
5.2.3 Base load power plants ..................................................................................... 43
5.2.4 Peak load power plants ..................................................................................... 47
5.2.5 Proportion of hydropower plants to other flexibility options ........................... 48
5.2.6 Grid expansion ................................................................................................... 49
THREE EUROPEAN ENERGY SCENARIOS
4
5.2.7 Net Transfer Capacities ..................................................................................... 49
6 Deriving scenarios of European power systems placing high demands on hydraulic power plants ............................................................................... 50
6.1 Three scenarios of European power systems ...................................................... 52
6.1.1 Reference Scenario ........................................................................................... 53
6.1.2 Green Hydro Scenario ........................................................................................ 56
6.1.3 Prosumer Scenario ............................................................................................ 59
6.2 Scenarios on frequency stability .......................................................................... 63
7 Conclusion and future prospect ................................................................ 65
Bibliography ........................................................................................................ 67
Table of figures ................................................................................................... 77
Table of tables .................................................................................................... 79

THREE EUROPEAN ENERGY SCENARIOS
5
Abbreviations CAES Compressed-air energy storage systems
DG Distributed Generation
DSM Demand Side Management
ENTSO-E European Network of Transmission System Operators for Electricity
EU European Union
GCA Global Climate Action
IAEW Institut für Elektrische Anlagen und Energiewirtschaft
Institute of Power Systems and Power Economics
RWTH Aachen University
IRES Intermittent Renewable Energy Sources
MAF Mid-term Adequacy Forecast
NTC Net Transfer Capacity
PRIMES Price-Induced Market Equilibrium System
PSH Pumped Storage Hydropower
RES Renewable Energy Sources
ST Sustainable Transition
TSO Transmission System Operators
TYNDP Ten-Year Network Development Plan


THREE EUROPEAN ENERGY SCENARIOS
7
1. Introduction 1.1 Background and motivation
The Paris Agreement [1], signed in 2015, unites the entirety of the world’s nations on a single goal: proceed against global climate change. The fact that nearly 200 countries are collaborating on one issue stresses the importance of limiting global warming and lowering carbon emissions. The success of this global collaboration will be mainly determined by changes in the usage of fossil fuels within the energy sector in particular. Their use in electricity generation is a significant contributor to greenhouse gas emissions. [2–5]
In the wake of the Paris Agreement, nearly all countries involved are changing their climate policies. Among these, the European Union (EU) has a history of pushing for climate action where it assumes a leading role in climate policy on the European continent. In order to emit fewer greenhouse gases, European countries have combined their efforts and agreed on common climate policies. They are planning to reduce the amount of climate-damaging fossil-fuelled power plants, e.g. hard coal and lignite. To cover electricity demand, European countries are increasing the share of renewable energies within their power systems. [2; 3]
Renewable energy sources (RES) are – in contrast to fossil fuels – considered climate-friendly. The term RES refers to, among others, wind and solar energy, biomass as well as hydropower. These energy resources are able to restore themselves, but are flow-limited [6]. They have the ability to generate electricity without utilizing fossil fuels. [6; 7]
In order to implement the Paris Agreement and reach climate goals, European countries have been increasing the amount of RES, in particular, wind and solar power units. As electrical power generation (actual electrical power output) by wind and solar power plants fluctuates, these technologies will be referred to as intermittent renewable energy sources (IRES) in this report. The fluctuating electrical power generation by IRES causes several challenges, which European countries have to find solutions for. Supply-dependent IRES increase the need for technologies able to balance power systems by providing flexibility.
In a joint effort of 16 research and industry partners from five European countries, the HydroFlex project ‘Increasing the value of Hydropower through increased Flexibility’ explores the role of hydropower as a flexibility option. HydroFlex is a research and innovation action funded under the EU Horizon 2020 programme “H2020-EU3.3.2 – Low-cost, low-carbon energy supply”. It addresses the technology-specific challenge “Hydropower: Increasing flexibility of hydropower” of the work programme topic “LCE-07-2016-2017 – Developing the next generation technologies of renewable electricity and heating/cooling”, which focuses on the need to develop new technologies, generators and turbine designs to increase the flexibility of hydropower plants while mitigating environmental impacts. The project is divided into seven work packages. Figure 1 depicts the tasks of work package two (WP2), which this report originates from.
THREE EUROPEAN ENERGY SCENARIOS
8
Figure 1: Tasks of work package 2
The main objective of WP2 is to identify and describe the demands hydropower plants will be confronted with in future power systems. The focus will be on identifying dynamic loads such as those resulting from providing high ramping rates and frequent start-stop-cycles. In order to achieve this main objective, future flexibility demands need to be taken into account in this project. As the future is subject to uncertainty, computational simulations based on various scenarios provide suitable assessments of the future. Therefore, this report defines three energy scenarios to fulfil task 2.1. In the further course of this work package, the identification of reference sites, the simulations and a guide describing the operational requirements hydropower plants have to meet in the future will follow. [8–10]
1.2 Aims and structure of the report The aim of this report is to derive three scenarios suitable to model the range of future developments in computational simulations as well as to examine demand on future flexibility and profitability of hydropower. These scenarios will serve as suitable input for the simulations created subsequent to this report. These will judge the suitability of hydropower as a flexibility option.
In order to provide a framework for judging hydropower’s options in the future, chapter 2 explains the status quo of electricity generation in Europe as well as fundamental knowledge related to the term flexibility. Flexibility provision needs to meet certain demands caused by different elements of power systems. This chapter also presents different flexibility options able to cover these demands. It aims to identify the currently most suitable flexibility option. Based on these findings, section 2.2.3 presents factors essential to appropriately judge future possibilities for Nordic hydropower. Chapter 3 describes the tool chain processing the simulations and chapter 4 provides an overview about scenario development with regard to the subsequent simulations.
As the future is hard to estimate, numerous outlines of future power systems are available, designed by different parties involved in power systems. Chapter 5 examines existing scenarios on possible opportunities of hydropower.
Chapter 6 explains three scenarios based on the findings of the previous chapter. These scenarios are specifically designed as suitable input for computational simulations of the European power systems. To evaluate the flexibility provision by hydropower plants, these explanations describe different contexts for Nordic hydropower represented by the Green Hydro, Prosumer and Reference scenarios.
T 2.1 Energy Scenarios T 2.4 GuideT 2.3 SimulationsT 2.2 Reference Sites

THREE EUROPEAN ENERGY SCENARIOS
9
2 Evaluation of flexibility in the light of future European power systems
The following chapter first explains the status quo of European power systems. Secondly, it describes demands on flexibility provision as well as options able to provide flexibility. The chapter ends with the conclusion of factors essential to an evaluation of flexibility provision in future European power systems.
2.1 The status quo of European power systems Due to the characteristics of Europe comprising of several nations, the European power systems can also be seen as a union made up by the electricity supply of each country. They have developed individually within each country. The design of power systems in the late 19th and early 20th century was not meant to transmit electricity long-distance. Mostly centralised systems with large fossil-fuelled power plants developed in close proximity to demand centres. These areas of supply expanded as technology was evolving, but remained limited. Consequently, countries were not necessarily well-connected to the power system of their neighbouring country. These large-scale, mostly fossil-fuelled power plants have shaped European power systems.
The same accounts for nuclear power plants. Their shares in electrical energy production (amount of electrical energy generated) increased in the 1950s. Figure 2 depicts the shares in electrical energy production, within Europe as of 2016, of the following four types of generation: hydropower, nuclear, fossil fuels, and RES excluding hydropower. As can be seen, nuclear and fossil fuels combined still amount to over 60%. Therefore, they still play an important role in electricity supply today. [11–13]
Figure 2: ENTSO-E shares of electrical energy production in 2016 [14]
Hydropower17%
Nuclear energy25%
Fossil fuels41%
RESexcluding
hydropower17%
THREE EUROPEAN ENERGY SCENARIOS
10
Reflecting European countries’ diversity, their composition of power plant units vary profoundly. They have grown nationally due to different geographical aspects, regional availability of primary energy sources and political objectives. At the beginning of electricity generation, countries used resources found within their territories. They developed the infrastructural means to transport these resources over short distances to large electrical power generation units. E.g., Germany has built its power supply on coal and lignite deposits mined in its western and eastern regions. These resources have also been mined within neighbouring countries of Germany or have been imported from Germany.
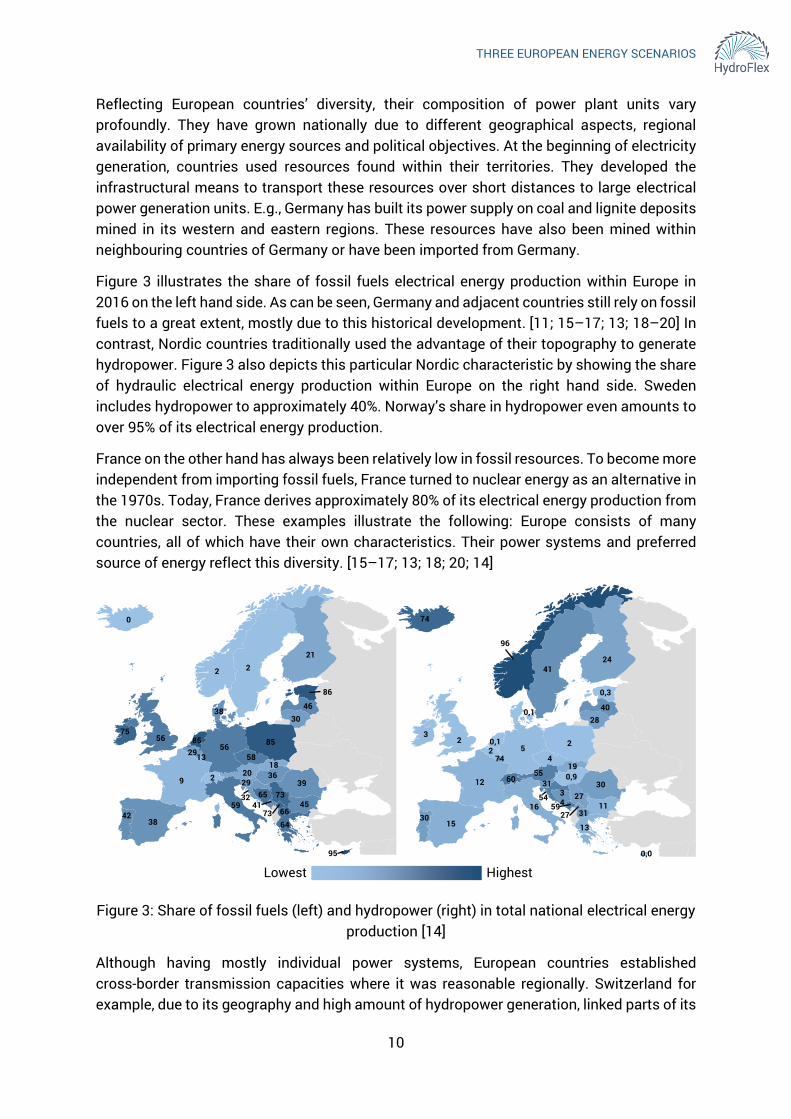
Figure 3 illustrates the share of fossil fuels electrical energy production within Europe in 2016 on the left hand side. As can be seen, Germany and adjacent countries still rely on fossil fuels to a great extent, mostly due to this historical development. [11; 15–17; 13; 18–20] In contrast, Nordic countries traditionally used the advantage of their topography to generate hydropower. Figure 3 also depicts this particular Nordic characteristic by showing the share of hydraulic electrical energy production within Europe on the right hand side. Sweden includes hydropower to approximately 40%. Norway’s share in hydropower even amounts to over 95% of its electrical energy production.
France on the other hand has always been relatively low in fossil resources. To become more independent from importing fossil fuels, France turned to nuclear energy as an alternative in the 1970s. Today, France derives approximately 80% of its electrical energy production from the nuclear sector. These examples illustrate the following: Europe consists of many countries, all of which have their own characteristics. Their power systems and preferred source of energy reflect this diversity. [15–17; 13; 18; 20; 14]
Figure 3: Share of fossil fuels (left) and hydropower (right) in total national electrical energy production [14]
Although having mostly individual power systems, European countries established cross-border transmission capacities where it was reasonable regionally. Switzerland for example, due to its geography and high amount of hydropower generation, linked parts of its
20
65
29
45
2
95
5856
38
86
38
21
9
56
64
32
36
75
0
59
30
13
46
66
85
2
85
42
3973
2
29
18
7341
55
34
2
11
60
0,0
45
0,1
0,3
15
24
12
2
13
54
0,9
3
74
16
28
74
40
31
0,1
96
2
30
3027
41
31
19
2759
Lowest Highest

THREE EUROPEAN ENERGY SCENARIOS
11
system to bordering parts of Germany, Italy, and France as early as the late 19th century [13]. Individual connections like these were rare at first and there was no methodical interconnecting of several countries. Over time, European countries established more and more of these links, connecting a growing number of countries in Continental Europe. [13; 21; 22]
These links were possible as all these different power systems are based on the same underlying technical standards. European countries implemented for the better part 50 Hertz as their standard system frequency as early as the beginning of the 20th century. Nowadays power systems either function with 50 or 60 Hertz worldwide; the latter being used on the American continent while the former on most of the others. The frequency is a measure of balance between the amount of energy generated and demanded. It is an important and necessary tool as electrical grids are not able to store electricity. This balance is shown in Figure 4: when demand is higher than generation, the frequency drops and vice versa. These imbalances happen naturally as neither demand nor generation are completely certain. As the basic principle of energy conservation dictates, the amount of energy within the system has to be balanced at any time. Therefore, flexibility options, such as hydropower plants, are essential to the power system. [23; 21; 24; 13; 22]
Figure 4: The balance of load and generation [25]
During the last century, European countries have continued to agree on common standards and to interconnect their power systems. Especially after World War II, they have increased collaboration on many issues, including electricity. [26; 22] They have formed several foundations and have initiated international standardisation regarding power systems, their history described in detail by [26] and [22]. These ambitions resulted in today’s European Network of Transmission System Operators for Electricity (ENTSO-E), a pan-European organisation currently including 43 Transmission System Operators (TSOs) from 36 EU and non-EU countries [27]. Figure 5 illustrates these member countries. As shown, the ENTSO-E area covers the majority of Europe. The member countries are organised regionally as synchronous areas, also illustrated in Figure 5. As outlined in [28], ENTSO-E was founded to improve coordination between TSOs. This includes, but is not limited to, the development of a European transmission system as well as the development and monitoring of the implementation of network codes. To ensure implementation, ENTSO-E takes actively part in the development of European regulations, especially in close cooperation with EU legislation. [28]
Demand Generation

THREE EUROPEAN ENERGY SCENARIOS
12
Figure 5: The origin of member TSOs of ENTSO-E [27]
European countries have also most notably agreed on decreasing their environmental emissions and limiting global warming. As one result of these agreements, they have introduced policies to increase the amount of emission-free RES considerably within their systems and strategies on how to include them. These plans also include altering their composition of power plant units. Clearly, European countries will need to build more RES and implement them into power systems. These countries will achieve less emissions most effectively by decreasing the usage of fossil-fuelled power plants. These changes will affect not only the composition of power plant units, but also the structure of transmission grids, as will be explained in the course of this chapter.
Nordic
Continental Europe
United Kingdom and Ireland
Baltic
Observer Member

THREE EUROPEAN ENERGY SCENARIOS
13
Figure 6 shows the course of electrical energy production by fuel within the EU. Starting in 1990, it illustrates the decline of fossil fuels and the rise of RES until the year 2015. Traditionally most used fossil fuels are decreasing while renewables are steadily increasing. A change within European power systems towards RES has begun. Continuing on this path towards one pan-European power system primarily supplied by RES, European countries have to face several challenges. [12; 29–31]
Figure 6: Electrical energy production by fuel in the EU (1990-2015) [32]
2.2 Flexibility within European power systems As the electrical power generation in renewable European power systems will fluctuate depending, inter alia, on the weather, the need for balancing will increase. Flexibility options, such as hydropower plants, could become more important. The more measures available within a system to balance demand and generation, which derivate in time, the more flexibility it offers [33]. The term flexibility in a broad sense describes the mere potential to balance the generation and demand by adjusting the electrical power generation or demand, whenever there is a deviation from the usual amount in the system. These imbalances originate from different elements of the power system and put different demands on the source of flexibility. [33–35; 30; 36; 37; 9]
2.2.1 Demands on flexibility provision The following will explain fundamental causes of flexibility demands such as power plant outages, load fluctuation, and fluctuation in power generated by RES. In principle, it is the task of the wholesale electricity markets to match demand and supply. Nevertheless, short-term imbalances occur due to the limited temporal resolution of products or uncertain circumstances. Regulatory control regularises today’s control actions to balance those imbalances. Finally, this section deals with grid congestion management, which requires flexibility as well.
0100200300400500
Mtoe700
1990
1992
1994
1996
1998
2000
2002
2004
2006
2008
2010
2012
2014
Nuclear Fossil fuels RES Wastes, Non-RES
THREE EUROPEAN ENERGY SCENARIOS
14
2.2.1.1 Power plant outages When designing power systems, fossil-fuelled power or hydropower plants primarily ensured electrical power generation. The output of these power plants is dispatchable. Nevertheless, the availability of power plants is limited because of unforeseeable failures of power plants. These losses happen continuously, stochastically and need to be compensated by other means. Disturbances do not have to be within gigawatts to disturb the power system: Even minor outages of power plants can cause a derivation from the standard frequency. [8, 38]
2.2.1.2 Load fluctuation Another fundamental cause for an imbalance of demand and generation is load fluctuations. The demand side has always been volatile as it consists of numerous differing components. Large industrial complexes with relatively steady and high electricity demand can cause a high discrepancy if disconnected suddenly. Multitudes of small consumers who can connect and disconnect household appliances or small devices at any time are uncertain in their individual behaviour and account for a natural fluctuation in demand. Therefore, load is not homogeneous, but varies in time and amount. [38; 8]
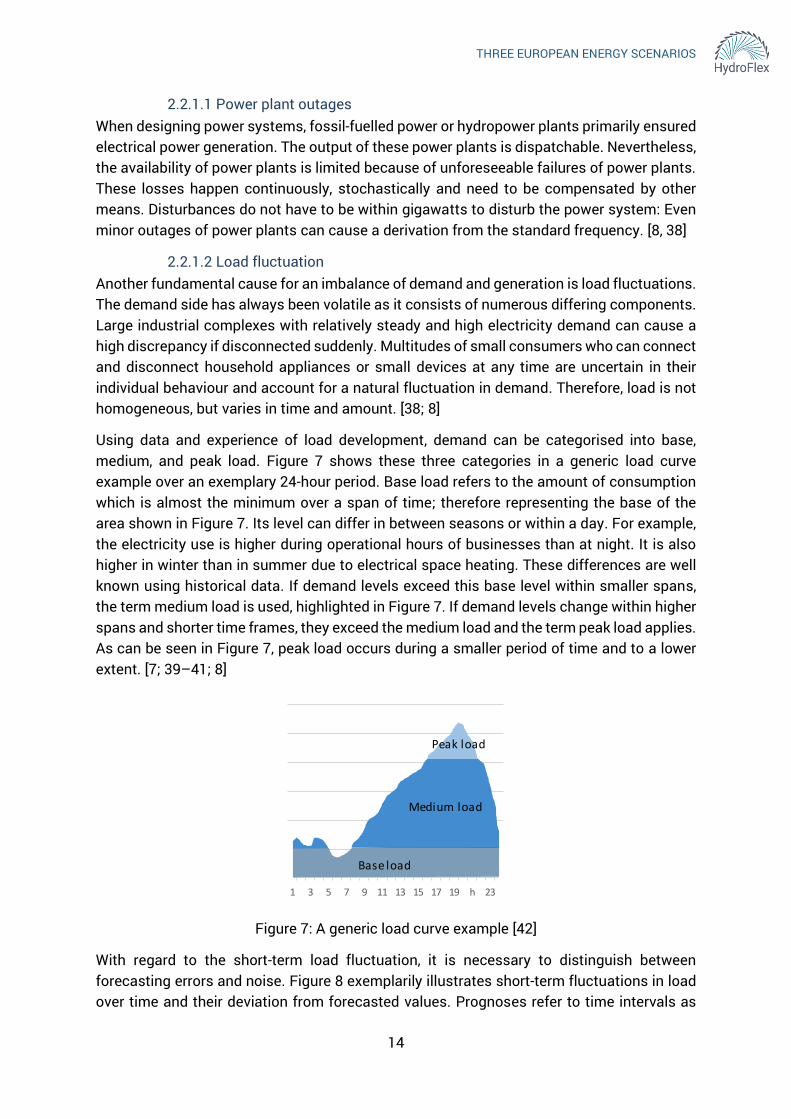
Using data and experience of load development, demand can be categorised into base, medium, and peak load. Figure 7 shows these three categories in a generic load curve example over an exemplary 24-hour period. Base load refers to the amount of consumption which is almost the minimum over a span of time; therefore representing the base of the area shown in Figure 7. Its level can differ in between seasons or within a day. For example, the electricity use is higher during operational hours of businesses than at night. It is also higher in winter than in summer due to electrical space heating. These differences are well known using historical data. If demand levels exceed this base level within smaller spans, the term medium load is used, highlighted in Figure 7. If demand levels change within higher spans and shorter time frames, they exceed the medium load and the term peak load applies. As can be seen in Figure 7, peak load occurs during a smaller period of time and to a lower extent. [7; 39–41; 8]
Figure 7: A generic load curve example [42]
With regard to the short-term load fluctuation, it is necessary to distinguish between forecasting errors and noise. Figure 8 exemplarily illustrates short-term fluctuations in load over time and their deviation from forecasted values. Prognoses refer to time intervals as
1 3 5 7 9 11 13 15 17 19 h 23
Base load
Peak load
Medium load

THREE EUROPEAN ENERGY SCENARIOS
15
small as possibly tradeable on electricity markets, mostly 15 minutes. An exemplary prognosis is highlighted in blue. Within one interval of 15 minutes, the forecasting error is the difference between the average value of actual load, inscribed in red, and the value of prognosis. As the demand of electricity is fluctuating, short-term variations occur. The deviation of load from its average value is called noise. Both deviations cause the need for flexibility options, such as hydropower plants. [43]
Figure 8: Short-term fluctuations and forecast errors in load
The power systems have grown to meet these demands as they occur and have adapted to these fluctuations. As electrical power generation is becoming increasingly renewable, the residual load gains greater significance. This term describes the actual electricity demand minus the power generated by renewable energy. It has been introduced as the energy provided by IRES must be prioritised in the power systems of most European countries. Giving priority to the feed-in of wind and solar power is a part of their plans to include RES into their power systems. The more energy IRES feed into the systems, the lower the amount of residual energy and the less fossil-fuelled power plants get to supply electricity. Since these power plants have provided a large part of the flexibility so far, other flexibility options, such as hydropower plants, might become more important. [7; 39–41]
2.2.1.3 IRES fluctuation The amount of energy being provided by IRES can vary within and between seasons, depending on their type. Wind and solar energy, for example, depend on supply of wind and solar irradiation. Figure 9 compares two days of wind and solar power feed-in in Germany. The 22nd of September in 2017 was comparatively low in electrical power generation by IRES. Except for midday, electrical power generation on this day was insignificant in comparison to 26thof December the same year. Figure 9 illustrates that 26thof December accounted for almost three times as much electrical power generation. Forecasts can, to some extent, calculate these differences in supply beforehand, using meteorological data. As the weather
Noise
Forecastingerror
Actual load Actual value of prognosis Average value
00:00 00:15 hh:mm 00:45
time
Pow
er

THREE EUROPEAN ENERGY SCENARIOS
16
cannot yet be determined completely, different frameworks and models are available to make such prognosis. Depending on the choice of methodology, meteorological parameters and their variation are calculated differently. This leads to different qualities in forecasting. The position of the sun determines solar electrical power generation output. Even though the position of the sun is well calculable, solar radiation can be hindered by fog or clouds. The formation of these meteorological processes is hard to simulate in a computer model, as further explained in [44]. Errors are thus still common in forecasting. [44; 45; 8]
Figure 9: Exemplary feed-in by wind and solar power in Germany (2017) [46]
The quality of a prognosis always depends on various factors: the forecast horizon, the size of the area considered, and the properties of facilities available within said area. This quality can only be assessed retrospectively and consists of the prognosticated amount of energy and the amount actually occurred. Forecast errors can be either negative or positive. If there is more electricity being generated than forecasted, the error is negative and flexibility options need to absorb this extra amount of energy. If there is less than expected, other electrical power generation units have to cover the remaining demand. [44; 45; 8]
Figure 8 in paragraph 2.2.1.2 exemplarily illustrates short-term fluctuations in load over time and their deviation from forecasted values. The distinction between forecasting errors and noise is also valid for the electrical power generation by IRES. Prognoses refer to time intervals as small as possibly tradeable on electricity markets, mostly 15 minutes. Within one interval of 15 minutes, the forecasting error is the difference between the average value of actual electrical power generation by IRES and the single value of prognosis. As the generation by IRES is fluctuating, short-term variations occur. The deviation of actual generation from its average value is called noise. This deviation occurs for example due to the effects of cloud course on solar irradiation. Both deviations cause the need for flexibility options. [43]
0
10
20
30
40
GW
60
1 2 3 4 5 6 7 8 9 10 11 12 13 14 15 16 17 18 19 20 21 22 h 24
26.12.2017 22.09.2017 Time
Gen
erat
ed a
mou
nt o
f po
wer

THREE EUROPEAN ENERGY SCENARIOS
17
The forecast horizon has a significant effect on quality. Figure 10 shows the example of wind power forecasts in Spain, from 2008 to 2012, and their forecasting errors in relation to the forecast horizon. The shorter the forecast horizon, the smaller the forecasting error. The limited reliability of weather forecasts hinders accurate planning of load supply. As can also be seen in Figure 10, forecasting improved within only a few years. As the amount of IRES is increasing and forecasting methods are still evolving, flexibility absorbing these forecasting errors gains growing importance. [44; 45; 8]
Figure 10: Errors in wind power forecasts in Spain plotted against the forecast horizon [8]
2.2.1.4 Steps in unit commitment Program changes of cross-border exchange transfer due to electricity trading activities and thus changes in the feed-in of power plants cannot be realised immediately for technical reasons. If such jump occurs, an inter-periodic ramping (increase or reduction) of the set point of cross-border exchange takes place controlled by the Frequency Restoration Reserve (described in section 2.2.1.5). This extends over a time range of up to 10 minutes. In this time range, the feed-in power of the power plants has to be adjusted as well. As this adaption can be non-synchronous, imbalances can occur resulting in an additional demand for flexibility provision by e.g. hydropower plants.
2.2.1.5 Regulatory Control Following the above-described fundamental causes of flexibility demands, control actions have been developed in the European power system. Today, regulatory control standardises and coordinates those measures within Europe to balance short-term imbalances.
Control actions respond within different time frames. Figure 11 shows their sequence and interconnection. To give an example, a sudden power plant’s outage causes a derivation from the standard frequency. This automatically activates Frequency Containment. It is a response of all technical elements operating within the system like speed controllers of turbines of power plants. They sense the derivation from the usual frequency within a span of ± 20 mHz and adjust their power. This change in kinetic energy alters the amount of power
0
5
10
15
%
25
1 3 5 7 9 11 13 15 17 19 21 23 25 27 29 31 33 35 37 39 41 43 h 47
Mea
n ab
solu
te e
rror
/ave
rage
pro
duct
ion
Forecast horizon
2008 2009 2010 2011 2012

THREE EUROPEAN ENERGY SCENARIOS
18
delivered until a balance between electrical power generation and consumption is re-established. If the frequency deviates up to ± 200 mHz, every Frequency Containment Reserve is fully activated. As Frequency Containment Reserves act as proportional control, the frequency cannot reach its original level, but only stabilise. After 15 to 30 seconds Frequency Restoration Reserve supersedes Frequency Containment Reserves. Frequency Containment Reserves resources are then fully available again. Grid operators activate Frequency Restoration Reserve automatically, which can stabilise the frequency back to its original level. When disturbances continue after these actions, grid operators can manually relieve Frequency Restoration Reserve and activate Replacement Reserves. Additional load or generation can be activated within the area in which the disturbance has occurred. Regarding a future energy system with less fossil-fuelled power plants, other options need to be implemented to provide regulatory control. [37, 39–41]
Figure 11: Time frames and measures of regulatory control [47]
To facilitate the exchange across borders and further international standardisation, these control actions were formulated at the beginning of the 21st century for the area of today’s ENTSO-E [43]. ENTSO-E has also published several regulations, called network codes, which include measures for electricity balancing and frequency restoration. Due to the high complexity and technical differences within European power systems, the implementation of a common European regulation and market is still in progress. These rules are widely agreed upon, but can differ between synchronous areas, e.g. between Continental Europe and the Nordic countries. States within these areas are also allowed to differ from regulations when necessary or reasonable. [44, 45]
2.2.1.6 Congestion management In order to ensure security in transmission grid operation, certain conditions must not be violated. Power grids are built to function at the height of forecasted transmission even if one element should fail or be shut down, therefore called (n-1)-criterion. Moreover, the level of voltage must not change considerably and other network elements must not overload in case of a failure. In case not all power flows can be sufficiently handled by the power grid
Occurrence ofthe disturbance
ReplacementReserves
Frequency Restoration
FrequencyContainment
Time to restorefrequency
0
Time
Freq
uenc
y/
pow
er

THREE EUROPEAN ENERGY SCENARIOS
19
without violating these operating conditions, congestions occur. The TSO’s task is to prevent these congestions, therefore called congestion management. [48; 49]
One measure to do so is called redispatch. If the operators of power grids deem it necessary, they can order operators of power plants to reschedule their electrical power generation. As the sum of energy being supplied cannot change in order to cover all demand, a power plant on one end of the bottleneck needs to generate less electricity. Another plant on the other end of the bottleneck then increases its generation. The congestion is simply avoided by this type of rescheduling. As illustrated above, fluctuations historically occurred on the demand side of power systems. Reliable sources on the side of generation balanced these fluctuations. With weather dependent IRES becoming a bigger part of power systems, congestion management has to adapt its strategies as well. [50; 48; 49]
Additionally, IRES are built at locations which promise high output, but are often remote from demand centres. As mentioned, the power grid was designed to supply locally, not to transmit electricity over long distances. Consequently, connecting these remote locations as well as variability caused by both sides of power systems increase the burden put on the power grid, the likeliness of congestions, and the complexity of managing the power flow. With the increasing amount of IRES and delays in grid expansion projects, finding solutions to lighten the burden on the elements of the power grid is an increasingly important task and an opportunity for flexibility options, such as hydropower plants. [50; 19]
2.2.2 Four kinds of flexibility Flexibility measures can be categorised into four main categories: dispatchable generation, demand side management, increased interconnection, and energy storage [35; 51; 8]. There are different kinds of facilities being able to provide either one or several of these types of flexibility. [35; 51; 8; 36; 52; 42]
2.2.2.1 Dispatchable generation
Fossil-fuelled and nuclear power plants
First of all, when there is a surplus or deficit of energy within a system, one option is to alter generation itself. Therefore, large-scale power plants are traditionally a main source of flexibility. The sensibility of this measure depends on the properties of the facility. This type of flexibility is hindered by four restrictions of power plants: minimum point and maximum point of operation, ramp rate, and start-up time [53]. These key figures can vary depending on characteristics of the facility. As fossil-fuelled power plants can be in operation for several decades, more recently built power plants are often further developed and more dynamic. The key figures mentioned below contain modern and older power plants. [24; 54; 36; 55]
Operating conditions of fossil-fuelled and nuclear power plants
Start-up time, as illustrated in Figure 12, is the amount of time needed for a power plant to reach a stable point in operation, which is mostly defined as the minimum load [34]. This key figure can generally be categorised as hot, warm, or cold start-up [56; 34]. The reason for this distinction lies in operating conditions. The materials of power plants can only endure certain temperature changes without damages [57]. Elements in fossil-fuelled power plants need a certain operating temperature, which has to be regained after a standstill [57]. In the

THREE EUROPEAN ENERGY SCENARIOS
20
future, power plants which are able to react quickly to fluctuations of IRES are gaining importance. In order to balance variability of IRES, other sources of electrical power generation will need to be able to be turned on and off quickly, within 15 to 30 minutes [8], and often, even several times within a day. [57; 53; 58; 59; 8]
Figure 12: Exemplary illustration of restrictions of fossil-fuelled power plants [53]
While in operation, fossil-fuelled power plants are often not dispatched below a certain point, the lowest stable point of operation, as shown in Figure 12. Operating power plants at a minimum load avoids long start-up phases and enables them to react more quickly to changes within power systems and energy markets. In regard to the creation of power systems, fossil-fuelled power plants are not optimised to function at low points of operation, but to constantly cover stable amounts of base load. Concerning a future highly renewable power system, low possible minimal loads are desirable. If electrical power generation by IRES is considerably high, for example at peak hours of photovoltaic electrical power generation at midday, the option of dispatching fossil-fuelled electrical power generation as low as necessary provides valuable flexibility. [57; 59]
The third parameter for this type of flexibility, the ramp rate, is the rate at which the supply of power can be adjusted [34; 53], again illustrated in Figure 12. It describes the potential change in load in proportion to the nominal load of the power plant [34]. The highest rates are achievable within the bandwidth of minimal to nominal load [34]. A high speed of load change indicates a high flexibility. Such a power plant is able to react more quickly to changes within power systems and power markets [57]. With IRES increasing within power systems, higher ramp rates provide higher degrees of flexibility [59].
Base load power plants
Following the categorisation of load explained before, fossil-fuelled and nuclear power plants are mainly used to cover base load. Due to the development of power systems, lignite and nuclear power plants are among the earliest and most common large-scale power plants.
0
10
20
30
40
50
60
70
80
%
100
Start-up time
Nominal load
Minimum load
Ramp rate
Time
h
Load
THREE EUROPEAN ENERGY SCENARIOS
21
They used to cover mostly expectable demand curves and to be operated for long periods at once. They are often high in investment costs, especially nuclear power plants in order to fulfil high safety requirements [60]. Due to low variable costs, fossil-fuelled power plants are most cost-effective over a longer period of operation [24]. Therefore, it is economically sensible to maximise the usage of these power plants, covering the mostly constant base load [24; 54].
After a standstill, depending on its duration, power plants can take several hours to reach a stable point of operation again. Even if they have been standing still for less than eight hours, lignite power plants require a run-up phase of two [61] to six hours [55; 57; 58]. The warm and cold start-up time can take five [61] to ten hours [57]. [55; 58; 57; 61].
Given their start-up phases lignite power plants do not completely disconnect from power systems in many cases, but operate at minimum load. These levels are about 35 to 60% of nominal load [53; 57; 55]. This point in operation limits the flexibility of lignite power plants. Their load change rate lies between one and four percent per minute given the fact that they are operating at 50 to 90% of nominal load [55; 58]. Table 1, at the end of this section, provides an overview over the characteristics of these and the following power plants.
Nuclear power plants are generally less dynamic and take longer to restore their maximum amount of power. Despite the technical ability of these power plants to provide regulatory power reducing their output to provide short-term regulatory actions can be less economical. Bringing them back to a stable point of operation can last three hours for a hot, eight to twelve hours for a warm and even up to fifty hours for a cold start-up [61; 34]. Therefore, nuclear power plants are often in operation even if power systems do not need their output. Them taking several days to be fully effective again would result in higher opportunity costs as they could not supply the market. This is why they often operate at a minimal load of 50% or higher, even though their technically possible minimum load is set at 20 to 30%. Above this minimal load, they can provide a load change rate of 10% per minute [62]. Therefore, they are not flexible enough to cushion short-term forecast errors of IRES. [55; 61; 34; 59]
As fossil-fuelled power plants already generate heat, there are power plants additionally offering a combination of electricity and heat supply. The heat provided by these facilities cannot travel long distances, but is used for heating applications and district heating networks within a nearby area, mostly near city or industrial areas [35; 24]. As they are not only feeding into the electricity but also the heating system, they are bound to the demands of both systems. This additional restriction, in comparison to regular fossil-fuelled plants, is a reason they tend to be less flexible. [24; 35; 55; 34]
As all of these base load power plants are often operated at a high amount of power, they do not have many resources left to provide regulatory power, except Frequency Containment Reserves. Due to their long run-up phases, they cannot react quickly to possible short-term changes caused by IRES and cushion prognosis errors. Additionally, to reach their climate goals, European countries will, in the long run, have to abolish fossil-fuelled sources of electrical power generation. Their properties make base load power plants fairly inflexible options for balancing a highly renewable power system. [54; 24; 63; 41; 64; 55; 65]

THREE EUROPEAN ENERGY SCENARIOS
22
Medium load power plants
Plants for medium load are similar, but are able to regulate their power output more easily. Plants powered by hard coal for example share many properties with lignite power plants, but are able to regulate more easily with a slightly shorter run-up phase and higher ramp rates. For an easier comparison of these power plants, refer to Table 1. Hard coal plants need two to three hours to provide their full potential again after a standstill of under eight hours [58; 57]. More recently built hard coal plants can even start up within one hour [61; 57]. Warm start-up can take three to ten, a cold one four to ten hours [61; 57]. Their minimum load is set at 25 to 40%. During operation, they can provide tertiary control as they can alter the amount of power provided by two percent per minute [55; 63]. Modern hard coal power plants can even reach six percent per minute [53]. Consequently, hard coal power plants are better equipped to serve as flexibility option than base load power plants. They are still not flexible enough to balance short-term fluctuations of IRES. In order to achieve more environmentally friendly power systems, many countries are planning to reduce the amount of power plants using fossil materials. Among those, hard coal causes the most greenhouse gas emissions. Eventually, other flexibility options have to be integrated into the systems. [55; 63]

THREE EUROPEAN ENERGY SCENARIOS
23
Peak load power plants
Peak load power plants on the other hand mainly cover high demand periods. Primary facilities for this use are often gas fired. Power plants using gas turbines are very flexible. Source [61] lists the start-up phase of gas turbine power plants as 0.33 hours, which equals approximately 20 minutes, regardless of the type of start-up phase. Sources [55] and [58] define their cold and hot start-up phases as less than six minutes. Unlike the former, [34] lists their warm start-up phase at one hour. As with other fossil-fuelled power plants, these characteristics can vary due to the properties of the facility. Although differing, these numbers show the higher amount of flexibility of gas power plants in comparison to other fossil-fuelled power plants. The minimum load is approximately 20 to 50% of nominal load [34; 57; 58]. They can change their load with a speed of eight to fifteen percent per minute within a load range of 40 to 90% of nominal load [57; 58]. These high degrees of flexibility reflect in their high operating costs [24]. Although low in investments costs, their high operating costs limit their appeal as a flexibility option. In general, many countries are trying to reduce greenhouse gas emissions and will need to abolish fossil fuels overall at some point in the future. [24; 54; 55; 34; 63]
Lignite Nuclear Hard coal Gas
Start-up time
Hot
(<8 h) 2h-6h 1h-3h 1h-3h 6min-20min
Warm
(8h-48 h) 5h-10h 8h-12h 3h-10h 6min-20min
Cold
(<48 h) 5h-10h <50h 4h-10h 6min-20min
Minimum load
%Pnom 35%-60% 20%-30% 25%-40% 20%-50%
Load change rate
%Pnom/min 1%-4% 10% 2%-6% 8%-15%
Table 1: Characteristics of dispatchable power plants [53; 56; 34; 58; 59; 8; 61; 57; 55; 62; 63]
Renewable power plants
Alternatives to fossil-fuelled power plants are already part of power systems. Run-of-river hydropower has been used for a long time to cover base load. As other base load power plants, run-of-river power plants are low in variable costs and are in operation for long periods of time. Run-of river hydropower does not consume materials like coal, but uses a river’s

THREE EUROPEAN ENERGY SCENARIOS
24
current flow to provide electricity steadily. In continental Europe, only a small amount of water can be withheld or stored and therefore, the generation of electricity cannot change to a great extent. On the contrary, run-of-river hydropower in the Nordics is often considered dispatchable due to large reservoirs high up in the rivers. The output depends highly on the availability of water, which can vary within or during seasons, depending on the location of the power plant. They can provide Frequency Containment and Frequency Restoration Reserve, but are bound to the restrictions of their environment and properties. [63; 66–68]
This dependency of supply is a key element of all IRES. If there is no wind or sun available, there is no generation of power and no flexibility. If there is, they have the ability to generate electricity without consuming natural resources and causing greenhouse gas emissions. These are reasons why converting wind and solar energy is more climate friendly than burning fossil fuels. This is also why their share and importance will increase in the future to achieve climate goals. [8]
The only type of RES power plant able to dispatch its generation is bioenergy. It uses harvested organic matter, including biomass and waste fuels, in solid, liquid or gaseous form. Compared to other RES, bioenergy only accounted for 8% of global renewable energy production in 2016. Their relatively high operational costs, in comparison to other, more mature technologies, often cause concerns about integrating this technology into power systems. The largest market for bioenergy is within the heat sector. This technology might become more important within power systems in the future. [69]
Aiming at making power systems as environmentally friendly as possible, current laws in many European countries give priority to the feed-in of wind and solar power. Their electrical power generation has to be implemented into systems first, then other plants have to follow their lead and adjust. This is why they mostly operate at their highest amount of power even though it limits their flexibility. The dispatch of IRES would be easier than the dispatch of fossil-fuelled power plants. Restrictions such as minimal load and start-up phases do not apply. Giving priority was a measure to promote the development of IRES and has helped to increase their amount. It also means that this priority will have to end at some point. When the priority feed-in is abolished, wind and solar power may not be generating on their highest power at every opportunity, but be reduced when desirable. Then, they would be able to provide flexibility in either dispatch or increase of their generation. These reasons limit the flexibility of wind and solar energy currently, but may provide possibilities in the future. [36; 8; 55; 66; 70]
In conclusion, flexibility in dispatching generation is technically possible for all these types of power plants. Altering their outcome may not always be economically sensible for various reasons. Additionally, as European countries are sharing a future vision of including higher amounts of RES and excluding fuel based power plants, many of these generation options may not be desirable or available in the future.
2.2.2.2 Demand side management Secondly, on the other side of the value chain, demand side management (DSM) can be used. DSM includes reviewing, choosing, and implementing measures to influence the amount or
THREE EUROPEAN ENERGY SCENARIOS
25
time of demand by TSOs, industrial or private consumers [64; 71]. These means can decrease costs, for consumers and TSOs, and increase system stability [64; 71; 72].
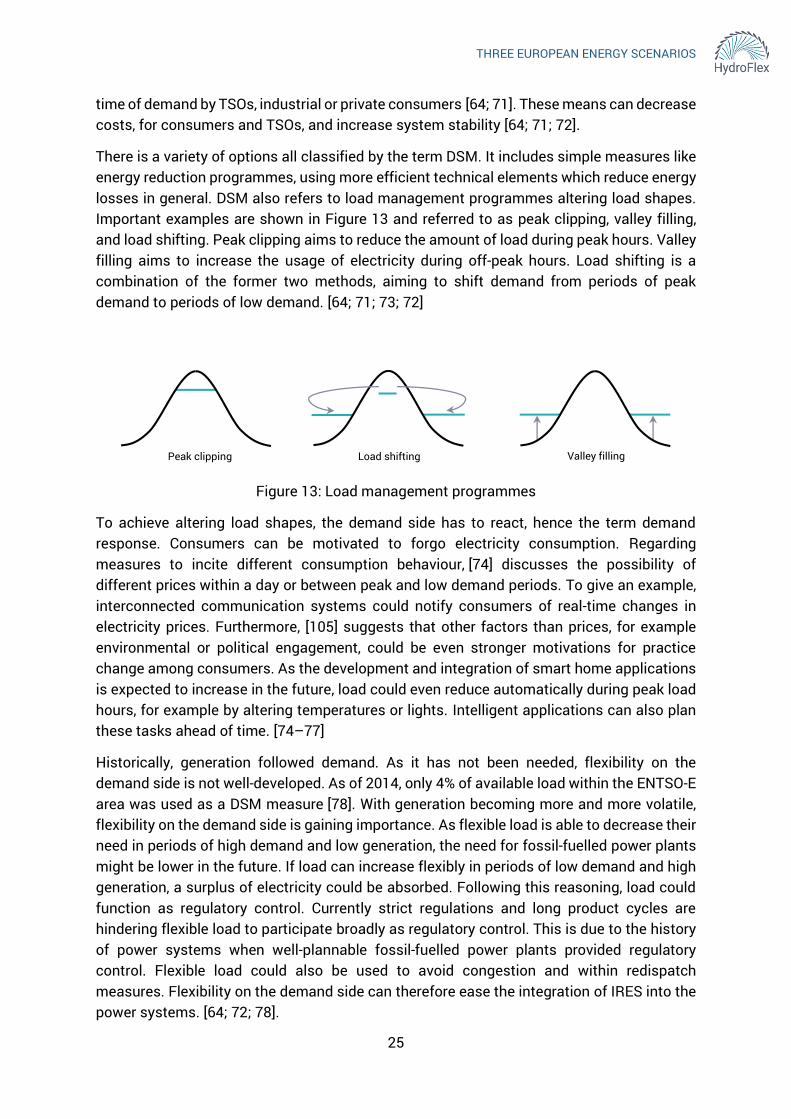
There is a variety of options all classified by the term DSM. It includes simple measures like energy reduction programmes, using more efficient technical elements which reduce energy losses in general. DSM also refers to load management programmes altering load shapes. Important examples are shown in Figure 13 and referred to as peak clipping, valley filling, and load shifting. Peak clipping aims to reduce the amount of load during peak hours. Valley filling aims to increase the usage of electricity during off-peak hours. Load shifting is a combination of the former two methods, aiming to shift demand from periods of peak demand to periods of low demand. [64; 71; 73; 72]
Figure 13: Load management programmes
To achieve altering load shapes, the demand side has to react, hence the term demand response. Consumers can be motivated to forgo electricity consumption. Regarding measures to incite different consumption behaviour, [74] discusses the possibility of different prices within a day or between peak and low demand periods. To give an example, interconnected communication systems could notify consumers of real-time changes in electricity prices. Furthermore, [105] suggests that other factors than prices, for example environmental or political engagement, could be even stronger motivations for practice change among consumers. As the development and integration of smart home applications is expected to increase in the future, load could even reduce automatically during peak load hours, for example by altering temperatures or lights. Intelligent applications can also plan these tasks ahead of time. [74–77]
Historically, generation followed demand. As it has not been needed, flexibility on the demand side is not well-developed. As of 2014, only 4% of available load within the ENTSO-E area was used as a DSM measure [78]. With generation becoming more and more volatile, flexibility on the demand side is gaining importance. As flexible load is able to decrease their need in periods of high demand and low generation, the need for fossil-fuelled power plants might be lower in the future. If load can increase flexibly in periods of low demand and high generation, a surplus of electricity could be absorbed. Following this reasoning, load could function as regulatory control. Currently strict regulations and long product cycles are hindering flexible load to participate broadly as regulatory control. This is due to the history of power systems when well-plannable fossil-fuelled power plants provided regulatory control. Flexible load could also be used to avoid congestion and within redispatch measures. Flexibility on the demand side can therefore ease the integration of IRES into the power systems. [64; 72; 78].
Peak clipping Load shifting Valley filling

THREE EUROPEAN ENERGY SCENARIOS
26
With a future highly renewable power system, flexible options to cushion IRES variability and forecast errors are becoming increasingly important. There is still a great amount of uncertainty about the future potential of load flexibility. As explained in [72], there are numerous technologies and industries which can be taken into consideration. With different assumptions and deductions, the possibilities cannot be clearly defined currently. Additionally, different countries offer different DSM options and frameworks. With a pan-European power system in mind, European countries will need to agree on common regulations concerning DSM to harness the potential of these measures. [78; 79]
2.2.2.3 Increased interconnection Thirdly, expanding power grids can help integrate IRES. Power grids did not use to transmit electricity over long distances, but did use to supply within limited areas. IRES facilities are bound to certain locations due to supply and location properties. Wind parks are therefore often not close to big demand centres and a growing number of private citizens are operating small-scale solar panels on village-based roof tops. Having these increasingly remotely located or decentralised sources of electrical power generation, the need for a stronger network is growing. Improving infrastructure can help include these locations and transport energy generated by IRES over longer distances. Developing power grids would also help prevent congestions within the power grids and provide more flexibility. More connections between generation and demand units could balance fluctuations in either load or generation more easily.
This is not only a task on a national, but on an international level in order to manage flows more efficiently. As mentioned in section 2.1, the electricity supply system in the European countries has mostly developed individually. Therefore, the European power system is heterogeneous and further interconnection in between European countries could lead to compensation effects decreasing the demand of flexibility.

THREE EUROPEAN ENERGY SCENARIOS
27
Figure 14 shows interconnection levels of power systems within Europe. As can be seen, these are currently below 15% for the better part.
Figure 14 however also depicts the fact that numerous countries are collaborating on projects to interconnect their power systems. Building one future European power grid will itself present a challenge as it is a highly complex operation in need of support by European governments regarding laws and policies. [8; 36; 29; 12; 80; 81; 15; 11; 30; 7]
Figure 14: Map of interconnection levels and interconnections projects (2017) [82]
2.2.2.4 Energy storage This chapter describes the last flexibility option: energy storage. Electrical energy cannot be stored directly. Storing electricity is a process of converting electrical into a different kind of energy, e.g. potential or chemical. At a later point in time, when needed, it is converted back into electrical energy and fed into the power system. There are several dissimilar storing options available. Their advantages, capacities, and costs can vary profoundly. [36; 8; 83; 55]
Compressed-air energy storage systems
Compressed-air energy storage systems (CAES) are an example of mechanical storage, using electricity by compressing air into caverns below the surface. In this manner, CAES can absorb surplus of electricity in times of low demand. These systems can later release the compressed air into a turbine, using it to generate power, and balance times of low electrical power generation. The size of CAES is technically unlimited, but depends on the volume of the caverns available. Sources [30] and [84] name northern Germany and north-western Europe specifically to offer suitable salt caverns for possible future CAES. These caverns also store gas which can restrict the availability for CAES. [41; 8; 30; 34; 84]
Projects of priority cross-borderinterconnections and projectsunder study
Lowest Highest

THREE EUROPEAN ENERGY SCENARIOS
28
So far CAES has not been widely used. There are only two relevant CAES facilities commercially in use today. The concrete possibilities and profitability of CAES as a future flexibility option are still affected by uncertainty and will depend on further technological developments. Therefore, CAES’ technical details are not considered in in this report in detail. [34; 85]
Batteries
A chemical storage possibility is using batteries. They are charged during a chemical process induced by a voltage source and drained by a reversed chemical process. They are also able to self-start and can provide the maximum of their power within seconds. Batteries therefore can provide Frequency Containment and Frequency Restoration Reserve. They can absorb surplus electricity during periods of low demand as well as provide electricity during periods of low electrical power generation. These processes of charge and discharge can happen repeatedly. Therefore, they are able to cover fluctuations of IRES and demand. The capacity and maximum power of batteries are technically very high, but depend on their type and profitability. [55; 8; 86; 87]
There are different technologies being used for different purposes. Lithium-ion batteries provide high efficiency and energy density. This is why they are common within the electromobility industry. The integration of batteries into power systems is currently under development. Recently, as of June 2018, the largest battery storage system in Europe started operation in Jardelund, Germany. This pilot project uses Lithium–ion batteries and offers 48 MW with a capacity of 50 MWh. The largest battery storage in the world is located in Australia and offers 100 MW with a capacity of 129 MWh. Electricity can be supplied or consumed in a split second [88; 89]. Lead-acid batteries are much cheaper, but tend to self-discharge more and endure fewer charging cycles. Either one of these types of batteries can react within less than ten milliseconds [90; 35]. Source [9] characterises battery storage as suitable for time frames of milliseconds to hours. In general, the potential of batteries providing flexibility is currently limited. Pilot projects like Jardelund are being developed and operated, but this technology is not yet commercially used in larger scales within power systems. They still cause high investment costs and may be a more suitable option in the future if further developments are achieved and costs decreased. [55; 8; 86; 90]
Power-to-gas
For a higher amount of storage, power-to-gas-systems are an option. This technology offers an interconnection of fields. Electricity can be transformed into hydrogen or, using additional transformation, methane. Source [91] provides a detailed description of the transformation process and technology involved. The gas can either be fed into the gas network or stored for later usage. Hydrogen can only be fed into power systems to a certain extent. The existing gas network offers some storage capacities in contrast to power systems. Connecting the electricity to the gas system expands the reach of energy within larger areas and adds extra flexibility. As this process also adds the demand for gas into the equations, this added flexibility is counterbalanced to a certain extent. [91; 55; 86]
Depending on future growth of these systems, added gas storage facilities may be needed which reduce their appeal of flexibility. Storing energy by these systems has a high potential

THREE EUROPEAN ENERGY SCENARIOS
29
as they allow for large capacities. However, they only offer an efficiency of 50% if the electricity is turned into hydrogen and back into electricity. If the electricity is additionally turned into methane, the efficiency is lowered to 30%. Despite this rather low efficiency, this technology profits from the well-expanded gas infrastructure in Europe. The possibility of connecting these systems within this infrastructure are numerous. In order to make this technology a viable option, the efficiency has to improve further. In case of such developments, these systems might be a promising technology, especially for seasonal storage. [55; 8; 86]
Storage hydropower
Overall, all of these storage systems cannot currently deliver the high level of flexibility needed while offering profitability at the same time. Another flexible storage alternative has already been used reliably for decades: storage hydropower. It is currently the most used storage technology worldwide, accounting for over 127 GW of installed power [90]. Storage hydropower facilities hold up water from a natural source in a reservoir. Figure 15, shows an exemplary structure of a hydro storage plant. As illustrated in Figure 15, the stored water can be released, mostly through the gates of a dam, to generate electricity. The water is not held and flows, e.g., into a river afterwards. Therefore, only the downwards motion illustrated in Figure 15 is relevant for storage hydropower. Depending on the volume of these plants, water can be stored for days or months – in the Nordics even for years by multi-year reservoirs – and released whenever electricity is needed. [66; 92; 41; 93]
Adding more flexibility to storage hydropower is pumped storage hydropower (PSH). Figure 15 illustrates an exemplary PSH plant. PSH plants consist of at least two basins of water, as Figure 15 depicts, one higher up than the other. Again, to release saved energy, water can flow downstream into a turbine. In contrast to storage hydropower, the released water then remains in a lower basin. The benefit of these power plants is their ability to use and store excess energy by pumping water upwards into the higher basin. [41; 66; 93; 30]
Figure 15: Exemplary structure of storage and pumped storage hydropower plants [41]
These power plants provide an electricity conversion efficiency rate of 80 to 95% [55; 30; 94]. The amount of power one facility can offer depends on the volume of the basins and can
Upper basin
Lower basin

THREE EUROPEAN ENERGY SCENARIOS
30
account for several hundred MW on short notice. They are quick to react and can provide their maximum pump power within 75 to 110 seconds, even after standing still [55]. Additionally, they provide self-start ability. Some highly flexible PSH plants can provide their full amount of power within a few seconds while in operation. [92; 66; 30; 41; 93]
With their ability of functioning as generation or demand unit, PSH especially can help ease variations in prognosis of both sides of power systems. This well-developed technology is able to provide all types of regulatory power. Traditionally designed as peak load power plants they are able to supply all categories of load. With this high degree of flexibility, PSH has a high potential to successfully integrate IRES into a European electricity system. [55; 8; 66; 9]
Due to their many benefits as well as their early implementation into power systems, PSH plants are well represented. Figure 16 compares the globally installed capacities of PSH to other storage technologies. As can be seen, the total number of installed PSH capacity (sum of maximum power output) worldwide is considerably higher than any other storage technology. Source [94] lists the installed capacity of the 28 countries in the EU plus Switzerland, Norway, and Iceland at 51 GW and their generation resulting through pumped storage plants at 33 TWh in 2017. This reflects the many possibilities of PSH for future use.
Figure 16: Proportion of installed capacity of various electric storage systems [95]
PSH facilities are high in space requirements: not only do they need wide spaces to include the volume of their basins, but significant differences in altitude as well. Interferences with nature as well as investment costs are high. As installed PSH plants are already numerous, additions are not expected in high numbers in the future. Updating storage hydropower to PSH or installing more capacity in existing power plants in Europe might be an option providing additional flexibility without additionally interfering with nature or causing the high investment costs of a completely new power plant. Depending on the properties of storage hydropower plants, updating might be easier with some power plants than with others. Many storage hydropower plants do not offer the possibility of creating a lower basin. Therefore, a great possibility is seen in the hydropower resources in the Nordics. The installed storage capacity of Norway, for example, is already listed at 110-120 TWh. Upon that, hydropower plants in the Nordics have often large reservoirs both upper and lower in many places which simplifies updating to PSH. Including these storage possibilities into a European system, could allow, for example, balancing Northern Europe’s wind electrical power generation. [35; 30; 67]
CAES
Lead-acid batteryLithium-ion battery
PSH
THREE EUROPEAN ENERGY SCENARIOS
31
2.2.3 Essential factors for flexibility When evaluating Nordic hydropower as an option for flexibility, certain future developments will influence their suitability. The following key factors will affect the possibilities of hydropower in future scenarios: net transfer capacity, extent of grid expansion, relation of hydropower to other sources of flexibility as well as of electrical power generation, the total IRES share, and the distribution ratio.
2.2.3.1 Grid expansion within Europe Higher levels of flexibility can be achieved by increased interconnection as mentioned in section 2.2.2.3. Expanding power grids creates more interconnections between and within European power systems. By these means, more facilities of generation and demand would be interconnected and able to balance each other. A higher number of flexible facilities would be able to contribute to the stability of the overall system as well. Recognised as an important form of flexibility, the expansion of power grids is currently a goal of many European countries. Following the same reasoning as above, the extent of compensation effects cannot be evaluated currently, but does not decrease the importance of this key factor.
2.2.3.2 Net Transfer Capacity between Continental Europe and the Nordic countries
Net Transfer Capacity (NTC) refers to the expected maximum amount of generation which two systems can exchange without causing system disturbances in either of them [96]. NTCs are defined by the sum of maximal transmission power of the border coupling lines. If NTCs between European countries rise, possibilities of electricity exchange improve. Higher NTCs between the Nordic countries and Central Europe in particular are of importance for hydropower. The Nordic countries include, in this report, the countries of Sweden, Norway, and Finland and exclude Iceland and Denmark due to their geographical position. Denmark is considered a part of Continental Europe due to its geographical position. When these Nordic countries, rich in hydropower, can deliver higher amounts of electrical power, they can provide higher flexibility. Even though higher NTCs offer added flexibility, this can be contradicted as the compensation area increases as well. Within a larger area, more compensating effects occur. This might decrease the need for flexibility, thus the potential need for hydropower. These contradicting effects are not measurable, which is why a statement about their extent cannot be made currently and has to be examined further using adequate computational simulations.
2.2.3.3 Number of base load power plants As hydropower plants can operate as base load power plants, their future benefits are highly dependent on the availability of other base load power plants. European countries are currently trying to limit global warming. For them to achieve their goals, they will eventually have to abolish or greatly reduce the amount of hard coal and lignite power plants from their power systems. If these currently used base load power plants are no longer in operation, hydropower plants are suitable to function as base load power plants. As base load power plants are operating continuously and at high levels of electrical power generation, they would be less able to alter their generation quickly and frequently. The flexibility of these hydropower plants would be limited. They would be less able to provide Replacement
THREE EUROPEAN ENERGY SCENARIOS
32
Reserves or function as long-time storage. A fewer amount of base load power plants could also imply less Frequency Containment Reserves provided by base load power plants. Hydropower plants would be a suitable option to cover these needs. If high numbers of competitors exist, other non-hydropower options might cover flexibility needs.
2.2.3.4 Competition of peak load power plants As hydropower plants can operate as peak load power plants as well, their expected future benefits depend on the availability of other flexibility options. Currently, there are numerous peak load power plants implemented into European power systems. These mostly fossil-fuelled power plants alone are not suitable to integrate high amounts of IRES, as discussed in section 2.2.2.1. If high numbers of competitors exist in future European power systems, flexibility provided by Nordic hydropower might not be needed. This competition might include CAES and batteries, depending on their future profitability as well as suitability. As gas power plants already cover peak load demand periods, they might be an important competitor to flexible hydropower within this field.
2.2.3.5 Proportion of hydropower to other flexibility options As hydropower plants can provide all sorts of flexible reaction, their future benefits highly depend on the availability of other options. The quotient of the available hydropower divided by the sum of available hydropower and other options measures this competition. A small quotient indicates a high number of competition while a high quotient indicates a lower number of competition. Competitors might be power-to-gas, batteries or CAES. Though currently not profitable, their technological and economic circumstances might change in the future and make them competitors of hydropower. If high numbers of these exist in the future, hydropower might not be the primary choice for flexibility needs.
2.2.3.6 IRES shares This key factor reflects the share of IRES in electricity net generation. When looking at future scenarios, IRES shares include fluctuating RES like wind and sun rather than stable RES like run-of-river hydropower or bioenergy. As forecast errors and their fluctuation will cause higher disruption within a system of high IRES shares, the amount of these varying RES dictates flexibility needs. Therefore, the more IRES are included in power systems, the more potential for hydropower as flexibility option arise.
2.2.3.7 Distribution ratio For the purpose of this report, this term is defined as follows: distribution ratio is a key indicator describing the decentralisation of power systems. Decentralisation describes the existence of several small-scale generation units distributed within an area. In contrast, power systems have historically been built centralised with large-scale power plants. The distribution ratio is expected to increase in the future alongside the rise of IRES capacities. For the usage of large-scale hydropower plants, a smaller distribution ratio is desirable. A high number of distributed small-scale IRES plants would go alongside a high number of home storage as well as local balance concepts. These would provide flexibility locally and be able to compensate each other. They would decrease the need for flexible hydropower plants.

THREE EUROPEAN ENERGY SCENARIOS
33
3 IAEW toolchain – power system simulation WP2’s main objective in the HydroFlex project is to identify and describe the demands that hydropower plants will be confronted with in future power systems. In order to do so, one main task is to simulate three scenarios of the European power system. Figure 17 depicts the different steps of the simulation toolchain.
Figure 17: Overview of power system simulation toolchain
3.1 Market The market simulation is the first step of the simulation toolchain and calculates the dispatch of generation units, the net positions, costs, and prices. Those output parameters are time series and input to the next step of the toolchain. The market simulation uses a fundamental approach and conducts a minimisation of the total costs for electrical power generation for an entire year in an hourly resolution for European countries considering exchanges between market areas [97]. The optimization approach considers the following technical and economic parameters:
detailed composition of power plant units of all coupled market areas
demand for electrical energy and balancing reserves
technical parameters and limited availabilities due to power plant outages
the variable costs of power plants
primary energy and emission certificate prices
dispatch constraints
Hence, this report defines three scenarios, which represent the input data for the market model. The status quo of the market model contains 40 interconnected European market areas. Regarding power supply, over 3000 hydraulic and thermal power plants in Europe are included with their commissioning date, rated power, planned decommissioning date, etc. – if publicly available. Those power plants cover 100 % of the installed capacities in Europe, since actual power plants with less than 50 MW can be aggregated. Upon that, RES units with unit type, rated power for each unit, etc., as well as the power demand for electrical energy and control reserves, are part of the model. Finally, household, commercial and
Market Grid operation Stability
3 scenarios
Scenario andinput data
• Dispatch• Net positions• Costs and
Prices
• Power flow on lines
• Redispatch (if required)
• Time series of frequency
• Evaluating frequency deviation
Market dispatch Critical situations
Step
1
Step
2
Step
3

THREE EUROPEAN ENERGY SCENARIOS
34
industrial loads are modelled depending on population density for postal code areas and economic strengths of regions.
In order to parametrise a future scenario, the status quo of IAEW’s (Institut für Elektrische Anlagen und Energiewirtschaft: Institute of Power Systems and Power Economics) power system database is used as a starting point. This offers the advantage that planned developments, such as commissioning and decommissioning of individual power plants, are taken into account. Upon that, it is possible to parametrise certain target installed capacities by fuel type with the knowledge of generation units, demands, and their locations. In this way, the parametrisation realises e.g. additional capacities as extensions of actual power plants or new constructions near historical locations. This procedure leads to a more appropriate future model, in particular, the connection to the transmission grid.
3.2 Grid operation The second step of the toolchain is the grid operation simulation. In order to evaluate the requirements for hydropower plants providing flexibility towards transmission systems operators (TSO), estimations on future transmission grid congestions and the amount of redispatch for removing these congestions are necessary. In order to achieve realistic results, operational practices and regulatory constraints have to be considered in an adequate way in a redispatch simulation model. This includes the (n-1)-criterion as well as the most effective and economically efficient remedial actions to relief congestions. The redispatch model used within this study uses a fundamental approach based on an optimisation problem design [98]. It was developed in cooperation with European TSOs and research facilities as part of a study for the European Union and determines optimised redispatch measures for a given grid parametrisation.
In the HydroFlex project, the future parameterisation builds on an approximated model of the European transmission grid. This includes lines according to grid maps and additional publications with their construction date as well as planned grid expansion projects. Furthermore, it uses standard operational equipment and connects power plants based on their location. Additionally, load is distributed according to known load centers. The parameter of the grid model has been set by means of published reference load flows.
In order to parameterise future scenarios, this grid model is used as a basis. Regarding the near future, planned grid expansion projects are included in the grid model’s database and can be easily integrated. Upon that, future scenarios have to define certain transmission capacities because no detailed grid expansion projects are available. To parameterise those, the actual grid will be taken into account. This procedure ensures an appropriate future model of the European transmission grid.
3.3 Stability This paragraph gives a short overview of studies on frequency stability. For the analysis of frequency stability time domain simulations from a few milliseconds up to a few minutes are performed. As shown in Figure 17 critical scenarios and events can be derived by market simulation and followed by a grid operation simulation and are important for stability analysis.

THREE EUROPEAN ENERGY SCENARIOS
35
In Figure 18, an overview of the different steps within the simulation tool for frequency stability analysis used in the HydroFlex project is shown. In general, the necessary input parameters are a grid model, data of loads and supply and a disturbance. The impact on the system of the latter is to be analysed by the tool.
Figure 18: Overview of simulation tool for stability analysis
First, the system needs to be initialised by a power flow calculation to obtain an initial steady-state system. To start a simulation in the time domain, the transient components are initialised. After applying the disturbance to the network, the time series of frequency for each site are calculated by solving the differential-algebraic equation system in use of numerical integration. The time series of frequency and the evaluation of the rate of frequency deviation is used to derive conclusions regarding the frequency stability of the network. Exemplary disturbances to be applied for calculations in this project are defined in paragraph 6.2.
Input parameters- Grid model- Loads and feeders- Disturbance
Output of results- For each site:
- Time series of frequency- Evaluation rate of frequency deviation
Stea
dy-s
tate
initi
alis
atio
n Initialisation of components forpower flow calculation
Power flow calculation
Dyna
mic
si
mul
atio
n Initialisation of dynamiccomponents for simulation
Simulation in time domain

THREE EUROPEAN ENERGY SCENARIOS
36
4 Scenario development with regard to subsequent simulations
Scenarios have been established in many fields as concepts of thinking systematically and reasonably about the future. These often describe fields of high social relevance. They especially discuss in detail fields characterised by great uncertainties. Uncertainties contain the extent of certain key factors involved as well as differences in opinions and knowledge about these. The future is seen as uncertain, but analysable by scientific methods, and to some extent shapeable. Scenarios express the possibility of future developments. Possibility, in the context of scenarios, implies a consistency with currently available and relevant knowledge. [99]
These characterisations are especially relevant for the future of electricity supply. Decisions about power grids or power plants always cause several economic, social, and ecological consequences. To give an example, building and operating a power plant is not only a significant financial expense but also often a commitment of several years, if not decades. Before investing in such projects or the development of new technologies, all parties involved are interested in their future profitability. Scenarios about the future electrical landscape are therefore a means of making well-founded decisions and are of high interest to all parties involved. [99]
State institutions, companies as well as civil society organisations publish scenarios in high numbers every year. Consequently, they differ in objectives and results, as well as transparency and quality as well as suitability to the tool chain described in chapter 3. Well-founded scenarios are an important foundation of social discourse, which can help to achieve consensus about the future of power systems. There are two different approaches for scenario development for future European power systems. [99]
The first approach is using scenario techniques and models to develop future scenarios of the European power system. Most of these models start from scratch. Based on external parameters, e.g. prices or electricity demands, these approaches use capacity expansion planning models to optimise the minimal cost development of the European generation system. PRIMES (Price-Induced Market Equilibrium System), as one example, has been used to create energy outlooks such as the EU reference scenarios or the so-called EUCO Scenarios of the European Commission [100]. Although this approach offers high transparency, these scenarios often have to deal with problems of acceptance. Since suitable input parameters are essential to the output of the optimisation models, the results of these models are often questionable. For this reason, using these scenarios based on expansion planning models or even optimising the future development of the European generation system is not reasonable to achieve the main objective of the HydroFlex project.
An alternative approach is using other selected European scenarios as a reference or starting point to define scenarios. The ENTSO-E publishes European scenarios such as the Mid-term Adequacy Forecast (MAF) and the Ten-Year Network Development Plan (TYNDP) on a regular basis. Various (national) stakeholders, e.g. TSOs, contribute national future developments that can be foreseen with certainty. In this way, the resulting scenarios are linked with

THREE EUROPEAN ENERGY SCENARIOS
37
national development plans. Upon that, the stakeholders discuss further developments in workshops and, in addition, validate their results by public consultations. Although these processes sometimes lack transparency, deriving scenarios from these ENTSO-E scenarios ensures the most appropriate and probable basis. For this reason, the following chapter describes the ENTSO-E’s scenarios of future European power systems.

THREE EUROPEAN ENERGY SCENARIOS
38
5 ENTSO-E’s scenarios of future European power systems ENTSO-E publishes scenarios of future electricity demand and supply on a regular basis, painting pictures of every aspect intertwined with and within these fields. As an umbrella organisation of European TSOs, ENTSO-E has access to TSO’s data, besides others, building a reasonable foundation to base scenarios on. In the following, ENTSO-E’s three scenarios for the years 2030 and 2040 are described. Based on ENTSO-E’s scenario report [101–103], this chapter summarises the main points of their storylines (cf. Figure 19) and outlines the results of a meta-analysis using the essential factors defined in section 2.2.3.
5.1 Storylines This section will judge the three ENTSO-E scenarios using the essential factors defined in chapter 2.2.3.
Figure 19: Overview of the ENTOS-E’s scenarios for 2030 and 2040 [101]
5.1.1 Sustainable Transition Conservative developments characterise the Sustainable Transition (ST) scenario. Within this scenario, CO2 level decreases quickly and economical viably. Altogether, the EU is on course with 2030 targets, but behind schedule with 2050 targets. Nationally implemented regulations include binding targets of decarbonisation, support RES projects, and decrease the number of fossil-fuelled power plants. This reduction is achieved by gas substituting coal in the power sector. Gas power plants are widely used. Nuclear power plants are less numerous. Other low-carbon technologies, e.g. power-to-gas, are not developed as not seen as cost-efficient. [101]
Electricity demand is stable from 2030 to 2040 in the industry and residential sector. Within the transport sector, electromobility is only growing moderately. In total, electricity demand is stable or grows to a limited extent within the timeframe of this scenario. Gas is preferred
THREE EUROPEAN ENERGY SCENARIOS
39
to electricity in the transport sector. The number of gas vehicles has increased significantly. Gas demand in the industrial sector is relatively stable. The heating sector is mainly supplied by gas, but efficiency measures have decreased gas demand. Demand flexibility has grown moderately and does not play a significantly more important role than today. [101]
5.1.2 Global Climate Action The Global Climate Action (GCA) scenario is based on the ST scenario for 2030 and provides a separate scenario for 2040. Therefore, the following description is limited to 2040. After relatively slow developments until 2030, common global attempts and achievements are made to decrease greenhouse gas emissions. Policies globally and within the EU are established to achieve decarbonisation. The EU is beyond their 2030 target and on track with their 2050 target. All other categories are driven and affected by these efforts. [101]
Policies implemented to achieve decarbonisation motivate a high growth in wind and solar energies. Investments in RES are financially rewarded while carbon-intense power plants are affected by a CO2 market price. These price signals cause technologies characterised by low emissions to be more profitable and to be developed, e.g. power-to-gas. Gas power plants replace coal power plants to offer flexibility and integrate IRES into the power systems. As nuclear power plants are generally low in greenhouse gas emissions, they are not affected by CO2 market prices. [101]
Electricity demand overall has grown, significantly in electromobility and electrical heating. Energy policies support the electrification of the transport and heating sectors to decrease the use of fossil fuels. Alongside, residential and commercial electricity demand shows moderate growth. Increasing energy efficiency restricts further growth. [101]
Opposing developments influence gas demand. The transport sector shows high numbers of gas vehicles. The residential sector’s needs have decreased as electrification, improvements in building insulation techniques, and efficiency rose. The gas demand of the industrial sector is stable within the timeframe of this scenario. [101]
Demand flexibility is taking a more important role, in industrial and residential sectors. Additionally, demand response has grown in this sector. Consumers use higher numbers of automated and interconnected appliances, and have more choices in shifting load to periods of low demand. Industrial demand is stable, but also marked by more possibilities of demand response. [101]
5.1.3 Distributed Generation The focus of the Distributed Generation (DG) scenario centres around prosumers and their end-user technologies. Prosumers are consumers and producers of electricity at the same time, hence the term. Electrical power generation is primarily provided by small-scale technologies. This technology is not subsidised, but costs decrease rapidly as the economy strives. Solar panels in combination with advanced batteries balance the residential sector while fossil-fuelled power plants are decreased. Due to efforts and regulations to develop low-carbon technologies, power-to-gas is financially attractive and further developed. [101]
Electrical heating as well as smart home applications are widespread and interconnected, therefore able to communicate price signals to the consumer. The electromobility sector has

THREE EUROPEAN ENERGY SCENARIOS
40
highly increased, solar panels and batteries are widespread. Demand flexibility has also increased in the industry sector. With this high degree of interconnection, demand side management is of great importance. [101]
Overall, electricity demand has grown in the transport sector, but reduced in the residential sector due to energy efficiency and interconnection. Due to these developments in the electricity sectors, gas demand has only grown slightly. Gas is still required to cover peak load periods. [101]
5.2 Meta-analysis of ENTSO-E’s scenarios with respect to flexibility and hydropower
This chapter will judge these scenarios using the essential factors defined in section 2.2.3. For these comparisons, data published in conjunction with these scenarios and available on the ENTSO-E website [104] has been used. Though non-member nations are included in ENTSO-E’s data, only ENTSO-E member nations are considered in the following.
5.2.1 IRES shares The amount of IRES installed is generally increased in all the scenarios as European countries follow their path to a highly renewable and low-carbon power system. Figure 20 shows the amount of installed IRES capacities within each scenario of 2030 and 2040. On the left hand side, the two scenarios, ST and DG, of 2030 are shown. On the right hand side, all three scenarios of 2040 are shown. For each, from left to right, the installed capacities of solar, wind, and their total sum are shown. The ST scenario shows lower capacities in 2030 than the DG scenario. This is in harmony with the ST storyline of a more conservative transition. As the main attribute of the DG storyline centres on small-scale solar panels of prosumers, the amount of solar is slightly ahead of wind capacities in 2030. By 2040, the ST scenario has reached the IRES capacities of DG in 2030, slightly above 40%, with a moderately higher share in wind than solar power. DG by then has reached 53.93% of total generation capacities, the highest of all scenarios. GCA is characterised by a storyline pushing towards a low-carbon power system, subsidising all sorts of low-carbon technologies. The total IRES capacities of GCA amount to slightly less than for the DG scenario. Solar and wind power capacities within the GCA scenario are more balanced than within the DG scenario.
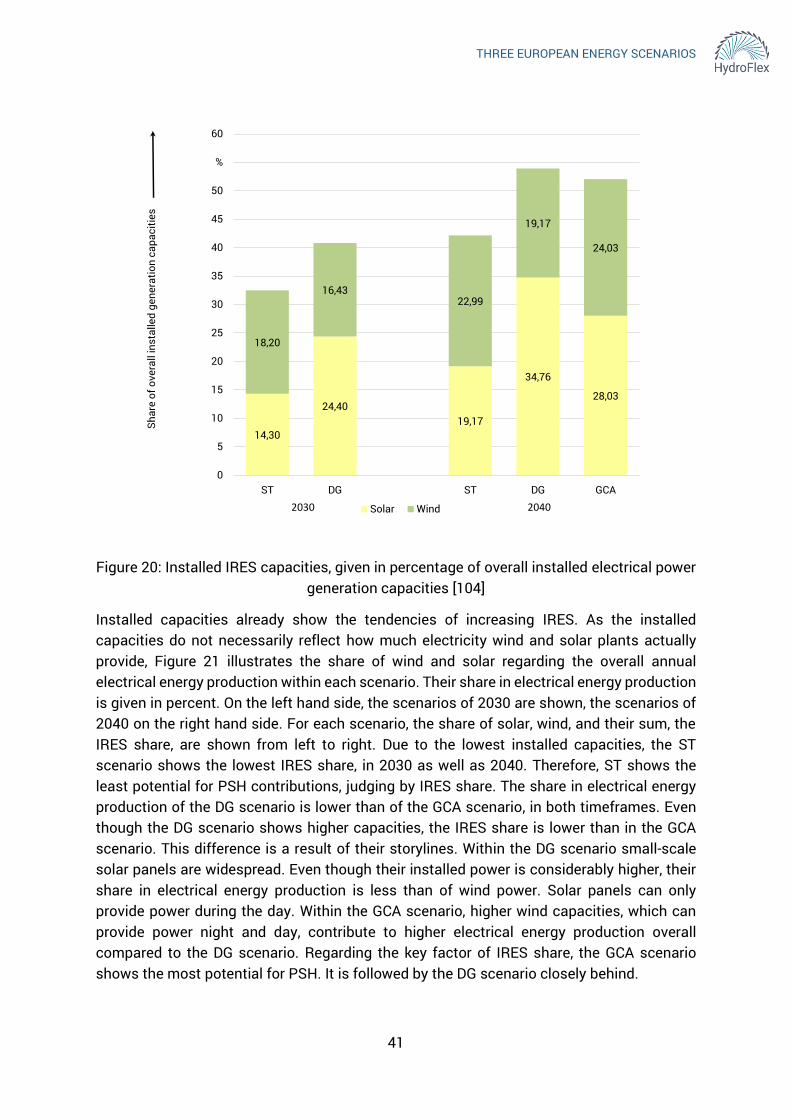
THREE EUROPEAN ENERGY SCENARIOS
41
Figure 20: Installed IRES capacities, given in percentage of overall installed electrical power generation capacities [104]
Installed capacities already show the tendencies of increasing IRES. As the installed capacities do not necessarily reflect how much electricity wind and solar plants actually provide, Figure 21 illustrates the share of wind and solar regarding the overall annual electrical energy production within each scenario. Their share in electrical energy production is given in percent. On the left hand side, the scenarios of 2030 are shown, the scenarios of 2040 on the right hand side. For each scenario, the share of solar, wind, and their sum, the IRES share, are shown from left to right. Due to the lowest installed capacities, the ST scenario shows the lowest IRES share, in 2030 as well as 2040. Therefore, ST shows the least potential for PSH contributions, judging by IRES share. The share in electrical energy production of the DG scenario is lower than of the GCA scenario, in both timeframes. Even though the DG scenario shows higher capacities, the IRES share is lower than in the GCA scenario. This difference is a result of their storylines. Within the DG scenario small-scale solar panels are widespread. Even though their installed power is considerably higher, their share in electrical energy production is less than of wind power. Solar panels can only provide power during the day. Within the GCA scenario, higher wind capacities, which can provide power night and day, contribute to higher electrical energy production overall compared to the DG scenario. Regarding the key factor of IRES share, the GCA scenario shows the most potential for PSH. It is followed by the DG scenario closely behind.
14,30
24,4019,17
34,76
28,03
18,20
16,4322,99
19,17
24,03
0
5
10
15
20
25
30
35
40
45
50
%
60
ST DG Dummy ST DG GCA
Shar
e of
ove
rall
inst
alle
d ge
nera
tion
capa
citie
s
Solar Wind2030 2040
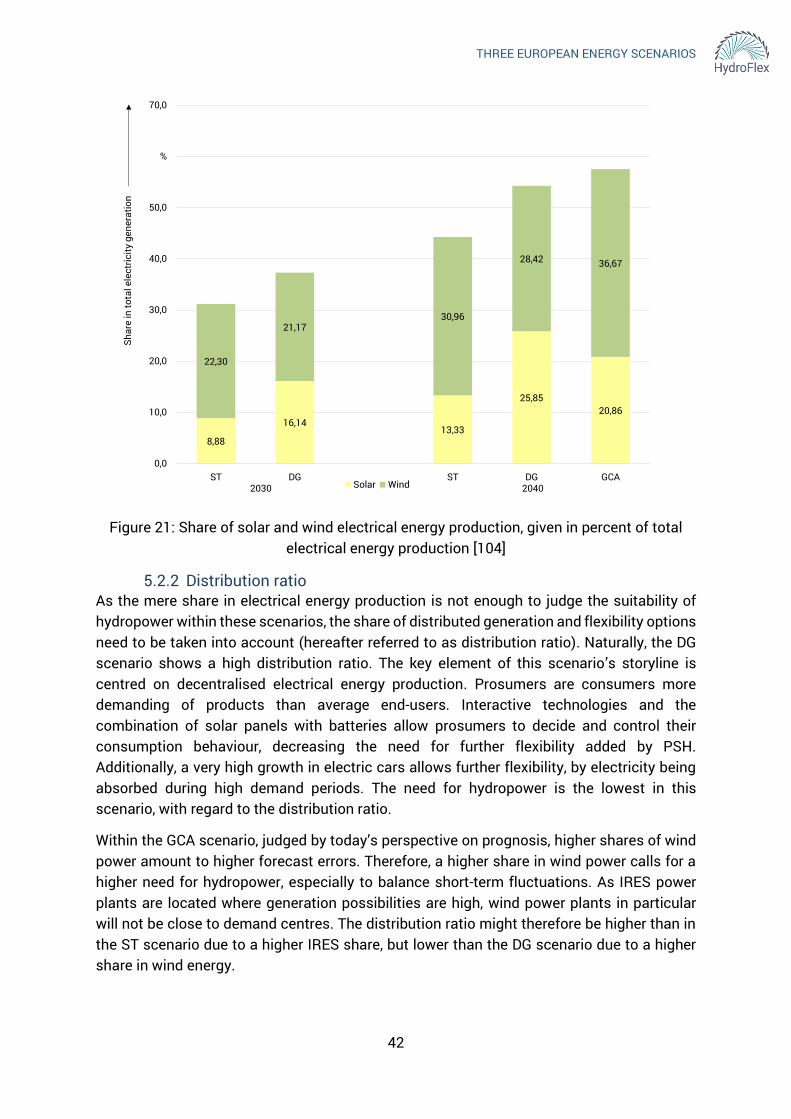
THREE EUROPEAN ENERGY SCENARIOS
42
Figure 21: Share of solar and wind electrical energy production, given in percent of total electrical energy production [104]
5.2.2 Distribution ratio As the mere share in electrical energy production is not enough to judge the suitability of hydropower within these scenarios, the share of distributed generation and flexibility options need to be taken into account (hereafter referred to as distribution ratio). Naturally, the DG scenario shows a high distribution ratio. The key element of this scenario’s storyline is centred on decentralised electrical energy production. Prosumers are consumers more demanding of products than average end-users. Interactive technologies and the combination of solar panels with batteries allow prosumers to decide and control their consumption behaviour, decreasing the need for further flexibility added by PSH. Additionally, a very high growth in electric cars allows further flexibility, by electricity being absorbed during high demand periods. The need for hydropower is the lowest in this scenario, with regard to the distribution ratio.
Within the GCA scenario, judged by today’s perspective on prognosis, higher shares of wind power amount to higher forecast errors. Therefore, a higher share in wind power calls for a higher need for hydropower, especially to balance short-term fluctuations. As IRES power plants are located where generation possibilities are high, wind power plants in particular will not be close to demand centres. The distribution ratio might therefore be higher than in the ST scenario due to a higher IRES share, but lower than the DG scenario due to a higher share in wind energy.
8,88
16,1413,33
25,8520,86
22,30
21,1730,96
28,42 36,67
0,0
10,0
20,0
30,0
40,0
50,0
%
70,0
ST DG ST DG GCA
Shar
e in
tota
l ele
ctric
ity g
ener
atio
n
Solar Wind2030 2040

THREE EUROPEAN ENERGY SCENARIOS
43
Within the ST scenario, due to conservative developments, power systems are still more centralised. As the IRES share is the lowest in this scenario, the distribution ratio is also the lowest. Therefore, ST shows high potential of PSH contributions.
5.2.3 Base load power plants With rising IRES shares, the traditional terms of base, medium, and peak load are losing clarity and residual load is gaining importance. As distinctions between these terms are fading, only base and peak load are distinguished in the following. Additionally, ENTSO-E does not specify which technologies are used to cover which kind of load. Adequate assumptions are made based on the traditional use of power plants. Possible competitors for hydropower within this key factor are therefore nuclear, hard coal, lignite, and gas. These technologies are the most used within all scenarios. Gas power plants, though possible as base load power plants, are categorised as peak load power plants due to their significantly higher operational costs in regard to nuclear and coal power plants in all scenarios and their high level of flexibility in comparison. Oil amounts to less than 0.01% to electrical energy production within all scenarios and is therefore not examined further. The same applies to biofuels and other non-intermittent RES.
To illustrate the power plant compilation within the ST scenario, Figure 22 shows the installed capacities by fuel type in overall electricity generation. The number of coal-fired power plants slowly decreases due to emission regulations and low gas prices. With 51 GW by 2040, their importance has significantly faded, especially compared to their role today. It is reasonable to say that coal power plants cover some amount of base load, but are likely to be abolished over time along this storyline. As nuclear power plants are seen as climate-friendly and stay low-cost, they still amount to 89 GW in 2030 and 79 GW in 2040 of this scenario. As no information is given on their technical specifications, but they generally endure long operating lives, it is assumed that they are equal to or only slightly improved compared to today’s standards. Therefore, they are highly likely used as main base load power plants. The installed capacities of hydropower amount almost equal in both years of the ST scenario. It is assumed that run-of-river hydropower is used to cover base load. Whether PSH or storage hydropower cover base load, cannot be distinguished. As reliable sources of power are covering base load needs, PSH has many competitors in this field of operation. These possible competitors can also contribute Frequency Containment Reserves. With many competitors in the field of base load power plants, the opportunities of PSH to provide Frequency Containment Reserves are also limited.
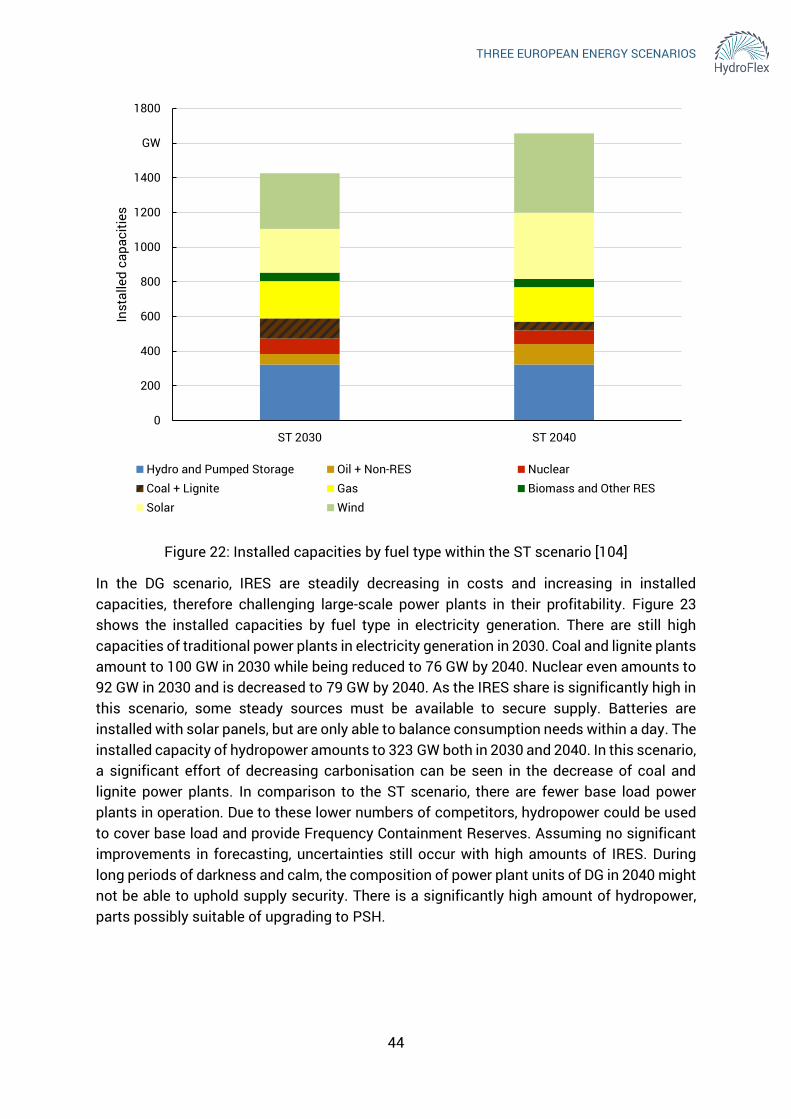
THREE EUROPEAN ENERGY SCENARIOS
44
Figure 22: Installed capacities by fuel type within the ST scenario [104]
In the DG scenario, IRES are steadily decreasing in costs and increasing in installed capacities, therefore challenging large-scale power plants in their profitability. Figure 23 shows the installed capacities by fuel type in electricity generation. There are still high capacities of traditional power plants in electricity generation in 2030. Coal and lignite plants amount to 100 GW in 2030 while being reduced to 76 GW by 2040. Nuclear even amounts to 92 GW in 2030 and is decreased to 79 GW by 2040. As the IRES share is significantly high in this scenario, some steady sources must be available to secure supply. Batteries are installed with solar panels, but are only able to balance consumption needs within a day. The installed capacity of hydropower amounts to 323 GW both in 2030 and 2040. In this scenario, a significant effort of decreasing carbonisation can be seen in the decrease of coal and lignite power plants. In comparison to the ST scenario, there are fewer base load power plants in operation. Due to these lower numbers of competitors, hydropower could be used to cover base load and provide Frequency Containment Reserves. Assuming no significant improvements in forecasting, uncertainties still occur with high amounts of IRES. During long periods of darkness and calm, the composition of power plant units of DG in 2040 might not be able to uphold supply security. There is a significantly high amount of hydropower, parts possibly suitable of upgrading to PSH.
0
200
400
600
800
1000
1200
1400
GW
1800
ST 2030 ST 2040
Inst
alle
d ca
paci
ties
Hydro and Pumped Storage Oil + Non-RES NuclearCoal + Lignite Gas Biomass and Other RESSolar Wind

THREE EUROPEAN ENERGY SCENARIOS
45
Figure 23: Installed capacities by fuel type within the DG scenario [104]
Figure 24 shows the compilation of electricity generation within the GCA scenario. In this ambitious scenario, coal and lignite power plants are reduced to 34 GW in 2040. This is significantly lower than the amount of the ST scenario in 2030. This development might be the effect of high decarbonisation ambitions as well as CO2 pricing. The nuclear energy sector is not affected by CO2 pricing and amounts to 95 GW. The amount of hydropower is significantly higher in this scenario, possibly to substitute for coal and lignite. Therefore, it might be assumed that hydropower plants are used frequently as base load power plants. A higher installed capacity of PSH, in comparison to the other scenarios, might be the result of the considerably high IRES share, especially of wind power. Assuming that no significant improvements have been made in forecasting, short-time fluctuations might be cushioned by PSH in this scenario.
0
500
1000
1500
GW
2500
DG 2030 DG 2040
Inst
alle
d ca
paci
ties
Hydro and Pumped Storage Oil + Non-RES NuclearCoal + Lignite Gas Biomass and Other RESSolar Wind

THREE EUROPEAN ENERGY SCENARIOS
46
Figure 24: Installed capacities by fuel type in the GCA scenario [104]
In conclusion, competition is mostly derived from nuclear power plants within the field of base load power plants. These are still limited in their flexibility. By 2040, coal and lignite are reduced in every scenario, in some more than in others. Possibilities for PSH as base load power plants can be seen especially within the GCA scenario and to some extent within the DG scenario. The least possibilities are seen in the ST scenario. To achieve more possible provisions by hydropower, the amount of PSH can be increased. Figure 25 shows the percentage share of different types of hydropower plants within the different scenarios. In every scenario the amount of hydro-turbine capacity is considerably higher than of other hydropower. Upgrading some of these to PSH plants might gain additional flexibility.
0
500
1000
1500
GW
2500
ST 2030 GCA 2040
Inst
alle
d ca
paci
ties
Hydro and Pumped Storage Oil + Non-RES NuclearCoal + Lignite Gas Biomass and Other RESSolar Wind
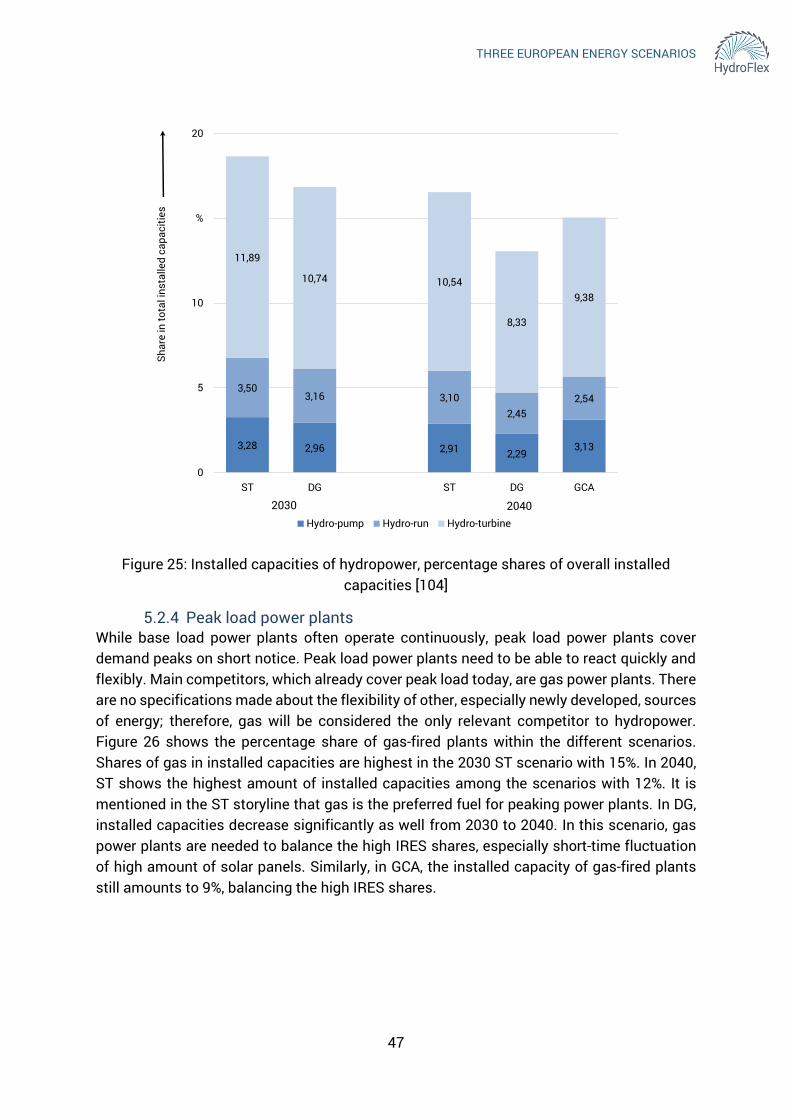
THREE EUROPEAN ENERGY SCENARIOS
47
Figure 25: Installed capacities of hydropower, percentage shares of overall installed capacities [104]
5.2.4 Peak load power plants While base load power plants often operate continuously, peak load power plants cover demand peaks on short notice. Peak load power plants need to be able to react quickly and flexibly. Main competitors, which already cover peak load today, are gas power plants. There are no specifications made about the flexibility of other, especially newly developed, sources of energy; therefore, gas will be considered the only relevant competitor to hydropower. Figure 26 shows the percentage share of gas-fired plants within the different scenarios. Shares of gas in installed capacities are highest in the 2030 ST scenario with 15%. In 2040, ST shows the highest amount of installed capacities among the scenarios with 12%. It is mentioned in the ST storyline that gas is the preferred fuel for peaking power plants. In DG, installed capacities decrease significantly as well from 2030 to 2040. In this scenario, gas power plants are needed to balance the high IRES shares, especially short-time fluctuation of high amount of solar panels. Similarly, in GCA, the installed capacity of gas-fired plants still amounts to 9%, balancing the high IRES shares.
3,28 2,96 2,91 2,293,13
3,503,16 3,10
2,452,54
11,89
10,74 10,54
8,33
9,38
0
5
10
%
20
ST DG Dummy ST DG GCA
Shar
e in
tota
l ins
talle
d ca
paci
ties
Hydro-pump Hydro-run Hydro-turbine
2030 2040

THREE EUROPEAN ENERGY SCENARIOS
48
Figure 26: Installed capacities of gas-fired plants, percentage shares of overall installed capacities [104]
As no other relevant competition is in the market, chances for PSH are high, especially in 2040 GCA for balancing short-term fluctuations of wind power, and in 2040 DG for covering periods of darkness disrupting solar electrical power generation during peak demand periods. Within the ST scenario, PSH finds its strongest competitor in gas power plants and the least chances in comparison to the other scenarios.
5.2.5 Proportion of hydropower plants to other flexibility options There are not many details given on other flexibility options. Power-to-gas is mentioned to be a commercially viable option in the DG and GCA scenarios, for the production of gas, but of no significance in the ST scenario. There is no information given how much gas is turned back into electricity after storage. Power-to-gas seems to mostly absorb electricity and cover gas demand. Within the 2030 timeframe, power-to-gas only covers 0.1% of gas demand in the DG scenario. By 2040, power-to-gas covers 1.1% in the DG and 2.5% of gas demand in the GCA scenario. It is not specified whether additional gas is stored or transported over large distances.
Storage options have grown slowly in the ST scenario, moderately in the GCA scenario, and very high in the DG scenario. There is no distinction made between types of storage. As the key element of the DG scenario is containing solar panels in combination with batteries, this might be the key driver of storage amounts. This combination also provides very high levels of demand flexibility in the DG scenario. Demand flexibility is more important as well in the GCA scenario, but is not significantly relevant in the ST scenario.
Therefore, the key factor concerning the proportion of hydropower to other flexibility options cannot be calculated accurately, but will amount to higher levels within scenarios of fewer competitors. It is therefore assumed that the factor is high in the ST scenario, therefore
0
2
4
6
8
10
12
%
16
ST 2030 DG 2030 ST 2040 GCA 2040 DG 2040
Shar
e of
inst
alle
d ca
paci
tes

THREE EUROPEAN ENERGY SCENARIOS
49
offering good chances for hydropower. The factor will be lower in the DG and GCA scenarios, therefore offering fewer chances for hydropower.
5.2.6 Grid expansion Chances for hydropower to provide flexibility increase with the size of the area interconnected. More connections between countries include a higher number of flexibility options. This also means a higher number of competitors is able to provide flexibility. The expansion of grids depends on the storylines of the scenarios. Slow developments and the lowest number of IRES power plants characterise the ST scenario. Grid expansion will be least developed in this scenario, simply out of less necessity. The chances for hydropower to be provided long-distance are therefore the lowest within the ST scenario. High number of decentralised small-scale solar panels characterise the DG scenario, which is therefore not in great need for a wide-cast net to transfer power. Hydropower might have low chances in this scenario as well. Within the GCA scenario global interaction is of high importance and will show the highest grid expansion. To include hydropower within a pan-European power system, the more interconnection, the better. Therefore, the GCA scenario shows most potential to benefit from Nordic hydropower.
5.2.7 Net Transfer Capacities The NTCs between Nordic countries and Continental Europe are relevant to include hydropower as a flexibility option. To compare possibilities for hydropower, the extent of NTC from the Nordic countries to Continental Europe is regarded and includes connections from the Nordic countries of Norway, Finland, and Sweden to Continental Europe. Connections from these countries to the Netherlands, Germany, Denmark, Poland, Lithuania, Latvia, and Estonia are taken into account. The sum of NTC capacities along these connections is shown in Table 2, for each scenario in 2040. In harmony with their storylines, the ST scenario shows the lowest and the GCA scenario the highest NTC, while the DG scenario is in between. Slow developments characterise the ST scenario. It is reasonable that the expansion of NTC is also progressing more conservatively. As the GCA scenario’s storyline is one of global interaction and decarbonisation efforts, higher NTC and higher interconnection levels are within reason. Regarding this key factor, GCA show most possibilities for hydropower. The more power can be transmitted safely from the Nordic countries to Continental Europe, the more flexibility by hydropower can be offered. Therefore, within the ST scenario, PSH can offer the least flexibility.
ST 2040 DG 2040 GCA 2040
NTCs [GW] 11,335 12,335 14,335
Table 2: Net Transfer Capacities from the Nordic countries Sweden, Norway and Finland to Continental Europe within each scenario [104]
In conclusion, regarding these key factors combined, all scenarios show some potential for hydropower. GCA shows the highest overall potential for hydropower. DG offers the highest RES share, but other factors show fewer opportunities. ST, including most large-scale power plants, offers the least chances for Nordic hydropower.

THREE EUROPEAN ENERGY SCENARIOS
50
6 Deriving scenarios of European power systems placing high demands on hydraulic power plants
An evaluation of the role of hydropower in evolving European power systems needs to foresee future developments, which are, to some extent, tough to estimate. The further into the future, the harder it becomes to foresee developments and to make valuable assumptions. Figure 27 illustrates this effect showing a scenario funnel.
Figure 27: Schematic illustration of a scenario funnel
Scenarios can depict these uncertainties. As uncertainties increase for simulation years further in the future and thus the scenario funnel opens, differences between possible scenarios should increase as well. The term scenario in the HydroFlex project refers to a path projecting the developments in the European power system over a future period in intervals, e.g. 5-year-intervals, as shown as the dashed line in Figure 27.
Chapter 5 has shown such exemplary outlines of future power systems. These are not drafted with a focus on the future role of hydropower within a pan-European power system. In order to further examine future possibilities of Nordic hydropower in particular, computational simulations of European power systems will depict the use of hydropower in the context of different trends. These simulations themselves will need suitable input to judge the profitability of including Nordic hydropower into European power systems.
The following chapter will describe three scenarios depicting different opportunities of hydropower to as flexibility option, which are designed for this purpose and the upcoming simulations in the HydroFlex project. Before explaining the cornerstones of the scenarios, general assumptions will be described.
Figure 28 illustrates the models of the European AC transmission grid used by the grid simulations for the scenario in 2020 and 2025. As described in chapter 3.2, these models provide the basis for the scenarios after 2025. This way, it is possible to add certain grid expansion projects exactly and integrate increased transfer capacities according to existing lines in order to ensure appropriate simulations.
Simulation year
B2
Scenarios

THREE EUROPEAN ENERGY SCENARIOS
51
Figure 28: European AC transmission grid models for 2020 (left) and 2025 (right)
Figure 29 shows the assumed fuel prices over all scenarios. The prices are calculated and interpolated on the basis of [70]. The assumed exchange rate between dollar and euros amounts to 1,19 $
€⁄ (average from January to October 2018).
Figure 29: Assumptions of fuel prices [70]
15° W 0° 15° E 30° E
30° N
45° N
60° N
15° W 0° 15° E 30° E
30° N
45° N
60° N
0
5
10
15
20
25
30
2020
2025
2030
2035
2040
Hard Coal
Oil
Natural Gas
Fuel
Pric
e €'2018GJ
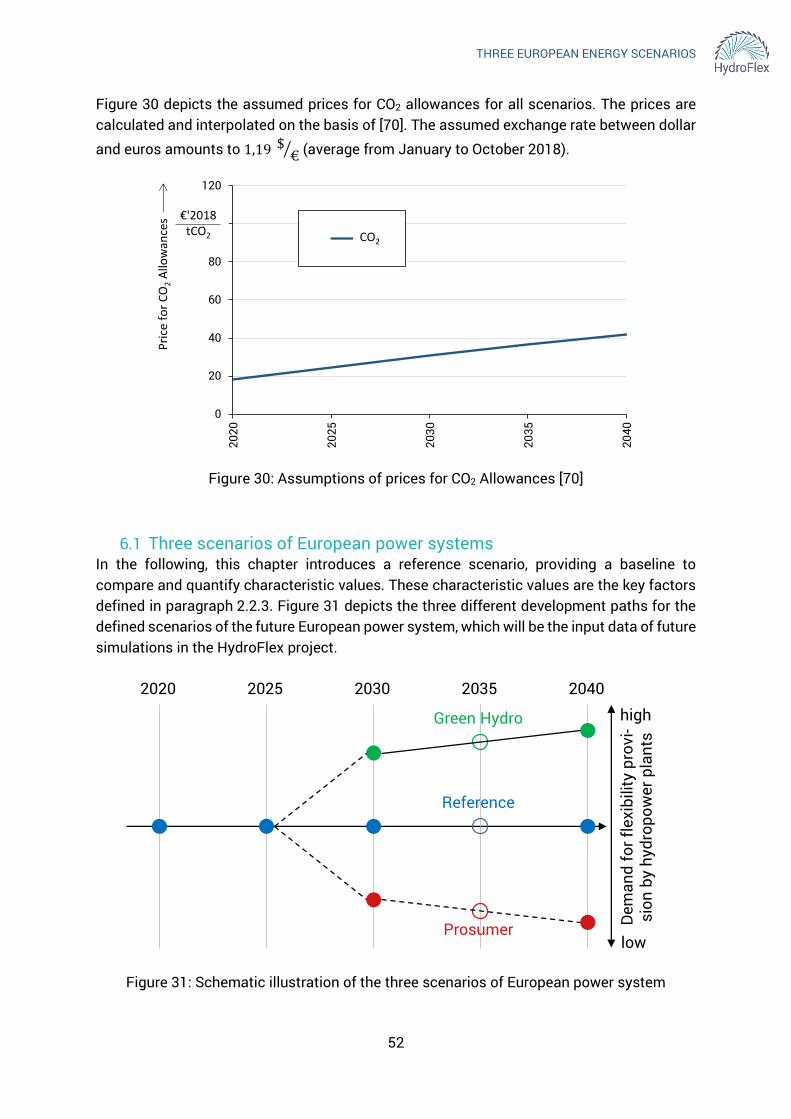
THREE EUROPEAN ENERGY SCENARIOS
52
Figure 30 depicts the assumed prices for CO2 allowances for all scenarios. The prices are calculated and interpolated on the basis of [70]. The assumed exchange rate between dollar
and euros amounts to 1,19 $€⁄ (average from January to October 2018).
Figure 30: Assumptions of prices for CO2 Allowances [70]
6.1 Three scenarios of European power systems In the following, this chapter introduces a reference scenario, providing a baseline to compare and quantify characteristic values. These characteristic values are the key factors defined in paragraph 2.2.3. Figure 31 depicts the three different development paths for the defined scenarios of the future European power system, which will be the input data of future simulations in the HydroFlex project.
Figure 31: Schematic illustration of the three scenarios of European power system
0
20
40
60
80
100
120
2020
2025
2030
2035
2040
CO2
Pri
ce f
or
CO
2A
llow
ance
s €'2018tCO2 CO2
2020 2025 2030 2035 2040
Green Hydro
Prosumer
Reference
Dem
and
for f
lexi
bilit
y pr
ovi-
sion
by h
ydro
pow
er p
lant
s
low
high
THREE EUROPEAN ENERGY SCENARIOS
53
The scenario framework of the HydroFlex project uses 5-year-intervals and thus, every fifth year will be simulated. The Reference scenario represents the best guess scenario and therefore the most probable developments of the European power system. As uncertainties in the near future are not significantly high, the Reference scenario is the only one in 2020 and 2025. Then, the Green Hydro and the Prosumer scenario start to differ from the Reference scenario. The Green Hydro scenario contains assumptions favourable to the demand for flexibility provision by hydropower plants. On the other hand, the Prosumer scenario represents less favourable conditions for this demand and hence for hydropower as flexibility provider. Both scenarios are designed explicitly for 2030 and 2040 regarding to the TYNDP scenarios described in chapter 5. The input data building the scenarios for 2035 is the result of the interpolation of the corresponding data of 2030 and 2040. The following describes the three scenarios in detail.
6.1.1 Reference Scenario As computational simulations need a point of reference in order to compare results, the Reference Scenario will serve as a starting point. This scenario is designed as best guess scenario, judged from today’s perspective. As for the near future, i.e. 2020 and 2025, most of the developments can be foreseen with less uncertainty, the Reference scenario is the only scenario simulated for those years. From 2025 on, it represents the most likely outcome if current developments within European power systems continue.
A balance of the essential factors characterises this scenario. All factors are equally developed, none is dominating. In comparison to today, IRES shares in power systems are increased. However, as the installation of IRES is not subsidised to noteworthy extents in
this scenario, the increase of IRES shares is consummated rather gradually. The change of the European composition of power plant units is proceeding in a similar manner as the
amount of coal and lignite power plants decreases slowly. Using a comparable approach to the ST Scenario analysed in chapter 5, this Reference Scenario contains a time of
transition. Technologies designed to balance fluctuating electrical power generation are developed and integrated into the power systems when financially reasonable. That means
if not profitable, other options are developed first before fossil-fuelled power plants are abolished from operation. As a result, other flexibility options and power plants are
available in reasonable numbers.
Figure 32 shows the characteristics of this scenario, classified by their extent in the essential factors in a radar chart. As can be seen, all factors are in balance. Neither kind of power plant technology dominates the composition of power plant units but contains base load and peak load power plants in equal proportion. IRES are integrated into power systems to an extent which is manageable by base and peak load power plants. Putting this categorisation into perspective, gas is gradually replacing coal and lignite in electrical energy production. The reduction of greenhouse gas emissions is an important goal of European countries, but is pursued sustainably.

THREE EUROPEAN ENERGY SCENARIOS
54
Figure 32: Essential factors of the Reference Scenario
Grids are expanded when reasonable and needed based on economic advantages. As large-scale power plants are only gradually being replaced by IRES, the need for further interconnections of power systems is only moderately evolving. Without high levels of interconnection within Europe, flexibility provisions from the Nordic countries can be distributed across Continental Europe to a moderate extent. Consequently, the rise of NTCs is not an urgent matter and not developed to a significant degree, but still offers some possibilities for the provision of flexibility by Nordic hydropower.
Figure 33 illustrates the sum of net generation capacities of thermal power plants in Europe assumed in the Reference Scenario. The values largely correspond to the TYNDP ST scenario, in order to represent the best guess scenario. The values in 2035 are interpolated between 2030 and 2040. The capacities of 2020 and 2025 are based on today’s European electrical power generation adjusted by planned and certain developments. The net generation capacities of nuclear power plants will decrease slightly until 2040, while the reduction of power plants fuelled by hard coal and lignite will be significant. A decrease from 2020 to 2030 and an increase from then on characterise the development of oil-fired power plants. At this point on, the installed capacities of gas-fired power plants will decrease slightly.
NTCContinental Europe -
Nordic
Gridexpansion
within Europe
Proportion of hydropowerto other flexibility options
IRES shares
Distribution ratio
Peak loadpower plants
Base loadpower plants

THREE EUROPEAN ENERGY SCENARIOS
55
Figure 33: Net generation capacities of thermal power plants in Europe of the Reference Scenario
Figure 34 shows the assumed RES share of final electricity consumption of the Reference scenario. The RES share increases from mostly 40% in 2020 to over 50% in 2040. The values in 2020 and 2025 are derived on todays installed capacities adjusted by planned and other expected developments, 2030 and 2040 correspond to the ST scenario and 2035 is interpolated between 2030 and 2040.
Figure 34: RES share of final electricity consumption of the Reference scenario
0
100
200
300
GW
500
2020 2025 2030 2035 2040
Net
gen
erat
ion
capa
citie
sNuclear Hard Coal + Lignite Gas Oil
30
35
40
45
50
55
60
65
70
%
80
2020 2025 2030 2035 2040
RES
sha
re

THREE EUROPEAN ENERGY SCENARIOS
56
Figure 35 shows the assumed annual European electricity demand in the Reference scenario. The demand increases from 2020 to 2025 by approx. 100 TWh due to additional consumers, e.g. electric vehicles and heat pumps. Afterwards, the annual demands do not differ significantly until 2040 because efficiency measures and additional consumers compensate.
Figure 35: Annual European electricity demand in the Reference scenario
In conclusion, the profitability of Nordic hydropower in this Reference Scenario seems to be neither particularly high nor particularly low. A well-balanced composition of power plant units in combination with moderate grid and NTC expansion might leave Nordic hydropower as one option among many. This environment is thus a suitable neutral context to compare the profitability of Nordic hydropower within the other scenarios in computational simulations. The future simulation will provide the results to evaluate the flexibility provision by Nordic hydropower in this scenario.
6.1.2 Green Hydro Scenario The Green Hydro Scenario shows similarities with the GCA scenario, but offers more possibilities of relevance for Nordic hydropower. While efforts to limit global warming in the GCA scenario have only started in global cooperation after 2030, rapid global collaboration at an earlier stage characterises the Green Hydro scenario. These efforts result in higher IRES shares already by the year 2030, in comparison to the GCA scenario. Consequently, the amount of coal and lignite power plants is reduced at a stage prior to the GCA scenario. Therefore, a need for flexibility options arises at an earlier point in time and to a higher extent.
Figure 36 shows the aspects of this Green Hydro Scenario, using the essential factors defined in section 2.2.3. The blue arrows mark significant deviations from the GCA scenario, in order to ensure optimal circumstances for flexibility provision by Nordic hydropower.
While IRES shares are high in this Green Hydro Scenario, peak load power plants are not numerous. Therefore, IRES shares exceed the assumptions of the GCA significantly. Inversely, the net generation capacities of peak load power plants fall below GCA scenario’s
0
500
1000
1500
2000
2500
3000
3500
TWh
4500
2020 2025 2030 2035 2040
Elec
tric
ity d
eman
d
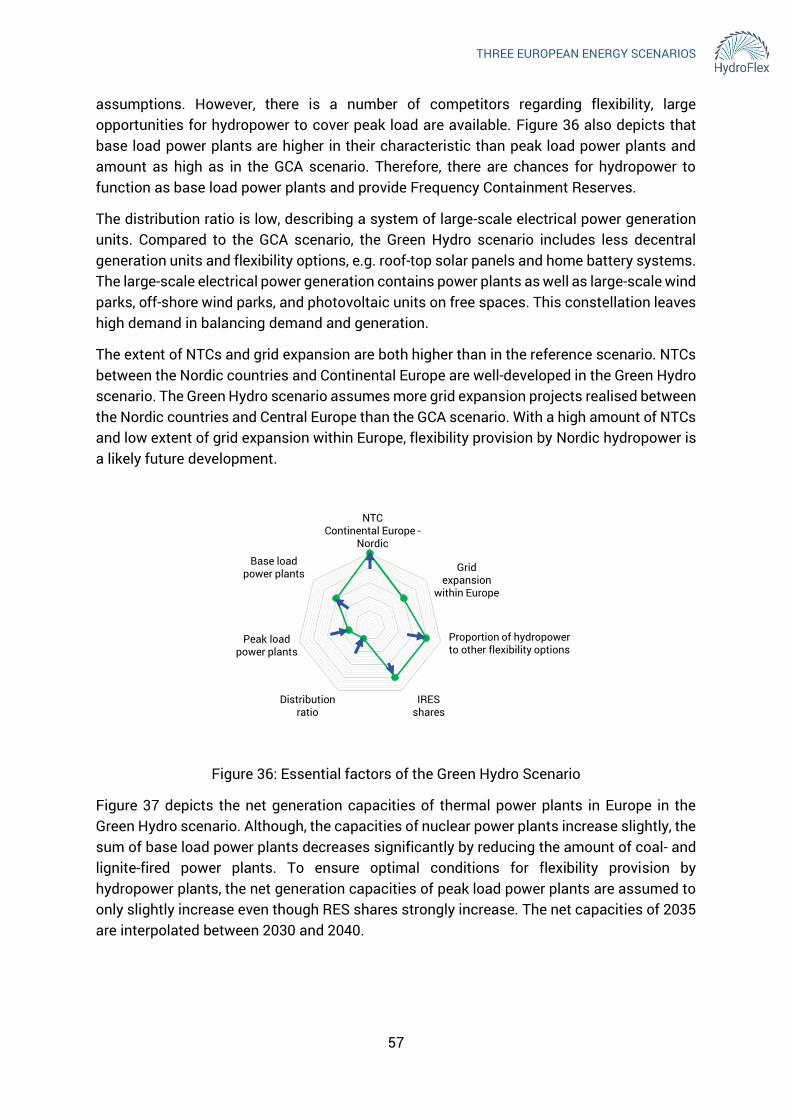
THREE EUROPEAN ENERGY SCENARIOS
57
assumptions. However, there is a number of competitors regarding flexibility, large opportunities for hydropower to cover peak load are available. Figure 36 also depicts that base load power plants are higher in their characteristic than peak load power plants and amount as high as in the GCA scenario. Therefore, there are chances for hydropower to function as base load power plants and provide Frequency Containment Reserves.
The distribution ratio is low, describing a system of large-scale electrical power generation units. Compared to the GCA scenario, the Green Hydro scenario includes less decentral generation units and flexibility options, e.g. roof-top solar panels and home battery systems. The large-scale electrical power generation contains power plants as well as large-scale wind parks, off-shore wind parks, and photovoltaic units on free spaces. This constellation leaves high demand in balancing demand and generation.
The extent of NTCs and grid expansion are both higher than in the reference scenario. NTCs between the Nordic countries and Continental Europe are well-developed in the Green Hydro scenario. The Green Hydro scenario assumes more grid expansion projects realised between the Nordic countries and Central Europe than the GCA scenario. With a high amount of NTCs and low extent of grid expansion within Europe, flexibility provision by Nordic hydropower is a likely future development.
Figure 36: Essential factors of the Green Hydro Scenario
Figure 37 depicts the net generation capacities of thermal power plants in Europe in the Green Hydro scenario. Although, the capacities of nuclear power plants increase slightly, the sum of base load power plants decreases significantly by reducing the amount of coal- and lignite-fired power plants. To ensure optimal conditions for flexibility provision by hydropower plants, the net generation capacities of peak load power plants are assumed to only slightly increase even though RES shares strongly increase. The net capacities of 2035 are interpolated between 2030 and 2040.
Gridexpansion
within Europe
Proportion of hydropowerto other flexibility options
IRES shares
Distribution ratio
Peak loadpower plants
Base loadpower plants
NTCContinental Europe -
Nordic
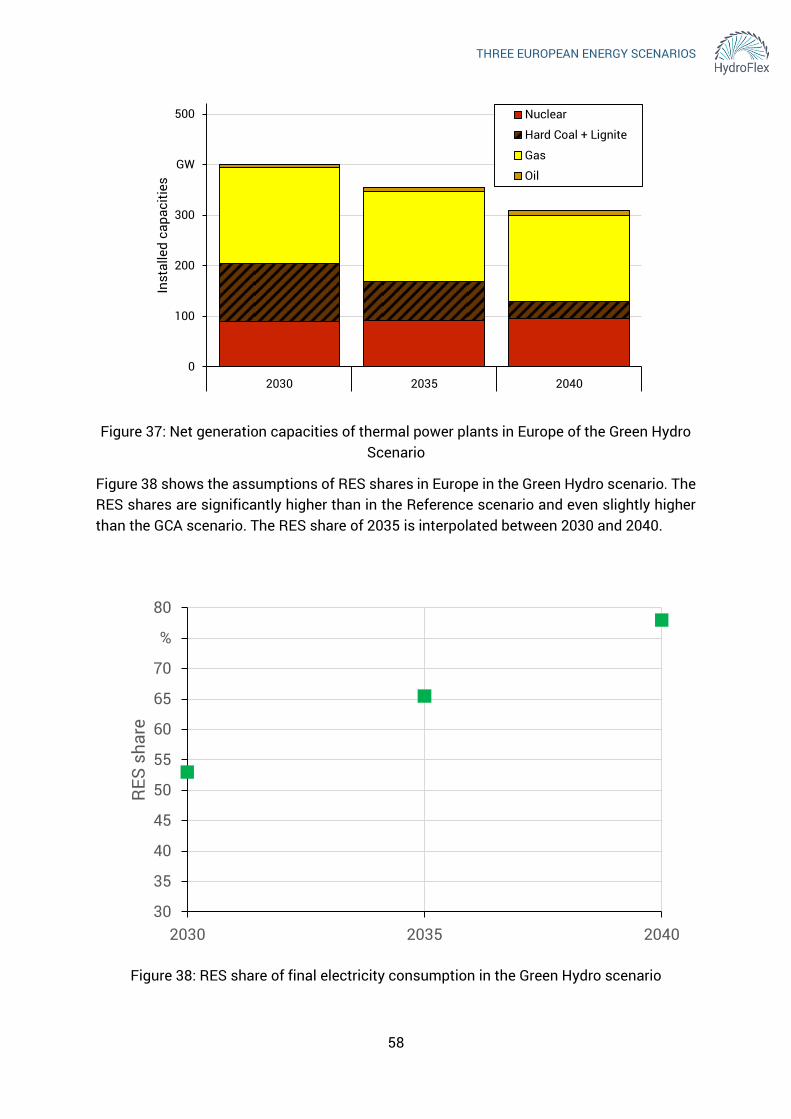
THREE EUROPEAN ENERGY SCENARIOS
58
Figure 37: Net generation capacities of thermal power plants in Europe of the Green Hydro Scenario
Figure 38 shows the assumptions of RES shares in Europe in the Green Hydro scenario. The RES shares are significantly higher than in the Reference scenario and even slightly higher than the GCA scenario. The RES share of 2035 is interpolated between 2030 and 2040.
Figure 38: RES share of final electricity consumption in the Green Hydro scenario
0
100
200
300
GW
500
2030 2035 2040
Inst
alle
d ca
paci
ties
Nuclear
Hard Coal + Lignite
Gas
Oil
30
35
40
45
50
55
60
65
70
%
80
2030 2035 2040
RES
sha
re

THREE EUROPEAN ENERGY SCENARIOS
59
Figure 39 shows the assumed annual European electricity demand in the Green Hydro scenario. The demand increases slightly from 2030 to 2040. Additional consumers, such as electric vehicles and heat pumps, and efficiency measures nearly compensate.
Figure 39: Annual European electricity demand in the Green Hydro scenario
Overall, the Green Hydro Scenario offers suitable circumstances in which Nordic hydropower could become an important provider of flexibility.
6.1.3 Prosumer Scenario The Prosumer scenario is designed in order to evaluate chances of hydropower in unfavourable circumstances. It captures developments with respect to hydropower not being the flexibility option and thus presents the pessimistic scenario in this report.
While sharing similarities with the DG scenario, the Prosumer scenario differs significantly, e.g. by more mature technologies aiding the integration of IRES into the power systems. A high amount of small-scale solar panels is combined with batteries as storage systems. These batteries are a more advanced technology than within the DG scenario, causing them to achieve high profitability and thus be widely used. At the centre of this scenario are prosumers, actively taking part in a decentralised electrical power generation system. These prosumers are owners of high amounts of solar panels acting as both consumers and producers of electricity. Prosumers are balancing their own electricity demand with small-scale solar panels and batteries and, thus, provide flexibility themselves. Due to the technological improvement of batteries in general, the electromobility sector has thrived and led to high numbers of electric vehicles as well. These technologies offer a high number of additional options to provide flexibility. This development decreases the need for Nordic hydropower.
As technological developments are assumed to have evolved rapidly in this scenario, digitalisation, intelligent networking of technologies and communication systems are common in households and industries. Smart home appliances are widely used and connected with power systems. These technologies can often regulate demand
0
500
1000
1500
2000
2500
3000
3500
TWh
4500
2030 2035 2040
Annu
al e
lect
ricity
dem
and

THREE EUROPEAN ENERGY SCENARIOS
60
automatically, offering numerous options of DSM. The high availability of these technologies causes more flexibility needs to be met on a local level. This high demand side flexibility hinders opportunities of hydropower. High numbers of peak load power plants cover flexibility needs not provided for by these technologies. This competition reduces the need for flexibility by Nordic hydropower further.
In this environment of high demand side flexibility and solar power storage by batteries, the overall need for additional flexibility provided for example by hydropower is rather low. High numbers of peak load power plants provide regulatory control, not covered by these options on the demand side. Figure 40 shows the extent of peak load power plants in relation to the other essential factors of this Prosumer Scenario. The blue arrows mark significant deviations from the DG scenario.
Numerous measures of DSM balance the fluctuating electricity generated by a high amount of IRES on a local level. The Prosumer scenario assumes even more decentral generation units and peak load power plants than the DG scenario. As a result, the proportion of hydropower to other flexibility options is low and thus opportunities are few. The involvement of high numbers of prosumers lessens the need for the provision of flexibility and thus the opportunities of hydropower plants. The NTCs between Continental Europe and the Nordic countries will not be significantly expanded in the Prosumer scenario and assumed less than in the DG scenario. This complicates the opportunities of Nordic hydropower plants. Due to the high amount of other flexibility options available in this scenario, opportunities for Nordic hydropower providing flexibility might be low.
Figure 40: Essential factors of the Prosumer Scenario
As electricity supply and demand are balanced locally to a great extent, grid expansion within Europe is not of high importance. There is no significant need to expand the power grids as electricity is primarily transferred on local levels. Following the same reasoning, NTC levels between the Nordic countries and Central Europe show similar characteristic value. However, the distribution grid will be well expanded due to the highly decentralised electrical power generation and flexibility. As European countries are able to balance their power systems using decentralised small-scale technologies, there might be low demand for
NTCContinental Europe -
Nordic
Gridexpansion
within Europe
Proportion of hydropowerto other flexibility options
IRES shares
Distribution ratio
Peak loadpower plants
Base loadpower plants

THREE EUROPEAN ENERGY SCENARIOS
61
exchanging electricity between the Nordic countries and Central Europe. Without suitable amounts of NTC between the Nordic and Central European countries, flexibility is not easily provided by Nordic hydropower. The lack of transfer capacities could cause hydropower to be difficult to be obtained.
Figure 41 depicts the net generation capacities of thermal power plants in Europe in the Prosumer scenario. While capacities of nuclear power plants and coal-fired power plants decrease significantly, the capacities of gas- and oil-fired power plants increase. The net generation capacities of 2035 are interpolated between 2030 and 2040.
Figure 41: Net generation capacities of thermal power plants in Europe of the Prosumer Scenario
Figure 42 shows the assumptions of RES shares in Europe in the Prosumer scenario. The RES shares are significantly higher than in the Reference scenario but a bit lower than in the Green Hydro Scenario. RES is to a large extend integrated as decentral units, e.g. roof-top solar panels, instead of large-scale units, such as onshore and offshore wind parks. The Prosumer scenario assumes IRES shares to increase further than the DG scenario. The RES share of 2035 is interpolated between 2030 and 2040.
0
100
200
300
GW
500
2030 2035 2040
Inst
alle
d ca
paci
ties
Nuclear Hard Coal + Lignite Gas Oil
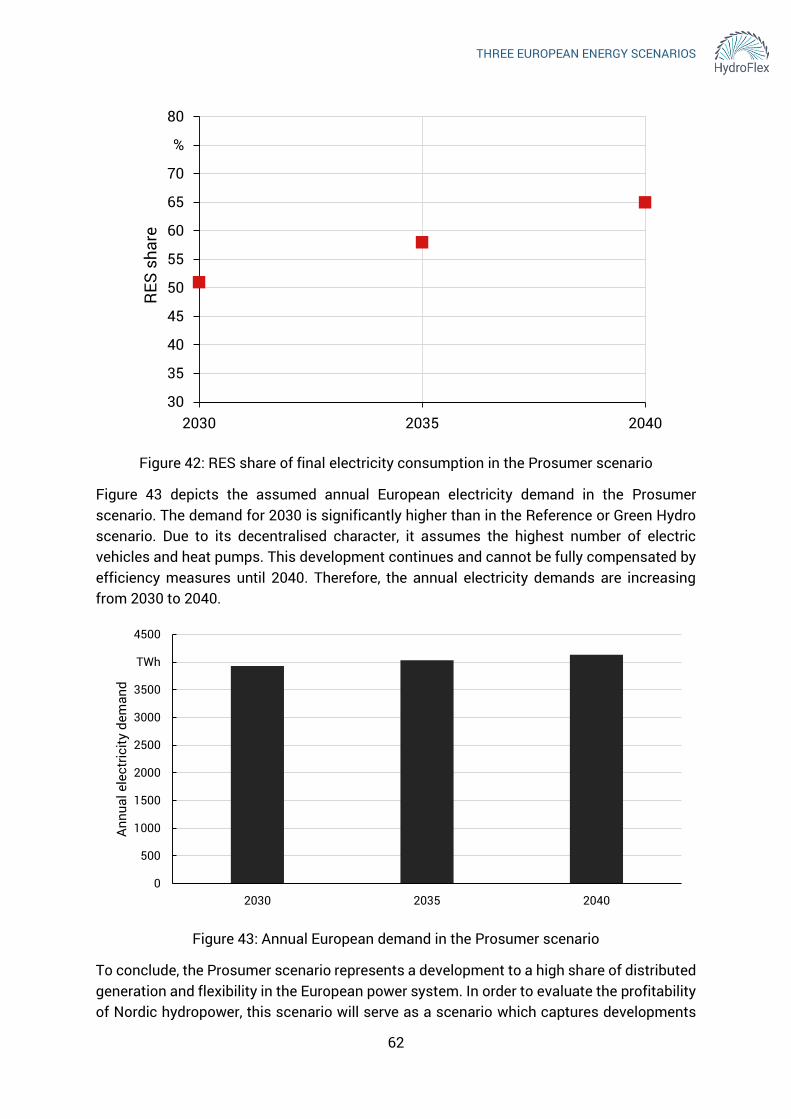
THREE EUROPEAN ENERGY SCENARIOS
62
Figure 42: RES share of final electricity consumption in the Prosumer scenario
Figure 43 depicts the assumed annual European electricity demand in the Prosumer scenario. The demand for 2030 is significantly higher than in the Reference or Green Hydro scenario. Due to its decentralised character, it assumes the highest number of electric vehicles and heat pumps. This development continues and cannot be fully compensated by efficiency measures until 2040. Therefore, the annual electricity demands are increasing from 2030 to 2040.
Figure 43: Annual European demand in the Prosumer scenario
To conclude, the Prosumer scenario represents a development to a high share of distributed generation and flexibility in the European power system. In order to evaluate the profitability of Nordic hydropower, this scenario will serve as a scenario which captures developments
30
35
40
45
50
55
60
65
70
%
80
2030 2035 2040
RES
sha
re
0
500
1000
1500
2000
2500
3000
3500
TWh
4500
2030 2035 2040
Annu
al e
lect
ricity
dem
and

THREE EUROPEAN ENERGY SCENARIOS
63
with respect to hydropower not being the flexibility option in the following computational simulations.
6.2 Scenarios on frequency stability As already noted in section 3.3, one input of the simulation tool for frequency stability analysis is the disturbance, which can be derived by market simulation and followed by a grid operation simulation and which impacts the network. In the following, different examples for possible disturbances as an input for stability analyses are shown.
One common fault is the tripping of one or more generators. Generator tripping describes an outage of one or more generators, which leads to the generator(s) being disconnected from the grid which in turn results in an imbalance of electrical generation and load. The missing generation leads to a descending frequency, which can be analysed. This kind of fault is to be investigated for fossil-fuelled power plants.
Also leading to a descending frequency because of missing generation are cloud-drifts and doldrums when it comes to power plants based on renewable energies like wind power plants and photovoltaic power plants. These weather effects can occur within a few seconds and can lead to a lack of generation. In contrast to cloud-drifts, wind fronts can lead to a quick rise of generation by wind power plants and therefore result in an ascending frequency. Hence very often, power plants based on renewable energies are connected to the grid by inverters. The defect of one or more inverters is another scenario because it will lead to an imbalance between generation and load as well.
To this point, all scenarios on frequency stability are addressing the fault of one or more generation units. Another kind of fault can occur in the network itself, e.g. by line tripping. Line tripping can lead to cascading faults in the network which can affect both generation and loads and therefore the frequency of the network in a high grade as well.
The last scenario to be investigated is the change of load. The load of a network is highly volatile but usually stays within certain borders. In some cases, it is possible that many loads are switched on or off at the same time which leads to a high rate of change of loads and results in an imbalance between load and generation. Eventually this results in a deviation from the nominal voltage in the grid. These scenarios should be investigated within this project to analyse the transient behaviour of water turbines depending on the fault applied to the network.


THREE EUROPEAN ENERGY SCENARIOS
65
7 Conclusion and future prospect The Paris Agreement of 2015 has united the world’s nations on the issue of climate policy. As fossil-fuelled power plants cause a high amount of greenhouse gas emissions, these nations are working on changing their power systems. Having committed to the climate goals of the Paris Agreement, European countries are collaborating on changing means and circumstances of electricity generation. Their goal is to incorporate high amounts of low-carbon and climate-friendly RES, especially IRES.
Changing power systems and including higher shares of IRES will increase imbalances and thus the need for flexibility. Imbalances have always occurred in power systems, resulting from various reasons, and power systems are able to react with flexibility. The term flexibility in a general sense refers to means able to balance electricity supply and demand. Considered options, categorised into four kinds of flexibility, all offer possibilities to balance the systems by different approaches. Although all providing individual advantages, hydropower, especially pumped storage hydropower, was identified in this report to be a very flexible, diverse option and a technology capable of meeting flexibility challenges set by the increase of IRES.
Hydropower is especially common in the Nordic countries. Assessments of future possibilities regarding this technology should therefore consider hydropower located in these countries. Flexibility might be transferred from the Nordic countries to Continental Europe. In order to judge profitability, factors were described essential to the future success of this possibility.
These factors were used to evaluate future possibilities of hydropower. As uncertainties characterise any assessment of the future, scenarios act as framework to evaluate these uncertain circumstances. Within this report, existing scenarios published by ENTSO-E were compared. These scenarios offer very different approaches to future designs of power systems. Among these three scenarios, this report identified the GCA scenario to offer the most possibilities for flexibility provision by Nordic hydropower.
Based on these findings this report derived three scenarios specifically designed to describe both favourable and less favourable conditions for the provision of flexibility by Nordic hydropower. These scenarios will be the basis of computational simulations, evaluating demands on and profitability of flexibility offered by hydropower of the Nordic countries to Continental Europe.


THREE EUROPEAN ENERGY SCENARIOS
67
Bibliography 1 UNITED NATIONS,
Paris Agreement, 2015.
2 BAUER, S., PEGELS, A., „Das Pariser Klimaabkommen und die globale Energiepolitik”, Aus Politik und Zeitgeschichte, vol.12-13 (66), pp.32–38, 2015.
3 BAUER, S., „Internationale Klimapolitik 2018: Von Paris über Bonn nach Katowice”, Aus Politik und Zeitgeschichte, vol.21-23 (68), pp.18–25, 2018.
4 BRIGGS, H., „What is in the Paris climate agreement?”, BBC News Online, available: https://www.bbc.com/news/science-environment-35073297, [accessed: 19.09.2018].
5 MACGUIRE, E., „Paris Agreement two years on: Who is taking the lead on climate change?”, CNN Online, available: https://edition.cnn.com/2017/12/12/world/climate-change-paris-agreement-two-years/index.html, [accessed: 20.09.2018].
6 EUROPEAN COMMISSION, EU Reference Scenario 2016: Energy, transport and GHG emissions Trends to 2050, Luxembourg, 2016.
7 SCHABER, K., Integration of Variable Renewable Energies in the European power system: a model-based analysis of transmission grid extensions and energy sector coupling, München, 2013.
8 INTERNATIONAL ENERGY AGENCY, The power of transformation: Wind, sun and the economics of flexible power systems, Paris, 2014.
9 INTERNATIONAL ENERGY AGENCY, Status of Power System Transformation 2018, Paris, 2018.
10 HYDROFLEX, Background: Flexible hydropower in energy systems of the future, 2018.
11 EUROPEAN COMMISSION, Launching the public consultation process on a new energy market design, Brussels, 2015.
12 SCHABER, K., ET AL., „Parametric study of variable renewable energy integration in Europe: Advantages and costs of transmission grid extensions”, Energy Policy (42), pp.498–508, 2012.

THREE EUROPEAN ENERGY SCENARIOS
68
13 G. VERBONG, E. VAN DER VLEUTEN, Long-term electricity supply systems dynamics; a historic analysis, 2002.
14 ENTSO-E, ENTSO-E: Electricity in Europe 2016, Brussels, 2017.
15 FRAUNHOFER-INSTITUT FÜR SYSTEM- UND INNOVATIONSFORSCHUNG, ECOFYS, Strommärkte im internationalen Vergleich, Berlin, Karlsruhe, 2015.
16 EUROSTAT, Breakdown of Electricity Production by source, available: http://ec.europa.eu/eurostat/statistics-explained/index.php?title=File:Breakdown_of_Electricity_Production_by_source,_2017_(in_%25)-F3.png, [accessed: 23.07.2018].
17 SORIN, F., „Weshalb Frankreich die Atomkraft liebt”, stern, available: https://www.stern.de/panorama/gesellschaft/energie-weshalb-frankreich-die-atomkraft-liebt-3850822.html, [accessed: 17.08.2018].
18 STEINLE, I., „Norwegen: Weg vom Öl, hin zur Wasserkraft”, Südwest Presse, available: https://www.swp.de/politik/inland/norwegen_-ein-land-unter-strom-23630533.html, [accessed: 20.08.2018].
19 CANZLER, W., ET AL., „Auf dem Weg zum (de-)zentralen Energiesystem? Ein interdisziplinärer Beitrag zu wesentlichen Debatten”, Vierteljahreshefte zur Wirtschaftsforschung, vol.4 (85), pp.127–159, 2016.
20 KEMFERT, C., „Globale Energiewende: „Made in Germany“?”, Aus Politik und Zeitgeschichte, vol.12-13 (66), pp.17–24, 2016.
21 HIRTH, L., ZIEGENHAGEN, I., „Balancing power and variable renewables: Three links”, Renewable and Sustainable Energy Reviews (50), pp.1035–1051, 2015.
22 UCTE, The 50 Year Success Story: Evolution of a European Interconnected Grid, Brussels, 2009.
23 NEIDHÖFER, G., „50-Hz Frequency”, IEEE Power and Energy Magazine, vol.4 (9), pp.66–81, 2011.
24 ZAHORANSKY, R., Energietechnik: Systeme zur Energieumwandlung. Kompaktwissen für Studium und Beruf, Wiesbaden, 2015.
25 CONSENTEC, Beschreibung von Regelleistungskonzepten und Regelleistungsmarkt: Studie im Auftrag der deutschen Übertragungsnetzbetreiber, Aachen, 2014.
THREE EUROPEAN ENERGY SCENARIOS
69
26 LAGENDIJK, V., Electrifying Europe: the power of Europe in the construction of electricity networks, Amsterdam, 2008.
27 ENTSO-E, ENTSO-E Member Companies, available: https://www.entsoe.eu/about/inside-entsoe/members/, [accessed: 29.08.2018].
28 ENTSO-E, Articles of association, Brussels, 2014.
29 SCHABER, K., STEINKE, F., HAMACHER, T., „Transmission grid extensions for the integration of variable renewable energies in Europe: Who benefits where?”, Energy Policy (43), pp.123–135, 2012.
30 DEUTSCHE ENERGIE-AGENTUR GMBH, Analyse der Notwendigkeit des Ausbaus von Pumpspeicherkraftwerken und anderen Stromspeichern zur Integration der erneuerbaren Energien, Berlin, 2010.
31 EUROPEAN COMMISSION, EU Reference Scenario 2016: Energy, transport and GHG emissions Trends to 2050, Luxembourg, 2016.
32 EUROPEAN COMMISSION, EU energy in figures: Statistical pocketbook 2017, Luxembourg, 2017.
33 KOCH, M., ET AL., „Modellgestützte Bewertung von Netzausbau im europäischen Netzverbund und Flexibilitätsoptionen im deutschen Stromsystem im Zeitraum 2020–2050”, Zeitschrift für Energiewirtschaft, vol.1 (39), pp.1–17, 2015.
34 BAUKNECHT, D., ET AL., Systematischer Vergleich von Flexibilitäts- und Speicheroptionen im deutschen Stromsystem zur Integration von erneuerbaren Energien und Analyse entsprechender Rahmenbedingungen, Freiburg, Darmstadt, 2016.
35 FUCHS, G., ET AL., Technology Overview on Electricity Storage: Overview on the potential and on the deployment perspectives of electricity storage technologies, 2012.
36 VRIES, L. de, VERZIJLBERGH, R., Organizing flexibility: how to adapt market design to the growing demand for flexibility, in: 2015 12th International Conference on the European Energy Market (EEM), Piscataway, NJ, 2015.
37 UCTE Handbook: Appendix 1 - Load-frequency control and performance, in: UCTE Operation Handbook, UCTE, Brussels, 2009.
38 ALBADI, M., EL-SAADANY, E., „Demand Response in Electricity Markets: An Overview”, 2007 IEEE Power Engineering Society General Meeting, 2007.

THREE EUROPEAN ENERGY SCENARIOS
70
39 BAUMANN, C., GROTE, F., MOSER, A., Entwicklung des Flexibilitätsbedarfs im europäischen Stromerzeugungssystem, in: 9. Internationale Energiewirtschaftstagung “Energiesysteme im Wandel: Evolution oder Revolution?”, Wien, 2015.
40 MARENBACH, R., NELLES, D., TUTTAS, C., Elektrische Energietechnik: Grundlagen, Energieversorgung, Antriebe und Leistungselektronik, Wiesbaden, 2013.
41 HEUCK, K., DETTMANN, K.-D., SCHULZ, D., Elektrische Energieversorgung: Erzeugung, Übertragung und Verteilung elektrischer Energie für Studium und Praxis, Wiesbaden, 2013.
42 INTERNATIONAL ENERGY AGENCY, Harnessing variable renewables: A guide to the balancing challenge, Paris, 2011.
43 CONSENTEC, Gutachten zur Höhe des Regelenergiebedarfs: Gutachten im Auftrag der Bundesnetzagentur für Elektrizität, Gas, Telekommunikation, Post und Eisenbahnen, 2008.
44 LANGE, B., ET AL., „Prognosen der zeitlich-räumlichen Variabilität von Erneuerbaren”, Transformationsforschung für ein nachhaltiges Energiesystem - Beiträge zur FVEE-Jahrestagung 2011, vol.1), pp.93–101, 2011.
45 MAGDOWSKI, A., KALTSCHMITT, M., „Prognose der Day-Ahead Wind- und Photovoltaikstromerzeugung – Einflussgrößen und Zuverlässigkeit”, Zeitschrift für Energiewirtschaft, vol.1 (41), pp.57–71, 2017.
46 FRAUNHOFER-INSTITUT FÜR SOLARE ENERGIESYSTEME, Energy Charts, available: https://www.energy-charts.de/power_de.htm, [accessed: 24.09.2018].
47 ENTSO-E, Supporting Document for the Network Code on Load-Frequency Control and Reserves, Brussels, 2013.
48 ENARGUS: ZENTRALES INFORMATIONSSYSTEM ENERGIEFORSCHUNGSFÖRDERUNG, Netzengpass, available: https://www.enargus.de/pub/bscw.cgi/d3455584-2/*/*/Netzengpass.html?op=Wiki.getwiki&scope=all, [accessed: 23.08.2018].
49 ENARGUS: ZENTRALES INFORMATIONSSYSTEM ENERGIEFORSCHUNGSFÖRDERUNG, Netzengpassmanagement, available: https://www.enargus.de/pub/bscw.cgi/d3455592-2/*/*/Netzengpassmanagement.html?op=Wiki.getwiki&scope=all, [accessed: 23.08.2018].

THREE EUROPEAN ENERGY SCENARIOS
71
50 KAMGA, A., Regelzonenübergreifendes Netzengpassmanagement mit optimalen Topologiemaßnahmen, Wuppertal, 2009.
51 VERZIJLBERGH, R., ET AL., „Institutional challenges caused by the integration of renewable energy sources in the European electricity sector”, Renewable and Sustainable Energy Reviews (75), pp.660–667, 2017.
52 KRUGER, K., ET AL., „Forecasting for Pumped Storage in Germany”, Hydro Review Worldwide, vol.6 (24), pp.10–15, 2016.
53 AGORA ENERGIEWENDE, Flexibility in thermal power plants: With a focus on existing coal-fired power plants, Berlin, 2017.
54 SPEIGHT, J., Coal-Fired Power Generation Handbook, Hoboken, Salem, 2013.
55 KRZIKALLA, N., ACHNER, S., BRÜHL, S., Möglichkeiten zum Ausgleich fluktuierender Einspeisungen aus Erneuerbaren Energien: Studie im Auftrag des Bundesverbandes Erneuerbare Energie, Bochum, 2013.
56 GÖRNER, K., SAUER, D., Konventionelle Kraftwerke: Technologiesteckbrief zur Analyse „Flexibilitätskonzepte für die Stromversorgung 2050“, Essen, 2016.
57 BUTTLER, A., ET AL., Statusbericht Flexibilitätsbedarf im Stromsektor: Eine Analyse der aktuellen marktwirtschaftlichen und technischen Herausforderungen an Speicher und Kraftwerke im Zuge der Energiewende, München, 2015.
58 MARKEWITZ, P., ROBINIUS, M., Technologiebericht 2.1 Zentrale Großkraftwerke, in: Technologien für die Energiewende: Teilbericht 2 an das Bundesministerium für Wirtschaft und Energie (BMWi), Wuppertal Institut, ISI, IZES, Wuppertal, Karlsruhe, Saarbrücken, 2017.
59 SPLIETHOFF, H., WAUSCHKUHN, A., SCHUHBAUER, C., „Anforderungen an zukünftige Kraftwerke“, Chemie Ingenieur Technik, vol.11 (83), pp.1792–1804, 2011.
60 KONSTANTIN, P., Praxisbuch Energiewirtschaft: Energieumwandlung, -transport und -beschaffung, Übertragungsnetzausbau und Kernenergieausstieg, Berlin, 2017.
61 ENERGIE-FORSCHUNGSZENTRUM NIEDERSACHSEN, Eignung von Speichertechnologien zum Erhalt der Systemsicherheit, Goslar, 2013.

THREE EUROPEAN ENERGY SCENARIOS
72
62 SCHERER, M., Frequency Control in the European Power System Considering the Organisational Structure and Division of Responsibilities, Zürich, 2016.
63 E. HERING ET AL., Elektrotechnik und Elektronik für Maschinenbauer, Berlin, 2018.
64 SCHWAB, A., Elektroenergiesysteme: Erzeugung, Übertragung und Verteilung elektrischer Energie, Berlin, 2017.
65 FRAUNHOFER-INSTITUT FÜR WINDENERGIE UND ENERGIESYSTEMTECHNIK, Optimierung der Marktbedingungen für die Regelleistungserbringung durch Erneuerbare Energien, Kassel, 2014.
66 GIESECKE, J., HEIMERL, S., MOSONYI, E., Wasserkraftanlagen: Planung, Bau und Betrieb, Berlin, Heidelberg, 2014.
67 INTERNATIONAL ENERGY AGENCY, Technology roadmap: Hydropower, Paris, 2012.
68 WORLD ENERGY COUNCIL, World Energy Resources 2016, London, 2016.
69 INTERNATIONAL ENERGY AGENCY, Technology Roadmap: Delivering Sustainable Bioenergy, Paris, 2017.
70 INTERNATIONAL ENERGY AGENCY, World Energy Outlook 2016, Paris, 2016.
71 GELLINGS, C., SMITH, W., „Integrating demand-side management into utility planning”, Proceedings of the IEEE, vol.6 (77), pp.908–918, 1989.
72 CONNECT ENERGY ECONOMICS, Aktionsplan Lastmanagement: Endbericht einer Studie von Connect Energy Economics, 2015.
73 SINGH, S., CHANDRA, S., „Energy Efficiency and Demand Side Management”, International Advanced Research Journal in Science, Engineering and Technology, vol.1 (2), pp.413–417, 2015.
74 BERGAENTZLÉ, C., CLASTRES, C., KHALFALLAH, H., „Demand-side management and European environmental and energy goals: An optimal complementary approach”, Energy Policy (67), pp.858–869, 2014.
75 GELLINGS, C., SAMOTYJ, M., „Smart Grid as advanced technology enabler of demand response”, Energy Efficiency, vol.4 (6), pp.685–694, 2013.
76 OUART, S., Lastmanagement bei Haushaltskunden: Ausgestaltung eines Konzepts zur prämienbasierten Nachfragesteuerung, Chemnitz, 2017.
THREE EUROPEAN ENERGY SCENARIOS
73
77 PALENSKY, P., DIETRICH, D., „Demand Side Management: Demand Response, Intelligent Energy Systems, and Smart Loads”, IEEE Transactions on Industrial Informatics, vol.3 (7), pp.381–388, 2011.
78 ENTSO-E, Demand Side Response Policy Paper, Brussels, 2014.
79 EID, C., ET AL., Aggregation of Demand Side flexibility in a Smart Grid: A review for European Market Design, 2015.
80 EUROPEAN COMMISSION, Energy infrastructure: priorities for 2020 and beyond ─ a blueprint for an integrated european energy network, Luxembourg, 2011.
81 EUROPEAN COMMISSION, Progress towards completing the International Energy Market, Brussels, 2014.
82 CAPGEMINI, World Energy Markets Observatory, Paris, 2017.
83 SCHILL, W.-P., „Integration von Wind- und Solarenergie: Flexibles Stromsystem verringert Überschüsse“, DIW Wochenbericht, vol.34 (80), pp.3–14, 2013.
84 SEITZ, A., ZUNFT, S., HOYER-KLICK, C., Technologiebericht: 3.3b Energiespeicher (thermisch,thermo-chemisch und mechanisch) innerhalb des Forschungsprojekts TF_Energiewende, Wuppertal, Karlsruhe, Saarbrücken, 2018.
85 LÄUBLI, M., „Druckluftbatterie in den Alpen“, Tages-Anzeiger, available: https://www.tagesanzeiger.ch/wissen/technik/Druckluftbatterie-in-den-Alpen/story/15469479, [accessed: 03.09.2018].
86 KURZWEIL, P., DIETLMEIER, O., Elektrochemische Speicher: Superkondensatoren, Batterien, Elektrolyse-Wasserstoff, Rechtliche Grundlagen, Wiesbaden, 2015.
87 STERNER, M., STADLER, I., Energiespeicher: Bedarf, Technologien, Integration, Berlin, 2017.
88 PREIß, S., 48-MW-Batteriespeicher geht in Jardelund in Betrieb, available: https://www.euwid-energie.de/48-mw-batteriespeicher-geht-in-jardelund-in-betrieb/, [accessed: 03.09.2018].
89 ABE INFRASTRUKTUR GMBH, Europas größter Batteriespeicher läuft: Die ABE Gruppe stellt den Betrieb von Jardelund sicher, press release, Süderlügum, 05.06.2018.

THREE EUROPEAN ENERGY SCENARIOS
74
90 ELSNER, P., SAUER, D., Energiespeicher: Technologiesteckbrief zur Analyse „Flexibilitätskonzepte für die Stromversorgung 2050“, Aachen, Pfinztal, 2015.
91 ZAPF, M., Stromspeicher und Power-to-Gas im deutschen Energiesystem: Rahmenbedingungen, Bedarf und Einsatzmöglichkeiten, Wiesbaden, 2017.
92 WESSELAK, V., ET AL., Handbuch Regenerative Energietechnik, Berlin, 2017.
93 WORLD ENERGY COUNCIL, World Energy Resources: Hydropower 2016, London, 2016.
94 EURELECTRIC, Hydropower: Fact sheets, Brussels, 2018.
95 BUSS, K., WROBEL, P., DOETSCH, C., „Global distribution of grid connected electrical energy storage systems”, International Journal of Sustainable Energy Planning and Management (9), pp.31–56, 2016.
96 ETSO, Net Transfer Capacities (NTC) and Available Transfer Capacities (ATC) in the Internal Market of Electricity in Europe (IEM): Information for User, 2000.
97 DREES, T., Simulation des europäischen Binnenmarktes für Strom und Regelleistung bei hohem Anteil erneuerbarer Energien, Aachen, 2015.
98 EICKMANN, J., Simulation der Engpassbehebung im deutschen Übertragungsnetzbetrieb, Aachen, 2015.
99 DIECKHOFF, C., ET AL., Zur Interpretation von Energieszenarien, München, 2014.
100 ENERGYPLAN, PRIMES, available: https://www.energyplan.eu/othertools/national/primes/, [accessed: 02.10.2018].
101 ENTSO-E, ENTSOG, TYNDP 2018 Scenario Report: Main Report, Brussels, 2018.
102 ENTSO-E, ENTSOG, TYNDP 2018 Scenario Report Annex I: Country Level Results, Brussels, 2018.
103 ENTSO-E, ENTSOG, TYNDP 2018 Scenario Report Annex II: Methodology, Brussels, 2018.
104 ENTSO-E, Maps & Data, available: https://tyndp.entsoe.eu/maps-data/, [accessed: 21.09.2018].

THREE EUROPEAN ENERGY SCENARIOS
75
105 THRONDSEN, W., RYGHAUG, M., “Material participation and the smart grid: Exploring different modes of articulation”, Energy Research & Social Science (9), pp. 157-165, 2015.


THREE EUROPEAN ENERGY SCENARIOS
77
Table of figures Figure 1: Tasks of work package 2 ........................................................................................... 8
Figure 2: ENTSO-E shares of electrical energy production in 2016 [14] .................................. 9
Figure 3: Share of fossil fuels (left) and hydropower (right) in total national electrical energy production [14] ......................................................................................................................... 10
Figure 4: The balance of load and generation [25] ................................................................. 11
Figure 5: The origin of member TSOs of ENTSO-E [27] .......................................................... 12
Figure 6: Electrical energy production by fuel in the EU (1990-2015) [32] ............................. 13
Figure 7: A generic load curve example [42] ........................................................................... 14
Figure 8: Short-term fluctuations and forecast errors in load ................................................ 15
Figure 9: Exemplary feed-in by wind and solar power in Germany (2017) [46] ...................... 16
Figure 10: Errors in wind power forecasts in Spain plotted against the forecast horizon [8].................................................................................................................................................. 17
Figure 11: Time frames and measures of regulatory control [47] .......................................... 18
Figure 12: Exemplary illustration of restrictions of fossil-fuelled power plants [53] ............. 20
Figure 13: Load management programmes ........................................................................... 25
Figure 14: Map of interconnection levels and interconnections projects (2017) [82] ........... 27
Figure 15: Exemplary structure of storage and pumped storage hydropower plants [41] .... 29
Figure 16: Proportion of installed capacity of various electric storage systems [95] ........... 30
Figure 17: Overview of power system simulation toolchain .................................................. 33
Figure 18: Overview of simulation tool for stability analysis ................................................. 35
Figure 19: Overview of the ENTOS-E’s scenarios for 2030 and 2040 [101] ........................... 38
Figure 20: Installed IRES capacities, given in percentage of overall installed electrical power generation capacities [104] ..................................................................................................... 41
Figure 21: Share of solar and wind electrical energy production, given in percent of total electrical energy production [104] .......................................................................................... 42
Figure 22: Installed capacities by fuel type within the ST scenario [104] ............................. 44
Figure 23: Installed capacities by fuel type within the DG scenario [104] ............................. 45
Figure 24: Installed capacities by fuel type in the GCA scenario [104] .................................. 46
Figure 25: Installed capacities of hydropower, percentage shares of overall installed capacities [104] ....................................................................................................................... 47
Figure 26: Installed capacities of gas-fired plants, percentage shares of overall installed capacities [104] ....................................................................................................................... 48
Figure 27: Schematic illustration of a scenario funnel .......................................................... 50
Figure 28: European AC transmission grid models for 2020 (left) and 2025 (right) ............. 51
Figure 29: Assumptions of fuel prices [70] ............................................................................. 51
Figure 30: Assumptions of prices for CO2 Allowances [70] .................................................... 52
Figure 31: Schematic illustration of the three scenarios of European power system .......... 52
Figure 32: Essential factors of the Reference Scenario ......................................................... 54
Figure 33: Net generation capacities of thermal power plants in Europe of the Reference Scenario ................................................................................................................................... 55
Figure 34: RES share of final electricity consumption of the Reference scenario ................ 55
Figure 35: Annual European electricity demand in the Reference scenario .......................... 56
THREE EUROPEAN ENERGY SCENARIOS
78
Figure 36: Essential factors of the Green Hydro Scenario ..................................................... 57
Figure 37: Net generation capacities of thermal power plants in Europe of the Green Hydro Scenario ................................................................................................................................... 58
Figure 38: RES share of final electricity consumption in the Green Hydro scenario ............ 58
Figure 39: Annual European electricity demand in the Green Hydro scenario ...................... 59
Figure 40: Essential factors of the Prosumer Scenario.......................................................... 60
Figure 41: Net generation capacities of thermal power plants in Europe of the Prosumer Scenario ................................................................................................................................... 61
Figure 42: RES share of final electricity consumption in the Prosumer scenario ................. 62
Figure 43: Annual European demand in the Prosumer scenario............................................ 62

THREE EUROPEAN ENERGY SCENARIOS
79
Table of tables Table 1: Characteristics of dispatchable power plants [53; 56; 34; 58; 59; 8; 61; 57; 55; 62; 63].................................................................................................................................................. 23
Table 2: Net Transfer Capacities from the Nordic countries Sweden, Norway and Finland to Continental Europe within each scenario [104] ...................................................................... 49


![[- 200 [ PROVIDING MODULATED COMMUNICATION SIGNALS ]](https://static.fdokumen.com/doc/165x107/6328adc85c2c3bbfa804c60f/-200-providing-modulated-communication-signals-.jpg)