Fish Passage and Hydropower - DigitalCommons@UMaine
117
The University of Maine The University of Maine DigitalCommons@UMaine DigitalCommons@UMaine Electronic Theses and Dissertations Fogler Library Fall 12-6-2019 Fish Passage and Hydropower: Investigating Resource Agency Fish Passage and Hydropower: Investigating Resource Agency Decision-making During the FERC Hydropower Relicensing Decision-making During the FERC Hydropower Relicensing Process Process Sarah Vogel University of Maine, [email protected] Follow this and additional works at: https://digitalcommons.library.umaine.edu/etd Part of the Aquaculture and Fisheries Commons, Environmental Studies Commons, and the Terrestrial and Aquatic Ecology Commons Recommended Citation Recommended Citation Vogel, Sarah, "Fish Passage and Hydropower: Investigating Resource Agency Decision-making During the FERC Hydropower Relicensing Process" (2019). Electronic Theses and Dissertations. 3135. https://digitalcommons.library.umaine.edu/etd/3135 This Open-Access Thesis is brought to you for free and open access by DigitalCommons@UMaine. It has been accepted for inclusion in Electronic Theses and Dissertations by an authorized administrator of DigitalCommons@UMaine. For more information, please contact [email protected].
-
Upload
khangminh22 -
Category
Documents
-
view
3 -
download
0
Transcript of Fish Passage and Hydropower - DigitalCommons@UMaine

The University of Maine The University of Maine
DigitalCommons@UMaine DigitalCommons@UMaine
Electronic Theses and Dissertations Fogler Library
Fall 12-6-2019
Fish Passage and Hydropower: Investigating Resource Agency Fish Passage and Hydropower: Investigating Resource Agency
Decision-making During the FERC Hydropower Relicensing Decision-making During the FERC Hydropower Relicensing
Process Process
Sarah Vogel University of Maine, [email protected]
Follow this and additional works at: https://digitalcommons.library.umaine.edu/etd
Part of the Aquaculture and Fisheries Commons, Environmental Studies Commons, and the Terrestrial
and Aquatic Ecology Commons
Recommended Citation Recommended Citation Vogel, Sarah, "Fish Passage and Hydropower: Investigating Resource Agency Decision-making During the FERC Hydropower Relicensing Process" (2019). Electronic Theses and Dissertations. 3135. https://digitalcommons.library.umaine.edu/etd/3135
This Open-Access Thesis is brought to you for free and open access by DigitalCommons@UMaine. It has been accepted for inclusion in Electronic Theses and Dissertations by an authorized administrator of DigitalCommons@UMaine. For more information, please contact [email protected].

FISH PASSAGE AND HYDROPOWER: INVESTIGATING RESOURCE AGENCY DECISION-MAKING DURING
THE FERC HYDROPOWER RELICENSING PROCESS
By
Sarah Vogel
B.A. (in Wildlife and Fisheries Science), Tennessee Technological University, 2013
B.A. (in Conservation Biology), Tennessee Technological University, 2013
A THESIS
Submitted in Partial Fulfillment of the
Requirements for the Degree of
Master of Science
(in Wildlife Ecology)
The Graduate School
The University of Maine
December 2019
Advisory Committee:
Joseph D. Zydlewski, Professor of Wildlife Ecology, Co-Advisor
Jessica S. Jansujwicz, Research Assistant Professor of Wildlife Ecology, Co-Advisor
Carly Sponarski, Assistant Professor of Wildlife Ecology

ii
© 2019 Sarah K. Vogel
All Rights Reserved

FISH PASSAGE AND HYDROPOWER: INVESTIGATING RESOURCE AGENCY DECISION-MAKING DURING
THE FERC HYDROPOWER RELICENSING PROCESS
By Sarah K. Vogel
Thesis Co-Advisors: Dr. Joseph D. Zydlewski and Dr. Jessica S. Jansujwicz
An Abstract of the Thesis Presented
in Partial Fulfillment of the Requirements for the Degree of Master of Science
(in Wildlife Ecology) December 2019
Hydropower dams represent a significant challenge for the successful migration of sea-run fish,
many species of which are in decline. Most hydropower dams in the United States are regulated by the
Federal Energy Regulatory Commission (FERC), an independent federal agency responsible for granting
30 to 50-year licenses to projects for their continued operation. Licenses typically include conditions for
the conservation of sea-run fish such as fish passage construction, operational changes, monitoring of
effectiveness, and other mitigative conditions. While FERC remains the primary authority in licensing,
the current regulatory framework stipulates input from other federal and state resource and regulatory
agencies, many working from differing timeframes, varying levels of authority, and within the bounds of
a complex legal system.
Outside of the relicensing process, modifications and improvements are not required unless
prescribed in the original license or prompted by legal action (e.g., the listing of new species under the
ESA). In effect, the relicensing process presents the most effective opportunity for agencies to influence
dam operations. Due to accelerated construction of hydropower dams in the 1980s, many of the
projects in Maine will require relicensing within the next decade requiring input from an array of federal
and state agencies. When negotiating hydropower operations, agencies must make timely decisions and

examine tradeoffs based on their respective and often competing authorities, values, and objectives.
Using the Kennebec and Penobscot Rivers in Maine as a model system, the overall goal of this research
is to examine the hydropower relicensing process to: 1) identify and describe the role and authority of
resource agencies during dam relicensing, 2) determine the factors that may affect the design and
implementation of fish passage measures, and 3) highlight management and policy implications that
may be used to inform fish passage decisions and future relicensing efforts. This research provides the
historical context for fish passage in the study area and describes hydropower regulation.
The first chapter uses content analysis of relicensing documents readily available on the Federal
Energy Regulatory Commission (FERC) eLibrary to identify the main factors that influence fish passage
decision-making and describe patterns in agency engagement during relicensing. Our results indicate an
overall increase in concern for fish passage over time with mitigation measures focused almost
exclusively on Atlantic salmon and American eel. Agency engagement and the use of regulatory
authority increased after the 1900s, especially with regards to the use of Water Quality Certification
conditions as a tool for addressing fish passage. Overall, hydropower projects were found to differ along
a spatial gradient with coastal projects correlated strongly to fish passage language and input from the
Maine Department of Marine Resources (MDMR), United States Fish and Wildlife Service (USFWS), and
National Oceanic and Atmospheric Administration (NOAA) and inland projects to input from the Maine
Department of Inland Fisheries and Wildlife (MDIFW). Despite stated interest in basin-scale planning,
policies in support of it, and continued improvement, implementation has been slow at best. Our results
suggest there remain significant opportunities to spatially integrate the FERC process.
The second chapter investigates the concept of “best available science” (BAS) as it applies to the
relicensing decision process. Agency regulators are tasked with using the BAS to make informed
decisions about hydropower operations and management. Although embraced as the standard, best
available science is not well-defined and is inconsistently applied. Citation analysis and an online survey

of regulatory and resource agency staff were used to identify the informational sources used in
relicensing and assess agency perceptions of BAS. Analysis of relicensing documents (n=62)
demonstrates that FERC and licensee documents (i.e., documents produced by the individual or
organization that was granted the license) are highly similar in citation composition. NOAA reports
typically cite more sources and are three times more likely to cite peer-reviewed literature than FERC
and licensee documents. Survey data reveals that federal and state agency respondents (n=49) rate
peer-reviewed literature highly in terms of BAS, followed by university (e.g., theses), agency (e.g.,
agency grey literature), and expert sources (e.g., guidance from experts), while industry (e.g., consultant
reports) and community (e.g., comments and personal interactions) sources rate poorly. Overall, there is
low agreement among respondents with regards to BAS rankings of informational sources. The reported
differences in information use may be linked to disparities in access to certain sources, particularly peer-
reviewed literature. A common concern expressed by agency staff is the lack of applied technical
information for all aspects of dam operations.
One such disparity relates to the difficulty in assessing downstream passage for out-migrating
juvenile fish. The final chapter addresses this knowledge gap by describing the development of a novel
buoyancy conversion (BC) tag that may be used to facilitate fish recapture for passage assessments. The
BC tag uses low-cost materials, does not significantly hinder fish movement, and has a delayed
deployment. This chapter provides a detailed description of the BC tag and describes the process used
to optimize the tag for a range of fish sizes, specifically for juvenile river herring. This work is intended
for the public domain and is meant to be highly adaptable for use with many fish species and life stages.

iii
ACKNOWLEDGEMENTS
This work would not be possible without the help of multiple organizations and individuals who
have supported me throughout my time at the University of Maine. Though I do not have the space to
list them all by name, I would like to take the opportunity to thank them. To anyone who I’ve forgotten,
I sincerely apologize, and hope that you know that your support has been greatly appreciated.
Funding for this project was provided by the National Science Foundation’s Research
Infrastructure Improvement Program, NSF #IIA-1539071. In kind support was provided by the U.S.
Geological Survey Maine Cooperative Fish and Wildlife Research Unit. Several individual grants for travel
and research were provided by the Graduate Student Government, the Department of Wildlife,
Fisheries, and Conservation Biology, and the Senator George J. Mitchell Center for Sustainability
Solutions. Surveys and stakeholder interviews were conducted under The University of Rhode Island IRB
protocol #HU1516-003 and permission to survey USFWS personnel was provided under DCN 069566.
Any use of trade, firm, or product names is for descriptive purposes only and does not imply
endorsement by the U.S. Government.
First and foremost, I would like to thank the faculty, staff, and fellow graduate students from the
University of Maine across multiple departments for their continued support. These include the many
professors that I have received mentorship from and the administrative staff (Rena Carey, Katherine
Goodine, Molly-Jean Langlais-Parker, and Carol Hamel) who have kept my life running smoothly. I am
especially thankful for the strong women in my life who have become family. Bryn Evans, I could not
have asked for a better roommate and support system. Your positive outlook and care have gotten me
through tough times. Steph Shea, I am eternally grateful for the fun you have brought to my life. I know I
can count on you for anything and I love “co-parenting” our pups together. Megan Hess, you have
opened my eyes to a world of new experiences from fly tying and fishing to dragonfly sampling. You are
a true adventure buddy.

iv
Over the years I have relied on the encouragement of my officemates: Alli Brehm, Sara Boone,
Anna Buckardt, Ches Gundrum, Kirstie Ruppert, Bayu Bronto, Winson, and Eugene. You truly made me
feel welcome in Maine and comfortable at the University. Thank you to the past and present members
of the Zydlewski Lab: Betsy Barber, Sarah Rubenstein, Andy O’Malley, Kevin Job, George Maynard,
Alejandro Molina Moctezuma, Dan Weaver, Erin Peterson, and Matthew Mensinger. You provided me
with invaluable assistance and kept me sane in the lab, classroom, and during the writing process. You
are the real MVPs.
I would like to thank my advisors, Joe Zydlewski and Jessica Jansujwicz, for giving me the
opportunity to participate in this research project. Additionally, I would like to thank them for the time,
care, and support they have given me, both professionally and personally. I thank Carly Sponarski, for
her valuable input throughout my research and continued guidance on the human dimensions of
wildlife. I would also like to thank the numerous volunteers and stakeholders that participated in
surveys, interviews, informal talks, and meetings.
Lastly, but certainly not least, I would like to thank my family, especially my parents, Julie and
Fred Vogel, my Sister, Danielle Vogel, and my pups, Juliet and Maverick, for all their love and support
over the years which have allowed me to reach this point in my career.

v
TABLE OF CONTENTS
ACKNOWLEDGEMENTS ................................................................................................................................ iii
LIST OF TABLES ............................................................................................................................................ viii
LIST OF FIGURES ............................................................................................................................................ix
LIST OF ACRONYMS AND ABBRIVIATIONS .................................................................................................... x
CHAPTERS
1. FISH PASSAGE DECISION-MAKING DURING HYDROPOWER RELICENSING IN THE KENNEBEC AND
PENOBSCOT RIVERS, MAINE ......................................................................................................................... 1
Abstract .............................................................................................................................................. 1
Introduction ........................................................................................................................................ 2
Hydropower Dams and Fish Passage ....................................................................................... 7
Regulation of Hydropower Projects and the FERC Relicensing Process ................................ 10
Methods ........................................................................................................................................... 13
Document Analysis ................................................................................................................. 13
Database Description and Document Discovery ......................................................... 13
Summarizing Characteristics of Hydropower Projects........................................................... 17
Summarizing Project Outcomes ............................................................................................. 22
Assessing Project Variation and Predicting Factors ............................................................... 25
Results .............................................................................................................................................. 27
Project Characteristics and Outcomes ................................................................................... 27
Fish Management ........................................................................................................ 27
Stakeholder Engagement ............................................................................................ 29
Basin-scale Hydropower Planning ............................................................................... 30
Variation and Predictive Factors ............................................................................................ 30

vi
Discussion ......................................................................................................................................... 36
Temporal Trends .................................................................................................................... 36
Spatial Trends ......................................................................................................................... 39
Challenges and Opportunities for Integrative Basin-scale Management .............................. 41
Limitations ........................................................................................................................................ 44
2. SCIENCE IN ACTION OR SCIENCE INACTION? EVALUATING THE IMPLEMENTATION OF “BEST
AVAILABLE SCIENCE” IN HYDROPOWER RELICENSING ............................................................................... 45
Abstract ............................................................................................................................................ 45
Introduction ...................................................................................................................................... 45
Science as a Basis for Hydropower Relicensing Policy ........................................................... 47
Study Area: Kennebec and Penobscot River Watersheds...................................................... 49
Citation Analysis ............................................................................................................................... 50
Methods ................................................................................................................................. 50
Results .................................................................................................................................... 55
Stakeholder Survey ........................................................................................................................... 58
Methods ................................................................................................................................. 58
Results .................................................................................................................................... 61
Conclusions and Policy Implications ................................................................................................. 65
3. DEVELOPMENT OF A NOVEL BUOYANCY CONVERSION TAG FOR RECAPTURING FISH .......................... 72
Introduction ...................................................................................................................................... 72
Methods ........................................................................................................................................... 74
Tag Optimization .................................................................................................................... 74
Results .............................................................................................................................................. 75
Buoyancy Conversion Tag Description ................................................................................... 78
vii
Future Development ........................................................................................................................ 81
REFERNCES .................................................................................................................................................. 83
APPENDIX A. SUMMARY OF SELECT HYDROPOWER RELICENSING DOCUMENTS ...................................... 89
APPENDIX B. FREQUENTLY USED SOURCES OF INFORMATION IN HYDROPOWER RELICENSEING ............ 94
APPENDIX C. USE OF SCIENTIFIC KNOWLEDGE IN HYDROPOWER RELICENSING QUESTIONNAIRE ........... 95
BIOGRAPHY OF THE AUTHOR.................................................................................................................... 102

viii
LIST OF TABLES
Table 1.1. Hydropower project characteristics ...................................................................................... 4
Table 1.2. Social and procedural variables ........................................................................................... 19
Table 1.3. Physical variables ................................................................................................................. 20
Table 1.4. Biological variables ............................................................................................................... 21
Table 1.5. License term frequency ........................................................................................................ 23
Table 2.1. Informational sources .......................................................................................................... 54
Table 2.2. Citation analysis summary ................................................................................................... 56
Table 2.3. Best available science index ................................................................................................. 63
Table 3.1. Buoyancy conversion tag specifications .............................................................................. 80
Table A.1. Relicensing document summary ......................................................................................... 89
Table B.1. Frequently used information sources .................................................................................. 94
ix
LIST OF FIGURES
Figure 1.1. Hydropower projects in the Kennebec and Penobscot Rivers, Maine .................................. 6
Figure 1.2. Fish passage document database ........................................................................................ 15
Figure 1.3. Term frequency values by year ............................................................................................ 28
Figure 1.4. NMDS of hydropower project characteristics ..................................................................... 32
Figure 1.5. NMDS of license term frequencies ...................................................................................... 33
Figure 1.6. Random forest model .......................................................................................................... 35
Figure 2.1. Citations per document ....................................................................................................... 55
Figure 2.2. Citation age .......................................................................................................................... 57
Figure 2.3. Perceptions and use of best available science ..................................................................... 64
Figure 3.1. Size measurements ............................................................................................................. 76
Figure 3.2. Maximum force measurements .......................................................................................... 77
Figure 3.3. Buoyancy conversion tag deployment ................................................................................. 79

x
LIST OF ACRONYMS AND ABBREVIATIONS
ALP Alternative Licensing Process
BA biological assessment
BAS best available science
BIOP Biological Opinion
CWA Clean Water Act
CZMA Coastal Zone Management Act
EA environmental assessment
EFH essential fish habitat
EIS environmental impact statement
ESA Endangered Species Act
FERC Federal Energy Regulatory Commission
FPA Federal Power Act
FWCA Fish and Wildlife Coordination Act
ILP Integrated Licensing Process
MSA Magnuson-Stevens Fishery Conservation and Management Act
MDEP Maine Department of Environmental Protection
MDMR Maine Department of Marine Resources
MDIFW Maine Department of Inland Fisheries and Wildlife
NEPA National Environmental Policy Act
NGO nongovernmental organization
NOAA National Oceanic and Atmospheric Administration
NOI Notice of Intent

xi
PIN Penobscot Indian Nation
PAD preliminary application document
TLP Traditional Licensing Process
USFWS U.S. Fish and Wildlife Service
WQC Water Quality Certification

1
CHAPTER 1
FISH PASSAGE DECISION-MAKING DURING HYDROPOWER RELICENSING
IN THE KENNEBEC AND PENOBSCOT RIVERS, MAINE
Abstract
Hydropower dams represent a significant challenge for the successful migration of sea-run fish,
many species of which are in decline. The Federal Energy Regulatory Commission (FERC) regulates most
hydropower dams and grants 30 to 50-year licenses to projects which typically include conditions for the
conservation of sea-run. FERC is the primary authority in licensing, however over time, the process has
been expanded to require input from other federal and state resource and regulatory agencies. When
negotiating hydropower operations, agencies must make timely decisions and examine tradeoffs based
on their respective and often competing authorities, values, and objectives.
Using the Kennebec and Penobscot Rivers as a model system, we sought to identify the main
factors that influence fish passage decisions-making and describe patterns of agency engagement in
licensing. Our results indicate an overall increase in concern for fish passage over time with mitigation
measures focused almost exclusively on Atlantic salmon (Salmo salar) and American eel (Anguilla
rostrata). Agency engagement and the use of regulatory authority increased after the 1990s resulting in
increased complexity. Overall, hydropower projects were found to differ in management along a spatial
gradient. Coastal projects correlated strongly to fish passage language and input from the Maine
Department of Marine Resources (MDMR), U.S. Fish and Wildlife Service (USFWS), and National Oceanic
and Atmospheric Administration (NOAA) and inland projects to input from MDIFW. Despite stated
interest in basin-scale planning, policies in support of it, and continued improvement, implementation
has been slow at best. Our results suggest there remain significant opportunities to spatially integrate
the FERC process.

2
Introduction
Hydropower dams are considered a clean source of domestic renewable energy and important
in lowering our nation’s dependence on fossil fuels (Dincer and Acar, 2015). Although dams provide
important benefits, they alter and fragment riverine habitat in ways that can be detrimental to sea-run
fish, many species of which are in decline (Fuller et al., 2015; Hall et al., 2011). Notable declines in
culturally and economically important species have led to more intense scrutiny of hydropower dam
operations. A complex regulatory framework is in place to license hydropower dams and address
energy, recreation, and environmental concerns. Nonfederal hydropower dams (“projects” hereafter) in
the US are regulated by the Federal Energy Regulatory Commission (FERC), an independent federal
agency which grants licenses to hydropower projects that specify the conditions for project operations
(16 U.S.C. Ch. 12). Licenses last 30 to 50-years and must be relicensed periodically. They typically include
conditions for the conservation of sea-run fish including the construction of fish passage facilities,
changes to operations, monitoring of effectiveness, and other mitigative conditions.
While FERC remains the primary authority in relicensing, the current relicensing framework
stipulates input from other federal and state resource and regulatory agencies. These agencies invoke a
suite of regulatory authorities and have the ability to affect license conditions (Richardson, 2000). When
negotiating changes to hydropower operations during relicensing, agencies must make timely decisions
based on their often competing authorities, values, and objectives (Richardson, 2000). Outside of the
relicensing process, modifications and improvements are not required unless prescribed in the original
license or prompted by legal action (e.g., the listing of new species under the ESA). In effect, the
relicensing process presents the most effective opportunity for agencies to influence dam operations
while considering human uses and ecological impacts (Kosnik, 2010).
In the next two decades, more than half of all active FERC-regulated projects in the nation will
require relicensing (Curtis and Buchanan, 2018). This demanding forecast will necessitate increased

3
participation from agencies and has led to pressure for a more streamlined decision-making process
(Berube et al. 2002). An understanding of the factors that influence agency decision-making is important
for navigating relicensing and informing future negotiations. The Kennebec and Penobscot River
watersheds in Maine provide an exemplary case for investigating fish passage decision-making in this
context.
The Kennebec and Penobscot Rivers drain more than 40 percent of the state by area and
contribute substantially to Maine’s energy profile. In 2018, 31 percent of net electricity generation came
from hydropower, the most per capita of any state East of the Mississippi (EIS, Profile Analysis, 2019).
Additionally, Maine ranks the fifth highest in the nation for the number of hydropower projects
requiring relicensing in the next two decades (n = 40; Curtis and Buchanan, 2018). Projects in these
watersheds exhibit a range of diverse characteristics (Table 1.1). They include small and large
hydropower dams as well as non-generating storage facilities. Some occupy mainstem rivers close to the
watershed mouth while others occupy small tributaries farther inland. A variety of fish species exist
within project boundaries and fish passage measures that are negotiated and enforced vary from
project to project. These rivers have been the site of notable conservation efforts and basin-scale
planning initiatives. The diversity in the Kennebec and Penobscot River watersheds makes insight into
agency decision-making transferable to other projects nationwide that exhibit similar characteristics.

4
Table 1.1. Hydropower project characteristics. General characteristics for hydropower projects in the Kennebec and Penobscot River watersheds including: project name and number of dams (if more than one); licensing process and year of current license; river where facility is located; authorized capacity (GW); mode-of-operation (e.g., run of river, storage, or combination); reservoir storage volume (million m3); dam height (m); number of documents in project docket; and the proportion of documents mentioning fish passage.
Project Code Process Lic year River Auth cap (GW)
Mode of operation
Storage volume (mil m3)
Height (m)
Project doc
FP Docs
Abenaki ABE ALP 2003 K 18.8 ROR 0.6 7.6 513 9.6%
American Tissue AMT TLP 1979* K 1 ROR 0.1 7.3 775 12.5%
Anson ANS ALP 2003 K 9 ROR 7.2 11.0 617 8.9%
Automatic #4 AUT TLP 1999 K 0.8 ROR 1.1 9.9 402 1.7%
Benton Falls BEN TLP 1984 K 4.33 ROR 1.2 8.2 604 22.5%
Brassua BRA ILP 1977* K 4.18 STOR 254.1 15.2 1204 2.6%
Burnham BUR TLP 2004 K 1.05 COM 2.3 9.8 559 25.2%
Eustis EUS TLP 1996 K 0.25 ROR 0.7 5.2 287 2.4%
Flagstaff FLA TLP 2004 K 0 STOR 339.8 13.7 949 1.0%
Great Lakes Hyd (9) GLH TLP 2004 P 0 STOR 33.6 7.9 1144 1.2%
Great Works GRW TLP 1963 P 7.655 ROR NA 4.9 656 10.5%
Howland HOW TLP 1980 P 1.875 ROR NA 5.2 827 15.5%
Hydro Kennebec HYK TLP 1986 K 15.433 ROR 4.8 10.7 1099 12.3%
Indian Pond INP TLP 2004 K 76.4 STOR 96.2 53.3 1268 1.4%
Lockwood LOC TLP 2005 K 6.915 ROR 0.7 5.2 897 18.5%
Lowell Tannery LTA TLP 1983* P 1 ROR 0.8 8.2 369 4.3%
Mattaceunk MAT TLP 1988* P 19.2 ROR 25.9 13.7 1034 9.3%
Medway MED TLP 1999 P 3.44 ROR 1.9 10.8 653 11.3%
Messalonskee (3) MES TLP 1999 K 5.9 ROR 0.7 6.6 1059 0.8%
Milford (2) MIL TLP 1998 P 8 ROR 2.8 10.4 1260 14.7%
Moosehead Lake (2) MOH TLP 1997 K 0 STOR 1332.2 6.9 1037 1.0%
Orono ORO TLP 2005 P 6.518 ROR 1.6 4.6 854 22.4%
Penobscot Mills (5) PEN TLP 1996 P 70.81 COM 109.4 10.6 2355 0.5%
Ripogenus RIP TLP 1996 P 37.53 STOR 848.6 25.3 1633 0.6%
Shawmut (2) SHA ILP 1981* K 8.74 ROR 6.2 7.9 688 12.2%
Stillwater STI TLP 1998 P 4.179 ROR 2.4 7.6 1109 16.8%
Veazie VEZ TLP 1998 P 8.4 ROR NA 6.1 1127 11.8%
Wenfield WEN TLP 1984* P 13 ROR 14.2 4.6 817 14.3%
Weston WES TLP 1997 K 15.98 ROR 22.9 11.6 1156 6.8%
Williams WIL ILP 2017 K 13 STOR 5.6 13.7 174 12.6%
Wyman WYM TLP 1997 K 83.7 STOR 257.7 47.2 1242 1.9%
*Indicates projects that have submitted Notice of Intent documentation (NOI); are currently involved in the relicensing process (Lowell Tannery, Mattaceunk, Brassau, Shawmut, West Enfield), or have completed relicensing (American Tissue, 2019)

5
This is especially important given the expected increase in workload related to the demanding
relicensing forecast. Basin-scale management has been identified as a way to reduce this complexity by
addressing objectives at multiple dams simultaneously (Curtis and Buchanan, 2018). FERC has issued a
policy statement (2017a) in support of coordinating license expiration dates for projects in the same
river basin in order to synchronize relicensing decision-making. Similarly, environmental assessments
required by the National Environmental Policy Act (NEPA), require that the cumulative impacts of
multiple projects be assessed during relicensing. While basin-scale management is advocated,
implementation remains inconsistent at individual projects.
Lessons learned from past decisions will allow us to track and gauge responsiveness to the
changing management paradigms (i.e., calls for more integrative basin-scale planning) and may help
inform future negotiations and alleviate some process complexity. This requires knowledge of the
primary agency stakeholders involved in the relicensing process, an understanding of the factors that
influence agency decision-making, and knowledge of the insight on the opportunities and challenges
facing the design and implementation of basin-scale hydropower planning. This paper sets the
groundwork by introducing the history of fish passage in the study area and describing hydropower
regulation. Methods are presented for using content analysis of archived relicensing documents to
extract and analyze textual data relevant to fish passage decision-making. Finally, guidance is given
regarding challenges to basin-scale hydropower management that may augment agency decision-
making in the future.

6
Figure 1.1. Hydropower projects in the Kennebec and Penobscot River watersheds, Maine.
GLH 6
BRA
WEN
ABE
SHA
GRW ORO
MIL 2 MIL 1
MAT PEN 1-4
MES 1-3 HYK LOC
Kennebec
Penobscot

7
Hydropower Dams and Fish Passage
The Kennebec and Penobscot Rivers have been of high economic importance for the transport
of timber and for paper production since the nineteenth century (Gibson, 2017). These activities were
predicated on the construction of dams for water control and hydropower for industrial mills. While
river uses have changed over time, hydropower dams still play an important role in Maine’s economy,
contributing 450 thousand megawatts of power (Table 1.1). Dams in the Kennebec and Penobscot Rivers
include 31 actively licensed projects (Figure 1.1). These represent significant barriers to the upstream
and downstream migration of sea-run fish that are important to commercial and recreational fisheries in
the area (Hall et al., 2011; Linnansaari et al., 2015).
Sea-run fish must undertake long-distance migrations and cross the ocean-freshwater boundary
in order to complete their life history. Fragmentation alters and reduces access to essential fish habitat,
limiting spawning and rearing grounds (Hall et al., 2011) and artificially influences fish assemblages
(Kiraly et al., 2014; Watson et al., 2018). Hydropower dams have been linked to fish mortality and injury
particularly associated with turbine passage (Maynard et al., 2018a; Olden, 2015; Pracheil et al., 2016).
Furthermore, delays incurred at dams are energetically taxing and may negatively impact survival (Izzo
et al., 2016; Nyqvist et al., 2017). Damming has specifically been identified as a leading cause for the
substantial population declines in the Kennebec and Penobscot Rivers (Bunt et al., 2011; Limburg and
Waldman, 2009).
There are 11 sea-run species native to the Kennebec and Penobscot Rivers. Most notable is the
Atlantic salmon (Salmo salar), of which the Gulf of Maine Distinct Population Segment (GOM DPS) is
listed as endangered under the ESA (65 FR 69459). Atlantic salmon in the study area once supported
multi-million dollar recreational and commercial fisheries and were essential to subsistence fishing by
the Penobscot Indian Nation (PIN). While the Penobscot River continues to host the largest run of
Atlantic salmon in the state, returns remain low (NASCO, 2019) prompting intense restoration efforts.
8
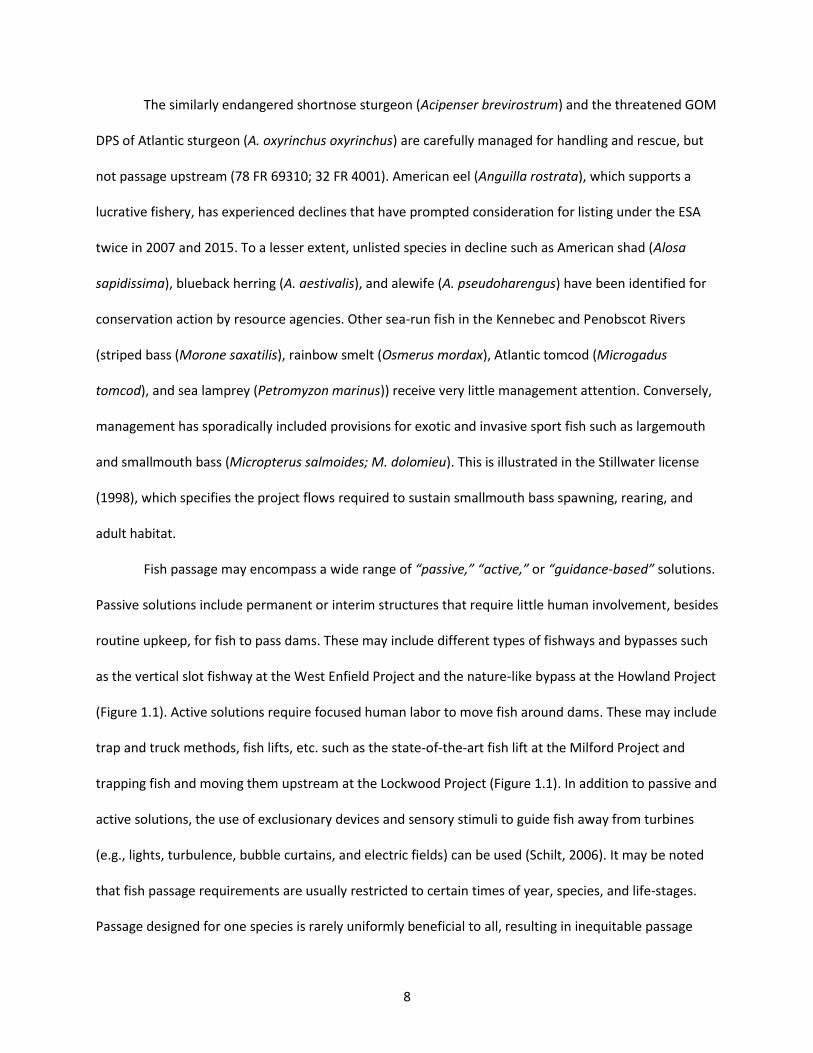
The similarly endangered shortnose sturgeon (Acipenser brevirostrum) and the threatened GOM
DPS of Atlantic sturgeon (A. oxyrinchus oxyrinchus) are carefully managed for handling and rescue, but
not passage upstream (78 FR 69310; 32 FR 4001). American eel (Anguilla rostrata), which supports a
lucrative fishery, has experienced declines that have prompted consideration for listing under the ESA
twice in 2007 and 2015. To a lesser extent, unlisted species in decline such as American shad (Alosa
sapidissima), blueback herring (A. aestivalis), and alewife (A. pseudoharengus) have been identified for
conservation action by resource agencies. Other sea-run fish in the Kennebec and Penobscot Rivers
(striped bass (Morone saxatilis), rainbow smelt (Osmerus mordax), Atlantic tomcod (Microgadus
tomcod), and sea lamprey (Petromyzon marinus)) receive very little management attention. Conversely,
management has sporadically included provisions for exotic and invasive sport fish such as largemouth
and smallmouth bass (Micropterus salmoides; M. dolomieu). This is illustrated in the Stillwater license
(1998), which specifies the project flows required to sustain smallmouth bass spawning, rearing, and
adult habitat.
Fish passage may encompass a wide range of “passive,” “active,” or “guidance-based” solutions.
Passive solutions include permanent or interim structures that require little human involvement, besides
routine upkeep, for fish to pass dams. These may include different types of fishways and bypasses such
as the vertical slot fishway at the West Enfield Project and the nature-like bypass at the Howland Project
(Figure 1.1). Active solutions require focused human labor to move fish around dams. These may include
trap and truck methods, fish lifts, etc. such as the state-of-the-art fish lift at the Milford Project and
trapping fish and moving them upstream at the Lockwood Project (Figure 1.1). In addition to passive and
active solutions, the use of exclusionary devices and sensory stimuli to guide fish away from turbines
(e.g., lights, turbulence, bubble curtains, and electric fields) can be used (Schilt, 2006). It may be noted
that fish passage requirements are usually restricted to certain times of year, species, and life-stages.
Passage designed for one species is rarely uniformly beneficial to all, resulting in inequitable passage

9
accessibility (Roscoe and Hinch, 2010; Noonan et al., 2012) and changes in demography and fitness
(Anderson et al., 2006; Maynard et al., 2018). Additionally, connectivity requires both upstream and
downstream passage to be effective for all life history stages (Calles and Greenberg, 2009; Silva et al.,
2018).
In addition to fish passage, ancillary mitigation measures may be adopted in place of physical
requirements. In-lieu funding may consist of fees that generally fund conservation efforts and
environmental studies in the watershed in place of immediate fish passage construction. Stocking of
hatchery-reared fish is another mitigative measure to supplement native fish populations, address the
recovery of endangered species, and fulfill trust responsibilities (USFWS 2018). However, it is widely
accepted that hatchery-reared fish experience lower survival than their wild counterparts and show
differences in behavior, morphology, genetics, and physiology (Maynard et al., 1995; Brown et al.,
2003).
Beyond fish passage and mitigative measures, assessment of tradeoffs has led to complete dam
removals (Stanley and Doyle, 2003). The most notable conservation-driven removal was of the Edwards
Dam on the Kennebec River in 1997. In relicensing proceedings, FERC found that the economic value of
the dam did not compensate for the environmental liabilities it incurred, particularly for fish passage
(Opperman et al., 2011; Wildman, 2013). This was the first federally-ordered dam removal against the
wishes of a licensee in US history. This action paved the way for other improvements to fish passage
including the removal of the Veazie and Great Works Dams on the Penobscot River in 2012 and 2013
(Figure 1.1). These were the result of a coordinated negotiation, endorsed by FERC, to balance fish
restoration and energy generation. The project included conservation organizations, state agencies,
USFWS, tribal entities, and multiple licensees (Opperman et al., 2011).

10
Regulation of Hydropower Projects and The FERC Relicensing Process
Like all FERC regulated hydropower projects nationwide, dams in the Kennebec and Penobscot
Rivers follow established procedural pathways for licensing. The licensing process follows one of three
procedural pathways that vary in the level of stakeholder involvement: i) the Traditional Licensing
Process (TLP), ii) Alternative Licensing Process (ALP), and iii) Integrated Licensing Process (ILP). Until
2005, the TLP was the default process and involves little to no early FERC oversight and favors
stakeholder involvement later in the process (18 C.F.R. § 4.38). Participation by FERC and other
stakeholders does not occur until after a license application is filed, generally two years prior to its
expiration. In contrast, the ALP favors self-driven stakeholder collaboration with some early FERC
involvement (18 C.F.R. § 4.34(i)). It allows environmental review and pre-filing consultation to occur in
tandem but does not exhibit a highly rigid regulatory schedule.
The ILP became the default process in 2005 and is designed to streamline the relicensing
process. It includes FERC oversight and stakeholder involvement upon the submission of a Notice of
Intent (NOI) to file a license application (no more than five and a half years prior to expiration) and
enforces predictable timeframes (18 C.F.R. Part 5). Despite being developed to standardize relicensing,
concerns exist over this process due to the amount of early stakeholder effort required and the tight
time frames imposed for decisions (Swinger and Grant, 2004).
Hydropower relicensing remains complex and demands have been made to further simplify the
process and reduce licensing timeframes as illustrated by the America’s Water Infrastructure Act (2018)
aimed at establishing an expedited process for issuing and amending licenses. Today, the TLP may be
requested for projects with relatively simple concerns and few study needs while the ALP may be
requested for smaller projects that demonstrate stakeholder consensus regarding the concerns and
objectives at the projects. Regardless of the procedural pathway taken, opportunity exists for diverse

11
stakeholder involvement and the relicensing process is especially reliant on input from state and federal
resource and regulatory agencies.
In the Kennebec and Penobscot Rivers, the U.S. Fish and Wildlife Service (USFWS) and the
National Marine Fisheries Service (NOAA) are the primary federal resource agencies that participate in
relicensing activities. Broadly, NOAA is responsible for managing sea-run fish while USFWS is responsible
for managing terrestrial and freshwater wildlife. Additionally, USFWS administers the National Fish
Hatchery System which supports two Atlantic salmon hatcheries in Maine. Maine is unique in that it has
three state agencies devoted to managing Maine’s diverse resources. The Maine Department of Marine
Resources (MDMR) manages sea-run fish. The Maine Department of Inland Fisheries and Wildlife
(MDIFW) manages freshwater fish such as trout (Salvelinus sp), whitefish (Coregoninae sp), and bass
(Micropterus sp) and maintain a general focus on recreational angling, stocking activities, and the
prevention of invasive species. The Maine Department of Environmental Protection (MDEP) is the state
agency responsible for managing water resources and issuing Water Quality Certifications (WQC) for
licenses that may include compulsory conditions such as minimum and maximum flows, lake level
management, habitat restoration, and provisions for the establishment of fish passage facilities, studies,
and monitoring.
Traditionally, hydropower regulation has been governed unilaterally by FERC, however, the
relicensing process has become increasingly inclusive. This inclusivity, known as collaborative
governance, has been attributed to increases in environmental benefits and distribution of decision-
making power in the last several decades (Blumm and Lang, 2015). Collaborative governance may
broadly be seen as decision-making processes that engage stakeholders across “the boundaries of public
agencies, levels of government, and/or the public, private and civic spheres” (Emerson et al., 2012). The
environmental movement in the United States in the 1970s largely set the stage for this shift. Legislative
action during this time established important environmental law including the National Environmental

12
Policy Act (NEPA; 1970), Clean Water Act (CWA; 1972), Endangered Species Act (ESA; 1973), and
Magnuson-Stevens Fishery Conservation and Management Act (MSA; 1976) which empower regulatory
and resource agencies in the relicensing process. In effect, FERC makes the final determination on
licenses but is obligated to include terms and conditions given by federal and state resource and
regulatory agencies based on the statutes above.
The NEPA requires that FERC prepare assessments to evaluate the environmental impacts of
proposed projects and assess cumulative impacts. Section 401 of the CWA, administered by MDEP,
requires Water Quality Certification for projects to be licensed (33 U.S.C. § 1341(a)(1)). Section 7 of the
ESA requires that FERC consult with the federal agency responsible for the management of existent
endangered species (either USFWS or NOAA) and obtain that agency’s Biological Opinion on measures
to avoid jeopardy and “take” of species. The MSA, has increasingly required FERC to consult with NOAA
on all actions that may adversely affect essential fish habitat for sea-run fish. Similarly, section 18 of the
FPA allows NOAA to make mandatory fish passage prescriptions that must be included in final licenses
(16 U. S. C.).
This platform has allowed for more consistent and structured input from various agencies at
different points in the policy process (Richardson, 2000; Ulibarri, 2015). The choices made during
relicensing are especially important to the long-term survival and persistence of sea-run fish. However,
the decision-making process is not always clear. To this end, the objectives of this research are to, 1)
identify the primary factors that influence fish passage decision-making including shifts in priority issues
and concerns over time, 2) identify agency stakeholders involved in the process and describe patterns in
agency engagement, and 3) assess how these factors may hinder or support efforts at integrative, basin-
scale hydropower planning. This information may be used to inform future relicensing decisions.

13
Methods
Document Analysis
One hallmark of the digital age is the increasing rate at which unstructured data is produced in
the form text documents, images, presentations, audio files, etc. This is no less true in hydropower
management. Given the complexity of the regulatory framework, increasing stakeholder participation,
and more stringent record keeping, the FERC hydropower process has generated copious documents
related to energy projects. These archived documents contain valuable information but require
extensive processing to become useful to decision-makers. Document analysis enables systematic
review of documents and interpretation to identify common patterns and emergent themes in the
context of agency relicensing decisions (Bowen, 2009; Krippendorff, 2018).
We used qualitative and quantitative document analysis techniques and applied them to FERC-
regulated dams on the Kennebec and Penobscot Rivers (Riffe et al., 2014; Table 1.1). This approach
allowed us to gain an understanding of fish passage issues specific to the study area while investigating
more generalizable themes (Creswell and Plano Clark, 2011). We systematically developed a database of
relevant fish passage and hydropower documents and assigned labels (“codes” hereafter) to denote
meaningful units of content. We evaluated emerging themes and patterns in the data. We then used
text frequencies to measure change in priority issues over time and to identify important process trends.
While documents are not necessarily complete records of events that have occurred (Bowen, 2009),
they provide unobtrusive and suitable material for systematically assessing the record of fish passage
decision-making, investigating stakeholder interactions, and identifying sources of discourse in
relicensing (Johnson et al., 2015).
Database Description and Document Discovery
Documents were obtained from the FERC eLibrary (https://ferc.gov/docs-filing/elibrary.asp), a
publicly available repository of project specific documents from 1989 to present day (FERC Documents &

14
Filing, 2011). These include licenses, settlements, safety reports, studies, orders, and all comments and
correspondences relating to specific projects. Fully electronic documents are available from 1995-
present, with previous years available on microfilm.
To isolate documents related specifically to the Kennebec and Penobscot River watersheds, we
performed docket searches that allowed us to access the entire recorded history for each project
(“docket” hereafter). We assessed differences in docket size and identified unique challenges and
participating stakeholder. As of December 31, 2017, this included 28,858 documents from 31 active
hydropower projects and 10 projects exempt from licensing (Figure 1.2) that comprised our initial
database. The database was further narrowed to include only documents referencing fish passage. Using
built-in search functionality, documents were identified and downloaded using “fish passage” as an exact
phrase search parameter. “Fish passage” is a term that In addition to “fish passage,” we explored other
terms (e.g., “fish”, “migration”, “fishway-“, “eelway-“, and “passage”). We found that “fish” and
“migration” led to results that were much broader than warranted (e.g., returned entries for all fish,
including those with no passage concerns), while “fishway-“ and “eelway-“ led to excessively narrow
results due to the specificity of the terms and were redundantly captured in the “fish passage” search.
“Passage” returned substantial results but included references to all types of passage (e.g., boat passage).
From this exercise, the parameter, “fish passage,” was deemed the most appropriate for our needs and
reduced the number of documents available for content analysis to 2,316 (Figure 1.2).

15
Figure 1.2. Fish passage document database. Selection process for compiling a fish passage database related to active hydropower projects in the Kennebec and Penobscot River watersheds in Maine. Documents were subsequently imported into NVivo software (QSR International Pty Ltd. Version 11 Plus, 2015) for further storage and content analysis.

16
Given the presence of the term “fish passage” in older documents, we assumed that the term
effectively captured most documents relating to the passage of fish through, past, or around
hydropower projects. We do acknowledge that this sample is not a complete record of all fish passage
documentation in our study area. Several limitations exist relating to restrictions in i) search capabilities,
ii) document quality, ii) document availability, iv) timing, and v) regulation changes. For example, the
search function relies on content being recognized as text. Most modern text files (e.g., .pdf, .txt, .doc,
etc.) were fully searchable while scanned image files (e.g., .jpg, .png, etc.) were not. Where possible,
image files were transformed into searchable documents using Optical Character Recognition software
(ABBYY FineReader 14, ABBYY North America, Milpitas, CA). Older documents of poor digital quality
were not recognized through text searches and some documents dated prior to the 1980s were not
available. Likewise, Critical Energy Infrastructure Information (CEII) could not be accessed without
special clearance through the Freedom of Information Act. Finally, record keeping requirements have
developed to be more extensive over time, leading to a prevalence of newer documents in proportion to
older documents. Regardless of these limitations, it was ultimately concluded (in consultation with a
representative from FERC) that most pertinent documents would be found using our search method. In
this manner, a final fish passage archive was created, consisting of text-searchable documents (n =
2,188; Figure 1.2).
General themes for individual projects were initially generated from the database using the auto
coding feature in the computer assisted qualitative data analysis software, NVivo (QSR International Pty
Ltd. Version 11 Plus, 2015). This gave us a preliminary view of broad subject matter based on word
frequencies and allowed us to make general comparisons among projects. In addition to the fish passage
database, separate searches were performed for each project to isolate process-specific documents that
were mandatory and/or highly common in relicensing irrespective of whether they addressed fish
passage (e.g., pre-application documents, study plans and reports, Biological Opinions, mandatory
17
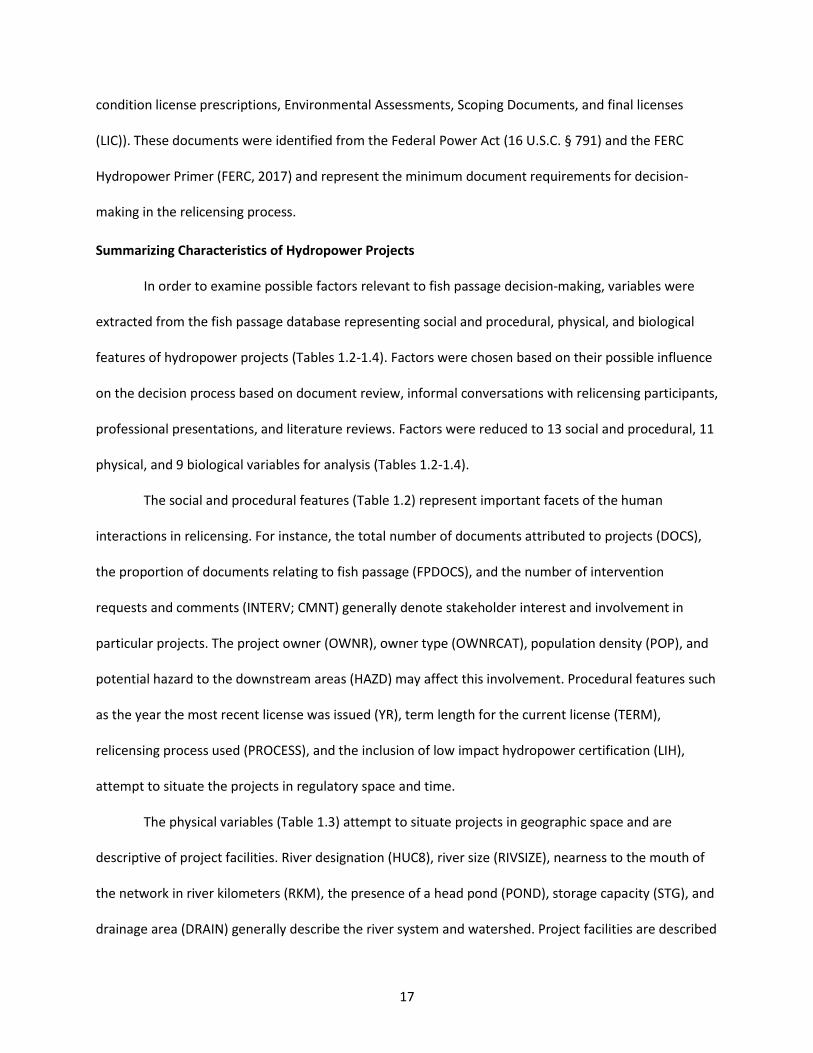
condition license prescriptions, Environmental Assessments, Scoping Documents, and final licenses
(LIC)). These documents were identified from the Federal Power Act (16 U.S.C. § 791) and the FERC
Hydropower Primer (FERC, 2017) and represent the minimum document requirements for decision-
making in the relicensing process.
Summarizing Characteristics of Hydropower Projects
In order to examine possible factors relevant to fish passage decision-making, variables were
extracted from the fish passage database representing social and procedural, physical, and biological
features of hydropower projects (Tables 1.2-1.4). Factors were chosen based on their possible influence
on the decision process based on document review, informal conversations with relicensing participants,
professional presentations, and literature reviews. Factors were reduced to 13 social and procedural, 11
physical, and 9 biological variables for analysis (Tables 1.2-1.4).
The social and procedural features (Table 1.2) represent important facets of the human
interactions in relicensing. For instance, the total number of documents attributed to projects (DOCS),
the proportion of documents relating to fish passage (FPDOCS), and the number of intervention
requests and comments (INTERV; CMNT) generally denote stakeholder interest and involvement in
particular projects. The project owner (OWNR), owner type (OWNRCAT), population density (POP), and
potential hazard to the downstream areas (HAZD) may affect this involvement. Procedural features such
as the year the most recent license was issued (YR), term length for the current license (TERM),
relicensing process used (PROCESS), and the inclusion of low impact hydropower certification (LIH),
attempt to situate the projects in regulatory space and time.
The physical variables (Table 1.3) attempt to situate projects in geographic space and are
descriptive of project facilities. River designation (HUC8), river size (RIVSIZE), nearness to the mouth of
the network in river kilometers (RKM), the presence of a head pond (POND), storage capacity (STG), and
drainage area (DRAIN) generally describe the river system and watershed. Project facilities are described

18
by the number of dams associated with each project (DAMCT), their authorized hydropower capacity
(AUTH), dam height (HT), flow regime (FLOW; run-of-river, storage, combination), and primary function
(PURPOSE; hydropower, flood control, water supply, other). Unless otherwise noted, metrics for multi-
dam projects were averaged, representing the average condition for the entire dam complex.
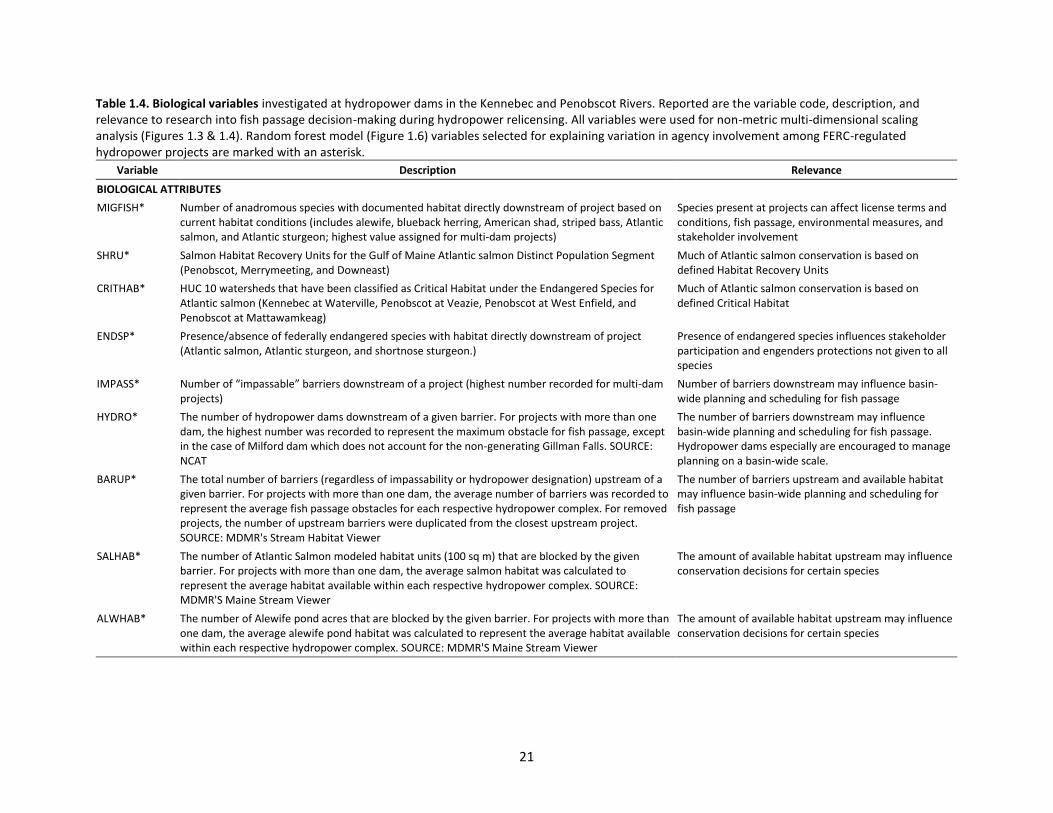
Biological variables (Table 1.4) generally relate to the presence of migratory fish (MIGFISH) and
federally endangered species (ENDSP). Specifically, they assess whether projects occupy one of three
Salmon Habitat Recover Units (SHRU; Penobscot, Merrymeeting, and Downeast) and salmon critical
habitat (CRITHAB). They also include the number of hydropower and impassable barriers downstream
(HYDRO; IMPASS), the total number of barriers upstream (BARUP), and the amount of blocked upstream
salmon and alewife habitat (SALHAB; ALWHAB). These features are important considerations for
management concerns and stakeholder involvement.

19
Table 1.2. Social and procedural variables investigated at hydropower dams in the Kennebec and Penobscot Rivers. Reported are the variable code, description, and relevance to research into fish passage decision-making during hydropower relicensing. All variables were used for non-metric multi-dimensional scaling analysis (Figures 1.3 & 1.4). Random forest model (Figure 1.6) variables selected for explaining variation in agency involvement among FERC-regulated hydropower projects are marked with an asterisk.
Variable Description Relevance
SOCIAL AND PROCEDURAL ATTRIBUTES
OWNR Parent company of licensee (wholly owned subsidiaries are assumed to be under the direct control of the parent company)
Represents the highest functional level of ownership at which decisions get made
OWNRCAT* Ownership category of the parent company, representing government, municipal, private, NGO, and individuals
Different types of owners may exhibit different management styles, problem solving, resource allocation, etc.
INTERV Number of intervention requests by in project docket Intervenors may influence decision-making
CMNT Number of comments in project docket Comments may influence relicensing and indicate desirable of outcomes
STKPART Summation of comments and intervention requests in project docket Measure of stakeholder participation that may indicate active involvement in relicensing and shed light on objectives and concerns
POP Population in 10km radius around dam as given by FreeMapTools.com which uses 2010 Census Data and crosschecked with Circular Area Profile (average taken for multi-project dams)
May impact community and agency involvement, resources availability, and concern for relicensing proceedings
DOCKET Number of documents included in project docket as of 12/31/2017 May indicate which projects receive the most stakeholder attention, controversy, impact, etc.
FPDOCS Proportion of documents relating specifically to fish passage as of 12/31/2017 through a general search of "fish passage" in the FERC eLibrary
May indicate which projects observe more challenges relating to, and concern for, fish passage
HAZD* Potential hazard to the downstream area resulting from failure or mis-operation of the dam (low, significant, and high; highest hazard potential listed for multi-dam projects)
Potential hazard may influence emergency action plans and prioritize safety in relicensing
YR* Year of the most recent license was issued Contributes to timeline and situates projects in regulatory space
TERM* License term given in most recent license (generally 30, 40, or 50 years, but may be adjusted for basin management)
Meant to offset uncertainty and investment expected from licensee as part of the licensing process (default: 40 years as of 2018)
PROCESS* Process used in most recent relicensing effort (TLP, ALP, or ILP) The licensing process can indicate the level of coordination and engagement expected of stakeholders.
LIH* Low impact hydro certification as determined by the Low Impact Hydro Institute Certification may correlate with environmental measures and stakeholder involvement

20
Table 1.3. Physical variables investigated at hydropower dams in the Kennebec and Penobscot Rivers. Reported are the variable code, description, and relevance to research into fish passage decision-making during hydropower relicensing. All variables were used for non-metric multi-dimensional scaling analysis (Figures 1.3 & 1.4). Random forest model (Figure 1.6) variables selected for explaining variation in agency involvement among FERC-regulated hydropower projects are marked with an asterisk.
Variable Description Relevance
PHYSICAL ATTRIBUTES
HUC8* River designation based on Hydrologic Unit Code from the USGS, includes the LowerKen, Piscataquis, Dead, LowerPen, WestBranchPen, and Sebec Rivers
River designation factors into regional participation and basin management
RIVSIZE* River size class based on NE Aquatic Habitat Classification, including small rivers, medium tributary rivers, medium mainstem rivers, and large rivers
River size may factor into regional participation, basin management, and environmental concerns
POND* Presense/absence of pond within 30 m of the dam. Projects with more than one dam were given the designation of "present" if at least one dam had an associated pond.
Presence of impoundment important to
RKM* Distance from dam to the network mouth in kilometers. For multi-dam projects, the lowest number was recorded to represent the most seaward dam in the complex.
The distinction of where a project is located can impact management, what types of fish occupy project waters, stakeholder engagement, and recreational use
DAMCT* Number of dams associated with each project, ranging from 1-9 May have implications for the coordination of mngt among dams, regions, waterbodies, and stakeholders
AUTH* Authorized hydropower capacity in gigawatts under current license (not a measure of "actual" generation)
Generation capacity may relate to the size and impact of a project and may determine stakeholder engagement and conservation efforts
PURPOSE* Primary purpose of project given by the USACE National Inventory of Dams database, including hydropower, water supply, flood control, and fish/wildlife
Poses different challenges relating to water use, inundation, habitat, recreation, priority of resources, and relicensing objectives
FLOW* Mode-of-operation (run of river, storage, or combination) Flow regimes may relate to specific impacts to fish and wildlife habitat above and below the project
HT* Height of the dam, defined as the vertical distance between the streambed and crest of the dam (average taken for multi-dam projects)
Height corresponds to dam size and may influence regulatory concern, project impacts, recreation, and stakeholder input
STG* Normal storage, defined as the total storage space in a reservoir below the normal retention level (average taken for multi-dam projects)
Impoundment size may relate to project impacts, recreation, and licensing objectives
DRAIN* Drainage area above a project (average taken for multi-dam projects) Area above projects may relate available wildlife habitat, recreation, passage concerns, and stakeholder input
21
Table 1.4. Biological variables investigated at hydropower dams in the Kennebec and Penobscot Rivers. Reported are the variable code, description, and relevance to research into fish passage decision-making during hydropower relicensing. All variables were used for non-metric multi-dimensional scaling analysis (Figures 1.3 & 1.4). Random forest model (Figure 1.6) variables selected for explaining variation in agency involvement among FERC-regulated hydropower projects are marked with an asterisk.
Variable Description Relevance
BIOLOGICAL ATTRIBUTES
MIGFISH* Number of anadromous species with documented habitat directly downstream of project based on current habitat conditions (includes alewife, blueback herring, American shad, striped bass, Atlantic salmon, and Atlantic sturgeon; highest value assigned for multi-dam projects)
Species present at projects can affect license terms and conditions, fish passage, environmental measures, and stakeholder involvement
SHRU* Salmon Habitat Recovery Units for the Gulf of Maine Atlantic salmon Distinct Population Segment (Penobscot, Merrymeeting, and Downeast)
Much of Atlantic salmon conservation is based on defined Habitat Recovery Units
CRITHAB* HUC 10 watersheds that have been classified as Critical Habitat under the Endangered Species for Atlantic salmon (Kennebec at Waterville, Penobscot at Veazie, Penobscot at West Enfield, and Penobscot at Mattawamkeag)
Much of Atlantic salmon conservation is based on defined Critical Habitat
ENDSP* Presence/absence of federally endangered species with habitat directly downstream of project (Atlantic salmon, Atlantic sturgeon, and shortnose sturgeon.)
Presence of endangered species influences stakeholder participation and engenders protections not given to all species
IMPASS* Number of “impassable” barriers downstream of a project (highest number recorded for multi-dam projects)
Number of barriers downstream may influence basin-wide planning and scheduling for fish passage
HYDRO* The number of hydropower dams downstream of a given barrier. For projects with more than one dam, the highest number was recorded to represent the maximum obstacle for fish passage, except in the case of Milford dam which does not account for the non-generating Gillman Falls. SOURCE: NCAT
The number of barriers downstream may influence basin-wide planning and scheduling for fish passage. Hydropower dams especially are encouraged to manage planning on a basin-wide scale.
BARUP* The total number of barriers (regardless of impassability or hydropower designation) upstream of a given barrier. For projects with more than one dam, the average number of barriers was recorded to represent the average fish passage obstacles for each respective hydropower complex. For removed projects, the number of upstream barriers were duplicated from the closest upstream project. SOURCE: MDMR's Stream Habitat Viewer
The number of barriers upstream and available habitat may influence basin-wide planning and scheduling for fish passage
SALHAB* The number of Atlantic Salmon modeled habitat units (100 sq m) that are blocked by the given barrier. For projects with more than one dam, the average salmon habitat was calculated to represent the average habitat available within each respective hydropower complex. SOURCE: MDMR'S Maine Stream Viewer
The amount of available habitat upstream may influence conservation decisions for certain species
ALWHAB* The number of Alewife pond acres that are blocked by the given barrier. For projects with more than one dam, the average alewife pond habitat was calculated to represent the average habitat available within each respective hydropower complex. SOURCE: MDMR'S Maine Stream Viewer
The amount of available habitat upstream may influence conservation decisions for certain species
22
Summarizing Project Outcomes
Because final licenses ultimately represent the culmination of each relicensing process, we
focused on characteristics that could be mined directly from the text of each license. Licenses represent
a direct response to prior decision-making in the system. For this reason, we did not consider
amendments made after licensing, additional arbitration, or the subsequent evaluation of licensing
compliance. This allowed us to investigate concepts related to fish passage decisions such as i) fish
management, ii) stakeholder engagement, and iii) basin-scale planning. Term frequency searches were
performed using NVivo software (QSR International Pty Ltd. Version 11 Plus, 2015). Unless indicated by
closed quotation marks, all searches were inclusive of stemmed words and used Boolean functions to
add search parameters. The license for the Great Works project was not available and therefore was not
included in the analysis. The search parameter (SP) for a term, number of licenses containing the term,
average term frequency, SD, and maximum term frequency are reported (Table 1.5).

23
Table 1.5. License term frequency. Text searches of hydropower licenses examining species of concern, fish passage including mitigative measures, basin management, and stakeholder participation including the invocation of licensing authorities. Searches were performed using NVivo software (QSR International Pty Ltd. Version 11 Plus, 2015). Unless indicated by closed quotation marks, all searches were inclusive of stemmed words and used Boolean functions to add search parameters. Average term frequency, SD, number of licenses containing the term, and maximum term freqrequency are reported.
Category Code Variable description and search parameter (SP) Average term frequency
Species of concern
EEL American eel (SP: eel) 16.8 ± 33.5 (11 projects; max 140)
SHAD American shad (SP: shad) 3.4 ± 7.0 (10 projects; max 31)
ALW River herring (SP: alewife) 1.7 ± 3.5 (7 project; max 16)
SALM Atlantic salmon (SP: salmon) 16.8 ± 24.5 (24 project; max 98)
Mitigation FPUP Upstream fish passage (SP: “upstream fish” OR “upstream passage”) 5.6 ± 11.1 (17 project; max 47)
FPDN Downstream fish passage (SP: “downstream fish” OR “downstream passage”) 10.3 ± 19.3 (17 project; max 95)
FPALL Total fish passage calculated as a sum of up and downstream passage 15.9 ± 29.8 (17 project; max 142)
STOCK Stocking effort (SP: stock) 3.2 ± 4.3 (15 project; max 15)
FUND Mitigation funding (SP: fund) 5.6 ± 8.3 (18 project; max 31)
SETTLE Settlement agreement (SP: settlement OR agreement) 11.7 ± 25.6 (9 project; max 95)
Entities USFWS U.S. Fish and Wildlife Service (SP: “fish and wildlife service” OR USFWS OR FWS) 14.8 ± 11.6 (26 project; max 37)
NOAA NOAA Fisheries (SP: “oceanic and atmospheric” OR NOAA OR “marine fisheries service” OR NMFS) 5.4 ± 11.1 (19 project; max 59)
MDEP Maine Dept. of Environmental Protection (SP: “department of environmental protection” OR MDEP OR DEP) 8.2 ± 5.3 (29 project; max 20)
MDIFW Maine Dept. of Inland Fisheries and Wildlife (SP: "inland fisheries and wildlife" OR MDIFW OR MIFW OR IFW) 9.8 ± 7.5 (27 project; max 33)
MDMR Maine Dept. of Marine Resources (SP: "department of marine resources" OR MDMR OR DMR) 7.4 ± 13.0 (15 project; max 62)
PIN Penobscot Indian Nation (SP: "Penobscot Indian Nation" OR "the Nation" OR PIN) 13.1 ± 30.0 (17 project; max 115)
Regulatory statutes
WQC Under CWA section 401, states must certify that the project will comply with applicable water quality standards (SP: “water quality certification”)
8.7 ± 5.7 (24 project; max 20)
SEC18 Under FPA section 18, fishway prescriptions can be administered by USFWS and NOAA Fisheries (SP: “fishway prescription” OR “section 18” OR “sec 18”)
4.1 ± 6.0 (23 project; max 34)
10J Under FPA section 10(j), licenses are required to “adequately and equitably protect, mitigate damages to, and enhance fish and wildlife...” (SP: “10(j)”)
5.8 ± 5.7 (21 project; max 28)
10A Under FPA section 10(a)(1-2), projects must serve the public interest in the river basin and consider recognized comprehensive plans (SP: “10(a)”)
2.3 ± 1.8 (18 project; max 5)
ESA Under ESA section 7(a)(1), FERC must protect and contribute to the recovery of all threatened and federally endangered species affected by projects (SP: “endangered species”)
2.2 ± 2.0 (18 project; max 9)
CZM Under Coastal Zone Management Act section 307, projects must be consistent with coastal zone management programs (SD: “coastal zone”)
0.7 ± 1.9 (5 project; max 9)
Complexity BASIN Management complexity index calculated from references to other projects within each license 0.43 ± 0.39 (range 0-1.6)
24
First, we investigated fish management by searching for specific terms in final licenses related to
fish species and mitigation measures. We explored searches for any species that might have occupied
project waters. Species of concern were identified as those mentioned more than once, and in more
than one license. Species of concern included American eel, Atlantic salmon, American shad, and river
herring (Table 1.5). Mitigation measures that were investigated included upstream and downstream fish
passage, conservation funding, fish stocking, and settlements (Table 1.5). We did not include searches
for specific types of fish passage as they are not consistently referenced in final project licenses.
Stakeholder engagement was assessed by searching license text for references to known
process participants and their mandated authorities. We assumed that active stakeholders would be
mentioned in the license text more often than inactive stakeholders, due to mandatory and traditional
standards for reporting intervenors, commenters, and negotiation participants Identified stakeholders
included federal resource agencies (NOAA and USFWS) and state resource agencies (MDEP, MDIFW, and
MDMR) (Table 1.5). Licensing authorities included WQC (administered by MDEP; CWA, section 401), fish
passage prescriptions (NOAA and USFWS; FPA, section 18), and Endangered Species Act consultation
(NOAA and USFWS). Statutes requiring interagency collaboration and shared administration included
comprehensive planning considerations (FPA, section 10(a)), the Protection of Fish and Wildlife (FPA,
section 10(j)), and Coastal Zone Management (CZMA, section 307).
Finally, management complexity was assessed by searching individual licenses for references to
projects besides their own. The assumption was made that projects that were co-managed would
reference each other frequently. A management complexity index was calculated for each project based
on the number of times co-managed projects were referenced in the project license (Table 1.5). This was
done by calculating the ratio of co-managed references in relation to the number of self-references in
each license where i is the first dam interaction and n is the total number of dam interactions.

25
𝑚𝑎𝑛𝑎𝑔𝑒𝑚𝑒𝑛𝑡 𝑐𝑜𝑚𝑝𝑙𝑒𝑥𝑖𝑡𝑦 = ∑𝑐𝑜 𝑚𝑎𝑛𝑎𝑔𝑒𝑑
𝑠𝑒𝑙𝑓 𝑟𝑒𝑓𝑒𝑟𝑒𝑛𝑐𝑒
𝑛
𝑖=1
For example, a project that referenced itself 10 times and referenced another project 5-times
would have a ratio of 5/10, or 0.5 for that interaction. This allowed us to normalize values among
projects that were naturally text light or heavy, and those that did not frequently reference any projects,
including their own. These values were then summed to create the index. Higher scores represent
higher levels of basin-scale planning.
Assessing Project Variation and Predictive Factors
In order to infer relationship patterns among projects we used a combination of non-metric
multidimensional scaling (NMDS) and random forest modeling. NMDS was used to graphically represent
similarities among projects in two-dimensional space (McCune et al., 2002). NMDS is an ordination
technique that assesses pairwise distance information between variables based on a rank order of
(dis)similarities (Borg and Groenen, 1997). Distances are plotted into two-dimensional space using
principal component analysis rotation so that the x-axis (NMDS 1) reflects the primary sources of
variation in the data, followed by the y-axis (NMDS 2; Oksanen et al., 2019). We used the metaMDS
routine in package vegan (Oksanen et al., 2019) in program R 3.6.1 (R Core Team, 2019). Ordinations
were based on Euclidean distance and the maximum number of random starts in the search for a stable
solution was increased from 20 (default) to 500. Three projects were excluded from analysis due to
incomplete data for all variables. These were Great Works and Veazie which were removed in 2012 and
2013 and Howland which was decommissioned.
NMDS was used to visualize the level of similarity among projects given their social (n = 13),
physical (n = 11), and biological (n = 9) characteristics (Tables 1.2-1.4, respectively). Polygons were used
to visualize groupings of projects by their location on the river in kilometers (RKM). This was categorized
based on histogram groupings with three bins: i) coastal projects (n = 46.24 – 131.97 RKM), ii) midway

26
projects (n = 131.97 – 217.7 RKM), and iii) inland projects (217.7 – 303.43 RKM). This was followed by a
second NMDS to assess relationship patterns based on final project outcomes (i.e., official licenses).
Specifically, license term frequencies (n = 23; Table 1.5) were used to characterize similarities among
projects. Polygons were used to visualize groupings of projects by the year licenses were issued.
Finally, a random forest model was used to describe the relative importance of a subset of the
social, biological, and physical factors (Tables 1.2-1.4, respectively) on fish passage concern. A reduced
number of project characteristics were used in order to comply with the model conventions (i.e., the
number of variables could not exceed the number of projects). Variables that were removed showed
low diagnostic power in relation to the first NMDS. We conceptualized our response variable (fish
passage concern) as the ratio of fish passage related documents to the total number of documents for a
project. We assumed that projects with a relatively high proportion of fish passage related documents
would equate to relatively high concern for fish passage.
Random forest is a type decision tree classification algorithm that splits data based on variable
characteristics. It computes many decision trees and outputs the mean prediction of the combined
trees. It can accommodate different types of data without rescaling (e.g., binary, categorical, numeric,
etc.), handles unbalanced data well, and exhibits low bias while estimating variable importance
(Breiman, 2001). We used package randomForest (Liaw and Wiener, 2002) in program R version 3.6.1 (R
Core Team, 2019). We used default parameters for the model but increased the number of decision
trees from 500 to 4000 and reduced the number of randomly sampled variables for candidates at each
split from 6 to 4. Variable importance was assessed using the importance function in randomForest. This
function assumes that variables attributed to relatively high increases in node purity, equate to
relatively high importance in predicting fish passage concern. We note that “importance” is not
statistically equivalent to mean effect size. For this reason, variables could have a larger impact on fish

27
passage concern despite low relative importance, and vice versa (Honsey et al., 2018). Great Works,
Veazie, and Howland were excluded from this analysis.
Results
Project Characteristics and Outcomes
The overall number of documents in each project docket ranged from 174 - 2355 (mean 915.1 ±
428.5; Table 1.1). In general, older licenses were shorter in length and less comprehensive than newer
licenses. For example, the Brassau license (1977) consisted of 19 pages of text and 9,050 words while
the American Tissue license (2019) consisted of 114 pages and 30,800 words, representing a 340%
difference in word count. Licenses from the 1970-80s primarily addressed the need for power, economic
feasibility, and human benefits. Documents referencing fish passage accounted for 9.3% of each
project’s docket, however, these ranged greatly from 0.5 to 25.2% (Table 1.1).
Fish Management
Among the species of concern identified in project licenses, American eel was the most
frequently mentioned species occurring in 11 licenses a maximum number of 140 times in a single
license (16.8 ± 34.2; Table 1.5). Atlantic salmon were the second most frequently mentioned fish species
occurring in 24 licenses (16.8 ± 25.0; max 98). Both Atlantic salmon and American eel exhibited an
increase in priority over time, as measured by text frequency, with American eel exhibiting a sharp
increase after the 1990s (Figure 1.3A). River herring and American shad did not experience a similar
trend and term frequency remained low. American shad were mentioned in 10 licenses (3.4 ± 7.1; max
31) and river herring in 7 licenses (1.7 ± 3.5; max 16; Table 1.5).

28
Figure 1.3. Term frequency values by year. A) Fish species, B) fish passage mitigation, C) resource and regulatory agencies, and D) statutes mentioned in project licenses as reported by term frequency searches (Table 1.5) and arranged by the year of license issuance.
A) B)
C) D)

29
We found an increase in fish passage language within project licenses over time (Figure 1.3B).
The term “fish passage” was referenced in 17 licenses with downstream passage being mentioned more
frequently than upstream passage (5.6 ± 11.1; max 47 vs. 10.3 ± 19.3; max 95; Table 1.5). In general,
projects closer to the mouth of the watershed (coastal projects) tended to reference fish passage more
often than those further inland (inland projects; Figure 1.5). Several inland projects made no mention of
passage beyond legal language reserving the right of NOAA and USFWS to prescribe fish passage in the
future under section 18 of the FPA. It may be noted that this is common language, often referred to as
“boilerplate” in contract law, describing contract parts that are considered standard.
In addition to fish passage, conservation funding was referenced in 18 licenses, a maximum of
31 times in a single license (5.6 ± 8.3). Fish stocking was mentioned in 15 licenses (3.2 ± 4.3; max 15).
Conservation funding and fish stocking did not increase with time and were prominent features of older
licenses (Figure 1.3B). Settlement agreements were mentioned in 9 licenses (11.7 ± 25.6; max 95; Table
1.5) and were largely absent from project licenses prior to 2005.
Stakeholder Engagement
USFWS was the most frequently and consistently referenced resource agency in project licenses.
They were mentioned in 26 licenses, a maximum of 37 times in a single license (14.8 ± 11.6; Figure 1.3c).
MDIFW and MDEP were also referenced relatively frequently, in 27 (9.8 ± 7.5; max 33) and 29 licenses
(8.2 ± 5.3; max 20), respectively (Table 1.5). MDMR was mentioned in 15 licenses (7.4 ± 13.0; max 62)
followed by NOAA in 19 licenses (5.4 ± 11.1; max 59). Overall, there was a slight increase in agency
references over time.
Licenses issued after the 1990s saw an increase in term frequency of regulatory statutes (Figure
1.3D). WQC, administered by MDEP under the CWA was referenced most frequently and occurred in 24
licenses (8.7 ± 5.7; max 20; Table 1.5). Fish passage prescriptions under section 18 of the FPA were
referenced in 23 licenses (4.1 ± 6.0; max 34), followed by section 10(j) of the FPA in 21 licenses (5.8 ±

30
5.7; max 28; Table 1.5). Section 10(a) of the FPA, while referenced in 18 licenses, was only referenced a
maximum of 5 times in a single license (2.3 ± 1.8). Similarly, while the term “endangered species” was
mentioned in 18 licenses, it appeared with relatively low frequency (2.2 ± 2.0; max 9). Coastal Zone
Management was the most infrequently referenced regulatory statute in only four licenses (0.7 ± 1.9;
max 9; Table 1.5).
Basin-Scale Hydropower Planning
The number and magnitude of projects referenced within a single license, led to the calculation
of a management complexity index. Values ranged from 0 (no basin-scale coordination) to 1.6,
(indicating relatively high coordination among projects). Overall, projects did not display a high degree
of basin-scale coordination (median = 0.28; Table 1.5). Several projects did not reference any projects
besides their own. These included Howland (1980), Shawmut (1981), Lowell Tannery (1983), Benton
Falls (1984), and American Tissue (2019); Figure 1.1). Several projects were clearly co-managed in pairs
(e.g., Abenaki and Anson (2003); Automatic and Messalonskee (1999); and Penobscot Mills and
Ripogenus (1996)) which frequently referenced each other (management complexity index range = 0.2 -
1.2). Over half of the projects (58%) referenced fewer than three others.
Variation and Predictive Factors
We obtained stable, 2-dimensional NMDS ordinations (Figure 1.4) for the 33 social, physical, and
biological factors (final stress = 0.10) indicating that the data were adequately described by the chosen
number of axes (Clarke, 1993). Arrows were applied to indicate diagnostic power with longer arrows
being associated with variables that hold relatively high influence. The x-axis ordinated along a coastal
to inland gradient (Figure 1.4). Negative values along the axis were more closely associated with large
areas of blocked alewife habitat (ALWHAB), a higher number of sea-run fish (MIGFISH), the presence of
federally endangered species (ENDSP), more densely populated areas (POP), and Low Impact
Hydropower Certification (LIH; Figure 1.4). Positive values were more closely associated with higher
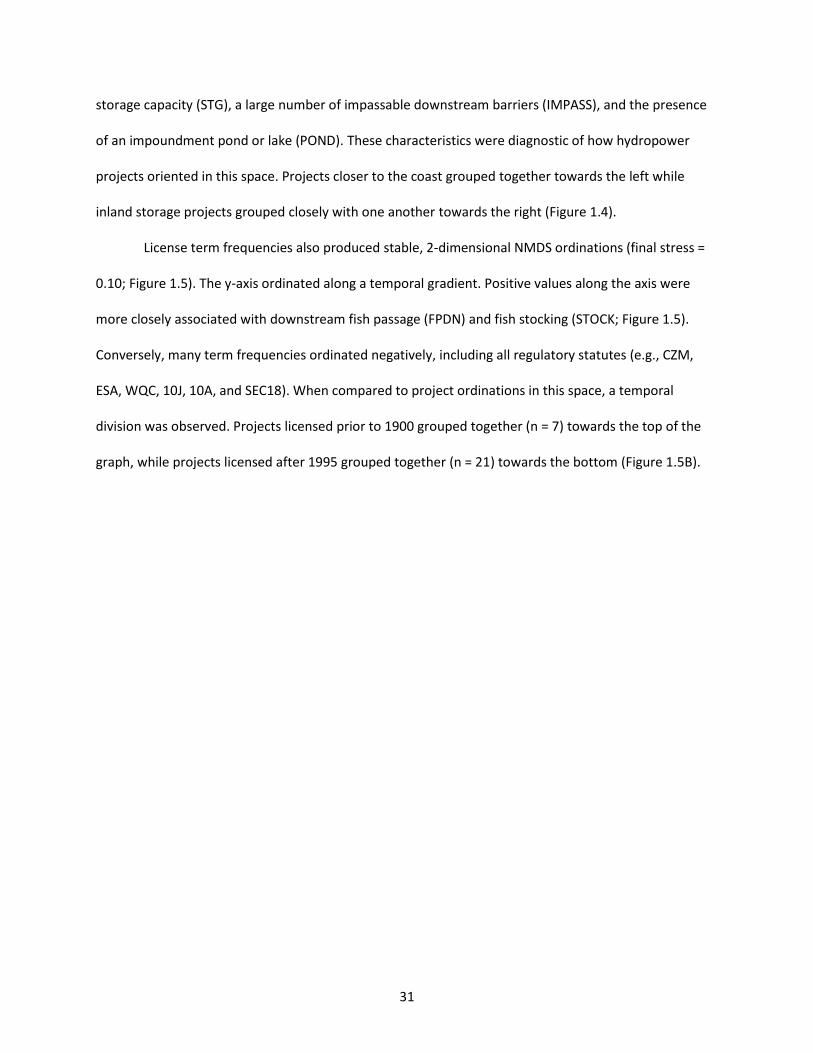
31
storage capacity (STG), a large number of impassable downstream barriers (IMPASS), and the presence
of an impoundment pond or lake (POND). These characteristics were diagnostic of how hydropower
projects oriented in this space. Projects closer to the coast grouped together towards the left while
inland storage projects grouped closely with one another towards the right (Figure 1.4).
License term frequencies also produced stable, 2-dimensional NMDS ordinations (final stress =
0.10; Figure 1.5). The y-axis ordinated along a temporal gradient. Positive values along the axis were
more closely associated with downstream fish passage (FPDN) and fish stocking (STOCK; Figure 1.5).
Conversely, many term frequencies ordinated negatively, including all regulatory statutes (e.g., CZM,
ESA, WQC, 10J, 10A, and SEC18). When compared to project ordinations in this space, a temporal
division was observed. Projects licensed prior to 1900 grouped together (n = 7) towards the top of the
graph, while projects licensed after 1995 grouped together (n = 21) towards the bottom (Figure 1.5B).
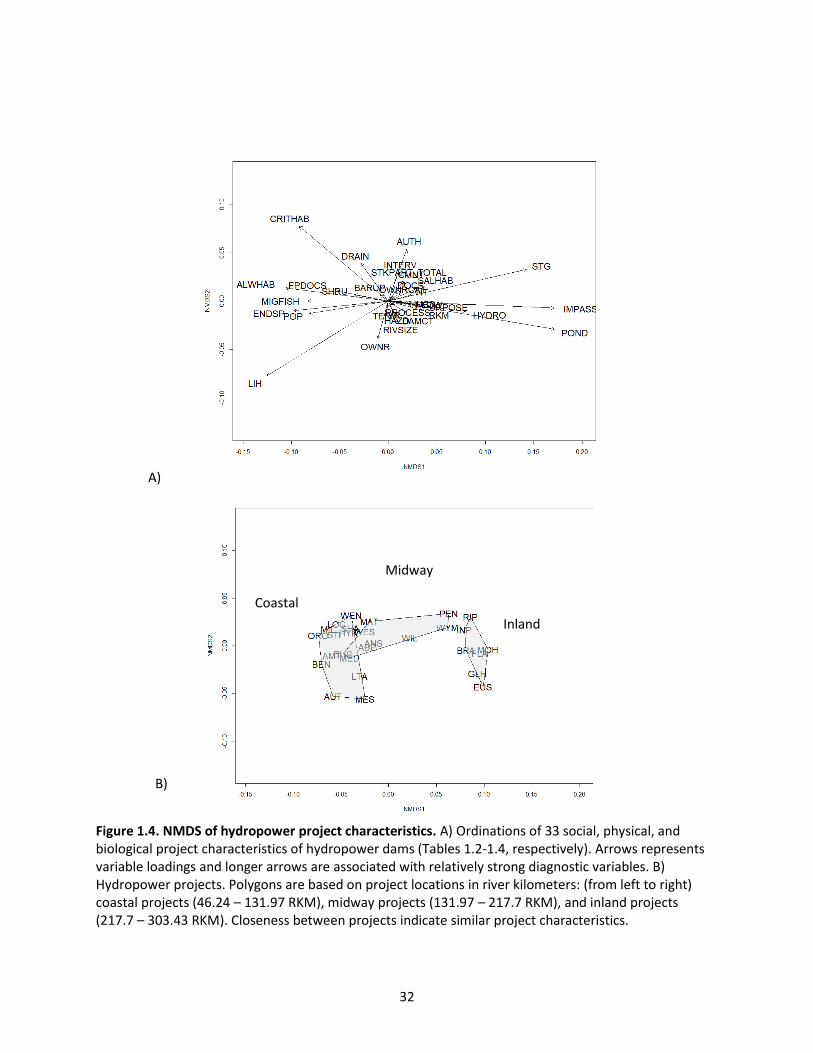
32
Figure 1.4. NMDS of hydropower project characteristics. A) Ordinations of 33 social, physical, and biological project characteristics of hydropower dams (Tables 1.2-1.4, respectively). Arrows represents variable loadings and longer arrows are associated with relatively strong diagnostic variables. B) Hydropower projects. Polygons are based on project locations in river kilometers: (from left to right) coastal projects (46.24 – 131.97 RKM), midway projects (131.97 – 217.7 RKM), and inland projects (217.7 – 303.43 RKM). Closeness between projects indicate similar project characteristics.
A)
B)
Coastal
Midway
Inland

33
Figure 1.5. NMDS of license term frequencies. A) Ordinations of term frequencies in hydropower licenses (Tables 1.5). Arrows represents variable loadings and longer arrows are associated with relatively strong diagnostic variables. B) Hydropower projects. Polygons are based on the year of license issuance. Closeness between projects indicate similar project characteristics.
A)
B)
Licensed prior to 1990
Licensed after 1990
34
Random forest modeling was used to describe the relative importance of project characteristics
(Tables 1.2-1.4) for explaining variation in fish passage concern, represented by the proportion of fish
passage related documents for each project. Our model explained 51% of the variation in fish passage
documents. Node purity (measured by the residual sum of squares) from splitting on a given variable
was averaged over all decision trees. Variables that were attributed to a relatively high increase in node
purity overall, were ranked relatively important in predicting fish passage concern (Figure 1.6). Variables
of high importance were the number of hydropower projects downstream (HYDRO), a large amount of
blocked alewife habitat (ALWHAB), the presence of a large impoundment (POND), and the number of
sea-run fish in the project area (MIGFISH; Figure 1.6). Variables of moderate importance were
placement on the river (RKM), the size of the river drainage above a project (DRAIN), population density
(POP), and the storage capacity of the project (STG; Figure 1.6). The remaining factors had relatively low
predicted impacts on fish passage concern.
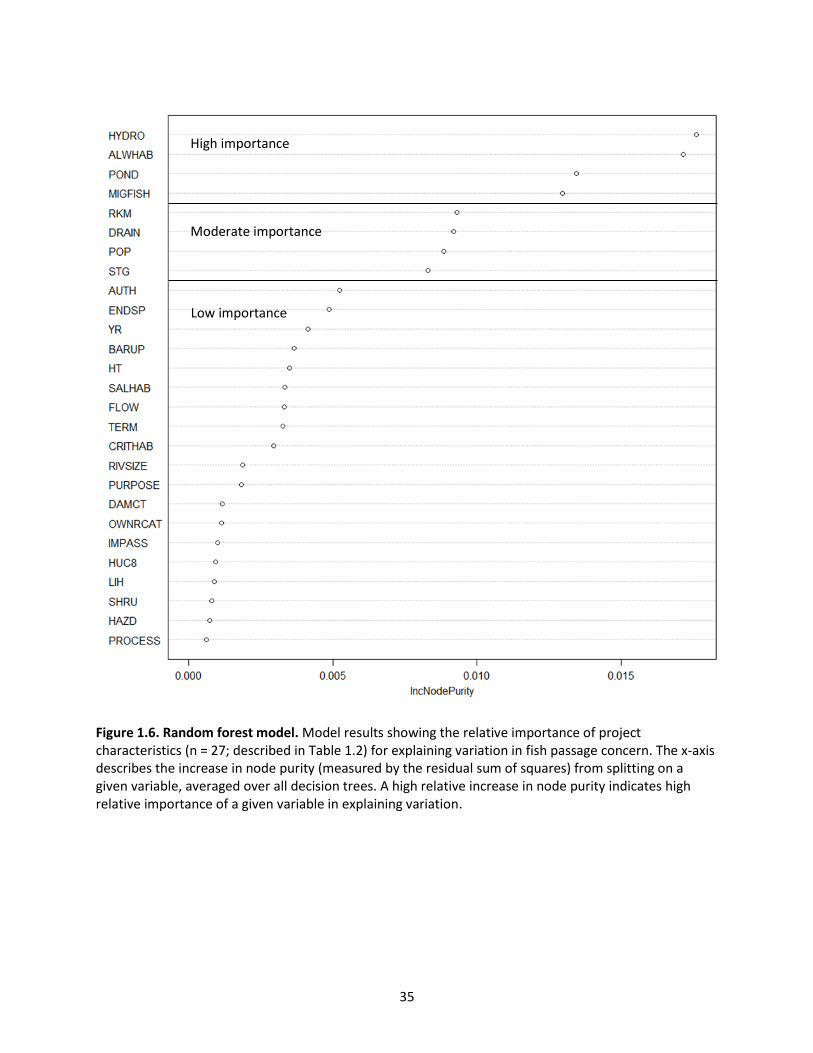
35
Figure 1.6. Random forest model. Model results showing the relative importance of project characteristics (n = 27; described in Table 1.2) for explaining variation in fish passage concern. The x-axis describes the increase in node purity (measured by the residual sum of squares) from splitting on a given variable, averaged over all decision trees. A high relative increase in node purity indicates high relative importance of a given variable in explaining variation.
High importance
Moderate importance
Low importance

36
Discussion
Temporal Trends
One major trend that emerged in our analysis of relicensing documents was a temporal “break”
in relicensing patterns. Besides older licenses being shorter and less comprehensive than newer licenses,
they exhibited lower levels of fish management, stakeholder engagement, and basin-scale planning prior
to the 1990s (Table 1.1 & Figure 1.3). While licenses during this time period did typically include sections
on recreation, cultural impacts, water quality, and environmental impacts, these were generally limited
in scope. After the 1990s however, references to the conservation of certain fish species became
apparent.
Atlantic salmon grew in importance for many projects in the Kennebec and Penobscot Rivers
(Figure 1.3). This increase in focus can be partially attributed to the listing of the GOM DPS of Atlantic
salmon in 2000 under the ESA though this did not include the Kennebec and Penobscot until 2009. The
listing prompted projects in salmon Critical Habitat to develop plans for passage improvements (NOAA &
USFWS, 2005) and granted protections for Atlantic salmon that are not shared by other species. Besides
the stronger regulatory framework, Atlantic salmon are a generally “likable” species due to their high
economic and cultural value. They elicit strong emotions and are popular, charismatic representatives
for restoration and conservation goals (Kochalsi et al., 2018). This is demonstrated by active
conservation campaigns for Atlantic salmon and their Pacific cousins (e.g., nativefishcoalition.org;
wildsalmon.org; standforsalmon.org) and by numerous special interest groups dedicated to salmon
recovery (e.g., Maine Rivers, Downeast Salmon Federation, Project SHARE, etc.). Fish passage measures
are most often developed with Atlantic salmon passage in mind (Williams, 2012) and they receive
substantial funding from public and private sources for their conservation (e.g., national hatchery
support, state and federal agency support, NGO initiatives, etc.)
37
Similarly, American eel have grown as a species of concern at hydropower projects (Figure 1.3).
They were considered for ESA listing in 2007 and 2015, but populations were found to be stable (80 FR
60834). Maine is currently the only state, besides South Carolina, that allows juvenile eels (elvers) to be
caught, which supports a lucrative fishery (ASMFC, 2019). Despite reported population stability at low
levels, concerns exist over the long-term sustainability of the fishery, given harvest-related crashes in
European eel and Japanese eel populations. Moreover, upstream eel passage is generally more
straightforward and cheaper to install than other types of fishways (Jellyman and Arai, 2016), making
them logistically easier to address during relicensing.
Despite the presence of a variety of sea-run fish in the Kennebec and Penobscot Rivers (Houston
et al., 2007), we found that other species are rarely referenced in licenses (Table 1.5). Mentions of
American shad and river herring are consistently low over time in comparison to Atlantic salmon and
American eel (Figure 1.3). This may be due to a reduced priority of these fish by federal and state
agencies or the expectation that fish passage designed for Atlantic salmon will meet the needs of all
species. Other species, such as sea lamprey are not mentioned at all, though they contribute valuable
nutrients and habitat improvements to their environments (Weaver, 2016). Lack of attention to sea
lamprey in license negotiations may be attributed to their negative image due to their impacts in areas
they are not native to, and because they lack value as a commercial fishery. While it may not be a
priority to allow passage for all fish species, a case can be made that integrated river management
requires free movement of all fishery resources.
Irrespective of individual species, we found that overall references to fish passage increased in
licenses over time (Figure 1.3). Increased concern over Atlantic salmon and American eel and changes in
environmental regulations have made fish passage a priority concern for many resource agencies. Other
mitigative terms such as fish stocking and conservation funding did not increase. Settlement agreements
were largely absent from licenses prior to 2005 (Figure 1.3) and have only recently been embraced as a

38
collaborative tool for stakeholders to negotiate license terms and conditions prior to relicensing
proceedings. One limitation of tracking settlements in relation to the relicensing process, is that there is
often a disconnect among project expiration dates and settlements may be achieved outside of the
relicensing process. For example, the Lower Penobscot Settlement Agreement led to the removal of two
dams and fish passage improvements at several projects in the Penobscot River (Opperman et al., 2011).
Despite being highly influential, the agreement was not reflected in project licenses that were issued
prior to the settlement in 1998 (Figure 1.3).
A temporal shift in relicensing was especially apparent in terms of the level of stakeholder
engagement in relicensing decisions (Figure 1.3). Dam construction continued to increase in the 1970s
and 1980s largely in response to U.S. Congressional incentive programs for hydropower development.
However, despite the new legal framework and public concern for the environment in the 1980s, many
regulations were not implemented immediately. In fact, the FPA was not modified until 1986 to require
the balance of energy, recreational, and environmental concerns at hydropower dams (16 U.S.C §
797(e)) and NEPA was not formally implemented until 1987 (Richardson, 2000).
Generally, we found that resource agency participation and the corresponding invocation of
authorities increased after the 1990s (Figure 1.3). This coincides with the instatement of the ILP as the
default process in 2005, before which, the process was traditionally marked by latent FERC and
stakeholder involvement. Additionally, several court rulings during this time supported resource agency
authority in matters regarding environmental law (Daniel Pollak, 2007; Richardson, 2000). The WQC in
particular, prompted numerous court cases that have clarified the boundaries of state authority after
FERC rejected water quality conditions as “beyond the scope of state authority.” More recently licensed
projects are required to incorporate all WQC conditions into licenses.
39
Spatial Trends
Another major trend that emerged from relicensing documents was a management gradient
relative to project location (Figure 1.4). Coastal projects tend to occupy larger rivers, operate run-of-
river flows, and host sea-run fish in the project’s boundaries (Table 1.1). Conversely, inland projects are
typically in smaller rivers, operate for water storage, have large impoundments, and have no historic
sea-run fish habitat (Table 1.1). In our analysis, fish passage language strongly correlated to this
gradient. Unsurprisingly (given the perceived importance of sea-run fish and an emphasis on Atlantic
salmon conservation) we found that coastal projects referenced fish passage more often than those
further inland (Figure 1.5). Several inland projects did not address fish passage at all. This was supported
by our random forest analysis that identified the number of downstream hydropower projects,
upstream alewife habitat, number of sea-run fish, and the presence of an impoundment as predictive of
fish passage documentation in project licenses (Figure 1.6).
While statute and stakeholder license terms had relatively little predictive power (except for
NOAA) in the NMDS, they did ordinate along the coastal-inland gradient. References to MDMR, NOAA,
and USFWS clustered with coastal projects, while MDIFW clustered with inland projects (Figure 1.5). This
is likely due to the specific authorities these agencies hold in relation to impacted resources. For
example, MDMR and NOAA are specifically tasked with managing sea-run fish which are prevalent at
coastal projects. Conversely, MDIFW is tasked with managing freshwater fish, terrestrial wildlife, and
inland recreation. At times this duality may be a source of conflict where the needs of sea-run and
freshwater fish clash. MDEP is a central figure at all projects due in part to their authority in
administering WQC and managing water resources.
One common way to promote basin-scale management has been to coordinate license terms for
projects in shared river basins. This generally includes accelerating or extending license terms to
relicense related projects concurrently (Curtis and Buchanan, 2018). Using this rational, projects in

40
proximity, especially those with the same licensee, may be synchronized. The FPA explicitly mandates
the coordination of licensing terms for multiple projects in a river basin (18 C.F.R. § 4). We found several
paired projects that were managed this way (e.g., Abenaki and Anson (2003); Automatic and
Messalonskee (1999); and Penobscot Mills and Ripogenus (1996). However, this coordination of
licensing terms did not extend to larger project groupings.
Several projects could be seen as employing basin-scale management with regard to the
number of individual dams managed in a single license. For example, though licensed as a distinct
project, Great Lakes Hydropower (2004) consists of a complex of nine storage dams over a broad area.
Similarly, Penobscot Mills (1996) consists of five dams, Messalonskee (1999) consists of three, and
Milford (1998), Moosehead Lake (1997), and Shawmut (1981) consists of two. These techniques in dam
management however are not consistently applied across the Kennebec and Penobscot River
watersheds. Despite a push towards basin-scale management and boiler plate references towards
cumulative impacts, we found low levels co-management in project licenses as shown by our index
(Table 1.2).
Beyond direct licensing decision-making, more comprehensive restoration actions have been
observed through external influences. The Penobscot River Restoration Project is a good example of
this. This project originated as a self-proclaimed “public-private effort to maintain hydropower and
restore sea-run fisheries on the Penobscot” (NRCM, 2019). Terms and conditions derived from the
project did influence project license amendments, however, the process itself was the result of
arbitration and cooperation outside of FERC licensing (Opperman et al., 2011). These stakeholder-driven
approaches may provide an avenue for negotiation and inclusion that is not possible within the bounds
of the relicensing process.
Projects that were co-managed and geographically close to one another translated to similar
project features, fish management concerns, and stakeholder objectives. This facilitated the

41
coordination of licensing dates so that relicensing could be addressed at the same time, however, this
did not hold true for all closely located projects. For example, the Orono (2005) license in the Penobscot
River readily referenced Great Works (1963), Howland (1980), Stillwater (1998), Veazie (1998), and
Milford Dams (1998) which are commonly addressed together in current conservation plans. The other
projects, which were relicensed prior to the Lower Penobscot River Basin Comprehensive Settlement
Accord in 2004, did not reference nearby projects. Similarly, Shawmut (1981), Benton Falls (1984),
Hydro-Kennebec (1986), and Weston (1997), which were relicensed prior to the Lower Kennebec River
Comprehensive Settlement in 1998, did not reference each other. Lockwood (2005), which was also part
of the settlement, did mention the other projects.
Challenges and Opportunities for Integrative Basin-scale Management
Ongoing assessments of the declines of sea-run fish and the increasingly collaborative regulatory
process, have led to the consideration of the cumulative impacts inherent of multiple dams in a river. It
has been found that the potential for improving hydropower sustainability is higher when projects are
managed beyond single project mitigation (Roy et al., 2018; Song et al., 2019). This has prompted a shift
towards basin-scale planning of river systems (Neeson et al., 2014). Energy policy as such has evolved to
require the assessment of cumulative impacts of multiple projects in order to manage the river and
environmental concerns pursuant to federal and state comprehensive plans (16 U. S. C. § 10(a)(2)).
Despite this, decision-making has been extremely site-specific.
Limitations are inherent to the long policy and management cycles typical of hydropower
relicensing. While long license terms are meant to mitigate market uncertainty for licensees and manage
resource use by regulatory agencies, they can make it difficult to effectively manage dynamic
environmental resources (Thomas and Koontz, 2011). Rigid license terms, often prohibit substantial
changes to hydropower operations outside of relicensing, making it difficult to coordinate and manage
fish passage concerns among all the projects in the system. The existent network of projects with

42
haphazard and uncoordinated licensing timeframes (Table 1.1), also makes it difficult to address basin-
scale planning.
Passage standards for sea-run fish often necessitate their passage at projects lower in the
system. Because license issuance is not necessarily dependent on location along the coastal to inland
gradient, projects management is often mismatched in time. This may have the effect of stalling
conservation measures. For example, fish passage provisions at the Hydro-Kennebec Project (1986)
were deemed necessary but were only to be implemented after fish passage needs were met at the
downstream project (Edwards, now removed). Fish passage was not further addressed until 1998 when
the Lower Kennebec Settlement Agreement required planning for interim fish passage. This stipulated
that permanent fish passage was not required until 2010 or until fish numbers reached a target goal at
the Lockwood Project downstream. Most recently (2018), permanent fish passage designs have been
approved, but construction has not been completed. Other projects in the Lower Kennebec River also
exhibit this long timeframe.
The hydropower relicensing process is perhaps more collaborative now than it has ever been, as
seen by the increase in agency participation and licensing authorities in the Kennebec and Penobscot
Rivers (Figure 1.3). The relicensing process has become more complex and interdependent over time
(Ansell and Gash, 2007) and research has suggested that this collaboration can directly improve
environmental outcomes (Mandarano, 2008; Ulibarri, 2015). Successful collaborative basin-scale
planning and assessments have occurred when federal agencies worked with state and local agencies,
Native American Tribes, environmental groups, the hydropower industry, and other interested
stakeholders to resolve issues regarding existing hydropower projects (Saulsbury et al., 2010).
Beyond the suite of federal (NOAA and USFWS) and state (MDNR, MDIFW, and MDEP) resource
and regulatory agencies, other stakeholders are invited to participate in the relicensing. These include
Tribal Governments, community members, and special interest groups. While our research did not

43
explicitly examine these stakeholder groups, we acknowledge that their influence may significantly
affect project outcomes. For example, the Penobscot Indian Nation, actively participates at projects
within their lands in the Penobscot River. They contribute to meetings, manage conservation funding,
and were instrumental in negotiating the Lower Penobscot River Settlement Agreement (NRCM, 2019).
While all stakeholders may be able to participate through official comments and influence agency
objectives as constituents, their ability to participate may vary depending on affiliation, time, human
capital, and financial resources (Ulibarri, 2015). These efforts may not always be consistent. An
opportunity for future research exists to investigate patterns of non-agency influence in relicensing to
encourage equitable participation from stakeholders that may be currently underrepresented in
relicensing.
Similarly, opportunity exists to facilitate passage for fish species currently underrepresented in
management with the implementation of equitable passage facilities and standards. This requires the
establishment of success standards for all fish species that have declines attributed to dams. For
example, while the Milford Project must meet passage standards for Atlantic salmon, similar standards
do not exist for other species. Furthermore, aggressive timelines for the construction of fish passage
would benefit populations currently unable to access essential habitat. Holistic passage is expected to
continue to be an issue in hydropower decision-making given that no perfect solution to pass all species
and life stages has been discovered (Bunt et al., 2011; Noonan et al., 2012) beyond complete dam
removal.
Given the expected increase in relicensing work in the next decade, benefit may be seen in
updating basin comprehensive plans. While emphasis has been placed on coordinated and inclusive
decision-making, comprehensive basin-wide assessments for the Kennebec and Penobscot River
watersheds have not been addressed since the early 1990s. A synthesis of historic changes, existing

44
studies, and objectives may also be useful for developing stakeholder understanding in future
relicensing processes.
Limitations
Further exploration of documents beyond fish passage and outside of the relicensing timeframe
could yield a more robust series of findings. Utilizing additional software and text analysis techniques
will only serve to further this study. Similarly, consideration for the diverse stakeholder groups active
during relicensing could uncover obscured themes and perceptions not captured here. Additionally,
utilizing phenomenological methods on a smaller scale (e.g., case studies of select hydropower projects),
may allow for a more nuanced understanding of the decision-making process. It is clear that the
complexities of the relicensing process warrant in-depth and dynamic continued analysis.

45
CHAPTER 2
SCIENCE IN ACTION OR SCIENCE INACTION? EVALUATING THE IMPLEMENTATION OF
“BEST AVAILABLE SCIENCE” IN HYDROPOWER RELICENSING
Abstract
Over the next two decades, half of all hydropower projects nationwide will require relicensing by FERC.
During this time, agency regulators are tasked with using the "best available science" (BAS) to make
informed decisions about hydropower operations and management. Although embraced as the
standard, BAS is not well-defined. Focusing on the Kennebec and Penobscot River watersheds in Maine,
citation analysis and an online stakeholder survey were used to identify the informational sources used
in relicensing and assess agency perceptions of BAS. Analysis of relicensing documents (n=62)
demonstrates that FERC and licensee documents are highly similar in citation composition. NOAA
reports typically cite more sources and are three times more likely to cite peer-reviewed literature than
FERC and licensee documents. Survey data reveals that federal and state agency respondents (n=49)
rate peer-reviewed literature highly as in terms of BAS, followed by university, agency, and expert
sources, while industry and community sources rate poorly. Overall, there is low agreement among
survey respondents with regards to BAS rankings of informational sources. The reported differences in
information use may be linked to disparities in the access to certain sources, particularly peer-reviewed
literature. Enhanced understanding of information use may aid in identifying pathways for better
informed relicensing decisions.
Introduction
Declines in migratory fish have been attributed to hydropower dams and resulting habitat
fragmentation (Limburg and Waldman, 2009). These dams are sites of fish mortality (Maynard et al.,
2018; Olden, 2015) and delay (Izzo et al., 2016; Nyqvist et al., 2017) for both upstream and downstream
46
migration. Application of “safe, timely, and effective passage” standards (Turek et al., 2016) can be
inconsistent and are generally negotiated on a case-by-case basis (FERC, 2017a). The Federal Energy
Regulatory Commission (FERC), under the Federal Power Act (FPA), requires non-federal hydropower
dam owners to obtain licenses for the operation and maintenance of their facilities (16 U.S.C. § 791 [a]).
Licenses may be renewed every 30 to 50 years, providing a short window of opportunity for reassessing
operations with respect to energy production, recreation, and environmental concerns (16 U.S.C. § 797
[e]). While license amendments may be made outside of this process, the relicensing period is the most
efficient and productive time to influence operations related to flow rates, fish passage structures, and
hydropower generation schedules (Kosnik, 2010).
In the next two decades, more than half of all active FERC-licensed projects (647 of 1,043) will
require relicensing (Curtis and Buchanan, 2018). At the time of relicensing, federal and state resource
agencies, Tribal Governments, dam licensees, and conservation organizations with different roles,
responsibilities, and statutory obligations may provide input to the process. These include the issuance
of Endangered Species Act (ESA) consultations (16 U.S.C. § 1531 et seq.), Water Quality Certifications
(CWA; 33 U.S.C § 1251 et seq.), and Mandatory Conditioning Authorities (e.g., Departments of Interior
and Commerce’s ability to impose fish passage prescriptions; 16 U.S.C. § 811). Balancing energy
production and conservation goals can make decision-making complicated. The use of science to inform
management is widely regarded as critical in policy decision-making (Holmes and Clark, 2008) and
agencies are frequently required to draw on the “best available science” (BAS) to support regulatory
decisions (Costa et al., 2016). Despite the importance of BAS, operationalizing the concept remains
inconsistent and difficult to define (Costa et al., 2016; Murphy and Weiland, 2016). We sought to
explore how information is used and valued by stakeholders in the FERC relicensing process. To do this,
we used citation analysis and a stakeholder survey to characterize information use by FERC, licensees,
and both federal and state resource agencies for dams in two Maine watersheds, the Kennebec and

47
Penobscot Rivers. This paper describes the use of science in hydropower relicensing policy. First, we
outline the regulatory and policy context for relicensing decisions. Then we identify and assess agency
perceptions of BAS using citation analysis and stakeholder survey methods and present out results. We
conclude with implications of our findings on the decision-making process for hydropower relicensing.
Science as a Basis for Hydropower Relicensing Policy
The use of BAS to inform decision-making is codified in laws that influence and govern the
relicensing process. The ESA provides the means for identifying threatened or endangered species and
grants regulatory authority to the U.S. Fish and Wildlife Service (USFWS) and the National Oceanic and
Atmospheric Administration’s National Marine Fisheries Service (NOAA) for species protection (Murphy
and Weiland, 2016). This was one of the first laws to stipulate that the “best scientific and commercial
data available,” be used in decision-making. The ESA’s standard for BAS has been widely emulated by
other federal and state laws (Murphy and Weiland, 2016) such as the Magnuson-Stevens Act (MSA),
enacted to ensure that national fishery conservation and management was based on “the best scientific
information available” (16 U.S.C. § 1801). Likewise, the U.S. Environmental Protection Agency (EPA) has
emphasized the role of BAS in implementing the Clean Water Act (CWA) through Water Quality
Certifications (Sullivan et al., 2006) and has prioritized “refocusing the EPA’s robust research and
scientific analysis to inform policy making” (US EPA, 2018, p 42).
The ESA, MSA, and CWA provide a regulatory framework for dam operation and management
decisions that places emphasis on the importance of BAS in relicensing decisions. When federally
endangered or threatened species are present near projects, ESA consultation ensures that “actions are
not likely to jeopardize the continued existence of the species...” (16 U.S.C. § 1536). If a project affects
the species, USFWS or NOAA must prepare a Biological Opinion that presents potential impacts,
reasonable and prudent measures to minimize impacts, and license terms and conditions (FERC, 2001).
Conditions may include flow prescriptions, operation management, and fishway installation.

48
Biological Opinions strongly influence relicensing decisions making it “unlikely that we [FERC]
will act in a manner that is inconsistent with the conditions of a Biological Opinion” (166 FERC ¶ 61,030).
Similarly, the MSA requires FERC to consult with NOAA on actions thought to impact Fishery
Conservation and Management Plans and Essential Fish Habitat (EFH) for diadromous fish. NOAA is
compelled by the MSA to establish overarching agency guidelines to address BAS and is explicitly
required to invoke BAS (50 C.F.R. § 600.315). In addition, the CWA and relevant state laws give state
agencies authority to impose mandatory terms and conditions (e.g., flow, oxygen, and temperature
limits) to the project license (33 U.S.C. § 1341).
FERC communicates a high value for BAS, stating “the finding of the Commission as to the facts,
if supported by substantial evidence, shall be conclusive” (16 U.S.C. § 8751). In practice, however, the
application of BAS varies, in part, because of the inconsistencies in regulatory scope of BAS mandates.
There are no laws that explicitly require FERC to consider BAS in their own decision-making. Additionally,
BAS is not consistently defined. Decision-making has largely relied on independent reports by the
National Research Council of National Academies (NRC, 2004) and the American Fisheries Society
(Sullivan et al., 2006). These reports informed the updated 2013 MSA Provisions (National Standard 2;
NS2) which outlines standards for scientific peer review and provides guidance on what constitutes BAS
for fisheries management (50 C.F.R. § 600.315). The NS2, stresses the importance of following a
research plan with a clear statement of objectives, conceptual model, study design, documentation of
methods, results, and conclusions, peer review as appropriate, and communication of findings (16 U.S.C.
§ 1851). It promotes the “widely accepted criteria for evaluating BAS: relevance, inclusiveness,
objectivity, transparency, timeliness, verification, validation, and peer review of fishery management
information as appropriate” (16 U.S.C. § 1851). However, the standards also caution that, “an overly
prescriptive definition of BAS should be avoided due to the dynamic nature of science” (78 FR 43066). As
a term, BAS seems relatively straight forward. In practice, however, application of BAS is more difficult

49
and, at best, inconsistent. This research seeks to clarify the concept and inform more effective use of
BAS in hydropower relicensing decisions.
Study Area: Kennebec and Penobscot River Watersheds
The Kennebec and Penobscot River watersheds in Maine provide an ideal opportunity for
studying BAS in the relicensing process. Within the next 20 years, 40 hydropower projects in Maine will
require relicensing, the fifth highest in the nation, necessitating increased participation from federal and
state resource agency stakeholders (Curtis and Buchanan, 2018). The Penobscot River is the second
largest river in New England, and combined with the Kennebec River, the two watersheds drain more
than 40 percent of the state by area. Both rivers were of high importance in the nineteenth century for
the transport of timber and paper production (Gibson, 2017). Dam construction decimated many
economically and culturally important fisheries in the 19th century (Hall and Jennings, 2010; Poff et al.,
2007).
Both rivers retain populations of Atlantic salmon (Salmo salar), of which the Gulf of Maine
Distinct Population Segment (GOM DPS) is listed as federally endangered (65 FR 69459) and returns
remain low (NASCO, 2019). The federally endangered shortnose sturgeon (Acipenser brevirostrum) and
the threatened GOM DPS of Atlantic sturgeon (A. oxyrinchus oxyrinchus) both occupy the tidal waters
(78 FR 69310; 32 FR 4001). Additionally, alewife (Alosa pseudoharengus) and blueback herring (A.
aestivalis) are candidate species for ESA listing in the region. American eel (Anguilla rostrata) has been
considered for listing twice in the past. Recovering these populations has become a top priority for
managing agencies.
Several noteworthy changes to these river systems have occurred. In 1997, FERC ordered the
removal of the Edwards Dam on the Kennebec River, the first federally-ordered dam removal against the
wishes of a licensee. FERC ruled that the benefits of a free-flowing river outweighed the benefits
provided by the dam, opening 30 km of habitat and eliciting other improvements to fish passage,

50
including several other dam removals. The Penobscot River Restoration Project in 1999 was a
collaborative effort to balance fish restoration and hydropower production interests that included
conservation organizations, state and federal resource agencies, and three licensees. A major outcome
of the PRRP was the removal of two hydropower dams and increased fish passage at another, improving
access to 3,200 km of open river (Opperman et al., 2011). Decisions in this system (e.g., restoration
focus, habitat improvements, fish passage implementation, etc.) consistently invoke the ESA and
associated standards of BAS making it important to understand information use, perceptions of BAS, and
knowledge gaps going forward.
Citation Analysis
Methods
We used citation analysis in tandem with an online stakeholder survey. This mixed methods
approach followed a convergent, parallel design included both qualitative and quantitative aspects that
allowed for more generalizable conclusions and compensated for the limitations of using a single
method (Creswell and Plano Clark, 2011). Citation analysis has been effectively used to compare
information use between stakeholders (Meho, 2016.) and to quantify BAS in ESA implementation
(Lowell and Kelly, 2016). Building off this work, we used the references present in relicensing documents
to understand how scientific information is applied in relicensing. Stakeholders with longer
bibliographies, a more diverse use of citations, and comparatively more peer-reviewed sources would
be more aligned with commonly held ideals of BAS (Lowell and Kelly, 2016). Similarly, we assumed that
stakeholders closely aligned in management would exhibit similar citation profiles with one another.
Citation analysis was followed by an on-line survey for which we developed criteria to evaluate
agency perceptions of informational sources as BAS. Drawing guidance from the NRC, AFS, and NS2, we
identified five testable components of BAS: i) relevance (appropriate to the current time period and
circumstances), ii) comprehensiveness (complete and inclusive), iii) objectivity (impartial and unbiased),

51
iv) transparency (clear and the approach to data collection understandable with the ability for validation
and verification), and v) availability (easily obtainable and accessible). These concepts informed the
survey design and allowed for the comparison of individual perceptions with the actual use of
informational sources.
Active FERC-regulated hydropower projects in the Kennebec and Penobscot River watersheds
which were granted new licenses or underwent license amendments from 2000 to 2018 were included
in our analysis. These documents were readily accessible through the FERC eLibrary and licensing
requirements were generally similar across projects. Relicensing documents analyzed include: i) Pre-
Application Documents (PAD), ii) study plans and reports (SP&R), iii) Biological Assessments (BA), iv) and
applications for new licenses authored by the licensee; v) Biological Opinions (BIOP) and v) mandatory
conditioning license prescriptions (MCLP) that are authored by NOAA, and vi) Environmental
Assessments (EA), vii) Scoping Documents (SD), and viii) official orders that are authored by FERC (FERC,
2017b; Supplement 1). We used the citations from these documents as an indication of information
deemed important by document authors (Ding et al., 2018). Though our research focused on the
relicensing process, several amendment documents were included, the most notable relating to the
expansion of the ESA to include Atlantic salmon in the Penobscot River in the Gulf of Maine Distinct
Population Segment. This change prompted the creation of documents analogous to the technical
relicensing process.
Documents were obtained from the FERC eLibrary. Text searches were performed to isolate
process-specific documents that were mandatory or common according to the FPA (16 U.S.C. § 791) and
the FERC Hydropower Primer (FERC, 2017b). Many stakeholders, including state and tribal entities,
actively participated in the relicensing process. Project licensees, NOAA, and FERC had the primary
responsibility for generating relicensing documents such as PAD, SP&Rs, BIOPs, MCLPs, EAs, and SDs.
These documents, dated 2008 and later, were downloaded in Portable Document Format (PDF) with

52
computer recognizable text elements. Documents dated prior to 2008 were downloaded as plain text
(.txt), Microsoft Documents (.doc), or raster graphics (.jpg) and transformed into searchable PDFs using
Optical Character Recognition software (ABBYY FineReader 14, ABBYY, Milpitas, CA 95035).
Our initial selection was 133 reference documents from 31 hydropower projects in the
Kennebec and Penobscot River watersheds. Draft documents were excluded from analysis unless a final
document was unavailable as well as small-scale, focused study reports containing few to no citations.
Our final sample consisted of 62 documents central to relicensing. They included: licensee PADs (n=5),
SP&Rs (n=15), BAs (n=7), and applications for new licenses (n=11); NOAA BIOPs (n=8); and FERC EAs
(n=16). All documents included site-specific information (e.g., physical characteristics, regulatory
histories, current state of knowledge, proposed operational changes, and potential impediments to
relicensing). They included in-text citations and “reference” sections with which licensees, NOAA, and
FERC supported their viewpoints and decisions.
From these selected documents, references were extracted into a citation database with their
year and source identified. These documents were categorized into seven groups: academic, federal,
state, FERC, licensee, peer-reviewed, and “other” (sensu Jennings and Hall, 2012; Lowell and Kelly, 2016;
Table 2.1). A distinction was made between peer-reviewed publications (i.e., scholarly journals and
books) and documents that reported “internal peer review”. Academic citations included student
theses/dissertations, general documents (e.g., maps), books from a University Press, and documents
produced by USGS Cooperative Fish and Wildlife Research Units. Federal citations included those
produced by any federal agency (foreign or domestic), consisting primarily of NOAA documents. State
citations included all state agency documents (e.g., Maine Department of Marine Resources (MDMR),
Inland Fisheries and Wildlife (MIFW), and Environmental Protection (MDEP)). FERC citations included all
FERC correspondences (generally as official orders). Licensee citations included correspondence, plans,
and reports produced directly by the licensee (by contracted consultants). Other citations included NGO

53
publications, international and mixed governance organizations, presentations, personal
communications, history books, general knowledge books, and textbooks.
A one-way ANOVA was used to compare the number of citations per document by author and a
Tukey post-hoc test was used for pairwise comparisons if a difference was detected. Chi-square tests
were used to compare the proportions of different sources used between licensee, NOAA, and FERC
authors with z-tests determining significance between paired items. Relative proportions of citation
categories were used to construct citation profiles for each stakeholder. The age of citations (at time of
document preparation) was compared among groups to assess use of recent information. “Highly
influential citations” were identified by widespread use in more than a quarter of the documents
(Supplement 2). An α value of 0.05 was adopted for all tests.
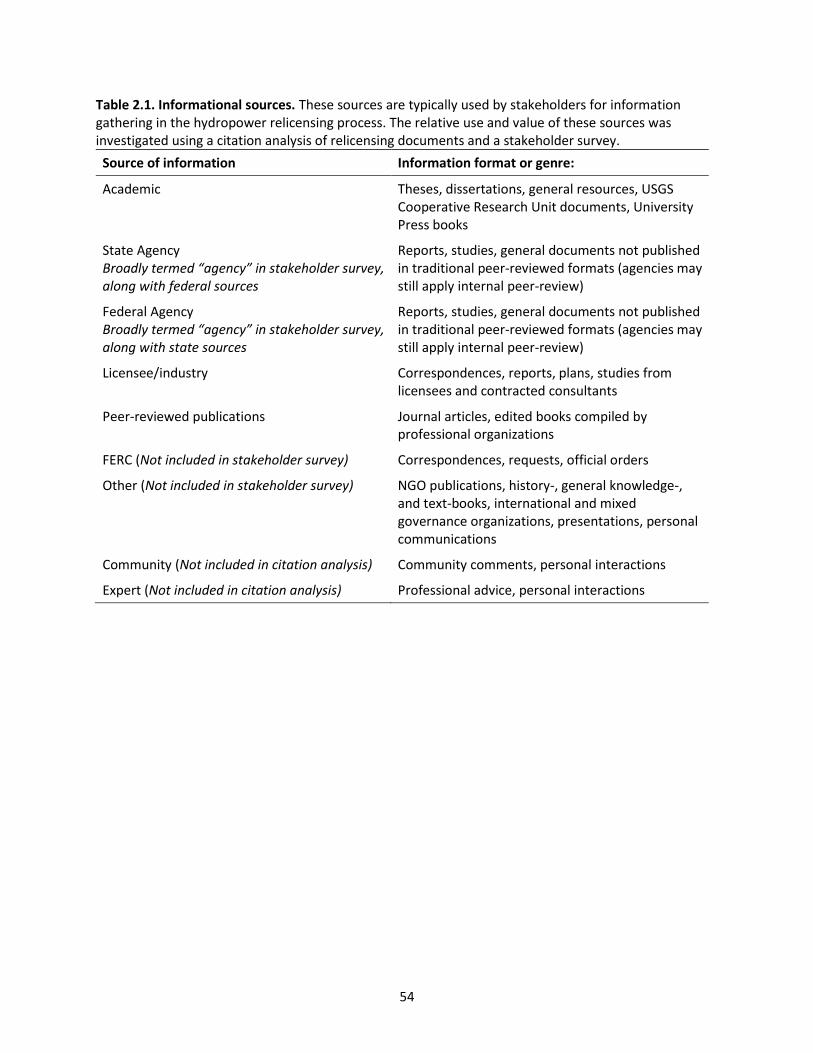
54
Table 2.1. Informational sources. These sources are typically used by stakeholders for information gathering in the hydropower relicensing process. The relative use and value of these sources was investigated using a citation analysis of relicensing documents and a stakeholder survey.
Source of information Information format or genre:
Academic Theses, dissertations, general resources, USGS Cooperative Research Unit documents, University Press books
State Agency Broadly termed “agency” in stakeholder survey, along with federal sources
Reports, studies, general documents not published in traditional peer-reviewed formats (agencies may still apply internal peer-review)
Federal Agency Broadly termed “agency” in stakeholder survey, along with state sources
Reports, studies, general documents not published in traditional peer-reviewed formats (agencies may still apply internal peer-review)
Licensee/industry Correspondences, reports, plans, studies from licensees and contracted consultants
Peer-reviewed publications Journal articles, edited books compiled by professional organizations
FERC (Not included in stakeholder survey) Correspondences, requests, official orders
Other (Not included in stakeholder survey) NGO publications, history-, general knowledge-, and text-books, international and mixed governance organizations, presentations, personal communications
Community (Not included in citation analysis) Community comments, personal interactions
Expert (Not included in citation analysis) Professional advice, personal interactions

55
Results
Among the 62 analyzed documents, a total of 5,044 individual citations were identified. The
average number of citations was 47.5 per document (IQR = 19.5-121.75). Citations could be attributed
to academic (5.5%), federal (19.8%), state (20.8%), FERC (2.9%), licensee (13.0%), peer-reviewed
(27.4%), and other (10.5%) sources (Table 2.2). NOAA documents (n=8) cited more sources than FERC (n
= 16) and licensee (n = 38) documents (211.5, IQR = 122.5-305.75; 28, IQR = 17.5-63; and 43, IQR = 17.5-
113, respectively; Table 2.2 and Figure 2.1).
Figure 2.1. Citations per document. Violin plots visualizing the average number of citations per
hydropower licensing document derived from the Kennebec and Penobscot Rivers, Maine from 2000-
2018. Citations are stratified by document author (FERC, Licensees, and NOAA). Mean, 95% CI, and SD
are indicated by internal box plots.

56
Table 2.2. Citation analysis summary. Summary statistics for citations found in hydropower relicensing documents from projects in the Kennebec and Penobscot Rivers, Maine, from 2000-2018. Citations were categorized by informational source (federal, FERC, licensee, other, peer-review, state, and academic) as cited by NOAA Fisheries, FERC, and Licensee authors. Each subscript letter denotes a subset of author categories whose column proportions do not differ significantly from each other at the 0.05 level.
NOAA FERC Licensee Total
Document count 8 17 37 62
Citation count 1626 915 2503 5044
Citation median per document 211.5 28 43 47.5
Citation interquartile range 122.5-305.8 17.5-6 17.5-113 19.5-121.8
Citations by source, % (n)
Federal 20.1 (327)a 20.0 (183)a 19.6 (491)a 19.8 (1001)
FERC 0.9 (14)a 3.5 (32)b 4.1 (102)b 2.9 (148)
Licensee 6.9 (113)a 16.5 (151)b 15.7 (392)b 13.0 (656)
Other 5.5 (89)a 15.4 (141)b 11.9 (299)c 10.5 (529)
Peer-review 50.4 (820)a 17.2 (157)b 16.1 (403)b 27.4 (1380)
State 9.7 (158)a 23.7 (217)b 27.0 (676)b 20.8 (1051)
Academic 6.5 (105)a 3.7 (34)b 5.6 (140)a,b 5.5 (279)
The use of information sources was found to differ by document author (x2 (12) = 790.2, p =
0.001, φ = 0.280). FERC and licensee citations showed no difference in their proportional use of six out
of seven informational sources and were evenly distributed across state (23.7/27.0%), federal
(20.0/19.6%), peer-reviewed (17.2/16.1%), licensee (16.5/15.7%), and other (15.4/11.9%) sources. Low
proportions of academic (3.7/5.6%) and FERC (3.5/4.1%) sources were used (Table 2.2). NOAA citations
differed from FERC and licensee citations and were primarily of peer-reviewed sources (50.4%) and
federal references (20.1%). Low proportions of state (9.7%), licensee (6.9%), academic (6.5%), other
(5.5%), and FERC (0.9%) sources were used (Table 2.2).
Citation publication year ranged from 1825 to 2017 and were 0 to 177 years old with respect to
the document they were cited in (Figure 2). Citations averaged 14.7 years old and differed among
authors (one-way ANOVA, F = 37.9, p = 0.001). A Tukey post-hoc test revealed (p = 0.001) that NOAA

57
citations are 4-5 years older than FERC and licensee documents (17.9 ± 16.1, 12.5 ± 18.1, and 13.5 ±
19.0, years respectively)). There was no difference between the age of citations from FERC and licensee
authors (p = 0.288).
On average, individual references were cited in at least three documents (mean = 3.8 ± 3.71).
Three quarters of all citations were used five times or fewer and 37.7% were used only once. Seven
sources were cited in 15 or more documents (Supplement 2). These documents were mainly technical
documents related to the decline, conservation efforts, and status of Atlantic Salmon.
Figure 2.2. Citation age. Relative age of the citations used by NOAA Fisheries, FERC, and licensee
authors in hydropower relicensing documents.

58
Stakeholder Survey
Methods
We used a non-proportional, purposive sampling (Etikan et al., 2016; Lavrarkas, 2008), to
characterize how federal and state resource agencies define and operationalize BAS. We used an online
survey which invited participation from individuals from agencies involved in the regional relicensing
process (NOAA, USFWS, MDEP, MIFW, MDMR). While our citation analysis did not include State of
Maine-authored documents, State agency members have specific influence in the relicensing process
related to water quality certification and fishery management. Penobscot Nation resource agency
members and some licensees were also invited to participate (Lavrarkas, 2008) but were not included in
our final analysis due to their small sample size and unstructured sampling.
Survey participants were identified by i) having demonstrated authority in the relicensing
process (e.g., listed as a mandatory contact in FERC eLibrary documents), ii) having been identified as
participants by those with authority (sensu Gilchrist and Williams, 2009), iii) through informal contacts
(e.g., participation at scoping meetings, fisheries conferences, and public forums), and iv) being listed in
agency directories as having relicensing responsibilities. Survey respondents were asked to identify
other key people (snowball technique; Lavrarkas, 2008) but no additional participants were identified.
The survey consisted of multiple choice (n=6), open-ended (n=8), and ranking (n=11) questions
(Supplement 3). Participants reported their organization, job title, and years of experience in the
relicensing process. They were asked a series of questions as to the frequency of participation in
common relicensing tasks (5-point Likert scale from “do not participate” to “frequently participate”).
Tasks included: FERC document review, scoping meetings, study design planning, scientific evaluation
and synthesis, coordination with other entities, providing official written comments, task
force/committee participation, and whether they held a supervisory role. Similarly, they were asked to
identify how frequently they invoked common skills and expertise (5-point Likert scale from “do not

59
employ” to “frequently employ”). Skills included: fisheries, engineering (including fish passage),
hydrology, policy, communication, negotiation/mediation, and community engagement. Participants
were invited to identify additional tasks or skills not included in the survey.
The open-ended question, “In your opinion, what constitutes best available science?” was used
to collect respondents’ view of BAS. Participants were asked to rate informational sources (i.e.,
unpublished academic research (e.g., theses), agency grey literature, industry reports, community
comments, peer-reviewed publications, and expert opinion) based on their perception of the defined
BAS metrics (relevance, comprehensiveness, objectivity, transparency, and availability) on a 5-point
Likert scale (“not relevant” to “extremely relevant”). Community comments (e.g., comments from
community members not affiliated with federal and state agencies) and expert opinion (e.g. advice and
information provided by key informants) were addressed through the survey in order to gage
respondents’ perceptions of personal interactions that could not be investigated through citation
analysis. The BAS metrics were used to calculate an index (mean value of these five metrics) for each
source. Frequency of use for each source was also assessed (5-point Likert scale, “do not use” to”
frequently use”). Two open-ended questions, “What do you consider the main strengths of the sources
you use?” and “What type of information would be beneficial to have but is currently unavailable to
you?” were used to assess what information participants found important.
Because of the routine use of email by our invited population, the questionnaire was
administered with Qualtrics web-based software (Qualtrics, Provo, UT). We implemented our survey
using the Tailored Design Method (Dillman Method) to increase trust, perception of reward, and to
minimize costs and time burden for respondents thereby reducing survey error (Dillman et al., 2014).
The survey was pilot tested with “knowledgeable colleagues” to identify omissions or redundancies
(Dillman et al., 2014). Pilot study participants were asked to assess the ease and length of the survey;

60
general comments were invited. Major deficiencies were not identified and only minor changes in
formatting were implemented for the final version.
A pre-survey letter was sent (by both mail and email) to inform invited participants and ask for
their help. A subsequent email to participants included a personal survey link. A series of reminder
emails (after one and two weeks) were sent to improve our response rate (Dillman et al., 2014; Van Mol,
2017). During this time there was a partial federal government shutdown, limiting federal employee
participation (and some state partners). To accommodate these participants, a final email was sent eight
weeks later to all non-respondents and those that partially completed the survey.
Of 99 initial invited people, 56 completed the survey (initial response rate of 56.6%). Six
respondents expressed that they had no affiliation with Maine or relicensing and were removed from
the pool. Two invited people had incorrect contact information did not receive the survey. An additional
nine individuals were convenience sampled (licensee and tribal stakeholders) and were not included in
our analysis. This brought the possible effective sample size to 82. Three individuals opted out of the
survey and 30 did not respond or did not finish the survey resulting in 49 participants (59.7 % response
rate) for our final analysis.
We compared federal and state agency responses across each of the BAS items using t-tests.
Differences within federal and state groups were examined using the Potential for Conflict Index₂ (PCI;
Vaske et al., 2010). The PCI₂ assesses variation in response within a group as well as the central
tendency and ranges from zero (perfect consensus among respondents and no potential for conflict) to
one (no consensus and a high potential for conflict). Statistical differences (d) tests were assessed as
described by Vaske et al. (2010).
We used deductive coding to characterize responses to open-ended questions. The question, “In
your opinion, what constitutes best available science?” was compared to measurements of the
perceived relevance, comprehensiveness, objectivity, transparency, and availability of different sources

61
of information (e.g., “not relevant” - “extremely relevant,” 5-point Likert scale). This was further
compared to the self-reported use of those sources (e.g., “do not use” – “frequently use,” 5-point Likert
scale). The open-ended questions, “What do you consider the main strengths of the sources you use?”
and “What type of information would be beneficial to have but is currently unavailable to you?” provided
further insight into what information participants found personally important.
Results
The 49 analyzed participants included a balanced response from state (n=24) and federal (n=25)
stakeholders. Federal respondents included USFWS (32%) and NOAA (68%) employees; state
respondents included employees from MDEP (16.7%), MDIFW (45.8%), MDMR (33.3%), and Maine
Bureau of Parks and Lands (4.2%). Collectively, respondents indicated a high degree of relicensing
experience with 77.6% indicating more than five years of experience. Several respondents identified
additional relicensing responsibilities related to public communication, conflict resolution, and
monitoring post-licensing mandates. Respondents reported a high use of fisheries expertise, policy
expertise, and communication skills. Additional expertise and skills included data management and
analysis, engagement with Tribal Governments, and balancing community needs. Tasks relating to
relicensing were not the primary job function of most respondents. With few exceptions, most
individuals assumed relicensing responsibilities in addition to their other organizational responsibilities.
Informational sources were rated by respondents in terms of the five BAS metrics previously
identified from literature and a BAS index calculated for each respondent. In general, respondents rated
peer-reviewed, academic, agency, and expert sources high in terms of BAS while industry and
community sources were rated low (Figure 2.3 and Table 2.3). Peer-reviewed and academic sources
received a higher BAS score from federal respondents (p < .001; Table 2.3). Conversely, expert sources
received a higher BAS score from state respondents (p < .05). There was no difference in the perceptions
of agency-, industry-, or community-produced information. Consensus between respondents was

62
consistently high among groups (federal = PCI₂ 0.38-0.58; state = PCI₂ 0.43-0.56). While there was higher
consensus among state respondents regarding industry sources (p < .05; Table 2.3), the remaining five
sources did not show a difference.
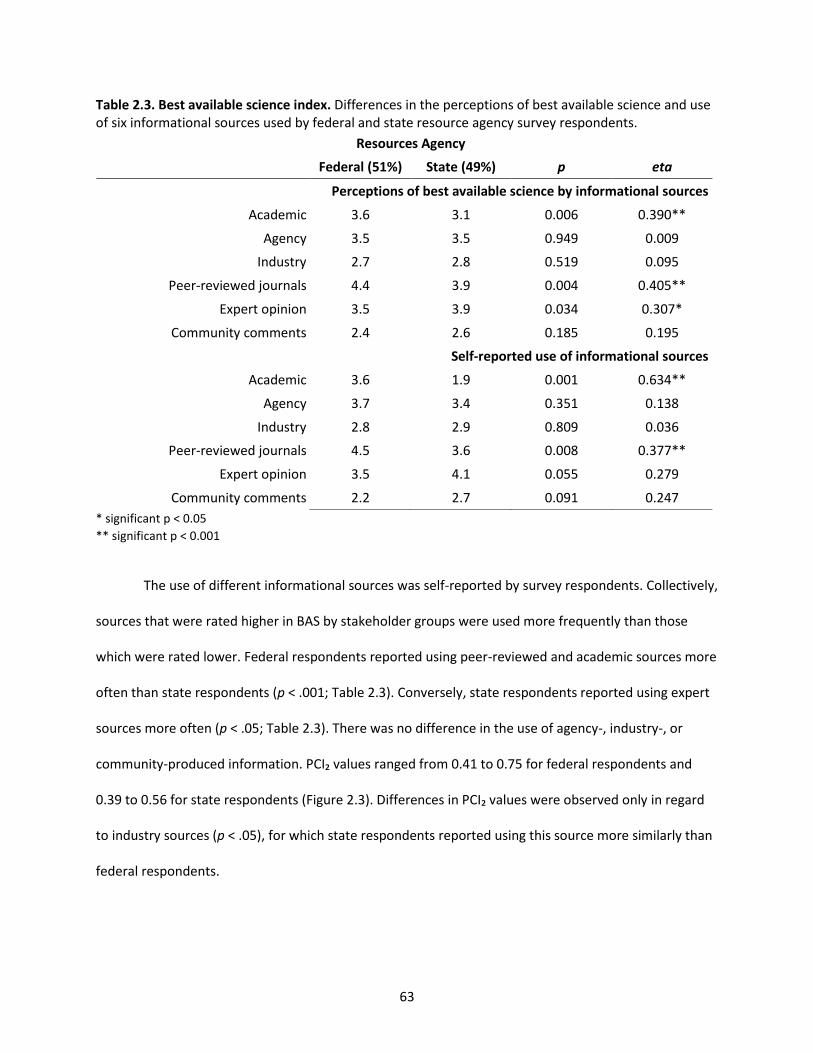
63
Table 2.3. Best available science index. Differences in the perceptions of best available science and use of six informational sources used by federal and state resource agency survey respondents.
Resources Agency
Federal (51%) State (49%) p eta
Perceptions of best available science by informational sources
Academic 3.6 3.1 0.006 0.390**
Agency 3.5 3.5 0.949 0.009
Industry 2.7 2.8 0.519 0.095
Peer-reviewed journals 4.4 3.9 0.004 0.405**
Expert opinion 3.5 3.9 0.034 0.307*
Community comments 2.4 2.6 0.185 0.195
Self-reported use of informational sources
Academic 3.6 1.9 0.001 0.634**
Agency 3.7 3.4 0.351 0.138
Industry 2.8 2.9 0.809 0.036
Peer-reviewed journals 4.5 3.6 0.008 0.377**
Expert opinion 3.5 4.1 0.055 0.279
Community comments 2.2 2.7 0.091 0.247
* significant p < 0.05
** significant p < 0.001
The use of different informational sources was self-reported by survey respondents. Collectively,
sources that were rated higher in BAS by stakeholder groups were used more frequently than those
which were rated lower. Federal respondents reported using peer-reviewed and academic sources more
often than state respondents (p < .001; Table 2.3). Conversely, state respondents reported using expert
sources more often (p < .05; Table 2.3). There was no difference in the use of agency-, industry-, or
community-produced information. PCI₂ values ranged from 0.41 to 0.75 for federal respondents and
0.39 to 0.56 for state respondents (Figure 2.3). Differences in PCI₂ values were observed only in regard
to industry sources (p < .05), for which state respondents reported using this source more similarly than
federal respondents.

64
Figure 2.3. Perceptions and use of best available science. BAS Index rankings of six informational sources in terms of (a) perceptions of BAS compared to (b) their reported use by federal and state resource agency survey respondents. The middle of each bubble represents the mean response. The size and numbers listed for each bubble represent the PCI2 value. The superscript letters indicate statistical differences at p < 0.05. PCI2 values range from zero to one, indicating complete consensus to no consensus.

65
All respondents provided written answers for the question, “what constitutes best available
science?” Respondents consistently affirmed relevance, comprehensiveness, objectivity, transparency,
and availability as important factors. For example, one respondent confirmed the importance of,
“findings that are recent enough, on a study subject similar enough, in a study location similar enough,
and carried out in a thorough and competent enough manner to be relevant.” Another stated that best
available science equated to information that was, “defendable [with] any caveats/biases
acknowledged/explained and put into context” (objectivity). Others highlighted the importance of
“publicly available” and “published” information. The accuracy of information by group consensus and
professional judgement was also highly valued. Greater than half of the respondents specifically
highlighted peer-review as being representative of BAS. One respondent stated, “peer-reviewed
publications have gone through an expert review, so the results are the most trustworthy.” However,
several respondents highlighted the uncertainty inherent to BAS: “peer-reviewed papers are the gold
standard, but there are lots of issues and questions that we must address for which the science has not
yet sic[been] addressed.”
Conclusions and Policy Implications
We found considerable variation in the informational sources that NOAA, the licensee, and FERC
stakeholders consult during relicensing. NOAA documents use more citations than FERC and licensee
documents and draw more deeply from peer-reviewed literature, suggesting a close alignment with
traditional perceptions of BAS (Table 2.2). This is supported by a review of ESA decisions that found that
NOAA exceeded USFWS in three of seven metrics related to BAS with no difference found for the
remaining metrics (Lowell and Kelly, 2016). Generally, longer bibliographies, more diverse use of
citations, and comparatively more peer-reviewed sources are seen as indicators for the use of BAS
(Lowell and Kelly, 2016; Meho, 2006). The prevalence of these indicators in NOAA documents may be
largely influenced by the direct regulatory guidance provided by the MSA, NS2 for fishery management.
66
Additionally, guidance is provided on what constitutes BAS, standards for peer review, and governance
for the review of scientific information. In this way, NOAA is obligated to adhere to BAS standards in
ways that other stakeholders may not.
FERC and licensee citation profiles were found to be similar in their proportional use of sources
(Table 2.2) and citation age (Figure 2.2), possibly indicating a close alignment in management goals and
decision-making styles. Alternately, the similarity could be a result of the regulatory burden and regional
scope that FERC staff operate under to gather information. High workloads coupled with unfamiliarity
with project sites may compel FERC staff to rely heavily on the submitted information from the licensee
and other stakeholders. The licensee sets the stage with the PAD in providing FERC and other
stakeholders with existing, relevant, and reasonably available information on the project. From this it is
anticipated that stakeholders can identify issues and information needs, develop study requests and
plans, and prepare for relicensing (18 CFR SS 5.6). The PAD also serves as a precursor to successive
environmental assessments, including the scoping documents, environmental impact statements, or
environmental assessments produced by FERC.
The licensee sets the foundation in the process. This process of “anchoring expectations” can
have unintended consequences for the types of information considered by FERC (Furnham and Boo,
2011). The relicensing process establishes terms and conditions of continued operations and
stakeholders may recommend certain changes. This initial information, provided by the licensee, may
bias expectations and subconsciously guide future negotiations toward this initial view at the cost of
other issues and priorities. Anchoring bias is difficult to avoid, even when participants are aware of it
(Englich et al., 2006). Because of this, the PAD sets the boundary for negotiations and often has a
stronger influence on the outcome of negotiations, subsequent counteroffers, and establishes what the
licensee views as BAS (Kristensen and Gärling, 1997).
67
Similarly, licensee generated Draft Biological Assessmets can strongly inform FERC documents
and influence operational outcomes. BAs are formulated as part of the application (or as optional
additional information). FERC then, “can either take the information and incorporate it into their
environmental document, make any necessary modifications to the BA and issue it, or adopt it [without
changes] and supplement it as necessary” (FERC, 2001). FERC stipulates the need for any information
and conclusions to be verified. However, the relicensing process often places the burden of information
largely on licensees. Information gaps, erroneous information, and alternative objectives may not be
addressed unless they are recognized by FERC, NOAA, or other project stakeholders. Validation is
resource intensive and may be applied irregularly depending on the resources stakeholders have
available.
It is important to note the limitations of citation analysis for assessing information use from
relicensing documents. First, not all information in the process is not formally cited. Because of this,
disproportionate emphasis may be placed on published documents to the exclusion of other
informational sources such as written comments, emails, etc. Moreover, some important documents,
such as FERC Scoping Documents contain no citations despite the wealth of information they contain
and their conspicuous role in the process. Additionally, citation analysis does not account for in-person
interactions and meetings which may yield substantial information and are highly valued in the
relicensing process (Porter and Birdi, 2018). Our research did not specifically address these sources of
information and opportunity exists to capture this information through additional stakeholder surveys
and interviews. Inconsistent stakeholder collaboration between hydropower projects and relicensing
decisions result in differing intensity of personal communication between stakeholders. This can have a
significant influence on the decision-making process. Highly collaborative projects for example, are
“more likely to increase capacity for joint action and result in satisfying settlement agreements” (Ulibarri,
2015). The assessment of the importance of these informational sources and interactions would be best

68
addressed using case study methodology in future research (see Pudry, 2012 and Ulibarri, 2015).
Nuances to consider include informal sharing across projects and collaborations between agencies that
could influence what stakeholders perceive as BAS.
Our survey data captured responses from a diverse group of individuals with a variety of
relicensing responsibilities and expertise. It is notable that tasks relating to relicensing were not the
primary job function of most respondents. Given the complexity of FERC relicensing, this may result in
commitment and resource conflicts within agencies. One respondent stated, “I may be asked to assist
with some responsibilities, but this is outside of my performance plan.” Another mentioned providing
“scientific advice/support” and “technical input” outside of their normal duties. Although respondents
were generally experienced in relicensing activities, this experience was intermittent. One respondent
stated:
A lot of times the agencies are limited in their ability to provide all the information necessary and
available to the licensee and FERC. From my experience this is not due to a lack of willingness or
ability, but rather simply the lack of enough people to do it all.
A common theme in both the citation analysis and stakeholder survey is the importance of peer-
reviewed publications as indicators of BAS. Without prompting, over half of federal and state
respondents specifically wrote that they considered peer-review as BAS. For example, respondents
stated that, “peer-reviewed and published is highly valued – preferred” and that, “peer-reviewed papers
are the gold standard.” This was further supported by high rankings of the relevance,
comprehensiveness, objectivity, transparency, and availability for peer-reviewed publications from both
groups (Table 2.3 and Figure 2.3). This was anticipated considering that many common definitions of
BAS implicitly recommend review by experts as critical for establishing consensus and checking validity
(e.g. ESA and NS2).

69
The reported use of informational sources mirrored the BAS value that respondents placed on
them (Figure 2.3). Respondents used sources they deemed representative of BAS more frequently than
others. This may influence information used in the relicensing process. As perceptions of BAS evolve
among stakeholders, the types of utilized information may as well. This is a potential source of
incongruence and conflict between stakeholders. The BAS rank of sources, and therefore their use, may
diverge or even contradict each other requiring time and resource intensive arbitration by FERC.
Although ranked highly consistently, federal survey respondents valued and used peer-reviewed
and academic sources more than state respondents (Figure 2.3). Conversely, state respondents valued
and used expert opinion to a higher degree than federal employees. Differences in information access
among agencies may be causal. Many peer-reviewed articles require payment for access, putting
stakeholders with fewer resources at a disadvantage. While there was no difference shown in how
federal and state respondents ranked the availability of peer-reviewed sources, several individuals
described access as an impediment. One respondent stated, “I am unable to access some peer-reviewed
literature, and I actually have problems accessing data from other regions within my own Division.”
Another stated a need for “greater access to peer-reviewed literature and an easily searchable database
of studies (and results) performed at FERC projects nationwide.” Perceptions of BAS and the use of
sources was likely also driven by the geographic scope in which federal and state agencies work. Given
the local nature and state-based responsibility of state resource agencies, respondents tended to report
using personal information such as expert opinion. In comparison, federal respondents, with a larger
regulatory scope, tended to use more traditional academic sources (Table 2.3).
For the most part, there was a similar degree of consensus among respondents irrespective of
organizational affiliation (Figure 2.3). Perceptions of BAS for informational sources did not differ
between federal and state agencies. There was relatively low consensus among federal and state
respondent groups (e.g., relatively high PCI2 values), especially for agencies governed by institutional and

70
statutory guidelines promoting BAS (Figure 2.3). The lack of clear agreement on what BAS means likely
makes it difficult to apply within a regulatory framework. Whether this is unique to our study area, or
hydropower decision-making in general, is unknown and opens opportunities to study perceptions of
BAS in other systems.
Though the majority of respondents felt that FERC receives adequate information to make
informed decisions, some identified knowledge gaps including those related to basin-scale and
cumulative impacts. One respondent stated that, “cumulative effects are not adequately captured by the
current science,” while another stated that, “most watershed(s) lack comprehensive fisheries
management plans needed for FERC to make informed decision that protect fisheries.” While licensees
are required to address cumulative impacts at hydropower projects, FERC has not been required to use
a pre-project environmental baseline to review project impacts. A respondent summarized this by
saying, “FERC largely looks at relicensing in the context of single project effects. For example, fish
passage should be evaluated in the context of the larger fisheries picture in a watershed, such as ongoing
and planned restoration.” Recently, however, the US Court of Appeals for the DC Circuit ruled that the
“failure to consider the damage already wrought by the construction of dams along the river fail[s] to
meet the requirements under the ESA or NEPA” (American Rivers v. FERC, 2018). Ensuing relicensing will
likely be required to incorporate a pre-dammed environmental baseline as a consequence of this new
litigation.
At the project-scale level, respondents stated their desire for “real-time data” and “monitoring
data” including fish passage facility inventories, timing and rates of fish movement, raw fish counts, and
streamflow data. “For many smaller hydro projects, basic research on project specific impacts is not
available and can be costly,” one respondent said. Another stated that:
…stream gages have been discontinued and many rivers in Maine are not gaged. This includes
other data that is sometimes measured at stream gages such as temperature and turbidity. Also,

71
a lot of information about hydropower dams such as project drawings and dam safety and
inspection reports are marked as "privileged" and are therefore unavailable through the FERC
eLibrary.
Similarly, information such as fish counts are not obligatory, “on the Androscoggin (Pejepscot and
Worumbo) and in places on the Penobscot (West Enfield) there are fish passage systems but fish counts
are not conducted (like at Milford). These are necessary.”
Finally, respondents stated the desire for a central repository for information (e.g., “I would like
to have information that may be difficult to get in a single archive”). The FERC eLibrary partially fills this
need for stakeholder correspondences, official relicensing documents, comments, and FERC orders.
However, it can be difficult to navigate due to its rudimentary search capabilities and user interface.
Survey respondents desired the inclusion of additional “information (reports, literature, testimonials,
etc.) available for each decision-making process” and the ability to access “old documents or information
that has not been generated (e.g., new studies or as yet evaluated concepts).” In particular, “a better
synthesis of similar study designs/methods/analytics for similar questions that are common” was
desired.
Given the politicization, interpretation challenges, and the competing demands inherent to
relicensing, it is likely that the idea of BAS will continue to be a source of conflict among stakeholders.
While information use in relicensing is inconsistent among stakeholders and individual perceptions of
BAS are varied, our data suggest opportunities for improvement. Efforts to standardize BAS metrics
within the relicensing process may benefit all participants, increasing transparency. Additionally,
developing a shared information repository for documents such as studies, reports, and raw data may
increase stakeholder access and use of BAS. Because the regulatory burden on federal and state
agencies is anticipated to increase in the next two decades such changes may be advantageous.
72
CHAPTER 3
DEVELOPMENT OF A NOVEL BUOYANCY CONVERSION TAG FOR RECAPTURING FISH
Introduction
Historically, Alewife (Alosa pseudoharengus) and Blueback Herring (Alosa aestivalis)
(collectively, river herring) sustained lucrative fisheries in the State of Maine and contributed important
food, forage, and cultural resources to local communities (Nedeau, 2003; McClenachan et al., 2015).
However, these fisheries have significantly declined in the last several decades due in large part, to the
construction and maintenance of dams and the subsequent fragmentation of riverine habitat (Hall et al.,
2011). As such, river herring conservation has become a high priority for fishery managers,
conservationists, Tribal Governments, and local communities. Successful passage through dams, without
injury, is critical for individual survival and population recovery. Numerous studies have assessed
passage success for upstream migrating adults (See Bunt et al., 2011), representing one important
component of their in-river life stage. Assessing downstream passage for out-migrating juveniles,
however, presents unique challenges and is less informed (Silva et al., 2018). Therefore, the ability to
assess downstream migratory passage is key for meeting management goals.
Downstream passage through hydropower facilities is achieved through three primary routes:
turbine intakes, spillways, and fish bypass systems. Each can cause reductions in fitness (e.g., mortality,
injury, and delay) through immediate and delayed means. These may include rapid pressure changes,
cavitation, turbine strikes, shear stress, barotrauma, turbulence, and the compounded effects of
multiple dams (FWS region 5, 2019). Passage facilities invariably differ among hydropower projects,
creating the need to assess effectiveness for a range of passage structures.
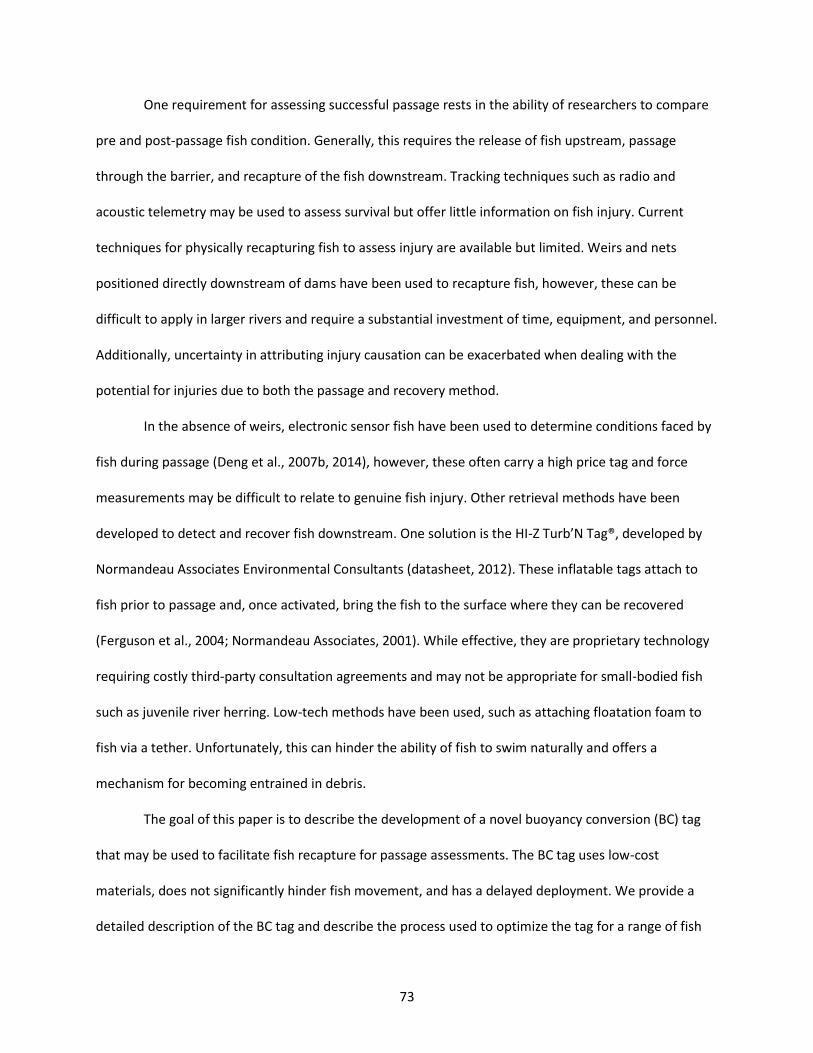
73
One requirement for assessing successful passage rests in the ability of researchers to compare
pre and post-passage fish condition. Generally, this requires the release of fish upstream, passage
through the barrier, and recapture of the fish downstream. Tracking techniques such as radio and
acoustic telemetry may be used to assess survival but offer little information on fish injury. Current
techniques for physically recapturing fish to assess injury are available but limited. Weirs and nets
positioned directly downstream of dams have been used to recapture fish, however, these can be
difficult to apply in larger rivers and require a substantial investment of time, equipment, and personnel.
Additionally, uncertainty in attributing injury causation can be exacerbated when dealing with the
potential for injuries due to both the passage and recovery method.
In the absence of weirs, electronic sensor fish have been used to determine conditions faced by
fish during passage (Deng et al., 2007b, 2014), however, these often carry a high price tag and force
measurements may be difficult to relate to genuine fish injury. Other retrieval methods have been
developed to detect and recover fish downstream. One solution is the HI-Z Turb’N Tag®, developed by
Normandeau Associates Environmental Consultants (datasheet, 2012). These inflatable tags attach to
fish prior to passage and, once activated, bring the fish to the surface where they can be recovered
(Ferguson et al., 2004; Normandeau Associates, 2001). While effective, they are proprietary technology
requiring costly third-party consultation agreements and may not be appropriate for small-bodied fish
such as juvenile river herring. Low-tech methods have been used, such as attaching floatation foam to
fish via a tether. Unfortunately, this can hinder the ability of fish to swim naturally and offers a
mechanism for becoming entrained in debris.
The goal of this paper is to describe the development of a novel buoyancy conversion (BC) tag
that may be used to facilitate fish recapture for passage assessments. The BC tag uses low-cost
materials, does not significantly hinder fish movement, and has a delayed deployment. We provide a
detailed description of the BC tag and describe the process used to optimize the tag for a range of fish

74
sizes, specifically for juvenile river herring (32-152 mm). This work is intended for the public domain and
is meant to be highly adaptable for use with many fish species and life stages.
Methods
Tag Optimization
Early work tested a novel buoyancy conversion (BC) tag. Work on this tagging approach was
promising; the tags deployed as hoped and in a stream setting fish were easily recaptured. However, the
pilot deployment ceased after the first field trials because of the challenge in recapturing the juvenile
fish in the Penobscot River, Maine. In deeper water, river herring were able to keep the float submerged
for a sustained period of time and evade those in a boat attempting to recapture the fish.
Phase II, reported here, was invested in optimizing the current tag design to counteract the
pulling force that fish exert. In order to calibrate the weight and size specifications for the tag necessary
for fish retrieval, we measured the downward swimming force for a range of fish sizes that would be
comparable to the variance found in wild river herring populations. Due to the restricted availability of
juvenile river herring, shiners (n=77) were used as a proxy (“Shiners” included common shiner (Luxilus
cornutus) and emerald shiner (Erimyzon oblongus)). While behavioral traits and restrictions on wild
release excluded shiners from being used in field trials, they functioned appropriately as a
morphological and behavioral analog in laboratory testing. Shiners were purchased from a local provider
and were known to be wild-caught. The use of commercially available fish allowed us to select for, and
assess, a range of sizes. Because of injuries incurred during the lab experiments and the non-
native/captive nature of commercially purchased fish, all subjects were euthanized upon completion.
Laboratory testing included placing each fish in a 110-liter tank. They were tethered to an
anchored Trobal FB10 Force Gauge (Scientific Industries Inc. 80 Orville Dr. Bohemia, NY 11716) by a
hook placed through the musculature caudal to the dorsal fin and a length of fishing line. Fish were
allowed to swim for 40 seconds, during which time researchers encouraged a flight response from the

75
fish causing them to swim in a consistent direction. Force measurements for all trials were recorded at
0.05-second intervals (n = 800 measurements per fish) and compiled. A force curve was generated as a
function of mass (g) versus the maximum swimming force (N) that was achieved. Measurements were
used to determine the buoyant force necessary to overcome the maximum swimming force allowing for
the calibration of the weight and size specifications for the BC tag. The 0.90 quantile was chosen to
functionally represent the upper bounds required for tag sizing relative to fish size.
Results
Sampled fish ranged in weight from 1.5 to 25.8 grams and length from 56 to 121 mm (Figure
3.1). All fish displayed instances of inactivity where the minimum force equaled zero. The maximum
force ranged from 0.010 to 1.981 Newtons of force. Fish under five grams were generally unable to
swim continuously while anchored. They did not exhibit a strong pulling ability and ceased swimming
before the end of the trials. The weight of the hook used itself, prevented movement in these fish. Fish
larger than five grams were able to swim more consistently and exhibited short bursts of flight at
irregular intervals. The 90th quantile was derived from the maximum force measurements (Figure 3.2).
It’s important to note that we used simplified calculations to measure buoyancy and swimming force.
These calculations did not account for variables such as drag, water flow, and changes in water density.
However, we argue that the calculations used provide a reasonable approximation of actual conditions.
As a rule, tags should be scaled up to account for this variation and further testing is encouraged.
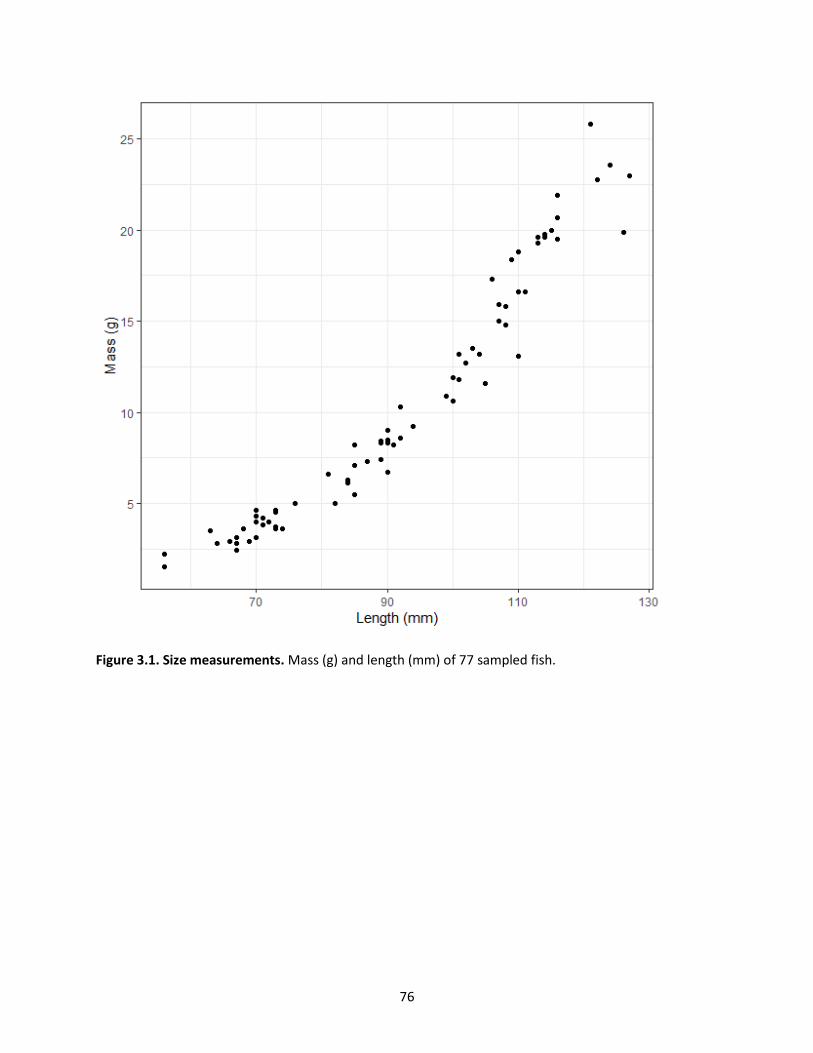
76
Figure 3.1. Size measurements. Mass (g) and length (mm) of 77 sampled fish.

77
Figure 3.3. Maximum force measurements. Maximum force achieved by fish during 40 second pulling trials as measured by a digital force gauge. The relative strength that fish exhibit increases with size. The 0.90 quantile was chosen to functionally represent the upper bounds required for tag sizing relative to fish size.

78
Buoyancy Conversion Tag Description
The inactivated floatation device is fastened to the fish by means of a tether, consisting of nylon
monofilament, typically fishing line (Figure 3.3). The tether is attached to a hook which is inserted
through the musculature of the fish, preferably below the posterior edge of the dorsal fin. Other
methods of attachment may be applied, such as the use of a piercing gun or needle. The floatation
device at the opposite end of the tether is constructed of a non-proteinaceous Hydroxypropyl Methyl
Cellulose capsule which is water soluble. Collagen derived, typically gelatin, capsules may be used in
warm water, however they exhibit restricted solubility in water below 30 °C. Inside the capsule is a
segment of foam (21 x 10 mm), preferably a cylinder matched to the diameter of the capsule. The foam
is attached to the tether by a needle passed through and tied off. It is recommended that the remaining
length of the tether is coiled independent from the foam and placed freely in the capsule. Coiling the
tether around the foam results in snags and may inhibit deployment. Weights, typically non-toxic metal
shot, are added to the capsule to counteract the buoyancy of the foam, keeping it neutral in the water
column.
The key benefit of the BC tag is its capacity for delayed deployment until after passage through
an obstacle. It may be desirable to increase or decrease the rate at which the capsule dissolves. Factors
that affect the dissolution rate include capsule material, capsule thickness, and water temperature.
During our trials, tags reliably deployed within five minutes. Initially the tag is neutrally buoyant and
trails behind the fish. The tag is small and moves freely, thus, does not impede normal swimming
behavior. Upon dissolution of the capsule, the foam is released to float to the surface providing a visual
indicator of fish location, facilitating fish retrieval. Because the fish remains below water, trauma to the
fish using this method is minimized. Best results can be obtained if the BC tag is sized to the swimming
strength of the fish based on general length measurements. The size of individual components (e.g.
capsules, foam, tethers, weights, and hooks) may be customized to suit research needs.

79
Figure 3.3. Buoyancy conversion tag deployment. Indicators are meant to (a) attach through the musculature of fish using a standard lead-free hook with monofilament line, (b) remain neutrally buoyant during obstacle passage, and (c) deploy after 5 minutes for recapture by researchers. In cold water, tags must be made from cellulose capsules in order for the release of the foam to occur.
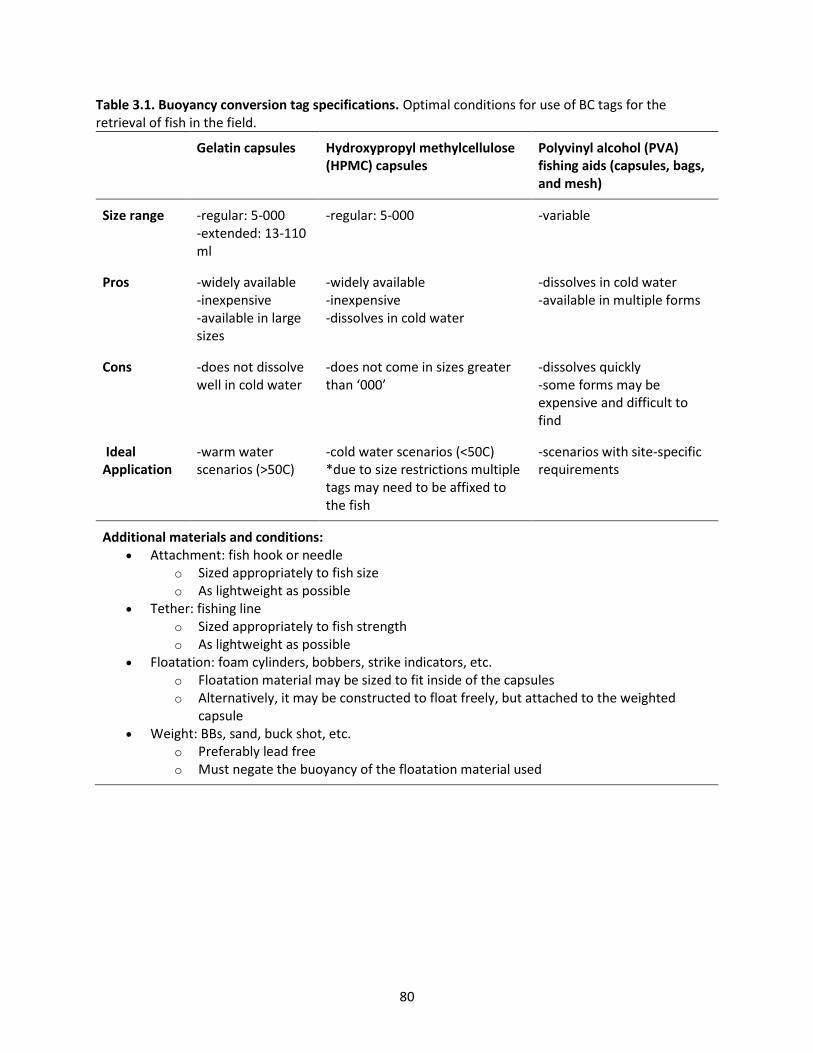
80
Table 3.1. Buoyancy conversion tag specifications. Optimal conditions for use of BC tags for the retrieval of fish in the field.
Gelatin capsules Hydroxypropyl methylcellulose
(HPMC) capsules Polyvinyl alcohol (PVA) fishing aids (capsules, bags, and mesh)
Size range -regular: 5-000 -extended: 13-110 ml
-regular: 5-000 -variable
Pros -widely available -inexpensive -available in large sizes
-widely available -inexpensive -dissolves in cold water
-dissolves in cold water -available in multiple forms
Cons -does not dissolve well in cold water
-does not come in sizes greater than ‘000’
-dissolves quickly -some forms may be expensive and difficult to find
Ideal Application
-warm water scenarios (>50C)
-cold water scenarios (<50C) *due to size restrictions multiple tags may need to be affixed to the fish
-scenarios with site-specific requirements
Additional materials and conditions: • Attachment: fish hook or needle
o Sized appropriately to fish size o As lightweight as possible
• Tether: fishing line o Sized appropriately to fish strength o As lightweight as possible
• Floatation: foam cylinders, bobbers, strike indicators, etc. o Floatation material may be sized to fit inside of the capsules o Alternatively, it may be constructed to float freely, but attached to the weighted
capsule • Weight: BBs, sand, buck shot, etc.
o Preferably lead free o Must negate the buoyancy of the floatation material used

81
Future Development
The Penobscot River Restoration Project (PRRP) facilitated the removal of two dams and other
passage improvements aimed at restoring sea-run fish to the Penobscot River. Among its outcomes, the
PRRP led to the installation of a nature-like fish bypass at the Howland Dam in Howland, Maine. This
type of dam infrastructure is generally seen as the gold standard in fish passage for reducing mortality
and injury, however, this has not been confirmed at the Howland Bypass. Downstream passage for fish
may be through either the nature-like bypass or a concrete sluiceway that includes a 1.5-meter drop.
The BC tag will be used to assess fish injury through both structures. This will further contribute to our
overall understanding of fish passage in the Penobscot River and provide a guide for those engaging in
similar passage assessments. This proof of concept will be demonstrated through field trial.
A maximum of 300 river herring, will be captured using dip-netting from the Saudapscook River
in Maine. Because of their similar morphology and life history, both species will be used, however,
alewife are expected to be taken more frequently due to being more common in Maine rivers. River
herring will be transported to the Howland Bypass for field tests which include three release treatments
(e.g., T1 = nature-like bypass; T2 = concrete sluiceway; T3 = control). Fish in T1 and T2 will be released
into the beginning of the bypass/sluiceway while T3 will be released directly into the Howland tailrace,
thereby avoiding all dam infrastructure. Fish will be released with minimal disturbance and handling. All
fish will be recovered in the tailrace after BC tag deployment.
Groups of 10 fish will be processed at a time, rotating through each treatment type until gone.
Prior to release, the BC tags will be affixed to the fish at an attachment point through the musculature
medial to the dorsal fin. Each fish and corresponding tag will be kept in an individual container to avoid
tag entanglement and allow the tags to begin softening. Fish will be released directly into the water,
where directional flow is expected to encourage movement downstream. If possible, fish may be visually
tracked through their downstream movement. Once the tag is deployed, this float will encourage fish to

82
swim near the water surface for recapture. In the tailrace, researchers will be situated onshore and in
canoes to sight and capture the deployed tags. In order to prevent the possibility of scale loss and
damage associated with confinement post-trial, all subjects will be euthanized upon recapture using
approved AVMA procedures. Physical assessments will be taken post-mortem to assess any injury
incurred during downstream passage. Comparison of passage type will be done using one-way ANOVA
followed by a Tukey’s post hoc test. Data transformations will be conducted as needed to meet the
assumptions of normality and homogeneity of variance. Significance will be assessed at 0.05.

83
REFERENCES
American Rivers v. FERC, Nos. 16-1195, 16-2336, ---- F.3d ----, 2018 WL 3320870 at *1 (D.C. Cir. July 6, 2018) Anderson, E.P., Freeman, M.C., Pringle, C.M., 2006. Ecological consequences of hydropower development in Central America: Impacts of small dams and water diversion on neotropical stream fish assemblages. River Research and Applications 22:4, 397-411. Ansell, C., Gash, A., 2007. Collaborative governance in theory and practice. Journal of Public Administration Research and Theory 18, 543-571. (ASMFC) Atlantic States Marine Fisheries Commission, 2019. American eel species page. Web resource asmfc.org/species/American-eel. Blumm, M.C., Lang, A., 2015. Shared sovereignty: The role of expert agencies in environmental law. Ecology Law Quarterly 42:3, 609–650. Bowen, G.A., 2009. Document analysis as a qualitative research method. Qualitative Research Journal 9:2, 27-40. Bunt, C.M., Castro-Santos, T., Haro, A., 2011. Performance of fish passage structures at upstream barriers to migration. River Research and Applications. Cada, G.F., Sale, M.J., 1993. Status of fish passage facilities at nonfederal hydropower projects. Fisheries 18, 4–12. Costa, M., Desmarais, B.A., Hird, J.A., 2016. Science use in regulatory impact analysis: The effects of political attention and controversy. Review of Policy Research 33:3, 251–269. Creswell, J.W., Plano Clark, V.L., 2011. Designing and Conducting Mixed Methods Research, 2nd ed. SAGE Publications. Curtis, T.L., Buchanan, H., 2019. Basin-wide approaches to hydropower relicensing: Case studies and considerations. Colden, CO: National Renewable Energy Laboratory. NREL/TP-6A20-71979. Daniel Pollak, 2007. S.D. Warren and the erosion of Federal preeminence in hydropower regulation. Ecology Law Quarterly 34, 763-800. Deng, Z.D., Lu, J., Myjak, M.J., Martinez, J.J., Tian, C., Morris, S.J., Carlson, T.J., Zhou, D., Hou, H., 2014. Design and implementation of a new autonomous sensor fish to support advanced hydropower development. Review in Scientific Instruments 85:11. Dillman, D.A., Smyth, J.D., Christian, L.M., 2014. Internet, phone, mail, and mixed-mode surveys; the tailored design method. SAGE Publications.

84
Dincer, I., Acar, C., 2015. A review on clean energy solutions for better sustainability. International Journal of Energy Research 39:5, 585–606. Ding, H., Song, X., Chen, L., Zheng, X., Jiang, G., 2018. The 100 most-cited papers in general thoracic surgery: A bibliography analysis. International Journal of Surgery 53, 230–238. Emerson, K., Nabatchi, T., Balogh, S., 2012 An integrative framework for collaborative governance. Journal of Public Administration Research 22, 1-29. Englich, B., Mussweiler, T., Strack, F., 2006. Playing dice with criminal sentences: The influence of irrelevant anchors on experts’ judicial decision making. Personality and Social Psychology Bulletin 32, 188–200. Etikan, I., Musa, S.A., Alkassim, R.S., 2016. Comparison of convenience sampling and purposive sampling. Journal of Nursing. Fuller, M.R., Doyle, M.W., Strayer, D.L., 2015. Causes and consequences of habitat fragmentation in river networks. Annals of the New York Academy of Sciences 1355, 31–51. (FERC) Federal Energy Regulatory Commission, 2017a. Policy statement on establishing license terms for hydroelectric projects. Washington, D.C. FERC, 2017b. Hydropower primer: A handbook of hydropower basics. Washington, D.C. FERC, 2001. Hydropower licensing and endangered species: A guide for applicants, contractors, and staff. Washington, D.C. Furnham, A., Boo, H.C., 2011. A literature review of the anchoring effect. Journal of Socio-Economics 40, 35–42. Gibson, R.J., 2017. Salient needs for conservation of Atlantic salmon. Fisheries 42, 163–174. Gilchrist, V.J., Williams, R.L., 2009. Key informant interviews, in: Crabtree, B.F., Miller, W.L. (Eds.), Doing Qualitative Research. SAGE Publications, Inc., pp. 4244–4244. Graf, W.L., 2005. Geomorphology and American dams: The scientific, social, and economic context. Geomorphology 71, 3–26. Hall, J.L., Jennings, E.T., 2010. Assessing the use and weight of information and evidence in U.S. state policy decisions. Policy and Society 29, 137–147. Hall, C.J., Jordaan, A., Frisk, M.G., 2011. The historic influence of dams on diadromous fish habitat with a focus on river herring and hydrologic longitudinal connectivity. Landscape Ecology 26, 95–107. Holmes, J., Clark, R., 2008. Enhancing the use of science in environmental policy-making and regulation. Environmental Science and Policy 11, 702–711.

85
Houston, R., Chadbourne, K., Lary, S., Charry, B., 2007. Geographic distribution of diadromous fish in Maine. Falmouth, Maine: U.S. Wish and Wildlife Service, Gulf of Maine Coastal Program. Izzo, L.K., Maynard, G.A., Zydlewski, J., 2016. Upstream movements of Atlantic salmon in the lower Penobscot River, Maine following two dam removals and fish passage modifications. Marine and Coastal Fisheries 8, 448–461. Jari Oksanen, F. Guillaume Blanchet, Michael Friendly, Roeland Kindt, Pierre Legendre, Dan McGlinn, Peter R. Minchin, R. B. O'Hara, Gavin L. Simpson, Peter Solymos, M. Henry H. Stevens, Eduard Szoecs and Helene Wagner (2019). vegan: Community ecology package. R package version 2.5-6. Jellyman, D.J., Arai, T., 2016. Juvenile eels: Upstream migration and habitat use. In: Biology and Ecology of Anguillid Eels. Editor: Arai, T. Taylor & Francis Group. Boca Raton, FL. Jennings, E.T., Hall, J.L., 2012. Evidence-based practice and the use of Information in state agency decision making. Journal of Public Administration Research and Theory 22, 245–266. Johnson, E.S, Bell, K.P., Leahy, J.E., 2017. Changing course: Comparing emerging watershed institutions in river restoration contexts. Society & Natural Resources. 30:6, 765-781 Kiraly, I.A., Coghlan, S.M., Zydlewski, J., Hayes, A.D., 2014. An assessment of fish assemblage structure in a large river. River Research and Applications. Kochalski, S., Riepe, C., Fujitani, M., Aas, Ø., Arlinghaus, R., 2019. Public perception of river fish biodiversity in four European countries. Conservation Biology 33, 164–175. Koontz, T.M., Thomas, C.W., 2018. Use of science in collaborative environmental management: Evidence from local watershed partnerships in the Puget Sound. Environmental Science and Policy 88, 17–23. Kosnik, L.R.D., 2006. Sources of bureaucratic delay: A case study of FERC dam relicensing. Journal of Law, Economics, and Organization 22, 258–288. Kosnik, L., 2010. Time to pick a fight interest group decision making to enter the hydropower regulatory process. Eastern Economics Journal 36, 11–32. Krippendorff, K., 2018. Content Analysis: An Introduction to Its Methodology. SAGE Publications. Kristensen, H., Gärling, T., 1997. The effects of anchor points and reference points on negotiation process and outcome. Organizational Behavior and Human Decision Processes 71, 85–94. Lavrarkas, P.J., 2008. Encyclopedia of Survey Research Methods. SAGE Publications, Inc., p. 1072. Liaw, A., Wiener, M. 2002. Classification and regression by randomForest. R News 2:3, 18--22. Limburg, K.E., Waldman, J.R., 2009. Dramatic declines in North Atlantic diadromous fishes. Bioscience 59, 955–965.
86
Linnansaari, T., Wallace, B., Curry, R.A., Yamazaki, G., 2015. Fish passage in large rivers: A literature review. Mactaquac Aquatic Ecosystem Study Report Series 2015-016. Canadian Rivers Institute, University of New Brunswick 55. Lowell, N., Kelly, R.P., 2016. Evaluating agency use of “best available science” under the United States Endangered Species Act. Biological Conservation 196, 53–59. Maynard, G.A., Izzo, L.K., Zydlewski, J.D., 2018. Movement and mortality of Atlantic salmon kelts (Salmo salar) released into the Penobscot River, Maine. Fisheries Bulletin 116, 281–290. McClenachan, L., Lovell, S., Keaveney, C., 2015. Social benefits of restoring historical ecosystems and fisheries: Alewives in Maine. Ecology and Society 20. Meho, L.I., 2007. The rise and rise of citation analysis. Physics World. Murphy, D.D., Weiland, P.S., 2016. Guidance on the use of best available science under the U.S. Endangered Species Act. Environmental Management 58, 1–14. NASCO, 2019. NASCO: The North Atlantic Salmon Conservation Organization [WWW Document]. URL http://www.nasco.int/index.html (accessed 5.26.19). National Academies Press, 2015. Improving the use of the “best scientific information available” standard in fisheries management. National Academies Press, Washington, D.C. Nedeau, E., 2003. The amazing alewife. The Gulf of Maine Times 7. Nieland, J.L., Sheehan, T.F., Saunders, R., 2015. Assessing demographic effects of dams on diadromous fish: a case study for Atlantic salmon in the Penobscot River, Maine. ICES Journal of Marine Science: Journal du Conseil 72, 2423–2437. Noonan, M.J., Grant, J.W.A., Jackson, C.D., 2012. A quantitative assessment of fish passage efficiency. Fish and Fisheries. 13, 450–464. (NRCM) Natural Resources Council of Maine, 2019. Penobscot River Restoration Project website. Nrcm.org/programs/waters/Penobscot-river-restoration-project/ Nyqvist, D., Greenberg, L.A., Goerig, E., Calles, O., Bergman, E., Ardren, W.R., Castro-Santos, T., 2017. Migratory delay leads to reduced passage success of Atlantic salmon smolts at a hydroelectric dam. Ecology of Freshwater Fish 26, 707–718. Olden, J.D., 2015. Challenges and opportunities for fish conservation in dam-impacted waters. Conservation of Freshwater Fishes. pp. 107–148. Opperman, J.J., Royte, J., Banks, J., Day, L.R., Apse, C., 2011. The Penobscot River, Maine, USA: A basin-scale approach to balancing power generation and ecosystem restoration. Ecology and Society 16, 04.

87
Poff, N.L., Olden, J.D., Merritt, D.M., Pepin, D.M., 2007. Homogenization of regional river dynamics by dams and global biodiversity implications. Proceedings of the National Academy of Sciences 104, 5732–5737. Porter, J.J., Birdi, K., 2018. 22 reasons why collaborations fail: Lessons from water innovation research. Environmental Science and Policy 89, 100–108. Pracheil, B.M., DeRolph, C.R., Schramm, M.P., Bevelhimer, M.S., 2016. A fish-eye view of riverine hydropower systems: the current understanding of the biological response to turbine passage. Reviews in Fish Biology and Fisheries 26:2, 153-167. Pudry, J.M., 2012. Framework for assessing power in collaborative governance processes. Public Administration Review 72, 409–417. R Core Team (2019). R: A language and environment for statistical computing. R Foundation for Statistical Computing, Vienna, Austria. URL https://www.R-project.org/ Richardson, S.C., 2000. The changing political landscape of hydropower project relicensing. William Mary Environmental Law Policy Review 25, 499–531. Roscoe, D.W., Hinch, S.G., 2010. Effectiveness monitoring of fish passage facilities: Historical trends, geographic patterns and future directions. Fish and Fisheries 11, 12–33. Roy, S.G., Uchida, E., de Souza, S.P., Blachly, B., Fox, E., Gardner, K., Gold, A.J., Jansujwicz, J., Klein, S., McGreavy, B., Mo, W., Smith, SM.C., Vogler, E., Wilson, K., Zydlewski, J., Hart., D., 2018. A multiscale approach to balance trade-offs among dam infrastructure, river restoration, and cost. Proceedings of the National Academy of Sciences 201807437. Silva, A.T., Lucas, M.C., Castro-Santos, T., Katopodis, C., Baumgartner, L.J., Thiem, J.D., Aarestrup, K., Pompeu, P.S., O’Brien, G.C., Braun, D.C., Burnett, N.J., Zhu, D.Z., Fjeldstad, H.-P., Forseth, T., Rajaratnam, N., Williams, J.G., Cooke, S.J., 2018. The future of fish passage science, engineering, and practice. Fish and Fisheries 19, 340–362. Song, C., O’Malley, A., Roy, S.G., Barber, B.L., Zydlewski, J., Mo, W., 2019. Managing dams for energy and fish tradeoffs: What does a win-win solution take? Science of the Total Environment 669, 833-843. Sullivan, P.J., Acheson, J.M., Angermeier, P.L., Faast, T., Flemma, J., Jones, C.M., Knudesen, E.E., Minello, T.J., Secor, D.H., Wunderlich, R., Zanetell, B.A., 2006. Defining and implementing best available science for fisheries and environmental science, policy, and management. Fisheries 31, 460–465. Turek, J., Haro, A., Towler, B., 2016. Federal Interagency Nature-like Fishway Passage Design Guidelines for Atlantic Coast Diadromous Fishes. Interagency Technical Memorandum 47 p. Ulibarri, N., 2015. Tracing process to performance of collaborative governance: A comparative case study of Federal hydropower licensing. Policy Studies Journal 43, 283–308. US EPA, 2018. Fiscal Year 2018-2022, U.S. EPA Strategic Plan. Washington, D.C.

88
Van Mol, C., 2017. Improving web survey efficiency: the impact of an extra reminder and reminder content on web survey response. International Journal of Social Research Methodology 20, 317–327. Vaske, J.J., Beaman, J., Barreto, H., Shelby, L., 2010. An extension and further validation of the potential for conflict index. Leisure Sciences 32, 240–254. Watson, J.M., Coghlan, S.M., Zydlewski, J., Hayes, D.B., Kiraly, I.A., 2018. Dam removal and fish passage improvement influence fish assemblages in the Penobscot River, Maine. Transactional of the American Fisheries Society 147, 525-540. Williams, J.G., Armstrong, G., Katopodis, C., Larinier, M., Travade, F., 2012. Thinking like a fish: A key ingredient for development of effective fish passage facilities at river obstructions. River Research and Applications 28, 407-417.
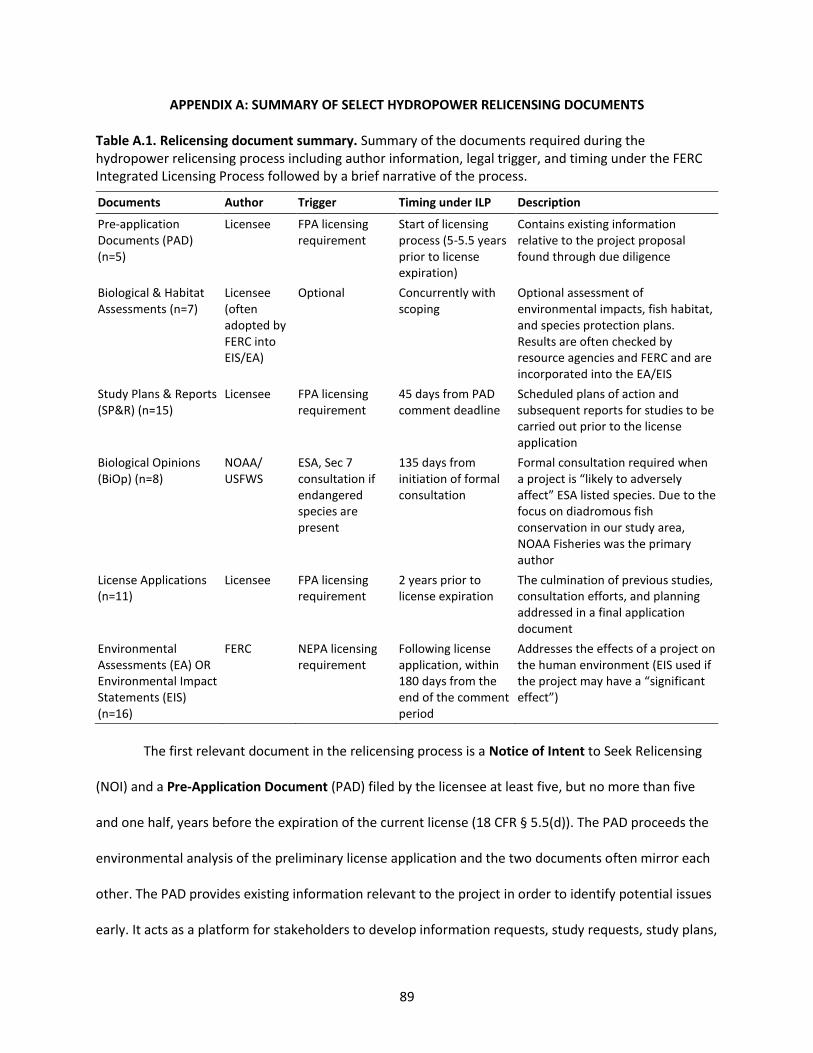
89
APPENDIX A: SUMMARY OF SELECT HYDROPOWER RELICENSING DOCUMENTS
Table A.1. Relicensing document summary. Summary of the documents required during the hydropower relicensing process including author information, legal trigger, and timing under the FERC Integrated Licensing Process followed by a brief narrative of the process.
The first relevant document in the relicensing process is a Notice of Intent to Seek Relicensing
(NOI) and a Pre-Application Document (PAD) filed by the licensee at least five, but no more than five
and one half, years before the expiration of the current license (18 CFR § 5.5(d)). The PAD proceeds the
environmental analysis of the preliminary license application and the two documents often mirror each
other. The PAD provides existing information relevant to the project in order to identify potential issues
early. It acts as a platform for stakeholders to develop information requests, study requests, study plans,
Documents Author Trigger Timing under ILP Description
Pre-application Documents (PAD) (n=5)
Licensee FPA licensing requirement
Start of licensing process (5-5.5 years prior to license expiration)
Contains existing information relative to the project proposal found through due diligence
Biological & Habitat Assessments (n=7)
Licensee (often adopted by FERC into EIS/EA)
Optional Concurrently with scoping
Optional assessment of environmental impacts, fish habitat, and species protection plans. Results are often checked by resource agencies and FERC and are incorporated into the EA/EIS
Study Plans & Reports (SP&R) (n=15)
Licensee FPA licensing requirement
45 days from PAD comment deadline
Scheduled plans of action and subsequent reports for studies to be carried out prior to the license application
Biological Opinions (BiOp) (n=8)
NOAA/ USFWS
ESA, Sec 7 consultation if endangered species are present
135 days from initiation of formal consultation
Formal consultation required when a project is “likely to adversely affect” ESA listed species. Due to the focus on diadromous fish conservation in our study area, NOAA Fisheries was the primary author
License Applications (n=11)
Licensee FPA licensing requirement
2 years prior to license expiration
The culmination of previous studies, consultation efforts, and planning addressed in a final application document
Environmental Assessments (EA) OR Environmental Impact Statements (EIS) (n=16)
FERC NEPA licensing requirement
Following license application, within 180 days from the end of the comment period
Addresses the effects of a project on the human environment (EIS used if the project may have a “significant effect”)

90
and to prepare additional documents. Licensees are not required to conduct studies at this stage but
must exercise due diligence in organizing information and describing the existing environmental and
potential impacts of the project. Sources of information included in the descriptions and summaries
must be referenced in the document and made available upon request.
Within 60 days of the NOI and PAD, FERC is required to provide a Scoping Document and Notice
of Commencement (18 CFR § 5.8(c)). These documents 1) summarize the procedures of the licensing
process, including formal means of participation, 2) describe the project, proposed protection and
enhancement measures, and possible alternatives, and 3) identify resource issues to be analyzed,
including the consideration of cumulative impacts. The Scoping Document also provides a schedule of
the licensing process and incorporates the coordination of federal, state, and tribal permitting process.
Comments on the PAD and Scoping Document and study requests are encouraged within 60 days of the
Notice of Commencement (18 CFR § 5.9(a)). A second Scoping Document may be issued if deemed
necessary (18 CFR § 5.10).
In the ILP, pre-filing consultation is conducted concurrently with NEPA scoping. The filing of the
NOI and PAD initiate both FERC scoping and mandatory consultation efforts. Endangered Species Act
(ESA) Section 7 consultations and Fish Habitat assessments are such requirements. ESA consultations
determine if a project will adversely affect a threatened or endangered species, allowing USFWS and
NOAA to establish reasonable and prudent alternatives (RPA) or measures (RPM) (ESA Section 7(a)(2)).
ESA consultation may remain informal unless the project is found to adversely affect the listed species
or its designated critical habitat (50 CFR 402.02 and 402.13). A Biological Assessment, prepared by
FERC, determines potential effects, resulting in an assessment of “no effect,” “may effect, but is not
likely to adversely affect,” or “may affect, and is likely to adversely affect.” Though FERC is ultimately
responsible for this determination, the licensee may optionally prepare their own biological assessments

91
and fish habitat assessments. These are often integrated into FERC’s Biological Assessments and
concurrent Environmental Assessments/Environmental Impact Statements.
If a determination of “may affect, and is likely to adversely affect,” an endangered species is
made, USFWS or NOAA prepares an incidental take statement and a Biological Opinion (BiOp). The BiOp
includes a description of the proposed action, the status of the endangered species and its critical
habitat, environmental baselines, cumulative effects of the proposed action, the agencies conclusion of
jeopardy or no jeopardy, and reasonable and prudent alternatives. The BiOp must be delivered within
135 days of the initiation of formal consultation.
A Study Plan is submitted by the licensee within 45 days from the PAD comment deadline. It
includes detailed descriptions of the proposed studies, schedules for completion, provisions for progress
reports, and explanations for rejecting requested studies (18 CRF § 5.11(a)). It must describe study goals
and objectives, address known resource management goals, describe existing information concerning
the study system, explain direct, indirect, and cumulative operational effects, support proposed
methodology, and describe considerations for cost and effort (18 CRF § 5.11(b)). Comments are
encouraged for 90 days following the issuance of the proposed Study Plan (18 CFR § 5.12) and requests
for additional studies must be accompanied by substantial reasoning. A revised Study Plan is issued by
the licensee in response to comments within 30 days of the commenting deadline (18 CFR § 5.13(a)) and
FERC makes a determination. Study disputes may only be made by agencies with the authority to
provide mandatory license conditions under section 4(e) and 18 of the Federal Power Act or section 401
of the Clean Water Act (18 CFR § 5.14(a)) and are subject to panel review.
Study Reports follow the implementation of the final study plan (18 CFR § 5.15(a)). Study
progress, data collection, explanation of variance, and proposed new studies must be reported no later
than 1 year after FERC approval of the study plan (18 CFR § 5.15(c)). A study meeting must be held with
agencies and FERC staff within 15 days of the initial study report with a meeting summary produced by

92
the licensee within 15 days of the meeting. Participants of the meeting can file disagreements about the
meeting summary within 30 days which FERC resolves. If no disagreements are raised, the contents of
the report are deemed approved. New studies may be requested at any time with an explanation of why
the request as not made earlier and why the new study is necessary (18 CFR 5.15(d)). FERC determines if
a new study should be conducted.
The licensee must submit a preliminary License Application proposal 2 years prior to the
expiration of the current license (18 CFR 5.16(a)). Applications describe the existing and proposed
project facilities, describe existing and proposed operation and maintenance plan, and include the
licensee’s draft environmental analysis with study results. They are required to include measures and
plans to protect, mitigate, or enhance environmental resources. Stakeholders may comment on the
license application within 90 days of its filing (18 CFR 5.16(e)), including recommendations on whether
an Environmental Assessment or Environmental Impact Statement should be constructed by FERC. The
final license application must address ESA consultation, MSA consultation, and CWA water quality
certification. Additionally, it must address the Coastal Zone Management Act, National Historic
Preservation Act, and Wild and Scenic Rivers and Wilderness Acts authorities.
Once a license application is accepted, FERC issues a Notice of Acceptance and Readiness for
Environmental Analysis at which time comments are invited within 60 days (18 CFR 5.23(a)). Mandatory
terms and conditions, prescribed by applicable agencies must also be filed within 60 days. These include
Forest Service conditions (16 USC 796(2)), Comprehensive Plan conditions (FPA Section 10(a),
preliminary fish and wildlife recommendations by USFWS and NOAA (FPA Section 10(j)), mandatory
fishway prescriptions by the Secretaries of Commerce and the Interior (FPA Section 18), and Agency
Conditions and Recommendations provided by other agencies. Taking these recommendations and
comments into consideration, a draft Environmental Assessment (EA) or Environmental Impact
Statement (EIS) is prepared by FERC pursuant to the National Environmental Policy Act (NEPA). It must

93
include draft license articles, determinations in regards to agency recommendations, and preliminary
terms and conditions and fishway prescriptions. Participating agencies may amend recommendations
(18 CFR 5.25(d)) and a final EA issued.
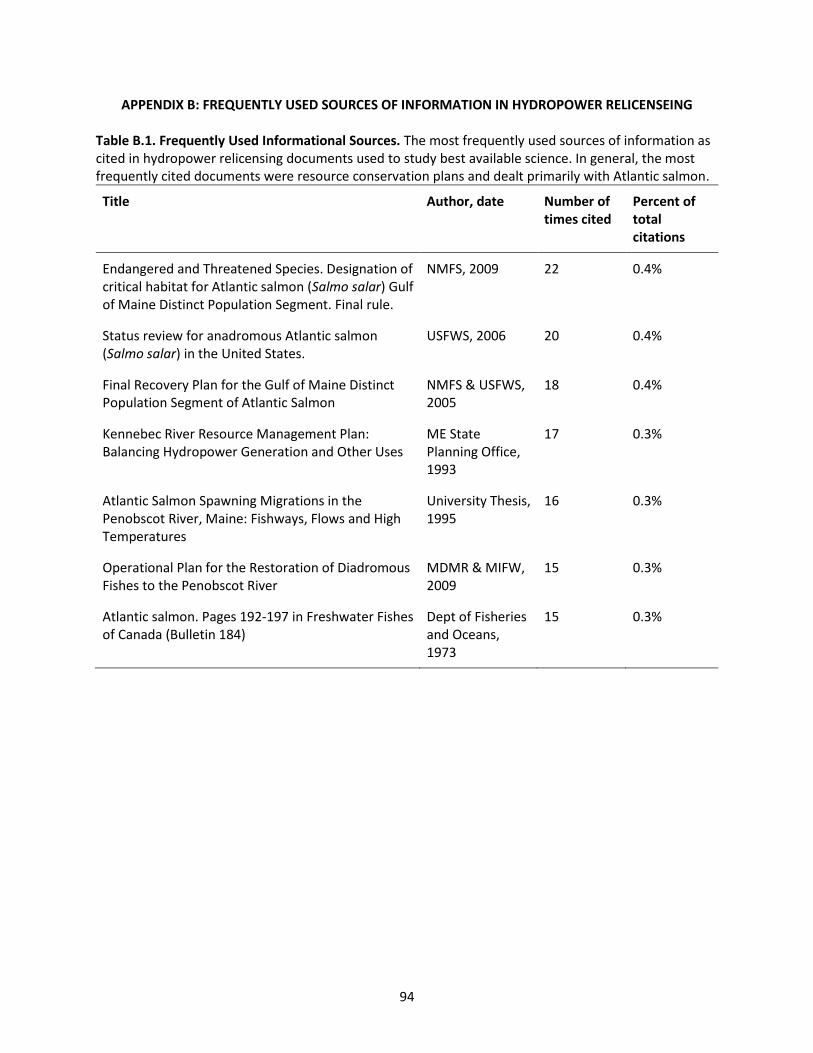
94
APPENDIX B: FREQUENTLY USED SOURCES OF INFORMATION IN HYDROPOWER RELICENSEING
Table B.1. Frequently Used Informational Sources. The most frequently used sources of information as cited in hydropower relicensing documents used to study best available science. In general, the most frequently cited documents were resource conservation plans and dealt primarily with Atlantic salmon.
Title Author, date Number of times cited
Percent of total citations
Endangered and Threatened Species. Designation of critical habitat for Atlantic salmon (Salmo salar) Gulf of Maine Distinct Population Segment. Final rule.
NMFS, 2009 22 0.4%
Status review for anadromous Atlantic salmon (Salmo salar) in the United States.
USFWS, 2006 20 0.4%
Final Recovery Plan for the Gulf of Maine Distinct Population Segment of Atlantic Salmon
NMFS & USFWS, 2005
18 0.4%
Kennebec River Resource Management Plan: Balancing Hydropower Generation and Other Uses
ME State Planning Office, 1993
17 0.3%
Atlantic Salmon Spawning Migrations in the Penobscot River, Maine: Fishways, Flows and High Temperatures
University Thesis, 1995
16 0.3%
Operational Plan for the Restoration of Diadromous Fishes to the Penobscot River
MDMR & MIFW, 2009
15 0.3%
Atlantic salmon. Pages 192-197 in Freshwater Fishes of Canada (Bulletin 184)
Dept of Fisheries and Oceans, 1973
15 0.3%

95
APPENDIX C: USE OF SCIENTIFIC KNOWLEDGE IN HYDROPOWER RELICENSING QUESTIONNAIRE
Use of Scientific Knowledge in
Hydropower Relicensing
Developed by:
Sarah K. Vogel
Dr. Joseph Zydlewski
Dr. Jessica S. Jansujwicz

96
STRENGTHENING THE SCIENTIFIC BASIS FOR DECISION MAKING ABOUT DAMS
CONSENT FORM FOR RESEARCH
You have been asked to participate in a research project described below. The researcher will explain
the project to you in detail. You should feel free to ask questions. If you have more questions later,
Dr. Todd Guilfoos (401) 874-4398, the person mainly responsible for this study, will discuss them
with you. You must be at least 18 years old to participate in this research project.
Description of the project:
This study examines decision making preferences and processes about dams. We hope to learn about
public preferences for ecosystem services from dams, common arguments for and against dams, and
how collaborative decision processes impact decisions about dam removal, rehabilitation, and
upgrading.
What will be done:
You have been invited to participate in the following research components (check one or more):
___ In the interview and/or stakeholder survey portion of this study, you will be asked a
series of questions about dams, decision making, and collaboration. Interviews are expected
to last from 30 to 120 minutes, while surveys will take approximately 20 minutes to
complete. Interview participants may be asked for follow-up interviews.
___ In the lab experiment, you will be presented with a sequence of decisions that provide
you an opportunity to make money. Your earnings will be affected by your decisions and the
decisions of others. The process should take not more than two hours.
___ In the choice experiment, you will be asked to complete either an internet-based survey
or an in-person workshop. Survey participants will answer a series of questions about valuing
ecosystem services related to dams. Workshop participants will be asked to complete
complex decision making tasks related to valuation. Surveys will take approximately 20
minues, while workshops will take not more than two hours.
___ In the role-play simulation/charrette, you will be asked to provide feedback about
several computer models and take on the role of a particular type of stakeholder to work
through the tradeoffs related to particular dam decisions. These two workshops are expected
to last approximately 6 hours each.
Risks or discomfort:
It is unlikely that you will incur any risks or will experience any discomfort as a result of
participating in this study.
Benefits of this study:
Although there may be no direct benefit to you from participation in this study, the researchers may
learn more about how people use science to make decisions about dams and about how collaboration
impacts decision making, resulting in better decision making about dams.

97
Confidentiality:
Your part in this study is confidential. None of the information will identify you by name. Your name
will not be included in the transcript of interviews, role-plays, or charrettes. Audio recordings will be
erased after they are transcribed. Signed consent forms will be kept in the investigator’s locked
cabinet, separate from any transcripts. For the experiments, decisions will be linked by a subject
number assigned to you by the researcher. This subject number will never be linked to anything
which can identify you. Other participants in the experiment will not be able to attribute your
decisions to you personally, and they will not know how much you earn. At the end of the
experiment, you will have to sign for the amount of your earnings. This form will not contain your
subject number, and will not be linked with your decision data.
Decision to quit at any time:
The decision to take part in this study is up to you. You do not have to participate. If you decide to
take part in the study, you may quit at any time. Whatever you decide will in no way penalize you. If
you wish to quit, simply inform the researcher of your decision.
Rights and complaints:
If you are not satisfied with the way this study is performed, you may discuss your complaints with
Dr. Guilfoos or with staff members at the office of the Vice President of Research and Economic
Development (401-874-4328), anonymously, if you choose. In addition, if you have questions about
your rights as a research participant, you may contact the office of the Vice President of Research
and Economic Development, 70 Lower College Road, Suite 2, University of Rhode Island, Kingston,
RI, telephone: 401-874-4328.
You have read this Consent Form. Your questions have been answered. Your signature on this form
means that you understand the information and you agree to participate in this study.
_______________________________ ______________________________
Signature of Participant Signature of Researcher
_______________________________ ______________________________
Typed/printed Name Typed/printed name
_____________________ ____________________
Date Date
Please sign both consent forms, keeping one for yourself
___ I agree to let the researcher audio record the interview. Audio recordings will be held until they
are transcribed, at which point they will be destroyed. If you agree, please sign below:
_________________________ Signature _________________ Date

98
Use of Scientific Knowledge in Hydropower Relicensing Survey
• Q1-Q3) Consent to take the survey
The following questions gauge your experience and role within the hydropower relicensing process. All information collected will remain confidential.
• Q5-Q6) Which organization are you employed by?
• Q7) What is your current job title?
• Q8) How long have you held your current position?
• Q9) How many years of experience do you have working directly or indirectly with hydropower issues?
• Q10) Are you or your organization a formal participant in the FERC hydropower relicensing process?
• Q11) How frequently do you participate in the following relicensing responsibilities?
Do not
participate Frequently
participate
FERC document review 1 2 3 4 5 Provide official written comments 1 2 3 4 5 Scoping meeting participation 1 2 3 4 5 Coordination with other entities 1 2 3 4 5 Study design planning 1 2 3 4 5 Scientific evaluation and synthesis 1 2 3 4 5 Task force/committee participation 1 2 3 4 5 Supervisory role 1 2 3 4 5
• Q12) Please use this space to identify relicensing responsibilities you participate in that weren't addressed.
• Q13) How frequently do you employ the following expertise/skills in your work
● Q14) Please use this space to identify expertise/skills you employ that weren’t addressed above. ● Q15) In your opinion, what constitutes “best available science?” ● Q16) In your opinion, how relevant is the information provided by the following sources to your work? (i.e.,
How appropriate to the current time period and circumstances is the information?)
Do not employ
Freq. employ
Fisheries 1 2 3 4 5 Engineering/fish passage 1 2 3 4 5 Hydrological 1 2 3 4 5 Policy (e.g., ESA authorities) 1 2 3 4 5 Communication 1 2 3 4 5 Negotiation/mediation 1 2 3 4 5 Community engagement 1 2 3 4 5
Not
relevant Extremely
relevant
Unpublished academic research (e.g., theses) 1 2 3 4 5 Agency grey literature 1 2 3 4 5 Industry reports 1 2 3 4 5 Community comments 1 2 3 4 5 Peer-reviewed publications 1 2 3 4 5 Expert opinion 1 2 3 4 5

99
● Q17) In your opinion, how comprehensive is the information provided by the following sources? (i.e., How complete and inclusive is the information?)
Not
comprehensive Extremely
comprehensive
Unpublished academic research (e.g., theses) 1 2 3 4 5 Agency grey literature 1 2 3 4 5 Industry reports 1 2 3 4 5 Community comments 1 2 3 4 5 Peer-reviewed publications 1 2 3 4 5 Expert opinion 1 2 3 4 5
● Q18) In your opinion, how objective is the information provided by the following sources? (i.e., How impartial
and unbiased is the information?)
Not
objective Extremely
objective
Unpublished academic research (e.g., theses) 1 2 3 4 5 Agency grey literature 1 2 3 4 5 Industry reports 1 2 3 4 5 Community comments 1 2 3 4 5 Peer-reviewed publications 1 2 3 4 5 Expert opinion 1 2 3 4 5
● Q19) In your opinion, how transparent is the information provided by the following sources? (i.e., Is the
information clear and the approach to data collection understandable? Can information be validated/verified?)
Not
transparent Extremely
transparent
Unpublished academic research (e.g., theses) 1 2 3 4 5 Agency grey literature 1 2 3 4 5 Industry reports 1 2 3 4 5 Community comments 1 2 3 4 5 Peer-reviewed publications 1 2 3 4 5 Expert opinion 1 2 3 4 5
● Q20) In your opinion, how available is the information provided by the following sources? (i.e., How accessible
and obtainable is the information?)
Not
available Extremely
available
Unpublished academic research (e.g., theses) 1 2 3 4 5 Agency grey literature 1 2 3 4 5 Industry reports 1 2 3 4 5 Community comments 1 2 3 4 5 Peer-reviewed publications 1 2 3 4 5 Expert opinion 1 2 3 4 5

100
● Q21) How frequently do you consult the following sources to obtain the data/information needed for your work?
Do not
use Frequently
use
Unpublished academic research (e.g., theses) 1 2 3 4 5 Agency grey literature 1 2 3 4 5 Industry reports 1 2 3 4 5 Community comments 1 2 3 4 5 Peer-reviewed publications 1 2 3 4 5 Expert opinion 1 2 3 4 5
● Q22) What do you consider the main strengths of the sources you use frequently? ● Q23) What type of information would be beneficial to have, but is currently unavailable to you? ● Q24) Please use this space to identify sources of information you use that weren't addressed above. ● Q25) How often are your recommendations taken into account by others?
Never Frequently
Within your organization 1 2 3 4 5 Outside your organization 1 2 3 4 5
● Q26) How much decision-making power do you believe the following organizations wield in the relicensing
process?
No Power Extreme
Power
NOAA 1 2 3 4 5 USFWS 1 2 3 4 5 Tribal Nations 1 2 3 4 5 FERC 1 2 3 4 5 MDMR 1 2 3 4 5 MDIFW 1 2 3 4 5 MDEP 1 2 3 4 5 Licensees 1 2 3 4 5 Conservation Organizations 1 2 3 4 5
● Q27) Please list any organizations that weren't mentioned above that you believe wield significant power in
the process. ● Q28) Why do you believe your organization has the level of influence that it does? ● Q29) In your opinion, how influential are the following official comments on FERC's decision-making?
Not at all influential
Extremely influential
Federal agency comments 1 2 3 4 5 Tribal Nation comments 1 2 3 4 5 Town/city comments 1 2 3 4 5 Citizen/public comments 1 2 3 4 5 State agency comments 1 2 3 4 5 Licensee comments 1 2 3 4 5

101
● Q30) Do you feel that FERC receives adequate information to make informed decisions about fish passage
during hydropower relicensing? ○ Q31) What information do you believe is lacking in current decision making about fish passage?
● Q32) Can you recommend anyone else we should contact regarding these issues? Please include their contact information below. All information will remain anonymous.
● Q33) This concludes the Use of Scientific Knowledge in Hydropower Relicensing Survey. Thank you for taking the time to inform our research. We value your opinions and feedback. Please take a moment to write any additional comments you may have.

102
BIOGRAPHY OF THE AUTHOR
Sarah Vogel was born in Oconomowoc, Wisconsin on July 19, 1984. She was raised in
Milwaukee, Wisconsin where she attended St. Joan Antida High School for three years. She moved to
New York during her senior year and graduated from Sachem North High School in Lake Ronkonkoma,
New York in 2002. She moved to Tennessee in 2004 where she worked for several years in a leadership
role as an operations and human resources manager for a large retailer. She attended Tennessee
Technological University as a non-traditional student in 2009 and graduated with two bachelor’s degrees
(Wildlife and Fisheries Sciences and Environmental Biology) in 2012. She traveled and worked closely
with bats and amphibians in Tennessee and Arizona before pursuing a graduate degree. In the spring of
2017, Sarah began a graduate research assistantship at the University of Maine in the Department of
Wildlife, Fisheries, and Conservation Biology. Throughout her college career, she remained active in The
Wildlife Society, the American Fisheries Society, and the American Institute of Fishery Research
Biologists. After receiving her degree, Sarah will continue to work closely with dam relicensing projects.
She aspires to work in state or federal government and may pursue a PhD to continue a career in wildlife
and fisheries research. Sarah is a candidate for the Master of Science degree in Wildlife Ecology from the
University of Maine in December 2019.