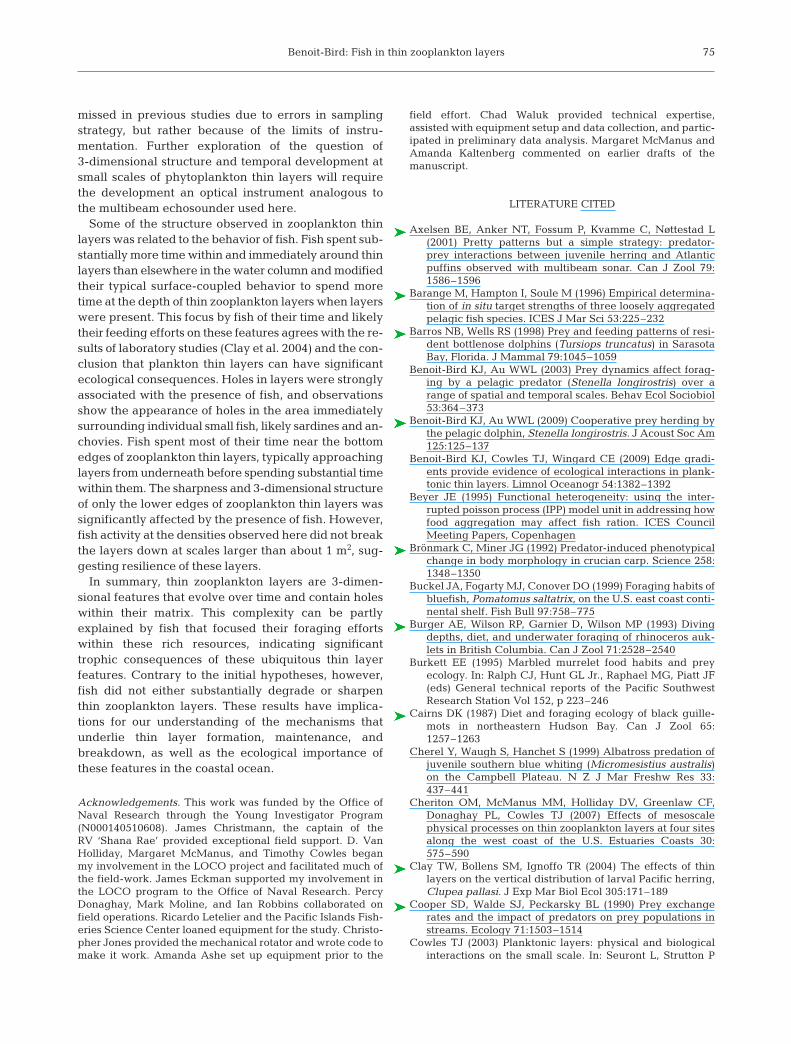
Dynamic 3-dimensional structure of thin zooplankton layers is impacted by foraging fish
16
MARINE ECOLOGY PROGRESS SERIES Mar Ecol Prog Ser Vol. 396: 61–76, 2009 doi: 10.3354/meps08316 Published December 9 INTRODUCTION The distribution of organisms in the ocean is highly heterogeneous, influencing both sampling and ecolog- ical structure. The complex spatial and temporal struc- tures of predators and prey affect one another. Preda- tors tend to congregate in areas of high prey density (Krebs 1978) while prey are trying to avoid or escape predators. Many animals, including marine mammals (Fiscus & Kajimura 1981, Fertl et al. 1997, Merrick et al. 1997, Barros & Wells 1998, Tamura et al. 1998, Benoit- Bird & Au 2003), water birds (Cairns 1987, Greene 1987, Burger et al. 1993, Burkett 1995, Ostrand et al. 1998, Cherel et al. 1999), and fishes (Roger 1994, Krause & Godin 1995, Buckel et al. 1999) feed specifi- cally on schooling or aggregated aquatic prey. This phenomenon seems to be particularly widespread when the prey is pelagic. The density and distribution of an animal’s food resource in its immediate surround- ings determine the amount of food the animal can obtain in a brief period, affecting its growth and sur- vival (Beyer 1995) as well as its behavior (Benoit-Bird & Au 2003). A predator’s survival is impacted over the long term by its prey, while, conversely, a prey organism’s sur- vival is immediately impacted by its predator. Preda- tion risk can affect the foraging behavior of the prey species (Lima & Dill 1990) and can even induce physi- ological and morphological changes in prey (Brönmark & Miner 1992). Predators can affect prey density through direct predation as well as prey emigration, since prey select different habitats in response to pre- © Inter-Research 2009 · www.int-res.com *Email: [email protected] Dynamic 3-dimensional structure of thin zooplankton layers is impacted by foraging fish Kelly J. Benoit-Bird* College of Oceanic and Atmospheric Sciences (COAS), Oregon State University, 104 COAS Administration Bldg., Corvallis, Oregon 97331, USA ABSTRACT: The potential attraction of fish to thin layers of zooplankton and the role of predation by fish in the formation and persistence of these layers were assessed using 3-dimensional sonar obser- vations. Zooplankton were found in intense layers with vertical scales of 0.2 to 4.6 m with a mode of 2.2 m. These thin zooplankton layers had complex 3-dimensional structure with significant, though gradual, undulations in their depth, thickness, and intensity. Fish spent significantly more time within zooplankton layers than expected, modifying their usual surface-coupled behavior when layers were present. Sonar tracks of individual fish showed them diving down through a zooplankton layer before spiraling slowly upwards through the layer. The upward portion of this behavior was correlated with a dramatic decrease in the intensity of zooplankton scattering at the scale of 1 m 2 , resulting in the appearance of holes in the layer. Continued observation of layers revealed that these holes slowly filled in with zooplankton an average of 4.3 min after the fish’s departure. Survey results show that when more fish were observed, more holes were observed, and when larger fish were observed, larger holes were observed, so that a total of up to 5% of a layer’s area could be comprised of holes. The thickness of layers was not affected by fish presence. Fish were attracted to zooplankton thin lay- ers, showing that thin layers in natural systems can have significant ecological effects; however, despite fish-associated changes to the structure of layers, the layers were resilient over time to the apparent foraging fish. KEY WORDS: Thin plankton layer · Fish · Foraging · Behavior · Multibeam echosounder Resale or republication not permitted without written consent of the publisher
-
Upload
independent -
Category
Documents
-
view
0 -
download
0
Transcript of Dynamic 3-dimensional structure of thin zooplankton layers is impacted by foraging fish

MARINE ECOLOGY PROGRESS SERIESMar Ecol Prog Ser
Vol. 396: 61–76, 2009doi: 10.3354/meps08316
Published December 9
INTRODUCTION
The distribution of organisms in the ocean is highlyheterogeneous, influencing both sampling and ecolog-ical structure. The complex spatial and temporal struc-tures of predators and prey affect one another. Preda-tors tend to congregate in areas of high prey density(Krebs 1978) while prey are trying to avoid or escapepredators. Many animals, including marine mammals(Fiscus & Kajimura 1981, Fertl et al. 1997, Merrick et al.1997, Barros & Wells 1998, Tamura et al. 1998, Benoit-Bird & Au 2003), water birds (Cairns 1987, Greene1987, Burger et al. 1993, Burkett 1995, Ostrand et al.1998, Cherel et al. 1999), and fishes (Roger 1994,Krause & Godin 1995, Buckel et al. 1999) feed specifi-cally on schooling or aggregated aquatic prey. This
phenomenon seems to be particularly widespreadwhen the prey is pelagic. The density and distributionof an animal’s food resource in its immediate surround-ings determine the amount of food the animal canobtain in a brief period, affecting its growth and sur-vival (Beyer 1995) as well as its behavior (Benoit-Bird &Au 2003).
A predator’s survival is impacted over the long termby its prey, while, conversely, a prey organism’s sur-vival is immediately impacted by its predator. Preda-tion risk can affect the foraging behavior of the preyspecies (Lima & Dill 1990) and can even induce physi-ological and morphological changes in prey (Brönmark& Miner 1992). Predators can affect prey densitythrough direct predation as well as prey emigration,since prey select different habitats in response to pre-
© Inter-Research 2009 · www.int-res.com*Email: [email protected]
Dynamic 3-dimensional structure of thin zooplankton layers is impacted by foraging fish
Kelly J. Benoit-Bird*
College of Oceanic and Atmospheric Sciences (COAS), Oregon State University, 104 COAS Administration Bldg., Corvallis, Oregon 97331, USA
ABSTRACT: The potential attraction of fish to thin layers of zooplankton and the role of predation byfish in the formation and persistence of these layers were assessed using 3-dimensional sonar obser-vations. Zooplankton were found in intense layers with vertical scales of 0.2 to 4.6 m with a mode of2.2 m. These thin zooplankton layers had complex 3-dimensional structure with significant, thoughgradual, undulations in their depth, thickness, and intensity. Fish spent significantly more time withinzooplankton layers than expected, modifying their usual surface-coupled behavior when layers werepresent. Sonar tracks of individual fish showed them diving down through a zooplankton layer beforespiraling slowly upwards through the layer. The upward portion of this behavior was correlated witha dramatic decrease in the intensity of zooplankton scattering at the scale of 1 m2, resulting in theappearance of holes in the layer. Continued observation of layers revealed that these holes slowlyfilled in with zooplankton an average of 4.3 min after the fish’s departure. Survey results show thatwhen more fish were observed, more holes were observed, and when larger fish were observed,larger holes were observed, so that a total of up to 5% of a layer’s area could be comprised of holes.The thickness of layers was not affected by fish presence. Fish were attracted to zooplankton thin lay-ers, showing that thin layers in natural systems can have significant ecological effects; however,despite fish-associated changes to the structure of layers, the layers were resilient over time to theapparent foraging fish.
KEY WORDS: Thin plankton layer · Fish · Foraging · Behavior · Multibeam echosounder
Resale or republication not permitted without written consent of the publisher

Mar Ecol Prog Ser 396: 61–76, 2009
dation risk (Kratz 1996), ultimately impacting commu-nity composition (Cooper et al. 1990). Prey in benthicsystems have been found to aggregate into discretepatches as a mechanism to avoid predators (see, forexample, Hildrew & Townsend 1982), changing notonly the prey animals’ density but also their distribu-tion. While numerous studies in pelagic systems haveinvestigated the effects of prey distribution on predatorbehavior, and studies in benthic habitats have re-vealed the significant impacts predators can have onprey distribution (see a review in Cooper et al. 1990),relatively few field studies outside the schooling fishliterature have investigated the effects of predatorbehaviors on prey distribution in pelagic systems (Orr1981, Axelsen et al. 2001, De Robertis et al. 2003,Benoit-Bird & Au 2009). These interactions can haveeffects on individual animals, their competitors andpredators, as well as the measurements obtained ofthem and their environment.
Recent advances in measurement capabilities haveled to the discovery of an extreme example of hetero-geneity in the plankton; aggregations over continentalshelves with vertical dimensions of tens of centimeters.These ‘thin layers’ can have a horizontal extent of sev-eral kilometers and may persist for days (Deksheniekset al. 2001, Rines et al. 2002, McManus et al. 2003).Sharply distinct from the surrounding water column,these layers contain a density of phytoplankton andzooplankton significantly higher than at surroundingdepths (Cowles 2003).
The ubiquity of thin layers of plankton in coastalecosystems (Cheriton et al. 2007) hints at their ecolo-gical importance. However, field studies investigatingthe ecological consequences of thin plankton layershave been limited. It is likely that planktivores will beattracted to these narrow-depth regions of aggregatedplankton, as hypothesized by Lasker (1975). Labora-tory studies have shown that thin layers of zooplanktondirectly influence the vertical distribution of larval her-ring, suggesting an attraction of zooplanktivores tothese areas of abundant resources despite their prefer-ence for other depths (Clay et al. 2004). Modelingresults suggest that a predator’s efficiency inside aneven and continuous thin layer is decreased relative toforaging in a patchy thin layer, effectively decreasingthe prey’s risk (Leising 2001). Thus, it is possible fororganisms to reduce their predation risk within thinlayers by changing their horizontal aggregation, sug-gesting that predators can have a significant impact onthe horizontal distribution of layers. Predation proba-bly has significant impacts on the vertical distributionof thin layers as well. Donaghay & Osborn (1997) sug-gested that feeding on thin layers could be a signifi-cant source of prey mortality, leading to degradation ofthe layers. Alternatively, feeding on the layer from
above or below may actually create sharp edges to thelayer, aiding in its formation or maintenance (Donag-hay & Osborn 1997). An understanding of predatorpresence and layer use is critical for understandinghow thin layers are formed, maintained, and dissi-pated, and is an important step towards understandingthe role of these features in coastal marine ecosystems.The goals of this work were to: (1) measure the scalesof thin zooplankton layers in 3 dimensions; (2) deter-mine the potential role of fish in determining thesescales; and (3) assess the role of zooplankton layers asa potential resource for fish by measuring zooplanktonand fish behavior in and around thin layers.
MATERIALS AND METHODS
Observations of zooplankton and fish were madeusing shipboard acoustics during both underway andstationary sampling. Previous studies have shown thatacoustical approaches are quite useful in monitoringsmall-scale zooplankton features (Holliday et al. 1998,2003, McManus et al. 2003, Cheriton et al. 2007).These acoustic data were supplemented by visualobservations and vertical net tows. Data were collectedin Monterey Bay, California, during 2 time periods inthe summer of 2006. From 13 to 27 July 2006, samplingwas conducted during daylight hours as part of theLayered Organization in the Coastal Ocean (LOCO)project in and around the experiment’s mooring arraythat ran in a line from 36.9381° N, 121.9171° W to36.9273° N, 121.9283° W. Frequent surveys covered a5 km transect running approximately 1 km inshore ofthe shallowest mooring to 2 km offshore of the deepest.Stationary observations were made periodically, usu-ally in the areas surrounding each of the experiment’s4 mooring sites. The selection of stationary samplingsites was based on the needs of other investigatorsusing the vessel as well as data from optical andacoustical sensors. From 4 to 8 August 2006, nighttimesampling was conducted in the same general area,with underway sampling of a 3 km across isobath by2 km along isobath box, along with 20 min stationaryobservations at each of the corners of the box on everypass. All underway surveying was conducted at a ves-sel speed of approximately 9 km h–1 (5 knots). Duringboth studies, underway sampling with the multibeamechosounder provided 3-dimensional information onboth thin zooplankton layers and fish that can be ana-lyzed statistically. Stationary sampling from both stud-ies allowed a 4-dimensional analysis of layers and fishthrough repeated sampling of approximately the samevolume.
Direct sampling. During all daytime sampling, visualobservations of fish near the surface and those in the
62

Benoit-Bird: Fish in thin zooplankton layers
mouths of seabirds and sea lions were made at inter-vals of 5 min. The observations were made by an indi-vidual experienced with identifying the species foundin Monterey Bay. Fishermen were also informallyinterviewed daily at the docks to determine the mostabundant fish present in the bay throughout the study.
During daytime and nighttime sampling, verticallyintegrated plankton tows were conducted using a0.75 m diameter 333 µm mesh equipped with a Gen-eral Oceanics flowmeter. A total of 49 tows were con-ducted from 3 m above the bottom to the surface.Plankton samples were preserved in 5% buffered for-malin in seawater and were later identified to genus,measured, and enumerated.
Acoustic sampling. The transducers of a 38 and120 kHz split-beam echosounder (Simrad EK60s) weremounted 1 m beneath the surface on a rigid pole off theside of the RV ‘Shana Rae’. The 38 kHz echosounder hada 12° beam and used a 256 µs pulse with an input powerlevel of 800 W. The 120 kHz echosounder had a 7° beamand used a 64 µs pulse with an input power of 200 W.The goal of the combination of instruments was not tocreate ‘combined frequency data’ to facilitate speciesidentification (Korneliussen et al. 2008) but rather to ex-ploit the strengths of each instrument while providingthe high vertical resolution necessary for addressing thescales of plankton thin layers. Both echosounders werecalibrated in the field using an indirect procedure incor-porating a 38.1 mm diameter tungsten carbide referencesphere as prescribed by Foote et al. (1987), using thesame setup used for the study. For calibration, the refer-ence sphere was held at varying distances from 3 to 22 mwith nearly identical mean target strengths measured byboth frequencies at all ranges with no systematic changein target strength as a function of depth. This suggeststhat non-linear effects are negligible in the setup usedover the depth range where observations were made(Tichy et al. 2003).
The transmit and receive transducers of the 200 kHzmultibeam echosounder (Simrad-Mesotech SM2000)were mounted to a small rotating motor controlled by atopside computer before being mounted next to theechosounder transducers. This allowed the multibeamechosounder to be rotated fore and aft during station-ary sampling and to be pointed directly downwardduring underway sampling. During stationary obser-vations, the motor rotated the multibeam echosoundertransducers over a ±20° range from the vertical over aperiod of 15 s before reversing rotation. This permittedlater reconstruction of the scattering field in 3 and even4 dimensions despite the lack of vessel motion.
The multibeam echosounder had 120 1.5° × 20°beams that overlapped by 0.25° in the across-trackdirection, providing an angular coverage 120° with 1°resolution in this direction. Data were taken using the
external imaging transducer of the sonar, thus forminga Mills Cross to provide the greatest spatial resolution.This gave a received beam width of 1.5° in the along-track direction. The system had a vertical resolution of0.20 m. The multibeam echosounder used a 150 µs out-going pulse transmitted at a rate of 5.6 s–1, with aninput power of 80 W. The multibeam echosounder sys-tem was calibrated in the Applied Physics Laboratoryof the University of Washington’s seawater calibrationfacility using tungsten carbide spheres with diametersof 20 and 38.1 mm following the protocols establishedby Foote et al. (2005). The system showed a nearly lin-ear gain function, stable performance, and beam pat-terns consistent with those predicted by the systemgeometry.
A small, 0.05° accuracy tilt-and-roll sensor wasmounted to the plate holding the echosounder trans-ducers to provide data on vessel motion. These dataand differential GPS data were digitized simultane-ously with raw echo data from the split-beam andmultibeam echosounders. Most sampling was con-ducted with sea states below Beaufort 2 (waves of lessthan 0.2 m, winds below 6 knots), often with com-pletely glassy conditions, limiting undesirable vesselmovement.
Echosounder data analysis. Scattering from theareas surrounding any probable schools of fish (e.g.discretely bounded, intense, relatively evenly scatter-ing in 38 and 120 kHz, ovoid or otherwise non-layeredaggregations) were excluded from further analysisbecause previous work showed schools were not asso-ciated with zooplankton layers (Benoit-Bird et al.2009). Single targets in each echosounder frequency(i.e. large individual scatters at densities equal to orless than 1 per sampling volume) were extracted usingSonarData’s Echoview program using a target strengththreshold of –70 dB. A pulse length determinationlevel (the value in dB below peak value consideredwhen determining the pulse length, or envelope, of asingle-target detection) of 12 dB was used. Normalizedpulse lengths (the measured pulse length divided bytransmitted pulse length) were required to be between0.8 and 2.0. The maximum beam compensation for cor-recting transducer directivity was set to 12 dB. To con-firm all sources of scattering within the measuredpulse length were from a single target, all sampleswithin this pulse envelope must have had a standarddeviation in angular position of less than 3° in both thealong and athwart ship directions of the beam. Identi-fied single targets were later analyzed independently.
For analysis of volume scattering data, the scatteringfrom single targets must be removed. Single targetswere masked in all frequencies, similar to the approachof Jurvelius et al. (2008). The scattering from single tar-gets was basically replaced with no value, so that their
63

Mar Ecol Prog Ser 396: 61–76, 2009
scattering did not affect volume scattering measure-ments, which must be calculated using averaging. Theparameters used to detect single targets for analysis offish characteristics were very conservative, possiblymissing fish that should not be included in the volumescattering analysis. Two approaches were taken toaddress this. First, the single-target parameters wererelaxed so that the normalized pulse lengths could bebetween 0.25 and 4.0. Targets identified with this ex-panded range that were greater than –70 dB were alsomasked to remove them from the volume scatteringanalysis; however, they were not included in the analy-sis of the characteristics of single targets. Second, thedifference in scattering between 38 and 120 kHz of in-dividual 1 m × 1 m cells was examined. Any values be-tween 3 and –3 dB, consistent with scattering from fish,were excluded from volume scattering analysis. Thenumber of these additional potential fish targets fromboth methods was less than 1% of all samples. AnANOVA on the rates of detection of these potential tar-gets showed no significant effect of sampling date,depth, or layer presence (p > 0.10 for all comparisons).This suggested that their removal has a limited effectvolume scattering analysis. After exclusion of thesepotential fish targets, the remaining volume scatteringdata were averaged over 5 contiguous echoes for com-parison with the multibeam echosounder data.
Multibeam data analysis. Data from the multibeamechosounder were beamformed with Chebyshev-typeamplitude weighting, and the amplitude and range ofechoes in each beam were then extracted using a cus-tom MATLAB program (The MathWorks). Single tar-gets in the multibeam echosounder data were identi-fied using a custom MATLAB program using the samecriteria used for the split-beam echosounders. Scatter-ing from single targets was then removed from thedata for independent analysis. Similarly, the scatteringfrom targets identified using the relaxed pulse lengthvalues were also excluded from the volume scatteringanalysis. The remaining volume scattering was aver-aged over 5 beams across-track and 5 echoes along-track with no vertical averaging and then thresholdedat a value of –75 dB. This provided spatial resolution ata depth of 10 m, approximately the mode of detectedlayers, of about 1 m both across and along track duringstationary sampling, and 1 m across and 2.5 m alongtrack during underway sampling. This provided ade-quate averaging for volume scattering estimationwhile still providing a vertical resolution of 0.2 m. Therange versus azimuth data from both single targets andmean volume scattering were transformed into a rec-tangular coordinate system, and the vessel motion wasremoved using both the GPS and tilt-and-roll data.
Single target analysis. Single targets with targetstrengths greater than –70 dB were consistent with
scattering from individual small fish. The frequencydifferences in target strength of single targets identi-fied within the beam of both the 38 and 120 kHz split-beam echosounders support this interpretation withrelatively small frequency differences. The differenceswere much lower than expected from zooplanktonechoes, which, over the range of frequencies usedhere, are more frequency-dependent than those fromfish (Korneliussen & Ona 2002).
To calculate the depth distribution of individual fish,the number of single-target detections from underwaysurveys was corrected for search area differences as afunction of depth (caused by the conical shape of thetransducer’s beam). This was done by dividing thenumber of animals located at a particular depth by thediameter of the beam at that depth. Diameter, not area,of the beam was used, because the second dimensionof the beam is covered by the direction of the transect.Counts of individual fish in survey data were con-ducted only for the area within 5 m vertically of thepeak of an identified thin layer. This was done in orderto reduce the inclusion of fish associated with the sur-face and not the thin layer in this relatively shallowwater column, resulting in an average volume ofapproximately 10000 m3. These counts were then con-verted to density for comparison with thin layer char-acteristics by dividing by the total volume of watersampled within 5 m of a thin layer. The density of allsingle targets within the water column was similarlycalculated when layers were detected and when theywere not for comparison of fish vertical distributions.
Thin layer definition. Following the definition ofCheriton et al. (2007), thin layers were identified asfeatures less than 5 m thick and at least 3 × (4.75 dB)greater in intensity than the background volume scat-tering. The background was defined by calculating avertical 5 m running median at each x,y position in theprocessed volume scattering data. Each layer’s peakwas defined as the depth of its most intense scatteringvalue and its minimum and maximum depths as thepoints above and below this depth, respectively, wherethe scattering first fell below the running medianvalue. The thickness of the layer was calculated as therange of values within half the peak intensity of thelayer, sometimes called the full width half maximum(FWHM).
Layer gradients. To quantify thin layer gradients, thedistance between the edge of the layer and its peakwere divided by the change in the intensity of layer’sacoustic scattering in linear units over that depth,resulting in a measure in m σ–1. This value approaches0 when a layer is extremely sharp, while a more grad-ual increase in scattering intensity results in a higher,positive number. An average gradient for the upperand lower edges was calculated for each 50 m along
64

Benoit-Bird: Fish in thin zooplankton layers
track section of thin layers detected with the multi-beam echosounder.
Relative surface area. To quantify the 3-dimensionalstructure of the top and bottom edges of identified thinscattering layers, a relative surface area calculationwas made for data collected with the multibeamechosounder. At the average depth of identified thinlayers, the multibeam echosounder’s across-track fieldof view is approximately 50 m. To provide roughlyequivalent analysis in the along-track direction, multi-beam echosounder data from 50 m long sections ofunderway transect were analyzed. Because of differ-ences in the along-track sampling area with depth,direct measures of surface area could not be made.Instead, the area of a linearly interpolated surface con-necting all the minimum layer depths within each 50 mtransect section were compared to the area of a flat,level sheet at the mean of the depth minima in thesame area (Fig. 2C). This results in a value of 1 for avery smooth, level thin layer and positive values repre-senting increased tilt and rippling of the layer. A simi-lar calculation was conducted for the lower edge ofeach thin layer.
Diel/date patterns. Diel patterns could be importantto the interpretation of results of this study. However,because of the sampling design, which was con-strained by the needs of other investigators, daytimeand nighttime sampling were conducting during dif-ferent time intervals. This meant that time of day anddate of sampling covaried, making it impossible to sep-arate their effects. To assess if diel patterns may affectinterpretation of the data, multivariate analyses of vari-ance (MANOVAs) on the effect of date were carriedout on the characteristics of layers and single targets.To reduce the chance of type 1 or false-positive error,the critical p value was raised to 0.10 from the custom-ary 0.05.
RESULTS
Fish observations
Fish were frequently observed visually in the upperwater column during daytime sampling. These obser-vations of fish at the surface and those being foragedon by seabirds and sea lions indicated that the domi-nant fish species in Monterey Bay during 2006 werePacific sardine Sardinops sagax and northern anchovyEngraulis mordax. Interviews with commercial purseseine fishermen in Monterey Bay confirmed that theywere also catching primarily sardines and anchovies.Both observations and informal interviews suggestedthat Pacific sardines were numerically dominant overnorthern anchovy in Monterey Bay. This is supported
by the commercial landings reported by the CaliforniaDepartment of Fish and Game for the greater Mon-terey Bay area. These landings showed that, of pelagicfish landed during the study period, 64% were Pacificsardine, 33% were northern anchovy, and 3% wereother small fish, primarily Pacific herring.
Zooplankton
In the 49 net tows conducted, zooplankton weredominated by copepods both numerically and by bio-mass. The most abundant genera of copepods wereCalanus (mean body length = 1.35 mm ± 0.27, mean ±SD), Ctenocalanus (mean length = 0.88 mm ± 0.09 SD),and Acartia (mean length = 0.95 mm ± 0.07, mean ±SD). Together, these 3 groups made up more than 90%of the zooplankton both numerically and by biomass.Only copepods were numerically abundant enough toallow comparison of their mean density from net towstaken within areas with detected thin layers with thosetaken in areas without layers. An ANOVA for theeffects of layer presence on copepod density in nettows showed a significant effect (F = 37.86; df = 1,47;p < 0.001). The samples collected from areas with thinzooplankton layers had a mean density of 71.4 cope-pods m–3, about 68 copepods m–3 greater than themean of 3.1 copepods m–3 in tows from areas withoutthin layers. If the background densities of copepodsare equal in the presence and absence of layers, theaverage layer would have had to have a density ofapproximately 1000 copepods m–3 to account for thedifferences in copepod density observed in the nettows.
Underway sampling
During underway sampling, a total 394.6 km weresurveyed, and 139.1 of these km had zooplankton thinlayers. During the main LOCO experiment, when day-time sampling was conducted, layers were detected16.1% of the time, with multiple layers occurring in thesame location 1.8% of the time. During the nighttimesampling following the main experiment, layers weredetected 50.2% of the time, with more than one layeroccurring in the same location 23.9% of the time. Thetypical frequency response of these layers is apparentin an example layer shown in Fig. 1. Scattering of allidentified layers was at least 13 dB less at 38 kHz thanat 120 kHz, with differences between 20 and 30 dBobserved in more than 80% of layers. While surveysshowed that these layers were often extensive, cover-ing kilometers continuously, layers varied greatly intheir vertical structure and intensity. One example is
65

Mar Ecol Prog Ser 396: 61–76, 2009
shown in Fig. 1. Note how this continuous feature splitsinto more than one layer and changes thickness overthe 3 km transect. Even within a single echo returnfrom the multibeam echosounder, there was consider-able variation in layer depth and structure. The upperpanel of Fig. 2 shows data from the multibeam echo-sounder averaged over 1 m along track and 5 pings.The lower panel shows the complexity of the samelayer’s shape over 8 m along the track of the vessel.
Single targets were detected quite often within thestudy area. The difference in target strength betweentargets detected at 38 kHz and those detected at120 kHz from the split-beam echosounders was be-tween 3 dB and –3 dB for all targets detected with athreshold of –70 dB, consistent with scattering fromfish rather than zooplankton (Kang et al. 2002, Kor-neliussen & Ona 2003). In an effort to identify fish thatmay have been aggregated but should still beexcluded from analysis of volume scattering in thinlayers, 2 approaches were utilized. First, less stringentecho criteria were used for single target detection. Thisdid not substantially increase the number of detectedsingle targets. Second, the frequency response of each1 m × 1 m cell in the split-beam echosounder data wasexamined, and those cells showing a frequency res-ponse similar to the response observed for single tar-
gets were excluded from volume scattering analysis.Combined, these 2 approaches identified potential fishmissed by the initial single target analysis in less than1% of cells within the data. Because of the small num-ber of data points affected by these analyses and thelack of any effects of date, depth, or layer presence ontheir detection rate, their removal was not likely to biasthe results.
The effects of sampling date were assessed on theobserved characteristics of zooplankton thin layersusing MANOVA (Table 1). Similarly, MANOVA was
66
0
10
20
30
40
–75 –70 –65 –60 –55
Bottom
Dep
th (m
)
Volume scattering (dB re 1 m–1)
NW Corner
1 layer2.8 m
0.75 km
2 layers0.9 m, 1.2 m
1.5 km
2 layers0.2 m, 0.3 m
2.25 km
1 layer0.3 m
3.0 km
1 layer2.5 m
38 kHz120 kHz
–75 –70 –65 –60 –55 –75 –70 –65 –60 –55 –75 –70 –65 –60 –55 –75 –70 –65 –60 –55
Fig. 1. Volume scattering strength at 38 kHz (gray lines) and 120 kHz (black lines) as a function of depth at 5 locations along a3 km long transect running offshore. The number of thin scattering layers identified in the 120 kHz data is shown below each plot,along with the thickness of the layers in order from shallowest to deepest. Despite the fact that this feature was continuous alongthe entire transect, there is considerable variability in the profile of the layer along this distance. The scattering at 38 kHz oftenshows a local peak in scattering at the position of the layer identified in the 120 kHz data; however it is typically reduced by 15 to30 dB relative to the scattering at 120 kHz, a change equal to a 30- to 1000-fold difference, as it is in the examples shown here
Table 1. Multivariate analysis of variance (MANOVA) of thecharacteristics of thin zooplankton layers as a function of sam-pling date. Because of the sampling design, time of day anddate cannot be separated, and thus a non-significant dateeffect can also be interpreted as a non-significant diel effect
Layer variable df Error df F p
Thickness 17 2781 0.563 >0.1Depth 17 2781 0.988 >0.1Surface area 17 2781 0.822 >0.1Upper gradient 17 2781 0.775 >0.1Lower gradient 17 2781 0.971 >0.1Hole area/layer area 17 2781 0.475 >0.1Layer mean intensity 17 2781 3.773 0.06

Benoit-Bird: Fish in thin zooplankton layers
used to examine the effect of date on the characteris-tics of detected single targets, shown in Table 2.Because of constraints on the sampling design, sam-pling during the day was conducted only during theJuly sampling interval. Sampling at night was onlyconducted during the August sampling, making itimpossible to separate the effects of diel patterns fromthose of date. However, there were no significant
effects of date on any layer characteristicexcept layer intensity. There were also noobserved effects of date on single-targetcharacteristics, suggesting no diel effectson these features. MANOVAs poolingdate into July and August only did notchange the results (data not shown). As aresult, all data from the 2 study periodswere pooled for the remaining analyses.
Mean layer thickness was measuredfrom the multibeam echosounder data in50 m bins along survey transects. A histo-gram of layer thickness from underwaysampling is shown in Fig. 3. It is importantto note that there are very few layersthicker than 3.6 m, validating the use of 5 mas a cutoff for defining layers in this dataset. The thinnest layers that could be mea-sured were 0.2 m, the vertical resolution ofthe multibeam echosounder. Of the 2782sections (50 m) of multibeam echosounderthat contained zooplankton thin layers,48% also contained single targets consis-tent with fish, while 52% did not. ANOVAshowed that there was no significant effect(F1,2781 = 1.351; p > 0.05) of single-targetpresence on layer thickness.
Fig. 4 shows a histogram of the depthof all acoustically identified zooplanktonthin layers from the multibeam echo-sounder data (n = 2782). ANOVA showedno significant effect of single-target pres-ence on layer depth (F1,2781 = 0.448; p >0.05). Fig. 4 also shows a histogram of thedepth of single targets when layers werepresent (n = 1335) and the depth of singletargets when no zooplankton layer wasdetected (n = 1855). A t-test revealed thatthere was a significant effect of layerpresence on the depth of single targets(t = 3.814; df = 3188; p < 0.001).
Single targets from the multibeamechosounder were consistently found as-sociated with the bottom edge of zooplank-ton thin layers, as shown in Fig. 5. Note thatthis figure only shows depths of individualfish that were within the 95% confidence
interval around the mean depth relative to the layer’sbottom edge for simplicity. It excludes targets that mayhave been swimming down to or coming up from thelayer. Stationary observations indicated that swimmingdown to and up from the layer represents only a smallfraction of an individual target’s time (see data visualiza-tion movie in electronic supplement at www.int-res.com/articles/suppl/m396p061_app/). The focus of in-
67
Fig. 2. (A) Volume scattering from the 200 kHz multibeam echosounder. Dataare an average of 5 echoes covering approximately 1 m along the vessel’s pathand are averaged over 1 m bins across the vessel’s path. (B) 3-dimensionalrendering of the same data, along with 8 other similar volume scattering mea-surements made at 1 m increments along the track of the vessel’s motion. (C) Conceptual drawing of how the relative surface area of a layer is calcu-lated. It is an identical rendering of the data with a flat plane shown at themean depth of the layer. The area of the top and bottom edges of the layer are
divided by the area of the flat plane to determine the relative surface area

Mar Ecol Prog Ser 396: 61–76, 2009
of individual targets on the layer’s bottomedge appears to have a significant effecton layer characteristics. Fig. 6 shows rela-tive surface area (an estimate of the 3-di-mensionality of a thin layer’s edges) as afunction of the density of fish in the 5 maround the layer. The slope of the regres-sion for the layer’s top edge was not signif-icantly different from 0 (p > 0.05), whilethere was a significant effect of fish densityaround the layer on the structure of thebottom edge of layers detected during un-derway sampling (r2 = 0.58; p < 0.01). Sim-ilarly, as shown in Fig. 7, the gradient ofthe layer’s top edge was not related to thedensity of fish in the 5 m surrounding thelayer, as the slope of the regression wasnot significantly different than 0 (p > 0.05).The gradients of the layer’s top edges wereall quite small, representing a sharp transi-tion between the layer and the back-ground, regardless of the density of fish.This was not the case for the bottom edgesof layers, which were much less distinctfrom the background when fish were pre-
68
Table 2. MANOVA of the characteristics of detected singletargets as a function of sampling date. Because of the sam-pling design, time of day and date cannot be separated, andthus a non-significant date effect can also be interpreted as a
non-significant diel effect
Single-target variable df Error df F p
Target strength 17 3188 0.123 >0.1Depth 17 3188 0.599 >0.1Numerical density 17 7891 0.959 >0.1
0
100
200
300
400
500
600
0.2 0.6 1.0 1.4 1.8 2.2 2.6 3.0 3.4 3.8 4.2 4.6 5.0
Fre
qu
ency (co
unts
)
Layer thickness (m)
Fig. 3. Histogram of the thickness of all thin acoustic scatteringlayers identified during underway sampling. Thickness wasmeasured as the vertical distance between the points abouteach layer’s peak that were half of the peak volume scatteringvalue. The thinnest layers that could be measured given the
multibeam echosounder’s vertical resolution were 0.2 m
2
4
6
8
10
12
14
16
18
20
22
24
26
28
30
100 2 4 6 8
Dep
th (m
)
Acoustic thin layers
0
Frequency (%)5 10 15 20 25
Single targets Layers present
0 5 10 15 20 25
Single targets Layers absent
0 10 20 30
1.0
0.8
0.2
0.0
–0.2
–0.4
–0.6
–0.8
–1.0
Frequency (%)D
ep
th r
e: la
yer
bo
tto
m e
dg
e (m
) Above bottom edge
Below bottom edge
0.6
0.4
Fig. 5. Depth of individual targets detected with the multi-beam echosounder within 5 m of the edge of a simultaneouslyidentified thin layer during underway sampling. Depth isshown relative to the bottom edge of the layer defined as thepoint that the intensity below the layer’s peak falls below the5 m running median value. Depth of individual targets wascorrected for beam effects by dividing the counts of single tar-gets by the diameter of the beam at that depth. Only depthsrelative to the bottom edge that were within the 95% confi-
dence interval about the mean are shown
Fig. 4. Left: Histogram of the depth of all acoustically identified thin layersfrom underway sampling. Water depth ranged from approximately 20 to 30 m.Center and right: Histograms of the depth of single targets identified duringunderway sampling, showing single targets detected when thin layers werealso detected (center panel) and single targets when no thin layers were iden-tified (right panel). There was a significant effect of thin zooplankton layer
presence on single-target depth

Benoit-Bird: Fish in thin zooplankton layers
sent. This response was not linear, however. It appearedto show a threshold response with an increase from 0 toabout 3 fish m–3; a flat response between 3 and approx-imately 12 fish m–3; and then another increase in layer
edge gradient when fish density was higher than 12 fishm–3. 1-way ANOVA showed a significant effect of fishdensity on edge gradient of the layer’s bottom edge(F1,2781 = 2.692; p < 0.001).
69
0 1 2 3 4 5 6 7 8 9 10 11 12 13 141
2
3
4
5
6
7
8
0 1 2 3 4 5 6 7 8 9 10 11 12 13 14
Rela
tive s
urf
ace a
rea
Single targets (no. m–3 x 10³)
Layer top Layer bottom
15 16 15 16
y = 0.20x + 2.42
r2 = 0.58
y = 0.00x + 2.50
Fig. 6. Relative surface area, a measure of 3-dimensional complexity, of each layer’s top edge (left) and bottom edge (right) as a function of fish density. There is no significant relationship between fish density in the 5 m around the layer and the structureof the layer’s top edge, but there is a significant, positive, linear relationship between fish density around the layer and the
3-dimensional structure of the bottom edges of layers
0 1 2 3 4 5 6 7 8 9 10 11 12 13 140
0.01
0.02
0.03
0.04
0.05
0.06
0 1 2 3 4 5 6 7 8 9 10 11 12 13 14
Layer
ed
ge g
rad
ien
t (m
σ–1)
Layer top Layer bottom
15 16 15 16
y = –0.001x + 0.004
Single targets (no. m–3 x 10³)
Fig. 7. Steepness of the edge gradients of zooplankton thin layers as a function of the density of fish within 5 m of the layer isshown for each layer’s upper (left) and lower (right) edges. Note that the gradient is shown in units of m σ–1, so a value approach-ing 0 represents a very sharp edge, while a high value represents a diffuse edge gradient. There is no significant relationship be-tween fish density around the layer and the upper edge of layers; however, there is a strong, apparently stepped response in thelower edge gradient with a sharp, linear increase from 0 to 3 fish m–3, a flat but elevated edge gradient value until fish densityreached approximately 12 fish m–3, and another sharp, approximately linear increase in edge gradient value as fish density
increased further

Mar Ecol Prog Ser 396: 61–76, 2009
Discretely bounded decreases in the scatteringintensity below the threshold of measurement, holeswere observed within identified zooplankton thin lay-ers. There was a significant correlation between thepresence of fish and these holes. However, the persis-tence of these holes after the fish was outside of thelayer means that they are not an artifact of the analysistechnique or acoustic shadows from the strong targets.Fig. 8 shows the percent of layer area that was hole asa function of the density of single targets within 5 m ofthe layer and the target strength of those individualtargets, an acoustic measurement related to fish size.The percent of layer area that was hole showed a sig-nificant increase with increasing target density (p <0.001; r2 = 0.77) and individual target strength (r2 =0.34; p < 0.01). A multiple regression analysis showedthat, together, fish density and target strengthaccounted for more than 91% of the variability in thepercent of layer area that was comprised of holes. Themode size of individual holes was 0.5 m2 and was notsignificantly affected by the number of single targets(r2 = 0.01; p > 0.05) but was affected by the mean indi-vidual target strength (r2 = 0.57; p < 0.01).
Stationary observations
A total of 1692 acoustic observations of at least 1 minin duration were made when the vessel was keepingstation. During these observations, the multibeam
echosounder was rotated to achieve 3-dimensionalmeasurements. Layers were present during 52% ofthese observations. In the August 2006 sampling, thelayer detection rate while stationary was 53%, closelymatching the rate for underway sampling, likelybecause the locations for stationary sampling werepredetermined. In the July 2006 sampling, the station-ary layer detection rate was 50%, much higher thanthe underway detection rate. This was because thelocation of stationary sampling sites was not randombut rather restricted by other needs of the vessel andguided by data from both the acoustics and opticalsampling by other investigators. The depth behavior ofsingle targets that could be tracked for at least 15 susing the split-beam echosounders was analyzed withrespect to thin layers. A χ2 test showed that the depthsof single targets consistent with fish were statisticallyidentical to an exponentially decaying distribution tiedto the surface (χ2 = 0.37; n = 1133). When thin layerswere present, 2 different distributions were observed.Targets that were first detected above 5 m (n = 268)spent at least 90% of their time within 5 m of the sur-face. Fish detected below 5 m (n = 951) spent an aver-age of 82% of their time within 2 m of the identifiedlayer. Given the layer thickness and water depth foreach observation, if fish were uniformly distributedvertically they would be within 2 m of the layer about13% of the time. If we assume a random distributionwith the midpoint of the water column as the mean,fish would be found within 2 m of the thin layer 7% of
70
Ho
le a
rea x
layer
up
per
ed
ge r
ela
tive a
rea
–1
(%)
y = 0.20x – 0.05
r2 = 0.77
0
0.5
1.0
1.5
2.0
2.5
3.0
3.5
4.0
4.5
0 1 2 3 4 5 6 7 8 9 10 11 12 13 14 15 16
Single targets (no. m–3 x 10³)
–70 –65 –60 –55 –50 –45 –40 –35
Mean individual target strength (dB)
y = 0.09x – 5.13
r2 = 0.34
Fig. 8. Percentage of thin zooplankton layer area that is hole as a function of the density of fish in the 5 m around the layer (left)and as a function of the mean target strength of these fish, an acoustic estimate of fish size (right). Each shows a significant, posi-tive relationship despite the fact that the average hole area is not significantly affected by the density of fish, suggesting thatmore fish lead to more holes in a layer while bigger fish lead to bigger holes in a layer. A multiple regression analysis showedthat, together, fish density and target strength accounted for more than 91% of the variability in the % of layer area that was
comprised of holes

Benoit-Bird: Fish in thin zooplankton layers
the time. Finally, if fish were found mostly near the sur-face with an exponential decay with depth, they wouldbe found within 2 m of the thin layer 15% of the time.Thus fish found below 5 m when thin layers were pre-sent spent more time around layers than expected byany model (χ2 < 0.001, uniform model; χ2 < 0.0005, ran-dom model; χ2 < 0.0001, exponential decal model).Analyzing only those tracks that were at least 1 min induration (n = 403) did not change the results, suggest-ing that the duration of the track did not affect theanalysis.
A total of 226 of these stationary observations con-taining thin layers were at least 20 min in duration.These observations allowed an in-depth analysis of the
behavior of fish around layers. Fig. 9 shows a singleframe (15 s) from one such observation. See the sup-plementary data visualization for an observation(approx. 9 min) of a single fish in and around a thinzooplankton layer. This is one example of 136 wherethe presence of a fish within a thin layer was observedto be associated with the formation of a void or hole ina thin layer. Even from the single frame in Fig. 9, it iseasy to detect the obvious hole in the thin layer at theposition of the fish. On 53 occasions, the region con-taining the hole was observed for at least 15 min afterthe departure of a fish, confirming that these holes arenot an artifact of data processing or acoustic shadow-ing from an intense target. The area of each of these
71
Across track (m)
I–20
I20
I0
I10
I–10
Dep
th (m
)
25 –
0 –
5 –
10 –
15 –
20 –
–69–75 –58–61–64 –55–72
sv (dB re 1 m–1)
Alo
ng
tra
ck (m
)
4 –
0 –
–4–
–60–65 –45–50–55 –40
Target strength (dB)
Across track (m)
I–20
I20
I0
I10
I–10
Volume scattering Single targets
Fig. 9. Data taken at 23:31 h local time of a thin zooplankton layer and an individual fish in Monterey Bay, California. Volumescattering (sv) from the 200 kHz multibeam echosounder during stationary sampling (left panels), showing the average of 5echoes covering approximately 1 m along the vessel’s path, which were also averaged in 1 m bins across the vessel’s path (topleft) and a top view of an 8 m swath of these averages integrated over the entire depth of the layer (bottom left). The dotted line at–2 indicates the position of the side-view section shown in the panel above it. The colored dots in the right panels show the posi-tion and target strength of an individual target detected with the split-beam echosounder at 38 kHz at the same time as the pan-els on the left. The white line represents the path of that target from the time it was first detected 3 min earlier than this image.The position of the single target in along-track-depth space (top right) and the position in the across-along-track plane for com-parison to the volume scattering data shown on the left (bottom right) are also shown. The entire time sequence of these data
can be seen as a data visualization movie in the supplement

Mar Ecol Prog Ser 396: 61–76, 2009
holes was measured as a function of time and is plottedin Fig. 10. In all but one case, the holes closed within 15min of the departure of the fish from the layer, with amean time to closure of just under 4.5 min. In eachcase, the individual fish approached the layer fromunderneath, often after diving through it from above,as shown in the observation in the supplementary datavisualization.
DISCUSSION
Thin zooplankton layers were relatively commonwithin the study area. Layers were detected more oftenduring the August nighttime sampling than during theJuly daytime sampling. Because of constraints on thesampling design, the effects of date and time of daycannot be separated. During the July sampling, thinlayers of phytoplankton (J. M. Sullivan pers. comm.)and zooplankton (D. V. Holliday pers. comm.) weremore common at night than during the day. Opticalsampling that covered both the July and August sam-pling periods showed that thin phytoplankton layerswere much more common during the August sampling(M. A. Moline pers. comm.), coincident with a changein the physical regime (M. A. McManus pers. comm.).It is likely that the higher abundance of zooplanktonthin layers during the August sampling is thus a com-bination of both diel and longitudinal changes.
The intensity of volume scattering from thin layersdetected acoustically in the present study ranged from–48 to –66 dB at 200 kHz, from –49 to –68 dB at120 kHz, and from –57 to levels below the –75 dB vol-ume scattering threshold used for analysis at 38 kHz.The volume scattering values at the 2 higher frequen-cies are quite high for scattering from zooplankton.
However, the sharp drop-off in scatter-ing from these layers at 38 kHz and thehigh abundance of copepods in net towsin areas with these thin layers in compar-ison to other areas support their classifi-cation as zooplankton. The scatteringvalues presented here are comparableto volume scattering measurements at265 kHz from similar zooplankton scat-tering layers from Santa Barbara, Cali-fornia, where –50 dB layers were de-tected (Cheriton et al. 2007) and fromOrcas Island, Washington, where –55 dBlayers were observed (Holliday et al.1998). Even more intense scattering hasbeen measured from thin zooplanktonlayers at higher frequencies (Holliday etal. 2003, McManus et al. 2005, Cheritonet al. 2007). These intense zooplankton
scattering layers represent both a significant biomassof animals and a potentially important source of noisefor the application of active acoustic systems in habi-tats containing these thin aggregations of plankton,particularly because their small vertical scales maymake their detection difficult with low-resolution sam-pling techniques.
Layer thickness showed a very strong mode at 2.2 m,with layers consistently thinner than about 3.6 m verti-cally. This suggests that these intense, vertically com-pressed features are occurring on a vertical scale dis-tinct from other layered structures commonly seen inacoustic scattering from zooplankton and validatingthe choice of 5 m to define them operationally. Acousti-cally identified thin plankton layers were foundthroughout the water column, which was limited to20 to 30 m in the study area. Layers detected duringunderway sampling extended at least 100 m and oftenwere at least 1 km in extent. These extensive layersshowed considerable variation in layer depth, thick-ness, and intensity over their extent.
Data on the 3-dimensional structure of acousticallyidentified zooplankton thin layers were collected forthe first time. These data could be collected veryrapidly. For example, during underway sampling a50 m along-track section of layer at 10 m depth could beassessed in about 20 s with an along-track samplingwidth of about 40 m. At this depth, the data in raw formhave a resolution of about 50 cm along track, 35 cmacross track, and 20 cm in depth. During stationarysampling, an 8 m along-track section of a layer at thesame depth could be imaged in 15 s before being re-peated immediately over the next 15 s. These rapidlyrepeated stationary observations permitted dynamicanalysis of 3-dimensional fish behavior and zooplank-ton thin layer structure, revealing the behavior of indi-
72
0
1
2
3
4
5
6
0 100 200 300 400 500 600 700 800 900
Ho
le a
rea (m
2)
Time after single target departure (s)
Fig. 10. Area of holes within zooplankton thin layers for 53 regions containingholes that were observed for at least 15 min after the departure of a fish as afunction of time after the fish’s departure. Each colored line represents thesize of an individual hole measured at 15 s intervals. Note that all except one
of the holes had closed by the end of the observation period

Benoit-Bird: Fish in thin zooplankton layers
vidual fish in and around zooplankton thin layers. Anexample observation can be seen in the supplementarydata visualization. Results from this acoustic samplingshow that layers have considerable variation in depth,thickness, and intensity across track, even though thesedata were collected simultaneously at all points alongthe layer’s across-track dimension. Similar variationwas observed in layer characteristics in 3-dimensionalcomposite data. This variation in thickness and depthwas generally gradual, as would be expected for a co-herent feature. These data show that thin layers are notsimply flat sheets but at least some of the time can havestrong 3-dimensional structure, resulting in layers thatlook more like mountainous terrain than flat pancakes.This 3-dimensional analysis also revealed that zoo-plankton thin layers in this habitat were marked by dis-tinctive voids or holes on the scale of 1 m2. Measure-ment of these complex, 3-dimensional features and thesmall holes within them has not been possible with pre-vious approaches for measuring these thin features.This structure has significant implications for under-standing the physical and biological processes occur-ring in and around layers. These results also have im-plications for interpreting results from instruments thatcannot directly assess layer structure in 3 dimensionsrapidly.
Acoustic targets consistent with small fish (based ontheir target strength values and their weak frequencydifferences) were detected acoustically quite oftenwithin the study area. While capture sampling of thesefish at appropriately small scales was not possible dur-ing acoustic observations, fish were readily observedat the surface and in the mouths of seabirds and sealions. These sightings indicate that the most commonfish within the study area were Pacific sardines,accounting for just over 75% of all visual observations,with the second most abundant fish being northernanchovy, representing about 22% of all visual speciesidentifications. No other species made up more than1% of all visual sightings. These observations are sup-ported by the catch informally reported by commercialfishermen working in the same area and the commer-cial landings reported by the California Department ofFish and Game for the greater Monterey Bay area dur-ing the study period. Target strength measurementsfrom the literature of Pacific sardines and northernanchovies are limited at 200 kHz. Depending on whichdata are used, how frequency is corrected for, andwhat the exact composition of the fish detected was,the estimated lengths of fish detected here would bebetween 1.1 and 1.8 cm on the small end and between24.5 and 39.7 cm for fish with the highest targetstrengths. When only 75% of the values are consid-ered, the length range narrows to between 4.2 and15.8 cm. This variability in estimated length could be
accounted for by the use of only dorsal aspect targetstrength for the calculation when fish in situ are foundat a wide range of orientations, introducing substantialvariability in target strength-length relationship. Alter-natively, the relatively few extreme values may repre-sent scattering from a small number of other, unidenti-fied organisms. The mean length of fish from theacoustics is estimated between 7.8 and 12.5 cm (Love1971, Barange et al. 1996, Patti et al. 2000, Kinacigil &Sawada 2001), which is consistent with the sizes of fishobserved visually and slightly smaller than the sardineand anchovy landings reported by fishermen workingthe same area.
The depth distribution of fish was strongly affected bythe presence of zooplankton thin layers. Fish in the habi-tat were found mostly near the surface during both day-time and nighttime when there were no zooplanktonthin layers. However, when a zooplankton thin layer waspresent, most fish were found at or very near the depth ofthe thin layer. This was observed in both the underwayand stationary sampling. Two mode depths in the distri-bution of fish were observed from underway data whenthin layers were present: one near the surface and onejust slightly deeper than the mode depth for all observedthin layers. Only one mode near the surface was ob-served when thin layers were absent (Fig. 4). Similarly,depth tracks of individual fish observed in stationarydata were tightly coupled to the surface when a thinlayer of zooplankton was not observed. This surface-keeping behavior was also observed in about 25% of fishwhen thin layers were detected. However, the remain-der of fish tracks were within 2 m of an identified thinlayer an average of 82% of the time, much more than ex-pected by chance given a random, uniform, or surface-coupled depth distribution model. This change in the be-havior of fish indicates attraction to thin zooplanktonlayers in this habitat, suggesting that zooplankton layersare an important resource for fish.
Looking at the depths of individual fish detected dur-ing underway sampling relative to the depth of thinlayers shows fish behavior in relation to thin layerseven more clearly. Fish detected at depths greater than5 m were nearly all found within 1 m of the bottomedge of a detected layer. This indicates not only thatfish were cuing to layers, but also that they werespecifically focusing on the bottom edges of layersrather than simply their peaks. This is supported by anexamination of the behavior of fish measured using thesplit-beam echosounders during stationary observa-tions. A total of 287 fish were observed for more than1 min in and around thin layers. Of these, 285 dovedown through a layer, descended 1 to 3 m below it, andthen ascended slowly in a spiraling motion through thezooplankton layer (see supplementary data visualiza-tion for an example). These fish spent an average 79%
73
Mar Ecol Prog Ser 396: 61–76, 2009
of their time within 1 m of the bottom edge of the thinlayer, 54% of their time within 1 m of the peak, andonly 19% of their time within 1 m of the upper edge ofthe layer.
The attraction of fish to zooplankton thin layers leadsto the question of how much fish could gain by foragingwithin thin layers. The density of copepods in layers pre-dicted from zooplankton net tows was about 1000 ind.m–3. This would equate to one copepod every 10 cm onaverage within a thin layer, while outside of the layersone copepod would be found on average about every70 cm. The mean layer would have a biomass of cope-pods of 3 g m–3, while outside of layers copepod biomasswould average 0.009 g m–3. This estimate of layer bio-mass, when converted to biovolume, is similar to thatfound in Cheriton et al. (2007) for the mean of acousticlayers measured off the Oregon coast but much higherthan the layers measured in Monterey Bay during Au-gust of 2002. It is important to recognize that we cannotbe certain of the composition of the layers identified heresince no sampling focused solely on the layers was pos-sible; so these estimates of mean layer numerical densityand zooplankton biomass are illustrative only. However,zooplankton thin layers in this study made up 81 to 98%of the total acoustic scattering attributable to zooplank-ton in the water column, indicating that these zooplank-ton thin layers would be highly favorable habitat forfeeding by zooplanktivorous fish.
From the other perspective, the presence of singletargets likely to be fish also had significant effects onzooplankton thin layer structure. An increase in3-dimensional complexity measured as layer relativesurface area was observed on the lower edge of zoo-plankton thin layers with increasing fish densities(Fig. 6). A decrease in the sharpness of the lower edgegradient of zooplankton was also observed withincreasing fish density surrounding the layer, thoughwith a threshold effect rather than a simple linearincrease (Fig. 7). While fish appear to be preferentiallyforaging at the lower edges of layers, the result isopposite to that proposed by Donaghay & Osborn(1997). There were no effects of fish density on the topedges of layers, likely because of the tendency of fishto spend most of their time near the bottom edge oflayers rather than the layer’s peak or top edge.
Fish were also correlated with the presence of holesin thin zooplankton layers, similar to the correlation offish with holes in krill layers (Onsrud et al. 2004) and oflarger predators with holes in fish aggregations (e.g.Axelsen et al. 2001, Benoit-Bird & Au 2003). Analysisof underway data showed that more fish were corre-lated with more of the same-sized holes, while biggerfish were correlated with bigger individual holes. Alltogether, these holes accounted for less 5% of layertotal area (Fig. 8). Stationary observations support this
correlation of fish with holes in the zooplankton thinlayers, as holes were repeatedly observed to form inthe area surrounding an individual fish swimming upthrough a zooplankton thin layer. These holes per-sisted after the departure of the fish, showing that thehole is not simply an acoustical shadow from the strongfish target or an artifact of data analysis. An example ofthis is shown in Fig. 9. These data cannot be used toexamine the direct causes of these holes, but there areseveral possible alternatives, including grazing losses,mixing caused by fish physically displacing the zoo-plankton, avoidance behavior by the zooplankton, or acombination of these (e.g. mixing caused by the fishcueing zooplankton avoidance behavior). Observa-tions of the size trajectory of individual holes showedthat they typically closed in just under 5 min after thefish associated with the hole left the thin layer. Again,the mechanism of hole closure cannot be examinedhere. However, the closure of these holes suggests thatthese zooplankton thin layers are resilient to the levelof fish activity observed here.
The resilience of zooplankton layers to fish-createdholes indicates that fish are not breaking these zoo-plankton layers down at large scales. There is also nosignificant effect of fish density around layers on layerthickness, refuting the initial hypotheses. The datasuggest that fish are neither helping to form or main-tain layers nor breaking them down with respect totheir small vertical scale structure, despite playing asignificant role in shaping the bottom edge of thin zoo-plankton layers and causing holes within the layers.Whether this pattern would hold if fish density weresubstantially higher remains to be investigated
The present study provides the first measurements ofdynamic 3-dimensional characteristics of zooplanktonthin layers. The results show that thin zooplankton lay-ers can be quite convoluted at scales of a few meterswith small voids or holes on the scale of 1 m2. Thestructure of thin zooplankton layers is much more com-plex than has been revealed by previous approachesfor studying these features (see, for example,McManus et al. 2003, Cheriton et al. 2007). This struc-tural complexity has important implications for ourunderstanding of how thin plankton layers are formedand maintained. It also has significant consequencesfor the interpretation of data collected with instru-ments that cannot measure this structure at rapid timescales, as there is the potential to alias the data. This isa particular concern if this kind of 3-dimensional struc-ture is also present in the more well-studied thin layersof phytoplankton because of the current absence ofoptical instruments capable of making measurementsof the type made here. It is important to recognize thatthe potential for the type of 3-dimensional structurewithin plankton thin layers shown here has not been
74
Benoit-Bird: Fish in thin zooplankton layers
missed in previous studies due to errors in samplingstrategy, but rather because of the limits of instru-mentation. Further exploration of the question of3-dimensional structure and temporal development atsmall scales of phytoplankton thin layers will requirethe development an optical instrument analogous tothe multibeam echosounder used here.
Some of the structure observed in zooplankton thinlayers was related to the behavior of fish. Fish spent sub-stantially more time within and immediately around thinlayers than elsewhere in the water column and modifiedtheir typical surface-coupled behavior to spend moretime at the depth of thin zooplankton layers when layerswere present. This focus by fish of their time and likelytheir feeding efforts on these features agrees with the re-sults of laboratory studies (Clay et al. 2004) and the con-clusion that plankton thin layers can have significantecological consequences. Holes in layers were stronglyassociated with the presence of fish, and observationsshow the appearance of holes in the area immediatelysurrounding individual small fish, likely sardines and an-chovies. Fish spent most of their time near the bottomedges of zooplankton thin layers, typically approachinglayers from underneath before spending substantial timewithin them. The sharpness and 3-dimensional structureof only the lower edges of zooplankton thin layers wassignificantly affected by the presence of fish. However,fish activity at the densities observed here did not breakthe layers down at scales larger than about 1 m2, sug-gesting resilience of these layers.
In summary, thin zooplankton layers are 3-dimen-sional features that evolve over time and contain holeswithin their matrix. This complexity can be partlyexplained by fish that focused their foraging effortswithin these rich resources, indicating significanttrophic consequences of these ubiquitous thin layerfeatures. Contrary to the initial hypotheses, however,fish did not either substantially degrade or sharpenthin zooplankton layers. These results have implica-tions for our understanding of the mechanisms thatunderlie thin layer formation, maintenance, andbreakdown, as well as the ecological importance ofthese features in the coastal ocean.
Acknowledgements. This work was funded by the Office ofNaval Research through the Young Investigator Program(N000140510608). James Christmann, the captain of theRV ‘Shana Rae’ provided exceptional field support. D. VanHolliday, Margaret McManus, and Timothy Cowles beganmy involvement in the LOCO project and facilitated much ofthe field-work. James Eckman supported my involvement inthe LOCO program to the Office of Naval Research. PercyDonaghay, Mark Moline, and Ian Robbins collaborated onfield operations. Ricardo Letelier and the Pacific Islands Fish-eries Science Center loaned equipment for the study. Christo-pher Jones provided the mechanical rotator and wrote code tomake it work. Amanda Ashe set up equipment prior to the
field effort. Chad Waluk provided technical expertise,assisted with equipment setup and data collection, and partic-ipated in preliminary data analysis. Margaret McManus andAmanda Kaltenberg commented on earlier drafts of themanuscript.
LITERATURE CITED
Axelsen BE, Anker NT, Fossum P, Kvamme C, Nøttestad L(2001) Pretty patterns but a simple strategy: predator-prey interactions between juvenile herring and Atlanticpuffins observed with multibeam sonar. Can J Zool 79:1586–1596
Barange M, Hampton I, Soule M (1996) Empirical determina-tion of in situ target strengths of three loosely aggregatedpelagic fish species. ICES J Mar Sci 53:225–232
Barros NB, Wells RS (1998) Prey and feeding patterns of resi-dent bottlenose dolphins (Tursiops truncatus) in SarasotaBay, Florida. J Mammal 79:1045–1059
Benoit-Bird KJ, Au WWL (2003) Prey dynamics affect forag-ing by a pelagic predator (Stenella longirostris) over arange of spatial and temporal scales. Behav Ecol Sociobiol53:364–373
Benoit-Bird KJ, Au WWL (2009) Cooperative prey herding bythe pelagic dolphin, Stenella longirostris. J Acoust Soc Am125:125–137
Benoit-Bird KJ, Cowles TJ, Wingard CE (2009) Edge gradi-ents provide evidence of ecological interactions in plank-tonic thin layers. Limnol Oceanogr 54:1382–1392
Beyer JE (1995) Functional heterogeneity: using the inter-rupted poisson process (IPP) model unit in addressing howfood aggregation may affect fish ration. ICES CouncilMeeting Papers, Copenhagen
Brönmark C, Miner JG (1992) Predator-induced phenotypicalchange in body morphology in crucian carp. Science 258:1348–1350
Buckel JA, Fogarty MJ, Conover DO (1999) Foraging habits ofbluefish, Pomatomus saltatrix, on the U.S. east coast conti-nental shelf. Fish Bull 97:758–775
Burger AE, Wilson RP, Garnier D, Wilson MP (1993) Divingdepths, diet, and underwater foraging of rhinoceros auk-lets in British Columbia. Can J Zool 71:2528–2540
Burkett EE (1995) Marbled murrelet food habits and preyecology. In: Ralph CJ, Hunt GL Jr., Raphael MG, Piatt JF(eds) General technical reports of the Pacific SouthwestResearch Station Vol 152, p 223–246
Cairns DK (1987) Diet and foraging ecology of black guille-mots in northeastern Hudson Bay. Can J Zool 65:1257–1263
Cherel Y, Waugh S, Hanchet S (1999) Albatross predation ofjuvenile southern blue whiting (Micromesistius australis)on the Campbell Plateau. N Z J Mar Freshw Res 33:437–441
Cheriton OM, McManus MM, Holliday DV, Greenlaw CF,Donaghay PL, Cowles TJ (2007) Effects of mesoscalephysical processes on thin zooplankton layers at four sitesalong the west coast of the U.S. Estuaries Coasts 30:575–590
Clay TW, Bollens SM, Ignoffo TR (2004) The effects of thinlayers on the vertical distribution of larval Pacific herring,Clupea pallasi. J Exp Mar Biol Ecol 305:171–189
Cooper SD, Walde SJ, Peckarsky BL (1990) Prey exchangerates and the impact of predators on prey populations instreams. Ecology 71:1503–1514
Cowles TJ (2003) Planktonic layers: physical and biologicalinteractions on the small scale. In: Seuront L, Strutton P
75

Mar Ecol Prog Ser 396: 61–76, 2009
(eds) Handbook of scaling methods in aquatic ecology.CRC Press, Boca Raton, p 31–49
De Robertis A, Schell C, Jaffe JS (2003) Acoustic observationsof the swimming behavior of the euphasiid Euphasia paci-fica Hansen. ICES J Mar Sci 60:885–898
Dekshenieks MM, Donaghay PL, Sullivan JM, Rines JEB,Osborn TR, Twardowski MS (2001) Temporal and spatialoccurrence of phytoplankton thin layers in relation tophysical processes. Mar Ecol Prog Ser 223:61–71
Donaghay PL, Osborn TR (1997) Toward a theory of biologi-cal-physical control of harmful algal bloom dynamics andimpacts. Limnol Oceanogr 42:1283–1296
Fertl D, Schiro AJ, Peake D (1997) Coordinated feeding byClymene dolphins (Stenella clymene) in the Gulf of Mex-ico. Aquat Mamm 23:111–112
Fiscus CH, Kajimura H (1981) Food of the Pacific white-sideddolphin, Lagenorhynchus obliquidens, Dall’s porpoise, Pho-coenoides dalli, and northern fur seal, Callorhinus ursinusoff California and Washington. Fish Bull 78: 951–959
Foote KG, Vestnes G, Maclennan DN, Simmonds EJ (1987)Calibration of acoustic instruments for fish density estima-tion: a practical guide. ICES Coop Res Rep 144
Foote KG, Chu D, Hammar TR, Baldwin KC, Mayer LA, Huf-nagle LC Jr, Jech JM (2005) Protocols for calibratingmultibeam sonar. J Acoust Soc Am 117:2013–2027
Greene E (1987) Individuals in an osprey colony discriminatebetween high and low quality information. Nature 329:239–241
Hildrew AG, Townsend CR (1982) Predators and prey in apatchy environment: a freshwater study. J Anim Ecol 51:797–815
Holliday DV, Pieper RE, Greenlaw CF, Dawson JK (1998)Acoustical sensing of small scale vertical structures inzooplankton assemblages. Oceanography 11:18–23
Holliday DV, Donaghay PL, Greenlaw CF, McGehee DE,McManus MM, Sullivan JM, Miksis JL (2003) Advances indefining fine- and micro-scale pattern in marine plankton.Aquat Living Resour 16:131–136
Jurvelius J, Knudsen F, Balk H, Marjomaki T and others(2008) Echo-sounding can discriminate between fish andmacroinvertebrates in fresh water. Freshw Biol 53:912–923
Kang M, Furusawa M, Miyashita K (2002) Effective and accu-rate use of difference in mean volume backscatteringstrength to identify fish and plankton. ICES J Mar Sci 59:794–804
Kinacigil HT, Sawada K (2001) Target strength measurementsof European anchovy (Engraulis encrasicolus L.) by thecontrol method. Acta Adriat 42:103–112
Korneliussen RJ, Ona E (2002) An operational system for pro-cessing and visualizing multi-frequency acoustic data.ICES J Mar Sci 59:293–313
Korneliussen RJ, Ona E (2003) Synthetic echograms gener-ated from the relative frequency response. ICES J Mar Sci60:636–640
Korneliussen RJ, Diner N, Ona E, Fernandes PG (2008) Rec-ommendations for the collection of multi-frequencyacoustic data. ICES J Mar Sci 65:982–994
Kratz KW (1996) Effects of stoneflies on local prey popula-tions: mechanisms of impact across prey density. Ecology77:1573–1585
Krause J, Godin JG (1995) Predator preferences for attackingparticular prey group sizes: consequences for predatorhunting success and prey predation risk. Anim Behav 50:465–473
Krebs JR (1978) Optimal foraging: decision rules for preda-tors. In: Krebs JR, Davies NB (eds) Behavioural ecology, anevolutionary approach. Sinauer, Sunderland, p 23–63
Lasker R (1975) Field criteria for the survival of anchovy lar-vae: the relation between inshore chlorophyll maximumlayers and successful first feeding. Fish Bull 73:453–462
Leising AW (2001) Copepod foraging in patchy habitats andthin layers using a 2-D individual-based model. Mar EcolProg Ser 216:167–179
Lima SL, Dill LM (1990) Behavioural decisions made underthe risk of predation: a review and prospectus. Can J Zool68:619–640
Love RH (1971) Dorsal-aspect target strength of an individualfish. J Acoust Soc Am 49:816–823
McManus MM, Alldredge AL, Barnard AH, Boss E andothers (2003) Characteristics, distribution, and persis-tence of thin layers over a 48 hour period. Mar Ecol ProgSer 261:1–19
McManus MM, Cheriton OM, Drake PJ, Holliday DV, Stor-lazzi CD, Donaghay PL, Greenlaw CF (2005) Effects ofphysical processes on structure and transport of thin zoo-plankton layers in the coastal ocean. Mar Ecol Prog Ser301:199–215
Merrick RL, Chumbley MK, Byrd GV (1997) Diet diversity ofSteller sea lions (Eumetopias jubatus) and their populationdecline in Alaska: a potential relationship. Can J FishAquat Sci 54:1342–1348
Onsrud M, Kaartvedt S, Rostad A, Klevjer T (2004) Verticaldistribution and feeding patterns in fish foraging on thekrill Meganyctiphanes norvegica. ICES J Mar Sci 61:1278–1290
Orr MH (1981) Remote acoustic detection of zooplanktonresponse to fluid processes, oceanographic instrumenta-tion, and predators. Can J Fish Aquat Sci 38:1096–1105
Ostrand WD, Coyle KO, Drew GS, Maniscalco JM, Irons DB(1998) Selection of forage-fish schools by murrelets andtufted puffins in Prince William Sound, Alaska. Condor100:286–297
Patti B, Mazzola S, Calise L, Bonanno A, Buscaino G, CosimiG (2000) Echo-survey estimates and distribution of smallpelagic fish concentrations in the Strait of Sicily duringJune 1998. GFCM/ SAC Working Group on Small Pelag-ics, Fuengirola, Spain, 1–3 March 2000
Rines JEB, Donaghay PL, Dekshenieks MM, Sullivan JM,Twardowski MS (2002) Thin layers and camouflage: hid-den Pseudo-nitzschia populations in a fjord in the SanJuan Islands, Washington, USA. Mar Ecol Prog Ser 225:123–137
Roger C (1994) Relationships among yellowfin and skipjacktuna, their prey-fish and plankton in the tropical westernIndian Ocean. Fish Oceanogr 3:133–141
Tamura T, Fujise Y, Shimazake K (1998) Diet of minke whalesBalaenoptera acutorostrata in the northwestern part of theNorth Pacific in summer, 1994 and 1995. Fish Sci 64:71–76
Tichy FE, Solli H, Klaveness H (2003) Non-linear effects in a200-kHz sound beam and the consequences for target-strength measurement. ICES J Mar Sci 60:571–574
76
Editorial responsibility: Andrew Brierley, St. Andrews, UK
Submitted: December 26, 2008; Accepted: September 10, 2009Proofs received from author(s): November 17, 2009