Foraging movements of breeding Kelp Gulls in South Africa
12
RESEARCH Open Access Foraging movements of breeding Kelp Gulls in South Africa Katharina Reusch 1* , Nicolás Suárez 2 , Peter G. Ryan 3 and Lorien Pichegru 1,3 Abstract Background: Kelp Gulls Larus dominicanus are one of the most abundant gulls in the Southern Hemisphere and can play an important role in their ecosystem. Understanding their foraging ecology is therefore important, especially in the context of anthropogenic changes of the environment. Over 35,000 Kelp Gulls breed in South Africa but little is known about their habitat use. It has been hypothesised that foraging mainly occurs in natural habitats while provisioning chicks to ensure high quality food, but knowledge on their foraging ecology during the incubation period remains poor. Methods: We tracked incubating Kelp Gulls from six colonies distributed along the coast of South Africa, varying in their distance to urban areas and landfills, and compared foraging trip patterns and habitat selection between colonies. Results: Gulls from west coast colonies, generally located further from landfills than the other studied colonies, travelled farther from their breeding sites (11.7 ± 9.9–17.8 ± 21.7 km, n = 3 colonies) than birds from Cape Town and south and east coast colonies (1.7 ± 0.8–3.1 ± 3.7 km, n = 3) with birds travelling farthest when foraging at sea. Gulls from all colonies spent more time foraging in marine, coastal, and natural terrestrial environments than scavenging in strongly modified habitats while incubating. Conclusions: Our results suggest that Kelp Gulls in South Africa are able to exploit various resources from different foraging habitats, regardless of colony location and seem to rely less on anthropogenic habitats than expected. Keywords: Seabird ecology, Larus dominicanus, Bio-logging, Anthropogenic food Background Humans are having increasingly profound impacts on the environment through a myriad of activities including urbanization, contributing towards global changes [1]. Some species show greater tolerance towards anthropo- genic changes than others, for example by being less specialised in terms of habitat or diet and can benefit from altered conditions. Such species are considered ‘winners’ of global changes (e.g. [2]). By comparison, more specialised species with more sensitive require- ments tend to be limited in their capacities to adapt to changes, and often experience population and range de- creases as a result of global changes (e.g. [2–4]). Seabirds are particularly threatened by global changes with 28% of seabirds being categorised as either critically endangered, endangered or vulnerable [5]. As seabirds use both marine and terrestrial habitats ([5, 6]), threats include overfishing inducing depletion of their prey, by- catch in fisheries, pollution, introduced species in their breeding sites, anthropogenic disturbance, and habitat loss [5]. Populations of specialist feeders in particular tend to have declined (e.g. [7–9]) due to major eco- logical changes [10], as well as competition with fisheries [11]. By contrast, opportunistic and scavenging species are generally advantaged and some of their populations are growing exponentially in several parts of the world © The Author(s). 2020 Open Access This article is licensed under a Creative Commons Attribution 4.0 International License, which permits use, sharing, adaptation, distribution and reproduction in any medium or format, as long as you give appropriate credit to the original author(s) and the source, provide a link to the Creative Commons licence, and indicate if changes were made. The images or other third party material in this article are included in the article's Creative Commons licence, unless indicated otherwise in a credit line to the material. If material is not included in the article's Creative Commons licence and your intended use is not permitted by statutory regulation or exceeds the permitted use, you will need to obtain permission directly from the copyright holder. To view a copy of this licence, visit http://creativecommons.org/licenses/by/4.0/. The Creative Commons Public Domain Dedication waiver (http://creativecommons.org/publicdomain/zero/1.0/) applies to the data made available in this article, unless otherwise stated in a credit line to the data. * Correspondence: [email protected] 1 Institute for Coastal and Marine Research, Department of Zoology, Nelson Mandela University, PO Box 77000, Port Elizabeth, South Africa Full list of author information is available at the end of the article Reusch et al. Movement Ecology (2020) 8:36 https://doi.org/10.1186/s40462-020-00221-x
-
Upload
khangminh22 -
Category
Documents
-
view
0 -
download
0
Transcript of Foraging movements of breeding Kelp Gulls in South Africa
RESEARCH Open Access
Foraging movements of breeding KelpGulls in South AfricaKatharina Reusch1* , Nicolás Suárez2, Peter G. Ryan3 and Lorien Pichegru1,3
Abstract
Background: Kelp Gulls Larus dominicanus are one of the most abundant gulls in the Southern Hemisphere andcan play an important role in their ecosystem. Understanding their foraging ecology is therefore important,especially in the context of anthropogenic changes of the environment. Over 35,000 Kelp Gulls breed in SouthAfrica but little is known about their habitat use. It has been hypothesised that foraging mainly occurs in naturalhabitats while provisioning chicks to ensure high quality food, but knowledge on their foraging ecology during theincubation period remains poor.
Methods: We tracked incubating Kelp Gulls from six colonies distributed along the coast of South Africa, varying intheir distance to urban areas and landfills, and compared foraging trip patterns and habitat selection betweencolonies.
Results: Gulls from west coast colonies, generally located further from landfills than the other studied colonies,travelled farther from their breeding sites (11.7 ± 9.9–17.8 ± 21.7 km, n = 3 colonies) than birds from Cape Town andsouth and east coast colonies (1.7 ± 0.8–3.1 ± 3.7 km, n = 3) with birds travelling farthest when foraging at sea. Gullsfrom all colonies spent more time foraging in marine, coastal, and natural terrestrial environments than scavengingin strongly modified habitats while incubating.
Conclusions: Our results suggest that Kelp Gulls in South Africa are able to exploit various resources from differentforaging habitats, regardless of colony location and seem to rely less on anthropogenic habitats than expected.
Keywords: Seabird ecology, Larus dominicanus, Bio-logging, Anthropogenic food
BackgroundHumans are having increasingly profound impacts onthe environment through a myriad of activities includingurbanization, contributing towards global changes [1].Some species show greater tolerance towards anthropo-genic changes than others, for example by being lessspecialised in terms of habitat or diet and can benefitfrom altered conditions. Such species are considered‘winners’ of global changes (e.g. [2]). By comparison,more specialised species with more sensitive require-ments tend to be limited in their capacities to adapt to
changes, and often experience population and range de-creases as a result of global changes (e.g. [2–4]).Seabirds are particularly threatened by global changes
with 28% of seabirds being categorised as either criticallyendangered, endangered or vulnerable [5]. As seabirdsuse both marine and terrestrial habitats ([5, 6]), threatsinclude overfishing inducing depletion of their prey, by-catch in fisheries, pollution, introduced species in theirbreeding sites, anthropogenic disturbance, and habitatloss [5]. Populations of specialist feeders in particulartend to have declined (e.g. [7–9]) due to major eco-logical changes [10], as well as competition with fisheries[11]. By contrast, opportunistic and scavenging speciesare generally advantaged and some of their populationsare growing exponentially in several parts of the world
© The Author(s). 2020 Open Access This article is licensed under a Creative Commons Attribution 4.0 International License,which permits use, sharing, adaptation, distribution and reproduction in any medium or format, as long as you giveappropriate credit to the original author(s) and the source, provide a link to the Creative Commons licence, and indicate ifchanges were made. The images or other third party material in this article are included in the article's Creative Commonslicence, unless indicated otherwise in a credit line to the material. If material is not included in the article's Creative Commonslicence and your intended use is not permitted by statutory regulation or exceeds the permitted use, you will need to obtainpermission directly from the copyright holder. To view a copy of this licence, visit http://creativecommons.org/licenses/by/4.0/.The Creative Commons Public Domain Dedication waiver (http://creativecommons.org/publicdomain/zero/1.0/) applies to thedata made available in this article, unless otherwise stated in a credit line to the data.
* Correspondence: [email protected] for Coastal and Marine Research, Department of Zoology, NelsonMandela University, PO Box 77000, Port Elizabeth, South AfricaFull list of author information is available at the end of the article
Reusch et al. Movement Ecology (2020) 8:36 https://doi.org/10.1186/s40462-020-00221-x
(e.g. [12–15]). Opportunistic seabirds that are able toswitch to alternative food sources can become a problemfor other seabirds through competition for prey or directpredation, when extensively used food sources, like fish-ery discards [16] or offal [17] are reduced.Many large gulls (Larus spp.) are opportunistic for-
agers, able to exploit a wide variety of food sources ran-ging from marine to intertidal, terrestrial, oranthropogenic (e.g. [18, 19]). Their ability to forage onhuman-derived food, such as fishery waste and open re-fuse tips, as well as cessation of population control mea-sures has led to an increase in population numbers formany species since the 1970s [13, 20]. Food derivedfrom anthropogenic sources can be more predictableand easily accessible [21] than food derived from e.g. themarine environment, which can often be patchily distrib-uted [22]. Even though many gull species feed opportun-istically throughout the year, there seems to be a switchin diet during the chick-rearing period to more naturalprey, e.g. fish [23, 24]. This selective behaviour might berelated to the fact that natural prey has a higher nutri-tional value and is more easily handled by chicks [23].The Kelp Gull Larus dominicanus is distributed in
coastal areas and on islands at mid-to high-latitudesthroughout much of the southern hemisphere [25]. KelpGull populations are generally increasing, with a globalestimate of 3.3 to 4.3 million individuals [25]. Populationincreases in both South America [26] and South Africa[27] have been attributed to increased feeding opportun-ities mostly from anthropogenic sources [13, 28, 29].Kelp Gulls are opportunistic feeders that forage on awide variety of natural prey as well as food derived fromhuman activities [30–33]. In South Africa, the breedingpopulation is estimated at about 17,500 pairs [27] andthey are known to feed on invertebrates, fish, insects,berries, frogs, snakes, small mammals and carcasses ofbirds and seals as well as seabirds’ eggs and chicks in-cluding conspecifics [34]. They also scavenge from rub-bish dumps, fishing harbours and croplands [34].Knowledge of Kelp Gull foraging ecology is limited in
South Africa and information exists mostly on abun-dance (e.g. [27, 35]) and distribution patterns (e.g. [28,36]), as well as their general diet (e.g. [30, 34]). As KelpGulls can have an important role in their ecosystem dueto their abundance it is important to understand theirforaging ecology. Kelp Gulls are generalists and can bepredators of other seabirds, so variations in the availabil-ity of their main food sources could affect other seabirds.In addition, a decrease in the availability of supplemen-tary food sources could cause population declines, asseen in other gull species [37, 38]. Gulls tend to switchto a more natural diet during chick-rearing (e.g. [23,24]), therefore the incubation period may provide theopportunity to get a more comprehensive insight into
the wider range of foraging habitats exploited, and toidentify the relative importance of anthropogenic re-sources for adult Kelp Gulls. In this study we investi-gated the foraging behaviour of Kelp Gulls breeding atsix colonies in South Africa, varying in their proximityto urban areas and landfills. We deployed GPS loggerson incubating adults to explore: 1) whether colony loca-tion in relation to anthropogenic areas influenced for-aging effort, and 2) whether foraging habitat choice (e.g.oceanic, terrestrial or anthropogenic, like landfills) dif-fered among colonies. We expected birds from colonieslocated closer to urban areas or landfills to have reducedforaging effort and to rely more on anthropogenic food.
MethodsThe foraging behaviour of incubating adult Kelp Gullswas investigated at six colonies, three on the west coast,one within Cape Town, one on the south coast and oneon the east coast of South Africa (Fig. 1).The Dwarskersbos colony (DW; 32°43′S, 18°12′E) is
located on the west coast of South Africa in a salt works4 km south of Dwarskersbos. This small coastal villagewith 670 inhabitants is 25 km from the closest landfill.The colony had some 1200 Kelp Gull breeding pairs in2018 (L. Upfold, pers. comm.).Malgas Island (MA; 33°03′S, 17°55′E) and Jutten Is-
land (JU; 33°05′S, 17°57′E) are small islands in the WestCoast National Park in the mouth of Saldanha Bay onthe west coast of South Africa. Malgas Island had 113breeding pairs of Kelp Gulls in 2018 (B. Dyer, pers.comm.). The 8.3 ha island lying 850 m offshore, is hometo colonies of Cape Gannets Morus capensis, Bank Pha-lacrocorax neglectus, Cape Phalacrocorax capensis, andCrowned Cormorants Microcarbo coronatus. The closesttowns are Saldanha and Langebaan, with 28,000 and8000 inhabitants, respectively, with the closest landfill15 km from the colony.Jutten Island (JU; 33°05′S, 17°57′E; 46 ha), 3.7 km
southeast of Malgas Island, had ca 1200 Kelp Gullbreeding pairs in 2018 (B. Dyer, pers. comm.) and isroughly 12 km away from the closest landfill. Other sea-birds breeding on the island include Crowned, Cape andBank Cormorants.The Strandfontein colony (ST; 34°05.4′S, 18° 32.1′E) is
located within the city of Cape Town with 3.4 millioninhabitants. The colony is located in sandy dunes be-tween Strandfontein sewage works and False Bay and isonly 3 km from the large Coastal Park landfill site. It hadca 1060 breeding pairs in 2018 (B. Dyer, pers. comm.).The Keurbooms Lookout Beach colony (KE; 34°03′S,
23°22′E) is located on a sandbank at the western side ofthe Keurbooms Estuary, in Plettenberg Bay on the southcoast. The colony is situated 1 km from Plettenberg Baywith 32,000 inhabitants and 51 km from the closest
Reusch et al. Movement Ecology (2020) 8:36 Page 2 of 12
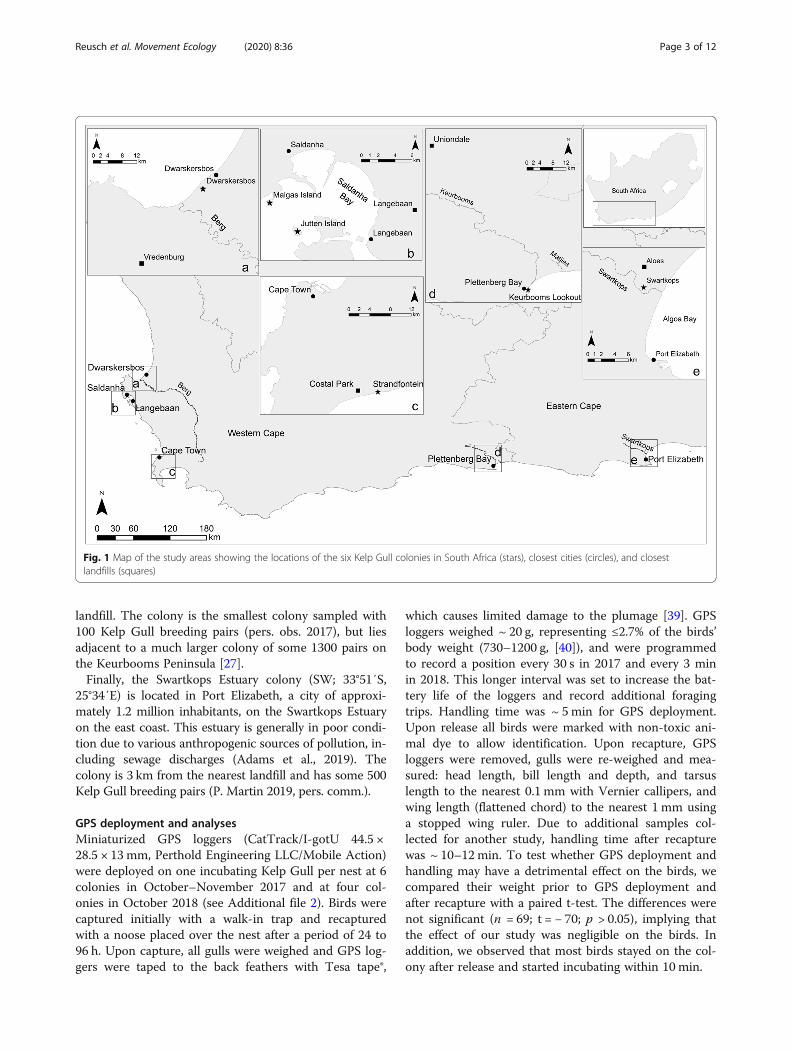
landfill. The colony is the smallest colony sampled with100 Kelp Gull breeding pairs (pers. obs. 2017), but liesadjacent to a much larger colony of some 1300 pairs onthe Keurbooms Peninsula [27].Finally, the Swartkops Estuary colony (SW; 33°51′S,
25°34′E) is located in Port Elizabeth, a city of approxi-mately 1.2 million inhabitants, on the Swartkops Estuaryon the east coast. This estuary is generally in poor condi-tion due to various anthropogenic sources of pollution, in-cluding sewage discharges (Adams et al., 2019). Thecolony is 3 km from the nearest landfill and has some 500Kelp Gull breeding pairs (P. Martin 2019, pers. comm.).
GPS deployment and analysesMiniaturized GPS loggers (CatTrack/I-gotU 44.5 ×28.5 × 13 mm, Perthold Engineering LLC/Mobile Action)were deployed on one incubating Kelp Gull per nest at 6colonies in October–November 2017 and at four col-onies in October 2018 (see Additional file 2). Birds werecaptured initially with a walk-in trap and recapturedwith a noose placed over the nest after a period of 24 to96 h. Upon capture, all gulls were weighed and GPS log-gers were taped to the back feathers with Tesa tape®,
which causes limited damage to the plumage [39]. GPSloggers weighed ~ 20 g, representing ≤2.7% of the birds’body weight (730–1200 g, [40]), and were programmedto record a position every 30 s in 2017 and every 3 minin 2018. This longer interval was set to increase the bat-tery life of the loggers and record additional foragingtrips. Handling time was ~ 5min for GPS deployment.Upon release all birds were marked with non-toxic ani-mal dye to allow identification. Upon recapture, GPSloggers were removed, gulls were re-weighed and mea-sured: head length, bill length and depth, and tarsuslength to the nearest 0.1 mm with Vernier callipers, andwing length (flattened chord) to the nearest 1 mm usinga stopped wing ruler. Due to additional samples col-lected for another study, handling time after recapturewas ~ 10–12min. To test whether GPS deployment andhandling may have a detrimental effect on the birds, wecompared their weight prior to GPS deployment andafter recapture with a paired t-test. The differences werenot significant (n = 69; t = − 70; p > 0.05), implying thatthe effect of our study was negligible on the birds. Inaddition, we observed that most birds stayed on the col-ony after release and started incubating within 10 min.
Fig. 1 Map of the study areas showing the locations of the six Kelp Gull colonies in South Africa (stars), closest cities (circles), and closestlandfills (squares)
Reusch et al. Movement Ecology (2020) 8:36 Page 3 of 12
GPS data were uploaded into ArcMap 10.5.1 (Esri,2018) to identify foraging trips. We only considered tripsaway from the colony lasting > 10min as foraging trips <10min were mostly within 1 km of the breeding site andwere most likely for comfort behaviours (i.e. bathing,roosting; see Additional file 1). All GPS data were filteredfor erroneous GPS locations following [41], based on amaximum flying speed of 70 km h− 1 [42]. As the samplinginterval differed between GPS tracks in 2017 and 2018,tracks were interpolated to a common interval of 3minusing the function redisltraj in the R package adehabi-tatLT [43] allowing comparisons between years. For eachtrip, maximum distance from the colony (greatest distancefrom last point on colony), path length (sum of distancebetween all consecutive GPS locations) and trip duration(time between last and first location on the colony beforeand after a trip) were calculated.
Habitat analysisIn order to identify foraging areas, we used anExpectation-Maximization Binary Clustering (EMbC) al-gorithm for behavioural annotation using the R packageEMbC [44]. This algorithm used turning angle and speedbetween successive GPS locations to assign each locationto one of four behavioural categories: low velocity andlow turns (LL), high velocity and low turns (HL), lowvelocity and high turns (LH), and high velocity and highturns (HH) [44]. We considered that an animal was fly-ing when the velocity was high and the turning anglelow (HL) and potentially foraging in all other three cat-egories (LL, LH, HH). Foraging locations were thenuploaded into ArcMap 10.5.1 and an Imagery Basemapwas used to associate them with a defined foraging habi-tat. Foraging habitats were categorised as follows:oceanic, coastal, terrestrial natural and terrestrial
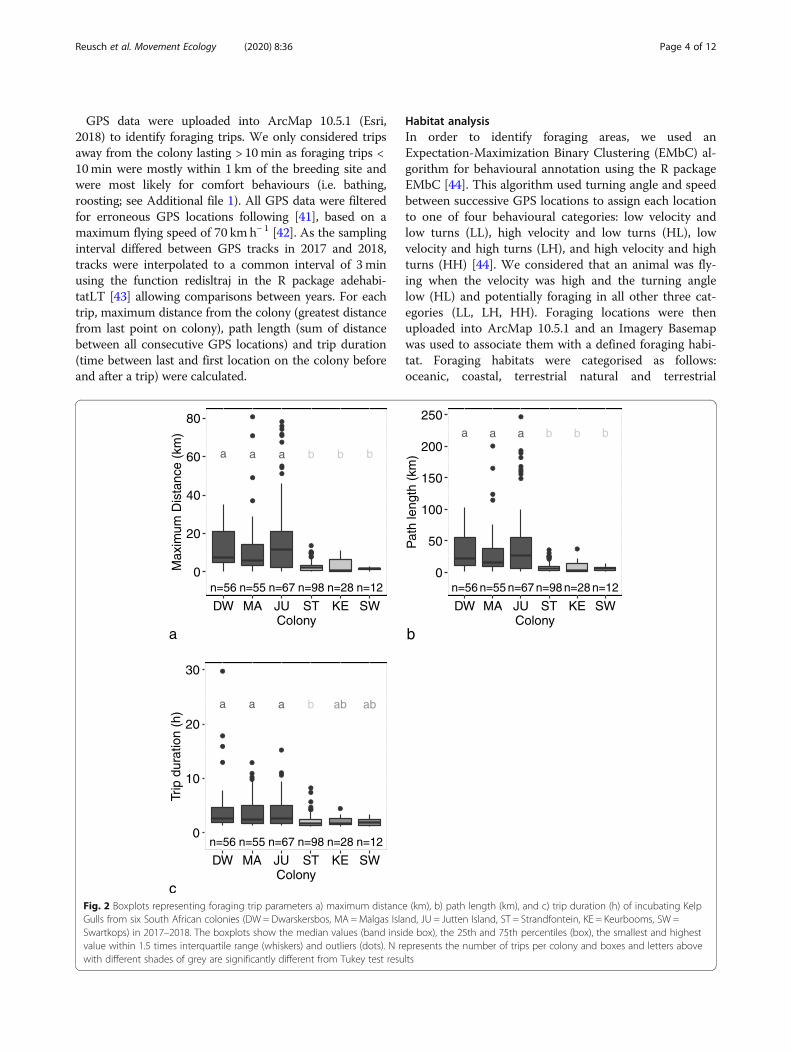
Fig. 2 Boxplots representing foraging trip parameters a) maximum distance (km), b) path length (km), and c) trip duration (h) of incubating KelpGulls from six South African colonies (DW = Dwarskersbos, MA =Malgas Island, JU = Jutten Island, ST = Strandfontein, KE = Keurbooms, SW =Swartkops) in 2017–2018. The boxplots show the median values (band inside box), the 25th and 75th percentiles (box), the smallest and highestvalue within 1.5 times interquartile range (whiskers) and outliers (dots). N represents the number of trips per colony and boxes and letters abovewith different shades of grey are significantly different from Tukey test results
Reusch et al. Movement Ecology (2020) 8:36 Page 4 of 12
anthropogenic. Oceanic habitat was defined as any pointin the marine environment > 60m from the shore.Coastal habitats included the shore (beach and up to 60m from the shoreline). Terrestrial natural habitats con-sisted of unmodified terrestrial habitats such as naturereserves, and terrestrial anthropogenic habitats were de-fined as transformed areas (e.g. artificial water bodies,parks), urban areas, landfills, and agricultural fields.
Statistical analysisAll statistical analyses were carried out in R (version3.5.2 [45];). To compare foraging trip parameters (max-imum distance from the colony, trip duration, pathlength) between colonies and years, we fitted modelsusing the lmer function from the lmerTest package [46].Trip parameters were log transformed to obtain normal-ity and homoscedasticity and set as the response vari-able, while year and colony were the explanatoryvariables, with bird ID as a random factor to account formultiple trips per bird. The MuMIn package [47] wasused for averaging the different models and selecting thebest fit model based on the Akaike Information Criter-ion (AIC). We performed post hoc Tukey tests on the
explanatory variable of each model to allow pair-wisecomparisons using the multcomp package [48].We then compared the use of different foraging habi-
tats (oceanic, coastal, terrestrial natural, terrestrial an-thropogenic) between colonies and whether foragingparameters were influenced by foraging habitat choice.A correlation matrix was used to assess the level of cor-relation between trip parameters in order to avoid anyeffect of collinearity in our results. The “Pearson”method with the Hmisc package [49] was used to obtainsignificance levels for correlations. As trip parameterswere strongly correlated (r values between 0.6–0.99 andp values < 0.001), trip duration and path length were re-moved from habitat choice analysis. In order to maxi-mise the accuracy of the model, maximum distance wasused, as it showed more significant differences betweencolonies. Only the dominant habitat (i.e. that most vis-ited during a foraging trip, > 50% of foraging time) wasconsidered in each trip. Habitats were combined whenan individual spent an equal amount of time in morethan one habitat. We used a conditional inference treewith the function ctree of the party package [50] to esti-mate what influenced habitat choice and used the type
Table 1 Summary statistics of colony influence on maximum distance (km), path length (km), and duration (h)
Model Fixed factors Model estimates ± SE AICc DF R2m R2c
Log (Max distance) ~ Intercept 1152.41 3
Log (Max distance) ~ Colony Intercept DW 1.94 ± 0.21 1108.95 8 0.26 0.31
Colony MA −0.17 ± 0.30
Colony JU 0.07 ± 0.28
Colony ST −1.66 ± 0.27
Colony KE −1.79 ± 0.36
Colony SW −1.58 ± 0.48
Log (Path length) ~ Intercept 1161.91
Log (Path length) ~ Colony Intercept DW 2.86 ± 0.20 1118.01 5 0.25 0.28
Colony MA −0.16 ± 0.29
Colony JU 0.05 ± 0.27
Colony ST −1.63 ± 0.26
Colony KE −1.78 ± 0.35
Colony SW −1.48 ± 0.47
Log (Trip duration) ~ Intercept 906.09
Log (Trip duration) ~ Colony Intercept DW 0.55 ± 0.15 888.43 5 0.14 0.21
Colony MA −0.03 ± 0.22
Colony JU −0.01 ± 0.20
Colony ST −0.80 ± 0.20
Colony KE −0.71 ± 0.27
Colony SW −0.88 ± 0.35
We used linear mixed-effect models with colony as fixed factors and bird ID as random intercept. All response variables were log transformed. Intercept DW is theintercept and the estimate for the Colony DW. Model estimates and standard errors are shown for the six colonies. We provided the marginal R2 which representsthe variance explained by the fixed factors alone, and the conditional R2 which describes the variance explained by both the fixed and random factors. ColoniesDW Dwarskersbos, MA Malgas Island, JU Jutten Island, ST Strandfontein, KE Keurbooms, SW Swartkops
Reusch et al. Movement Ecology (2020) 8:36 Page 5 of 12
of habitat as response variable and maximum distanceand colony as explanatory variables. We used the defaultsetting to build the tree and set statistical significance atp ≤ 0.05. To estimate model accuracy, we set the seed at1234 and divided the data set into a training (70% ofdata) and testing data set (30% of data). Model accuracywas obtained by calculating the misclassification errorrate on the testing data set following [51].
ResultsOf the 85 incubating Kelp Gulls equipped with GPS log-gers, 75 were recaptured. All 10 birds that eluded recap-ture were observed alive. Of the 75 recaptured birds, oneGPS logger was damaged and data could not be re-trieved, two loggers did not record data in a consistentway and one bird had lost the GPS. In addition, in 2017three birds did not leave their colony. As a result, datawere collected from 68 birds, which completed 316 for-aging trips (see Additional file 2).
Trip parametersForaging trip parameters did not vary between years(lmer, p > 0.05), allowing data from both years to bepooled for comparisons between colonies. Birds fromJutten Island foraged farthest from their colony, with an
average maximum distance ± SD of 17.8 ± 21.7 km(Range = 0.03–78.2 km; n = 56), compared to averagesvarying between 1.7 ± 0.8 and 11.8 ± 15.9 km (Range =0.07–80.7 km; n = 206) at the five other colonies (Fig. 2).Gulls from Cape Town and south and east coast col-onies, Strandfontein, Keurbooms, and Swartkops, all for-aged close to their colony, i.e. 1.7 ± 0.8 to 3.1 ± 3.7 km(Range = 0.07–13.66; n = 138) from their breeding sites,with birds from Swartkops travelling the shortest dis-tances. Maximum distances and path lengths varied sig-nificantly between colonies (lmer, p < 0.001), with birdsfrom west coast colonies, Dwarskersbos, Malgas and Jut-ten travelling farther and with longer path lengths thanbirds from the three other colonies. Trip durations alsodiffered between colonies with trips from Strandfonteinbeing significantly shorter than trips from the west coastcolonies (lmer, p < 0.001; Table 1). Trip durationsranged from a minimum of 12.6 min at Swartkops up toa maximum of 28.7 h in Dwarskersbos and foraging dis-tances from 30m from the colony at Jutten, up to 80 kmat Malgas.
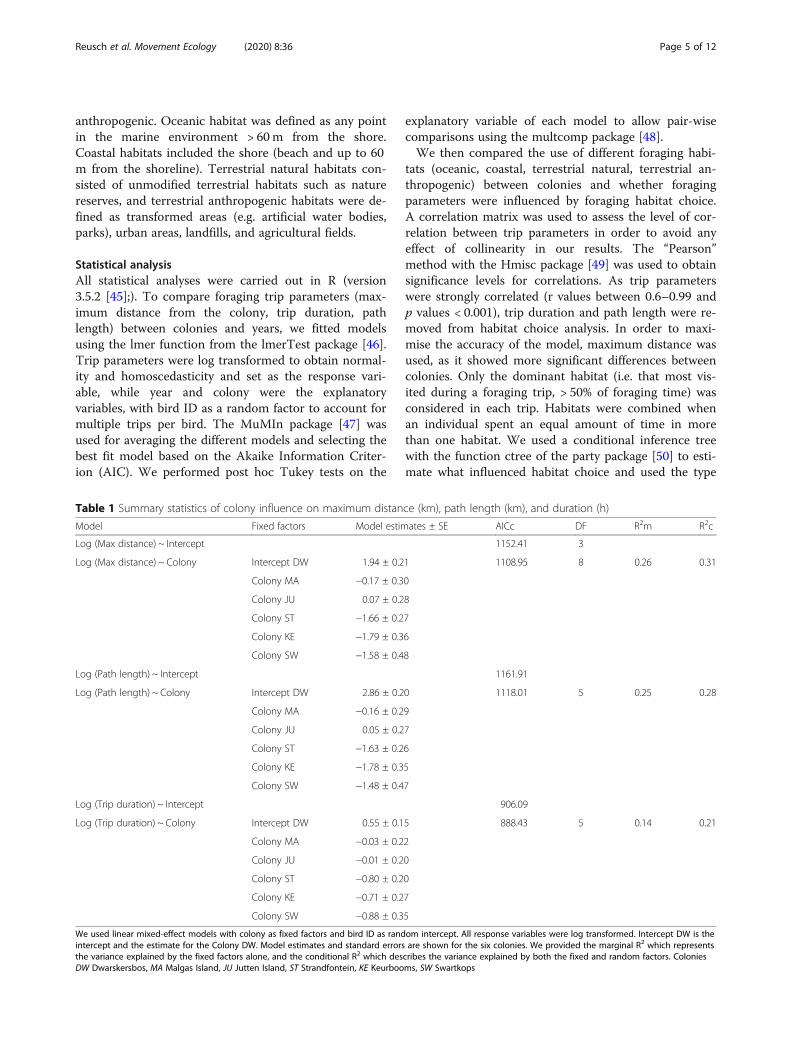
Habitat analysisBirds from all six colonies spent 75–87% of their timewithin the colony, 10–17% foraging and 1–6% flying
0
25
50
75
100
DW MA JU ST KE SWColony
Per
cent
age
of ti
me
spen
t (%
)
Behaviour
ColonyForagingFlyingOther
Fig. 3 Percentage of time spent by incubating Kelp Gulls at the colony, foraging, flying, or other (i.e. trips < 10min outside the breeding colony) for eachof the six South African colonies (DW=Dwarskersbos, MA=Malgas Island, JU = Jutten Island, ST = Strandfontein, KE = Keurbooms, SW= Swartkops)
Reusch et al. Movement Ecology (2020) 8:36 Page 6 of 12
(Fig. 3). Trips < 10min outside the breeding colony arerepresented as “other” (0.5 to 3% of time). Overall, birdsfrom Dwarskersbos and Malgas Island spent the longesttime away from the colony foraging (17%), while birdsfrom Swartkops foraged for only 10% of the time.Foraging habitats, as identified by the EMbC, varied
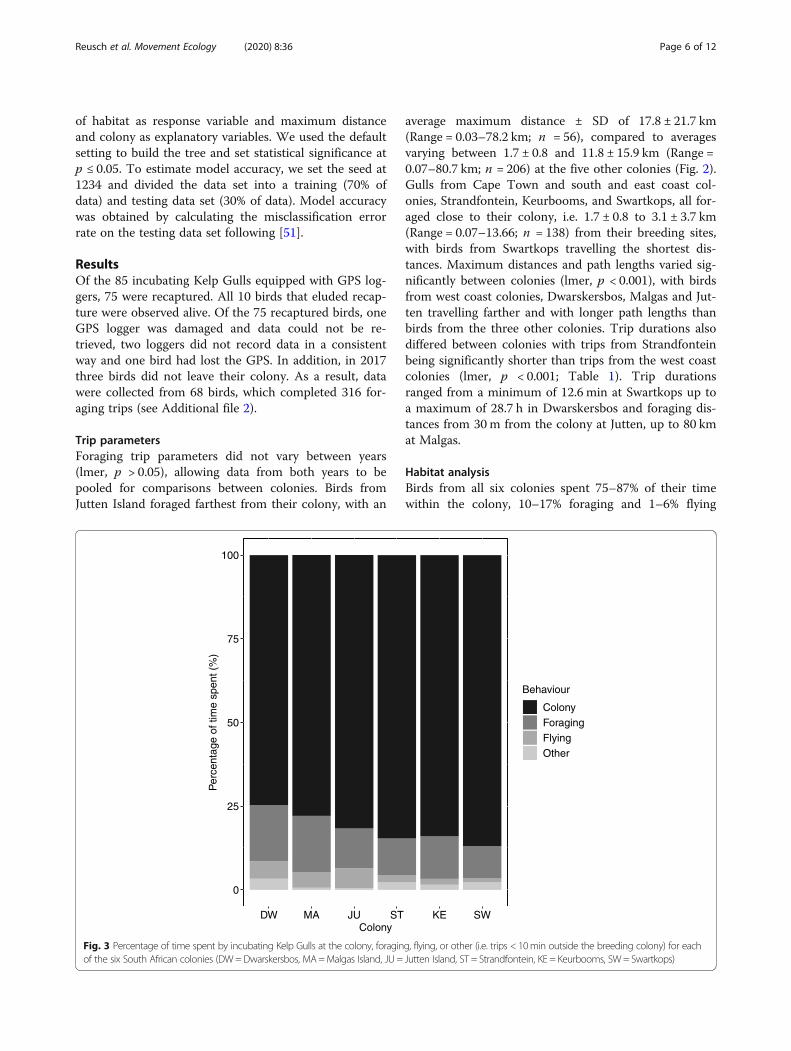
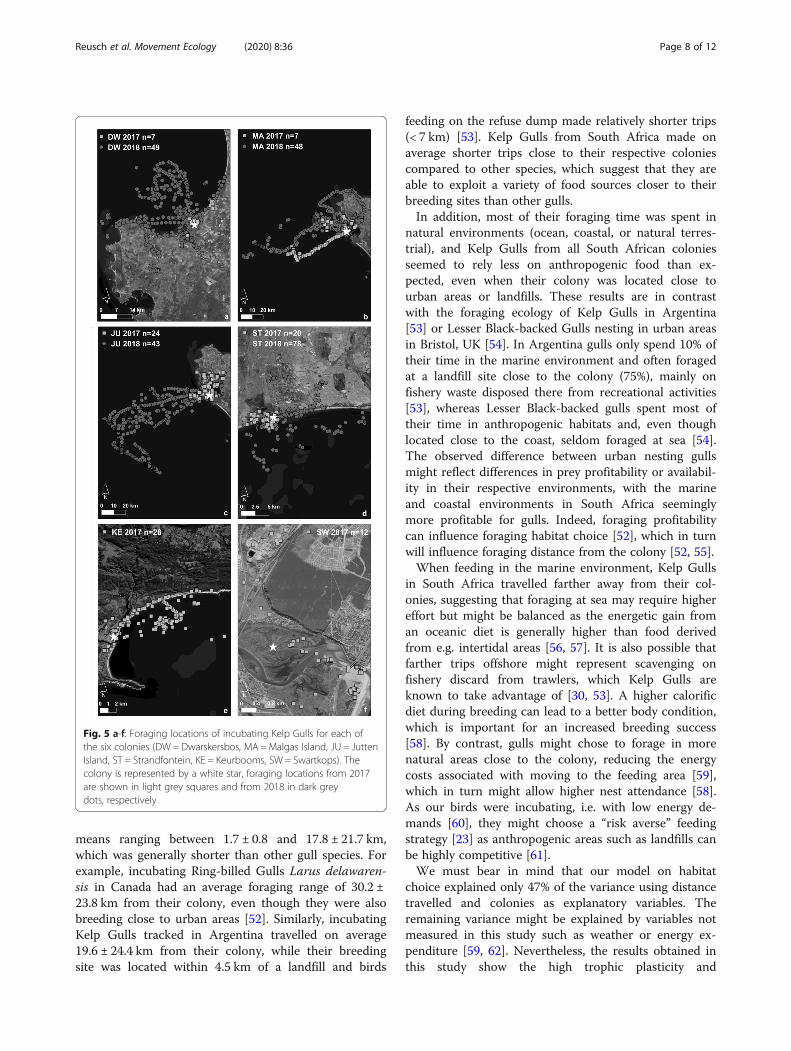
widely across colonies (Fig. 4, see Additional file 3). Gullsfrom Dwarskersbos, Malgas, and Jutten Island, i.e. thewest coast colonies, mostly foraged in oceanic habitats(37–52% of their foraging time), whereas birds from Keur-booms foraged mainly in coastal habitats (57%) and fromSwartkops in terrestrial natural areas (65%; Fig. 5). Birdsfrom Strandfontein showed more diverse habitat choices,foraging in oceanic, coastal, terrestrial natural and terres-trial anthropogenic habitats. Birds from all colonies fed tosome extent in terrestrial anthropogenic areas (4–41% oftheir time), with birds from Malgas Island (41%) andStrandfontein (33%) spending the highest amount of time.Birds from Malgas spent more time on artificial waterbodies (19%) and agricultural fields (16%) compared tobirds from Strandfontein which frequented the sewageworks (15%) and nearby landfill (15%). However, much ofthis time at wetlands could be spent roosting, bathing, orin other comfort behaviours, which could indicate thattime spend foraging in these areas was overestimated.
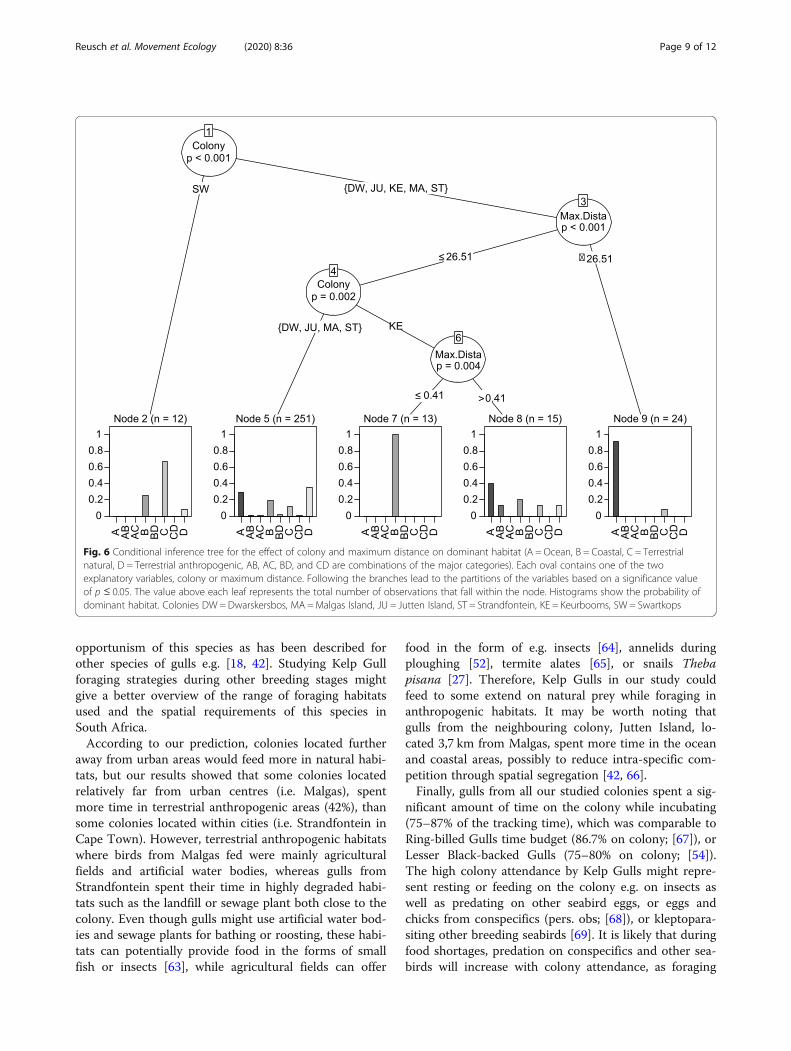
Results from the conditional inference tree showedthat foraging habitat choice was significantly influencedby colony (p < 0.001; Fig. 6) and maximum foraging dis-tance (p < 0.01; Fig. 6), which explained 47% of the vari-ance in habitat choice. The first split (Node 1) showed asignificant difference between birds from Swartkops andthe other colonies, as the former foraged predominantlyin terrestrial natural habitats. The next split showed thatbirds from all other five colonies were more likely for-aging in the marine environment (A, Node 9) when tripswere farther from their respective colonies (> 26.51 km;Node 3). The following split revealed different foragingbehaviours between colonies again, with Keurbooms col-ony foraging only in coastal areas (B, Node 7), when for-aging ≤0.41 km from their colony, and in the marineenvironment when foraging further away (Node 8). Fi-nally, birds from Dwarskersbos, Malgas, Jutten andStrandfontein were dividing their time more equallyamong the four habitats when foraging closer to the col-ony (Node 5).
DiscussionOur study showed high foraging flexibility of incubatingKelp Gulls in South Africa. Their foraging range variedfrom 30m up to 80 km from the colonies, with colony
0
25
50
75
100
DW MA JU ST KE SWColony
Per
cent
age
of ti
me
spen
t for
agin
g (%
)
Habitat
OceanCoastalTerrestrial naturalTerrestrial anthropogenic
Fig. 4 Percentage of time spent by incubating Kelp Gulls in each of the four foraging habitats for each of the six studied colonies in South Africa(DW = Dwarskersbos, MA =Malgas Island, JU = Jutten Island, ST = Strandfontein, KE = Keurbooms, SW = Swartkops)
Reusch et al. Movement Ecology (2020) 8:36 Page 7 of 12
means ranging between 1.7 ± 0.8 and 17.8 ± 21.7 km,which was generally shorter than other gull species. Forexample, incubating Ring-billed Gulls Larus delawaren-sis in Canada had an average foraging range of 30.2 ±23.8 km from their colony, even though they were alsobreeding close to urban areas [52]. Similarly, incubatingKelp Gulls tracked in Argentina travelled on average19.6 ± 24.4 km from their colony, while their breedingsite was located within 4.5 km of a landfill and birds
feeding on the refuse dump made relatively shorter trips(< 7 km) [53]. Kelp Gulls from South Africa made onaverage shorter trips close to their respective coloniescompared to other species, which suggest that they areable to exploit a variety of food sources closer to theirbreeding sites than other gulls.In addition, most of their foraging time was spent in
natural environments (ocean, coastal, or natural terres-trial), and Kelp Gulls from all South African coloniesseemed to rely less on anthropogenic food than ex-pected, even when their colony was located close tourban areas or landfills. These results are in contrastwith the foraging ecology of Kelp Gulls in Argentina[53] or Lesser Black-backed Gulls nesting in urban areasin Bristol, UK [54]. In Argentina gulls only spend 10% oftheir time in the marine environment and often foragedat a landfill site close to the colony (75%), mainly onfishery waste disposed there from recreational activities[53], whereas Lesser Black-backed gulls spent most oftheir time in anthropogenic habitats and, even thoughlocated close to the coast, seldom foraged at sea [54].The observed difference between urban nesting gullsmight reflect differences in prey profitability or availabil-ity in their respective environments, with the marineand coastal environments in South Africa seeminglymore profitable for gulls. Indeed, foraging profitabilitycan influence foraging habitat choice [52], which in turnwill influence foraging distance from the colony [52, 55].When feeding in the marine environment, Kelp Gulls
in South Africa travelled farther away from their col-onies, suggesting that foraging at sea may require highereffort but might be balanced as the energetic gain froman oceanic diet is generally higher than food derivedfrom e.g. intertidal areas [56, 57]. It is also possible thatfarther trips offshore might represent scavenging onfishery discard from trawlers, which Kelp Gulls areknown to take advantage of [30, 53]. A higher calorificdiet during breeding can lead to a better body condition,which is important for an increased breeding success[58]. By contrast, gulls might chose to forage in morenatural areas close to the colony, reducing the energycosts associated with moving to the feeding area [59],which in turn might allow higher nest attendance [58].As our birds were incubating, i.e. with low energy de-mands [60], they might choose a “risk averse” feedingstrategy [23] as anthropogenic areas such as landfills canbe highly competitive [61].We must bear in mind that our model on habitat
choice explained only 47% of the variance using distancetravelled and colonies as explanatory variables. Theremaining variance might be explained by variables notmeasured in this study such as weather or energy ex-penditure [59, 62]. Nevertheless, the results obtained inthis study show the high trophic plasticity and
Fig. 5 a-f: Foraging locations of incubating Kelp Gulls for each ofthe six colonies (DW = Dwarskersbos, MA =Malgas Island, JU = JuttenIsland, ST = Strandfontein, KE = Keurbooms, SW = Swartkops). Thecolony is represented by a white star, foraging locations from 2017are shown in light grey squares and from 2018 in dark greydots, respectively
Reusch et al. Movement Ecology (2020) 8:36 Page 8 of 12
opportunism of this species as has been described forother species of gulls e.g. [18, 42]. Studying Kelp Gullforaging strategies during other breeding stages mightgive a better overview of the range of foraging habitatsused and the spatial requirements of this species inSouth Africa.According to our prediction, colonies located further
away from urban areas would feed more in natural habi-tats, but our results showed that some colonies locatedrelatively far from urban centres (i.e. Malgas), spentmore time in terrestrial anthropogenic areas (42%), thansome colonies located within cities (i.e. Strandfontein inCape Town). However, terrestrial anthropogenic habitatswhere birds from Malgas fed were mainly agriculturalfields and artificial water bodies, whereas gulls fromStrandfontein spent their time in highly degraded habi-tats such as the landfill or sewage plant both close to thecolony. Even though gulls might use artificial water bod-ies and sewage plants for bathing or roosting, these habi-tats can potentially provide food in the forms of smallfish or insects [63], while agricultural fields can offer
food in the form of e.g. insects [64], annelids duringploughing [52], termite alates [65], or snails Thebapisana [27]. Therefore, Kelp Gulls in our study couldfeed to some extend on natural prey while foraging inanthropogenic habitats. It may be worth noting thatgulls from the neighbouring colony, Jutten Island, lo-cated 3,7 km from Malgas, spent more time in the oceanand coastal areas, possibly to reduce intra-specific com-petition through spatial segregation [42, 66].Finally, gulls from all our studied colonies spent a sig-
nificant amount of time on the colony while incubating(75–87% of the tracking time), which was comparable toRing-billed Gulls time budget (86.7% on colony; [67]), orLesser Black-backed Gulls (75–80% on colony; [54]).The high colony attendance by Kelp Gulls might repre-sent resting or feeding on the colony e.g. on insects aswell as predating on other seabird eggs, or eggs andchicks from conspecifics (pers. obs; [68]), or kleptopara-siting other breeding seabirds [69]. It is likely that duringfood shortages, predation on conspecifics and other sea-birds will increase with colony attendance, as foraging
Fig. 6 Conditional inference tree for the effect of colony and maximum distance on dominant habitat (A = Ocean, B = Coastal, C = Terrestrialnatural, D = Terrestrial anthropogenic, AB, AC, BD, and CD are combinations of the major categories). Each oval contains one of the twoexplanatory variables, colony or maximum distance. Following the branches lead to the partitions of the variables based on a significance valueof p ≤ 0.05. The value above each leaf represents the total number of observations that fall within the node. Histograms show the probability ofdominant habitat. Colonies DW = Dwarskersbos, MA =Malgas Island, JU = Jutten Island, ST = Strandfontein, KE = Keurbooms, SW = Swartkops
Reusch et al. Movement Ecology (2020) 8:36 Page 9 of 12
on or close to the colony can be beneficial for breedingsuccess [58]. However, this situation will present a prob-lem in mixed seabird colonies, such as Malgas and Jut-ten Island. Indeed, gulls from these colonies fedextensively in the marine environment and on terrestrialanthropogenic areas during our study and changes inthe availability of these food sources could result in in-creased predation on other seabird eggs and chicks. Forexample, during the 2018 breeding season Kelp Gulls onMalgas predated on 8000 endangered Cape Gannet eggs[68], i.e. some 50% of the total gannet colony, which fora species that does not lay repeat clutches, will have ser-ious population-level effects over the long term. Theresolution of our GPS did not allow us to discriminatebetween time spend resting/ foraging on the colony ornest attendance, and it is possible that data from acceler-ometers may allow gain that insight by identifying be-haviours such as standing, sitting or walking.
ConclusionsThis is the first comprehensive study using GPS loggersto investigate the foraging ecology of incubating KelpGulls in South Africa. We showed that like other Larusgulls, this opportunistic seabird is capable of foraging invarious habitats, regardless of the proximity of their col-ony to urban areas or landfills. Additional informationon Kelp Gull diet from stomach and pellet sampleswould be necessary to understand the energetic conse-quence of feeding in different habitats. Similarly, thisstudy should be repeated during the chick-rearing stageto gain a more complete picture of the foraging ecologyand energetics of South African Kelp Gulls. Such infor-mation is important to understand and predict the fu-ture population trajectory of Kelp Gulls in South Africa,with potential consequences on their environment andother species breeding in their vicinity.As incubating Kelp Gulls in South Africa did not seem
to depend highly on food made available from landfills,it is possible that changes in the availability of scrapsdue to improved landfill management (e.g. closing, cov-ering, or diverting organic waste to composting facilities)might have little impact on South African Kelp Gullpopulations. The ability of Kelp Gulls in South Africa toexploit different foraging habitats allows this opportunis-tic forager to be highly adaptable and can thus be con-sidered ‘winners’ of global change.
Supplementary informationSupplementary information accompanies this paper at https://doi.org/10.1186/s40462-020-00221-x.
Additional file 1. 3D graph showing trip duration (min) and maximumdistance (km) of foraging trips (%) between 0 and 1730 min and 0 and90 km from colony in intervals.
Additional file 2. Overview of timing of data collection and number ofadult Kelp Gulls deployed and recaptured per colony in South Africa in2017 and 2018 with number of complete foraging trips performed.
Additional file 3. Time spent (%) in each of the foraging habitats indetail (Ocean, shore, natural, natural-transformed, urban, agriculture, land-fill) for each of the six colonies.
AbbreviationsDW: Dwarskersbos; MA: Malgas Island; JU: Jutten Island; ST: Strandfontein;KE: Keurbooms Lookout Beach; SW: Swartkops Estuary; Km: Kilometers;M: Meters; Mm: Millimeters; H: Hours; Min: Minutes; G: Grams;EMbC: Expectation-Maximization Binary Clustering algorithm; LL: Low velocityand low turns; HL: High velocity and low turns; LH: Low velocity and highturns; HH: High velocity and high turns; A: Ocean; B: Coastal; C: Terrestrialnatural; D: Terrestrial anthropogenic
AcknowledgementsWe thank R. Vanstreels, R. Hurtado, R. Schoeman, T. Shaanika, G. Passuni, B.Fouche, O. Adekola, M. Amiguet, C. Mitchell, M. Wheeler, G. Traisnel, and D.Le Gouvello for their assistance in the field and P. Nel for coordinatingaccess to Malgas and Jutten Island. Transport to the islands was madepossible with the help of Elite charters. T. Mayes granted permission to workon the salt pans. G. Passuni, G Traisnel, F. Orgeret, and T. Carpenter-Kling pro-vided assistance with statistical advice.
Authors’ contributionsLP, KR, NS, PGR conceptualised the project and designed the study. KR, LP,NS collected and analysed the data. The manuscript was drafted by KR andedited by LP, PGR, and NS. All authors read and approved the finalmanuscript.
FundingFinancial support from the FitzPatrick Institute of African Ornithologyfacilitated this research project and was further supported by the NationalResearch Foundation.
Availability of data and materialsThe datasets used and/or analysed during the current study are availablefrom the corresponding author on reasonable request.
Ethics approvalPermission to conduct this research at the various field sites was granted bythe Department of Environmental Affairs, the Department of Agriculture,Forestry and Fishery, and South African National Parks. All research protocolswere approved by the Research Ethics Committee (Animal) of NelsonMandela University.
Consent for publicationNot applicable.
Competing interestsThe authors declare that they have no competing interests.
Author details1Institute for Coastal and Marine Research, Department of Zoology, NelsonMandela University, PO Box 77000, Port Elizabeth, South Africa. 2Centro parael Estudio de Sistemas Marinos, CCT CENPAT-CONICET, Puerto Madryn,Chubut, Argentina. 3FitzPatrick Institute of African Ornithology, DST-NRFCentre of Excellence, University of Cape Town, Rondebosch, Cape Town7701, South Africa.
Received: 4 March 2020 Accepted: 19 August 2020
References1. Steffen W, Sanderson A, Tyson P, Jäger J, Matson P, Moore B III, et al.
Executive summary - global change and the earth system: a planet underpressure. Glob Change Earth Syst. 2004;44.
Reusch et al. Movement Ecology (2020) 8:36 Page 10 of 12
2. McKinney ML, Lockwood JL. Biotic homogenization: a few winnersreplacing many losers in the next mass extinction. Trends Ecol Evol. 1999;14:450–3.
3. Thuiller W, Lavorel S, Araujo MB. Niche properties and geographical extentas predictors of species sensitivity to climate change. Glob Ecol Biogeogr.2005;14:347–57.
4. Clavel J, Julliard R, Devictor V. Worldwide decline of specialist species:toward a global functional homogenization? Front Ecol Environ. 2011;9:222–8.
5. Croxall JP, Butchart SHM, Lascelles B, Stattersfield AJ, Sullivan B, Symes A,et al. Seabird conservation status, threats and priority actions: a globalassessment. Bird Conserv Int. 2012;22:1–34.
6. Sydeman W, Thompson S, Kitaysky A. Seabirds and climate change:roadmap for the future. Mar Ecol Prog Ser. 2012;454:107–17.
7. BirdLife International. Speniscus demersus. IUCN Red List Threat Species.2018;.
8. BirdLife International. Morus Capensis. IUCN Red List Threat Species 2018;.9. BirdLife International. Phalacrocorax capensis. IUCN Red List Threat Species.
2018;.10. Blamey L, Shannon L, Bolton J, Crawford R, Dufois F, Evers-King H, et al.
Ecosystem change in the southern Benguela and the underlying processes.J Mar Syst. 2015;144:9–29.
11. Crawford RJM. Responses of african penguins to regime changes of sardineand anchovy in the Benguela system. Afr J Mar Sci. 1998;19:355–64.
12. Cotter R, Rail J-F, Boyne A, Robertson G, Weseloh D, Chaulk K. Populationstatus, distribution, and trends of gulls and kittiwakes breeding in easternCanada, 1998–2007. Can Wildl Serv. 2012;120:1–93.
13. Lisnizer N, Garcia-Borboroglu P, Yorio P. Spatial and temporal variation inpopulation trends of kelp gulls in northern Patagonia. Argentina Emu. 2011;111:259–67.
14. Neubauer G, Zagalska-Neubauer M, Gwiazda R, Faber M, Bukacinski D,Betleja J, et al. Breeding large gulls in Poland: distribution, numbers, trendsand hybridisation. Vogelwelt. 2006;127:11–22.
15. Furness R, Monaghan P. Seabird ecology. Glasgow and London: Blackie;1987.
16. Votier S, Furness R, Bearhop S, Crane J, Caldow R, Catry P, et al. Changes infisheries discard rates and seabird communities. Nature. 2004;427:727–30.
17. de Ponte Machado M. Is predation on seabirds a new foraging behaviourfor Great White Pelicans? History, foraging strategies and prey defensiveresponses. Final Rep BCLME Benguela Curr Mar Ecosyst Proj Top Predat BiolIndic Ecosyst Change BCLME. Cape Town: Avian Demography Unit; 2007. p.131–42.
18. Duhem C, Vidal E, Legrand J, Tatoni T. Opportunistic feeding responses ofthe yellow-legged Gull Larus michahellis to accessibility of refuse dumps.Bird Study. 2003;50:61–7.
19. Yoda K, Tomita N, Mizutani Y, Narita A, Niizuma Y. Spatio-temporalresponses of black-tailed gulls to natural and anthropogenic food resources.Mar Ecol Prog Ser. 2012;466:249–59.
20. Oro D, Genovart M, Tavecchia G, Fowler MS, Martínez-Abraín A. Ecologicaland evolutionary implications of food subsidies from humans. Ecol Lett.2013;16:1501–14.
21. Horton N, Brough T, Rochard JBA. The importance of refuse tips togulls wintering in an inland area of south-East England. J Appl Ecol.1983;20:751.
22. Weimerskirch H. Are seabirds foraging for unpredictable resources? DeepSea Res II. 2007;54:211–23.
23. Annett C, Pierotti R. Chick hatching as a trigger for dietary switching in theWestern Gull. Colon Waterbirds. 1989;12:4–11.
24. Smith GC, Carlile N. Food and feeding ecology of breeding silver gulls(Larus novaehollandiae) in urban Australia. Colon Waterbirds. 1993;16:9–16.
25. BirdLife International. Larus dominicanus. IUCN Red List Threat Species.2018;.
26. Yorio P, Branco JO, Lenzi J, Luna-Jorquera G, Zavalaga C. Distribution andtrends in kelp Gull (Larus dominicanus) coastal breeding populations inSouth America. Waterbirds. 2016;39:114–35.
27. Whittington PA, Crawford RJM, Martin AP, Randall RM, Brown M, Ryan PG,et al. Recent trends of the kelp Gull ( Larus dominicanus ) in South Africa.Waterbirds. 2016;39:99–113.
28. Whittington PA, Martin AP, Klages NTW. Status, distribution andconservation implications of the kelp Gull (Larus dominicanus vetula) withinthe eastern cape region of South Africa. Emu. 2006;106:127–39.
29. Yorio P, Caille G. Fish waste as an alternative resource for gulls along thePatagonian coast: availability, use, and potential consequences. Mar PollutBull. 2004;48:778–83.
30. Steele W. Diet of Hartlaub’s Gull Larus hartlaubii and the kelp Gull L.dominicanus in the southwestern Cape Province, South Africa. Ostrich. 1992;63:68–82.
31. Bertellotti M, Yorio P. Spatial and temporal patterns in the diet of the kelpGull in Patagonia. Condor. 1999;101:790–8.
32. Ludynia K, Garthe S, Luna-Jorquera G. Seasonal and regional variation in thediet of the kelp Gull in northern Chile. Waterbirds. 2005;28:359–65.
33. Silva-Costa A, Bugoni L. Feeding ecology of kelp gulls (Larus dominicanus) inmarine and limnetic environments. Aquat Ecol. 2013;47:211–24.
34. Hockey P, Dean W, Ryan P. Roberts - Birds of Southern Africa. 7th ed. CapeTown: The Trustees of the John Voelcker Bird Book Fund; 2005.
35. Crawford RJM, Nel DC, Williams AJ, Scott A. Seasonal patterns of abundanceof kelp gulls Larus dominicanus at breeding and non-breeding localities insouthern Africa. Ostrich. 1997;68:37–41.
36. Steele W, Hockey P. Population size, distribution and dispersal of kelp gullsin the southwestern cape, South Africa. Ostrich. 1990;61:97–106.
37. Duhem C, Roche P, Vidal E, Tatoni T. Effects of anthropogenic foodresources on yellow-legged gull colony size on Mediterranean islands. PopEcol. 2008;50:91–100.
38. Washburn BE, Elbin SB, Davis C. Historical and current population trends ofherring gulls (Larus argentatus) and great black-backed gulls (Larus marinus)in the New York bight, USA. Waterbirds. 2016;39:74–86.
39. Wilson R, Pütz K, Peters G, Culik B, Scolaro J, Charrassin J-B, et al. Long-termattachment of transmitting and recording devices to penguins and otherseabirds. Wildl Soc Bull. 1997;25:101–6.
40. Torlaschi C, Gandini P, Frere E, Peck RM. Predicting the sex of kelp gulls byexternal measurements. Waterbirds. 2000;23:518–20.
41. McConnell BJ, Chambers C, Fedak MA. Foraging ecology of southernelephant seals in relation to the bathymetry and productivity of theSouthern Ocean. Antarct Sci. 1992;4:393–8.
42. Shaffer SA, Cockerham S, Warzybok P, Bradley RW, Jahncke J, ClatterbuckCA, et al. Population-level plasticity in foraging behavior of western gulls(Larus occidentalis). Mov Ecol. 2017;5:27.
43. Calenge C. Analysis of Animal Movements in R: the adehabitatLT Package;2019. p. 85.
44. Garriga J, Palmer JRB, Oltra A, Bartumeus F. Expectation-Maximization BinaryClustering for Behavioural Annotation. Gursoy A, editor. PLoS One. 2016;11:e0151984.
45. R Core Team. R: A language and environment for statistical computing.Vienna, Austria. URL https://www.R-project.org/: R Foundation for StatisticalComputing; 2018.
46. Kuznetsova A, Brockhoff PB, Christensen RHB. lmerTest Package: Tests inLinear Mixed Effects Models. J Stat Softw. 2017;82:26.
47. Barton K. Package “MuMIn”; 2019.48. Hothorn T, Bretz F, Westfall P, Heiberger R, Schuetzenmeister A, Scheibe S.
Package “multcomp”; 2020. p. 1–36.49. Alzola C, Harrell F. An Introduction to S and the Hmisc and Design Libraries;
2006. p. 310.50. Hothorn T, Hornik K, Zeileis A. ctree: Conditional Inference Trees; 2006. p. 34.51. Jawaharlal V. Decisiontree using party package. 2014. Available from: https://
rpubs.com/njvijay/14899.52. Patenaude-Monette M, Bélisle M, Giroux J-F. Balancing energy budget in a
central-place forager: which habitat to select in a heterogeneousenvironment? Sears M, editor. PLoS One. 2014;9:e102162.
53. Kasinsky T, Suárez N, Marinao C, Yorio P. Kelp Gull (Larus dominicanus) useof alternative feeding habitats at the Bahía san Blas protected area,Argentina. Waterbirds. 2018;41:285–94.
54. Spelt A, Williamson C, Shamoun-Baranes J, Shepard E, Rock P, Windsor S.Habitat use of urban-nesting lesser black-backed gulls during the breedingseason. Sci Rep. 2019;9:10527.
55. Duhem C, Vidal E, Roche P, Legrand J. How is the diet of yellow-legged Gullchicks influenced by parents’ accessibility to landfills? Waterbirds. 2005;28:46–52.
56. van Donk S, Camphuysen KCJ, Shamoun-Baranes J, van der Meer J. Themost common diet results in low reproduction in a generalist seabird. EcolEvol. 2017;7:4620–9.
57. O’Hanlon N, McGill R, Nager R. Increased use of intertidal resources benefitsbreeding success in a generalist gull species. Mar Ecol Prog Ser. 2017;574:193–210.
Reusch et al. Movement Ecology (2020) 8:36 Page 11 of 12
58. Bukacinska M, Bukacinski D, Spaans A. Attendance and diet in relation tobreeding success in herring gulls (Larus argentatus). Auk. 1996;113:300–9.
59. van Donk S, Shamoun-Baranes J, van der Meer J, Camphuysen KCJ.Foraging for high caloric anthropogenic prey is energetically costly. MovEcol. 2019;7:1–12.
60. Pierotti R, Annett CA. Diet choice in the herring Gull: constraints imposedby reproductive and ecological factors. Ecology. 1991;72:319–28.
61. Monaghan P. Dominance and dispersal between feeding sites in theherring Gull (Larus argentatus). Anim Behav. 1980;28:521–7.
62. Isaksson N, Evans TJ, Shamoun-Baranes J, Åkesson S. Land or sea? Foragingarea choice during breeding by an omnivorous gull. Mov Ecol. 2016;4:11.
63. Vernon J. Feeding habitats and food of the black-headed and commongulls. Part 2 - food. Bird Study. 1972;19:173–86.
64. Coulson JC, Coulson BA. Lesser black-backed gulls Larus fuscus nesting in aninland urban colony: the importance of earthworms (Lumbricidae) in theirdiet. Bird Study. 2008;55:297–303.
65. Haarhoff P. Karoo harvester termite alates found in the stomach of a kelpGull Larus dominicanus. Cormorant. 1982;10:119.
66. Corman A-M, Mendel B, Voigt CC, Garthe S. Varying foraging patterns inresponse to competition? A multicolony approach in a generalist seabird.Ecol Evol. 2016;6:974–86.
67. Caron-Beaudoin É, Gentes M-L, Patenaude-Monette M, Hélie J-F, Giroux J-F,Verreault J. Combined usage of stable isotopes and GPS-based telemetry tounderstand the feeding ecology of an omnivorous bird, the ring-billed Gull(Larus delawarensis). Can J Zool. 2013;91:689–97.
68. Pichegru L. Crude estimation of Kelp Gull predation on Cape Gannetsbreeding on Malgas Island. Dep Environ Aff Tech Rep. 2019. p. 8.
69. García GO, Favero M, Vassallo AI. Factors affecting Kleptoparasitism by gullsin a multi-species seabird Colony. Condor. 2010;112:521–9.
Publisher’s NoteSpringer Nature remains neutral with regard to jurisdictional claims inpublished maps and institutional affiliations.
Reusch et al. Movement Ecology (2020) 8:36 Page 12 of 12