Foraging for fruits: natural resource use and its conservation ...
MARINE ECOLOGY PROGRESS SERIESMar Ecol Prog Ser
Vol. 343: 295–306, 2007doi: 10.3354/meps06954
Published August 7
INTRODUCTION
Foraging in seabirds often occurs over wideranges, which is a consequence of the variablemarine environment. The pelagic food chain reliesmainly on the presence of nutrients in the upperlayer of the water column that fuel primary produc-tion (Nybakken & Bertness 2005). The distribution ofnutrients and, hence, phytoplankton and zooplanktonat sea depends mainly on oceanographic parameterssuch as currents, temperature and mixing (Miller2004). The result is a patchy distribution of produc-tivity and, ultimately, seabird prey. In response to
this, seabirds often need to travel long distances inorder to find food.
Penguins are well adapted for a pelagic life anddespite their flightlessness are able to cover distancesof several hundred km on single foraging trips (Wilson1995). Although penguins are often described as‘pelagic foragers’ (e.g. Williams 1995), some specieshave adopted an inshore foraging strategy whereoceanographic conditions support such a lifestyle(Croxall & Davis 1999). Nevertheless, as consumers ofresources that primarily occur in the upper layers ofthe water column, even inshore foraging penguinsmust deal with the variability of the marine environ-
© Inter-Research 2007 · www.int-res.com*Email: [email protected]
Consistent foraging routes and benthic foragingbehaviour in yellow-eyed penguins
Thomas Mattern1,*, Ursula Ellenberg1, David M. Houston2, Lloyd S. Davis1
1Department of Zoology, University of Otago, PO Box 56, Dunedin, New Zealand2Department of Conservation, Coastal Otago Area Office, PO Box 5244, Dunedin, New Zealand
ABSTRACT: Yellow-eyed penguins Megadyptes antipodes seemingly forage at discrete marine loca-tions over the continental shelf, where they are believed to feed predominantly at the seafloor. Suchbehaviour would distinguish them from most other penguin species that generally employ pelagicforaging strategies. From 2003 to 2005 we studied the foraging behaviour of yellow-eyed penguinsbreeding near Oamaru, New Zealand. We used 2 types of data loggers: GPS loggers recorded geo-graphical position and dive depth at set intervals, while time-depth recorders (TDRs) recorded onlydive depth. The penguins performed day trips (range: 12 to 20 km from the coast) or shorter eveningtrips (range: <7 km). Consecutive foraging trips of individuals revealed remarkably consistent forag-ing routes. Birds travelled along similar — at times congruent — paths, markedly changed course atdistinct locations, and revisited certain locations on separate trips, indicating skilful navigation.Three trip stages could be distinguished on one-day trips. During the outgoing (seaward travelling)and incoming (shoreward travelling) stages the birds followed linear courses. These stages were sep-arated by a period of midday activity in which birds exhibited higher dive effort and often tended tostay within confined areas. The diving behaviour revealed an exclusive bottom-foraging strategy,with 87% of all dives being benthic dives; the majority of non-benthic dives occurred during the last2 to 3 h of the trip, indicating primarily travelling behaviour. Furthermore, yellow-eyed penguinsemploy benthic dives not only when feeding but also frequently when travelling. We suggest thatbenthic dives might facilitate navigation and, consequently, account for the consistent foragingpatterns of yellow-eyed penguins.
KEY WORDS: Megadyptes antipodes · Yellow-eyed penguin · Foraging range · Diving behaviour ·Benthic dive · Navigation
Resale or republication not permitted without written consent of the publisher
Mar Ecol Prog Ser 343: 295–306, 2007
ment. As such, they must be able to adjust their forag-ing behaviour in case of unfavourable prey situations,for example, by extending their foraging ranges orincreasing their diving effort (Mattern 2001).
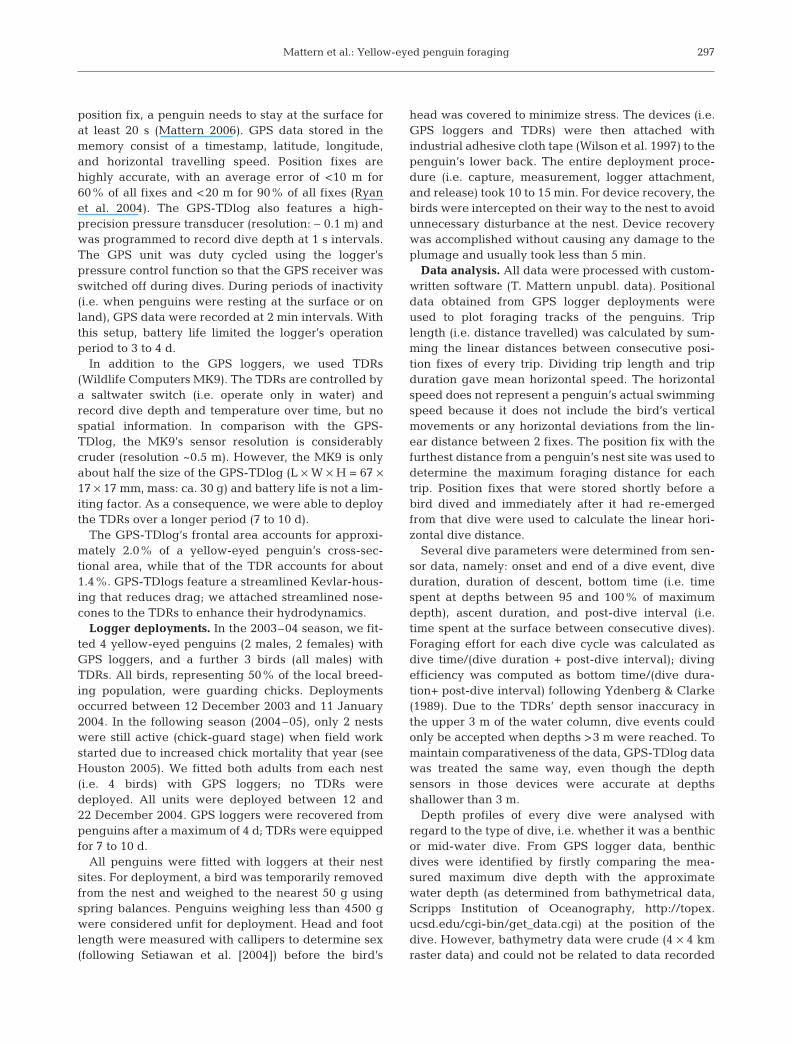
The yellow-eyed penguin Megadyptes antipodes isendemic to New Zealand and breeds along the South Is-land’s southeastern coastlines, on Stewart Island and onthe subantarctic Auckland and Campbell Islands (seeFig. 1). On the mainland, penguins benefit from oceanicproductivity that allows them to stay close to their breed-ing areas throughout the year (Darby & Seddon 1990).When breeding, the penguins are rarely at sea for longerthan 2 d, and after chicks have hatched, the birds leavetheir nests for only 10 to 15 h at a time (Edge 1996). Ac-cordingly, a telemetry study found that on average yel-low-eyed penguins foraged within a 16 km radius fromtheir breeding sites (Moore et al. 1995, Moore 1999).
Interestingly, Moore (1999) also reported that thepenguins apparently retained similar foraging patternson different trips — and seemed to concentrate theirforaging to distinct individual centres of activity. How-ever, these individual patterns were only brieflyreported and not discussed. Yet the consistency ofthese patterns (as deducible from data presented byMoore et al. 1995) and the apparently well-definedcentres of activity in some birds (see Moore’s Figs. 8 &9 in Moore 1999) warrants a more detailed considera-tion of individual behaviour in an ecological context. Inretrospect, Moore’s (1999) data suggests a target-ori-ented foraging strategy in yellow-eyed penguins thatlacks the variability of at-sea movements commonlyobserved in penguins that find their prey in a pelagicenvironment (Wilson 1995).
Yellow-eyed penguins primarily feed on benthic fishspecies (van Heezik 1990a,b, Moore & Wakelin 1997).In comparison with pelagic prey, the distribution ofbenthic species is less influenced by hydrodynamicprocesses (e.g. currents) and more related to seafloorsubstrates and other bottom features such as reefs(Mutch 1983). A feeding strategy that primarily targetsbenthic species would thus depend mainly on the localbenthic environment rather than on oceanographicparameters that usually dictate foraging behaviour inpenguins (e.g. Hull 1997, Tremblay & Cherel 2003).
In order to examine whether benthic foraging mightfacilitate consistent movement patterns, we studied theyellow-eyed penguins’ foraging behaviour with GPSdive loggers and time-depth recorders (TDRs). Ouraims were to (1) examine in detail at-sea movementsand dive behaviour of individual penguins, (2) deter-mine the degree of consistency of foraging trackswithin and among individuals, and (3) analyse theobserved foraging and diving patterns with regard tothe marine areas visited by the penguins, with anemphasis on local seafloor features.
MATERIALS AND METHODS
Study site. Field work was completed in 2 consecu-tive seasons, 2003–04 and 2004–05, at the BushyBeach Scenic Reserve, Oamaru, New Zealand (Fig. 1).Here, yellow-eyed penguins breed under dense vege-tation on the slope bordering the beach. Bushy Beachrepresents one of the smaller yellow-eyed penguincolonies on the mainland (1995 to 2004 average: 7nests; D. Houston unpubl. data) and was chosen forthis study primarily because of its accessibility and theavailability of observers to monitor the nests. All pen-guins at Bushy Beach are banded and nests are moni-tored regularly during the breeding season.
GPS loggers and dive recorders. We used GPS-diveloggers (GPS-TDlog, earth & OCEAN Technology) thatuse satellites of the Global Positioning System(www.gps.gov) to record the penguins’ at-sea move-ments and dive behaviour. The GPS-TDlog (L × W × H= 100 × 48 × 24 mm, mass: ca. 70 g) contains a GPSreceiving unit that determines its geographical posi-tion through an array of global positioning satellites.The interval of position fix acquisition is freely pro-grammable, but reception of GPS signals is inhibitedwhen the device is submerged and is thus only avail-able when the penguin is at the surface (i.e. betweendives). For the GPS unit to successfully determine a
296
Auckland Is.
The Snares
Campbell Is.
Stewart Island
Otago Peninsula
Catlins
NewZealand
Bushy Beach
Oamaru
15 km
44°S
46°
48°
50°
52°
165°E 170° 175°
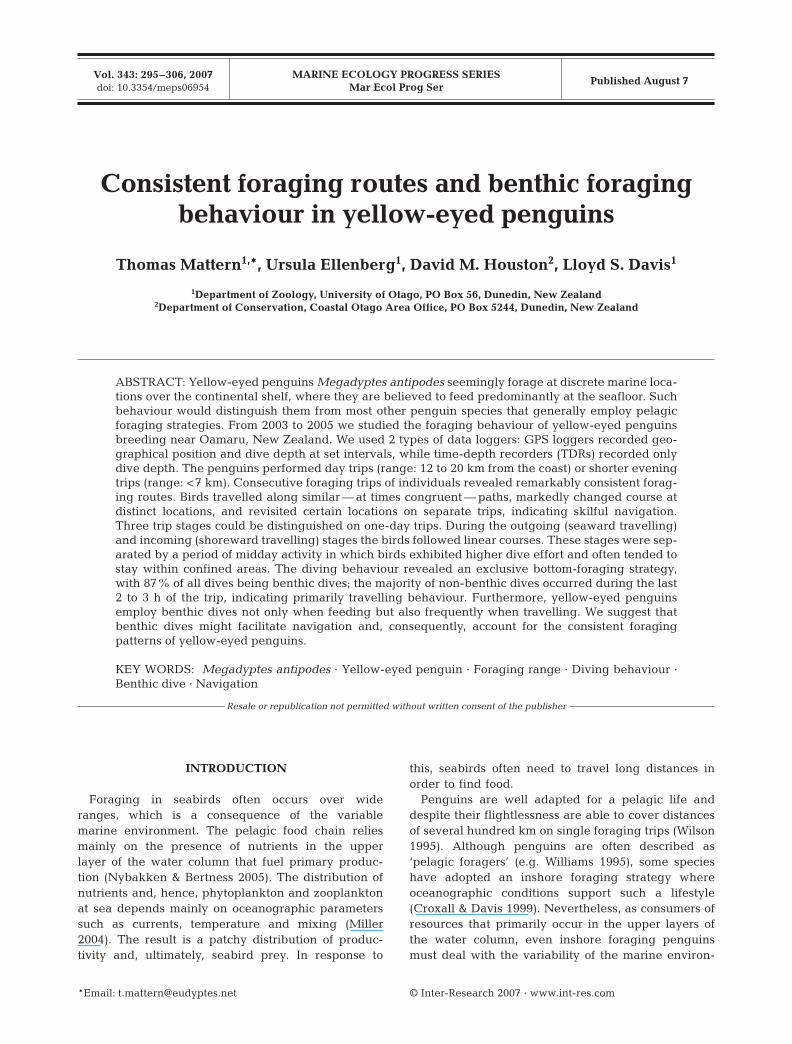
Fig. 1. Megadyptes antipodes. Breeding range of yellow-eyedpenguins. Main breeding areas are dark grey. Arrows indi-cate mainland sites with highest nest densities, Otago Penin-sula and Catlins, are indicated by arrows. Main figure: solidlines indicate 100 m depth contour; dashed lines indicate500 m contour. Inset: overview of the study site, Bushy Beach,
Oamaru. Here, depth contours given as 10 m isolines
Mattern et al.: Yellow-eyed penguin foraging
position fix, a penguin needs to stay at the surface forat least 20 s (Mattern 2006). GPS data stored in thememory consist of a timestamp, latitude, longitude,and horizontal travelling speed. Position fixes arehighly accurate, with an average error of <10 m for60% of all fixes and <20 m for 90% of all fixes (Ryanet al. 2004). The GPS-TDlog also features a high-precision pressure transducer (resolution: ∼ 0.1 m) andwas programmed to record dive depth at 1 s intervals.The GPS unit was duty cycled using the logger’spressure control function so that the GPS receiver wasswitched off during dives. During periods of inactivity(i.e. when penguins were resting at the surface or onland), GPS data were recorded at 2 min intervals. Withthis setup, battery life limited the logger’s operationperiod to 3 to 4 d.
In addition to the GPS loggers, we used TDRs(Wildlife Computers MK9). The TDRs are controlled bya saltwater switch (i.e. operate only in water) andrecord dive depth and temperature over time, but nospatial information. In comparison with the GPS-TDlog, the MK9’s sensor resolution is considerablycruder (resolution ~0.5 m). However, the MK9 is onlyabout half the size of the GPS-TDlog (L × W × H = 67 ×17 × 17 mm, mass: ca. 30 g) and battery life is not a lim-iting factor. As a consequence, we were able to deploythe TDRs over a longer period (7 to 10 d).
The GPS-TDlog’s frontal area accounts for approxi-mately 2.0% of a yellow-eyed penguin’s cross-sec-tional area, while that of the TDR accounts for about1.4%. GPS-TDlogs feature a streamlined Kevlar-hous-ing that reduces drag; we attached streamlined nose-cones to the TDRs to enhance their hydrodynamics.
Logger deployments. In the 2003–04 season, we fit-ted 4 yellow-eyed penguins (2 males, 2 females) withGPS loggers, and a further 3 birds (all males) withTDRs. All birds, representing 50% of the local breed-ing population, were guarding chicks. Deploymentsoccurred between 12 December 2003 and 11 January2004. In the following season (2004–05), only 2 nestswere still active (chick-guard stage) when field workstarted due to increased chick mortality that year (seeHouston 2005). We fitted both adults from each nest(i.e. 4 birds) with GPS loggers; no TDRs weredeployed. All units were deployed between 12 and22 December 2004. GPS loggers were recovered frompenguins after a maximum of 4 d; TDRs were equippedfor 7 to 10 d.
All penguins were fitted with loggers at their nestsites. For deployment, a bird was temporarily removedfrom the nest and weighed to the nearest 50 g usingspring balances. Penguins weighing less than 4500 gwere considered unfit for deployment. Head and footlength were measured with callipers to determine sex(following Setiawan et al. [2004]) before the bird’s
head was covered to minimize stress. The devices (i.e.GPS loggers and TDRs) were then attached withindustrial adhesive cloth tape (Wilson et al. 1997) to thepenguin’s lower back. The entire deployment proce-dure (i.e. capture, measurement, logger attachment,and release) took 10 to 15 min. For device recovery, thebirds were intercepted on their way to the nest to avoidunnecessary disturbance at the nest. Device recoverywas accomplished without causing any damage to theplumage and usually took less than 5 min.
Data analysis. All data were processed with custom-written software (T. Mattern unpubl. data). Positionaldata obtained from GPS logger deployments wereused to plot foraging tracks of the penguins. Triplength (i.e. distance travelled) was calculated by sum-ming the linear distances between consecutive posi-tion fixes of every trip. Dividing trip length and tripduration gave mean horizontal speed. The horizontalspeed does not represent a penguin’s actual swimmingspeed because it does not include the bird’s verticalmovements or any horizontal deviations from the lin-ear distance between 2 fixes. The position fix with thefurthest distance from a penguin’s nest site was used todetermine the maximum foraging distance for eachtrip. Position fixes that were stored shortly before abird dived and immediately after it had re-emergedfrom that dive were used to calculate the linear hori-zontal dive distance.
Several dive parameters were determined from sen-sor data, namely: onset and end of a dive event, diveduration, duration of descent, bottom time (i.e. timespent at depths between 95 and 100% of maximumdepth), ascent duration, and post-dive interval (i.e.time spent at the surface between consecutive dives).Foraging effort for each dive cycle was calculated asdive time/(dive duration + post-dive interval); divingefficiency was computed as bottom time/(dive dura-tion+ post-dive interval) following Ydenberg & Clarke(1989). Due to the TDRs’ depth sensor inaccuracy inthe upper 3 m of the water column, dive events couldonly be accepted when depths >3 m were reached. Tomaintain comparativeness of the data, GPS-TDlog datawas treated the same way, even though the depthsensors in those devices were accurate at depthsshallower than 3 m.
Depth profiles of every dive were analysed withregard to the type of dive, i.e. whether it was a benthicor mid-water dive. From GPS logger data, benthicdives were identified by firstly comparing the mea-sured maximum dive depth with the approximatewater depth (as determined from bathymetrical data,Scripps Institution of Oceanography, http://topex.ucsd.edu/cgi-bin/get_data.cgi) at the position of thedive. However, bathymetry data were crude (4 × 4 kmraster data) and could not be related to data recorded
297
Mar Ecol Prog Ser 343: 295–306, 2007
by TDRs. The second criterion for benthic dives, whichapplied to data from both device types, was a trapezoidshape of the dive profile (i.e. steady descent, horizontalbottom phase with little vertical undulation, steadyascent; see Tremblay & Cherel 2000) as well as con-stant maximum dive depths during a series of dives.
Separate foraging trips were identified from GPSdata or from TDR sensor readings. Exact foraging tripduration was determined by calculating the time dif-ference between the onset of the first dive and theend of the last dive of every trip. By projecting diveprofiles vertically along foraging tracks, we gener-ated pseudo-3D plots that provided spatiotemporalillustrations of the penguins’ dive activity. Althoughthese illustrations do not give true 3D representationsof the penguins’ dive paths (i.e. no horizontal move-ments were registered during dives), pseudo-3D plotsnevertheless facilitated the analysis of foraging be-haviour with regard to environmental features ofthe visited sea area (e.g. bathymetry, benthic commu-nities).
RESULTS
Data outcome and quality
Table 1 gives an overview of the outcome of logger de-ployments on yellow-eyed penguins in both seasons. Inthe 2003–04 breeding season, the 4 GPS logger deploy-ments (2 females, 2 males) at Bushy Beach resulted inGPS data for a total of 7 foraging trips. Complete sets ofdive data were obtained for 6 of these trips. The 3 TDRdeployments on 3 males yielded dive data for the entiredeployment periods and encompassed a total of 17 for-aging trips: 2 birds each made 5 foraging trips and 1 birdmade 7 trips. In the following season, 2004-05, 4 deploy-ments of GPS loggers on 4 adults from 2 nests resulted inGPS and dive data for 5 complete foraging trips.
In both years, GPS loggers recorded between 69 and235 position fixes during single foraging trips (mean:168 ± 60 fixes, n = 11 trips, Table 1). Penguins fittedwith GPS loggers performed between 95 and 297 divesper trip (mean: 206 ± 99 dives). The median time inter-
298
2003–04 2004–05Evening One-day t8 p One-day
General parametersNo. of birds 5 5 4Total no. of trips 13 11 5Mean trip duration (h) 4.0 ± 0.9 11.5 ± 2.6 6.15 <0.01 12.9 ± 1.2
Foraging parameters (only GPS)No. of birds 2 2 4No. of trips 3 3 5Max. range (km) 6.2 ± 0.8 17.5 ± 2.5 – – 18.2 ± 1.1Distance travelled (km) 15.9 ± 1.2 47.5 ± 1.8 – – 46.0 ± 3.0Horizontal speed (km h–1) 4.9 ± 0.7 3.5 ± 0.3 – – 3.7 ± 0.2Dive distance (m) 161.1 ± 18.3 166.6 ± 4.9 – – 162.9 ± 37.9
Diving parameters (all birds)Dives per trip 108 ± 15 246 ±39 7.26 <0.01 286 ± 66% benthic dives 71.6 ± 6.7 86.6 ± 6.7 0.28 0.79 91.5 ± 2.1Dive frequency (dives h–1) 27.2 ± 2.5 21.6 ± 1.8 –4.11 <0.01 22.2 ± 3.2
Dive duration(s) 85.7 ± 5.8 115.4 ± 9.7 6.37 <0.01 112.6 ± 13.5Bottom time (s) 47.1 ± 2.9 66.6 ± 8.7 4.75 <0.01 68.1 ± 9.8Post-dive interval (s) 45.1 ± 7.7 52.1 ± 9.9 1.42 0.19 51.2 ± 10.3
Mean depth (m) 15.8 ± 1.5 25.2 ± 1.7 9.61 <0.01 24.5 ± 2.7Max. depth (m) 28.1 ± 6.3 41.1 ± 2.9 9.55 <0.01 38.4 ± 8.2
Descent rate (m s–1) 0.9 ± 0.1 1.1 ± 0.1 6.15 <0.01 1.1 ± 0.1Ascent rate (m s–1) 0.8 ± 0.1 0.7 ± 0.1 1.77 0.121 0.9 ± 0.1
Foraging effort 0.76 ± 0.03 0.69 ± 0.05 –2.77 0.032 0.68 ± 0.02Diving efficiency 0.42 ± 0.01 0.40 ± 0.04 –1.16 0.311 0.42 ± 0.02
Table 1. Megadyptes antipodes. Foraging and diving behaviour of yellow-eyed penguins equipped with GPS loggers and TDRsat Bushy Beach in the breeding seasons of 2003–04 and 2004–05. All foraging and diving parameters given as means ±SD,derived from individual means if birds performed >1 foraging trip during logger deployment. Max. depth represents the meanthat derives from the single deepest dives recorded for each bird. Differences in dive parameters determined for short-term andone-day trips in 2003–04 were statistically compared using Student’s t-test. Similar comparisons were also conducted for one-day
trip data recorded in both seasons, but differences proved non-significant and are thus not shown
Mattern et al.: Yellow-eyed penguin foraging
val between consecutive position fixes averaged 2.7 ±0.2 min, which corresponds well with the duration of adive cycle (i.e. dive time + post-dive interval; meanduration: 2.5 ± 0.4 min, see Table 1). This suggests thatfixes were recorded after every dive. However, thiswas only true for the first part of most penguins’ forag-ing trips. In some cases, position fixes became moreinfrequent when the birds travelled back towards thecoast and spent little time at the surface (Table 2). As aresult, consecutive fixes were sometimes recorded upto 3 h apart. Consequently, the shoreward portion ofsome foraging tracks could only be linearly extrapo-lated from position fixes stored before and after travel-ling episodes. However, considering the high horizon-tal swimming speeds determined during shorewardtravel (Table 2), it seems likely that the penguins didnot deviate far from a straight-line course so that thelinear extrapolation was deemed an acceptableapproximation to the penguins’ true travel paths.
Trip duration and foraging ranges
In 2003–04, 2 general types of foraging trips wereapparent in all penguins regardless of whether GPS orTDRs were deployed: one-day trips and evening trips(Table 1). During one-day trips, the birds left theirnests in the morning (generally between 05:00 h and07:00 h) and returned in the evening of the same dayafter an average 11.5 ± 2.6 h (range: 9.1 to 15.5 h). One
overnight trip was observed (22.4 h). On evening trips,the penguins left in the afternoon or early evening(between 15:00 h and 18:00 h) and foraged for a mean4.0 ± 0.9 h (range: 3.1 to 5.0 h) before returning to theirnests shortly before nightfall. Evening trips were onlyobserved in 5 males fitted with GPS (2 birds) and TDRs(3 birds). In the 2004–05 season, only one-day tripswere recorded (mean duration: 12.9 ± 1.2 h, range:11.5 to 14.2 h); however, evening trips could haveoccurred outside of the deployment period. There waslittle variation in the trip duration of one-day trips ineither season (Table 1).
A comparison of GPS data from male (n = 2) andfemale (n = 4) penguins performing 1 d trips in bothseasons revealed no sex-related differences. However,foraging parameters varied greatly with trip type. Onevening trips, penguins foraged 6.2 ± 0.8 km awayfrom the coast and covered average distances of 15.9 ±1.2 km while swimming at an average horizontal speedof 4.9 ± 0.7 km h–1. This was considerably faster thanthe 3.5 and 3.7 km h–1 we determined for penguins onone-day trips in 2003–04 and 2004–05, respectively(see Table 1).
Patterns of at-sea movements
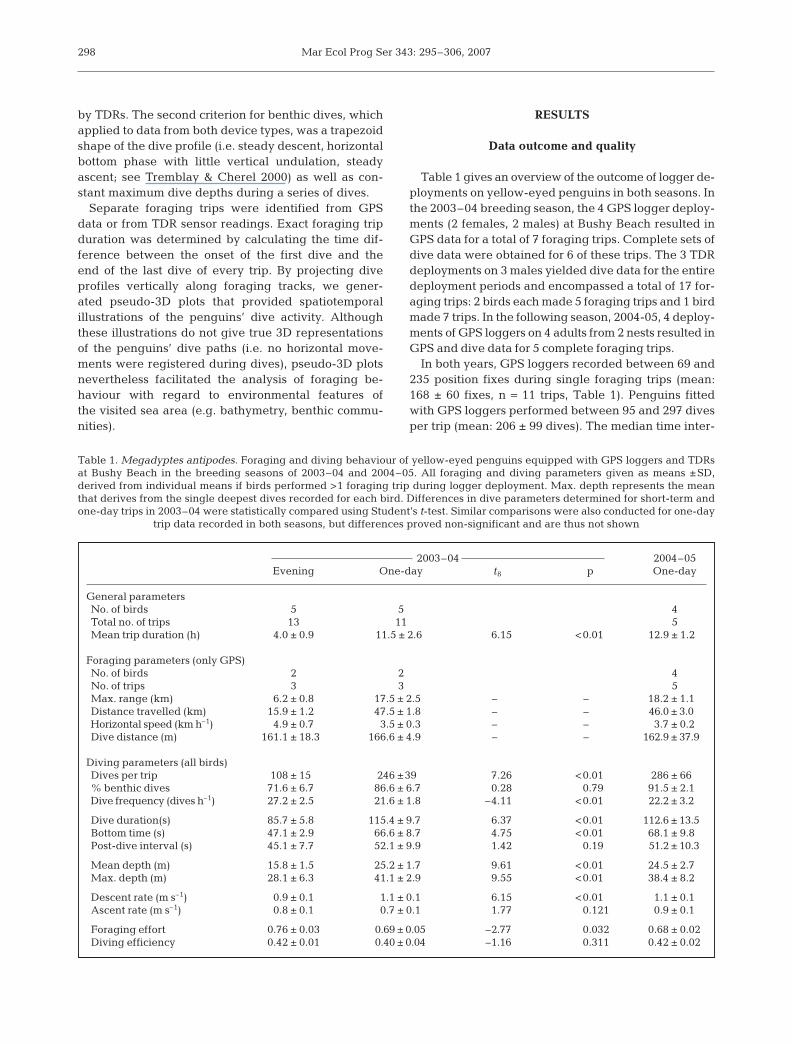
The foraging tracks that were reconstructed fromGPS data showed that one-day foraging trips cangenerally be broken down into 3 stages: (1) the outgo-
ing travelling stage during which thebirds maintain a directional courseaway from the coast, (2) the middayactivity period, which was marked byfrequent course changes, and (3) theincoming travelling stage, duringwhich the birds again assumed a direc-tional course back towards theircolony (Fig. 2). In some instances, themidday activity period was spent inwell-defined areas before the birdstravelled back towards the land. Forfurther analysis, we divided data fromGPS loggers according to trip stage.For this we defined the end of the out-going stage as the time and position af-ter which a penguin changed its travelbearing at least 3 times by more than45° within a 15 min interval; similarly,the onset of the incoming stage wasdefined as the position and time afterwhich course changes of >45° eitherdid not occur or were isolated occur-rences that did not affect the linearityof the penguins’ travelling trajectory.
299
Foraging trip stage ANOVAOutgoing Midday Incoming F2,12 p
Distance travelled (km) 17.6 ± 3.4 12.3 ± 7.6 15.9 ± 3.2 1.36 0.29Duration (h) 4.7 ± 1.2 4.7 ± 2.5 3.3 ± 0.7 1.25 0.32Horizontal speed (km h–1) 3.8 ± 0.4 2.5 ± 0.7 4.9 ± 0.3 32.71 <0.01
Dive distance (m) 191.8 ± 25.3 141.5 ± 28.4 172.3 ± 34.0 3.80 0.06Dives per stage 84 ± 23 128 ± 48 79 ± 69 2.58 0.11% benthic dives 91.4 ± 4.2 96.8 ± 2.7 73.9 ± 20.6 5.71 0.01Dive frequency (dives h–1) 18.6 ± 3.1 21.4 ± 3.3 30.1 ± 5.5 10.65 <0.01
Dive duration (s) 124.7 ± 9.9 117.2 ± 14.9 91.8 ± 19.2 6.45 0.01Bottom time (s) 81.8 ± 13.9 99.4 ± 58.1 69.1 ± 20.1 0.87 0.44Post-dive interval (s) 76.7 ± 25.9 53.4 ± 13.9 31.4 ± 7.3 8.38 <0.01Mean depth (m) 22.3 ± 3.2 35.2 ± 9.0 18.6 ± 4.8 10.87 <0.01Descent rate (m s–1) 0.9 ± 0.1 1.4 ± 0.2 0.8 ± 0.2 14.35 <0.01Ascent rate (m s–1) 0.8 ± 0.1 1.2 ± 0.2 0.6 ± 0.2 19.14 <0.01Foraging effort 0.64 ± 0.06 0.69 ± 0.03 0.74 ± 0.06 5.47 0.02Diving efficiency 0.33 ± 0.15 0.42 ± 0.06 0.30 ± 0.15 1.19 0.34
Table 2. Megadyptes antipodes. Foraging and diving behaviour of yellow-eyedpenguins fitted with GPS loggers during different stages of one-day foragingtrips recorded in 2003–04 (3 trips, 2 birds) and 2004–05 (5 trips, 4 birds). Tripstages are defined as seaward movement (outgoing), activity at foraging desti-nation (midday), and shoreward movement (incoming). Statistical comparison
was performed using 1-way ANOVA
Mar Ecol Prog Ser 343: 295–306, 2007
The mean duration of the stages was similar foroutgoing and midday but significantly shorter forthe incoming stage (Table 2). During the midday stage,the penguins covered the shortest distances and exhib-ited the lowest travelling speeds. During the 2 travel-ling stages we found no differences in the distancescovered (outgoing: 17.5 ± 3.4 km; incoming: 15.9 ±3.2 km; t-test; t8 = –0.8, p = 0.45), but travel speedswere significantly higher when the penguins returnedto the colony (outgoing: 3.8 ± 0.4 km h–1; incoming:4.9 ± 0.3 km h–1; t8 = 5.18, p < 0.01), suggesting muchmore travel-oriented behaviour.
Penguins with GPS loggers that performed morethan 1 trip during the deployment foraged along simi-lar routes during the different trips and tended to visit
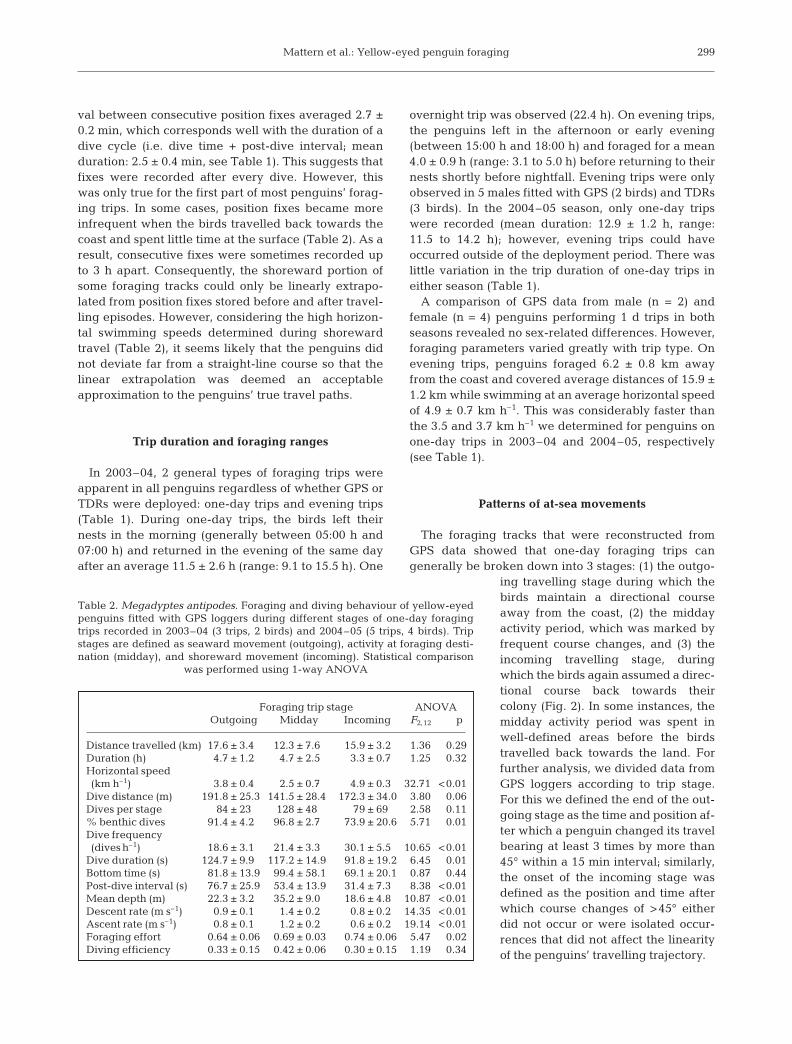
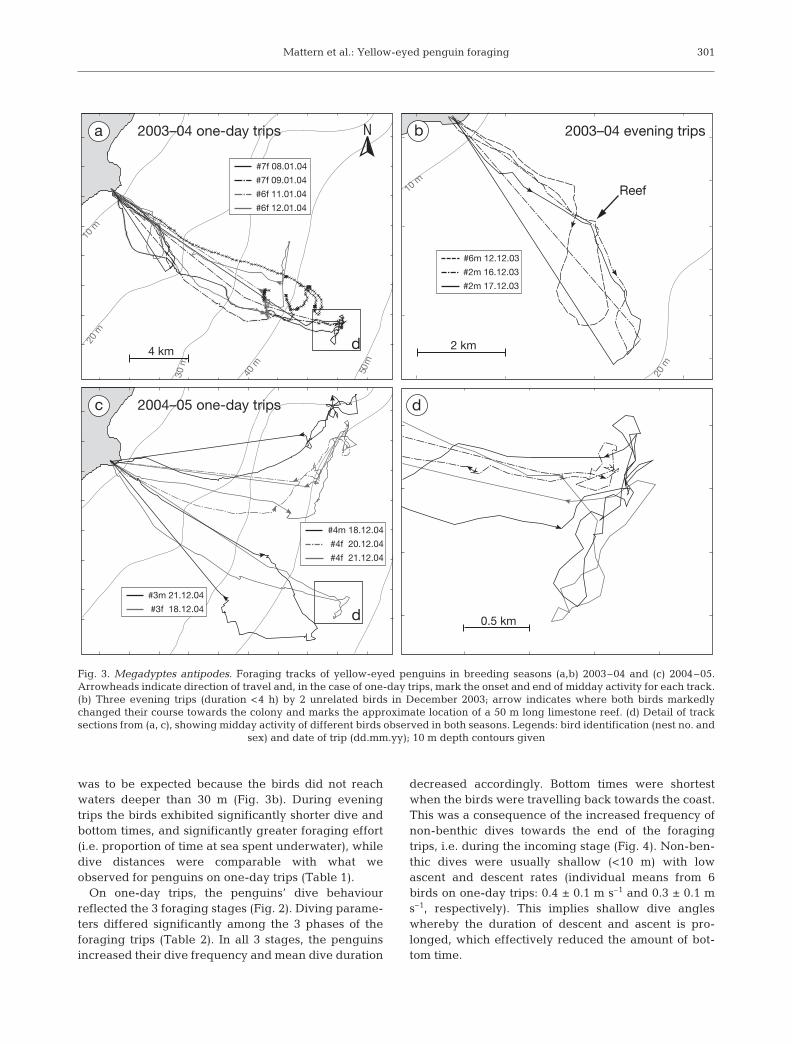
the same areas during their midday activ-ity. Further, similarities in foraging pat-terns were apparent among different birdsand between the seasons (Fig. 3). Birdsfrom a pair foraged in the same generalareas (Fig. 3c). Some tracks revealedremarkable consistencies both within indi-viduals and among different birds. Forexample, on 2 consecutive one-day trips in2003, 1 female (Fig. 3a,d, black solid anddash-dotted lines) travelled along a similarroute and concentrated its midday activityin a small area approximately 20 km off-shore. Strikingly, another almost identicalforaging track to the same area was deter-mined in 2004 for an unrelated male(Fig. 3c,d, grey solid line).
Other remarkable similarities wereapparent in the tracks of the 3 eveningtrips that were recorded with GPS log-gers in 2003-04 (Fig. 3b). In this instance,1 male (solid and dash-dotted lines) per-formed 2 evening trips on consecutivedays. The penguin followed the sameroute on both days when travelling backtowards the coast, with parts of thetracks being virtually congruent withanother, which suggests a high degree ofnavigational specificity. At a distinct loca-tion some 4 km offshore, the penguinmarkedly changed its course towards itsbreeding colony. A similar course changeat the same location was also observedfor another male on an evening trip 1 wkearlier (Fig. 3b, dashed line). During aseafloor survey with scuba gear, wefound that the location of the coursechanges coincides with the existence ofa small (2 × 50 m) limestone reef protrud-ing ∼ 0.5 m from the otherwise featureless
sand bottom, and it seems likely that this featurerepresented a navigational cue for both birds.
Diving behaviour
Means of basic dive parameters revealed no signifi-cant differences when tested in terms of sex or devicetype. Accordingly, individual means of dive parame-ters determined for the respective seasons were pooledwith regard to trip type. Dive parameters of birds onevening trips differed from birds performing one-daytrips. Overall, the dive frequency on evening trips wassignificantly higher than that observed during one-daytrips (Table 1). The maximum depth was less, which
300
16:45 16:55
c
c
c
12:35 12:45
b
b
b
06:45 06:55
0
10
20
30
40
50
Dep
th (m
)
a
a
a
0
10
20
30
40
50
06:00 09:00 12:00 15:00 18:0007:00 08:00 10:00 11:00 13:00 14:00 16:00 17:00
Dep
th (m
)
Time of day (h)
Time of day (h)
Outgoing Incoming
N
10 m
20 m30 m 40 m 50 m
Outgoing
Incoming
4 km
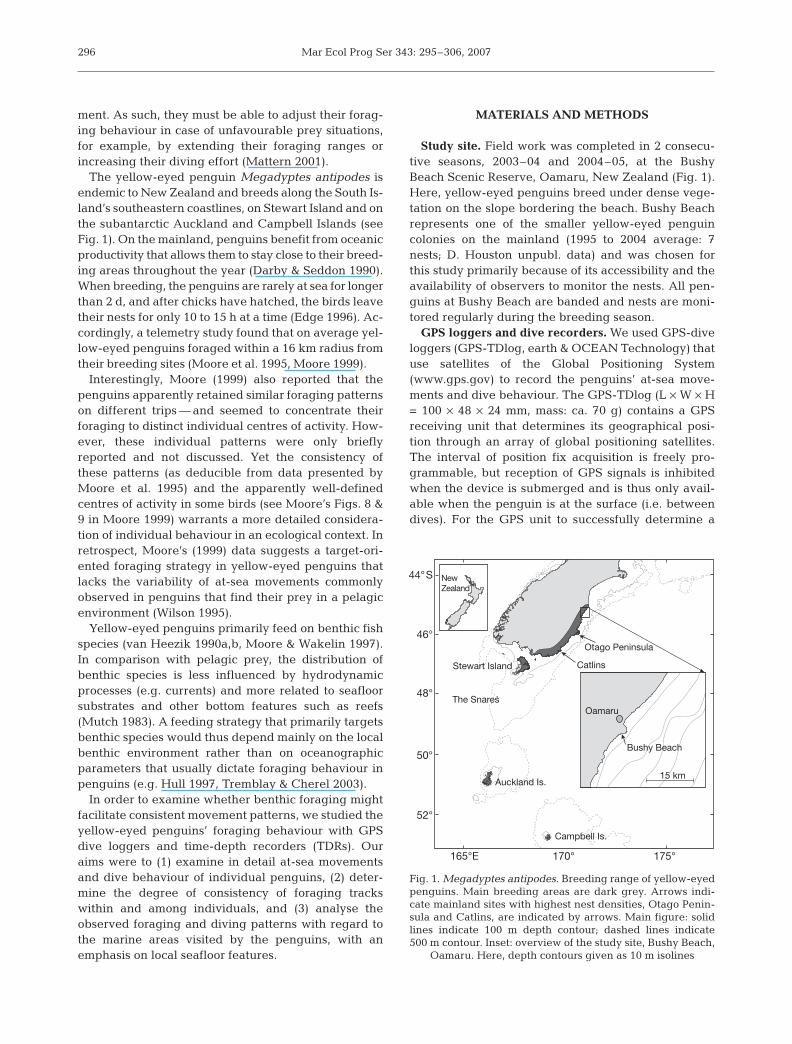
Fig. 2. Megadyptes antipodes. Structure of a yellow-eyed penguin’s one-day foraging trip (Bird # 3m, trip date 21 December 2004, cf. Fig. 3c). Top:pseudo-3D illustration of the foraging trip. Middle: corresponding dive pro-file; the majority of dives represent benthic dives so that the overall divepattern reflects the seafloor’s depth profile. Black bars labelled (a–c) along-side the track in the top graph and above the middle graph indicate sectionsof the dive profile. Bottom: 22 min sections of diving activity during (a) out-going stage, (b) midday activity and (c) incoming stage. Note differences in
dive duration at similar depths between (a) and (c)
Mattern et al.: Yellow-eyed penguin foraging
was to be expected because the birds did not reachwaters deeper than 30 m (Fig. 3b). During eveningtrips the birds exhibited significantly shorter dive andbottom times, and significantly greater foraging effort(i.e. proportion of time at sea spent underwater), whiledive distances were comparable with what weobserved for penguins on one-day trips (Table 1).
On one-day trips, the penguins’ dive behaviourreflected the 3 foraging stages (Fig. 2). Diving parame-ters differed significantly among the 3 phases of theforaging trips (Table 2). In all 3 stages, the penguinsincreased their dive frequency and mean dive duration
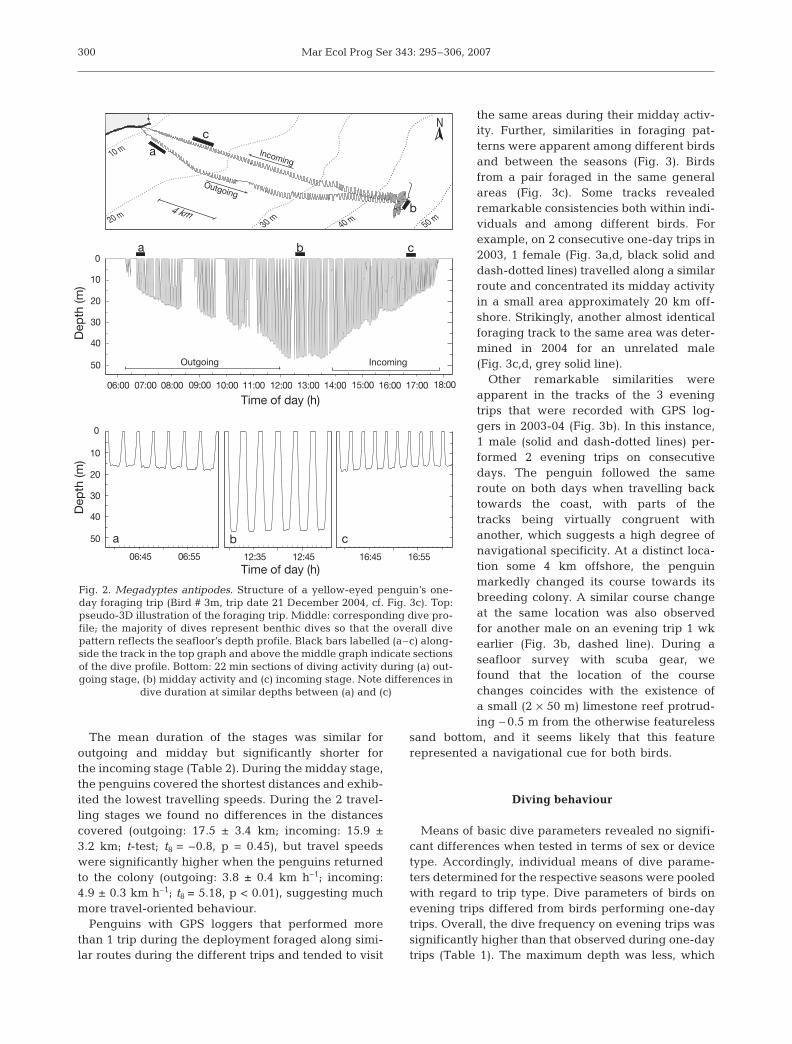
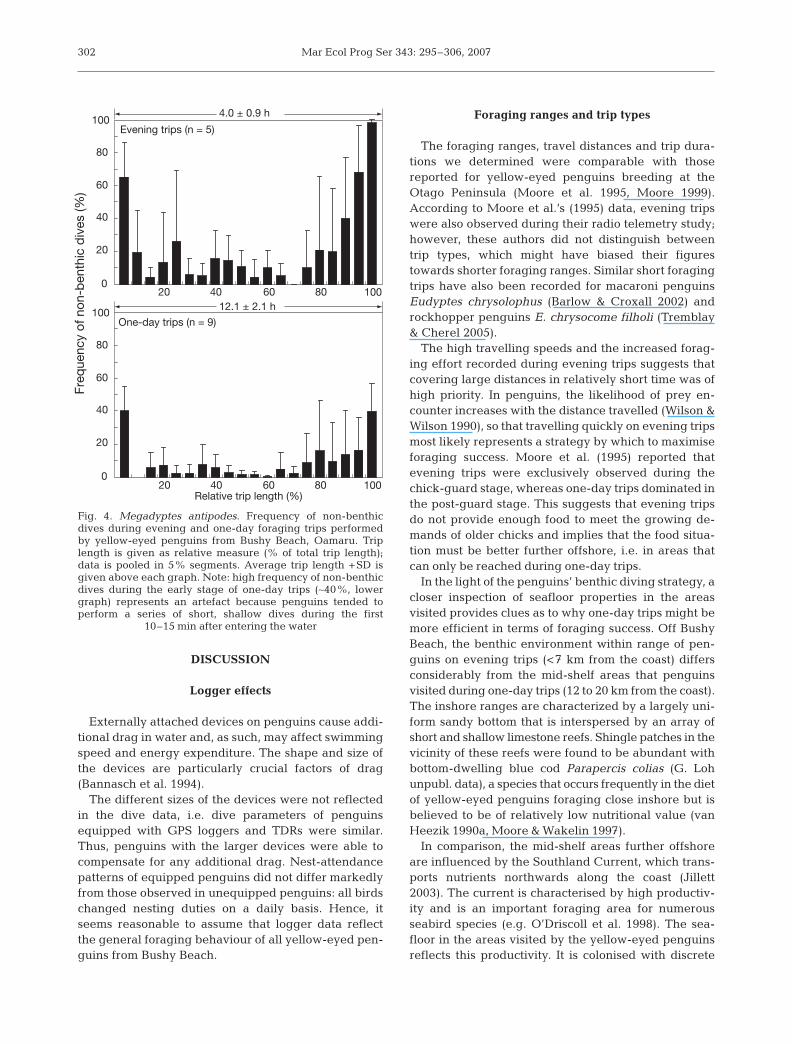
decreased accordingly. Bottom times were shortestwhen the birds were travelling back towards the coast.This was a consequence of the increased frequency ofnon-benthic dives towards the end of the foragingtrips, i.e. during the incoming stage (Fig. 4). Non-ben-thic dives were usually shallow (<10 m) with lowascent and descent rates (individual means from 6birds on one-day trips: 0.4 ± 0.1 m s–1 and 0.3 ± 0.1 ms–1, respectively). This implies shallow dive angleswhereby the duration of descent and ascent is pro-longed, which effectively reduced the amount of bot-tom time.
301
0.5 km
d
10 m
20 m
30 m
40 m 50 m
#3m 21.12.04
#3f 18.12.04
#4m 18.12.04
#4f 20.12.04
#4f 21.12.04
c
d
2004–05 one-day trips
10 m
20 m
2003–04 evening trips
#6m 12.12.03
#2m 16.12.03
#2m 17.12.03
2 km
b
Reef
N
#7f 08.01.04
#7f 09.01.04
#6f 11.01.04
#6f 12.01.04
d
a 2003–04 one-day trips
4 km
Fig. 3. Megadyptes antipodes. Foraging tracks of yellow-eyed penguins in breeding seasons (a,b) 2003–04 and (c) 2004–05.Arrowheads indicate direction of travel and, in the case of one-day trips, mark the onset and end of midday activity for each track.(b) Three evening trips (duration <4 h) by 2 unrelated birds in December 2003; arrow indicates where both birds markedlychanged their course towards the colony and marks the approximate location of a 50 m long limestone reef. (d) Detail of tracksections from (a, c), showing midday activity of different birds observed in both seasons. Legends: bird identification (nest no. and
sex) and date of trip (dd.mm.yy); 10 m depth contours given
Mar Ecol Prog Ser 343: 295–306, 2007
DISCUSSION
Logger effects
Externally attached devices on penguins cause addi-tional drag in water and, as such, may affect swimmingspeed and energy expenditure. The shape and size ofthe devices are particularly crucial factors of drag(Bannasch et al. 1994).
The different sizes of the devices were not reflectedin the dive data, i.e. dive parameters of penguinsequipped with GPS loggers and TDRs were similar.Thus, penguins with the larger devices were able tocompensate for any additional drag. Nest-attendancepatterns of equipped penguins did not differ markedlyfrom those observed in unequipped penguins: all birdschanged nesting duties on a daily basis. Hence, itseems reasonable to assume that logger data reflectthe general foraging behaviour of all yellow-eyed pen-guins from Bushy Beach.
Foraging ranges and trip types
The foraging ranges, travel distances and trip dura-tions we determined were comparable with thosereported for yellow-eyed penguins breeding at theOtago Peninsula (Moore et al. 1995, Moore 1999).According to Moore et al.’s (1995) data, evening tripswere also observed during their radio telemetry study;however, these authors did not distinguish betweentrip types, which might have biased their figurestowards shorter foraging ranges. Similar short foragingtrips have also been recorded for macaroni penguinsEudyptes chrysolophus (Barlow & Croxall 2002) androckhopper penguins E. chrysocome filholi (Tremblay& Cherel 2005).
The high travelling speeds and the increased forag-ing effort recorded during evening trips suggests thatcovering large distances in relatively short time was ofhigh priority. In penguins, the likelihood of prey en-counter increases with the distance travelled (Wilson &Wilson 1990), so that travelling quickly on evening tripsmost likely represents a strategy by which to maximiseforaging success. Moore et al. (1995) reported thatevening trips were exclusively observed during thechick-guard stage, whereas one-day trips dominated inthe post-guard stage. This suggests that evening tripsdo not provide enough food to meet the growing de-mands of older chicks and implies that the food situa-tion must be better further offshore, i.e. in areas thatcan only be reached during one-day trips.
In the light of the penguins’ benthic diving strategy, acloser inspection of seafloor properties in the areasvisited provides clues as to why one-day trips might bemore efficient in terms of foraging success. Off BushyBeach, the benthic environment within range of pen-guins on evening trips (<7 km from the coast) differsconsiderably from the mid-shelf areas that penguinsvisited during one-day trips (12 to 20 km from the coast).The inshore ranges are characterized by a largely uni-form sandy bottom that is interspersed by an array ofshort and shallow limestone reefs. Shingle patches in thevicinity of these reefs were found to be abundant withbottom-dwelling blue cod Parapercis colias (G. Lohunpubl. data), a species that occurs frequently in the dietof yellow-eyed penguins foraging close inshore but isbelieved to be of relatively low nutritional value (vanHeezik 1990a, Moore & Wakelin 1997).
In comparison, the mid-shelf areas further offshoreare influenced by the Southland Current, which trans-ports nutrients northwards along the coast (Jillett2003). The current is characterised by high productiv-ity and is an important foraging area for numerousseabird species (e.g. O’Driscoll et al. 1998). The sea-floor in the areas visited by the yellow-eyed penguinsreflects this productivity. It is colonised with discrete
302
20 40 60 80Relative trip length (%)
0
20
40
60
80
100
Freq
uenc
y of
non
-ben
thic
div
es (%
)
One-day trips (n = 9)
12.1 ± 2.1 h
100
0
20
40
60
80
100Evening trips (n = 5)
4.0 ± 0.9 h
20 40 60 80 100
Fig. 4. Megadyptes antipodes. Frequency of non-benthicdives during evening and one-day foraging trips performedby yellow-eyed penguins from Bushy Beach, Oamaru. Triplength is given as relative measure (% of total trip length);data is pooled in 5% segments. Average trip length +SD isgiven above each graph. Note: high frequency of non-benthicdives during the early stage of one-day trips (∼40%, lowergraph) represents an artefact because penguins tended toperform a series of short, shallow dives during the first
10–15 min after entering the water
Mattern et al.: Yellow-eyed penguin foraging
patches of horse mussels Atrina zelandica (G. Lohunpubl. data), which provide substrate for settlementof sponges and soft corals and thus considerablyenhance the local benthic biodiversity (Cummings2001). This in turn is likely to provide yellow-eyedpenguins with a wider range of prey species and foodof higher nutritional quality than found further inshore(van Heezik 1990b).
Consistent foraging patterns
Foraging tracks compiled from GPS data revealedsome remarkably consistent foraging patterns. Yellow-eyed penguins that performed 2 foraging trips duringthe deployment of GPS loggers all showed very con-servative at-sea movements. Regardless of trip type(i.e. one-day trip or evening trip), birds revisited loca-tions on consecutive trips, in some cases travellingalong similar, almost congruent routes to and fromthese locations. This extends the information providedby Moore (1999), who found that yellow-eyed pen-guins from the Otago Peninsula not only retained for-aging ranges and travel directions between foragingtrips but also between years.
Moore (1999) raised the question of whether suchhabitual foraging patterns were a result of the birdsfavouring certain locations or stemmed from a similarheading that the birds followed each day. Consideringthe concentration of position fixes in particular areasthat we observed for individuals on consecutive trips, itseems that penguins deliberately re-visit certain areas.Presumably, the attraction of these areas is related toprey occurrence and abundance. The fact that differ-ent, unrelated birds occupied the same centre of activ-ity in different years suggests that the attractiveness ofsuch locations is not temporary but persistent.
Overall, the conservative routes used by individualson different foraging trips and the consistency ofmovement patterns among individuals and betweenyears suggest that yellow-eyed penguins target areasthat feature a predictable abundance of prey items. Itis unlikely that such a foraging strategy would beviable if these prey species were exposed to the hydro-dynamic influence of currents in the middle and toplayers of the water column (Wilson 1991). In contrast,the preference of yellow-eyed penguins for bottom-dwelling prey species facilitates a strategy of learnedand retained foraging patterns.
Exclusive bottom feeders
Several studies concluded that bottom-feedingbehaviour is an important component of the yellow-
eyed penguin’s foraging strategy (van Heezik 1988,Seddon & van Heezik 1990, Moore et al. 1995, Moore &Wakelin 1997). Our data suggests that benthic forag-ing is more than just a component. The proportion ofbenthic dives, particularly on one-day trips (∼87% ofall dives), shows that the yellow-eyed penguins fromBushy Beach feed predominantly — if not exclu-sively — at the bottom. Non-benthic dives occurredmainly during the very early stages and during the last3 h of the trips (Fig. 4), and as such primarily representtravelling dives during which the birds cover largerdistances. In some individual penguins, benthic divesoccurred frequently throughout all stages of the forag-ing trip (Fig. 2). But despite bottom-diving behaviourduring the return, these birds covered the distances totheir colony in considerably less time than when theyheaded offshore in the morning, indicating a direc-tional orientation of their dives, primarily consistentwith travel.
Moore et al. (1995) used dive recorders to determinedive profiles of yellow-eyed penguins at the OtagoPeninsula and from the Catlins. The continental shelfat both locations is considerably deeper than at BushyBeach (see Fig. 1). Nevertheless, these yellow-eyedpenguins seemed to perform mainly benthic diveseven though they were foraging in water depths rang-ing from 80 to 120 m. Furthermore, recent deploy-ments of GPS dive loggers on yellow-eyed penguinsfrom the Otago Peninsula and Stewart Island alsorevealed predominantly benthic foraging at both sites(Mattern 2006, T. Mattern unpubl. data). Moore et al.(1995) also stated that they observed longer bouts ofmid-water dives, and diet studies showed that the pen-guins occasionally took non-demersal prey species(van Heezik 1990b, Moore & Wakelin 1997). However,from the general prey composition and unpublisheddive data available, it appears that mid-water feedingby yellow-eyed penguins is the exception rather thanthe rule.
Benthic foraging has been observed in penguins thatsometimes search for prey in shallow coastal waters,e.g. rockhopper penguins (Tremblay & Cherel 2000),gentoo penguins Pygoscelis papua (e.g. Lescroël &Bost 2005), chinstrap penguins Pygoscelis antarctica(Takahashi et al. 2003), and emperor penguins Apten-odytes fosteri (e.g. Rodary et al. 2000). However, noneof these species appear to have developed an exclusivebottom-feeding strategy as have yellow-eyed pen-guins at Bushy Beach. With the exception of gentoopenguins, these species are offshore feeders that usu-ally forage for pelagic prey in deep waters (Croxall &Davis 1999); thus, bottom foraging seems to be ratheropportunistic behaviour.
Gentoo penguins, like yellow-eyed penguins, areconsidered inshore foragers. Benthic prey is common
303
Mar Ecol Prog Ser 343: 295–306, 2007
in the gentoo penguin’s diet at the northern limits of itsdistributional range, while pelagic prey forms themajor part of its diet further south (Claussen & Pütz2003). This differentiation seems to be a result of theseasonality at higher latitudes, where increased abun-dance of pelagic prey over the summer makes foragingfor such prey a more efficient strategy than targeting amore consistent food source like benthic prey, which isavailable year-round at lower latitudes (Croxall &Davis 1999). The yellow-eyed penguins’ southern dis-tribution limit (i.e. subantarctic Campbell Island, 52°S)is still further north than the northern limit of the gen-too penguins’ range in the Pacific Ocean (MacquarieIsland, 54°S). Thus, it seems unlikely that prey ofsouthern yellow-eyed penguins is linked to seasonal-ity, so that a specialisation for benthic foraging by allyellow-eyed penguins is imaginable. This would alsoexplain why the species is absent from other sub-antarctic islands within its latitudinal range that havelittle continental shelf, such as the Antipodes andSnares Islands (Smith 1987, Fig. 1).
Diving behaviour during different trip stages
In the light of their exclusive bottom-feeding behav-iour, the yellow-eyed penguins exhibited surprisinglylow overall descent and ascent rates. If all dives duringa trip are considered, the penguins spent almost two-thirds of their dive duration transiting between surfaceand bottom. Theoretically, in order to maximise bottomand consequently feeding time, bottom foragersshould attempt to keep the time spent in transit at aminimum, and descent and ascent rates should be highrather than low (Wilson & Wilson 1988). Rockhopperpenguins performing benthic dives to depths of 20 to30 m were found to descend at around 1.5 m s–1, withascent rates being slightly slower (~1.3 m s–1) (Trem-blay & Cherel 2000). Compared with that, the transitrates we observed appear surprisingly inefficient(Table 1). However, mean descent and ascent rateswere significantly higher during midday activity,which allowed for longer bottom times and conse-quently higher diving efficiency at the penguins’ tripdestinations (Table 2). Thus, yellow-eyed penguinsperformed the more efficient benthic dives after theyarrived in the presumably productive feeding areasthat were further offshore. Conversely, during the out-going and incoming stages of their trips the penguinsperformed benthic dives that appear inefficient, atleast according to the principle of minimised transittimes (Wilson & Wilson 1988). However, this principleonly applies under the assumption that the primaryaim of a benthic dive is to forage for food. The longtransit times during the yellow-eyed penguins’ outgo-
ing and incoming stages imply shallow descent andascent angles whereby penguins can cover horizontaldistances while transiting to the bottom. Thus, benthicdives during outgoing and incoming possibly serve 2purposes — to travel and search for prey at the sametime.
Interestingly, dive parameters during both travellingstages differ also. It appears as if the penguins weremore likely to exhibit ‘real’ travelling behaviour whenreturning to the colony: the frequency of non-benthicdives increased markedly (Fig. 4), and horizontal trav-elling speed was higher, indicating a more linearmovement than during the outgoing stage. The differ-ences between outgoing and incoming stages can beinterpreted as higher search effort while travellingaway from the coast, whereas on return to the coast thepenguins’ emphasis lies with travelling.
Considering the prevalence of benthic dives duringall stages of the trip and the consistency of foragingroutes, it is likely that benthic dives are also utilised bythe penguins for the purpose of navigation.
Navigation by bottom features?
The occurrence of reefs or similar bottom featurestriggers behavioural responses in yellow-eyed pen-guins such as course changes (Fig. 3b). In one case apenguin even followed exactly the same course onseparate trips (Fig. 3b, Bird # 2m). This implies a highlevel of fine-scaled navigation skill.
Little is known about navigation in penguins orseabirds in general. Although olfactory (e.g. Nevitt2000) and magnetic orientation (Benhamou et al.2003a) have been considered, it is currently believedthat seabirds rely largely on visible cues for navigation(e.g. sun/star compass, wave patterns) (Benhamou etal. 2003b). While the apparent scarcity of visual cues inthe offshore oceanic environment suggests non-visualmeans of route finding, species that forage in coastalwaters can use the skyline of landmasses to take theirbearings.
In the case of bottom-diving yellow-eyed penguins,the seafloor provides additional features for naviga-tion. The occurrence of reefs and shingle patches (andassociated flora such as bladder or giant kelp Macro-cystis pyrifera) at discrete locations certainly representunderwater landmarks available to yellow-eyed pen-guins for orientation. Navigation by landmarks hasrecently been proved to be an important component inthe route-finding abilities of homing pigeons (Lipp etal. 2004). Homing pigeons use stereotyped but individ-ual routes over familiar landscapes, and it was sug-gested that the birds might utilize memorized land-scape maps for navigation (Meade et al. 2005). The fact
304
Mattern et al.: Yellow-eyed penguin foraging
that yellow-eyed penguins remain resident in theirbreeding location throughout the year (Darby & Sed-don 1990) and, thus, forage in the same sea areas foryears on end would allow for the development of navi-gation skills comparable with those described for hom-ing pigeons.
CONCLUSION
The foraging strategy employed by yellow-eyedpenguins from Oamaru is quite extraordinary for amember of the Sphenisciformes. Consistent foragingpatterns and exclusive benthic feeding suggest a highlevel of specialisation that requires a high degree ofstability and predictability in the marine environment.Ultimately, this raises the question of whether the yel-low-eyed penguins are able to adjust their behaviourto compensate for perturbations in the marine environ-ment as efficiently as other penguin species.
Acknowledgments. We are especially grateful to G. Loh(Department of Conservation, Dunedin) for surveying theseafloor along foraging routes of yellow-eyed penguins atBushy Beach. We thank our helpers during field work: K.Pearce (Department of Conservation, Oamaru) monitorednests and re-covered loggers; J. Caldwell provided informa-tion about individual penguins he has known for years; K.Houston and L.-G. Ellenberg helped during the deploymentand recovery of devices. Further thanks are due to G. Peters,earth&OCEAN Technologies, Kiel, for outstanding productsupport. H. Ellenberg and 4 anonymous reviewers providedinvaluable comments on various drafts of the manuscript. Weare particularly grateful to the Yellow-eyed Penguin Trust forallowing the use of the Trust’s GPS loggers in the 2004–05season. This study was funded by a University of OtagoResearch Grant issued to L.S.D. T.M. was supported by a Uni-versity of Otago Postgraduate Scholarship. The research wasapproved by the University of Otago’s Animal Ethics Commit-tee (No. 32/03) and was permitted by the NZ Department ofConservation (SOUCO-45822 CR AP).
LITERATURE CITED
Bannasch R, Wilson RP, Culik BM (1994) Hydrodynamicaspects of design and attachment of a back-mounteddevice in penguins. J Exp Biol 194:83–96
Barlow KE, Croxall, JP (2002) Provisioning behaviour of mac-aroni penguins Eudyptes chrysolophus. Ibis 144:248-258
Benhamou S, Bried J, Bonadonna F, Jouventin P (2003a)Homing in pelagic birds: a pilot experiment with white-chinned petrels released in the open sea. Behav Proc61:98–100
Benhamou S, Bonadonna F, Jouventin P (2003b) Successfulhoming of magnet-carrying white-chinned petrels re-leased in the open sea. Anim Behav 65:729–734
Claussen A, Pütz K (2003) Winter diet and foraging of gentoopenguins (Pygoscelis papua) from Kidney Cove, FalklandIslands. Polar Biol 26:32–40
Croxall JP, Davis LS (1999) Penguins: paradoxes and patterns.Mar Ornithol 27:1-12
Cummings V (2001) Horse mussels enhance biodiversity incoastal soft sediments. NIWA Biodiversity Update 2:5
Darby JT, Seddon PJ (1990) Breeding biology of yellow-eyedpenguins (Megadyptes antipodes). In: Davis LS, Darby JT(eds) Penguin biology. Academic Press, San Diego, CA,p 45–62
Edge KA (1996) Parental investment in penguins: a phyloge-netic and experimental approach. PhD thesis, Universityof Otago, Dunedin
Houston D (2005) Diphtheritic stomatitis in yellow-eyed pen-guins. N Z J Zool 32:263–271
Hull CL, Hindell MA, Michael K (1997) Foraging zones ofroyal penguins during the breeding season, and theirassociation with oceanographic features. Mar Ecol ProgSer 153:217–228
Jillett JB (2003) Physical oceanographic setting and watermasses. In: Darby JT (ed) The natural history of southernNew Zealand. University of Otago Press, Dunedin,p 318–322
Lescroël A, Bost CA (2005) Foraging under contrasting ocea-nographic conditions: the gentoo penguin at KerguelenArchipelago. Mar Ecol Prog Ser 302:245–261
Lipp HP, Vyssotski AL, Wolfer DP, Renaudineau S, Savini M,Troester G, Dell’Omo G (2004) Pigeon homing along high-ways and exits. Curr Biol 14:1239–1249
Mattern T (2001) Foraging strategies and breeding success inthe little penguin, Eudyptula minor: a comparative studybetween different habitats. MSc thesis, University ofOtago, Dunedin
Mattern T (2006) Marine ecology of offshore and inshore for-aging penguins: the Snares penguin Eudyptes robustusand yellow-eyed penguin Megadyptes antipodes. PhDthesis, University of Otago, Dunedin
Meade J, Biro D, Guildford T (2005) Homing pigeons developlocal route stereotypy. Proc R Soc Lond B 272:17–23
Miller CB (2004) Biological oceanography. Blackwell Publish-ing, Oxford
Moore PJ (1999) Foraging range of the yellow-eyed penguinMegadyptes antipodes. Mar Ornithol 27:49–58
Moore PJ, Wakelin MD (1997) Diet of the yellow-eyed pen-guin Megadyptes antipodes, South Island, New Zealand,1991–1993. Mar Ornithol 25:17–29
Moore PJ, Wakelin MD, Douglas ME, McKinlay B, Nelson D,Murphy B (1995) Yellow-eyed penguin foraging study,south-eastern New Zealand, 1991–1993, Department ofConservation, Wellington
Mutch PG (1983) Factors influencing the density and distribu-tion of the P. colias, Parapercis colias. Pisces: Mugiloidae.MS thesis, University of Auckland
Nevitt GA (2000) Olfactory foraging by Antarctic procellari-iform seabirds: life at high Reynolds numbers. Biol Bull(Woods Hole) 198:245–253
Nybakken JW, Bertness MD (2005) Marine biology: an eco-logical approach, Pearson/Benjamin Cummings, SanFrancisco, CA
O’Driscoll RL, Renner M, Austin FJ, Spencer HG (1998) Distri-bution of seabirds in coastal waters off Otago, NewZealand. N Z J Mar Freshw Res 32:203–213
Rodary D, Bonneau W, Le Maho Y, Bost CA (2000) Benthicdiving in male emperor penguins Aptenodytes forsteri for-aging in winter. Mar Ecol Prog Ser 207:171–181
Ryan PG, Petersen SL, Peters G, Grémillet D (2004) GPStracking a marine predator: the effects of precision, reso-lution and sampling rate on foraging tracks of Africanpenguins. Mar Biol 145:215–223
305
Mar Ecol Prog Ser 343: 295–306, 2007
Seddon PJ, van Heezik Y (1990) Diving depths of the yellow-eyed penguin Megadyptes antipodes. Emu 90:53–57
Setiawan AN, Darby JT, Lambert DM (2004) The use of mor-phometric measurements to sex yellow-eyed penguins.Waterbirds 27:96–101
Smith R (1987) Biogeography of a rare species—the yellow-eyed penguins (Megadyptes antipodes). BSc (Honours)dissertation, University of Otago, Dunedin
Takahashi A, Dunn MJ, Trathan PN, Sato K, Croxall JP (2003)Foraging strategies of chinstrap penguins at Signy Island,Antarctica: importance of benthic feeding on Antarctickrill. Mar Ecol Prog Ser 250:279–289
Tremblay Y, Cherel Y (2000) Benthic and pelagic dives: a newforaging behaviour in rockhopper penguins. Mar EcolProg Ser 204:257–267
Tremblay Y, Cherel Y (2003) Geographic variation in the for-aging behaviour, diet and chick growth of rockhopperpenguins. Mar Ecol Prog Ser 251:279–297
Tremblay Y, Cherel Y (2005) Spatial and temporal variation inthe provisioning behaviour of female rockhopper penguinsEudyptes chrysocome filholi. J Avian Biol 36:135–145
van Heezik Y (1988) Growth and diet of the yellow-eyed pen-guin, Megadyptes antipodes. PhD thesis, University ofOtago, Dunedin
van Heezik Y (1990a) Diets of yellow-eyed, Fiordland crested,
and little blue penguins breeding sympatrically on Cod-fish Island, New Zealand. N Z J Zool 17:543-548
van Heezik Y (1990b) Seasonal, geographical, and age-related variations in the diet of the yellow-eyed penguin(Megadyptes antipodes). N Z J Zool 17:201-212
Williams TD (1995) The penguins. Oxford University Press,Oxford
Wilson RP (1991) The behaviour of diving birds. Acta XXCongressus Internationalis Ornithologici, Christchurch,2–9 December 1990. New Zealand Ornithological Con-gress Trust Board, Wellington, p 1853–1867
Wilson RP (1995) Foraging ecology. In: Williams TD (ed) Thepenguins. Oxford University Press, Oxford, p 81–106
Wilson RP, Wilson MP (1988) Foraging behaviour in four sym-patric cormorants. J Anim Ecol 57:943–955
Wilson RP, Wilson MPT (1990) Foraging ecology of breedingSpheniscus penguins. In: Davis LS, Darby JT (eds) Pen-guin biology. Academic Press, San Diego, CA, p 181–206
Wilson R, Pütz K, Peters G, Culik B, Scolaro J, Charrassin JB,Ropert-Coudert Y (1997) Long-term attachment of trans-mitting and recording devices to penguins and otherseabirds. Wildl Soc Bull 25:101–106
Ydenberg RC, Clark CW (1989) Aerobiosis and anaerobiosisduring diving by western grebes: an optimal foragingapproach. J Theor Biol 139:437-449
306
Editorial responsibility: Otto Kinne (Editor-in-Chief),Oldendorf/Luhe, Germany
Submitted: September 26, 2006; Accepted: February 22, 2007Proofs received from author(s): July 18, 2007
Copyright © 2022 FDOKUMEN