Experimental Studies on Bioregeneration of Activated Carbon Contaminated With Hydrocarbon
Upload
independentCategory
view
0download
0
1. INTRODUCTION
Zooplankton species are cosmopolitan in nature andthey inhabit all freshwater habitats of the world, includ-ing polluted industrial and municipal wastewaters.Zooplankton are not only useful as bioindicators to helpus detect pollution load, but are also helpful for amelio-rating polluted waters. Comparisons of size structure,fecundity, and reproductive strategies of zooplankterscan indicate the nature and extent of pollutant loads(Sarma 1996; Mukhopadhyay et al. 2000). The easternfringe of Kolkata (formerly Calcutta), has the largesturban wetland, the East Calcutta Wetlands (ECW), aRamsar site (No. 1208), that covers around 12,500 ha.The area includes 286 wastewater-fed fishponds spreadover 3,832.27 ha (over 30% of the total wetland area)that produce nearly 10,915 metric tonnes of fish annual-ly (Chattopadhyay et al. 1999). It receives effluentsfrom about 6000 small-scale industrial establishmentslike tanneries, rubber industries, electroplating indus-tries, pigment manufacturing units, potteries, and bat-tery manufacturing plants. Composite industrial effluenttogether with municipal wastewater flow down througha web of canals traversing the ECW ecosystem and arefinally discharged in Kultigong River, nearly 40 kilome-
ters from Kolkata city. A number of vast shallow waterbodies receive the bulk of polluted wastewater and areused in pisciculture. ECW ecosystem modifies and trapsa broad spectrum of contaminants. From the source tothe discharge site the wastewater exhibits substantialreductions in Total Suspended Solids (TSS), TotalDissolved Solids (TDS), total hardness, chloride con-tent, Biochemical Oxygen Demand (BOD5) andChemical Oxygen Demand (COD) (Chattopadhyay et al2004). Interesting dynamics in the community structureof zooplankton, thriving in wastewater and contaminat-ed waters, have been recently reported from India. Thepresent study is the first attempt to record the changes inthe community structure of zooplankton, in a stabiliza-tion pond and in wastewater carrying canals along thegradient from the source points down to the confluencesite in response to the changing physico-chemical envi-ronment.
2. MATERIALS AND METHODS
The areas under investigation were located betweenDhapa and Kultigong in the ECW (lat. 22° 33’ – 22° 40’
N; long. 88° 25’ – 88° 33’ E), India. The first samplingstation (Site 1) was a fishpond fed by tannery effluent,
J. Limnol., 66(2): 97-106, 2007
Spatial variations in zooplankton diversity in waters contaminated with composite effluents
Subhra Kumar MUKHOPADHYAY1), Buddhadeb CHATTOPADHYAY, Abhishek Roy GOSWAMI* andAsitava CHATTERJEE2)
Government College of Engineering and Leather Technology, Block- LB Sector III, Salt Lake City Kolkata-700098 1) Durgapur Government College, J.N Avenue Durgapur 713214, India 2) Directorate of Forest, Govt. of West Bengal, Kolkata, India*e-mail corresponding author: [email protected]
ABSTRACT
Zooplankton species are cosmopolitan in their clean freshwater habitat and are also found in industrial and municipal waste-waters. The present study records for the first time the aspects of zooplankton diversity in relation to physico-chemical environment offive selected sites of the East Calcutta wetlands, a Ramsar site of Kolkata city, India, heavily contaminated by industrial and munici-pal wastewaters. The study revealed the occurrence of 22 species of zooplankton, among these 3 species of Cladocera, 2 species ofCopepoda, 15 species of Rotifera, and 2 species of Ostracoda were recorded. The copepod Mesocyclops leuckarti was found in all thefive sites, rotifers Asplanchna brightwelli, Brachionus angularis, B. calyciflorus and Cladocera Ceriodaphnia cornuta were found infour sites; Moina micrura and Diaphanosoma sarsi were found at three sites. Site wise variation in dominance, diversity, evenness andrichness were calculated. Site 1, a fish-pond that stabilized composite wastewater, showed the maximum species richness having 17species, while Site 2, SWF wastewater carrying canal, showed only 4 species. The calculated Jack 1 values of Sites 1 to 5 were 21.78,3.77, 18.63, 12.5 and 16.95 respectively. Shannon-Wiener species diversity index (H/) values were almost similar for all the three rel-atively less polluted sites viz, Site 1 (1.959), Site 4 (2.010), Site 5 (2.047). However, at highly polluted sites viz., 2 and 3, H/ value of1.336 and 0.984 respectively, were calculated. Simpson’s Dominance index (Dsimp) value was highest at Site 3 (0.618) indicating max-imum dominance, whereas at Site 5 dominance was lowest (0.1680) and diversity was highest. We discuss the role of zooplankton inthe amelioration of wastewater.
Keywords: East Calcutta wetland, Ramsar site, zooplankton, wastewater-fed fishponds, diversity indices

98 S.K. Mukhopadhyay et al.
around 1 km away from the source point of the canalthat carried raw composite tannery effluent from Tangratannery agglomerate, Kolkata. The second station (Site2) was located at Chowbaga, which is 8 km from thesource point, where the composite tannery effluent wassiphoned into the Storm Water Flow (SWF) canal, thatis being mixed with the municipal sewage throughBallygunge Drainage Pumping System which carries thebulk effluent load from two other tannery agglomerates(Topsia and Tiljala) and other small-scale industries.The third sampling station (Site 3) was on the SWFcanal, near the proposed Calcutta Leather Complex atKaraidanga, around 15 km away from the source point.Site 4 was located on the same canal near Kultigonglock gate around 40 km away from the source point.Here SWF meets with the Dry Weather Flow (DWF)canal that principally carries the municipal sewageabout 200 metres upstream of Kultigong river. Site 5was on the DWF at Ghoshpur, 1km upstream fromKultigong lock gate. Sampling was done monthly fortwo years (24 months) between 11.00 and16.00 hours.
From each sampling station 35 l of surface water was slowly filtered through a No. 25 bolting silk clothplankton net for quantitative estimation of plankters.Phytoplankters and Nanozooplankters were studied inlive condition. All plankton samples were analysedusing Leica DM LB2 microscope fitted with LeicaDFC320 camera. Narcotization, preservation and identi-fication of plankters were made using standard refer-ences (Ahlstorm 1940; Sharma 1979a; Sharma 1979b;
Michael & Sharma 1988; Edmondson 1992; Battish1992).
The chemical parameters of water, includingChloride, Acidity, Alkalinity, Total Hardness, Carbonatehardness, were analyzed on the spot by using EMERCK(Germany) Aquamerk/ Aquaquont water testing kits.COD, BOD, TSS, phosphate (PO4
3-), nitrate (NO3-), sul-
phide (S2-) and metals were analyzed following Eaton etal. 1995. pH, conductivity, TDS and Dissolved Oxygen(DO) were measured potentiometrically on the spotusing Multiline P4 (WTW, Germany). Air and watertemperature were measured by using multi-user digitalthermometer. For statistical computation and communi-ty structure analyses, statistical computer software(Statistica for Windows, Version 5.1A, Statsoft Inc.,1996), SPSS (SPSS for Windows, Release 10.0.1 SV,SPSS Inc., 1999) and Community Analysis Package(IRC, UK, 2000) were used.
3. RESULTS AND DISCUSSION
Tables 1 and 2 show the mean values (and standarddeviation) of different physico-chemical conditions andmetal loads recorded from the four sites on the waste-water-carrying canal and from the tannery wastewaterfed fishpond. Most of these values, even in the relative-ly cleaner sites of the wastewater carrying canal and thetannery wastewater-fed fishpond, were much differentfrom those reported from uncontaminated ponds of WestBengal (Sharma 1992; Michael 1968). Zooplankters
Site 1 Site 2 Site 3 Site 4 Site 5
Mean s.d. Mean s.d. Mean s.d. Mean s.d. Mean s.d.
Air Temp. (°C) 32.4 2.7 32.6 2.8 32.3 3.0 32.2 2.9 33.1 3.4
Water Temp. (°C) 31.3 4.0 30.8 4.0 30.8 3.2 30.9 3.0 29.8 3.5
pH 7.9 0.7 7.6 0.6 7.3 0.6 7.4 0.6 7.5 0.7
DO (mg l-1) 6.0 1.6 0.1 0.2 0.4 0.6 4.2 2.0 4.5 1.5
TDS (mg l-1) 1451 686 2386 1830 958 358 2307 2194 1753 1563
Conductivity (mS) 2.9 1.4 4.8 3.6 1.9 0.6 4.8 4.5 3.6 3.2
TSS (mg l-1) 542 378 344 144 499 319 96 36 243 98
Tot. Acidity (mmol l-1) 6.3 4.1 6.3 2.7 8.1 7.9 9.7 5.4 9.0 1.8
Tot. Alkalinity (mmol l-1) 26.7 25.6 63.6 68.5 21.7 18.6 20.6 22.5 18.6 18.6
CO3 Hardness (mg l-1 CaCO3) 449 397 528 433 407 417 430 410 315 206
Tot. Hardness (mg l-1 CaCO3) 754 825 693 648 641 616 944 890 667 422
Cl- (mg l-1) 988 695 1621 1195 726 444 1627 1698 1082 858
PO43- (mg l-1) 0.9 0.7 1.8 1.2 3.3 1.1 2.4 1.6 2.4 1.1
NO3 (mg l-1) 43.6 29.0 41.0 31.9 34.6 31.5 36.9 28.2 41.5 26.7
NO2- (mg l-1) 9.9 7.9 4.4 0.4 4.4 0.4 4.7 0.4 7.4 2.4
S2- (mg l-1) 128.4 100.5 77.6 79.1 141.9 39.6 85.3 40.3 121.1 55.1
BOD5 (mg l-1) 149 77 264 171 95 40 86 37 122 79
COD (mg l-1) 4740 4408 5602 3968 3979 3785 2241 2105 1642 1312
Chlorophyll a (mg l-1) 38.6 0.0 18.5 6.6 8.6 3.8 12.7 3.0 21.2 6.8
Tab. 1. Mean and standard deviation (N = 24) of the physicochemical parameters measured at the study sites.

Zooplankton diversity in contaminated waters 99
were represented by fifteen rotifers, two copepods, threecladocerans and two ostracoda species. Tables 3 demon-strates the succession of zooplankters along the studysites starting from the source down to final dischargepoint. The successional sequence was as follows: sessileRotifera (Site 2) ➜ pelagic Rotifera (Site 3) ➜ pelagicRotifera and Microcrustaceans (Site 4 and 5). Wetzel(2001) pointed out that rotifers commonly appear earlyin the succession of zooplankton communities and aresucceeded by microcrustaceans. Rotifers were usuallysuppressed by cladocerans through exploitative compe-tition for shared, limiting food resources. In cleanerwater, the abundance and diversity of organisms withcomplex life history strategies increased.
3.1. Rotifers: Nature’s water purifiers
Rotifers, the tiny wheel animalcules, are considerednature’s water purifiers because they perform an impor-tant cleanup service in the still or slow-moving watersthey inhabit. Sharma (1992) made a detailed account ofthe systematics and ecology of freshwater rotifers ofWest Bengal, but investigations on rotifers inhabitingindustrial or municipal wastewater of India are scant(Arora 1961; Chandra & Krishna 1983; Patil & Harshey1983; Sharma 1986; Saksena & Kulkarni 1986; Das &Dutta 1998). As an age-old practice, raw composite tan-nery effluents are stabilised in a number of tanks for thepurpose of pisciculture in the ECW ecosystem. Rotifersare present in such tanks and in the wastewater carryingcanal and perform the excellent function of combatingorganic debris load.
The presence of fifteen-rotifer species in waters witha high chloride concentration (725–1627 mg l-1) indi-cates their euryhaline nature. Interestingly, these rotiferswere also observed to grow when the pH was in therange of 7.3–7.9. Species that reached large populationsizes in the slightly acidic or near-neutral waters includ-ed: Asplanchna intermedia, A. brightwelli, Brachionuscalyciflorus dorcas and Filinia longiseta. Sharma(1992) also records the occurrence of A. priodonta, A.brightwelli and B. calyciflorus in acidic and neutral
waters. B. calyciflorus dorcas f. spinosa flourished inboth acidic (pH 6.9) and alkaline (pH 8.6) conditions inthe present study, thus exhibiting a wide range of pH tol-erance. DO (0.1 to 6.0 mg l-1) showed little effect on therotiferan community. Both illoricate rotifers and rotifersas a whole exhibited significant (P <0.05) positive corre-lation with DO (r = 0.80 and 0.81 respectively), NO2
- (r= 0.90 and 0.89 respectively) and S2- (r = 0.84 and 0.83respectively) and significant (P <0.05) negative correla-tion with conductivity (r = –0.98 in both cases) andChloride (r = –0.90 and –0.88 respectively). Correlationcoefficient values are given in Table 4.
The significant positive correlation between rotifersand S2- in the present study is interesting. The reductionof sulphate (SO4
2-) to S2-, some of which is lost to thesediment as insoluble metallic sulphides, and the oxida-tion of H2S to SO4
2- both play a significant role in themodification of conditions for wastewater that is con-taminated with proteinaceous material. A number of sul-phate-reducing bacteria are heterotrophic and anaerobicand use the sulphur compounds during oxidative metab-olism. Sulphur-reducing bacteria on the other hand, areobligate anaerobes and produce oxygen from sulphate.These two kinds of bacteria, along with sulphur-oxidis-ing bacteria, grow abundantly in wastewater that is richin tannery effluent (van Groenestijn et al. 1999) andencourage the growth of both protozoa and rotifersalong the food chain.
Freshwater aquaculture ponds of the state of WestBengal are known to harbor a variety of rotiferanspecies. In a fishpond at Barrackpore, West Bengal, asmany as 30 species were recorded (Michael 1968), andin a similar pond 18 species were reported (Sharma1992). In contrast, throughout the present study period,the presence of only 7-9 species, at low densities in thecomponent populations, categorically indicates the pres-ence of significant toxicants that limit species diversityand density. Even in such adverse physico-chemicalenvironment, three brachionids, viz., Brachionus cauda-tus personatus (density 13.2 ± 12.311 nos. l-1), B. calyci-florus dorcas f. spinosa (density 72.6 ± 32.650 nos. l-1)and B. quadridentatus cluniorbicularis (density 114.5 ±
Site 1 Site 2 Site 3 Site 4 Site 5
Mean s.d. Mean s.d. Mean s.d. Mean s.d. Mean s.d.
Chromium (mg l-1) 0.014 0.031 0.263 0.372 0.067 0.188 0.029 0.062 0.058 0.125
Lead (mg l-1) 0.463 0.124 0.408 0.088 0.336 0.105 0.359 0.101 0.281 0.097
Copper (mg l-1) 0.661 0.338 0.211 0.025 0.834 0.631 0.897 0.439 1.262 1.091
Zinc (mg l-1) 0.112 0.058 0.215 0.035 0.136 0.035 0.194 0.026 0.267 0.050
Manganese (mg l-1) 2.358 1.651 1.142 0.114 1.814 1.237 2.654 1.657 1.925 0.765
Magnesium (mg l-1) 83.55 20.53 103.4 4.17 152.2 52.69 50.89 38.97 177.6 94.61
Iron (mg l-1) 2.162 0.756 1.978 0.999 2.500 1.317 1.800 0.673 2.305 1.272
Tab. 2. Mean and standard deviation (N = 24) of the total metal content of the wastewater measured at the study sites.

100 S.K. Mukhopadhyay et al.
Site 1 Site 2 Site 3 Site 4 Site 5
ROTIFERA
Asplanchana 9.4 ± 5.9 0.7 ± 2.1 19.9 ± 21.4intermedia (0.0 – 18.4)
-(0.0 – 9.6)
-(1.5 – 86.1)
42.1 ± 55.2 0.3 ± 1.3 1.8 ± 4.3 4.6 ± 5.8A. brightwelli(0.0 – 163)
-(0.0 – 6.2) (0.0 – 15.3) (0.1 – 18.7)
Brachionus 13.2 ± 12.3 2.8 ± 4.2 2.2 ± 5.6candatus personatus (0.0 – 40.2)
-(0.0 – 13.5) (0.0 – 24.7)
-
0.8 ± 0.76 1.8 ± 4.2 1.6 ± 2.7 3.1 ± 5.2B. angularis(0.0 – 2.2)
-(0.0 – 15.1) (0.0 – 11.6) (0.0 – 18.3)
B. calyciflorus 72.6 ± 32.6 126 ± 90.8 3.0 ± 3.8 62.4 ± 55.4dorcas f. spinosa (2.6 – 122)
-(12.5 – 318) (0.0 – 16.1) (7.1 – 182.6)
B. quadridentatus 114 ± 101 8.3 ± 16.6cluniorbicularis (0.0 – 274)
- - -(0.0 – 67.1)
0.2 ± 0.4 1.8 ± 4.9 0.9 ± 2.2B. plicatilis(0.0 – 1.4)
-(0.0 – 18.1) (0.0 – 10.3)
-
- - 2.2 ± 5.3 6.6 ± 7.9B. bidentata(0.0 – 25.2) (0.2 – 28.1)
-
- - 4.7 ± 11.5B. rubens(0.0 – 48.2)
- -
7.1 ± 17.5 11.5 ± 17.2B. falcatus(0.0 – 82.5)
- - -(0.0 – 53.2)
0.6 ± 0.8 1.1 – 2.2 1.0 – 2.6 1.0 – 1.7Keratella tropica(0.0 – 2.4) (0.0 – 8.2) (0.0 – 2.6)
-(0.0 – 5.1)
21.4 ± 38.1 1.4 ± 2.2 9.1 ± 15.6Filinia opoliensis(0.0 – 132)
-(0.0 – 7.0)
-(0.0 – 47.3)
3.3 ± 3.7F. longiseta - - - -(0.0 – 11.8)
1.2 - ± 3.6Philodina citrina
-(0.0 – 14.2)
- - -
0.2 ± 0.8 0.8 ± 2.1 0.5 ± 1.2Scaridium longicaudum(0.0 – 4.1) (0.0 – 8.5)
- -(0.0 – 4.6)
COPEPODA
Mesocyclops leuckarti 6.6 ± 16.2 0.5 ± 1.2 2.1 ± 3.9 14.5 ± 8.7 93.6 ± 64.1(0.0 – 66.2) (0.0 – 3.4) (0.0 – 13.2) (2.0 – 31.9) (6.5 – 191.3)
M. hyalinus 3.1 ± 4.5 1.9 ± 3.5(0.0 – 12.7)
- - -(0.0 – 12.4)
CLADOCERA
1.1 ± 18.2 5.4 ± 4.4 36.9 ± 40Moina micrura(0.0 – 69.1)
- -(0.2 – 13.5) (1.5 – 133)
1.9 ± 5.7 0.2 ± 0.4 1.1 ± 1.8 6.1 ± 11Ceriodaphnia cornuta(0.0 – 26.5)
-(0.0 – 1.2) (0.0 – 6.8) (0.0 – 41.7)
0.4 ± 1.1 0.5 ± 0.9 12.4 ± 14.3Diaphanosoma sarsii(0.0 – 3.9)
-(0.0 – 2.8)
-(0.0 – 55.9)
OSTRACODA
13.7 ± 14.2 0.8 ± 0.7Cyclocypris globosa - -(0.2 – 45.1) (0.0 – 1.9)
-
79.2 ± 77.6 6.4 ± 7.6 38.2 ± 28.2Cyprinotus dentatus(0.0 – 210)
- -(0.2 – 29.6) (6.6 – 99.0)
Tab. 3. Abundance of zooplanktonic organisms in the sampling sites (Number of organisms x l-1 ± sd). In parenthesis are the mini-mum and maximum value.

100.656 nos. l-1) thrived in large numbers in the waste-water fed fish pond (Site 1). Thus, these species couldbe considered very tolerant species, as far as the presentecotoxicants were concerned. B. calyciflorus dorcas f.spinosa also appeared in even larger numbers in themore troubled waters of Site 3 (density 126.1 ± 90.791nos. l-1). Two illoricate forms, viz, A. intermedia and A.brightwelli, thrived in larger numbers at Sites 1 and 5,which share a much more similar physico-chemicalregime. Several toxicants in the environment are knownto induce rapid parthenogenetic development whilereduced sexual development in different rotifer species,even at low concentrations (Snell et al. 1999).Parthenogenetic swarms of brachionids and, at times, ofA. brightwelli corroborate such findings in the stabilisa-tion ponds fed by tannery wastewater in the present study.
Forbes (1999) pointed out that parthenogeneticallyreproducing clones of cladocerans and rotifers offer sev-eral advantages, the most important of which is the iden-tification and quantification of the role of genetic factorsin controlling responses to toxicants, under stressful sit-uations. Snell et al. (1999) reported a toxicant-inducedreduction in rotiferan population growth rate. It wasobserved that the most serious consequence of suchreduced population growth rate was a reduction in rest-ing egg production.
Rotifers were common in the samples collected fromSites 1, 3, 4 and 5. Three rotifer species, viz., Keratellatropica, Philodina citrina and Scaridium longicaudumappeared in small number in the samples collected fromSite 2. A very small population of Scaridium longi-caudum was also noted from Sites 1 and 5 (Tab. 3).Dominant rotifer species were Asplanchna intermedia,A. brightwelli, B. calyciflorus dorcas f. spinosa and B.quadridentatus cluniorbicularis. Occurrence of theseclean-water species in high abundance in wastewaterindicates their tolerance to a wide range physico-chemi-cal factors. Sharma (1992) reported the alkaline prefer-ence of B. angularis, B. caudatus and B. calyciflorus,but in the present study they grew in the mean pH rangeof 7.32 ± 0.586 – 7.91 ± 0.690.
3.2. Micro crustaceans: grazing – predation – detritivory
Six microcrustacean species, comprising of two preda-tory Copepods, three grazer Cladocerans and two detriti-vore Ostracods appeared in the wastewater (Tab. 3).Mesocyclops leuckarti was the only copepod present inall the sampling stations. In sites 1and 5 M. hyalinusalso appeared along with M. leuckarti. Collections fromthese sites also contained 3 cladoceran species; of these,Moina micrura was the most abundant. The other twospecies, Ceriodaphnia cornuta and Diaphanosoma sarsiwere present in small numbers at Sites 1 and 5. C. cor-nuta was also present at low abundance in Site 4 whilea similarly low density of D. sarsi was noted from site3. Two species of ostracoda, viz., Cyclocypris globosa
and Cyprinotus dentatus were observed in the collectedsamples. Ostracods are omnivorous and feed on bacte-ria, algae, detritus and other microorganisms by meansof filtration (Edmondson 1992). They are mostly activeon the surface of the sediment and as their populationflourished, the species appeared in the littoral samples.Cyclocypris globosa was present at Sites 3 and 4 where-as Cyprinotus dentatus was present Sites 1, 4 and 5.Important physico-chemical factors influenced themicrocrustacean population fluctuation, including DO,conductivity, chloride, nitrite (NO2
-), S2-, COD, Cu andMg. Significant negative correlations were observedbetween ostracods and conductivity (r = –0.98; P < 0.05)and chloride (r = – 0.89; P < 0.05). Significant positivecorrelations were observed between ostracods and NO2
-
(r = 0.90; P < 0.05) and S2- (r = 0.89; P < 0.05). Totalcopepods and cladocerans exhibited a significant nega-tive correlation with COD (r = –0.78 and –0.74 respec-tively; P < 0.05) but positive correlations with Cu (r =0.84 for both cases; P < 0.05) and Mg (r = 0.75 and 0.73respectively; P < 0.05). Both correlations and multipleregression analyses are given in Table 4.
3.3. Zooplankton community structure analysis
Site-wise variations in dominance, diversity, even-ness, richness and other indices of community structureare given in Tables 5 and 6. Estimating the total or realnumber of species, i.e., species richness, including thosethat were not sampled, in a community is a crucial task,especially when the habitat is in a stressful situation. Forthis purpose, first-order Jack Knife Estimate (JACK1) ofspecies richness was employed to resample the observedspecies and to relate the estimated species richness to ahigher sample size. JACK1 values calculated for the fivesites were as follows: Site 1 - 21.78, Site 2- 3.77 Site 3-18.63 and Site 4- 12.5 and Site 5- 16.95. Therefore, thevalue was lowest for the most polluted sampling station(Site 2) and highest for the stabilized fishpond (Site 1).Shannon–Wiener species diversity index (H/), basedmainly on the proportional species abundance, wasalmost similar for all the three sites, viz., Site 1 (1.959),Site 4 (2.010) and Site 5 (2.047). In Site 2 and Site 4 thecalculated values were 1.336 and 0.984 respectively. Atthe most stressful site (site 2), H/ value was slightly high-er than Site 3, though only four species occurred at theformer site. Pielou’s index of evenness (J/) was highestin Site 2 (0.964) followed by Site 4 (0.838), Site 5(0.738) and Site 1 (0.691) while the lowest was record-ed in Site 3 (0.363). Therefore, except Site 3, the J/ val-ues for all other sites were within a comparable range.
Simpson’s dominance index (DSIMP), which is alsobased on proportional abundance like H/, showed quitecontrasting values to those for H/. DSIMP value was high-est for Site 3 (0.618) indicating maximum dominance atthe site with minimum diversity, as reflected by the H/
value. In contrast, dominance was lowest at Site 5
Zooplankton diversity in contaminated waters 101

102 S.K. Mukhopadhyay et al.
(0.168) where diversity was maximum (2.047).Although both Shannon measures and Simpson’s indexconsider the proportional abundance of species, H/ ismore sensitive to rare species and DSIMP puts moreemphasis on the common species. Therefore, theseindices point out the occurrence of many rare species in
Sites 1, 4 and 5, but not at Site 3. Margalef’s richnessindex (DMARG), which considers both abundance andspecies numbers, varied between 2.342 and 2.757. Thehighest DMARG value of 2.757 was calculated at Site 3, fol-lowed by Site 1 (2.688), Site 4 (2.638) and Site 5 (2.611)(Tab. 5). All these sites harboured a good number of
Diversity indicesSite-1 Site-2 Site-3 Site-4 Site-5
Species Number Estimate 21.78 3.77 18.63 12.5 16.95[Jack1 = OS + r1(n-1)/n
Shannon-Wiener Species 1.959 1.336 0.984 2.010 2.047Diversity Index
os
[H/ = –S pi ln pi ]i=l
Pielou’s Evenness Index 0.691 0.964 0.363 0.838 0.738
H’[J = ]
ln OS
Margalef’s Richness Index 2.688 2.342 2.757 2.638 2.611
OS – l[DMARG = ]
ln N
Simpson’s Dominance Index 0.185 0.273 0.618 0.176 0.168os
[HSIMP = S (pi)2 ]i=l
Where OS = observed number of species; Pi = Proportional abundance of species i; n = number ofindividuals per species; N = total number of individuals per sample; r1 = occurrence of species withminimum density.
Tab. 5. Different indices to comment on the community structure of the study sites.
D.0 Cond Cl- NO2- S2- COD Cu Mg
Illoricate Rotifera 0.80* – 0.98* – 0.90* 0.90* 0.84* – 0.14 0.37 0.12
Total Rotifera 0.81* – 0.98* – 0.88* 0.89* 0.83* – 0.14 0.38 0.07
Copepoda 0.49 – 0.46 – 0.59 0.42 0.57 – 0.78* 0.83* 0.74*
Cladocera 0.58 – 0.59 – 0.69 0.53 0.67 – 0.74* 0.83* 0.73*
Ostracoda 0.84* – 0.98* – 0.89* 0.90* 0.84* – 0.20 0.43 0.09
Total Zooplankton 0.85* – 0.98* – 0.95* 0.90* 0.89* – 0.39 0.60 0.31
Tab. 4. Correlation coefficients (significant at P <0.05) between the zooplankton communities andthe physicochemical environment of their habitat (*marked correlations were significant).
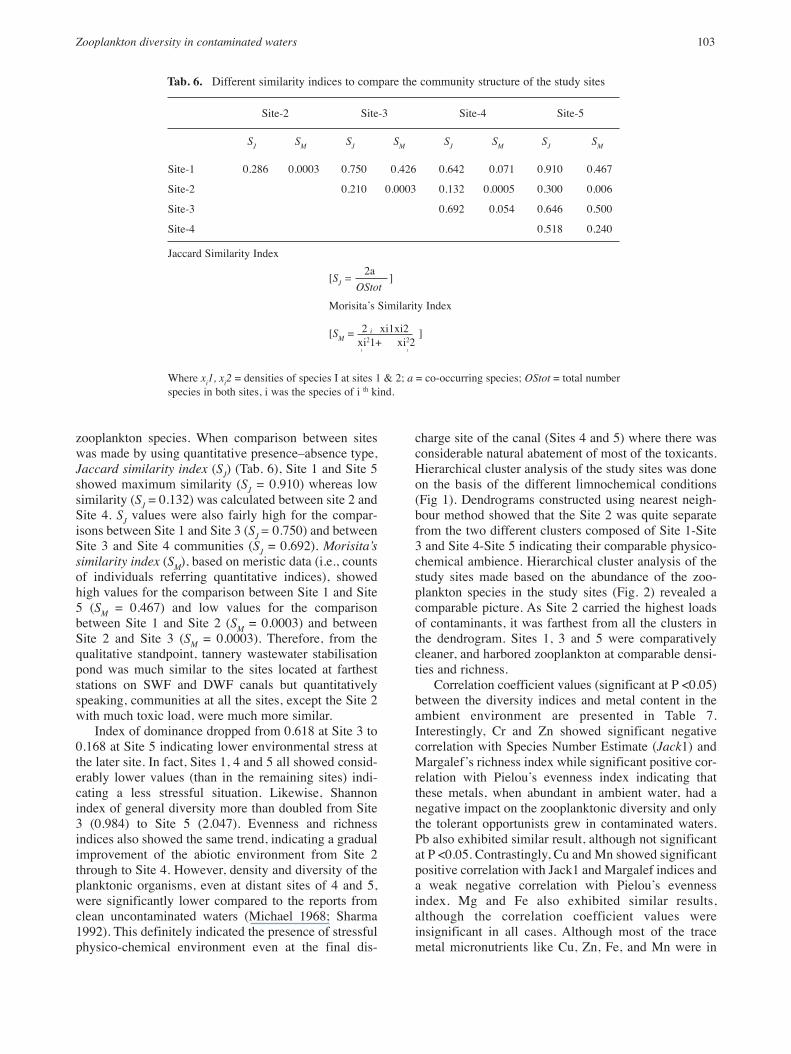
zooplankton species. When comparison between siteswas made by using quantitative presence–absence type,Jaccard similarity index (SJ) (Tab. 6), Site 1 and Site 5showed maximum similarity (SJ = 0.910) whereas lowsimilarity (SJ = 0.132) was calculated between site 2 andSite 4. SJ values were also fairly high for the compar-isons between Site 1 and Site 3 (SJ = 0.750) and betweenSite 3 and Site 4 communities (SJ = 0.692). Morisita’ssimilarity index (SM), based on meristic data (i.e., countsof individuals referring quantitative indices), showedhigh values for the comparison between Site 1 and Site5 (SM = 0.467) and low values for the comparisonbetween Site 1 and Site 2 (SM = 0.0003) and betweenSite 2 and Site 3 (SM = 0.0003). Therefore, from thequalitative standpoint, tannery wastewater stabilisationpond was much similar to the sites located at fartheststations on SWF and DWF canals but quantitativelyspeaking, communities at all the sites, except the Site 2with much toxic load, were much more similar.
Index of dominance dropped from 0.618 at Site 3 to0.168 at Site 5 indicating lower environmental stress atthe later site. In fact, Sites 1, 4 and 5 all showed consid-erably lower values (than in the remaining sites) indi-cating a less stressful situation. Likewise, Shannonindex of general diversity more than doubled from Site3 (0.984) to Site 5 (2.047). Evenness and richnessindices also showed the same trend, indicating a gradualimprovement of the abiotic environment from Site 2through to Site 4. However, density and diversity of theplanktonic organisms, even at distant sites of 4 and 5,were significantly lower compared to the reports fromclean uncontaminated waters (Michael 1968; Sharma1992). This definitely indicated the presence of stressfulphysico-chemical environment even at the final dis-
charge site of the canal (Sites 4 and 5) where there wasconsiderable natural abatement of most of the toxicants.Hierarchical cluster analysis of the study sites was doneon the basis of the different limnochemical conditions(Fig 1). Dendrograms constructed using nearest neigh-bour method showed that the Site 2 was quite separatefrom the two different clusters composed of Site 1-Site3 and Site 4-Site 5 indicating their comparable physico-chemical ambience. Hierarchical cluster analysis of thestudy sites made based on the abundance of the zoo-plankton species in the study sites (Fig. 2) revealed acomparable picture. As Site 2 carried the highest loadsof contaminants, it was farthest from all the clusters inthe dendrogram. Sites 1, 3 and 5 were comparativelycleaner, and harbored zooplankton at comparable densi-ties and richness.
Correlation coefficient values (significant at P <0.05)between the diversity indices and metal content in theambient environment are presented in Table 7.Interestingly, Cr and Zn showed significant negativecorrelation with Species Number Estimate (Jack1) andMargalef’s richness index while significant positive cor-relation with Pielou’s evenness index indicating thatthese metals, when abundant in ambient water, had anegative impact on the zooplanktonic diversity and onlythe tolerant opportunists grew in contaminated waters.Pb also exhibited similar result, although not significantat P <0.05. Contrastingly, Cu and Mn showed significantpositive correlation with Jack1 and Margalef indices anda weak negative correlation with Pielou’s evennessindex. Mg and Fe also exhibited similar results,although the correlation coefficient values wereinsignificant in all cases. Although most of the tracemetal micronutrients like Cu, Zn, Fe, and Mn were in
Zooplankton diversity in contaminated waters 103
Site-2 Site-3 Site-4 Site-5
SJ SM SJ SM SJ SM SJ SM
Site-1 0.286 0.0003 0.750 0.426 0.642 0.071 0.910 0.467
Site-2 0.210 0.0003 0.132 0.0005 0.300 0.006
Site-3 0.692 0.054 0.646 0.500
Site-4 0.518 0.240
Jaccard Similarity Index
Where xi1, xi2 = densities of species I at sites 1 & 2; a = co-occurring species; OStot = total numberspecies in both sites, i was the species of i th kind.
Tab. 6. Different similarity indices to compare the community structure of the study sites
2a[SJ = ]
OStot
Morisita’s Similarity Index
2 xi1xi2[SM = i ]xi21+ xi22
1 1

104 S.K. Mukhopadhyay et al.
organic complexes, a large fraction of Zn usuallyremained in ionic form or weak complexes (Wetzel2001). Thereby, a difference between Zn and otherbioactive trace elements were observed to influence thezooplankton community structure differently. Most Pbwas also reported to be adsorbed to particle surfaces andthereby exhibited weak correlations as compared to Crand Zn in the present study. Wetzel (2001) reviewed theeffects of trace metals on plankton community and itwas important to note that the relative concentrations oftrace elements had a significant effect on the competi-tive abilities of the plankton.
4. CONCLUSION
The ECW is able to transform and trap a wide rangeof contaminants. The present study records the remark-able decrease in TSS (72 %), TDS (59 %) and chlorides
(55 %) between the wastewater source point (Site 2) andthe final discharge site (Site 4). DO profile increaseddramatically from 0.10 mg l-1 at Site 2 to 4.24 mg l-1 atSite 4. Site 1, the wastewater-fed fish pond, had normalDO level (6.01 mg l-1) for fish development, while Site4 and Site 5 attained DO values 4.24 and 4.53 mg l-1
respectively, the limit of the fish tolerance by naturalprocesses of stabilization. Decreases in BOD and CODvalues were 67 % and 60 % respectively. Such changesdefinitely indicate the cost-effective ameliorative role ofthe wetland ecosystem proving the excellent efficiencyof the natural stabilization of wastewater. At about 30km down the source point, we noticed a number of waterdependent avifauna around the study sites. From theseregions different oligosaprobic fauna like, dragonflies,their nyaads, bloodworms and aquatic beetles were alsofound. Plankters played a major role in the ameliorationprocesses through degradation of the suspended solids
Fig. 1. Hierarchical cluster analysis of the selected study sites depending on the limnochemical conditions.
Fig. 2. Hierarchical cluster analysis of the sites depending on the richness and abundance of zooplankton species in the study sites.

Zooplankton diversity in contaminated waters 105
and progressive utilization and transformation of thenutrients. Rotifers, both sessile and pelagic species,degraded TSS, releasing nutrient in one hand andincreasing light penetration on the other and therebyaugmented phytoplankton productivity and consequent-ly improved DO profile. Such series of changes areimportant in amelioration processes operating in thewastewater carrying canal (Koteswari & Ramanibai2004). Despite the presence of high nutrient load, differ-ent other chemical factors might have been responsibleto check the excess growth of autotrophs, leading toeutrophication. In addition to the remarkable ameliora-tive capacity of the ECW, treating about 1/3 of theKolkata city’s wastewater (estimated at 68 millionliters/day), agriculture and pisciculture in these regionsproduce 150 tons of fresh vegetables and 40 tons of fishdaily providing an employment opportunity of 2 personsper hectare. Tiny microbes and plankton are instrumen-tal in turning wastes into wealth, with the support of thestrong solar radiation, and a myriad of physico-chemicalinteractions and transformations.
ACKNOWLEDGEMENT
Authors thankfully acknowledge AICTE and UGC-MRP for financial supports. One of the authors (AR)also expresses gratitude to the UGC for Junior ResearchFellowship. Authors are also thankful to the Director ofTechnical Education and the Director of PublicInstructions, Govt. of West Bengal, India for coopera-tion and necessary infrastructural support.
REFERENCES
Ahlstorm, E.H. 1940. Revision of Rotatoria, Genus Brachionusand Platyias with descriptions of one new species and twonew varieties.
Arora, H.C. 1961. Rotifera as indicators of pollution, Bull.CPHERI Nagpur, 3&4: 24-26.
Battish, S.K. 1992. Freshwater Zooplankton of India, Oxfordand IBH publishing CO, Pvt, Ltd. Delhi.
Chandra, S. & G. Krishna. 1983, Effect of tannery waste dis-posal on the quality of the river Ganges in Kanpur. Poll.Res., 2: 63-64.
Chattopadhyay, B., R. Gupta, A. Chatterjee & S.K.Mukhopadhyay. 1999. Characterisation and ecotoxicity oftannery wastes envisaging environmental impact assess-ment, J.Amer.Leather Chem. Assoc., 94 (9): 337-346.
Chattopadhyay, B., S. Chatterjee & S.K Mukhopadhyay. 2004.Seasonality in Physico Chemical; Parameters of TanneryWastewater Passing Through The East Calcutta WetlandEcosystem. J. Soc. Leather Technol. Chem., 88: 27-36.
Das, N.K. & N.C. Datta. 2000. Seasonal variation in diversityindices of periphytic community of wastewater-fed pond,2000, Waste recycling and resource management in thedeveloping world, University of Kalyani and Internationalecological engineering society, Kalyani: 10-11.
Eaton, A.D., L.S. Clesceri, A.E. Greenberg. 1995. StandardMethods of the Examination of Water and Wastewater. 19th. Edn. APHA, Washington D.C.
Edmondson, W.T. Fresh water Biology (Ward & Whipple).1992. International Books & Periodicals Supply Service,2nd ed.
Forbes, V.E. 1999. Genetics and Ecotoxicology-Insight fromthe Interface. In: V.E. Forbes (Ed.), Genetics andEcotoxicology. Taylor & Francis, U.S.A: 1-8.
Koteswari, Y.N. & R. Ramanibai. 2004. Evaluation of toxicityof tannery effluent on plankton community structure: amultispecies microcosm study II. Turk J Biol., 28: 55-63.
Michael, P. 1984. Ecological methods for Field and LaboratoryInvestigation. Tata McGraw Hill Publication Ltd, NewDelhi.
Michael, R.G. 1968. Studies on the Zooplankton of a tropicalfishpond. Hydrobiol., 32: 47-68.
Mishra, S.R. & D.N. Saksena. 1992. Eds., Aquatic Ecology,Asish Publication House, Delhi: 231-273.
Mukhopadhyay, S.K., A. Chatterjee, R. Gupta & B.Chattopadhyay. 2000. Rotiferan community structure of atannery effluent stabilisation pond in east Calcutta wetlandecosystem. Chem. Env. Res., 9 (1 & 2): 85-91.
Patil, S.G. & D.K. Harshey. 1983. Impact of gelatine factoryeffluent on the water quality and biota of a stream nearJabbalpur, J. Environ. Biol., 7: 61-65.
Saksena, D.N. & N. Kulkarni. 1986. On the rotifer fauna of twosewage chanels of Gwalior. Limnologica (Berlin), 17: 139-148.
Sarma, S.S.S. 1996. Some relationships between size structureand fertility of rotifer populations. In: B.L. Kaul (Ed.),Advances in Fish Wildlife Ecology and Biology. DayaPublishing House, Delhi, 1: 37-50.
Jack1 Shannon Pielou’s Margalef’s Simpson’sEstimate Index Index Index Index
Cr – 0.87* – 0.50* 0.49* – 0.90* 0.11
Pb – 0.03 0.001 0.25 – 0.19 – 0.18
Cu 0.60* 0.46* – 0.38 0.64* – 0.11
Zn – 0.50* 0.31 0.53* – 0.52* – 0.42
Mn 0.59* 0.64* – 0.15 0.68* – 0.34
Mg 0.23 – 0.29 – 0.47* 0.13 0.39
Fe 0.58* – 0.46* – 0.84* 0.51* 0.66*
Tab. 7. Correlation coefficients (significant at P <0.05) between the diversityindices and metal content in the ambient environment (*marked correlationswere significant).

106 S.K. Mukhopadhyay et al.
Snell, S.W., M. Serra & M.J. Carmona. 1999. Toxicity and sex-ual reproduction in Rotifers: Reduced resting egg produc-tion and heterozygosity loss, In: V.E. Forbes (Ed.),Genetics and Ecotoxicology, Taylor & Francis, U.S.A., 169-185.
Sharma, B.K. 1979a. Rotifers of West Bengal III, Hydrobiol.,64: 239-250.
Sharma, B.K. 1979b. Rotifers of West Bengal IV, Hydrobiol.,65: 39-47.
Sharma, B.K. 1986. Assessment of pollution indicators inIndian rotifera, J. Meghalaya Sci. Soc., 9: 47-49.
Sharma, B.K. 1992. Systematics, distribution and ecology offresh water rotifer of West Bengal. In: S.R. Mishra and
D.N. Saksena (Eds), Aquatic Ecology, Asish PublishingHouse, Delhi: 231-237.
Sharma, D.C., P.C. Srivastava, B.N. Johri & P. Chandra. 1996.Environmental Impact of Tannery Effluents on HeavyMetal Phytotoxicity and Health Hazards. J. Indust. Poll.Cont., 12(2): 137-142.
van Groenestijn, J.W., E. Ravindranath & J.S.A. Langerwerf.1999. Sulphur recovery from tannery wastewater, Proc.XXV IULTCS Congress, Central Leather Research Institute,Madras: 428-433.
Wetzel, R.G. 2001. Limnology: Lake and River Ecosystems, 3rd
Ed. Academic Press, New York: 181-186.
Received: June 2007Accepted: December 2007
Copyright © 2022 FDOKUMEN