Treatment of groundwater contaminated with benzene, MTBE ...
116
Treatment of groundwater contaminated with benzene, MTBE and ammonium by constructed wetlands Dissertation der Mathematisch-Naturwissenschaftlichen Fakultät der Eberhard Karls Universität Tübingen zur Erlangung des Grades eines Doktors der Naturwissenschaften (Dr. rer. nat.) vorgelegt von Diplom-Chemikerin Eva Mareike Seeger aus Heidelberg Tübingen 2012
-
Upload
khangminh22 -
Category
Documents
-
view
3 -
download
0
Transcript of Treatment of groundwater contaminated with benzene, MTBE ...
Treatment of groundwater contaminatedwith benzene, MTBE and ammonium by
constructed wetlands
Dissertation
der Mathematisch-Naturwissenschaftlichen Fakultätder Eberhard Karls Universität Tübingen
zur Erlangung des Grades einesDoktors der Naturwissenschaften
(Dr. rer. nat.)
vorgelegt vonDiplom-Chemikerin Eva Mareike Seeger
aus Heidelberg
Tübingen2012

ii
Tag der mündlichen Qualifikation: tt.mm.jjjjDekan: Prof. Dr. Wolfgang RosenstielBerichterstatter: Prof. Dr. Peter GrathwohlBerichterstatter: Prof. Dr. Matthias Kästner

iii
Die vorliegende Arbeit wurde im Zeitraum von Mai 2007 bis September 2011 amHelmholtz-Zentrum für Umweltforschung-UFZ im Department Umweltbiotechnologieunter der Leitung von Herrn Prof. Dr. M. Kästner und Herrn Dr. P. Kuschk ange-fertigt. Die universitäre Betreuung von Seiten des Fachbereichs Geowissenschaftender mathematisch-naturwissenschaftlichen Fakultät der Eberhard Karls UniversitätTübingen erfolgte durch Herrn Prof. Dr. P. Grathwohl.

Abstract
Multi-component contamination of groundwater at industrial sites due to chemicalprocessing and transport causes a major hazard to the environment. Depending ontoxicity, persistence and mobility, chemicals impair the quality of groundwater and canhave adverse effect on ecosystems and human health, e.g. when polluted groundwaterdischarges into rivers / river floodplains, or if the groundwater is used as drinking watersource. Within the last decades several groundwater remediation techniques have beendeveloped, but oftentimes the commonly applied P&T methods are economically notfeasible. Constructed wetlands (CWs) are a promising near-natural alternative for acost-efficient remediation of groundwater.In the present thesis, different pilot-scale horizontal subsurface-flow CW types (gravelCWs with different filter composition and a hydroponic plant root mat) have beentested for their potential to remediate groundwater contaminated with benzene, thegasoline additive methyl tert-butyl ether (MTBE) and ammonium at a field site. Theperformance evaluation comprised (i) the determination of contaminant specific removalefficiency based on season-dependent concentration decline, (ii) the investigation of thefate of the volatile organic compounds in the different CW types during summer andwinter time based on a mass balance approach taking into account the main removalpathways volatilization, plant uptake and microbial degradation, and (iii) the hydrauliccharacterization of the CWs with regard to wetland type and operational mode.Overall, it could be shown that contaminant decline is greatly affected by the wetlandtype, with the hydroponic plant root mat achieving lower outflow concentrations thanthe planted gravel filter, and is season-dependent with highest concentration declineduring spring and summer at temperatures above 15°C, and contaminant-specificwith most efficient decline observed for benzene. In contrast, the filter composition(gravel matrix with or without filter additives charcoal or ferric oxide) did not enhancetreatment efficiency. The hydroponic plant root mat and the planted gravel CWefficiently improved the water quality as indicated by the achieved concentration declineduring summer of 99 ± 1 % and 81 ± 7 % for benzene, 82 ± 4 % and 17 ± 7 % forMTBE, and 41 ± 7 % and 54 ± 17 % for ammonium-N, respectively.
v
vi Abstract
The VOC mass balance confirmed the removal trends regarding seasonality, compound-and system-specificity, yet summer mass removal from the aqueous phase was elevatedcompared to the mere concentration decline, given that water loss via evapotranspirationwas considered (hydroponic plant root mat: benzene: 606 ± 51 mg d−1 m−2 = 99.9± 8.5 %; MTBE: 117 ± 9 mg d−1 m−2 = 96 ± 8 %; gravel CW: benzene: 480 ± 42mg d−1 m−2 = 96 ± 8 %; MTBE: 85 ± 13 mg d−1 m−2 = 75 ± 11 %). Moreover, massbalancing enabled to distinguish between elimination and distribution pathways: for thegravel CW and the hydroponic plant root mat, the main benzene flux during summerwas by microbial degradation (76.4%, 82.9%), with minor removal via plant uptakeand volatilization. In contrast, MTBE removal via microbial degradation was poorfor both treatment systems (gravel CW: 30.9%, hydroponic plant root mat: 13.2%).Furthermore, with regard to treatment reliability mass balancing pointed out thatthe application potential for the hydroponic plant root mat strongly depends on thecontaminant to be treated, given that emission was a minor removal pathway forbenzene in both CW types (<5%), but was considerably enhanced for MTBE in theplant root mat (23.6%).The hydraulic characterization of the CWs revealed lower dispersion indices (N = 11.3,Dn = 0.04, Pé = 23) and on that basis better hydraulic flow behavior for the plantedgravel CW in comparison to the resting (N = 5.3, Dn = 0.09, Pé = 11) and floating (N= 1.9, Dn = 0.26, Pé = 4) hydroponic plant root mat. So, the fact that the restingplant root mat showed highest removal efficiency although the flow behavior was lessoptimal evinced that good hydraulic flow behavior with low dispersion is not the onlydecisive factor for high contaminant removal, but high actual water-root contact, rootdensity and a sufficient residence time are also important.To conclude, both CW types represent a promising approach for the remediation ofVOC and ammonium contaminated groundwater during spring/summer time. However,VOC removal via volatilization should not be overlooked, especially for the hydroponicsystem.
Zusammenfassung
Die großflächige und zugleich heterogene Verunreinigung von Grundwasser an Industrie-standorten infolge der Verwendung und des Transports von Chemikalien stellt ein hohesGefährdungspotential für die Umwelt dar. In Abhängigkeit von Toxizität, Persistenzund Mobilität beeinträchtigen die Schadstoffe nicht nur die Grundwasserqualität. Auchandere Umweltgüter und die menschliche Gesundheit können betroffen sein, wennkontaminiertes Grundwasser beispielsweise in Oberflächengewässer infiltriert, z.B. inFlüsse oder Flussauen, oder das Grundwasser als Trinkwasserquelle dient. In den letztenJahren wurde eine Vielzahl von Reinigungsstrategien für kontaminiertes Grundwasserentwickelt, wobei sich die klassischen Pump & Treat - Methoden ökonomisch oft alsnicht tragbar erwiesen. Eine vielversprechende und zudem kostengünstige naturnaheAlternative stellt die Anwendung von Pflanzenkläranlagen, engl. constructed wetlands(CWs), dar.In der vorliegenden Dissertation wurden verschiedene horizontal unterhalb der Ober-fläche durchflossene CWs (bepflanzte Kiesfilter mit unterschiedlichen Filteradditivenund ein hydroponisches Versuchssystem, eine sogenannte hydroponische Wurzelmatte)im Pilotmaßstab und unter Feldbedingungen auf ihr Potential untersucht, mit Benzol,dem Benzinzusatzstoff Methyl tert-butyl Ether (MTBE) und Ammonium kontaminiertesGrundwasser zu reinigen. Die Leistungsbewertung umfasste folgende Schwerunkte: (i)die Bestimmung schadstoffspezifischer Reinigungsleistung basierend auf der erreichtenKonzentrationsverringerung, (ii) die Untersuchung der Verteilung der flüchtigen organ-ischen Schadstoffe (engl. volatile organic compounds, VOCs) im System Grundwasser-Boden-Pflanze-Atmosphäre basierend auf der Erstellung von Massenbilanzen, wobei dieProzesse Volatilisierung, Pflanzenaufnahme und mikrobieller Schadstoffabbau als dieHaupt-Eliminierungspfade berücksichtigt wurden, und (iii) die hydraulische Charakter-isierung der verschiedenen constructed wetlands, auch im Hinblick auf ihre Betriebsweise.Die Untersuchungen zeigten, dass die Verringerung der Schadstoffkonzentration sys-temabhängig und schadstoffspezifisch erfolgte. Die Wurzelmatte erzielte im Vergleichzum bepflanzten Kiesfilter eine deutlich höhere Reinigungsleistung und Benzol wurdeeffektiver eliminiert als die anderen Schadstoffe. Zudem unterlag die Reinigungseffizienz
vii
viii Zusammenfassung
saisonalen Schwankungen: Die stärkste Abnahme wurde während der Frühjahrs- undSommermonate verzeichnet bei Lufttemperaturen über 15°C. Keinen Einfluss auf dieReinigungsleistung hatte die unterschiedliche Zusammensetzung der Kiesfilter (Zusatzder Filteradditive Aktivkohle oder dreiwertiges Eisenoxid). Im Sommer wurden dieSchadstoffkonzentrationen durch die Behandlung via Wurzelmatte und bepflanztenKiesfilter effizient verringert: um 99 ± 1 % und 81 ± 7 % für Benzol, um 82 ± 4 %und 17 ± 7 % für MTBE, und um 41 ± 7 % und 54 ± 17 % für Ammonium-N.Anhand der VOC-Massenbilanzierung konnten die beschriebenen Trends hinsichtlichSaisonalität sowie Schadstoff- und System-Spezifität bestätigt werden, wobei die Elim-inierungseffizienz basierend auf Schadstofffrachten im Vergleich zur Konzentrationsver-ringerung höher ausfiel (Wurzelmatte: Benzol: 606 ± 51 mg d−1 m−2 = 99,9 ± 8,5 %;MTBE: 117 ± 9 mg d−1 m−2 = 96 ± 8 %; bepflanzter Kiesfilter: Benzol: 480 ± 42mg d−1 m−2 = 96 ± 8 %; MTBE: 85 ± 13 mg d−1 m−2 = 75 ± 11 %). Darüber hin-aus ermöglichte die Massenbilanzierung die Unterscheidung zwischen Transformations-und Umverteilungsprozessen. Die Berechnungen ergaben, dass Benzol im bepflanztenKiesfilter und in der hydroponischen Wurzelmatte hauptsächlich via mikrobiellen Schad-stoffabbau entfernt wurde (76,4% bzw. 82,9%), während pflanzliche Aufnahme undEmission eine untergeordnete Rolle spielten. Im Vergleich dazu fiel für MTBE derAnteil des mikrobiellen Abbaus an der Gesamteliminierung gering aus (bepflanzterKiesfilter: 30,9%; Wurzelmatte: 13,2%). Die Emissionsmessungen unterstrichen zudem,dass das Anwendungspotential des hydroponischen Systems stark von dem zu behan-delnden Schadstoff abhängt. Denn während die Emission von Benzol in beiden CWSystemen nur einen geringen Anteil an der Gesamteliminierung ausmachte (<5%), trugdie Emission von MTBE in der Wurzelmatte entscheidend zur Gesamteliminierung bei(23,6%).Die Erfassung der hydraulischen Charakteristika der CWs zeigte für den bepflanztenKiesfilter eine geringere Tendenz zur Dispersion (N = 11,3; Dn = 0,04; Pé = 23)und somit ein besseres hydraulisches Fließverhalten im Vergleich zum hydroponischenSystem - unabhängig davon, ob dieses als auf dem Beckenboden aufsitzende (N = 5,3;Dn = 0,09; Pé = 11) oder als schwimmende (N = 1,9; Dn = 0,26; Pé = 4) Wurzelmattebetrieben wurde. Die Tatsache, dass das unter hydraulischen Gesichtspunkten wenigereffiziente hydroponische System (die auf dem Beckenboden aufsitzende Wurzelmatte)die beste Reinigungsleistung erzielte, verdeutlicht, dass für eine hohe Schadstoffeli-minierungseffizienz eine gutes hydraulisches Fließverhalten nicht allein entscheidendist. Faktoren wie ein guter Kontakt zwischen den Schadstoffen im Wasser und denPflanzenwurzeln, aber auch die Wurzeldichte sowie eine genügend lange Verweilzeit

Zusammenfassung ix
spielen hier eine wichtige Rolle.Abschließend lässt sich sagen, dass während der Vegetationszeit im Frühling und Som-mer beide Arten von constructed wetlands eine vielversprechende Methode darstellenfür die Reinigung von mit VOCs und Ammonium belastetem Grundwasser. Dabeisollte insbesondere für das hydroponische System der Eliminierungspfad Volatilisierungnicht außer Acht gelassen werden.

List of abbreviations and notations
Abbreviations
AC Activated carbonBOD5 Five-day biochemical oxygen demandBTC Breakthrough curveBTEX Group of the aromatic compounds:
benzene, toluene, ethylbenzene, xylenesCOD Chemical oxygen demandCoTra Compartment TransferCSTR Continuously stirred tank reactorCW Constructed wetlandDAC Dynamic air chamberDVGW German guidelines for drinking water qualityE EvaporationEh Redox potentialEPA Environmental Protection AgencyET EvapotranspirationFWS Free water surfaceHF Horizontal flowHSSF Horizontal subsurface flowIARC International Agency for Research on CancerIC Inorganic carbonMCB MonochlorobenzeneMPN Most probable numberMTBE Methyl tert-butyl etherNA Natural attenuationNPL National Priority ListÖGP German: Ökologisches Großprojekt;
English: large-scale ecological project
xi
xii List of abbreviations and notations
P&T Pump-and-treatPAH Polycyclic aromatic hydrocarbonPCE PerchloroethylenePF Plug flowPFR Plug-flow reactorPHCs Petroleum hydrocarbonsRTD Residence time distributionSSF Subsurface flowT TranspirationTBA tert-butyl alcoholTCA 1,1,1-trichloroethaneTCE TrichloroethyleneTEA Terminal electron acceptorTN Total nitrogenTOC Total organic carbonTSCF Transpiration stream concentration factorUSGS United States Geological SurveyUV UltravioletVF Vertical flowVOC Volatile organic compoundWHO World Health Organization
Notations
The abbreviations shown in brackets represent the dimensionality of the variable beingused: M = mass; L = length; L3 = volume, t = time.
A Surface area of the wetland [L2]Ain Area perpendicular to the flow direction [L2]Asurf Surface area [L2]ACLin/out Areal contaminant load for the inflow or outflow [M L−2 t−1]c′(Φ) Normalized concentration [-]cA Contaminant concentration in the atmospherecCW,average Average contaminant concentration in the water compartment
of the CW [M L−3]cin/out Contaminant concentration at the inflow or outflow [M L−3]
List of abbreviations and notations xiii
ctracer Fluorescein concentration of the tracer solution [M L3]cW Contaminant concentration in the water phase [M L3]cx,y Contaminant concentration at the sampling position (x,y) [M L3]D Dispersion coefficient [L2 t−1]Dn Dispersion number [-]E Evaporation [L3 L−2 t−1]ET Evapotranspiration [L3 L−2 t−1]fOC Organic carbon content [%]h Water table [L]H Henry coefficient [Pa m3 mol−1]KAW Henry constant, air-water partition coefficient [-]Kd Solid water distribution coefficient [L3 M−1]kf Hydraulic conductivity [L t−1]KOC Soil organic-carbon partition coefficient [L3 M−1]KOW Octanol-water partition coefficient [-]L Solubility [M L−3]L Length of the wetland [L]Lm Contaminant loss via microbial degradation [M L−2 t−1]Lp Contaminant loss via plant uptake [M L−2 t−1]Lphoto Contaminant loss via photolysis [M L−2 t−1]Ls Contaminant loss via sorption on filter material [M L−2 t−1]Lv Contaminant loss via volatilization [M L−2 t−1]Lv,phyto Contaminant loss via phytovolatilization [M L−2 t−1]Lv,surface Contaminant loss via surface volatilization [M L−2 t−1]LD50 Lethal dose, 50% [-]mair,in/out Contaminant mass detected on the adsorption tubes positioned
in the inlet and outlet wind flux of the DACs [M]Min Total mass of tracer applied [M]Mout Total tracer mass recovered [M]n Gravel porosity [-]N Number of continuously stirred tank reactors [-]nHRT Theoretical hydraulic retention time [t]P é Péclet number [-]pi Vapor pressure of the component iPr Pumping rate [L3 t−1]
xiv List of abbreviations and notations
Q Flow rate [L3 t−1]QA Flow through the cross section A [L3 t−1]qet Evapotranspiration rate per surface area [L3 t−1 or L t−1]qin Inflow specific discharge [L t−1]Qin Mean inflow rate [L3 t−1]Qmean Mean flux [L3 t−1]Qout Mean outflow rate [L3 t−1]Q∆(t),in/out Average inflow or outflow water volume between two consecutive
concentration samplings at time ti and ti+1 [L3 t−1]R Gas constant [J K−1 mol−1]R Tracer recovery rate [%]RD Retardation factor [-]RW Contaminant removal efficiency for the water phase [%]S Conductivity [mS L−1]t1/2 Half-life [t]tbreak Tracer breakthrough time [t]ts Initial tracer detection [t]T Temperature [K; °C]T Transpired water volume [L3 L−2 t−1]Tair Air temperature [K; °C]v Flow velocity [L t−1]Vin Water influx [L3 L−2 t−1]Vout Water outflux [L3 L−2 t−1]Vout(t) Outflow volume accumulated for the time t [L3 t−1]vp Vapor pressure [Pa]Vprecepitation resp. Vrain: precipitation flux [L3 L−2 t−1]Vs Sample volume [L3]Vsys Estimated pore volume [L3]vx,y Flow velocity at the sampling position (x,y) [L t−1]w Width of the wetland [L]x Flow distance [L]
Greek symbols
αL Longitudinal dispersivity [L]δ13C Carbon stable isotope ratio [‰]
List of abbreviations and notations xv
∆m Overall contaminant loss in the water phase [M]∆t Time interval [t]Φ Dimensionless flow-weighted time [-]θ Porosity [-]ρ Density of the gravel/soil matrix [M L−3]σ2 Variance [t2]σ2Θ Dimensionless variance [-]τ Mean residence time [t]τcorr Mean residence time corrected for sorption processes [t]τfit Mean residence time of the analytical fit of the RTD [t]

Contents
1 Introduction 11.1 Chemically Contaminated Groundwater . . . . . . . . . . . . . . . . . . 1
1.1.1 Sources, Pollutants, and Risks . . . . . . . . . . . . . . . . . . . 11.1.2 Groundwater Treatment Options . . . . . . . . . . . . . . . . . 2
1.2 Constructed Wetlands: Principles . . . . . . . . . . . . . . . . . . . . . 31.2.1 Microbial degradation . . . . . . . . . . . . . . . . . . . . . . . 41.2.2 Sorption . . . . . . . . . . . . . . . . . . . . . . . . . . . . . . . 61.2.3 Volatilization . . . . . . . . . . . . . . . . . . . . . . . . . . . . 61.2.4 Plant uptake . . . . . . . . . . . . . . . . . . . . . . . . . . . . 71.2.5 Wetland Design . . . . . . . . . . . . . . . . . . . . . . . . . . . 81.2.6 The role of the wetland filter . . . . . . . . . . . . . . . . . . . . 9
1.3 Industrial site “Leuna” . . . . . . . . . . . . . . . . . . . . . . . . . . . 101.4 Main groundwater pollutants at the CoTra plant . . . . . . . . . . . . . 12
1.4.1 Benzene . . . . . . . . . . . . . . . . . . . . . . . . . . . . . . . 121.4.2 Methyl tert-butyl ether . . . . . . . . . . . . . . . . . . . . . . . 151.4.3 Ammonium . . . . . . . . . . . . . . . . . . . . . . . . . . . . . 17
1.5 Current state of research and gaps in wetland phytoremediation ofbenzene, MTBE and ammonium . . . . . . . . . . . . . . . . . . . . . . 18
1.6 Aims and outline of the thesis . . . . . . . . . . . . . . . . . . . . . . . 20
2 Paper I - Bioremediation of benzene-, MTBE- and ammonium-contaminated ground-water with pilot-scale constructed wetlands 23
3 Paper II - Performance evaluation using a three compartment mass balance for theremoval of volatile organic compounds in pilot scale constructed wetlands 31
4 Paper III - Performance evaluation of different horizontal subsurface flow wetlandtypes by characterization of flow behavior, mass removal and depth-dependentcontaminant load 39
xvii
xviii Contents
5 Summary, conclusion, and future perspectives 515.1 Summary of the results and concluding remarks . . . . . . . . . . . . . 515.2 Outlook and perspective for future research . . . . . . . . . . . . . . . 57
6 Bibliography 59
Acknowledgments 81
Appendix IA.1 Supporting Information EST-paper . . . . . . . . . . . . . . . . . . . . IA.2 Supporting Information WR-paper . . . . . . . . . . . . . . . . . . . . VI
Selbständigkeitserklärung IX
Curriculum Vitae XI
Peer-review Articles XV
1 Introduction
1.1 Chemically Contaminated Groundwater
1.1.1 Sources, Pollutants, and Risks
Spills of chemicals during processing or transport, improper waste management, indus-trial and agricultural run-off water, as well as leaking underground storage tanks havecaused manifold and often multi-component contamination of surface and subsurfacesoils and waters (EEA, 2000). Volatile organic compounds (VOCs), both chlorinatedand non-chlorinated aromatic and aliphatic ones, account for the most frequently de-tected contaminants, given that they are produced in large volumes and are widelyused for industrial purposes (USGS, 2006; ATSDR, 2011). Prominent applicationsof VOCs are the use as solvents (benzene, dichloromethane), degreasing agents inmetal industries (benzene, perchloroethene) or precursors (chlorobenzenes) for theproduction of pesticides, pharmaceuticals and dyes (WHO, 2003b, 2004b,a). As part ofthe National Water-Quality Assessment Program of the US Geological Survey (USGS)(1985 - 2002), water samples from groundwater and drinking water wells from all overthe USA, including 98 aquifers and 3500 wells, have been analyzed for 60 VOCs (USGS,2006). In this context, it was found that chloroform, the solvents perchloroetheneand trichloroethene, and the gasoline oxygenate methyl tert-butyl ether (MTBE) werethe most ubiquities VOCs in both rural and urban areas. Explicitly, for 12% of thewells VOCs were detected at concentrations of potential concern exceeding the USEPA maximum contaminant levels (Squillace et al., 1999, 2002). Although VOCs, oncereleased into the environment, are subject to volatilization, they may also leach fromsurface waters and soils into groundwater. Under the prevailing anaerobic conditionsin most aquifers, many pollutants are recalcitrant. Depending on their toxicity andpersistence they therefore impair the quality of groundwater and can cause adverseeffects on ecosystems and human health, if used e.g. as drinking water. The US EPAcurrently lists about 1300 contaminated sites on the National Priority List (NPL)(EPA, 2012); the number of potentially contaminated sites in Germany and Europe
1
2 1 Introduction
varies depending on the literature source (Germany: 240.000 (EEA, 2000) - 288.000(LABO, 2011); Europe: 750.000 (CARACAS, 1998) - 1.400.000 (EEA, 2000)). Eventhough only about 10-15% of the suspected sites in Germany may actually requireremediation (Frauenstein, 2009), these facts point out that contamination of soil andwater is a worldwide problem. As a consequence, risk mitigation as well as the timelyand cost–effective remediation of contaminated soil and groundwater is of politicalconcern.
1.1.2 Groundwater Treatment Options
Groundwater remediation can be realized by a multitude of strategies either in situ orex situ (Farhadian et al., 2008b). A general classification of the available treatmentoptions is derived from the underlying treatment principle, thus one is distinguishingbetween physical (e.g. air stripping, adsorption on activated carbon (AC) or zeolites,extraction, electro-kinetic separation), chemical (e.g. oxidation with ozone or hydrogenperoxide, reduction at reactive walls of zero-valent iron, immobilization, combustion, UVradiation, heterogeneous catalysis) and biological (e.g. biostimulation, bioaugmentation)methods.Commonly, the remediation of groundwater is accomplished by so-called pump-and-treat(P&T) technologies in which groundwater is pumped from the subsurface to ex situremediation facilities and - after being cleaned to certain concentration limits - is eitherre-injected into the aquifer or infiltrated into surface waters. The appropriate treatmenttechnique is predetermined by the physico-chemical characteristics of the respectivecontaminant(s), such as volatility, sorption tendency, or potential for biodegradation.For example, the stripping technique is best applicable for pollutants with a vapourpressure of >70 Pa and a Henry coefficient of >70 Pa m3 mol−1 (Bracke and Klüm-pen, 2005). Although P&T technologies effectively reduce pollutant concentrationand control plume migration they are technically extensive and costly since they re-quire (i) steady energy input for the continuous pumping of water as well as for thetreatment facilities and (ii) constant maintenance work. For sites characterized bylow pollutant concentrations, P&T remediation measures may not be technically andeconomically feasible within a reasonable timeframe (Travis and Doty, 1990), in partic-ular for strongly sorbing compounds e.g. polycyclic aromatic hydrocarbons (PAHs).Applying in situ methods such as funnel and gate technologies or reactive barriersinstead avoids complex pumping, but still involves enormous technical effort and sitedisturbance. Therefore, there is an increased interest in moving away from traditional
1.2 Constructed Wetlands: Principles 3
remediation approaches towards innovative low-tech in situ bioremediation technologies(Collins et al., 2002), which take advantage of the natural potential of microorganismsfor remediating contaminated waters. Prerequisites for the successful application ofnatural attenuation (NA) are: (i) reasonable biodegradability of the pollutants, (ii)availability of microorganisms capable to metabolize the present pollutants, and (iii)convenient geochemical conditions (e.g. electron donors/acceptors, redox potential (Eh),temperature (T), nutrients) for microbial degradation. One prominent example of apassive in situ bioremediation strategy is represented by the constructed wetland (CW)approach, a phytoremediation technique which combines the remediation potential ofboth microorganisms and plants (Wissing and Hofmann, 2002). Phytoremediation canbe used for the treatment of shallow groundwater and surface waters as well as soils andsediments. Overall, phytoremediation is minimally invasive and entails substantiallyreduced costs compared with conventional P&T clean-up technologies (EPA, 1998c;van Epps, 2006). Furthermore, it is potentially applicable to a variety of pollutants,including petroleum hydrocarbons, chlorinated solvents, metals, nutrients, and PAHs(e.g. Pivetz, 2001; Collins et al., 2002; Kadlec and Wallace, 2008; Imfeld et al., 2009).
1.2 Constructed Wetlands: PrinciplesConstructed wetlands are composed of aquatic or marsh plants, e.g. common reed(Phragmites australis), cattail (Typha spp.) or soft rush (Juncus spp.), growing ongravel or sediment or in hydroponic solution, but always in waterlogged environmentsand hence reducing conditions. The macrophytes are adapted to the oxygen deficiencyin the root zone by the development of a tubular plant tissue, the aerenchyma, whichworks as a gas-transport system. Oxygen, either plant-produced or atmospheric, istransported into the rhizosphere, enabling root respiration and also forming oxidativeprotection layers against phytotoxins (e.g. soluble heavy metals, hydrogen sulfide)(Stottmeister et al., 2003). Overall oxygen transfer rates have been found to cover abroad range of 0.02 - 12 g O2 m
−2 d−1 for common wetland plants, e.g. common reed,cattail, pondweed, or sea grass (e.g. Armstrong et al., 1990; Brix, 1990; Wu et al., 2001;Tyroller et al., 2010; Lai et al., 2012).The bioremediation potential of wetlands basically results from the plant associated mi-croorganisms, both rhizospheric and endophytic, which are able to metabolize hazardoussubstances, using them directly as carbon or energy source to support growth or assecondary substrates in co-metabolic pathways (Kadlec and Wallace, 2008). The plants
4 1 Introduction
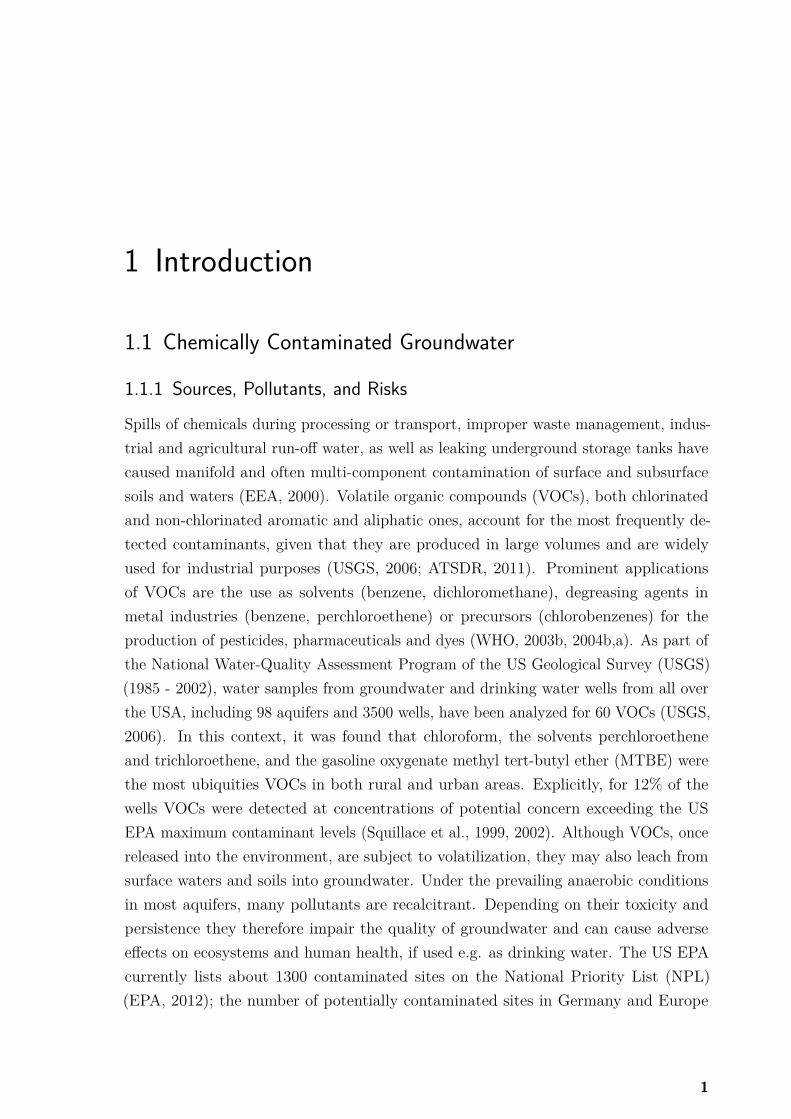
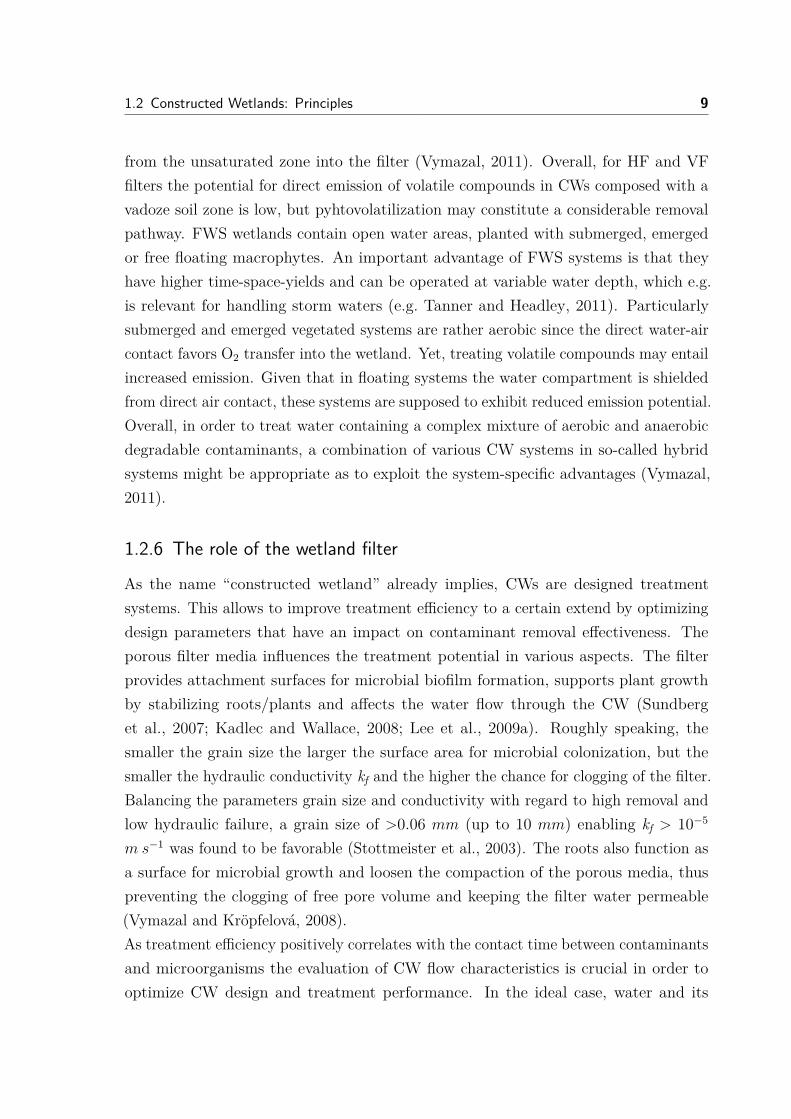
influence microbial degradation by providing suitable conditions for the microorganismsand even foster microbial turnover processes in the rhizosphere by emitting root exudates(mostly short chain organic acids, sugars, amino acids, and vitamins), which stimulatethe growth of the microbial population, the community diversity and also the enzymaticactivity (Pivetz, 2001; Stottmeister et al., 2003). The plant-mediated release of oxygencreates microsites with steep oxygen/Eh gradients at the root surfaces. Given thatplant activity changes during the course of the day (Armstrong and Armstrong, 1990),the geochemical conditions in the CW filter also vary on a diurnal scale (Wießner et al.,2005). Consequently, a broad consortium of aerobic and anaerobic microorganisms canexist in adjacent niches, enabling complex contaminant degradation pathways. Thisstimulation of microbial growth, activity and diversity is referred to as the rhizosphericeffect (Williams, 2002).During the transport of the contaminated water through the CW filter, the fate of thepollutants is governed by a number of competing processes: microbial degradation inthe rhizosphere, sorption onto the filter matrix, surface volatilization, and plant uptakewith subsequent phyto-degradation, extraction and/or -volatilization (Pivetz, 2001;Pilon-Smits, 2005) (see Figure 1.1). Microbial degradation in the rhizosphere and inplanta alone leads to effective mass elimination, the other abiotic pathways - althoughpotentially contributing to a decrease of aqueous contaminant concentration - merelypromote the transfer of contaminants from the water phase into adjacent compartments(soil, plants or atmosphere). Overall, the evaluation of CW treatment performancewith respect to microbial contaminant turnover, as well as the contribution of abioticprocesses to actual load removal is essential for the implementation of CWs as a reliableclean-up technology. In the following each process is discussed briefly, including itsdetermining factors and relevance in CW systems.
1.2.1 Microbial degradation
Microbial degradation of pollutants requires the availability of terminal electron accep-tors (TEA; e.g. O2, NO−3 , Mn(IV), Fe(III), SO2−
4 , CO2) or electron donors (organiccompounds, e.g. short chain organic acids, organic pollutants) - depending on the con-taminant degradation mechanism (reductive or oxidative) - in addition to the presenceof microorganisms capable of metabolizing the respective chemical at the ambient condi-tions (Farhadian et al., 2008b). From an energetic point of view, microbial oxidation ismost effective when oxygen is used as TEA. However, the amount of oxygen transferredinto the rhizosphere is often limited, since the oxygen diffusion from the atmosphere
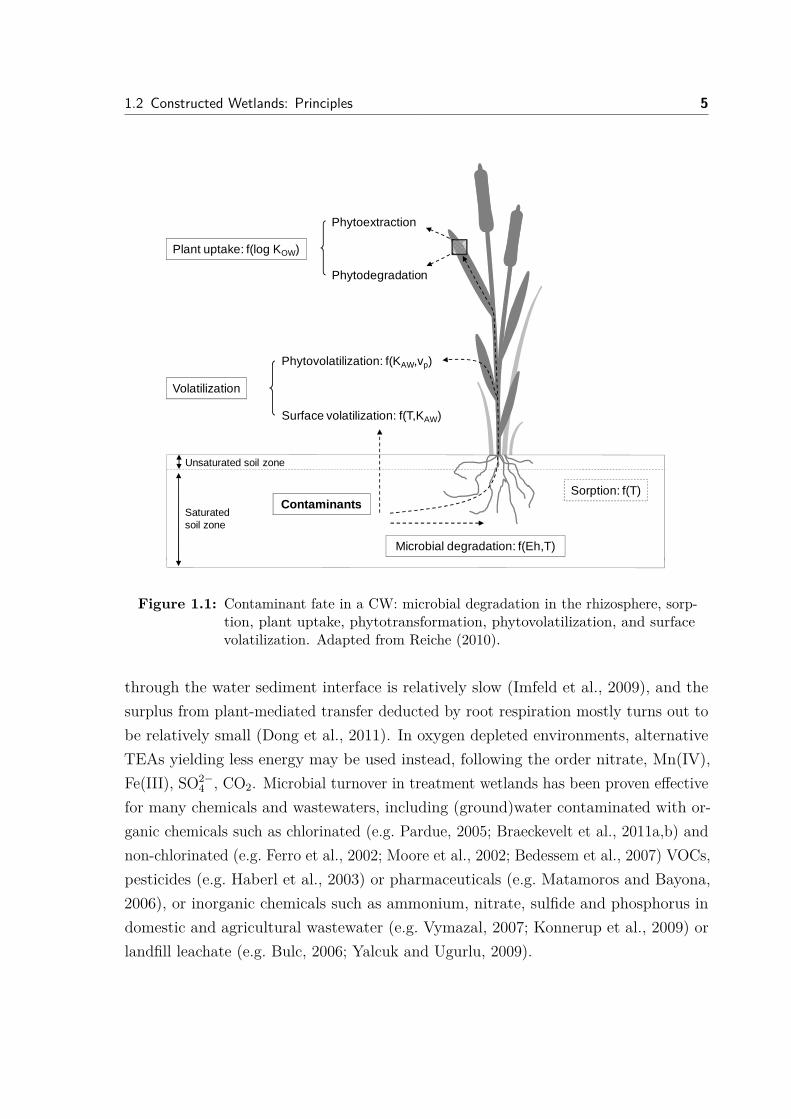
1.2 Constructed Wetlands: Principles 5
Plant uptake: f(log KOW)
Phytoextraction
Phytodegradation
Unsaturated soil zone
Saturated soil zone
ContaminantsSorption: f(T)
Microbial degradation: f(Eh,T)
Volatilization
Surface volatilization: f(T,KAW)
Phytovolatilization: f(KAW,vp)
Figure 1.1: Contaminant fate in a CW: microbial degradation in the rhizosphere, sorp-tion, plant uptake, phytotransformation, phytovolatilization, and surfacevolatilization. Adapted from Reiche (2010).
through the water sediment interface is relatively slow (Imfeld et al., 2009), and thesurplus from plant-mediated transfer deducted by root respiration mostly turns out tobe relatively small (Dong et al., 2011). In oxygen depleted environments, alternativeTEAs yielding less energy may be used instead, following the order nitrate, Mn(IV),Fe(III), SO2−
4 , CO2. Microbial turnover in treatment wetlands has been proven effectivefor many chemicals and wastewaters, including (ground)water contaminated with or-ganic chemicals such as chlorinated (e.g. Pardue, 2005; Braeckevelt et al., 2011a,b) andnon-chlorinated (e.g. Ferro et al., 2002; Moore et al., 2002; Bedessem et al., 2007) VOCs,pesticides (e.g. Haberl et al., 2003) or pharmaceuticals (e.g. Matamoros and Bayona,2006), or inorganic chemicals such as ammonium, nitrate, sulfide and phosphorus indomestic and agricultural wastewater (e.g. Vymazal, 2007; Konnerup et al., 2009) orlandfill leachate (e.g. Bulc, 2006; Yalcuk and Ugurlu, 2009).
6 1 Introduction
1.2.2 Sorption
For CWs in the early stage of operation, sorption may constitute a significant con-taminant sink, considering the sorption capacity of the previously unexposed filtermaterial. Once sorption-desorption has reached equilibrium and system disturbance bye.g. temperature fluctuations remain small, sorption processes only retard contaminantflow and lower effective contaminant availability (Imfeld et al., 2009), thus indirectlyaffecting biodegradation rates, but net-loss can be assumed to be negligible. The amountof adsorbed contaminant primarily depends on the soil organic-carbon partition coeffi-cient KOC of the contaminant, which can be roughly estimated from the octanol-waterpartition coefficient KOW, e.g. according to the approximation by Karickhoff Karickhoff(1981) (KOC = 0.411 * KOW), as well as the organic carbon content of the filter matrixfOC. High sorption tendency has been shown for lipophilic compounds, such as PAHs(e.g. Nam et al., 1998; Achten et al., 2011) or chlorinated hydrocarbons (chlorinatedbenzenes: e.g. Pardue et al. (1993); Lee et al. (2003, 2009b); chlorinated ethenes: e.g.Kassenga et al. (2003)). Nevertheless, many studies provided evidence that adsorbedand even aged contaminants are still bioavailable and can therefore be biodegraded,albeit at reduced rates (e.g. Lee et al., 2003, 2009b; Haritash and Kaushik, 2009). Theimmobilization of contaminants in the sediment or within the wetland plants followingroot uptake may account for a considerable mass reduction in the aqueous phase andrepresent a desired remediation process in particular for persistent substances, such asPAHs (e.g. Fountoulakis et al., 2009) or heavy metals (Cu, Cr, and Ni) (e.g. Liu et al.,2010), but immobilization entails the necessity for post-treatment of sediment and/orplants.
1.2.3 Volatilization
The tendency for direct volatilization at the air-water interface can be predicted fromthe compound specific Henry’s Law coefficient H (H = pi / cW, Pa m3 mol−1) or thedimensionless Henry constant KAW (KAW = cA / cW = H / RT ), both describingthe contaminant distribution between water and air under equilibrium conditions fornon-dissociated volatile compounds (Kadlec and Wallace, 2008). The actual distributiondepends on many factors such as T, pH, salinity, or co-solutes/solvents (Staudingerand Roberts, 2001; Schwarzenbach et al., 2003). For highly water soluble compoundseffective water-air transfer might as well result from phytovolatilization rather thanfrom surface emission only. Hence, in order to estimate the volatilization potential of aspecific compound, both the Henry coefficient and the water solubility in conjunction
1.2 Constructed Wetlands: Principles 7
with the water volume transpired by the plants have to be taken into account. Insubsurface-flow CW systems soil-borne emission may be restrained by the relatively slowdiffusive gas transport through the unsaturated zone to the surrounding atmosphere(Imfeld et al., 2009). Total volatilization (including surface- and phyto-volatilization)in plant-mediated remediation systems was shown to be a relevant removal processfor many VOCs, such as benzene, toluene, ethyl-benzene, o/m-xylenes (BTEX) (e.g.Burken and Schnoor, 1998), MTBE (e.g. Hong et al., 2001), gas-condensate C5-C12
hydrocarbons (e.g. Moore et al., 2002), MCB (e.g. Braeckevelt et al., 2011a), and TCE(e.g. Ma and Burken, 2003). In case atmospheric half-lives are reasonably short andhazardous effects towards environmental goods and humans can be assumed to benegligible, volatilization represents a desired removal pathway.
1.2.4 Plant uptake
The plant uptake of organic contaminants can be estimated according to the transpi-ration stream concept. Plants actively take up water and nutrients via the roots inorder to sustain their metabolism; this concomitantly involves the transfer of dissolvedcontaminants into the plants (Pivetz, 2001). The transpiration stream concentrationfactor (TSCF) indicates the effectiveness of contaminant translocation and in principlerefers to the contaminant concentration as the fraction in the xylem of the plant (thetranspiration stream) and the root-external solution (Briggs et al., 1982; Shone andWood, 1972). The TSCF can also be approximated from the KOW, either as a Gaussian(Briggs et al., 1982) or sigmoidal relationship (Dettenmaier et al., 2009), of whichthe latter was found to give a better fit in particular for highly water soluble, lowlog KOW compounds such as MTBE, TBA, or sulfolane (Dettenmaier et al., 2009).It is accepted that uptake is most effective for contaminants with intermediate logKOW values in the range of 0.5 and 3 (Trapp and Karlson, 2001; Stottmeister et al.,2003); compounds with higher or lower log KOW will be rather retained in or excludedfrom passing biomembranes (Pilon-Smits, 2005). Notably, the uptake of inorganiccompounds represents a biological rather than a physical process and occurs by thehelp of membrane transporter proteins (Pilon-Smits, 2005). Plant uptake has beeninvestigated for different plant species and pollutants, amongst others for BTEX inCanna (e.g. Boonsaner et al., 2011) and poplar (e.g. Burken and Schnoor, 1998), MTBEin poplar (e.g. Hong et al., 2001), phenanthrene and chlorobenzene in willow andbulrush (e.g. Gomez-Hermosillo et al., 2006), ammonium in bulrush (e.g. Kadlec et al.,2005), and metals such as Cd, Cr, Cu, Ni, Pb, and Zn in reed and wheat (e.g. Tani and
8 1 Introduction
Barrington, 2005; Du Laing et al., 2009; Liu et al., 2010). Once taken up, pollutants aresubject to (i) phytoaccumulation, (ii) enzymatic or bacterial phytodegradation, and/or(iii) phytovolatilization. Phytovolatilization turned out to be relevant at high vaporpressure vp (> 1.01 k Pa; Burken and Schnoor (1998)) and high KAW (� 10−5; Trappand Karlson (2001)). In comparison to microbial degradation contaminant plant uptakeis considered to be of minor importance (Kadlec and Wallace, 2008).
1.2.5 Wetland Design
From a technological point, CWs can be classified by many aspects, such as the flowregime (vertical flow (VF), horizontal flow (HF)), the mode of operation (e.g. surface orsubsurface flow, up or down flow direction, continuous or discontinuous charging), andthe plant growth (submerged, emerged and free floating) (Vymazal, 2007; Vymazal andKröpfelová, 2008). Widely-used in real-scale application are VF systems, mostly withsubsurface feeding, horizontal subsurface flow (HSSF) wetlands and free water surface(FWS) wetlands (Kadlec and Wallace, 2008). The crucial factors in the decision processfor choosing the right CW for a wastewater are the systems-specific oxygen transferrate and the emission potential to such a degree as the amount of oxygen should behigh or low enough to allow oxidative or reductive contaminant degradation and theemission potential should be low to prevent pollution of ambient air. Aspects such asenergy and areal demand come second. System characteristics and application potentialare briefly discussed hereafter.VF filters are mostly operated in a discontinuous mode. As the water percolates throughthe filter air refills the void pore space, resulting in increased oxygen input (30 - 90 g O2
m−2 d−1; Tyroller et al. (2010)). Therefore, VF CWs show great potential for aerobicdegradation, e.g. nitrification of ammonium (Langergraber et al., 2009), but provideless suitable conditions for anaerobic processes, e.g. denitrification to N2 (Kadlec andWallace, 2008). In general, it has to be kept in mind that VF filters use less space,but require higher energy input for the water pumping than HF filters. HSSF CWsare oxygen limited due to the permanent saturation of the filter, and the oxygen inputis rather low (0.3 - 12 g O2 m
−2 d−1; e.g. Armstrong et al. (1990); Tyroller et al.(2010)). However, for treating aerobic and anaerobic degradable contaminants in thesame wetland HSSF CWs may be advantageous, since they constitute both aerobic andanaerobic filter zones (Faulwetter et al., 2009). A possibility to increase the oxygeninput in HF wetlands is given by modifying the flow regime from continuous feed withstable water level to a tidal flow system, since draining promotes the transport of air
1.2 Constructed Wetlands: Principles 9
from the unsaturated zone into the filter (Vymazal, 2011). Overall, for HF and VFfilters the potential for direct emission of volatile compounds in CWs composed with avadoze soil zone is low, but pyhtovolatilization may constitute a considerable removalpathway. FWS wetlands contain open water areas, planted with submerged, emergedor free floating macrophytes. An important advantage of FWS systems is that theyhave higher time-space-yields and can be operated at variable water depth, which e.g.is relevant for handling storm waters (e.g. Tanner and Headley, 2011). Particularlysubmerged and emerged vegetated systems are rather aerobic since the direct water-aircontact favors O2 transfer into the wetland. Yet, treating volatile compounds may entailincreased emission. Given that in floating systems the water compartment is shieldedfrom direct air contact, these systems are supposed to exhibit reduced emission potential.Overall, in order to treat water containing a complex mixture of aerobic and anaerobicdegradable contaminants, a combination of various CW systems in so-called hybridsystems might be appropriate as to exploit the system-specific advantages (Vymazal,2011).
1.2.6 The role of the wetland filter
As the name “constructed wetland” already implies, CWs are designed treatmentsystems. This allows to improve treatment efficiency to a certain extend by optimizingdesign parameters that have an impact on contaminant removal effectiveness. Theporous filter media influences the treatment potential in various aspects. The filterprovides attachment surfaces for microbial biofilm formation, supports plant growthby stabilizing roots/plants and affects the water flow through the CW (Sundberget al., 2007; Kadlec and Wallace, 2008; Lee et al., 2009a). Roughly speaking, thesmaller the grain size the larger the surface area for microbial colonization, but thesmaller the hydraulic conductivity kf and the higher the chance for clogging of the filter.Balancing the parameters grain size and conductivity with regard to high removal andlow hydraulic failure, a grain size of >0.06 mm (up to 10 mm) enabling kf > 10−5
m s−1 was found to be favorable (Stottmeister et al., 2003). The roots also function asa surface for microbial growth and loosen the compaction of the porous media, thuspreventing the clogging of free pore volume and keeping the filter water permeable(Vymazal and Kröpfelová, 2008).As treatment efficiency positively correlates with the contact time between contaminantsand microorganisms the evaluation of CW flow characteristics is crucial in order tooptimize CW design and treatment performance. In the ideal case, water and its
10 1 Introduction
constituents would flow through the filter according to plug flow conditions uniformlyutilizing the entire filter volume (Holland et al., 2004). However, in reality, localflow velocities and actual filter residence time are influenced by water loss due toevapotranspiration, the occurrence of different flow paths due to short circuits as wellas dead zones and sorption processes. The outcome of this is a distribution of residencetimes (Werner and Kadlec, 2000). To what extent actual flow deviates from ideal flowand whether or not short circuits and dead zones exist can be assessed by conductingtracer experiments and evaluating the actual residence time distribution by means ofthe temporal moment concept (e.g. Werner and Kadlec, 1996; Yu et al., 1999; Luo et al.,2006), a statistical approach commonly used to gain information on solute transportmechanisms in soils (e.g. Cirpka and Kitanidis, 2000). For information on how to applythe temporal moment approach in tracer test analysis and what can be concludedfrom the temporal moments with respect to wetland specific transport parameters seechapter 4.
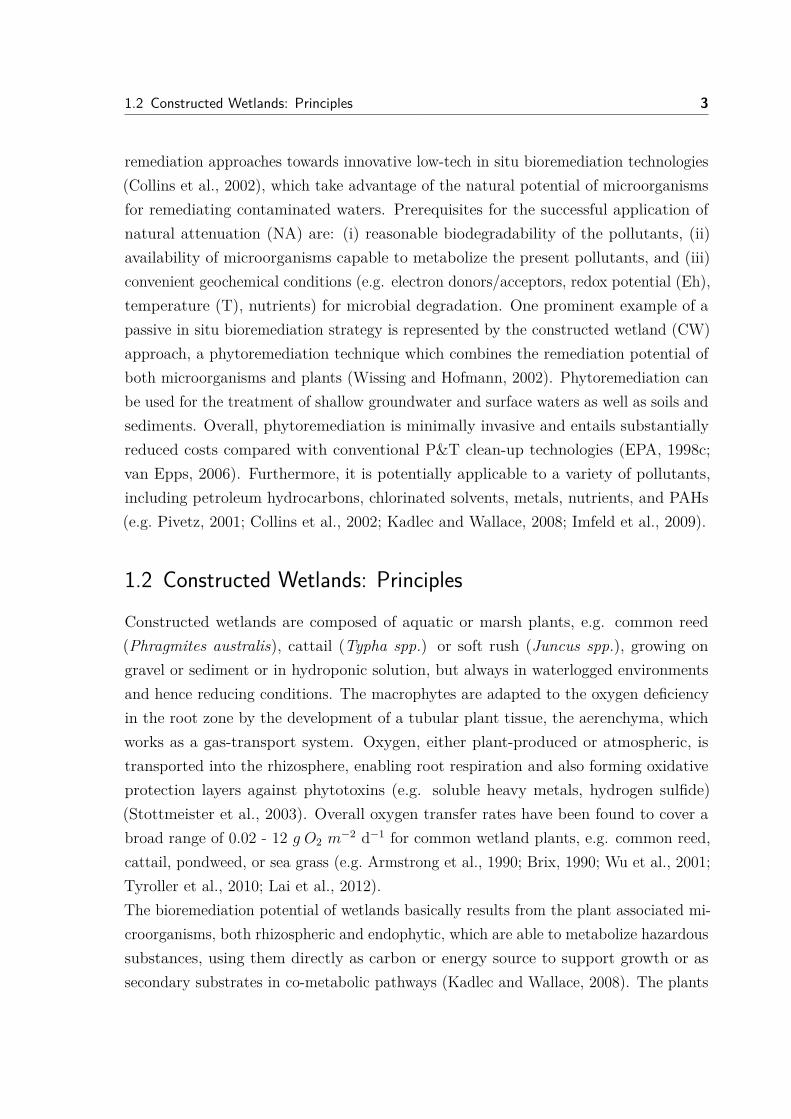
1.3 Industrial site “Leuna”The industrial site “Leuna” is located in Saxony-Anhalt, Germany, and has been used asa chemical production area since 1916 for the generation of ammonia used as a precursorin nitrogen fertilization and explosives production, the production of ammonium sulfate,and the synthesis of methanol (high pressure synthesis) and synthetic petrol (highpressure hydrogenation of charcoal). As a result of World War II, more than 80%of the facilities were destroyed, which lead to massive local contamination of thesaturated and unsaturated zone (Harpke et al., 2006). Between 1949 and 1990, therange of products was expanded, including synthetic rubber, educts for other plastics,e.g. caprolactam for synthesizing the polyamide fiber nylon, and surfactants. Besides,crude oil refinement and the large-scale MTBE production were established (UBA, 2003;LAF, 2009; Schirmer et al., 2012). Given the overall chemical production during thattime, accidental spills and leakages from underground storage tanks, and war damage,groundwater and soil at the Leuna site are nowadays heavily contaminated by a diversechemical mixture: petroleum hydrocarbons (PHCs; ~1-10 mg L−1), BTEX (up to morethan 10 mg L−1), MTBE (up to 125 mg L−1), PAHs (up to more than 100 µg L−1),phenols (up to more than 100 mg L−1), and ammonium sulfate (UBA, 2003; LAWA,2004; Niemes and Schirmer, 2010).An overview of the site-specific geology and hydrogeology is given by Martienssen et al.
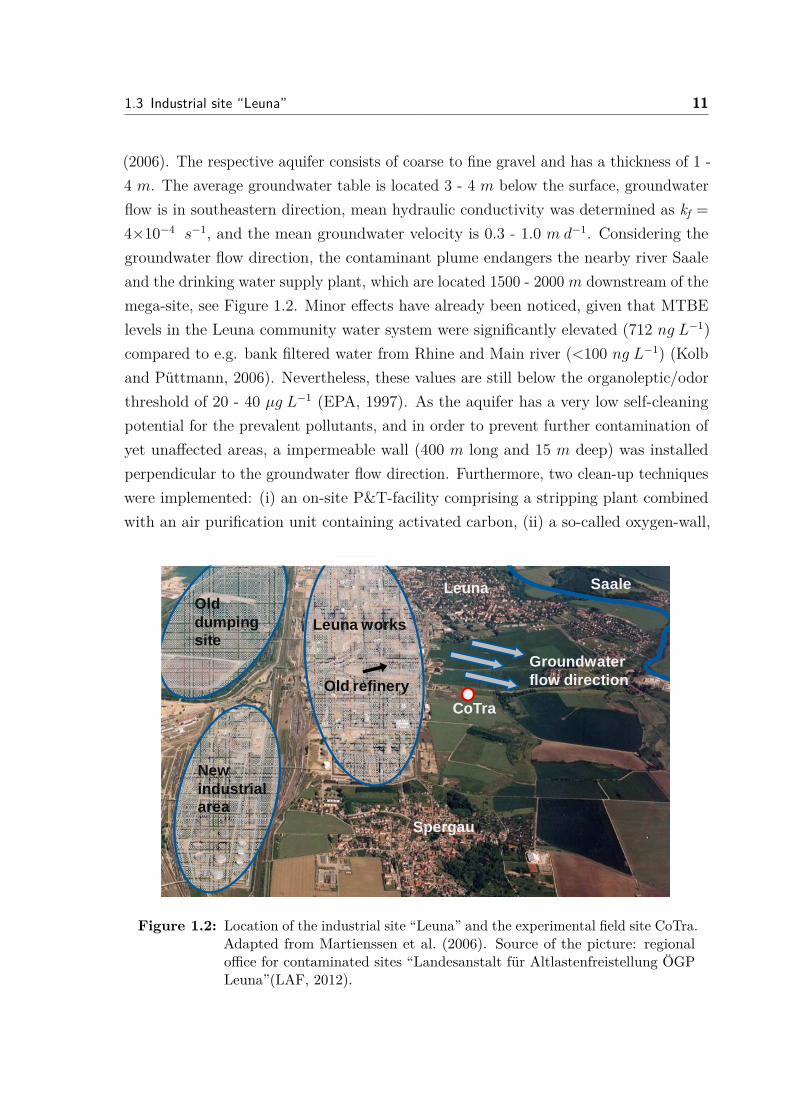
1.3 Industrial site “Leuna” 11
(2006). The respective aquifer consists of coarse to fine gravel and has a thickness of 1 -4 m. The average groundwater table is located 3 - 4 m below the surface, groundwaterflow is in southeastern direction, mean hydraulic conductivity was determined as kf =4×10⁻⁴ s−1, and the mean groundwater velocity is 0.3 - 1.0 m d−1. Considering thegroundwater flow direction, the contaminant plume endangers the nearby river Saaleand the drinking water supply plant, which are located 1500 - 2000 m downstream of themega-site, see Figure 1.2. Minor effects have already been noticed, given that MTBElevels in the Leuna community water system were significantly elevated (712 ng L−1)compared to e.g. bank filtered water from Rhine and Main river (<100 ng L−1) (Kolband Püttmann, 2006). Nevertheless, these values are still below the organoleptic/odorthreshold of 20 - 40 µg L−1 (EPA, 1997). As the aquifer has a very low self-cleaningpotential for the prevalent pollutants, and in order to prevent further contamination ofyet unaffected areas, a impermeable wall (400 m long and 15 m deep) was installedperpendicular to the groundwater flow direction. Furthermore, two clean-up techniqueswere implemented: (i) an on-site P&T-facility comprising a stripping plant combinedwith an air purification unit containing activated carbon, (ii) a so-called oxygen-wall,
CoTra
Saale
Groundwaterflow direction
Leuna
Spergau
Leuna works
Old refinery
Old dumpingsite
New industrialarea
Figure 1.2: Location of the industrial site “Leuna” and the experimental field site CoTra.Adapted from Martienssen et al. (2006). Source of the picture: regionaloffice for contaminated sites “Landesanstalt für Altlastenfreistellung ÖGPLeuna”(LAF, 2012).
12 1 Introduction
used to stimulate the natural remediation potential of the aquifer by oxygen sparging(Niemes and Schirmer, 2010).Within the framework of the Compartment Transfer (CoTra) project, initiated by theHelmholtz Centre for Environmental Research - UFZ, Leipzig, an experimental site wasbuilt nearby the Leuna works in 2006/2007 to investigate the potential of alternativenear-natural treatment systems for remediating the local groundwater. Based on theprinciple idea to use flood plains for protecting surface water bodies (e.g. the riverSaale) downstream of the plume, the concept of the CoTra project relies on the transferof the contaminated anaerobic groundwater into more aerobic environments in orderto promote microbial contaminant degradation. The treatment plant comprises thefollowing remediation systems at the pilot-scale: HSSF CWs, VF CWs and aerobicponds (Ruegner et al., 2007).
1.4 Main groundwater pollutants at the CoTra plantBenzene, MTBE and ammonium are the main pollutants in the groundwater used forfeeding the CoTra treatment plant. During the first year of plant operation (06/2007-06/2008), the concentrations of benzene, MTBE and ammonium-nitrogen were 19 ± 3.7,3.8 ± 0.8, and 45 ± 4.1 mg L−1, respectively. Contaminant characteristics, productionvolumes, sources and emission pathways, and potential degradation pathways are brieflydiscussed hereafter. The most important physical and chemical characteristics of theorganic model compounds are summarized in Table 1.1.
1.4.1 Benzene
Benzene ranks in the top 20 of the most abundantly produced petrochemicals in theUSA (ATSDR, 2007). Today, its major use is as a feedstock in the production ofaromatic intermediates - with ethylbenzene (52%), cumene (20%) and cyclohexane(13%) as the most prominent ones - which are further processed for manufacturingplastics, resins, drugs, dyes, and plant protection agents; the raw compound serves asa solvent, e.g. for ink or glue (RPA, 2000; UBA, 2006; EPA, 2007). Being a naturalcomponent of crude oil, benzene is also present in gasoline (EU, 2008b). In 2010 forexample the production volume in Germany amounted to 2.1 million t a−1 (VCI, 2011).More than half of the German benzene demand is derived by extractive distillationof naphtha (a product of crude oil distillation which is rich in aromatic compounds,with a benzene content of 31-40 v-%); less important methods to obtain benzene are
1.4 Main groundwater pollutants at the CoTra plant 13
isolation from coke oven gas by means of special washing processes, thermal or catalytictoluene dealkylation and toluene disproportionation (Index, 2001).Classified as a human carcinogen by the IARC (International Agency for Research onCancer), benzene can cause severe health damage even at short term contact (IARC,1999a; WHO, 2011). According to a prioritization based on a combination of compoundfrequency, toxicity, and potential for human exposure, benzene ranks 6th on the prioritylist of hazardous substances (ATSDR, 2011). In order to minimize human health risk,the EU drinking water directive (1998/83/EC) constitutes a threshold of 1 µg L−1, andbenzene emission to ambient air is restricted to 5 µg m−3 (2008/50/EC). Besides, themaximum content in European gasoline was lowered from 5% to 1% (v/v) since 2000(Directive 1998/70/EC) (U.S. gasoline standards are even lower since 2011: 0.62% (v/v)(EPA, 2010)), and the overall use as a solvent has decreased due to the implementationof the solvent emission directive 1999/13/EC in 2001 (UBA, 2002).The release of benzene into the environment occurs from point (e.g. oil refineries,industrial production and processing) and nonpoint sources (e.g. exhaust of motorvehicles, fuel evaporation at automobile service stations, cigarette smoke) (EU, 2008b).Inhalation is the dominant pathway for human exposure, accounting for >99% of thedaily intake (ATSDR, 2007). According to Wallace (1996) smokers have an averagebenzene body burden about 6-10 times that of non smokers, and receive ~90% of theirbenzene exposure (~2 mg per day) from smoking. Outdoor air concentrations averageout at <2 µg m−3 (<1 ppb) (EU, 2008b; EPA, 2008). In case contamination resultsfrom fuel hydrocarbons, e.g. by leaking underground storage tanks, benzene occursconcomitantly with other aromatic hydrocarbons such as toluene, ethylbenzene and m-,o- and p-xylene. In groundwater benzene is considered as fairly mobile, given that theKOC value (predicted from the KOW ) is not large enough (KOC ~80) to cause significantretardation (Zogorski et al., 1997) and water solubility is relatively high (see Tab. 1.1).Of course, the mobility of benzene in the subsurface also depends on the organic carboncontent (fOC) of the respective aquifer. Due to the high volatility, indicated by theHenry constant and the vapor pressure, benzene tends to evaporate from surface soilor water. In the atmosphere benzene is chemically degraded by photooxidation withhydroxyl or nitrogen oxide radicals and ozone, of which the reaction with hydroxylradicals is fastest and thus most important, resulting in a half-life of several days (5-13)(Zogorski et al., 1997; WHO, 2003a; EPA, 2004; EU, 2008b).Common in situ benzene treatment technologies involve soil vapor extraction (e.g.Soares et al., 2010) and air sparging (e.g. Reddy et al., 1995; Bass et al., 2000),aiming to enhance volatilization and concomitantly promoting biodegradation; ex
14 1 Introduction
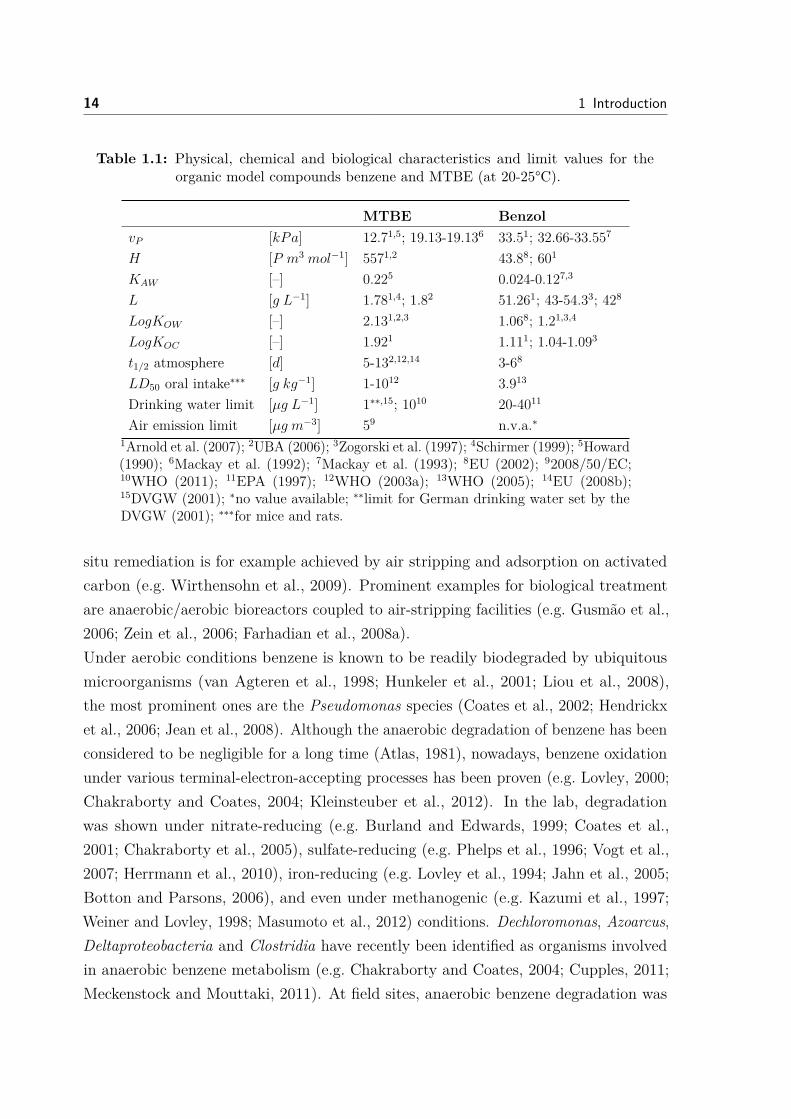
Table 1.1: Physical, chemical and biological characteristics and limit values for theorganic model compounds benzene and MTBE (at 20-25°C).
MTBE BenzolvP [kPa] 12.71,5; 19.13-19.136 33.51; 32.66-33.557
H [P m3 mol−1] 5571,2 43.88; 601
KAW [–] 0.225 0.024-0.127,3
L [g L−1] 1.781,4; 1.82 51.261; 43-54.33; 428
LogKOW [–] 2.131,2,3 1.068; 1.21,3,4
LogKOC [–] 1.921 1.111; 1.04-1.093
t1/2 atmosphere [d] 5-132,12,14 3-68
LD50 oral intake∗∗∗ [g kg−1] 1-1012 3.913
Drinking water limit [µg L−1] 1∗∗,15; 1010 20-4011
Air emission limit [µg m−3] 59 n.v.a.∗1Arnold et al. (2007); 2UBA (2006); 3Zogorski et al. (1997); 4Schirmer (1999); 5Howard(1990); 6Mackay et al. (1992); 7Mackay et al. (1993); 8EU (2002); 92008/50/EC;10WHO (2011); 11EPA (1997); 12WHO (2003a); 13WHO (2005); 14EU (2008b);15DVGW (2001); ∗no value available; ∗∗limit for German drinking water set by theDVGW (2001); ∗∗∗for mice and rats.
situ remediation is for example achieved by air stripping and adsorption on activatedcarbon (e.g. Wirthensohn et al., 2009). Prominent examples for biological treatmentare anaerobic/aerobic bioreactors coupled to air-stripping facilities (e.g. Gusmão et al.,2006; Zein et al., 2006; Farhadian et al., 2008a).Under aerobic conditions benzene is known to be readily biodegraded by ubiquitousmicroorganisms (van Agteren et al., 1998; Hunkeler et al., 2001; Liou et al., 2008),the most prominent ones are the Pseudomonas species (Coates et al., 2002; Hendrickxet al., 2006; Jean et al., 2008). Although the anaerobic degradation of benzene has beenconsidered to be negligible for a long time (Atlas, 1981), nowadays, benzene oxidationunder various terminal-electron-accepting processes has been proven (e.g. Lovley, 2000;Chakraborty and Coates, 2004; Kleinsteuber et al., 2012). In the lab, degradationwas shown under nitrate-reducing (e.g. Burland and Edwards, 1999; Coates et al.,2001; Chakraborty et al., 2005), sulfate-reducing (e.g. Phelps et al., 1996; Vogt et al.,2007; Herrmann et al., 2010), iron-reducing (e.g. Lovley et al., 1994; Jahn et al., 2005;Botton and Parsons, 2006), and even under methanogenic (e.g. Kazumi et al., 1997;Weiner and Lovley, 1998; Masumoto et al., 2012) conditions. Dechloromonas, Azoarcus,Deltaproteobacteria and Clostridia have recently been identified as organisms involvedin anaerobic benzene metabolism (e.g. Chakraborty and Coates, 2004; Cupples, 2011;Meckenstock and Mouttaki, 2011). At field sites, anaerobic benzene degradation was
1.4 Main groundwater pollutants at the CoTra plant 15
demonstrated many times (e.g. Lovley et al., 1994; Fischer et al., 2007; Vogt et al.,2007). Besides, the stimulation of in situ biodegradation by injection of nitrate andsulfate was also shown (e.g. Cunningham et al., 2001).
1.4.2 Methyl tert-butyl ether
Methyl tert-butyl ether (MTBE) has been used as a gasoline additive since the 1970s inorder to boost the octane rating and also to improve the combustion process, resultingin lower exhaust emissions (CRS, 2006). It came into widespread use in the 1980s whenthe toxic octane enhancer tetraethyl lead was phased out (Johnson et al., 2000); thefinal ban of leaded gasoline became effective in the years 2000 and 1996 in the EU (EUDirective 1998/70/EC) and USA (EPA, 2010), respectively. European gasoline contains~2% (v/v) MTBE (Effenberger et al., 2001); in the US the addition of MTBE to gasolinewas restricted to 0.5% (v/v) (EPA, 2010) from formerly 11-15% (v/v) (EPA, 1998b). In1997, at the peak consumption of MTBE as a fuel additive, the European productionamounted to 3 million t a−1 whereof about 98% was blended with gasoline and onlyminor amounts were used in the production of isobutylene (1.2%), as a solvent in thepharmaceutical industry (0.3%), or in chemical reactions such as Grignard reactions(EU, 2002; IARC, 1999b). MTBE is manufactured by the chemical reaction of methanolwith isobutene over an acidic ion-exchange catalyst (EU, 2002), steamcracking or butanedehydrogenation (Fayolle et al., 2001).The main source of human exposure to MTBE is likely to occur by inhalation of contami-nated air at gas stations and production sites or from automobile exhaust gases. Besides,leaking underground storage tanks and pipelines for petrol storage and distribution,as well as spills during all phases of the petroleum fuel cycle (e.g. production, petrolblending, storage, transport, delivery), resulted in intense contamination of (ground)water and (sub)-surface soils (WHO, 2005; IARC, 1999b), which pose a potential risk forhuman health as well. According to the IARC MTBE is not classifiable as a carcinogento humans, though the WHO (2005) and the EPA (1997, 1998b) noted that only veryfew data exist on the effect of MTBE to humans by inhalation, and no data regardingthe oral uptake. Given the very low organoleptic perception level, the US EPA drinkingwater advisory (EPA, 1997) recommends keeping MTBE levels in the range of 20-40µg L−1 or lower for consumer acceptability (CRS, 2006). At these levels MTBE isconsidered to cause no adverse health effects to humans (EU, 2002).MTBE is categorized as a low risk chemical, although it is known to be the mostmobile and recalcitrant of the gasoline components (Schmidt et al., 2004; WHO, 2011).
16 1 Introduction
Relative to benzene, MTBE exhibits increased water solubility (42 g L−1 at 20°C; EU(2002)) and decreased tendency for sorption onto soil (log KOW = 1.2; Schirmer (1999)).Therefore, MTBE contamination might spread out over large areas. As indicated by theHenry constant, being one order of magnitude lower than the one of benzene, MTBE isless volatile from water. This also explains why air stripping of MTBE contaminatedwater is only effective for high air-to-water ratios (200:1), and thus relatively costly. Bycomparison, an effective air-to-water ratio for benzene is typically about 50:1 (EPA,1998b). Lifetimes in the atmosphere are in the range of 3-6 days (EU, 2002), and thussimilar to those of benzene.Typically applied physical remediation technologies for MTBE contaminated soil are va-por extraction (in situ) and low-temperature thermal desorption (ex situ) (EPA, 1998a).For contaminated groundwater air sparging (in situ) is used, and given that MTBEdoes not significantly adsorb to soils and is highly water soluble, also the extraction ofgroundwater followed by above ground treatment has been shown feasible (e.g. Fayolleet al., 2001; Deeb et al., 2003). Biological treatment includes the use of bioreactors, forexample inoculated with material from contaminated aquifers (e.g. Zein et al., 2004,2006), supplied with oxygen (e.g. Salanitro et al., 2000) or oxygen-release compoundssuch as MgO2 (e.g. Koenigsberg and Sandefur, 1999), or selected microorganisms (e.g.Salanitro et al., 2000) in order to promote biodegradation.Alkyl ethers such as MTBE are not readily biodegradable (Zogorski et al., 1997; Fayolleet al., 2003). Nevertheless, in recent years biodegradation of MTBE has been shownunder oxic (e.g. Schirmer et al., 2003; Volpe et al., 2009; Thornton et al., 2011) andoccasionally under anoxic (e.g. Mormile et al., 1994; Bradley et al., 2001; Somsamaket al., 2006) conditions, and also to occur by co-metabolism (e.g. Steffan et al., 1997;Garnier et al., 1999; Liu et al., 2001). For a conclusive overview of biodegradationunder various redox conditions and present knowledge of the biodegradability and thedegradation pathway see Deeb et al. (2000), Fayolle et al. (2001), and Schmidt et al.(2004). Generally, MTBE metabolism is slow, especially when MTBE is the sole carbonand energy source (Zanardini et al., 2002). Several aerobic degraders that use MTBE assole C- and energy source have been identified including Methylobacterium, Rhodococus,Arthrobacter and Rubrivivax gelatinosus PM-1 (e.g. Fayolle et al., 2001; Lopes Ferreiraet al., 2006). In the field, biostimulation and bioaugmentation by oxygenation andmicrobial inoculation, respectively, improved MTBE degradation (e.g. Zanardini et al.,2002).
1.4 Main groundwater pollutants at the CoTra plant 17
1.4.3 Ammonium
The groundwater at the Leuna site is characterized by high ammonium levels ac-companied by increased sulfate concentrations. Therefore, the observed ammoniumcontamination seems to be related to (i) the large scale synthetic production of am-monium sulfate, (ii) the processing of ammonia during nitrogen-fertilizer production,(iii) the coking process and the caprolactam manufacture, during which ammoniumsulfate is produced as a by-product, and (iv) the leachate from the near-by dumpsite(UBA, 2003). Ammonium sulfate is known for its use as one of the early nitrogenfertilizers (UNEP, 1998). To a minor extent (~10%) it is used in the chemical industry,in the manufacturing of food additives, and as an ingredient of cleaning products andpaints (OECD, 2004). In addition to spillage, anthropogenic imission originates fromagricultural activities, e.g. from runoff water containing synthetic fertilizer or animalmanure. Naturally, ammonium is produced by the constant microbial mineralization ofnitrogen-containing organic matter (ammonification).Ammonium in the aqueous medium affects the environment in several ways, eitherdirectly in the form of ammonium or following microbial oxidation by nitrate and nitrite.In soil systems, ammonium tends to adsorb as an exchangeable ion to positively chargedclay surfaces and humic substances (Vymazal, 2007; Lee et al., 2009a), can be taken upand assimilated by plants (OECD, 2004), and furthermore causes acidification of soiland water by nitrification (Kadlec and Wallace, 2008; IFA, 2000). Large amounts ofammonium/nitrate entering pristine aqueous ecosystems (rivers, lakes, oceans), e.g. byagricultural runoff, promote eutrophication (Frink et al., 1999; Ahlgren et al., 2008).Nitrite is known to disrupt multiple physiological functions in aquatic animals and ispotentially toxic to infants as it can cause methemoglobinemia (Jensen, 2003). Levelsof ammonium in ground/surface waters are usually below 0.2 mg L−1 (WHO, 2011).Although ammonium does not pose any direct health risk to humans (OECD, 2004),a low limit of 0.5 mg L−1 is constituted for drinking water in the EU (EU directive1998/83/EC). This might be related to the fact that ammonium serves as an indicatorfor contaminated water (NH+
4 is formed during microbial decomposition of urea andproteins). Nitrate and nitrite drinking water limits in Europe are 50 mg L−1 and 0.5mg L−1 (EU directive 1998/83/EC).Various physical-chemical methods can be applied to treat high-strength ammoniumwastewaters, including chemical precipitation (e.g. Zhang et al., 2009), air stripping athigh pH (e.g. Marttinen et al., 2002; Renou et al., 2008) or ion-exchange using zeolites(e.g. Chang et al., 2009; Widiastuti et al., 2011). For moderate/low-strength ammonium
18 1 Introduction
waters, also the remediation in aerobic-anaerobic bioreactors, such as activated sludgesystems (e.g. Carrera et al., 2003), is efficient, proceeding via nitrification-denitrification(e.g. Chan et al., 2009) or partial nitrification-anaerobic ammonium oxidation (e.g. Fuxet al., 2002).Microbial ammonium degradation in CWs occurs via nitrification to nitrate underaerobic conditions, with hydroxylamine and nitrite as intermediates, and, subsequently,via denitrification of nitrate to nitrogen gas (Kadlec and Wallace, 2008). Alternatively,under anaerobic conditions ammonium can be autotrophically converted to N2 withnitrite as an electron acceptor via the so-called anaerobic ammonium oxidation (anam-mox) (Lee et al., 2009a). The transformation pathways of the different N species inecosystems under various environmental conditions are described in the reviews ofParedes et al. (2007) and Lee et al. (2009a).
1.5 Current state of research and gaps in wetlandphytoremediation of benzene, MTBE and ammonium
Wetland phytoremediation represents a viable treatment technology for lightly tomoderately contaminated (ground) water and has attracted increasing interest duringthe last few years. In most cases, studies investigate CW treatment performanceexpressed as contaminant removal from the aqueous phase depending on system designand operational mode. Many of them refer to removal efficiency as the mere pollu-tant concentration decline, and only few report on areal mass load removal. Theconcentration-decline approach is valuable to prove whether effluent water complieswith contaminant concentration thresholds and to determine the extent to which designand operational mode affect treatment performance and process indication parameters(e.g. Eh, TEA). However, the assessment of actual mass removal and specifying removalin mass/time/area units is essential to ascertain actual treatment efficiency and to keepresults comparable.For benzene and MTBE, several concentration-decline studies have been published(e.g. Wallace, 2001; Moore et al., 2002; Tang et al., 2009; Rakoczy et al., 2011), whileinvestigations on loads are currently rather rare (e.g. Zhang et al., 2000; Bedessemet al., 2007). Overall, treatment efficiency was found to be (i) site-specific and - for theconcentration range investigated - not related to inflow concentrations in particular, and(ii) more efficient for benzene (75-99% concentration decline, e.g. Moore et al. (2002);Tang et al. (2009); Rakoczy et al. (2011)) in comparison to MTBE (<40% concentration
1.5 Current state of research and gaps in wetland phytoremediation of benzene, MTBE andammonium
19
decline, e.g. Keefe et al. (2004); Bedessem et al. (2007)). First evidence on areal loadremoval showed moderate-to-low efficiency for benzene (e.g. 66% at an inflow load of0.18 g m−2 d−1; Bedessem et al. (2007)) and MTBE (e.g. 45% at an inflow load of 0.67g m−2 d−1; Zhang et al. (2000)) in comparison to other VOCs (phenol, toluene, TCA,TCE, PCE) for which efficiencies of e.g. 76 - 99% were obtained (at theoretical inflowloadings of 0.06 - 1.24 g m−2 d−1; Narayanan et al. (1995a,b); James et al. (2009)). Thepotential for optimizing treatment performance was found promising for subsurfaceaeration and bioaugmentation, both improving performance by ~10-25% (e.g. Zhanget al., 2000; Ferro et al., 2002; Bedessem et al., 2007). Temperature elevation resultedin a similar enhancement (e.g. Eke and Scholz, 2008; Tang et al., 2009).Regarding ammonium treatment in CWs, many studies address areal load removal,possibly given that for sewage plants this is the common practice. Mostly, data includestotal nitrogen (TN) and ammonium-N removal in order to distinguish between transfor-mation and removal. Vymazal (2005) compiled the results of about 100 wetland studiesand found average ammonium and TN load removal efficiencies in single-stage HSSFCWs of about 34% and 40% with actual load removal of 133 and 250 g N m−2 a−1,respectively. The performance dependency was investigated for many parameters, in-cluding T and season (e.g. Kuschk et al., 2003; Akratos and Tsihrintzis, 2007), planting(e.g. Zhu and Sikora, 1995; Maltais-Landry et al., 2009), aeration (e.g. Maltais-Landryet al., 2009), fill-and-drain mode (e.g. Vymazal and Masa, 2003), and hybrid systems(e.g. Vymazal, 2005; Tanner et al., 2012). Briefly, high optimization potential wasshown for (i) fill-and-drain mode, e.g. ammonium removal was increased by 27% incomparison to non pulsed CWs (Vymazal and Masa, 2003), and (ii) hybrid systems,e.g. for a HF-VF system TN elimination was twice as high compared to the solelyHF-treatment (Tanner et al., 2012).Recent studies on contaminant fate acknowledge the importance of analyzing the roleand relevance of different removal pathways. Regarding N fate, studies monitor TNshift and N export in terms of nitrate, ammonium, N2 and N2O to measure biolog-ical transformation by nitrification and (in)complete denitrification, and quantify Nincorporation in plants and sediment storage. Overall, for various macrophytes plantuptake (with biomass harvesting) accounted for a rather small amount of TN removal(<40%) in comparison to biological transformations (up to 60-84%) (e.g. Tanner et al.,2002; Lee et al., 2009a; Maltais-Landry et al., 2009; Tunçsiper, 2009), and sedimentstorage was negligible (≤6% of TN removal) in planted CWs (e.g. Tanner et al., 2002;Reinhardt et al., 2006). For benzene and MTBE, researchers investigated surface- plusphyto-volatilization (e.g. Burken and Schnoor, 1998; Hong et al., 2001; Keefe et al.,
20 1 Introduction
2004), plant uptake (e.g. Burken and Schnoor, 1998; Arnold et al., 2007; Mothes et al.,2010), and rhizo- or endopyhtic degradation (e.g. Trapp et al., 2003; Porteous Mooreet al., 2006; Rakoczy et al., 2011). First conclusions can be derived from these studies:(i) benzene and MTBE are taken up by plants, (ii) benzene is susceptible to degradationin planta, but MTBE is not, (iii) phytovolatilization from tree cuttings is high inabsence of degradation, e.g. 28% and 18% of the applied mass of MTBE and benzenewas phytovolatilized, respectively, (iv) actual mass of benzene and MTBE retainedin plant (willow, poplar, reed) tissue is small (<5% of the total removal), and (v)rhizospheric biodegradation may represent the major removal pathway for benzene inpilot-scale CWs, accounting for 85% of the total removal. Unfortunately, either notall potential removal pathways were assessed for one single system or studies wereconducted at lab-scale and/or with trees instead of helophytes. Thus, transferabilityand extrapolation of results to pilot/full-scale CW applications have been limited sofar.However, conclusive insights into the fate of all kinds of contaminants in wetlands areneeded to determine and classify actual removal efficiencies and to comprehensivelyoptimize the respective treatment systems. Thereby, it is essential to assess contaminantload removal and to quantify and distinguish between elimination and compartmenttransfer processes as to proof treatment reliability. This is especially important for thetreatment of VOCs, also with regard to legal issues such as emission limits. To date,mass balance studies for benzene and MTBE are rare and were mostly performed atlab-scale, under lab conditions and with tree cuttings. Hence, assessing the fate of VOCsin wetlands using a mass balance approach at a large scale and under field conditions isstill missing. Moreover, to conclusively evaluate CW treatment performance and allowfor a valid comparison of different treatment systems, the performance evaluation hasto include the assessment of system-specific flow behavior.
1.6 Aims and outline of the thesisThe overall aim of this thesis was to evaluate the potential of five differently designedpilot-scale constructed wetlands to treat groundwater contaminated with benzene,MTBE and ammonium in a field approach under northern European climate, and toassess contaminant fate and removal pathways on a mass balancing approach followingup the gaps of knowledge in wetland phytoremediation described above. Gaining insightsregarding these aspects is expected to be crucial for the technological optimization
1.6 Aims and outline of the thesis 21
and implementation of treatment wetlands at a large-scale and to evidence whetherCWs constitute a reliable alternative technology for the treatment of VOCs. The HSSFwetlands of investigation were: three planted gravel filters, whereof two contained filtermaterial additives, either charcoal or ferric oxide; one unplanted gravel filter used as areference; one hydroponic plant root mat.
The specific objectives of the thesis are to:
(i) investigate whether and to which extend the wetland design (gravel filter CW,hydroponic plant root mat) and the filter additives (charcoal, ferric oxide) affecttreatment performance,
(ii) determine the effect of environmental parameters (T, season) on contaminantremoval,
(iii) assess areal load removal efficiencies by taking into account water loss due toevapotranspiration,
(iv) elucidate the fate of benzene and MTBE by quantifying potential removal path-ways, in particular surface- and phytovolatilization, plant uptake and microbialdegradation,
(v) determine the wetland specific flow characteristics and relate these to achievedload removal efficiencies,
(vi) evaluate the local flow behavior of the gravel wetlands to calculate contaminantloads within the filter.
This doctoral thesis is written in publication format and is based on the followingthree scientific articles. In addition, the thesis comprises an introductory and sum-mary chapter, embedding the articles into the current state of research in wetlandphytoremediation. Paper I and II have been published in Environmental Pollutionand Environmental Science & Technology, respectively, and paper III has beenaccepted for publication in Water Research.
Paper I (Chapter 2) is a comparative study, reporting on the effectiveness of thegravel CWs and the hydroponic plant root mat to improve the groundwater qualityregarding the concentrations of benzene, MTBE and ammonium, and evaluating howthe wetland design and the filter additives affect treatment performance. Positiveeffects were suggested by (i) increasing pollutant-microorganism contact time dueto contaminant sorption processes or (ii) providing additional electron acceptors formicrobial contaminant turnover. Besides, for characterizing the CWs and for identifying
22 1 Introduction
processes involved in contaminant removal and to furthermore investigate the potentialfor microbial degradation of benzene and MTBE in the rhizosphere, seasonal and spatialconcentration dynamics of pollutants and environmental parameters (nitrate, nitrite,Fe(II), Eh, O2, T) were monitored and most probable number tests and microcosmstudies were performed.Paper II (Chapter 3) evaluates contaminant fate and potential removal pathwaysin wetlands by setting up an integral mass balancing approach. The study aimed toassess actual treatment efficiency on the basis of areal loads and to quantify removalof benzene and MTBE by emission into the air by surface- and phyto-volatilization,plant uptake and biodegradation. In both cases, the dependency on seasonal effectsand particularly the wetland design (the comparison of conventional gravel beds with ahydroponic plant root mat system) was of interest. Overall, this study presents thefirst complete mass balance for VOCs in pilot-scale HSSF CWs.Paper III (Chapter 4) completes the performance evaluation of the CWs by providinga detailed characterization of the system-specific hydraulic flow behavior. Specifically,it aims to investigate the impact of wetland design and operational mode on the flowcharacteristics, and to examine the relation between the wetland-specific flow char-acteristics and the achieved removal efficiencies. Aiming to overcome the black boxconcept often applied to CWs, particular focus was laid on the analysis of local tracerbreakthrough curves in order to assess variability of flow velocities within the filtersfor localizing stagnant zones and for predicting local flow rates and depth-dependentcontaminant loads.
Supplementary material of the article published in Environmental Science & Technologyand of the article accepted for publication in Water Research can be found in theAppendix A.1 and A.2, respectively.
Bioremediation of benzene-, MTBE- and ammonia-contaminatedgroundwater with pilot-scale constructed wetlands
Eva M. Seeger a,*, Peter Kuschk a, Helga Fazekas a, Peter Grathwohl b, Matthias Kaestner a
aDepartment of Environmental Biotechnology, Helmholtz Centre for Environmental Research e UFZ, Permoserstr. 15, 04318 Leipzig, GermanybCenter of Applied Geoscience, University of Tübingen, Hölderlinstr. 12, 72074 Tübingen, Germany
a r t i c l e i n f o
Article history:Received 25 November 2010Received in revised form29 June 2011Accepted 6 July 2011
Keywords:BTEXFuel hydrocarbonPlant root matPhytoremediation
a b s t r a c t
In this pilot-scale constructed wetland (CW) study for treating groundwater contaminated with benzene,MTBE, and ammonia-N, the performance of two types of CWs (a wetland with gravel matrix and a plantroot mat) was investigated. Hypothesized stimulative effects of filtermaterial additives (charcoal, iron(III))on pollutant removal were also tested. Increased contaminant loss was found during summer; the besttreatment performance was achieved by the plant root mat. Concentration decrease in the planted gravelfilter/plant root mat, respectively, amounted to 81/99% for benzene, 17/82% for MTBE, and 54/41%for ammonia-N at calculated inflow loads of 525/603 mg/m2/d, 97/112 mg/m2/d, and 1167/1342 mg/m2/dfor benzene, MTBE, and ammonia-N. Filter additives did not improve contaminant depletion, althoughsorption processes were observed and elevated iron(II) formation indicated iron reduction. Bacterial andstable isotope analysis provided evidence for microbial benzene degradation in the CW, emphasizing thepromising potential of this treatment technique.
� 2011 Elsevier Ltd. All rights reserved.
1. Introduction
Multi-component contamination of groundwater, caused byleakage of storage tanks, improper handling during processingor transport, and disposal at industrial sites (e.g. refineries), causesamajor hazard for the environment. In aquifers, anaerobic conditionsoften prevail; pollutants recalcitrant under these conditions migratewith the groundwater flow and may affect sensitive environments,e.g. surface water or groundwater bodies used as drinking-waterresources. Fuel hydrocarbons, BTEX compounds (benzene, toluene,xylenes and ethylbenzene), and fuel oxygenates such asmethyl-tert-butyl-ether (MTBE) are among the most commonly found ground-water pollutants (Schmidt et al., 2004); they are all to be found atthe investigated site in the Leuna region (Saxony-Anhalt, Germany),accompanied by high levels of ammonia.
For sites contaminated with a broad spectrum of compoundsat low concentrations, conventional groundwater remediationtechniques such as “pump and treat” methods are often applied.However, these techniques are invasive, cost intensive, andeconomically inefficient, hence new strategies are needed (Salt et al.,1998; Dietz and Schnoor, 2001). Phytoremediation, with natural orconstructed wetlands, is thus a promising near-natural in situ watertreatment method, since plants greatly enhance microbial growth
and thereby contaminant degradation by supplying oxygen and rootexudates in the rhizosphere (Williams, 2002; Stottmeister et al.,2003; Kadlec and Wallace, 2008). Two principal technical designschemes for constructed wetlands (CWs) can be distinguished:the conventional CW, consisting of a gravel or soil filter matrix onwhich thewetland plants grow, and themore sophisticated floating/non-floating plant root mat systems, supported by a raft or thedensely woven root bed only.
To date, there have been very few pilot- and large-scale fieldapplications involving phytoremediation of chemically contaminatedwaterswith CWs (Ferro et al., 2002;Moore et al., 2002; Singh and Jain,2003; Wallace and Kadlec, 2005; Bedessem et al., 2007), althoughapplication of CWs to clean household waters is very common(Haberl et al., 2003; Vymazal and Kröpfelová, 2008; Vymazal, 2009).In most cases, the CW approach is applied as a secondary treatmentstep, the so-called polishing technique (Dietz and Schnoor, 2001;Van Epps, 2006). Some studies do report on large-scale applicationsto treat groundwater containing BTEX and MTBE (Wallace, 2001;Moore et al., 2002; Keefe et al., 2004; Wallace and Kadlec, 2005),but the concentrations treated are rather low. Some strategies topromote contaminant turnover have been tested, but these werelimited to bioaugmentation (Mehmannavaz et al., 2002; Nurk et al.,2009), the use of engineered bacteria (Barac et al., 2004), and theaeration of wetlands (Wallace and Kadlec, 2005). In general, theavailability of electron acceptors is a crucial aspect in microbialcontaminant oxidation (Farhadian et al., 2008).
* Corresponding author.E-mail address: [email protected] (E.M. Seeger).
Contents lists available at ScienceDirect
Environmental Pollution
journal homepage: www.elsevier .com/locate/envpol
0269-7491/$ e see front matter � 2011 Elsevier Ltd. All rights reserved.doi:10.1016/j.envpol.2011.07.019
Environmental Pollution 159 (2011) 3769e3776
Chapter 2 – Paper I 23
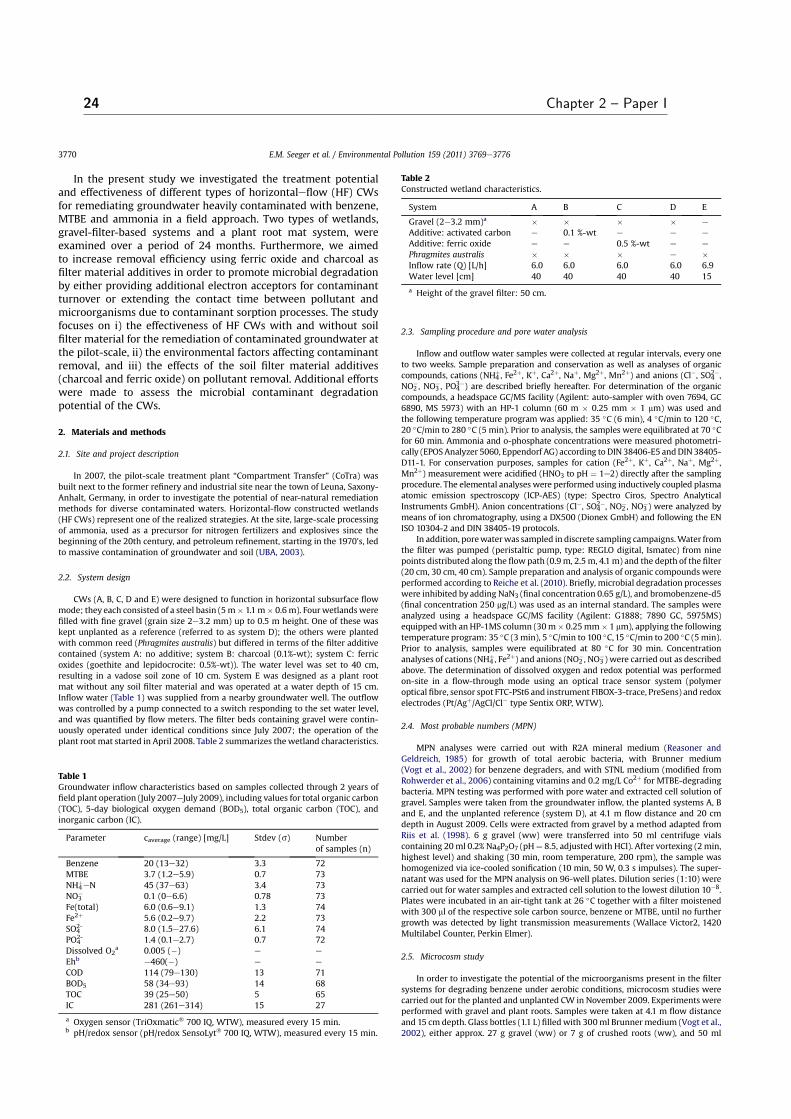
In the present study we investigated the treatment potentialand effectiveness of different types of horizontaleflow (HF) CWsfor remediating groundwater heavily contaminated with benzene,MTBE and ammonia in a field approach. Two types of wetlands,gravel-filter-based systems and a plant root mat system, wereexamined over a period of 24 months. Furthermore, we aimedto increase removal efficiency using ferric oxide and charcoal asfilter material additives in order to promote microbial degradationby either providing additional electron acceptors for contaminantturnover or extending the contact time between pollutant andmicroorganisms due to contaminant sorption processes. The studyfocuses on i) the effectiveness of HF CWs with and without soilfilter material for the remediation of contaminated groundwater atthe pilot-scale, ii) the environmental factors affecting contaminantremoval, and iii) the effects of the soil filter material additives(charcoal and ferric oxide) on pollutant removal. Additional effortswere made to assess the microbial contaminant degradationpotential of the CWs.
2. Materials and methods
2.1. Site and project description
In 2007, the pilot-scale treatment plant “Compartment Transfer” (CoTra) wasbuilt next to the former refinery and industrial site near the town of Leuna, Saxony-Anhalt, Germany, in order to investigate the potential of near-natural remediationmethods for diverse contaminated waters. Horizontal-flow constructed wetlands(HF CWs) represent one of the realized strategies. At the site, large-scale processingof ammonia, used as a precursor for nitrogen fertilizers and explosives since thebeginning of the 20th century, and petroleum refinement, starting in the 1970’s, ledto massive contamination of groundwater and soil (UBA, 2003).
2.2. System design
CWs (A, B, C, D and E) were designed to function in horizontal subsurface flowmode; they each consisted of a steel basin (5m� 1.1m� 0.6m). Fourwetlands werefilled with fine gravel (grain size 2e3.2 mm) up to 0.5 m height. One of these waskept unplanted as a reference (referred to as system D); the others were plantedwith common reed (Phragmites australis) but differed in terms of the filter additivecontained (system A: no additive; system B: charcoal (0.1%-wt); system C: ferricoxides (goethite and lepidocrocite: 0.5%-wt)). The water level was set to 40 cm,resulting in a vadose soil zone of 10 cm. System E was designed as a plant rootmat without any soil filter material and was operated at a water depth of 15 cm.Inflow water (Table 1) was supplied from a nearby groundwater well. The outflowwas controlled by a pump connected to a switch responding to the set water level,and was quantified by flow meters. The filter beds containing gravel were contin-uously operated under identical conditions since July 2007; the operation of theplant root mat started in April 2008. Table 2 summarizes thewetland characteristics.
2.3. Sampling procedure and pore water analysis
Inflow and outflow water samples were collected at regular intervals, every oneto two weeks. Sample preparation and conservation as well as analyses of organiccompounds, cations (NH4
þ, Fe2þ, Kþ, Ca2þ, Naþ, Mg2þ, Mn2þ) and anions (Cl�, SO42�,
NO2�, NO3
�, PO43�) are described briefly hereafter. For determination of the organic
compounds, a headspace GC/MS facility (Agilent: auto-sampler with oven 7694, GC6890, MS 5973) with an HP-1 column (60 m � 0.25 mm � 1 mm) was used andthe following temperature program was applied: 35 �C (6 min), 4 �C/min to 120 �C,20 �C/min to 280 �C (5 min). Prior to analysis, the samples were equilibrated at 70 �Cfor 60 min. Ammonia and o-phosphate concentrations were measured photometri-cally (EPOSAnalyzer 5060, Eppendorf AG) according to DIN 38406-E5 andDIN 38405-D11-1. For conservation purposes, samples for cation (Fe2þ, Kþ, Ca2þ, Naþ, Mg2þ,Mn2þ) measurement were acidified (HNO3 to pH ¼ 1e2) directly after the samplingprocedure. The elemental analyses were performed using inductively coupled plasmaatomic emission spectroscopy (ICP-AES) (type: Spectro Ciros, Spectro AnalyticalInstruments GmbH). Anion concentrations (Cl�, SO4
2�, NO2�, NO3
�) were analyzed bymeans of ion chromatography, using a DX500 (Dionex GmbH) and following the ENISO 10304-2 and DIN 38405-19 protocols.
In addition, porewaterwas sampled in discrete sampling campaigns.Water fromthe filter was pumped (peristaltic pump, type: REGLO digital, Ismatec) from ninepoints distributed along the flow path (0.9m, 2.5 m, 4.1m) and the depth of the filter(20 cm, 30 cm, 40 cm). Sample preparation and analysis of organic compounds wereperformed according to Reiche et al. (2010). Briefly, microbial degradation processeswere inhibited by adding NaN3 (final concentration 0.65 g/L), and bromobenzene-d5(final concentration 250 mg/L) was used as an internal standard. The samples wereanalyzed using a headspace GC/MS facility (Agilent: G1888; 7890 GC, 5975MS)equippedwith an HP-1MS column (30m� 0.25mm� 1 mm), applying the followingtemperature program: 35 �C (3min), 5 �C/min to 100 �C,15 �C/min to 200 �C (5min).Prior to analysis, samples were equilibrated at 80 �C for 30 min. Concentrationanalyses of cations (NH4
þ, Fe2þ) and anions (NO2�, NO3
�) were carried out as describedabove. The determination of dissolved oxygen and redox potential was performedon-site in a flow-through mode using an optical trace sensor system (polymeroptical fibre, sensor spot FTC-PSt6 and instrument FIBOX-3-trace, PreSens) and redoxelectrodes (Pt/Agþ/AgCl/Cl� type Sentix ORP, WTW).
2.4. Most probable numbers (MPN)
MPN analyses were carried out with R2A mineral medium (Reasoner andGeldreich, 1985) for growth of total aerobic bacteria, with Brunner medium(Vogt et al., 2002) for benzene degraders, and with STNL medium (modified fromRohwerder et al., 2006) containing vitamins and 0.2 mg/L Co2þ for MTBE-degradingbacteria. MPN testing was performed with pore water and extracted cell solution ofgravel. Samples were taken from the groundwater inflow, the planted systems A, Band E, and the unplanted reference (system D), at 4.1 m flow distance and 20 cmdepth in August 2009. Cells were extracted from gravel by a method adapted fromRiis et al. (1998). 6 g gravel (ww) were transferred into 50 ml centrifuge vialscontaining 20ml 0.2% Na4P2O7 (pH¼ 8.5, adjusted with HCl). After vortexing (2min,highest level) and shaking (30 min, room temperature, 200 rpm), the sample washomogenized via ice-cooled sonification (10 min, 50 W, 0.3 s impulses). The super-natant was used for the MPN analysis on 96-well plates. Dilution series (1:10) werecarried out for water samples and extracted cell solution to the lowest dilution 10�8.Plates were incubated in an air-tight tank at 26 �C together with a filter moistenedwith 300 ml of the respective sole carbon source, benzene or MTBE, until no furthergrowth was detected by light transmission measurements (Wallace Victor2, 1420Multilabel Counter, Perkin Elmer).
2.5. Microcosm study
In order to investigate the potential of the microorganisms present in the filtersystems for degrading benzene under aerobic conditions, microcosm studies werecarried out for the planted and unplanted CW in November 2009. Experiments wereperformed with gravel and plant roots. Samples were taken at 4.1 m flow distanceand 15 cm depth. Glass bottles (1.1 L) filled with 300ml Brunnermedium (Vogt et al.,2002), either approx. 27 g gravel (ww) or 7 g of crushed roots (ww), and 50 ml
Table 1Groundwater inflow characteristics based on samples collected through 2 years offield plant operation (July 2007eJuly 2009), including values for total organic carbon(TOC), 5-day biological oxygen demand (BOD5), total organic carbon (TOC), andinorganic carbon (IC).
Parameter caverage (range) [mg/L] Stdev (s) Numberof samples (n)
Benzene 20 (13e32) 3.3 72MTBE 3.7 (1.2e5.9) 0.7 73NH4
þeN 45 (37e63) 3.4 73NO3
� 0.1 (0e6.6) 0.78 73Fe(total) 6.0 (0.6e9.1) 1.3 74Fe2þ 5.6 (0.2e9.7) 2.2 73SO4
2- 8.0 (1.5e27.6) 6.1 74PO4
2- 1.4 (0.1e2.7) 0.7 72Dissolved O2
a 0.005 (�) e e
Ehb �460(�) e e
COD 114 (79e130) 13 71BOD5 58 (34e93) 14 68TOC 39 (25e50) 5 65IC 281 (261e314) 15 27
a Oxygen sensor (TriOxmatic� 700 IQ, WTW), measured every 15 min.b pH/redox sensor (pH/redox SensoLyt� 700 IQ, WTW), measured every 15 min.
Table 2Constructed wetland characteristics.
System A B C D E
Gravel (2e3.2 mm)a � � � � e
Additive: activated carbon e 0.1 %-wt e e e
Additive: ferric oxide e e 0.5 %-wt e e
Phragmites australis � � � e �Inflow rate (Q) [L/h] 6.0 6.0 6.0 6.0 6.9Water level [cm] 40 40 40 40 15
a Height of the gravel filter: 50 cm.
E.M. Seeger et al. / Environmental Pollution 159 (2011) 3769e37763770
24 Chapter 2 – Paper I
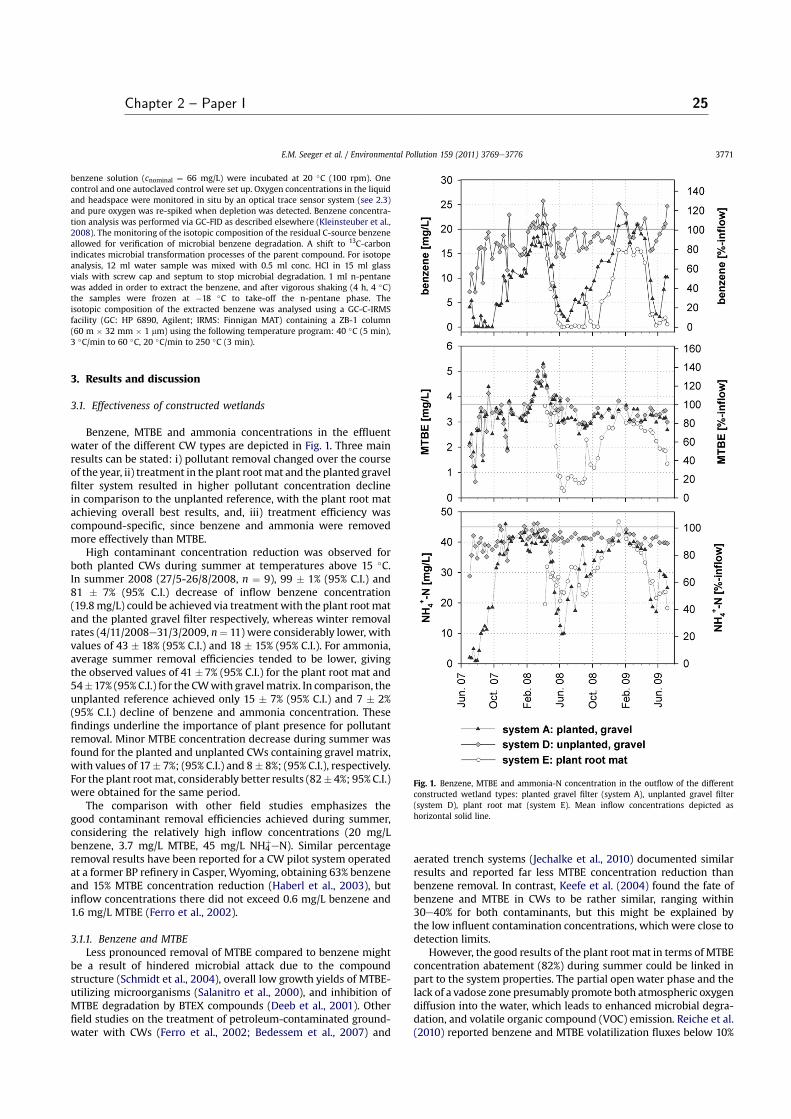
benzene solution (cnominal ¼ 66 mg/L) were incubated at 20 �C (100 rpm). Onecontrol and one autoclaved control were set up. Oxygen concentrations in the liquidand headspace were monitored in situ by an optical trace sensor system (see 2.3)and pure oxygen was re-spiked when depletion was detected. Benzene concentra-tion analysis was performed via GC-FID as described elsewhere (Kleinsteuber et al.,2008). The monitoring of the isotopic composition of the residual C-source benzeneallowed for verification of microbial benzene degradation. A shift to 13C-carbonindicates microbial transformation processes of the parent compound. For isotopeanalysis, 12 ml water sample was mixed with 0.5 ml conc. HCl in 15 ml glassvials with screw cap and septum to stop microbial degradation. 1 ml n-pentanewas added in order to extract the benzene, and after vigorous shaking (4 h, 4 �C)the samples were frozen at �18 �C to take-off the n-pentane phase. Theisotopic composition of the extracted benzene was analysed using a GC-C-IRMSfacility (GC: HP 6890, Agilent; IRMS: Finnigan MAT) containing a ZB-1 column(60 m � 32 mm � 1 mm) using the following temperature program: 40 �C (5 min),3 �C/min to 60 �C, 20 �C/min to 250 �C (3 min).
3. Results and discussion
3.1. Effectiveness of constructed wetlands
Benzene, MTBE and ammonia concentrations in the effluentwater of the different CW types are depicted in Fig. 1. Three mainresults can be stated: i) pollutant removal changed over the courseof the year, ii) treatment in the plant rootmat and the planted gravelfilter system resulted in higher pollutant concentration declinein comparison to the unplanted reference, with the plant root matachieving overall best results, and, iii) treatment efficiency wascompound-specific, since benzene and ammonia were removedmore effectively than MTBE.
High contaminant concentration reduction was observed forboth planted CWs during summer at temperatures above 15 �C.In summer 2008 (27/5-26/8/2008, n ¼ 9), 99 � 1% (95% C.I.) and81 � 7% (95% C.I.) decrease of inflow benzene concentration(19.8mg/L) could be achieved via treatment with the plant rootmatand the planted gravel filter respectively, whereas winter removalrates (4/11/2008e31/3/2009, n¼ 11) were considerably lower, withvalues of 43 � 18% (95% C.I.) and 18 � 15% (95% C.I.). For ammonia,average summer removal efficiencies tended to be lower, givingthe observed values of 41 �7% (95% C.I.) for the plant root mat and54�17% (95% C.I.) for the CWwith gravelmatrix. In comparison, theunplanted reference achieved only 15 � 7% (95% C.I.) and 7 � 2%(95% C.I.) decline of benzene and ammonia concentration. Thesefindings underline the importance of plant presence for pollutantremoval. Minor MTBE concentration decrease during summer wasfound for the planted and unplanted CWs containing gravel matrix,with values of 17� 7%; (95% C.I.) and 8� 8%; (95% C.I.), respectively.For the plant rootmat, considerably better results (82� 4%; 95% C.I.)were obtained for the same period.
The comparison with other field studies emphasizes thegood contaminant removal efficiencies achieved during summer,considering the relatively high inflow concentrations (20 mg/Lbenzene, 3.7 mg/L MTBE, 45 mg/L NH4
þeN). Similar percentageremoval results have been reported for a CW pilot system operatedat a former BP refinery in Casper, Wyoming, obtaining 63% benzeneand 15% MTBE concentration reduction (Haberl et al., 2003), butinflow concentrations there did not exceed 0.6 mg/L benzene and1.6 mg/L MTBE (Ferro et al., 2002).
3.1.1. Benzene and MTBELess pronounced removal of MTBE compared to benzene might
be a result of hindered microbial attack due to the compoundstructure (Schmidt et al., 2004), overall low growth yields of MTBE-utilizing microorganisms (Salanitro et al., 2000), and inhibition ofMTBE degradation by BTEX compounds (Deeb et al., 2001). Otherfield studies on the treatment of petroleum-contaminated ground-water with CWs (Ferro et al., 2002; Bedessem et al., 2007) and
aerated trench systems (Jechalke et al., 2010) documented similarresults and reported far less MTBE concentration reduction thanbenzene removal. In contrast, Keefe et al. (2004) found the fate ofbenzene and MTBE in CWs to be rather similar, ranging within30e40% for both contaminants, but this might be explained bythe low influent contamination concentrations, which were close todetection limits.
However, the good results of the plant root mat in terms of MTBEconcentration abatement (82%) during summer could be linked inpart to the system properties. The partial open water phase and thelack of a vadose zone presumably promote both atmospheric oxygendiffusion into the water, which leads to enhanced microbial degra-dation, and volatile organic compound (VOC) emission. Reiche et al.(2010) reported benzene and MTBE volatilization fluxes below 10%
Fig. 1. Benzene, MTBE and ammonia-N concentration in the outflow of the differentconstructed wetland types: planted gravel filter (system A), unplanted gravel filter(system D), plant root mat (system E). Mean inflow concentrations depicted ashorizontal solid line.
E.M. Seeger et al. / Environmental Pollution 159 (2011) 3769e3776 3771
Chapter 2 – Paper I 25
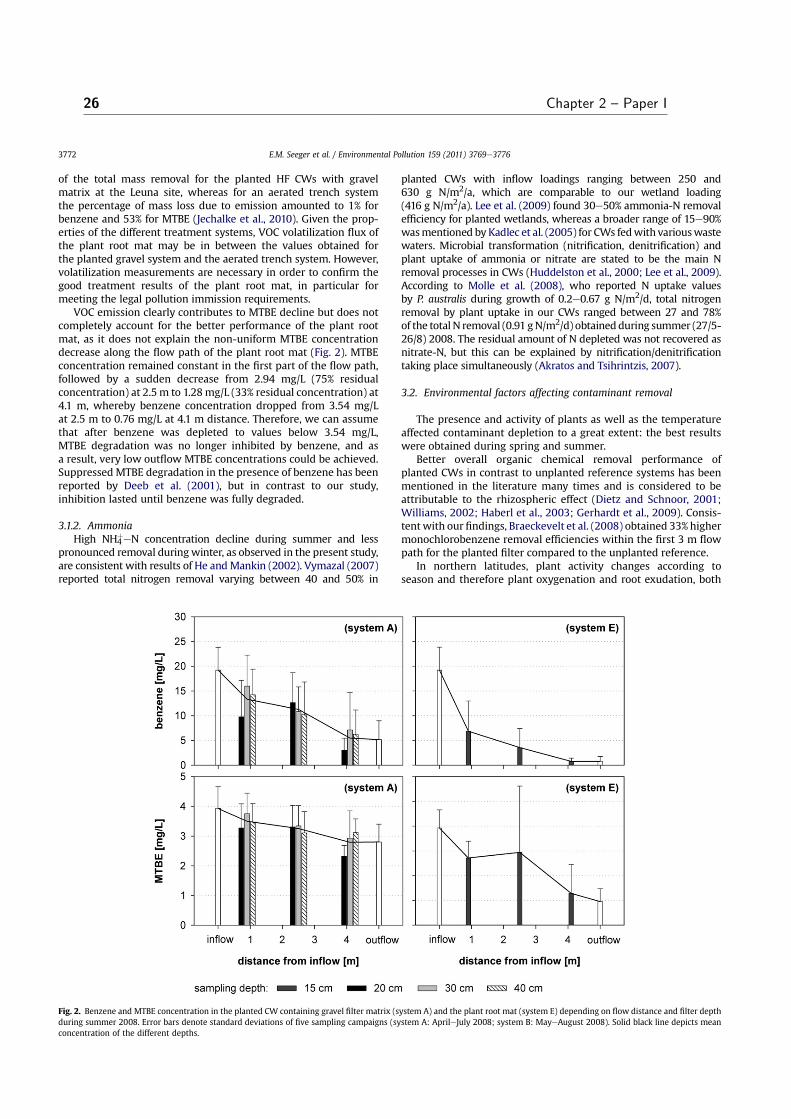
of the total mass removal for the planted HF CWs with gravelmatrix at the Leuna site, whereas for an aerated trench systemthe percentage of mass loss due to emission amounted to 1% forbenzene and 53% for MTBE (Jechalke et al., 2010). Given the prop-erties of the different treatment systems, VOC volatilization flux ofthe plant root mat may be in between the values obtained forthe planted gravel system and the aerated trench system. However,volatilization measurements are necessary in order to confirm thegood treatment results of the plant root mat, in particular formeeting the legal pollution immission requirements.
VOC emission clearly contributes to MTBE decline but does notcompletely account for the better performance of the plant rootmat, as it does not explain the non-uniform MTBE concentrationdecrease along the flow path of the plant root mat (Fig. 2). MTBEconcentration remained constant in the first part of the flow path,followed by a sudden decrease from 2.94 mg/L (75% residualconcentration) at 2.5m to 1.28mg/L (33% residual concentration) at4.1 m, whereby benzene concentration dropped from 3.54 mg/Lat 2.5 m to 0.76 mg/L at 4.1 m distance. Therefore, we can assumethat after benzene was depleted to values below 3.54 mg/L,MTBE degradation was no longer inhibited by benzene, and asa result, very low outflow MTBE concentrations could be achieved.Suppressed MTBE degradation in the presence of benzene has beenreported by Deeb et al. (2001), but in contrast to our study,inhibition lasted until benzene was fully degraded.
3.1.2. AmmoniaHigh NH4
þeN concentration decline during summer and lesspronounced removal duringwinter, as observed in the present study,are consistent with results of He andMankin (2002). Vymazal (2007)reported total nitrogen removal varying between 40 and 50% in
planted CWs with inflow loadings ranging between 250 and630 g N/m2/a, which are comparable to our wetland loading(416 g N/m2/a). Lee et al. (2009) found 30e50% ammonia-N removalefficiency for planted wetlands, whereas a broader range of 15e90%wasmentioned by Kadlec et al. (2005) for CWs fedwith variouswastewaters. Microbial transformation (nitrification, denitrification) andplant uptake of ammonia or nitrate are stated to be the main Nremoval processes in CWs (Huddelston et al., 2000; Lee et al., 2009).According to Molle et al. (2008), who reported N uptake valuesby P. australis during growth of 0.2e0.67 g N/m2/d, total nitrogenremoval by plant uptake in our CWs ranged between 27 and 78%of the total N removal (0.91 gN/m2/d) obtained during summer (27/5-26/8) 2008. The residual amount of N depleted was not recovered asnitrate-N, but this can be explained by nitrification/denitrificationtaking place simultaneously (Akratos and Tsihrintzis, 2007).
3.2. Environmental factors affecting contaminant removal
The presence and activity of plants as well as the temperatureaffected contaminant depletion to a great extent: the best resultswere obtained during spring and summer.
Better overall organic chemical removal performance ofplanted CWs in contrast to unplanted reference systems has beenmentioned in the literature many times and is considered to beattributable to the rhizospheric effect (Dietz and Schnoor, 2001;Williams, 2002; Haberl et al., 2003; Gerhardt et al., 2009). Consis-tentwith our findings, Braeckevelt et al. (2008) obtained 33% highermonochlorobenzene removal efficiencies within the first 3 m flowpath for the planted filter compared to the unplanted reference.
In northern latitudes, plant activity changes according toseason and therefore plant oxygenation and root exudation, both
Fig. 2. Benzene and MTBE concentration in the planted CW containing gravel filter matrix (system A) and the plant root mat (system E) depending on flow distance and filter depthduring summer 2008. Error bars denote standard deviations of five sampling campaigns (system A: AprileJuly 2008; system B: MayeAugust 2008). Solid black line depicts meanconcentration of the different depths.
E.M. Seeger et al. / Environmental Pollution 159 (2011) 3769e37763772
26 Chapter 2 – Paper I
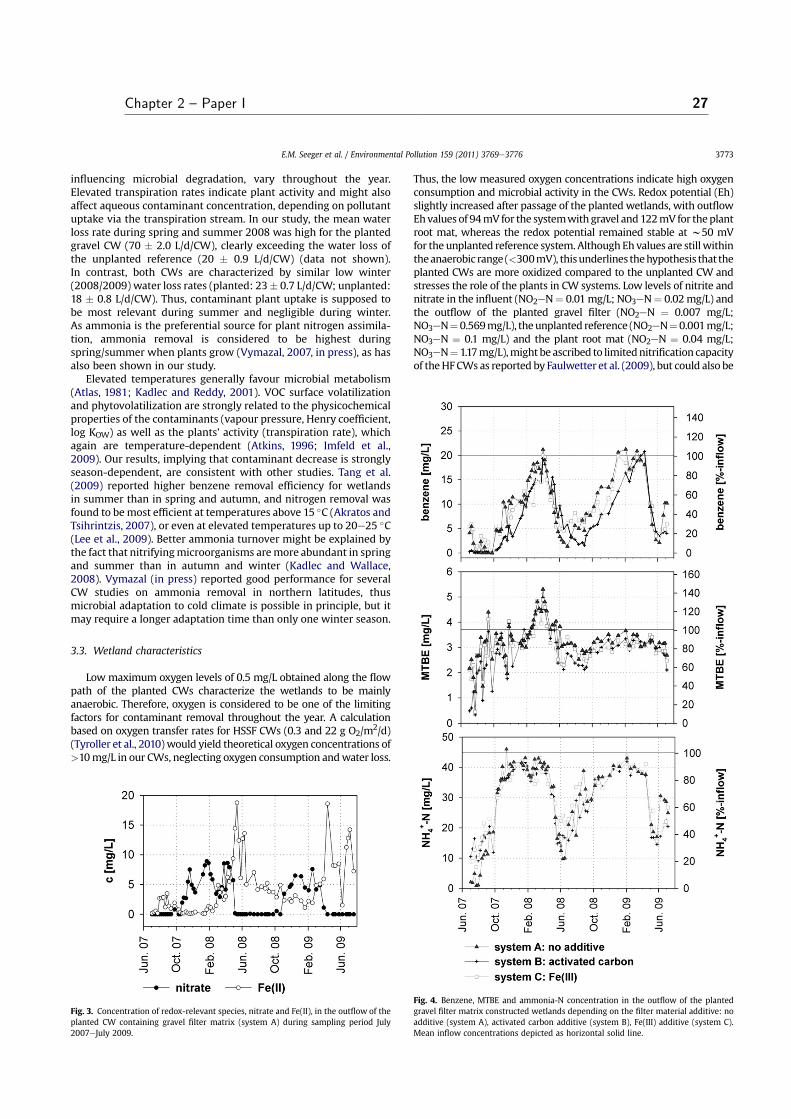
influencing microbial degradation, vary throughout the year.Elevated transpiration rates indicate plant activity and might alsoaffect aqueous contaminant concentration, depending on pollutantuptake via the transpiration stream. In our study, the mean waterloss rate during spring and summer 2008 was high for the plantedgravel CW (70 � 2.0 L/d/CW), clearly exceeding the water loss ofthe unplanted reference (20 � 0.9 L/d/CW) (data not shown).In contrast, both CWs are characterized by similar low winter(2008/2009) water loss rates (planted: 23� 0.7 L/d/CW; unplanted:18 � 0.8 L/d/CW). Thus, contaminant plant uptake is supposed tobe most relevant during summer and negligible during winter.As ammonia is the preferential source for plant nitrogen assimila-tion, ammonia removal is considered to be highest duringspring/summer when plants grow (Vymazal, 2007, in press), as hasalso been shown in our study.
Elevated temperatures generally favour microbial metabolism(Atlas, 1981; Kadlec and Reddy, 2001). VOC surface volatilizationand phytovolatilization are strongly related to the physicochemicalproperties of the contaminants (vapour pressure, Henry coefficient,log KOW) as well as the plants’ activity (transpiration rate), whichagain are temperature-dependent (Atkins, 1996; Imfeld et al.,2009). Our results, implying that contaminant decrease is stronglyseason-dependent, are consistent with other studies. Tang et al.(2009) reported higher benzene removal efficiency for wetlandsin summer than in spring and autumn, and nitrogen removal wasfound to bemost efficient at temperatures above 15 �C (Akratos andTsihrintzis, 2007), or even at elevated temperatures up to 20e25 �C(Lee et al., 2009). Better ammonia turnover might be explained bythe fact that nitrifyingmicroorganisms aremore abundant in springand summer than in autumn and winter (Kadlec and Wallace,2008). Vymazal (in press) reported good performance for severalCW studies on ammonia removal in northern latitudes, thusmicrobial adaptation to cold climate is possible in principle, but itmay require a longer adaptation time than only one winter season.
3.3. Wetland characteristics
Low maximum oxygen levels of 0.5 mg/L obtained along the flowpath of the planted CWs characterize the wetlands to be mainlyanaerobic. Therefore, oxygen is considered to be one of the limitingfactors for contaminant removal throughout the year. A calculationbased on oxygen transfer rates for HSSF CWs (0.3 and 22 g O2/m2/d)(Tyroller et al., 2010)would yield theoretical oxygen concentrations of>10mg/L in our CWs, neglecting oxygen consumption andwater loss.
Thus, the low measured oxygen concentrations indicate high oxygenconsumption and microbial activity in the CWs. Redox potential (Eh)slightly increased after passage of the planted wetlands, with outflowEhvalues of 94mV for the systemwith gravel and122mV for theplantroot mat, whereas the redox potential remained stable at w50 mVfor the unplanted reference system. Although Eh values are still withintheanaerobic range (<300mV), thisunderlines thehypothesis that theplanted CWs are more oxidized compared to the unplanted CW andstresses the role of the plants in CW systems. Low levels of nitrite andnitrate in the influent (NO2eN¼ 0.01mg/L; NO3eN¼ 0.02mg/L) andthe outflow of the planted gravel filter (NO2eN ¼ 0.007 mg/L;NO3eN¼0.569mg/L), theunplanted reference (NO2eN¼0.001mg/L;NO3eN ¼ 0.1 mg/L) and the plant root mat (NO2eN ¼ 0.04 mg/L;NO3eN¼ 1.17mg/L),might be ascribed to limitednitrification capacityof theHFCWs as reported by Faulwetter et al. (2009), but could also be
Fig. 3. Concentration of redox-relevant species, nitrate and Fe(II), in the outflow of theplanted CW containing gravel filter matrix (system A) during sampling period July2007eJuly 2009.
Fig. 4. Benzene, MTBE and ammonia-N concentration in the outflow of the plantedgravel filter matrix constructed wetlands depending on the filter material additive: noadditive (system A), activated carbon additive (system B), Fe(III) additive (system C).Mean inflow concentrations depicted as horizontal solid line.
E.M. Seeger et al. / Environmental Pollution 159 (2011) 3769e3776 3773
Chapter 2 – Paper I 27
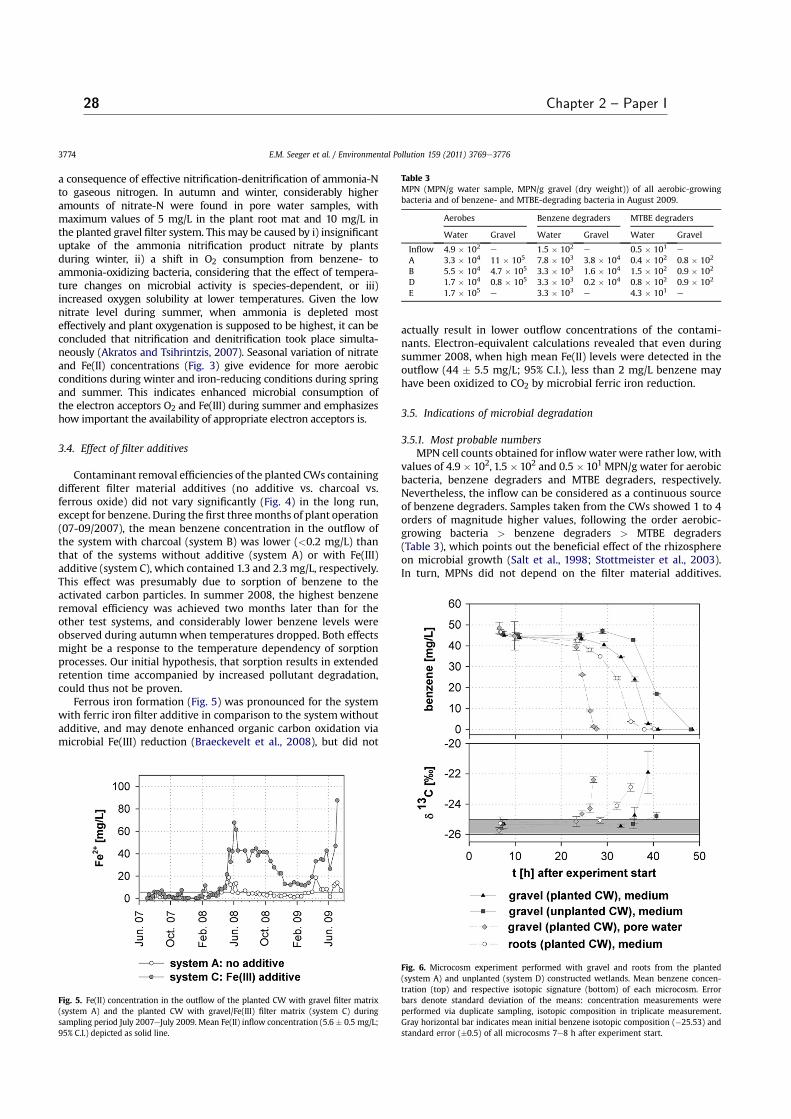
a consequence of effective nitrification-denitrification of ammonia-Nto gaseous nitrogen. In autumn and winter, considerably higheramounts of nitrate-N were found in pore water samples, withmaximum values of 5 mg/L in the plant root mat and 10 mg/L inthe planted gravel filter system. This may be caused by i) insignificantuptake of the ammonia nitrification product nitrate by plantsduring winter, ii) a shift in O2 consumption from benzene- toammonia-oxidizing bacteria, considering that the effect of tempera-ture changes on microbial activity is species-dependent, or iii)increased oxygen solubility at lower temperatures. Given the lownitrate level during summer, when ammonia is depleted mosteffectively and plant oxygenation is supposed to be highest, it can beconcluded that nitrification and denitrification took place simulta-neously (Akratos and Tsihrintzis, 2007). Seasonal variation of nitrateand Fe(II) concentrations (Fig. 3) give evidence for more aerobicconditions during winter and iron-reducing conditions during springand summer. This indicates enhanced microbial consumption ofthe electron acceptors O2 and Fe(III) during summer and emphasizeshow important the availability of appropriate electron acceptors is.
3.4. Effect of filter additives
Contaminant removal efficiencies of the planted CWs containingdifferent filter material additives (no additive vs. charcoal vs.ferrous oxide) did not vary significantly (Fig. 4) in the long run,except for benzene. During the first threemonths of plant operation(07-09/2007), the mean benzene concentration in the outflow ofthe system with charcoal (system B) was lower (<0.2 mg/L) thanthat of the systems without additive (system A) or with Fe(III)additive (system C), which contained 1.3 and 2.3 mg/L, respectively.This effect was presumably due to sorption of benzene to theactivated carbon particles. In summer 2008, the highest benzeneremoval efficiency was achieved two months later than for theother test systems, and considerably lower benzene levels wereobserved during autumnwhen temperatures dropped. Both effectsmight be a response to the temperature dependency of sorptionprocesses. Our initial hypothesis, that sorption results in extendedretention time accompanied by increased pollutant degradation,could thus not be proven.
Ferrous iron formation (Fig. 5) was pronounced for the systemwith ferric iron filter additive in comparison to the systemwithoutadditive, and may denote enhanced organic carbon oxidation viamicrobial Fe(III) reduction (Braeckevelt et al., 2008), but did not
actually result in lower outflow concentrations of the contami-nants. Electron-equivalent calculations revealed that even duringsummer 2008, when high mean Fe(II) levels were detected in theoutflow (44 � 5.5 mg/L; 95% C.I.), less than 2 mg/L benzene mayhave been oxidized to CO2 by microbial ferric iron reduction.
3.5. Indications of microbial degradation
3.5.1. Most probable numbersMPN cell counts obtained for inflowwater were rather low, with
values of 4.9 � 102, 1.5 � 102 and 0.5 � 101 MPN/g water for aerobicbacteria, benzene degraders and MTBE degraders, respectively.Nevertheless, the inflow can be considered as a continuous sourceof benzene degraders. Samples taken from the CWs showed 1 to 4orders of magnitude higher values, following the order aerobic-growing bacteria > benzene degraders > MTBE degraders(Table 3), which points out the beneficial effect of the rhizosphereon microbial growth (Salt et al., 1998; Stottmeister et al., 2003).In turn, MPNs did not depend on the filter material additives.
Fig. 5. Fe(II) concentration in the outflow of the planted CW with gravel filter matrix(system A) and the planted CW with gravel/Fe(III) filter matrix (system C) duringsampling period July 2007eJuly 2009. Mean Fe(II) inflow concentration (5.6 � 0.5 mg/L;95% C.I.) depicted as solid line.
Table 3MPN (MPN/g water sample, MPN/g gravel (dry weight)) of all aerobic-growingbacteria and of benzene- and MTBE-degrading bacteria in August 2009.
Aerobes Benzene degraders MTBE degraders
Water Gravel Water Gravel Water Gravel
Inflow 4.9 � 102 e 1.5 � 102 e 0.5 � 101 e
A 3.3 � 104 11 � 105 7.8 � 103 3.8 � 104 0.4 � 102 0.8 � 102
B 5.5 � 104 4.7 � 105 3.3 � 103 1.6 � 104 1.5 � 102 0.9 � 102
D 1.7 � 104 0.8 � 105 3.3 � 103 0.2 � 104 0.8 � 102 0.9 � 102
E 1.7 � 105 e 3.3 � 103 e 4.3 � 101 e
Fig. 6. Microcosm experiment performed with gravel and roots from the planted(system A) and unplanted (system D) constructed wetlands. Mean benzene concen-tration (top) and respective isotopic signature (bottom) of each microcosm. Errorbars denote standard deviation of the means: concentration measurements wereperformed via duplicate sampling, isotopic composition in triplicate measurement.Gray horizontal bar indicates mean initial benzene isotopic composition (�25.53) andstandard error (�0.5) of all microcosms 7e8 h after experiment start.
E.M. Seeger et al. / Environmental Pollution 159 (2011) 3769e37763774
28 Chapter 2 – Paper I
According to common acceptance that filter material promotesbacterial biofilm formation (Sundberg et al., 2007), higher bacterialnumbers (MPN/g) were obtained for gravel than for water samples.For MPNs performed with the substrate MTBE, only minimalbacterial growth was detected, which may be attributed to residualbenzene from the wetland inoculums. MPNs for aerobic benzenedegraders ranged from 3.3 � 103 to 7.8 � 103 MPN/g for watersamples and from 0.2 � 104 to 3.8 � 104 MPN/g for gravel samples.For the water samples, these findings are in agreement with theresults of Jechalke et al. (2010), who investigated the treatmentperformance of aerated trench systems at the Leuna plant.
3.5.2. Microbial benzene degradation microcosm experimentIn the aerobic microcosms study, benzene consumption started
after a lag phase of 25e35 h and the pollutant was eliminatedcompletely after 35e48 h (Fig. 6). Earliest and fastest turnover wasobtained for the microcosm containing gravel from the planted CWand pore water instead of mineral medium. For all microcosmsexcept the one carried out with gravel from the unplanted CW, thedecrease of benzene concentration correlated with a significantshift in carbon isotope composition of residual benzene towardsheavier isotopes, proving microbial degradation (Fig. 6). The shift ofd13C of about 2.8e3.4& demonstrated the benzene degradationpotential of the microorganism present in the pore water, on thefilter material and on/in the roots of P. australis, since a significantincrease in d13C/12C of the parent compound is generally consideredas a proof of microbial contaminant degradation (Hunkeler et al.,2001; Meckenstock et al., 2004).
4. Conclusions
The following conclusions can be drawn from this study:
� Treatment performance of HF CWs was highest during spring/summer at temperatures above 15 �C, when plants weregrowing.
� For the CW with gravel filter, high removal efficiencies werefound for benzene (81%) and ammonia (54%), whereas lowMTBE depletion (17%) was observed.
� The plant root mat achieved higher organic pollutant concen-tration decrease than the gravel filter system. Maximumsummer removal efficiencies of 99%, 82% and 41% were ach-ieved for benzene, MTBE and ammonia, respectively, showingthat the plant root mat is a promising alternative to conven-tional CWs.
� Oxygen is considered to be one of the limiting factors forcontaminant turnover in both wetland types, given low oxygenconcentrations (<0.5 mg/L).
� Activated carbon and ferric oxide filter material additives didnot promote contaminant removal in the long term, althoughsorption occurred and elevated ferrous iron formation indi-cated microbial iron(III) reduction.
� Microbial benzene degradation potential could be proven in anaerobic microcosm study by a shift in carbon isotope fraction-ation of þ2.8e4.3&, as well as high MPN counts for benzenedegraders in water (3.3 � 103 to 7.8 � 103 MPN/g) and gravel(0.2 � 104 to 3.8 � 104 MPN/g) samples.
The results of the study showHF CWs to be an efficient treatmentmethod for the remediation of chemically contaminated waters andpoint out that plant root mat systems are a promising alternativeto conventional solid filter matrix HF CWs. In order to confirmthe good treatment results of the plant root mat and to investigatecontaminant fate, emission measurements and mass balancestudies for benzene and MTBE in HF CW (with and without gravel
matrix) are currently in progress and will be published hereafter.Since the supply with electron acceptors did not promote contam-inant removal, future experiments will deal with the optimization ofthe removal efficiency with respect to technical approaches, e.g.tidal flowmode as well as coupling of vertical and horizontal filters.
Acknowledgements
This work was supported by the Helmholtz Centre for Environ-mental Research e UFZ within the scope of the SAFIRA II ResearchProgramme (Revitalization of Contaminated Land and Groundwaterat Megasites, subproject “Compartment TransfereCoTra”).
References
Akratos, C.S., Tsihrintzis, V.A., 2007. Effect of temperature, HRT, vegetation andporous media on removal efficiency of pilot-scale horizontal subsurface flowconstructed wetlands. Ecol. Eng. 29, 173e191.
Atkins, P.W., 1996. Physikalische Chemie, Zweite Auflage. VCH VerlagsgesellschaftmbH, Weinheidem, Bunderepublik Deutschland.
Atlas, R.M., 1981. Microbial degradation of petroleum hydrocarbons: an environ-mental perspective. FEMS Microbiol. Rev. 45 (1), 180e209.
Barac, T., Taghavi, S., Borremans, B., Provoost, A., Oeyen, L., Colpaert, J.V.,Vangronsveld, J., van der Lelie, D., 2004. Engineered endophytic bacteria improvephytoremediation of water-soluble, volatile, organic pollutants. Nat. Biotechnol.22 (5), 583e588.
Bedessem, M.E., Ferro, A.M., Hiegel, T., 2007. Pilot-scale constructed wetlands forpetroleum-contaminated groundwater. Water Environ. Res. 79 (6), 581e586.
Braeckevelt,M.,Mirschel, G.,Wiessner, A., Rueckert,M., Reiche, N., Vogt, C., Schultze, A.,Paschke, H., Kuschk, P., Kaestner, M., 2008. Treatment of chlorobenzene-contaminated groundwater in a pilot-scale constructed wetland. Ecol. Eng. 33,45e53.
Deeb, R.A., Hu, H.-Y., Hanson, J.R., Scow, K.M., Alvarez-Cohen, L., 2001. Substrateinteractions in BTEX and MTBE mixtures by an MTBE-degrading isolate.Environ. Sci. Technol. 35 (2), 312e317.
Dietz, A.C., Schnoor, J.L., 2001. Advances in phytoremediation. Environ. HealthPerspect. 109 (1), 163e168.
Farhadian, M., Vachelard, C., Duchez, D., Larroche, C., 2008. In situ bioremediation ofmonoaromatic pollutants in groundwater: a review. Bioresour. Technol. 99,5296e5308.
Faulwetter, J.L., Gagnon, V., Sundberg, C., Chazarenc, F., Burr, M.D., Brisson, J.,Camper, A.K., Stein, O.R., 2009. Microbial processes influencing performance oftreatment wetlands: a review. Ecol. Eng. 35, 987e1004.
Ferro, A.M., Kadlec, R.H., Deschamp, J., 2002. Constructed wetland system to treatwastewater at the BP Amoco former Casper refinery: pilot scale project. The 9thInternational Petroleum Environmental Conference. Albuquerque, NM.
Gerhardt, K.E., Huang, X.-D., Glick, B.R., Greenberg, B.M., 2009. Phytoremediationand rhizoremediation of organic soil contaminants: potential and challenges.Plant Sci. 176, 20e30.
Haberl, R., Grego, S., Langergraber, G., Kadlec, R.H., Cicalini, A.-R., Dias, S.M.,Novais, J.M., Aubert, S., Gerth, A., Thomas, H., Hebner, A., 2003. Constructedwetlands for treatment of organic pollutants. J. Soils Sediments 3 (2), 109e124.
He, Q., Mankin, K.R., 2002. Performance variations of COD and nitrogen removal byvegetated submerged bed wetlands. J. Am. Water Resour. As 38 (6), 1679e1689.
Huddelston, G.M., Gillespie, W.B., Rodgers, J.H., 2000. Using constructed wetlands totreat biochemical oxygen demand and ammonia associated with a refineryeffluent. Ecotoxicol. Environ. Saf. 45, 188e193.
Hunkeler, D., Andersen, N., Aravena, R., Bernasconi, S.M., Butler, B.J., 2001. Hydrogenand carbon isotope fractionation during aerobic biodegradation of benzene.Environ. Sci. Technol. 35, 3462e3467.
Imfeld, G., Braeckevelt, M., Kuschk, P., Richnow, H.H., 2009. Monitoring andassessing processes of organic chemicals removal in constructed wetlands.Chemosphere 74, 349e362.
Jechalke, S., Vogt, C., Reiche, N., Frachini, A.G., Borsdorf, H., Neu, T.R., Richnow, H.H.,2010. Aerated treatment pond technology with biofilm promoting mats for thebioremediation of benzene, MTBE and ammonium contaminated groundwater.Water Res. 44, 1785e1796.
Kadlec, R.H., Reddy, K.R., 2001. Temperature effects in treatment wetlands. WaterEnviron. Res. 73 (5), 543e557.
Kadlec, R.H., Wallace, S.D., 2008. Treatment Wetlands, second ed. CRC Press,Taylor&Francis Group, Boca Raton, USA.
Kadlec, R.H., Tanner, C.C., Hally, V.M., Gibbs, M.M., 2005. Nitrogen spiralling insubsurface-flow constructed wetlands: implications for treatment response.Ecol. Eng. 25, 365e381.
Keefe, S.H., Barber, L.B., Runkel, R.L., Ryan, J.N., 2004. Fate of volatile organiccompounds in constructed wastewater treatment wetlands. Environ. Sci.Technol. 38, 2209e2216.
Kleinsteuber, S., Schleinitz, K.M., Breitfeld, J., Harms, H., Richnow, H.H., Vogt, C.,2008. Molecular characterization of bacterial communities mineralizingbenzene under sulfate-reducing conditions. FEMS Microbiol. Ecol. 66, 143e157.
E.M. Seeger et al. / Environmental Pollution 159 (2011) 3769e3776 3775
Chapter 2 – Paper I 29
Lee, C., Fletcher, T.D., Sun, G., 2009. Nitrogen removal in constructed wetlandsystems. Eng. Life Sci. 9 (1), 11e22.
Meckenstock, R.U., Morasch, B., Griebler, C., Richnow, H.H., 2004. Stable isotopefractionation analysis as a tool to monitor biodegradation in contaminatedaquifers. J. Contam. Hydrol 75, 215e255.
Mehmannavaz, R., Prasher, S.O., Ahmad, D., 2002. Rhizospheric effects of alfalfa onbiotransformation of polychlorinated biphenyls in a contaminated soilaugmented with Sinorhizobium meliloti. Process Biochem. 37, 955e963.
Molle, P., Prost-Boucle, S., Lienard, A., 2008. Potential for total nitrogen removal bycombining vertical flow and horizontal flow constructed wetlands: a full-scaleexperiment study. Ecol. Eng. 34, 23e29.
Moore, B.J., Headley, J.V., Dupont, R.R., Doucette, W.D., Armstrong, J.E., 2002.Abatement of gas-condensate hydrocarbons in a natural wetland. J. Environ. Sci.Health Part A 37 (4), 425e438.
Nurk, K., Zaytsev, I., Talpsep, I., Truu, J., Mander, Ü, 2009. Bioaugmentation ina newly established LECA-based horizontal flow soil filter reduces the adapta-tion period and enhances denitrification. Bioresour. Technol. 100, 6284e6289.
Reasoner, D.J., Geldreich, E.E., 1985. A new medium for the enumeration andsubculture of bacteria from potable water. Appl. Environ. Microbiol. 49 (1), 1e7.
Reiche, N., Lorenz, W., Borsdorf, H., 2010. Development and application of dynamicair chambers formeasurement of volatilizationfluxes of benzene andMTBE fromconstructed wetlands planted with common reed. Chemosphere 79, 162e168.
Riis, V., Lorbeer, H., Babel, W., 1998. Extraction of microorganisms from soil:evaluation of the efficiency by counting methods and activity measurements.Soil Biol. Biochem. 30 (12), 1573.
Rohwerder, T., Breuer, U., Benndorf, D., Lechner, U., Muller, R.H., 2006. The alkyl tert--butyl ether intermediate 2-hydroxyisobutyrate is degraded via a novel cobalamin-dependent mutase pathway. Appl. Environ. Microbiol. 72 (6), 4128e4135.
Salanitro, J.P., Johnson, P.C., Spinnler, G.E., Maner, P.M., Wisniewski, H.L., Bruce, C.,2000. Field-scale demonstration of enhanced MTBE bioremediation throughaquifer bioaugmentation and oxygenation. Environ. Sci. Technol. 34, 4152e4162.
Salt, D.E., Smith, R.D., Raskin, I., 1998. Phytoremediation. Annu. Rev. Plant Phys. 49,643e668.
Schmidt, T.C., Schirmer, M., Weiß, H., Haderlein, S.B., 2004. Microbial degradation oftert-butyl ether and tert-butyl alcohol in the subsurface. J. Contam. Hydrol 70,173e203.
Singh, O.V., Jain, R.K., 2003. Phytoremediation of toxic aromatic pollutants from soil.Appl. Microbiol. Biotechnol. 63, 128e135.
Stottmeister, U., Wießner, A., Kuschk, P., Kappelmeyer, U., Kästner, M.,Bederski, O., Müller, R.A., Moormann, H., 2003. Effects of plants and micro-organisms in constructed wetlands for wastewater treatment. Biotechnol.Adv. 22, 93e117.
Sundberg, C., Tonderski, K., Lindgren, P.E., 2007. Potential nitrification and denitri-fication and the corresponding composition of the bacterial communities ina compact treating landfill leachates. Water Sci. Technol. 65 (3), 159e166.
Tang, X.Q., Eke, P.E., Scholz, M., Huang, S.L., 2009. Processes impacting on benzeneremoval in vertical-flow constructed wetlands. Bioresour. Technol. 100, 227e234.
Tyroller, L., Rousseau, D.P.L., Santa, S., García, J., 2010. Application of the gas tracermethod for measuring oxygen transfer rates in subsurface flow constructedwetlands. Water Res. 44, 4217e4225.
UBA, 2003. Inventarisierung von Grundwasserschäden und deren Beurteilung inGroßprojekten “Ökologische Altlasten" der neuen Bundesländer. Auftraggeber:Umweltbundesamt. Bearbeiter GICON Großmann Ingenieur Consult GmbH.
Van Epps, A., 2006. U.S. Phytoremediation of petroleum hydrocarbons. Environ-mental Protection Agency.
Vogt, C., Alfreider, A., Lorbeer, H., Ahlheim, J., Feist, B., Boehme, O., Weiss, H.,Babel, W., Wuensche, L., 2002. Two pilot plant reactors designed for the in situbioremediation of chlorobenzene-contaminated ground water: hydrogeologicaland chemical characteristics and bacterial consortia. Water Air Soil Poll.: Focus2, 161e170.
Vymazal, J., Kröpfelová, L., 2008. Wastewater Treatment in Constructed Wetlandswith Horizontal Sub-surface Flow e Environmental Pollution, vol 14. SpringerScience þ Business Media B.V.
Vymazal, J., 2007. Removal of nutrients in various types of constructed wetlands.Sci. Total Environ. 380, 48e65.
Vymazal, J., 2009. The use of constructed wetlands with horizontal sub-surface flowfor various types of wastewater. Ecol. Eng. 35, 1e17.
Vymazal, J., in press. Long-term performance of constructed wetlands with hori-zontal sub-surface flow: ten case studies from the Czech Republic. Ecol. Eng.
Wallace, S., Kadlec, R., 2005. BTEX degradation in cold-climate wetland systems.Water Sci. Technol. 51 (9), 165e171.
Wallace, S.D., 2001. On-site remediation of petroleum contact wastes usingsubsurface flow wetlands. Proceedings of the 2nd International Conference onWetlands and Remediation (Burlington, Vermont).
Williams, J.B., 2002. Phytoremediation on wetland ecosystems: progress, problems,and potential. Crit. Rev. Plant Sci. 21 (6), 607e635.
E.M. Seeger et al. / Environmental Pollution 159 (2011) 3769e37763776
30 Chapter 2 – Paper I
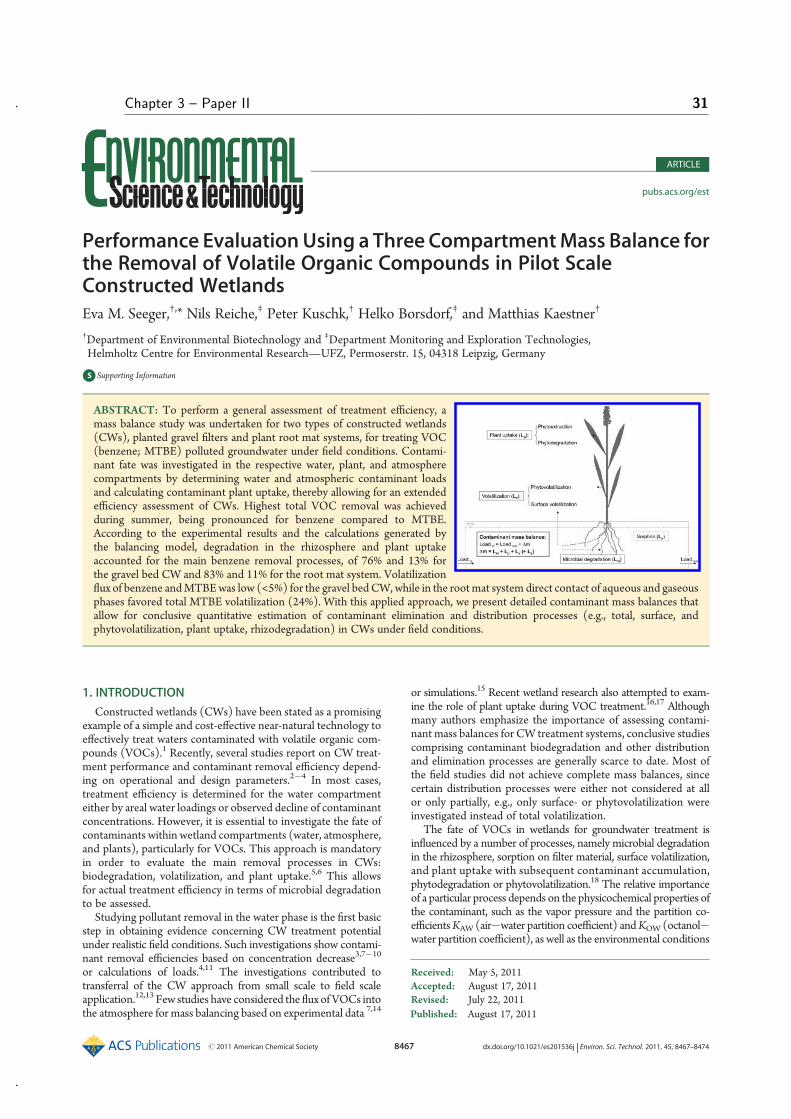
Published: August 17, 2011
r 2011 American Chemical Society 8467 dx.doi.org/10.1021/es201536j | Environ. Sci. Technol. 2011, 45, 8467–8474
ARTICLE
pubs.acs.org/est
Performance EvaluationUsing a Three CompartmentMass Balance forthe Removal of Volatile Organic Compounds in Pilot ScaleConstructed WetlandsEva M. Seeger,†,* Nils Reiche,‡ Peter Kuschk,† Helko Borsdorf,‡ and Matthias Kaestner†
†Department of Environmental Biotechnology and ‡Department Monitoring and Exploration Technologies,Helmholtz Centre for Environmental Research—UFZ, Permoserstr. 15, 04318 Leipzig, Germany
bS Supporting Information
1. INTRODUCTION
Constructed wetlands (CWs) have been stated as a promisingexample of a simple and cost-effective near-natural technology toeffectively treat waters contaminated with volatile organic com-pounds (VOCs).1 Recently, several studies report on CW treat-ment performance and contaminant removal efficiency depend-ing on operational and design parameters.2�4 In most cases,treatment efficiency is determined for the water compartmenteither by areal water loadings or observed decline of contaminantconcentrations. However, it is essential to investigate the fate ofcontaminants within wetland compartments (water, atmosphere,and plants), particularly for VOCs. This approach is mandatoryin order to evaluate the main removal processes in CWs:biodegradation, volatilization, and plant uptake.5,6 This allowsfor actual treatment efficiency in terms of microbial degradationto be assessed.
Studying pollutant removal in the water phase is the first basicstep in obtaining evidence concerning CW treatment potentialunder realistic field conditions. Such investigations show contami-nant removal efficiencies based on concentration decrease3,7�10
or calculations of loads.4,11 The investigations contributed totransferral of the CW approach from small scale to field scaleapplication.12,13 Few studies have considered the flux ofVOCs intothe atmosphere for mass balancing based on experimental data 7,14
or simulations.15 Recent wetland research also attempted to exam-ine the role of plant uptake during VOC treatment.16,17 Althoughmany authors emphasize the importance of assessing contami-nant mass balances for CW treatment systems, conclusive studiescomprising contaminant biodegradation and other distributionand elimination processes are generally scarce to date. Most ofthe field studies did not achieve complete mass balances, sincecertain distribution processes were either not considered at allor only partially, e.g., only surface- or phytovolatilization wereinvestigated instead of total volatilization.
The fate of VOCs in wetlands for groundwater treatment isinfluenced by a number of processes, namely microbial degradationin the rhizosphere, sorption on filter material, surface volatilization,and plant uptake with subsequent contaminant accumulation,phytodegradation or phytovolatilization.18 The relative importanceof a particular process depends on the physicochemical properties ofthe contaminant, such as the vapor pressure and the partition co-efficientsKAW (air�water partition coefficient) andKOW (octanol�water partition coefficient), as well as the environmental conditions
Received: May 5, 2011Accepted: August 17, 2011Revised: July 22, 2011
ABSTRACT: To perform a general assessment of treatment efficiency, amass balance study was undertaken for two types of constructed wetlands(CWs), planted gravel filters and plant root mat systems, for treating VOC(benzene; MTBE) polluted groundwater under field conditions. Contami-nant fate was investigated in the respective water, plant, and atmospherecompartments by determining water and atmospheric contaminant loadsand calculating contaminant plant uptake, thereby allowing for an extendedefficiency assessment of CWs. Highest total VOC removal was achievedduring summer, being pronounced for benzene compared to MTBE.According to the experimental results and the calculations generated bythe balancing model, degradation in the rhizosphere and plant uptakeaccounted for the main benzene removal processes, of 76% and 13% forthe gravel bed CW and 83% and 11% for the root mat system. Volatilizationflux of benzene andMTBEwas low (<5%) for the gravel bedCW,while in the rootmat system direct contact of aqueous and gaseousphases favored total MTBE volatilization (24%). With this applied approach, we present detailed contaminant mass balances thatallow for conclusive quantitative estimation of contaminant elimination and distribution processes (e.g., total, surface, andphytovolatilization, plant uptake, rhizodegradation) in CWs under field conditions.
Chapter 3 – Paper II 31
8468 dx.doi.org/10.1021/es201536j |Environ. Sci. Technol. 2011, 45, 8467–8474
Environmental Science & Technology ARTICLE
(temperature, redox conditions, and oxygen flux) prevailing inthe specific constructed wetland system. For a detailed descrip-tion of the relationship between the physicochemical character-istics and the fate of contaminants, see Imfeld et al.6
Therefore, the objective of our work was to evaluate theperformance of different horizontal subsurface flowCWs treatingVOC contaminated groundwater under field conditions, utilizinga detailed balancing approach. By this, we were able to subdividethe overall removal efficiencies determined from water loadingsinto (i) destructive removal via biodegradation in the rhizosphereand (ii) the nondestructive processes VOC-volatilization (surface-and phytovolatilization) and plant uptake. Our approach is basedupon three key elements: (i) themonitoring of influent and effluentVOC load, (ii) the determination of total VOC volatilization usingdynamic air chambers, and (iii) the calculation of VOC uptake intothe plants. Rhizodegradation is assessed as the difference of totalremoval from water phase and the losses due to plant uptake andvolatilization. This evaluation was conducted for two types of CWs,a conventional wetland with a filter matrix (gravel) and a plant rootmat system without lithospheric solid state material.
2. EXPERIMENTAL SECTION
2.1. Site Description and Pilot Plant Design. At the indus-trial site Leuna (Saxony-Anhalt, Germany), decades of petro-leum refinement led to large-scale contamination of the soil andgroundwater with the fuel constituents benzene and methyl-tert-butyl-ether (MTBE). In 2007, an outdoor pilot plant was builtdown gradient of the contamination plume at the Leuna site, inorder to investigate the remediation efficiency of constructedwetlands (CWs).The CWs (A and B) were designed to operate in horizontal
subsurfaceflowmode and consistedof steel basins (5� 1.1� 0.6m)planted with common reed (Phragmites australis). System A wasfilledwith gravel (grain size 2�3.2mm) up to a height of 50 cm andthe water level was set to 40 cm, resulting in a vadose soil zone of10 cm. System B was designed as a plant root mat (Phragmitesaustralis), only supported by the densely woven root bed and wasoperated at a water depth of 15 cm. An unplanted gravel filterdesigned and operated like systemAwas used as a reference. Inflowand outflow connections were installed 5 cm above the bottom ofthe basins. Inflow water was supplied via a closed nonaeratedholding tank (nHRT: 7 h) from a nearby groundwater well. Duringthe period of investigation (June 2007 to June 2009), the con-centrations of the groundwater contaminants benzene and MTBEwere 19 ( 3.7 and 3.8 ( 0.8 mg L�1, respectively. For othergroundwater inflow characteristics see Table S1 in Supporting In-formation, SI. The hydraulic loading rate was fixed to 6 L h�1
for system A and 6.9 L h�1 for system B, respectively. Hydraulicretention times (nHRT= Vsys/inflow rate) were calculated to 5.3 dfor system A and to 2.7 d for system B. Water inflow and outflowvolumeswere quantified by flowmeters (15-min interval), allowingfor contaminant loading rate to be calculated.Dynamic air chambers (DACs) were mounted on top of the
CWs in order to determine total benzene and MTBE volatiliza-tion from the wetlands in an integral approach. The chamberswere equipped with wind turbines, so realistic environmentalconditions could be simulated within the chambers (air exchangerate > 40 h�1). DAC design and construction has been previouslydescribed in detail.19
2.2. Sampling Procedure and Analysis of Aqueous andGaseousSamples. Inflow and outflowwater samples were collected
at regular intervals, every one to two weeks, and were analyzed induplicate for VOC concentration by a GC�MS system. Samplepreparation and conservation, as well as analyses of organiccompounds, are described elsewhere.20 To determine the organiccompounds, a headspace GC/MS facility (Agilent: auto samplerwith oven 7694, GC 6890, MS 5973) with a HP-1 column(60 m� 0.25 mm�1 μm) was used and the following tempera-ture program was applied: 35 �C (6 min), 4 �C/min to 120 �C,20 �C/min to 280 �C (5 min).The determination of VOC emission rates was performed in
discrete 1�2-week sampling campaigns every 2�3 months allaround the year, in order to investigate meteorological influenceon contaminant volatilization. Atmospheric VOCs were trappedon adsorption tubes, placed in the inlet and outlet tube of theDAC, by means of active gas sampling. After thermal desorption,VOC concentration analysis was performed via a GC�MS system.A detailed description of this process is reported by Reiche et al.19
2.3. Mass Balance and Treatment Removal Efficiency.Calculation of treatment removal efficiency of the CWs for thewater compartment is based upon system-specific influent andeffluent loading rates of the contaminants, and thus accounts forthe water loss due to evapotranspiration (ET).The contaminant mass balance in the constructed wetlands is
maintained as follows:
ACLin ¼ ACLout þ Δm ð1Þ
where ACLin/out (mg m�2 d�1) is the areal contaminant load forthe inflow or outflow, respectively, andΔm is the overall contam-inant mass loss in the water phase. ACLin/out was obtained asfollows:
ACLin=out ¼ A�1 � ∑n
i¼ 1ðcin=outðtiÞ � QΔt, in=outÞ ð2Þ
where c is the contaminant concentration (mg L�1) at the inflow(in) or outflow (out) at a sampling time ti, QΔt,in/out is the averageinflow or outflow water volume (L d�1) between two consecu-tive concentration samplings at time ti and ti+1, and A is thesurface area of the wetland (5.5 m2).The treatment removal efficiency for the water phase Rw (%)
was calculated using eq 3:
Treatment removal efficiency
ðRwÞ ¼ ACLin � ACLoutACLin
� 100 ð3Þ
2.4. Quantitative Assessment of Elimination and Distribu-tion Processes. The overall contaminant mass loss Δm (eq 1)can be split up into the losses microbial degradation in the rhizo-sphere (Lm), volatilization (Lv), including surface volatilization(Lv, surface) and phytovolatilization (Lv, phyto), plant uptake (Lp),photolysis (Lphoto), and sorption on filter material (Ls), see eq 4:
Δm ¼ Lm þ Lv þ Lp þ Lphoto þ Ls ð4Þ
As atmospheric halftimes of benzene andMTBE are long, 7 d 21 and3�6 d,22 respectively, in comparison to the air exchange rate appliedto theDACs (>40 h�1), contaminant photolysis is considered to beinsignificant in our mass balance approach. In addition, net con-taminant loss due to sorption is neglected, since mass calculations
32 Chapter 3 – Paper II
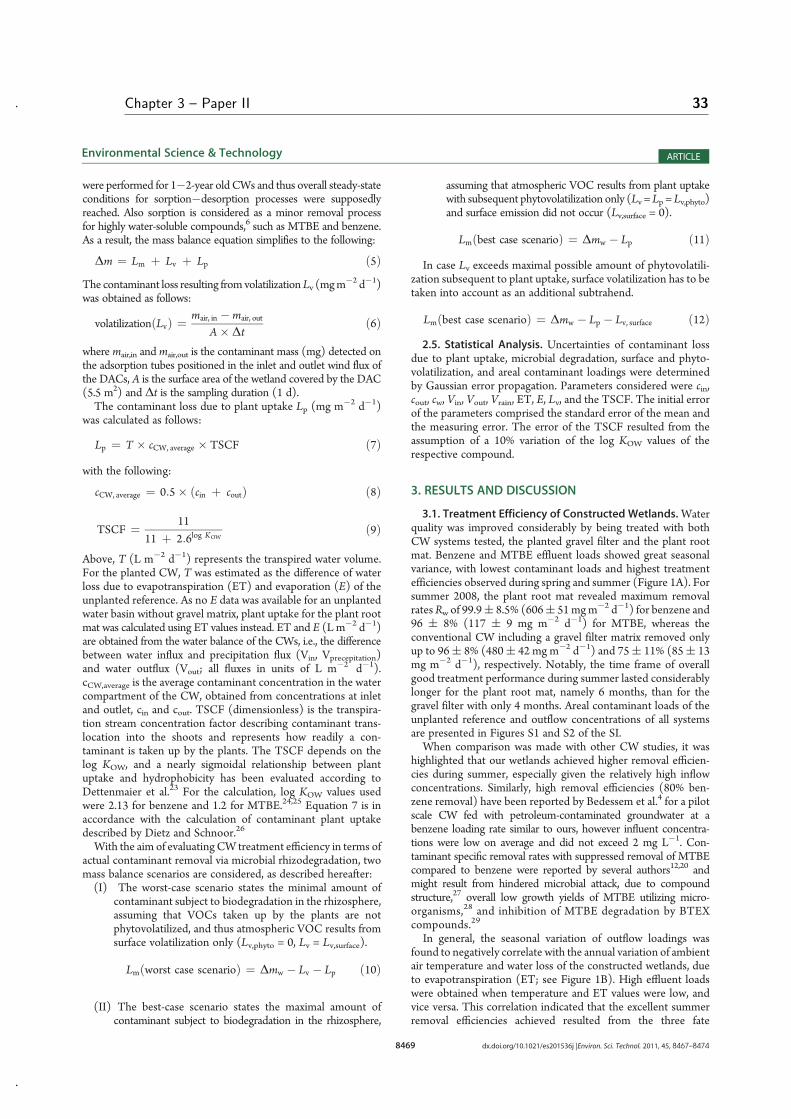
8469 dx.doi.org/10.1021/es201536j |Environ. Sci. Technol. 2011, 45, 8467–8474
Environmental Science & Technology ARTICLE
were performed for 1�2-year old CWs and thus overall steady-stateconditions for sorption�desorption processes were supposedlyreached. Also sorption is considered as a minor removal processfor highly water-soluble compounds,6 such as MTBE and benzene.As a result, the mass balance equation simplifies to the following:
Δm ¼ Lm þ Lv þ Lp ð5ÞThe contaminant loss resulting from volatilizationLv (mgm
�2 d�1)was obtained as follows:
volatilizationðLvÞ ¼ mair, in �mair, out
A� Δtð6Þ
where mair,in andmair,out is the contaminant mass (mg) detected onthe adsorption tubes positioned in the inlet and outlet wind flux ofthe DACs, A is the surface area of the wetland covered by the DAC(5.5 m2) and Δt is the sampling duration (1 d).The contaminant loss due to plant uptake Lp (mg m�2 d�1)
was calculated as follows:
Lp ¼ T � cCW, average � TSCF ð7Þwith the following:
cCW, average ¼ 0:5� ðcin þ coutÞ ð8Þ
TSCF ¼ 11
11 þ 2:6log KOWð9Þ
Above, T (L m�2 d�1) represents the transpired water volume.For the planted CW, T was estimated as the difference of waterloss due to evapotranspiration (ET) and evaporation (E) of theunplanted reference. As no E data was available for an unplantedwater basin without gravel matrix, plant uptake for the plant rootmat was calculated using ET values instead. ET and E (L m�2 d�1)are obtained from the water balance of the CWs, i.e., the differencebetween water influx and precipitation flux (Vin, Vprecepitation)and water outflux (Vout; all fluxes in units of L m�2 d�1).cCW,average is the average contaminant concentration in the watercompartment of the CW, obtained from concentrations at inletand outlet, cin and cout. TSCF (dimensionless) is the transpira-tion stream concentration factor describing contaminant trans-location into the shoots and represents how readily a con-taminant is taken up by the plants. The TSCF depends on thelog KOW, and a nearly sigmoidal relationship between plantuptake and hydrophobicity has been evaluated according toDettenmaier et al.23 For the calculation, log KOW values usedwere 2.13 for benzene and 1.2 for MTBE.24,25 Equation 7 is inaccordance with the calculation of contaminant plant uptakedescribed by Dietz and Schnoor.26
With the aim of evaluating CW treatment efficiency in terms ofactual contaminant removal via microbial rhizodegradation, twomass balance scenarios are considered, as described hereafter:(I) The worst-case scenario states the minimal amount of
contaminant subject to biodegradation in the rhizosphere,assuming that VOCs taken up by the plants are notphytovolatilized, and thus atmospheric VOC results fromsurface volatilization only (Lv,phyto = 0, Lv = Lv,surface).
Lmðworst case scenarioÞ ¼ Δmw � Lv � Lp ð10Þ
(II) The best-case scenario states the maximal amount ofcontaminant subject to biodegradation in the rhizosphere,
assuming that atmospheric VOC results from plant uptakewith subsequent phytovolatilization only (Lv =Lp =Lv,phyto)and surface emission did not occur (Lv,surface = 0).
Lmðbest case scenarioÞ ¼ Δmw � Lp ð11ÞIn case Lv exceeds maximal possible amount of phytovolatili-
zation subsequent to plant uptake, surface volatilization has to betaken into account as an additional subtrahend.
Lmðbest case scenarioÞ ¼ Δmw � Lp � Lv, surface ð12Þ2.5. Statistical Analysis. Uncertainties of contaminant loss
due to plant uptake, microbial degradation, surface and phyto-volatilization, and areal contaminant loadings were determinedby Gaussian error propagation. Parameters considered were cin,cout, cw, Vin, Vout, Vrain, ET, E, Lv, and the TSCF. The initial errorof the parameters comprised the standard error of the mean andthe measuring error. The error of the TSCF resulted from theassumption of a 10% variation of the log KOW values of therespective compound.
3. RESULTS AND DISCUSSION
3.1. Treatment Efficiency of Constructed Wetlands.Waterquality was improved considerably by being treated with bothCW systems tested, the planted gravel filter and the plant rootmat. Benzene and MTBE effluent loads showed great seasonalvariance, with lowest contaminant loads and highest treatmentefficiencies observed during spring and summer (Figure 1A). Forsummer 2008, the plant root mat revealed maximum removalratesRw of 99.9( 8.5% (606( 51mgm�2 d�1) for benzene and96 ( 8% (117 ( 9 mg m�2 d�1) for MTBE, whereas theconventional CW including a gravel filter matrix removed onlyup to 96( 8% (480( 42 mg m�2 d�1) and 75( 11% (85( 13mg m�2 d�1), respectively. Notably, the time frame of overallgood treatment performance during summer lasted considerablylonger for the plant root mat, namely 6 months, than for thegravel filter with only 4 months. Areal contaminant loads of theunplanted reference and outflow concentrations of all systemsare presented in Figures S1 and S2 of the SI.When comparison was made with other CW studies, it was
highlighted that our wetlands achieved higher removal efficien-cies during summer, especially given the relatively high inflowconcentrations. Similarly, high removal efficiencies (80% ben-zene removal) have been reported by Bedessem et al.4 for a pilotscale CW fed with petroleum-contaminated groundwater at abenzene loading rate similar to ours, however influent concentra-tions were low on average and did not exceed 2 mg L�1. Con-taminant specific removal rates with suppressed removal of MTBEcompared to benzene were reported by several authors12,20 andmight result from hindered microbial attack, due to compoundstructure,27 overall low growth yields of MTBE utilizing micro-organisms,28 and inhibition of MTBE degradation by BTEXcompounds.29
In general, the seasonal variation of outflow loadings wasfound to negatively correlate with the annual variation of ambientair temperature and water loss of the constructed wetlands, dueto evapotranspiration (ET; see Figure 1B). High effluent loadswere obtained when temperature and ET values were low, andvice versa. This correlation indicated that the excellent summerremoval efficiencies achieved resulted from the three fate
Chapter 3 – Paper II 33
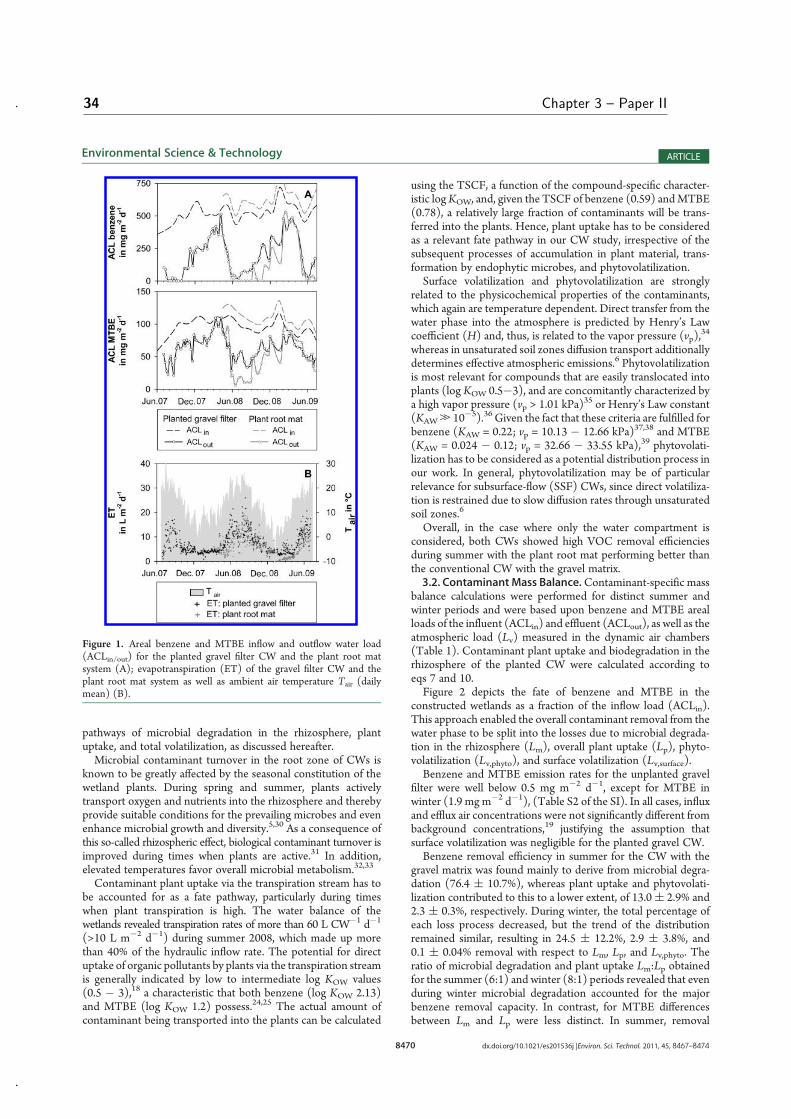
8470 dx.doi.org/10.1021/es201536j |Environ. Sci. Technol. 2011, 45, 8467–8474
Environmental Science & Technology ARTICLE
pathways of microbial degradation in the rhizosphere, plantuptake, and total volatilization, as discussed hereafter.Microbial contaminant turnover in the root zone of CWs is
known to be greatly affected by the seasonal constitution of thewetland plants. During spring and summer, plants activelytransport oxygen and nutrients into the rhizosphere and therebyprovide suitable conditions for the prevailing microbes and evenenhance microbial growth and diversity.5,30 As a consequence ofthis so-called rhizospheric effect, biological contaminant turnover isimproved during times when plants are active.31 In addition,elevated temperatures favor overall microbial metabolism.32,33
Contaminant plant uptake via the transpiration stream has tobe accounted for as a fate pathway, particularly during timeswhen plant transpiration is high. The water balance of thewetlands revealed transpiration rates of more than 60 L CW�1 d�1
(>10 L m�2 d�1) during summer 2008, which made up morethan 40% of the hydraulic inflow rate. The potential for directuptake of organic pollutants by plants via the transpiration streamis generally indicated by low to intermediate log KOW values(0.5 � 3),18 a characteristic that both benzene (log KOW 2.13)and MTBE (log KOW 1.2) possess.24,25 The actual amount ofcontaminant being transported into the plants can be calculated
using the TSCF, a function of the compound-specific character-istic logKOW, and, given the TSCF of benzene (0.59) andMTBE(0.78), a relatively large fraction of contaminants will be trans-ferred into the plants. Hence, plant uptake has to be consideredas a relevant fate pathway in our CW study, irrespective of thesubsequent processes of accumulation in plant material, trans-formation by endophytic microbes, and phytovolatilization.Surface volatilization and phytovolatilization are strongly
related to the physicochemical properties of the contaminants,which again are temperature dependent. Direct transfer from thewater phase into the atmosphere is predicted by Henry’s Lawcoefficient (H) and, thus, is related to the vapor pressure (vp),
34
whereas in unsaturated soil zones diffusion transport additionallydetermines effective atmospheric emissions.6 Phytovolatilizationis most relevant for compounds that are easily translocated intoplants (log KOW 0.5�3), and are concomitantly characterized bya high vapor pressure (vp > 1.01 kPa)35 or Henry’s Law constant(KAW. 10�5).36 Given the fact that these criteria are fulfilled forbenzene (KAW = 0.22; vp = 10.13 � 12.66 kPa)37,38 and MTBE(KAW = 0.024 � 0.12; vp = 32.66 � 33.55 kPa),39 phytovolati-lization has to be considered as a potential distribution process inour work. In general, phytovolatilization may be of particularrelevance for subsurface-flow (SSF) CWs, since direct volatiliza-tion is restrained due to slow diffusion rates through unsaturatedsoil zones.6
Overall, in the case where only the water compartment isconsidered, both CWs showed high VOC removal efficienciesduring summer with the plant root mat performing better thanthe conventional CW with the gravel matrix.3.2. Contaminant Mass Balance.Contaminant-specific mass
balance calculations were performed for distinct summer andwinter periods and were based upon benzene and MTBE arealloads of the influent (ACLin) and effluent (ACLout), as well as theatmospheric load (Lv) measured in the dynamic air chambers(Table 1). Contaminant plant uptake and biodegradation in therhizosphere of the planted CW were calculated according toeqs 7 and 10.Figure 2 depicts the fate of benzene and MTBE in the
constructed wetlands as a fraction of the inflow load (ACLin).This approach enabled the overall contaminant removal from thewater phase to be split into the losses due to microbial degrada-tion in the rhizosphere (Lm), overall plant uptake (Lp), phyto-volatilization (Lv,phyto), and surface volatilization (Lv,surface).Benzene and MTBE emission rates for the unplanted gravel
filter were well below 0.5 mg m�2 d�1, except for MTBE inwinter (1.9 mg m�2 d�1), (Table S2 of the SI). In all cases, influxand efflux air concentrations were not significantly different frombackground concentrations,19 justifying the assumption thatsurface volatilization was negligible for the planted gravel CW.Benzene removal efficiency in summer for the CW with the
gravel matrix was found mainly to derive from microbial degra-dation (76.4 ( 10.7%), whereas plant uptake and phytovolati-lization contributed to this to a lower extent, of 13.0( 2.9% and2.3 ( 0.3%, respectively. During winter, the total percentage ofeach loss process decreased, but the trend of the distributionremained similar, resulting in 24.5 ( 12.2%, 2.9 ( 3.8%, and0.1 ( 0.04% removal with respect to Lm, Lp, and Lv,phyto. Theratio of microbial degradation and plant uptake Lm:Lp obtainedfor the summer (6:1) and winter (8:1) periods revealed that evenduring winter microbial degradation accounted for the majorbenzene removal capacity. In contrast, for MTBE differencesbetween Lm and Lp were less distinct. In summer, removal
Figure 1. Areal benzene and MTBE inflow and outflow water load(ACLin/out) for the planted gravel filter CW and the plant root matsystem (A); evapotranspiration (ET) of the gravel filter CW and theplant root mat system as well as ambient air temperature Tair (dailymean) (B).
34 Chapter 3 – Paper II
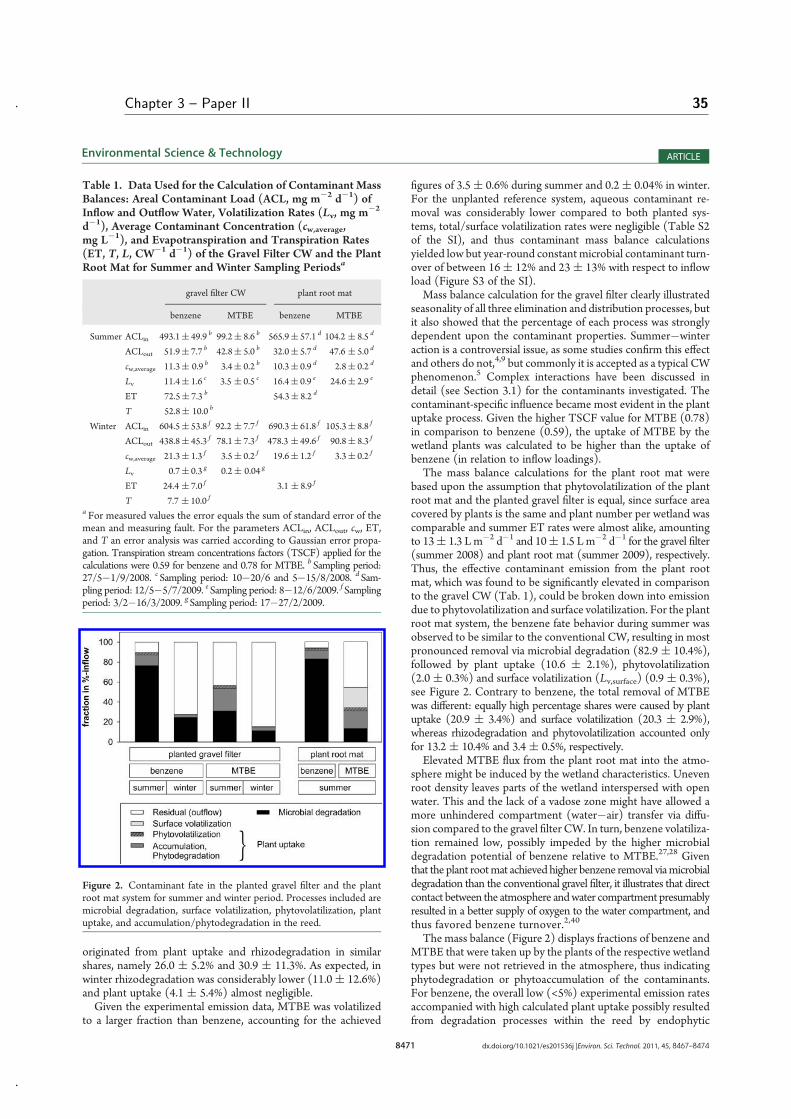
8471 dx.doi.org/10.1021/es201536j |Environ. Sci. Technol. 2011, 45, 8467–8474
Environmental Science & Technology ARTICLE
originated from plant uptake and rhizodegradation in similarshares, namely 26.0 ( 5.2% and 30.9 ( 11.3%. As expected, inwinter rhizodegradation was considerably lower (11.0( 12.6%)and plant uptake (4.1 ( 5.4%) almost negligible.Given the experimental emission data, MTBE was volatilized
to a larger fraction than benzene, accounting for the achieved
figures of 3.5( 0.6% during summer and 0.2( 0.04% in winter.For the unplanted reference system, aqueous contaminant re-moval was considerably lower compared to both planted sys-tems, total/surface volatilization rates were negligible (Table S2of the SI), and thus contaminant mass balance calculationsyielded low but year-round constant microbial contaminant turn-over of between 16( 12% and 23( 13% with respect to inflowload (Figure S3 of the SI).Mass balance calculation for the gravel filter clearly illustrated
seasonality of all three elimination and distribution processes, butit also showed that the percentage of each process was stronglydependent upon the contaminant properties. Summer�winteraction is a controversial issue, as some studies confirm this effectand others do not,4,9 but commonly it is accepted as a typical CWphenomenon.5 Complex interactions have been discussed indetail (see Section 3.1) for the contaminants investigated. Thecontaminant-specific influence became most evident in the plantuptake process. Given the higher TSCF value for MTBE (0.78)in comparison to benzene (0.59), the uptake of MTBE by thewetland plants was calculated to be higher than the uptake ofbenzene (in relation to inflow loadings).The mass balance calculations for the plant root mat were
based upon the assumption that phytovolatilization of the plantroot mat and the planted gravel filter is equal, since surface areacovered by plants is the same and plant number per wetland wascomparable and summer ET rates were almost alike, amountingto 13( 1.3 Lm�2 d�1 and 10( 1.5 L m�2 d�1 for the gravel filter(summer 2008) and plant root mat (summer 2009), respectively.Thus, the effective contaminant emission from the plant rootmat, which was found to be significantly elevated in comparisonto the gravel CW (Tab. 1), could be broken down into emissiondue to phytovolatilization and surface volatilization. For the plantroot mat system, the benzene fate behavior during summer wasobserved to be similar to the conventional CW, resulting in mostpronounced removal via microbial degradation (82.9 ( 10.4%),followed by plant uptake (10.6 ( 2.1%), phytovolatilization(2.0 ( 0.3%) and surface volatilization (Lv,surface) (0.9 ( 0.3%),see Figure 2. Contrary to benzene, the total removal of MTBEwas different: equally high percentage shares were caused by plantuptake (20.9 ( 3.4%) and surface volatilization (20.3 ( 2.9%),whereas rhizodegradation and phytovolatilization accounted onlyfor 13.2 ( 10.4% and 3.4 ( 0.5%, respectively.Elevated MTBE flux from the plant root mat into the atmo-
sphere might be induced by the wetland characteristics. Unevenroot density leaves parts of the wetland interspersed with openwater. This and the lack of a vadose zone might have allowed amore unhindered compartment (water�air) transfer via diffu-sion compared to the gravel filter CW. In turn, benzene volatiliza-tion remained low, possibly impeded by the higher microbialdegradation potential of benzene relative to MTBE.27,28 Giventhat the plant rootmat achieved higher benzene removal viamicrobialdegradation than the conventional gravel filter, it illustrates that directcontact between the atmosphere andwater compartment presumablyresulted in a better supply of oxygen to the water compartment, andthus favored benzene turnover.2,40
The mass balance (Figure 2) displays fractions of benzene andMTBE that were taken up by the plants of the respective wetlandtypes but were not retrieved in the atmosphere, thus indicatingphytodegradation or phytoaccumulation of the contaminants.For benzene, the overall low (<5%) experimental emission ratesaccompanied with high calculated plant uptake possibly resultedfrom degradation processes within the reed by endophytic
Figure 2. Contaminant fate in the planted gravel filter and the plantroot mat system for summer and winter period. Processes included aremicrobial degradation, surface volatilization, phytovolatilization, plantuptake, and accumulation/phytodegradation in the reed.
Table 1. Data Used for the Calculation of Contaminant MassBalances: Areal Contaminant Load (ACL, mg m�2 d�1) ofInflow and Outflow Water, Volatilization Rates (Lv, mg m�2
d�1), Average Contaminant Concentration (cw,average,mg L�1), and Evapotranspiration and Transpiration Rates(ET, T, L, CW�1 d�1) of the Gravel Filter CW and the PlantRoot Mat for Summer and Winter Sampling Periodsa
gravel filter CW plant root mat
benzene MTBE benzene MTBE
Summer ACLin 493.1( 49.9 b 99.2( 8.6 b 565.9( 57.1 d 104.2 ( 8.5 d
ACLout 51.9( 7.7 b 42.8( 5.0 b 32.0( 5.7 d 47.6 ( 5.0 d
cw,average 11.3( 0.9 b 3.4( 0.2 b 10.3( 0.9 d 2.8( 0.2 d
Lv 11.4( 1.6 c 3.5 ( 0.5 c 16.4( 0.9 e 24.6( 2.9 e
ET 72.5( 7.3 b 54.3( 8.2 d
T 52.8( 10.0 b
Winter ACLin 604.5( 53.8 f 92.2 ( 7.7 f 690.3( 61.8 f 105.3( 8.8 f
ACLout 438.8( 45.3 f 78.1( 7.3 f 478.3 ( 49.6 f 90.8( 8.3 f
cw,average 21.3( 1.3 f 3.5( 0.2 f 19.6( 1.2 f 3.3( 0.2 f
Lv 0.7( 0.3 g 0.2( 0.04 g
ET 24.4 ( 7.0 f 3.1 ( 8.9 f
T 7.7 ( 10.0 f
a For measured values the error equals the sum of standard error of themean and measuring fault. For the parameters ACLin, ACLout, cw, ET,and T an error analysis was carried according to Gaussian error propa-gation. Transpiration stream concentrations factors (TSCF) applied for thecalculations were 0.59 for benzene and 0.78 for MTBE. bSampling period:27/5�1/9/2008. cSampling period: 10�20/6 and 5�15/8/2008. dSam-pling period: 12/5�5/7/2009. eSampling period: 8�12/6/2009. fSamplingperiod: 3/2�16/3/2009. gSampling period: 17�27/2/2009.
Chapter 3 – Paper II 35
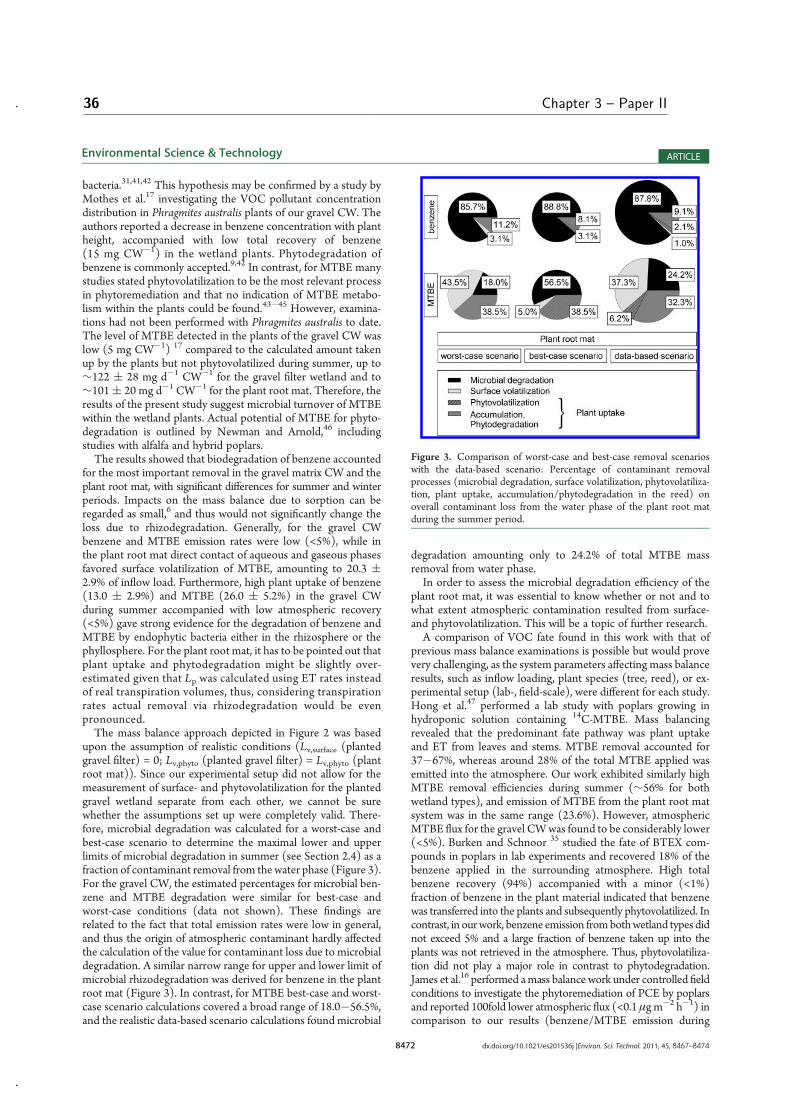
8472 dx.doi.org/10.1021/es201536j |Environ. Sci. Technol. 2011, 45, 8467–8474
Environmental Science & Technology ARTICLE
bacteria.31,41,42 This hypothesis may be confirmed by a study byMothes et al.17 investigating the VOC pollutant concentrationdistribution in Phragmites australis plants of our gravel CW. Theauthors reported a decrease in benzene concentration with plantheight, accompanied with low total recovery of benzene(15 mg CW�1) in the wetland plants. Phytodegradation ofbenzene is commonly accepted.9,42 In contrast, for MTBE manystudies stated phytovolatilization to be the most relevant processin phytoremediation and that no indication of MTBE metabo-lism within the plants could be found.43�45 However, examina-tions had not been performed with Phragmites australis to date.The level of MTBE detected in the plants of the gravel CW waslow (5 mg CW�1) 17 compared to the calculated amount takenup by the plants but not phytovolatilized during summer, up to∼122 ( 28 mg d�1 CW�1 for the gravel filter wetland and to∼101( 20 mg d�1 CW�1 for the plant root mat. Therefore, theresults of the present study suggest microbial turnover of MTBEwithin the wetland plants. Actual potential of MTBE for phyto-degradation is outlined by Newman and Arnold,46 includingstudies with alfalfa and hybrid poplars.The results showed that biodegradation of benzene accounted
for the most important removal in the gravel matrix CW and theplant root mat, with significant differences for summer and winterperiods. Impacts on the mass balance due to sorption can beregarded as small,6 and thus would not significantly change theloss due to rhizodegradation. Generally, for the gravel CWbenzene and MTBE emission rates were low (<5%), while inthe plant root mat direct contact of aqueous and gaseous phasesfavored surface volatilization of MTBE, amounting to 20.3 (2.9% of inflow load. Furthermore, high plant uptake of benzene(13.0 ( 2.9%) and MTBE (26.0 ( 5.2%) in the gravel CWduring summer accompanied with low atmospheric recovery(<5%) gave strong evidence for the degradation of benzene andMTBE by endophytic bacteria either in the rhizosphere or thephyllosphere. For the plant root mat, it has to be pointed out thatplant uptake and phytodegradation might be slightly over-estimated given that Lp was calculated using ET rates insteadof real transpiration volumes, thus, considering transpirationrates actual removal via rhizodegradation would be evenpronounced.The mass balance approach depicted in Figure 2 was based
upon the assumption of realistic conditions (Lv,surface (plantedgravel filter) = 0; Lv,phyto (planted gravel filter) = Lv,phyto (plantroot mat)). Since our experimental setup did not allow for themeasurement of surface- and phytovolatilization for the plantedgravel wetland separate from each other, we cannot be surewhether the assumptions set up were completely valid. There-fore, microbial degradation was calculated for a worst-case andbest-case scenario to determine the maximal lower and upperlimits of microbial degradation in summer (see Section 2.4) as afraction of contaminant removal from the water phase (Figure 3).For the gravel CW, the estimated percentages for microbial ben-zene and MTBE degradation were similar for best-case andworst-case conditions (data not shown). These findings arerelated to the fact that total emission rates were low in general,and thus the origin of atmospheric contaminant hardly affectedthe calculation of the value for contaminant loss due to microbialdegradation. A similar narrow range for upper and lower limit ofmicrobial rhizodegradation was derived for benzene in the plantroot mat (Figure 3). In contrast, for MTBE best-case and worst-case scenario calculations covered a broad range of 18.0�56.5%,and the realistic data-based scenario calculations found microbial
degradation amounting only to 24.2% of total MTBE massremoval from water phase.In order to assess the microbial degradation efficiency of the
plant root mat, it was essential to know whether or not and towhat extent atmospheric contamination resulted from surface-and phytovolatilization. This will be a topic of further research.A comparison of VOC fate found in this work with that of
previous mass balance examinations is possible but would provevery challenging, as the system parameters affecting mass balanceresults, such as inflow loading, plant species (tree, reed), or ex-perimental setup (lab-, field-scale), were different for each study.Hong et al.47 performed a lab study with poplars growing inhydroponic solution containing 14C-MTBE. Mass balancingrevealed that the predominant fate pathway was plant uptakeand ET from leaves and stems. MTBE removal accounted for37�67%, whereas around 28% of the total MTBE applied wasemitted into the atmosphere. Our work exhibited similarly highMTBE removal efficiencies during summer (∼56% for bothwetland types), and emission of MTBE from the plant root matsystem was in the same range (23.6%). However, atmosphericMTBE flux for the gravel CWwas found to be considerably lower(<5%). Burken and Schnoor 35 studied the fate of BTEX com-pounds in poplars in lab experiments and recovered 18% of thebenzene applied in the surrounding atmosphere. High totalbenzene recovery (94%) accompanied with a minor (<1%)fraction of benzene in the plant material indicated that benzenewas transferred into the plants and subsequently phytovolatilized. Incontrast, in ourwork, benzene emission frombothwetland types didnot exceed 5% and a large fraction of benzene taken up into theplants was not retrieved in the atmosphere. Thus, phytovolatiliza-tion did not play a major role in contrast to phytodegradation.James et al.16 performed amass balance work under controlled fieldconditions to investigate the phytoremediation of PCE by poplarsand reported 100fold lower atmospheric flux (<0.1 μgm�2 h�1) incomparison to our results (benzene/MTBE emission during
Figure 3. Comparison of worst-case and best-case removal scenarioswith the data-based scenario: Percentage of contaminant removalprocesses (microbial degradation, surface volatilization, phytovolatiliza-tion, plant uptake, accumulation/phytodegradation in the reed) onoverall contaminant loss from the water phase of the plant root matduring the summer period.
36 Chapter 3 – Paper II
8473 dx.doi.org/10.1021/es201536j |Environ. Sci. Technol. 2011, 45, 8467–8474
Environmental Science & Technology ARTICLE
summer: gravel CW = 475 ( 67/146 ( 23 μg m�2 h�1,plant root mat = 683 ( 38/1025 ( 122 μg m�2 h�1). Con-versely to our findings, contaminant loss via transpiration, volatiliza-tion, and accumulation in the trees was stated to be of minorrelevance compared to overall PCE removal (>99%). Adequatecomparison of emission fluxes is highly complicated as inflow con-centrations vary between the different studies. Generally, hightotal hydrocarbon volatilization flux (12 500 μg m�2 h�1) wasobtained for high inflow concentrations (BTEX: 50 mg L�1),7
and low atmospheric flux (benzene: 0.042 μg m�2 h�1, MTBE:0.333 μg m�2 h�1) accompanied with low inflow concentrations(<0.0002 mg L�1).15 However, our results were in the rangestated above. Besides, Moore et al. 7 identified biodegradationand volatilization as being the most important attenuation pro-cesses in a wetland treating hydrocarbons, which is in accordancewith our findings.Explicitly, comprehensive evaluation of benzene and MTBE
fate in the tested wetland systems clarified the fraction each of theremoval processes contribute to the overall removal, and thatmicrobial degradation plays a major role with minor effects byplant uptake and volatilization. This finding may represent arealistic share of removal processes in general. Therefore, the as-sessment of CW treatment performance should always be basedon a mass balance approach that is comprised of a breakdown ofthe total removal into the various removal processes taking placein a CW.
’ASSOCIATED CONTENT
bS Supporting Information. Groundwater characteristics,complete mass balance data for the reference system, andcontaminant outflow concentrations of all systems. This materialis available free of charge via the Internet at http://pubs.acs.org.
’AUTHOR INFORMATION
Corresponding Author*Phone: +49 341 2351696; fax: +49 341 2352492; e-mail:[email protected].
’ACKNOWLEDGMENT
This work was supported by the Helmholtz Centre forEnvironmental Research—UFZ within the scope of the SAFIRAII Research Programme (Revitalization of Contaminated Landand Groundwater at Megasites, subproject ‘‘CompartmentTransfer—CoTra”).
’REFERENCES
(1) Kadlec, R. H.; Wallace, S. D. Treatment Wetlands; CRC Press:Boca Raton, FL, 2008.(2) Faulwetter, J. L.; Gagnon, V.; Sundberg, C.; Chazarenc, F.; Burr,
M. D.; Brisson, J.; Camper, A. K.; Stein, O. R. Microbial processesinfluencing performance of treatment wetlands: A review. Ecol. Eng.2009, 35, 987–1004.(3) Braeckevelt, M.; Mirschel, G.; Wiessner, A.; Rueckert, M.;
Reiche, N.; Vogt, C.; Schultze, A.; Paschke, H.; Kuschk, P.; Kaestner,M. Treatment of chlorobenzene-contaminated groundwater in a pilot-scale constructed wetland. Ecol. Eng. 2008, 33, 45–53.(4) Bedessem, M. E.; Ferro, A. M.; Hiegel, T. Pilot-scale constructed
wetlands for petroleum-contaminated groundwater.Water Environ. Res.2007, 79 (6), 581–586.
(5) Williams, J. B. Phytoremediation on wetland ecosystems:progress, problems, and potential. Crit. Rev. Plant Sci. 2002, 21 (6),607–635.
(6) Imfeld, G.; Braeckevelt, M.; Kuschk, P.; Richnow, H. H.Monitoring and assessing processes of organic chemicals removal inconstructed wetlands. Chemosphere 2009, 74, 349–362.
(7) Moore, B. J.; Headley, J. V.; Dupont, R. R.; Doucette, W. D.;Armstrong, J. E. Abatement of gas-condensate hydrocarbons in a naturalwetland. J. Environ. Sci. Health. Part A 2002, 37 (4), 425–438.
(8) Gessner, T. P.; Kadlec, R. H.; Reaves, R. P. Wetland remediationof cyanide and hydrocarbons. Ecol. Eng. 2005, 25, 457–469.
(9) Tang, X. Q.; Eke, P. E.; Scholz, M.; Huang, S. L. Processesimpacting on benzene removal in vertical-flow constructed wetlands.Bioresour. Technol. 2009, 100, 227–234.
(10) Eke, P. E.; Scholz, M. Benzene removal with vertical-flowconstructed treatment wetlands. J. Chem. Technol. Biot. 2008, 83, 55–63.
(11) Machate, T.; Heuermann, E.; Schramm, K.-W.; Kettrup, A.Purification of fuel and nitrate contaminated ground water using a freewater surface constructed wetland plant. J. Environ. Qual. 1999, 28,1665–1673.
(12) Ferro, A. M.; Kadlec, R. H.; Deschamp, J. Constructed wetlandsystem to treat wastewater at the BP Amoco former Casper refinery: Pilotscale project; The 9th International Petroleum Environmental Confer-ence: Albuquerque, NM, 2002.
(13) Wallace, S.; Kadlec, R. BTEX degradation in cold-climatewetland systems. Water Sci. Technol. 2005, 51 (9), 165–171.
(14) Zhang, Q.; Davis, L. C.; Erickson, L. E. An experimental studyof phytoremediation ofmethyl-tert-butyl ether (MTBE) in groundwater.J. Hazard. Subst. Res. 2000, 2, 4�1–4�19.
(15) Keefe, S. H.; Barber, L. B.; Runkel, R. L.; Ryan, J. N. Fateof volatile organic compounds in constructed wastewater treatmentwetlands. Environ. Sci. Technol. 2004, 38, 2209–2216.
(16) James, C. A.; Xin, G.; Doty, S. L.; Muiznieks, I.; Newman, L.;Strand, S. E. A mass balance study of the phytoremediation of per-chloroethylene-contaminated groundwater. Environ. Pollut. 2009, 157,2564–2569.
(17) Mothes, F.; Reiche, N.; Fiedler, P.; Moeder, M.; Borsdorf, H.Capability of headspace based sample preparation methods for thedetermination of methyl tert-butyl ether and benzene in reed(Phragmites australis) from constructed wetlands. Chemosphere 2010,80, 396–403.
(18) Pilon-Smits, E. Phytoremediation. Annu. Rev. Plant Biol. 2005,56, 15–39.
(19) Reiche, N.; Lorenz, W.; Borsdorf, H. Development and appli-cation of dynamic air chambers for measurement of volatilization fluxesof benzene andMTBE from constructed wetlands planted with commonreed. Chemosphere 2010, 79, 162–168.
(20) Jechalke, S.; Vogt, C.; Reiche, N.; Frachini, A. G.; Borsdorf, H.;Neu, T. R.; Richnow, H. H. Aerated treatment pond technology withbiofilm promoting mats for the bioremediation of benzene, MTBE andammonium contaminated groundwater.Water Res. 2010, 44, 1785–1796.
(21) Quantification of Exposure: Dispersion, Transport, and Fate of AirToxics in the Atmosphere in Chapter 8 of Air Toxic Risk AssessmentReference Ribrary, Vol. 1, Technical resource manual; EPA-453-K-04�001A; U.S. Environmental Protection Agency: Office of AirQuality Planning and Standards: Research Triangle Park, NC, 2004;www.epa.gov/ttn/fera/data/risk/vol_1/Chapter_08.pdf.
(22) European Risk Assessment Report � tert-butyl methyl ether; Vol.19, CAS No: 1634�04�4; European Commission � Joint ResearchCentre: Institute for Health and Consumer Protection, EuropeanChemicals Bureau, 2002; http://ecb.jrc.ec.europa.eu/documents/Exist-ing-Chemicals/RISK_ASSESSMENT/REPORT/mtbereport313.pdf
(23) Dettenmaier, E. M.; Doucette, W. J.; Bugbee, B. Chemicalhydrophobicity and uptake by plant roots. Environ. Sci. Technol. 2009,43, 324–329.
(24) Zogorski, J. S., Murduchowitz, A. M.; Baehr, A. L.; Bauman,B. J.; Conrad, D. L.; Drew, R. T.; Korte, N. E.; Lapham, W. W.; Pankow,J. F.; Washington, E. R. Fuel Oxygenates and Water Quality in Chapter 2
Chapter 3 – Paper II 37
8474 dx.doi.org/10.1021/es201536j |Environ. Sci. Technol. 2011, 45, 8467–8474
Environmental Science & Technology ARTICLE
of Interagency Assessment of Oxygenated Fuels, 1997; http://www.epa.gov/otaq/regs/fuels/ostp-2.pdf.(25) Schirmer, M. Das Verhalten des Benzininhaltsstoffes Methyl-
terti€arbutylether (MTBE) in Grundwasser. Grundwasser 1999, 3, 95–102.(26) Dietz, A. C.; Schnoor, J. L. Advances in Phytoremediation.
Environ. Health Perspect. 2001, 109 (Supplement 1), 163–168.(27) Schmidt, T. C.; Schirmer, M.; Weiß, H.; Haderlein, S. B.
Microbial degradation of tert-butyl ether and tert-butyl alcohol in thesubsurface. J. Contam. Hydrol. 2004, 70, 173–203.(28) Salanitro, J. P.; Johnson, P. C.; Spinnler, G. E.; Maner, P. M.;
Wisniewski, H. L.; Bruce, C. Field-scale demonstration of enhancedMTBE bioremediation through aquifer bioaugmentation and oxygena-tion. Environ. Sci. Technol. 2000, 34, 4152–4162.(29) Deeb, R. A.; Hu, H.-Y.; Hanson, J. R.; Scow, K. M.; Alvarez-
Cohen, L. Substrate interactions in BTEX and MTBE mixturesby an MTBE-degrading isolate. Environ. Sci. Technol. 2001, 35 (2),312–317.(30) García, J.; Rousseau, D. P. L.; Morat�o, J.; Lesage, E.; Matamoros,
V.; Byona, J. M. Contaminant removal processes in subsurface-flowconstructed wetlands: A review. Crit. Rev. Env. Sci. Technol. 2010, 40 (7),561–661.(31) Stottmeister, U.; Wießner, A.; Kuschk, P.; Kappelmeyer, U.;
K€astner, M.; Bederski, O.; M€uller, R. A.; Moormann, H. Effects of plantsand microorganisms in constructed wetlands for wastewater treatment.Biotechnol. Adv. 2003, 22, 93–117.(32) Atlas, R. M. Microbial degradation of petroleum hydrocarbons:
an environmental perspective. FEMSMicrobiol. Rev. 1981, 45 (1), 180–209.(33) Kadlec, R. H.; Reddy, K. R. Temperature effects in treatment
wetlands. Water Environ. Res. 2001, 73 (5), 543–557.(34) Schwarzenbach, R. P.; Gschwend, P. M.; Imboden, D. M.
Environmental Organic Chemistry; Wiley-Interscience: New York, 2003.(35) Burken, J. G.; Schnoor, J. L. Predicitve relationships for uptake
of organic contaminants by hybrid poplar trees. Environ. Sci. Technol.1998, 32, 3379–3385.(36) Trapp, S.; Karlson, U. Aspects of phytoremediation of organic
pollutants. J. Soils Sed. 2001, 1, 37–42.(37) Howard, P. H.; Sage, G. W.; Jarvis, W. F.; Gray, D. A.Handbook
of Environmental Fate and Exposure Data for Organic Chemicals; Lewis:Chelsea, MI, 1991; Vol. 2.(38) Mackay, D.; Shiu, W. Y.; Ma, K. C. Monoaromatic Hydro-
carbons, Chlorobenzens and PCB. Illustrated Handbook of Physical-Chemi-cal Properties and Environmental Fate of Organic Chemicals; Lewis: Chelsea,MI, 1992; Vol. 1.(39) Mackay, D.; Shiu, W. Y.; Ma, K. C. Volatile Organic Chemicals.
Illustrated Handbook of Physical-Chemical Properties and EnvironmentalFate of Organic Chemicals; Lewis: Chelsea, MI, 1993; Vol. 3.(40) Coates, D. J.; Chakraborty, R.; McInerney, M. J. Anaerobic
benzene biodegradation � a new era. Res. Microbiol. 2002, 153, 621–628.(41) Collins, C.; Laturnus, F.; Nepovim, A. Remediation of BTEX
and trichloroethene. Environ. Sci. Pollut. Res. 2002, 9 (1), 86–94.(42) Moore, F. P.; Barac, T.; Borremans, B.; Oeyen, L.; Vangronsveld,
J.; van der Lelie, D.; Campbell, C. D.; Moore, E. R. B. Endophyticbacterial diversity in poplar trees growing on a BTEX-contaminated site:The characterisation of isolates with potential to enhance phytoreme-diation. Syst. Appl. Microbiol. 2006, 29, 539–556.(43) Trapp, S.; Yu, X.; Mosbaek, H. Persistence of methyl tertiary
butyl ether (MTBE) against metabolism by Danish vegetation. Environ.Sci. Pollut. Res. 2003, 10 (6), 357–360.(44) Yu, X.-Z.; Gu, J.-D. Uptake, metabolism, and toxicity of methyl
tert-butyl ether (MTBE) in weeping willows. J. Hazard. Mater. Part B2006, 137, 1417–1423.(45) Arnold, C. W.; Parfitt, D. G.; Kaltreider, M. Phytovolatilization
of oxygenated gasoline-impacted groundwater at an undergroundstorage tank site via conifers. Int. J. Phytorem. 2007, 9, 53–69.(46) Newman, L. A.; Arnold, C. W. Phytoremediation ofMTBE—A
review of the State of Technology. In MTBE Remediation Handbook;Moyer, E. E., Kostecki, P. T., Eds.; Amherst Scientific Publishers:Amherst, MA, 2003; pp 279�288.
(47) Hong, M. S.; Farmayan, W. F.; Dortch, I. J.; Chiang, C. Y.;McMillan, S. K.; Schnoor, J. L. Phytoremediation of MTBE from agroundwater plume. Environ. Sci. Technol. 2001, 35, 1231–1239.
38 Chapter 3 – Paper II
Performance evaluation of different horizontal subsurfaceflow wetland types by characterization of flow behavior, massremoval and depth-dependent contaminant load
Eva M. Seeger a,*, Uli Maier b, Peter Grathwohl b, Peter Kuschk a, Matthias Kaestner a
aDepartment of Environmental Biotechnology, Helmholtz Centre for Environmental Research e UFZ, Permoserstr. 15,
04318 Leipzig, GermanybCenter of Applied Geoscience, University of Tubingen, Holderlinstr. 12, 72074 Tubingen, Germany
a r t i c l e i n f o
Article history:
Received 10 March 2012
Received in revised form
30 October 2012
Accepted 31 October 2012
Available online xxx
Keywords:
Tracer test
Fluorescein
Hydroponic plant root mat
Local contaminant loads
Benzene
MTBE
Ammonium removal
a b s t r a c t
For several pilot-scale constructed wetlands (CWs: a planted and unplanted gravel filter)
and a hydroponic plant root mat (operating at two water levels), used for treating
groundwater contaminated with BTEX, the fuel additive MTBE and ammonium, the
hydrodynamic behavior was evaluated by means of temporal moment analysis of outlet
tracer breakthrough curves (BTCs): hydraulic indices were related to contaminant mass
removal. Detailed investigation of flow within the model gravel CWs allowed estimation of
local flow rates and contaminant loads within the CWs. Best hydraulics were observed for
the planted gravel filter (number of continuously stirred tank reactors N ¼ 11.3, dispersion
number ¼ 0.04, Peclet number ¼ 23). The hydroponic plant root mat revealed lower N and
pronounced dispersion tendencies, whereby an elevated water table considerably impaired
flow characteristics and treatment efficiencies. Highest mass removals were achieved by
the plant root mat at low level: 98% (544 mg m�2 d�1), 78% (54 mg m�2 d�1) and 74%
(893 mg m�2 d�1) for benzene, MTBE and ammoniumenitrogen, respectively. Within the
CWs the flow behavior was depth-dependent, with the planting and the position of the
outlet tube being key factors resulting in elevated flow rate and contaminant flux imme-
diately below the densely rooted porous media zone in the planted CW, and fast bottom
flow in the unplanted reference.
ª 2012 Elsevier Ltd. All rights reserved.
1. Introduction
Constructed wetlands (CWs) have proven to be an efficient
ecological technology for the treatment of various kinds of
contaminated waters (Williams, 2002; Haberl et al., 2003;
Kadlec andWallace, 2008), includingdomestic and agricultural
wastewater (Konnerup et al., 2009; Vymazal and Kropfelova,
2009), landfill leachate (Bulc, 2006; Yalcuk and Ugurlu, 2009),
industrial effluents (Vymazal, 2009) and groundwater
contaminatedwith organic chemicals (Braeckevelt et al., 2008;
Seeger et al., 2011a). The use of CWs has been successfully
tested in pilot- (Braeckevelt et al., 2011) and field-scale (Ferro
et al., 2002; Moore et al., 2002) applications, providing data on
overall contaminant removal efficiency on the basis of either
concentrations or loads.
CW treatment efficiency primarily depends on the
contact time between the contaminated water and the filter
material, including biota, as longer residence times enhance
* Corresponding author. Tel.: þ49 341 2351765; fax: þ49 341 2351471.E-mail address: [email protected] (E.M. Seeger).
Available online at www.sciencedirect.com
journal homepage: www.elsevier .com/locate/watres
wat e r r e s e a r c h x x x ( 2 0 1 2 ) 1e1 2
Please cite this article in press as: Seeger, E.M., et al., Performance evaluation of different horizontal subsurface flow wetlandtypes by characterization of flow behavior, mass removal and depth-dependent contaminant load, Water Research (2012),http://dx.doi.org/10.1016/j.watres.2012.10.051
0043-1354/$ e see front matter ª 2012 Elsevier Ltd. All rights reserved.http://dx.doi.org/10.1016/j.watres.2012.10.051
Chapter 4 – Paper III 39
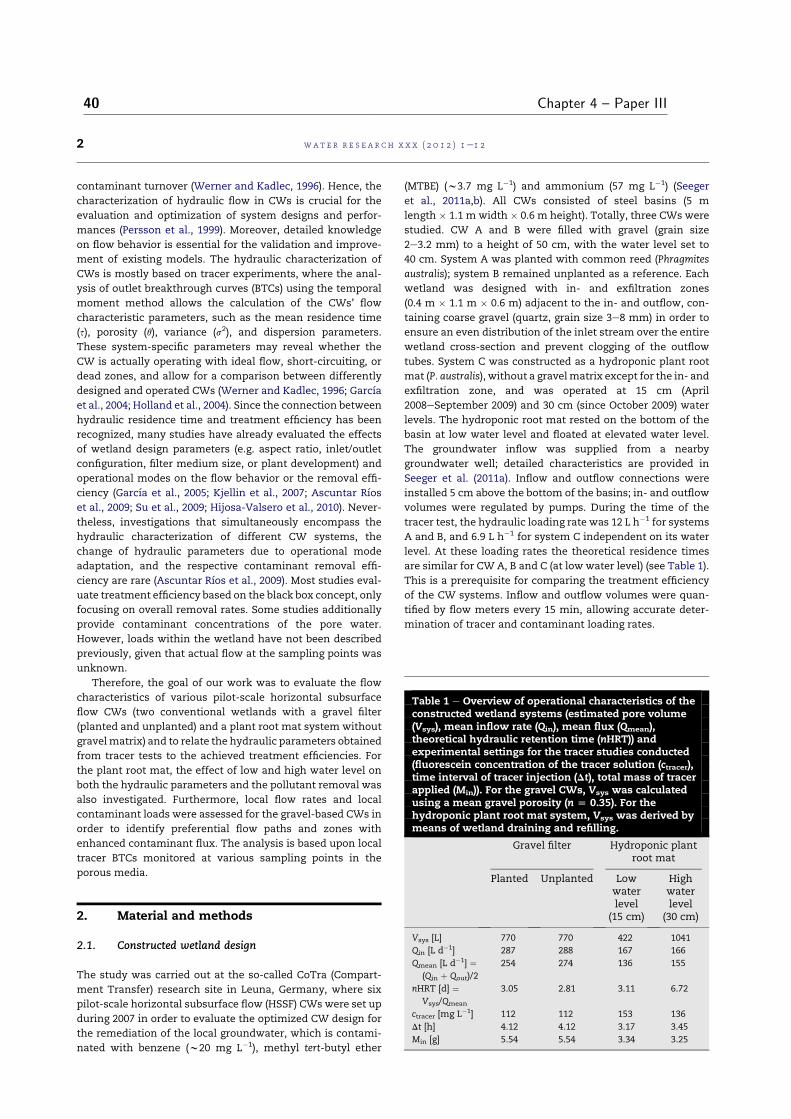
contaminant turnover (Werner and Kadlec, 1996). Hence, the
characterization of hydraulic flow in CWs is crucial for the
evaluation and optimization of system designs and perfor-
mances (Persson et al., 1999). Moreover, detailed knowledge
on flow behavior is essential for the validation and improve-
ment of existing models. The hydraulic characterization of
CWs is mostly based on tracer experiments, where the anal-
ysis of outlet breakthrough curves (BTCs) using the temporal
moment method allows the calculation of the CWs’ flow
characteristic parameters, such as the mean residence time
(s), porosity (q), variance (s2), and dispersion parameters.
These system-specific parameters may reveal whether the
CW is actually operating with ideal flow, short-circuiting, or
dead zones, and allow for a comparison between differently
designed and operated CWs (Werner and Kadlec, 1996; Garcıa
et al., 2004; Holland et al., 2004). Since the connection between
hydraulic residence time and treatment efficiency has been
recognized, many studies have already evaluated the effects
of wetland design parameters (e.g. aspect ratio, inlet/outlet
configuration, filter medium size, or plant development) and
operational modes on the flow behavior or the removal effi-
ciency (Garcıa et al., 2005; Kjellin et al., 2007; Ascuntar Rıos
et al., 2009; Su et al., 2009; Hijosa-Valsero et al., 2010). Never-
theless, investigations that simultaneously encompass the
hydraulic characterization of different CW systems, the
change of hydraulic parameters due to operational mode
adaptation, and the respective contaminant removal effi-
ciency are rare (Ascuntar Rıos et al., 2009). Most studies eval-
uate treatment efficiency based on the black box concept, only
focusing on overall removal rates. Some studies additionally
provide contaminant concentrations of the pore water.
However, loads within the wetland have not been described
previously, given that actual flow at the sampling points was
unknown.
Therefore, the goal of our work was to evaluate the flow
characteristics of various pilot-scale horizontal subsurface
flow CWs (two conventional wetlands with a gravel filter
(planted and unplanted) and a plant root mat system without
gravelmatrix) and to relate the hydraulic parameters obtained
from tracer tests to the achieved treatment efficiencies. For
the plant root mat, the effect of low and high water level on
both the hydraulic parameters and the pollutant removal was
also investigated. Furthermore, local flow rates and local
contaminant loads were assessed for the gravel-based CWs in
order to identify preferential flow paths and zones with
enhanced contaminant flux. The analysis is based upon local
tracer BTCs monitored at various sampling points in the
porous media.
2. Material and methods
2.1. Constructed wetland design
The study was carried out at the so-called CoTra (Compart-
ment Transfer) research site in Leuna, Germany, where six
pilot-scale horizontal subsurface flow (HSSF) CWs were set up
during 2007 in order to evaluate the optimized CW design for
the remediation of the local groundwater, which is contami-
nated with benzene (w20 mg L�1), methyl tert-butyl ether
(MTBE) (w3.7 mg L�1) and ammonium (57 mg L�1) (Seeger
et al., 2011a,b). All CWs consisted of steel basins (5 m
length � 1.1 m width � 0.6 m height). Totally, three CWs were
studied. CW A and B were filled with gravel (grain size
2e3.2 mm) to a height of 50 cm, with the water level set to
40 cm. System A was planted with common reed (Phragmites
australis); system B remained unplanted as a reference. Each
wetland was designed with in- and exfiltration zones
(0.4 m � 1.1 m � 0.6 m) adjacent to the in- and outflow, con-
taining coarse gravel (quartz, grain size 3e8 mm) in order to
ensure an even distribution of the inlet stream over the entire
wetland cross-section and prevent clogging of the outflow
tubes. System C was constructed as a hydroponic plant root
mat (P. australis), without a gravelmatrix except for the in- and
exfiltration zone, and was operated at 15 cm (April
2008eSeptember 2009) and 30 cm (since October 2009) water
levels. The hydroponic root mat rested on the bottom of the
basin at low water level and floated at elevated water level.
The groundwater inflow was supplied from a nearby
groundwater well; detailed characteristics are provided in
Seeger et al. (2011a). Inflow and outflow connections were
installed 5 cm above the bottom of the basins; in- and outflow
volumes were regulated by pumps. During the time of the
tracer test, the hydraulic loading rate was 12 L h�1 for systems
A and B, and 6.9 L h�1 for system C independent on its water
level. At these loading rates the theoretical residence times
are similar for CW A, B and C (at low water level) (see Table 1).
This is a prerequisite for comparing the treatment efficiency
of the CW systems. Inflow and outflow volumes were quan-
tified by flow meters every 15 min, allowing accurate deter-
mination of tracer and contaminant loading rates.
Table 1 e Overview of operational characteristics of theconstructed wetland systems (estimated pore volume(Vsys), mean inflow rate (Qin), mean flux (Qmean),theoretical hydraulic retention time (nHRT)) andexperimental settings for the tracer studies conducted(fluorescein concentration of the tracer solution (ctracer),time interval of tracer injection (Dt), total mass of tracerapplied (Min)). For the gravel CWs, Vsys was calculatedusing a mean gravel porosity (n [ 0.35). For thehydroponic plant root mat system, Vsys was derived bymeans of wetland draining and refilling.
Gravel filter Hydroponic plantroot mat
Planted Unplanted Lowwaterlevel
(15 cm)
Highwaterlevel
(30 cm)
Vsys [L] 770 770 422 1041
Qin [L d�1] 287 288 167 166
Qmean [L d�1] ¼(Qin þ Qout)/2
254 274 136 155
nHRT [d] ¼Vsys/Qmean
3.05 2.81 3.11 6.72
ctracer [mg L�1] 112 112 153 136
Dt [h] 4.12 4.12 3.17 3.45
Min [g] 5.54 5.54 3.34 3.25
wat e r r e s e a r c h x x x ( 2 0 1 2 ) 1e1 22
Please cite this article in press as: Seeger, E.M., et al., Performance evaluation of different horizontal subsurface flow wetlandtypes by characterization of flow behavior, mass removal and depth-dependent contaminant load, Water Research (2012),http://dx.doi.org/10.1016/j.watres.2012.10.051
40 Chapter 4 – Paper III
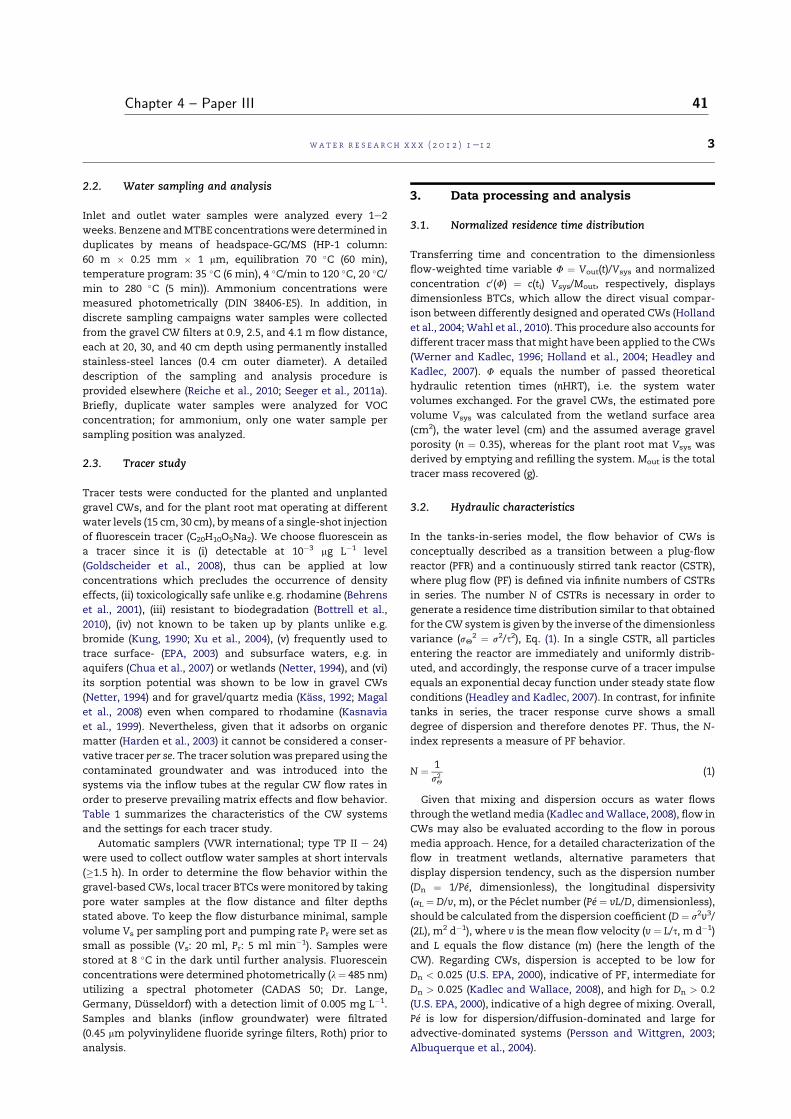
2.2. Water sampling and analysis
Inlet and outlet water samples were analyzed every 1e2
weeks. Benzene andMTBE concentrationswere determined in
duplicates by means of headspace-GC/MS (HP-1 column:
60 m � 0.25 mm � 1 mm, equilibration 70 �C (60 min),
temperature program: 35 �C (6 min), 4 �C/min to 120 �C, 20 �C/min to 280 �C (5 min)). Ammonium concentrations were
measured photometrically (DIN 38406-E5). In addition, in
discrete sampling campaigns water samples were collected
from the gravel CW filters at 0.9, 2.5, and 4.1 m flow distance,
each at 20, 30, and 40 cm depth using permanently installed
stainless-steel lances (0.4 cm outer diameter). A detailed
description of the sampling and analysis procedure is
provided elsewhere (Reiche et al., 2010; Seeger et al., 2011a).
Briefly, duplicate water samples were analyzed for VOC
concentration; for ammonium, only one water sample per
sampling position was analyzed.
2.3. Tracer study
Tracer tests were conducted for the planted and unplanted
gravel CWs, and for the plant root mat operating at different
water levels (15 cm, 30 cm), bymeans of a single-shot injection
of fluorescein tracer (C20H10O5Na2). We choose fluorescein as
a tracer since it is (i) detectable at 10�3 mg L�1 level
(Goldscheider et al., 2008), thus can be applied at low
concentrations which precludes the occurrence of density
effects, (ii) toxicologically safe unlike e.g. rhodamine (Behrens
et al., 2001), (iii) resistant to biodegradation (Bottrell et al.,
2010), (iv) not known to be taken up by plants unlike e.g.
bromide (Kung, 1990; Xu et al., 2004), (v) frequently used to
trace surface- (EPA, 2003) and subsurface waters, e.g. in
aquifers (Chua et al., 2007) or wetlands (Netter, 1994), and (vi)
its sorption potential was shown to be low in gravel CWs
(Netter, 1994) and for gravel/quartz media (Kass, 1992; Magal
et al., 2008) even when compared to rhodamine (Kasnavia
et al., 1999). Nevertheless, given that it adsorbs on organic
matter (Harden et al., 2003) it cannot be considered a conser-
vative tracer per se. The tracer solutionwas prepared using the
contaminated groundwater and was introduced into the
systems via the inflow tubes at the regular CW flow rates in
order to preserve prevailing matrix effects and flow behavior.
Table 1 summarizes the characteristics of the CW systems
and the settings for each tracer study.
Automatic samplers (VWR international; type TP II e 24)
were used to collect outflow water samples at short intervals
(�1.5 h). In order to determine the flow behavior within the
gravel-based CWs, local tracer BTCs weremonitored by taking
pore water samples at the flow distance and filter depths
stated above. To keep the flow disturbance minimal, sample
volume Vs per sampling port and pumping rate Pr were set as
small as possible (Vs: 20 ml, Pr: 5 ml min�1). Samples were
stored at 8 �C in the dark until further analysis. Fluorescein
concentrations were determined photometrically (l¼ 485 nm)
utilizing a spectral photometer (CADAS 50; Dr. Lange,
Germany, Dusseldorf) with a detection limit of 0.005 mg L�1.
Samples and blanks (inflow groundwater) were filtrated
(0.45 mm polyvinylidene fluoride syringe filters, Roth) prior to
analysis.
3. Data processing and analysis
3.1. Normalized residence time distribution
Transferring time and concentration to the dimensionless
flow-weighted time variable F ¼ Vout(t)/Vsys and normalized
concentration c0(F) ¼ c(ti) Vsys/Mout, respectively, displays
dimensionless BTCs, which allow the direct visual compar-
ison between differently designed and operated CWs (Holland
et al., 2004; Wahl et al., 2010). This procedure also accounts for
different tracermass thatmight have been applied to the CWs
(Werner and Kadlec, 1996; Holland et al., 2004; Headley and
Kadlec, 2007). F equals the number of passed theoretical
hydraulic retention times (nHRT), i.e. the system water
volumes exchanged. For the gravel CWs, the estimated pore
volume Vsys was calculated from the wetland surface area
(cm2), the water level (cm) and the assumed average gravel
porosity (n ¼ 0.35), whereas for the plant root mat Vsys was
derived by emptying and refilling the system. Mout is the total
tracer mass recovered (g).
3.2. Hydraulic characteristics
In the tanks-in-series model, the flow behavior of CWs is
conceptually described as a transition between a plug-flow
reactor (PFR) and a continuously stirred tank reactor (CSTR),
where plug flow (PF) is defined via infinite numbers of CSTRs
in series. The number N of CSTRs is necessary in order to
generate a residence time distribution similar to that obtained
for the CW system is given by the inverse of the dimensionless
variance (sQ2 ¼ s2/s2), Eq. (1). In a single CSTR, all particles
entering the reactor are immediately and uniformly distrib-
uted, and accordingly, the response curve of a tracer impulse
equals an exponential decay function under steady state flow
conditions (Headley and Kadlec, 2007). In contrast, for infinite
tanks in series, the tracer response curve shows a small
degree of dispersion and therefore denotes PF. Thus, the N-
index represents a measure of PF behavior.
N ¼ 1
s2Q
(1)
Given that mixing and dispersion occurs as water flows
through thewetlandmedia (Kadlec andWallace, 2008), flow in
CWs may also be evaluated according to the flow in porous
media approach. Hence, for a detailed characterization of the
flow in treatment wetlands, alternative parameters that
display dispersion tendency, such as the dispersion number
(Dn ¼ 1/Pe, dimensionless), the longitudinal dispersivity
(aL ¼ D/v, m), or the Peclet number (Pe ¼ vL/D, dimensionless),
should be calculated from the dispersion coefficient (D ¼ s2v3/
(2L), m2 d�1), where v is the mean flow velocity (v ¼ L/s, m d�1)
and L equals the flow distance (m) (here the length of the
CW). Regarding CWs, dispersion is accepted to be low for
Dn < 0.025 (U.S. EPA, 2000), indicative of PF, intermediate for
Dn > 0.025 (Kadlec and Wallace, 2008), and high for Dn > 0.2
(U.S. EPA, 2000), indicative of a high degree of mixing. Overall,
Pe is low for dispersion/diffusion-dominated and large for
advective-dominated systems (Persson and Wittgren, 2003;
Albuquerque et al., 2004).
wat e r r e s e a r c h x x x ( 2 0 1 2 ) 1e1 2 3
Please cite this article in press as: Seeger, E.M., et al., Performance evaluation of different horizontal subsurface flow wetlandtypes by characterization of flow behavior, mass removal and depth-dependent contaminant load, Water Research (2012),http://dx.doi.org/10.1016/j.watres.2012.10.051
Chapter 4 – Paper III 41
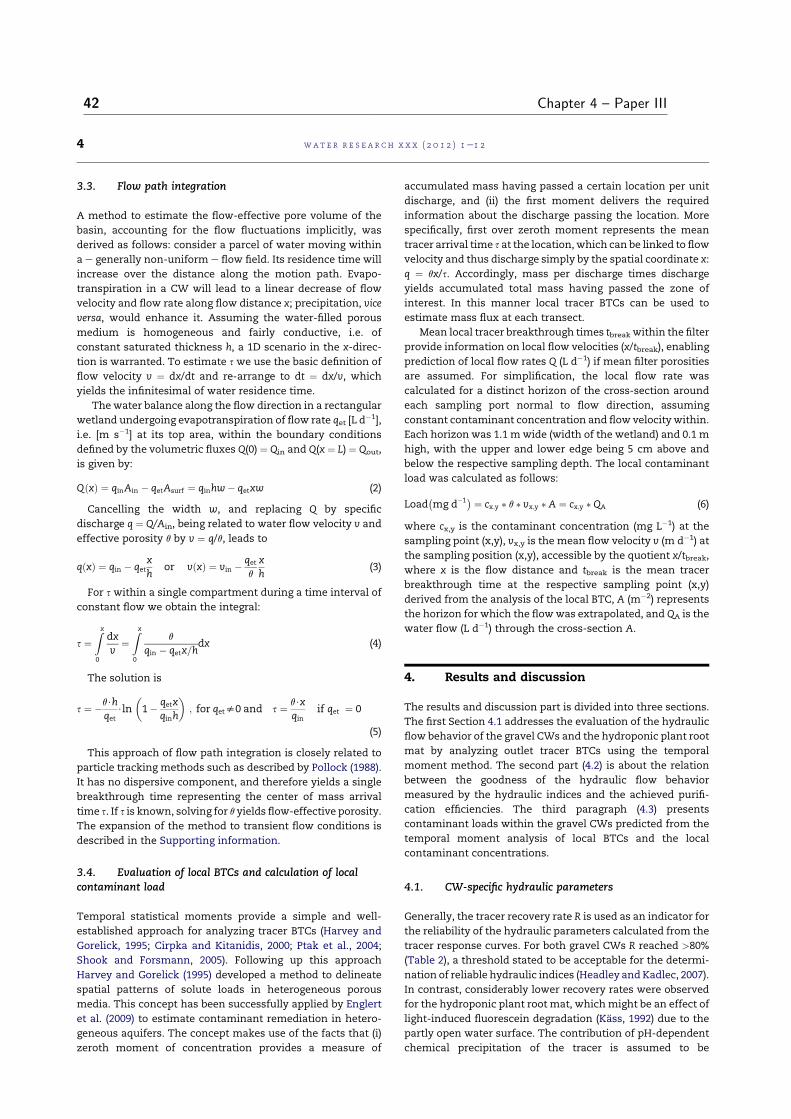
3.3. Flow path integration
A method to estimate the flow-effective pore volume of the
basin, accounting for the flow fluctuations implicitly, was
derived as follows: consider a parcel of water moving within
a e generally non-uniform e flow field. Its residence time will
increase over the distance along the motion path. Evapo-
transpiration in a CW will lead to a linear decrease of flow
velocity and flow rate along flow distance x; precipitation, vice
versa, would enhance it. Assuming the water-filled porous
medium is homogeneous and fairly conductive, i.e. of
constant saturated thickness h, a 1D scenario in the x-direc-
tion is warranted. To estimate s we use the basic definition of
flow velocity v ¼ dx/dt and re-arrange to dt ¼ dx/v, which
yields the infinitesimal of water residence time.
The water balance along the flow direction in a rectangular
wetland undergoing evapotranspiration of flow rate qet [L d�1],
i.e. [m s�1] at its top area, within the boundary conditions
defined by the volumetric fluxes Q(0) ¼ Qin and Q(x ¼ L) ¼ Qout,
is given by:
QðxÞ ¼ qinAin � qetAsurf ¼ qinhw� qetxw (2)
Cancelling the width w, and replacing Q by specific
discharge q ¼ Q/Ain, being related to water flow velocity v and
effective porosity q by v ¼ q/q, leads to
qðxÞ ¼ qin � qetxh
or vðxÞ ¼ vin � qet
q
xh
(3)
For s within a single compartment during a time interval of
constant flow we obtain the integral:
s ¼Zx
0
dxv
¼Zx
0
q
qin � qetx=hdx (4)
The solution is
s ¼ �q$hqet
$ln
�1� qetx
qinh
�; for qets0 and s ¼ q$x
qinif qet ¼ 0
(5)
This approach of flow path integration is closely related to
particle tracking methods such as described by Pollock (1988).
It has no dispersive component, and therefore yields a single
breakthrough time representing the center of mass arrival
time s. If s is known, solving for q yields flow-effective porosity.
The expansion of the method to transient flow conditions is
described in the Supporting information.
3.4. Evaluation of local BTCs and calculation of localcontaminant load
Temporal statistical moments provide a simple and well-
established approach for analyzing tracer BTCs (Harvey and
Gorelick, 1995; Cirpka and Kitanidis, 2000; Ptak et al., 2004;
Shook and Forsmann, 2005). Following up this approach
Harvey and Gorelick (1995) developed a method to delineate
spatial patterns of solute loads in heterogeneous porous
media. This concept has been successfully applied by Englert
et al. (2009) to estimate contaminant remediation in hetero-
geneous aquifers. The concept makes use of the facts that (i)
zeroth moment of concentration provides a measure of
accumulated mass having passed a certain location per unit
discharge, and (ii) the first moment delivers the required
information about the discharge passing the location. More
specifically, first over zeroth moment represents the mean
tracer arrival time s at the location, which can be linked to flow
velocity and thus discharge simply by the spatial coordinate x:
q ¼ qx/s. Accordingly, mass per discharge times discharge
yields accumulated total mass having passed the zone of
interest. In this manner local tracer BTCs can be used to
estimate mass flux at each transect.
Mean local tracer breakthrough times tbreak within the filter
provide information on local flow velocities (x/tbreak), enabling
prediction of local flow rates Q (L d�1) if mean filter porosities
are assumed. For simplification, the local flow rate was
calculated for a distinct horizon of the cross-section around
each sampling port normal to flow direction, assuming
constant contaminant concentration and flow velocity within.
Each horizon was 1.1 mwide (width of the wetland) and 0.1 m
high, with the upper and lower edge being 5 cm above and
below the respective sampling depth. The local contaminant
load was calculated as follows:
Load�mg d�1� ¼ cx;y � q � vx;y �A ¼ cx;y � QA (6)
where cx,y is the contaminant concentration (mg L�1) at the
sampling point (x,y), vx,y is the mean flow velocity v (m d�1) at
the sampling position (x,y), accessible by the quotient x/tbreak,
where x is the flow distance and tbreak is the mean tracer
breakthrough time at the respective sampling point (x,y)
derived from the analysis of the local BTC, A (m�2) represents
the horizon for which the flowwas extrapolated, and QA is the
water flow (L d�1) through the cross-section A.
4. Results and discussion
The results and discussion part is divided into three sections.
The first Section 4.1 addresses the evaluation of the hydraulic
flow behavior of the gravel CWs and the hydroponic plant root
mat by analyzing outlet tracer BTCs using the temporal
moment method. The second part (4.2) is about the relation
between the goodness of the hydraulic flow behavior
measured by the hydraulic indices and the achieved purifi-
cation efficiencies. The third paragraph (4.3) presents
contaminant loads within the gravel CWs predicted from the
temporal moment analysis of local BTCs and the local
contaminant concentrations.
4.1. CW-specific hydraulic parameters
Generally, the tracer recovery rate R is used as an indicator for
the reliability of the hydraulic parameters calculated from the
tracer response curves. For both gravel CWs R reached >80%
(Table 2), a threshold stated to be acceptable for the determi-
nation of reliable hydraulic indices (Headley and Kadlec, 2007).
In contrast, considerably lower recovery rates were observed
for the hydroponic plant root mat, whichmight be an effect of
light-induced fluorescein degradation (Kass, 1992) due to the
partly open water surface. The contribution of pH-dependent
chemical precipitation of the tracer is assumed to be
wat e r r e s e a r c h x x x ( 2 0 1 2 ) 1e1 24
Please cite this article in press as: Seeger, E.M., et al., Performance evaluation of different horizontal subsurface flow wetlandtypes by characterization of flow behavior, mass removal and depth-dependent contaminant load, Water Research (2012),http://dx.doi.org/10.1016/j.watres.2012.10.051
42 Chapter 4 – Paper III
negligible, since the pH did not change between in- and
outflow (pH: 7.2 � 0.1 SD), although the actual pH-gradient at
root surfaces and thus local chemical precipitation potential
remained unknown. However, even at R w50% hydraulic
parameters were found to be valid (Lin et al., 2003; Dierberg
and DeBusk, 2005).
4.1.1. Gravel-based constructed wetlandsOverall, the planting considerably improved the flow behavior
in the gravel filter, as indicated by the reduced dispersion
tendency and the elevated plug-flow component (see Table 2).
The same effect has been reported by Chazarenc et al. (2003)
who observed seasonality of Peclet numbers with lower Pe
during winter/spring (Pe ¼ 7e11) (when plants are in a state of
reduced activity) than during summer (Pe ¼ 14e16), and by
Persson et al. (1999) who simulated the effect of various
vegetation styles and found that the number of CSTRs
increased from 5.7 to 15 for the base and the fully vegetated
case, respectively. In contrast, Hamouri et al. (2007) found
almost identical dispersion for planted (P. australis: Dn ¼ 0.070,
Pe ¼ 14.29; Arundo donax: Dn ¼ 0.069, Pe ¼ 14.49) and unplanted
(Dn ¼ 0.072, Pe ¼ 13.89) CWs, but did not further discuss these
findings.
The hydraulic flow behavior of the planted gravel filter (see
Table 1) proved to be good in comparison to other CWs. On
average, HSSF CWs achieve an N-index of 11.0 � 1.2 (Kadlec
and Wallace, 2008), with N � 8 being indicative for close to PF
behavior (Kadlec et al., 2010): a limit exceeded by the present
gravel CW. In order to gauge PF behavior, the dimensionless
variance e in theory being zero for PF and unity for a well-
mixed system e can be interpreted as the percentage devia-
tion from PF (Kadlec, 1994). Accordingly, the planted and
unplanted filter would be 9% and 22% of the way from a PFR to
a CSTR, respectively. The dispersion indices obtained for our
CWs (Table 1) are similar to those observed for several other
HSSF wetlands (D: 1.18e1.5 mm2 s�1 ¼ 0.1e0.13 m2 d�1, a:
62e67 mm for similar-sized CWs (Grismer et al., 2001); Dn:
0.017e0.025 for laboratory-scale CWs (Araujo et al., 2008),
0.05e0.18 for pilot-scale CWs (Garcıa et al., 2004), 0.001e0.767
for field-scale CWs (Kadlec, 1994; Martinez and Wise, 2003))
and indicate a medium dispersion (U.S. EPA, 2000). This
interpretation is supported by the Peclet numbers, whichwere
within the range reported for other CWs (Pe ¼ 5e30) (Keefe
et al., 2004; Hamouri et al., 2007; Araujo et al., 2008; Ranieri
et al., 2011). They were found to be well above the limit at
which advection and dispersion processes become significant
(Pe > 4) (Grismer et al., 2001), but far below the limit repre-
senting PF behavior (Pe > 100) (Hoehn and Roberts, 1982).
Hence, both gravel CWs displayed transitional flow behavior
between a PFR and a CSTR.
The large deviation between s and nHRT suggests that the
actual porosities of both filters were in fact greater than the
assumed gravel porosity, and/or that mean residence times
appeared longer due to the presence of stagnant zones or
tracer sorption (e.g. by microbial biofilms). The mean actual
residence time exceeded nHRT by about 52% and 34% for the
planted and unplanted filters, respectively: a trend that has
been found for various wetlands (Garcıa et al., 2004; Headley
et al., 2005). For comparison, mean residence times are typi-
cally about 0.91 nHRT for HSSF wetlands, given that the
available wetland volume is not fully utilized (Kadlec and
Wallace, 2008). Sorption of fluorescein onto gravel is negli-
gible (Kass, 1992); thus, for the unplanted filter, zones of
stagnant water may have led to the long RTD tailing, which in
turn shifted the centroid to longer residence times. In the
planted filter, fluorescein is susceptible to sorption on root
surfaces and dead plant material. The retardation factor
(RD ¼ 1 þ r/n * Kd) was calculated according to Kass (1992),
where r is the bulk density of the gravel/soil matrix (approx-
imated as r ¼ 1.7 g cm�3 for quartz and a gravel porosity n of
0.35), and Kd (¼fOC * KOC) is the distribution coefficient, with
KOC being the organic carbon water distribution coefficient,
and fOC being the organic carbon content of the porous media
(estimated as 5%). KOC was estimated from the octanol water
distribution coefficient (KOW; log KOW ¼ �0.39) (Sabatini and
Austin, 1991) by means of the regression
KOC ¼ 0.937 * KOW � 0.006 (Brown and Flagg, 1981). Calculation
yielded a RD of 1.103, which indicates a rather weak retarda-
tion, suggesting that actual porosity in the planted CW was
greater than the assumed gravel porosity.
The calculation of effective filter porosities yielded
reasonable porosities of 46% and 38% for the planted and
unplanted CW, respectively. Briefly, calculations based on Eq.
(5) and its extension in the Supporting information, using the
mean residence time corrected for sorption processes
(scorr ¼ 4.2 d) for the planted CW, and themean residence time
of the analytical fit of the RTD for the unplanted filter,
Table 2 e Results of the tracer tests including thehydraulic parameters obtained by means of temporalmoment analysis of the outlet tracer BTCs: tracerrecovery (R, %), initial tracer detection (ts, d), meanresidence time (s, d), variance (s2, d2), dimensionlessvariance (sq
2 [ s2/s2, dimensionless), number ofcontinuously stirred tank reactors (N, dimensionless),dispersion coefficient (D [ s2v3/(2x), m2 dL1), dispersionnumber (Dn [ D/(vx), dimensionless), Peclet number(Pe [ 1/Dn [ v * x/D, dimensionless), longitudinaldispersivity (aL [ D/v, m), and porosity (q,dimensionless). Normalized parameter results are givenin brackets (calculation based on the expected systemwater volume).
Parameter Gravel filter Hydroponic plantroot mat
Planteda Unplanteda 15 cmwater levelb
30 cmwater levelc
R [%] 80 87 53 67
ts [d] 2.3 (0.66) 2.3 (0.75) 1.5 (0.37) 1.7 (0.24)
s [d] 4.6 (1.31) 3.8 (1.26) 7.1 (1.73) 11.9 (1.63)
s2 [d2] 1.9 (0.15) 3.1 (0.34) 9.4 (0.57) 74.4 (1.39)
sq2 [e] 0.09 0.22 0.19 0.52
N [e] 11.3 4.6 5.3 1.9
D [m2 d�1] 0.24 0.72 0.34 0.55
Dn [e] 0.04 0.11 0.09 0.26
Pe [e] 23 9 11 4
aL [m] 0.22 0.54 0.47 1.31
q [e] 0.46 0.38 1.08 1.10
a Tracer experiment start: 7/9/2009.
b Tracer experiment start: 3/9/2009.
c Tracer experiment start: 14/10/2009.
wat e r r e s e a r c h x x x ( 2 0 1 2 ) 1e1 2 5
Please cite this article in press as: Seeger, E.M., et al., Performance evaluation of different horizontal subsurface flow wetlandtypes by characterization of flow behavior, mass removal and depth-dependent contaminant load, Water Research (2012),http://dx.doi.org/10.1016/j.watres.2012.10.051
Chapter 4 – Paper III 43
according to Van Genuchten and Alves (1982) (sFit ¼ 3.0 d) in
order to exclude bias introduced by the long tailing (as dis-
cussed in Section 4.3). The difference between actual and
theoretical gravel porosity (35%) suggests that growing roots
loosened the gravel compaction and opened new pore space.
In case of an even coarser gravel material the opposite effect
should be expected.
4.1.2. Hydroponic plant root matThe normalized outlet tracer response curves (Fig. 1) of the
hydroponic plant root mat show relatively broad peaks for
both water levels, with an onset shortly after tracer injection
(far earlier than the ideal theoretical retention time) and
extension over up to three system volumes, thus revealing
a wider spectrum of residence times compared to the planted
gravel CW. These observations are also reflected by the
increased RTD spread and dispersion tendency (Table 2).
Raising the water table from 15 to 30 cm considerably
impaired the flow behavior of the plant root mat, as demon-
strated by the N-index decreasing from 5.3 to 1.9 while the
various measures of dispersion (s2, sq2, D, Dn, Pe) increased.
Moreover, the water table elevation resulted in an even earlier
initial tracer detection and a second tracer peak. Most notably,
the RTD at the high level resembled the curve of a CSTRmodel,
with a steep increase accompanied by a long tailing.
The variation in flow properties upon raising the water
level may have been due to transformation of the previously
resting into a floating root mat system composed of two
horizontal compartments: a densely rooted upper zone and
a sparsely rooted deeper zone. Thereby, a preferential flow
path may have been created in the lower zone at high water
level, explaining the short initial detection time. The bimodal
shape of the RTD, suggesting the presence of preferential flow
paths (Kadlec and Wallace, 2008; Wanko et al., 2009) and/or
stagnant zones, and the increased variance (s2 ¼ 74.4) and
dispersion at high water level, indicate that the two horizons
do not act as discrete layers, but rather that water parcels
presumably alternate between the deep and shallow zone
while passing the CW.
Overall, our results are in accordance with the findings of
Holland et al. (2004), who reported a decrease of N from 2.1 to
1.4, a 57% increase in RTD spread, and short-circuiting upon
a rise of the water table in a 250-m2 CW. However, detailed
comparison of the hydraulic characteristics turned out to be
challenging, since very little information is available on the
flow behavior of floating plant systems. Comparing a floating
plant mat to a free water surface (FWS) wetland ignores the
fact that in the latter, flow might be affected by wind friction
in the case of sparse vegetation (Lloyd et al., 2003; Kadlec and
Wallace, 2008). Nevertheless, dispersion tendency and N-
index of FWS systems (Dn ¼ 0.36 (Kadlec, 2000), N ¼ 4.1 � 0.4
(Kadlec andWallace, 2008)) were similar to our results, at least
concerning the low level.
System porosities, as determined by draining and refilling,
amounted to 51% and 63% for the low and high level, respec-
tively. In contrast, the flow path integration yielded effective
porosities ofw100% for bothwater levels. Both approaches are
impacted by conceptual errors, given that in the first case the
retainedwater volume is unknown, and in the second case the
retardation factor could not be estimated in order to correct s
for sorption, since the root mass was unknown. Assuming the
adhered water volume to be about 100 L, q calculates to 63%
and 69% for the low and high level respectively. These values
are reasonable, considering that for dense-emergent-
vegetated FWS CWs, porosity values are stated to be
0.65e0.75 (Kadlec and Wallace, 2008).
4.2. Treatment efficiency vs. hydraulic behavior
The planted gravel filter yielded considerably higher benzene,
MTBE and ammoniumenitrogen monthly mass removal effi-
ciencies compared to the unplanted reference, upon both
a percentage and a masseload scale (Table 3). Notably, in
October and November, when temperatures declined and
plant senescence started, the elimination of ammonium
sharply decreased for the planted filter, reflecting the stimu-
lating effect of the plants on nitrogen removal (Lee et al., 2009)
and the temperature/seasonal dependency of microbial N
transformation (Kadlec, 2009). In contrast, the removal of
organic compounds was not yet affected by seasonal change.
The unplanted reference bed exhibited low but stable removal
during the same time period. The treatment efficiency of the
hydroponic plant root mat was excellent for the low water
level (September), amounting to 98 � 1%, 78 � 1% and 74 � 1%
for benzene, MTBE and ammoniumeN, respectively. At the
high water level, removal was reduced by 30e44% for all three
contaminants. Since seasonal effects can be neglected, at
least for the organic pollutants (see Table 3), this trend is
probably related to the water table elevation alone. Overall,
the CWs can be ranked, regarding absolute contaminant load
Fig. 1 e Flow-weighted residence time distribution C0(F):
breakthrough curves and tracer mass recovery for the
planted gravel CW and the unplanted reference (top) and
for the hydroponic plant root mat operated at 15 cm (low)
and 30 cm (high) water level (bottom).
wat e r r e s e a r c h x x x ( 2 0 1 2 ) 1e1 26
Please cite this article in press as: Seeger, E.M., et al., Performance evaluation of different horizontal subsurface flow wetlandtypes by characterization of flow behavior, mass removal and depth-dependent contaminant load, Water Research (2012),http://dx.doi.org/10.1016/j.watres.2012.10.051
44 Chapter 4 – Paper III
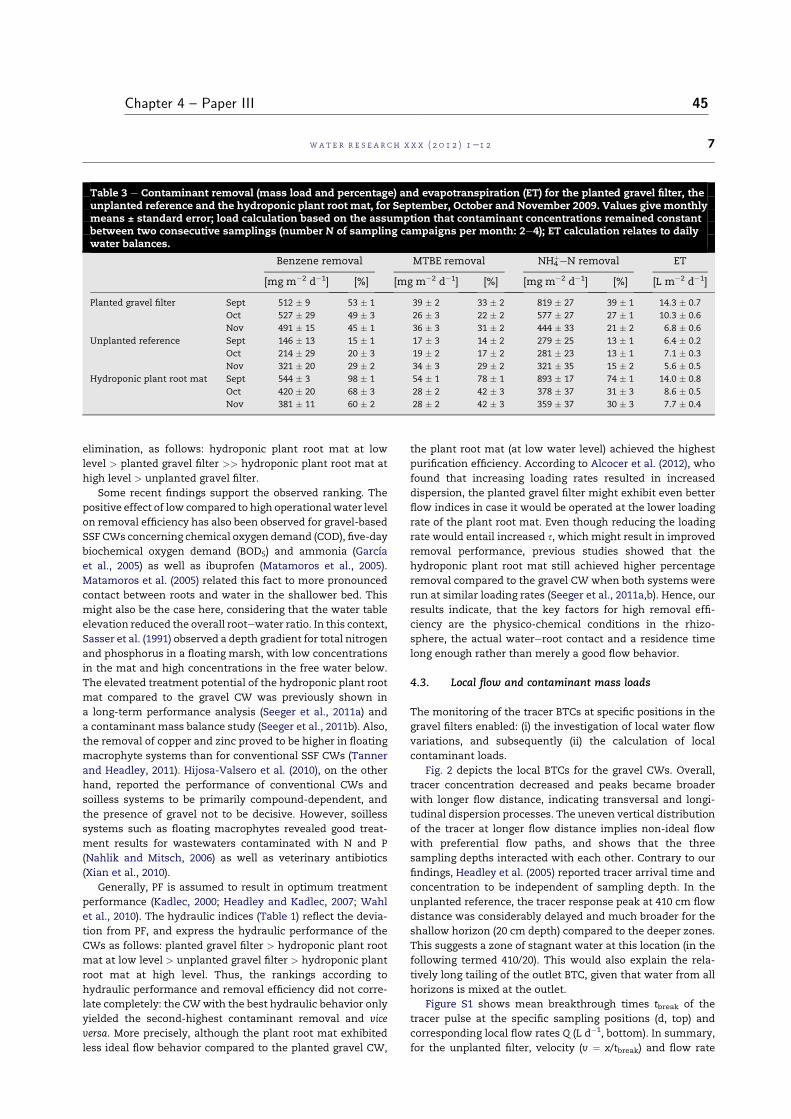
elimination, as follows: hydroponic plant root mat at low
level > planted gravel filter >> hydroponic plant root mat at
high level > unplanted gravel filter.
Some recent findings support the observed ranking. The
positive effect of low compared to high operational water level
on removal efficiency has also been observed for gravel-based
SSF CWs concerning chemical oxygen demand (COD), five-day
biochemical oxygen demand (BOD5) and ammonia (Garcıa
et al., 2005) as well as ibuprofen (Matamoros et al., 2005).
Matamoros et al. (2005) related this fact to more pronounced
contact between roots and water in the shallower bed. This
might also be the case here, considering that the water table
elevation reduced the overall rootewater ratio. In this context,
Sasser et al. (1991) observed a depth gradient for total nitrogen
and phosphorus in a floating marsh, with low concentrations
in the mat and high concentrations in the free water below.
The elevated treatment potential of the hydroponic plant root
mat compared to the gravel CW was previously shown in
a long-term performance analysis (Seeger et al., 2011a) and
a contaminant mass balance study (Seeger et al., 2011b). Also,
the removal of copper and zinc proved to be higher in floating
macrophyte systems than for conventional SSF CWs (Tanner
and Headley, 2011). Hijosa-Valsero et al. (2010), on the other
hand, reported the performance of conventional CWs and
soilless systems to be primarily compound-dependent, and
the presence of gravel not to be decisive. However, soilless
systems such as floating macrophytes revealed good treat-
ment results for wastewaters contaminated with N and P
(Nahlik and Mitsch, 2006) as well as veterinary antibiotics
(Xian et al., 2010).
Generally, PF is assumed to result in optimum treatment
performance (Kadlec, 2000; Headley and Kadlec, 2007; Wahl
et al., 2010). The hydraulic indices (Table 1) reflect the devia-
tion from PF, and express the hydraulic performance of the
CWs as follows: planted gravel filter > hydroponic plant root
mat at low level > unplanted gravel filter > hydroponic plant
root mat at high level. Thus, the rankings according to
hydraulic performance and removal efficiency did not corre-
late completely: the CWwith the best hydraulic behavior only
yielded the second-highest contaminant removal and vice
versa. More precisely, although the plant root mat exhibited
less ideal flow behavior compared to the planted gravel CW,
the plant root mat (at low water level) achieved the highest
purification efficiency. According to Alcocer et al. (2012), who
found that increasing loading rates resulted in increased
dispersion, the planted gravel filter might exhibit even better
flow indices in case it would be operated at the lower loading
rate of the plant root mat. Even though reducing the loading
rate would entail increased s, which might result in improved
removal performance, previous studies showed that the
hydroponic plant root mat still achieved higher percentage
removal compared to the gravel CW when both systems were
run at similar loading rates (Seeger et al., 2011a,b). Hence, our
results indicate, that the key factors for high removal effi-
ciency are the physico-chemical conditions in the rhizo-
sphere, the actual watereroot contact and a residence time
long enough rather than merely a good flow behavior.
4.3. Local flow and contaminant mass loads
The monitoring of the tracer BTCs at specific positions in the
gravel filters enabled: (i) the investigation of local water flow
variations, and subsequently (ii) the calculation of local
contaminant loads.
Fig. 2 depicts the local BTCs for the gravel CWs. Overall,
tracer concentration decreased and peaks became broader
with longer flow distance, indicating transversal and longi-
tudinal dispersion processes. The uneven vertical distribution
of the tracer at longer flow distance implies non-ideal flow
with preferential flow paths, and shows that the three
sampling depths interacted with each other. Contrary to our
findings, Headley et al. (2005) reported tracer arrival time and
concentration to be independent of sampling depth. In the
unplanted reference, the tracer response peak at 410 cm flow
distance was considerably delayed and much broader for the
shallow horizon (20 cm depth) compared to the deeper zones.
This suggests a zone of stagnant water at this location (in the
following termed 410/20). This would also explain the rela-
tively long tailing of the outlet BTC, given that water from all
horizons is mixed at the outlet.
Figure S1 shows mean breakthrough times tbreak of the
tracer pulse at the specific sampling positions (d, top) and
corresponding local flow rates Q (L d�1, bottom). In summary,
for the unplanted filter, velocity (v ¼ x/tbreak) and flow rate
Table 3 e Contaminant removal (mass load and percentage) and evapotranspiration (ET) for the planted gravel filter, theunplanted reference and the hydroponic plant root mat, for September, October and November 2009. Values give monthlymeans ± standard error; load calculation based on the assumption that contaminant concentrations remained constantbetween two consecutive samplings (number N of sampling campaigns per month: 2e4); ET calculation relates to dailywater balances.
Benzene removal MTBE removal NH4þeN removal ET
[mg m�2 d�1] [%] [mg m�2 d�1] [%] [mg m�2 d�1] [%] [L m�2 d�1]
Planted gravel filter Sept 512 � 9 53 � 1 39 � 2 33 � 2 819 � 27 39 � 1 14.3 � 0.7
Oct 527 � 29 49 � 3 26 � 3 22 � 2 577 � 27 27 � 1 10.3 � 0.6
Nov 491 � 15 45 � 1 36 � 3 31 � 2 444 � 33 21 � 2 6.8 � 0.6
Unplanted reference Sept 146 � 13 15 � 1 17 � 3 14 � 2 279 � 25 13 � 1 6.4 � 0.2
Oct 214 � 29 20 � 3 19 � 2 17 � 2 281 � 23 13 � 1 7.1 � 0.3
Nov 321 � 20 29 � 2 34 � 3 29 � 2 321 � 35 15 � 2 5.6 � 0.5
Hydroponic plant root mat Sept 544 � 3 98 � 1 54 � 1 78 � 1 893 � 17 74 � 1 14.0 � 0.8
Oct 420 � 20 68 � 3 28 � 2 42 � 3 378 � 37 31 � 3 8.6 � 0.5
Nov 381 � 11 60 � 2 28 � 2 42 � 3 359 � 37 30 � 3 7.7 � 0.4
wat e r r e s e a r c h x x x ( 2 0 1 2 ) 1e1 2 7
Please cite this article in press as: Seeger, E.M., et al., Performance evaluation of different horizontal subsurface flow wetlandtypes by characterization of flow behavior, mass removal and depth-dependent contaminant load, Water Research (2012),http://dx.doi.org/10.1016/j.watres.2012.10.051
Chapter 4 – Paper III 45
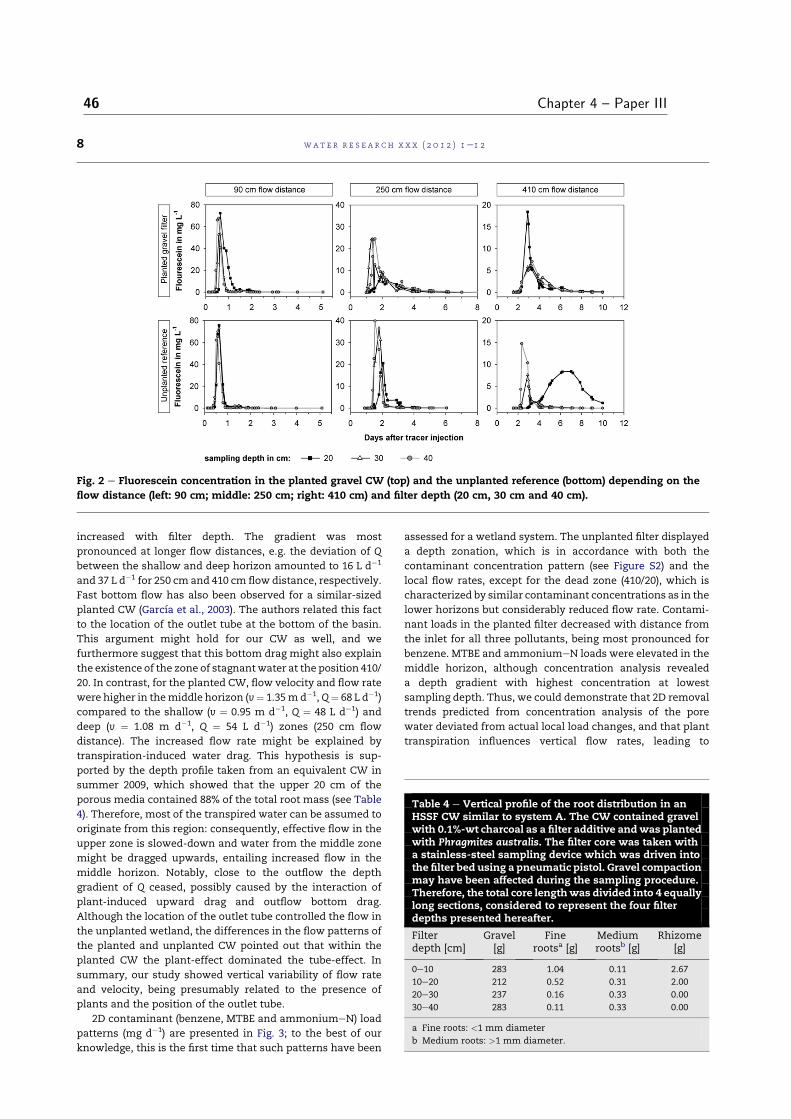
increased with filter depth. The gradient was most
pronounced at longer flow distances, e.g. the deviation of Q
between the shallow and deep horizon amounted to 16 L d�1
and 37 L d�1 for 250 cm and 410 cm flow distance, respectively.
Fast bottom flow has also been observed for a similar-sized
planted CW (Garcıa et al., 2003). The authors related this fact
to the location of the outlet tube at the bottom of the basin.
This argument might hold for our CW as well, and we
furthermore suggest that this bottom drag might also explain
the existence of the zone of stagnantwater at the position 410/
20. In contrast, for the planted CW, flow velocity and flow rate
were higher in themiddle horizon (v¼ 1.35md�1,Q¼ 68 L d�1)
compared to the shallow (v ¼ 0.95 m d�1, Q ¼ 48 L d�1) and
deep (v ¼ 1.08 m d�1, Q ¼ 54 L d�1) zones (250 cm flow
distance). The increased flow rate might be explained by
transpiration-induced water drag. This hypothesis is sup-
ported by the depth profile taken from an equivalent CW in
summer 2009, which showed that the upper 20 cm of the
porous media contained 88% of the total root mass (see Table
4). Therefore, most of the transpired water can be assumed to
originate from this region: consequently, effective flow in the
upper zone is slowed-down and water from the middle zone
might be dragged upwards, entailing increased flow in the
middle horizon. Notably, close to the outflow the depth
gradient of Q ceased, possibly caused by the interaction of
plant-induced upward drag and outflow bottom drag.
Although the location of the outlet tube controlled the flow in
the unplanted wetland, the differences in the flow patterns of
the planted and unplanted CW pointed out that within the
planted CW the plant-effect dominated the tube-effect. In
summary, our study showed vertical variability of flow rate
and velocity, being presumably related to the presence of
plants and the position of the outlet tube.
2D contaminant (benzene, MTBE and ammoniumeN) load
patterns (mg d�1) are presented in Fig. 3; to the best of our
knowledge, this is the first time that such patterns have been
assessed for a wetland system. The unplanted filter displayed
a depth zonation, which is in accordance with both the
contaminant concentration pattern (see Figure S2) and the
local flow rates, except for the dead zone (410/20), which is
characterized by similar contaminant concentrations as in the
lower horizons but considerably reduced flow rate. Contami-
nant loads in the planted filter decreased with distance from
the inlet for all three pollutants, being most pronounced for
benzene. MTBE and ammoniumeN loads were elevated in the
middle horizon, although concentration analysis revealed
a depth gradient with highest concentration at lowest
sampling depth. Thus, we could demonstrate that 2D removal
trends predicted from concentration analysis of the pore
water deviated from actual local load changes, and that plant
transpiration influences vertical flow rates, leading to
Fig. 2 e Fluorescein concentration in the planted gravel CW (top) and the unplanted reference (bottom) depending on the
flow distance (left: 90 cm; middle: 250 cm; right: 410 cm) and filter depth (20 cm, 30 cm and 40 cm).
Table 4 e Vertical profile of the root distribution in anHSSF CW similar to system A. The CW contained gravelwith 0.1%-wt charcoal as a filter additive andwas plantedwith Phragmites australis. The filter core was taken witha stainless-steel sampling device which was driven intothe filter bed using a pneumatic pistol. Gravel compactionmay have been affected during the sampling procedure.Therefore, the total core lengthwas divided into 4 equallylong sections, considered to represent the four filterdepths presented hereafter.
Filterdepth [cm]
Gravel[g]
Finerootsa [g]
Mediumrootsb [g]
Rhizome[g]
0e10 283 1.04 0.11 2.67
10e20 212 0.52 0.31 2.00
20e30 237 0.16 0.33 0.00
30e40 283 0.11 0.33 0.00
a Fine roots: <1 mm diameter
b Medium roots: >1 mm diameter.
wat e r r e s e a r c h x x x ( 2 0 1 2 ) 1e1 28
Please cite this article in press as: Seeger, E.M., et al., Performance evaluation of different horizontal subsurface flow wetlandtypes by characterization of flow behavior, mass removal and depth-dependent contaminant load, Water Research (2012),http://dx.doi.org/10.1016/j.watres.2012.10.051
46 Chapter 4 – Paper III
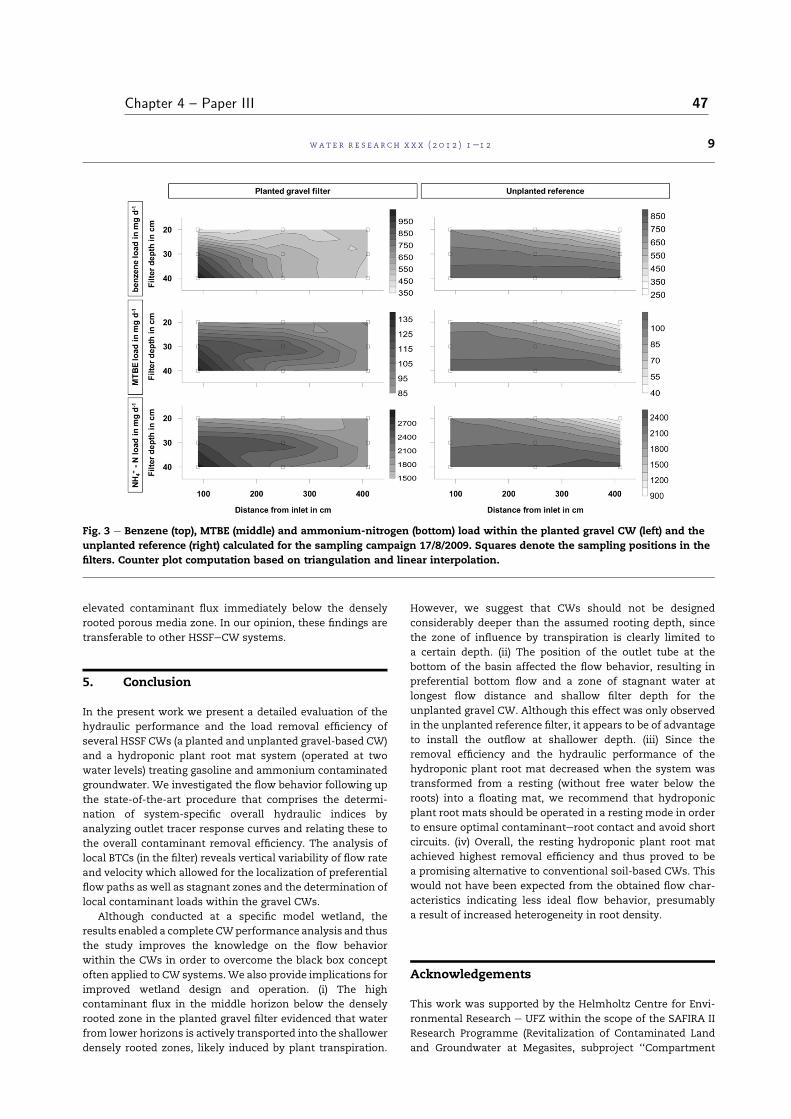
elevated contaminant flux immediately below the densely
rooted porous media zone. In our opinion, these findings are
transferable to other HSSFeCW systems.
5. Conclusion
In the present work we present a detailed evaluation of the
hydraulic performance and the load removal efficiency of
several HSSF CWs (a planted and unplanted gravel-based CW)
and a hydroponic plant root mat system (operated at two
water levels) treating gasoline and ammonium contaminated
groundwater. We investigated the flow behavior following up
the state-of-the-art procedure that comprises the determi-
nation of system-specific overall hydraulic indices by
analyzing outlet tracer response curves and relating these to
the overall contaminant removal efficiency. The analysis of
local BTCs (in the filter) reveals vertical variability of flow rate
and velocity which allowed for the localization of preferential
flow paths as well as stagnant zones and the determination of
local contaminant loads within the gravel CWs.
Although conducted at a specific model wetland, the
results enabled a complete CWperformance analysis and thus
the study improves the knowledge on the flow behavior
within the CWs in order to overcome the black box concept
often applied to CW systems.We also provide implications for
improved wetland design and operation. (i) The high
contaminant flux in the middle horizon below the densely
rooted zone in the planted gravel filter evidenced that water
from lower horizons is actively transported into the shallower
densely rooted zones, likely induced by plant transpiration.
However, we suggest that CWs should not be designed
considerably deeper than the assumed rooting depth, since
the zone of influence by transpiration is clearly limited to
a certain depth. (ii) The position of the outlet tube at the
bottom of the basin affected the flow behavior, resulting in
preferential bottom flow and a zone of stagnant water at
longest flow distance and shallow filter depth for the
unplanted gravel CW. Although this effect was only observed
in the unplanted reference filter, it appears to be of advantage
to install the outflow at shallower depth. (iii) Since the
removal efficiency and the hydraulic performance of the
hydroponic plant root mat decreased when the system was
transformed from a resting (without free water below the
roots) into a floating mat, we recommend that hydroponic
plant root mats should be operated in a resting mode in order
to ensure optimal contaminanteroot contact and avoid short
circuits. (iv) Overall, the resting hydroponic plant root mat
achieved highest removal efficiency and thus proved to be
a promising alternative to conventional soil-based CWs. This
would not have been expected from the obtained flow char-
acteristics indicating less ideal flow behavior, presumably
a result of increased heterogeneity in root density.
Acknowledgements
This work was supported by the Helmholtz Centre for Envi-
ronmental Research e UFZ within the scope of the SAFIRA II
Research Programme (Revitalization of Contaminated Land
and Groundwater at Megasites, subproject ‘‘Compartment
Fig. 3 e Benzene (top), MTBE (middle) and ammonium-nitrogen (bottom) load within the planted gravel CW (left) and the
unplanted reference (right) calculated for the sampling campaign 17/8/2009. Squares denote the sampling positions in the
filters. Counter plot computation based on triangulation and linear interpolation.
wat e r r e s e a r c h x x x ( 2 0 1 2 ) 1e1 2 9
Please cite this article in press as: Seeger, E.M., et al., Performance evaluation of different horizontal subsurface flow wetlandtypes by characterization of flow behavior, mass removal and depth-dependent contaminant load, Water Research (2012),http://dx.doi.org/10.1016/j.watres.2012.10.051
Chapter 4 – Paper III 47
Transfer e CoTra”), and the European Union (European
Commission, FP7 Contract No. 265946, Minotaurus). The
authors thank F. Loper, P. Weibbach and M. Schroter for their
assistance in the field and laboratory.
Appendix A. Supplementary data
Local tbreak and Q for the gravel CWs, contaminant pore water
concentrations, and supplementary information for the flow
path integration approach. This material is available free of
charge at http://dx.doi.org/10.1016/j.watres.2012.10.051.
r e f e r e n c e s
Albuquerque, A., Araujo, A., Sousa, E., 2004. Application of theadvectionedispersion equation to characterize thehydrodynamic regime in a submerged packed bed reactor. In:Proceedings of the International Conference onComputational & Experimental Engineering & Science. July26e29, Madeira, Portugal, pp. 548e553.
Alcocer, D.J.R., Vallejos, G.G., Champagne, P., 2012. Assessment oftheplugflowanddeadvolumeratios inasub-surfacehorizontal-flow packed-bed reactor as a representativemodel of a sub-surface horizontal constructed wetland. Ecol. Eng. 40, 18e26.
Araujo, A., Sousa, E., Albuquerque, A., 2008. Longitudinaldispersion in a horizontal subsurface flow constructedwetland: a numerical solution. Aus. N. Zeal. Indust. Appl.Math. J. 50, 339e353.
Ascuntar Rıos, D.A., Toro Velez, A.F., Pena, M.R., MaderaParra, C.A., 2009. Changes of flow patterns in a horizontalsubsurface flow constructed wetland treating domesticwastewater in tropical regions. Ecol. Eng. 35, 274e280.
Behrens, H., Beims, U., Dieter, H., Dietze, G., Eikmann, T.,Grummt, T., Hanisch, H., Henseling, H., Kaß, W., Kerndorf, H.,Leibundgut, C., Muller-Wegener, U., Ronnefahrt, I.,Scharenberg, B., Schleyer, R., Schloz, W., Tilkes, F., 2001.Toxicological and ecotoxicological assessment of watertracers. Hydrogeol. J. 9, 321e325.
Bottrell, S.H., Thronton, S.F., Spence, M.J., Allshorn, S.,Spence, K.H., 2010. Assessment of the use of fluoresecenttracers in a contaminated chalk aquifer. Q. J. Eng. Geol.Hydrogeol. 43, 195e206.
Braeckevelt, M., Mirschel, G., Wiessner, A., Rueckert, M.,Reiche, N., Vogt, C., Schultze, A., Paschke, H., Kuschk, P.,Kaestner, M., 2008. Treatment of chlorobenzene-contaminated groundwater in a pilot-scale constructedwetland. Ecol. Eng. 33, 45e53.
Braeckevelt, M., Reiche, N., Trapp, S., Wiessner, A., Paschke, H.,Kuschk, P., Kaestner, M., 2011. Chlorobenzene removalefficiencies and removal processes in a pilot-scale constructedwetland treating contaminated groundwater. Ecol. Eng. 37,903e913.
Brown, D.S., Flagg, E.W., 1981. Empirical prediction of organicpollutant sorption in natural sediments. J. Environ. Qual. 10(3), 382e386.
Bulc, T.G., 2006. Long term performance of a constructed wetlandfor landfill leachate treatment. Ecol. Eng. 26, 365e374.
Chazarenc, F., Merlin, G., Gonthier, Y., 2003. Hydrodynamics ofhorizontal subsurface flow constructed wetlands. Ecol. Eng.21, 165e173.
Chua, L.H.C., Robertson, A.P., Yee, W.K., Shuy, E.B., Lo, E.Y.M.,Lim, T.T., Tan, S.K., 2007. Use of fluorescein as a ground watertracer in brackish water aquifers. Ground Water 45 (1), 85e88.
Cirpka, O.A., Kitanidis, P.K., 2000. Characterization of mixing anddilution in heterogeneous aquifers by means of local temporalmoments. Water Resour. Res. 36 (5), 1221e1236.
Dierberg, F.E., DeBusk, T.A., 2005. An evaluation of two tracers insurface-flow wetlands: rhodamine-Wt and lithium. Wetlands25 (1), 8e25.
Englert, A., Hubbard, S.S., William, K.H., Li, L., Steefel, C.I., 2009.Feedbacks between hydrological heterogeneity andbioremediation induced biogeochemical transformations.Environ. Sci. Technol. 43, 5197e5204.
Ferro, A.M., Kadlec, R.H., Deschamp, J., 2002. Constructed wetlandsystem to treat wastewater at the BP Amoco former Casperrefinery: pilot scale project. In: The 9th International PetroleumEnvironmental Conference: Albuquerque (NM), USA.
Garcıa, J., Ojeda, E., Sales, E., Chico, F., Pıriz, T., Aguirre, P.,Mujeriego, R., 2003. Spatial variations of temperature, redoxpotential and contaminants in horizontal flow reed beds. Ecol.Eng. 21, 129e142.
Garcıa, J., Chiva, J., Aguirre, P., Alvarez, E., Sierra, J.P.,Mujeriego, R., 2004. Hydraulic behaviour of horizontalsubsurface flow constructed wetlands with different aspectratio and granular medium size. Ecol. Eng. 23, 177e187.
Garcıa, J., Aguirre, P., Barragan, J., Mujeriego, R., Matamoros, V.,Bayona, J., 2005. Effect of key design parameters on theefficiency of horizontal subsurface flow constructed wetlands.Ecol. Eng. 25, 405e418.
Goldscheider, N., Meiman, J., Pronk, M., Smart, C., 2008. Tracertests in karst hydrogeology and speleology. Int. J. Speleol. 37(1), 27e40.
Grismer, M.E., Tausendschoen, M., Shepherd, H.L., 2001.Hydraulic characteristics of a subsurface flow constructedwetland for winery effluent treatment. Water Environ. Res. 73(4), 466e477.
Haberl, R., Grego, S., Langergraber, G., Kadlec, R.H., Cicalini, A.-R.,Dias, S.M., Novais, J.M., Aubert, S., Gerth, A., Thomas, H.,Hebner, A., 2003. Constructed wetlands for the treatment oforganic pollutants. J. Soils Sediments 3 (2), 109e124.
Hamouri, B.E., Nazih, J., Lahjouj, J., 2007. Subsurface-horizontalflow constructed wetland for sewage treatment underMaroccan climate conditions. Desalination 215, 153e158.
Harden, H.S., Chanton, J.P., Rose, J.B., John, D.E., Hooks, M.E., 2003.Comparison of sulfur hexafluoride, fluorescein andrhodamine dyes and the bacteriophage PRD-1 in tracingsubsurface flow. J. Hydrol. 277, 100e115.
Harvey, C.F., Gorelick, S.M., 1995. Temporal moment-generatingequations e modeling transport and mass-transfer inheterogeneous aquifers. Water Resour. Res. 31 (8), 1895e1911.
Headley, T.R., Kadlec, R.H., 2007. Conducting hydraulic tracerstudies of constructed wetlands: a practical guide. Ecohydrol.Hydrobiol. 7 (3e4), 269e282.
Headley, T.R., Herity, E., Davison, L., 2005. Treatment at differentdepths and vertical mixing within a 1-m deep horizontalsubsurface-flow wetland. Ecol. Eng. 25, 567e582.
Hijosa-Valsero, M., Matamoros, V., Sidrach-Cardona, R., Martın-Villacorta, J., Becares, E., Bayona, J.M., 2010. Comprehensiveassessment of the design configuration of constructedwetlands for the removal of pharmaceuticals and personalcare products from urban wastewaters. Water Res. 44,3669e3678.
Hoehn, E., Roberts, P.V., 1982. Advectionedispersioninterpretation of tracer observations in an aquifer. GroundWater 20 (4), 457e465.
Holland, J.F., Martin, J.F., Granata, T., Bouchard, V., Quigley, M.,Brown, L., 2004. Effects of wetland depth and flow rate onresidence time distribution characteristics. Ecol. Eng. 23,189e203.
Kadlec, R.H., 1994. Detention and mixing in free water wetlands.Ecol. Eng. 3, 345e380.
wat e r r e s e a r c h x x x ( 2 0 1 2 ) 1e1 210
Please cite this article in press as: Seeger, E.M., et al., Performance evaluation of different horizontal subsurface flow wetlandtypes by characterization of flow behavior, mass removal and depth-dependent contaminant load, Water Research (2012),http://dx.doi.org/10.1016/j.watres.2012.10.051
48 Chapter 4 – Paper III
Kadlec, R.H., 2000. The inadequacy of first-order treatmentwetland models. Ecol. Eng. 15, 105e119.
Kadlec, R.H., 2009. Comparison of free water and horizontalsubsurface treatment wetlands. Ecol. Eng. 35, 159e174.
Kadlec, R.H., Wallace, S.D., 2008. Treatment Wetlands. CRC Press,Boca Raton, USA.
Kadlec, R.H., Cuvellier, C., Stober, T., 2010. Performance of theColumbia, Missouri, treatment wetland. Ecol. Eng. 36, 672e684.
Kasnavia, T., Vu, D., Sabatini, D.A., 1999. Fluorescent dye andmedia properties affecting sorption and tracer selection.Ground Water 37 (3), 376e381.
Kass, W., 1992. Geohydrologische Markierungstechnik e
Lehrbuch der Hydrogeologie, Band 9. Gebruder Borntraeger,Berlin.
Keefe, S.H., Barber, L.B., Runkel, R.L., Ryan, J.N., McKnight, D.M.,Wass, R.D., 2004. Conservative and reactive solute transport inconstructed wetlands. Water Resour. Res. 40 (1), 1e12.
Kjellin, J., Worman, A., Johansson, H., Lindahl, A., 2007.Controlling factors for water residence time and flow patternsin Ekeby treatment wetland, Sweden. Adv. Water Resour. 30,838e850.
Konnerup, D., Koottatep, T., Brix, H., 2009. Treatment of domesticwastewater in tropical, subsurface flow constructed wetlandsplanted with Canna and Heliconia. Ecol. Eng. 35, 248e257.
Kung, K.J.-S., 1990. Influence of plant uptake on the performanceof bromide tracer. Soil Sci. Soc. Am. J 54, 975e979.
Lee, C., Fletcher, T.D., Sun, G., 2009. Nitrogen removal inconstructed wetland systems. Eng. Life Sci. 9 (1), 11e22.
Lin, A.Y.-C., Debroux, J.-F., Cunningham, J.A., Reinhard, M., 2003.Comparison of rhodamine WT and bromide in thedetermination of hydraulic characteristics of constructedwetlands. Ecol. Eng. 20, 75e88.
Lloyd, B.J., Vorkas, C.A., Guganesharajah, R.K., 2003. Reducinghydraulic short-circuiting in maturation ponds to maximizepathogen removal using channels and wind breaks. Water Sci.Technol. 48 (2), 153e162.
Magal, E., Weisbrod, N., Yakirevich, A., Yechieli, Y., 2008. The useof fluorescent dyes as tracers in highly saline groundwater. J.Hydrol. 358, 124e133.
Martinez, C.J., Wise, W.R., 2003. Analysis of constructedtreatment wetland hydraulics with the transient storagemodel OTIS. Ecol. Eng. 20, 211e222.
Matamoros, V., Garcıa, J., Bayona, J.M., 2005. Behaviour of selectedpharmaceuticals in subsurface flow constructed wetlands:a pilot-scale study. Environ. Sci. Technol. 39, 5449e5454.
Moore, B.J., Headley, J.V., Dupont, R.R., Doucette, W.D.,Armstrong, J.E., 2002. Abatement of gas-condensatehydrocarbons in a natural wetland. J. Environ. Sci. Health PartA 37 (4), 425e438.
Nahlik, A.M., Mitsch, W.J., 2006. Tropical treatment wetlandsdominated by free-floating macrophytes for water qualityimprovement in Costa Rica. Ecol. Eng. 28, 246e257.
Netter, R., 1994. Flow characteristics of planted soil filters. WaterSci. Technol. 29 (4), 37e44.
Persson, J., Wittgren, H.B., 2003. How hydrological and hydraulicconditions affect performances of ponds. Ecol. Eng. 21,259e269.
Persson, J., Somes, N.L.G., Wong, T.H.F., 1999. Hydraulicsefficiency of constructed wetlands and ponds. Water Sci.Technol. 40 (3), 291e300.
Pollock, D.W., 1988. Semianalytical computation of pathlines forfinite-difference models. Ground Water 26 (6), 743e750.
Ptak, T., Piepenbrink, M., Martac, E., 2004. Tracer tests for theinvestigation of heterogeneous porous media and stochasticmodelling of flow and transport e a review of some recentdevelopments. J. Hydrol. 294, 122e163.
Ranieri, E., Verlicchi, P., Young, T.M., 2011. Paracetamol removal insubsurface flow constructed wetlands. J. Hydrol. 404, 130e135.
Reiche, N., Lorenz, W., Borsdorf, H., 2010. Development andapplication of dynamic air chambers for measurement ofvolatilization fluxes of benzene and MTBE from constructedwetlandsplantedwithcommonreed.Chemosphere79, 162e168.
Sabatini, D.A., Austin, T.A., 1991. Characteristics of rhodamineWT and fluorescein as adsorbing ground-water tracers.Ground Water 29 (3), 341e349.
Sasser, C.E., Gosselink, J.G., Shaffer, G.P., 1991. Distribution ofnitrogen and phosphorus on a Louisiana freshwater floatingmarsh. Aquatic Bot. 41, 317e331.
Seeger, E.M., Kuschk, P., Fazekas, H., Grathwohl, P., Kaestner, M.,2011a. Bioremediation of benzene-, MTBE- and ammonia-contaminated groundwater with pilot-scale constructedwetlands. Environ. Pollut. 159, 3769e3776.
Seeger, E.M., Reiche, N., Kuschk, P., Borsdorf, H., Kaestner, M.,2011b. Performance evaluation using a three compartmentmass balance for the removal of volatile organic compoundsin pilot scale constructed wetlands. Environ. Sci. Technol. 45,8467e8474.
Shook, G.M., Forsmann, J.H., 2005. Tracer Interpretation UsingTemporal Moments on a Spreadsheet. Idaho NationalLaboratory, U.S. Department of Energy.
Su, T.-M., Yang, A.-C., Shih, S.-S., Lee, H.-Y., 2009. Optimal designfor hydraulic efficiency performance of free-water-surfaceconstructed wetlands. Ecol. Eng. 35, 1200e1207.
Tanner, C.C., Headley, T.R., 2011. Components of floatingemergent macrophyte treatment wetlands influencingremoval of stormwater pollutants. Ecol. Eng. 37, 474e486.
U.S. EPA, 2000. Constructed Wetlands e Treatment of MunicipalWastewaters. EPA/625/R-99/010. U.S. EnvironmentalProtection Agency: Office of Research and Development,National Risk Management Research Laboratory, Cincinnati,OH. http://.epa.gov/ncea.
U.S. EPA, 2003. Tracer-test Planning using the Efficient HydrologicTracer-test Design (EHTD) Program. EPA/600/R-03/034. U.S.Environmental Protection Agency: National Center forEnvironmental Assessment, Washington, DC. http://.epa.gov/ncea.
Van Genuchten, M.T., Alves, W.J., 1982. Analytical Solutions ofthe One-dimensional ConvectiveeDispersive Solute TransportEquation. United States Department of Agriculture,Agricultural Research Service. Technical Bulletin 1661.
Vymazal, J., 2009. The use of constructed wetlands withhorizontal sub-surface flow for various types of wastewater.Ecol. Eng. 35, 1e17.
Vymazal, J., Kropfelova, L., 2009. Removal of organics inconstructed wetlands with horizontal sub-surface flow:a review of the field experience. Sci. Total Environ. 407,3911e3922.
Wahl, M.D., Brown, L.C., Soboyejo, A.O., Martin, J., Dong, B., 2010.Quantifying the hydraulic performance of treatment wetlandsusing the moment index. Ecol. Eng. 36, 1691e1699.
Wanko, A., Tapia, G., Mose, R., Gregoire, C., 2009. Adsoprtiondistribution impact on preferential transport withinhorizontal flow constructed wetland (HFCW). Ecol. Modell.220, 3341e3352.
Werner, T.M., Kadlec, R.H., 1996. Application of residence timedistributions to stormwater treatment systems. Ecol. Eng. 7,213e234.
Williams, J.B., 2002. Phytoremediation on wetland ecosystems:progress, problems, and potential. Crit. Rev. Plant Sci. 21 (6),607e635.
Xian, Q., Hu, L., Chen, H., Chang, Z., Zou, H., 2010. Removal ofnutrients and veterinary antibiotics from swine wastewaterby a constructed macrophyte floating bed system. J. Environ.Manage. 91, 2657e2661.
Xu, S., Leri, A.C., Myneni, S.C.B., Jaffe, P.R., 2004. Uptake ofbromide by two wetland plats (Typha latifolia L. and Phragmites
wat e r r e s e a r c h x x x ( 2 0 1 2 ) 1e1 2 11
Please cite this article in press as: Seeger, E.M., et al., Performance evaluation of different horizontal subsurface flow wetlandtypes by characterization of flow behavior, mass removal and depth-dependent contaminant load, Water Research (2012),http://dx.doi.org/10.1016/j.watres.2012.10.051
Chapter 4 – Paper III 49
australis (Cav.) Trin. ex Steud). Environ. Sci. Technol. 38,5642e5648.
Yalcuk, A., Ugurlu, A., 2009. Comparison of horizontal andvertical constructed wetlands systems for landfill leachatetreatment. Bioresour. Technol. 100, 2521e2526.
Glossary
Ain: area perpendicular to the flow direction [L2]Asurf: surface area [L2]c0(F): normalized concentration [e]ctracer: fluorescein concentration of the tracer solution [M L3]cx,y: contaminant concentration at the sampling position (x,y)
[M L3]D: dispersion coefficient [L2 t�1]Dn: dispersion number [e]fOC: organic carbon content [%]h: water table [L]Kd: solid water distribution coefficient [L3 Me1]KOC: organic carbon water distribution coefficient [L3 Me1]KOW: octanol water distribution coefficient [e]L: length of the wetland [L]Min: total mass of tracer applied [M]Mout: total tracer mass recovered [M]N: number of continuously stirred tank reactor [e]n: gravel porosity [e]nHRT: theoretical hydraulic retention time [t]Pe: Peclet number [e]
Pr: pumping rate [L3 t�1]Q: flow rate [L3 t�1]QA: flow through the cross-section A [L3 t�1]qet: evapotranspiration rate per surface area [L t�1]qin: inflow specific discharge [L t�1]Qin: mean inflow rate [L3 t�1]Qmean: mean flux [L3 t�1]Qout: mean outflow rate [L3 t�1]R: tracer recovery [%]RD: retardation factor [e]tbreak: tracer breakthrough time [t]ts: initial tracer detection [t]v: flow velocity [L t�1]Vout(t): outflow volume accumulated for the time t [L3 t�1]Vs: sample volume [L3]Vsys: estimated pore volume [L3]vx,y: flow velocity at the sampling position (x,y) [L t�1]w: width of the wetland [L]x: flow distance [L]F: dimensionless flow-weighted time [e]Dt: time interval of tracer injection [t]aL: longitudinal dispersivity [L]q: porosity [e]r: density of the gravel/soil matrix [M L�3]s2: variance [t2]sQ
2: dimensionless variance [e]s: mean residence time [t]scorr: mean residence time corrected for sorption processes [t]sfit: mean residence time of the analytical fit of the RTD [t]
wat e r r e s e a r c h x x x ( 2 0 1 2 ) 1e1 212
Please cite this article in press as: Seeger, E.M., et al., Performance evaluation of different horizontal subsurface flow wetlandtypes by characterization of flow behavior, mass removal and depth-dependent contaminant load, Water Research (2012),http://dx.doi.org/10.1016/j.watres.2012.10.051
50 Chapter 4 – Paper III
5 Summary, conclusion, and futureperspectives
The overall aim of this study was to evaluate the treatment performance of differentlydesigned HSSF CWs at the pilot-scale for the remediation of water contaminated withbenzene, MTBE and ammonium. Investigations were carried out at the field site Leunausing the local polluted groundwater for feeding the CWs (gravel CWs with differentfilter composition, an unplanted gravel filter as a reference system and a hydroponicplant root mat) and were conducted over a period of 30 months. The key objectiveswere to gain knowledge on (i) contaminant specific treatment efficiency dependingon wetland type and filter composition (chapter 2), (ii) the fate of the VOCs in thedifferent CW types taking into account the main elimination pathways volatilization,plant uptake and microbial degradation (chapter 3), and (iii) the hydraulic behavior ofthe CWs with regard to wetland type and operational mode (chapter 4).
5.1 Summary of the results and concluding remarksIn chapter 2, the effectiveness of the gravel filter and the hydroponic plant root matto remove benzene, MTBE and ammonium from groundwater, and also the impact ofthe filter additives charcoal and ferric oxide, is presented. Overall, the results revealedthat the extent of contaminant decline is (i) greatly affected by the wetland type, withthe hydroponic plant root mat realizing lower outflow concentrations and longer-lastinghigh treatment performance than the gravel-based CW, (ii) season-dependent, withincreased concentration decline during spring-summer at temperatures above 15°C,when plants were growing, (iii) contaminant-specific with most pronounced declinefollowing the order benzene � ammonium > MTBE for the planted gravel filter andbenzene > MTBE � ammonium for the hydroponic plant root mat, and (iv) notimproved by the filter additives charcoal and ferric oxide in the long term, althoughsorption processes were observed and elevated ferrous iron formation indicated iron(III)
51
52 5 Summary, conclusion, and future perspectives
reduction. Specifically, at average inflow concentrations of 20 ± 3.3 mg L−1, 3.7 ± 0.7mgL−1 and 45 ± 3.4 mgL−1 for benzene, MTBE and ammonium-N, the plant root matand the planted gravel CW achieved relative concentration decrease during summer(May - Aug. 2008) of about 99 ± 1 % and 81 ± 7 % for benzene, 82 ± 4 % and 17 ± 7 %for MTBE, and 41 ± 7 % and 54 ± 17 % for ammonium-N. Comparison of these resultswith other wetland studies (HF and VF CWs) emphasizes the excellent treatmentperformance of the hydroponic plant root mat in particular regarding MTBE, giventhat concentration decline reported in the literature was less than half of that found inthe presented study (e.g. Keefe et al., 2004; Bedessem et al., 2007). For benzene, theresults of the present study were in the upper reported range (concentration decline75-99%; e.g. Wallace et al., 2001; Tang et al., 2009; Rakoczy et al., 2011), whereasammonium treatment efficiency was lower than the average value reported for 150 HFwetlands (58%; Vymazal (2005)). Based on the determination of milieu parameters,the filters were shown to be mainly anaerobic, as pointed out by the very low dissolvedoxygen content (<0.5 mg L−1), the low redox values of the pore water (<122 mV) andthe observed low levels of nitrate and nitrite (during summer: <1.2 mgL−1). Therefore,oxygen is considered to be one of the limiting factors for contaminant turnover in bothwetland types. Concerning the processes contributing to VOC removal, the potentialfor microbial degradation could be proven for benzene in an aerobic microcosm studyby a shift in carbon isotope fractionation (+2.8-4.3h) and elevated MPN counts forbenzene degraders in water (up to 7.8 × 10³ MPN g−1) and gravel (up to 3.8 × 10⁴
MPN g−1) samples taken from the wetlands in comparison with groundwater samples(1.5 × 10² MPN g−1). Summing up, the results of the comparative study show theprinciple potential of HF CWs for remediating the present contaminated groundwaterand chemically polluted water in general, and furthermore point out that charcoaland ferric oxide do not considerably enhance treatment performance. The key finding,however, is that hydroponic plant root mat systems represent a promising alternativeto conventional solid filter matrix HF CWs for treatment of VOC contaminated waters.
The focus of chapter 3 was on the evaluation of actual treatment efficiency of thegravel CW and the hydroponic plant root mat by investigating contaminant fate andsetting up contaminant mass balances in order to quantify and distinguish betweenelimination and distribution pathways (volatilization, plant uptake, and microbial degra-dation). The mass balancing was carried out for the compounds benzene and MTBE.For measuring VOC air emission, dynamic air chambers (DAC) were mounted on top ofthe CWs; the measurement of VOC in the atmosphere for the mass balance calculation
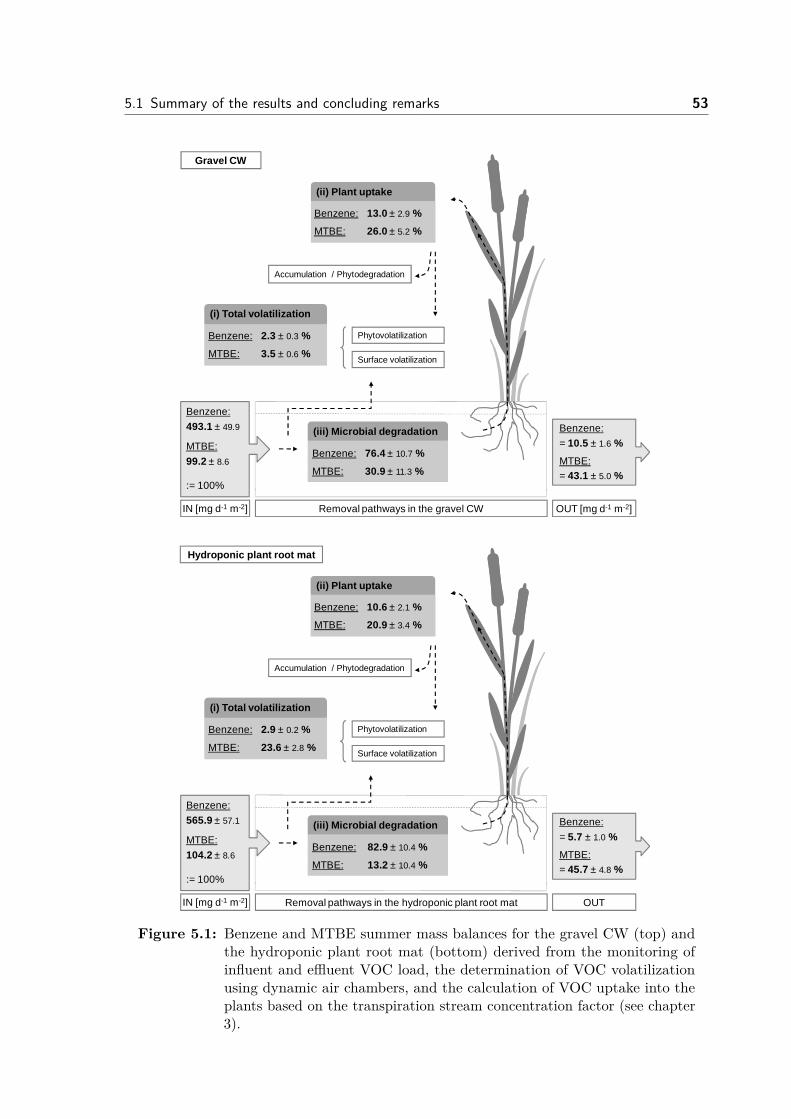
5.1 Summary of the results and concluding remarks 53
Benzene:
493.1 ± 49.9
MTBE:
99.2 ± 8.6
:= 100%
(ii) Plant uptake
Benzene: 13.0 ± 2.9 %
MTBE: 26.0 ± 5.2 %
OUT [mg d-1 m-2]Removal pathways in the gravel CWIN [mg d-1 m-2]
(i) Total volatilization
Benzene: 2.3 ± 0.3 %
MTBE: 3.5 ± 0.6 %
(iii) Microbial degradation
Benzene: 76.4 ± 10.7 %
MTBE: 30.9 ± 11.3 %
Benzene:
= 10.5 ± 1.6 %
MTBE:= 43.1 ± 5.0 %
Phytovolatilization
Surface volatilization
Accumulation / Phytodegradation
Gravel CW
Benzene:
565.9 ± 57.1
MTBE:
104.2 ± 8.6
:= 100%
OUTRemoval pathways in the hydroponic plant root matIN [mg d-1 m-2]
(i) Total volatilization
Benzene: 2.9 ± 0.2 %
MTBE: 23.6 ± 2.8 %
(iii) Microbial degradation
Benzene: 82.9 ± 10.4 %
MTBE: 13.2 ± 10.4 %
Benzene:
= 5.7 ± 1.0 %
MTBE:= 45.7 ± 4.8 %
(ii) Plant uptake
Benzene: 10.6 ± 2.1 %
MTBE: 20.9 ± 3.4 %
Phytovolatilization
Surface volatilization
Accumulation / Phytodegradation
Hydroponic plant root mat
Figure 5.1: Benzene and MTBE summer mass balances for the gravel CW (top) andthe hydroponic plant root mat (bottom) derived from the monitoring ofinfluent and effluent VOC load, the determination of VOC volatilizationusing dynamic air chambers, and the calculation of VOC uptake into theplants based on the transpiration stream concentration factor (see chapter3).
54 5 Summary, conclusion, and future perspectives
was performed by N. Reiche. First of all, the VOC load removal assessment confirmedthe principle trends obtained from the performance evaluation based on contaminantoutflow concentrations: Benzene and MTBE effluent loads showed great seasonal vari-ance, with highest removal efficiencies during summer, and the hydroponic plant rootmat achieved higher maximum removal (benzene: 99.9 ± 8.5 %, 606 ± 51 mg d−1 m−2;MTBE: 96 ± 8 %, 117 ± 9 mgd−1m−2) than the gravel CW (benzene: 96 ± 8 %, 480 ±42 mg d−1 m−2; MTBE: 75 ± 11 %, 85 ± 13 mg d−1 m−2). Second, the results and thecalculations generated by the balancing model state that (i) not only the overall loadremoval from the water phase, but also the degree of mass flux via a particular removalpathway is contaminant dependent, and (ii) the wetland’s characteristics have a directimpact on emission dimensions. Figure 5.1 gives an overview of the mass fluxes (in % ofapplied mass) regarding volatilization, plant uptake, and microbial degradation in therhizosphere for the gravel CW and the hydroponic plant root mat during summer time.Briefly, irrespective of the wetland type benzene was removed to greater extent thanMTBE and the main mass flux for benzene was by microbial contaminant degradation(76.4%, 82.9%), while plant uptake and volatilization fluxes amounted to much lowervalues. During winter the same trend of mass flux was obtained, but the values werelower. By comparison, MTBE mass flux via microbial degradation was relatively poorfor both CW types (13.2%, 30.9%). Particular attention should furthermore be paid tothe fact that the CW types differed with respect to total volatilization of MTBE, whichwas enhanced in the hydroponic plant root mat (23.6%) compared to the gravel CW(3.5%). The outcome of this mass balance evaluation can be summarized as follows:The hydroponic plant root mat achieved good treatment results for benzene, withhigh mass flux via microbial degradation and low emission flux. However, for MTBEremoval was much lower and the achieved removal was mainly caused by volatilization,more precisely by surface volatilization presumably resulting from the direct contactbetween water and atmosphere. Hence, the application potential of the plant root matstrongly depends on the contaminant to be treated, e.g. for VOCs similar to benzene(e.g. volatile but sufficiently fast degradable) it appears to provide a viable and reliabletreatment option, whereas for compounds exhibiting high volatility, high water solubilityand reduced degradability such as MTBE, emission might arise leading to restrictedapplicability. In contrast, the gravel CW achieved similar good treatment results forbenzene, but volatilization was shown to be negligible (<5%) for both benzene andMTBE. Overall, mass balancing allowed for a conclusive analysis of the reliability ofthe two CW types, as it enabled estimation of mass flux due to microbial degradation,and the results may serve as a basis for deciding which CW type, a conventional gravel
5.1 Summary of the results and concluding remarks 55
CW or a hydroponic plant root mat, is appropriate for treatment of a wastewater thatcontains different VOCs.
Chapter 4 completes the CW performance analysis by providing a detailed char-acterization of the wetland-specific flow behavior and relating hydraulic indices tocontaminant mass removal in order to investigate to what extent the flow behaviorinfluences and predetermines removal efficiency. Investigations were carried out forthe planted gravel CW, the unplanted gravel filter as a reference and the hydroponicplant root mat operated at two water levels. Tracer test results evinced best hydraulicbehavior for the planted gravel CW (N = 11.3, Dn = 0.04, Pé = 23), whereas the plantroot mat exhibited pronounced dispersion tendencies and thus less optimal flow evenwhen operated at low water table (N = 5.3, Dn = 0.09, Pé = 11). However, highestmass removal for benzene, MTBE and ammonium were achieved by the plant rootmat (at low water level). In order to test whether the treatment performance of theplant root mat can still be improved, the resting mat was transformed into a floatingsystem by water table elevation. These changes in operational mode/design impairedboth hydraulic flow behavior - as indicated by increased dispersion parameters and theobservation of short-circuit flow - and contaminant load removal even though averageresidence time was increased. The generation of a not yet fully rooted zone belowthe swimming root mat might have caused this performance decline. Based on theassumption that the water-root/biota contact is essential for contaminant removal, adepth profile of the gravel CW was analysed. Investigations evinced that 80% of theroots were contained in the upper 20 cm of the porous medium. In contrast, the porousmedia of the resting plant root mat is composed exclusively of roots, hence the plantroot mat might provide better water-root/biota contact than the gravel filter at leastwhen operated in a resting mode. Summing up, the aforementioned findings clearlystate that high actual water-root contact and root density as well as a long enoughresidence time - rather than merely a good flow behavior - are decisive factors for highcontaminant removal. In order to overcome the black box concept, flow behavior wasalso investigated within the porous media, exemplarily for the gravel CWs. The analysisof local tracer breakthrough curves allowed the assessment of local variability of flowrate, which could be used for estimation of contaminant loads in the filter and thelocalization of preferential flow paths and stagnant zones. Summarizing the results,flow in the gravel filter was depth-dependent, with the planting and the position ofthe effluent tube being key factors. The planting resulted in elevated flow rate andcontaminant flux directly underneath the densely rooted porous media zone in the
56 5 Summary, conclusion, and future perspectives
planted CW, likely induced by transpiration-induced transportation of water from lowerinto densely rooted shallower horizons. The position of the outlet tube caused fastbottom flow in the unplanted reference. A stagnant zone was only apparent in theunplanted filter, possibly an effect of the fast bottom flow. Overall, investigating CWhydraulics provides implications for improved wetland design and operation, such as(i) CWs should not be designed considerably deeper than the rooting depth, unlessanaerobic conditions are desired, (ii) outlet tubes should be installed at shallowerdepth to prevent fast bottom flow, and (iii) hydroponic plant root mat systems shouldbe operated in a resting mode to realize optimal water-root/biota contact and avoidshort-circuit flow.
In order to conclude, the gravel CW and the hydroponic plant root mat achieved goodtreatment efficiencies for the contaminated groundwater at the Leuna site containing thethree main contaminants benzene, MTBE and ammonium, whereas best results wereobtained for benzene. However, good treatment performance was seasonally restrictedand even during summer time when highest treatment efficiencies were achieved, outflowcontaminant concentrations did not comply with the guideline values for drinking water(benzene: 10 µg L−1, MTBE: 20-40 µg L−1) or ground/surface waters (ammonium: 0.5mg L−1). Seasonal variations of contaminant concentration decline and load removaloutlined in chapter 2 and 3, respectively, underline the importance of assessing annualmeans to evaluate treatment performance in addition to maximum and minimumremoval during summer/winter time. Overall, the resting hydroponic plant root matproved to be a promising alternative to conventional soil-based CWs, despite the matexhibited less-ideal flow behavior. According to investigations on investment costs forHSSF CWs the porous media constitutes a high percentage (27-53%) of total costs(Vymazal, 2008). Thus, considerable savings are achievable if plant root mat systemscan be applied for the treatment of contaminated waters. However, mass balancingdemonstrated the limits of the plant root mat with respect to emission problems, giventhat considerably elevated emission rates were obtained for MTBE in the hydroponicplant root mat compared to the gravel CW.
Overall, the limiting factor for a successful application of both CW types is the season-ality of the treatment performance. In order to accomplish discharge values throughoutthe year, the installation of additional treatment subsequent to the CWs for optional useis necessary from a regulatory perspective. In the case of aerobic degradable compoundslike benzene and MTBE such a unit could be e.g. an aerobic pond system. Alternatively,
5.2 Outlook and perspective for future research 57
for VOCs in general the adsorption on activated carbon filters or the use of strippingfacilities may represent viable options for post-treatment. At sites where enough area forcomplete remediation is available and affordable, the contaminated water is accessiblewithout extensive pumping, e.g. in case of shallow groundwater discharging into floodplains, or surface waters, and the realization of clean-up is not restricted in termsof time, CWs in combination with low cost post-treatment as back-up systems maybe an effective treatment alternative to traditional P&T techniques for remediatingcontaminated waters.
5.2 Outlook and perspective for future researchThe experimental results and the concluding remarks presented in the preceding pagesunderline the potential of CW systems for treating water containing a complex mixtureof pollutants. However, some aspects could not be addressed in the present thesis, butshould be considered and studied in future work. From a scientific point of view thismay be for example:
(i) the assessment of long-term removal efficiency of the hydroponic plant root matincluding the adaptation potential to elevated water level,
(ii) the measurement of N2O and N2 in addition to ammonium, nitrite and nitrate inorder to identify and quantify processes involved in N transformation and find outto whether extent low nitrate/nitrite levels are indicative for limited nitrificationor effective denitrification and/or plant uptake,
(iii) the determination of VOC metabolites both in the wetland filter and the helophytesin order to confirm microbial contaminant degradation,
(iv) the tracking of isotopically (13C, 15N) labeled contaminants to examine microbialtransformation and incorporation, plant uptake and accumulation, phytodegrada-tion and water-plant-air transfer, and
(v) the experimental differentiation of phytovolatilzation and surface volatilization.Relevant for public sanitation systems and application-oriented implementationswould furthermore be the evaluation of optimization strategies to promote con-taminant removal. In this context investigations should focus on e.g. outflowrecirculation, tidal flow mode or the coupling of different CW systems. Testing ofdifferent plant species regarding their phytotransformation potential might alsobe reasonable.

6 BibliographyAchten, C., Cheng, S., Straub, K. L., Hofmann, T., 2011. The lack of microbial
degradation of polycyclic aromatic hydrocarbons from coal-rich soils. EnvironmentalPollution 159 (2), 623–629.
Ahlgren, S., Baky, A., Bernesson, S., Nordberg, ., Norén, O., Hansson, P.-A., 2008.Ammonium nitrate fertiliser production based on biomass - environmental effectsfrom a life cycle perspective. Bioresource Technology 99 (17), 8034–8041.
Akratos, C., Tsihrintzis, V., 2007. Effect of temperature, hrt, vegetation and porousmedia on removal efficiency of pilot-scale horizontal subsurface flow constructedwetlands. Ecological Engineering 29 (2), 173–191.
Armstrong, J., Armstrong, W., 1990. Light-enhanced convective throughflow increasesoxygenation in rhizomes and rhizosphere of Phragmites australis (cav.) trin. ex steud.New Phytologist 114 (1), 121–128.
Armstrong, W., Armstrong, J., Beckett, P., 1990. Measurement and modelling of oxygenrelease from roots of Phragmites Australis. Pergamon Press, Wiltshire, UK, pp. 41–51.
Arnold, C., Parfitt, D., Kaltreider, M., 2007. Phytovolatilization of oxygenated gasoline-impacted groundwater at an underground storage tank site via conifers. InternationalJournal of Phytoremediation 9 (1), 53–69.
Atlas, R., 1981. Microbial degradation of petroleum hydrocarbons: an environmentalperspective. Microbiological Reviews 45 (1), 180–209, using Smart Source ParsingMar.
ATSDR, 2007. Toxicological profile for benzene. by s. wilbur, s. keith, and o. faroonfrom atsdr (division of toxicology and environmental medicine, atlanta, ga, usa), andd. wohlers, j. stickney, s. paikoff, g. diamond, and a. quinones-rivera from syracuseresearch corporation (north syracuse, ny, usa). Tech. rep., Agency for Toxic Substancesand Disease Registry (ATSDR). U.S. Department of Health and Human Services.Public Health Service.
ATSDR, 2011. Detailed data table for the 2011 priority list of hazardous substances.Tech. rep., Agency for Toxic Substances and Disease Registry (ATSDR).
Bass, D., Hastings, N., Brown, R., 2000. Performance of air sparging systems: a reviewof case studies. Journal of Hazardous Materials 72 (2-3), 101–119.
59
60 6 Bibliography
Bedessem, M., Ferro, A., Hiegel, T., 2007. Pilot-scale constructed wetlands for petroleum-contaminated groundwater. Water Environment Research 79 (6), 581–586, usingSmart Source Parsing Jun.
Boonsaner, M., Borrirukwisitsak, S., Boonsaner, A., 2011. Phytoremediation of btexcontaminated soil by canna×generalis. Ecotoxicology and Environmental Safety74 (6), 1700–1707.
Botton, S., Parsons, J., 2006. Degradation of btex compounds under iron-reducing condi-tions in contaminated aquifer microcosms. Environmental Toxicology and Chemistry25 (10), 2630–2638, using Smart Source Parsing Oct.
Bracke, R., Klümpen, C., 2005. Materialien zur altlastensanierung und zum bodenschutz.band 20. leistungsbuch altlasten und flächenentwicklung 2004/2005.
Bradley, P., Chapelle, F., Landmeyer, J., 2001. Methyl t-butyl ether mineralizationin surface-water sediment microcosms under denitrifying conditions. Applied andEnvironmental Microbiology 67 (4), 1975–1978.
Braeckevelt, M., Reiche, N., Trapp, S., Wiessner, A., Paschke, H., Kuschk, P., Kaestner,M., 2011a. Chlorobenzene removal efficiencies and removal processes in a pilot-scaleconstructed wetland treating contaminated groundwater. Ecological Engineering37 (6), 903–913.
Braeckevelt, M., Seeger, E. M., Paschke, H., Kuschk, P., Kaestner, M., 2011b. Adapta-tion of a constructed wetland to simultaneous treatment of monochlorobenzene andperchloroethene. International Journal of Phytoremediation 13 (10), 998–1013.
Briggs, G. G., Bromilow, R. H., Evans, A. A., 1982. Relationships between lipophilicityand root uptake and translocation of non-ionised chemicals by barley. PesticideScience 13 (5), 495–504.
Brix, H., 1990. Gas exchange through the soil-atmosphere interphase and through deadculms of phragmites australis in a constructed reed bed receiving domestic sewage.Water Research 24 (2), 259–266.
Bulc, T. G., 2006. Long term performance of a constructed wetland for landfill leachatetreatment. Ecological Engineering 26 (4), 365–374.
Burken, J., Schnoor, J., 1998. Predictive relationships for uptake of organic contaminantsby hybrid poplar trees. Environmental Science & Technology 32 (21), 3379–3385.
Burland, S., Edwards, E., 1999. Anaerobic benzene biodegradation linked to nitratereduction. Applied and Environmental Microbiology 65 (2), 529–533.
CARACAS, 1998. Risk assessment for contaminated sites in europe. vol. 1 scientificbasis.
6 Bibliography 61
Carrera, J., Baeza, J. A., Vicent, T., Lafuente, J., 2003. Biological nitrogen removalof high-strength ammonium industrial wastewater with two-sludge system. WaterResearch 37 (17), 4211–4221.
Chakraborty, R., Coates, J., 2004. Anaerobic degradation of monoaromatic hydrocar-bons. Applied Microbiology and Biotechnology 64 (4), 437–446.
Chakraborty, R., O’Connor, S., Chan, E., Coates, J., 2005. Anaerobic degradation ofbenzene, toluene, ethylbenzene, and xylene compounds by dechloromonas strain rcb.Applied and Environmental Microbiology 71 (12), 8649–8655.
Chan, Y., Chong, M., Law, C., Hassell, D., 2009. A review on anaerobic–aerobictreatment of industrial and municipal wastewater. Chemical Engineering Journal155 (1-2), 1–18.
Chang, W.-S., Tran, H.-T., Park, D.-H., Zhang, R.-H., Ahn, D.-H., 2009. Ammoniumnitrogen removal characteristics of zeolite media in a biological aerated filter (baf) forthe treatment of textile wastewater. Journal of Industrial and Engineering Chemistry15 (4), 524–528.
Cirpka, O. A., Kitanidis, P. K., 2000. Characterization of mixing and dilution in het-erogeneous aquifers by means of local temporal moments. Water Resources Research36 (5), 1221–1236.
Coates, J., Chakraborty, R., Lack, J., O’Connor, S., Cole, K., Bender, K., Achenbach,L., 2001. Anaerobic benzene oxidation coupled to nitrate reduction in pure cultureby two strains of dechloromonas. Nature 411 (6841), 1039–1043, 10.1038/35082545.
Coates, J., Chakraborty, R., McInerney, M., 2002. Anaerobic benzene biodegradation –a new era. Research in Microbiology 153 (10), 621–628.
Collins, C., Laturnus, F., Nepovim, A., 2002. Remediation of btex and trichloroethene.Environmental Science and Pollution Research 9 (1), 86–94.
CRS, 2006. Mtbe in gasoline: Clean air and drinking water issues. by j.e. mccarthyand m. tiemann. specialist in environmental policy. resources, science, and industrydivision. Tech. rep., Congressional Research Service (CRS).
Cunningham, J., Rahme, H., Hopkins, G., Lebron, C., Reinhard, M., 2001. Enhancedin situ bioremediation of btex-contaminated groundwater by combined injection ofnitrate and sulfate. Environmental Science & Technology 35 (8), 1663–1670.
Cupples, A., 2011. The use of nucleic acid based stable isotope probing to identifythe microorganisms responsible for anaerobic benzene and toluene biodegradation.Journal of Microbiological Methods 85 (2), 83–91.
Deeb, R., Chu, K.-H., Shih, T., Linder, S., Suffet, I., Kavanaugh, M., Alvarez-Cohen,L., 2003. Mtbe and other oxygenates: Environmental sources, analysis, occurrence,and treatment. Environmental Engineering Science 20 (5), 433–447, (Mel).
62 6 Bibliography
Deeb, R. A., Scow, K. M., Alvarez-Cohen, L., 2000. Aerobic mtbe biodegradation:an examination of past studies, current challenges and future research directions.Biodegradation 11 (2-3), 171–186, using Smart Source Parsing.
Dettenmaier, E., Doucette, W., Bugbee, B., 2009. Chemical hydrophobicity and uptakeby plant roots. Environmental Science & Technology 43 (2), 324–329.
Dong, C., Zhu, W., Zhao, Y. Q., Gao, M., 2011. Diurnal fluctuations in root oxygenrelease rate and dissolved oxygen budget in wetland mesocosm. Desalination 272 (1-3),254–258.
Du Laing, G., Van de Moortel, A. M. K., Moors, W., De Grauwe, P., Meers, E.,Tack, F. M. G., Verloo, M. G., 2009. Factors affecting metal concentrations in reedplants (phragmites australis) of intertidal marshes in the scheldt estuary. EcologicalEngineering 35 (2), 310–318.
DVGW, 2001. Verordnung zur novellierung der trinkwasserverordnung vom 21. mai2001. Tech. rep., Deutsche Vereinigung des Gas- und Wasserfaches e.V. (DVGW).
EC, 1998a. Council directive 98/83/ec of 3 november 1998 on the quality of waterintended for human consumption. official journal of the european communities.
EC, 1998b. Directive 98/70/ec of the european parliament and of the council of 13october 1998 on relating to the quality of petrol and diesel fuels and amending councildirective 93/12/eec. official journal of the european communities.
EC, 1999. Council directive 1999/13/ec of 11 march 1999 on the limitation of emissionsof volatile organic compounds due to the use of organic solvents in certain activitiesand installations. official journal of the european communities.
EEA, 2000. Managemant of contaminated sites in western europe. by prokop g.,schamann, m., edelgaard, i. Tech. rep., European Environment Agency (EEA).
Effenberger, M., Weiß, H., Popp, P., Schirmer, M., 2001. Untersuchungen zum ben-zininhaltstoff methyl-tertiär-butylether (mtbe) in grund- und oberflächenwasser indeutschland. Grundwasser - Zeitschrift der Fachsektion Hydrogeologie 2.
Eke, P., Scholz, M., 2008. Benzene removal with vertical-flow constructed treatmentwetlands. Journal of Chemical Technology and Biotechnology 83 (1), 55–63.
EPA, U., 1997. Drinking water advisory: Consumer acceptability advice and healtheffects analysis on methyl tertiary-butyl ether (mtbe). Tech. rep., U.S. EnvironemntalProtection Agency (US EPA).
EPA, U., 1998a. Mtbe fact sheet 2: Remediation of mtbe contaminated soil andgroundwater. Tech. rep., U.S. Environemntal Protection Agency (US EPA).
6 Bibliography 63
EPA, U., 1998b. Oxygenates in water: Critical information and research needs. by j.m.davis, j. brophy, r. hitzig, f. kremer, m. osinski, j.d. prah, s. schemlling, t.f. speth, r.swank, a.n. tafuri, and c. west. Tech. rep., U.S. Environmental Protection Agency(US EPA).
EPA, U., 1998c. Phytoremediation of tce in groundwater using populus. by j. chappell.Tech. rep., U.S. Environmental Protection Agency (US EPA).
EPA, U., 2004. Quantification of exposure: Dispersion, transport, and fate of air toxicsin the atmosphere in chaptor 8 of air toxics risk assessment reference library. bymitchell, k.l., smith, r.l., and murphy, d. Tech. rep.
EPA, U., 2007. Control of hazardous air pollutants from mobile sources - regulatoryimpact analysis. Tech. rep., U.S. Environmental Protection Agency (US EPA).
EPA, U., 2008. Epa’s report on the environment. Tech. rep., U.S. EnvironmentalProtection Agency (US EPA).
EPA, U., 2010. Gasoline composition regulations affecting lust sites. by j.w. weaver, l.r.exum, and l.m. prieto. Tech. rep., U.S. Environmental Protection Agency (US EPA).
EPA, U., May 2012 2012. National priorities list (npl) sites.
EU, 2002. European union risk assessment report: tert-butyl methyl ether. Tech. rep.,European Chemicals Bureau. Institute for Health and Consumer Protection.
EU, 2008a. Directive 2008/50/ec of the european parliament and of the council of 21may 2008 on ambient air quality and cleaner air for europe. official journal of theeuropean union.
EU, 2008b. European union risk assessment report - benzene. Tech. rep., Federal Institutefor Occupational Safety and Health, Notification Unit. german: Bundeansanstalt fürArbeitsschutz und Arbeitsmedizin, Anmeldestelle Chemikaliengesetz (BAuA).
Farhadian, M., Duchez, D., Vachelard, C., Larroche, C., 2008a. Monoaromatics removalfrom polluted water through bioreactors - a review. Water Research 42 (6-7), 1325–1341.
Farhadian, M., Vachelard, C., Duchez, D., Larroche, C., 2008b. In situ bioremediation ofmonoaromatic pollutants in groundwater: A review. Bioresource Technology 99 (13),5296–5308.
Faulwetter, J., Gagnon, V., Sundberg, C., Chazarenc, F., Burr, M., Brisson, J., Camper,A., Stein, O., 2009. Microbial processes influencing performance of treatment wetlands:A review. Ecological Engineering 35 (6), 987–1004.
Fayolle, F., François, A., Garnier, L., Godefroy, D., Mathis, H., Piveteau, P., Monot,F., 2003. Limitations in mtbe biodegradation. Oil & Gas Science and Technology -Rev. IFP 58 (4), 497–504.
64 6 Bibliography
Fayolle, F., Vandecasteele, J. P., Monot, F., 2001. Microbial degradation and fate inthe environment of methyl tert-butyl ether and related fuel oxygenates. AppliedMicrobiology and Biotechnology 56 (3-4), 339–349, using Smart Source Parsing Aug.
Ferro, A., Kadlec, R., Deschamp, J., 2002. Constructed wetland system to treatwastewater at the bp amoco former casper refinery: Pilot scale project.
Fischer, A., Theuerkorn, K., Stelzer, N., Gehre, M., Thullner, M., Richnow, H., 2007.Applicability of stable isotope fractionation analysis for the characterization of benzenebiodegradation in a btex-contaminated aquifer. Environmental Science & Technology41 (10), 3689–3696.
Fountoulakis, M. S., Terzakis, S., Kalogerakis, N., Manios, T., 2009. Removal ofpolycyclic aromatic hydrocarbons and linear alkylbenzene sulfonates from domesticwastewater in pilot constructed wetlands and a gravel filter. Ecological Engineering35 (12), 1702–1709.
Frauenstein, 2009. Current state and future prospects of remedial soil protection. Tech.rep., Federal Environment Agency (Umweltbundesamt).
Frink, C., Waggoner, P., Ausubel, J., 1999. Nitrogen fertilizer: retrospect and prospect.Proceedings of the National Academy of Sciences USA 96 (4), 1175–1180, using SmartSource Parsing Feb 16.
Fux, C., Boehler, M., Huber, P., Brunner, I., Siegrist, H., 2002. Biological treatmentof ammonium-rich wastewater by partial nitritation and subsequent anaerobic am-monium oxidation (anammox) in a pilot plant. Journal of Biotechnology 99 (3),295–306.
Garnier, P., Auria, R., Augur, C., Revah, S., 1999. Cometabolic biodegradation of methylt-butyl ether by Pseudomonas aeruginosa grown on pentane. Applied Microbiologyand Biotechnology 51 (4), 498–503.
Gomez-Hermosillo, C., Pardue, J. H., Reible, D. D., 2006. Wetland plant uptake ofdesorption-resistant organic compounds from sediments. Environmental Science &Technology 40 (10), 3229–3236.
Gusmão, V., Martins, T., Chinalia, F., Sakamoto, I., Thiemann, O., Varesche, M., 2006.Btex and ethanol removal in horizontal-flow anaerobic immobilized biomass reactor,under denitrifying condition. Process Biochemistry 41 (6), 1391–1400.
Haberl, R., Grego, S., Langergraber, G., Kadlec, R., Cicalini, A.-R., Dias, S., Novais,J., Aubert, S., Gerth, A., Thomas, H., Hebner, A., 2003. Constructed wetlands forthe treatment of organic pollutants. Journal of Soils and Sediments 3 (2), 109–124.
Haritash, A. K., Kaushik, C. P., 2009. Biodegradation aspects of polycyclic aromatichydrocarbons (pahs): A review. Journal of Hazardous Materials 169 (1-3), 1–15.
6 Bibliography 65
Harpke, B., Müller, H., Endriszewitz, M., Winter-Pelliccioni, M., Hasselwander, E.,2006. Mtbe-sanierung am standort leuna. TerraTech 5, 13–16.
Hendrickx, B., Junca, H., Vosahlova, J., Lindner, A., Ruegg, I., Bucheli-Witschel, M.,Faber, F., Egli, T., Mau, M., Schlomann, M., Brennerova, M., Brenner, V., Pieper,D., Top, E., Dejonghe, W., Bastiaens, L., Springael, D., 2006. Alternative primersets for pcr detection of genotypes involved in bacterial aerobic btex degradation:distribution of the genes in btex degrading isolates and in subsurface soils of a btexcontaminated industrial site. Journal of Microbiological Methods 64 (2), 250–265,using Smart Source Parsing Feb; Epub 2005 Jun 8.
Herrmann, S., Kleinsteuber, S., Chatzinotas, A., Kuppardt, S., Lueders, T., Richnow,H., Vogt, C., 2010. Functional characterization of an anaerobic benzene-degradingenrichment culture by dna stable isotope probing. Environmental Microbiology 12 (2),401–411, using Smart Source Parsing Feb; Epub 2009 Oct 16.
Holland, J. F., Martin, J. F., Granata, T., Bouchard, V., Quigley, M., Brown, L., 2004.Effects of wetland depth and flow rate on residence time distribution characteristics.Ecological Engineering 23 (3), 189–203.
Hong, M., Farmayan, W., Dortch, I., Chiang, C., McMillan, S., Schnoor, J., 2001.Phytoremediation of mtbe from a groundwater plume. Environmental Science &Technology 35 (6), 1231–1239.
Howard, P., 1990. Handbook of Environmetal Fate and Exposure Data for OrganicChemicals, Volume 2, second edition Edition. CRS Press, Taylor&Francis Group,Chelseas, MI, USA.
Hunkeler, D., Andersen, N., Aravena, R., Bernasconi, S., Butler, B., 2001. Hydrogen andcarbon isotope fractionation during aerobic biodegradation of benzene. EnvironmentalScience & Technology 35 (17), 3462–3467.
IARC, 1999a. Iarc monographs on the evaluation of carcinogenic risks to humans.volume 29: Some industrial chemicals and dyestuffs - summary of data reported andevaluation. Tech. rep., World Health Organization (WHO) International Agency forResearch on Cancer (IARC).
IARC, 1999b. Iarc monographs on the evaluation of carcinogenic risks to humans.volume 73: Some chemicals that cause tumours of the kidney or urinary bladder inrodents and some other substances. Tech. rep., World Health Organization (WHO)International Agency for Research on Cancer (IARC).
IFA, 2000. Mineral fertilizer use and the environment.by k.f. isherwood. Tech. rep.,International Fertilizer Industry Association (IFA). Paris. France. United NationsEnvironment Programme (UNEP). Division of Technology, Industry and Economics.Paris. France.
66 6 Bibliography
Imfeld, G., Braeckevelt, M., Kuschk, P., Richnow, H., 2009. Monitoring and assessingprocesses of organic chemicals removal in constructed wetlands. Chemosphere 74 (3),349–362.
Index, M., 2001.
Jahn, M., Haderlein, S., Meckenstock, R., 2005. Anaerobic degradation of benzene,toluene, ethylbenzene, and o-xylene in sediment-free iron-reducing enrichment cultures.Applied and Environmental Microbiology 71 (6), 3355–3358.
James, C., Xin, G., Doty, S., Muiznieks, I., Newman, L., Strand, S., 2009. A mass bal-ance study of the phytoremediation of perchloroethylene-contaminated groundwater.Environmental Pollution 157 (8-9), 2564–2569.
Jean, J.-S., Lee, M.-K., Wang, S.-M., Chattopadhyay, P., Maity, J., 2008. Effects ofinorganic nutrient levels on the biodegradation of benzene, toluene, and xylene (btx)by pseudomonas spp. in a laboratory porous media sand aquifer model. BioresourceTechnology 99 (16), 7807–7815.
Jensen, F., 2003. Nitrite disrupts multiple physiological functions in aquatic animals.Comparative Biochemistry and Physiology Part A: Molecular & Integrative Physiology135 (1), 9–24, using Smart Source Parsing May.
Johnson, R., Pankow, J., Bender, D., Price, C., Zogorski, J., 2000. Peer reviewed:Mtbe - to what extent will past releases contaminate community water supply wells?Environmental Science & Technology 34 (9), 210A–217A.
Kadlec, R., Tanner, C., Hally, V., Gibbs, M., 2005. Nitrogen spiraling in subsurface-flowconstructed wetlands: Implications for treatment response. Ecological Engineering25 (4), 365–381.
Kadlec, R., Wallace, S., 2008. Treatment Wetlands, second edition Edition. CRS Press,Taylor&Francis Group, Boca Raton, USA.
Karickhoff, S. W., 1981. Semi-empirical estimation of sorption of hydrophobic pollutantson natural sediments and soils. Chemosphere 10 (8), 833–846.
Kassenga, G. R., Pardue, J. H., Blair, S., Ferraro, T., 2003. Treatment of chlorinatedvolatile organic compounds in upflow wetland mesocosms. Ecological Engineering19 (5), 305–323.
Kazumi, J., Caldwell, M., Suflita, J., Lovley, D., Young, L., 1997. Anaerobic degradationof benzene in diverse anoxic environments. Environmental Science & Technology31 (3), 813–818.
Keefe, S., Barber, L., Runkel, R., Ryan, J., 2004. Fate of volatile organic compounds inconstructed wastewater treatment wetlands. Environmental Science & Technology38 (7), 2209–2216.
6 Bibliography 67
Kleinsteuber, S., Schleinitz, K., Vogt, C., 2012. Key players and team play: anaerobicmicrobial communities in hydrocarbon-contaminated aquifers. Applied Microbiologyand Biotechnology 94 (4), 851–873.
Koenigsberg, S., Sandefur, C., 1999. The use of oxygen release compound for theaccelerated bioremediation of aerobically degradable contaminants: The advent oftime-release electron acceptors. Remediation Journal 10 (1), 3–29.
Kolb, A., Püttmann, W., 2006. Methyl tert-butyl ether (mtbe) in finished drinkingwater in germany. Environmental Pollution 140 (2), 294–303.
Konnerup, D., Koottatep, T., Brix, H., 2009. Treatment of domestic wastewater intropical, subsurface flow constructed wetlands planted with canna and heliconia.Ecological Engineering 35 (2), 248–257.
Kuschk, P., Wießner, A., Kappelmeyer, U., Weißbrodt, E., Kästner, M., Stottmeister,U., 2003. Annual cycle of nitrogen removal by a pilot-scale subsurface horizontal flowin a constructed wetland under moderate climate. Water Research 37 (17), 4236–4242.
LABO, 2011. Bundesweite kennzahlen zur altlastenstatistik. Tech. rep., Bund/Länder-Arbeitsgemeinschaft Bodenschutz (LABO) Ständiger Ausschuss Altlasten (ALA).
LAF, 2009. Von industriebrachen zu attraktiven wirtschaftsstandorten. Tech. rep.,Landesanstalt für Altlastenfreistellung des Landes Sachen-Anhalt (LAF).
LAF, 2012. Landesanstalt für altlastenfreistellung (laf) sachsen-anhalt - Ögp leuna.
Lai, W.-L., Zhang, Y., Chen, Z.-H., 2012. Radial oxygen loss, photosynthesis, andnutrient removal of 35 wetland plants. Ecological Engineering 39, 24–30.
Langergraber, G., Leroch, K., Pressl, A., Sleytr, K., Rohrhofer, R., Haberl, R., 2009.High-rate nitrogen removal in a two-stage subsurface vertical flow constructed wetland.Desalination 246 (1-3), 55–68.
LAWA, 2004. Ableitung von geringfügigkeitsschwellenwerten für das grundwasser. by m.altmayer, t. bach, h.h dieter, k. häfner, w. leuchs, b. moll, g. siegert, k.t. von der trenck,e. six, k-m. wollin, r. altenburger, and t. hauck. Tech. rep., LänderarbeitsgemeinschaftWasser (LAWA).
Lee, C., Fletcher, T., Sun, G., 2009a. Nitrogen removal in constructed wetland systems.Engineering in Life Sciences 9 (1), 11–22.
Lee, S., Pardue, J. H., Moe, W. M., Kim, D. J., 2009b. Effect of sorption and desorption-resistance on biodegradation of chlorobenzene in two wetland soils. Journal of Haz-ardous Materials 161 (1), 492–498.
Lee, S., Pardue, J. H., Moe, W. M., Valsaraj, K. T., 2003. Mineralization of desorption-resistant 1,4-dichlorobenzene in wetland soils. Environmental Toxicology and Chem-istry 22 (10), 2312–22, using Smart Source Parsing Oct.
68 6 Bibliography
Liou, J., Derito, C., Madsen, E., 2008. Field-based and laboratory stable isotopeprobing surveys of the identities of both aerobic and anaerobic benzene-metabolizingmicroorganisms in freshwater sediment. Environmental Microbiology 10 (8), 1964–1977, using Smart Source Parsing Aug; Epub 2008 Apr 21.
Liu, C., Speitel, G., Georgiou, G., 2001. Kinetics of methyl t-butyl ether cometabolismat low concentrations by pure cultures of butane-degrading bacteria. Applied andEnvironmental Microbiology 67 (5), 2197–2201.
Liu, J.-G., Li, G.-H., Shao, W.-C., Xu, J.-K., Wang, D.-K., 2010. Variations in uptakeand translocation of copper, chromium and nickel among nineteen wetland plantspecies. Pedosphere 20 (1), 96–103.
Lopes Ferreira, N., Maciel, H., Mathis, H., Monot, F., Fayolle-Guichard, F., Greer, C.,2006. Isolation and characterization of a new mycobacterium austroafricanum strain,ifp 2015, growing on mtbe. Applied Microbiology and Biotechnology 70 (3), 358–365,using Smart Source Parsing Apr; Epub 2005 Jul 19.
Lovley, D., 2000. Anaerobic benzene degradation. Biodegradation 11 (2-3), 107–116,using Smart Source Parsing.
Lovley, D., Woodward, J., Chapelle, F., 1994. Stimulated anoxic biodegradation ofaromatic hydrocarbons using fe(iii) ligands. Nature 370 (6485), 128–131, using SmartSource Parsing Jul 14.
Luo, J., Cirpka, O. A., Kitanidis, P. K., 2006. Temporal-moment matching for truncatedbreakthrough curves for step or step-pulse injection. Advances in Water Resources29 (9), 1306–1313.
Ma, X., Burken, J. G., 2003. Tce diffusion to the atmosphere in phytoremediationapplications. Environmental Science & Technology 37 (11), 2534–2539.
Mackay, D., Shiu, W., Ma, K., 1992. Illustrated handbook of physical-chemical propertiesand environmental fate of organic chemicals. Vol. Vol. 1: Monoaromatic hydrocarbons,chlorobenzens and PCB. Lewis Publisher, Chelsea, MI, USA.
Mackay, D., Shiu, W., Ma, K., 1993. Illustrated handbook of physical-chemical propertiesand environmental fate of organic chemicals. Vol. Vol. 3: Volatile organic chemicals.Lewis Publisher, Chelsea, MI, USA.
Maltais-Landry, G., Maranger, R., Brisson, J., Chazarenc, F., 2009. Nitrogen transfor-mations and retention in planted and artificially aerated constructed wetlands. WaterResearch 43 (2), 535–545.
Martienssen, M., Fabritius, H., Kukla, S., Balcke, G., Hasselwander, E., Schirmer,M., 2006. Determination of naturally occurring mtbe biodegradation by analysingmetabolites and biodegradation by-products. Journal of Contaminant Hydrology87 (1-2), 37–53.
6 Bibliography 69
Marttinen, S., Kettunen, R., Sormunen, K., Soimasuo, R., Rintala, J., 2002. Screeningof physical-chemical methods for removal of organic material, nitrogen and toxicityfrom low strength landfill leachates. Chemosphere 46 (6), 851–858.
Masumoto, H., Kurisu, F., Kasuga, I., Tourlousse, D., Furumai, H., 2012. Completemineralization of benzene by a methanogenic enrichment culture and effect of putativemetabolites on the degradation. Chemosphere 86 (8), 822–828.
Matamoros, V., Bayona, J. M., 2006. Elimination of pharmaceuticals and personalcare products in subsurface flow constructed wetlands. Environmental Science &Technology 40 (18), 5811–5816.
Meckenstock, R., Mouttaki, H., 2011. Anaerobic degradation of non-substituted aromatichydrocarbons. Current Opinion in Biotechnology 22 (3), 406–414.
Moore, B., Headley, J., Dupont, R., Doucette, W., Armstrong, J., 2002. Abatement ofgas-condensate hydrocarbons in a natural wetland. Journal of Environmental Scienceand Health, Part A Toxic/Hazardous Substances and Environmental Engineering37 (4), 425–438, using Smart Source Parsing.
Mormile, M., Liu, S., Suflita, J., 1994. Anaerobic biodegradation of gasoline oxygenates:Extrapolation of information to multiple sites and redox conditions. EnvironmentalScience & Technology 28 (9), 1727–1732.
Mothes, F., Reiche, N., Fiedler, P., Moeder, M., Borsdorf, H., 2010. Capability ofheadspace based sample preparation methods for the determination of methyl tert-butyl ether and benzene in reed (phragmites australis) from constructed wetlands.Chemosphere 80 (4), 396–403.
Nam, K., Chung, N., Alexander, M., 1998. Relationship between organic matter contentof soil and the sequestration of phenanthrene. Environmental Science & Technology32 (23), 3785–3788.
Narayanan, M., Davis, L., Erickson, L., 1995a. Fate of volatile chlorinated organiccompounds in a laboratory chamber with alfalfa plants. Environmental Science &Technology 29 (9), 2437–2444.
Narayanan, M., Davis, L., Tracy, J., Erickson, L., Green, R., 1995b. Experimental andmodeling studies of the fate of organic contaminants in the presence of alfalfa plants.Journal of Hazardous Materials 41 (2-3), 229–249.
Niemes, H., Schirmer, M., 2010. Entropy, Water and Resources: An Essay in naturalsciences-consistent economics. Springer-Verlag, Berlin Heidelberg.
OECD, 2004. Ammonium sulfate. Tech. rep., Organisation for Economic Co-operationand Development (OECD).
70 6 Bibliography
Pardue, J. H., 2005. Development of treatment wetland technology for voc-contaminatedgroundwater. Tech. rep., Department of Civil & Environmental Engineering LouisianaState University.
Pardue, J. H., Masscheleyn, P. H., DeLaune, R. D., Patrick, W. H., Adrian, D. D., 1993.Assimilation of hydrophobic chlorinated organics in freshwater wetlands: sorptionand sediment-water exchange. Environmental Science & Technology 27 (5), 875–882.
Paredes, D., Kuschk, P., Mbwette, T., Stange, F., Müller, R., Köser, H., 2007. Newaspects of microbial nitrogen transformations in the context of wastewater treatment- a review. Engineering in Life Sciences 7 (1), 13–25.
Phelps, C., Kazumi, J., Young, L., 1996. Anaerobic degradation of benzene in btxmixtures dependent on sulfate reduction. FEMS Microbiology Letters 145 (3), 433–437.
Pilon-Smits, E., 2005. Phytoremediation. Annual Review of Plant Biology 56, 15–39.
Pivetz, B., 2001. Ground water issue: Phytoremediation of contaminated soil andground water at hazardous waste sites. pdf EPA/540/S-01/500, “February 2001.”Includes bibliographical references (p. 17-22).
Porteous Moore, F., Barac, T., Borremans, B., Oeyen, L., Vangronsveld, J., van derLelie, D., Campbell, C., Moore, E., 2006. Endophytic bacterial diversity in poplartrees growing on a btex-contaminated site: The characterisation of isolates withpotential to enhance phytoremediation. Systematic and Applied Microbiology 29 (7),539–556.
Rakoczy, J., Remy, B., Vogt, C., Richnow, H., 2011. A bench-scale constructed wetlandas a model to characterize benzene biodegradation processes in freshwater wetlands.Environmental Science & Technology 45 (23), 10036–10044.
Reddy, K., Kosgi, S., Zhou, J., 1995. A review of in-situ air sparging for the remedi-ation of voc-contaminated saturated soils and groundwater. Hazardous Waste andHazardous Materials 12 (2), 97–118.
Reiche, N., 2010. Volatilisierung von flüchtigen organischen verbindungen bei derphytoremediation industriell belasteter grundwässer. Ph.D. thesis.
Reinhardt, M., Müller, B., Gächter, R., Wehrli, B., 2006. Nitrogen removal in a smallconstructed wetland: An isotope mass balance approach. Environmental Science &Technology 40 (10), 3313–3319.
Renou, S., Givaudan, J., Poulain, S., Dirassouyan, F., Moulin, P., 2008. Landfill leachatetreatment: Review and opportunity. Journal of Hazardous Materials 150 (3), 468–493.
RPA, 2000. Socio-economic impacts of the identification of priority hazardous substancesunder the water framework directive. by c. corden. Tech. rep., Risk & Policy Analysts(RPA).
6 Bibliography 71
Ruegner, H., Henzler, R., Bittens, M., Weiß, H., Leven, C., Finkel, M., 2007. Sagira ii -revitalisierungskonzepte für großskalige boden- und grundwasserverunreinigungen.Altlasten Spektrum 1, 1–6.
Salanitro, J., Johnson, P., Spinnler, G., Maner, P., Wisniewski, H., Bruce, C., 2000.Field-scale demonstration of enhanced mtbe bioremediation through aquifer bioaug-mentation and oxygenation. Environmental Science & Technology 34 (19), 4152–4162.
Schirmer, M., 1999. Das verhalten des benzininhaltsstoffes methyltertiärbutylether(mtbe) in grundwasser. Grundwasser 4 (3), 95–102.
Schirmer, M., Butler, B., Church, C., Barker, J., Nadarajah, N., 2003. Laboratoryevidence of mtbe biodegradation in borden aquifer material. Journal of ContaminantHydrology 60 (3-4), 229–249.
Schirmer, M., Lyon, K., Armstrong, J. E., Farrell, K. N., 2012. A socio-ecologicaladaptive approach to contaminated mega-site management: From ’control and correct’to ’coping with change’. Journal of Contaminant Hydrology 127 (1-4), 101–109.
Schmidt, T., Schirmer, M., Weiß, H., Haderlein, S., 2004. Microbial degradation ofmethyl tert-butyl ether and tert-butyl alcohol in the subsurface. Journal of Contami-nant Hydrology 70 (3-4), 173–203.
Schwarzenbach, R., Gschwend, P., Imboden, D., 2003. Environmental Organic Chemistry.Wiley-Interscience.
Shone, M., Wood, A., 1972. Factors affecting absorption and translocation of simazineby barley. Journal of Experimental Botany 23 (1), 141–151.
Soares, A., Albergaria, J., Domingues, V., Alvim-Ferraz, M., Delerue-Matos, C., 2010.Remediation of soils combining soil vapor extraction and bioremediation: Benzene.Chemosphere 80 (8), 823–828.
Somsamak, P., Richnow, H., Häggblom, M., 2006. Carbon isotope fractionation dur-ing anaerobic degradation of methyl tert-butyl ether under sulfate-reducing andmethanogenic conditions. Applied and Environmental Microbiology 72 (2), 1157–1163.
Squillace, P., Moran, M., Lapham, W., Price, C., Clawges, R., Zogorski, J., 1999.Volatile organic compounds in untreated ambient groundwater of the united states,1985-1995. Environmental Science & Technology 33 (23), 4176–4187.
Squillace, P. J., Scott, J. C., Moran, M. J., Nolan, B. T., Kolpin, D. W., 2002. Vocs,pesticides, nitrate, and their mixtures in groundwater used for drinking water in theunited states. Environmental Science & Technology 36 (9), 1923–1930.
Staudinger, J., Roberts, P. V., 2001. A critical compilation of henry’s law constanttemperature dependence relations for organic compounds in dilute aqueous solutions.Chemosphere 44 (4), 561–576.
72 6 Bibliography
Steffan, R., McClay, K., Vainberg, S., Condee, C., Zhang, D., 1997. Biodegradation ofthe gasoline oxygenates methyl tert-butyl ether, ethyl tert-butyl ether, and tert-amylmethyl ether by propane-oxidizing bacteria. Applied and Environmental Microbiology63 (11), 4216–22.
Stottmeister, U., Wießner, A., Kuschk, P., Kappelmeyer, U., Kästner, M., Bederski,O., Müller, R. A., Moormann, H., 2003. Effects of plants and microorganisms inconstructed wetlands for wastewater treatment. Biotechnology Advances 22 (1-2),93–117.
Sundberg, C., Tonderski, K., Lindgren, P. E., 2007. Potential nitrification and denitrifi-cation and the corresponding composition of the bacterial communities in a compactconstructed wetland treating landfill leachates. Water Science and Technology 56 (3),159–166, using Smart Source Parsing.
Tang, X., Eke, P., Scholz, M., Huang, S., 2009. Processes impacting on benzene removalin vertical-flow constructed wetlands. Bioresource Technology 100 (1), 227–234.
Tani, F., Barrington, S., 2005. Zinc and copper uptake by plants under two transpirationrates. part i. wheat (triticum aestivum l.). Environmental Pollution 138 (3), 538–547.
Tanner, C., Headley, T., 2011. Components of floating emergent macrophyte treatmentwetlands influencing removal of stormwater pollutants. Ecological Engineering 37 (3),474–486.
Tanner, C., Kadlec, R., Gibbs, M., Sukias, J., Nguyen, M., 2002. Nitrogen processing gra-dients in subsurface-flow treatment wetlands – influence of wastewater characteristics.Ecological Engineering 18 (4), 499–520.
Tanner, C., Sukias, J., Headley, T., Yates, C., Stott, R., 2012. Constructed wetlandsand denitrifying bioreactors for on-site and decentralised wastewater treatment:Comparison of five alternative configurations. Ecological Engineering 42 (0), 112–123.
Thornton, S., Bottrell, S., Spence, K., Pickup, R., Spence, M., Shah, N., Mallinson,H., Richnow, H., 2011. Assessment of mtbe biodegradation in contaminated ground-water using 13c and 14c analysis: Field and laboratory microcosm studies. AppliedGeochemistry 26 (5), 828–837.
Trapp, S., Karlson, U., 2001. Aspects of phytoremediation of organic pollutants. Journalof Soils and Sediments 1 (1), 37–43.
Trapp, S., Yu, X., Mosbaek, H., 2003. Persistence of methyl tertiary butyl ether (mtbe)against metabolism by danish vegetation. Environmental Science and PollutionResearch International 10 (6), 357–360, using Smart Source Parsing.
Travis, C., Doty, C., 1990. Es&t views: Can contaminated aquifers at superfund sitesbe remediated? Environmental Science & Technology 24 (10), 1464–1466.
6 Bibliography 73
Tunçsiper, B., 2009. Nitrogen removal in a combined vertical and horizontal subsurface-flow constructed wetland system. Desalination 247 (1–3), 466 – 475.
Tyroller, L., Rousseau, D., Santa, S., García, J., 2010. Application of the gas tracermethod for measuring oxygen transfer rates in subsurface flow constructed wetlands.Water Research 44 (14), 4217–4225.
UBA, 2002. Implementation guide for the german solvent ordinance (31. bimschv). byu. hackmack and b. mahrwald. Tech. rep., Federal Environmental Agency, german:Umweltbundesamt.
UBA, 2003. Inventarisierung von grundwasserschäden und deren beurteilung in großpro-jekten “Ökologische altlasten” der neuen bundesländer. by j. großmann, j. drangmeis-ter, f. nitschke, and a. willand.
UBA, 2006. Emissionsminderung für prioritäre und prioritäre gefährliche stoffe derwasserrahmenrichtlinie - stoffdatenblätter. by t. hillenbrand, f. marscheider-weidmann,and m. strauch from frauenhofer-institut für systems- und innovationsforschung(karlsruhe, germany), k. heitmann from institut für Ökologie and politik (ham-burg, germany), and d. schaffrin from institut für internationale und europäischeumweltpolitik (berlin, germany). Tech. rep., Federal Environment Agency, german:Umweltbundesamt (UBA).
UNEP, 1998. Mineral fertilizer production and the environment: Part 1. the fertilizerindustry’s manufacturing processes and environmental issues. Tech. rep., UnitedNations Environment Programme (UNEP), Industry and Environment, Paris, France.United Nations Industrial Development Organization (UNIDO), Vienna InternationalCentre, Vienna, Austria. International Fertilizer Industry Association (IFA), Paris,France.
USGS, 2006. The quality of our nation’s waters - volatile organic compounds in thenation’s ground water and drinking-water supply wells. by j.s. zogorski, j.m. carter, t.ivahnenko, w.w. lapham, m.j. moran, b.l. rowe, p.j. squillace, and p.l. toccalino. Tech.Rep. ISBN 1-411-30836-0, U.S. Geological Survey.
van Agteren, M., Keuning, S., Janssen, D., 1998. Handbook on biodegradation andbiological treatment of hazardous organic compounds. Kluwer Academic Publisher,Dordrecht, The Netherlands.
van Epps, A., 2006. Phytoremediation of petroleum hydrocarbons. Tech. rep., Envi-ronmental Careers Organization for U.S. Environmental Protection Agency, Officeof Solid Waste and Emergency Response, Office of Superfund Remediation andTechnology Innovation.
VCI, 2011. Chemiewirtschaft in zahlen 2011. Tech. rep., Verband der chemischenIndustrie e.V.
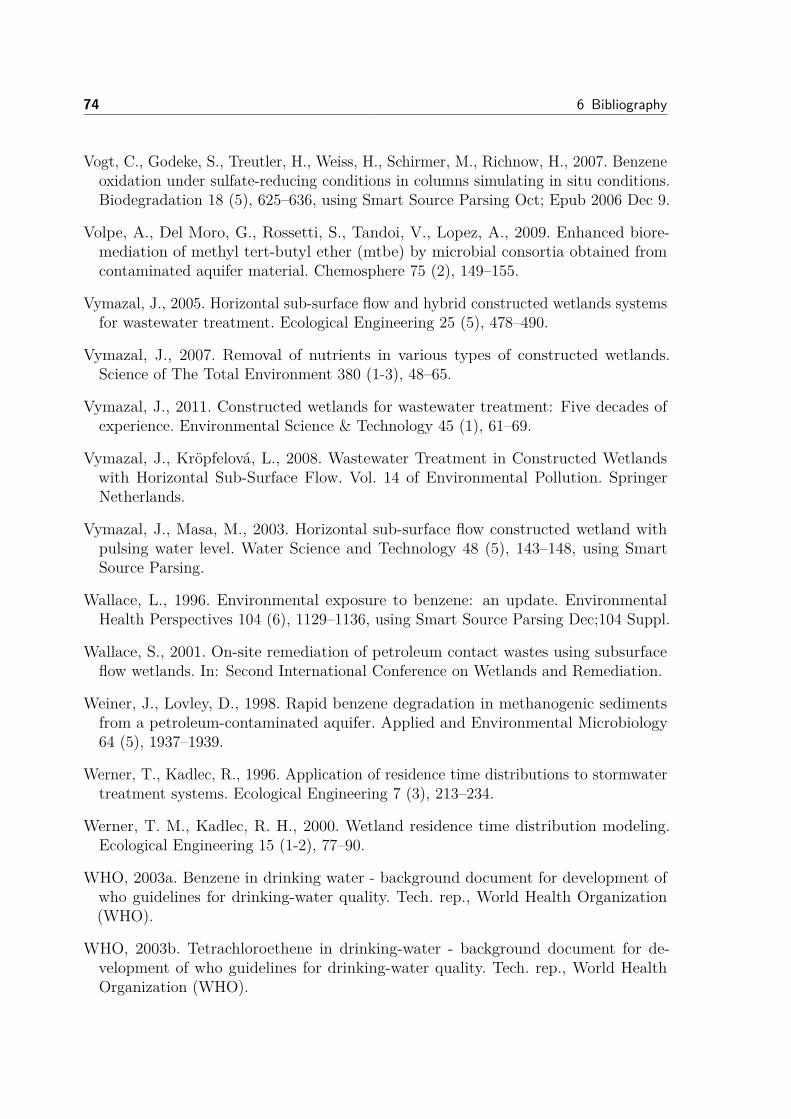
74 6 Bibliography
Vogt, C., Godeke, S., Treutler, H., Weiss, H., Schirmer, M., Richnow, H., 2007. Benzeneoxidation under sulfate-reducing conditions in columns simulating in situ conditions.Biodegradation 18 (5), 625–636, using Smart Source Parsing Oct; Epub 2006 Dec 9.
Volpe, A., Del Moro, G., Rossetti, S., Tandoi, V., Lopez, A., 2009. Enhanced biore-mediation of methyl tert-butyl ether (mtbe) by microbial consortia obtained fromcontaminated aquifer material. Chemosphere 75 (2), 149–155.
Vymazal, J., 2005. Horizontal sub-surface flow and hybrid constructed wetlands systemsfor wastewater treatment. Ecological Engineering 25 (5), 478–490.
Vymazal, J., 2007. Removal of nutrients in various types of constructed wetlands.Science of The Total Environment 380 (1-3), 48–65.
Vymazal, J., 2011. Constructed wetlands for wastewater treatment: Five decades ofexperience. Environmental Science & Technology 45 (1), 61–69.
Vymazal, J., Kröpfelová, L., 2008. Wastewater Treatment in Constructed Wetlandswith Horizontal Sub-Surface Flow. Vol. 14 of Environmental Pollution. SpringerNetherlands.
Vymazal, J., Masa, M., 2003. Horizontal sub-surface flow constructed wetland withpulsing water level. Water Science and Technology 48 (5), 143–148, using SmartSource Parsing.
Wallace, L., 1996. Environmental exposure to benzene: an update. EnvironmentalHealth Perspectives 104 (6), 1129–1136, using Smart Source Parsing Dec;104 Suppl.
Wallace, S., 2001. On-site remediation of petroleum contact wastes using subsurfaceflow wetlands. In: Second International Conference on Wetlands and Remediation.
Weiner, J., Lovley, D., 1998. Rapid benzene degradation in methanogenic sedimentsfrom a petroleum-contaminated aquifer. Applied and Environmental Microbiology64 (5), 1937–1939.
Werner, T., Kadlec, R., 1996. Application of residence time distributions to stormwatertreatment systems. Ecological Engineering 7 (3), 213–234.
Werner, T. M., Kadlec, R. H., 2000. Wetland residence time distribution modeling.Ecological Engineering 15 (1-2), 77–90.
WHO, 2003a. Benzene in drinking water - background document for development ofwho guidelines for drinking-water quality. Tech. rep., World Health Organization(WHO).
WHO, 2003b. Tetrachloroethene in drinking-water - background document for de-velopment of who guidelines for drinking-water quality. Tech. rep., World HealthOrganization (WHO).
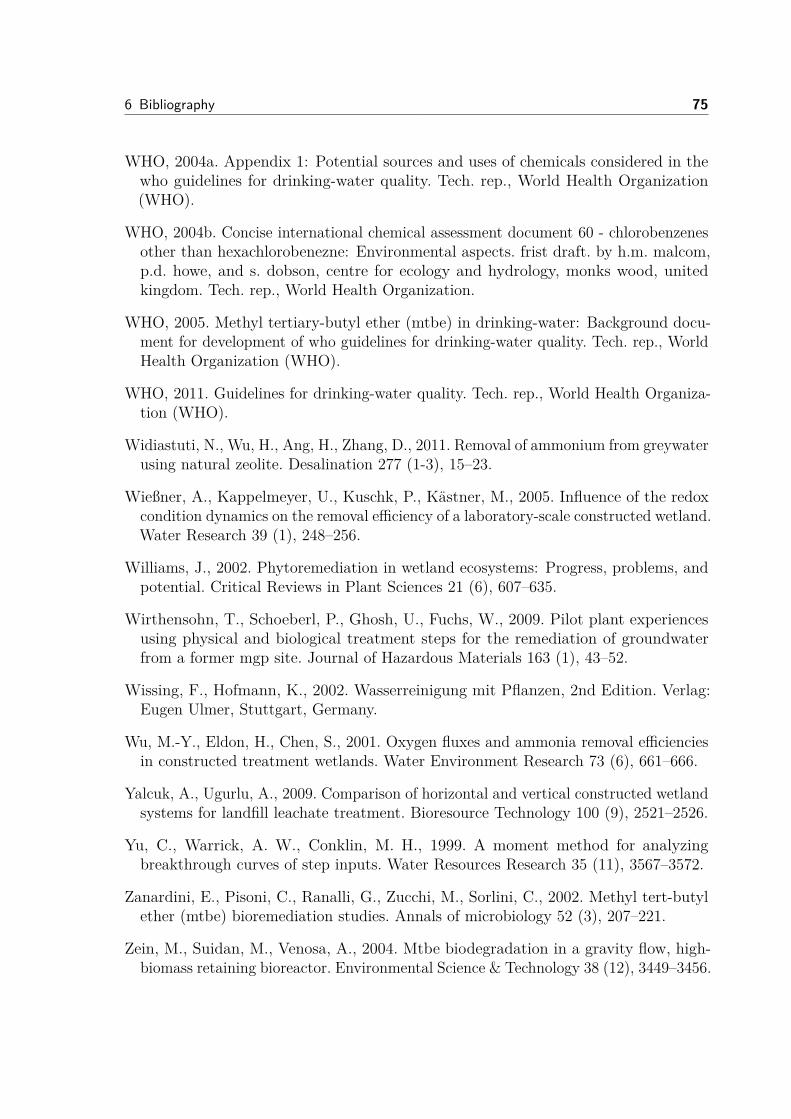
6 Bibliography 75
WHO, 2004a. Appendix 1: Potential sources and uses of chemicals considered in thewho guidelines for drinking-water quality. Tech. rep., World Health Organization(WHO).
WHO, 2004b. Concise international chemical assessment document 60 - chlorobenzenesother than hexachlorobenezne: Environmental aspects. frist draft. by h.m. malcom,p.d. howe, and s. dobson, centre for ecology and hydrology, monks wood, unitedkingdom. Tech. rep., World Health Organization.
WHO, 2005. Methyl tertiary-butyl ether (mtbe) in drinking-water: Background docu-ment for development of who guidelines for drinking-water quality. Tech. rep., WorldHealth Organization (WHO).
WHO, 2011. Guidelines for drinking-water quality. Tech. rep., World Health Organiza-tion (WHO).
Widiastuti, N., Wu, H., Ang, H., Zhang, D., 2011. Removal of ammonium from greywaterusing natural zeolite. Desalination 277 (1-3), 15–23.
Wießner, A., Kappelmeyer, U., Kuschk, P., Kästner, M., 2005. Influence of the redoxcondition dynamics on the removal efficiency of a laboratory-scale constructed wetland.Water Research 39 (1), 248–256.
Williams, J., 2002. Phytoremediation in wetland ecosystems: Progress, problems, andpotential. Critical Reviews in Plant Sciences 21 (6), 607–635.
Wirthensohn, T., Schoeberl, P., Ghosh, U., Fuchs, W., 2009. Pilot plant experiencesusing physical and biological treatment steps for the remediation of groundwaterfrom a former mgp site. Journal of Hazardous Materials 163 (1), 43–52.
Wissing, F., Hofmann, K., 2002. Wasserreinigung mit Pflanzen, 2nd Edition. Verlag:Eugen Ulmer, Stuttgart, Germany.
Wu, M.-Y., Eldon, H., Chen, S., 2001. Oxygen fluxes and ammonia removal efficienciesin constructed treatment wetlands. Water Environment Research 73 (6), 661–666.
Yalcuk, A., Ugurlu, A., 2009. Comparison of horizontal and vertical constructed wetlandsystems for landfill leachate treatment. Bioresource Technology 100 (9), 2521–2526.
Yu, C., Warrick, A. W., Conklin, M. H., 1999. A moment method for analyzingbreakthrough curves of step inputs. Water Resources Research 35 (11), 3567–3572.
Zanardini, E., Pisoni, C., Ranalli, G., Zucchi, M., Sorlini, C., 2002. Methyl tert-butylether (mtbe) bioremediation studies. Annals of microbiology 52 (3), 207–221.
Zein, M., Suidan, M., Venosa, A., 2004. Mtbe biodegradation in a gravity flow, high-biomass retaining bioreactor. Environmental Science & Technology 38 (12), 3449–3456.
76 6 Bibliography
Zein, M., Suidan, M., Venosa, A., 2006. Bioremediation of groundwater contaminatedwith gasoline hydrocarbons and oxygenates using a membrane-based reactor. Envi-ronmental Science & Technology 40 (6), 1997–2003.
Zhang, Q., Davis, L., Erickson, L., 2000. An experimental study of phytoremediationof methyl tert-butyl ether (mtbe) in groundwater. Journal of Hazardous SubstanceResearch 2, 4–1–4–19.
Zhang, T., Ding, L., Ren, H., Xiong, X., 2009. Ammonium nitrogen removal from cokingwastewater by chemical precipitation recycle technology. Water Research 43 (20),5209–5215.
Zhu, T., Sikora, F., 1995. Ammonium and nitrate removal in vegetated and unvegetatedgravel bed microcosm wetlands. Water Science and Technology 32 (3), 219–228.
Zogorski, J., Murduchowitz, A., Baehr, A., Bauman, B., Conrad, D., Drew, R., Korte,N., Lapham, W., Pankow, J., Washington, E., 1997. Chapter 2: Fuel oxygenates andwater quality.
List of Figures
Chapter Page Titel (short version)
1 5 Contaminant fate in a CW: microbial degradation in therhizosphere, sorption, plant uptake, phytotransformation,phytovolatilization, and surface volatilization.
11 Location of the industrial site “Leuna” and the experimentalfield site CoTra.
2 25 Seasonality of benzene, MTBE and ammonia-N concentra-tion in the outflow of the planted gravel CW, the unplantedgravel filter and the plant root mat.
26 Benzene and MTBE concentration in the planted gravelCW and the plant root mat depending on flow distance andfilter depth during summer 2008.
27 Seasonality of redox-relevant species, nitrate and Fe(II), inthe outflow of the planted gravel.
27 Benzene, MTBE and ammonia-N concentration in the out-flow of the planted gravel CWs depending on the filtermaterial additive: no additive, activated carbon additive,Fe(III) additive.
28 Seasonality of Fe(II) concentration in the outflow of theplanted CW with gravel filter matrix and the planted CWwith gravel/Fe(III) filter.
28 Microcosm experiment performed with gravel and rootsfrom the planted and unplanted gravel CW. Mean ben-zene concentration and respective isotopic signature of eachmicrocosm.
3 34 Correlation of areal benzene and MTBE inflow and outflowwater load (ACLin/out) for the planted gravel filter and theplant root mat system with evapotranspiration (ET) valuesand ambient air temperature Tair.
35 Contaminant fate in the planted gravel filter and the plantroot mat system for summer and winter period. Processesincluded: microbial degradation, surface volatilization, phy-tovolatilization, plant uptake, and accumulation / phy-todegradation in the reed.
77
78 List of Figures
Chapter Page Titel (short version)
3 36 Percentage of contaminant removal processes (microbialdegradation, surface volatilization, phytovolatilization,plant uptake, accumulation / phytodegradation in the reed)on overall contaminant loss from the water phase of theplant root mat during the summer period. Comparison ofworst-case, best-case and data-based removal scenarios.
4 44 Flow-weighted residence time distribution C’(Φ): break-through curves and tracer mass recovery for the plantedgravel CW, the unplanted reference and the hydroponicplant root mat operated at 15 cm (low) and 30 cm (high)water level.
46 Fluorescein concentration in the planted gravel CW andthe unplanted reference depending on the flow distance andfilter depth.
47 Benzene, MTBE and ammonium-nitrogen load within theplanted gravel CW and the unplanted reference calculatedfor the sampling campaign 17/8/2009.
5 53 Benzene and MTBE summer mass balances for the gravelCW and the hydroponic plant root mat.
Appendix A.1 III Correlation of areal benzene and MTBE inflow and outflowwater load (ACLin/out) for the unplanted reference systemwith evaporation (E) values and ambient air temperatureTair.
IV Benzene and MTBE inflow and outflow concentrations forthe planted gravel filter, the plant root mat and the un-planted reference system.
V Contaminant fate in the unplanted reference system forsummer and winter period. Processes included: microbialdegradation and surface volatilization.
Appendix A.2 VII Tracer breakthrough times tbreak and respective flow ratesQ at the pore water sampling positions in the planted gravelCW and the unplanted eference.
VIII Benzene, MTBE, and ammonium-nitrogen concentrationsat the pore water sampling positions in the planted gravelCW and the unplanted reference for the sampling campaign17/8/2009.
List of TablesChapter Page Titel (short version)
1 14 Physical, chemical and biological characteristics and limitvalues for the organic model compounds benzene andMTBE.
2 24 Groundwater inflow characteristics: main contaminants,nutrients, redox-relevant compounds, redox parameters,parameters describing wetland carbon speciation.
24 Constructed wetland characteristics: filter composition, in-flow rate and water level.
28 Most probable numbers of total aerobic bacteria, benzene-degrading bacteria and MTBE-degrading bacteria in porewater and extracted cell solution of gravel.
3 35 Data used for the calculation of contaminant mass balancesof the gravel filter CW and the plant root mat duringsummer and winter sampling periods.
4 40 Overview of operational characteristics of the planted andunplanted gravel filter and the hydroponic plant root matoperated at high and low water level and the experimentalsettings for the tracer studies conducted.
43 Hydraulic parameters obtained from the analysis of theoutlet tracer BTCs: tracer recovery, initial tracer detec-tion, mean residence time, variance, dimensionless variance,number of continuously stirred tank reactors, dispersioncoefficient, dispersion number, Péclet number, longitudinaldispersivity, and porosity.
45 Contaminant removal (mass load and percentage) and evap-otranspiration (ET) for the planted gravel filter, the un-planted reference and the hydroponic plant root mat, forSeptember, October and November 2009.
46 Vertical profile of the root distribution in the planted HSSFCW containing 0.1%-wt charcoal as a filter additive.
79

80 List of Tables
Chapter Page Titel (short version)
Appendix A.1 I Physico-chemical characteristics of the groundwater inflow:nutrients, redox-relevant compounds, redox parameters,parameters describing wetland carbon speciation.
II Data used for the calculation of contaminant mass balanceof the unplanted reference system during summer and wintersampling periods.
Acknowledgments
This dissertation has been conducted at the Helmholtz Centre for EnvironmentalResearch - UFZ in the department of Environmental Biotechnology and would not havebeen possible without the support, guidance and help of many people who in one wayor another contributed to the preparation and completion of this doctoral thesis.
First and foremost I would like to thank my supervisors Prof. Dr. Matthias Kästnerand Dr. Peter Kuschk for giving me the opportunity to do my PhD in the field of wastewater treatment as well as for providing valuable guidance and scientific advice. I amespecially grateful to Peter for his constant support concerning practical things andmotivation.
I am also very grateful to Prof. Dr. Peter Grathwohl who supervised my thesis onbehalf of the faculty of Applied Geosciences of the University of Tübingen.
Many thanks go to my UFZ colleagues, especially the ones from the EnvironmentalBiotechnology Department. There was always a friendly and good atmosphere, e.g.during the numerous “coffe&cake sessions”. In particular, I would like to convey thanksto Ines Mäusezahl, Kerstin Ethner, Kerstin Puschendorf, and Claudia Pietsch for theirorganizational support in the labs, to Uwe Kappelmayer, Paula Martinez and MarcelNikolausz for answering microbiology questions, and to Ursula Günther for assistingme with the isotope measurements.
I very much acknowledge the help of all the students, interns, apprentices, researchassistants and ABM workers, who participated with interest and enthusiasm in the fieldsampling campaigns - even though the weather was not always appropriate to spenda whole day or even a night outside in the field. My thanks go to: Madlen Schröter,Helga Fazekas, Roland Schröder, Alexander Soran Al-Dahoodi, Robert Wickert, InesMäusezahl, Zhongbing Chen, Shubiao Wu, Paul Weißbach, Daniel Preußger, MikaelNader Mroueh, Alia Marrakchi, Erika Fischer, Stefanie Dotzauer, Mandy Kirsten,Macarena Ona Burgos, Marcel Lamkewitz, Janneth Cubillos, Diana Hincapié, Juliana
82 Acknowledgments
Valencia Quintero. In addition, I thank very much Francesca Löper, the engineer of theCoTra plant, for her assistance in the field and the many nice drives to and back fromthe plant.
I also would like to take the opportunity to thank Dr. Uli Maier for providing insightsinto the field of modeling, the fruitful discussions and his contribution regarding theevaluation of the tracer data. Also, many thanks go to Dr. Nils Reiche for thecollaboration concerning the measurement of VOC emission and the great discussionswhen it came to writing publications.
Many, many thanks go to my friends Esther Cyrus, Nils Reiche, Martin Seidel, JanetRiedl, Jana Rakoczy, Axel Schmidt and Iris Adam. You were close to me even when Iwas far away. Thank you for being there! My special thanks go to Mareike Braeckeveltand Anna Schwarzer who were always by my side as my best friends, supporting meduring all the phases of my PhD, celebrating the good things and hugging me whenthings went wrong. For the willingness for discussions regarding the thesis I want toexpress my gratitude to Mareike, Nils and Axel. Also, thanks to Florian and Nils forleading me through the world of LATEX. Thanks to my flat mates Atz, Charlotte, Rikeand Tobi for their companionship and in particular the relaxing cooking sessions.
Finally, I wish to express my love and gratitude to my family. You always supported,encouraged and believed in me during my studies and PhD time. Without you I wouldnot have been able to keep on doing what I did. Thank you, Sylvia and Werner, forunderstanding and helping to solve my doubts; Henning, for never stopping to ask howthings precede; Wibke, for telling me not to be so serious and that there are otherthings apart from work; and Svenja for teaching me to not skip breaks. Also, I wouldlike to thank my grandmas who always wanted to see me handing in my thesis – I amsad that you passed away before.
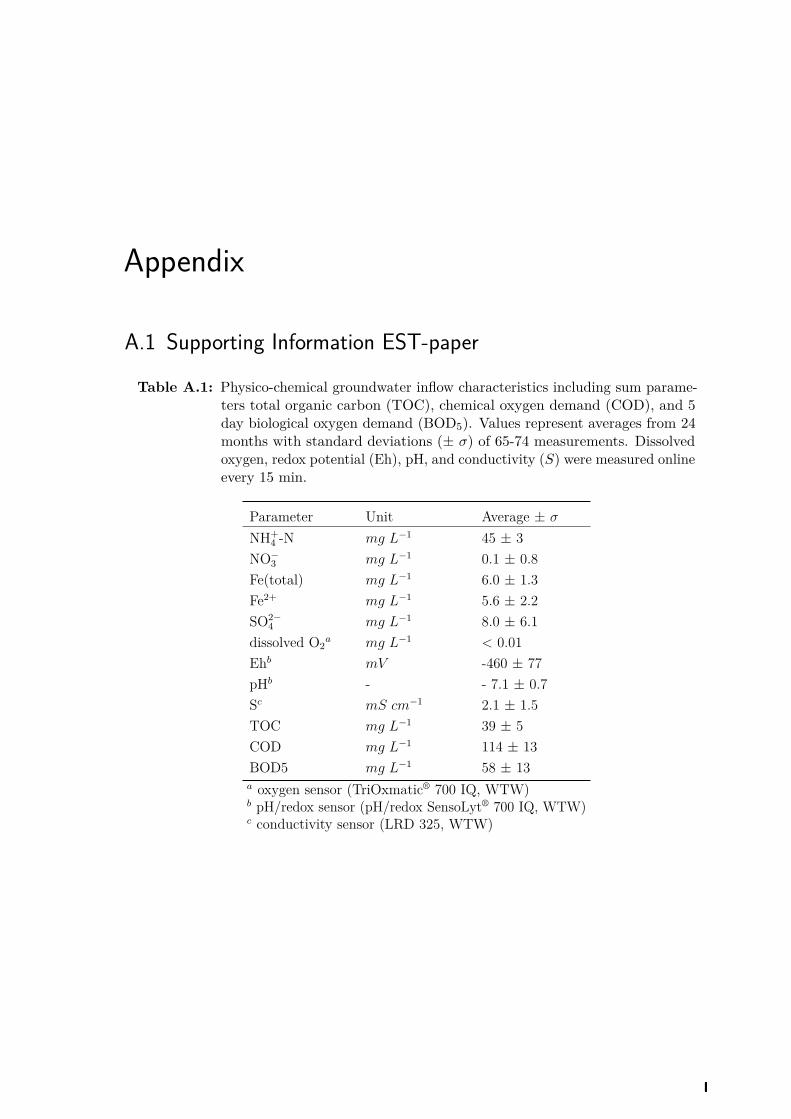
Appendix
A.1 Supporting Information EST-paper
Table A.1: Physico-chemical groundwater inflow characteristics including sum parame-ters total organic carbon (TOC), chemical oxygen demand (COD), and 5day biological oxygen demand (BOD5). Values represent averages from 24months with standard deviations (± σ) of 65-74 measurements. Dissolvedoxygen, redox potential (Eh), pH, and conductivity (S) were measured onlineevery 15 min.
Parameter Unit Average ± σ
NH+4 -N mg L−1 45 ± 3
NO−3 mg L−1 0.1 ± 0.8Fe(total) mg L−1 6.0 ± 1.3Fe2+ mg L−1 5.6 ± 2.2SO2−
4 mg L−1 8.0 ± 6.1dissolved O2
a mg L−1 < 0.01Ehb mV -460 ± 77pHb - - 7.1 ± 0.7Sc mS cm−1 2.1 ± 1.5TOC mg L−1 39 ± 5COD mg L−1 114 ± 13BOD5 mg L−1 58 ± 13a oxygen sensor (TriOxmatic® 700 IQ, WTW)b pH/redox sensor (pH/redox SensoLyt® 700 IQ, WTW)c conductivity sensor (LRD 325, WTW)
I
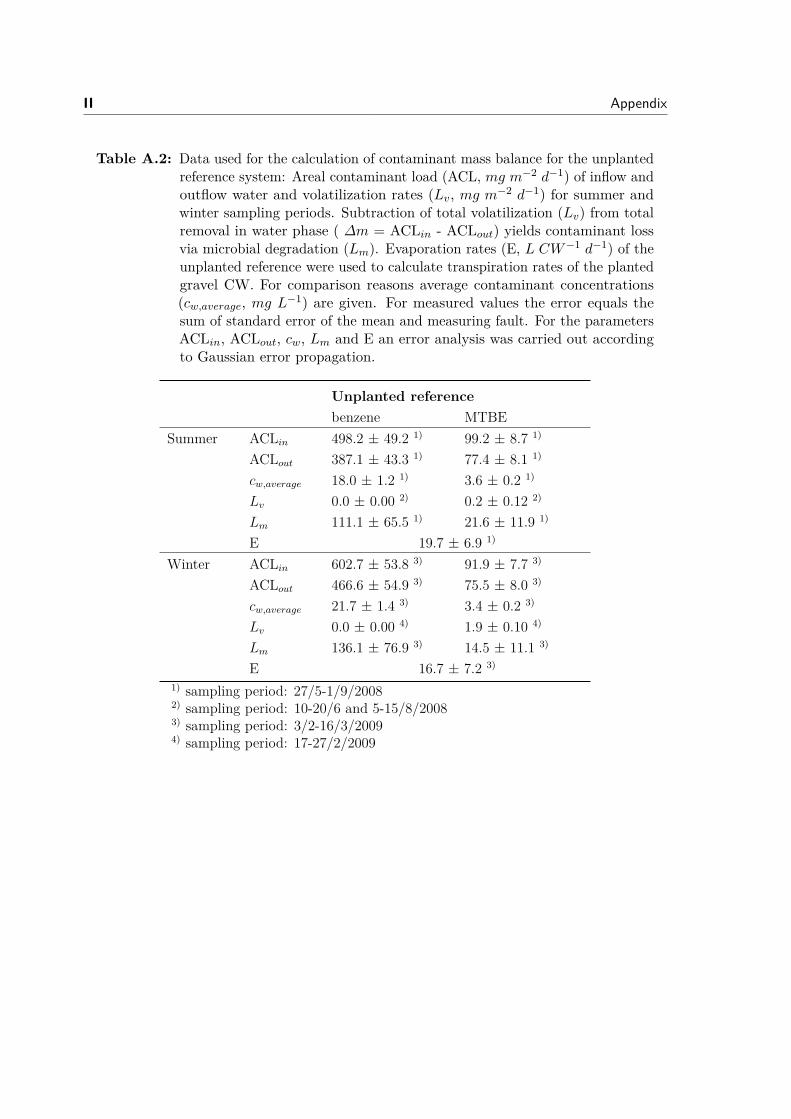
II Appendix
Table A.2: Data used for the calculation of contaminant mass balance for the unplantedreference system: Areal contaminant load (ACL, mg m−2 d−1) of inflow andoutflow water and volatilization rates (Lv, mg m−2 d−1) for summer andwinter sampling periods. Subtraction of total volatilization (Lv) from totalremoval in water phase ( ∆m = ACLin - ACLout) yields contaminant lossvia microbial degradation (Lm). Evaporation rates (E, L CW−1 d−1) of theunplanted reference were used to calculate transpiration rates of the plantedgravel CW. For comparison reasons average contaminant concentrations(cw,average, mg L−1) are given. For measured values the error equals thesum of standard error of the mean and measuring fault. For the parametersACLin, ACLout, cw, Lm and E an error analysis was carried out accordingto Gaussian error propagation.
Unplanted referencebenzene MTBE
Summer ACLin 498.2 ± 49.2 1) 99.2 ± 8.7 1)
ACLout 387.1 ± 43.3 1) 77.4 ± 8.1 1)
cw,average 18.0 ± 1.2 1) 3.6 ± 0.2 1)
Lv 0.0 ± 0.00 2) 0.2 ± 0.12 2)
Lm 111.1 ± 65.5 1) 21.6 ± 11.9 1)
E 19.7 ± 6.9 1)
Winter ACLin 602.7 ± 53.8 3) 91.9 ± 7.7 3)
ACLout 466.6 ± 54.9 3) 75.5 ± 8.0 3)
cw,average 21.7 ± 1.4 3) 3.4 ± 0.2 3)
Lv 0.0 ± 0.00 4) 1.9 ± 0.10 4)
Lm 136.1 ± 76.9 3) 14.5 ± 11.1 3)
E 16.7 ± 7.2 3)
1) sampling period: 27/5-1/9/20082) sampling period: 10-20/6 and 5-15/8/20083) sampling period: 3/2-16/3/20094) sampling period: 17-27/2/2009
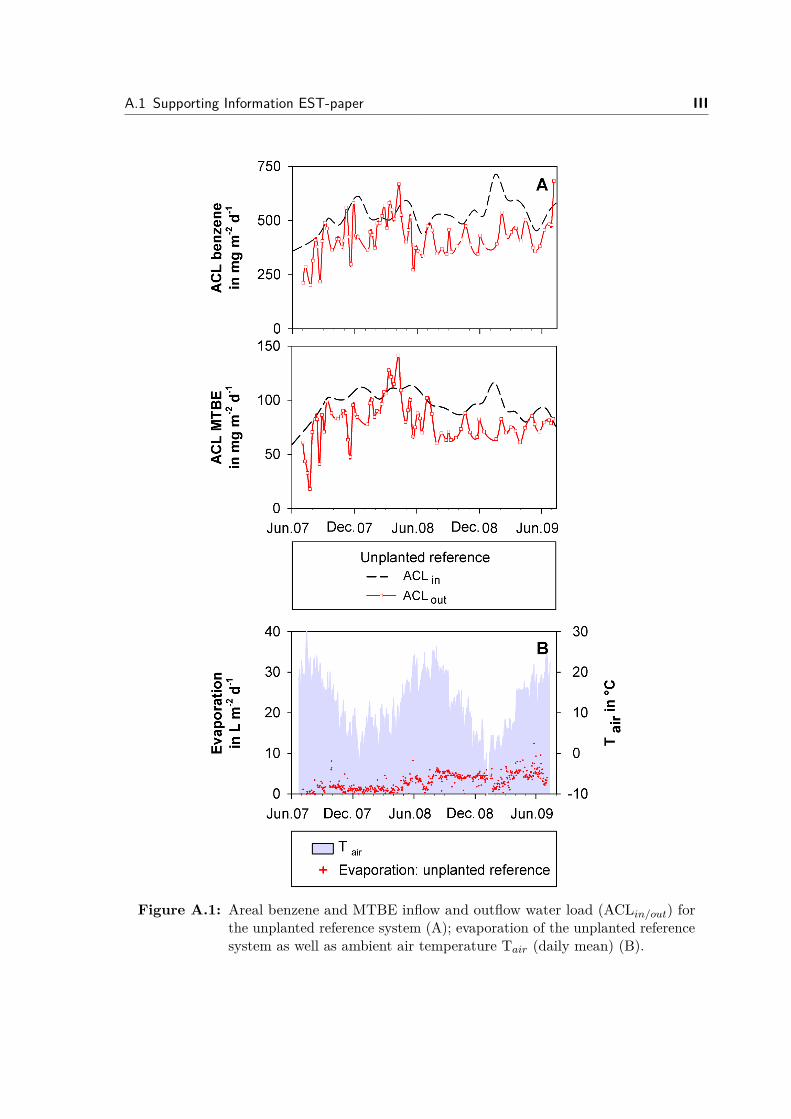
A.1 Supporting Information EST-paper III
Figure A.1: Areal benzene and MTBE inflow and outflow water load (ACLin/out) forthe unplanted reference system (A); evaporation of the unplanted referencesystem as well as ambient air temperature Tair (daily mean) (B).
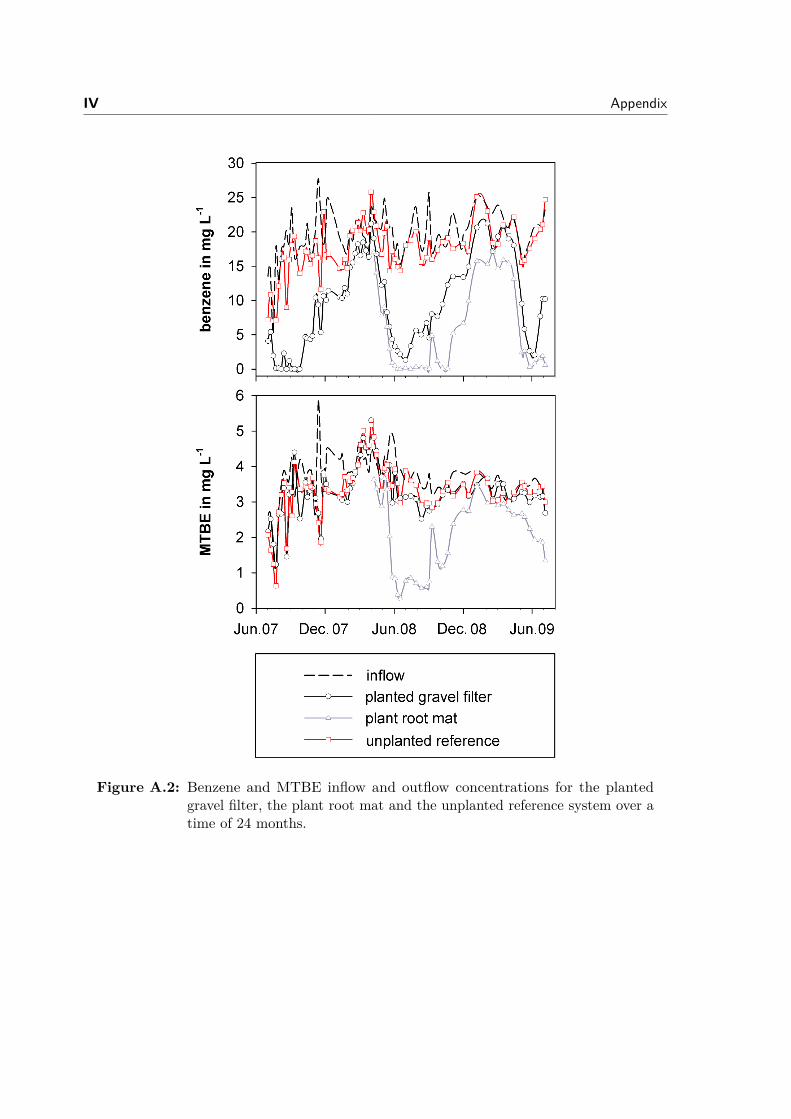
IV Appendix
Figure A.2: Benzene and MTBE inflow and outflow concentrations for the plantedgravel filter, the plant root mat and the unplanted reference system over atime of 24 months.
A.1 Supporting Information EST-paper V
Figure A.3: Contaminant fate in the unplanted reference system for summer and winterperiod. Processes included are microbial degradation and surface volatiliza-tion.
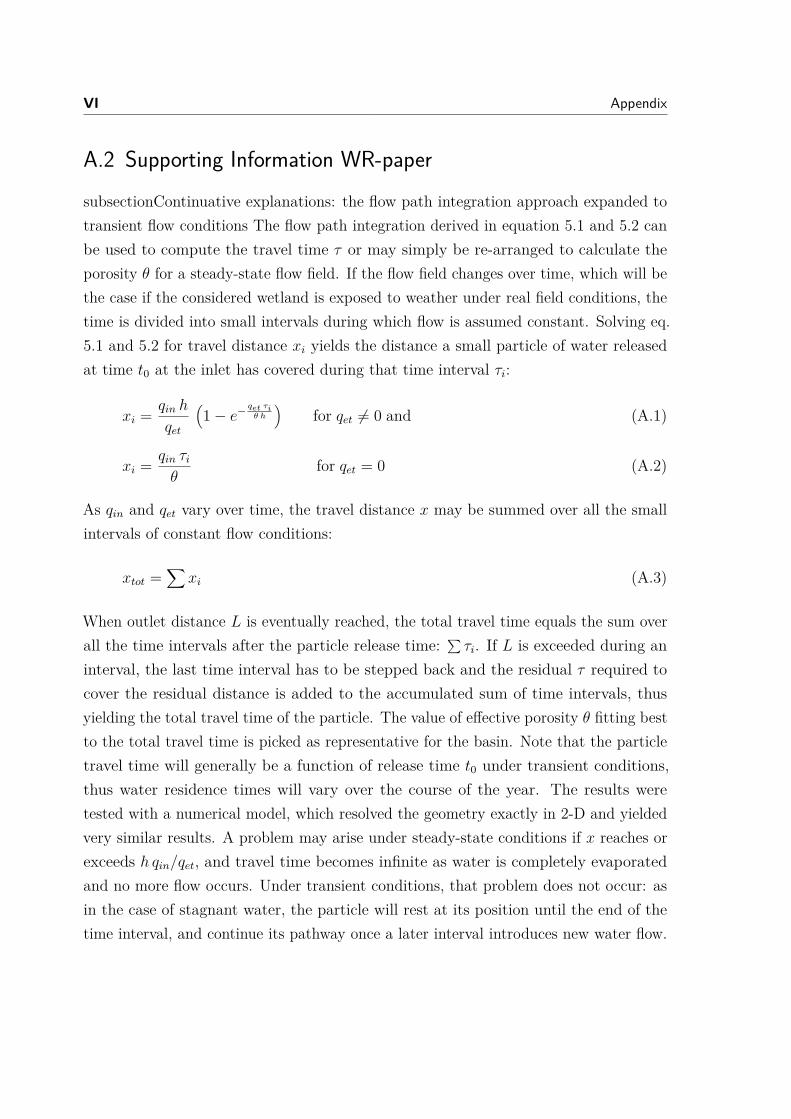
VI Appendix
A.2 Supporting Information WR-papersubsectionContinuative explanations: the flow path integration approach expanded totransient flow conditions The flow path integration derived in equation 5.1 and 5.2 canbe used to compute the travel time τ or may simply be re-arranged to calculate theporosity θ for a steady-state flow field. If the flow field changes over time, which will bethe case if the considered wetland is exposed to weather under real field conditions, thetime is divided into small intervals during which flow is assumed constant. Solving eq.5.1 and 5.2 for travel distance xi yields the distance a small particle of water releasedat time t0 at the inlet has covered during that time interval τi:
xi = qin h
qet
(1− e−
qet τiθ h
)for qet 6= 0 and (A.1)
xi = qin τiθ
for qet = 0 (A.2)
As qin and qet vary over time, the travel distance x may be summed over all the smallintervals of constant flow conditions:
xtot =∑
xi (A.3)
When outlet distance L is eventually reached, the total travel time equals the sum overall the time intervals after the particle release time: ∑ τi. If L is exceeded during aninterval, the last time interval has to be stepped back and the residual τ required tocover the residual distance is added to the accumulated sum of time intervals, thusyielding the total travel time of the particle. The value of effective porosity θ fitting bestto the total travel time is picked as representative for the basin. Note that the particletravel time will generally be a function of release time t0 under transient conditions,thus water residence times will vary over the course of the year. The results weretested with a numerical model, which resolved the geometry exactly in 2-D and yieldedvery similar results. A problem may arise under steady-state conditions if x reaches orexceeds h qin/qet, and travel time becomes infinite as water is completely evaporatedand no more flow occurs. Under transient conditions, that problem does not occur: asin the case of stagnant water, the particle will rest at its position until the end of thetime interval, and continue its pathway once a later interval introduces new water flow.
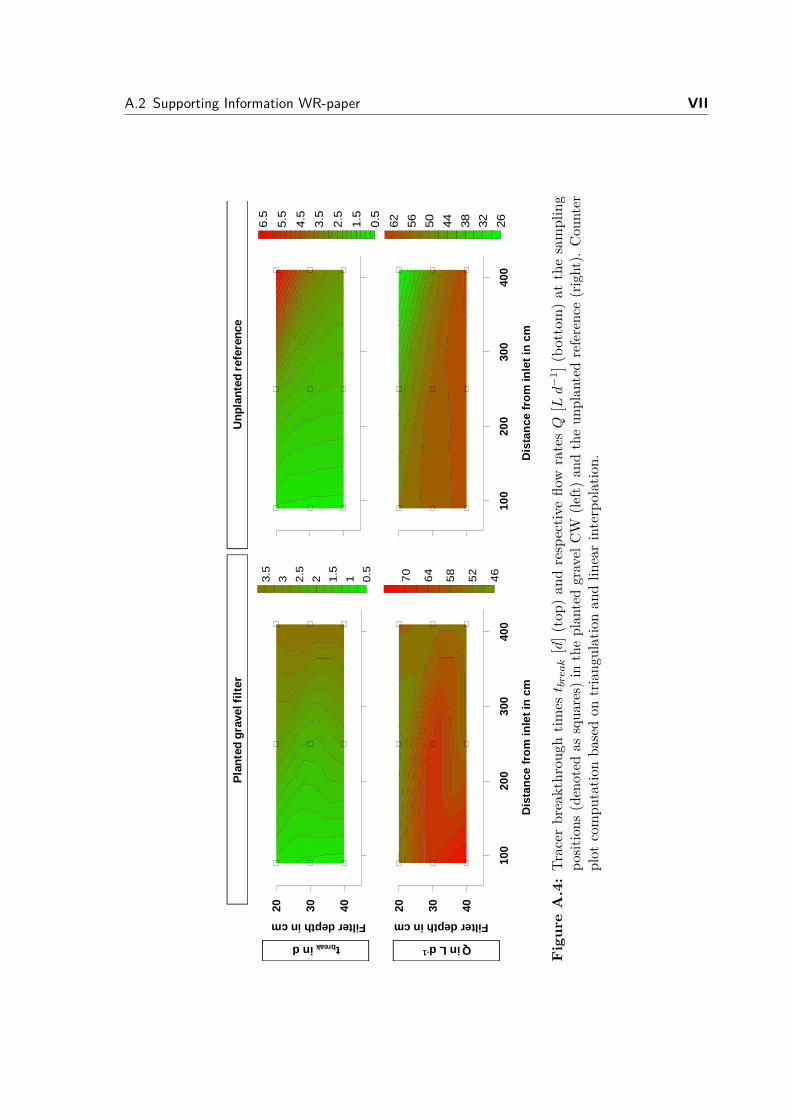
A.2 Supporting Information WR-paper VII
Q in L d-1
Pla
nted
grav
elfi
lter
Unp
lant
edre
fere
nce
tbreakin d
403020
Filter depth in cm
0.5
11.5
22.5
33.5
100
200
300
400
0.5
1.5
2.5
3.5
4.5
5.5
6.5
100
200
300
400
Dis
tan
ce f
rom
inle
t in
cm
403020
Filter depth in cm
46
52
58
64
70
100
200
300
400
Dis
tan
ce f
rom
inle
t in
cm
26
32
38
44
50
56
62
Fig
ure
A.4
:Tr
acer
breakthrou
ghtim
est break[d](
top)
andrespectiv
eflo
wratesQ
[Ld−
1 ](bottom)at
thesampling
posit
ions
(denoted
assqua
res)
intheplan
tedgravel
CW
(left)
andtheun
plan
tedreference(right).
Cou
nter
plot
compu
tatio
nba
sedon
triang
ulationan
dlin
earinterpolation.
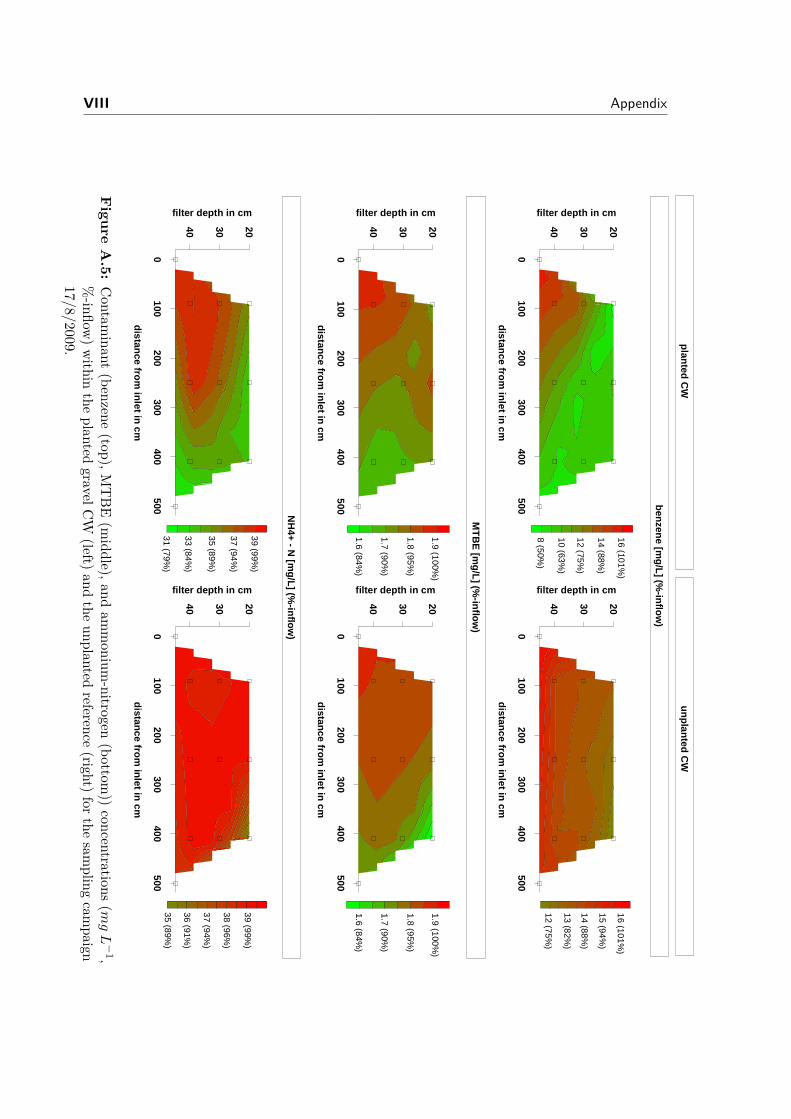
VIII Appendix
0100
200300
400500
distan
ce from
inlet in
cm
40 30 20
filter depth in cm
8 10
12
14
16
0100
200300
400500
distan
ce from
inlet in
cm
40 30 20
filter depth in cm
plan
ted C
Wu
np
lanted
CW
ben
zene [m
g/L
] (%-in
flow
)
0100
200300
400500
distan
ce from
inlet in
cm
40 30 20
filter depth in cm
1.6
1.7
1.8
1.9
MT
BE
[mg
/L] (%
-inflo
w)0
100200
300400
500
distan
ce from
inlet in
cm
40 30 20
filter depth in cm
0100
200300
400500
distan
ce from
inlet in
cm
40 30 20
filter depth in cm
31
33
35
37
39
NH
4+ - N [m
g/L
] (%-in
flow
)0100
200300
400500
distan
ce from
inlet in
cm
40 30 20
filter depth in cm
35
36
37
38
39
31 (79%)
33 (84%)
35 (89%)
37 (94%)
39 (99%)
36 (91%)
37 (94%)
38 (96%)
39 (99%)
1.6 (84%)
1.7 (90%)
1.8 (95%)
1.9 (100%)
12
13
14
15
16
8 (50%)
1.5
5
1.6
1.6
5
1.7
1.7
5
1.8
1.8
5
1.91.6 (84%
)
1.7 (90%)
1.8 (95%)
1.9 (100%)
10 (63%)
12 (75%)
14 (88%)
16 (101%)
12 (75%)
13 (82%)
14 (88%)
15 (94%)
16 (101%)
35 (89%)
Figure
A.5:
Contam
inant(benzene
(top),MTBE
(middle),and
ammonium
-nitrogen(bottom
))concentrations
(mgL−
1,%-inflow)within
theplanted
gravelCW(left)and
theunplanted
reference(right)forthe
sampling
campaign
17/8/2009.
Selbständigkeitserklärung
Ich erkläre hiermit, dass ich die zur Promotion eingereichte Arbeit mit dem Titel“Treatment of groundwater contaminated with benzene, MTBE and ammonium byconstructed wetlands” selbständig verfasst, nur die angegebenen Quellen und Hilfsmittelbenutzt und wörtlich oder inhaltlich übernommene Stellen (alternativ: Zitate) alssolche gekennzeichnet habe. Ich erkläre, dass die Richtlinien zur Sicherung guterwissenschaftlicher Praxis der Universität Tübingen (Beschluss des Senats vom 25.5.2000)beachtet wurden. Ich versichere an Eides statt, dass diese Angaben wahr sind unddass ich nichts verschwiegen habe. Mir ist bekannt, dass die falsche Abgabe einerVersicherung an Eides statt mit Freiheitsstrafe bis zu drei Jahren oder mit Geldstrafebestraft wird.
Eva Mareike Seeger
IX

Curriculum VitaeContact InformationName Eva Mareike SeegerAddress Karl-Liebknechtstr. 49
04107 Leipzig, GermanyPhone +49/(0)341 / 6402723Email [email protected]
Work Experiencesince 08/2012 Helmholtz Centre for Environmental Research - UFZ,
Leipzig, Germany; Department of Environmental Microbi-ologyPosition: Research Assistant
05/2007 – 11/2012 Helmholtz Centre for Environmental Research - UFZ,Leipzig, Germany; Department of Environmental Biotech-nologyPosition: PhD candidate
Educationsince 05/2007 PhD candidate at the Helmholtz Centre for Environmental
Research -UFZ, Leipzig, Germany supervised by Prof. Dr.M. Kästner (UFZ, Department of Environmental Biotechnol-ogy) and Prof. Dr. P. Grathwohl (University of Tübingen,Center of Applied Geoscience)
Topic of the PhD project: “Constructed wetlands for thetreatment of groundwater contaminated by benzene, MTBEand ammonium”
05/2007 – 11/2012 Helmholtz Centre for Environmental Research - UFZ,Leipzig, Germany; Department of Environmental Biotech-nologyPosition: PhD candidate
XI
XII Curriculum Vitae
Education03/2007 Obtaining the Diploma in Chemistry
University of Leipzig, Faculty of Chemistry and Mineralogy
03/2006 – 02/2007 Diploma thesis at the Helmholtz Centre for Environ-mental Research - UFZ, Leipzig, Germany; DepartmentBioremediation
Title of the thesis: “Constructed wetlands for treatinggroundwater contaminated by chlorinated VOCs (MCBand PCE)”
10/2004 – 02/2006 Advanced studies of Chemistry at the University of Leipzig,Faculty of Chemistry and MineralogySpecialization: Environmental Chemistry, Organic Chem-istry, Biosciences
09/2003 – 09/2004 Exchange year in Chemistry at the University of Uppsala,Sweden
10/2000 – 09/2003 Basic studies of Chemistry at the University of Leipzig,Faculty of Chemistry and Mineralogy
1987 – 2000 Elementary school and gymnasiumGraduation: Abitur (German high school degree)
Research Stay11/2008 Technical University of Pereira (UTP), Colombia; Prof. D.
Paredes
Project: Scientific exchange program regarding wastewatertreatment in constructed wetlands within the DAAD-projectPROCOL
11/2007 – 02/2008 Technical University Denmark (DTU), Copenhagen; Prof.S. Trapp
Project: Tree toxicity tests with willow cuttings (benzene,MTBE, TCE, MCB and TiO2 nanoparticles) within theframework of the SAFIRA-project CoTra
3/2003 University of Southampton, United Kingdom; Prof. M.Hursthouse
Project: Evaluation of the structures of racemic lithiumtartrate hydrates using crystallographic structural
Curriculum Vitae XIII
Language SkillsGerman Mother TongueEnglish Fluent in spoken and writtenSwedish Basic knowledgeFrench Basic knowledge
Additional SkillsSoftware Surfer, SigmaPlot, windows applications, basic knowledge
of VBA, LaTeX

Publications
Peer-review ArticlesSeeger, E.M.; Maier, U.; Grathwohl, P.; Kuschk, P.; Kaestner, M..:Performance evaluation of different horizontal subsurface flow wetland types by char-acterization of flow behavior, mass removal and depth–dependent contaminant load.Water Research, accepted for publication October 2012.
Seeger, E.M.; Reiche, N.; Kuschk, P.; Borsdorf, H.; Kaestner, M..: Perfor-mance evaluation using a three compartment mass balance for the removal of volatileorganic compounds in pilot scale constructed wetlands. Environmental Science &Technology (2011), 45: 8467–8474.
Seeger, E.M.; Kuschk, P.; Fazekas, H.; Grathwohl, P.; Kaestner, M..:Bioremediation of benzene–, MTBE– and ammonium–contaminated groundwater withpilot-scale constructed wetlands. Environmental Pollution (2011), 159: 3769–3776
Seeger, E.M.; Baun, A.; Kaestner, M.; Trapp, S..: Insignificant acute toxicityof TiO2 nanoparticles to willo trees. Journal of Soils and Sediments (2009), 9: 46–53.
Wu, S.; Chen, Z.; Braeckevelt, M; Seeger, E.M., Dong, R.; Kaestner, M.;Paschke, H.; Hahn, A.; Kayser, G.; Kuschk, P..: Dynamics of Fe(II), sulphurand phosphate in pilot-scale constructed wetlands treating a sulphate-rich chlorinatedhydrocarbon contaminated groundwater. Water Research (2012), 46(6): 1923–1932.
Voyevoda, M.; Geyer, W.; Mosig, P.; Seeger, E.M.; Mothes, S..: Evaluationof the Effectiveness of different methods for the remediation of contaminated ground-water by determining the petroleum hydrocarbon content. Clean - Soil, Air, Water(2012), 40(8): 817–822.
Braeckevelt, M.; Seeger, E.M.; Paschke, H.; Kuschk, P.; Kaestner, M..:
XV

XVI Publications
Adaptation of a constructed wetland to simultaneous treatment of monochlorobenzeneand perchlorethene. International Journal of Phytoremediation (2011), 13(10): 998–1013.