Determination of Substituted Benzene - DORA 4RI
146
Diss. No. 11 437 Determination of Substituted Benzene- and Naphthalenesulfonates in Waste Water and their Behaviour in Sewage Treatment A dissertation submitted to the SWISS FEDERAL INSTITUTE OF TECHNOLOGY ZURICH for the degree of DOCTOR OF NATURAL SCIENCES presented by BEAT WERNER ALTENBACH dipl. phil. II (Chemistry) University of Basle bom on August 2, 1965 Prof. Dr. R. Schwarzenbach, examiner Prof. Dr. W. Giger, co-examiner Prof. Dr. A. M. Cook, co-examiner Zurich 1996
-
Upload
khangminh22 -
Category
Documents
-
view
3 -
download
0
Transcript of Determination of Substituted Benzene - DORA 4RI

Diss. No. 11 437
Determination of Substituted Benzene- and
Naphthalenesulfonates in Waste W ater and their Behaviour in
Sewage Treatment
A dissertation submitted to the SWISS FEDERAL INSTITUTE OF TECHNOLOGY ZURICH
for the degree of DOCTOR OF NATURAL SCIENCES
presented by BEAT WERNER ALTENBACH
dipl. phil. II (Chemistry) University of Basle bom on August 2, 1965
Prof. Dr. R. Schwarzenbach, examiner Prof. Dr. W. Giger, co-examiner
Prof. Dr. A. M. Cook, co-examiner
Zurich 1996

AMDG
"Und alle grossen Wissenschaftler waren sich klar darüber, dass jede Lösung eines Wissenschaftlichen Problems viele neue ungelöste Probleme aufwirft. Je mehr wir über die Welt lernen, um so bewusster, um so detaillierter und um so genauer wird unser Wissen von den noch ungelösten Problemen, unser sokra-tisches Wissen von unserem Nichtwissen. Die wissenschaftliche Forschung ist in der Tat die beste Methode, uns über uns selbst und über unser Nicht-wissen aufzuklären. Sie führt uns zu der wichtigen Einsicht, dass wir Menschen sehr verschieden sind hinsichtlich der Kleinigkeiten, über die wir vielleicht etwas wissen. In unserer unendlichen Unwissenheit sind wir aber alle gleich."
Karl R. Popper

An dieser Stelle möchte ich mich bei all denjenigen bedanken, die zum Entstehen dieser Arbeit beigetragen haben:
Meinen Eltern für die Geduld, Unterstützung und Liebe, die sie mir in den letzten dreissig Jahren geschenkt haben und die ich auch in Zukunft weiter strapazieren werde.
Walter Giger für die Betreuung meiner Doktorarbeit und dafür, dass ich mich in seiner Gruppe trotz meinem "special kind of Basle humour" (Zitat: ILMAC 1993) all die Jahre willkommen fühlen durfte.
Rene Schwarzenbach für die Übernahme des Referates und Alasdair Cook für die Übernahme des zweiten Koreferates.
Sonja Riediker für die enorme Arbeit, die sie im Rahmen ihrer Diplomarbeit für das Zustandekommen dieser Dissertation geleistet hat, sowie Hans Peter Kohler und Pius Kölbener für die fachliche Beratung während dieser Diplomarbeit.
Marc Suter für seine Bemühungen, aus meinen Extrakten brauchbare Massenspektren zu gewinnen.
Hansruedi Siegrist für seine Hilfe beim Modellieren mit ASIM 3.0.
Michael Stern für seinen unermüdlichen Eifer, mit dem er mir alle Proben und Informationen aus der Kläranlage Herisau zukommen liess. Seiner Frau Patricia und den Kindern Vera, Julia und Silvan für die freundliche Aufnahme in ihre Familie während meiner Feldstudie in Herisau.
Christian Eggenberger für den grossen Enthusiasmus, den er anlässlich seines Weiterbildungssemesters meiner Arbeit entgegenbrachte.
Michael Elovitz für seine Bemühungen, mein Englisch lesbar zu machen.
Den Mönchen des Benediktinerklosters Mariastein bei Basel für ihre Gastfreundschaft und ihr Gebet während der Entstehungsphase des vor-liegenden Berichtes.
Frau Grob für das Gastrecht, das ich in ihrem Haus in W allisellen geniessen durfte und dafür, dass sie es stets mit viel Geduld ertragen hat, wie ich versuchte, meine wechselnden Gemütslagen pianistisch umzu-setzen.

Den lieben Kolleginnen, Joggerlnnen und Volleyballerlnnen für die einzigartige Arbeitsatmosphäre an der EA W AG und für die Geduld, mit der sie sich all die Jahre meinen Basler Dialekt und meine militärischen, sportlichen, philosophischen und theologischen Exkurse angehört haben.
Den Kolleginnen vom Rhine Basin Programm für die fachlichen Diskussionen und die vielen Stunden gemütlichen Zusammenseins anlässlich verschiedener Treffen in Hamburg, Berlin, Karlsruhe, Dresden u.a.
All denjenigen, die hier vergeblich nach ihrem Namen gesucht haben. Auch sie alle waren in den letzten Jahren massgeblich daran beteiligt, mich zu dem zu machen, was ich heute bin.
Diese Arbeit wurde im Rahmen des Rhine Basin Programs durch-geführt, das von der Firma Hewlett-Packard zu seinem fünfzigjährigen Bestehen ins Leben gerufen wurde und an dem Forscher aus Deutschland, Holland, Frankreich und der Schweiz beteiligt waren.

TABLE OF CONTENTS
Zusammenfassung
Abstract
Abbreviations
1. General Introduction 1.1. Types and Applications of Aromatic Sulfonates 1.2. Some Important Properties of Aromatic Sulfonates 1.3. Present Knowledge about the Fate and Behaviour of
Aromatic Sulfonates in the Aquatic Environment 1.4. Motivation and Goals of this Work
2. Analytical Method Development 2.1. Introduction 2.2. Experimental Section
2.2.1. Chemicals and Reagents 2.2.2. Conventional Ion-Pair Extraction 2.2.3. Enrichment with Carbopack B 2.2.4. Recovery and Breakthrough
1
4
6 7
11
11 15 15 15 16 17
2.2.5. Reversed-Phase Ion-Pair Liquid Chromatography 18 2.2.6. Detection and Quantitation 19
2.3. Results and Discussion 20 2.3.1. Ion-Pair Solid-Phase Extraction 20 2.3.2. Solid-Phase Extraction with Carbopack B 21 2.3.3. Recovery and Breakthrough 27 2.3.4. Reversed-Phase Ion-Pair Liquid Chromatography 32
3. Occurrence and Behaviour of Aromatic Sulfonates in Sewage Treatment Plants
3.1. Introduction 3.2. Experimental Section
3.2.1. Description of the STP Herisau 3.2.2. Sampling 3.2.3. Sample Preparation 3.2.4. HPLC, detection and quantitation 3.2.5. Electrospray/MS and FAB/MS 3.2.6. Modelling with ASIM 3.0.
37
37 42 42 42 43 45 47 48
3.3. Results and Discussion 50 3.3.1. Identification of Benzene- and Naphthalenesulfonates
in the Waste Waters from the STP Herisau 50 3.3.2. Analyses of Sewage Sludges from the STP Herisau 57 3.3.3. Concentrations and Massfluxes of Nitro- and
Aminobenzenesulfonates 5 8 3.3.4. Isomer Patterns, Concentrations and Massfluxes
of Naphthalenesulfonates 61 3.3.5. Aminonaphthalene- and Aminobenzenesulfonates 63 3.3.6. Effect of Waste Water Flow on the Elimination of
Nitrobenzene- and Naphthalenesulfonates 66 3.3.7. Elimination ofNitrobenzene- and Naphthalenesulfo-
nates after Intermissions of Work in the Textile Industry 68 4. Biodegradation Experiments
4.1. Introduction 4.2. Experimental Section
4.2.1. Chemicals 4.2.2. Sewage Sludge and Inoculum 4.2.3. Apparatus 4.2.4. Test Solutions and Procedure 4.2.5. Sampling 4.2.6. HPLC 4.2.7. DOC Measurement
4.3. Results and Discussion 4.3.1. Blank and Control Samples 4.3.2. Nitrobenzenesulfonates 4.3.3. Naphthalenesulfonates
5. Determination of Aromatic Sulfonates in River Waters and
75
75 79 79 79 80 82 84 84 85 86 86 86 95
Leachates 105
5.1. River Waters 5.2. Leachates from Waste Dump Sites
6. Conclusions and Outlook
References
Appendix
105 108
111
113

Zusammenfassung Substituierte Benzol- und Naphthalinsulfonate sind gut wasserlösliche,
anionische Verbindungen mit breiter Anwendung in der chemischen, pharmazeutischen und textilverarbeitenden Industrie. Neben ihrem Ein-satz als Reaktanden in chemischen Synthesen finden sie auch Verwendung als Textilhilfsmittel (Dispergatoren, Benetzungsmittel, Oxidationsmittel, hydrotrope Mittel, Reservierungsmittel) und als Betonzusatzstoffe (Beton-verflüssiger). Über die Abwässer gelangen sie schliesslich in industrielle oder kommunale Kläranlagen.
Im Gegensatz zu anderen anthropogenen organischen Verbindungen (zB. LAS, EDTA, NTA) existieren kaum Studien über das Verhalten von Benzol- und Naphthalinsulfonaten in der Abwasserreinigung. Auf Grund der guten Wasserlöslichkeit und des xenobiotischen Charakters musste man aber davon ausgehen, dass aromatischen Sulfonate weder mechanisch noch biologisch leicht eliminierbar sind.
Um dieser Frage auf den Grund zu gehen, wurde eine Festphasenex-traktionsmethode entwickelt, mit deren Hilfe Benzol- und Naphthalinsul-fonate aus industriellen Abwässern angereichert werden konnten. Als Adsorbent diente eine graphitisierte Aktivkohle (Carbopack B), die an ihrer Oberfläche positiv geladene Oxoniumgruppen aufweist. Diese Kom-bination erwies sich als sehr selektiv für aromatische Anionen. Die De-sorption der Sulfonate erfolgte mittels einer Lösung von 50 mM Ammo-niumacetat in Methanol und Methylenchlorid. Die einzelnen Verbin-dungen wurden mit Umkehrphasen-Ionenpaar-Flüssigchromatographie getrennt und mit UV- und Fluoreszenzdetektion bestimmt. Mit Ausnahme einiger Aminoverbindungen wurden dabei Wiederfindungen von > 90% mit Standardabweichungen von 0.2-5.0 % erzielt. Die Detektionsgrenzen für Proben von 100 mL lagen zwischen 0.1 und 1.0 µg/L bei UV-Detektion und < 0.1 µg/L bei Fluoreszenzdetektion. Höhermolekulare Verbindungen und Huminsäuren wurden nicht desorbiert.
Die Anwendung dieser Methode auf Rohabwässer der kommunalen Kläranlage von Herisau führte zur Identifizierung von 6 Benzol- und 9 N aphthalinsulfonaten, die aus drei lokalen, textil veredelnden Betrieben stammten. Die Identifizierung erfolgte mittels UV-Spektren, Retentions-zeitenvergleich und Massenspektren. 3-Nitrobenzolsulfonat, die mit bis zu

5 mg/L bei weitem höchstkonzentrierte Verbindung, und die Naphthalin-monosulfonate wurden zu > 98 % eliminiert. Die Elimination von Naph-thalindisulfonaten lag zwischen 5 % (Naphthalin-1,5-disulfonat) und 96 % (Naphthalin-1,6-disulfonat). Hohe regenbedingte Abwasserflüsse und län-gere produktionsbedingte Unterbrüche in der Sulfonatzufuhr (Ferien) führten jedoch zu einer drastischen Verminderung der Eliminationsleis-tung. Der Umstand, dass keine Adsorption der untersuchten Verbindun-gen an Schlammpartikel beobachtet wurde, deutete darauf hin, dass biolo-gischer Abbau für die beobachtete Elimination verantwortlich war.
Die Resultate von Bioabbautests (OECD 302B) mit Belebtschlamm aus der Kläranlagen von Herisau stimmten weitgehend mit den Beobachtun-gen aus den Feldstudien überein. Vorallem die unterschiedliche Abbau-barkeit der verschiedenen Naphthalindisulfonat Isomeren konnte klar re-produziert werden. Der Belebtschlamm aus der Kläranlage Zürich-Glatt hingegen war wie erwartet nicht an aromatische Sulfonate adaptiert. Dennoch wurde auch hier in einigen Fällen nach längerer Adaptationszeit ein Abbau beobachtet, was darauf hindeutete, das das Potential zum Ab-bau von gewissen Benzol- und Naphthalinsulfonaten vorhanden war.
Die Ergebnisse dieser Arbeit geben keinen Anlass, die aus industriellen Punktquellen stammenden Benzol- und Naphthalinsulfonate als vordring-liches Umweltproblem zu betrachten. Die unter Anwendung der hier beschriebenen Analytik in Sickerwässem von Bauschuttdeponien gefun-denen Naphthalinsulfonate mögen eine weit grössere Bedrohung für die aquatische Umwelt darstellen, speziell in Gegenden mit ausgedehnte Grundwasservorkommen.

Abstract Substituted benzene- and naphthalenesulfonates are highly water soluble
anionic compounds that are widely used in chemical, pharmaceutical and textile industries. They are applied as reactants in chemical syntheses but also as textile auxiliaries (dispersants, wetting agents, oxidants, hydro-tropic agents, reservation agents) and concrete admixtures (plasticisers). After use, aromatic sulfonates are discharged to either industrial or muni-cipal sewage treatment plants (STP).
In contrast to other anthropogenic organic compounds (e.g„ LAS, EDTA, NTA), data on the behaviour of benzene- and naphthalenesul-fonates during sewage treatment are very scarce. The high water-solubil-ity and the xenobiotic character indicate that aromatic sulfonates might not be readily eliminated by either mechanical or biological sewage treatment.
To investigate the fate of aromatic sulfonates during sewage treatment, a solid-phase extraction method for the enrichment of small benzene- and naphthalenesulfonates from industrial waste waters was developed. A gra-phitized carbon black (Carbopack B) with positively charged oxonium groups was used as an adsorbent. The graphite structure and anion ex-change sites make Carbopack B a very selective adsorbent for aromatic anions. Desorption of sulfonates was achieved with 50 mM ammonium acetate in methanol/dichloromethane. Reversed-phase ion-pair liquid chromatography with UV and fluorescence detection was used for sepa-ration and quantification. With the exception of some amino substituted compounds recoveries were generally >90% with relative standard devia-tions of 0.2-5.0% for replicate analyses. The detection limits for 100 mL samples were between 0.1 and 1.0 µg/L with UV detection and < 0.1 µg/L with fluorescence detection. Higher molecular weight compounds, es-pecially humic substances were nearly absent in the final extracts.
By applying this new method, 6 benzene- and 9 naphthalenesulfonates were found in raw waste waters from the municipal STP Herisau (Switzerland) which receives waste waters from three textile manufacturing plants. The sulfonates were identified by UV spectra, re-tention times and mass spectra. 3-Nitrobenzenesulfonate was found as a major pollutant in concentrations of up to 5 mg/L. Elimination of nitro-
benzene- and naphthalenemonosulfonates was >98%. Naphthalenedisulfo-nates had elimination rates between 5% (naphthalene-1,5-disulfonate) and 96% (naphthalene-1,6-disulfonate). However, high waste water flows (due to rainy weather) and longer periods with no sulfonate input (due to intermissions of work in the industry) drastically reduced the elimination efficiency. The fact that no adsorption of aromatic sulfonates to suspended matter was observed, indicated that the elimination must have been due to biodegradation.
The results obtained from biodegradation batch tests (OECD 302B) with activated sludge from the STP Herisau were in good agreement with the observations made in the field studies. In particular, the differences in the degradability of naphthalenedisulfonate isomers were clearly repro-duced. In contrast, the activated sludge from the municipal STP Zurich-Glatt (Switzerland) was shown to be unadapted to aromatic sulfonates. In some cases, however, elimination was observed after longer adaptation phases indicating that the potential to eventually degrade aromatic sul-fonates was present.
The results from Herisau suggest, that benzene- and naphthalenesul-fonates originating from industrial point sources are not an environmental topic of high priority. In contrast, by applying the analytical method to leachates from construction waste dump sites, several naphthalenesul-fonates were found. This might be a more immediate threat for the aquatic environment, especially for ground waters.

Abbreviations
3-ABS ASIM AST BS BW Cs, Cis CF-FAB COD Cp-B DAD DAS disa DNS DOC EAWAG
ECo, ECso
EDTA EMPA
EPA ESI FWA GC HPCE HPLC IPE Kow LAS LC LDso MS N-1-S N-2-S N-1,5-dS
3-aminobenzenesulfonate activated sludge simulation activated sludge treatment benzenesulfonate Bachwis (name of the STP at Herisau) octyl-, octadecyl coated silica gel continuous-flow fast atom bombardment chemical oxygen demand Carbopack B diode array detector 4 ,4' -diaminostilbene-2,2' -disulfonate disulfonate 4,4' -dinitrostilbene-2,2 '-disulfonate dissolved organic carbon Swiss Federal Institute for Environmental Science and Technology effect concentration at which 0% resp. 50% of the organisms are affected ethy lenediaminetetraacetic acid Swiss Federal Laboratories for Materials Testing and Research Environmental Protection Agency electrospray interface fluorescent whitening agent gas chromatography high performance capillary electrophoresis high performance liquid chromatography ion-pair extraction octanol/water partitioning coefficient linear alkylbenzenesulfonate liquid chromatography lethal dosis for 50 % of the test population mass spectrometry naphthalene-1-sulfonate naphthalene-2-sulfonate naphthalene-1,5-disulfonate

N-1,6-dS N-1,7-dS N-2,6-dS N-2,7-dS 2-NBS 3-NBS 4-NBS NTA OECD
PKAS PLRP-S PROSPEKT RP RSD sa SAMOS
SDU STP TBA-(HS/Br) UV
naphthalene-1,6-disulfonate naphthalene-1, 7-disulfonate naphthalene-2,6-disulfonate naphthalene-2, 7-disulfonate 2-nitrobenzenesulfonate 3-nitrobenzenesulfonate 4-nitrobenzenesulfonate nitrilotriacetic acid Organisation for Economic Co-operation and Development polycondensated aromatic sulfonates styrene-divinylbenze copolymer programmable on-line solid-phase extraction reversed-phase relative standard deviation sulfonate system for automated measurement of organic contaminants in surface water solvent delivery unit sewage treatment plant tetrabutylammonium - (hydrogen sulfate/bromide) ultraviolet visible

1. GENERAL INTRODUCTION 1.1. Types and Applications of Aromatic Sulfo-
nates
Organic sulfonates are rather rare among the naturally occurring com-pounds. The most important aliphatic sulfonates are taurine (1, Table 1.1), cysteinsulfonic acid (2) (Furukawa and Fujihara 1991) and 6-sulfo-quinovone. The latter is found as sulfoquinovosyl diacylglycerol (3) in thylakoid membranes (10%) of chloroplasts (Voet and Voet 1995). Aeruginosine B is the only sulfonated aromatic compound which has been observed in nature so far.
The ability of the sulfonate group to increase the solubility of organic molecules in aqueous phases made sulfonation a very important industrial process. The sulfonate group is relatively easy to introduce in aromatic systems by electrophilic substitution using either concentrated sulfuric acid or oleum (7-8% S03 in H2S04)(Morrison and Boyd 1986). As a consequence, aromatic sulfonates are widely used in industrial processes as well as in consumer products. Linear alkylbenzenesulfonates (LAS) (4) with a worldwide consumption of 2.4 million tons in 1992 (de Almeida et al. 1994) are presently the most important surfactants in laundry and cleaning products. In addition, most laundry detergents contain about 0.15% (w/w) fluorescent whitening agents (FWA) which are based on sulfonated stilbenes (5) (Poiger et al. 1993).
A wide variety of substituted benzene- and naphthalenesulfonates are used in the chemical industry, especially in the production of pharmaceu-ticals and dyes. 4-Amino-5-hydroxynaphthalene-2,7-disulfonate (German: H-Säure) (6), 3-aminonaphthalene-1,5-disulfonate (7), and 3,4-diamino-naphthalene-l-sulfonate (8) are currently tested with respect to inhibitory effects on HIV-1 and HIV-2 induced cytopathogenicity in MT-4 cells (Mohan et al. 1991). 7-Amino-4-hydroxynaphthalene-2-sulfonate (Ger-man: 1-Säure) (9), 4-aminobenzene- (10) and 4-aminonaphthalenesulfona-te (11) are examples of commonly used precursors of mono- and diazo-chromophores in acid, direct, and reactive dyes (Rys and Zollinger 1982).
A wide range of sulfonated polyphenols (12) are also employed in the tanning industry as dispersants, wetting and suspending agents (Reemtsma

2
1994; Reemtsma et al. 1993). About 10'000 t/y of oligo- or polymeric sulfonated naphthalene-formaldehyde condensates (13) and sulfonated melamine-formaldehyde condensates (14) are applied as superplasticisers in concrete (Dodson 1990; Ochs and Gälli 1995). The production of 1 t of the explosive trinitrotoluene (TNT) is reported to yield about 50 kg dinitrotoluenesulfonates (15-17) as waste products (Holzstein 1991).
Different aromatic sulfonates are used in the textile industry as dye bath and textile auxiliaries (Chwala and Anger 1977; Shore 1990): cumene-4-sulfonate (18) and naphthalene-2-sulfonate (19) serve as hy-drotropic agents enhancing the solubility of non- or only slightly water soluble dyes. Complex condensation products of aromatic sulfonates with formaldehyde are used as dispersants, dye retardants and in several other applications. 3-Nitrobenzenesulfonate (3-NBS) (20) is added to most pro-cesses involving reactive dyes as a mild oxidizing agent to prevent reduction of either the tissue or the dye.
Table 1.1. Structures of some naturally occurring sulfonates and some of the most important anthropogenic aromatic sulfonates.
application
naturally occurring compounds
surfactants (LAS)
fluorescent whitening agents
HOOC-fHCH2-S03-NHa +
2
structure
?Oa-QA OH
R = diacylglycerol
3

Table 1.1. (continued)
application
pharrnaceutical industry
dye stuff production (eg. azo dyes)
tannery industry (wetting and suspending agents)
concrete admixtures
3
structure
6 8
9 10 11
l~NH~~-l™ l oo-1 ( superplasticisers) H· -00-·CH2- ~N
NH CH2S03- n n = 1-10
13 14
waste products of CH3
qN~ CH3
TNT production 02N* 02Nl():::N02
h SOa- SOa- h S03-N02 N02
15 16 17
textile auxi!iaries 2- 0: roSOa-h N02
18 19 20

4
1. 2. Some lmportant Properties of Aromatic Sulfonates
Sulfonic acids constitute the most strongly acidic class of uncharged organic compounds. Different approaches have been undertaken to determine the equilibrium constants of sulfonic acids. Although the resulting pK3 values are quite different depending on the method of determination, they are generally well below -2. Some pK3 values tabulated by Steward are shown in Table 1.2. These values are in the same order of magnitude as pure sulfuric acid. As a consequence, organic sulfonic acids occur in natural aqueous systems exclusively in the sulfonate form. Therefore, the term "sulfonate" is used instead of "sulfonic acid" throughout this study.
Because of the anionic character, the octanol/water partitioning coefficients (Log K0 w) of the pure benzene- and naphthalenesulfonic acids are well below 2 (Greim et al. 1994). Some Log Kow values are listed in Table 1.2. However, these values may change by several orders of magnitude depending on the pH and the ionic strength.
Table 1.2. pK3 and Log K0 w values of some aromatic sulfonic acids
compound pKa• Log Kowb
benzenesulfonic acid - 2.8 4-methylbenzenesulfonic acid - 2.7 0.934 4-nitrobenzenesulfonic acid - 3.8 3-nitrobenzenesulfonic acid - 2.61 3-aminobenzenesulfonic acid - 3.4 naphthalene-2-sulfonic acid - 0.94 6-aminonaphthalene-1,3-disulfonic acid - 1.6 4-amino-5-hydroxynaphthalene-2, 7-disulfonic acid - 2.3 sulfuric acid - 3.0
a (King 1991), b (Greim et al. 1994) no information about pH and ionic strength
Benzene- and naphthalenesulfonates were reported to be of low sys-temic toxicity and neither mutagenic nor carcinogenic effects were ob-served (Greim et al. 1994). LDso values for rats were mostly in excess of

5
5000 mg/kg body weight (eg. 3-NBS). However, almost nothing is known about chronic and reproductive toxicity. The former is expected to be small due to the low tendency of highly water soluble compounds to ac-cumulate in living organisms. Only few data exist about the ecotoxicologi-cal properties of aromatic sulfonates: the acute toxicity to fish and bacte-ria, based on different methods of testing, was higher than 100 mg/L for some benzene- and naphthalenesulfonates and the acute effect concentra-tions (ECso) for daphnia and algae were in the same order of magnitude. In Table 1.3 some toxicity data for selected benzene- and naphthalenesul-fonates are listed (Greim et al. 1994).
Table 1.3. Toxicity data of some benzene- and naphthalenesulfonates
acute toxicity chronic toxicity toxicity to compound ratLD50 toxicity to fish bacteria
mg/kg b. w. mg/L mg/L
S03H no toxicolo-
0 >5000 gical effect, LCo96h ECo rat > 500 > 2500
CH3 28 d
oaH LCo48 h
12300 no data 1000 ECo24h LCso 96 h 10000
NH2 100.4
SOaH
6NH2 5200 no data LC50 96 h ECso 17 h
> 10000 7000
S03H LC50 96 h
6N02 > 5000 no data > 500 ECso 17 h
LCso 24 h > 10000 1350
SOaH
CO 1400 no data LCso 96 h EC50 17 h "" 100-500 91
H2NWS03H 1 "" ""
> 5000 no data LCo96h ECo24h OH 1000 1000

6
1. 3. Present Knowledge about the Fate and Be-haviour of Aromatic Sulfonates in the Aquatic Environment.
Up to now most research on the occurrence and the fate of sulfonated aromatic compounds has been focusing on LAS (Brunner et al. 1988; Di Corcia et al. 1991; Di Corcia et al. 1994; Field et al. 1992; Giger et al. 1987; Moreno et al. 1994), and most recently on fluorescent whitening agents (Poiger 1994; Poiger et al. 1993) due to their widespread applica-tion in laundry detergents. The fact that LAS occurred in relatively high amounts in municipal waste waters (mg/L) has made them an environ-mental topic.
In contrast, little research has dealt with the more hydrophilic benzene-and naphthalenesulfonates. At least three reasons may account for the Jack of attention these compounds have received up to now: (1) until recently, the analytical tools for the qualitative and quantitative determination of highly water-soluble aromatic anions at the trace level have not been available; (II) the ecotoxicity of aromatic sulfonates was reported to be low (see 1.2); (III) except for LAS, no aromatic sulfonates are listed among the 600 chemicals in the German list of water polluting chemicals (Katalog wassergefährdender Stoffe 1988) or in the EEC and EPA pri-ority pollution lists.
A large number of Swiss and German chemical industries discharge their waste waters to the river Rhine. Therefore, especially in the Nether-lands and in Germany where river Rhine water and bank filtrates are used for drinking water production, there has been an increasing interest in the determination of very water soluble compounds. In cooperation with Ciba-Geigy (Grenzach, Germany) S. Schullerer from the Engler Bunte Institute (Karlsruhe, Germany) developed an analytical method for the enrichment and the separation of aromatic sulfonates by solid-phase extraction and high-performance liquid chromatography (HPLC), respec-tively (Schullerer et al. 1990; Schullerer et al. 1992). At Grenzach, one of Ciba-Geigy's main production sites for stilbene based optical brighteners, large amounts of sulfonated precursors and byproducts were discharged into the river Rhine prior to the introduction of the wet oxidation in 1990 ( e.g., 4,4'-dinitrostilbene-2,2'-disulfonate (DNS), 4,4'-diaminostilbene-2,2'-disulfonate (DAS), 4-nitrotoluene-2-sulfonate). As a consequence,

7
several aromatic sulfonates, mainly naphthalenesulfonates, DNS, DAS and 2-hydroxy-4,6-bis-( 4-sulfanilo )-1,3,5-triazine were found in river Rhine water as well as in the bank filtrates (Lange et al. 1995; Schullerer et al. 1990). In addition, mono- and disulfonated naphtalenes were observed in samples from the river Elbe (Germany) and the river Bormida (ltaly) (Fichtner et al. 1995; Zerbinati et al. 1994). Concentrations were generally well above the limiting value for single pesticides (0, l µg/L).
As a consequence, several authors investigated the effect of different steps of modern drinking water production (iron and manganese removal, ozonation, activated carbon filtration) on aromatic sulfonates (Bastian et al. 1995; Fichtner et al. 1995; Johannsen et al. 1994; Lange et al. in press; Lange et al. 1995). lt was shown that not all water purification plants are able to eliminate aromatic sulfonates from drinking water. In particular naphthalene-1,5-disulfonate and naphthalene-1,3,6-trisulfonate are quite persistent and hence relevant to waterworks and drinking water agencies.
2.4. Motivation and Goals of this Work
The German textile industry uses about 12'000 t of dye stuff and an estimated 100'000 t of textile auxiliaries annually (Enquete-Kommission "Schutz des Menschen und der Umwelt" des Deutschen Bundestages 1995). In 1987 the textile finishing industry generated about 47 million cubic meters of waste water thus making it the most important industrial discharger in Germany. The COD (chemical oxygen demand) emission of the textile finishing industry in 1979 was estimated to be about 97'000 t (DECHEMA 1981). The textile auxiliaries in particular will end up almost completely in the waste waters; only few textile manufacturing plants have their own waste water treatment plants. In Germany 95% of the textile finishing industry discharges their partially treated process waters (e.g., after precipitation of dyes, neutralisation, flotation, filtra-tion) through the sewerage to municipal sewage treatment plants.
The high water solubility and the xenobiotic character of benzene- and naphthalenesulfonates indicate that these compounds might not be readily eliminated in mechanical-biological sewage treatment plants. In fact Reemtsma et al. (1993, 1994) observed no elimination of sulfonated

8
polyphenols and naphthalenesulfonates from tannery waste waters. Lange et al. (1995) found up to 3.2 mg/L naphthalene-1,5-disulfonate and 5.7 mg/L DNS in effluents of industrial sewage treatment plants along the river Rhine in Germany. Nevertheless, studies of the fate of aromatic sulfonates in sewage treatment plants are scarce. Kölbener et al. (1994) reported complete biodegradation of 3-NBS with industrial sewage sludge in a laboratory trickling filter, but little information exists about how 3-NBS, which can occur in concentrations up to 360 mg/L in process waters (DECHEMA 1981), actually behaves in the mechanical-biological sewage treatment. Although several studies dealt with the elucidation of biodegradation pathways for benzene- and naphthalenesulfonates under laboratory conditions (see Chapter 4), almost nothing is known about how the sulfonate degrading microorganisms behave in the complex envi-ronment of a sewage treatment plant.
Therefore, the main goal of this work was, to investigate whether mu-nicipal sewage treatment plants are able to cope with benzene- and naph-thalenesulfonates originating from industrial waste waters. In contrast to earlier laboratory scale experiments, a major part of this work was carried out in a real sewage treatment plant. However, the pre-existing analytical methods were neither selective for aromatic anions nor suited for the enrichment of the most hydrophilic benzenesulfonates (see Chapter 2.1). Hence, as a conditio sine qua non, a new analytical method for the selective extraction and enrichment of aromatic sulfonates from highly polluted waste waters had to be developed. The whole work was structured in three parts with the following questions and objectives:
1 . Analytical methods: A new solid-phase extraction method had to be developed that, in contrast to earlier work, should allow selective extraction of even the very water-soluble hydroxy- and aminobenzenesulfonates from complex waste water matrices. Extensive elimination of the interfering matrix, in particular the humic substances, was required to achieve optimum chromatographic separation and low detection limits. With respect to a subsequent LC-MS application, the final extract had to be free of non volatile ion-pair reagents such as tetrabutylammonium (TBA).

9
2. Field studies in a waste water treatment plant: The analytical method should be applied to waste waters from a municipal sewage treatment plant which is connected to the textile manufacturing and finishing industry. The identity and the concentration of the occur-ring benzene- and naphthalenesulfonates should be determined by means of retention times, UV spectra and mass spectra. Mass balances should show how effectively aromatic sulfonates are eliminated during mechani-cal-biological sewage treatment and how strongly the elimination depends on waste water flow and acclimation of the activated sludge. lt should also be assessed whether the aromatic sulfonates are eliminated by adsorption and sedimentation or by biodegradation.
3. Laboratory experiments: Based on the results of the field studies laboratory experiments should be carried out to reproduce the observed effects and verify the interpreta-tions (e.g., biodegradation tests with sludges from different sewage treat-ment plants).
At the end, the results will be used to assess the environmental relevance of aromatic sulfonates originating from industrial point sources. In addi-tion, it should be established whether the analytical method can also be applied to other environmental samples such as river waters, ground wa-ters and leachates from waste dump sites.

11
2 . ANAL YTICAL METHOD DEVELOPMENT
2.1. Introduction
Aromatic sulfonates are strong acids with pKa-values below -1 (King 1991) and are difficult to derivatise, especially when they carry other functional groups. Therefore, aromatic sulfonates are not easily amenable to classical GC methods. However, the rapid progress of HPLC technology in the last fifteen years has been very successful for the determination of organic anions. The introduction of the diode array de-tector (DAD) and electronic data handling systems allow the identification of aromatic compounds by their UV spectra. With a spectra library of reference compounds it is possible to distinguish even the very similar spectra of different naphthalenesulfonates. HPLC methods for the sepa-ration of aromatic sulfonates have been described by several authors. Apart from the methods based on anion exchange chromatography (Fritz and Gillette 1968; Kirn et al. 1992), the most generally used approach is ion-pair chromatography (for references see below).
By adding an ion-pairing reagent to the aqueous mobile phase, the aromatic sulfonates are retained and separated on silica gel based reversed-phase HPLC columns (Cis, Cs) using methanol or acetonitrile as organic eluant. Usually, tetrabutylammonium hydrogen sulfate (TBA-HS) is used as ion-pairing reagent (Bastian et al. 1994; Gutierrez et al. 1993; Jandera et al. 1983; Lagerström 1982; Lange et al. 1995; Prandi and Venturini 1981; Reemtsma and Jekel 1994; Schullerer et al. 1990) but also tetramethyl-, tetraethyl-, and tetrapropyl- (Jandera et al. 1983; Lagerström 1982) as well as cetyltrimethylammonium (Zerbinati et al. 1993; Zerbinati et al. 1994) have been employed. In addition, divalent cations such as hexamethonium and diaminohexane were tested as counterions (Petterson and Schill 1989).
Depending on the separation problem aromatic sulfonates can also be separated on reversed-phase columns using potassium phopsphate buffer solutions (Grossenbacher et al. 1986) or other inorganic salts (Jandera et al. 1980). More recent approaches to the separation of benzene- and naphthalenesulfonates are based on HPLC with a cyclodextrin bonded

12
phase (Wilder et al. 1993), ion-pair chromatography with styrene-divinylbenzene copolymer (PLRP-S) columns (Brouwer et al. 1992) and high-performance capillary electrophoresis (HPCE) (Brumley 1992; Burkinshaw et al. 1993; Chen and Pietrzyk 1993).
Aromatic sulfonate concentrations in most environmental water sam-ples are too low for direct injection into HPLC and therefore an enrich-ment step is required. Furthermore, elimination of interfering chemicals like humic substances and other higher molecular compounds is required in many cases to enhance chromatographic separation and column life time. Up to now only a few enrichment methods which are summarized in the following paragraph, have been reported.
Fritz et al. (Fritz and Gillette 1968) extracted aromatic sulfonates with Chromosorb W or Teflon that was previously treated with Alamin 336 (Tricaprylmethylammonium). The procedure is complicated, time consuming and not designed for samples with sulfonate concentrations of only some µg/L. Others reduced the sample volume by lyophilisation and subsequent dissolution in methanol which is also a very time consuming procedure that requires further sample clean-up steps (Brumley 1992; Kirn et al. 1992). Attempts to enrich aromatic sulfonates from environ-mental samples on ion-exchange resins have not been very successful. Although quantitative extraction was achieved, several compounds could not be desorbed any more (Bastian et al. 1994; Zerbinati et al. 1993).
Zerbinati and co-workers (1993) successfully extracted aromatic sul-fonates by applying a solution of cetyltrimethylammonium to a Cis solid-phase extraction (SPE) cartridge prior to extraction of the samples. A similar ion-pair SPE method was developed by Schullerer et al. (1990, 1992). Analogous to the ion-pair chromatography a reversed-phase Cw material is used as adsorbent and tetrabutylammonium bromide (TBA-Br) as ion-pairing reagent. Tue method is easy to handle, readily adaptable to on-line SPE-HPLC systems (Brouwer et al. 1992; Fichtner et al. 1995; Lange et al. 1995) and gives good results for naphthalenesulfonates and benzenesulfonates with nitro, chloro, and alkyl groups. However, apart from the fact that more hydrophilic benzenesulfonates (e.g. 4-hydroxy-benzenesulfonate) are not enriched, the ion-pair extraction is not very specific. Humic substances as well as nonionic polar and nonpolar com-pounds are also enriched and occur in the fractions subjected to HPLC

13
analyses. Moreover, the presence of nonvolatile TBA in the final extract is not favorable for potential LC/MS analyses.
Recently, Di Corcia and co-authors have published several applications of Carbopack B (Cp-B), a graphitized carbon black material, for the extraction of polar pesticides (Di Corcia and Marchetti 1991; Di Corcia et al. 1993) and linear alkylbenzenesulfonates (Di Corcia et al. 1991; Di Corcia et al. 1994) from aqueous samples. Cp-B offers a combination of both hydrophobic and anion exchange properties. Besides the hydropho-bic graphite structure Cp-B contains positively charged oxonium groups on its surface which act as anion exchange sites (Figure 2.1).
Figure 2.1. Oxonium moieties, responsible for the anion-exchange character of Carbopack B (Perst 1971).
In addition, Di Corcia et al. (1991) reported the presence of several other oxygen groups such as quinones, semiquinones, and hydroquinones on the Cp-B surface. lt is not definitely known whether the oxygen con-taining groups are part of the Cp-B surface structure or bound to large polycyclic molecules adsorbed on the Cp-B surface (Di Corcia et al. 1980). Regardless, the result is a combination of at least three different adsorption mechanisms; (1) anion exchange due to oxonium functions, (II) hydrophobic interaction between the graphite surface and the aromatic

14
structure of the solutes, and (III) hydrogen bridges between protonated functional groups (-OH, -NH2) of the solutes and carbonyl groups of Cp-B (or vice versa) (Figure 2.2). Due to the absence of apolar functional groups inorganic anions can only slightly compete for the adsorption sites which should be an advantage over conventional anion exchange phases.
1 2
0 Carbopack B
3
Figure 2.2: Combination of adsorption mechanisms on Carbopack B; (1) = ion exchange, (2) = dispersion, hydrophobic interac-tion, (3) = hydrogen bonding
In the method presented here, Cp-B has been used for the selective ex-traction of benzene- and naphthalenesulfonates from industrial waste wa-ter (Altenbach and Giger 1995). The potential of the combined anion exchange and hydrophobic mechanism was investigated with respect to the extraction of very hydrophilic amino- and hydroxybenzenesulfonates and the elimination of humic substances. Recoveries for several benzene- and naphthalenesulfonates as weil as -carboxylates have been determined. The extracts were separated by reversed-phase ion-pair chromatography and detected with UV detection.
Additional analytical methods that were not part of the method devel-opment are described in the Experimental Sections of the chapters in which they were applied (fluorescence detection, continuous-flow fast atom bombardment (CF-FAB) and electrospray (ESI) mass spectrometry, sludge extraction and on-line SPE/HPLC (SAMOS) in Chapter 3; dis-solved organic carbon (DOC) determination in Chapter 4).

15
2.2. Experimental Section
2.2.1. Chemicals and Reagents.
The graphitized carbon black (Carbopack-B, Cp-B) material, prepacked Cp-B (250 mg) and Cis (0.5g) solid-phase extraction cartridges were obtained from Supelco SA (Bellefonte, USA). Anion exchange cartridges were purchased from Varian (SAX), Waters Accell (QMA) and Analytichem International (NH2, PSA). The following compounds were kindly provided by Ciba-Geigy AG (Basle, Switzerland): ben-zenesulfonic acid sodium sald, 4-amino-, 3-amino-, 2-amino-, 4-hydroxy-, 4-carboxy-, 2-amino-5-nitro-, 3-carboxy-4-hydroxy-, 2-carboxy-5-nitro-, 2-amino-5-chloro-4-methylbenzenesulfonic acid, 2-amino-naphthalene-1,5-disulfonic acid disodium salt and 4-amino-5-hydroxy-naphthalene-2,7-disulfonic acid disodium salt. All other sulfonic and carboxylic acids used in this study were commercially available products of different quality. Stock solutions of all sulfonate and carboxylate standards were prepared by dissolving 25 mg in 25 mL water. In some cases several drops of 1 M sodium hydroxide were added to enhance the solubility. Reagent-grade dichloromethane, methanol, ammonium acetate, tetrabutylammonium hydrogen sulfate (TBA-HS) and bromide (TBA-Br), formaldehyde, and hydroxylamine sulfate were purchased from Fluka AG (Buchs, Switzerland). Methanol and acetonitrile for HPLC were obtained from Scharlau (Barcelona, Spain). Bidistilled water was used for all experiments.
2.2.2. Conventional Ion-Pair Extraction.
500 mg C1s-cartridges were washed and conditioned with 5 mL methanol and 10 mL bidistilled water. TBA-Br (1 mM) and sodium hy-drogen phosphate (2 mM) was added to the test solutions and the pH ad-justed to 6.5. The samples were passed through the cartridges at a flow rate of about 5 mL/min by means of a vacuum extraction box from J.T.Baker Inc. (Phillipsburg, USA). A detailed description of the appara-tus is given in 2.2.3. After extraction, the adsorbent was dried by blowing nitrogen through the cartridge for 15 min. The compounds were then eluted with 5-10 mL methanol. The eluates were evaporated on an alu-

16
minium heating block (50-60°C) under a gentle stream of nitrogen and the dry residues were dissolved in 1 mL of HPLC eluant A (see 2.2.5).
In an attempt to use anion exchange materials for further sample clean-up, the methanol eluates were passed through PSA, NH2, QMA, and Chromabond SB anion exchange SPE cartridges which were previously washed with 5 mL methanol. The aromatic sulfonates were then eluted with 5 mL 4 N hydrochloric acid/methanol (1:1, v/v). The eluates were evaporated to dryness in a Büchi Rotavapor (Flawil, Switzerland) and the residues were dissolved in 1 mL of HPLC eluant A.
2.2.3. Enrichment with Carbopack B.
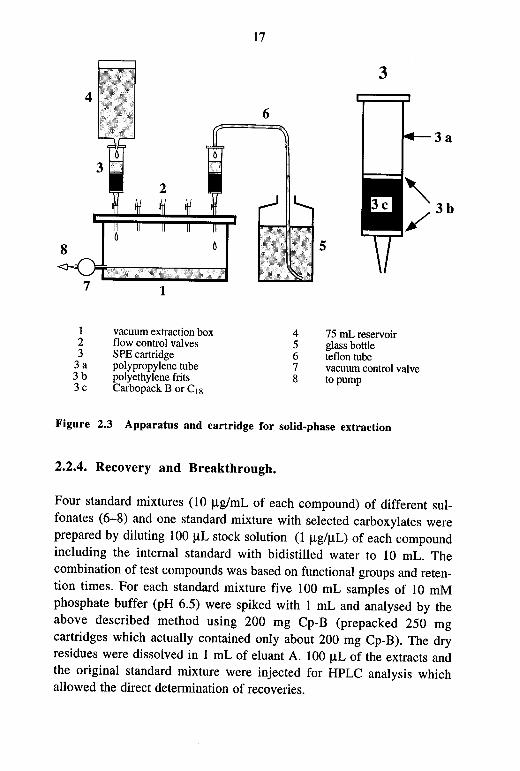
The Cp-B material (200-250 mg) was filled into 3 mL polypropylene cartridges (Supelco) and washed with 3 mL of the eluant system (see below) and 3 mL methanol. Further conditioning was performed using 20 mL ascorbic acid in 0.1 M hydrochloric acid (10 g/L) and 1 mL bidistilled water. In order to achieve optimum wetting of the Cp-B the solvents were allowed to pass through the cartridge without the use of vacuum. Although pH is not a critical factor between pH 2-8 all samples were adjusted to pH 6.5 to achieve well defined conditions throughout all experiments. The samples were filled into 75 mL polyethylene reservoirs connected to the extraction cartridge and then extracted with a flow rate of 5-10 mL/min using a vacuum extraction box from J.T.Baker. Larger samples (> 100 mL) were directly transferred via a Teflon tube from a glass bottle to the extraction cartridge. A picture of the apparatus and a solid-phase extraction cartridge is shown in Figure 2.3. Depending on the amount and the consistency of the Cp-B material, flow rates of up to 50 mL/min were possible without effects on recoveries. To avoid losses of amino compounds it was important that at the end of the extraction step the column was not dried at all. After washing with 1 mL bidistilled water, the aromatic sulfonates were eluted with 2 mL methanol and 5 mL 50 mM ammonium acetate in dichloromethane/methanol (80:20, viv). The combined organic eluates were evaporated on an aluminium heating block (50-60°C) under a gentle stream of nitrogen and the dry residues were dissolved in 1 mL of HPLC eluant A (see 2.2.5). All processes involving methanol and dichloromethane were carried out in a hood.
1 2 3
3a 3b 3c
vacuum extraction box flow control valves SPE cartridge polypropylene tube polyethylene frits Carbopack Bor Cis
17
6
4 5 6 7 8
5
3
75 mL reservoir glass bottle teflon tube vacuum control valve topump
Figure 2.3 Apparatus and cartridge for solid-phase extraction
2.2.4. Recovery and Breakthrough.
Four standard mixtures (10 µg/mL of each compound) of different sul-fonates (6-8) and one standard mixture with selected carboxylates were prepared by diluting 100 µL stock solution (1 µg/µL) of each compound including the internal standard with bidistilled water to 10 mL. The combination of test compounds was based on functional groups and reten-tion times. For each standard mixture five 100 mL samples of 10 mM phosphate buffer (pH 6.5) were spiked with l mL and analysed by the above described method using 200 mg Cp-B (prepacked 250 mg cartridges which actually contained only about 200 mg Cp-B). The dry residues were dissolved in 1 mL of eluant A. 100 µL of the extracts and the original standard mixture were injected for HPLC analysis which allowed the direct determination of recoveries.

18
Breakthrough curves for the enrichment with 250 mg Cp-B were de-termined by extracting 25, 50, 100, 250, and 500 mL of 1 mM phosphate buffer (pH 6.5) spiked with 1 mL of a standard mixture as described above. The same procedure was carried out for the ion-pair extraction method. 1 mM TBA-Br/2 mM phosphate buffer samples (pH 6.5) were extracted with 500 mg C 1 s-adsorbent. The effect of waste water matrices on the extraction efficiency was studied by spiking 25, 50, 100 and 250 mL of a sulfonate free influent sample from the sewage treatment plant (STP) Herisau (Sun, Jan 2, 1994; pH adjusted to 6.5) with 1 mL of the same standard mixture as above. Extraction was carried out with 250 mg Cp-B. Again, the dry residues were dissolved in 1 mL of eluant A and the final extract was compared with the original standard mixture.
2.2.5. Reversed-Phase Ion-Pair Liquid Chromatography.
Separation and detection were performed using a Hewlett-Packard model 1090L Series II HPLC system equipped with a diode array detector, an autosampler, a ternary solvent delivery system, a heated column compartment, and a 250 µL injection system. A conventional octadecylsilica column (Hypersil ODS, 5µm, 250 x 4 mm i.d. Knauer, Germany) with a 5 x 4 mm i.d. precolumn of the same type was used for separation. The system was operated at a temperature of 40 °C at a flow rate of l mL/min. The aqueous mobile phase (eluant A) was a 5 mM TBA-HS and 10 mM phosphate buffer solution adjusted with 1 M sodium hydroxide (NaOH) to pH 6.5. The organic modifier (eluant B) was either methanol, acetonitrile or a mixture of both depending on the specific separation problem. All solvents were continuously degased with a gentle stream of helium. Normally, a linear gradient starting with 5-20% B and an increase rate of about 1 %/min was used. After each injection the column was washed for 2 min with 75% B. The initial eluant composition was re-established by a 1 min linear gradient, followed by an equilibra-tion time of 10-15 min.
The eluant A with TBA and phosphate buffer is susceptible to biologi-cal growth, even if stored in brown-glass bottles at 4 °C. In addition, the eluant could not be stabilized by formaldehyde which led to massive peak-broadening of aminobenzenesulfonates in the HPLC chromatograms.

19
Therefore, eluant A was filtered every day through a 0.2 µm membrane filter (regenerated cellulose, Sartorius).
2.2.6. Detection and Quantitation.
The HPLC eluates were monitored by UV detection using a diode array detector (see 2.2.5). Wavelengths between 220 and 300 nm and a refer-ence wavelength of 450 nm were used for UV detection. Peak identifica-tion was performed by comparing the UV absorption spectra and reten-tion times of the samples with corresponding reference compounds. Diphenylamine-4-sulfonate was added as an internal standard to all sam-ples prior to the extraction step. The optimum UV detection wavelength of the internal standard is 294 nm.
Quantitation was performed by comparing the ratios of peak areas for the sulfonates and the internal standard (diphenylamine-4-sulfonate) in SPE extracts to that of standard solutions. Peak areas of extracts derived from recovery and breakthrough experiments could be directly compared with those of the original standard mixtures (see chapter 2.2.4). There-fore, all recovery and breakthrough values are listed in % relative to the peak areas of the aromatic sulfonates in the standard samples which were determined by three injections.

20
2.3. RESUL TS AND DISCUSSION
2.3.1. Ion-Pair Solid-Phase Extraction.
The hydrophobic Cis-material used in ion-pair extraction (IPE) was originally designed for the extraction of nonpolar compounds and is therefore not very specific for aromatic sulfonates. In particular, humic substances are highly enriched and elute during the same eluant conditions as most benzene- and naphthalenesulfonates thereby substantially raising the detection limits of the latter chemicals. Furthermore, the capacity factors of amino-, hydroxy- and carboxybenzenesulfonates are not suffi-ciently high for quantitative enrichment. Figure 2.4 shows breakthrough curves of benzene- and naphthalenesulfonates extracted from 1 mM TBA-Br solutions using 500 mg C1s-adsorbent. Only 4-chlorobenzenesulfonate and naphthalene-2-sulfonate were quantitatively enriched from samples of more than 250 mL. The amino- and hydroxybenzenesulfonates had break-through volumes of less than 50 mL.
100
90
80
70
~ 60
f 50
40
30
20
10
0 0 100 200 300 400 500
elution volume [mL]
___..,____ naphthalene-2-sa
---0- 4-Cl-benzene-sa
-e--4-CH3-benzene-sa
---0-4-COOH-benzene-sa --ts-- benzene-sa
--4-NH2-naphthalene-l-sa
---4-0H-benzene-sa
---o- 3-NH2-benzene-sa
--4-NH2-benzene-sa
Figure 2.4 Breakthrough curves of aromatic sulfonates (sa) derived from ion-pair extraction experiments with 1 mM TBA-Br solutions using 500 mg C18-cartridges. The samples were spiked with 10 µg of each compound.

21
Despite these shortcomings, ion-pair extraction is still the fastest and easiest method for the enrichment of naphthalenesulfonates and nitro-, chloro- and alkylbenzenesulfonates. Moreover, sulfonates with larger aromatic systems such as stilbenes or antraquinones have to be extracted using IPE (for explanation see 2.3.2). Requiring only methanol and water as solvents, IPE can easily be automated in an on-line SPE-HPLC system. An application of such a system is described in Chapter 3.
Anion exchange materials such as SAX, QMA, NH2 and PSA are sus-ceptible to high inorganic salt concentrations which makes them unsuit-able for waste water analysis. Nevertheless, the capacity of anion ex-change materials for sample clean-up in IPE was investigated. For this purpose the methanol eluates with the enriched sulfonates were passed through PSA-, NH2- and QMA-columns. No breakthrough of aromatic sulfonates was observed. However, disulfonated compounds could be only partially desorbed with 4M HCl in methanol, which was consistent with earlier experiments (Bastian et al. 1994; Zerbinati et al. 1993).
2.3.2. Solid-Phase Extraction with Carbopack B.
All benzene- and naphthalenesulfonates could be extracted from water samples by solid-phase extraction with Cp-B (for recoveries see 2.3.3). However, the ability to subsequently elute them from the extraction car-tridge strongly depended on the type and amount of functional groups and the size of the aromatic structure. Most benzene- and naphthalenesul-fonates were readily eluted with 50 mM ammonium acetate in dichloro-methane/methanol (80:20; viv). However, compounds with amino and hy-droxy groups which may undergo hydrogen bonding were more difficult to recover. In particular amino compounds were not desorbed at all from Cp-B cartridges which were dried with air after the extraction of the sample.
Di Corcia et al. (1991) reported reduced recoveries of pesticides with free amino groups such as metribuzin and chloridazon. Suspecting irreversible addition of the amino moiety to quinone groups present on the Cp-B, it was proposed to pretreat Cp-B with ascorbic acid to reduce the quinones to the corresponding hydroquinones. By following this course of action and not drying the Cp-B cartridge after the extraction, satisfactory results were achieved for sulfonates with only one amino or

22
hydroxy group. Nevertheless, compounds with more than one of these groups were still not successfully recovered even though no breakthrough was observed.
In order to investigate, whether irreversible addition of amino com-pounds took place, different attempts were made to saturate the Cp-B surface with amines. After conditioning Cp-B with O.lM HCl and ascor-bic acid in O.lM HCl (10 g/L), a solution of hydroxylamine sulfate was applied to the cartridge prior to sample extraction. In two other experi-ments the Cp-B was first oxidized with a Fe(IIl)Ch solution and then treated with hydroxylamine or ammonia. The qualitative results are presented in Table 2.1. lt can be seen that treatment with hydroxylamine did not significantly improve the recoveries of 3-amino-4-hydroxyben-zenesulfonate and 6-amino-1-hydroxynaphthalenesulfonate. Furthermore, after oxidation of Cp-B with Fe(III) even 3-aminobenzenesulfonate was not recovered. On the other band 3-nitrobenzenesulfonate was not affec-ted at all by these treatments. These findings indicate that the potential to form hydrogen bridges may decrease the recovery of aromatic sulfonates. Moreover, the reduction with ascorbic acid only partially eliminates the functional groups involved in hydrogen bonding with amines.
Table 2.1. Qualitative effectsa of different Cp-B pretreatments on the recovery of aromatic sulfonates (sa) with amino and hydroxy groups.
3-NH2-4-0H- 6-NH2-l-OH- 3-NH2-benzene-sa na12hthalene-4-sa benzene-sa
Vitamin Ch + ++ +++ HCl/NH20H ++ +++ Vitamin CI NH20H ++ + ++++ Fe(III) I NH20H Fe(III) I NH3 ++ +
a ( ++++) = recovery of 80-100%; ( +++) = 60-80%; ( ++) = 40-60%; (+) = 20-40%; (-) = 0-20% b 10 g/L ascorbic acid in O.IM HCI
3-N02-benzene-sa
++++ ++++ ++++ +++
++++
A comparison of the strengths of the different intermolecular forces may confirm this assumption. Hydrophobie interactions are in the order of some kJ/mol and the electrostatic interaction between alkyl ammonium

23
ions and a negatively charged mineral surface was shown to be in the or-der of 10 kJ/mol (Schwarzenbach et al. 1993). Both these interactions are strongly influenced by the elution solvent. Dichloromethane affects the hydrophobic interaction and anion-exchange and ion-pair formation with acetate and ammonium, respectively, breaks up the electrostatic interac-tion. Therefore, the formation of hydrogen bridges with binding forces of about 20 kJ/mol (Morrison and Boyd 1986) may significantly affect the partitioning of aromatic sulfonates between the Cp-B surface and the elu-tion solvent.
Molecules with larger aromatic structures such as stilbene- and anthra-quinonesulfonates could not be eluted from Cp-B making it impossible to analyse for sulfonated dyes or optical brighteners using this method. An overview of the structures and functional groups which can be eluted from Cp-B is presented in Figure 2.5.
so;
Q R
R = -CH3, -N02 ,-CI, -COOH, -OH, -S03H
Can be eluted without special pretreatment.
Can be eluted only after treat-ment with ascorbic acid and without drying after extraction.
Elution insufficient even after treatment with ascorbic acid.
Figure 2.5. Effect of structure and functional groups on the ability to elute aromatic sulfonates from Carbopack B.

24
On the other band, this restriction with respect to the molecular size allowed to almost completely remove interferences caused by humic sub-stances in environmental samples (Figure 2.6). Compared to the chro-matogram of the C1sffBA-extract (A), the characteristic hump formed by humic substances is nearly absent in the chromatogram of the Cp-B-ex-tract (B). A comparison with the standard chromatogram (C) shows that the spiked naphthalene-2-sulfonate is easily extracted in both cases. In contrast to the dark brown extracts of the IPE, the elimination of most higher molecular compounds leads to translucent yellow samples which can be injected directly into HPLC without further sample clean-up.
UV220nm
t 1
10 20 30 time [min]
2
2
40 50
Figure 2.6. Chromatograms of extracts from 1 L river water spiked with 1 µg/L 3-nitrobenzenesulfonate (1) and 1 µg/L naphthalene-2· sulfonate (2). The samples were extracted with (A) 1 g C1s-adsorbent, 5 mM TBA-Br and (B) 1 g Carbopack B. (C) standard solution.

25
In contrast to IPE with TBA and Cis in which the adsorbent is usually dried with air or nitrogen prior to elution, the Cp-B should not be dried at all. In particular, the recoveries of amino compounds were drastically reduced after drawing air through the extraction cartridge. Even by treat-ing the adsorbent with ascorbic acid, this effect could only be partially eliminated. Therefore, drying of the Cp-B with air was avoided and the residual water was displaced from the cartridge with 2 mL methanol fol-lowed by the elution solvent. However, if only sulfonates without amino and carboxy groups were the target analytes, then the adsorbent could be dried without negative effects on recovery.
Apart from dichloromethane several solvents and solvent mixtures were tested for the elution of aromatic sulfonates from Cp-B (Table 2.2). Neither methanol nor mixtures of 20% methanol and 80% ethyl acetate, acetone or diethyl ether successfully desorbed all the tested sulfonates. Hence, no alternative to the ecologically harmful and carcinogenic dichlo-romethane could be found.
Table 2.2. Recovery of selected aromatic sulfonates from Carbopack B by desorption with different eluants contalning 50 mM ammonium acetate.
recovery (%) compound A• ßb Cb Db 4-NH2-benzenesulfonate nd 43 nd 19 2-NH2-benzenesulfonate nd 87 90 77 4-0H-benzenesulfonate 64 80 61 60 4-COOH-benzenesulfonate 93 nd nd nd 3-N02-benzenesulfonate 59 0 98 0 4-N02-toluene-2-sulfonate 0 nd nd nd 2-NHi-naphthalene-1,5- nd 0 85 0 disulfonate Naphthalene-2-sulfonate 0 0 66 0 A methanol B methanol I ethylacetate (20:80, viv) c methanol I acetone (20:80, viv) D methanol I diethylether (20:80, viv) E methanol I dichloromethane (20:80, viv)
a Mean values were calculated from four determinations. b Values from one determination. c Mean values were calculated from fife determinations. nd: not determined
EC 66 98 87 97 101 nd 97
101

26
The effect of ammonium acetate in the eluant on the desorption of aro-matic sulfonates from Cp-B was investigated by washing the cartridges with pure methanol and methanol/dichloromethane (20:80; viv) after sample extraction. No desorption of sulfonates was observed after extrac-tion of spiked phosphate buffer samples. However, the high amount of dissolved organic carbon in waste waters reduced the capacity of the Cp-B which led to partial desorption of some benzenesulfonates without ammo-nium acetate in the eluant. Therefore, washing the cartridge with an organic solvent prior to elution is not recommended. The 2 mL methanol used to displace the water after the extraction should be combined with the final extract to avoid losses.
In the range of pH 2.4-8 no effects on recovery of aromatic sulfonates from 25 ml 10 mM phosphate buffer samples were observed (Figure 2. 7). Apart from the most hydrophilic benzenesulfonates all compounds tested could even be recovered at pH 10 without losses. However, to achieve reproducible conditions throughout the whole study all samples were adjusted to pH 6.5-6.6.
1 600 .•
500 ·-·-·-·~.
400 t--"--„--·--· 300 ·-·:::::-·--·
~--·
0 +----lf---+--+--+----l
4000
3000
2000 r-·-·--·-·-· 1000 ·--·--·--·--·--·
o I , , , , , 2.4 4 6 7 8 10
pH
-•-4-COOH-benzenesulfonate ---o--4-0H-benzenesulfonate -·-2-COOH-5-N02-benzenesulfonate -•-diphenylamin-4-sulfonate ~ 3-NOrbenzenesulfonate -·-4-NHrbenzenesulfonate --+--- benzenesulfonate
---0--4-Cl-benzenesulfonate -•-naphthalene-1-sulfonate -•-4-NHrnaphthalene-1-sulfonate
Figure 2.7. pH dependence on recovery of aromatic sulfonates extracted with Carbopack B.

27
2.3.3. Recovery and Breakthrough.
In Table 2.3. recovery values of several aromatic sulfonates and carbo-xylates are listed. The procedure is schematically shown in Figure 2.8. The values in column A were determined with 100 mL samples of 10 mM phosphate buffer containing 100 µg/L of each compound. Although the amount of adsorbent (200 mg) was relatively small, most sulfonates were recovered >90%. In paricular, the disulfonated compounds were almost quantitatively enriched and desorbed. In addition, it is shown that a wide range of aromatic carboxylates can also be enriched on Cp-B. As ex-plained above the amino-hydroxy-sulfonates could not be recovered successfully. No explanation for the low recovery of 2-carboxybenzene-sulfonate could be found. In the second column (B) some values for spiked 25 mL sewage treatment influent samples (400 µg/L) are given. The high relative standard deviations (RSD) of the amino compounds in the second series were due to different Cp-B qualities. The first three samples, extracted with prepacked 250 mg cartridges, showed 71 % recovery of 3-aminobenzenesulfonate (3-ABS) and a RSD of 12%, com-pared to 97% by extraction with two self-packed columns.
Sample Filtration and pH·A<IJustment
Washlng end Condltionlng or Carbopack·B
Sample Extraction Important: Column should not be dried
Ellmlnati on or Waier from Carbopack-B wlth Methanol
Elution wlth Ammonlumacetate In Methaml / Dlchloromethane
Solvent Evaporation wlth Nitrogen to DrynfSs
Dissolution In HPLC Solvmt
Figure 2.8. Extraction procedure with Carbopack B

28
Table 2.3. Recovery of aromatic sulfonates and carboxylates by ex-traction with Carbopack B. (A) 100 mL, 10 mM phosphate buffer (pH 6.5) with 100 µg/L of each compound; (B) 25 mL waste water (pH adjusted to 6.5) with 400 µg/L of each compound.
recove!Xa Ab Be
aromatic sulfonates % RSD % RSD benzenesulfonate 94.0 3.1 43.6 11.2 4-CH3-benzenesulfonate 100.5 0.3 102.0 1.1 4-NHz-benzenesulfonate 66.3 8.1 84.2 13.3 3-NHz-benzenesulfonate 75.0 7.7 81.6 20.6 2-NHz-benzenesulfonate 98.0 1.1 4-0H-benzenesulfonate 86.8 15.8 99.8 1.9 4-COOH-benzenesu!fonate 97.0 1.7 68.4 13.8 2-COOH-benzenesulfonate 27.1 7.2 3-NOz-benzenesulfonate 100.6 0.2 4-Cl-benzenesulfonate 98.2 4.2 2-NHz-5-NOz-benzenesulfonate 100.7 0.8 2-COOH-5-NOz-benezenesulfonate 98.9 1.6 3-COOH-4-0H-benzenesulfonate 100.0 0.2 2-NH2-5-Cl-4-CH3-benzenesulfonate 96.4 0.4 3-NHz-4-0H-benzenesulfonate 24.5 5.7 naphthalene-2-sulfonate 101.1 0.7 100.6 2.8 naphthalene-2, 7-disulfonate 92.5 1.4 naphthalene-1,3 ,6-trisulfonate 66.1 5.8 4-NHz-naphthalene-1-sulfonate 96.5 0.4 6-NHz- l-OH-naphthalene-4-sulfonate 13.6 4.7 2-NHz-naphthalene-1,5-disulfonate 96.5 0.3 2-NHz-naphthalene-4,8-disulfonate 84.0 11.7 l-OH-naphthalene-3,6-disulfonate 96.1 2.7 2-0H-naphthalene-3,6-disulfonate 94.3 4.8 4-NHz-5-0H-naphthalene-2,7- 2.0 0.5 disulfonate 4,5-diOH-naphthalene-2,7-disulfonate 4.7 5.9
aromatic carbox)'.lat1is benzoic acid 63.7 4.6 phthalic acid 102.1 1.3 3-NHz-benzoic acid 35.5 7.6 2-Cl-benzoic acid 70.4 5.3 2,4-diCI-benzoic acid 100.6 0.3 2,4-diCl-phenoxyacetic acid 100.8 0.6 phenylacetic acid 94.6 1.2 1-naphthylacetic acid 100.6 0.2
a Mean values were calculated from five determinations. b Compounds were investigated in five groups. c Cp-B from two different lots was used.

29
Extraction with Cp-B was highly reproducible. RSD values for easily extractable compounds (recovery >95%) were generally below 2%. The detection limits (signal to noise ratio, 3:1) in spiked test solutions varied between 0.1-1.0 µg/L, depending on the UV spectra of the analytes and the detection wavelength. By increasing the sample volume and the amount of Cp-B used for the extraction the detection limits can easily be improved. However, interferences from waste waters may heavily in-crease the detection limits.
The recovery of the internal standard diphenylamine-4-sulfonate was determined for 25 mL waste water samples. The recovery was >97% (n=4) with the RSD of 0.8%. The detection of diphenylamine-4-sulfonate was mostly unaffected by interferences owing to a strong UV maximum at 294 nm (Figure 2.9).
210 250 300 350 400 wavelenght [nm]
Figure 2.9. UV absorption spectrum and structure of diphenylamine-4-sulfonate.
To investigate the capacity of Cp-B breakthrough, experiments using 250 mg Cp-B and 1 mM phosphate buffer samples of 25-500 mL were carried out. The samples were spiked with 10 µg of each compound. The results are shown in Figure 2.10.A. Apart from the 4-aminobenzenesulfo-nate (4-ABS), none of the benzenesulfonates extracted with Cp-B showed a significant breakthrough up to a sample volume of 500 mL. Less polar compounds such as 3-NBS and naphthalene-2-sulfonate could be extracted out of even lL samples without significant losses. These results also confirmed that the reduced recoveries of 3-ABS and 4-ABS described in Table 2.3 were not due to breakthrough but to irreversible adsorption.

30
Figure 2.1 O.B shows breakthrough curves of several benzenesulfonates extracted from different volumes of untreated waste water spiked with 10 µg of each compound. The relatively high amount of dissolved organic carbon (DOC) in waste waters substantially reduced the capacity of Cp-B. Therefore, the volume of sewage treatment influent which can be extrac-ted with 250 mg Cp-B depends on the compounds of interest and should not exceed 50 mL for the most hydrophilic benzenesulfonates. Figure 2.10.B. also suggests that the previous hypothesis of the combination of adsorption mechanisms on Cp-B are consistent. Apart from a constant loss of 10-30% the aminobenzenesulfonates did not break through up to 100 mL. In contrast, the less hydrophilic benzene- and toluenesulfonates, which are not able to build hydrogen bridges, were affected earlier by the reduced number of adsorption sites. However, as will be shown in Chapter 3, in most cases it is unnecessary to enrich more than 25 mL of industrial waste water which should be possible without major losses.
110 100 90 80
~ 70 -; 60 ~ 50 !! 40
30 20 10
0 0
A 110
~100 ~~90
80 70 60 50 40 30 20 10
0 100 200 300 400 500 0
elution volume [mL]
B
50 100 150 200 250 elution volume [mL]
--II- benzenesulfonate (sa) -o-- 4-CH3-benzene-sa -+-- 4-0H-benzene-sa
--0--4-COOH-benzene-sa -----..-- 3-NH2-benzene-sa ~ 4-NH2-benzene-sa
Figure 2.10. Breakthrough curves of benzenesulfonates (10 µg of each compound) extracted with 250 mg Carbopack B from (A) 1 mM phosphate buffer solutions and (B) waste water from the municipal STP Herisau, Switzerland.

31
Di Corcia et al. (1991) suggested that inorganic anions should not compete with aromatic acids for the ion exchange sites on the Cp-B surface. Nevertheless, because of the high inorganic salt load of industrial waste waters, the influence of different inorganic anions on the extraction efficiency of benzene- and naphthalenesulfonates was evaluated. For this purpose 100 mL samples of 1 mM phosphate buffer (pH 6.5) were amended with different anions (10 mM), spiked with 100 µg/L of several aromatic sulfonates and extracted with 250 mg Cp-B. The results are pre-sented in Table 2.4. With the exception of the most hydrophilic amino-and carboxybenzenesulfonates no significant effects on the extraction ef-ficiency of sulfonates were observed. Nitrate appeared to be the most competitive anion, but the concentration in waste water was generally far below the concentration of the experiment. However, chloride, a major anion in industrial waste water (5-10 mM at Herisau), was almost non-competitive. The effect of higher salt concentrations (e.g., 0.5 M sea-water) was not investigated.
Table 2.4. Recovery of aromatic sulfonates from 100 mL 1 mM phos-l!hate buffer (l!H 6.5) and 10 mM inorganic anions.
f~!;;QV!m'. (%)a compound none phosphateb sulfate nitrate chlorideb
benzenesulfonate 99 57 /95 93 69 68/99 3-NH2-benzenesulfonate 80 24/ 61 56 35 39/83 4-NH2-benzenesulfonate 84 22 / 41 34 27 31/69 4-COOH-benzenesulfonate 99 69194 75 51 93 4-0H-benzenesulfonate 99 90 101 92 97 4-CH3-benzenesulfonate 99 99 101 101 100 4-Cl-benzenesulfonate 99 100 102 102 100 naphthalene-2-sulfonate 99 100 101 101 100 4-NH2-naphthalene- l-sulfonate 96 95 86 81 95 a Mean values were calculated from two determinations b Cp-B from two different lots were used. Values differing > 20% are listed separately
Quality differences between various lots of Cp-B may strongly affect the recovery of 3-ABS and 4-ABS. Changes in recoveries by as much as a factor of two between different lots were observed (Table 2.4). Presumably, the specific composition of oxygen functionalities on the Cp-B surface, which strongly affects the adsorption of amino compounds, varies between the different lots. The varying recoveries of 3-ABS and 4-
32
ABS (compare Table 2.3. and Figure 2.10.A) may also be explained by different Cp-B qualities. Therefore, the Cp-B has to be tested carefully with respect to the extraction of aminobenzenesulfonates. However, no significant effects of Cp-B quality on recovery were observed for the majority of aromatic sulfonates.
2.3.4. Reversed-Phase Ion-Pair Liquid Chromatography.
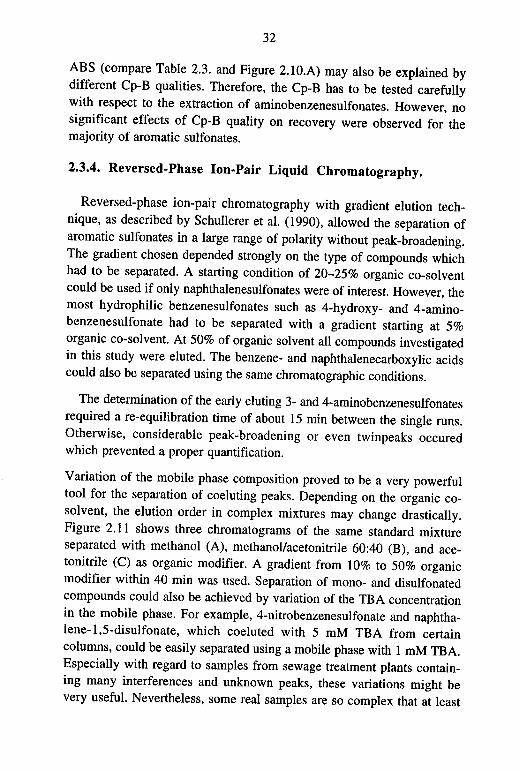
Reversed-phase ion-pair chromatography with gradient elution tech-nique, as described by Schullerer et al. (1990), allowed the separation of aromatic sulfonates in a !arge range of polarity without peak-broadening. The gradient chosen depended strongly on the type of compounds which had to be separated. A starting condition of 20-25% organic eo-solvent could be used if only naphthalenesulfonates were of interest. However, the most hydrophilic benzenesulfonates such as 4-hydroxy- and 4-amino-benzenesulfonate had to be separated with a gradient starting at 5% organic eo-solvent. At 50% of organic solvent all compounds investigated in this study were eluted. The benzene- and naphthalenecarboxylic acids could also be separated using the same chromatographic conditions.
The determination of the early eluting 3- and 4-aminobenzenesulfonates required a re-equilibration time of about 15 min between the single runs. Otherwise, considerable peak-broadening or even twinpeaks occured which prevented a proper quantification.
Variation of the mobile phase composition proved to be a very powerful tool for the separation of coeluting peaks. Depending on the organic co-solvent, the elution order in complex mixtures may change drastically. Figure 2.11 shows three chromatograms of the same standard mixture separated with methanol (A), methanol/acetonitrile 60:40 (B), and ace-tonitrile (C) as organic modifier. A gradient from 10% to 50% organic modifier within 40 min was used. Separation of mono- and disulfonated compounds could also be achieved by variation of the TBA concentration in the mobile phase. For example, 4-nitrobenzenesulfonate and naphtha-lene-1,5-disulfonate, which coeluted with 5 mM TBA from certain columns, could be easily separated using a mobile phase with 1 mM TBA. Especially with regard to samples from sewage treatment plants contain-ing many interferences and unknown peaks, these variations might be very useful. Nevertheless, some real samples are so complex that at least

33
two chromatograms using different conditions are necessary to isolate all the individual compounds of interest.
A
1 2 3
B
2
3
c 6
3 74
2 1
5 10
9
8
15
4 5
7 4
6 5
10
6
20 time [min]
9 10
8 7
9 10
8
25 30
Figure 2.11. Chromatograms of a standard mixture (10 µg/L of each com-pound) separated with (A) methanol, (B) methanoVacetoni-trile (60:40%), and (C) acetonitrile as organic eluant. (l) 3-aminobenzenesulfonate (sa), (2) 4-hydroxybenzene-sa, (3) 4-carboxy-benzene-sa, (4) 2-aminonaphthalene-1,5-disa, (5) 4-nitrobenzene-sa, (6) naphthalene-1,5-disa, (7) toluene-4-sa, (8) 2-hydroxynaphthalene-3,6-disa, (9) 4-chlorobenzene-sa, (10) naphthalene-2-sa.

34
With regard to a later HPLC/MS-application, different attempts were made to separate aromatic sulfonates with volatile buffers and ion-pairing reagents. Ammonium acetate was tested as an alternative to both phos-phate buffer and TBA. Figure 2.12. shows a chromatogram of a test mixture (9 components) separated with a 0.1 M ammonium acetate solu-tion (pH 6.8) and methanol as organic solvent. A gradient of 0 to 50% methanol in 40 min was used. Benzenesulfonates with nitro, chloro, and alkyl groups as weil as monosulfonated naphthalenes could be easily sepa-rated. But compounds with two acidic functional groups such as 4-car-boxybenzenesulfonate and naphthalenedisulfonates were not sufficiently retained for analyses in waste water samples. 4-Carboxybenzenesulfonate and naphthalene-1,5-disulfonate eluted almost with the solvent front.
1 2
1
3 !
1
4
5 UV254nm 6
7 8
9
1 1 1 1 1 1 1 1 1 1 1 1 1 1 1 1 1 1 1 1
5 10 15 20 25 time [min]
Figure 2.12. Chromatogram of a test mixture (10 µg/mL of each com-pound) separated with 0.1 M ammonium acetate and metha-nol as organic eluant. Gradient: 0-50% methanol in 40 min. Column: Hypersil ODS 250 x 4 mm, 5 µm particle size. ( 1) 4-carboxybenzenesulfonate (sa), (2) naphthalene-1,5-disa, (3) 3-amino-benzenesa, (4) naphthalene-1,6-disa, (5) 4-aminonaphthalene-1-sa, (6) 3-nitrobenzenesa, (7) 4-chlorobenzenesa, (8) 4-nitrotoluene-2-sa, (9) naphthalene-2-sa.
Although the peaks 1-4 are clearly separated in the standard chro-matogram, the early eluting anions like chloride, nitrate and excess

35
acetate in the waste water extracts would prevent a proper detection and quantitation of these peaks. Moreover, ammonium acetate absorbs UV light below 240 nm which results in a strong background absorption in the most important range of detection wavelengths (200-240 nm). Especially with gradient elution this leads to a drastic downward baseline drift.
Somewhat better results were achieved by using triethylamine as ion-pairing reagent. Figure 2.13. shows a chromatogram of a test mixture (6 compounds) separated with a solution of 0.03 M triethylamine in 1-2 M phosphate buffer (pH 6.7) under isocratic conditions. Again, compounds with two acidic groups were only poorly retained. In ion-pair chromatog-raphy with TBA the compounds 3-5 eluted after 2-aminobenzenesulfonate (peak 6). The triethylamine used was high purity grade (>99.5 %). However, it was far from being clean enough for gradient elution. Even in isocratic elution the baseline was not stable over a longer period of time.
4 UV220nm
t 2
3 1
s
6
2 4 6 8 10 12 14 time [min]
Figure 2.13. Chromatogram of a test mixture (10 µg/mL of each com-pound) separated with a solution of 0.03 M triethylamine in 0.1-0.2 M phosphate buffer (pH 6.7). Column: Hypersil ODS 250 x 4 mm, S µm particle size, isocratic elution. (1) 4-aminobenzenesulfonate (sa), (2) 3-aminobenzene-sa, (3) 5-ami-no-2-carboxybenzene-sa, (4) l-hydroxynaphthalene-3,6-disa, (5) 5-sulfosalicylate, (6) 2-aminobenzene-sa.

37
3. OCCURRENCE AND BEHAVIOUR OF AROMATIC SULFONATES IN SEW AGE TREATMENT PLANTS
3.1. Introduction
In the area of Herisau, the capital of the Swiss canton of Appenzell Ausserroden, there are three major textile manufacturing and finishing plants: Signer AG, Walser AG and Zilander AG. Processes like textile dyeing, printing and finishing are applied in all three factories. Conse-quently, their waste waters consist not only of dyes and dye stuff related compounds but also different dyeing assistants, dye fixing agents and other textile auxiliaries. Among others, the following products containing polycondensated aromatic sulfonates (PKAS) were used at Herisau in 1992 (Stern 1995): Dispersogen A (140 kg), Dispersogen P (1040 kg), Rucoegalisierer (550 kg), Mesitol HWS (210 kg), and Setamol WS (2700 kg). Unknown amounts of the 3-NBS containing Lyoprint RG (Ciba-Geigy) were applied as an oxidizing agent.
All three factories at Herisau have storage tanks (200-1000 m3) for re-taining the waste waters of about one workday. In each case the waste wa-ters are neutralised and in two factories further treatment by flocculation-sedimentation is carried out depending on the intensity of the waste water colouring. The waste waters are then discharged via the sewerage to the municipal sewage treatment plant (STP) to which 15'000 (1993) residents are connected. About 15-25% of the dry weather influent of the munici-pal STP Herisau originate from the local textile industry. This corre-sponds to about 40% of the total COD (chemical oxygen demand) and 33% of the total phosphorus (Community of Herisau 1994).
The receiving water at Herisau, the River Glatt (St.Gallen), has a flow on the same order of magnitude as the treatment plant effluent (about 6000 m3/d at dry weather). The dilution rate varies between 1:1 and 1:4 (waste water/river water). Thus a thorough treatment of the mixed municipal and industrial waste waters is required. In the early 1970's, a new Attisholz-type STP was built at Herisau which was specially designed

38
to deal with heavily loaded industrial waste waters. This type of treatment
plant was developed by Cellulose Attisholz AG, a Swiss cellulose manufacturer which was concerned with heavy carbon loads, especially
large amounts of ligninsulfonates, in its own waste waters. The main characteristic of the Attisholz-type STP's are two activated sludge treatments (AST) which are connected in series (Figure 3.1. For ade-tailed description see 3.2.1).
The relative small and manageable size of the STP Herisau was very suited for an investigation of the behaviour of aromatic sulfonates in mu-
nicipal waste water treatment. Based on the industrial activities described above, different benzene- and naphthalenesulfonates could be expected to be found in the waste waters at Herisau, in particular 3-nitrobenzene-sulfonate (3-NBS) from the textile printing activity and different naph-thalenesulfonates from PKAS applications. The scope of this study was to
establish how effectively a municipal STP eliminates the various aromatic sulfonates discharged from the textile industry.
Three processes determine the behaviour of organic waste water con-stituents in mechanical-biological sewage treatment: (1) gas exchange with the atmosphere, (II) adsorption to suspended matter (biological or min-eral) with subsequent sedimentation, and (III) aerobic and anaerobic biodegradation.
The first process can be neglected since aromatic sulfonates are
negatively charged ions and not volatile at all. This could be shown in the sample extraction procedure. No loss of aromatic sulfonates was observed
when the elution solvent was evaporated by blowing nitrogen into the sample vial (see 2.2.3). Even after the solvent evaporated no aromatic sulfonates were lost from the heated vial.
Elimination by adsorption to suspended matter might also be expected to be unimportant. Benzene- and naphthalenesulfonates are relatively small anions and their octanol/water partitioning coefficients (Log K0 w)
are well below 2 (Greim et al. 1994). Moreover, LAS with their large hydrophobic groups (C10-C13) were reported tobe only 10-15% removed by adsorption (Berna et al. 1989; Giger et al. 1987). However, ion-pair
formation with cations such as calcium might possibly increase the
tendency to adsorb, as was demonstrated in the case of fluorescent whitening agents (Poiger 1994 ).

39
The absence of anaerobic compartments in the STP Herisau eliminates anaerobic biodegradation as a potential elimination process. Therefore, if any elimination of aromatic sulfonates should be observed, aerobic biodegradation is the most likely explanation. A summary of the present knowledge about biodegradation of benzene-and naphthalenesulfonates is given in the introduction of Chapter 4.
In addition to physical and biological processes, some other factors might also influence the degree of the elimination of aromatic sulfonates in the STP Herisau. First, the amount of waste water varies between 4000 m3/d and 35'000 m3/d depending on the meteorological conditions. The theoretical retention times at dry weather flow of 10'850 m3 / d (Community of Herisau 1994) are about 90 min in the first aeration tank and about 70 min in the second tank. However, during thunder-showers and extended rain periods, retention times drop to 30 and 20 min, respec-tively, or even less. This could have a substantial effect on the elimination efficiency of the activated sludge treatment.
A second factor that had to be considered was the discontinuity of the industrial waste water input. The degradative capacity of a highly special-ized activated sludge depends strongly on the continuous feeding with the specific substrates. The sludge ages in the STP Herisau are about 4 days in the first and > 20 days in the second aeration tank. As a consequence, the population of highly adapted sulfonate degrading microorganisms sub-stantially decreases during intermissions of work in the textile industry (e.g., 4 week summer holiday). Thus, at the restart of industrial activity, the elimination rate of aromatic sulfonates would be low and a re-adapta-tion phase should be observable.
Consequently, several field studies bad to be carried out in the STP Herisau to establish the importance of the above mentioned processes and factors on the elimination of benzene- and naphthalenesulfonates during waste water treatment. The goal of these studies was to answer the following questions:
1. Which benzene- and naphthalenesulfonates occur in the raw waste water?
2. What are their concentrations in the influent and effluent?

40
3. What are the elimination rates of these compounds during the activated sludge treatment?
4. What are the major elimination mechanisms? 5. What are the effects of waste water flow and temperature on the
elimination of aromatic sulfonates? 6. How efficient is the elimination of aromatic sulfonates after several
days without industrial input following intermissions of work in the textile industry?

41
sewerage
sand and oil trap
sampling point A
sludge thickener 266 m3
sludge stabilisation tank 436 m3
first aeration tank 2 X 336 m3
first clarifier 2 X 1772 m3
sampling point B
second aeration tank 2 x272m3
recirculation
second clarifier 2 X 1772 m3
sampling point C
to receiving water
Figure 3.1. Scheme of the Attisholz type municipal sewage treatment plant at Herisau (AR, Switzerland).
42
3.2. Experimental Section
3.2.1. Description of the STP Herisau
In contrast to conventional municipal STP's, the Attisholz-type STP
Herisau has no primary settling tank but only a small sand and oil trap.
From there the waste waters pass through two activated sludge treatments
(AST) which are connected in series. Bach aeration tank is followed by a
clarifier. Part of the effluent from the second clarifier can be recircu-
lated. In this way, the nitrogen nitrified in the second aeration tank can be
partially eliminated by denitrification in the first aeration tank (Cellulose
Attisholz SA 1975). However, the Herisau waste water is relatively rieb in
oxygen due to turbulent waters in the sewerage and therefore, only about
25% of the nitrogen is eliminated by denitrification. Phosphate is
removed by addition of iron sulfate (Fe(Il)SÜ4) in the second aeration
tank. The treatment plant is divided into two identical lines which can be
operated independently. The raw sludge is collected in a thickener and
then transferred to a stabilization tank. No anaerobic sludge treatment is
carried out. In front of the first aeration tank (sampling point A) and
after the second clarifier (sampling point C) flow proportional samplers
are installed which collect 24 h composite samples for routine analyses
(COD, total phosphorus, ammonium, nitrite, nitrate). A scheme of the
STP Herisau together with its dimensions is shown in Figure 3.1.
3.2.2. Sampling
Composite samples (24 h) of the influents and effluents were collected
during several weeks by two routine sampling stations of the treatment
plant which worked in a flow proportional mode. The locations of these
sampling stations are indicated in Figure 3.1. Sampling was carried out on
July 12 to 18, 1993 (study BW2), August 16 to 21, 1993 (BW3) , January
3 to 7, 1994 (BW4), January 30 to February 5, 1994 (BW5), and August
15 to 20, 1994 (BW6). The samples were preserved by addition of 1 %
formaldehyde (37%, Fluka) and stored in polyethylene bottles at 4°C.
They were sent by mail to the laboratory at the end of the week.
2-h composite samples of influents (sampling point A), effluents
(sampling point C), and the effluents of the first clarifier (sampling point

43
B) were collected over a two day sampling period on August 15 and 16,
1994. Three fully automated samplers (Manning, USA) were used
working in time proportional mode. Every 30 min a 100 mL sample was
collected and always four samples were mixed in one bottle. Every two
hours a new bottle was automatically introduced. The samples were
preserved with 1 % formaldehyde and immediately filtered through a
glass microfibre filter (Schleicher & Schüell) and a 0.45 µm membrane
filter (Sartorius). Samples of 250 mL were then filled into dark
polyethylene bottles and stored at 4°C.
Sewage sludge was collected from the sludge stabilisation tank and the
first aeration tank and filled into polyethylene bottles. Formaldehyde
(1 %) was added for preservation and the samples were stored at 4°C.
The sludge from the stabilisation tank was frozen and freeze-dried. The
dried sludge was then homogenized and stored at 4 °C.
3.2.3. Sample Preparation
Waste Water
The waste water samples were adjusted to pH 6.5±0.1 with solid
sodium dihydrogen phosphate and lM sodium hydroxide. 25 mL of the
influent samples and 25 mL (BW4, BW5) or 100 mL (BW2, BW3, BW6)
of the effluent samples were then extracted with 250 mg Cp-B. The
method is described in detail in section 2.2.3. In addition, several samples
were extracted by ion-pair solid-phase extraction (see 2.2.2) in order to
check for sulfonates which are not determinable with the Cp-B method.
W aste water from Herisau was first screened for aromatic sulfonates
using an automated on-line trace enrichment-LC system for water
samples. This so-called SAMOS-LC system (system for the automated
measurement of organic contaminants in surface water) was developed in
the Rhine Basin Program and is now commercially available from
Hewlett-Packard. lt consisted of a solvent delivery unit (SDU, Spark,
Holland), a PROSPEKT system (programmable on-line solid-phase
extraction, Spark) and a HP 1090 HPLC system. The PROSPEKT system
bad three six-port valves which could be used for different extraction and
elution procedures. However, only one valve was used in this study. A
scheme of the SAMOS-LC system in the configuration used for sulfonate

44
analyses is shown in Figure 3.2. For ion-pair solid-phase extraction disposable 10 mm x 2 mm i.d. cartridges containing 20 mg of reversed-phase Cis material were used. These cartridges had already been used once by researchers of the DVGW Forschungsstelle at Karlsruhe (Germany) for analyses of River Rhine water (Lange et al. 1995). However, no memory effects were observed. The sample preparation and the extraction procedure were analogues to off-line ion-pair extraction (section 2.2.2).
SDU 6 PROSPEKT HP 1090
7
8
Figure 3.2. Scheme of the SAMOS-LC system with the valve settings in
the sample enrichment position. (1) samples, (2) solvents for
cartridge washing and conditioning, (3) pump, (4) switching valve, (5)
disposable reversed-phase Cis cartridge, (6) waste, (7) HPLC pump,
(8) analytical column, (9) diode-array detector
The disposable Cis cartridge was rinsed for 1 min with methanol at 4 mL/min and for 3 min with 5 mM TBA-HS solution at 4 mL/min. The samples were then applied to the cartridge during 2 min at a flow rate of 2.5 mL/min. After the sample enrichment, the valve was switched thereby connecting the cartridge with the HPLC system. The enriched compounds were then eluted from the cartridge with the HPLC gradient (20-100% methanol in 60 min) and separated on the analytical column (for liquid chromatography see also 2.2.5). The elution was carried out in the back-flush mode (against the direction used during extraction) which was reported to yield slightly better peak shapes (Lange et al. 1995). After 20 min all compounds of interest were transferred from the cartridge to the

45
analytical column and the cartridge could be disconnected from the HPLC system. This allowed time to clean or change the cartridge and enrich a new sample while the previous HPLC chromatogram was still running.
Sewage Sludge
A 50 mL sample of the preserved sludge from the first aeration tank was centrifuged at 1500 rpm for about 10 min. The liquid fraction was then filtered with 8.0 µm and 0.45 µm membrane filters (Sartorius). TBA-Br (5 mM) was added to the sample and the pH was adjusted to pH 6.5. The sample was then extracted by ion-pair solid-phase extraction with a 0.5 g C1s cartridge (Supelco). After drying with air and nitrogen for 20 min the cartridge was eluted with 5 mL methanol. The eluate was evaporated and the residue was dissolved in 1 mL eluant A (see 2.2.5) for HPLC analysis. The solid fraction was extracted twice with ca. 25 mL of 20 mM TBA-HS in methanol by sonication for 5 min. The combined extracts were then filtered through ca. 1.2 µm glass microfibre filters (GF/C, Whatman) and 0.2 µm membrane filters (regenerated cellulose, Sartorius). After evaporation of the methanol, the residual 2-3 mL of an aqueous brown emulsion were directly used for HPLC analysis.
250 mg of freeze dried sludge from the stabilisation tank were extract-ed with 3 x 10 mL 5 mM TBA-HS in methanol by shaking and sonication for 5 min. The sample was centrifuged at 1500 rpm for about 10 min and the liquid fraction was decanted into a round-bottom flask. The solvent was then evaporated with a rotary evaporator (Büchi) and the residue was dissolved in 5 mL water for HPLC analysis. The HPLC samples were non-transparent emulsions since part of the residue consisted of non water-soluble oily components.
3.2.4. HPLC, Detection and Quantitation
The apparatus and the general chromatographic parameters are de-scribed in section 2.2.5. In addition to UV detection, chromatograms were simultaneously monitored by fluorescence detection using a Hewlett Packard 1046 A programmable fluorescence detector. The specific HPLC gradient used for the separation of the influent and effluent samples from the sewage treatment plant at Herisau is shown in Table 3.2. A mixture of 80% methanol and 20% acetonitrile was used as eluent B.

46
UV absorption chromatograms were monitored simultaneously at 225, 230, 236, 242 and 294 nm using a diode array detector. In addition, UV absorption spectra between 210-400 nm (interval 4 nm) were acquired continuously every 1.28 s during the entire chromatogram. Fluorescence chromatograms were monitored at an excitation wavelength (Aex) of 230 nm and an emission wavelength (Aem) of 340 nm based on the method developed by Lange et al. (1995). Aminonaphthalenedisulfonates were detected at Aex = 246 nm and Aem = 430 nm.
Table 3.2. HPLC gradient used for the separation of waste water samples from the sewage treatment plant at Herisau.
time [min] eluentA [%P eluent B [%]b flow [rnLJmin]
0 95 5 1.0
40 55 45
42 20 80
44 20 80
46 95 5 1.0
46.2 1.2
60 95 5 1.2
a 5 mM TBA-HS / 10 mM phophate buffer pH 6.5, b 80% methanol / 20% acetonitrile
Quantification of the compounds from the STP Herisau was performed by comparing the ratios of peak areas for the sulfonates and the internal standard in SPE extracts to that of standard solutions. Six-point calibra-tion curves were obtained by extracting 25 mL of influent and 100 mL of effluent samples from the municipal STP Zurich-Glatt (Switzerland) which contained only traces of benzene- and naphthalenesulfonates. Prior to extraction, these samples were spiked with a known amount of internal standard and different amounts of sulfonates. The exraction was carried out as described in chapter 2.2.3. The concentration ranges for different sulfonates in waste water samples were first estimated by external calibra-tion with a single standard sample of known concentration. Concentra-tions were calculated using a proportional model (y = bx) with normal distribution (Badertscher 1992). The concentration ranges of the calibra-tions together with the proportionality factors (b) and the corresponding correlation coefficients are given in Table 3.3.

47
Table 3.3. Parameters of calibration curves (n=6) for the quantitation of
aromatic sulfonates in the STP Herisau, obtained from a pro-
portional model (y=bx) with normal dlstribution.
compound concentration b correlation range coefficient a [µg/L) [Uµg)
3-nitrobenzenesulfonate infl.b 0-2000 1.50 X lQ-3 0.99997
effl.C 0-1000 5.67 X lQ-3 0.99993
4-nitrobenzenesulfonate infl. 0-100 1.62 X lQ-3 0.98852
effl. 0-50 6.63 X lQ-3 0.9993
3-aminobenzenesulfonate infl. 0-1000 3.05 X 10⁻⁴ 0.9997
effl. 0-100 7.86 X 10⁻⁴ 0.9998
naphthalene-1-sulfonate infl. 0-200 18.3 X 10⁻³ 0.999998
effl. 0-40 69.8 X lQ-3 0.999993
naphthalene-2-sulfonate infl. 0-250 34.1 X lQ-3 0.99999
effl. 0-50 12.8 X lQ-2 0.99997
naphthalene-2,6-disulfonate infl. 0-10 89.4 X lQ-4 0.99998
effl. 0-5 33.3 X lQ-3 0.99995
naphthalene-1,5-disulfonate infl. 0-10 16.7 X 10⁻⁴ 0.99992
effl. 0-5 60.0 X lQ-3 0.993
naphthalene-2, 7-disulfonate infl. 0-25 60.5 X lQ-4 0.99998
effl. 0-10 23.3 X l0-3 0.99998
naphthalene-1,6-disulfonate infl. 0-50 29.7 X lQ-4 0.99996
effl. 0-20 11.2 X lQ-3 0.9997
a based on linear regression, b influent (25 mL sarnples ), c effluent ( 100 mL samples)
3.2.5. Electrospray/MS and F AB/MS
All mass spectra were acquired on a Fisons AutoSpec-Q hybrid instru-
ment (Manchester, UK), operated in the negative ion mode_ Liquid sam-
ples were introduced into the mass spectrometer by direct infusion, using
a continuous-flow FAB (fast atom bombardment) or electrospray inter-
face.
The electrospray interface was operated with a needle voltage of about
8 kV (4 kV above source potential)_ Tue ring electrode was operated at a
voltage of about -300 V and the sample cone at about -40 V relative to the
acceleration voltage. The photomultiplier voltage was set to 450 V. The

48
mass range acquired during magnetic field scans was from mlz 500 to 15 at 1 s/decade scan speed. Compressed air was used as nebuliser gas and 200 L/h nitrogen as bath gas. The aqueous samples were diluted with iso-propanol (1: 1) and continuously infused into the mass spectrometer at a flow rate of 2 µL/min.
The continuous-flow FAB (CF-FAB) interface was of the frit-FAB type, used in conjunction with a cesium ion gun. The extraction voltage was set to 25 kV. The ion source was operated at a temperature of 50°C and the ion source pressure was 3.3 x 10⁻⁵ mbar. The photomultiplier voltage was set to 400 V. The mass range acquired during magnetic field scans was from mlz= 800 to 50 and the scan time was 3 s. The samples were diluted with methanol (1:1) and glycerol was added to the mixture to give 3% (v/v). The injection flow rate was 2 µL/min.
3.2.6. Modelling with ASIM 3.0.
The diurnal variations of the 3-NBS and N-2-S concentrations in the effluent of the first clarifier during the study BW6 were investigated by means of the sewage treatment plant modelling program ASIM 3.0 (activated sludge simulation) which was developed by the engineering department of the EA W AG (Dübendorf, Switzerland) (Gujer and Larsen 1995). This program models the effluent concentrations of the first clarifier as a function of the influent concentrations, the influent flows, treatment plant dimensions, and physical and biological elimination parameters.
To model the hydrodynamic conditions, the first clarifier was divided into two hypothetical parts: a lower part from which the settled sludge is pumped back to the aeration tank and an upper part from which the waste water leaves the basin. The amount of return sludge was estimated to be half the waste water flow (Stern 1995). The influent concentration was corrected for by the volume of the recirculated waste water. In addition, recirculation was assumed to be constant during the whole day and therefore, 39% (Mon) and 35% (Tue) of the aromatic sulfonates measured in the effluent were added to the influent. Based on the assumption that neither 3-NBS nor N-2-S was adsorbed to suspended matter and there was no biological elimination after the holidays, both

49
sulfonates were modeled as inert compounds. Tue system parameters were adjusted and optimized using the 3-NBS peak of the first day. A scheme of the model treatment plant with the optimized parameters is shown in Figure 3.3.
recirculation
aeration tank
1544 m3
672m3 2000m3
retum sludge ca .. 5000 m3/d, second activated sludge treatment
(not modeled)
Figure 3.3. Scheme of the model sewage treatment plant used with ASIM 3.0 to model the elimination in the first activated sludge treatment at Herisau.

50
3.3. Results and Discussion
3.3.1. ldentification of Benzene- and Naphthalenesulfonates in Waste Waters from the STP Herisau
The SAMOS-LC was used as an automated combination of ion-pair solid-phase extraction and ion-pair reversed-phase liquid chromatogra-phy. lt was employed to establish which anionic waste water components were present in the STP influent at Herisau. A typical chromatogram of an influent sample is shown in Figure 3.4. The occurring peaks could be divided into three groups. The first group (1) with retention times < 20 min consisted of benzene- and naphthalenesulfonates of the type discussed in Chapter 2. The second group (II) eluting between 20 and 35 min contained mainly naphthalene based compounds of unknown identity. UV spectra and fluorescence activity of these compounds were similar to those of the naphthalene isomers in the first group. The third group (III) consisted of linear alkylbenzenesulfonates (LAS). In the following studies only the compounds of the first group were investigated.
1
j
10 20
II
30 time [min]
UV225nm
III
40 50 60
Figure 3.4. On-line ion-pair solid-phase extraction/HPLC chromatogram of an influent sample from the STP Herisau, For chromato-
graphic conditions see 3.2.4.

51
Comparison of UV spectra and retention times with reference substan-
ces allowed us to identify 15 compounds out of the first group. These
compounds could be divided into two main groups which were found in
all workday samples:
The first group was dominated by 3-NBS which most likely originated
from textile dyeing with reactive dyes and from textile printing. With
concentrations up to 5 mg/L, 3-NBS was much more abundant than the
other sulfonates found in the waste water at Herisau. Together with
3-NBS, 4-nitrobenzenesulfonate (4-NBS) occurred as an impurity (4.3.%
in Ludigol, BASF) of 3-NBS and 3-aminobenzenesulfonate (3-ABS) as the
reduced form of 3-NBS after the application.
The second group consisted of different naphthalenesulfonates. Apart
from naphthalene-1-sulfonate (N-1-S) and naphthalene-2-sulfonate (N-2-
S) five naphthalenedisulfonate isomers were identified: the 2,6-, 1,5-, 2,7-
and 1,6- and most likely also the 1,7-isomer. These seven compounds
occurred always together indicating that they may have a common source,
probably polycondensated aromatic sulfonate (PKAS) mixtures which are
used for different applications (see Appendix A). The main component of
this group was N-2-S which occured in concentrations of 50-300 µg/L.
In addition, cumene-4-sulfonate (4-isopropylbenzenesulfonate) was
regularly observed in all influent samples. Cumene-4-sulfonate is used in
the textile industry as a hydrotropic agent (Chwala and Anger 1977).
Aminobenzene-2,5-disulfonate, 2-aminonaphathalene-1,5-disulfonate and
2-aminonaphthalene-4,8-disulfonate could also be identified in some
samples. They probably did not originate from textile auxiliaries, but
instead from the reductive cleavage of azo dyes. In a few samples, 4-hy-
droxybenzenesulfonate was observed; the origin of this compound is,
however, unknown.
A typical chromatogram obtained from an influent sample with fluo-
rescence and UV detection is shown in Figure 3.5. The use of two differ-
ent detectors allowed us to determine simultaneously the coeluting 3-NBS
(12) and naphthalene-1,5-disulfonate (3) with UV (242 nm) and fluores-
cence (Aex 230 nm, Aem 340 nm) detection, respectively. A list of all iden-
tified compounds with their retention times and detection parameters used
for quantitation is given in Table 3.4.

j A
Aex 230nm
Aem 340nm
1
B
UV225 nm
1
15
52
2
12
10
20 25 30
time [min]
8 6
5
4
7
8
5 6 13
35 40 45
Figure 3.5. Fluorescence (A) and UV (B) chromatograms obtained from an influent sample from the STP Herisau. For chromatogra-phic parameters see 3.2.4. (1) 3-aminobenzenesulfonate (sa), (2) naphthalene-2,6-disa, (3) naphthalene-1,5-disa, ( 4) naphthalene-2,7-disa, (5) naphthalene-1,6-disa, (6) naphthalene-1,7-disa, (7) naphthalene-1-sa, (8) naphthalene-2-sa, (9) 4-hydroxybenzene-sa, (10) aminobenzene-2,5-disa, (11) 4-nitrobenzene-sa, (12) 3-nitrobenzene-sa, (13) cumene-4-sa.

53
Table 3.4. Retention times and UV and fluorescence detection (FD) parameters of aromatic sulfonates in the waste waters from Herisau. For chromatographic parameters see chapter 3.2.4.
compound abbrevia- retention uva FDa
tion time [min] [nm] AexlAem 3-aminobenzenesulfonate 3-ABS 13.2 236 2301340
3-nitrobenzenesulfonate 3-NBS 31.4 242
4-nitrobenzenesulfonate 4-NBS 30.9 242
cumene-4-sulfonate 44.0 225
4-hydroxybenzenesulfonate 13.7 225
naphthalene-1-sulfonate N-1-S 39.7 225 230/340
naphthelene-2-sulfonate N-2-S 40.4 225 230/340
naphthalene-2,6-disulfonate N-2,6-dS 30.3 230/340
naphthalene-1,5-disulfonate N-1,5-dS 31.5 230/340
naphthalene-2,7-disulfonate N-2,7-dS 33.4 236 230/340
naphthalene-1,6-disulfonate N-1,6-dS 34.1 236 230/340
naphthalene-1, 7-disulfonate N-1,7-dS 38.1 225 230/340
aminobenzene-2,5-disulfonate 24.5 236 230/340
2-aminonaphthalene-4,8-disulfonate ca. 29.5 246/433
2-aminonaphthalene-1,5-disulfonate ca. 30.3 246/433
diphenylamine-4-sulfonate int. stnd. 41.9 294
a not identical with the optimum detection conditions
The identity of several compounds was also verified by MS (mass
spectrometry) using electrospray (ESI) and CF-FAB (continuous-flow
fast atom bombardment) interfaces for sample introduction. A concen-
trated extract of a STP influent sample was previously separated by ion-
pair chromatography and each peak was separately collected for off-line
MS analysis by continuous infusion into the ESI or CF-FAB interface.
Only the HPLC fraction corresponding to 3-NBS was investigated by
ESI/MS. The mass spectra of the reference compound and the 3-NBS
fraction are shown in Figure 3.6. In both the reference spectrum (Figure
3.6.A) and the spectrum of the real sample (Figure 3.6.B) a strong signal
at m/z 202 [M-H]- was observed. In addition, the reference spectrum in-
cluded a signal at m/z 156 (magnified by a factor 10) which can be
rationalized by the loss of the nitro group [M-N02]-. This signal was not

54
observed in the original spectrum of the real sample. However, after
adjustment of the sample cone voltage, more collisions between sample
molecules and the sheath gas were induced and the signal at m/z 156 [M-
N02]- appeared again (Figure 3.6.C).
59
50
202
A X J0
156
130 140 150 160 170 180 190 200 210 220 230
B
119
100 150 200 250
m/z
300 50 m/z
c 1 6
214
1 8 262
100 150 200 250 300
Figure 3.6. Mass spectra of a 3-NBS reference sample (A) and the HPLC
fraction of a waste water extract (B,C). The samples were
acquired using negative ion ESl/MS with continuous-flow
injection. Mass spectrum C was obtained by adjusting the
sample cone voltage.

55
The examination of the same 3-NBS containing HPLC fraction with
CF-FAB/MS yielded a strong molecular ion peak at m/z 202 [M-H]-
(Figure 3.7.A). In the mass spectrum of the 3-ABS containing HPLC
fraction the ion m/z 172 [M-H]- and a glycerol adduct at m/z 264 [M+Gly-
H]- were observed (Figure 3.7.B). However, the signal at m/z 264 was
found in all CF-FAB mass spectra indicating that it might also originate
from the matrix.
202 59
A B 172
80 264
214
186
80 264
60 100 140 180 220 260 300 50 100 150 200 250 300
m/z
2<rl 360
c D
287
528
2 7
80 265
60 100 140 180 220 260 300 150 200 250 300 350 400 450 500 550
m/z
Figure 3.7. Mass spectra of 3-NBS (A), 3-ABS (B), N-2-S (C) and
N-2,7-dS (D) isolated from an industrial waste water sam-
ple. The samples were acquired using negative ion CF-FAB.

56
Different HPLC fractions containing naphthalenesulfonates were also
analyzed by CF-FAB/MS. The results corresponded well to those of ref-
erence compounds. Although positional isomers of naphthalenesulfonates
could not be distinguished with this technique, mono- and disulfonated
compounds could be easily differentiated. Of N-1-S and N-2-S only the
quasi molecular ion at m/z 207 [M-H]- but no fragment ions were ob-
served (Figure 3.7.C). For N-2,7-dS three major signals could be as-
signed to the assumed structure: the quasi molecular ion at m/z 287 [M-
H]-, a TBA adduct at m/z 528 [M+TBA-2H]- and a fragment ion at m/z
207 [M-S03-H]- (Figure 3.7.D). In conclusion, all mass spectra were in
good agreement with the identification of the compounds based on UV
spectra and retention times of reference compounds.
Some of the mass spectra did, however, contain several signals which
could not be explained. They might have originated from the matrix
(adducts of glycerol, acetate, TBA etc.) or from coeluting compounds in
the HPLC chromatogram. This made the interpretation of mass spectra of
unknown peaks difficult. Figure 3.8 shows for example the mass spectrum
of the HPLC fraction corresponding to the unknown peak eluting around
27 min (Figure 3.5). The UV spectrum indicated a benzenesulfonate but
the three major signals at m/z 264, 360, and 493 can not be explained by
any combination of the most common substituents (sulfo, nitro, amino,
hydroxy, carboxy, chloro, methyl). Only the signal at m/z 172 would
indicate an aminobenzene sulfonate (ABS) and the signal at m/z 264 might
then be explained as a glycerol adduct of ABS. The problem is that the
three ABS isomers elute with shorter retention times and would therefore
not be found in this HPLC fraction. However, an additional sulfo group
would give rise to a signal at m/z 252 which was actually observed in the
mass spectrum. Moreover, the signal at m/z 493 could then be interpreted
as a TBA adduct of this aminobenzenedisulfonate. The signal at m/z 360
appeared in several mass spectra and might be explained as an adduct of
TBA with 2 acetate ions. Although the mass spectrum indicated this
unknown peak to be a aminobenzenedisulfonate, the identity could not be
verified due to the lack of a reference compound.
Because no standard was available for N-1,7-dS, it was synthesized
using a method described by Cerfontain (Cerfontain 1982). Sulfonation of
N-1-S with 98.5% sulfuric acid at room temperature was reported to
yields N-1,5-dS, N-1,6-dS, and N-1,7-dS in the ratio 6:3:1. Complete

57
sulfonation of N-1-S and three major peaks were observed in the HPLC
chromatogram of the reaction solution. N-1,5-dS and N-1,6-dS were
identified by reference compounds and therefore, the third peak was
concluded tobe N-1,7-dS. Retention time and UV spectrum exactly fitted
those of the unknown peak.
100 264.1
~ 80 172.0 360.3
~ 60 493.1
j 79.9
~ 40
20
100 200 300 400 500 600 m/z
Figure 3.8. CF-FAB/MS spectrum (negative ion mode) of an unidentified
peak, possibly a aminobenzenedisulfonate.
All samples from Herisau were enriched by solid-phase extraction with
Cp-B. Tests with ion-pair extraction showed that generally no compounds
occurred which were not extractable with Cp-B. However, the first of the
three peaks between 17-19 min in Figure 3.4. was never observed in the
Cp-B extracts. This peak could not be identified, but the UV spectrum and
the fact that it was not determinable with Cp-B strongly indicated an
amino and hydroxy substituted naphthalenesulfonate.
3.3.2. Analyses of Sewage Sludges from the STP Herisau
Neither nitrobenzenesulfonates nor naphthalene mono- and disulfonates
could be found in the extracts of sewage sludges from the sludge
stabilisation tank and the first aeration tank. However, in both the liquid
and the solid fraction of the sludge collected from the aeration tank,

58
2-aminonaphthalene-1,5-disulfonate and 2-aminonaphthalene-4,8-disul-
fonate were detected. In reversed-phase ion-pair chromatography these
compounds elute with shorter retention times than the unsubstituted naph-
thalenedisulfonates suggesting that they are more hydrophilic. Therefore,
it seems rather unlikely that aminonaphthalenedisulfonates should adsorb
to a significant amount to sludge particles. The fact that most of the
aminonaphthalenedisulfonates were found in the liquid fraction indicates
that these compounds might originate from the reductive cleavage of azo
dyes adsorbed to the sludge. Even though the sludge was preserved with
1 % formaldehyde after sampling, it tumed anoxic during storage yielding
reductive conditions in the sample.
Benzoic acid was found in both the liquid and solid fractions of the
sludge from the first aeration tank. In addition, the liquid fraction also
contained phthalic acid, phenylacetic acid and probably toluenesulfonate.
These compounds were never observed in the waste water samples and
most likely originated from degradation processes during the storage of
the sludge sample.
3.3.3. Concentrations and Massfluxes of Nitro- and Amino-benzenesulfona tes
3-NBS in the waste water at Herisau was always accompanied by 3-ABS
and small amounts of 4-NBS. By summing up the loads of 3-NBS, 4-NBS
and the corrected value for 3-ABS, an equivalent of sometimes more than
70 kg NBS per day entered the treatment plant. Hence, the fraction of
3-ABS among the NBS related compounds varied between 5-100%. Part
of the 3-ABS is formed by the reduction of 3-NBS during the textile
dyeing and printing processes. But at the beginning of the week the rela-
tive amounts of 3-ABS were generally less than 20% indicating that only
a small fraction of 3-NBS was reduced during the application. Obviously,
3-NBS was used in large excess and most of it was discharged unaltered
into the waste water. However, as shown in Figure 3.9, the relative
amount of 3-ABS steadily increased during the course of the week.
This increase might have been a consequence of the waste water
pretreatment which was carried out by the textile industry. Due to high
amounts of easily degradable compounds and due to the absence of
aeration, the waste waters in the industrial storage tanks turn anaerobic

59
and highly reductive. Thus, 3-NBS can be abiotically reduced to 3-ABS
by metal sulfides (e.g., MnS, FeS, FeS2, ZnS) formed under sulfate
reducing conditions, or by molecular hydrogen produced under
methanogenic conditions (Haderlein and Schwarzenbach 1995). In insuffi-
ciently preserved waste water samples which were reported to contain
high amounts of 3-NBS, no 3-NBS but high amounts of 3-ABS instead
were found after a few days.
[kgNBS/d]
monl
~ ~~;i:.=~~==~~=·~~=·~==·~==·~==·~=.·:=.·:=.·:=.·:=.·:=.·:=.·:=.·:=.·:=.·: mon
tue -~ wed -::: thu = fri
sat - -~ ~ ~i-====-„„„„„„„„„„„„„„„.
0 20
·4-NBS
40
03-ABS
60 80
• 3-NBS
100 [%]
20.1 31.5 22.2 11.1 5.9
18.4 33.8 15.2 31.5 22.1
4.4
25.6 71.1 44.3
4.2 1.0
Figure 3.9. Relative amounts of 3-NBS, 3-ABS and 4-NBS in the STP
Herisau. Values are calculated as percentage of total NBS
compounds. For BW2, BW3, and BW4 see chapter 3.2.1.
Tue relative amount of 4-NBS in the sum of NBS related compounds
was found to be 4-6%. This corresponds well to the estimated 5% 4-NBS
in commercially available 3-NBS products. 4-ABS was not detected what
might be rationalized by the small concentrations and the coelution of
4-ABS with interferences in HPLC. Based on results from other

60
nitrobenzenes with electron withdrawing groups (eg. -Cl, -COCH3), the
abiotic reduction of 4-NBS under anaerobic conditions would also have
been expected (Dunnivant et al. 1992; Haderlein and Schwarzenbach
1995). However, the constant ratio of 4-NBS to the sum of 3-NBS and
3-ABS in the influent indicated that no significant reduction of 4-NBS
took place in the waste water storage tanks. The behaviour of NBS
isomers under anaerobic conditions was not further investigated in this
work.
3-NBS and 3-ABS were readily eliminated in the STP Herisau provided
that the waste water flow was not too high and the activated sludge was
acclimated to these compounds. During the study BW5, which was carried
out in the first week of February 1994, dry weather flows of 7400-
15'000 m3/d were measured, and the activated sludge had been fed with
NBS since the beginning of the year. Under these almost optimum
conditions (waste water temperatures were only 10-12°C) about 98% and
96% elimination were measured for 3-NBS and 3-ABS over the whole
week. The results of the study BW5 are listed in Table 3.5. 4-NBS could
not be determined properly in this study. However, other studies showed
that 4-NBS is even better eliminated than 3-NBS (see 3.3.5 and 3.3.6).
Table 3.5. lnfluent and effluent concentrations of 3-NBS and 3-ABS in
the study BWS (Herisau, Jan. 30-Feb. 4, 1994).
concentration [µg/L]
3-NBS 3-ABS
flow [m3/d] influent effluent influent effluent
sun 15034 0 ± 26 nda nd nd
mon 13988 592 ± 25 0 ± 7 147 ± 9 0 ± 2
tue 11700 1096 ± 25 50 ± 7 318 ± 10 12 ± 2
wed 10700 847 ± 25 22 ± 7 290 ± 10 16 ± 2
thu 10300 538 ± 25 6 ± 7 441 ± 12 18 ± 2
fri 9550 16 ± 26 0 ± 7 302 ± 10 9 ± 2
sat 7460 nd 0 ± 7 nd 0 ± 2
Total Joad [kg/w] 35.85 0.89 1.50 0.05
elimination [%] 98 96
a not detennined

61
3.3.4. Isomer Patterns, Concentrations and Massfluxes of Naphthalenesulfonates
All naphthalene mono- and disulfonates except N-1,7-dS could be quan-
titated using reference compounds. This allowed a detailed analysis of the
composition of naphthalenesulfonates in STP influents at Herisau. The
concentration ranges (BW6) and the relative amounts of the six com-
pounds which could be quantified are listed in Table 3.6. The ratio of the
sum of N-2-S and N-1-S and the sum of N-2,6-dS, N-1,5-dS, N-2,7-dS,
and N-1,6-dS was found tobe 70%:30% with standard deviations of 7%
for both groups (n=17, values from BW4, BW5, and BW6). The fraction
of monosulfonates varied between 60-80%. On the other band the ratio of
N-2-S and N-1-S was 86.6%:13.4% with standard deviations of only 1.7%
for both compounds. At the same time N-2,6-dS, N-1,5-dS, N-2,7-dS, and
N-1,6-dS were found in the ratio 5.9%, 11.7%, 20.2%, and 62.3% with
standard deviations of 0.9%, 3.1 %, 2.7%, and 2.3%. Although the inter-
nal ratios of mono- and disulfonated naphthalenes were almost constant,
the relatively high variations in the mono- to disulfonate ratio indicated
that the naphthalenesulfonates did not originate from a single source. In
contrast to the ratio of 3-NBS and 3-ABS, neither a systematic increase
nor a decrease of the mono- to disulfonate ratio was observed during the
course of the week. Hence, there was no evidence for an elimination or
transformation of naphthalenesulfonates in the mostly anaerobic waste
water storage tanks of the textile industry.
Table 3.6. Concentration ranges and relative amounts of naphthalene
mono- and disulfonates in the influent of the STP Herisau.
compound concentration relative amount ± standard
[µg/L]" deviation [%]b
naphthalene-2-sulfonate 2-300 60.4 ± 6.8
naphthalene-1-sulfonate 0-56 9.3 ± 1.1
naphthalene- J ,6-disulfonate 0-86 18.8 ± 3.8
naphthalene-2,7-disulfonate 0-27 6.1 ± 1.8
naphthalene-1,5-disulfonate 0-19 3.6 ± 1.5
naphthalene-2,6-disulfonate 0-9 1.8 ± 0.6
• values from BW6, b n=l7, values from BW4, BW5 and BW6

62
N-2-S is used in the textile industry as a hydrotropic agent (Chwala and
Anger 1977). However, the small concentrations of less than 300 µg/L
N-2-S and the presence of other isomers in the waste water suggest that
these compounds were introduced by the application of polycondensated
naphthalenesulfonates. The latter are produced by reaction of formalde-
hyde with technical N-2-S containing N-1-S and different naphthalene-
disulfonates in nearly constant ratios. Therefore the variations of the
mono- to disulfonate ratio which is determined by the N-2-S concen-
tration might be explained by different condensation grades of the PKAS
products applied in the textile industry.
Under the conditions of the study BW5 (see 3.3.3) N-2-S and N-1-S
were found to be 100% eliminated from the waste water. The naphtha-
lenedisulfonates which were expected to be not readily biodegradable (see
4.1) showed a different behaviour (Figure 3.10). N-2,6-dS and N-1,6-dS
showed a high elimination rate of about 95% and N-2,7-dS was still 78%
eliminated. In contrast, 4% and 5% elimination of N-1,5-dS and N-1,7-
dS, respectively, indicated that these compounds were not eliminated at all
(Table 3.7). The influent from Saturday has not been determined and
therefore, the percent values can only be interpreted relative to each
other. However, the naphthalenesulfonates can be arranged as follows
based on their elimination rates in the STP Herisau: N-2-S, N-1-S >
N-2,6-dS, N-1,6-dS > N-2,7-dS » N-1,5-dS, N-1,7-dS (for discussion see
Chapter 4).
Table 3.7. Mass balances of naphthalenesulfonates in the field study BWS
(Herisau, Jan. 31- Feb. 5, 1994).
influent [g/week]3 effluent [g/week]b elimination [%]
naphthalene-1-sulfonate 248 0 100
naphthalene-2-sulfonate 1665 0 100
naphthalene-2, 6-disulfonate 73 4 95
naphthalene-1,5-disulfonate 161 155 4
naphthalene-2, 7-disulfonate 265 59 78
naphthalene-1,6-disulfonate 786 34 96
naphthalene-1, 7-disulfonate nqc nq 5
a 30.1.--4.1.1994, b 31.1.-5.2.1994, c not quantitated
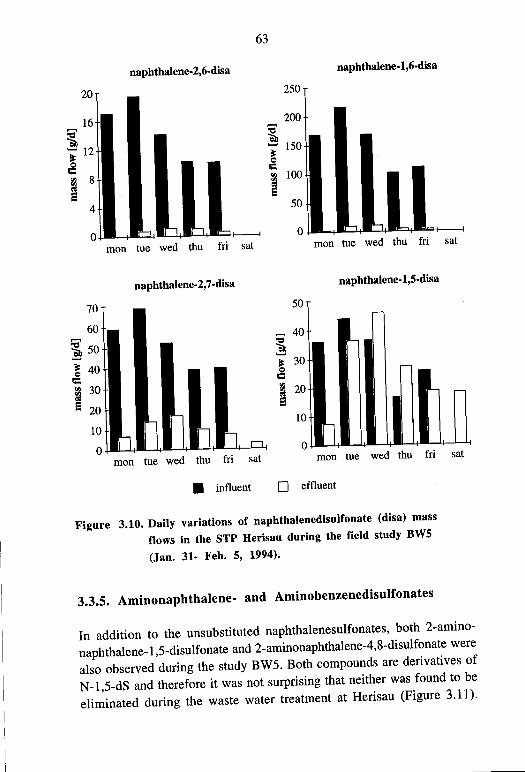
63
naphthalene-2,6-disa naphthalene-1,6-disa
20 250
200
~ -; 150
.a "' 100 ~
50
0 0 --, --, =+ =!---!
mon tue wed thu fri sat mon tue wed thu fri sat
naphthalene-2, 7-disa
70
60
~ 50
~ 40 Ci "' 30 ~ e 20
10 l l l l 0 l „
50
~ 40
-; 30 .a ~ 20
10
0 l
naphthalene-1,5-disa
-1 L
~
1 L -
mon tue wed thu fri sat mon tue wed thu fri sat
• influent 0 effluent
Figure 3.10. Daily variations of naphthalenedisulfonate (disa) mass
flows in the STP Herisau during the field study BW5
(Jan. 31- Feb. 5, 1994).
3.3.5. Aminonaphthalene- and Aminobenzenedisulfonates
In addition to the unsubstituted naphthalenesulfonates, both 2-amino-
naphthalene-1,5-disulfonate and 2-aminonaphthalene-4,8-disulfonate were
also observed during the study BW5. Both compounds are derivatives of
N-1,5-dS and therefore it was not surprising that neither was found tobe
eliminated during the waste water treatment at Herisau (Figure 3.11).

64
Moreover, the aminonaphthalenedisulfonates were only observed in one study suggesting that they did not occur regularly in the waste water at Herisau. This makes an adaptation of the activated sludge to these compounds even more unlikely.
2-aminonaphthalene-4,8-disa 2-aminonaphthalene-1,5-disa
100 -
80 -
60
40 -
= <1.1 = 20 E ~ 0
·~ a
, _ __, l mon tue wed thu 1 r i sat mon tue wed thu f ri sat
.... e ~
aminobenzene-2,5-disa unknown
..... 100 ~ e = 80
~ 60
mon tue wed thu f ri sat mon tue wed thu f ri sat
• influent D effluent
Figure 3.11. Daily variations of mass flows of aminonaphthalene- and aminobenzenedisulfonates (disa) in the STP Herisau during the field study BW5 (Jan. 31- Feb. 5, 1994). Mass flows
are indicated in percent of the maximum influent. The un-known peak corresponds to the compound addressed in Figure 3.8.

65
In the studies BW3 and BW5, aminobenzene-2,5-disulfonate was
detected in the influent and in the effluent. In addition, an unknown
compound, which was also suspected to be an aminobenzenedisulfonate
(see 3.3.1), occurred concurrently with aminobenzene-2,5-disulfonate. lt
might be concluded that both compounds originated from the same
source. By comparing the influent and effluent loads it seems that amino-
benzene-2,5-disulfonate was about 10-20% eliminated relative to the
unknown compound. However, peak areas of aminobenzene-2,5-disulfo-
nate were about 20-30 times smaller than those of the unknown peak
resulting in a higher analytical uncertainty. Therefore, it can be assumed
that neither compound was significantly eliminated.
The aminonaphthalene- and aminobenzenedisulfonates occurred mainly
in the second half of the week. The most simple explanation is that these
compounds were applied only in the second half of the week. However,
the fact that no such compounds were mentioned in the context of textile
auxiliaries strongly favors another explanation: the aminonaphthalenedi-
sulfonates might have been released from the waste water storage tanks of
the textile industry after reductive cleavage of azo dyes under anaerobic
conditions (Baugham and Weber 1994; Weber and Wolfe 1987). In this
case the two aminonaphthalenedisulfonates would probably originate from
different dyes which would also explain the different load maxima as
shown in Figure 3.11. Both compounds are actually components of azo
dyes. 2-Aminonaphthalene-1,5-disulfonate for example is part of Reactive
Red 141 (Procion Red H-E7B, structure not published) and 2-aminonaph-
thalene-4,8-disulfonate is used in Direct Yellow 50 (C.1.29025) (Figure
3.12) and Direct Blue 71 (C.I.34140). Unfortunately, the chemical struc-
tures of must modern dye stuffs are not published because of reasons of
trade secrecy. Therefore, it was not possible to correlate the amino-
benzene- and aminonaphthalenedisulfonates with dye stuffs which were
actually in use at Herisau.
Figure 3.12. Direct Yellow 50 (C.I. 29025), (Aldrich catalog 1992-93),

66
3.3.6. Effect of Waste Water Flow on the Elimination of Nitrobenzene- and Naphthalenesulfonates
The capacity of the activated sludge to eliminate aromatic sulfonates
was found to be stronly dependent on the waste water flow. During the study BW2 (12.-16.7.93) rainy weather predominated and waste water
flows of 17800-26400 m3/d were measured. This corresponded to reten-
tion times of only 7-11 hin the whole treatment plant, compared to about 24 h at a dry weather flow of 8000 m3/d. lt was the last week before the
summer vacation of the local textile industry and the activated sludge could be considered well acclimated to aromatic sulfonates. Nevertheless,
concentrations of 1.1 mg/L 3-NBS were found in the effluent on Wednesday and almost 40 kg 3-NBS were released to the River Glatt during the first three days of this week (Table 3.8). The mass balance cal-
culated over the whole week yielded a 3-NBS elimination of only about
70% which is significantly less as compared to 98% in BW5. Elimination
of 4-NBS was found to be about 10% higher than that of 3-NBS.
In contrast to the 3-NBS, elimination of N-2-S, N-1-S and 3-ABS were only slightly affected by the reduced retention times. Only small amounts
of N-1-S (0.1-0.6 µg/L) were observed in the effluents during the first three days of the week and no N-2-S was found at all after waste water treatment. However, with a maximum of 40 µg/L on Monday influent
concentrations of N-2-S were rather small. Naphthalenedisulfonates were not yet determined in BW2, but based on the results of BW5 elimination of them might also be expected to be reduced.
Table 3.8. Mass balances of nitrobenzene- and naphthalenesulfonates in
the field study BW2 (Herisau, Jul. 12-16, 1993).
influent [kg/week] effluent [kg/week] elimination [%]
3-nitrobenzene-sa 125 38.3 69
4-nitrobenzene-sa 5.94 1.15 81
3-aminobenzene-sa 12.2 0.83 93
naphthalene-1-sa 0.35 0.02 93
naphthalene-2-sa 2.48 bda > 95
a below detection limit

67
The waste water flow through the STP Herisau strongly depends on the
meteorological conditions. During rainy weather high amounts of rain-
water get into the sewerage and pass through the STP, thereby diluting
the municipal and industrial waste water and substantially reducing reten-
tion times. As a drastic example, the waste water flow changed from 7128
m3/d on August 18, 1994 to 27847 m3/d on August 19, 1994 due to heavy
thunder-storms. This resulted in a reduction of the retention time by a
factor of 4.
Similar results were obtained during the first three days of the study
BW4 (January 1-7, 1994) when waste water flows were 27300, 24100,
and 18000 m3/d. Only 50% elimination of 3-NBS and 77% of 4-NBS
were determined, and, as a consequence, about 38 kg 3-NBS were re-
leased from the treatment plant to the River Glatt. Although N-2-S also
showed an elimination of only 91 %, the elimination of naphthalenesul-
fonates seemed generally less affected by waste water flow than those of
the NBS. N-2,6-dS and N-1,6-dS, for example, were still eliminated by
about 80% and N-2,7-dS by 63% (Table 3.9). However, besides the high
waste water flow, another important factor might account for the reduced
elimination efficiency during the study BW4: namely the short intermis-
sion of work around Christmas and New Year's Day (see 3.3.7).
Table 3.9. Mass balances of nitrobenzene- and naphthalenesulfonates in
the field study BW4 (Herisau, Jan. 1-7, 1994).
compound influent [g/week] effluent [g/week] elirnination [ % ]
3-nitrobenzenesulfonate 76.8 a 38.0 a 50
4-nitrobenzenesulfonate 4.2 a 1.0 a 77
3-arninobenzenesulfonate 8.4 a 0.7 a 91
naphthalene-1-sulfonate 440 69 84
naphthalene-2-sulfonate 3208 282 91
naphthalene-2,6-disulfonate 88 15 82
naphthalene-1,5-disulfonate 187 168 10
naphthalene-2,7-disulfonate 299 112 63
naphthalene-1,6-disulfonate 1009 209 79
naphthalene-1,7-disulfonate nqb nq (24)C
a [kg/week], b not quantitated, c peak not pure

68
3.3. 7. Elimination of Nitrobenzene- and Naphthalenesulfonates after Intermissions of W ork in the Textile Industry
Input variations of aromatic sulfonates due to intermissions of work in the textile industry at Herisau drastically reduced the degradative capacity of the activated sludge with respect to NBS and naphthalenesulfonates. In particular, during the annual summer holidays from mid July to mid August, no textile waste waters were discharged to the municipal sewage treatment plant, and, therefore, the activated sludge was not fed with NBS and naphthalenesulfonates. As a consequence, the elimination of aromatic sulfonates was clearly reduced at the restart of industrial activity. The mean effluent concentrations of 3-NBS and N-2-S on Tuesday in the study BW3 (August 16-21, 1993) were > 1.2 mg/L and about 20 µg/L, respec-tively, although the weather conditions were ideally dry and waste water flow was only 7500-8400 m3/d, corresponding to a theoretical retention time of about 24 h in the whole treatment plant. One year later (BW6, August 15-20, 1994), mean effluent concentrations of 0.7 mg/L 3-NBS and > 40 µg/L N-2-S were measured on Tuesday with peak concentrations of 1.3 mg/L and 94 µg/L, respectively. Again, waste water flows were only 6700 m3/d (mon) and 7100 m3/d (tue). However, during the second study one half of the second AST was not in use due to periodical cleaning and therefore, the theoretical retention time in the whole STP was only about 18 h.
The degradative capacity of the activated sludge with respect to aro-matic sulfonates quickly recovered, provided the whole treatment plant was in use and the waste water flow did not increase drastically. On Friday in the study BW3 the effluent concentration of 3-NBS was down to 15 µg/L even though the influent concentration on Thursday was still about 2.5 mg/L. The degradative capacity for N-2-S recovered even faster and on Thursday N-2-S could no longer be detected in the effluent. Figure 3.13. illustrates this re-adaptation of the activated sludge to 3-NBS and N-2-S.
The short re-adaptation times are in good agreement with the maxi-mum specific growth rates (µmax) of the 3-NBS and N-2-S degrading mi-croorganisms which were about 0.6 d-1 and > 1.5 d-1, respectively. These µmax values were roughly estimated from degradation curves obtained from OECD 302 B batch experiments (see Chapter 4). The estimated
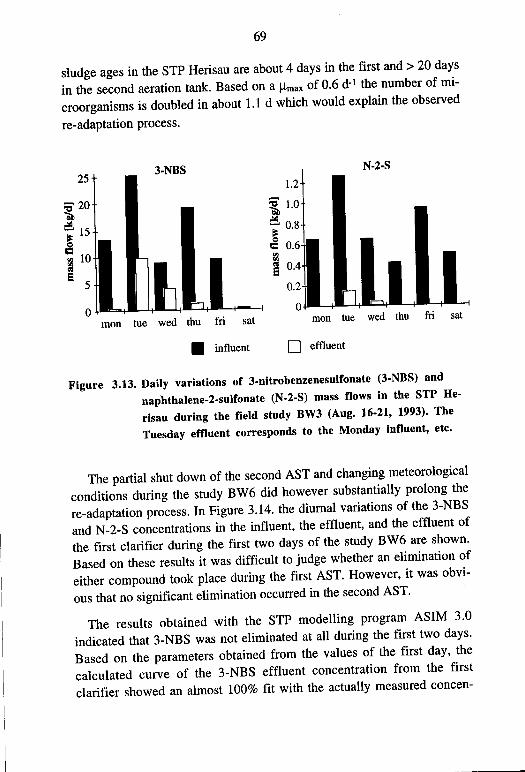
69
sludge ages in the STP Herisau are about 4 days in the first and > 20 days
in the second aeration tank. Based on a µmax of 0.6 d-1 the number of mi-
croorganisms is doubled in about 1.1 d which would explain the observed
re-adaptation process.
25 3-NBS N-2-S
1.2
::; 20 ::; 1.0 ) bli
0 -; 15 ~ 0.8
.a ~ 0.6
~ 10 - ~ 1 0.4
5 0.2 l 0
1 0 mon tue wed thu fri sat mon tue wed thu fri sat
• influent D effluent
Figure 3.13. Daily variations of 3-nitrobenzenesulfonate (3-NBS) and
naphthalene-2-sulfonate (N-2-S) mass flows in the STP He-
risau during the field study BW3 (Aug. 16-21, 1993). The
Tuesday effluent corresponds to the Monday influent, etc.
The partial shut down of the second AST and changing meteorological
conditions during the study BW6 did however substantially prolong the
re-adaptation process. In Figure 3.14. the diurnal variations of the 3-NBS
and N-2-S concentrations in the influent, the effluent, and the effluent of
the first clarifier during the first two days of the study BW6 are shown.
Based on these results it was difficult to judge whether an elimination of
either compound took place during the first AST. However, it was obvi-
ous that no significant elimination occurred in the second AST.
The results obtained with the STP modelling program ASIM 3.0
indicated that 3-NBS was not eliminated at all during the first two days.
Based on the parameters obtained from the values of the first day, the
calculated curve of the 3-NBS effluent concentration from the first
clarifier showed an almost 100% fit with the actually measured concen-

70
trations (Figure 3.15) on the end of the second day. In contrast, the ac-
tually measured concentration of N-2-S increasingly dropped below the
calculated line thus indicating a slow adaptation of the activated sludge (Figure 3.15). However, elimination of N-2-S was at most 20% at the end of Tuesday night which was much lower than in the study BW3.
4.0 3-Nitrobenzenesulfonate
~ 3.5
3.0 .s 2.5 §
;::: 2.0 = ... ... = 1.5 „ ... = 1.0 8 0.5
0 8 8 8 8 8 8 8 8 oci ;! ?:l C'i oci ;! d C'i
N
time
300 Naphthalene-2-sulfonate
250
~ 200 ..: = <:)
150 ;::: e ... ~ 100 = 8 50
0 8 8 8 ~ 8 8 8 8 oci ;! d N oci ;! d C'i
N N
time
--- influent ---0-- 1. effluent ---+- 2. effluent
Figure 3.14. Diurnal variation of 3-NBS and N-2-S concentrations in the
influent and in the effluents of the first and second clarifier
of the STP Herisau (BW6, Aug. 16117, 1994).

71
600
~ 500 • 3-NBS (first day)
Cli .: = 400 • • ~ • !: 300
5 200 (j = • 0 • D (j
100 • •
08.00 12.00 16.00 20.00 24.00 04.00 time
2500 • 3-NBS (second day) • ~ 2000
• • •
.: • = 1500 • • •
1 1000
= 0 500 (j • 08.00 12.00 16.00 20.00 24.00 04.00
time
250
~ 200 N-2-S (second day) • •
Cli • .: • • • = 150 • • ~
• 100
D D D D
~ 8 50
08.00 12.00 16.00 20.00 24.00 04.00 time
• influent (measured) o 1. effluent (measured) - 1. effluent (calculated)
Figure 3.15. Variation of the calculated 1. effluent concentrations of 3-NBS and N-2-S compared with the measured influent and 1. effluent concentrations of the study BW6 (Herisau, Aug. 16/17, 1994).

72
The heavy thundershowers starting on Wednesday moming during the study BW6 further disturbed the re-adaptation process. Although both compartments of the second AST had been in use since Wednesday mor-ning, the waste water flow of about 27'000 m3/d (compared to 7100 m3/d on Tuesday) reduced the theoretical retention time to about 7 h. As a con-sequence, no significant elimination was observed and 12 kg 3-NBS and 1.2 kg N-2-S were released to the River Glatt on this day (Figure 3.16).
14
:o' 12
~ 10
~ 8
~ : 2
3-NBS
0+-L.......L....---'-.-C-'-1 ..... -4-
60
~ 50 t .::!. 40 il:
.;§ 30
~ 20
10
mon tue wed thu fri sat
N-2,6-dS
0 .j.lmL.....L....---Lf-ml--'-f ..... -4 mon tue wed thu fri sat
• influent
1.6 1.4
~ 1.2 -; 1.0 i§ 0.8 ~ 0.6
0.4 0.2
N-2-S
0+-"-1 ...... --4'--...... "'-~
180 160
:o' 140 ~ 120 i 100 - 80
e~ 60 40 20
mon tue wed thu fri sat
N-1,5-dS
0+-"'=-+mi.--'-!.IE..-4J---1+ mon tue wed thu fri sat
D effluent
Figure 3.16 Daily variations of 3-nitrobenzenesulfonate (3-NBS), naph-thalene-2-sulfonate (N-2-S), naphthalene-2,6-disulf onate (N-2,6-dS) and naphthalene-1,5-disulfonate (N-1,5-dS)
mass flows in the STP Herisau during the field study BW6 (Aug. 15-20, 1995).
Unfortunately, the effluent sample from Friday was lost due to a fail-ure in the sampling station and therefore the adaptation process could not

73
be properly followed. Nevertheless, Figure 3.16 shows that 3-NBS and
N-2-S were at least partially eliminated at the end of the week compared
to N-2,6-dS and N-1,5-dS. However, the relatively high effluent concen-
trations of 380 µg/L 3-ABS, 30 µg/L 3-NBS, 3 µg/L N-2-S and 10 µg/L
N-2,6-dS on Saturday indicated that the treatment plant was not yet com-
pletely acclimated.
The incomplete acclimatisation is further illustrated by comparing the
isomer distribution of the naphthalenedisulfonates in the influents and ef-
fluents during the field study BW6. Figure 3.17 shows the isomer distri-
bution in the influents (average) and effluents together with the mean
isomer distribution in the effluents of the study BWS. The latter repre-
sents a state of high acclimatisation. This comparison shows that the re-
adaptation process did not proceed much until Thursday and was still far
from being finished on Saturday.
70
60
........ 50 ~ Q ~ 40 e i .~
30
20
10
0 mean tue wed
influent thu sat mean
effluent BW5
• N-1,6-dS 0 N-2,7-dS • N-1,5-dS II N-2,6-dS
Figure 3.17. Isomer ratios of naphthalendisulfonates in the effiuents and
the mean influent of the study BW6 (Aug. 15-20, 1995)
compared with the ratios in the mean effiuent of the study
BW5 (Jan. 31-Feb. 5, 1994).

74
The slow re-adaptation observed during the first two days of the study BW6 led to the hypothesis that the elimination of the aromatic sulfonates took place mainly in the second AST. The reduction of the second AST by one half on Monday and Tuesday was the only major variation of the ex-temal conditions compared to those of the study BW3. As a consequence, the waste water flow through the second AST was doubled and the resi-dence time drastically reduced. As shown in Chapter 3.3.6 high waste water flows reduce the elimination efficiency and hence the slow re-adaptation was expected.
In addition, the spectrum of microorganisms in the second AST is ex-pected to be broader than in the first AST in which merely the easily degradable waste water constituents are eliminated. Therefore, the highly specialized sulfonate degrading microorganisms are more likely to be found in the second AST which is in good agreement with the aforementioned hypothesis.

75
4. BIODEGRADATION EXPERI-MENTS
4.1. Introduction
The results of the field studies at the municipal STP Herisau strongly
indicated that some nitrobenzene- and naphthalenesulfonates are quite
readily eliminated by aerobic biodegradation. In her diploma work Sonja
Riediker tried to verify and reproduce these observations by means of
batch experiments in the laboratory.
Aeruginosine B is the only aromatic sulfonate known among naturally
occurring compounds (Cook 1994), and consequently, benzene- and
naphthalenesulfonates have to be considered xenobiotic compounds.
Therefore, they have originally been thought to be not readily biodegrad-
able for different reasons: (I) the electron withdrawing sulfonate group
reduces the electron density in the aromatic structure which makes the
electrophilic attack of an arene dioxygenase difficult (Nörtemann and
Knackmuss 1988), (II) the sulfonate group which is about the size of a
t-butyl group makes the electrophilic attack sterically difficult, and (III)
the anionic character of aromatic sulfonates requires an active transport
mechanism into the organism which is another limiting factor for bio-
degradation.
Despite these considerations, recent studies showed that sulfonated
organic compounds are not rare in nature at all. The sulfur content of
aquatic humic substances isolated from natural rivers was found to be
0.2-1.7% (van Loon et al. 1993), and the fraction of sulfonate sulfur in
the total organic sulfur content in forest soils exceeded 40% (Autry and
Fitzgerald 1990). One possible source of naturally occurring sulfonated
organics is 6-sulfoquinovose, the sulfur containing moiety of a plant
sulfolipid. The decreasing sulfonate levels with increasing depth in forest
soils indicated that the potential for the mineralisation of sulfonated
compounds is actually present in nature.
In fact, several authors reported on the isolation of sulfonate degrading
bacteria from industrial sewage sludges. The sulfonates were either used
as carbon source (Locher et al. 1989; Nörtemann and Knackmuss 1988;

76
Thurnheer et al. 1988; Thurnheer et al. 1990; Wittich 1984) or as sole sulfur source (Zürrer et al. 1987). The latter is not likely to apply for treatment plants like that at Herisau in which sulfate concentrations of 150-250 mg/L are regularly measured. Soeder et al. (Soeder et al. 1988) reported on microalgae which are able to use naphthalenesulfonates as sulfur source, but no technical application seems feasible up to now. In contrast to aerobic biodegradation, information about anaerobic desul-fonation reactions is very scarce (Chien et al. 1995; Denger et al. sub-mitted).
The initial metabolic step in the aerobic biodegradation of most ben-zene- and naphthalenesulfonates was found to be dioxygenation with sub-sequent desulfonation and catechol formation. The reaction of benzene-and naphthalene-1-sulfonate is shown in Figure 4.1. (Nörtemann and Knackmuss 1988; Thurnheer et al. 1990). The initial dioxygenation was, however, found to take place at different positions on the aromatic ring depending on additional substituents and the type of microorganisms involved (Feigel and Knackmuss 1993; Focht and Williams 1970; Junker et al. 1994a; Junker et al. 1994b; Thurnheer et al. 1990).
NADH + 02 + H'
-NAD+
_-_H_s_o_3--~OH ••• W cleavage
Figure 4.1. Dioxygenation of benzene- and naphthalene-1-sulfonate with
subsequent desulfonation and catechol formation.
Only few studies exist concerning aerobic biodegradation of naphthalene- and nitrobenzenesulfonates, the most important compounds detected in the STP Herisau. Some monosulfonated naphthalenes were found to be readily biodegradable by organisms isolated from industrial sludges whereas most di- and trisulfonated naphthalenes were not degraded (Nörtemann and Knackmuss 1988). Only one Moraxella species was isolated which degraded naphthalene-2,6-disulfonate (N-2,6-dS) and after adaptation also naphthalene-1,6-disulfonate (N-1,6-dS) (Wittich 1984; Wittich et al. 1988). Reemtsma et al. (1993) observed no

77
biodegradation of di- and trisulfonated naphthalenes in a tannery waste
water treatment pilot plant.
Biodegradation of 3-nitrobenzenesulfonate (3-NBS) was investigated by
several authors. According to Wellens (1990), 3-NBS, with a nitro and
sulfo group in meta position, is not expected to be readily biodegradable.
Nevertheless, Locher et al. (1989) isolated bacteria from industrial
sewage sludge which degraded 3-NBS, 3-ABS and 4-nitrobenzenesul-
fonate (4-NBS). But these organisms were not salt tolerant and degrada-
tion rates were low. Deshpande et al. (Deshpande et al. 1985) reported
degradation of 3-NBS by acclimated activated sludge from a 3-aminophe-
nol manufacturing plant. However, repeating the experiment with a real
waste water from the same plant, 3-NBS was only partially removed.
Kölbener et al. (Kölbener 1995; Kölbener et al. 1994) found complete
mineralisation of 3-NBS in a laboratory trickling filter using sludge from
an industrial sewage treatment plant. On the other band, they always
measured residual dissolved organic carbon (DOC) and a peak was
observed in the HPLC chromatograms that could be shown to be 4-NBS.
lt was present at about 5 % which agrees with the amount of 4-NBS in the
commercially available 3-NBS (eg. Ludigol). Hence, 4-NBS was not
degraded in the laboratory trickling filter.
Most of the results obtained from the field studies at Herisau were in
good agreement with the literature cited above. N aphthalene-1-sulfonate
(N-1-S) and naphthalene-2-sulfonate (N-2-S) were readily eliminated. On
the other band, compared to the experiences of Nörtemann (1988) and
Reemtsma (1993), N-2,6-dS, N-1,6-dS, andin particular N-2,7-dS were
quite readily eliminated. 3-NBS was almost completely eliminated if not
more than about 15'000 m3 waste water per day passed through the
treatment plant and if the activated sludge was well acclimated. But in
contrast to Kölbener et al. (1994), 4-NBS was found tobe eliminated to
an even higher degree than 3-NBS. In addition, it has been shown that
adsorption to solid matter and subsequent sedimentation was not
responsible for elimination of the sulfonates mentioned above.
In this study, biodegradation experiments with activated sludge from
the STP Herisau were carried out to establish whether the observations of
the field studies could be reproduced in the laboratory. Activated sludge
from the STP Zurich-Glatt, representing a mainly municipal sewage

78
treatment plant, was used as reference sludge. The OECD 302 B test was chosen to generate data under well defined conditions. However, due to the limited installations some more experiments were performed in simple Erlenmeyer flasks which were aerated by shaking. The elimination of single compounds was monitored by ion-pair chromatography with UV detection. The DOC was determined to test whether the mineralisation of the test compounds was complete. The following questions were of primary interest:
1) Are both 3-NBS and 4-NBS biodegraded by activated sludge from the STP Herisau?
2) Is one of the two NBS isomers biodegraded in preference to the other?
3) Are the NBS degrading organisms specifically adapted to 3-NBS and 4-NBS or can 2-NBS (which does not occur in the waste water) also be biodegraded?
4) Which naphthalenedisulfonates (N-2,6-dS, N-2,7-dS, N-1,5-dS) are biodegraded by activated sludge from the STP Herisau and what are the relative degradation rates of these various isomers? (N-1,6-dS and N-1,7-dS were not available in our laboratory at the time the ex-periments were carried out).
5) Can the above-mentioned compounds also be biodegraded by acti-vated sludge from the municipal STP Zurich-Glatt, Switzerland?
6) How strongly does the biodegradation rate depend on the waste water temperature (25°C/10°C)?
7) Are there any stable metabolites formed which can be detected in the HPLC chromatograms of the test solutions? If so, can they also be found in the effluents of the STP Herisau and the STP Zurich-Glatt?

79
4.2. Experimental Section
4.2.1. Chemicals
All the test compounds are listed in Table 4.1.
Table 4.1. List of compounds tested in the biodegradation experiments.
compound formula purity origin
2-Nitrobenzene-sa Na-salt 4;RiNüiS03Na anal. grade TCI
3-Nitrobenzene-sa Na-salt C6H4N02S03Na ca. 95 % TCI 4-5 % 4-NBS
4-Nitrobenzene-sa Na-salt C6H4N02S03Na anal. grade TCI
Naphthalene-1-sa Na-salt C10H7S03Na techn. 75 % Fluka 10% N-2-S
Naphthalene-2-sa Na-salt C10H7S03Na high purity CHEM Service, West Chester, PA.
Naphthalene-2,6-disa C10H6(S03)2Na2 techn. 80 % Aldrich Chemie,
diNa-salt Steinheim, Germany
N aphthalene-1,5-disa C1o~(S03)2Na2 techn. 85 % Fluka
diNa-salt N aphthalene-2, 7-disa C1o~(S03)2Na2 Ebert-Merz,
diNa-salt Germany
4-Sulfobenzoic acid C7H5S05H Ciba-Geigy
4.2.2. Sewage Sludge and lnoculum
Fresh activated sludges were collected from the municipal STP Herisau
(Switzerland) and the STP Zurich-Glatt (Switzerland). In Herisau the
sludges were collected from the second aeration tank. In this tank the
sludge index is only about 40-50 mL/g compared to about 100-120 mL/g
in the first aeration tank. However, due to the fact that in the first aera-
tion tank mainly the most easily degradable pollutants are degraded, the
second tank was expected to have a wider spectrum of microorganisms.
Some characteristic data of the investigated sludges are listed in Table 4.2.
The sludges were then transported in half-filled polyethylene bottles in
a cooling box. The bottles were periodically opened and shaken for aera-
tion. In the laboratory the sludges were aerated for 18 h to reduce the
remaining DOC as much as possible. Then the solid sludge particles were
allowed to settle and about two thirds of the water was decanted. The

80
amount of dry matter was determined by filtering 5 mL of the remaining sludge through a 0.45 µm membrane filter (Sartorius, Germany). The filter was then dried for 30 min. at l 00°C and weighed. The sludges which were not immediately used for the experiments were filled into polyethylene bottles and frozen at -22°C.
Frozen activated sludge from the STP Herisau was obtained from P. Kölbener (EMPA, St Gallen). The frozen sludge was slowly thawed in a water bath (20-30°C) and aerated. The further treatment was as described above.
Table 4.2. Characteristic data of the activated sludges in the STP's at Herisau and Zurich-Glatt.
Herisau a Zurich Glatt b
second aeration tank
dry matter [g/L] 5.5 3.5-4.0
sludge index [mUg] 47 c 100-110
age of sludge [days] > 1Qd 6-7
a average values in 1993, b average values in May 1994, c phosphate elimination with
Fe(Il)-salts, d estimated value
4.2.3. Apparatus
Setup A: Analogous to OECD 302 B, but with a 750 mL instead of 1 L test volume. Eight brown glass bottles (lL) were equipped with a magnetic stirrer and a glass tube to introduce air about 1 cm above the bottom of the bottle. Air (1 atm) free of oil and organic impurities was distributed via a reservoir bottle to the reaction vessels (Figure 4.2).
Setup B: 500 mL Erlenmeyer flasks were closed with a piece of cotton and fixed on a shaking apparatus (Figure 4.3).

air tubes
air distribution bottle
81
brown glass bottle
test so!ution
U::::::J+i+.+.+~t- glass tube for aeration
magnetic stirrer plate
Figure 4.2. Setup A for biodegradation tests analogous OECD 302 B at 25°C
cotton plug
shaking apparatus
500 mL Erlenmeyer flask
Figure 4.3. Setup B for biodegradation tests at 25°C and 10°C.

82
4.2.4 Test Solutions and Procedure
The test solutions were prepared using the following stock solutions:
a) 8.5 g KH2P04, 21.75 g K1HP04, 26.6 g Na2HP04 (water free), and 2.5 g NH4Cl in 1000 mL H20.
b) 22.5 g MgS04 · 7 H20 in 1000 mL H20
c) 27 .5 g CaCh in 1000 mL H20
d) 0.25 g FeCh·6 H20 in 1000 mL H20
The stock solutions were stored at 4 °C. All salts were purchased from Merck (Darmstadt, Germany) and pro analysi grade. Double destilled wa-ter was used for all applications.
Setup A: test volume 750 mL
Test substances giving a final DOC concentration of 35-50 mg/L were dissolved in 500 mL water, 6.75 mL of stock solution a and 675 µL of stock solution b-d. Activated sludge was added to achieve a final dry matter concentration of 200 mg/L. The mixture was then made up to 750 mL with water.
Setup B: test volume 125 mL
The preparation procedure was analogous to setup A, using 1.125 mL of stock solution a and 113 µL of stock solution b-d.
Prior to each sampling, the pH was measured and maintained between 7-8 by addition of 1 M sodium hydroxide solution. The sulfonates were tested either as single compounds or in mixtures of up to 5 compounds. The overall sulfonate concentration was always 50 mg/L DOC. The readily biodegradable 4-carboxybenzenesulfonate was used to test whether the sludges were still active or not. For both setups test solutions with the stock solutions a-d and activated sludge were analyzed as blanks.
In the first test series frozen sludge from Herisau (received from P. Kölbener, EMPA St.Gallen) and fresh sludge from Zurich-Glatt were used. The second test series was carried out with freshly collected sludge from Herisau and frozen sludge from Zurich-Glatt (same as in the first series). All tests were run in the dark in rooms with a constant tempera-ture of 25°C and 10°C.
In Table 4.3-6. all tests with their specific conditions are summarized.

83
Table 4.3. Nitrobenzenesulfonates
treatment Exp. compound sludge setup temperature
plant No. [OC]
Herisau 3 3-NBS, 4-NBS frozen A 25
11 3-NBS, 4-NBS frozen B 25
15 3-NBS, 4-NBS frozen B 10
31 3-NBS fresh A 25
32 4-NBS fresh A 25
33 3-NBS, 4-NBS fresh A 25
40 2-NBS fresh B 25
41 2-NBS, 3-NBS, 4-NBS fresh B 25
Zurich-Glatt 7 3-NBS, 4-NBS fresh A 25
19 3-NBS, 4-NBS fresh B 25
22 3-NBS, 4-NBS fresh B 10
48 3-NBS, 4-NBS frozen B 25
Table 4.4. Naehthalenesulfonates
treatment Exp. compound sludge setup temperature
plant No. [OC]
Herisau 4 N-1-S, N-2-S, and frozen A 25
N-1,5-/-2,6-/-2,7-dS 34 N-1,5-/-2,6-/-2,7-dS fresh A 25
35 N-1,5-dS fresh A 25
36 N-2,6-dS fresh A 25
37 N-2,7-dS fresh A 25
42 N-1-S, N-2-S and fresh B 25
N-1,5-/-2,6-/-2,7-dS 45 N-1-S, N-2-S, and fresh B 10
N-1,5-/-2,6-/-2,7-dS
Zurich-Glatt 8 N-1-S, N-2-S, and fresh A 25
N-1,5-/-2,6-/-2,7-dS
Table 4.5. 4-Carbox~benzenesulfonate
treatment Exp. compound sludge setup temperature
plant No. [OC]
Herisau 2 4-Carboxybenzene-sa frozen A 25
10 frozen B 25
39 fresh B 25
14 frozen B 10
44 fresh B 10
Zurich-Glatt 6 4-Carboxybenzene-sa fresh A 25
18 fresh B 25
47 frozen B 25
21 ffresh B 10

84
Table 4.6. Blanks
treatment Exp. compound sludge setup temperature plant No. ["C]
Herisau l none frozen A 25 9 frozen B 25 13 frozen B 10 30 fresh A 25 38 fresh B 25 43 fresh B 10
Zurich-Glatt 5 none fresh A 25 17 fresh B 25 46 frozen B 25 20 fresh B 10
4.2.5. Sampling
Samples were collected directly after the addition of the inoculum. The second sample was taken after 3 h and then every day until the test com-pound and the DOC were completely eliminated. Afterwards, samples were collected according to the OECD 302 B guideline after 7, 14, 21, and 28 days. The blank tests were sampled after 1, 8, 15, 21, and 29 days. The volume of the test solutions was steadily reduced by evaporation, especially in the samples of setup A due to the continuous stream of air which was blown through the solutions. These losses were corrected prior to each sampling by addition of water to the test solution.
4.2.6. HPLC
1 mL samples of setup A and B were spiked with 10 µL of an intemal standard (1 µg/µL, see Table 4.7), passed through a Teflon syringe filter (Nalgene, Rochester, NY), and preserved with one drop of formaldehyde solution (37%, Fluka). Samples (20 µL) were then injected into HPLC and analyzed by reversed-phase ion-pair chromatography (for apparatus and chromatographic conditions see section 2.2.5). The gradients, detection wavelengths, and intemal standards which were used for the different classes of compounds are listed in Table 4.7.
In addition to the specific detection wavelengths of the test compounds, a chromatogram at 220 nm was monitored for each sample to screen for

85
metabolites. The HPLC runs with nitrobenzenesulfonates were also moni-
tored at 242 nm to check whether reduction to the corresponding amino-
benzenesulfonates occurred.
Table 4.7. Internal standards and analytical parameters for the determi·
nation of nitrobenzene- and naehthalenesulfonates.
method compound internal standard UV detection gradient
(A. detection) [nm]
1 2-NBS N-2,7-dS 220 20-45 % methanol 3-NBS (225 nm) 264 in 15 min 4-NBS 264
II N-1-S 225
N-2-S diphenylamine-4- 225 25- 55 % methanol N-2,6-dS sulfonate 225
N-1,5-dS (294 nm) 232 in 15 min
N-2,7-dS 232
III 4-COOH-BS 4-aminonaphthalene-1- 230 20-50 % methanol
sulfonate in 18 min (230 nm)
blank diphenylamine-4- 1 III 1 III sulfonate (294nm)
4.2. 7. DOC Measurements
DOC was measured using a TOCOR 2, MAIHAK DOC analyzer. 10
mL samples from the setups A were filtered through 0.45 µm membrane
filters (Sartorius, Germany) and acidified with 0.1 M hydrochloric acid
to pH < 4. A potassium hydrogen phthalate (CsHsK04) solution of 106.02
mg C/L (tests number 1-8) or 53.01 mg C/L (tests number 30-38) was
used as an external standard and nanopure water was measured as a blank.
DOC was determined only for samples of the setup A.
The relative DOC concentrations were calculated by the following
equation:
rel DOCs [%] = Cs(t) - Cb(t) * 100
Cs(t=O) - Cb(t=O)
Cs(t) = DOC concentration ofthe sample at the timet [mg C/L]
Cb(t) = DOC concentration of the blank sample at the timet [mg C/L]

86
4.3. Results and Discussion
4.3.1. Blank and control samples
In the chromatograms of the blank samples no aromatic sulfonates or
any other compounds interfering with the HPLC/DAD determination of
the target compounds could be detected.
4-Carboxybenzenesulfonate was readily degraded by both sludges from
the STP Herisau and the STP Zurich-Glatt. The adaptation phase (10 %
elimination) at 25°C was 1-2 d and the degradation phase (70 % elimi-
nation) was 0.5-1.5 d. There was no significant difference between fresh
and frozen sludge or between setup A and B. The adaptation phases at
10°C varied between 2 d (Zurich-Glatt) and 7 d (Herisau) with degra-
dation phases of 7 d and 2-4 d, respectively. The DOC concentration was
reduced concurrently with the concentration of 4-carboxybenzene-
sulfonate which indicated that no stable metabolites were created. Based
on these observations all sludges could be considered biologically active.
The results of the control samples with 4-carboxybenzenesulfonate are
summarized in Table 4.8.
Table 4.8. Biodegradation tests of 4-carboxybenzenesulfonate
treatment plant Exp. setup sludge T adaptation degradation No. [OC] phase[d] phase [d]
Herisau 2 A frozen 25 2.0 0.5 10 B frozen 25 2.0 0.5 39 B fresh 25 1.0 0.5 14 B frozen 10 7.0 2.0 44 B fresh 10 7.0 4.0
Zurich-Glatt 6 A fresh 25 1.0 1.5 17 B fresh 25 1.0 1.5 47 B frozen 25 1.0 0.5 21 B fresh 10 2.0 7.0
4.3.2. Nitrobenzenesulfonates
The results summarized in Table 4.9-10. clearly show that both 3-NBS
and 4-NBS were readily eliminated by activated sludge from the STP
Herisau. Neither the DOC concentrations nor the specific compound con-
centrations showed any significant difference between the first (t = 0 h)

87
and the second (t = 3 h) sampling. Hence it can be concluded that adsorp-
tion of nitrobenzenesulfonates to sludge particles is negligible and that the
elimination can be explained by biodegradation.
Table 4.9. Biode~radation tests of 3-nitrobenzenesulfonate
treatment Exp. competing setup sludge T adaptation degradation
plant No. compound [OC] phase phase [d] [d]
Herisau 31 A fresh 25 3.5 3.5
33 4-NBS A fresh 25 3.5 3.5
3 4-NBS A frozen 25 3.5 4.0
11 4-NBS B frozen 25 3.5 4.0
41 2-, 4-NBS B fresh 25 5.5 4.0
15 4-NBS B frozen 10 10 > 18
Zurich-Glatt 7 4-NBS A fresh 25 7.5 10.5
48 4-NBS B frozen 25 n.e. n.e.
19 B fresh 25 10 4
22 B fresh 10 n.e. n.e.
n.e: elimination of 10 % (adaptation phase) and 70 % (degradation phase) was not
achieved.
Table 4.10. Biodearadation tests of 4-nitrobenzenesulfonate
treatment Exp. competing setup sludge T adaptation degradation
plant No. compound [OC] phase phase [d] [d]
Herisau 32 A fresh 25 3.5 3.5
33 3-NBS A fresh 25 3.5 3.0
3 3-NBS A frozen 25 3.5 2.5
11 3-NBS B frozen 25 4 2.5
41 2-, 3-NBS B fresh 25 4 2.5
15 3-NBS B frozen 10 13 > 15
Zurich-Glatt 7 4-NBS A fresh 25 7.5 19
48 4-NBS B frozen 25 n.e. n.e.
n.e: elimination of 10 % (adaptation phase) and 70 % (degradation phase) was not
achieved.
Table 4.11. Biodegradation tests of 2-nitrobenzenesulfonate
treatment Exp. competing setup sludge T adaptation degradation
plant No. compound [OC] phase phase [d] [d]
Herisau 40 B fresh 25 n.e. n.e.
41 3-, 4-NBS B fresh 25 n.e. n.e.
n.e: elimination of 10 % (adaptation phase) and 70 % (degradation phase) was not
achieved.

88
The adaptation phases at 25°C varied between 3 and 4 d and the degra-dation phases from 2 to 4 d. No significant difference between frozen and
fresh sludge was observed and both setups A and B gave about the same results. The degradation curves of the experiments 31-33 (Figure 4.3-5)
show that 3-NBS and 4-NBS were degraded almost simultaneously with a maximum specific growth rate of about 0.6 d-1. There was no difference
observed between the experiments in which the two compounds were
tested separately and the experiment with both compounds together. These findings suggest that either two non competing microorganisms were pre-sent or that one microorganism was able to use both substrates without
any preferences. However, how specifically active this or these microor-ganisms were was illustrated by the fact that 2-NBS was not degraded at all (Table 4.11), when tested as single compound or in a mixture with 3-NBS and 4-NBS (Figure 4.6). Apparently, the microorganisms which
were acclimated to 3-NBS and 4-NBS were not able to utilize 2-NBS as C-source after the other two isomers bad been metabolized.
These results are in good agreement with the observations of Wellens
(1990) who found no biodegradation of 2-NBS in the Zahn-Wellens test. Nevertheless, Wellens also showed that ortho- and para-substituted ben-zenes were generally easier to degrade than meta-substituted compounds. Considering only the para- and meta-substituted isomers, these findings
were at least partially supported by the situation in the STP Herisau and by the results from the laboratory experiments. In all the field studies 4-NBS was eliminated to a somewhat higher degree than 3-NBS (see chapter 3). A closer look at experiment 33 (Figure 4.5) also reveals that degrada-tion of 4-NBS started earlier than degradation of 3-NBS although the dif-ference was very small. Finally, in experiment 41 with all three NBS
isomers (Figure 4.6), 4-NBS was degraded 3 days earlier than 3-NBS. This observation may explain why 4-NBS was actually degraded in the STP Herisau where 4-NBS made up only about 5 % of the total NBS con-centration in the waste water.
The DOC elimination curve was almost identical with the elimination curve of the specific compound concentration. Only in the experiments with 4-NBS was a residual relative DOC concentration of 5-15 % mea-sured after the end of the degradation phase.

89
100
80 • DOC ...... ~ ...... --o-3-NBS := 60 ~
~ 40 <.I
20
0 5 10 15 20 25
days
Figure 4.3. Degradation curve of 3-NBS tested with sludge from the STP Herisau at 25°C, exp. 31, setup A
100
80
~ „ DOC
~ 60
'-' --0-4-NBS
~ <.I 40
20
0 5 10 15 20 25
days
Figure 4.4. Degradation curve of 4-NBS tested with sludge from the STP Herisau at 25°C, experiment 32, setup A

90
100
80 " DOC
~ -o---3-NBS := 60 !") '-' • 4-NBS ~ ~ ..,
40
20
0 5 10 15 20 25
days
Figure 4.5. Degradation curves of 3-NBS and 4-NBS tested with sludge from the STP Herisau at 25°C, experiment 33, setup A
100
80 ~
~ " 2-NBS := 60 ~ ~ --o--3-NBS ~ .., 40 4-NBS
20
0 5 10 15 20 25
days
Figure 4.6. Degradation curves of 2·, 3-, and 4-NBS tested with sludge from the STP Herisau at 25°C, exp. 41, setup B

91
This residual DOC concentration then decreased to 2-4% until the end
of the test period. Moreover, in all experiments with 4-NBS the test
solution became yellow coloured at the end of the degradation phase. This
colour was probably caused by the unknown compound with the UV
spectrum shown in Figure 4.7.B. Simultaneously with the occurrence of
the yellow colour, the pH decreased to pH 6-7. However, it could not be
established whether the residual DOC concentration, the yellow colour,
and the decreasing pH were related to the biodegradation of 4-NBS or
rather to an impurity in the 4-NBS reference sample.
A
300 400 wavelength [nm]
B
300 400
Figure 4.7. UV spectra of unknown peaks in the chromatograms of (A) all
test samples with NBS and (B) of experiment 32 with 4-NBS.
P. Kölbener at the EMPA (St. Gallen, Switzerland) observed a similar
yellow colouring during the degradation of 3-ABS in the laboratory
trickling filter testing sludge from Herisau (Kölbener et al. 1994). Never-
theless, it could not be established whether these colours were due to the
same compounds. A comparison of the HPLC chromatograms of the
trickling filter effluent and the test solution of experiment 32 did not
show any identical peaks with UV spectra in the yellow range. However,
in both cases the yellow colour vanished during the course of the experi-
ment; therefore, the corresponding compounds may not have been present
any more at the time of the HPLC analyses.
Small amounts of 3-ABS and an unknown compound (Figure 4.7.A)
were detected in almost all experiments with 3-NBS as test compound,
andin experiment 11 traces of 4-ABS were found. Obviously, there were

92
at least temporarily reductive conditions or NBS reducing microorgan-isms in the test vessels which led to the reduction of NBS isomers to the corresponding ABS. lt is known from experiences with non preserved waste water samples that 3-NBS is completely reduced to 3-ABS when the sample becomes anoxic. Therefore, a decrease in the oxygen concentra-tion during the degradation phase may have caused the reduction of some NBS. However, the concentrations were very small compared to the orig-inal concentrations of the test compounds and the peaks vanished again during the course of the experiment. Hence, neither the DOC measure-ments nor the HPLC chromatograms indicated the presence of any stable metabolites after degradation of 3-NBS and presumably also of 4-NBS.
The experiments carried out at 10°C showed only a small decrease in 3-NBS and 4-NBS concentrations over 28 days (Figure 4.8). These results suggested that no biodegradation of NBS would take place in the STP Herisau during winter time when the temperature of the waste water varies between 7-13°C (data from Jan/Feb. 1994). However, the data from the field study BW5 (see 3.3.3) clearly showed that 3-NBS and 4-NBS were readily eliminated at water temperatures of 9.6-12.6°C. lt seems that the critical factor for the degradation is the kinetics of the adaptation rather than the degradation kinetics. This could be another explanation for the low elimination of 3-NBS in the field study BW4. Even though the holidays at Christmas/New Year 1994 was only a few days, the microorganisms in the Herisau treatment plant would have had to acclimate again to the industrial waste water at the beginning of January. This adaptation was probably slowed down by the low temperatures of 8.4-12.2°C. In early February the sludge was again acclimated and the degradation of 3-NBS started instantaneously even though the temperatures were in the same range.
As expected, the activated sludge from the STP Zurich-Glatt, which was not acclimated to 3-NBS and 4-NBS, showed a different behaviour: At 25°C the frozen sludge was not able to degrade 3-NBS and 4-NBS at all whereas a slow almost continuous elimination of both isomers was ob-served using fresh activated sludge (Figure 4.9). However, it was rather difficult to distinguish between the adaptation and degradation phase. Again, the DOC elimination was almost simultaneous with the elimination of the specific compounds which indicated that no conversion to stable metabolites took place.

93
100
80 ....... ~ ....... 2 60 ~ ~ Z' ._, 3-NBS 25°C u 40 •
--c-- 4-NBS 25°C
20 3-NBS 10°C
--0-- 4-NBS l0°C
0 5 10 15 20 25
days
Figure 4.8. Degradation curves of 3-NBS and 4-NBS tested with sludge from the STP Herisau at 25°C (experiment 11) and 10°C (experiment 15), setup B.
100 „ DOC
--C-3-NBS
80 4-NBS
_, ~ ~
2 60 ~
~ _, u 40
20
0 5 10 15 20 25
days
Figure 4.9. Degradation curves of 3-NBS and 4-NBS tested with sludge from the STP Zurich-Glatt at 25°C, experiment 11, setup A.

94
In contrast to the experiments with activated sludge from the STP
Herisau, the sludge from the STP Zurich-Glatt eliminated 3-NBS better
than 4-NBS. In experiment 19 using the setup B with fresh sludge, 3-NBS
was eliminated in 4 days after an adaptation phase of 10 days. This exper-
iment was the only one in which a complete elimination of an NBS isomer
by sludge from the STP Zurich-Glatt was observed. These results indicate
that the activated sludge from the municipal STP Zurich-Glatt was not
acclimated to NBS. However, the partial elimination of 3-NBS showed
that the sludge from the STP Zurich-Glatt may eventually adapt to 3-NBS
if this substance should occur regularly in the waste water.
Overall, the results discussed above are in good agreement with the re-
sults from the field studies at Herisau as well as with the expectations
based on the literature. lt could be shown that the elimination of 3-NBS
and 4-NBS in the STP Herisau was due to biodegradation. That means that
the degradative capacity of 3-NBS degrading microorganisms isolated
from industrial sludges not only works in laboratory experiments but also
under real conditions. However, it may be that the special situation at
Herisau, where the industrial waste water is diluted with non-industrial
waste water by a factor of about four, is very favorable for the effective
activity of the NBS degrading microorganisms. Through the dilution of
the industrial waste water with municipal waste water in the STP Herisau,
the salt concentration is probably lower than in most industrial treatment
plants thereby creating a more suitable environment for the NBS degrad-
ing microorganisms. Kölbener et al. (1994) reported only incomplete
degradation of 3-NBS in a purely industrial sewage treatment plant and
Locher et al. (1989) found the isolated bacteria tobe intolerant to saline
environments.
The only major difference between our findings and the literature was
the fact that 4-NBS was readily degraded both in the treatment plant at
Herisau and in the laboratory experiments. Kölbener et al. (1994) found
4-NBS to be non-biodegradable with sludge from Herisau. On the other
band, the observation that 3-NBS is not readily degraded by non-indus-
trial sewage sludges is again in accordance with Kölbener. The inherent
potential of the STP Zurich-Glatt to eventually degrade 3-NBS may be
explained by the partially industrial origin of the waste water which
makes the STP Zurich-Glatt not a purely municipal waste water treatment
plant.
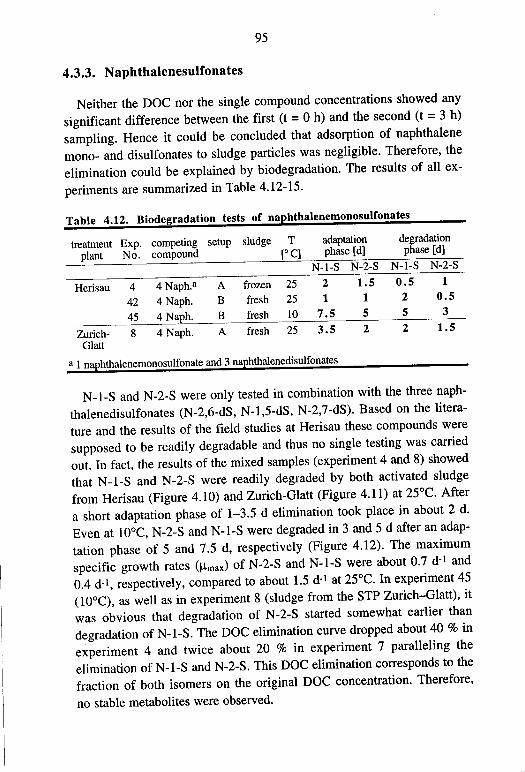
95
4.3.3. Naphthalenesulfonates
Neither the DOC nor the single compound concentrations showed any
significant difference between the first (t = 0 h) and the second (t = 3 h)
sampling. Hence it could be concluded that adsorption of naphthalene
mono- and disulfonates to sludge particles was negligible. Therefore, the
elimination could be explained by biodegradation. The results of all ex-
periments are summarized in Table 4.12-15.
Table 4.12. Biodegradation tests of naphthalenemonosulfonates
treatment Exp. competing setup sludge T adaptation degradation
plant No. compound [OC] phase [d] phase [d]
N-1-S N-2-S N-1-S N-2-S
Herisau 4 4 Naph.a A frozen 25 2 1.5 0.5 1
42 4 Naph. B fresh 25 1 1 2 0.5
45 4 Naph. B fresh 10 7.5 5 5 3
Zurich- 8 4 Naph. A fresh 25 3.5 2 2 1.5 Glatt
a 1 naEhthalenemonosulfonate and 3 naEhthalenedisulfonates
N-1-S and N-2-S were only tested in combination with the three naph-
thalenedisulfonates (N-2,6-dS, N-1,5-dS, N-2,7-dS). Based on the litera-
ture and the results of the field studies at Herisau these compounds were
supposed to be readily degradable and thus no single testing was carried
out. In fact, the results of the mixed samples (experiment 4 and 8) showed
that N-1-S and N-2-S were readily degraded by both activated sludge
from Herisau (Figure 4.10) and Zurich-Glatt (Figure 4.11) at 25°C. After
a short adaptation phase of 1-3.5 d elimination took place in about 2 d.
Even at 10°C, N-2-S and N-1-S were degraded in 3 and 5 d after an adap-
tation phase of 5 and 7 .5 d, respectively (Figure 4.12). The maximum
specific growth rates (µmax) of N-2-S and N-1-S were about 0.7 d-1 and
0.4 d-1, respectively, compared to about 1.5 d-I at 25°C. In experiment 45
(10°C), as well as in experiment 8 (sludge from the STP Zurich-Glatt), it
was obvious that degradation of N-2-S started somewhat earlier than
degradation of N-1-S. The DOC elimination curve dropped about 40 % in
experiment 4 and twice about 20 % in experiment 7 paralleling the
elimination of N-1-S and N-2-S. This DOC elimination corresponds to the
fraction of both isomers on the original DOC concentration. Therefore,
no stable metabolites were observed.

96
--t•--ooc ~N-2,6-dS
-+-N-1-S -O--N-1,5-dS -X- N-2-S ---l:r-- N-2,7-dS
100
~ 80 !;f. ........ ::: 60 ~ ~ ;::., " 40
20 X
0 1\ ~ ~ +X+-X
5 10 15 25 days
Figure 4.10. Degradation curves of naphthalenesulfonates tested with sludge from the STP Herisau at 25°C, exp. 4, setup A
100
80
~ ........ ,-, 60 .c
i tr 40
20
+ 0 X, \ x-x X 1 ~
5 10 15 20 25 days
Figure 4.11. Degradation curves of naphthalenesulfonates tested with sludge from the STP Zurich-Glatt at 25°C, exp. 8, setup A. for legend see Figure 4.10.

97
100 l.n.a~ . ·x ·+
' ·+ ..... 80 \ '\ ~ .-, .c 60 ~ \ \ ~ ... ._, C.I 40
\ \ 20
0 X X X 5 10 15 20 25
days
Figure 4.12. Degradation curves of naphthalenesulfonates tested with sludge from the STP Herisau at 10°C, exp. 45, setup B. for legend see Figure 4.10.
As expected, the disulfonated naphthalenes were more difficult to de-grade. Generally, all three isomers showed a steady linear decrease in concentration to about 60-80 % of the original concentration during the course of the experiment provided that no exponential degradation phase occurred. However, these linear degradation phases were limited to ex-periments with setup A indicating that a physical rather than a biological process may account for the observed kinetics. In Table 4.13-15 the end of the adaptation phase was therefore defined as the beginning of the ex-ponential decrease of the degradation curve and not as the usual crossing of the 90 % value.
In accordance with the literature (Wittich 1984, Nörtemann & Knackmuss 1988) N-2,6-dS was relatively readily biodegraded. At 25°C both sludges from the STP Herisau and the STP Zurich-Glatt were able to degrade N-2,6-dS in mixtures in about 3 d (experiment 4 and 8) after an adaptation phase of about 5 and 13 d, respectively (Figure 4.10-11). Even at 10°C, N-2,6-dS was fully degraded by sludge from Herisau within 28 d (Figure 4.12). In both experiment 4 and 8 the DOC elimination curve dropped by about 20% during the elimination of N-2,6-dS which corre-

98
sponds to the fraction of N-2,6-dS in the initial DOC. Hence, no accumulation of stable metabolites was expected.
Table 4.13. Biodegradation tests of naphthalene-2,6-disulfonate
treatment plant
Herisau
Zurich-Glatt
Exp. No.
36 34 4 42 45 8
competing setup compound
A 2 Naph.3 A 4 Naph.b A 4 Naph. B 4 Naph. B 4 Naph. A
sludge T adaptation degradation [OC] phase [d] phase [d]
fresh 25 n.e. n.e. fresh 25 8 7
frozen 25 5 3 fresh 25 16 6 fresh 10 15 9 fresh 25 13 3
a 2 naphthalenedisulfonates, b 2 naphthalenemonosulfonate and 2 naphthalenedisulfo-nates, n.e. = not eliminated
Table 4.14. Biode~radation tests of naehthalene-1,5-disulfonate
treatment Exp. competing setup sludge T adaptation degradation plant No. compound [OC] phase [d] phase [d]
Herisau 35 A fresh 25 n.e. n.e. 34 2 Naph.a A fresh 25 n.e. n.e. 4 4 Naph.b A frozen 25 n.e. n.e.
42 4 Naph. B fresh 25 n.e. n.e. 45 4 Naph. B fresh 10 n.e. n.e.
Zurich- 8 4 Naph. A fresh 25 n.e. n.e. Glatt
a 2 naphthalenedisulfonates, b 2 naphthalenemonosulfonate and 2 naphthalenedisulfo-nates, n.e. = not eliminated
In mixed systems, degradation of N-2,6-dS started only after the elimination of the naphthalenemonosulfonates. However, it is not clear whether the degradation of N-2,6-dS was initiated by the previous degradation of N-2-S and N-1-S. In experiment 34 (setup A) in which only the three naphthalenedisulfonates were tested with sludge from Herisau, N-2,6-dS was also fully degraded after an adaptation phase of about 8 days. In experiment 42 using the same sludge with setup B the adaptation phase of N-2,6-dS was twice as long even though both monosulfonates were present and fully degraded within 5 days. Hence,

99
degradation of N-2,6-dS seems not tobe enhanced but rather suppressed by the presence of the naphthalenemonosulfonates.
N-1,5-dS was not biodegraded in any of the experiments. Although the concentration in all experiments with setup A linearly decreased well be-low 90 % of the original concentration, no indication of an exponential decrease was observed. In the experiments with setup B, N-1,5-dS was never measured below 95 % of the original concentration.
Biodegradation of N-2,7-dS was observed with both sludge from the STP Herisau and the STP Zurich-Glatt. However, the adaptation phases were much longer than for N-2,6-dS and not all experiments showed degradation. In experiment 4 (sludge from Herisau), the exponential phase started after 14 days and by day 23 N-2,7-dS was fully eliminated. In experiment 8 (sludge from Zurich-Glatt) the degradation started at day 23 and the concentration was down to 31 % of the original value at the end of the experiment (day 28).
Table 4.15. Biode~radation tests of nal!hthalene-2,7-disulfonate
treatment Exp. competing setup sludge T adaptation degradation plant No. compound [o C] phase [d] phase [d]
Herisau 37 A fresh 25 14 6 34 2 Naph.a A fresh 25 n.e. n.e. 4 4 Naph.b A frozen 25 14 7
42 4 Naph. B fresh 25 n.e. n.e. 45 4 Naph. B fresh 10 n.e. n.e.
Zurich- 8 4 Naph. A fresh 25 22 > 6 Glatt
a 2 naphthalenedisulfonates, b 2 naphthalenemonosulfonate and 2 naphthalenedisulfo-nates, n.e. = not eliminated
Although N-2,7-dS was always degraded after N-2,6-dS, the capacity of the sludges to biodegrade N-2,7-dS seemed not to depend on the presence of N-2,6-dS or other naphthalene sulfonate isomers. In experiment 37, N-2,7-dS was tested as single compound with sludge from Herisau using setup A. The degradation started after about 14 days and at day 22 N-2,7-dS was fully eliminated. To check whether the degradative capacity was still present after 3 days, a second spike of N-2,7-dS (25 mg/L DOC) was added to the test sample. As shown in Figure 4.13 degradation started

100
instantly. However, it seems that as long as N-2,6-dS was present in the sample no biodegradation of N-2,7-dS would take place. In all experi-ments biodegradation of N-2,7-dS started at least 4 days after N-2,6-dS had completely vanished.
100
~ 80
:= 60 g, :::._ .... tr 40
20
0 0
• DOC
----0--- N-2,7-dS
5 10 15 days
20 25 30
Figure 4.13. Degradation curve of naphthalene-2,7-disulfonate tested with sludge from the STP Herisau at 25°C, exp. 37, setup A. At day 25 a secont portion of N-2,7-dS (25 mg C/L) was added to the test solution.
Based on the results discussed above, the naphthalenemono- and -disul-fonates can be arranged in the following order according to their biode-gradability: N-2-S > N-1-S » N-2,6-dS > N-2,7-dS » N-1,5-dS. This is in good agreement with the relative elimination rates found in the field studies at Herisau. Although N-1-S is eliminated almost cuncurrently with N-2-S under optimum conditions (see 3.3.4 and experiment 4), the differ-ence becomes obvious when the sludge is not fully adapted. In the studies BW3 and BW5 elimination of N-1-S was only 91 % and 84 %, respective-ly, compared to 96 % and 91 % for N-2-S. In experiment 8 (sludge from the STP Zurich-Glatt) degradation of N-1-S was delayed by two days compared to N-2-S (Figure 4.11) even though the degradation rates were very similar. Testing sludge from the STP Herisau at 10°C (Figure 4.11), the adaptation phase of N-2-S was about 2 d shorter than that of N-1-S and the maximum specific growth rate (µmax) of the N-2-S degrading organisms was about 0.7 d-1 compare to 0.4 d-1 for those of N-1-S.

101
N-2,6-dS and N-2,7-dS were eliminated somewhat better than expected in the studies at the STP Herisau in consideration of the results of the lab-oratory experiments. During the non-optimum conditions of BW4, N-2,6-dS was eliminated by 82 % even though the concentration was about 5 and 40 times smaller than the concentrations of N-1-S and N-2-S, respectively. In the same study about 63 % elimination of N-2,7-dS was observed. Hence, in contrast to the laboratory experiments, the activated sludge in the STP Herisau was able to degrade N-2,6-dS and N-2,7-dS concurrently with the monosulfonated naphthalenes, and this under con-ditions when not even the latter were completely degraded.
One explanation could be that for each isomer a specific organism de-veloped in the sludge. The relative amounts of these organisms would de-pend on their growth kinetics and the relative concentrations of the dif-ferent isomers in the waste water. N-2,6-dS has by far the smallest con-centration of all the investigated naphthalenesulfonate isomers, and there-fore the amount of N-2,6-dS degrading organisms would be small com-pared to the organisms which are specialized on naphthalenemonosulfo-nates. In the laboratory experiments the concentrations of all isomers were equal which means that the activity of the N-2,6-dS degrading or-ganisms would only be observed after they built up a population as large as those of the monosulfonate degrading organisms. A closer investigation of experiment 34 might confirm this hypothesis: Due to the fact that the products used for testing were not absolutely pure, small amounts of N-1,6-dS were initially found in all test mixtures containing the three naphthalenedisulfonates. Based on the results of the field studies N-1,6-dS is expected tobe almost as readily degraded as N-2,6-dS, but certainly not much better. However, degradation of N-1,6-dS in experiment 34 (also in experiment 42 and 45) started almost instantaneously and after 4 days the corresponding peak had disappeared whereas N-2,6-dS degradation was first observed only after about 8 days (Figure 4.14). The concentration of N-1,6-dS in the waste water is about 10 times higher than the N-2,6-dS concentration, and therefore the original amount of N-1,6-dS degrading organisms in the activated sludge can be expected to be higher than the amount of N-2,6-dS degrading organisms. On the other hand, the N-1,6-dS concentration in the test sample was probably less than 1 % of the N-2,6-dS concentration; hence, the degradation of N-1,6-dS would be instantaneously observable whereas a decrease in N-2,6-dS concentration

102
would only be measurable after the buildup of a !arger population of N-2,6-dS degrading organisms.
Differences in concentration, however, can not be the only explanation for the different behaviour of naphthalenedisulfonates in the STP Herisau and in the laboratory experiments. According to the hypotheses described above degradation of N-2,7-dS in the laboratory experiments should start much earlier than observed. The concentration of N-2,7-dS in the waste water is at least 3 times higher than the N-2,6-dS concentration. On the other hand, an explanation based on differences in growth kinetics would not explain why degradation of N-2,7-dS in experiment 37 started after 14 days whereas in experiment 34 with the same sludge and the same setup no degradation at all was observed.
The compound which is assumed to be N-1,7-dS was also found in small amounts in the mixture of experiment 34. As shown in Figure 4.14 this compound was readily degraded until 20 % of the original concen-tration, but then no further elimination was observed. lt seems that this peak consisted of at least two compounds. However, it is questionable whether the compositions of the peak in experiment 34 and the peaks in the Herisau studies were identical because the latter was barely eliminated during sewage treatment. Another small peak found in experiment 34 was not eliminated at all. A comparison with a naphthalene-1,3,6-trisulfonate reference chromatogram indicated that this compound may be a naph-thalenetrisulfonate isomer, what again would explain the poor elimi-nation.
The experiments discussed above clearly show that N-2,6-dS and N-2,7-dS can be degraded with activated sludge from different sewage treatment plants in laboratory experiments. N-2,6-dS and N-1,6-dS were already known to be biodegradable and a specific organism was isolated by Wittich (1984). In addition, no naphthalenedisulfonates were found to be adsorbed to sludge particles. Therefore, it is straightforward to conclude that the elimination of these compounds observed in the STP Herisau was actually due to biodegradation.
In contrast to the experiments with 3-NBS, the activated sludge from the STP Zurich-Glatt did not represent the conditions in a naphthalenesul-fonate free sewage treatment plant. Only after the biodegradation experi-ment had been carried out, the introduction of the highly selective and

103
sensitive fluorescence detection revealed that traces of mono- and disul-fonated naphthalenes were also present in the raw waste waters of the STP Zurich-Glatt. In a composite sample (7 d) which was used as blank matrix for the calibration of the samples from Herisau, all six mono- and disulfonated naphthalenes were found in concentrations between 0.2 µg/L (N-2,6-dS) and 2.7 µg/L (N-2-S, N-1,6-dS). Consequently, the similar re-sults of experiment 4 and 8 are no longer surprising. Moreover, the presence of naphthalenesulfonates in the municipal STP Zurich-Glatt also indicates that these compounds might originate from more sources than expected up to now.
100
~ 80
~
:= 60 c ~ 40 <,;
20
0
Figure 4.14.
5 10
--1•-- N-2,6-dS
--.1Ak--- N-2,7-dS
-...-- N-1,5-dS
15 days
20 25
--0- N-1,6-dS
~ (N-1,7-dS)
--o-- N-triS
Degradation curves of naphthalenedisulfonates tested with sludge from the STP Herisau at 25°C, exp. 34, setup A. The compounds represented by white signs were only present as impurities.

105
5. DETERMINATION OF AROMA-TIC SULFONATES IN RIVER WATERS. AND LEACHATES
Solid-phase extraction with Cp-B proved tobe a powerful tool for the extraction of anionic aromatic compounds from complex aquatic ma-trices. In particular, with respect to the analysis of surface waters, the absence of chromatographically interferring humic substances in the Cp-B extracts was a big advantage over the ion-pair extraction method. In this chapter, three applications of SPE with Cp-B to river water and leachate samples will be briefly discussed.
5.1. River Waters
The matrix of surface waters is quite different from that of waste wa-ters. Inorganic salt concentrations in river waters are generally much lower. On the other band, humic substances contribute largely to the dissolved organic matter. In addition, the usually low concentrations of xenobiotic compounds in surface waters require larger sample volumes to be extracted.
Figure 5 .1. shows three chromatograms obtained from samples which were simultaneously collected from the effluent of the STP Herisau and from the river Glatt 50 m upstream and downstream of the treatment plant. No significant difference can be observed between the chromatograms of the 100 mL effluent sample and the 200 mL efflu-ent/receiving water mixture. The humic substances usually forming a large hump at elution times of 20 to 35 min are almost completely absent. Moreover, all the important compounds could fully be recovered from sample volumes which exceeded the usual range for waste water samples (25-100 mL) without increasing the amount of Cp-B (250 mg) used for extraction. Only the most hydrophilic 3-ABS was not fully recovered from the 200 mL samples. Concentrations of 3-NBS and N-2-S in the river Glatt downstream of the STP were 360 µg/L and 27 µg/L, respectively, compared to 688 µg/L and 52 µg/L in the STP effluent. Apart from about 0.5 µg/L N-2-S, none of the aromatic sulfonates were found in the river Glatt upstream of the STP.

c .2 e: 0 U) .c m
0
B
c 10
106
1
20 time [min)
2
1
2
2
30 40
Figure 5.1. Chromatograms 0„=220 nm) obtained from (A) an effiuent sample (100 mL) from the STP Herisau and river Glatt sam-ples (200 mL) from 50 m (B) downstream and (C) upstream of the STP. Gradient: from 10% to 45% organic eo-solvent (80% methanol/20% acetonitrile) in 35 min. (1) 3-nitroben-zenesulfonate, (2) naphthalene-2-sulfonate.
Some 1 L samples from the river Rhine in Basel (Palmrain Bridge, Switzerland) were extracted using 1 g Cp-B SPE cartridges. The identi-fied compounds and their estimated concentrations are listed in Table 5.1. 3-NBS, N-2-S, and N-1,5-dS were regularly observed in concentrations well below 1 µg/L. However, the relatively high concentrations of 2-aminonaphthalene-1,5-disulfonate ( 4.5 µg/L) and 2,4-dichlorobenzoic acid (5.3 µg/L) in certain samples illustrated that it might actually be worthwhile to screen for aromatic anions. Supposing the 2,4-dichloroben-zoic acid, which was found in a seven day composite sample, occurred during only one day, the actual concentration could have been in the or-der of 40 µg/L or more.

107
Table 5.1. Concentrations (µg/L) of aromatic sulfonates and carboxylates found in river Rhine samples (1 L) from Basel.
compound
3-nitrobenzenesulfonate naphthalene-2-sulfonate naphthalene-1,5-disulfonate 2-aminonaphthalene-1,5-disulfonate 2,4-dichlorobenzoic acid benzoic acid
sample l 26.5.1993
0.3 0.4 0.5
4.4-4.8
• 7 day composite sample, b not quantitated
1 A
UV spectrum of peak 2 COOH qc1 Cl
250 300 350 wavelength [nm]
20 24 28
1
time [min]
sample2 sample3• 22.6.1993 29.6.-5.7.1993
1.2 0.3-0.4 0.4 0.1 0.8 0.2-0.3
5.3 nqb
2
32 36 40
Figure 5.2. Chromatograms (/i,=220 nm) obtained from a river Rhine sample (1 L) from Basel extracted with (A) 1 g of C18 ad-sorbent and 5 mM TBA-Br and (B) 1 g of Carbopack B. Gradient: from 10% to 50% organic modifier (methanol) in 40 min. (1) unknown (see text), (2) 2,4-dichlorobenzoic acid, (3) naphthalene-2-sulfonate.

108
Figure 5.2. illustrates the difference between river Rhine samples ex-tracted by SPE with TBA/C1s and with Cp-B, respectively. The hump formed by humic substances was drastically reduced in the chromatogram of the Cp-B extract (see also Figure 2.6). However, the peak correspond-ing to 2,4-dichlorobenzoic acid (peak 2) was easily determinable in both cases. The UV spectrum of the sharp peak eluting at 31 min (peak 1) and the fact that this peak is absent in the Cp-B chromatogram indicates an amino- and hydroxy-substituted naphthalenesulfonate which is not ex-tractable with Cp-B.
5.2. Leachates from Waste Dump Sites
In areas where ground water is used for drinking water production, waste dump sites might be an immediate threat for the ground water quality. Therefore, the Cp-B method was applied to high DOC samples (dissolved organic carbon: 10-20 mg C/L) from the waste dump site Tännlimoos (Zug, Switzerland) to screen for aromatic sulfonates. As a re-sult, the same unsubstituted naphthalenemono- and -disulfonates as in the STP Herisau were found in most samples in concentrations of up to 20 µg/L. In addition, 4-aminonaphthalene-1-sulfonate, 2-aminonaphtha-lene-1,5-disulfonate, 2-aminonaphthalene-4,8-disulfonate and 2-amino-5-chloro-4-methylbenzenesulfonate were identified in one sample. A list of the compounds with their estimated concentrations is given in Table 5.2 and a typical fluorescence chromatogram with all naphthalenesulfonates is shown in Figure 5.3. The detection limits for naphthalenesulfonates ex-tracted from 250 mL samples with 500 mg Cp-B were approximately 50 ng/L (injection volume: 250 µL).
The dump site Tännlimoos is filled with construction waste and bottom ashes of waste incinerators. Therefore, one probable source of the naph-thalenesulfonates in these leachates are sulfonated naphthalene-formalde-hyde condensates used as admixtures (superplasticisers) in the production of concrete. However, no obvious source could be found for the occur-rence of the aminonaphthalenesulfonates and the 2-amino-5-chloro-4-methylbenzenesulfonate. Again, reductive cleavage of azo dyes in the anaerobic compartments of the dump site might be a possible explanation. But neither chemical wastes nor sewage sludges from treatment plants

109
connected to chemical or textile industries are reported to be deposited at the Tännlimoos dump site.
Table 5.2. Aromatic sulfonates identified in leachate samples from the waste dump site Tännlimoos (Canton of Zug, Switzerland) and their estimated concentrations (µg/L).
compound
naphthalene-1-sulfonate naphthalene-2-sulfonate naphthalene-2,6-disulfonate naphthalene-1,5-disulfonate naphthalene-2,7-disulfonate naphthalene-1,6-disulfonate 4-aminonaphthalene- l-sulfonate 2-aminonaphthalene-1,5-disulfonate 2-aminonaphthalene-4,8-disulfonate 2-amino-5-chloro-4-methylbenzenesulfonate
sample l•
10 20
10 10-15 10-15
5 5-10 15-20 60-80
sample 2•
1-2 2-3
5-10
a determined with UV detection, b determined with fluorescence detection
~ ~ ~ B e ..2 e c
"' ..2 ..2 c 51 ..2 "3
~ 51 ~
~ "' ~ r- 1;!
~ ~ c c ..2 ..2 c 0 ~ ] Cl) "3 ~ "' c :ä ~ "' "' ... ';;j ';;j = "' 0 ,q ';;j ..c: -5 :g Cl)
-5 l ..c: c ... N §- §- ~ ~ 0 1 e z z -5 g ~ z ..c: §-r.= :g z
l
10 12 14 16 18 20 time [min]
sample 3b
~ c ..2 51 ~ c "' ~ 1 z
2.6 9.9 0.3
1.2 0.7
Figure 5.3. Fluorescence chromatogram (Aex=230 nm, Aem=340 nm) obtained from a leachate sample of the waste dump site Tänn-limoos (Zug, Switzerland). Gradient: from 25% to 50% orga-nic modifier (80% methanol/20% acetonitrile) in 25 min.

110
To investigate whether aromatic sulfonates can be found in bottom ashes from waste incinerators, basic extracts of different bottom ashes (Ferrari, dissertation in preparation) were extracted with Cp-B after neutralisation and filtration. As expected, no aromatic sulfonates were observed in these extracts. On the other hand, benzoic acid, phthalic acid, and terephthalic acid were identified in all samples thus demonstrating the successful use of the SPE method with Cp-B for the determination of aromatic carboxylic acids in complex matrices. The sum of benzoic acid (0.5-0.7 mg/L), phthalic acid (0.3-0.7 mg/L), and terephthalic acid (1.0-1.6 mg/L) made up about 1 % of the extracts DOC (50-60 mg C/L). A chromatogram of a bottom ash extract with Cp-B is shown in Figure 5.4.
1 3
= t 2
10 12 14 16 18 20 time [min]
Figure 5.4. Chromatogram (l,=220 nm) obtained from a extract of bottom ash (25 mL) extracted with 250 mg Carbopack B. Gradient: from 5% to 45% organic modifler (methanol) in 20 min. (1) terephthalic acid, (2) phthalic acid, (3) benzoic acid.

111
6. CONCLUSIONS AND OUTLOOK By using a newly developed solid-phase extraction method with Carbo-
pack B and reversed-phase ion-pair liquid chromatography with UV- and fluorescence detection, it was possible to investigate the fate and beha-viour of several benzene- and naphthalenesulfonates in the municipal STP Herisau which receives waste waters from the textile finishing industry. lt was shown that municipal STP's are able to eventually develop a degradative capacity for xenobiotic industrial sulfonates. Under optimum conditions (dry weather flow, acclimated activated sludge) even com-pounds such as 3-NBS and some naphthalenedisulfonate isomers, which were reported to be not readily biodegradable, were almost completely eliminated during waste water treatment. By combining field studies and laboratory experiments (OECD 302 B biodegradation tests) it was shown that aerobic biodegradation was solely responsible for the elimination. However, biodegradation was limited to compounds with not more than two substituents. Aminobenzene- and aminonaphthalenedisulfonates were not eliminated at all.
Elimination of benzene- and naphthalenesulfonates in the STP Herisau strongly depended on meteorological conditions and on the acclimatisation of the activated sludge. High waste water flows and longer absences of aromatic sulfonates in the waste water drastically reduced the degradative capacity. Under such conditions concentrations of 0.5-0.7 mg/L 3-NBS and 100-200 µg/L N-2-S were measured in the River Glatt (St.Gallen, Switzerland) downstream of the STP Herisau. These local concentrations were much higher than those of other xenobiotic compounds in surface waters (FW A's, pesticides, chlorinated hydrocarbons etc.), which raises the question of the potential impact on the aquatic ecosystem. So far, ecological problems connected with the presence of aromatic sulfonates have not been reported. However, although benzene- and naphthalenesul-fonates exhibit a low acute toxicity, the ecotoxicological effects of aro-matic sulfonates are only poorly investigated.
A review article about analysis of aromatic sulfonates from the aquatic environment, which will be published in 1996, will illustrate the very small number of environmental studies currently existing in this field (Reemtsma, in press). However, the analytical methods described and

112
cited in this dissertation now enable investigations of benzene- and naph-thalenesulfonates in almost every aquatic environment, and therefore it seems advisable to establish whether still unknown sources of these com-pounds are present. In particular, waste dump sites and areas of chemical industries should be target areas of future environmental studies. The following examples will illustrate this requirement: Zerbinati et al. (1994) found up to 1.6 g/L N-2,7-dS, 2-hydroxynaphthalene-3,6-disulfonate and other naphthalenesulfonates in a spring polluted by landfills situated in an area of chemical industry in Italy. 4-Chlorobenzenesulfonate and disul-fonated pesticides were observed in leachates from the Stringfellow haz-ardous waste site (California, USA) (Brown et al. 1991), and up to 400 µg/L dinitrotoluenesulfonates were found in leachates from dump sites of a TNT producing plant in Germany (Holzstein 1991). Finally, as described in Chapter 5 of this work, several aromatic sulfonates were found in leachates from a dump site of construction waste and bottom ash.
Construction waste as a potential source of naphthalenesulfonates in the environment has not been investigated up to now. Since before World War II sulfonated naphthalene formaldehyde condensates have been used as plasticisers in concrete (Reul 1991). But construction waste was usually considered to be more or less inert, and therefore no special dump sites were used for disposal. However, the potential of naphthalenesulfonates to be washed out through leachates might produce a threat to ground water sources and eventually to drinking water production. Although some naphthalenesulfonates were shown to be aerobically biodegradable, no biodegradition under anaerobic conditions has yet been observed in na-ture. The origin of naphthalenesulfonates in dump sites and their be-haviour in anaerobic compartments are currently investigated in this insti-tute (Riediker, dissertation in preparation).
Future analytical method development should focus on sulfonated naphthalene formaldehyde condensates which can be found in many textile auxiliaries and concrete admixtures. The peak group II in Figure 3.3 (see chapter 3.3.1) probably consists of such compounds. The monomeric mono- and disulfonated naphthalenes observed so far in waste waters and environmental samples might be only the tip of an iceberg.
113
REFERENCES
Aldrich catalog. (1992-93) Altenbach, B., and Giger, W. (1995). Determination of benzene- and
naphthalenesulfonates in wastewater by solid-phase extraction with graphitized carbon black and ion-pair liquid chromato-graphy with UV detection. Anal. Chem., 67, 2325-2333.
Autry, A. R., and Fitzgerald, J. W. (1990). Sulfonate S: A major form of forest soil organic sulfur. Biol. Fertil. Soils, 10, 50-56.
Badertscher, M. (1992). Statistische Auswertung von experimentellen Rohdaten. , ETH Zürich.
Bastian, B., Haberer, K., and Knepper, P. (1995). Untersuchung zur Wasserwerks- und Trinkwassergängigkeit von aromatischen Sulfonaten. Vom Wasser, 84, 369-378.
Bastian, B., Knepper, T. P., Hoffmann, P., and Ortner, H. M. (1994). Determination of aromatic sulfonic acids in industrial waste water by ion-pair chromatography. Fresenius J. Anal. Chem., 348, 674-679.
Baugham, G. L., and Weber, E. J. (1994). Transformation of dyes and related compounds in anoxic sediment: kinetics and products. Environ. Sei. Technol., 28, 267-276.
Bema, J. L., Ferrer, J., Moreno, A., Prats, D., and Ruiz Bevia, F. (1989). Fate of LAS in the environment. Tenside Surfactants Deterg, 26, 101.
Brouwer, E. R., Slobodnik, J., Lingeman, H., and Brinkman, U. A. T. (1992). Determination by reversed-phase ion-pair chromato-graphy of aromatic sulphonic acids in surface water. Analusis, 20, 121-126.
Brumley, W. C. (1992). Qualitative analysis of environmental samples for aromatic sulfonic acids by high-performance capillary electro-phoresis. J. Chromatogr., 603, 267-272.
Brunner, P. H„ Capri, S., Marcomini, A., and Giger, W. (1988). Occurrence and behaviour of LAS, nonylphenol, nonylphenol mono- and nonylphenol diethoxylates in sewage and sewage sludge treatment. War. Res., 22, 1465-1472.
Burkinshaw, S. M., Hinks, D., and Lewis, D. M. (1993). Capillary zane electrophoresis in the analysis of dyes and other compounds employed in the dye-manufacturing and dye-using industries. J. Chromatogr., 640, 413-417.

114
Cellulose Attisholz SA. (1975). La station d'epuration des eaux de Herisau.
Cerfontain, H. (1982). On the sulfonation positional reactivity order of arenesulfonic acids. J. Org. Chem., 47, 4680-4688.
Chen, S., and Pietrzyk, D. J. (1993). Separation of sulfonate and sulfate surjactants by capillary electrophoresis: effect of buffer cation. Anal.Chem., 65, 2770-2775.
Chien, C.-C., Leadbetter, E. R., and Godchaux III, W. (1995). Sulfonate-sulfur can be assimilated for fermentative growth. FEMS Microbiol. Lett., 129, 189-194.
Chwala, A., and Anger, V. (1977). Handbuch der Textilhilfsmittel. Verlag Chemie, Weinheim, New York.
Community of Herisau. (1994). Ausbau ARA Herisau Technischer Bericht Anhang C.
Cook, A. (1994). Abbau von Arylsulfonaten. BioEngeneering, 10, 58-59. de Almeida, J. L. G., Dufaux, M., Ben Taarit, Y., and Naccache, C.
(1994). Lineare Alkylbenzene. J. Am. Oil. Chemistr. Soc., 71, 675-694.
DECHEMA. (1981). Entwicklung umweltfreundlicher Technologien in der Textilveredlungsindustrie. , Frankfurt.
Denger, K., Kertesz, M. A., Vock, E., Schön, R., Mägli, A., and Cook, A. M. Anaerobic desulfonation of 4-toluenesulfonate and 2-(4-sulfophenyl)butyrate by Clostridium sp. Appl. Environ. Microbiol., submitted
Deshpande, S. D., Chakrabarti, T., Subrahmanyam, P. V. R., and Sundaresan, B. B. (1985). Biological treatability of m-Amino-phenol plant wastewater containing structural isomers of benzene with different substituents. Wat. Res., 19, 293-298.
Di Corcia, A., and Marchetti, M. (1991). Multiresidue method for pesticides in drinking water using a graphitized carbon black cartridge extraction and liquid chromatographic analysis. Anal.Chem., 63, 580-585.
Di Corcia, A., Marchetti, M., Samperi, R., and Marcomini, A. (1991). Liquid chromatographic determination of linear alkylbenzene-sulfonates in aqueous environmental samples. Anal.Chem., 63, 1179-1182.
Di Corcia, A., Samperi, R., and Marcomini, A. (1994). Monitoring aromatic surfactants and their biodegradation intermediates in raw and treated sewage by solid-phase extraction and liquid chromatography. Environ. Sei. Technol., 28, 850-858.

115
Di Corcia, A., Samperi, R., Marcomini, A„ and Stelluto, S. (1993). Graphitized carbon black extraction cartridges for monitoring polar pesticides in water. Anal.Chem., 65, 907-912.
Di Corcia, A„ Samperi, R., Sebastiani, E., and Severini, C. (1980). Acid-washed graphitized carbon blackfor gas chromatography. Anal.Chem., 52, 1345-1350.
Dodson, V. (1990). Concrete admixtures. Van Nostrand Reinhold, New York.
Dunnivant, F. M„ Schwarzenbach, R. P„ and Macalady, D. L. (1992). Reduction of substituted nitrobenzenes in aqueous solutions containing natural organic matter. Environ. Sei. Techno!., 26, 2133-2141.
Feigel, B. J„ and Knackmuss, H.-J. (1993). Syntropie interactions during degradation of 4-aminobenzenesulfonic acid by a two species bacterial culture. Arch. Microbiol., 159, 124-130.
Ferrari, S. thesis in preparation, ETH Zurich. Fichtner, S„ Lange, F. T„ Schmidt, W„ and Brauch, H.-J. (1995).
Determination of aromatic sulfonates in the river Elbe by on-line ion-pair extraction and ion-pair chromatography. Fresenius J. Anal. Chem„ 353, 57.
Field, J. A„ Miller, D. J„ Field, T. M„ Hawthome, S. B., and Giger, W. (1992). Quantitative determination of sulfonated aliphatic and aromatic surfactants in sewage sludge by ion-pairlsupercritical fluid extraction and derivatisation gas chromatography!mass spectrometry. Anal.Chem„ 64, 3161-3167.
Focht, D. D„ and Williams, F. D. (1970). The degradation of p-toluene-sulfonate by a Pseudomonas. Can. J. Microbiol., 16, 309-316.
Fritz, J. S„ and Gillette, R. K. (1968). Separation of aromatic sulfonic acids with a liquid anion exchanger. Anal.Chem„ 40, 1777-1781.
Furukawa, N„ and Fujihara, H. (1991). Acidity, hydrogen bonding and metal complexation of sulfonic acids and derivatives. The chem-istry of sulfonic acids, esters and their derivatives, S. Patai and Z. Rappaport, eds„ Wiley, 261-281.
Giger, W„ Brunner, P. H„ Abel, M„ McEvoy, J„ Marcomini, A„ and Schaffner, C. (1987). Organische Waschmittelinhaltsstoffe und deren Abbauprodukte in Abwasser und Klärschlamm. Gas Wass-Abwass, 67, 111-122.

116
Greim, H., Ahlers, J., Bias, R., Broecker, B., Hollander, H., Gelbke, H.-P., Klimisch, H.-J., Mangelsdorf, 1., Paetz, A., Schön, N., Stropp, G., Vogel, R., Weber, C., Ziegler-Skylakakis, K., and Bayer, E. (1994). Toxicity and ecotoxicity of sulfonic acids: structure-activity relationship. Chemosphere, 28, 2203-2236. Grossenbacher, H., Thurnheer, T., Zürrer, D., and Cook, A. M. (1986). Determination of sulfonated aza dystuffs and their bacterial metabolites by high-performance liquid chromatography. J. Chromatogr., 360, 219-223. Gujer, W., and Larsen, T. A. (1995). The implementation of biokinetics and conservation principles in ASIM. Wat. Sei. Tech., 31, 257-266. Gutierrez, M. C., Gago, N., and Crespi, M. (1993). The use of HPLC in the determination of aromatic sulphonates. Tenside Surfactants Detergents, 30, 15-17. Haderlein, S. B., and Schwarzenbach, R. P. (1995). Environmental pro-cesses influencing the rate of abiotic reduction of nitroaromatic compounds in the subsurface. Biodegradation of nitroaromatic compounds, J. C. Spain, ed., Plenum Press, New York. Holzstein, W. (1991). Nachweis und Bestimmung von aromatischen Sulfonsäuren aus Rückständen der Sprengstoffproduktion in Sicker- und Brunnenwasser. Thesis, University of Marburg. Jandera, P., Churacek, J., and Bartosova, J. (1980). Reversed-phase liquid chromatography of aromatic sulfonic and carboxylic acids using inorganic electrolyte solutions as the mobile phase.
Chromatographia, 13, 485-492. Jandera, P., Churacek, J., and Taraba, B. (1983). Comparision of retention behaviour of aromatic sulfonic acids in reversed-phase systems with mobile phases containing ion-pairing ions and in systems with solutions of inorganic salts as the mobile phases. J. Chromatogr., 262, 121-140. Johannsen, K., Gross, H.-J., Gaukel, V., Sontheimer, H., and Frimmel, F. H. (1994). Adsorption ausgewählter Sulfonsäuren an Aktiv-kohle; Teil I!Il:. Vom Wasser, 83, 169-178. Junker, F., Field, J. A., Bangerter, F., Ramsteiner, K., Kohler, H.-P., Joannou, C. L., Mason, J. R., Leisinger, T., and Cook, A. M. (1994a). Oxygenation and spontaneous deamination of 2-amino-benzenesulfonic acid in Alcaligenes sp. strain 0-1 with subse-quent meta ring cleavage and spontaneous desulfonation to 2-hydroxymuconic acid. Biochem. J., 300, 429-436.

117
Junker, F., Leisinger, T., and Cook, A. M. (1994b). 3-Sulfocatechol 2,3-dioxygenase and other dioxygenases (EC 1.13.11.2 and EC 1.14.12. -) in the degradative pathways of 2-aminobenzene-sulfonic, benzenesulfonic and 4-toluenesulfonic acids in Alcali-genes sp. strain 0-1. Microbiology, 140, 1713-1722.
Katalog wassergefährdender Stoffe. (1988). Roth, Daunderer - Giftliste 33. Erg. Lfg. 7/88.
Kirn, 1. S., Sasinos, 1. F., Rishi, D. K., Stephens, R. D., and Brown, M. A. (1992). Determination of aromatic sulfonic acids in aqueous environmental samples by anion-exchange chromatography coupled to particle beam mass spectrometry and UV spectro-photometry. J. Chromatogr., 589, 177-183.
King, J. F. (1991). Acidity. The chemistry of sulfonic acids, esters and their derivatives, S. Patai and Z. Rappaport, eds., Wiley, 249-258.
Kölbener, P. (1995). Biodegradation of aromatic sulfonates - especially linear alkylbenzenesulfonates (LAS) - in a laboratory trickling filter. Thesis, ETH Zürich.
Kölbener, P., Baumann, U., Cook, A. M„ and Leisinger, T. (1994). 3-Nitrobenzenesulfonic acid and 3-aminobenzenesulfonic acid in a laboratory trickling filter: biodegradability with different activated sludges. Wat. Res„ 28, 1855-1860.
Lagerström, P.-0. (1982). Separation of structurally related aromatic sulphonic acids and sulphates in synthesis mixtures by ion-pair liquid chromatography. J. Chromatogr., 250, 43-54.
Lange, F. T., Wenz, M., and Brauch, H.-J. The behavior of aromatic sulfonates in drinking water production from River Rhine water and bankfiltrates. Analytical Methods and Instrumentation, submitted
Lange, F. T., Wenz, M., and Brauch, H.-J. (1995). Trace-level determi-nation of aromatic sulfonates in water by on-line ion-pair extractionlion-pair chromatography and their behavior in the aquatic environment. J. High Resol. Chromatogr., 18, 243.
Locher, H. H., Thurnheer, T., Leisinger T, C., and AM. (1989). 3-Nitrobenzenesulfonate, 3-Aminobenzenesulfonate, and 4-Aminobenzenesulfonate as sole carbon source for bacteria. Appl. Environ. Microbiol., 55, 492-494.
Mohan, P., Singh, R., and Baba, M. (1991). Potential anti-AIDS agents. Synthesis and antiviral activity of naphthalenesulfonic acid deri-vatives against HIV-1 and HIV-2. J. Med. Chem., 34, 212-217.

118
Moreno, A., Ferrer, J., Bevia, F. R., Prats, D., Vazquez, B., and Zazrzo, D. (1994). LAS monitoring in a lagoon treatment plant. Wat. Res., 28, 2183-2189.
Morrison, R. T., and Boyd, R. N. (1986). Lehrbuch der organischen Chemie. VCH Verlagsgesellschaft, Weinheim. Nörtemann, B., and Knackmuss, H.-J. (1988). Abbau sulfonierter Aromaten. Wasser Abwasser, 129, 75-79. Ochs, M., and Gälli, R. (1995). MBT Umwelttechnik. Perst, H. (1971). Oxonium ions in organic chemistry. Verlag Chemie, Weinheim. Petterson, C., and Schill, G. (1989). Ion-pair chromatography with divalent counter cations in reversed-phase systems.
Chromatographia, 28, 437-444. Poiger, T. (1994). Behavior and fate of detergent-derived fluorescent whitening agents in sewage treatment. thesis, ETH Zürich. Poiger, T., Field, J. A., Field, T. M., and Giger, W. (1993).
Determination of detergent-derived fluorescent whitening agents in sewage sludge by liquid chromatography. Analytical Methods and Instrumentation, 1, 104-113.
Prandi, C., and Venturini, T. (1981). Retention behaviour of aromatic sulfonic acids in ion-pair reversed-phase column liquid chroma-tography. Journal of Chromatographie Science, 19, 308-313. Reemtsma, T. (1994). Wirkung einer anaerob-aeroben biologischen Behandlung auf gelöste organische Stoffe in Gerbereiabwasser. thesis, Technische Universität Berlin. Reemtsma, T. (in press). Methods of analysis of aromatic sulfonates from the aquatic environment: A review. Chromatography in environmental analysis: water pollution, E. Heftman, Elsevier, Amsterdam. Reemtsma, T., and Jekel, M. (1994). Analysis of sulphonated polyphenols, synthetic tanning agents in heavily polluted tannery wastewaters. J. Chromatogr., 660, 199-204. Reemtsma, T., Jochimsen, J., and Jekel, M. (1993). Persistence of sulfo-nated polyphenols in the biological treatment of industrial wastewater. Vom Wasser, 81, 353-363. Reul, H. (1991). Handbuch Bauchemie. Verlag für ehern. Industrie, Augsburg. Riediker, S. thesis in preparation, ETH Zurich. Rys, P., and Zollinger, H. (1982). Farbstoffchemie. Verlag Chemie, Weinheim, Basel.

119
Schullerer, S., Brauch, H.-J., and Frimmel, F. H. (1990). Bestimmung organischer Sulfonsäuren in Wasser durch Ionenpaar-Chroma-tographie. Vom Wasser, 75, 83-97.
Schullerer, S., Koschenz, G., Brauch, H.-J., and Frimmel, F. H. (1992). Ein neuer Parameter zur summarischen Bestimmung organi-scher Schwefelverbindungen nach Ionenpaar-Extraktion: !OS. Vom Wasser, 78, 229-243.
Schwarzenbach, R. P., Gschwend, P. M., and Imboden, D. M. (1993). Environmental organic chemistry. Wiley, New York.
Shore, J. (1990). Colorants and auxiliaries. Society of Dyers and Colourists, West Y orkshire.
Soeder, C. J., Luther, M., and Kneife!, H. (1988). Abbaupotential von Mikroalgen unter besonderer Berücksichtigung der Desulfonie-rung aromatischer Sulfonsäuren. Wasser Abwasser, 129, 82-85.
Thurnheer, T., Cook, A. M., and Leisinger, T. (1988). Co-culture of defined bacteria to degrade seven sulfonated aromatic com-pounds: efficiency, rates and phenotypic variations. Appl Microbiol Biotechnol, 29, 605-609.
Thurnheer, T., Zürrer, D., Höglinger, 0., Leisinger, T., and Cook, A. M. (1990). Initial steps in the degradation of benzene sulfonic acid, 4-toluene-sulfonic acid, and orthanilic acid in Alcaligenes sp. strain 0-1. Biodegradation, 1, 55-64.
van Loon, W. M. G. M., Boon, J. J., and de Groot, B. (1993). Quantita-tive analysis of sulfonic acid groups in macromolecular ligno-sulfonic acids and aquatic humic substances by temperature-resolved pyrolysis-mass spectrometry. Environ. Sei. Techno!., 27, 2387-2396.
Voet, D., and Voet, J. G. (1995). Biochemistry. John Wiley & Sons, Inc., New York.
Weber, E. J., and Wolfe, N. L. (1987). Kinetic studies of the reduction of aromatic azo compounds in anaerobic sediment/water systems. Environ. Toxicol. Chem., 6, 911-919.
Wilder, D. R., Tindall, G. W., Cunningham, L. J., and Little, J. L. (1993). High-peiformance liquid chromatographic analysis of sulfonated aromatics using a b-cyclodextrin-bonded phase. J. Chromatogr., 635, 221-226.
Wittich, R.-M. (1984). Bakterieller Abbau substituierter Naphthalin-sulfonsäuren. thesis, Göttingen.

120
Wittich, R. M„ Rast, H. G., and Knackmuss, H.-J. (1988). Degradation of naphthalene-2,6- and naphthalene-1,6-disulfonic acid by a Moraxella sp. Appl. Environ. Microbiol., 54, 1842-1847. Zerbinati, 0., Ostacoli, G., Gastaldi, D., and Zelano, V. (1993). Determi-nation and identification by high-performance liquid chromato-graphy and spectrofluorimetry of twentythree aromatic sul-phonates in natural waters. J. Chromatogr„ 640, 231-240. Zerbinati, 0„ Salomone, S„ and Ostacoli, G. (1994). Suljonated deriva-tives of naphthalene in water samples of an ltalian river. Chemosphere, 29, 2639-2643. Zürrer, D„ Cook, A. M„ and Leisinger, T. (1987). Microbial desul-fonation of substituted naphthalenesulfonic acids and benzene-sulfonic acids. Appl. Environ. Microbiol., 53, 1459-1463.

Al
Appendix A
Textile Auxiliaries containing Aromatic Sulfonates (Ullmanns Enzyklopädie der technischen Chemie 1978)
Abbreviation: 3-NBS 3-nitrobenzenesulfonate PKAS polycondensated aromatis sulfonates
dispersing agents producer composition Tamol BASF polycondensated naphthalene-2-
sulfonates Setamol BL, WS BASF PKAS AvolanIS Bayer PKAS Dispersogen A, P Ciba-Geigy PKAS LyocolO Sandoz PKAS Matexil DA-AC ICI PKAS DS-14 Tanatex aromatic polysulfonates
hydrotropic agents Alkanol S Flakes DuPont tetrahydronaphthalenesulfonic acid
sodium salt Glyezin SB BASF N-benzylsulfanilic acid sodium salt
egalyzing agents Avolan IS Bayer condensated naphthalenesulfonates Ruco-Egalisierer POS Rudolf & Co. naphthalenesulfonates and
ethoxylation products Ruco-Egalisierer DOC Rudolf & Co. alkylarylsulfonates UnivadinPA Ciba-Geigy alky lary lsulfonates CibatexPA Ciba-Geigy PKAS Edolan PA W fl. Bayer aromatic sulfonates Levega!ER Bayer aromatic sulfonates TebanEST Th. Böhme aromatic sulfonates
reservation agents Ludigol BASF 3-NBS LyoprintRG Ciba-Geigy 3-NBS Reservesalz B ACNA 3-NBS Reservesalz 0 PUC-FMC 3-NBS CibatexPA Ciba-Geigy PKAS Erional HW, RF, WRN Ciba-Geigy PKAS EdolanPAW Bayer PKAS Mesito!HWS Bayer PKAS MesitolNBS Bayer PKAS Matexil PA-L ICI PKAS Tanisol BMW, WR ICI PKAS Thiotan PES fl. Sandoz PKAS

oxidyzing agents Ludigol LyoprintRG MatexilPA-L Prevatol SPW Protegal NBS Sei Reservol 0
dye protection agents MeropanSO
finishing agents DepsolinND Mesitol PS
A2
BASF Ciba-Geigy ICI Sandoz Protex PCUK
CHT
3-NBS 3-NBS 3-NBS 3-NBS 3-NBS 3-NBS
derivatives of benzenesulfonic acid
Ugine, Kuhlmann PKAS Bayer condensation products of
polycyclic aromatic sulfonates with formaldehyde
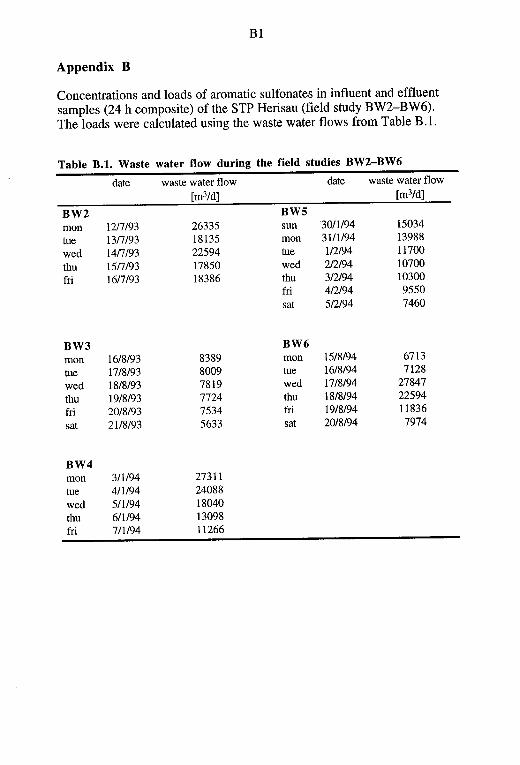
Bl
Appendix B
Concentrations and loads of aromatic sulfonates in influent and effluent samples (24 h composite) of the STP Herisau (field study BW2-BW6). The loads were calculated using the waste water flows from Table B.l.
Table B.1. Waste water flow during the field studies BW2-BW6
date waste water flow date waste water flow [m3/d] [m3/d]
BW2 BWS mon 1217/93 26335 sun 30/1/94 15034 tue 1317/93 18135 mon 31/1194 13988
wed 1417/93 22594 tue 112/94 11700
thu 1517/93 17850 wed 212194 10700 fri 1617/93 18386 thu 312194 10300
fri 4/2/94 9550 sat 512194 7460
BW3 BW6 mon 16/8/93 8389 mon 15/8/94 6713 tue 17/8/93 8009 tue 16/8/94 7128
wed 18/8/93 7819 wed 17/8/94 27847 thu 19/8/93 7724 thu 18/8/94 22594 fri 20/8/93 7534 fri 19/8/94 11836
sat 2118/93 5633 sat 20/8/94 7974
BW4 mon 3/1/94 27311 tue 411/94 24088 wed 511194 18040 thu 611194 13098 fri 7/1194 11266

B2
Table B.2. Field study BW2 (Jul. 12-16. 1993)
concentration [µg/L] load [g/d]
3-NBS influent effluent influent effluent mon 12n193 847 ± 25 61 ± 7 22302 ± 652 1600 ± 174 tue 1317/93 3438 ± 27 611 ± 7 62355 ± 485 11086 ± 123 wed 14n193 1676 ± 24 1118 ± 9 37869 ± 553 25262 ± 198 thu 15n/93 132 ± 26 20 ± 7 2348 ± 459 362 ± 120 fri 16n/93 0 ± 26 bd 0 ± 477 bd
4-NBS influent effluent influent effluent mon 1217/93 40.7 ± 1.1 4.4 ± 0.2 1071 ± 29 117 ± 6 tue 1317/93 161.1 ± 1.2 19.6 ± 0.2 2922 ± 21 356 ± 4 wed 1417/93 79.5 ± 1.1 27.0 ± 0.2 1797 ± 25 611 ± 5 thu 1517193 9.8 ± 1.1 1.3 ± 0.2 175 ± 20 23 ± 4 fri 1617193 bd bd bd bd
3-ABS influent effluent influent effluent mon 1217/93 71.3 ± 9.0 3.0 ± 2.3 1879 ± 236 78 ± 60 tue 1317/93 272.6 ± 9.5 21.0 ± 2.3 4943 ± 172 382 ± 41 wed 1417193 175.3 ± 8.9 16.5 ± 2.2 3960 ± 201 374 ± 50 thu 1517/93 79.2 ± 8.9 nq 1413 ± 159 nq fri 1617193 47.9 ± 9.1 nq 880 ± 167 nq
N-1-S influent effluent influent effluent mon 1217193 6.18 ± 1.02 0.57 ± 0.07 163 ± 27 15 ± 2 tue 1317193 5.74 ± 1.02 0.26 ± 0.07 104 ± 19 5 ± 1 wed 1417193 3.02 ± 1.03 0.17 ± 0.07 68 ± 23 4 ± 2 thu 1517193 0.96 ± 1.03 bd 17 ± 18 bd fri 1617193 0.09 ± 1.04 bd 2 ± 19 bd
N-2-S influent effluent influent effluent mon 1217193 39.2 ± 7.7 bd 1032 ± 204 bd tue 1317193 36.1 ± 7.8 bd 654 ± 141 bd wed 1417193 29.2 ± 7.8 bd 661 ± 176 bd thu 1517193 7.2 ± 8.0 bd 129 ± 143 bd fri 1617193 0.8 ± 8.1 bd 16 ± 149 bd bd = below detection limit, nq = not quantitated

B3
Table B.3. Field study BW3 (Aug. 16-21. 1993)
concentration [µg/L] load [g/d]
3-NBS influent effluent influent effluent mon 16/8/93 1602 ± 24 50 ± 7 13440 ± 205 418 ± 56 tue 17/8/93 3151 ± 26 1219 ± 9 25237 ± 209 9763 ± 74 wed 18/8/93 1147 ± 25 538 ± 7 8969 ± 192 4204 ± 52 thu 19/8/93 2479 ± 25 178 ± 6 19145 ± 193 1376 ± 50 fri 20/8/93 1274 ± 24 15 ± 7 9598 ± 184 111 ± 51 sat 21/8/93 72 ± 26 bd 406 ± 145 bd
4-NBS influent effluent influent effluent mon 16/8/93 83.1 ± 1.1 5.6 ± 0.2 698 ± 9 47 ± 2 tue 17/8/93 208.3 ± 1.3 49.9 ± 0.3 1669 ± 10 400 ± 2 wed 18/8/93 79.9 ± 1.1 34.7 ± 0.3 625 ± 9 271 ± 2 thu 19/8/93 173.1 ± 1.2 19.7 ± 0.2 1337 ± 9 152 ± 2 fri 20/8/93 165.4 ± 1.2 11.1 ± 0.2 1246 ± 9 83 ± 2 sat 21/8/93 76.7 ± 1.1 bd 432 ± 6 bd
3-ABS influent effluent influent effluent mon 16/8/93 429 ± 11 10 ± 2 3602 ± 96 84 ± 19 tue 17/8/93 737 ± 17 56 ± 3 5905 ± 138 451 ± 27 wed 18/8/93 613 ± 15 207 ± 12 4790 ± 115 1619 ± 93 thu 19/8/93 1220 ± 28 193 ± 11 9420 ± 215 1489 ± 86 fri 20/8/93 1280 ± 29 46 ± 3 9647 ± 221 350 ± 23 sat 21/8/93 543 ± 13 1 ± 2 3060 ± 75 5 ± 13
N-1-S influent effluent influent effluent mon 16/8/93 11.92 ± 1.01 0.77 ± 0.07 100 ± 8 6 ± 1 tue 17/8/93 29.06 ± 0.99 3.85 ± 0.07 233 ± 8 31 ± 1 wed 18/8/93 14.63 ± 1.01 2.32 ± 0.07 114 ± 8 18 ± 1 thu 19/8/93 8.38 ± 1.02 0.56 ± 0.07 65 ± 8 4 ± 1 fri 20/8/93 22.10 ± 0.99 0.54 ± 0.07 166 ± 7 4 ± 1 sat 21/8/93 15.25 ± 1.00 0.51 ± 0.07 86 ± 6 3 ± 0
N-2-S influent effluent influent effluent mon 16/8/93 78.4 ± 7.7 0.6 ± 0.3 657 ± 64 5 ± 3 tue 17/8/93 157.9 ± 8.6 18.6 ± 0.6 1264 ± 69 149 ± 5 wed 18/8/93 84.0 ± 7.7 5.7 ± 0.3 657 ± 60 44 ± 3 thu 19/8/93 54.5 ± 7.7 bd 421 ± 59 bd fri 20/8/93 126.3 ± 8.1 bd 952 ± 61 bd sat 2118/93 89.8 ± 7.7 bd 506 ± 44 bd
bd = below detection Iimit

B4
Table B.4. Field study BW4 (Jul. 12-16. 1993)8
concentration [µg/L] load [g/d)
3-NBS influent effluent influent effluent mon 3/1194 742 ± 25 495 ± 7 20262 ± 679 13531 ± 178 tue 411194 1249 ± 24 716 ± 7 30089 ± 590 17241 ± 170 wed 511194 1166 ± 25 621 ± 7 21033 ± 443 11200 ± 122 thu 611194 751 ± 25 37 ± 7 9838 ± 325 482 ± 87 fri 7/1194 335 ± 25 179 ± 6 3772 ± 286 2013 ± 72
4-NBS influent effluent influent effluent mon 3/1194 36.9 ± 1.1 18.1 ± 0.2 1007 ± 30 495 ± 6 tue 411194 60.5 ± 1.1 19.7 ± 0.2 1457 ± 26 474 ± 6 wed 511194 67.3 ± 1.1 12.5 ± 0.2 1213 ± 20 225 ± 4 thu 611194 46.9 ± 1.1 0.9 ± 0.2 615 ± 14 12 ± 3 fri 711/94 38.8 ± 1.1 2.7 ± 0.2 437 ± 12 30 ± 3
3-ABS influent effluent influent effluent mon 3/1194 31 ± 32 5 ± 32 854 ± 862 136 ± 862 tue 411194 81 ± 32 8 ± 32 1941 ± 761 194 ± 760 wed 511194 122 ± 32 10 ± 32 2194 ± 571 182 ± 569 thu 611194 125 ± 32 10 ± 32 1634 ± 415 134 ± 413 fri 7/1/94 160 ± 32 7 ± 32 1804 ± 357 84 ± 355
N-1-S influent effluent influent effluent mon 3/1/94 1.2 ± 2.8 0.0 ± 2.8 32 ± 77 0 ± 77 tue 411194 3.1 ± 2.8 0.6 ± 2.8 76 ± 68 15 ± 68 wed 511194 6.5 ± 2.8 1.5 ± 2.8 118 ± 51 27 ± 51 thu 611194 7.2 ± 2.8 1.0 ± 2.8 94 ± 37 14 ± 37 fri 7/1/94 10.7 ± 2.8 1.1 ± 2.8 120 ± 32 13 ± 32
N-2-S influent effluent influent effluent mon 3/1194 6.5 ± 0.9 0.0 ± 0.9 178 ± 25 0 ± 25 tue 411194 18.9 ± 0.9 0.0 ± 0.9 456 ± 22 0 ± 22 wed 511194 40.1 ± 0.9 7.3 ± 0.9 723 ± 17 132 ± 17 thu 611194 70.2 ± 0.9 7.7 ± 0.9 920 ± 12 101 ± 12 fri 7/l/94 82.7 ± 0.9 4.3 ± 0.9 931 ± 11 49 ± 10
N-2,6-dS influent effluent influent effluent mon 3/1194 0.34 ± 0.07 0.04 ± 0.07 9 ± 2 1 ± 2 tue 411194 0.65 ± 0.07 0.14 ± 0.07 16 ± 2 3 ± 2 wed 511194 l.06 ± 0.07 0.31 ± 0.07 19 ± 1 6 ± 1 thu 611194 l.42 ± 0.07 0.20 ± 0.07 19 ± l 3 ± l fri 7/1194 2.23 ± 0.07 0.24 ± 0.07 25 ± 1 3 ± 1 a 25 mL influent and effluent samples (except for 3-NBS and 4-NBS; effluents were quantitated with influent calibration

B5
Table B.4. (continued)
concentration [µg/L] load [g/d]
N-1,S-dS influent effluent influent effluent mon 3/1/94 1.0 ± 0.2 0.8 ± 0.2 28 ± 4 21 ± 4 tue 4/1194 2.2 ± 0.2 1.6 ± 0.2 52 ± 4 38 ± 4 wed 5/1194 1.9 ± 0.2 2.4 ± 0.2 35 ± 3 44 ± 3 thu 6/1194 3.2 ± 0.2 2.4 ± 0.2 42 ± 2 31 ± 2 fri 7/1194 2.7 ± 0.2 2.9 ± 0.2 30 ± 2 33 ± 2
N-2,7-dS influent effluent influent effluent mon 3/1194 1.3 ± 0.2 0.3 ± 0.2 35 ± 6 8 ± 6 tue 4/1/94 2.3 ± 0.2 1.0 ± 0.2 56 ± 5 24 ± 5 wed 5/1/94 3.6 ± 0.2 1.9 ± 0.2 65 ± 4 35 ± 4 thu 6/1194 4.8 ± 0.2 1.6 ± 0.2 63 ± 3 21 ± 3 fri 7/1/94 7.2 ± 0.2 2.2 ± 0.2 81 ± 3 25 ± 2
N-1,6-dS influent effluent influent effluent mon 3/1194 4.2 ± 0.6 1.0 ± 0.6 114 ± 16 26 ± 16 tue 411/94 8.4 ± 0.6 2.2 ± 0.6 202 ± 14 52 ± 14 wed 511194 12.0 ± 0.6 3.3 ± 0.6 216 ± 11 59 ± 10 thu 6/1194 17.3 ± 0.6 2.8 ± 0.6 226 ± 8 36 ± 8 fri 7/1194 22.3 ± 0.6 3.2 ± 0.6 251 ± 7 36 ± 7
a 25 mL influent and effluent samples; effluents were quantitated with influent calibration

B6
Table B.5. Field study BW5 (Jan. 30 • Feb. 5. 1994)a
concentration [µg/L] load [g/d]
3-NBS influent effluent influent effluent sun 30/1/94 0 ± 26 nd 0 ± 390 nd mon 31/1/94 592 ± 25 0 ± 7 8277 ± 350 0 ± 95 tue 1/2/94 1096 ± 25 50 ± 7 12825 ± 287 590 ± 78 wed 2/2/94 847 ± 25 22 ± 7 9063 ± 265 235 ± 72 thu 3/2/94 538 ± 25 6 ± 7 5540 ± 258 62 ± 69 fri 4/2/94 16 ± 26 0 ± 7 148 ± 247 0 ± 65 sat 5/2/94 nd 0 ± 7 nb 0 ± 50
3-ABS influent effluent influent effluent sun 30/1/94 48 ± 32 nd 718 ± 475 nd mon 31/1/94 108 ± 32 2 ± 32 1506 ± 442 25 ± 441 tue 1/2/94 276 ± 32 8 ± 32 3226 ± 375 99 ± 369 wed 212/94 245 ± 32 17 ± 32 2622 ± 342 182 ± 338 thu 312/94 374 ± 32 29 ± 32 3851 ± 335 299 ± 325 fri 4/2/94 225 ± 32 16 ± 32 2151 ± 305 154 ± 301 sat 5/2/94 nd 2 ± 32 nd 13 ± 235
N-1-S influent effluent influent effluent sun 30/1/94 0.53 ± 1.02 nd 8 ± 15 nd mon 31/1/94 3.14 ± 1.02 bd 44 ± 14 bd tue 1/2/94 6.37 ± 1.02 bd 75 ± 12 bd wed 2/2/94 5.94 ± 1.02 bd 64 ± 11 bd thu 3/2/94 3.13 ± 1.02 bd 32 ± 11 bd fri 4/2/94 2.74 ± 1.02 bd 26 ± 10 bd sat 5/2/94 nd bd nd bd
N-2-S influent effluent influent effluent sun 30/1/94 3.5 ± 0.9 nd 53 ± 14 nd mon 31/1/94 18.6 ± 0.9 bd 260 ± 13 bd tue 1/2/94 36.5 ± 0.9 bd 427 ± 11 bd wed 2/2/94 48.0 ± 0.9 bd 514 ± 10 bd thu 3/2/94 21.1 ± 0.9 bd 218 ± 9 bd fri 4/2/94 20.3 ± 0.9 bd 194 ± 9 bd sat 5/2/94 nd bd nd bd
a 25 mL influent and effluent samples (except for 3-NBS); effluents were quantitated with influent calibration nd = not determined bd = below detection limit
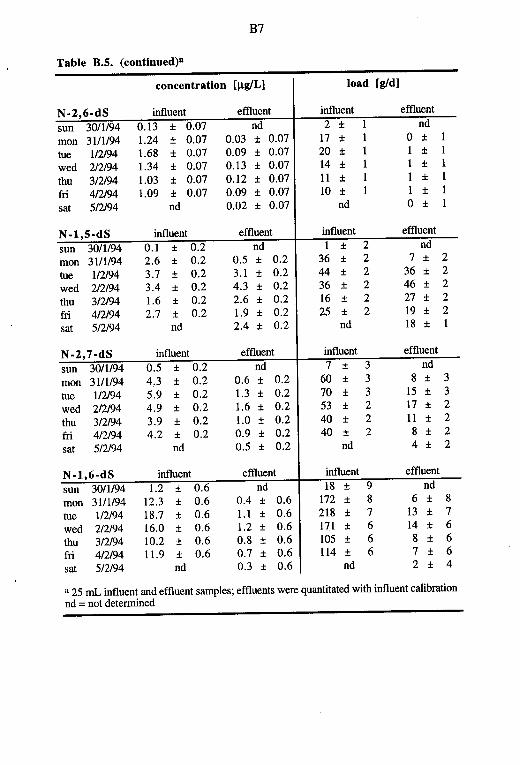
B7
Table B.S. (continued)a
concentration [µg/L] load [g/d]
N-2,6-dS influent effluent influent effluent
sun 30/1194 0.13 ± 0.07 nd 2 ± 1 nd
mon 3111194 1.24 ± 0.07 0.03 ± 0.07 17 ± 1 0 ± 1
tue 112/94 1.68 ± 0.07 0.09 ± 0.07 20 ± 1 1 ± 1
wed 2/2/94 1.34 ± 0.07 0.13 ± 0.07 14 ± 1 1 ± 1
thu 3/2/94 1.03 ± 0.07 0.12 ± 0.07 11 ± 1 1 ± 1
fri 4/2/94 1.09 ± 0.07 0.09 ± 0.07 10 ± 1 1 ± 1
sat 5/2/94 nd 0.02 ± 0.07 nd 0 ± 1
N-1,S-dS influent effluent influent effluent
sun 30/1194 0.1 ± 0.2 nd 1 ± 2 nd mon 31/1/94 2.6 ± 0.2 0.5 ± 0.2 36 ± 2 7 ± 2
tue 112/94 3.7 ± 0.2 3.1 ± 0.2 44 ± 2 36 ± 2
wed 2/2/94 3.4 ± 0.2 4.3 ± 0.2 36 ± 2 46 ± 2
thu 3/2/94 1.6 ± 0.2 2.6 ± 0.2 16 ± 2 27 ± 2
fri 4/2/94 2.7 ± 0.2 1.9 ± 0.2 25 ± 2 19 ± 2
sat 5/2/94 nd 2.4 ± 0.2 nd 18 ± 1
N-2,7-dS influent effluent influent effluent
sun 30/1194 0.5 ± 0.2 nd 7 ± 3 nd
mon 3111194 4.3 ± 0.2 0.6 ± 0.2 60 ± 3 8 ± 3
tue 112/94 5.9 ± 0.2 1.3 ± 0.2 70 ± 3 15 ± 3
wed 2/2/94 4.9 ± 0.2 1.6 ± 0.2 53 ± 2 17 ± 2
thu 3/2/94 3.9 ± 0.2 1.0 ± 0.2 40 ± 2 11 ± 2
fri 4/2/94 4.2 ± 0.2 0.9 ± 0.2 40 ± 2 8 ± 2
sat 5/2/94 nd 0.5 ± 0.2 nd 4 ± 2
N-1,6-dS influent effluent influent effluent
sun 30/1194 1.2 ± 0.6 nd 18 ± 9 nd mon 31/1/94 12.3 ± 0.6 0.4 ± 0.6 172 ± 8 6 ± 8
tue 1/2/94 18.7 ± 0.6 1.1 ± 0.6 218 ± 7 13 ± 7 wed 2/2/94 16.0 ± 0.6 1.2 ± 0.6 171 ± 6 14 ± 6 thu 3/2/94 10.2 ± 0.6 0.8 ± 0.6 105 ± 6 8 ± 6 fri 4/2/94 11.9 ± 0.6 0.7 ± 0.6 114 ± 6 7 ± 6 sat 5/2/94 nd 0.3 ± 0.6 nd 2 ± 4
a 25 mL influent and effluent samples; effluents were quantitated with influent calibration nd = not determined
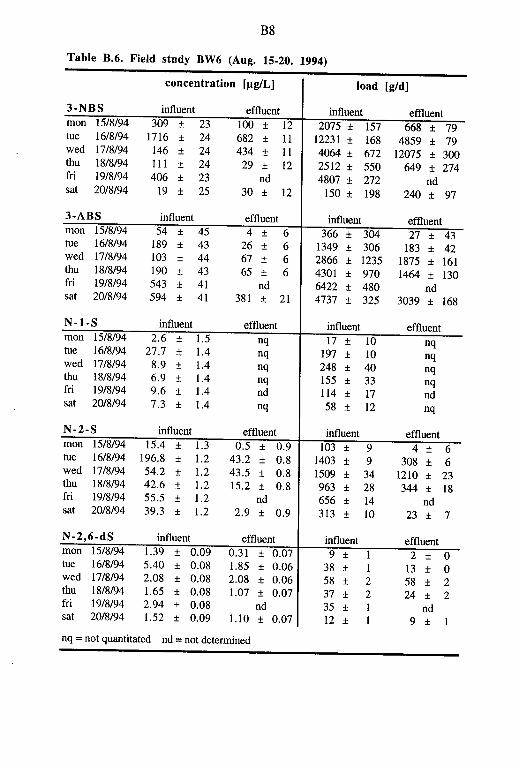
B8
Table B.6. Field study BW6 (Aug. 15-20. 1994)
concentration [µg/L] load [g/d]
3-NBS influent effluent influent effluent mon 15/8/94 309 ± 23 100 ± 12 2075 ± 157 668 ± 79 tue 16/8/94 1716 ± 24 682 ± 11 12231 ± 168 4859 ± 79 wed 17/8/94 146 ± 24 434 ± 11 4064 ± 672 12075 ± 300 thu 18/8/94 111 ± 24 29 ± 12 2512 ± 550 649 ± 274 fri 19/8/94 406 ± 23 nd 4807 ± 272 nd sat 20/8/94 19 ± 25 30 ± 12 150 ± 198 240 ± 97
3-ABS influent effluent influent effluent mon 15/8/94 54 ± 45 4 ± 6 366 ± 304 27 ± 43 tue 1618194 189 ± 43 26 ± 6 1349 ± 306 183 ± 42 wed 17/8/94 103 ± 44 67 ± 6 2866 ± 1235 1875 ± 161 thu 18/8/94 190 ± 43 65 ± 6 4301 ± 970 1464 ± 130 fri 1918194 543 ± 41 nd 6422 ± 480 nd sat 20/8/94 594 ± 41 381 ± 21 4737 ± 325 3039 ± 168
N-1-S influent effluent influent effluent mon 1518194 2.6 ± 1.5 nq 17 ± 10 nq tue 16/8/94 27.7 ± 1.4 nq 197 ± 10 nq wed 17/8/94 8.9 ± 1.4 nq 248 ± 40 nq thu 18/8/94 6.9 ± 1.4 nq 155 ± 33 nq fri 1918194 9.6 ± 1.4 nd 114 ± 17 nd sat 20/8/94 7.3 ± 1.4 nq 58 ± 12 nq
N-2-S influent effluent influent effluent mon 1518194 15.4 ± 1.3 0.5 ± 0.9 103 ± 9 4 ± 6 tue 1618194 196.8 ± 1.2 43.2 ± 0.8 1403 ± 9 308 ± 6 wed 17/8/94 54.2 ± 1.2 43.5 ± 0.8 1509 ± 34 1210 ± 23 thu 18/8/94 42.6 ± 1.2 15.2 ± 0.8 963 ± 28 344 ± 18 fri 1918194 55.5 ± 1.2 nd 656 ± 14 nd sat 20/8/94 39.3 ± 1.2 2.9 ± 0.9 313 ± 10 23 ± 7
N-2,6-dS influent effluent influent effluent mon 1518194 1.39 ± 0.09 0.31 ± 0.07 9 ± 1 2 ± 0 tue 1618194 5.40 ± 0.08 1.85 ± 0.06 38 ± 1 13 ± 0 wed 17/8/94 2.08 ± 0.08 2.08 ± 0.06 58 ± 2 58 ± 2 thu 18/8/94 1.65 ± 0.08 1.07 ± 0.07 37 ± 2 24 ± 2 fri 1918194 2.94 ± 0.08 nd 35 ± 1 nd sat 20/8/94 1.52 ± 0.09 1.10 ± 0.07 12 ± 1 9 ± 1 nq = not quantitated nd = not determined

B9
Table B.6. (continued)
concentration [µg/L] load [g/d]
N-1,5-dS influent effluent influent effluent
mon 15/8/94 1.5 ± 0.2 0.5 ± 0.1 10 ± 3 ± 1
tue 16/8/94 9.4 ± 0.2 3.7 ± 0.1 67 ± 1 26 ± 1
wed 17/8/94 5.8 ± 0.2 5.5 ± 0.1 163 ± 5 153 ± 4
thu 18/8/94 3.5 ± 0.2 3.3 ± 0.1 78 ± 4 74 ± 3
fri 19/8/94 8.4 ± 0.2 nd 100 ± 2 nd
sat 20/8/94 2.6 ± 0.2 7.0 ± 0.2 21 ± 56 ±
N-2,7-dS influent effluent influent effluent
mon 15/8/94 4.2 ± 0.2 0.9 ± 0.3 28 ± 2 6 ± 2
tue 16/8/94 18.0 ± 0.2 5.8 ± 0.3 128 ± 2 42 ± 2
wed 17/8/94 6.9 ± 0.2 6.9 ± 0.3 193 ± 6 193 ± 8
thu 18/8/94 5.2 ± 0.2 3.4 ± 0.3 117 ± 5 78 ± 6
fri 19/8/94 9.5 ± 0.2 nd 112 ± 3 nd
sat 20/8/94 4.8 ± 0.2 4.4 ± 0.3 38 ± 2 35 ± 2
N-1,6-dS influent effluent influent effluent
mon 15/8/94 8.8 ± 0.6 1.9 ± 0.7 59 ± 4 13 ± 5
tue 16/8/94 56.7 ± 0.7 18.9 ± 0.7 404 ± 5 135 ± 5
wed 17/8/94 25.3 ± 0.6 22.2 ± 0.8 705 ± 15 619 ± 21
thu 18/8/94 18.1 ± 0.6 11.3 ± 0.6 408 ± 13 256 ± 14
fri 19/8/94 34.7 ± 0.6 nd 411 ± 7 nd
sat 20/8/94 15.3 ± 0.6 10.7 ± 0.6 122 ± 5 85 ± 5
nd = not determined

Cl
Appendix C
Technical data and results of the two days mass flow study on Monday and Tuesday of the field study BW6 (Aug. 15116. 1994) at the STP Herisau (Switzerland).
Table C.1. Technical data of the STP Herisau (Aug 15/16. 1994) residence time mon 1. aeration tank (2 tanks) 1.5 h
2. aeration tank ( l tank) 0.6 h tue 1. aeration tank (2 tanks) 1.5 h
2. aeration tank ( l tank) 0.6 h waste water flow mon 6713 m3/d
tue 7128 m3/d recirculation mon 4294 m3/d
tue 3793 m3/d temperature mon influent (mean) 19.7 'C
effluent (mean) 19.0 'C tue influent (mean) 21.3 'C
effluent (mean) 20.3 'C pH mon influent 6.9-8.5
influent (mean) 8.1 tue influent 6.9-8.5
influent (mean) 8.1 COD mon raw waste water 385 mg/L
tue raw waste water 380 mg/L effluent 82 mg/L
Table C.2. Diurnal variation of the waste water flow (Aug 15/16. 1994) Monday Tuesday
time waste water flow time waste water flow Us Us
06.00-08.00 60 06.00-08.00 65 08.00-10.00 80 08.00-10.00 100 10.00-12.00 90 l 0.00-12.00 100 12.00-14.00 90 12.00-14.00 100 14.00-16.00 85 14.00-16.00 95 16.00-18.00 95 16.00-18.00 90 18.00-20.00 80 18.00-20.00 95 20.00-22.00 70 20.00-22.00 90 22.00-24.00 60 22.00-24.00 75 24.00-02.00 45 24.00--02.00 55 02.00-04.00 40 02.00-04.00 50 04.00-06.00 40 04.00-06.00 50

C2
Table C.3. 3-Nitrobenzenesulfonate concentration [µg/L]
time influent effluent l.clarifier effluent 2.clarifier 06.00-08.00 0 ± 22 1 ± 9 0 ± 9 08.00-10.00 0 ± 22 3 ± 9 0 ± 9 10.00-12.00 36 ± 22 2 ± 9 0 ± 9 12.00-14.00 677 ± 22 37 ± 9 6 ± 9 14.00-16.00 823 ± 23 173 ± 9 27 ± 9 16.00-18.00 580 ± 22 263 ± 9 98 ± 9 18.00-20.00 433 ± 22 292 ± 9 185 ± 9 20.00-22.00 238 ± 22 273 ± 9 237 ± 9 22.00-24.00 145 ± 22 257 ± 9 233 ± 9 24.00-02.00 93 ± 22 222 ± 9 218 ± 9 02.00-04.00 68 ± 22 189 ± 9 185 ± 9 04.00-06.00 57 ± 22 154 ± 9 152 ± 9 06.00-08.00 62 ± 22 128 ± 9 119 ± 9 08.00-10.00 472 ± 22 114 ± 9 91 ± 9 10.00-12.00 1617 ± 25 198 ± 9 96 ± 9 12.00-14.00 3529 ± 34 516 ± 9 183 ± 9 14.00-16.00 2501 ± 29 1021 ± 11 478 ± 9 16.00-18.00 1861 ± 26 1195 ± 11 792 ± 10 18.00-20.00 1706 ± 25 1251 ± 11 1018 ± 11 20.00-22.00 1649 ± 25 1296 ± 12 1152 ± 11 22.00-24.00 1771 ± 25 1312 ± 12 1205 ± 11 24.00-02.00 2209 ± 27 1346 ± 12 1239 ± 11 02.00-04.00 2519 ± 29 1393 ± 12 1249 ± 11 04.00-06.00 2664 ± 29 1448 ± 12 1286 ± 12
Table C.4. 3-Aminobenzenesulfonate concentration [µg/L]
time influent effluent 1.clarifier effluent 2.clarifier
06.00-08.00 13 ± 34 2 ± 6 1 ± 6 08.00-10.00 32 ± 33 2 ± 6 1 ± 6 10.00-12.00 16 ± 34 2 ± 6 1 ± 6 12.00-14.00 34 ± 33 3 ± 6 1 ± 6 14.00-16.00 34 ± 33 5 ± 6 2 ± 6 16.00-18.00 55 ± 33 5 ± 6 3 ± 6 18.00-20.00 65 ± 33 8 ± 6 5 ± 6 20.00-22.00 59 ± 33 10 ± 6 4 ± 6 22.00-24.00 60 ± 33 10 ± 6 6 ± 6 24.00-02.00 52 ± 33 9 ± 6 5 ± 6 02.00-04.00 59 ± 33 7 ± 6 5 ± 6 04.00-06.00 62 ± 33 7 ± 6 6 ± 6 06.00-08.00 88 ± 33 7 ± 6 4 ± 6 08.00-10.00 137 ± 32 13 ± 6 4 ± 6 10.00-12.00 61 ± 33 24 ± 6 4 ± 6 12.00-14.00 110 ± 32 22 ± 6 8 ± 6 14.00-16.00 197 ± 31 35 ± 6 11 ± 6 16.00-18.00 285 ± 31 56 ± 6 21 ± 6 18.00-20.00 251 ± 31 71 ± 7 33 ± 6 20.00-22.00 94 ± 33 91 ± 7 55 ± 6 22.00-24.00 66 ± 33 79 ± 7 54 ± 6 24.00-02.00 80 ± 33 90 ± 7 56 ± 6 02.00-04.00 88 ± 33 99 ± 7 51 ± 6 04.00-06.00 143 ± 32 94 ± 7 42 ± 6

C3
Table c.s. Naphthalene-2-sulfonate concentration [µg/L]
time influent effluent l .clarifier effluent 2.clarifier 06.00-08.00 2.6 ± 0.9 0.2 ± 0.6 0.0 ± 0.6 08.00-10.00 5.6 ± 0.9 0.5 ± 0.6 0.1 ± 0.6 l 0.00-12.00 9.8 ± 0.9 0.4 ± 0.6 0.1 ± 0.6 12.00-14.00 20.0 ± 0.9 0.9 ± 0.6 0.3 ± 0.6 14.00-16.00 18.8 ± 0.9 1.6 ± 0.6 0.3 ± 0.6 16.00-18.00 18.9 ± 0.9 1.9 ± 0.6 0.8 ± 0.6 18.00-20.00 24.7 ± 0.9 1.9 ± 0.6 1.1 ± 0.6 20.00-22.00 27.5 ± 0.9 2.4 ± 0.6 1.1 ± 0.6 22.00-24.00 20.4 ± 0.9 2.1 ± 0.6 1.3 ± 0.6 24.00-02.00 12.8 ± 0.9 1.2 ± 0.6 1.0 ± 0.6 02.00-04.00 10.6 ± 0.9 0.6 ± 0.6 0.6 ± 0.6 04.00-06.00 10.2 ± 0.9 0.4 ± 0.6 0.5 ± 0.6 06.00-08.00 12.0 ± 0.9 0.3 ± 0.6 0.3 ± 0.6 08.00-10.00 89.6 ± 0.9 2.5 ± 0.6 0.3 ± 0.6 10.00-12.00 153.7 ± 1.0 16.3 ± 0.6 3.5 ± 0.6 12.00-14.00 206.5 ± 1.0 35.6 ± 0.7 13.1 ± 0.6 14.00-16.00 217.5 ± 1.1 61.4 ± 0.8 30.2 ± 0.6 16.00-18.00 222.8 ± l.l 78.6 ± 0.9 48.5 ± 0.7 18.00-20.00 223.4 ± 1.1 92.5 ± 1.0 65.2 ± 0.8 20.00-22.00 193.7 ± 1.0 104.l ± 1.0 80.6 ± 0.9 22.00-24.00 196.5 ± 1.0 104.3 ± 1.0 89.9 ± 0.9 24.00-02.00 234.0 ± 1.1 106.9 ± 1.0 93.7 ± 1.0 02.00-04.00 267.9 ± 1.1 103.3 ± 1.0 91.l ± 0.9 04.00-06.00 298.6 ± 1.2 99.1 ± 1.0 87.7 ± 0.9
Table C.6. Naphthalene-1-sulfonate concentration [µg/L]
time influent effluent l .clarifier effluent 2.clarifier 06.00-08.00 0.7 ± 2.8 0.2 ± 0.9 0.0 ± 0.9 08.00-10.00 0.9 ± 2.8 0.2 ± 0.9 0.0 ± 0.9 10.00-12.00 1.6 ± 2.8 0.2 ± 0.9 0.0 ± 0.9 12.00-14.00 3.5 ± 2.8 0.3 ± 0.9 0.0 ± 0.9 14.00-16.00 3.3 ± 2.8 0.6 ± 0.9 0.0 ± 0.9 16.00-18.00 3.7 ± 2.8 0.7 ± 0.9 0.0 ± 0.9 18.00-20.00 4.8 ± 2.8 0.7 ± 0.9 0.0 ± 0.9 20.00-22.00 4.9 ± 2.8 0.8 ± 0.9 0.0 ± 0.9 22.00-24.00 4.1 ± 2.8 0.7 ± 0.9 0.0 ± 0.9 24.00-02.00 2.5 ± 2.8 0.5 ± 0.9 0.1 ± 0.9 02.00-04.00 2.2 ± 2.8 0.3 ± 0.9 0.1 ± 0.9 04.00-06.00 2.2 ± 2.8 0.2 ± 0.9 0.1 ± 0.9 06.00-08.00 2.5 ± 2.8 0.2 ± 0.9 0.1 ± 0.9 08.00-10.00 14.8 ± 2.8 0.5 ± 0.9 0.1 ± 0.9 10.00-12.00 24.6 ± 2.8 2.2 ± 0.9 0.2 ± 0.9 12.00-14.00 28.4 ± 2.8 4.7 ± 0.9 1.7 ± 0.9 14.00-16.00 37.5 ± 2.9 8.4 ± 1.0 3.6 ± 0.9 16.00-18.00 38.7 ± 2.9 11.0 ± 1.0 5.8 ± 0.9 18.00-20.00 39.8 ± 2.9 13.1 ± 1.0 7.7 ± 1.0 20.00-22.00 34.5 ± 2.9 14.5 ± 1.0 9.5 ± 1.0 22.00-24.00 35.3 ± 2.9 14.2 ± 1.0 10.7 ± 1.0 24.00-02.00 43.8 ± 2.9 14.4 ± 1.0 10.4 ± 1.0 02.00-04.00 50.l ± 2.9 13.4 ± 1.0 8.8 ± 1.0 04.00-06.00 55.4 ± 2.9 12.0 ± 1.0 7.3 ± 1.0

C4
Tab Je C.7. Naphthalene-2,6-disulfonate concentration [µg/L]
time influent effluent l.clarifier effluent 2.clarifier 06.00-08.00 0.2 ± 0.1 0.1 ± 0.1 0.0 ± 0.1 08.00-10.00 0.2 ± 0.1 0.1 ± 0.1 0.0 ± 0.1 10.00-12.00 0.9 ± 0.1 0.1 ± 0.1 0.1 ± 0.1 12.00-14.00 2.0 ± 0.1 0.3 ± 0.1 0.1 ± 0.1 14.00-16.00 1.6 ± 0.1 0.5 ± 0.1 0.2 ± 0.1 16.00-18.00 1.2 ± 0.1 0.6 ± 0.1 0.4 ± 0.1 18.00-20.00 1.9 ± 0.1 0.7 ± 0.1 0.5 ± 0.1 20.00-22.00 2.6 ± 0.1 0.8 ± 0.1 0.5 ± 0.1 22.00-24.00 1.6 ± 0.1 1.0 ± 0.1 0.7 ± 0.1 24.00-02.00 0.9 ± 0.1 0.8 ± 0.1 0.7 ± 0.1 02.00-04.00 0.7 ± 0.1 0.7 ± 0.1 0.6 ± 0.1 04.00-06.00 0.6 ± 0.1 0.6 ± 0.1 0.5 ± 0.1 06.00-08.00 0.6 ± 0.1 0.5 ± 0.1 0.5 ± 0.1 08.00-10.00 2.9 ± 0.1 0.5 ± 0.1 0.4 ± 0.1 10.00-12.00 4.2 ± 0.1 1.0 ± 0.1 0.5 ± 0.1 12.00-14.00 4.9 ± 0.1 1.5 ± 0.1 0.8 ± 0.1 14.00-16.00 6.1 ± 0.1 2.3 ± 0.1 1.3 ± 0.1 16.00-18.00 7.7 ± 0.1 2.6 ± 0.1 1.7 ± 0.1 18.00-20.00 8.3 ± 0.1 3.4 ± 0.1 2.3 ± 0.1 20.00-22.00 6.3 ± 0.1 4.0 ± 0.1 2.9 ± 0.1 22.00-24.00 5.6 ± 0.1 4.1 ± 0.1 3.4 ± 0.1 24.00-02.00 5.1 ± 0.1 4.1 ± 0.1 3.6 ± 0.1 02.00-04.00 5.5 ± 0.1 4.1 ± 0.1 3.6 ± 0.1 04.00-06.00 6.1 ± 0.1 3.9 ± 0.1 3.6 ± 0.1
Table C.8. N aphthalene-1,5-disulfonate concentration [µg/L]
time influent effluent l.clarifier effluent 2.clarifier 06.00-08.00 o.4 ± 0.2 0.4 ± 0.1 0.4 ± 0.1 08.00-10.00 0.4 ± 0.2 0.4 ± 0.1 0.4 ± 0.1 10.00-12.00 0.3 ± 0.2 0.4 ± 0.1 0.3 ± 0.1 12.00-14.00 0.6 ± 0.2 0.4 ± 0.1 0.3 ± 0.1 14.00-16.00 0.8 ± 0.2 0.5 ± 0.1 0.3 ± 0.1 16.00-18.00 1.0 ± 0.2 0.4 ± 0.1 0.4 ± 0.1 18.00-20.00 1.0 ± 0.2 0.5 ± 0.1 0.5 ± 0.1 20.00-22.00 0.9 ± 0.2 0.5 ± 0.1 0.5 ± 0.1 22.00-24.00 0.7 ± 0.2 0.6 ± 0.1 0.7 ± 0.1 24.00-02.00 1.1 ± 0.2 0.6 ± 0.1 0.6 ± 0.1 02.00-04.00 0.6 ± 0.2 0.6 ± 0.1 0.6 ± 0.1 04.00-06.00 2.5 ± 0.2 0.6 ± 0.1 0.6 ± 0.1 06.00-08.00 0.6 ± 0.2 0.6 ± 0.1 0.6 ± 0.1 08.00-10.00 3.8 ± 0.2 0.7 ± 0.1 0.6 ± 0.1 10.00-12.00 5.7 ± 0.2 1.3 ± 0.1 0.8 ± 0.1 12.00-14.00 8.0 ± 0.2 1.9 ± 0.1 1.2 ± 0.1 14.00-16.00 15.2 ± 0.2 3.0 ± 0.1 1.9 ± 0.1 16.00-18.00 18.7 ± 0.3 4.8 ± 0.1 2.9 ± 0.1 18.00-20.00 17.0 ± 0.2 6.0 ± 0.1 4.3 ± 0.1 20.00-22.00 7.5 ± 0.2 7.1 ± 0.2 5.8 ± 0.1 22.00-24.00 6.1 ± 0.2 6.1 ± 0.1 6.6 ± 0.1 24.00-02.00 6.9 ± 0.2 6.3 ± 0.1 6.7 ± 0.2 02.00-04.00 7.1 ± 0.2 6.4 ± 0.1 6.7 ± 0.1 04.00-06.00 8.9 ± 0.2 6.1 ± 0.1 6.8 ± 0.2

C5
Table C.9. N aphthalene-2, 7 -disulfonate concentration [µg/L]
time influent effluent 1.clarifier effluent 2.clarifier 06.00-08.00 0.3 ± 0.2 0.3 ± 0.2 0.1 ± 0.2 08.00-10.00 1.1 ± 0.2 0.3 ± 0.2 0.2 ± 0.2 10.00-12.00 3.1 ± 0.2 0.4 ± 0.2 0.2 ± 0.2 12.00-14.00 6.0 ± 0.2 1.0 ± 0.2 0.5 ± 0.2 14.00-16.00 4.9 ± 0.2 1.8 ± 0.2 0.7 ± 0.2 16.00-18.00 3.9 ± 0.2 2.1 ± 0.2 1.1 ± 0.2 18.00-20.00 5.9 ± 0.2 2.3 ± 0.2 1.5 ± 0.2 20.00-22.00 7.8 ± 0.2 2.8 ± 0.2 1.7 ± 0.2 22.00-24.00 5.3 ± 0.2 3.3 ± 0.2 2.0 ± 0.2 24.00-02.00 3.1 ± 0.2 3.0 ± 0.2 2.0 ± 0.2 02.00-04.00 2.3 ± 0.2 2.6 ± 0.2 1.9 ± 0.2 04.00-06.00 2.0 ± 0.2 2.2 ± 0.2 1.6 ± 0.2 06.00-08.00 2.0 ± 0.2 2.0 ± 0.2 1.4 ± 0.2 08.00-10.00 12.1 ± 0.2 2.0 ± 0.2 1.3 ± 0.2 10.00-12.00 13.1 ± 0.2 3.4 ± 0.2 1.7 ± 0.2 12.00-14.00 15.5 ± 0.2 4.9 ± 0.2 2.5 ± 0.2 14.00-16.00 19.8 ± 0.2 6.8 ± 0.3 3.8 ± 0.2 16.00-18.00 24.8 ± 0.3 8.5 ± 0.3 5.1 ± 0.2 18.00-20.00 26.4 ± 0.3 10.8 ± 0.3 6.8 ± 0.3 20.00-22.00 19.7 ± 0.2 12.6 ± 0.3 8.8 ± 0.3 22.00-24.00 17.3 ± 0.2 12.5 ± 0.3 10.1 ± 0.3 24.00-02.00 16.2 ± 0.2 12.9 ± 0.3 10.6 ± 0.3 02.00-04.00 17.0 ± 0.2 12.9 ± 0.3 10.5 ± 0.3 04.00-06.00 19.1 ± 0.2 12.6 ± 0.3 10.4 ± 0.3
Table C.10. N aphthalene-1,6-disulfonate concentration [µg/L]
time influent effluent l.clarifier effluent 2.clarifier 06.00-08.00 0.8 ± 0.6 0.7 ± 0.6 0.3 ± 0.6 08.00-10.00 1.9 ± 0.6 0.8 ± 0.6 0.6 ± 0.6 10.00-12.00 5.9 ± 0.6 1.0 ± 0.6 0.5 ± 0.6 12.00-14.00 13.2 ± 0.6 2.2 ± 0.6 1.1 ± 0.6 14.00-16.00 11.3 ± 0.6 3.6 ± 0.6 1.5 ± 0.6 16.00-18.00 9.1 ± 0.6 4.2 ± 0.6 2.5 ± 0.6 18.00-20.00 13.3 ± 0.6 4.5 ± 0.6 3.2 ± 0.6 20.00-22.00 17.4 ± 0.6 5.5 ± 0.6 3.6 ± 0.6 22.00-24.00 11.6 ± 0.6 6.3 ± 0.6 4.3 ± 0.6 24.00-02.00 6.8 ± 0.6 5.4 ± 0.6 4.4 ± 0.6 02.00-04.00 5.1 ± 0.6 4.5 ± 0.6 4.0 ± 0.6 04.00-06.00 4.6 ± 0.6 3.8 ± 0.6 3.6 ± 0.6 06.00-08.00 4.8 ± 0.6 3.2 ± 0.6 3.1 ± 0.6 08.00-10.00 27.7 ± 0.6 3.8 ± 0.6 2.8 ± 0.6 10.00-12.00 41.6 ± 0.7 8.3 ± 0.6 3.9 ± 0.6 12.00-14.00 53.4 ± 0.7 13.5 ± 0.6 7.0 ± 0.6 14.00-16.00 72.2 ± 0.8 20.8 ± 0.7 11.8 ± 0.6 16.00-18.00 85.0 ± 0.9 27.3 ± 0.8 17.0 ± 0.7 18.00-20.00 85.3 ± 0.9 34.4 ± 0.9 23.2 ± 0.7 20.00-22.00 58.6 ± 0.7 39.8 ± 1.0 29.8 ± 0.8 22.00-24.00 53.1 ± 0.7 37.4 ± 0.9 33.5 ± 0.9 24.00-02.00 54.7 ± 0.7 39.2 ± 0.9 35.0 ± 0.9 02.00-04.00 59.0 ± 0.7 39.2 ± 0.9 34.5 ± 0.9 04.00-06.00 67.6 ± 0.8 37.4 ± 0.9 34.6 ± 0.9

Curriculum Vitae
Name: Date of birth: Born in: Citizenship:
1972-1976
1976-1984
1984
1985
1985-1990
1987
1989
1990
1991
1992-1996
Beat Werner Altenbach August 2, 1965 Basel, Switzerland Switzerland
Primary school in Basel
Gymnasium in Basel, "Matura" Type A
Military service I
Military service II
Undergraduate and graduate studies at the University of Basle, Switzerland
Military service III
Military service IV
Diploma in Chemistry at the University of Basle, Switzerland
Research at the Swiss Federal Institute for Environmental Science and Technology, Dübendorf
Doctoral studies at the Swiss Federal Institute for Environmental Science and Technology and the Swiss Federal Institute of Technology, Zurich