Wet Air Oxidation of Benzene
139
.. WET AIR OXIDATION OF BENZENE by Basim Ahmed Ahussaud A Thesis submitted to the Faculty of graduate Studies and Research in Partial Fulfillment of the Requirements for the Degree of Doctorate of Philosophy Department of Chemical Engineering Mc Gill University Montréal (Quebec) © Basim Abussaud, 2007
-
Upload
independent -
Category
Documents
-
view
0 -
download
0
Transcript of Wet Air Oxidation of Benzene

~ ..
WET AIR OXIDATION OF BENZENE
by
Basim Ahmed Ahussaud
A Thesis submitted to the Faculty of graduate Studies
and Research in Partial Fulfillment of the
Requirements for the Degree of
Doctorate of Philosophy
Department of Chemical Engineering
Mc Gill University
Montréal (Quebec)
© Basim Abussaud, 2007

1+1 Libraryand Archives Canada
Bibliothèque et Archives Canada
Published Heritage Branch
Direction du Patrimoine de l'édition
395 Wellington Street Ottawa ON K1A ON4 Canada
395, rue Wellington Ottawa ON K1A ON4 Canada
NOTICE: The author has granted a nonexclusive license allowing Library and Archives Canada to reproduce, publish, archive, preserve, conserve, communicate to the public by telecommunication or on the Internet, loan, distribute and sell theses worldwide, for commercial or noncommercial purposes, in microform, paper, electronic and/or any other formats.
The author retains copyright ownership and moral rights in this thesis. Neither the thesis nor substantial extracts from it may be printed or otherwise reproduced without the author's permission.
ln compliance with the Canadian Privacy Act some supporting forms may have been removed from this thesis.
While these forms may be included in the document page count, their removal does not represent any loss of content from the thesis.
• •• Canada
AVIS:
Your file Votre référence ISBN: 978-0-494-38555-5 Our file Notre référence ISBN: 978-0-494-38555-5
L'auteur a accordé une licence non exclusive permettant à la Bibliothèque et Archives Canada de reproduire, publier, archiver, sauvegarder, conserver, transmettre au public par télécommunication ou par l'Internet, prêter, distribuer et vendre des thèses partout dans le monde, à des fins commerciales ou autres, sur support microforme, papier, électronique et/ou autres formats.
L'auteur conserve la propriété du droit d'auteur et des droits moraux qui protège cette thèse. Ni la thèse ni des extraits substantiels de celle-ci ne doivent être imprimés ou autrement reproduits sans son autorisation.
Conformément à la loi canadienne sur la protection de la vie privée, quelques formulaires secondaires ont été enlevés de cette thèse.
Bien que ces formulaires aient inclus dans la pagination, il n'y aura aucun contenu manquant.

~ ~ M dedicated
tom/jf~~
m/jf~~~~ m/jf ~ ofoie~
fJ m/jf~~
~ tnœ bue amd~~kuoo enabfecI
nwto~de~oYtIXM~

~ ..
ABSTRACT
Processing ofpetrochemical compounds produces a large amount ofwastewater. This
wastewater consists of toxic (hazardous) materials that can not be discharged to the
environment without treatment. As restrictive environmental constraints increase, new
technologies are needed to treat those toxic materials before discharging them to the
environment. Wet Air Oxidation (WAO) is one ofthese new methods.
This study casts light on the effect of initial pH on the W AO of benzene at different
temperatures and pressures. It was found that at pH 6, a temperature of 260°C and a
partial pressure of oxygen of 1.38 MPa around 97% degradation was achieved in one
hour. When the initial pH was lowered to 4 more than 90% degradation was achieved at
220°C and P02 of 1.38 MPa in only 15 minutes. It was concluded that the higher the
temperature the better the benzene degradation, and the faster benzene degradation has
been obtained with the increasing partial pressure of oxygen. The main intermediates
were acetic acid and formic acid.
Furthermore, it was found that the degradation of benzene can be further enhanced in
the presence of phenol. The main reason can be attributed to the effect of the free radicals
generated from the fast phenol degradation. A simplified pathway for oxidation of
benzene was proposed.
i
RÉSUMÉ
Le traitement de composants pétrochimiques produit une quantité importante d'eaux
usées. Composées de matériaux toxiques, ces eaux usées ne peuvent être déversées dans
la nature sans traitements additionnels. Au fur et à mesure que les contraintes
environnementales augmentent, de nouvelles technologies sont indispensables afin de
réduire ces matériaux dangereux; l'oxydation en phase aqueuse est l'une de ces
techniques.
Cette étude s'intéresse à l'effet du pH initial sur l'oxydation en phase aqueuse du
benzène à différentes températures et pressions. On note qu'à un pH de 6, une
température de 260°C et une pression partielle d'oxygène P02 à 1.38 Mpa, environ 97%
du benzene est oxydé en une heure. Lorsque le pH initial est diminué à 4, plus de 90% de
la décomposition s'est produite en seulement 15 minutes à 220°C et à une pression
partielle P02 de 1.38 Mpa. Ces résultats suggèrent que cette réaction se fait mieux à des
températures plus élevées. De plus, une augmentation de la pression partielle de
l'oxygène permet d'accélérer le processus. Les intermédiaires principaux de cette
réaction sont l'acide acétique et l'acide formique.
En outre, on observe que la présence de phénol favorise la transformation du
benzène; ceci peut être attribué aux radicaux libres générés par la décomposition rapide
du phénol. Une approche simplifiée pour l'oxydation du benzène a été proposé.
11
ACKNOWLEDGMENTS
Praise and gratitude be to God "he who taught (the use of) the pen. Taught man that
which he knew not."
It is a great pleasure to any human being to accomplish the work he devoted to. Yet, it
is a pride to human being to remember, in those moments of pleasures, those who
contributed to get the work completed.
Therefore, in acknowledgment thereof, l wish to express appreciation to Mc Gill
University, CoHege of Graduate Studies and Chemical Engineering Department who
granted me the chance and facilitated matters to me to do my PhD.
AIso, l would like to sincerely thank King Fahd University ofPetroleum and MineraIs
for the scholarship awarded to me.
Extreme appreciation and deep thanks are extended to my supervisors; Dr. George
Kubes and Dr. Dimitrios Berk for their sincere advice, valuable guidance and
continuance assistance throughout the course of this work.
Gratitude and thanks are also extended to Dr. Nilgun Ulkem for her assistance and
advices.
l am also deeply thankful to Charles Dolan, Alain Gagnon and Lou Cusmich for their
help during this work.
Special Thanks to Ed Siliauskas and Ranjan Roy for aH the technical assistance they
offered during this work.
l also wish to thank aH the member of the Pulp and Paper Center at McGill University
for their friendship.
Last, but not least, l wish to express my gratitude to my parents for their moral
support. Many thanks go to my loving wife, Maram, for her sacrifices, much
encouragements, and moral support; very special thanks go to our daughter Jude and son
Ahmed for the joy they brought us.
Finally, l extend thanks and appreciation to everyone helped directly or indirectly to
get this work done.
111
TABLE OF CONTENTS
ABSTRACT
RÉSUMÉ
ACKNOWLEDGMENTS
LIST OF FIGURES
LIST OF TABLES
CHAPTERONE
INTRODUCTION
1.1 Petrochemical Wastewater Effluent
1.1.1 Benzene
1.2 Objectives
1.3 Thesis Structure
CHAPTERTWO
LITERA TURE REVIEW
2.1 WAO ofOrganic Compounds
2.1.1 W AO of Phenol
2.1.2 WAO of Formic Acid and Acetic Acid
2.2 Free Radical Mechanism
2.2.1 Induction Period
2.3 Effect of the Initial pH on the WAO
2.4 Wet Air Oxidation Enhancements
ii
111
V111
XIV
2
2
3
4
5
5
6
8
10
11
12
iv

3.1 Apparatus
3.2 Materials
CHAPTER THREE
Experimental Setup and Procedure
3.3 Experimental Procedures
3.4 Analytical Methods
3.4.1 Gas Chromatography Analysis
3.4.1.1 Gas Chromatography Method
3.4.1.2 Calibration ofthe GC
3.4.2 Ion Chromatography
3.4.2.1 Ion Chromatography Method
3.4.2.2 Repeatability of the IC
3.4.3 Total Organic Compound Measurement
3.4.3.1 TOC Method
CHAPTER FOUR
RESULTS AND DISCUSSIONS
WET AIR OXIDATION OF BENZENE
4.1 Experiments with Benzene in the Absence of Oxygen
4.2 Chemical Oxygen Demand Measurements
4.3 Repeatability of the Results
4.4 Influence of pH on Benzene Degradation
4.4.1 Effeet of Temperature on Degradation of Benzene at pH 6
4.4.2 Effect of Oxygen Pressure on Benzene Degradation at pH 6
15
17
18
19
19
20
21
21
22
22
23
23
25
26
26
28
32
36
v
4.4.3 Effect of Temperature on the Benzene Degradation at pH 5 38
4.4.4 Effect of the Oxygen Pressure on Benzene Degradation at pH 5 39
4.4.5 Effect of Temperature on Benzene Degradation at pH 4 40
4.4.6 Effect of the Oxygen Pressure on the Benzene Degradation at pH 4 42
4.4.7 The pH Fluctuation during the Experiments 45
4.4.8 Effect of Acidification Methods on the Degradation of Benzene 46
4.5 Effect of Initial Benzene Concentration on its Degradation 48
4.6 Kinetic Modeling 51
CHAPTER FIVE
RESULTS AND DISCUSSION
REACTION INTERMEDIATES
5 .1 Total Organic Carbon Measurements 62
5.2 Effect of Temperature on the Production and Degradation ofboth Acetic Acid 69
and Formic Acid
5.3 Effect of Oxygen Pressure on the Production and Degradation of both Acetic 72
Acid and F ormic Acid
5.4 Effect ofp!;l on Acetic and Formic Acids 77
5.4.1 Effect of Acidification Methods on the Intermediates 81
5.5 Effect of Initial Benzene Concentration on Both Acetic and Formic Acids 83
5.6 Wet Air Oxidation of Both Acetic and Formic Acids 84
5.7 Repeatability of the Results 86
vi
CHAPTERSIX
RESULTS AND DISCUSSIONS
WET AIR OXIDATION OF BENZENE ENHANCED BY
PHENOL
6.1 Wet Air Oxidation of Phenol in Absence of Benzene 91
6.2 Wet Air Oxidation of Benzene in Presence of Phenol 94
6.2.1 Effect of the Initial Phenol Concentration on Benzene Degradation 95
6.2.2 Effect of Temperature on the Benzene Degradation 97
6.2.3 Effect of Benzene on the Phenol Oxidation 99
6.3 Reaction Kinetics of Benzene Oxidation 101
6.4 Repeatability of the Experiments 103
6.5 Proposed Simplified Pathway for Oxidation of Benzene 104
CHAPTER SEVEN
CONCLUSIONS AND RECOMMENDATIONS
7.1 Conclusions
7.2 Recommendations for future work
7.3 Contributions to Knowledge
REFERENCES
APPENDICES
106
108
109
110
Appendix A: Calculation of Oxygen Pressure Needed 119
Appendix B: Oxygen Solubility in Water 120
Appendix C: Calculation of Theoretical Amount of Carbon Dioxide Generated 121
Vll
('. LIST OF FIGURES
Page
Figure 3.1 Schematic Diagram of the Experimental Setup 16
Figure 3.2 Schematic Diagram for the Reactor, ID = 8.2 cm, OD = Il.2 cm, 17 L=23.0 cm
Figure 3.3 Upper View for the Cap 17
Figure 4.1 Repeatability of Data from Two Experiments at 220°C, 27 P02= 1.38 MPa, pH=4.
Figure 4.2 Repeatability of Data from Two Experiments at 240°C, 27 P02= 1.38 MPa, pH=4.
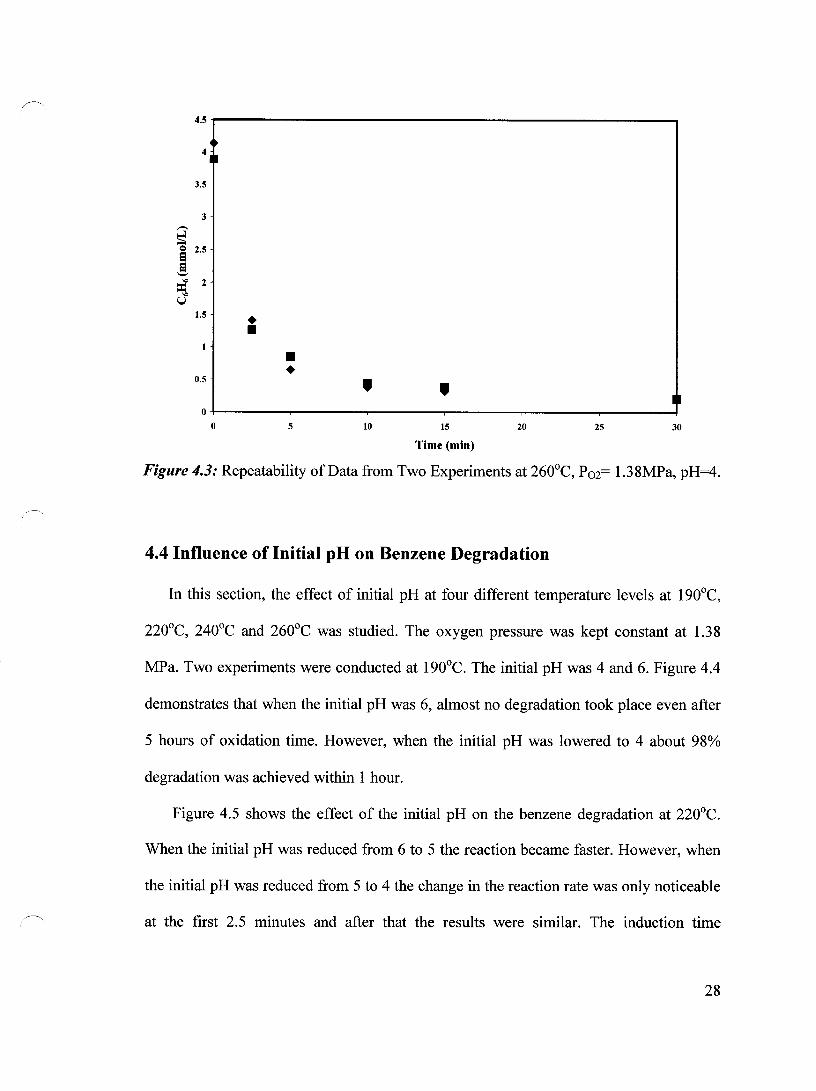
Figure 4.3 Repeatability of Data from Two Experiments at 260°C, 28 P02= 1.38 MPa, pH=4.
Figure 4.4 Effeet ofpH on Benzene Degradation at 190°C, P02= 1.38 MPa 29
Figure 4.5 Effeet of pH on the Benzene Degradation at 220°C, 30 P02= 1.38 MPa
Figure 4.6 Effeet of pH on the Benzene Degradation at 240°C, 31 P02= 1.38 MPa
Figure 4.7 Effect of pH on the Benzene Degradation at 260°C, 31 P02= 1.38 MPa
Figure 4.8 Degradation of Benzene at Different Temperatures, 33 P02= 1.38 MPa, pH= 6
Figure 4.9 Repeatability of Data from Two Experiments at 240°C, 33 P02= 1.38 MPa, pH= 6
Figure 4.10 Degradation of Benzene at 200°C, P02= 1.38 MPa, pH= 6 34
Figure 4.11 Degradation of Benzene at 210°C, P02= 1.38 MPa, pH= 6. 34
Figure 4.12 Degradation of Benzene at Different Temperatures, 35 P02= 1.38 MPa, pH=6
Figure 4.13 Degradation of Benzene at Different Oxygen Pressure, T= 260°C, 36 pH=6
i"
V111

Figure 4.14 Effect of Oxygen Pressure on the Benzene Degradation at 260°C, 37 pH=6
Figure 4.15 Effect of Temperature on the Benzene Degradation at pH 5, 38 P02= 1.38 MPa
Figure 4.16 Effect of Oxygen Pressure on the Benzene Degradation at pH 5 39
Figure 4.17 Effect of Temperature on the Benzene Degradation at 1.03 MPa, 41 pH=4
Figure 4.18 Effect of Temperature on the Benzene Degradation at 1.38 MPa, 41 pH=4
Figure 4.19 Effect of Temperature on the Benzene Degradation at 1.72 MPa, 42 pH=4
Figure 4.20 Effect of Oxygen Pressure on the Benzene Degradation at 220°C, 44 pH4
Figure 4.21 Effect of Oxygen Pressure on the Benzene Degradation at 240°C, 44 pH4
Figure 4.22 Effect of Oxygen Pressure on the Benzene Degradation at 260°C, 45
,~' pH4
Figure 4.23 Change of pH with Time during Experiment, P02= 1.38 MPa, 46 Initial Benzene Concentration = 5.63 mmol/L
Figure 4.24 Degradation of Benzene with Sulfuric Acid at 220°C, 47 P02= 1.38 MPa, pH=4
Figure 4.25 Degradation of Benzene at 240°C, P02= 1.38 MPa, pH=4 47
Figure 4.26 Degradation of Benzene at 260°C, P02= 2.07 MPa, pH= 6, 49 Initial Benzene Concentration = 11.25 mmol/L
Figure 4.27 Degradation of Benzene at 260°C, P02= 2.07 MPa, pH= 6, 49 Initial Benzene Concentration = 16.88 mmol/L
Figure 4.28 Effect of Temperature on Benzene Degradation, P02= 2.76 MPa, 50 pH=4, Initial Benzene Concentration of 11.25 mmollL
Figure 4.29 Change ofpH with Time during Experiment, T= 220°C, P02= 2.76 50 MPa, Initial Benzene Concentration = 11.25 mmol/L
Figure 4.30 First Order Kinetic Model Fit of Benzene Degradation, T=220°C, 51 P02=0.69 MPa, pH= 4
~ Figure 4.31 First Order Kinetic Model Fit of Benzene Degradation, T=220°C, 52 P02=0.86 MPa, pH= 4
ix

Figure 4.32 First Order Kinetic Model Fit of Benzene Degradation, T=220oC, 52 P02=1.03 MPa, pH= 4
Figure 4.33 First Order Kinetic Model Fit of Benzene Degradation, T=220°C, 53 P02=1.38 MPa, pH= 4
Figure 4.34 First Order Kinetic Model Fit of Benzene Degradation, T=220oC, 53 P02=1.72 MPa, pH= 4
Figure 4.35 First Order Kinetic Model Fit of Benzene Degradation, T=240°C, 54 P02=1.03 MPa, pH= 4
Figure 4.36 First Order Kinetic Model Fit of Benzene Degradation, T=240°C, 55 P02=1.38 MPa, pH= 4
Figure 4.37 First Order Kinetic Model Fit of Benzene Degradation, T=240°C, 55 P02=1.72 MPa, pH= 4
Figure 4.38 First Order Kinetic Model Fit of Benzene Degradation, T=260°C, 56 P02=1.03 MPa, pH= 4
Figure 4.39 First Order Kinetic Model Fit of Benzene Degradation, T=260°C, 56 P02=1.38 MPa, pH=4
Figure 4.40 First Order Kinetic Model Fit of Benzene Degradation, T=260°C, 57 P02=1.72 MPa, pH= 4
~
Figure 4.41 k' vs. P02, T=220°C, pH=4 58
Figure 4.42 k' vs. P02, T=240°C, pH=4 59
Figure 4.43 k' vs. P02, T=260°C, pH=4 59
Figure 4.44 Arrhenius Plot for Oxidation of Benzene, pH=4 60
Figure 5.1 TOC Reduction with Time, P02=1.38 MPa, pH=6 63
Figure 5.2 Detailed Change in Carbon Concentration with Time, T=220°C, 64 pH=6, P02=1.38 MPa
Figure 5.3 Detailed Change in Carbon Concentration with Time, T=240°C, 64 pH=6, P02=1.38 MPa
Figure 5.4 Detailed Change in Carbon Concentration with Time, T=260°C, 65 pH=6, P02=1.38 MPa
Figure 5.5 Carbon Balance, T=220°C, pH=6, P02=1.38 MPa 65
x

/---" Figure 5.6 Carbon Balance, T=240°C, pH=6, P02=1.38 MPa 66
Figure 5.7 Carbon Balance, T=260°C, pH=6, P02=1.38 MPa 66
Figure 5.8 Repeatability of Carbon Balance, T=220°C, pH=6, P02=1.38 MPa 67
Figure 5.9 Repeatability of Carbon Balance, T=240°C, pH=6, P02=1.38 MPa 67
Figure 5.10 Repeatability of Carbon Balance, T=260°C, pH=6, P02=1.38 MPa 68
Figure 5.11 Effect of Temperature on Acetic Acid, P02= 1.38 MPa, pH=6 70
Figure 5.12 Effect of Temperature on Acetic Acid, P02= 1.38 MPa, pH=4 70
Figure 5.13 Effect of Temperature on Formic Acid, P02= 1.38 MPa, pH=6 71
Figure 5.14 Effect of Temperature on Formic Acid, P02= 1.38 MPa, pH=4 72
Figure 5.15 Effect of Pressure on Acetic Acid T= 260°C, pH=6 73
Figure 5.16 Effect of Pressure on Formic Acid, T= 260°C, pH=6 73
Figure 5.17 Effect of Pressure on Acetic Acid, T= 220°C, pH=4 74
Figure 5.18 Effect of Pressure on Acetic Acid, T= 240°C, pH=4 74
Figure 5.19 Effect of Pressure on Acetic Acid, T= 260°C, pH=4 75
Figure 5.20 Effect of Pressure on Formic Acid, T= 220°C, pH=4 76
Figure 5.21 Effect of Pressure on Formic Acid, T= 240°C, pH=4 76
Figure 5.22 Effect of Pressure on Formic Acid, T= 260°C, pH=4 77
... --" Figure 5.23 Effect ofpH on Acetic Acid, T= 220°C, pH= 4, P02= 1.38 MPa 78
Xl
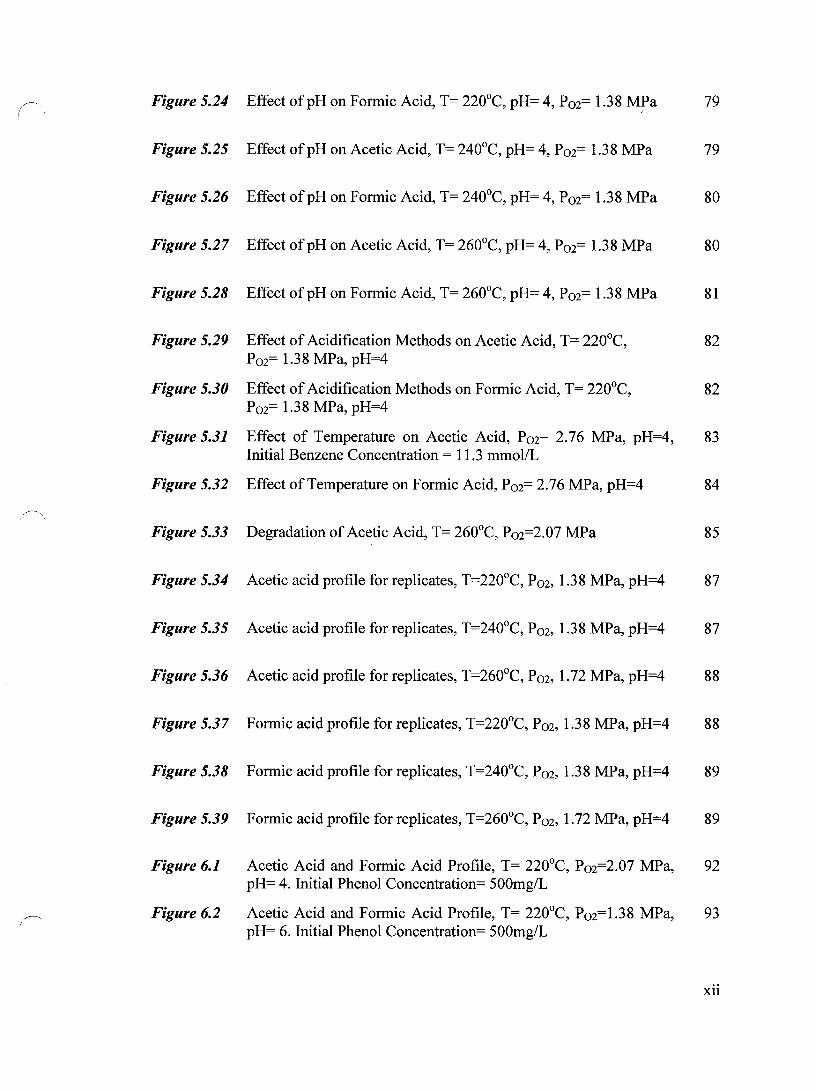
! Figure 5.24 Effect ofpH on Formic Acid, T= 220°C, pH= 4, P02= 1.38 M?a 79
Figure 5.25 Effect ofpH on Acetic Acid, T= 240°C, pH= 4, Pm= 1.38 MPa 79
Figure 5.26 Effect ofpH on Formic Acid, T= 240°C, pH= 4, P02= 1.38 MPa 80
Figure 5.27 Effect ofpH on Acetic Acid, T= 260°C, pH= 4, Pm= 1.38 MPa 80
Figure 5.28 Effect ofpH on Formic Acid, T= 260°C, pH= 4, P02= 1.38 MPa 81
Figure 5.29 Effect of Acidification Methods on Acetic Acid, T= 220°C, 82 Pm= 1.38 MPa, pH=4
Figure 5.30 Effect of Acidification Methods on Formic Acid, T= 220°C, 82 P02= 1.38 MPa, pH=4
Figure 5.31 Effect of Temperature on Acetic Acid, Pm= 2.76 MPa, pH=4, 83 Initial Benzene Concentration = Il.3 mmol/L
Figure 5.32 Effect of Temperature on Formic Acid, P02= 2.76 MPa, pH=4 84
~,
Figure 5.33 Degradation of Acetic Acid, T= 260°C, Po2=2.07 MPa 85
Figure 5.34 Acetic acid profile for replicates, T=220°C, P02, 1.38 MPa, pH=4 87
Figure 5.35 Acetic acid profile for replicates, T=240°C, P02, 1.38 MPa, pH=4 87
Figure 5.36 Acetic acid profile for replicates, T=260oC, Pm, 1.72 MPa, pH=4 88
Figure 5.37 Formic acid profile for replicates, T=220°C, P02, 1.38 MPa, pH=4 88
Figure 5.38 Formic acid profile for replicates, T=240°C, P02, 1.38 MPa, pH=4 89
Figure 5.39 Formic acid profile for replicates, T=260°C, Pm, 1.72 MPa, pH=4 89
Figure 6.1 Acetic Acid and Formic Acid Profile, T= 220°C, Pm=2.07 MPa, 92 pH= 4. Initial Phenol Concentration= 500mg/L
Figure 6.2 Acetic Acid and Formic Acid Profile, T= 220°C, Pm=1.38 MPa, 93 pH= 6. Initial Phenol Concentration= 500mg/L
xii

Figure 6.3 Acetic Acid and Formic Acid Profile, T= 220°C, Poz=0.51 MPa, 93 pH= 4. Initial Phenol Concentration= 200mg/L
Figure 6.4 Degradation of Benzene at 220°C, P02= 1.72 MPa 94
Figure 6.5 Degradation of Phenol at 220°C, P02= 1.72 MPa 95
Figure 6.6 Degradation of Benzene at Different Initial Phenol 96 Concentrations, T=220°C, 100% Excess Oz, Initial pH= 6
Figure 6.7 Degradation of Benzene at Different Initial Phenol 97 Concentrations, T=200°C, 100% Excess Oz, Initial pH= 6
Figure 6.8 Degradation of Benzene at Different Temperatures, 100% Excess 98 Oz, Initial Phenol Concentration= 0.27 mmol/L, Initial pH= 6
Figure 6.9 Degradation of Benzene at Different Temperatures, 100% Excess 99 Oz, Initial Phenol Concentration= 0.53 mmol/L, Initial pH= 6
Figure 6.10 Normalized concentration of Phenol with Time, 100% Excess Oz, 100 Initial pH=6, Initial Phenol Concentration= 0.53 mmol/L
Figure 6.11 Normalized concentration of Phenol with Time, 100% Excess Oz, 101 Initial pH=6, Initial Phenol Concentration= 0.27 mmol/L
Figure 6.12 Pseudo First Order Kinetic Plot for Benzene 102
Figure 6.13 Arrhenius Plot for Pseudo First Order Rate Constant Calculated 102 from Benzene Removal Data
Figure 6.14 Repeatability of Benzene Result at 220°C, 100% Excess 02, 103 Initial pH= 6, Initial Phenol Concentration= 0.27 mmol/L
Figure 6.15 Repeatability of Phenol Result at 220°C, 100% Excess 02, Initial 104 pH= 6, Initial Phenol Concentration= 0.27 mmol/L
Figure 6.16 Simplified Pathway for Oxidation of Benzene 105
xiii
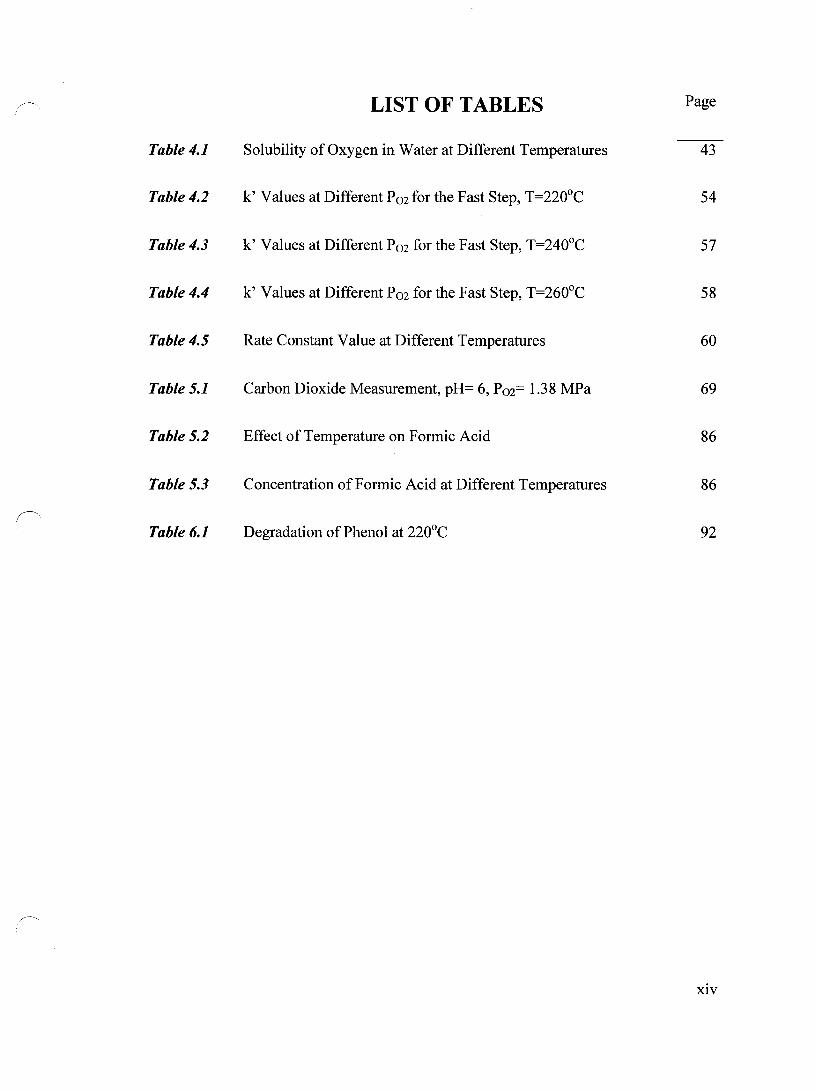
LIST OF TABLES Page
Table 4.1 Solubility ofOxygen in Water at Different Temperatures 43
Table 4.2 k' Values at Different P02 for the Fast Step, T=220°C 54
Table 4.3 k' Values at Different P02 for the Fast Step, T=240°C 57
Table 4.4 k' Values at Different P02 for the Fast Step, T=260°C 58
Table 4.5 Rate Constant Value at Different Temperatures 60
Table 5.1 Carbon Dioxide Measurement, pH= 6, P02= 1.38 MPa 69
Table 5.2 Effect of Temperature on Formic Acid 86
Table 5.3 Concentration of Formic Acid at Different Temperatures 86
(
Table 6.1 Degradation of Phenol at 220°C 92
XIV
CHAPTERONE
INTRODUCTION
Processing of organic compounds produces a large amount of wastewater, which
consists of toxic (hazardous) materials that cannot be discharged to the environment
without treatment. As restrictive environmental constraints increase, new technologies are
needed to treat those toxic materials before discharging them to the environment. Wet Air
Oxidation (WAO) is one of these methods. It is defined as the oxidation of soluble or
suspended oxidizable components in an aqueous environment using either pure oxygen or
air as an oxidizing agent at elevated temperature and pressure. It is a very attractive
method for wastewater treatment, especially when the effiuent is too dilute for
incineration, and either too toxic or concentrated for biological treatment. Typically,
WAO takes place at a temperature range of 125-320°C and at a pressure range of 0.5-30
MPa. The residence time ranges between 15 and 120 minutes. The need of the high
pressure is to maintain the liquid phase at the elevated temperatures. The final products in
this method are water, carbon dioxide and low molecular weight organics. The overall
reaction for organic materials can be expressed as:
Organics + 02
WAO has several advantages and disadvantages. Sorne of the advantages are as
follows: It can treat more than one chemical compound at the same time; it is
environmentally friendly since the destruction of the wastes is in the liquid phase and in
comparison to incineration, no nitrogen oxides are generated. Finally, it does not need a
dewatering step as a pretreatment. On the other hand, there are sorne disadvantages
associated with the WAO. It is limited to wastes that contain oxidizable organic and
1
inorganic compounds. AIso, it is costly since it involves both high temperatures and
pressures.
1.1 Petrochemical Wastewater Effluent
The waste effiuents from the petrochemical industries contain a large amount of
various organic compounds which cannot be discharged to the environment without
treatment. Among the many available methods, activated sludge treatment is the most
widely used because of its simplicity and low cost [47]. However, it can not be used for
highly concentrated wastes due to a low biodegradability and inhibitory effects of the
organic compounds [SOl. For the wastewaters containing phenol and phenolic compounds
which are very common in petrochemical industries, solvent extraction is an economical
method if the concentration of these compounds is high (i.e. over 1 %) [12, 22]. If the
concentration is low, biological treatment is the appropriate method. Finally, incineration
can be an economically attractive alternative although it is limited only for concentrated
wastes and it contributes to air pollution.
1.1.1 Benzene
Benzene (C6H6) is an aromatic hydrocarbon with a molecular weight of78.1 g/mol. It
is a clear, colorless liquid that is volatile and highly flammable. Its water solubility is
about 17S0 mg/L at 2SoC [S]. It is known to be a carcinogenic compound [23] and is
usually found in the wastewater effiuents of the petrochemical industries. A strong
association between leukemia and modest benzene exposure greater than 16 mg/L per
year has been demonstrated [21]. Effiuents that contain benzene can not be discharged to
2
the environment without further treatment in order to remove benzene, which is very
harmful to the environment even at very low concentrations. While the exposure limit for
drinking water to benzene is set to be 5 flg/L in the United States, it is set to be 25 flg/L in
Canada [35]. Benzene is known to be a very refractory compound; that is very difficult to
oxidize. While the aerobic benzene biodegradation has been observed since the 1950's,
the anaerobic benzene degradation was only discovered on 1980 by Ward et al. [68] and
since then much attention was given to it, especially when an extensive anaerobic zone
was developed by soils and sediments contaminated with benzene [1,9,43]. Coates et al.
[10] were the first group to report the isolation of two Dechloromonas strains that can
completely degrade the benzene anaerobically under nitrate reducing conditions. There
has been no single publication available that deals with the wet air oxidation ofbenzene.
1.2 Objectives
The objectives ofthis study were as follows:
• To study the effect of initial pH on the wet air oxidation of benzene at
different temperatures and pressures, hence to find the optimum conditions at
which the benzene will be degraded.
• To determine the main intermediates that resulted from benzene degradation.
• To study the kinetics ofbenzene degradation.
• To study the degradation of benzene in the presence of phenol which is
known to be a common component in many of the wastewater streams.
• To study the kinetics ofbenzene degradation enhanced by phenol.
3

1.3 Thesis Structure
This thesis casts light on the wet air oxidation ofbenzene. The literature about the wet
air oxidation of sorne of the organic components that exist in the wastewater from
petrochemical industries will be reviewed in chapter 2.
Chapter 3 summarizes the experimental methods that were utilized in this study. A
detailed description of the experimental setup, materials, procedures and analytical
methods used for analysis is presented. In Chapter 4, the results for benzene degradation
are presented. The influence of pH on benzene degradation at different temperatures and
pressures is discussed. The kinetic modeling for benzene removal is presented.
Chapter 5 deals with the results that have been obtained regarding the reaction
intermediates. Total Organic Carbon (TOC) measurements are presented. Effect of
temperature, pressure and pH on both, production and degradation of intermediates, is
discussed. WAO for acetic acid and formic acid is presented.
The WAO ofbenzene enhanced by phenol is presented in Chapter 6. The effect of the
initial phenol concentration on benzene degradation is shown. The effect of temperature
on the benzene degradation is discussed. The effect of benzene on the oxidation of phenol
is presented. Reaction kinetics of benzene oxidation enhanced by phenol is presented.
The simplified pathway for benzene oxidation is presented.
The general conclusions, recommendations for future work and contributions to
knowledge are presented in Chapter 7.
4
/~,
CHAPTERTWO
LITERATURE REVIEW
During the last decades, WAO has been the subject of intensive studies in both
chemical and environmental engineering literature. The most important applications are
in municipal sewage sludge treatment, industrial wastewater treatment, carbon
regeneration, and pulping spent liquors. Many of the studies that have been reported in
the literature dealt with both phenol and carboxylic acids. [6,48]
2.1 WAO of Organic Compounds
Numerous studies have been done on the WAO of organic compounds. Phenol in
particular was a subject of considerable interest since it is found in the wastewater of
many industries such as the petrochemicals, plastics and pulp and paper industries. AIso,
numerous studies have been done on the wet air oxidation of the carboxylic acids since
they are the main intermediates during the wet air oxidation of the other organic
compounds, and they are usually difficult to oxidize.
2.1.1 WAO of Phenol
Phenol is considered to be one of the most common and important pollutants that can
be found in the effluent streams of most chemical plants. It is highly toxic even at low
concentrations and therefore wastewaters that contain phenol should be treated before
they can be discharged to environment. WAO is an effective method for the treatment of
effluents containing phenol. Sorne researchers studied the degradation of phenol while
5
the others were more concemed about the environment and therefore studied the COD
reduction instead. Joglekar et al. [33] studied the WAO of phenol in the temperature
range of 150-180°C and oxygen partial pressure from 0.3 to 1.5 MPa, and reported that
more than 90% COD reduction was achieved, while Lin and Chuang [39] reached 100%
COD reduction at an oxygen partial pressure of 10.3 MPa and 300°C. Kolaczkowski et
al. [36] showed that more than 95% phenol degradation was achieved in less than 30
minutes at 200°C and total pressure of 3.0 MPa. Portela Miguelez [52] studied the WAO
of phenol and achieved around 100% degradation at 300°C and a total pressure of 10
MPa in less than 10 minutes. Imamura [24] studied the degradation of phenol at 220°C
and oxygen partial pressure of 3MPa. The COD and TOC reduction achieved in two
hours were 93% and 88%, respectively. Complete phenol degradation was achieved in 10
minutes at 220°C and 10.15MPa in the study that has been done by Vicente et al. [66].
Vaidya and Mahajani [64] reported more than 90% COD reduction in 30 minutes at
230°C and oxygen partial pressure of 0.69 MPa in their study ofWAO of phenol.
In summary, the WAO of phenol was studied at a temperature range between 150 to
300°C and oxygen partial pressure range between 0.3 to 10.3 MPa. It was found that
considerable phenol degradation can be achieved even at mild temperatures.
2.1.2 WAO of Formic Acid and Acetic Acid
Low molecular weight carboxylic acids, especially acetic acid, are resistant to
oxidation [26,29,30,31]. They are either originally found in the waste or generated as
intermediates during the WAO ofvarious waste streams, and they accumulate at the latter
stages of WAO [3,4,17,18,19,34,72], hence becoming a major limitation of the process.
6
Many studies that deal with the oxidation of the mono-and dicarboxylic acids were
carried out with the main aim being the determination of the kinetic parameters together
with TOC and COD removal. Most of the studies were done using a temperature in the
range of 230-290°C, and a pressure of 0.35-12.8 MPa [48]. Chowdary and Copa [8]
achieved 98.3% reduction of formic acid at 300°C in 60 minutes. Shendi and Mahajani
[59] studied the WAO of formic acid in the temperature range 150-240°C and partial
oxygen pressure of 0.69 MPa. Their results showed 12.92% and 95% COD reduction at
150°C and 240°C, respectively. Shendi and Levec [58] studied the wet oxidation kinetic
of sorne refractory low molecular mass carboxylic acids. While only 24% formic acid
degradation was achieved in 2 hours at 240°C and 0.8 MPa of partial oxygen pressure,
around 90 % degradation was achieved at 270°C.
For the acetic acid, 9% degradation was achieved at 300°C and partial oxygen
pressure of 6 MPa while 20% degradation was achieved at 320°C and partial oxygen
pressure of 3 MPa. The methyl group which is an electron donor to the carbon having =0
and -OH group is the main cause for the high stability of acetic acid [58]. While
Imamura et al. [25] showed only 24.9% TOC reduction at 150°C and an oxygen pressure
of 1 MPa in 1 hour, 42.0% TOC removal was achieved for acetic acid when the
temperature was increased to 247°C [28]. The wet air oxidation of acetic acid was studied
by Merchant [46] and it was found that only 7% COD reduction was achieved at 275°C in
5 hours. The WAO of both formic acid and acetic acid were studied by Imamura [24] at
220°C and partial oxygen pressure of 3 MPa in 2 hours. 99% TOC reduction and 100%
COD reduction was achieved for formic acid while only 4% TOC reduction and 10%
COD reduction were achieved for acetic acid.
7
In summary, the wet air oxidation of acetic and formic acids was studied at a
temperature range between 150 to 320°C and an oxygen pressure range between 0.35 to
12.8 MPa. It can be concluded that while the formic acid was easily degraded, the acetic
acid was resistant to oxidation and in most cases stayed as a final product.
2.2 Free Radical Mechanism
The destruction of the organic compounds in the W AO method follows a free-radical
mechanism [38]. The free radical mechanism has been proposed by many researchers
[13,16,32,39,45,51,54,67]; however, only a few of them supported that by direct
experimental evidence [6]. In the absence of initiators, free radicals are formed by the
reaction of oxygen with the weakest C-H bonds of the oxidized organic compound as
follows:
RH +02 ~ R· + HO;
RH + HO; ~ R· +H202
2-1
2-2
where R denotes the organic functional group. In the case of phenol, the reaction of
oxygen with the 0-H bond may also form free radicals. The hydrogen peroxide
decomposes to generate hydroxyl radicals. The oxidation of the organic compound by
hydroxyl radicals follows a hydrogen abstraction mechanism as shown in equation 2-4.
H 202 ~ 2HO·
RH + HO· ~ R· +H20
2-3
2-4
8
The organic radical R· then reacts with oxygen to form an organic peroxy radical
(RaO·) which further abstracts hydrogen atom from the organic compound to produce
an organic hydroperoxide (ROOH) and another organic radical.
2-5
RaO· + RH ~ ROOH + RO 2-6
The organic hydroperoxides, which are formed are relatively unstable and decompose
to intermediates with lower carbon numbers. These reactions continue rapidly until the
formation of the acetic and formic acid which will eventually be converted to carbon
dioxide and water [38].
Robert et al. [56] is the only one who provided a direct experimental evidence of free
radical intermediates under typical WO conditions when they studied the wet oxidation of
cellulose. In their study, the (HO·) hydroxyl radical that is a free radical intermediate
proposed by many researchers was identified. On the other hand, there are sorne indirect
methods to determine the free radical reactions. The co-oxidation is one of these
methods. In this method the free radicals that are produced from an easily oxidizable
compound are used to initiate the oxidation of more refractory compounds [6]. In his
study of WO of sodium malonate in highly alkaline solution, Tardio [61] used this
method to determine the presence of free radical intermediates. Imamura also reported
this method in his study of the wet oxidation of Polyethylene glycols (PEG's).
Sorne researchers used a free radical initiator to enhance the oxidation. Rivas et al.
[55] showed that the addition of hydrogen peroxide not only significantly enhanced the
wet air oxidation of phenol but also eliminated the induction time period experienced
9
during the conventional wet air oxidation at mild conditions. Rivas et al. [53] in their
study about the wet air oxidation of landfill leachates tried both hydrogen peroxide and
Oxone as free radical promoters. They showed that the additions of those promoters
enhanced the COD reduction. Using free radical reaction inhibitors is another indirect
method to determine free radical reactions. Vaidya and Mahajani [64] showed that by
using t-butanol, which is known to be a free radical inhibitor, the degradation rate of
phenol was decreased.
2.2.1 Induction Period
The induction period, which is typical of free radical reactions, is defined as the time
needed for the free radicals to be generated in a sufficient concentration [69]. Willms et
al. [70] studied the WAO ofboth m-xylene and phenol at a temperature range between 27
to 227°C and a total pressure range between 7-14 MPa. They found that the oxidation
reactions of both compounds are characterized by an induction period during which no
reaction was noticed. They reported that the induction time was inversely proportional to
the dissolved oxygen concentration. The induction period was also observed for phenol
by Joglekar et al. [33]. Their study was conducted in temperature range between 150-
180°C and oxygen partial pressures range between 0.3 to 1.5 MPa and initial phenol
concentration was 200 mg/L. Portela Miguelez et al. [52] studied the wet air oxidation of
phenol in a batch reactor at temperatures between 150-300°C and pressures from 10 to 20
MPa, while the initial oxygen concentration was always above 800% excess. They found
that the induction time was over 1 hour at 150°C and it decreased with the increase of the
temperature until it almost disappeared at 300°C. Thomsen [62] in his study about the
10

degradation of quinoline by wet oxidation found that the temperature has a dramatic
effect on the induction period. While the induction time was 45 minutes at 220°C, it was
less than 10 minutes when the temperature was increased to 240°C. These studies showed
the significant effect of the temperature on the induction period.
2.3 Effect of the Initial pH on the W AO
The initial pH has a significant effect on both the W AO reaction rate and pathway
[36]. However, the operating pH, which is different than the initial pH, has a complex
effect on reaction rate [36,64]. Only a few studies have been reported about the effect of
pH on the wet oxidation of organic compounds [64]. The pH of the solution has an effect
on the type of free radical reactions that occur during W AO and the stability of the free
radical intermediates formed. The oxidizing strength of free radical intermediates
decreases at alkaline conditions in most cases since in alkaline solution, carbonate,
bicarbonate and hydroxide can scavenge hydroxyl radicals [6]
HO· +cot ~-OH+·CO;
HO· + Hcoi- ~ H20+ ·CO;
HO·+-OH ~H20+0·-
2.7
2.8
2.9
Kolaczkowski et al. [36] studied the WAO of phenol at 200°C and pressure of 3.0
MPa with different initial pH and found that the initial pH has a significant effect on the
W AO reaction rate. For pH less than or equal to 2 and between 7 and 10, no reaction took
place. However, when no acid or base was added, i.e. when pH was approximately 4,
significant phenol decomposition was achieved. AIso, when the pH was adjusted to be
above the pKa of phenol, rapid oxidation was achieved with no induction period. This can
11

be attributed to the effect pH has on the chemical structure of the phenol, Le. the
phenolate ion is highly reactive [6,36]. The change ofpH during the oxidation period has
a noticeable effect on both the phenol decomposition and COD removal [39]. When
buffer was added in order to stabilize the pH, the COD reduction decreased dramatically.
The W AO of carboxylic acids is also affected by the pH of the solution. While 90%
TOC reduction was achieved for oxalic acid at a pH of 2.5 and 160°C within 20 minutes
[27], less than 2% TOC conversion was achieved at pH greater than 14 within 2 h at
165°C [60,61]. In their study of the catalytic WAO of formic acid Imamura et al. [25]
showed that the reactivity depends remarkably on pH. They achieved total TOC removal
at 150°C, oxygen partial pressure of 1.0 MPa and at pH of 1.9, while only 7%
degradation was achieved at pH of 5.6, which suggests that the reactivity of the formic
acid is more than the formate ion since the pKa of formic acid is 3.75. They showed also
that the oxidation of acetic acid was also affected by the pH. While 44.5% TOC
degradation was achieved at 200°C in 1 hour at pH of 2.7 in the oxidation catalyzed by
Ru/Ce, only 19.4% was achieved at pH of 6.9. Those results show the strong influence of
the pH on the W AO process for different organic compounds.
2.4 Wet Air Oxidation Enhancements
In the last section, it was shown how the pH can affect the W AO of many organic
compounds. In addition, there are numerous other methods that have been reported in
order to increase the effectiveness of the W AO. One of these is the catalytic wet air
oxidation in which either homogenous or heterogeneous catalysts were used to enhance
the degradation [11,25,40,44]. The wet oxidation method was also enhanced by using
12
/"' ..
ozone [3] or hydrogen peroxide [14,15,42] as an oxidizing agent. Supercriticaloxidation
[37] was also tried in order to improve the oxidation of sorne compounds.
The Co-oxidation method, which was discussed in section 2.3, was reported to be
one of the promising methods that can be used to enhance the WAO. In 1987, Willims et
al. [71] showed that the addition of phenol to a solution containing m-xylene enhanced
the oxidation rate of m-xylene. Ingale et al. [32] reported that the degradation rate of
acetic acid is faster when it is present with other compounds than when it is alone. Shendi
and Levec [58] showed that at the same operating conditions, the conversion of formic
acid was about Il % higher when an equal amount of acetic acid was added to the
solution. Birchmeier et al. [7] reported that the oxidation of recalcitrant low molecular
weight acids was enhanced by the addition of either phenol or cellobiose to the solution.
The degradation of thiocyanate was significantly enhanced when simultaneously oxidized
together with phenol, as shown by Vicente and Diaz [65]. Recently, Fu et al. [20] studied
the wet air oxidation of nitrobenzene and they reported that the presence of phenol in the
reaction media enhanced the removal of nitrobenzene.
As suggested in the literature, the first intermediate formed during the wet air
oxidation of phenol is hydroquinone, which is unstable and breaks rapidly in the presence
of excess oxygen forming other low molecular weight products and carbon dioxide [51].
It also forms hydrogen peroxide. The hydrogen peroxide then produces hydroxyl and
perhydroxyl radicals [36]. Hydroxyl radicals have the second highest oxidation potential
after fluorine, which makes them very reactive oxidants [64]. Because of the presence of
these radicals the rate of the degradation reaction increases. The following reactions show
the mechanism [64]:
13
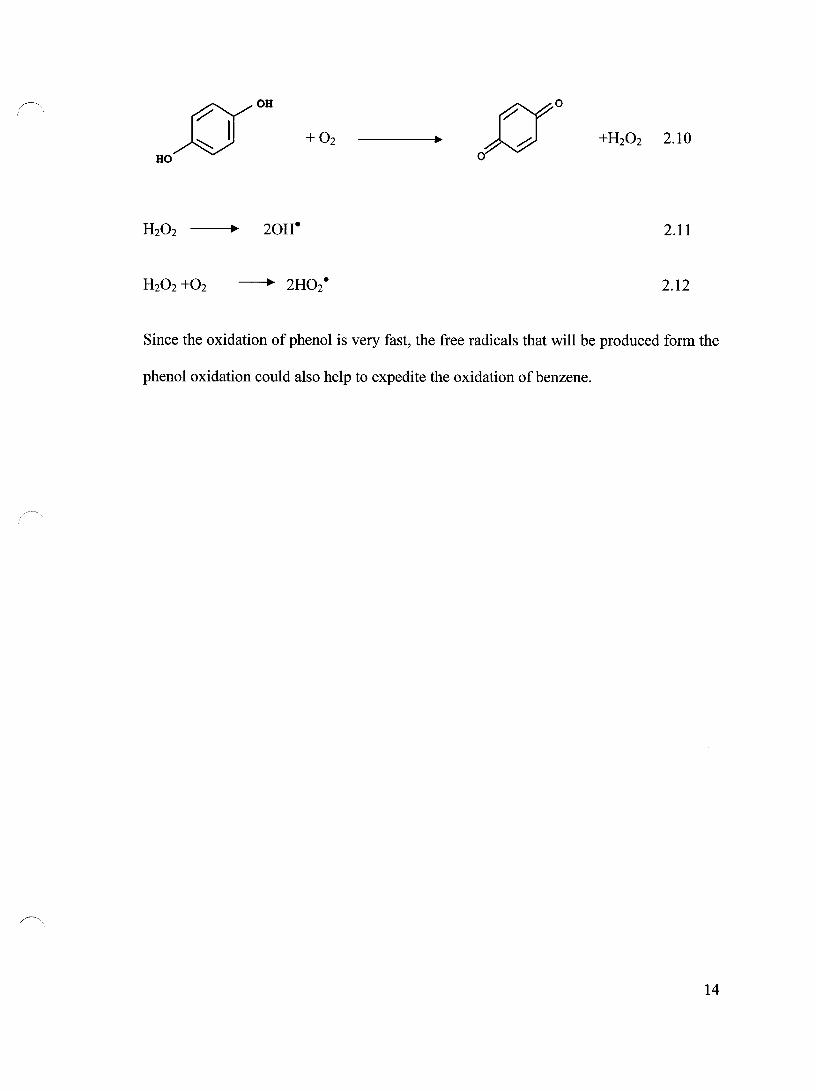
2.11
2.12
Since the oxidation of phenol is very fast, the free radicals that will be produced form the
phenol oxidation could also help to expedite the oxidation ofbenzene.
14
CHAPTER THREE
Experimental Setup and Procedure
3.1 Apparatus
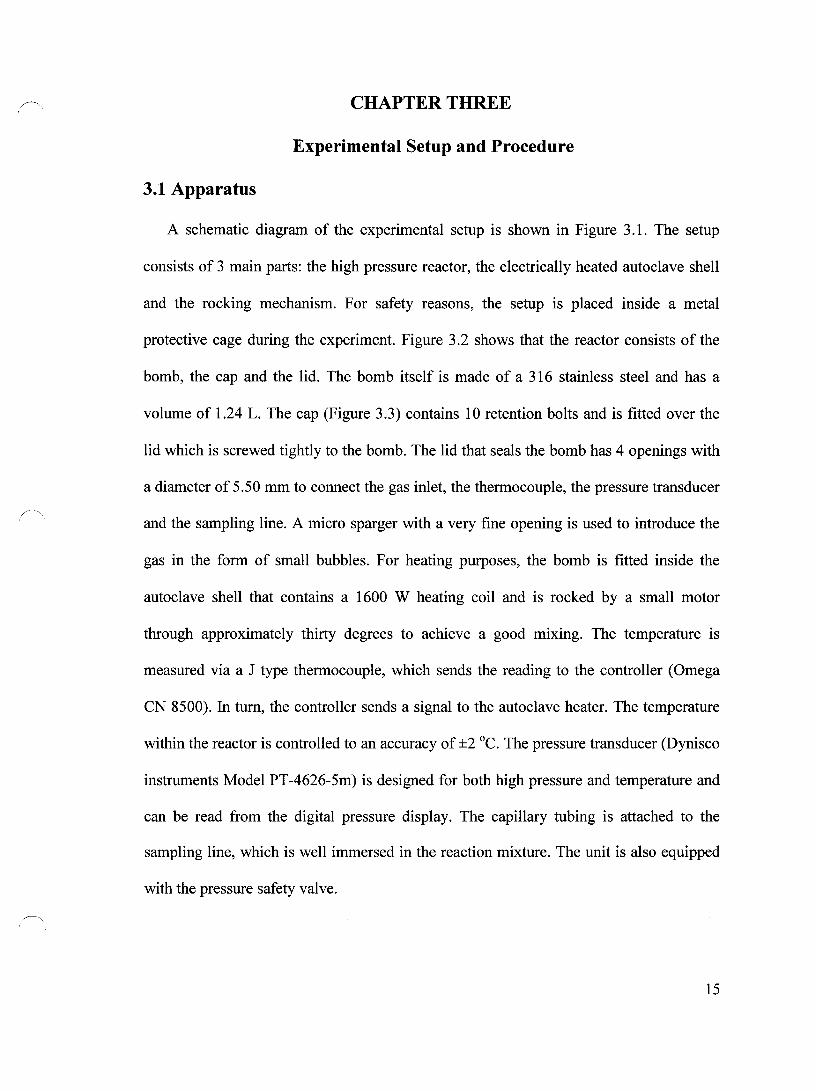
A schematic diagram of the experimental setup is shown in Figure 3.1. The setup
consists of 3 main parts: the high pressure reactor, the electrically heated autoclave shell
and the rocking mechanism. For safety reasons, the setup is placed inside a metal
protective cage during the experiment. Figure 3.2 shows that the reactor consists of the
bomb, the cap and the lido The bomb itself is made of a 316 stainless steel and has a
volume of 1.24 L. The cap (Figure 3.3) contains 10 retention bolts and is fitted over the
lid which is screwed tightly to the bomb. The lid that seals the bomb has 4 openings with
a diameter of 5.50 mm to connect the gas inlet, the thermocouple, the pressure transducer
and the sampling line. A micro sparger with a very fine opening is used to introduce the
gas in the form of small bubbles. For heating purposes, the bomb is fitted inside the
autoclave shell that contains a 1600 W heating coil and is rocked by a small motor
through approximately thirty degrees to achieve a good mixing. The temperature is
measured via a J type thermocouple, which sends the reading to the controller (Omega
CN 8500). In tum, the controller sends a signal to the autoclave heater. The temperature
within the reactor is controlled to an accuracy of ±2 oC. The pressure transducer (Dynisco
instruments Model PT-4626-5m) is designed for both high pressure and temperature and
can be read from the digital pressure display. The capillary tubing is attached to the
sampling line, which is well immersed in the reaction mixture. The unit is also equipped
with the pressure safety valve.
15
~ (
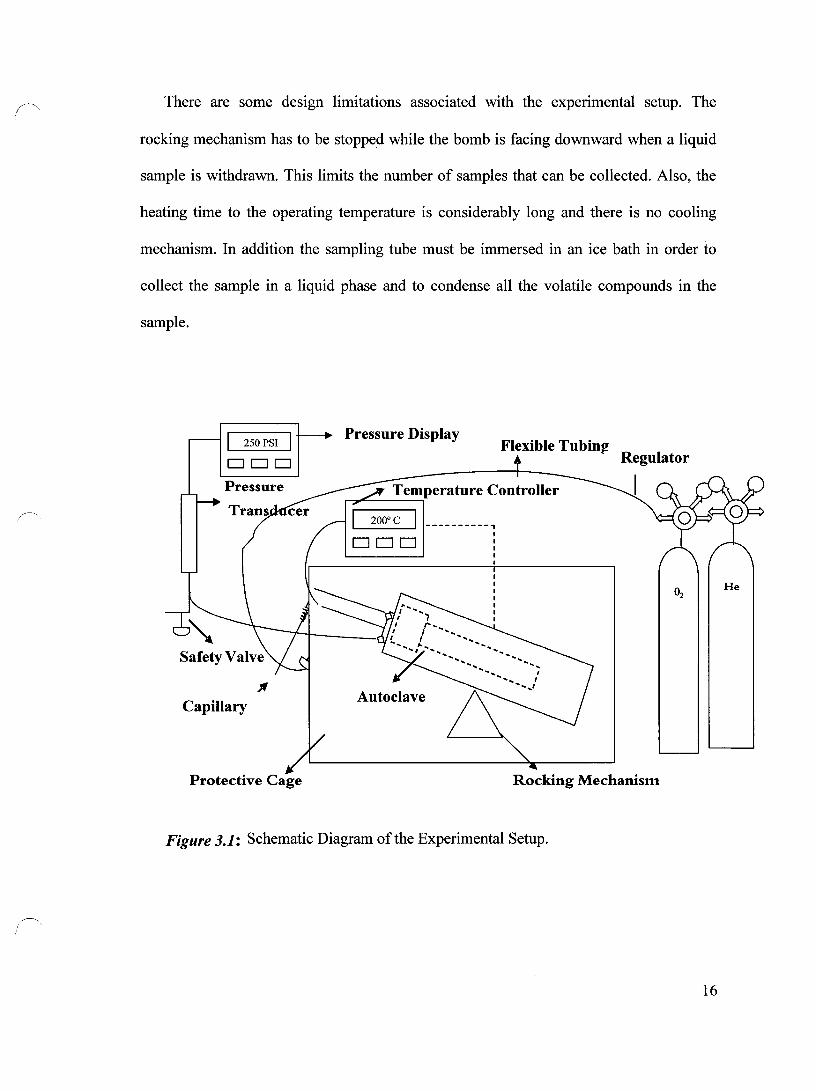
There are sorne design limitations associated with the experimental setup. The
rocking mechanism has to be stopped while the bomb is facing downward when a liquid
sample is withdrawn. This Iimits the number of samples that can be coIlected. AIso, the
heating time to the operating temperature is considerably long and there is no cooling
mechanism. In addition the sampling tube must be immersed in an ice bath in order to
coIlect the sample in a Iiquid phase and to condense aIl the volatile compounds in the
sample.
250 PSI
DDD
Pressure
Capillary
Protective Cage
Pressure Display
200°C 1
DDD ----------,
1 1 1 1 1
Flexible TubioJ! Regulator
Rocking Mechanism
Figure 3.1: Schematic Diagram of the Experimental Setup.
16
He

~ Thermocouple
__ .~ Pressure
---+ Gas (lnlet)
---+ Lid
Sparger
Bomb
Figure 3.2: Schematic Diagram of the Reactor ID = 8.2 cm, OD = 11.2 cm, L = 23.0 cm.
3.2 Materials
Retention bolts
o o
o 0 000
Figure 3.3: Upper View for the Cap
Benzene ACS grade was obtained from Fisher Scientific with a 99.9% purity and
was used as received from the supplier. Toluene HPLC grade was obtained from
American Chemicals LMD. Oxygen from a cylinder with a minimum purity of 99.6%
was used as oxidant. Helium that is the inert gas used in the experiment was also used
from a cylinder with a purity of 99%. Both oxygen and helium were obtained from BOC
Gases in Montreal, Canada. Phenol (ACS grade) was obtained from J.T Baker and used
without further purification. Sulfuric acid and nitric acid were ACS grade and obtained
17
Fisher Scientific. Formic acid (ACS grade) was obtained from American Chemicals
LMD. Acetic acid (trace metal grade) was obtained from Fisher Scientific.
3.3 Experimental Procedures
Throughout the experiments, 500 pL of benzene was added to 1000 mL of water and
stirred for 1 hour. Since the benzene is a very dangerous and carcinogenic material, this
was done in the fume hood and gloves were worn. The initial pH of the solution was in
the range of 4-6. Depending on the desired initial value, the pH was typicaHy lowered
with nitric acid, but sulfuric acid or acetic acid were also used to determine if the type of
acid has any influence on the reaction. The solution was then transferred to the reactor,
which was then sealed at once. AH auxiliary components were connected and the reactor
was purged with helium to remove any oxygen in the reactor. Helium was added to the
system before heating to prevent the oxidation before the reaction temperature was
reached and to keep the effluent in the liquid phase. After that, the reactor was placed
inside the autoclave that was pre-heated for about 60-75 minutes to minimize the time
needed to reach the operating temperature. Then, the system was heated to the
predetermined operating temperature. The operating temperature was in the range of 190-
260°C. When the operating temperature was reached, the reactor was pressurized with
pure 02 to the appropriate oxygen partial pressure. This was considered as time zero for
the reaction. In aH experiments the amount of oxygen was always in excess. Appendix A
shows the ca1culation for the theoretical amount of oxygen needed. To coHect a liquid
sample from the reactor, the rocking mechanism was stopped, and with the bomb facing
downward, the capillary tube was immersed in an ice bath. AH collected samples were of
18
the same volume and they were weighed and stored in the refrigerator. Toluene was
added to each sample as an internaI standard for the GC analysis of the benzene and the
phenol. The above mentioned procedure was repeated at different temperatures and
pressures. Usually, experiments were done in duplicate.
In the second part of this study, phenol was used to enhance the degradation of the
benzene. Experiments were done with different phenol concentrations in the range of 10
to 200 mg/L with 100% excess of oxygen. In those experiments, the concentration of
benzene was kept constant at 5.63 mmol/L. The operating temperatures were in the range
of 160-220°C. After the preparation of the solution, the experimental procedure was
exactly as it was described before.
3.4 Analytical Methods
The main analytical method that was used to study the effectiveness of the W AO
method was Gas Chromatography (GC). It was used to measure the degree of oxidation
for both benzene and phenol. AIso, in sorne experiments the Total Organic Carbon (TOC)
analysis was used to determine the carbon degradation. Ion Chromatography (IC) was
used to study the production and the degradation of organic acids.
3.4.1 Gas Chromatography Analysis
Gas Chromatography is one of the most important separation methods, which is based
on components partitioning between a stationary phase that can be either liquid or solid,
and a mobile phase, which is an inert carrier gas. The column used in this work was
19
bought from Chromatographie Specialties Inc. and it was a Stabilwax column 30 meter
long with 0.32 mm ID and 0.251lm df. The GC apparatus was a Hewlett Packard 5890.
3.4.1.1 Gas Chromatography Method
The injector temperature was set to 215°C while the FID detector temperature was set
at 275°C. The flow rates for the air, hydrogen, and helium were 300, 30, 30 mL/min,
respectively. Before the analysis, the split ratio of helium was set to 10 mL/min and the
column temperature was set at 215°C for about an hour, in order to flush the column.
Then, the temperature was reduced to 80°C as the initial temperature. The initial time was
set to 2 minutes, after which the temperature was increased to 200°C at a rate of
20°C/min. The sample volume was 0.3 ,uL. Toluene was used as an internaI standard
because it has similar structure to benzene and has similar retenti on time. The use of
internaI standard is very important in order to minimize the error during the injection of
the sample. When using an internaI standard, the standard that contains known
concentrations of both benzene and toluene was prepared. The standard was injected into
the GC in order to calculate the k factor which is defined as
k
where,
(area / amount )c (area / amount )1
[(area/amount)]c: value of the compound
[(area/amount)],: Value of the internaI standard
This k value is constant which is used to caIculate the concentration of tested component.
20
3.4.1.2 Calibration of the GC
Three benzene standards that contain the same benzene and toluene concentrations
were prepared. Five 0.3 ,uL samples from each standard were injected randomly in the
GC. These 15 samples were used to calibrate the GC, which is done automatically by the
instrument. After calibration, a sample from each standard was injected in order to check
the calibration. The results that were obtained showed that the maximum deviation was
6.8%. There are many sources that can lead to this deviation, such as error that results
from the preparation of the standards, error that can results from the addition of the
internaI standard and instrument's error. It should be mentioned that for two injections
from the same sample, the reading was close to each other with a difference less than 4%
in most cases. This difference decreased for highly concentrated samples and increased
when the concentration of the sample was less than 0.1 mmol/L.
After the calibration of the GC apparatus, a repeatability of the standard was
determined. A fresh standard with a known concentration was prepared and it was used to
calibrate the GC. After calibration, two fresh standards that have the same concentration
were prepared to check the repeatability of the results. It was found that the maximum
deviation was 5.3%
3.4.2 Ion Chromatography
Ion Chromatography (lC), which is a form of liquid chromatography, is an analytical
method used to separate atomic or molecular ions by the use of ion exchange resins, and
this is based on their interaction with the resin. In this study, IC was used mainly to
determine the concentration of the molecular ions for both the acetate and formate. The
21
IC used was the DX-lOO which is manufactured by the Dionex Corporation. The column
which was used is 10nPac AS14 4mm while the eluent was 2.7 mmol Na2C03/L + 0.3
mmol NaHC03/L. One limitation of this method was the poor separation between the
acetic acid and the formic acid, due to the isocratic technique that was used. In this
technique, the solvent composition remains constant throughout the analysis since no
gradient pump was used to change the concentration of the eluent after certain time,
which is important to achieve better separation. This problem was overcome by using a
slow pump speed in order to get better separation.
3.4.2.1 Ion Chromatography Method
Standards with different concentrations for both acetic acid and formic acid were
prepared. A calibration curve for each acid was produced and stored in the IC program.
The pump speed was adjusted to 50 mL/min and the eluent nitrogen pressure was
adjusted to 68.9 kPa. A blank was injected to check for any contaminants that may be
present in the column. 1.0 mL of the sample was injected in the column after which the
values of the acids were recorded.
3.4.2.2 Repeatability of the IC
Five different standards with five different concentrations of both acetic and formic
acids were prepared for the IC calibration. After calibration, fresh standards of both
acetic acid and formic acid were prepared and were injected to check the validity of the
IC calibration. The results showed that the calibration was good and the error was less
than 3%. To study the calibration of a mixture of both acetic and formic acids, a fresh
22
~ (
standard that contained a known concentration of both acids was prepared and injected in
the IC. The results show that the calibration was good even for the mixtures. For
example, when a standard that contain 60 mmol/L formic acid and 20 mmol/L acetic acid
was prepared and injected in the IC after calibration, the results that were obtained were
59.4 mmol/L for formic acid and 19.6 for acetic acid. The same results were obtained
even if only formic or acetic acid was injected.
3.4.3 Total Organic Compound Measurement
Total Organic Carbon analysis is a method that measures the carbon content of
dissolved organic matter present in a solution and it is a common parameter that can
describe the efficiency of the treatment process. TOC does not measure any organically
bound elements other than carbon and it does not depend on the oxidation state of the
organic matter. AIso, TOC does not measure the inorganic compounds, which may
contribute to the oxygen demand as measured by Chemical Oxygen Demand analysis
(COD). For this study, the UV-Persulfate method was used. The organic compounds
were oxidized to carbon dioxide by persulphate in the presence of a UV light source. A
nondispersive infrared analyzer measured the C02 generated during the reaction. The
apparatus that was used for the TOC measurement was the DC-80 Total Carbon Analyzer
manufactured by Rose Mount Dohrmann.
3.4.3.1 TOC Method
Before the measurement, the TOC analyzer was calibrated with a 400 mg/L standard
of Potassium Hydrogen Phthalate (KPH). After calibration, the sample was injected with
23
a 200 ilL syringe into the apparatus. AH samples were injected with both lamp on and
lamp off. When the lamp was on, the results included both Total Organic Carbon and
Total Inorganic Carbon, while with the lamp off, only the Total Inorganic Carbon was
detected. Then, the TOC was calculated as the difference between the two values. This
has been done in order to minimize any error that may occur because of the interference
of the inorganic compounds. The repeatability of the TOC analysis was tested by 10
injections for the same sample and the standard deviation was found to be 2.95%.
24
CHAPTER FOUR
RESULTS AND DISCUSSIONS
WET AIR OXIDATION OF BENZENE
The wet air oxidation of benzene was studied to determine the optimum conditions
required to achieve benzene degradation. The effect of initial pH on the degradation of
benzene has been studied at different temperatures and pressures. Results from
experiments that have been performed in the absence of oxygen are presented. The
repeatability of the results was tested. The pH fluctuation during the experiment was also
shown. Both the effect of acidification method and the effect of the initial benzene
concentration on its degradation were examined. Finally, a simple kinetic model was
proposed.
4.1 Experiments with Benzene in the Absence of Oxygen
At the beginning of this study, two experiments were carried out without oxygen
using only nitrogen to determine whether any pyrolysis of the benzene took place. These
two experiments were done under 1.1 MPa nitrogen pressure with Il.3 mmol/L benzene
solution at 20°C and 250°C. In the absence of oxygen, no degradation was observed.
These experiments also showed that the sampling procedure did not have any effect on
the liquid concentration and the benzene stayed in the liquid phase throughout the
experiment.
25

4.2 Chemical Oxygen Demand Measurements
Chemical Oxygen Demand (COD) is one of the most widely used parameters to
evaluate the degree of oxidation during the WAO. At the beginning of this study, the
COD was one of the parameters used to study the extent of degradation of organic
compound. However, the results showed that benzene was not completely oxidized under
the conditions of the COD test. This observation is in agreement with the literature (2).
For example, when the benzene concentration was 4.52 mmol/L, the equivalent COD
concentration should have been 33.9 mmol 02/L. In fact, the actual COD value measured
was 26.6 mmol 02/L. Therefore, in this thesis the results will be reported in terms of the
concentrations of benzene, byproducts and the total organic carbon.
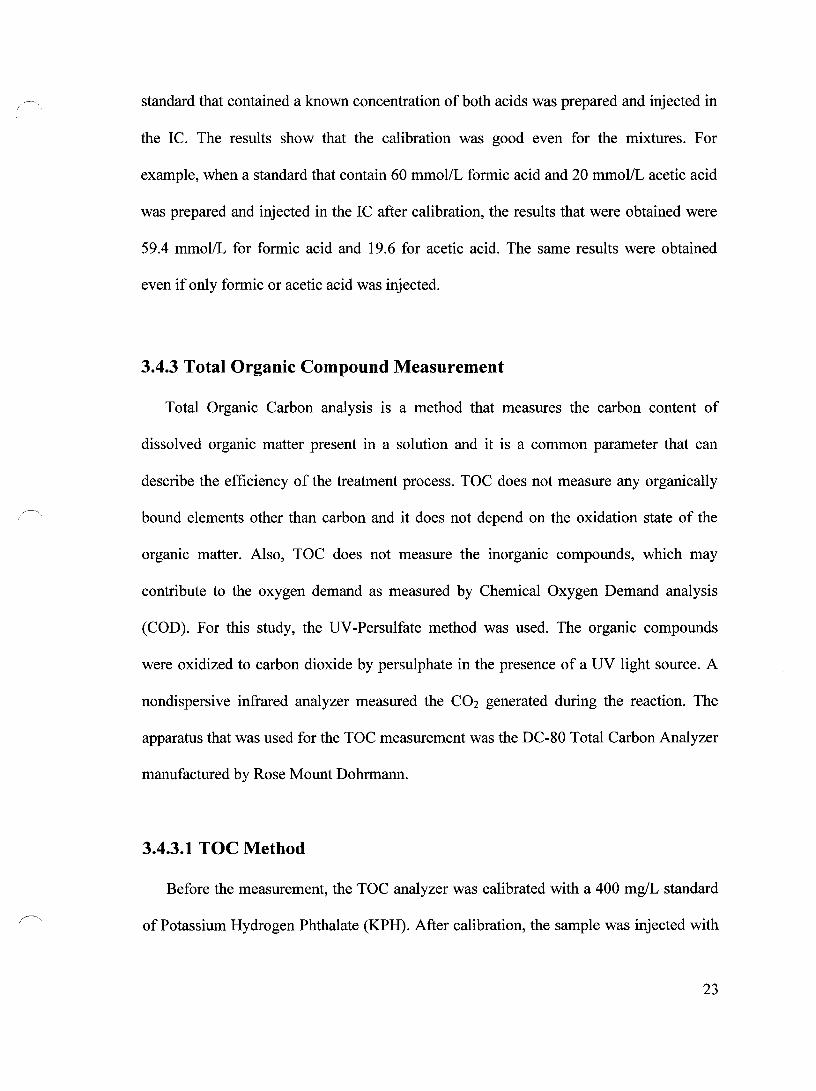
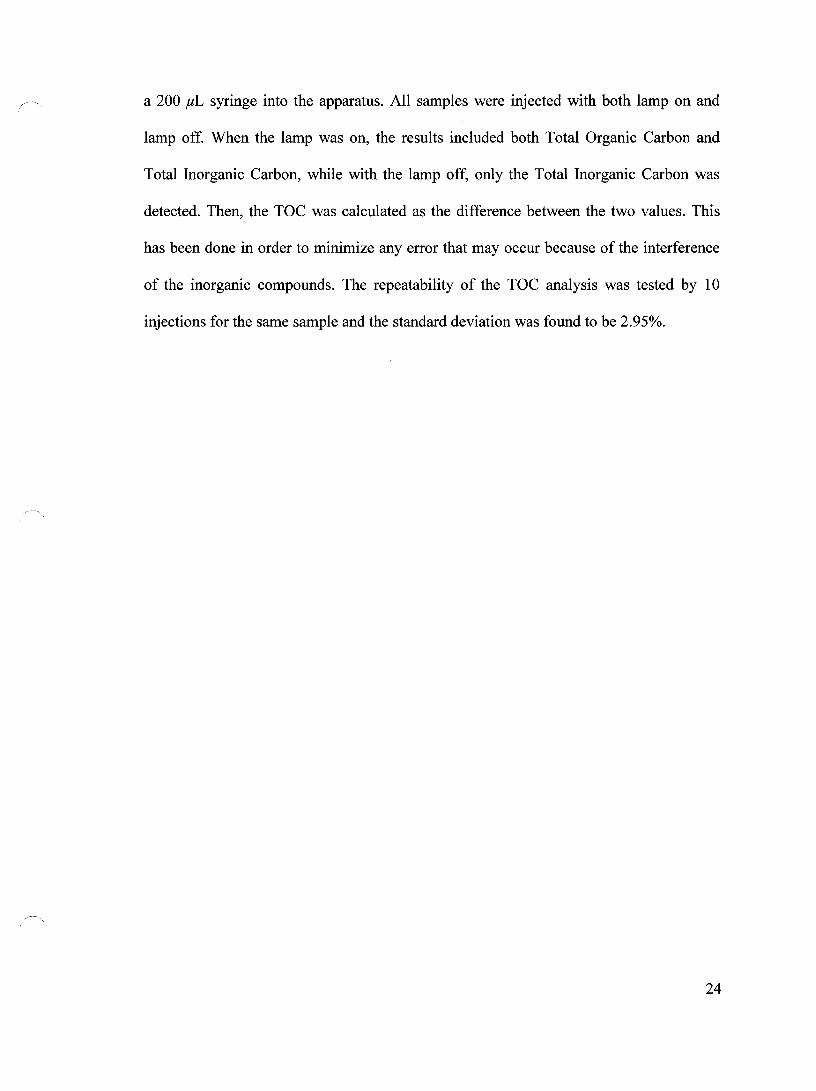
4.3 Repeatability of the Results
Repeatability of the experimental results has been tested by conducting duplicate
experiments. The majority of the data points that will be shown in this chapter are
averages of two experiments. Figures 4.1, 4.2 and 4.3 demonstrate the repeatability of the
experimental points obtained at oxygen pressure of 1.38 MPa, pH 4 and temperatures of
220, 240 and 260°C, respectively. It is apparent that excellent repeatability has been
achieved.
26
4r----------------------------------------------------, 3.5
3
~ 2.5
Q
a a 2 '-'
=â U 1.5
• 0.5
• • • 0
0 5 10 15 20 25 30
Time (min)
Figure 4.1: Repeatability of Data from Two Experiments at 220°C. P02= 1.38MPa. pH=4.
4.5
• 4
3.5
3 ,-.
S ~ 2.5
a '-'
'" 2 = '" • U 1.5
Figure 4.2: Repeatability of Data from Two Experiments at 240°C. P02= 1.38MPa. pH=4.
27
~.
4.5
~ 4
3.5
3 ,-., ~ ;::. e 2.5
El '-'
'" 2 = '" U 1.5 • •
• • 0.5 , , Il
0
0 5 10 15 20 25 30
Time (min)
Figure 4.3: Repeatability of Data from Two Experiments at 260°C, P02= 1.38MPa, pH=4.
4.4 Influence of Initial pH on Benzene Degradation
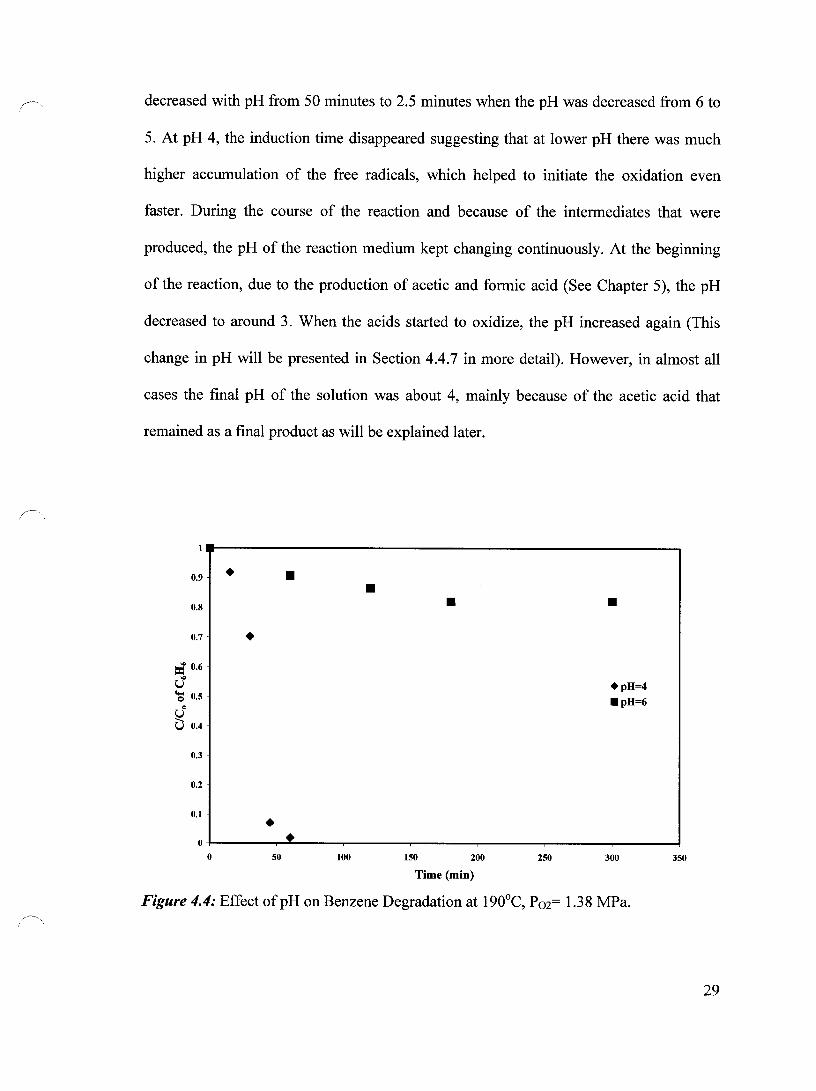
In this section, the effect of initial pH at four different temperature levels at 190°C,
220°C, 240°C and 260°C was studied. The oxygen pressure was kept constant at 1.38
MPa. Two experiments were conducted at 190°C. The initial pH was 4 and 6. Figure 4.4
demonstrates that when the initial pH was 6, almost no degradation took place even after
5 hours of oxidation time. However, when the initial pH was lowered to 4 about 98%
degradation was achieved within 1 hour.
Figure 4.5 shows the effect of the initial pH on the benzene degradation at 220°C.
When the initial pH was reduced from 6 to 5 the reaction became faster. However, when
the initial pH was reduced from 5 to 4 the change in the reaction rate was only noticeable
at the first 2.5 minutes and after that the results were similar. The induction time
28
decreased with pH from 50 minutes to 2.5 minutes when the pH was decreased from 6 to
5. At pH 4, the induction time disappeared suggesting that at lower pH there was much
higher accumulation of the free radicals, which helped to initiate the oxidation even
faster. During the course of the reaction and because of the intermediates that were
produced, the pH of the reaction medium kept changing continuously. At the beginning
of the reaction, due to the production of acetic and formic acid (See Chapter 5), the pH
decreased to around 3. When the acids started to oxidize, the pH increased again (This
change in pH will be presented in Section 4.4.7 in more detail). However, in almost aIl
cases the final pH of the solution was about 4, mainly because of the acetic acid that
remained as a final product as will be explained later .
0.9 • • • 0.8 • • 0.7 •
== 0.6
'" U +pH=4 'a 0.5 .pH=6
'" U U 0.4
0.3
0.2
0.1 • 0 •
0 50 100 150 200 250 300 350
Time (min)
Figure 4.4: Effect ofpH on Benzene Degradation at 190°C, P02= 1.38 MPa.
29

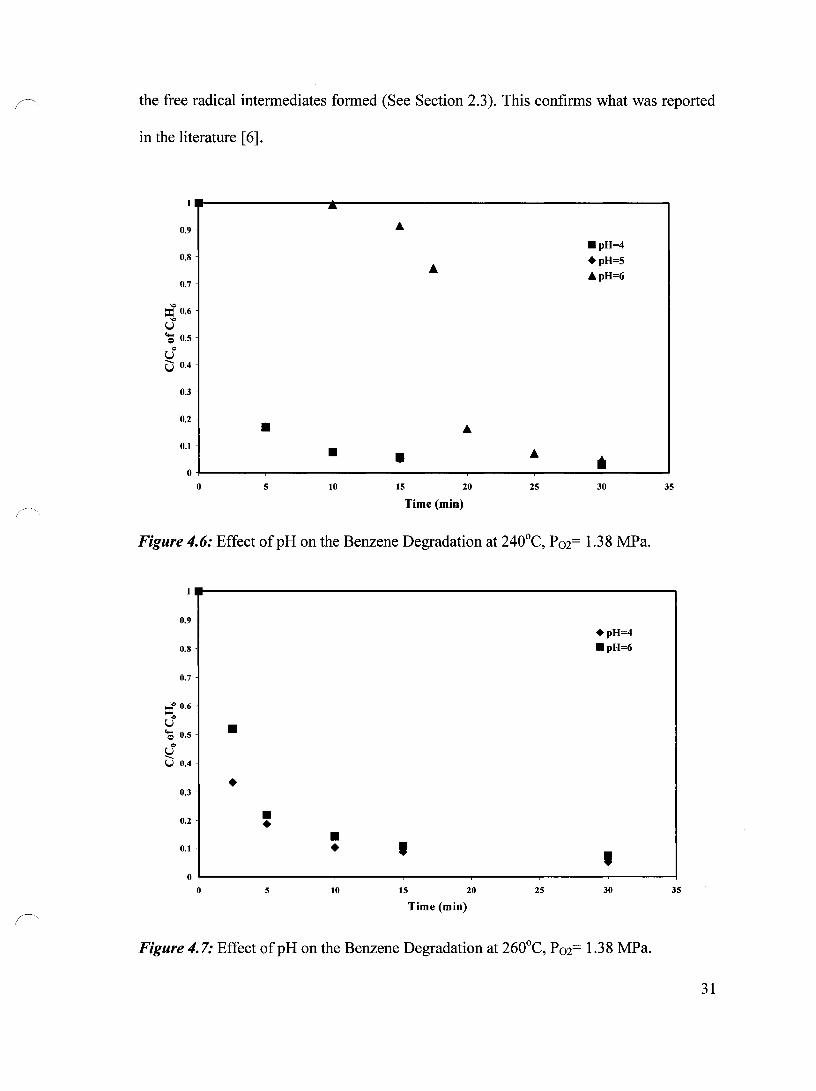
Similarly, at 240°C (Figure 4.6), reducing the pH from 6 to 5 had a large effect on the
degradation of benzene. The induction time, which was about 15 minutes at pH 6,
disappeared entirely at pH 5 and pH 4. AIso, reducing the pH from 5 to 4 did not change
the benzene degradation at this temperature, suggesting that at 240°C the accumulation of
the free radicals at both pH 4 and pH 5 was comparable.
The effect of pH was further studied at 260°C where the oxidation was fast even in
the first 5 minutes of the experiment. Figure 4.7 shows the degradation at 260°C at both
pH 4 and pH 6. The degradation of benzene was enhanced dramatically especially at the
beginning of the reaction. While only 48% degradation was achieved at pH 6 in the first
2.5 minutes, about 67% has been achieved at pH 4.
In summary, the initial pH of the reaction medium had a significant effect on the
benzene oxidation; especially at lower oxidation temperatures, because the pH of the
solution influences the type of free radical reactions that occur and also the stability of
30
(
~
the free radical intermediates formed (See Section 2.3). This confirms what was reported
in the literature [6].
0.9
0.8
0.7
"" == 0.6 "" U ~ 0.5
= U Û 0.4
0.3
0.2 • 0.1
0
0 5
-
• • 10 15 20 25
Time (min)
.pH=4
+pH=5 ApH=6
• 30
Figure 4.6: Effect ofpH on the Benzene Degradation at 240°C, P02= 1.38 MPa.
0.9
0.8
0.7
=0.6
"" U ~ 0.5 • = S2
U 0.4
• 0.3
0.2 • • 0.1
0
0 5
• • , 10 15
Time (min)
20 25
+pH=4 .pH=6
, 30
Figure 4.7: Effect of pH on the Benzene Degradation at 260°C, P 02= 1.3 8 MPa.
35
35
31
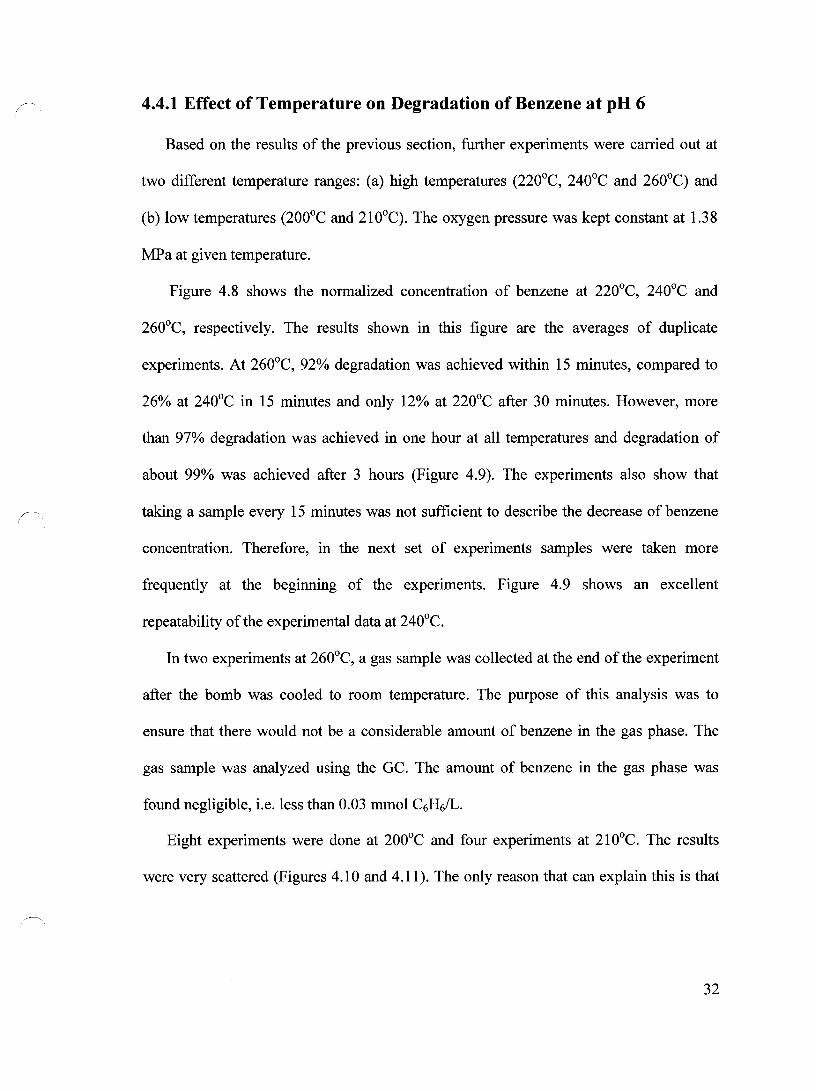
4.4.1 Effect of Temperature on Degradation of Benzene at pH 6
Based on the results of the previous section, further experiments were carried out at
two different temperature ranges: (a) high temperatures (220°C, 240°C and 260°C) and
(b) low temperatures (200°C and 210°C). The oxygen pressure was kept constant at 1.38
MPa at given temperature.
Figure 4.8 shows the normalized concentration of benzene at 220°C, 240°C and
260°C, respectively. The results shown in this figure are the averages of duplicate
experiments. At 260°C, 92% degradation was achieved within 15 minutes, compared to
26% at 240°C in 15 minutes and only 12% at 220°C after 30 minutes. However, more
than 97% degradation was achieved in one hour at all temperatures and de gradation of
about 99% was achieved after 3 hours (Figure 4.9). The experiments also show that
taking a sample every 15 minutes was not sufficient to describe the decrease of benzene
concentration. Therefore, in the next set of experiments samples were taken more
frequently at the beginning of the experiments. Figure 4.9 shows an excellent
repeatability of the experimental data at 240°C.
In two experiments at 260°C, agas sample was collected at the end of the experiment
after the bomb was cooled to room temperature. The purpose of this analysis was to
ensure that there would not be a considerable amount of benzene in the gas phase. The
gas sample was analyzed using the Ge. The amount of benzene in the gas phase was
found negligible, i.e. less than 0.03 mmol C6H6/L.
Eight experiments were done at 200°C and four experiments at 210°C. The results
were very scattered (Figures 4.10 and 4.11). The only reason that can explain this is that
32

this may be near the border temperature at which the activation energy may be high and a
small increase in the temperature may ignite the reaction .
0.9
0.8
0.7
=~ 0.6
u~ ... 0.5 0
~ U 0.4
0.3
0.2
0.1
0
0
•
10 20
•
• 30
Time (min)
40
+T=2200C .T=2400C • T=260°C
50 60
Figure 4.8: Degradation of Benzene at Different Temperatures, Poz= 1.38 MPa, pH= 6.
5
4.5
•• 4
3.5
~ 3 ;;;, 0
E3 !. 2.5
ô= 2
1.5
0.5
• o+-----~----~----~·~----~----~----~·~----~----~------. o 20 40 60 80 100 120 140 160 180
Time (min)
Figure 4.9: Repeatability of Data from Two Experiments at 240°C, Poz= 1.38 MPa, pH= 6.
33

~._-
0.9 " • t • 0.8 )1( )1(
)1( 0.7
= 0.6
Û • ... 0.5 Q
= ~ U 0.4
+ 0.3
0.2
• 0.1
~ X • " 0
0 50 100 150 200 250 300
Time (min)
Figure 4.10: Degradation ofBenzene at 200°C, P02= 1.38 MPa, pH= 6 .
- • • 0.9
0.8
0.7
~ 0.6
... 0.5 Q
= ~ 0.4
• 0.3
0.2 • 0.1 X
0 ,
0 20 40 60 80 100 120
Time (min)
Figure 4.11: Degradation of Benzene at 210°C, P02= 1.38 MPa, pH= 6.
34

The results that were obtained during the preliminary experiments led us to decide to
work with the high temperatures range (from 220-260°C), at which more samples were
collected at each run. In those experiments, the oxygen pressure was kept constant at 1.38
MPa at given temperature. The initial pH of the solution was 6. Figure 4.12 shows the
degradation of benzene at 220°C, 230°C, 240°C, 250°C and 260°C, respectively. As
expected the degradation of benzene became faster with the increasing temperature. The
reaction consisted of three steps; induction, fast reaction, and the termination. This is a
typical pattern of the reactions governed by the free radical mechanism (See Chapter 2).
During the induction time there was an accumulation of the hydroxyl radicals and as soon
as there was a sufficient amount of hydroxyl radicals, the reaction proceeded quickly
until most of the reactant was oxidized [69]. Then the rate of reaction decreased until the
oxidation was complete. As the temperature increased the induction time decreased until
it almost disappeared at 250°C.
" & +T=260°C 0.9
-T=250oC Â
X .T=240°C 0.8
• XT=230oC Â ÂT=220°C
0.7
-= 0.6
'" • u '0 0.5
= U ...... U 0.4
0.3
0.2 • X Â
• • 0.1 • X Â • III
0
0 10 20 30 40 50 60 70
Time (min)
Figure 4.12: Degradation of Benzene at Different Temperatures, P02= 1.38 MPa, pH=6.
35

4.4.2 Effect of Oxygen Pressure on Benzene Degradation at pH 6
The effect of pressure was studied at 260°C and the samples were collected
periodically during the experiment and at the end of the experiment. Figure 4.13 shows
the degradation of C6H6 at two different pressures. It was found that 99% degradation
was achieved in just 15 minutes when the pressure was 5.52 MPa while only 86% was
reached when the pressure was 1.38 MPa. However, the difference became negligible
after 3 hours. The main reason is that at the higher oxygen pressure the solubility of the
oxygen in the liquid phase increases.
0.9 +P=5.52 MPa .P=1.38 MPa
0.8
,/-. 0.7
50.6
... 0.5 Q 0
~ U 0.4
0.3
0.2
0.1 • • • -' 0 • ..... ...... ---0 20 40 60 80 100 120 140 160 180 200
Time (min)
Figure 4.13: Degradation of Benzene at Different Oxygen Pressure, T= 260°C, pH=6.
Furthermore, the effect of the oxygen pressure on the benzene degradation was
studied at 260°C and pH 6, at which more samples were collected. Figure 4.14 shows that
36

at 1.03 MPa the degradation ofbenzene was slow, and that in the first 2.5 minutes higher
degradation was achieved with 2.07 MPa than 1.38 MPa. However, this effect diminished
as the time proceeded. AIso, comparable results were obtained for both 1.38 MPa and
1.72 MPa. This is attributed to the amount of dissolved oxygen in the liquid phase. More
clearly, since at the beginning of the experiment more benzene was present in the
solution, more oxygen was needed. However, after the oxidation proceeded less oxygen
was needed, which made the results comparable at the later stages. A detailed discussion
about the effect OfP02 on the dissolved oxygen is discussed in Section 4.4.6 .
0.9
0.8
0.7
:If 0.6 'Q
U • .... 0.5 0
'" ~ U 0.4
0.3 X
0.2 • X • 0.1 X
0
0 10
• •
~ " 20 30 40
Time (min)
50
• P=1.03 MPa .P= 1.38 MPa ÂP= 1.72 MPa XP=2.07 MPa
• 60
Figure 4.14: Effect of Oxygen Pressure on the Benzene Degradation at 260°C, pH=6.
70
37
4.4.3 Effect of Temperature on the Benzene Degradation at pH 5
As explained in the previous section, the major effect of temperature is in the high
range; therefore experiments were done at pH 5 and two temperatures, 220°C and 240°C.
As expected, the degradation was faster at 240°C; however, a slightly higher conversion
was achieved after 15 minutes at the lower temperature (Figure 4.15). The main reason
for this may be that at the lower temperature more of the carboxylic acids produced
during the degradation of benzene stayed in the solution. This keeps the pH of the
solution low hence resulting in higher conversion of benzene.
0.9
0.8
0.7
~ 0.6
U ... 0.5 0
q U 0.4
0.3
• 0.2 • 0.1 • ,
0
0 5 10 15 20
Time (min)
+T=220°C
.T=240°C
25
, 30
Figure 4.15: Effeet of Temperature on the Benzene Degradation at pH 5, P02= 1.38 MPa.
38

4.4.4 Effect of the Oxygen Pressure on Benzene Degradation at pH 5
Three different oxygen pressures were chosen (1.38, 1.72 and 2.07 MPa) to study the
effect of oxygen pressure on the benzene degradation at 220°C and pH 5. Figure 4.16
shows the effect of oxygen pressure on the benzene degradation. It is apparent that the
higher the oxygen pressure the higher the benzene degradation, especially at the
beginning of the oxidation. This effect diminished as the oxidation proceeded. More
details about the effect OfP02 on the benzene de gradation will be shown in Section 4.4.6
0.9 +1.38 MPa
/ .1.72 MPa 0.8
"'2.07 MPa
0.7
== 0.6
'" U ... 0.5 0 = U
U 0.4
0.3
• 0.2 , 0.1
1 • • 0
0 10 15 20 25 30 35
Time (min)
Figure 4.16: Effect of Oxygen Pressure on the Benzene Degradation at pH 5.
39

4.4.5 Effect of Temperature on Benzene Degradation at pH 4
The effect of temperature on the benzene degradation has been studied at different
temperatures and pressures at pH 4. Figures 4.17, 4.18 and 4.19 show the effect of
temperature on the degradation ofbenzene at pH 4 and at oxygen pressures of 1.03, 1.38
1.72 MPa, respectively. It can be seen that at lowest pressure almost same results have
been obtained for the 240°C and 260°C, especiaUy in the first 5 minutes. In this period the
oxidation at those two temperatures was faster than that of 220°C. After 10 minutes of
oxidation, the degradation was better at 220°C than those at 240°C and 260°C. At 1.38
MPa, higher benzene degradation has been achieved at 260°C at the beginning of the
experiment. After 5 minutes of oxidation the results became comparable for aU three
temperatures and later, the higher benzene conversion has been achieved for the lowest
temperature. When the pressure was increased to 1.72 MPa the similar pattern was
observed. One possible reason for this is that at the beginning of the oxidation, the higher
temperature resulted in higher degradation, hence more acids were produced. This
lowered the pH of the reaction medium (Section 4.4.7). At higher temperatures (i.e.
260°C), these acids were oxidized faster (see Chapter 5), and because of that the pH of
the medium increased. However, at lower temperature, produced acids were more stable
which kept the pH lower than that achieved at higher temperature, thus resulting in higher
degradation.
40
~ i
f' 1
0.9
0.8
0.7
== 0.6 '" U ~ 0.5
Q
U ...... U 0.4
0.3
0.2
0.1
0
•
..
0
• .. • •
5 10
• • • 15 20
Time (min)
25
+T=220°C .T=240oC
.T=260oC
• • • 30 35
Figure 4.17: Effect of Temperature on the Benzene Degradation at 1.03 MPa, pH= 4.
0.9
0.8
0.7
== 0.6
r.J ~ 0.5
ç} U 0.4
0.3
0.2
0.1
•
• •
• 5 10
• • 15 20
Time (min)
25
+T=220oC
.T=240°C
.T=2600C
30 35
Figure 4.18: Effect of Temperature on the Benzene Degradation at 1.38 MPa, pH= 4.
41

~~
1
0.9 +T=220oC
.T=240°C 0.8 ... T=260°C
• 0.7
r;l 0.6
'" U ~ O.S ~
~ U 0.4
 0.3 • 0.2 ...
• Â 0.1 Â , , Â • 0
0 S 10 IS 20 2S 30 3S
Time (min)
Figure 4.19: Effect of Temperature on the Benzene Degradation at 1.72 MPa, pH= 4.
4.4.6 Effect of the Oxygen Pressure on the Benzene Degradation at pH 4
The effect of oxygen partial pressure on the benzene degradation was further studied
at 220, 240 and 260°C, respectively and at pH 4. At 220°C the degradation was studied at
the range of 0.69 MPa to 1.72 MPa. Figure 4.20 demonstrates that the oxidation started
slowly within the first 2.5 minutes followed by a fast oxidation step, during which most
of the benzene was degraded. After that, the oxidation slowed down. It is apparent that
the degradation in the first 2.5 minutes, in which the oxidation process was slow, was
almost comparable for 0.69, 0.86 and 1.03 MPa, while it was slightly faster for both 1.38
and 1.72 MPa, respectively. This may be due to the accumulation of radicals at this low
temperature and low P02. After 5 minutes of oxidation, it was clear that the degradation
~. of benzene increased with the increase of the oxygen partial pressure. At higher
1
42

temperatures, the effect of the oxygen pressure on the benzene degradation was more
pronounced as it appears in Figures 4.21 and 4.22 at 240 and 260°C, respectively. While
only 40% degradation was achieved at 240°C after 2.5 minutes with 1.03MPa, 58% and
70% have been achieved at 1.38 and 1.72MPa, respectively. It is apparent that the oxygen
partial pressure has a significant effect on the benzene degradation. This is attributed to
the amount of the oxygen dissolved in the liquid phase. Table 4.1 shows the solubility of
oxygen (Caq) in the water at different temperatures. The detailed calculation can be
found in Appendix B.
Table 4.1: Solubility ofOxygen in Water at Different Temperatures.
Caq (mol/kg water)
P02(MPa) T=220°C T=240oC T=260°C
0.69 0.012
0.86 0.014
1.03 0.017 0.021 0.027
1.38 0.023 0.028 0.035
1.72 0.029 0.035 0.044
43

0.9
* 0.8 • • 0.7
== 0.6
'" U • 'E 0.5 0
~ U 0.4
• 0.3
0.2 • • 0.1
0
0 S
• •
• 1 • • 10 IS 20
Time (min)
2S
.0.69 MPa -0.86 MPa .1.03 MPa .1.38 MPa .1.72 Mpa
• ~ 30 35
Figure 4.20: Effect of Oxygen Pressure on the Benzene Degradation at 220°C, pH 4 .
0.9
0.8
0.7
== 0.6
'" U .... 0.5 c:> 0
~ U 0.4
0.3
0.2
0.1
0
• •
0
• • 5
• • • • • • 10 15 20
Time (min)
2S
• 1.03 MPa .1.38 MPa
.1.72 MPa
• • 30 35
Figure 4.21: Effect of Oxygen Pressure on the Benzene Degradation at 240°C, pH 4.
44
0.9
0.8
0.7
='" 0.6
'" U ... 0.5 Q Q
~ U 0.4 . ..
0.3 • • 0.2
• 0.1
0
0 5
.. .. • • • • 10 15 20
Time (min)
25
Â1.03 MPa
.1.38 MPa
.1.72 MPa
.. • • 30 35
Figure 4.22: Effect of Oxygen Pressure on the Benzene Degradation at 260°C, pH 4.
4.4.7 The pH Fluctuation during the Experiments
As was rnentioned before, during each experirnent the pH of the solution fluctuated.
At the beginning of the experirnent, as benzene started to oxidize organic acids were
produced and the pH of the solution decreased. As the experirnent proceeded rnost of the
produced organic acids oxidized, thus increasing the pH of the solution. As shown in
Figure 4.23, the pH decreased faster at 240 and 260 than 220°C. AIso, as will be seen in
chapter 5, at higher ternperatures lower arnounts of acids were produced and degraded
faster than at the lower ternperature. This is reflected on the pH value with its initial steep
decrease followed by the subsequent increase.
45
~-
1
4.4 -+-T=220°C ___ T=240°C
4.2 """*-T=260oC
1: 4
.~
-= ~ 3.8 .. -= .... .... Q = 3.6 CI.
3.4
3.2
3
0 5 10 15 20 25 30
Time (min)
Figure 4.23: Change ofpH with Time during Experiment, P02= 1.38 MPa, Initial Benzene Concentration = 5.63 mmol/L.
4.4.8 Effect of Acidification Methods on the Degradation of Benzene
Nitric acid was commonly used to lower the pH of the reaction medium. However,
sulfuric acid was also tried. From Figure 4.24, it is obvious that with the sulfuric acid also
a good degradation was achieved at 220°C and 1.38 MPa. The initial pH of this
experiment was 4. Furthermore, to determine whether the type of the additive has an
effect on the quality of the oxidation, two experiments have been repeated at the same pH
with two different additives, nitric and acetic acids. These experiments have been done at
240°C and oxygen pressure of 1.38 MPa. It can be seen from Figure 4.25 that the results
were comparable, which suggests that the oxidation is independent on the type of acid, as
long as the given pH is reached.
46
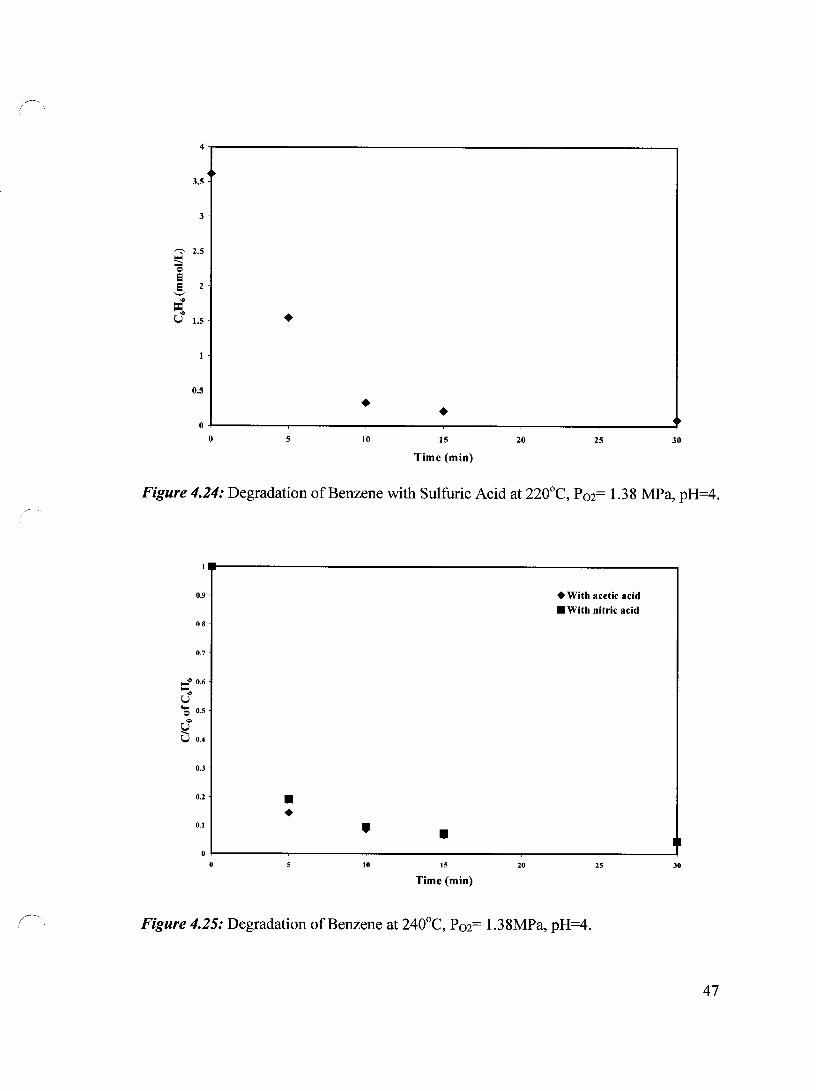
~ 1
4
3.5
3
~ 2.5
Q
e 5 2
== '" • U 1.5
0.5
• • 0 ~
0 5 10 15 20 25 30
Time (min)
Figure 4.24: Degradation of Benzene with Sulfuric Acid at 220°C, P02= 1.38 MPa, pH=4 .
0.9 • With aeetie acid • With nitrie acid
0.8
0.7
== 0.6
'" U .... 0.5 Q
C>
S:2 U 0.4
0.3
0.2 • • 0.1 • • •• 0
0 10 15 20 25 30
Time (min)
Figure 4.25: Degradation of Benzene at 240°C, P02= 1.38MPa, pH=4.
47
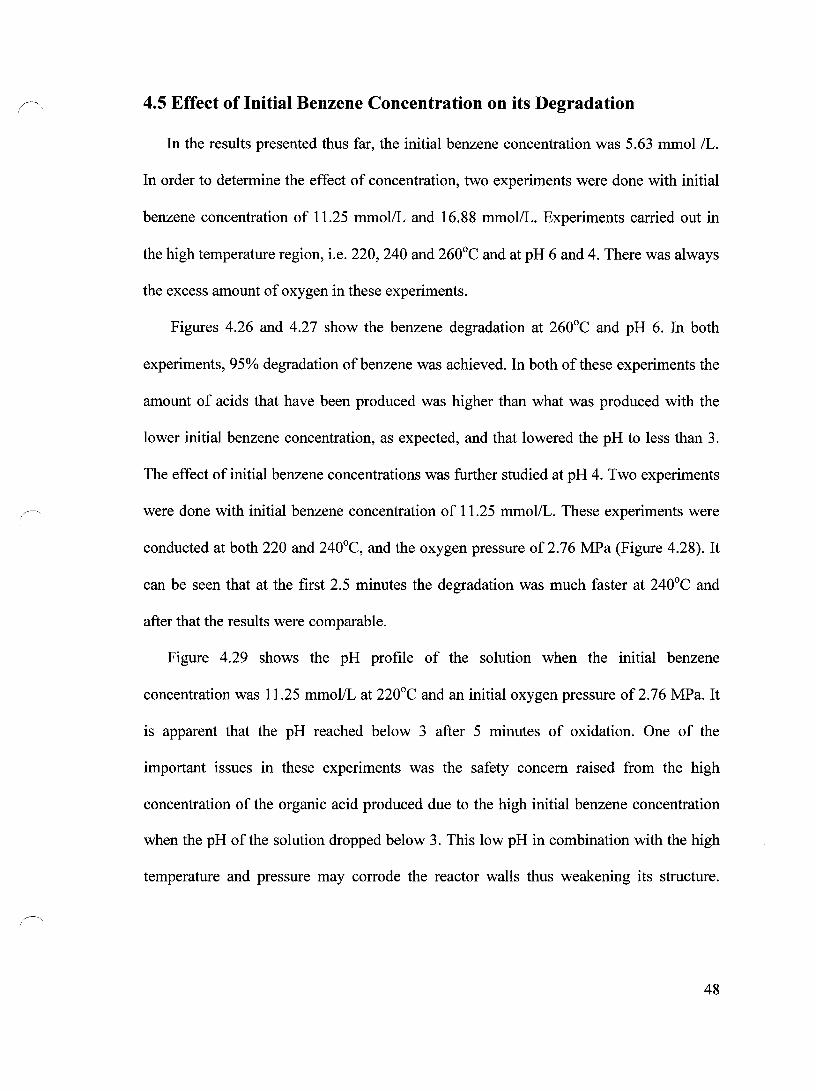
4.5 Effect of Initial Benzene Concentration on its Degradation
In the results presented thus far, the initial benzene concentration was 5.63 mmol IL.
In order to determine the effect of concentration, two experiments were done with initial
benzene concentration of 11.25 mmol/L and 16.88 mmol/L. Experiments carried out in
the high temperature region, i.e. 220, 240 and 260°C and at pH 6 and 4. There was always
the excess amount of oxygen in these experiments.
Figures 4.26 and 4.27 show the benzene degradation at 260°C and pH 6. In both
experiments, 95% degradation of benzene was achieved. In both of these experiments the
amount of acids that have been produced was higher than what was produced with the
lower initial benzene concentration, as expected, and that lowered the pH to less than 3.
The effect of initial benzene concentrations was further studied at pH 4. Two experiments
were done with initial benzene concentration of 11.25 mmol/L. These experiments were
conducted at both 220 and 240°C, and the oxygen pressure of 2.76 MPa (Figure 4.28). It
can be seen that at the first 2.5 minutes the degradation was much faster at 240°C and
after that the results were comparable.
Figure 4.29 shows the pH profile of the solution when the initial benzene
concentration was 11.25 mmol/L at 220°C and an initial oxygen pressure of2.76 MPa. It
is apparent that the pH reached below 3 after 5 minutes of oxidation. One of the
important issues in these experiments was the safety concern raised from the high
concentration of the organic acid produced due to the high initial benzene concentration
when the pH of the solution dropped below 3. This low pH in combination with the high
temperature and pressure may corrode the reactor walls thus weakening its structure.
48
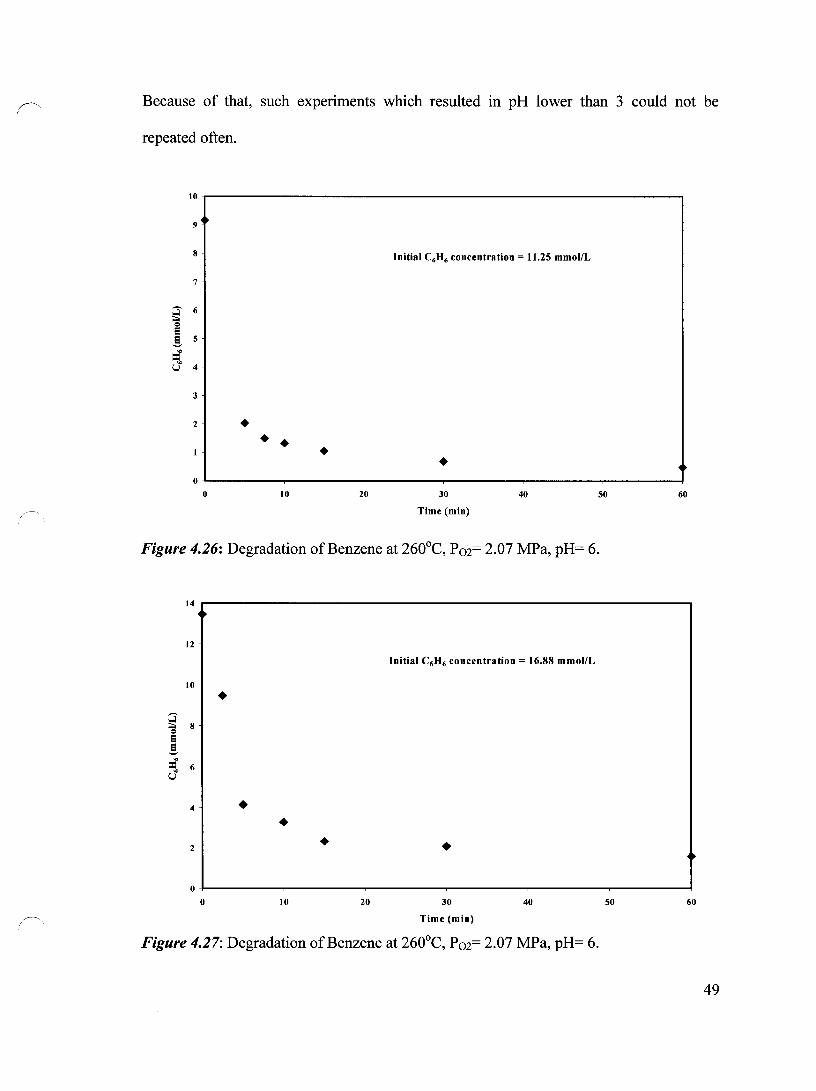
Because of that, such experiments which resulted in pH lower than 3 could not be
repeated often.
10,-----------------------------------------------------------,
9
8 Initial C6H6 concentration = 11.25 mmollL
7
~ 6 e e !. 5
~ 4
3
2 • • • • • o~--------~--------~--------~--------~--------~------~
o 10 20 30 40 50 60
Time (min)
Figure 4.26: Degradation ofBenzene at 260°C, P02= 2.07 MPa, pH= 6.
14
12
Initial C6H6 concentration = 16.88 mmollL
10
• ~ ;;;;, 8 e e !. =[ 6 U
4 • • 2 • • o~--------~--------~--------~--------_r--------~--------~
o 10 20 30
Time (min)
40
Figure 4.27: Degradation of Benzene at 260°C, P02= 2.07 MPa, pH= 6.
50 60
49

8
il +T=220°C
7 .T=240oC
6
• '-'5
~ = ë ë 4 '-'
'" =", U 3
2
• !la
0 • • • 0 5 10 15 20 25 30 35
Time (min)
Figure 4.28: Effect of Temperature on Benzene Degradation, P02= 2.76 MPa, pH=4. Initial Benzene Concentration of 11.25 mmol/L.
4.5 -r------------------------------,
c =
4.3
4.1
3.9
~ 3.7
o ri) ~ 3.5
oC -.... = = 3.3 CI.
3.1
2.9
2.7
2.5 +-------r----......,...----........... ------r----.....,....---~ o 5 10 15
Time (min)
20 25 30
Figure 4.29: Change ofpH with Time during Experiment, T= 220°C P02= 2.76 MPa. Initial Benzene Concentration = 11.25 mmol/L.
50
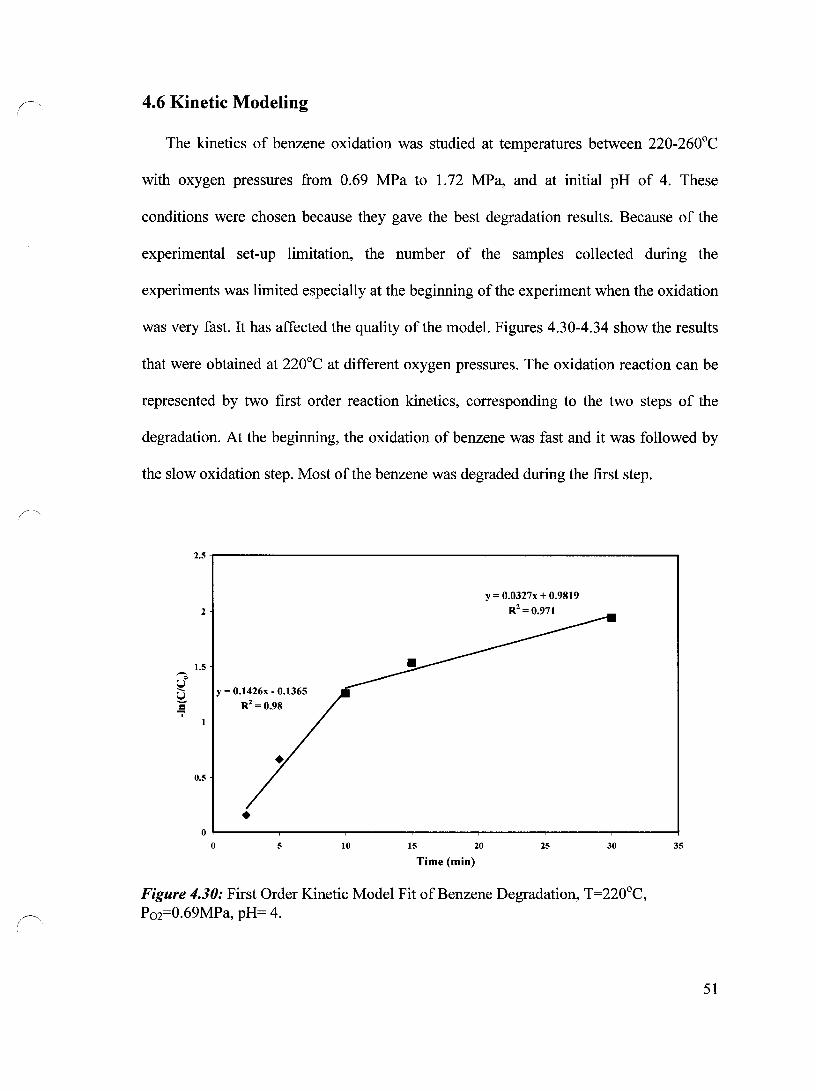
. 1".
4.6 Kinetic Modeling
The kinetics of benzene oxidation was studied at temperatures between 220-260°C
with oxygen pressures from 0.69 MPa to 1.72 MPa, and at initial pH of 4. These
conditions were chosen because they gave the best degradation results. Because of the
experimental set-up limitation, the number of the samples collected during the
experiments was limited especially at the beginning of the experiment when the oxidation
was very fast. It has affected the quality of the model. Figures 4.30-4.34 show the results
that were obtained at 220°C at different oxygen pressures. The oxidation reaction can be
represented by two first order reaction kinetics, corresponding to the two steps of the
degradation. At the beginning, the oxidation of benzene was fast and it was followed by
the slow oxidation step. Most of the benzene was degraded during the first step.
2.5,...-----------------------------,
2
1.5
E y = 0.1426x - 0.1365
..e R2 = 0.98
1
0.5
•
y = 0.0327x + 0.9819
R2 = 0.971
o+----~--~---~---~---~---~--~ o 5 10 15 20 25 30
Time (min)
Figure 4.30: First Order Kinetic Model Fit of Benzene Degradation, T=220°C, P02=0.69MPa, pH= 4 .
35
51

3~------------------------------------------------------~
2.5
2
'Ô' y = 0.1983x - 0.241 ~ R2 = 0.9512 U1.5 '-'
= ï
0.5
•
y = 0.0406x + 1.3435
R 2 = 0.9586
o~------~------~------~------~------~------~------~ o 5 10 IS 20 25 30
Time (min)
Figure 4.31: First Order Kinetic Mode! Fit of Benzene Degradation, T=220°C, P02=O.86 MPa, pH= 4.
3S
3.5~--------------------------------------------------------,
3
2.5
~ 2
~ =-ï 1.5
0.5
y = 0.2418x - 0.3165
R2 = 0.9677
•
y = 0.0469x + 1.6498
R2 = 0.9619
o~------~------~------~------~------~--------~----~ o S 10 IS 20 25 30
Time (min)
Figure 4.32: First Order Kinetic Mode! Fit of Benzene Degradation, T=220°C, P02=1.03 MPa, pH= 4.
35
52

4.5 -r------------------------------, 4
3.5
3
'J 2.5
8 oS 2
1
1.5
0.5
y = 0.3199x - 0.3405 R2
= 0.9497
• O+----~---_r---~---~----~----~---~
o 5 10 15 20 25 30
Time (min)
Figure 4.33: First Order Kinetic Model Fit of Benzene Degradation, T=220°C, P02=1.38 MPa, pH= 4.
35
6~-----------------------------~
5
4
2
y = 0.3889x - 0.3584
R2 = 0.9358
•
y = 0.0662x + 2.8809
R2= 0.9283
O+-----~---_r---~----~---~---~---~ o 5 10 15 20 25 30
Time (min)
Figure 4.34: First Order Kinetic Model Fit of Benzene Degradation, T=220°C, P02=1.72 MPa, pH= 4.
35
53
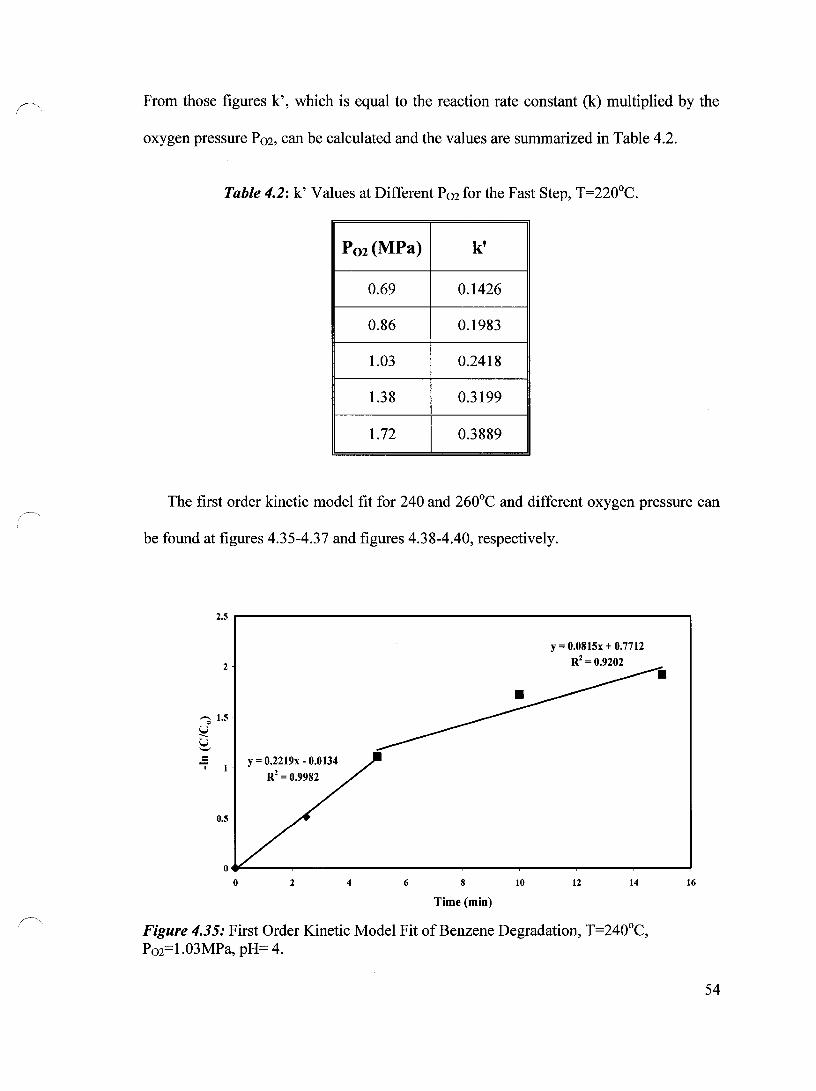
~. 1
From those figures k', which is equal to the reaction rate constant (k) multiplied by the
oxygen pressure P02, can be calculated and the values are summarized in Table 4.2.
Table 4.2: k' Values at Different P02 for the Fast Step, T=220°C.
P02(MPa) k'
0.69 0.1426
0.86 0.1983
1.03 0.2418
1.38 0.3199
1.72 0.3889
The first order kinetic model fit for 240 and 260°C and different oxygen pressure can
be found at figures 4.35-4.37 and figures 4.38-4.40, respectively.
2.5 r--------------------------,
2
= ï 1
0.5
y = 0.2219x - 0.0134 R2 =0.9982
y = 0.0815x + 0.7712 R2 =0.9202
O~--~--~--~--~--~--~--~--~ o 2 4 6 8
Time(min)
10 12 14
Figure 4.35: First Order Kinetic Model Fit of Benzene Degradation, T=240oC, P02=1.03MPa, pH= 4.
16
54
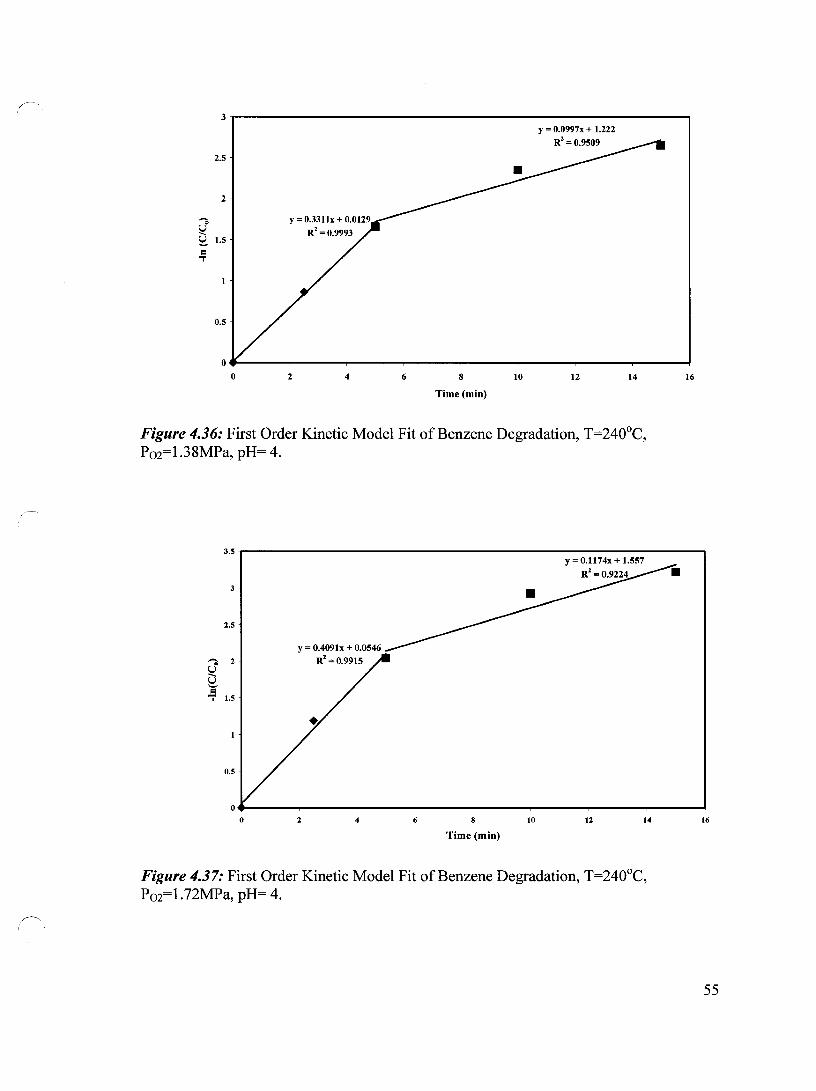
3r----------------------------------------------------------,
2.5
2
~ ~ 1.5
= ,.
0.5
y = 0.0997x + 1.222
R'=O.9S09
O.-------~----~------~------~----~------~------~----~ o 2 4 6 8
Time (min)
10 12 14
Figure 4.36: First Order Kinetic Model Fit of Benzene Degradation, T=240°C, P02=1.38MPa, pH= 4.
16
3.5 -.-----------------------------------------------------------.....
3
2.5
~ 2
= -:- 1.5
0.5
o.-------~----~------~------~------~----~------~------~ o 2 6 8
Time (min)
10 12 14
Figure 4.37: First Order Kinetic Model Fit of Benzene Degradation, T=240°C, P02=1.72MPa, pH= 4.
16
55
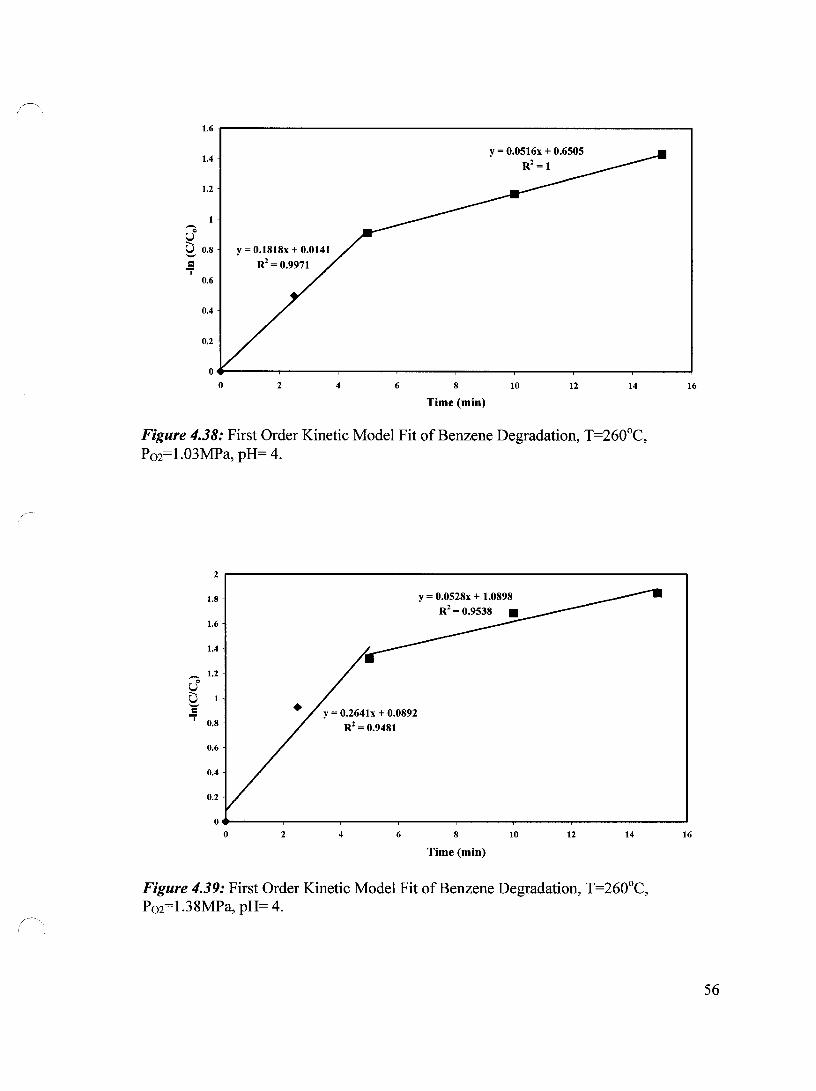
1.6r----------------------------------------------------------,
1.4
1.2
Q ~ 0.8 Y = 0.1818x + 0.0141
..5 R2 = 0.9971
1
0.6
0.4
0.2
y = 0.0516x + 0.6505
R2= 1
O.-----~~----~------~------~----~------~------r_----~ o 2 4 6 8
Time (min)
10 12 14
Figure 4.38: First Order Kinetic Model Fit of Benzene Degradation, T=260°C, P02=l.03MPa, pH= 4.
2
1.8
1.6
1.4
.-, 1.2 ., U Û '-'
Ji! 0.8
0.6
0.4
0.2
0
0 2
y = 0.264lx + 0.0892 R2 = 0.9481
4 6 8
Time (min)
10 12 14
Figure 4.39: First Order Kinetic Model Fit of Benzene Degradation, T=260°C, P02=1.38MPa, pH= 4.
16
16
56
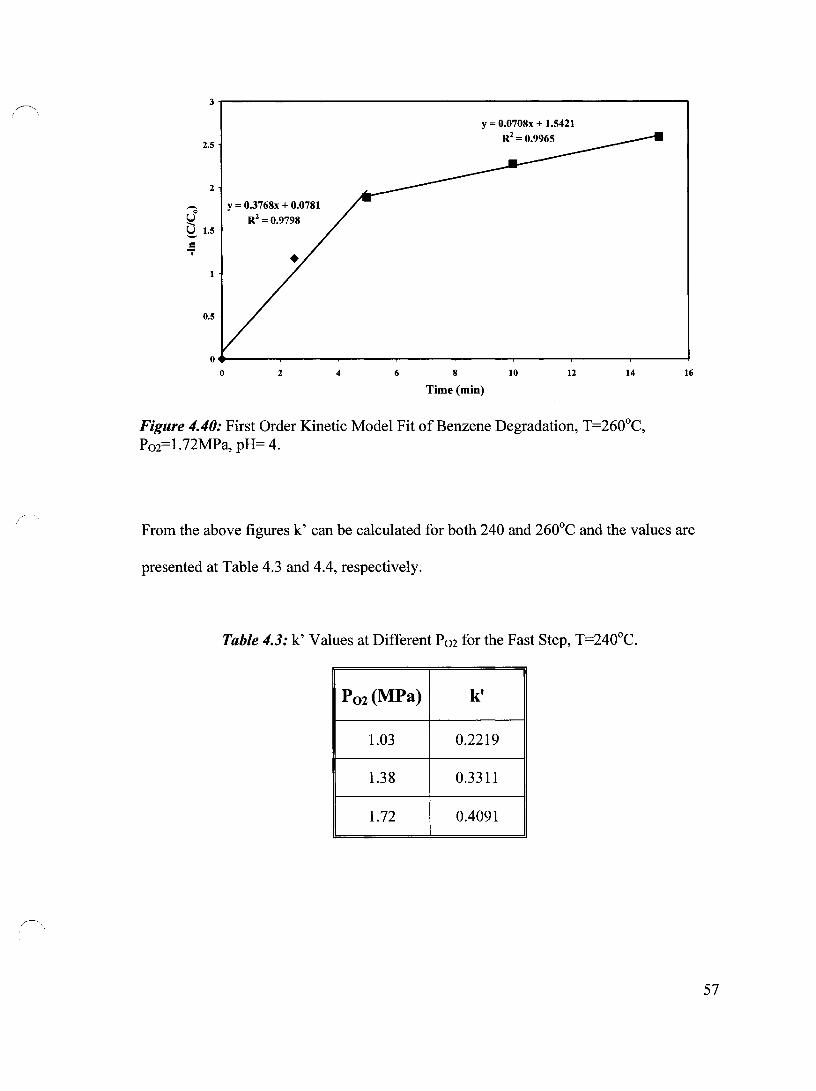
~ /
3~--------------------------------------------------,
2.5
2
q S 1.5
.5 1
0.5
y = 0.3768x + 0.0781 R2 =0.9798
y = 0.0708x + 1.5421
R2 =0.9965
o.-----~----~------~----~----~----~------~----~ o 2 4 6 8
Time(min)
10 12 14
Figure 4.40: First Order Kinetic Model Fit of Benzene Degradation, T=260°C, P02=1.72MPa, pH= 4.
16
From the above figures k' can be calculated for both 240 and 260°C and the values are
presented at Table 4.3 and 4.4, respectively.
Table 4.3: k' Values at Different P02 for the Fast Step, T=240°C.
P02(MPa) k'
1.03 0.2219
1.38 0.3311
1.72 0.4091
57
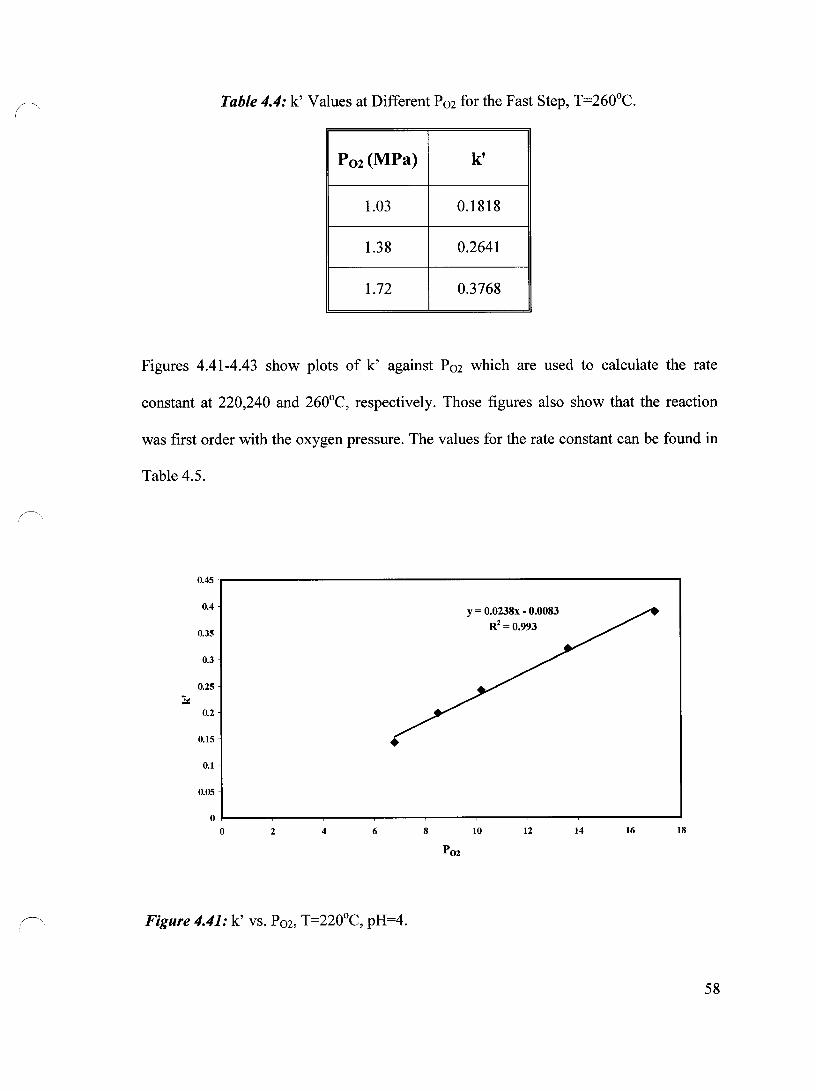
Table 4.4: k' Values at Different P02 for the Fast Step, T=260°C.
Po2 (MPa) k'
1.03 0.1818
1.38 0.2641
1.72 0.3768
Figures 4.41-4.43 show plots of k' against P02 which are used to calculate the rate
constant at 220,240 and 260°C, respectively. Those figures also show that the reaction
was first order with the oxygen pressure. The values for the rate constant can be found in
Table 4.5.
0.45
0.4
0.35
0.3
0.25
~ 0.2
0.15 • 0.1
0.05
0
0 2 4 6
Figure 4.41: k' vs. P02, T=220°C, pH=4.
8
y = 0.0238x - 0.0083
R2= 0.993
10 12 14 16 18
58

~, !
0.45
0.4
0.35
0.3
0.25
::.: 0.2
0.15
0.1
0.05
0
0 2 4 6
Figure 4.42: k' vs. P02, T=240oC, pH=4.
0.4
0.35
0.3
0.25
::.: 0.2
0.15
0.1
0.05
0
0 2 4 6
Figure 4.43: k' vs. P02, T=260°C, pH=4.
8
8
P02
y = 0.0275x - 0.0537
R2 = 0.9908
10 12 14
y = 0.0287x - 0.1158 R2 = 0.992
10 12 14
16 18
16 18
59
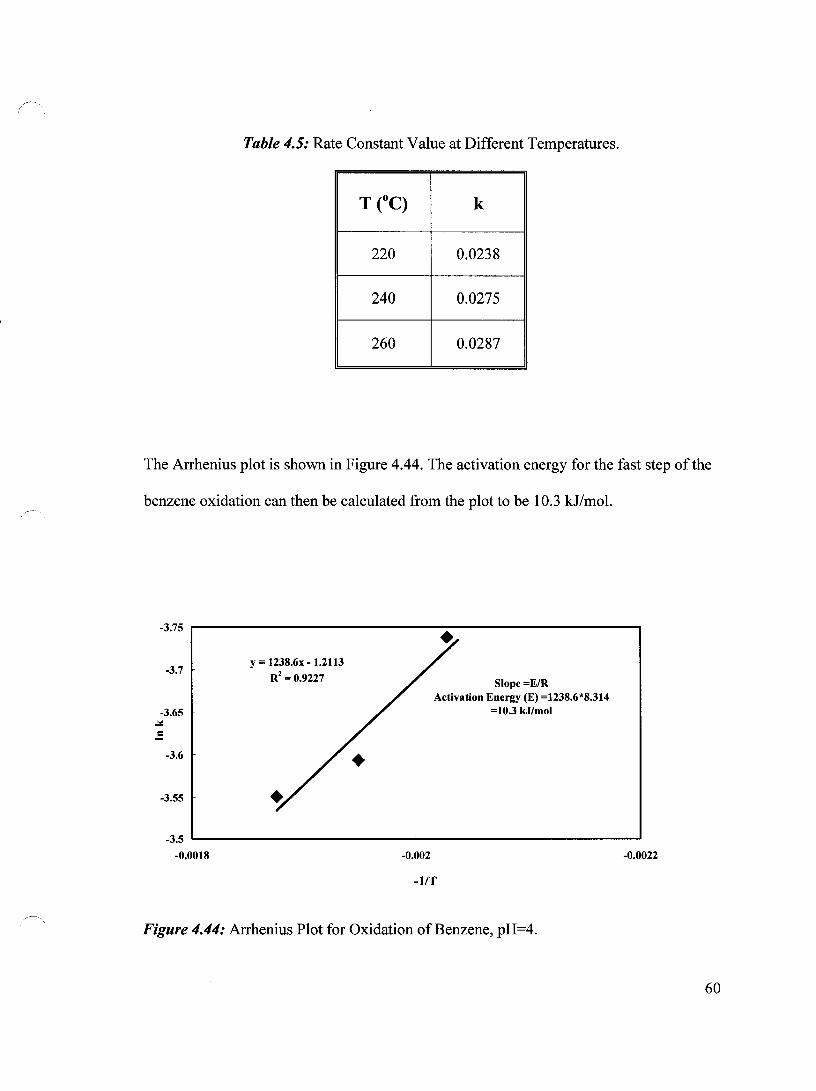
~ ..
Table 4.5: Rate Constant Value at Different Temperatures.
T (OC) k
220 0.0238
240 0.0275
260 0.0287
The Arrhenius plot is shown in Figure 4.44. The activation energy for the fast step ofthe
benzene oxidation can then be calculated from the plot to be 10.3 kJ/mol.
-3.75 ,....----------------------------.
-3.7
-3.65 ..:.= .s
-3.6
-3.55
y = 1238.6x - 1.2113
R2 = 0.9227 Slope=E/R Activation Energy (E) =1238.6*8.314
=10.3 kJ/mol
-3.5 '--------------"-----------------' -0.0018 -0.002 -0.0022
-lIT
Figure 4.44: Arrhenius Plot for Oxidation of Benzene, pH=4.
60

r' .. In summary, it is apparent from the results obtained in this chapter that the wet air
oxidation of benzene was affected by temperature, pressure and pH. AIso, it was shown
that the wet air oxidation of benzene exhibited a two-step reaction. The initial step was
fast followed by a slow rate of reaction. The oxidation rate was found to be first order
with oxygen. The order with respect to benzene was found to be one in both steps.
61

~ .. CHAPTER FIVE
RESULTS AND DISCUSSIONS
REACTION INTERMEDIATES
During the course of experiments, different reaction intermediates were produced.
Most of those intermediates were oxidized further to the final products. Sorne of them
were more stable during the oxidation under the experimental conditions and appeared as
final products (e.g. the acetic acid). From an environmental point of view, it is important
to know that the intermediates produced during waste treatment processes are not more
harmful than the original materials in the waste effluent.
5.1 Total Organic Carbon Measurements
The Total Organic Carbon (TOC) measurements were performed in order to close the
carbon balance, to demonstrate indirectly that the main reaction products were acetic acid
and formic acid and that almost total degradation of benzene to C02 and H20 was
achieved. The effect of temperature on the formation of the intermediates was studied by
measuring the TOC reduction during the experiment.
Figure 5.1 shows the TOC results obtained at oxygen pressure of 1.38 MPa, pH 6 and
temperatures of 220, 240 and 260°C. The results suggest that the higher the temperature,
the faster the TOC reduction, especially within the first 60 minutes, implying that at
higher temperature, the reaction proceeded fast to the final products.
62

1 .. 0.9 .. Â T=220°C
0.8 • .T=240°C
Q 0.7 +T=260°C
----U o 0.6 ~ 0.5 U 0.4 0 ~ 0.3
0.2 • • .. 0.1 • , t • 0
0 20 40 60 80 100 120 140 160 180
Time (min)
Figure 5.1: TOC Reduction with Time, P02=1.38 MPa, pH=6.
Figures 5.2, 5.3 and 5.4 show the results from the TOC measurements together with
the results that were calculated from the remaining benzene and the produced acids at
220, 240 and 260°C, respectively. The results show that the acetic acid was one of the
final products and could not be degraded within the range of temperatures studied. The
amount of TOC was compared to the total amount of carbon in the produced acetic acid,
formic acid and in the remaining unreacted benzene during the experiment in order to
verify the carbon balance. Figures 5.5,5.6 and 5.7 show that the results obtained from the
TOC measurement were comparable to the total amount of carbon that was calculated at
220,240 and 260°C, respectively, confirming the carbon balance. It should be mentioned
that ncgligiblc amounts of propanoic acid, glycolic acid and benzoquinone were detected
during the oxidation at aIl conditions.
63

r 25
,-..
~ Q 20 e e "-'
= .s 15 -= r.. -= ~
10 u
= 0 u
= 0 ~ 5 r.. = U
0
0 20 40
• 60 80 100
Time (min)
• Total C from benzene • Total C from acetic acid .. Total C from formic acid
---.-TOC
120 140 160
Figure 5.2: Detailed Change in Carbon Concentration with Time, T=220°C, pH=6, P02=1.38MPa.
180
30~------------------------------------------------,
~ 25 o e ê 20 = .s -e 15 -= ~ u = 8 10 = o
,.Q
; 5 u
• Total C from benzene
• Total C from acetic acid
-A-TOC
, O----~·Lr--~~----~----~----~--~~--~----~----~
o 20 40 60 80 100 120 140 160
Time (min)
Figure 5.3: Detailed Change in Carbon Concentration with Time, T=240oC, pH=6, P02=1.38MPa.
180
64
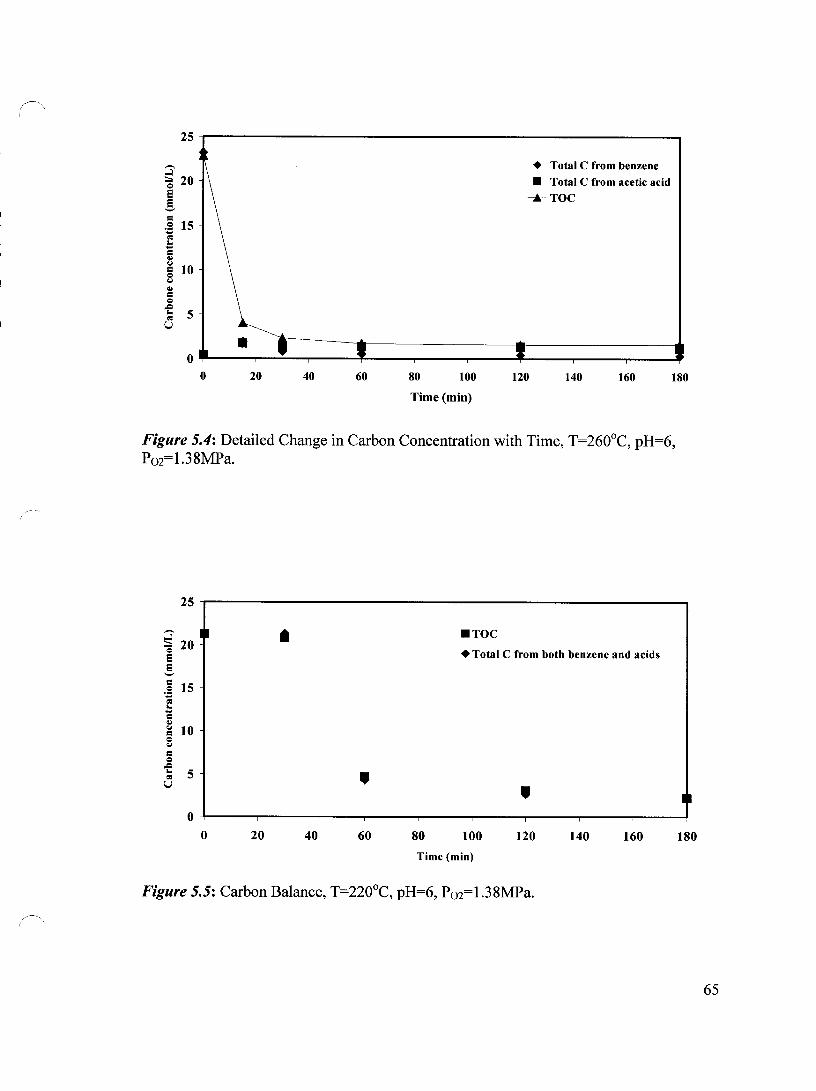
25
,-..
S 20 = e ! = .g 15 .... <= 10 .... = Q> ...
10 = = ... Q>
= = .c 10 5 <=
U
0
• Total C from benzene
• Total C from acetic acid
---.-TOC
0 20 40 60 80 100 120 140 160 180
Time(min)
Figure 5.4: Detailed Change in Carbon Concentration with Time, T=260oC, pH=6, P02=1.38MPa.
25
~ 20 Il 0 e
.TOC
• Total C from both benzene and acids e '-'
= 15 .g -; 10 .... = Q> ... 10 = = ... = = .c 10 5 <= u
, , 0
0 20 40 60 80 100 120 140 160
Time (min)
Figure 5.5: Carbon Balance, T=220°C, pH=6, P02=1.38MPa.
Il
180
65
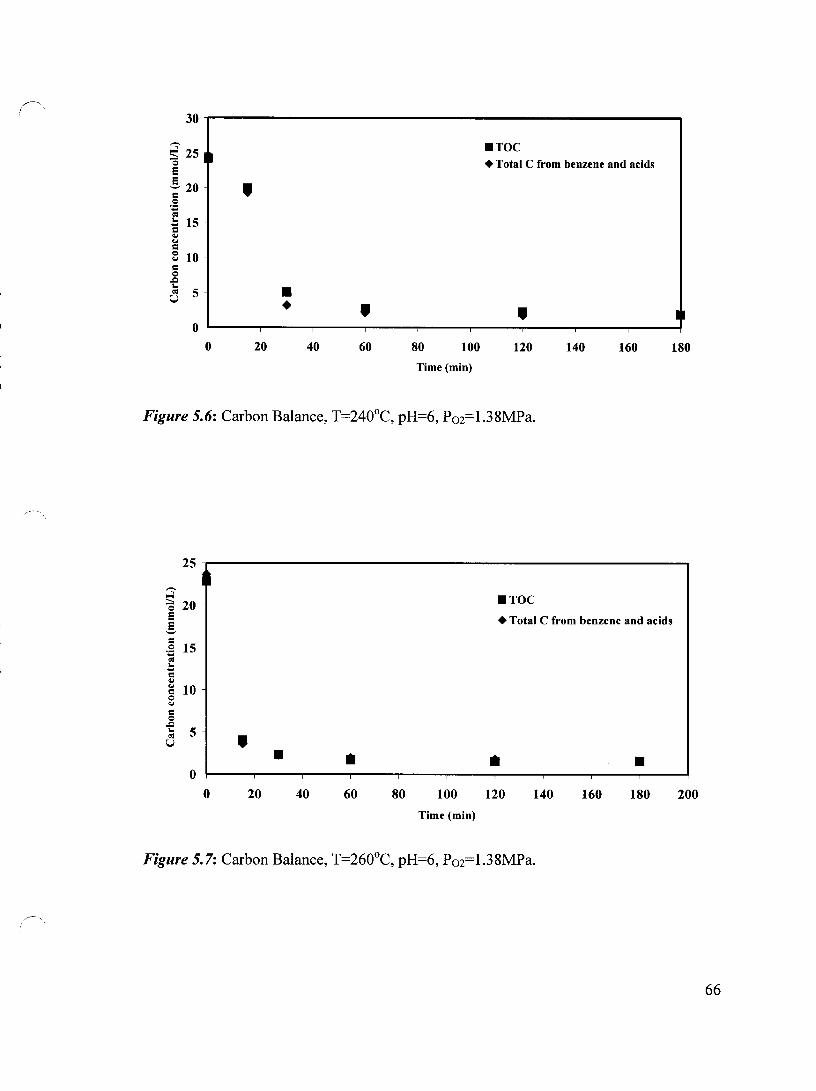
30~-------------------------------------------------,
~ 25 • ë S 20 c Q :c ~ 15 c .. ... c 8 10 c Q
,.Q ... -:l 5
,
• • ,
• TOC • Total C from benzene and acids
, Il O+-----~----~------r_----~----~------~----~----_r----~
o 20 40 60 80 100 120 140 160 180
Time (min)
Figure 5.6: Carbon Balance, T=240oC, pH=6, P02=1.38MPa.
25
,-.,
~ 20 .TOC
E! E! • Total C from benzene and acids '-' C Q 15 . .;: 0:1 ... .... c .. ... 10 c Q ... C Q
,.Q ... 5 0:1 , U • • • 0
0 20 40 60 80 100 120 140 160 180 200
Time (min)
Figure 5.7: Carbon Balance, T=260°C, pH=6, P02=1.38MPa.
66
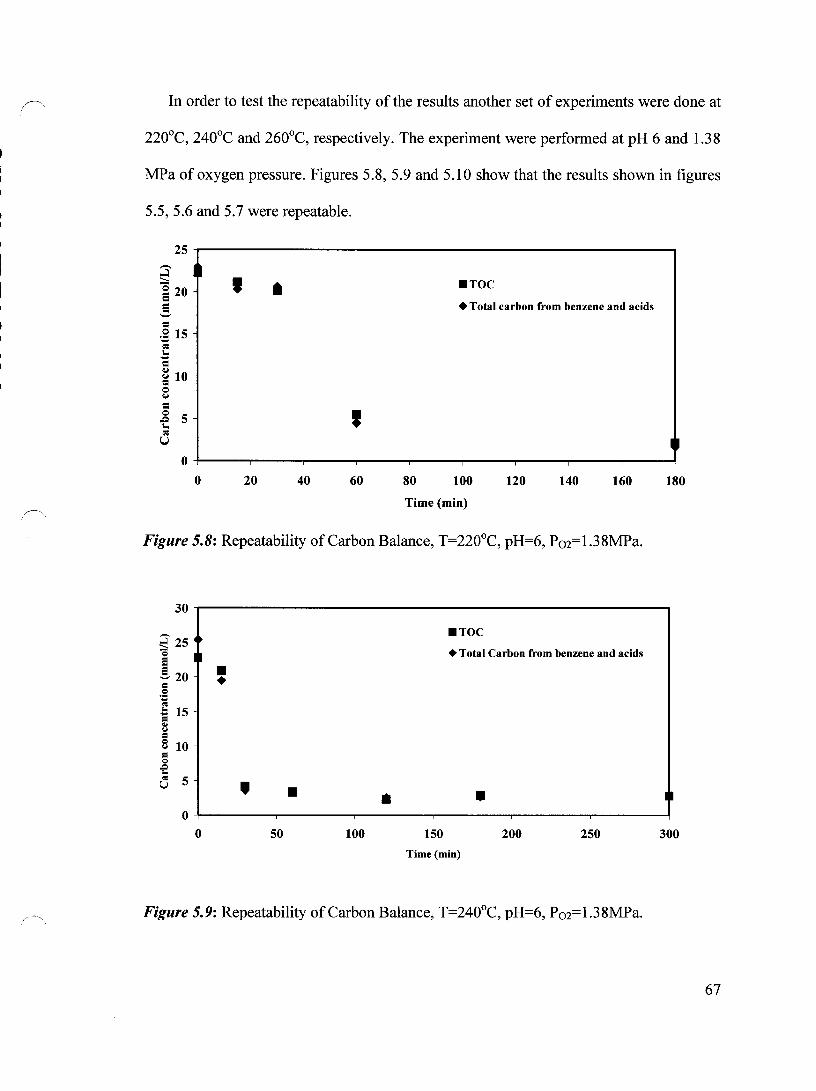
In order to test the repeatability of the results another set of experiments were do ne at
220°C, 240°C and 260°C, respectively. The experiment were performed at pH 6 and 1.38
MPa of oxygen pressure. Figures 5.8, 5.9 and 5.10 show that the results shown in figures
5.5,5.6 and 5.7 were repeatable.
25 ,-.
l~ ~ , 020 e e • Total carbon from benzene and acids
.TOC
'-'
= ~ 15 \II
"" -= ~ 10 = 0 Col
= 0 5 ..c "" • \II U
0 0 20 40 60 80 100 120 140 160 180
Time (min)
Figure 5.8: Repeatability of Carbon Balance, T=220°C, pH=6, P02=1.38MPa.
30~--------------------------------------------------~
~ 25 ~
e -! 20 = = ~ .... 15 = .. ... = 8 10 = Cl
of ç:J 5
• •
• TOC
• Total Carbon from benzene and acids
, • • • O+-------~--------~--------~--------~------~--------~
o 50 100 150 200 250 300 Time(min)
Figure 5.9: Repeatability of Carbon Balance, T=240°C, pH=6, P02=1.38MPa.
67
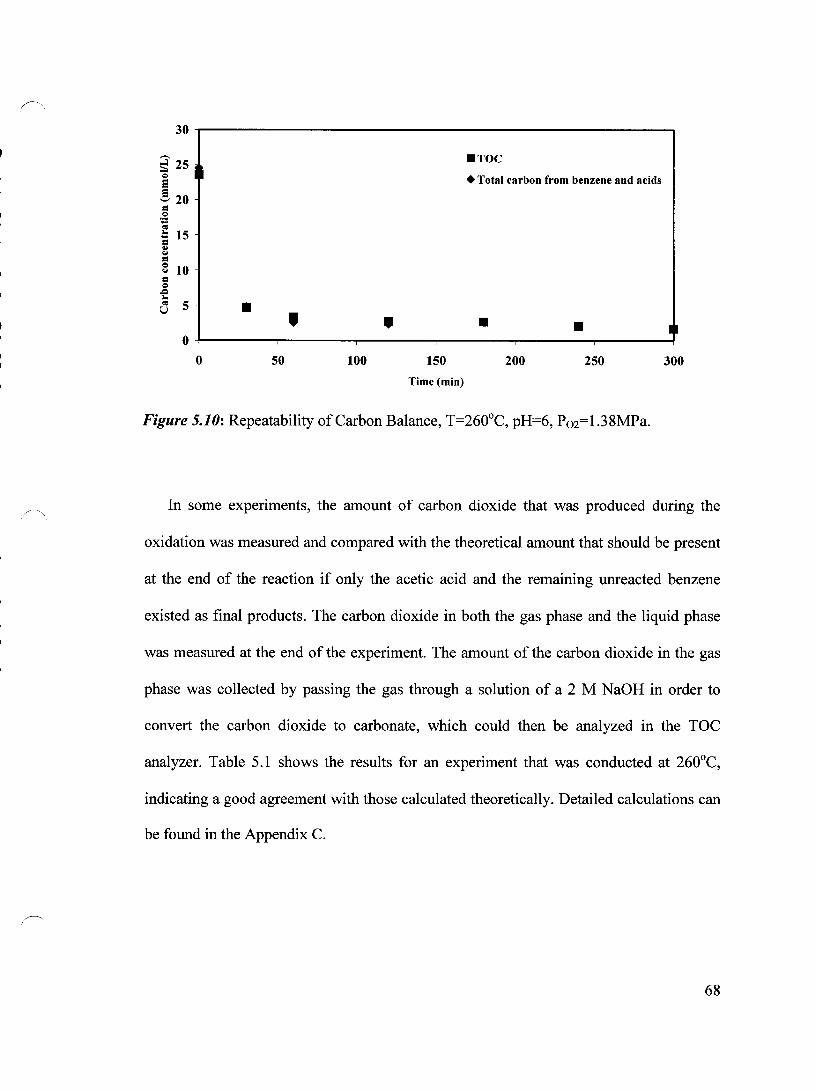
30~----------------------------------------------------~
~ 251~ 5 !, 20 = co
',c
t 15 = .. ... = 8 10 = co
.CI .. Ü 5
.TOC
• Total carbon from benzene and acids
• , . . . . O+-----~------~------~------~----~------~
o 50 100 150 200 250 300 Time(min)
Figure 5.10: Repeatability of Carbon Balance, T=260°C, pH=6, P02=1.38MPa.
ln sorne experiments, the amount of carbon dioxide that was produced during the
oxidation was measured and compared with the theoretical amount that should be present
at the end of the reaction if only the acetic acid and the remaining unreacted benzene
existed as final products. The carbon dioxide in both the gas phase and the liquid phase
was measured at the end of the experiment. The amount of the carbon dioxide in the gas
phase was collected by passing the gas through a solution of a 2 M NaOH in order to
convert the carbon dioxide to carbonate, which could then be analyzed in the TOC
analyzer. Table 5.1 shows the results for an experiment that was conducted at 260°C,
indicating a good agreement with those calculated theoretically. Detailed calculations can
be found in the Appendix C.
68
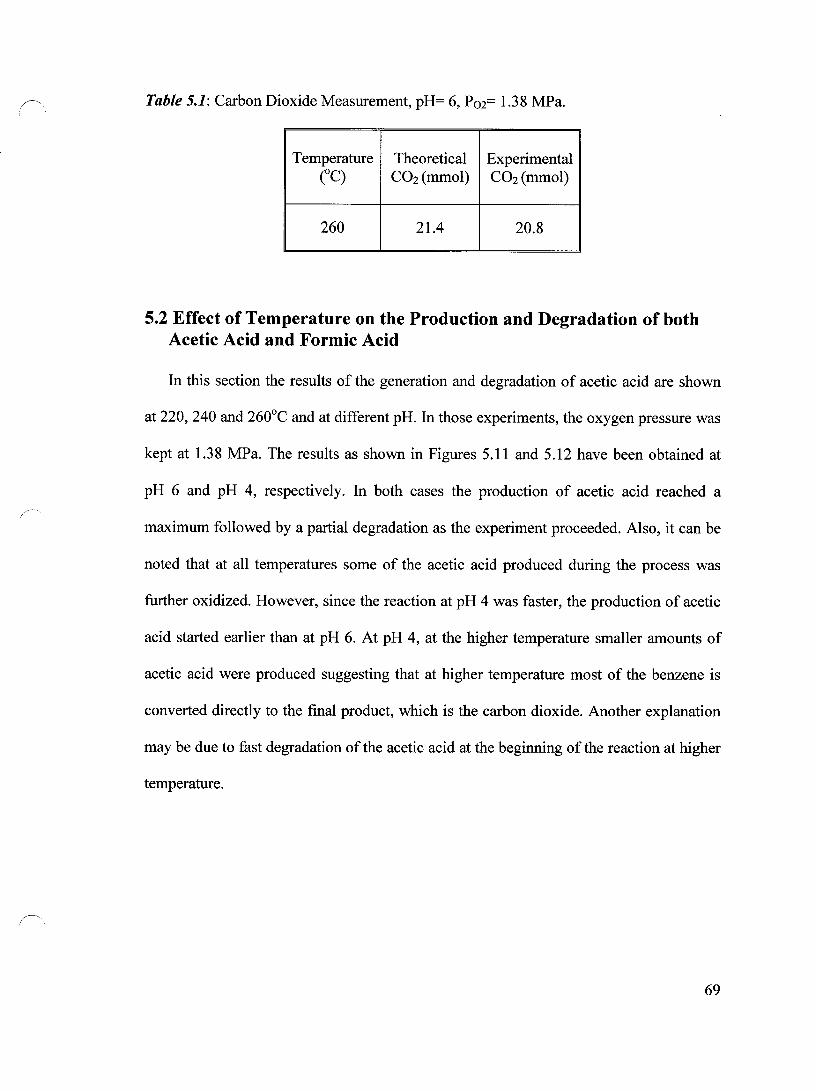
Table 5.1: Carbon Dioxide Measurement, pH= 6, P02= 1.38 MPa.
Temperature Theoretical Experimental (OC) CO2 (mmol) CO2 (mmol)
260 21.4 20.8
5.2 Effect of Temperature on the Production and Degradation of both Acetic Acid and Formic Acid
In this section the results of the generation and degradation of acetic acid are shown
at 220, 240 and 260°C and at different pH. In those experiments, the oxygen pressure was
kept at 1.38 MPa. The results as shown in Figures 5.11 and 5.12 have been obtained at
pH 6 and pH 4, respectively. In both cases the production of acetic acid reached a
maximum foHowed by a partial degradation as the experiment proceeded. Also, it can be
noted that at aH temperatures sorne of the acetic acid produced during the process was
further oxidized. However, since the reaction at pH 4 was faster, the production of acetic
acid started earlier than at pH 6. At pH 4, at the higher temperature smaller amounts of
acetic acid were produced suggesting that at higher temperature most of the benzene is
converted directly to the final product, which is the carbon dioxide. Another explanation
may be due to fast degradation of the acetic acid at the beginning of the reaction at higher
temperature.
69
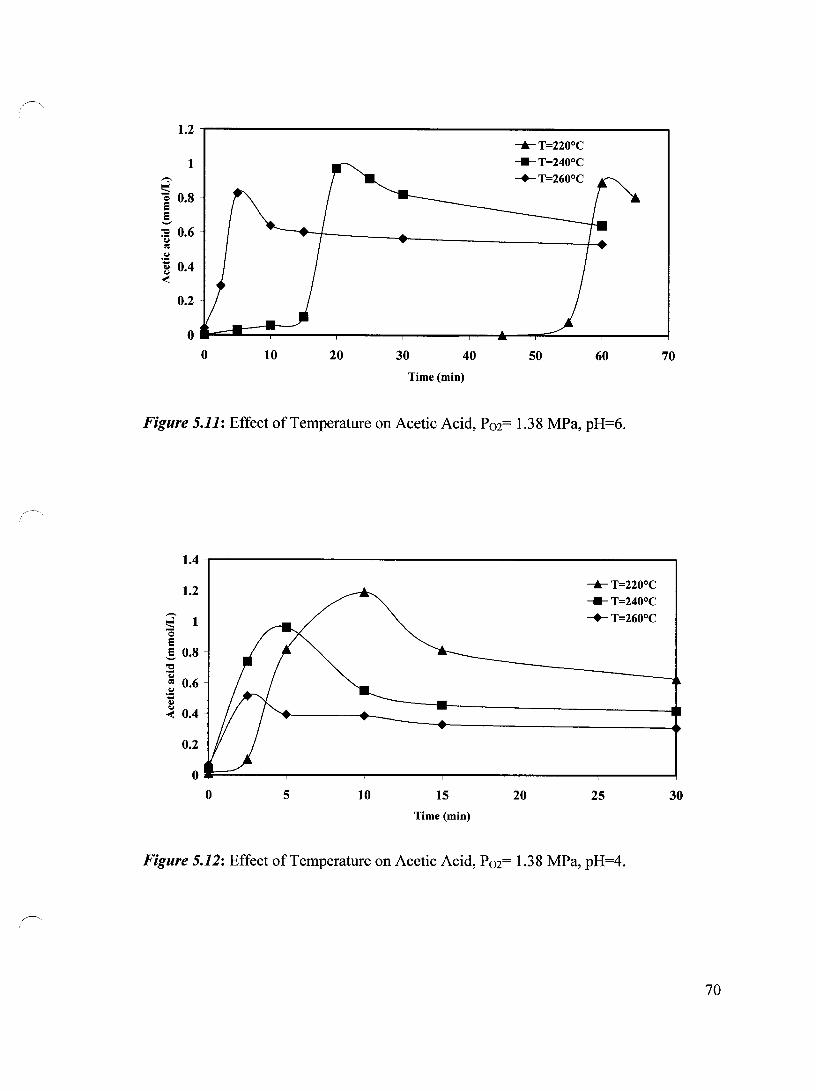
r-1.2
1
~ ~ 0.8 Si '-'
:s 0.6 '" <'OS
'" ~ 0.4 <
0.2
0
0 10 20 30 40
Time(min)
--.- T=220°C ___ T=240°C
-+-T=2600C
50 60
Figure 5.11: Effect of Temperature on Acetic Acid, P02= 1.38 MPa, pH=6.
70
1.4 ,..------------------------------,
1.2
~ 1 Q
Si ~ 0.8 ~ 'y ~ 0.6 t < 0.4
0.2
--.- T=2200C ___ T=2400C
-+-T=260oC
O~----~----~---~----~---~---~ o 5 10 15 20 25 30
Time (min)
Figure 5.12: Effect of Temperature on Acetic Acid, P02= 1.38 MPa, pH=4.
70
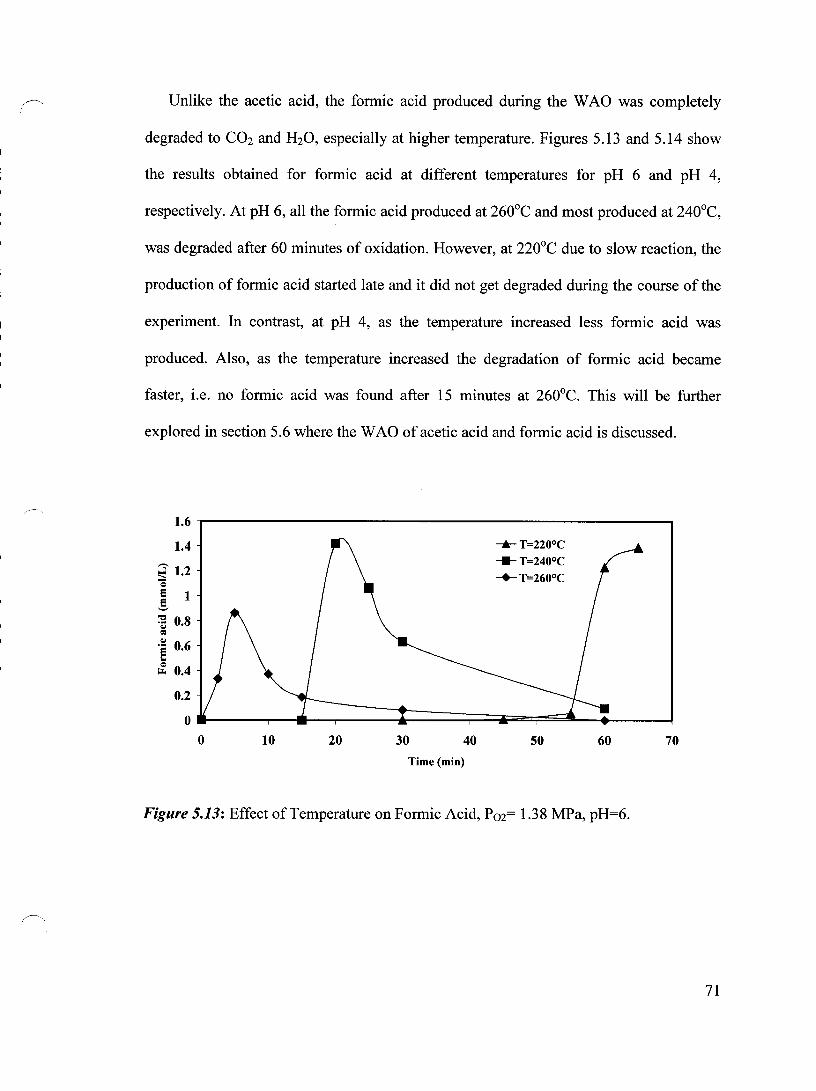
"~-
Unlike the acetic acid, the formic acid produced during the W AO was completely
degraded to COz and HzO, especially at higher temperature. Figures 5.13 and 5.14 show
the results obtained for formic acid at different temperatures for pH 6 and pH 4,
respectively. At pH 6, all the formic acid produced at 260°C and most produced at 240°C,
was degraded after 60 minutes of oxidation. However, at 220°C due to slow reaction, the
production of formic acid started late and it did not get degraded during the course of the
experiment. In contrast, at pH 4, as the temperature increased less formic acid was
produced. AIso, as the temperature increased the degradation of formic acid became
faster, i.e. no formic acid was found after 15 minutes at 260°C. This will be further
explored in section 5.6 where the WAO of acetic acid and formic acid is discussed.
1.6
1.4
~ 1.2 '0 e 1 !, ~ 0.8 = .~ 0.6 10
~ 0.4
0.2
0 0 10 20 30 40
Time (min)
--.- T=2200C ___ T=2400C
-+-T=2600C
50 60
Figure 5.13: Effect of Temperature on Formic Acid, P02= 1.38 MPa, pH=6.
70
71
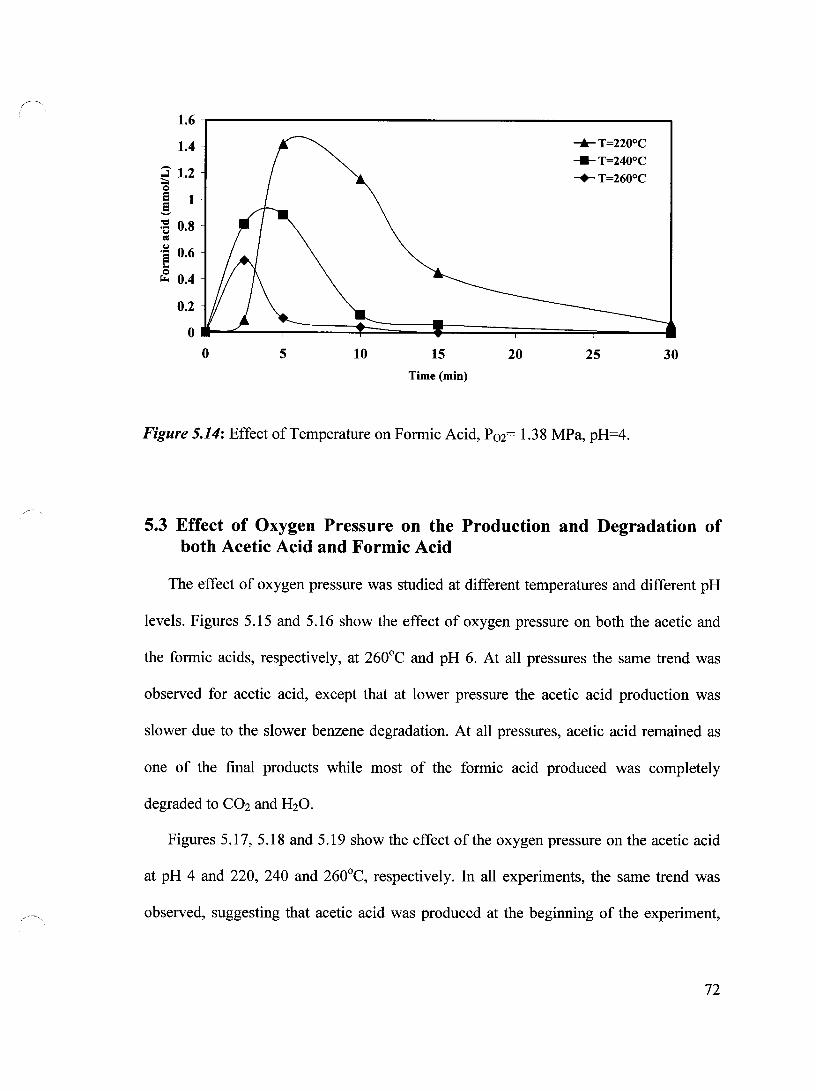
~
1.6
1.4 ....... T=2200C ___ T=2400C
~ 1.2 -+-T=2600C ;:;:. Q 5 1 5 '-'
:g 0.8 = 'i 0.6 '"' Q ~ 0.4
0.2
0 0 5 10 15 20 25 30
Time (min)
Figure 5.14: Effect of Temperature on Formic Acid, P02= 1.38 MPa, pH=4.
5.3 Effect of Oxygen Pressure on the Production and Degradation of both Acetic Acid and Formic Acid
The effect of oxygen pressure was studied at different temperatures and different pH
levels. Figures 5.15 and 5.16 show the effect of oxygen pressure on both the acetic and
the formic acids, respectively, at 260°C and pH 6. At aH pressures the same trend was
observed for acetic acid, except that at lower pressure the acetic acid production was
slower due to the slower benzene degradation. At aIl pressures, acetic acid remained as
one of the final products while most of the formic acid produced was completely
degraded to C02 and H20.
Figures 5.17, 5.18 and 5.19 show the effect of the oxygen pressure on the acetic acid
at pH 4 and 220, 240 and 260°C, respectively. In aH experiments, the same trend was
observed, suggesting that acetic acid was produced at the beginning of the experiment,
72
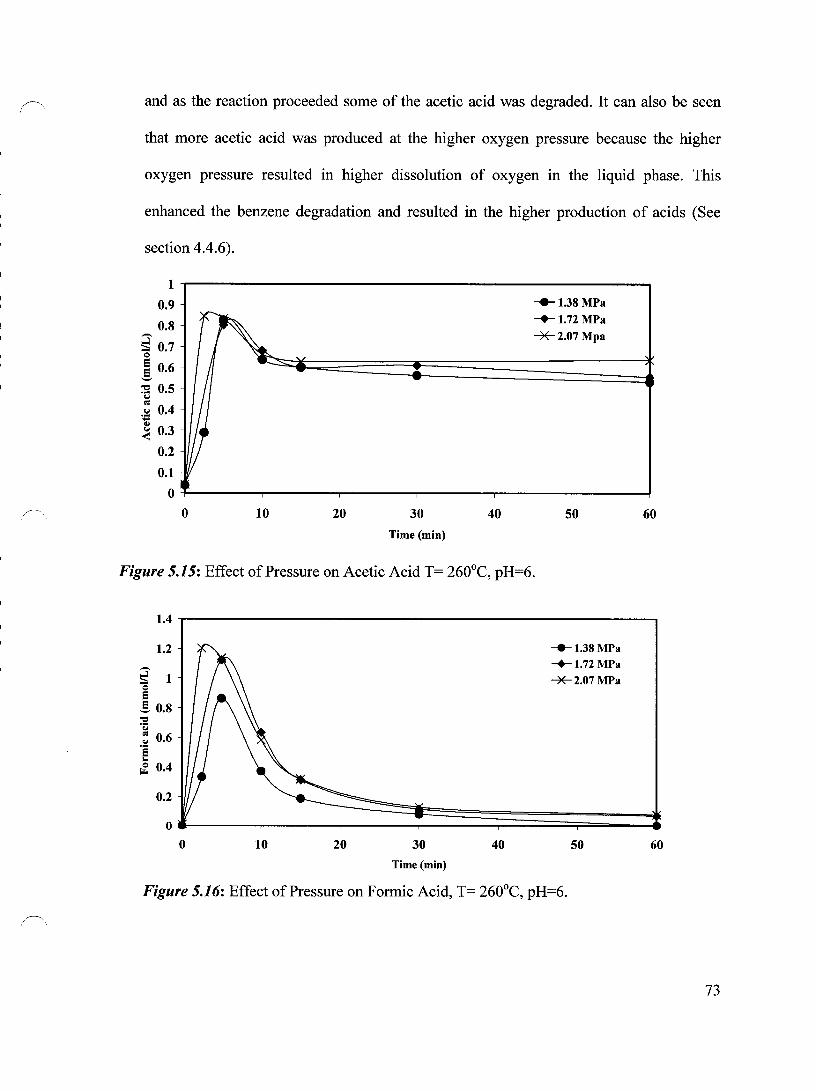
and as the reaetion proeeeded sorne of the aeetic aeid was degraded. It ean also be se en
that more aeetie aeid was produced at the higher oxygen pressure beeause the higher
oxygen pressure resulted in higher dissolution of oxygen in the liquid phase. This
enhaneed the benzene degradation and resulted in the higher production of aeids (See
section 4.4.6).
1
0.9 -e-1.38 MPa
0.8 ---:s 0.7
--+-- 1.72 MPa -*2.07Mpa
~
10.6
:g 0.5 CJ C':I
.S:! 0.4 II < 0.3
0.2
0.1
0
0 10 20 30 40 50 60
Time (min)
Figure 5.15: Effeet of Pressure on Acetie Aeid T= 260°C, pH=6.
1.4 -.------------------------------,
1.2
~ 1 ~
E !, 0.8 :5! ... ~ 0.6 .! ~ 0.4
10 20
-*-1.38 MPa
--+-- 1.72 MPa
-*2.07 MPa
30 40 50
Time(min)
Figure 5.16: Effeet of Pressure on Formie Aeid, T= 260°C, pH=6.
60
73
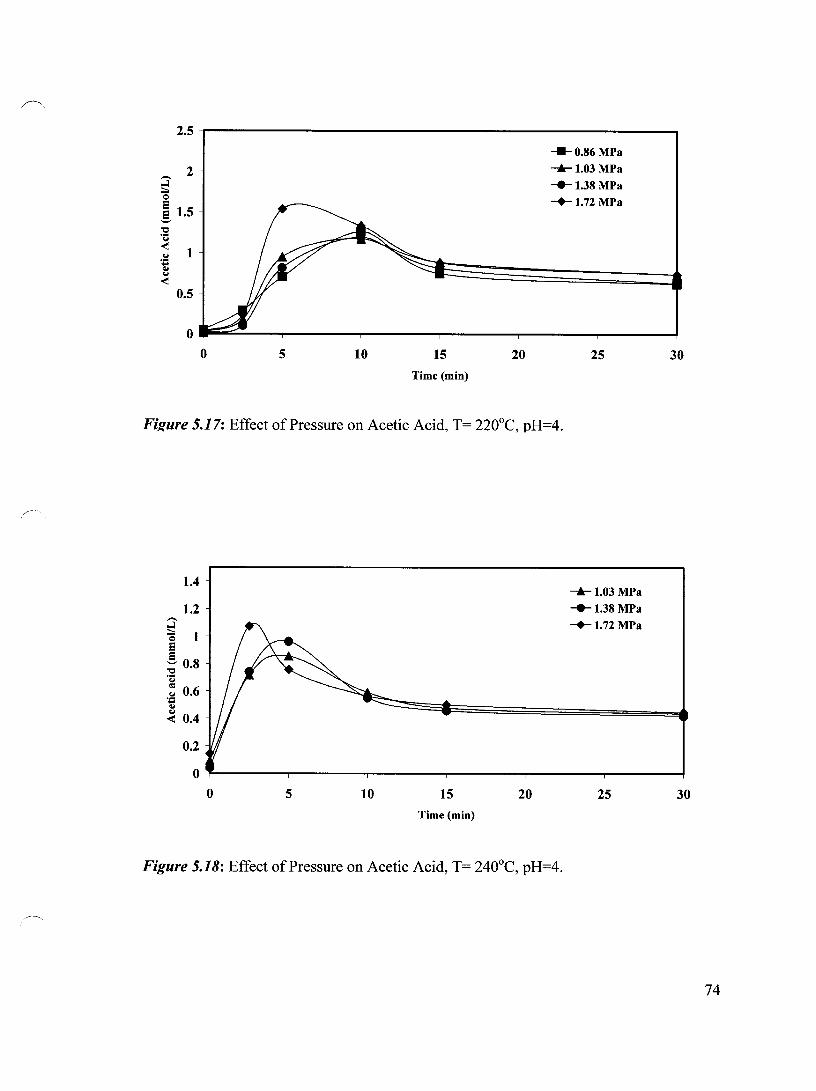
r-'.
2.5
2 ,-,
~ Q
e e 1.5 '-' "0 .;:; ~ 1 .:! ... ~
'" ~ 0.5
0
0 5 10 15
Time (min)
20
___ 0.86 MPa
-'-1.03 MPa ___ 1.38 MPa
-+-1.72 MPa
25
Fil!ure 5.17: Effect of Pressure on Acetic Acid, T= 220°C, pH=4.
1.4
1.2
~ Q 1 e e :; 0.8 .;:; ~ 0.6 .~
< 0.4
0.2
-'-1.03 MPa ___ 1.38MPa
-+-1.72 MPa
30
OT--------r--------r--------r-------,--------~------~
o 5 10 15 20 25 30
Time (min)
Figure 5.18: Effect of Pressure on Acetic Acid, T= 240°C, pH=4.
74
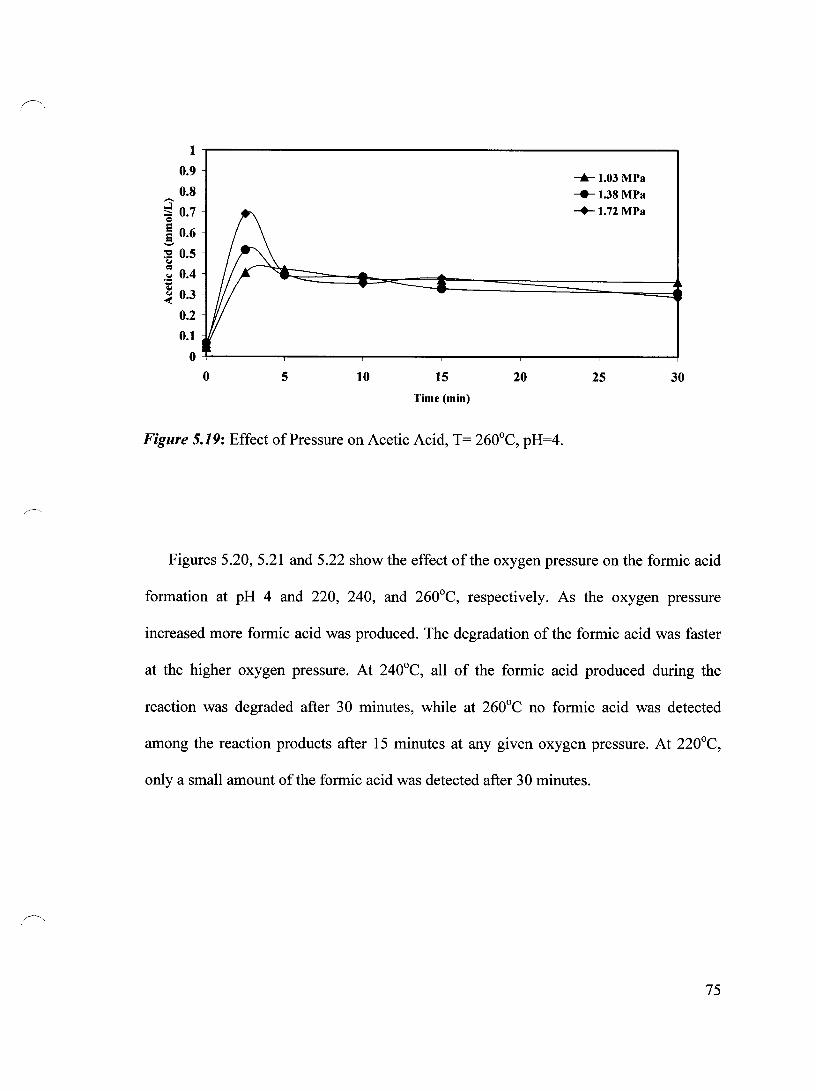
1
0.9
0.8 --~ 0.7 0 E E 0.6 '-'
:5! 0.5 <,j o:s ~ 0.4
< 0.3
0.2
0.1
0
0 5 10 15 20
Time (min)
Figure 5.19: Effect of Pressure on Acetic Acid, T= 260°C, pH=4.
--..- 1.03 MPa ____ 1.38 MPa
-'-1.72MPa
25 30
Figures 5.20, 5.21 and 5.22 show the effect of the oxygen pressure on the formic acid
formation at pH 4 and 220, 240, and 260°C, respective1y. As the oxygen pressure
increased more formic acid was produced. The degradation of the formic acid was faster
at the higher oxygen pressure. At 240°C, all of the formic acid produced during the
reaction was degraded after 30 minutes, while at 260°C no formic acid was detected
among the reaction products after 15 minutes at any given oxygen pressure. At 220°C,
only a small amount of the formic acid was detected after 30 minutes.
75
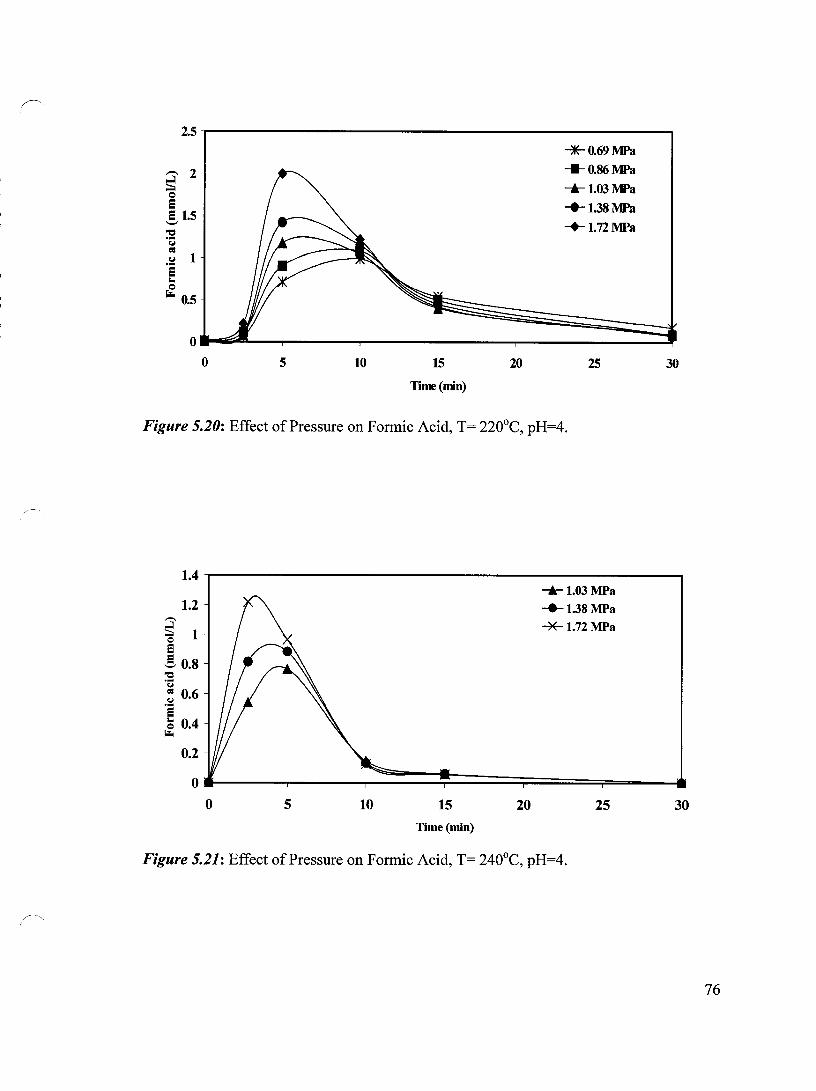
2.5,..-------------------------...,
~ 2 Q e e 1.5 '-' "0 .• c:; ~ c:; 1 ïii "'" Q
r. 0.5
-r0.69MPa ___ O.86MPa
+1.03MPa
+l.38MPa
-+-1.72MPa
O .. ~~-~---~---~----~---~---~ o 5 10 15
Time(min)
20
Figure 5.20: Effect of Pressure on Formic Acid, T= 220°C, pH=4.
25 30
1.4 -,----------------------------,
1.2
~ 1 Q
e !, 0.8 "0 'C ~ 0.6 .~ Q 0.4 r.
+ 1.03 MPa
-'-1.38MPa ~l.72MPa
0.2
ot---~----~~==~====r===~~--__ o 5 10 15 20 25 30
Time(min)
Figure 5.21: Effect of Pressure on Formic Acid, T= 240°C, pH=4.
76

r"
1
0.9 __ 0.8
~ CS 0.7 5 !, 0.6
~ 0.5 <= .~ 0.4 5 8 0.3 ~
0.2
0.1
0
0 2 4 6 8
Time (min)
10
......... 1.03 MPa ~1.38MPa
-+-1.72 MPa
12 14
Figure 5.22: Effect of Pressure on Formic Acid, T= 260°C, pH=4.
5.4 Effect of pH on Acetic and Formic Acids
As mentioned before, the initial pH of the reaction medium has a significant effect on
the benzene oxidation; it affects both the production as well as the degradation of both
the acetic and the formic acids, as is evident in Figures 5.23 and 5.24, respectively. The
experiments were done at 220°C and 1.38MPa. It should be mentioned that sorne ofthese
results were obtained and reported before (Figures 5.11-5.14). At pH 6, the production of
both acids started late because the oxidation of the benzene was slow. However, at lower
pH, the production of both acids started early. AIso, more acids were produced at pH 5
than that at pH 4. The main reason is that at the lower pH most of the benzene was
oxidized to the final products (Section 4.4). Unlike pH 6, faster degradation was achieved
at both pH 4 and pH 5. At 240°C, again higher concentrations of acids were produced at
the lower pH and both the production and the degradation rates of the acids were faster at
77
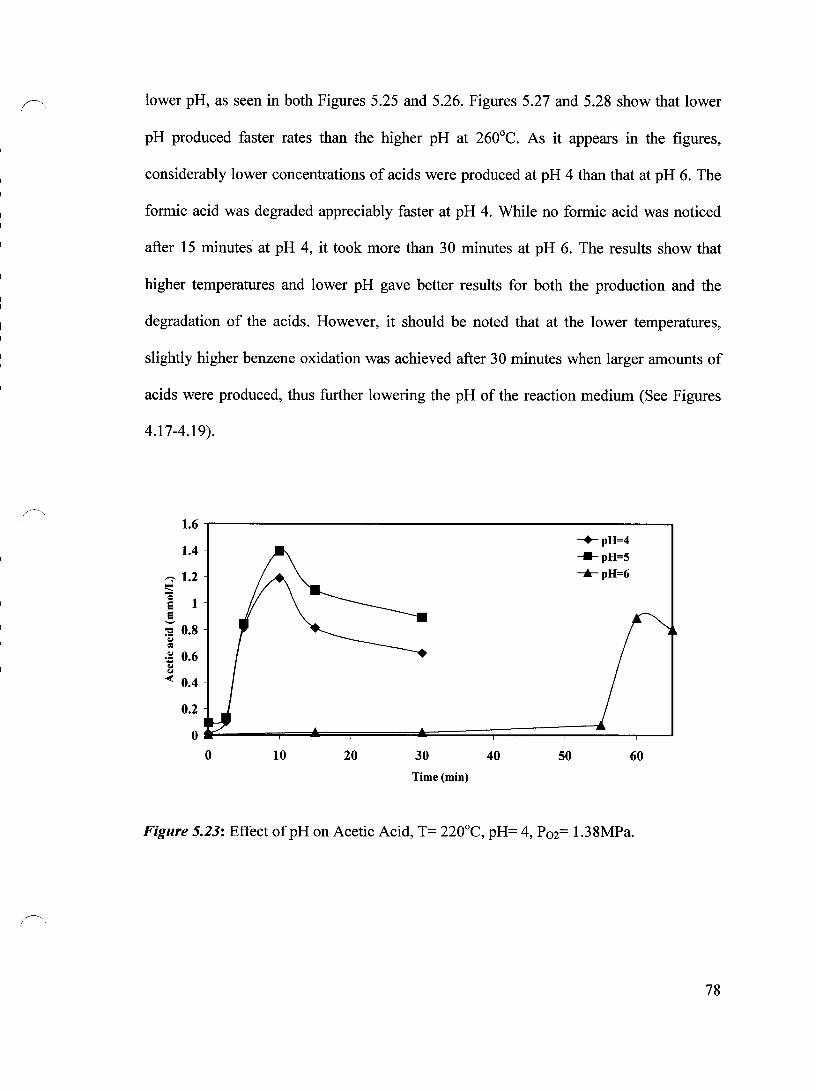
lower pH, as seen in both Figures 5.25 and 5.26. Figures 5.27 and 5.28 show that lower
pH produced faster rates than the higher pH at 260°C. As it appears in the figures,
considerahly lower concentrations of acids were produced at pH 4 than that at pH 6. The
formic acid was degraded appreciably faster at pH 4. While no formic acid was noticed
after 15 minutes at pH 4, it took more than 30 minutes at pH 6. The results show that
higher temperatures and lower pH gave better results for both the production and the
degradation of the acids. However, it should he noted that at the lower temperatures,
slightly higher benzene oxidation was achieved after 30 minutes when larger amounts of
acids were produced, thus further lowering the pH of the reaction medium (See Figures
4.17-4.19).
1.6,..----------------------------,
1.4
~ 1.2
e 1 e :; 0.8 .-
0:1
~ 0.6 .--< 0.4
-+-pH=4 ____ pH=5
-'-pH=6
0.2
o~~-=~~==~==~~==~====~==~~~ o 10 20 30 40 50 60
Time (min)
Figure 5.23: Effect ofpH on Acetic Acid, T= 220°C, pH= 4, P02= 1.38MPa.
78

f'. 1.8
! ~pH=4 1.6 ___ pH=5
~ 1.4 ........ pH=6
~ 1.2 El 1 '-'
"CI 'y 0.8 =
Col
'~ 0.6 Cl
f;T;.; 0.4
0.2
0 0 10 20 30 40 50 60
Time (min)
Figure 5.24: Effect ofpH on Formic Acid, T= 220°C, pH= 4, P02= 1.38MPa,
1.4 -+-pH=4
1.2 ___ pH=5
--- ""'-pH=6 ~ 1 Q
e e 0.8 '-' "CI 'r;:;
0.6 e<I ... '.o:l ~ ... 0.4 -<
0.2
0 0 10 20 30 40 50 60
Time (min)
Figure 5.25: Effect ofpH on Acetic Acid, T= 240°C, pH= 4, P02= 1.38MPa, (~
79
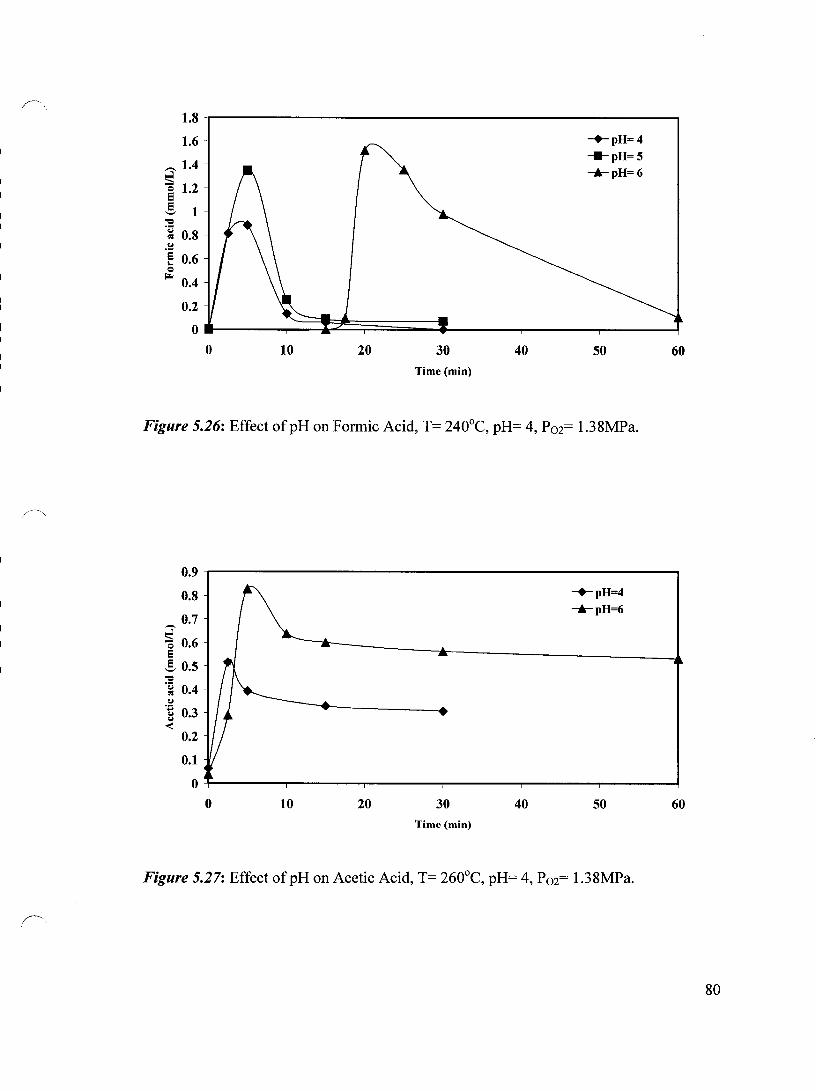
1.8
1.6 -+-pH=4
__ 1.4 ____ pH=5
~ -k-pH=6
~ 1.2 E 1 --"t:l
.~ 0.8
.~
Ë 0.6 Q
.... 0.4
0.2
0 0 10 20 30 40 50 60
Time (min)
Figure 5.26: Effect ofpH on Formic Acid, T= 240°C, pH= 4, P02= 1.38MPa.
0.9
0.8 -+-pH=4
0.7 --'-pH=6
--~ '0 0.6 E !, 0.5 "t:l
.~ 0.4 ... ~ 0.3 -(
0.2
0.1
0 0 10 20 30 40 50 60
Time(min)
Figure 5.27: Effect ofpH on Acetic Acid, T= 260°C, pH= 4, P02= 1.38MPa.
(~
80

1
-+-pH=4
,-... 0.8 -'-pH=6
S Q
El El 0.6 '-' oc '0 c.s .~ 0.4 El ... Q
f;l"
0.2
0
0 10 20 30 40 50 60
Time (min)
Figure 5.28: Effeet ofpH on Formie Aeid, T= 260°C, pH= 4, P02= 1.38MPa.
5.4.1 Effect of Acidification Methods on the Intermediates
As mentioned before, nitrie acid was usually used to lower the pH. However, suIf urie
acid was also tried in order to find out whether the anion would have any effect on the
process. The results shows that the same trend has been obtained for both acetic acid and
formic acid, which means that the type of acid did not have any impact on the results, as
long as the initial pH was similar (Figures 5.29 and 5.30). The difference in the amount
of acids can be attributed to the slightly different initial amount of the benzene used in the
experiments.
81
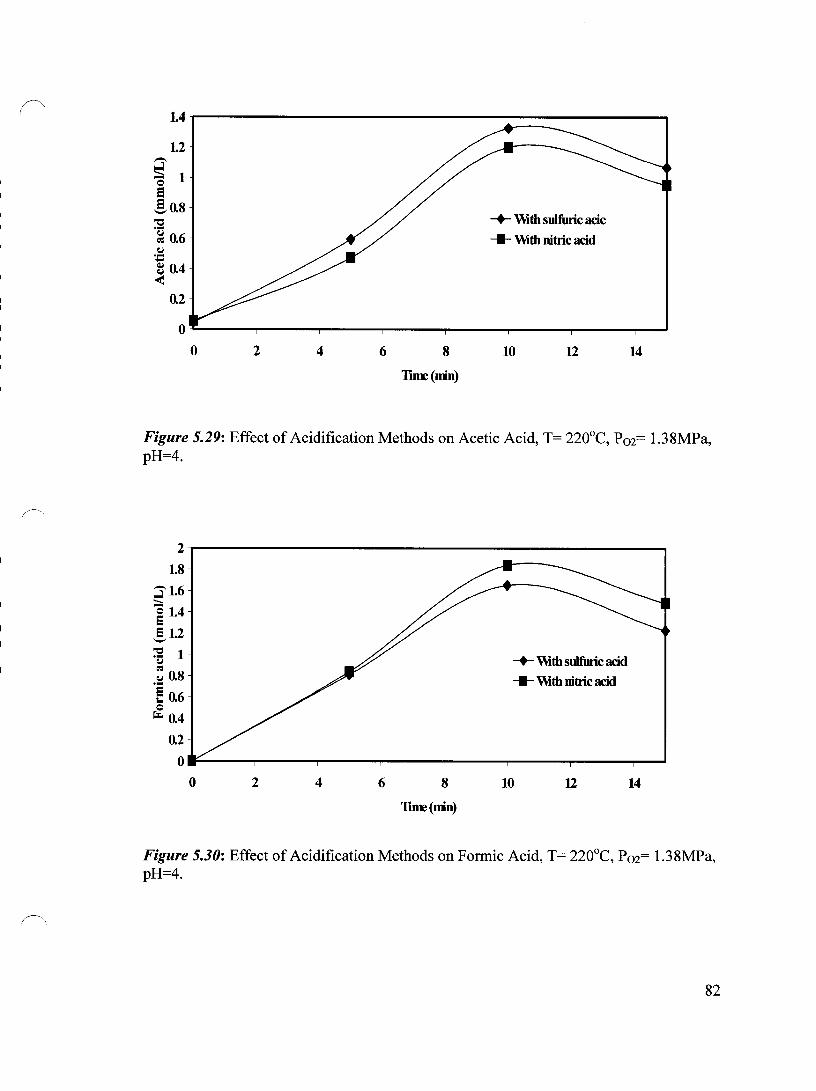
r-'.
r'
1.4
1.2 -~ -- 1 -0 El -!0.8 "C
.~ 0.6
.S:! .... ~ 0.4 -<
0.2
0
0 2 4 6 8
TIIœ (Irin)
+ \\ith sulfurie acie
____ \\ith nitrie acid
10 12 14
Figure 5.29: Effect of Acidification Methods on Acetic Acid, T= 220°C, P02= 1.38MPa, pH=4.
2
1.8
;:::5:'1.6 ;:::;, e 1.4 El 1.2 '-' "C 1 ... CJ
~ 0.8 ... Ë 0.6 0 r.. 0.4
0.2
0
0 2 4 6 8
TIIœ(Irin)
+ \\ith sulfurie acid ____ \\ith nitrie acid
10 12 14
Figure 5.30: Effect of Acidification Methods on Formic Acid, T= 220°C, P02= 1.38MPa, pH=4.
82

5.5 Effect of Initial Benzene Concentration on Both Acetic and Formic Acids Two experiments were done at pH 4 with an initial benzene concentration of 11.25
mmol/L, which was double the amount that was typically used in this study (See section
4.5). The initial oxygen pressure was set to be 2.76 MPa. From the Figures 5.31 and 5.32
for acetic and formic acids, respectively, it is apparent that the higher amount of acids
was produced when compared with results obtained from lower initial amount of benzene
(See Figures 5.12 and 5.14). Since the oxidation of benzene was faster at 240°C the
production of both acids started faster at this temperature. More acids were produced at
220°C than 240°C and no formic acid was noticed after 15 minutes at 240°C. At both
temperatures, acetic acid was preserved as a final product.
3.5
3 ,.-,
~ 2.5 0 e e 2 '-' "0 .;:;
1.5 ~ ... i ... 1 <
0.5
0
0 2 4 6 8
Time (min)
10
""-T=2200C -4-T=2400C
12 14
Figure 5.31: Effect of Temperature on Acetic Acid, P02= 2.76 MPa, pH=4, Initial Benzene Concentration = 11.25 mmol/L.
83
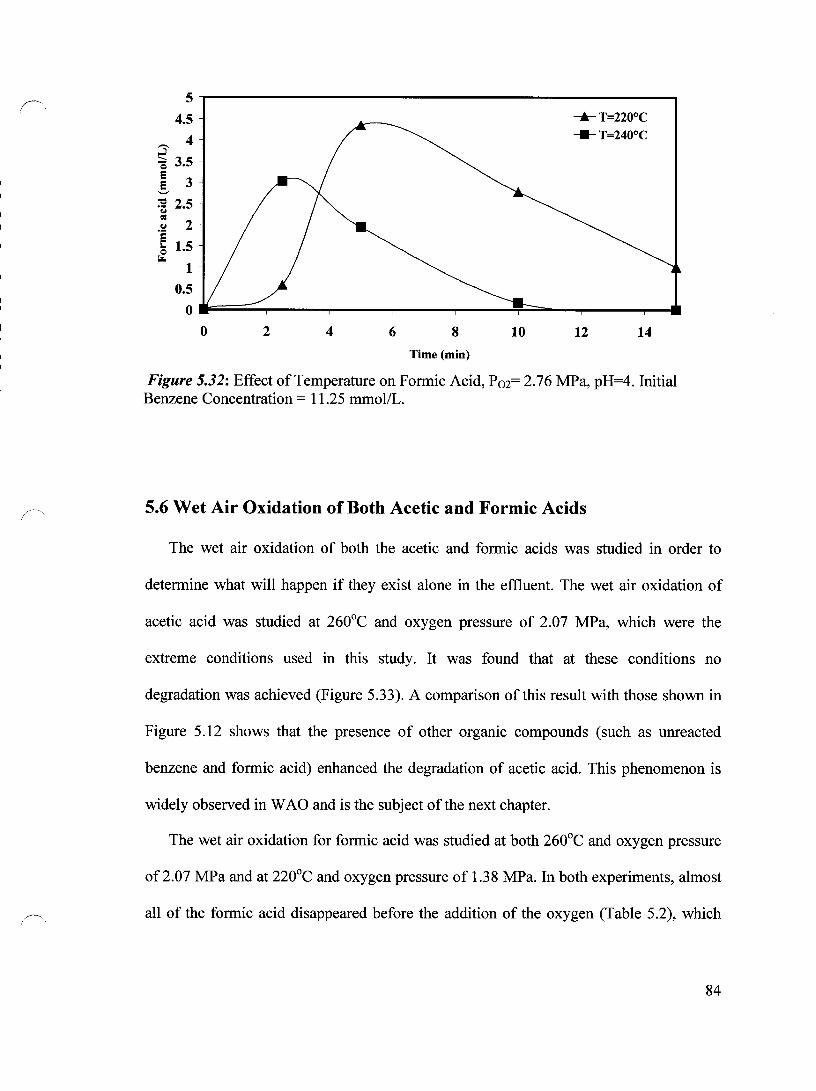
(~
5 ~-------------------------------------------------, 4.5
,.-., 4 ~ 3.5
i 3 '-'
~ 2.5 œ Col 2
ïEl 8 1.5 ~ 1
0.5
-"'T=220°C ___ T=2400C
O-===~r-----~--~----~----~~--~----~ __ o 2 4 6 8 10 12 14
Time (min)
Figure 5.32: Effect of Temperature on Formic Acid, P02= 2.76 MPa, pH=4. Initial Benzene Concentration = 11.25 mmol/L.
5.6 Wet Air Oxidation of Both Acetic and Formic Acids
The wet air oxidation of both the acetic and formic acids was studied in order to
determine what will happen if they exist alone in the effluent. The wet air oxidation of
acetic acid was studied at 260°C and oxygen pressure of 2.07 MPa, which were the
extreme conditions used in this study. It was found that at these conditions no
degradation was achieved (Figure 5.33). A comparison ofthis result with those shown in
Figure 5.12 shows that the presence of other organic compounds (such as unreacted
benzene and formic acid) enhanced the degradation of acetic acid. This phenomenon is
widely observed in W AO and is the subject of the next chapter.
The wet air oxidation for formic acid was studied at both 260°C and oxygen pressure
of 2.07 MPa and at 220°C and oxygen pressure of 1.38 MPa. In both experiments, almost
an of the formic acid disappeared before the addition of the oxygen (Table 5.2), which
84
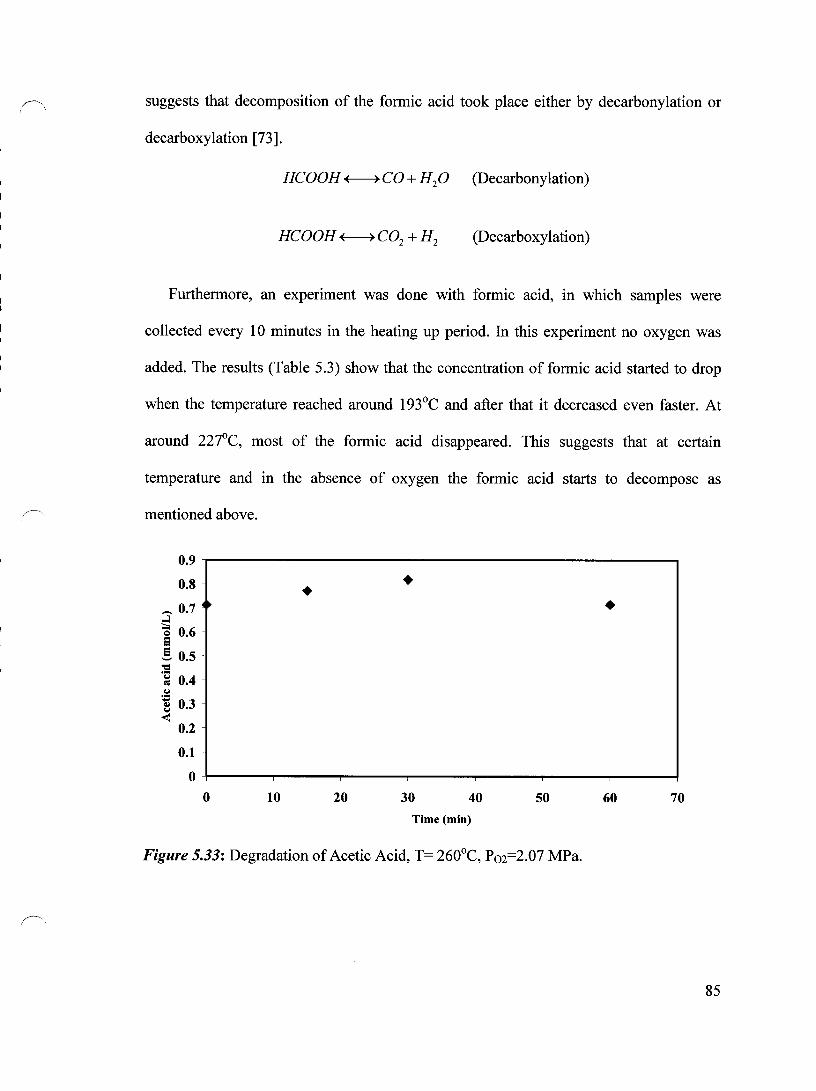
suggests that decomposition of the forrnic acid took place either by decarbonylation or
decarboxylation [73].
HCOOH ~ co + H20 (Decarbonylation)
HCOOH ~C02 + H2 (Decarboxylation)
Furtherrnore, an experiment was done with forrnic acid, in which sarnples were
collected every 10 minutes in the heating up period. In this experiment no oxygen was
added. The results (Table 5.3) show that the concentration of forrnic acid started to drop
when the temperature reached around 193°C and after that it decreased even faster. At
around 227°C, most of the forrnic acid disappeared. This suggests that at certain
temperature and in the absence of oxygen the forrnic acid starts to decompose as
mentioned above.
0.9
0.8 • • ,-., 0.7 • ~ e 0.6
! 0.5 oc .~ 0.4 <J
~ 0.3 -<
0.2
0.1
0 0 10 20 30 40 50 60 70
Time (min)
Figure 5.33: Degradation of Acetic Acid, T= 260°C, P02=2.07 MPa.
85

Table 5.2: Effect of Temperature on Formic Acid.
Time mmol Formic Acid mmol Formic Acid
(min) (220°C,P02=1.38 MPa) (260°C, P02= 2.07 MPa)
Original Sample 2.1 2.1
0 0.1 0
15 0 0
Table 5.3: Concentration ofFormic Acid at Different Temperatures.
Time (min) Temperature(°C) Total pressure (MPa) mmol Formic acid/L
0 17 0.20 1.97 10 21 0.19 2.03 20 32 0.19 2.04 30 49 0.20 2.10 40 68 0.23 1.92 50 88 0.28 1.96 60 109 0.37 2.01 70 132 0.52 2.06 80 153 0.78 2.03 90 173 1.15 1.91
100 193 1.65 1.76 110 211 2.27 0.84 120 227 3.03 0.06 130 241 3.86 0.01 150 257 4.90 0.00
5.7 Repeatability of the ResuUs
Since the initial henzene concentration was not exact1y the same for the replicates it
was expected not to have exactly the same results. The results that were ohtained for
replicates for acetic acid can he seen in figures 5.34, 5.35 and 5.36 while those for formic
86

acid can be seen in figures 5.37, 5.38 and 5.39 both at 220, 240 and 260°C, respectively.
These figures show that the trend in aIl experiment were comparable.
2~--------------------------------------------------~ 1.8
,-, 1.6
~ 1.4
~ 1.2 '-' "0 1 'y .~ 0.8 .... ~ 0.6
0.4
0.2
o .. ~~--~------~------~------~------~------~ o 5 10 15
Time (min)
20 25
Figure 5.34: Acetic acid profile for replicates, T=220°C, P02, 1.38 MPa, pH=4.
30
1.4~---------------------------------------------------,
1.2
~ 1 Q
e ! 0.8 "0 .~ 0.6 CJ
;
~ 0.4
0.2
O~------~--------r-------~------~--------~------~ o 5 10 15
Time (min)
20 25
Figure 5.35: Acetic acid profile for replicates, T=240oC, P02, 1.38 MPa, pH=4.
30
87

r" (
0.8
0.7
~ 0.6 Q ë 0.5 ë '-'
::! 0.4 Col <n .~ 0.3 -~ ..( 0.2
0.1
0
0 5 10 15 20 25 30
Time(min)
Figure 5.36: Acetic acid profile for replicates, T=260°C, P02, 1.72 MPa, pH=4.
1.6
1.4
~ 1.2
= e 1 e '-'
:5! 0.8 Col ~
'ê 0.6 .. ~ 0.4
0.2
0
0 5 10 15 20 25 30
Time (min)
Figure 5.37: Fonnic acid profile for replicates, T=220°C, P02, 1.38 MPa, pH=4.
88

~,
1.2
1 ,-., ...::1 ;:;:, ~ 0.8 e '-'
:'5! 0.6 (,j ~ (,j
'ê 0.4 Q
r.. 0.2
0
0 5 10 15 20 25 30
Time (min)
Figure 5.38: Formic acid profile for replicates, T=240°C, Pm, 1.38 MPa, pH=4.
0.8 -r------------------------------, 0.7
-. ::; 0.6 o i 0.5 -:s! 0.4 (,j ~
.!:! 0.3 e ... ~ 0.2
0.1
O __ ---_r---~-~~--__ ------_r------~--------. o 5 10 15
Time(min)
20 25
Figure 5.39: Formic acid profile for replicates, T=260oC, Pm, 1.72 MPa, pH=4.
30
89

In summary, the results show that the main intermediates were found to be acetic acid
and formic acid. Negligible amounts of both propanoic acid and glycolic acid were also
detected. In addition, a negligible amount of benzoquinone was identified by the Gas
Chromatography Mass Spectrometry (GCMS). Most of the intermediates were degraded
to CO2 and H20 as the reaction proceeded. However, only sorne of the acetic acid
produced during the oxidation was degraded and the remaining stayed as a final product.
90

CHAPTERSIX
RESULTS AND DISCUSSIONS
WET AIR OXIDATION OF BENZENE ENHANCED BY PHENOL
The co-oxidation method is used to enhance the wet air oxidation of many
compounds (see Section 2.5). In this study, phenol was used to enhance the benzene
degradation. Simultaneous benzene and phenol oxidation has been studied at a
temperature range of 160-220°C. In most experiments the initial phenol concentration
ranged from 0.11 to 2.13 mmollL while the concentration ofbenzene was kept constant at
5.63 mmol/L. 100% excess of oxygen was used. However, at the beginning ofthis study,
different conditions were applied, as described below.
6.1 Wet Air Oxidation of Phenol in Absence of Benzene
The wet air oxidation of phenol in the absence of benzene showed that 99.5%
degradation can be achieved in 2.5 minutes at 220°C and oxygen pressure of 2.07 MPa.
The initial phenol concentration was 5.31 mmollL and the initial pH was set to be 4. This
experiment was repeated at pH 6 with 1.38 MPa of oxygen pressure and again more than
99% degradation was achieved within 2.5 minutes. In contrast to benzene, this shows that
the pH in the range of 4 to 6 does not have a significant influence on the phenol
degradation. An experiment using 2.13 mmol/L as the initial concentration of phenol has
been conducted at pH 6 with 100% excess of oxygen, which is the same as the excess that
was used throughout this part of study. In this experiment, 95% degradation was achieved
within 2.5 minutes and after 5 minutes no phenol was detected. Those experiments
91
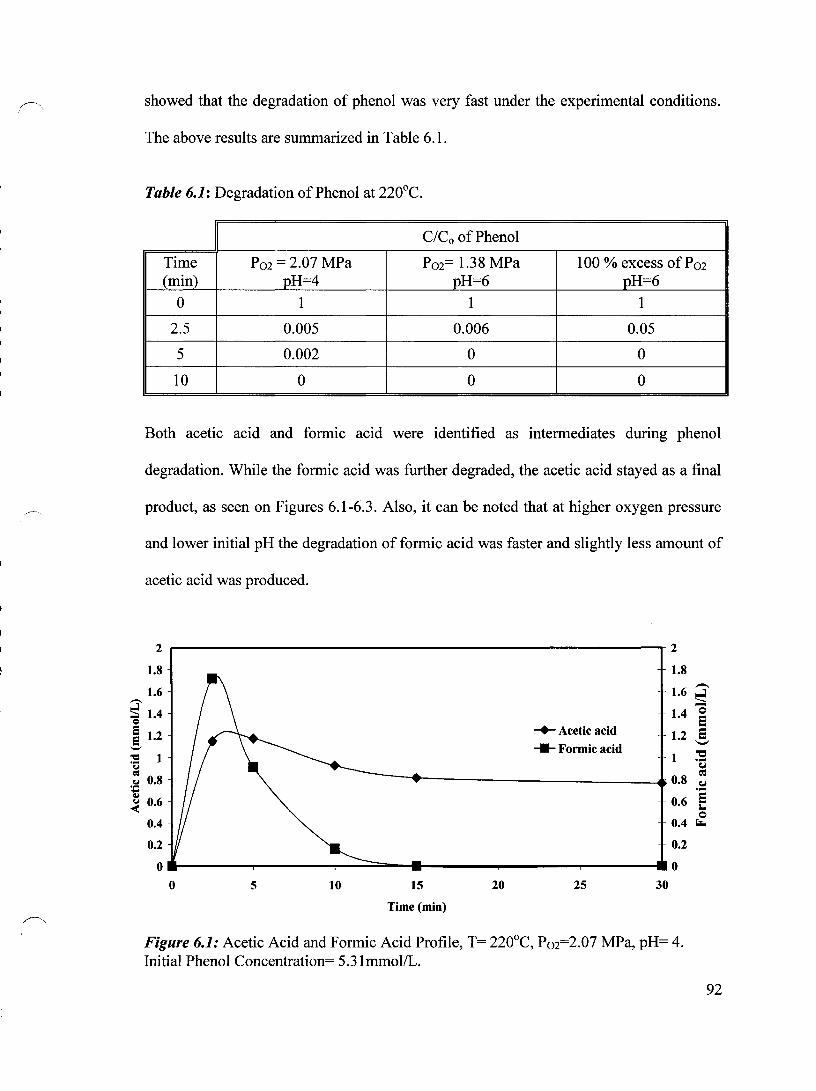
showed that the degradation of phenol was very fast under the experimental conditions.
The above results are summarized in Table 6.1.
Table 6.1: Degradation of Phenol at 220°C.
C/CoofPhenol
Time P02 = 2.07 MPa P02= 1.38 MPa 100 % excess of P 02 (min) pH=4 pH=6 pH=6
0 1 1 1
2.5 0.005 0.006 0.05
5 0.002 0 0
10 0 0 0
Both acetic acid and formic acid were identified as intermediates during phenol
degradation. While the formic acid was further degraded, the acetic acid stayed as a final
product, as seen on Figures 6.1-6.3. AIso, it can be noted that at higher oxygen pressure
and lower initial pH the degradation of formic acid was faster and slightly less amount of
acetic acid was produced.
2~----------------------------------------------------~
1.8
1.6 ~ _ 1.4 Q
~ 1.2 '-'
:s 1 ... ~ 0.8 i .< 0.6
0.4
0.2
-+- Acetic acid ___ Formic acid
O __ ------~--------~--~--~~------~--------r_------~ o 5 10 15
Time (min)
20 25 30
2
1.8
1.6
1.4
1.2
1
0.8
0.6
0.4
0.2
0
Figure 6.1: Acetic Acid and Formic Acid Profile, T= 220°C, P02=2.07 MPa, pH= 4. Initial Phenol Concentration= 5.31mmollL.
-. ~ -0
ES ES --"C .... CJ ~ CJ .... ES a. 0 ~
92

r
(
2 2
1.8 -+- Acetic acid 1.8
_1.6 ____ Fonnic acid 1.6 ;3' S ~
Q 1.4 1.4 0
e e E 1.2 1.2 g '-'
:s 1 1 "CS ... Col Col C'II C'II .~ 0.8 0.8 Col ... ... e ~ 0.6 0.6 ... -< 0
0.4 0.4 ~
0.2 0.2
0 0
0 5 10 15 20 25 30
Time(min)
Figure 6.2: Acetic Acid and Formic Acid Profile, T= 220°C, P02=1.38 MPa, pH= 6. Initial Phenol Concentration= 5.31mmollL.
0.6 0.6
-+- Acetic acid 0.5 ....... Fonnic acid 0.5.-- ..J
S ~ 0 ë 0.4 0.4 e e e '-'
'-' 0.3 :s :s 0.3 Col
Col C'II C'II Col Col ... ~ 0.2 0.2 e
Col ... -< 0
~
0.1 0.1
0 0
0 5 10 15 20 25 30
Time(min)
Figure 6.3: Acetic Acid and Formic Acid Profile, T= 220°C, Po2=O.51 MPa, pH= 4. Initial Phenol Concentration= 2.13 mmollL.
93
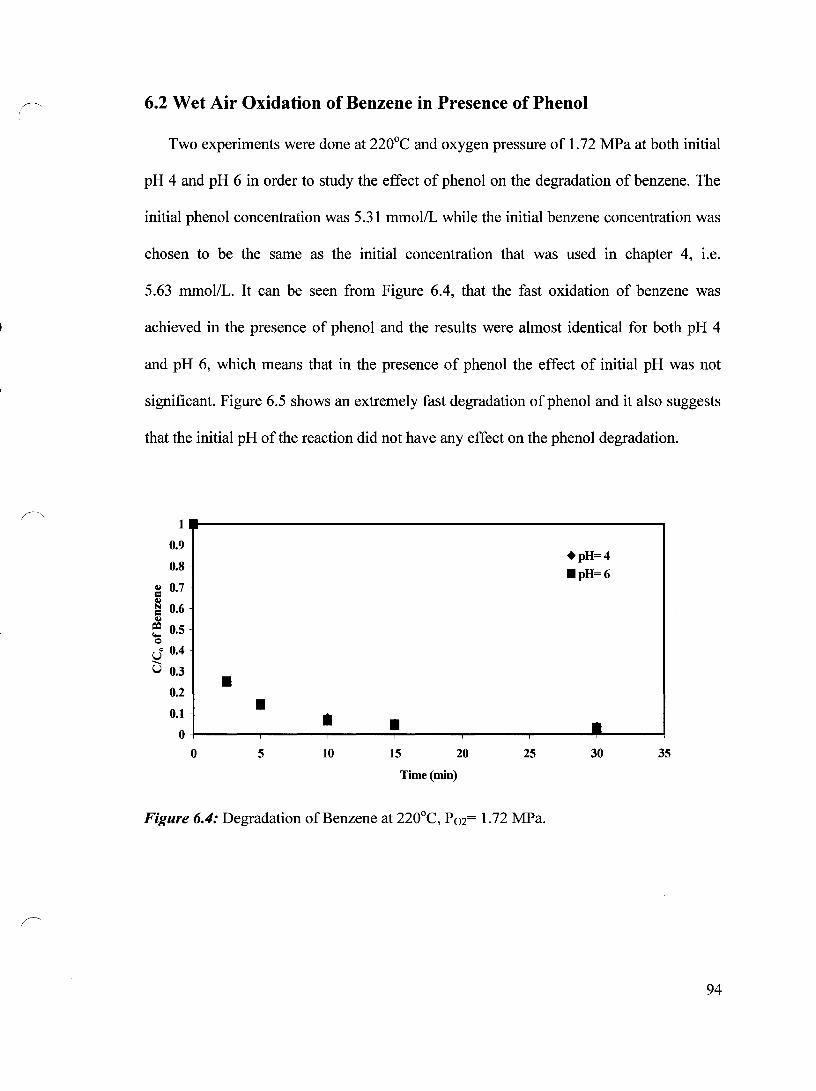
(-~
6.2 Wet Air Oxidation of Benzene in Presence of Phenol
Two experiments were done at 220°C and oxygen pressure of 1.72 MPa at both initial
pH 4 and pH 6 in order to study the effect of phenol on the degradation of benzene. The
initial phenol concentration was 5.31 mmol/L while the initial benzene concentration was
chosen to be the same as the initial concentration that was used in chapter 4, i.e.
5.63 mmol/L. It can be seen from Figure 6.4, that the fast oxidation of benzene was
achieved in the presence of phenol and the results were almost identical for both pH 4
and pH 6, which means that in the presence of phenol the effect of initial pH was not
significant. Figure 6.5 shows an extremely fast degradation of phenol and it also suggests
that the initial pH of the reaction did not have any effect on the phenol degradation.
1
0.9
0.8
~ 0.7 ~
~ 0.6 Qi
~ 0.5 Q
cl 0.4 ...... U 0.3 • 0.2
0.1 • • • 0
0 5 10 15 20 25
Time (min)
Figure 6.4: Degradation of Benzene at 220°C, P02= 1.72 MPa.
+pH=4
.pH=6
• 30 35
94
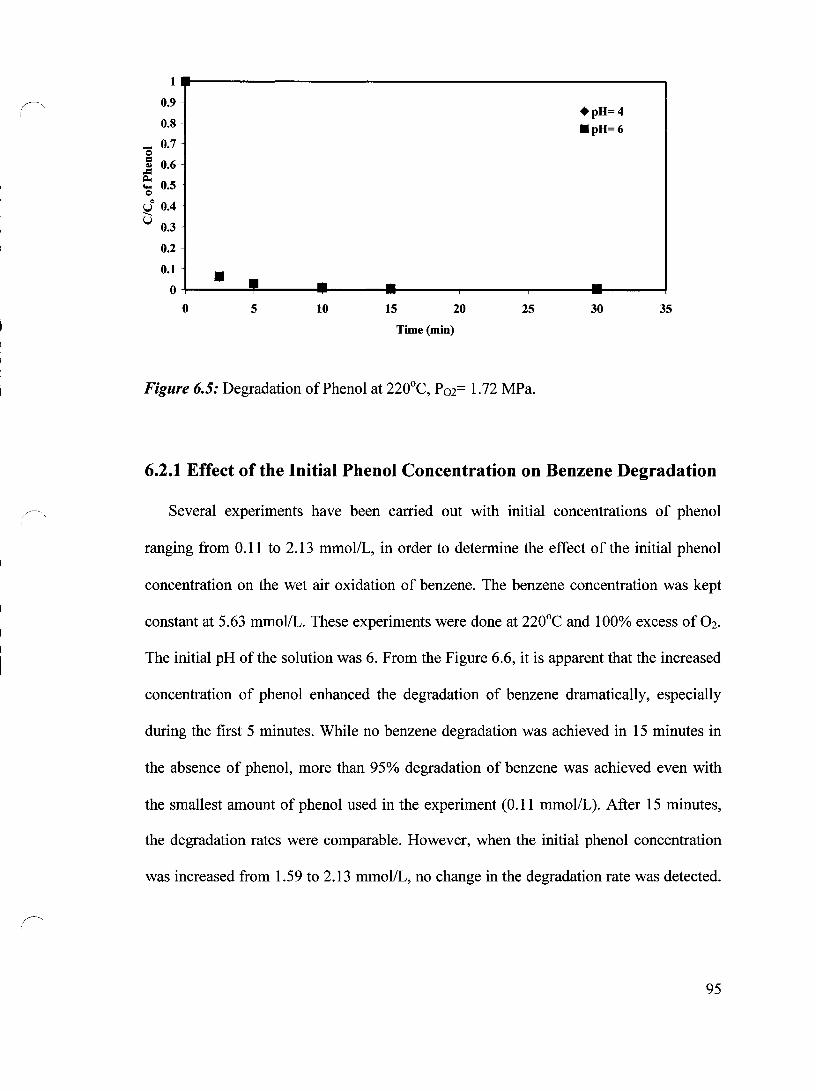
1
~. 0.9 +pH=4
0.8 .pH=6
'0 0.7
= 0.6 .. ..Cl ~
0.5 ... = U
O
0.4 --u 0.3
0.2
0.1 • 0 • - - -0 5 10 15 20 25 30 35
Time (min)
Figure 6.5: Degradation of Phenol at 220°C, P02= 1.72 MPa.
6.2.1 Effect of the Initial Phenol Concentration on Benzene Degradation
Several experiments have been carried out with initial concentrations of phenol
ranging from 0.11 to 2.13 mmollL, in order to determine the effect of the initial phenol
concentration on the wet air oxidation of benzene. The benzene concentration was kept
constant at 5.63 mmollL. These experiments were done at 220°C and 100% excess of 02.
The initial pH of the solution was 6. From the Figure 6.6, it is apparent that the increased
concentration of phenol enhanced the degradation of benzene dramatically, especially
during the first 5 minutes. While no benzene degradation was achieved in 15 minutes in
the absence of phenol, more than 95% degradation of benzene was achieved even with
the smallest amount of phenol used in the experiment (0.11 mmollL). After 15 minutes,
the degradation rates were comparable. However, when the initial phenol concentration
was increased from 1.59 to 2.13 mmol/L, no change in the degradation rate was detected.
95
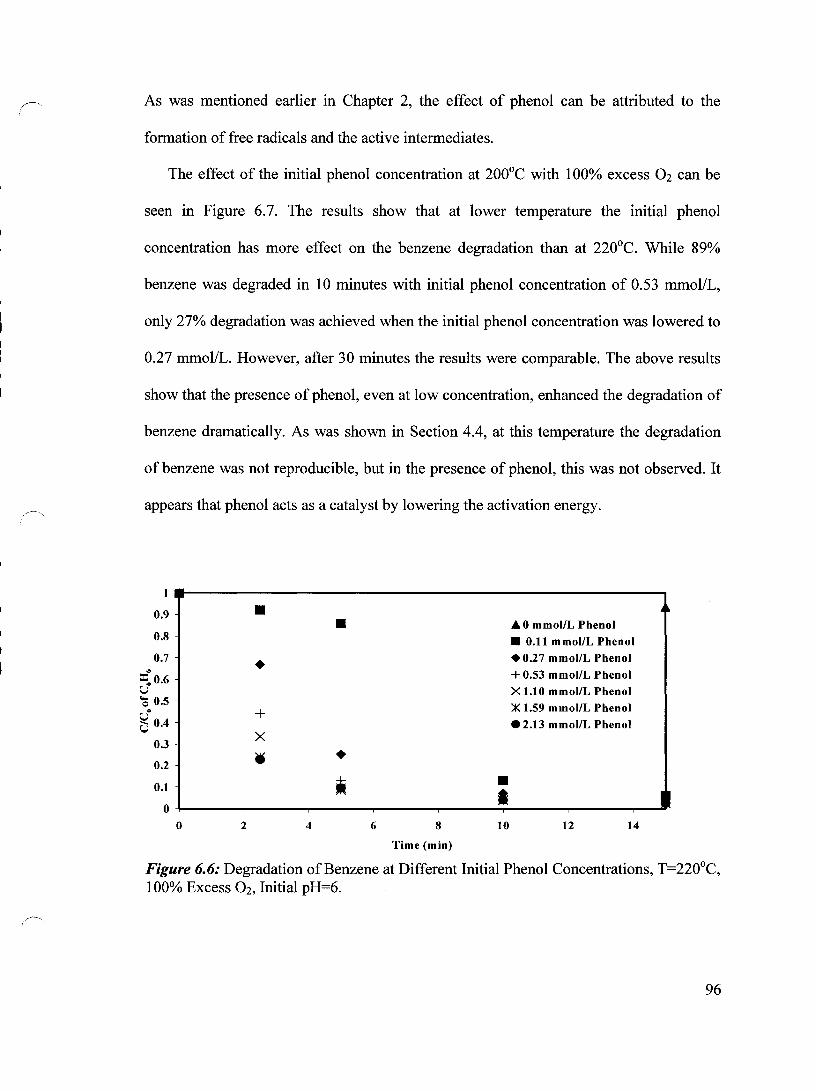
As was mentioned earlier in Chapter 2, the effect of phenol can be attributed to the
formation of free radicals and the active intermediates.
The effect of the initial phenol concentration at 200°C with 100% excess Oz can he
seen in Figure 6.7. The results show that at lower temperature the initial phenol
concentration has more effect on the benzene degradation than at 220°C. While 89%
henzene was degraded in 10 minutes with initial phenol concentration of 0.53 mmol/L,
only 27% degradation was achieved when the initial phenol concentration was lowered to
0.27 mmollL. However, after 30 minutes the results were comparable. The above results
show that the presence of phenol, even at low concentration, enhanced the degradation of
benzene dramatically. As was shown in Section 4.4, at this temperature the degradation
of henzene was not reproducible, but in the presence of phenol, this was not observed. It
appears that phenol acts as a catalyst by lowering the activation energy.
1
0.9 • • ... 0 mmol/L Phenol 0.8 • 0.11 mmol/L Phenol
0.7 • .0.27 mmol/L Phenol
=;: 0.6 + 0.53 mmoIlL Phenol U X 1.10 mmol/L Phenol ~ 0.5
)K 1.59 mmoIlL Phenol d" + Ù 0.4 .2.13 mmol/L Phenol
0.3 X
• • 0.2
0.1 • • • Il 0
0 2 4 6 8 10 12 14
Time (min)
Figure 6.6: Degradation of Benzene at Different Initial Phenol Concentrations, T=220°C, 100% Excess Oz, Initial pH=6.
96

Figure 6.7: Degradation of Benzene at Different Initial Phenol Concentrations, T=200°C, 100% Excess 02, Initial pH=6.
6.2.2 Effect of Temperature on Benzene Degradation in the Presence of Phenol
In the previous section, the effect of the initial phenol concentration on benzene
degradation was studied at constant temperature. However, in this section the initial
phenol concentration was kept constant and the temperature was varied to study the effect
of the temperature on the benzene degradation at constant initial phenol concentration.
Two different initial phenol concentrations were used. The initial selected phenol
concentration was the lowest phenol concentration that gave good results at the lowest
temperature used, i.e. 0.27 mmollL, when the lowest temperature was 200°C and 0.53
mmol/L when the lowest temperature was 160°C. The oxygen concentration was kept at
100% excess and the initial pH was 6. Figure 6.8 shows the degradation of benzene at
both 200 and 220°C. The initial phenol concentration was 0.27 mmollL. It can be seen
that when the temperature was increased from 200 to 220°C a considerably faster
97

(
degradation was achieved. The co-oxidation of benzene was further studied with the
initial phenol concentration of 0.53 mmol/L at 4 different temperatures ranging from 160
to 220°C (Figure 6.9). The results show that the benzene degradation was rather slow at
160°C and only around 50% degradation was achieved within 60 minutes. However, with
the increasing temperature, the degradation rate of benzene became faster and more
degradation was achieved during the first 20 minutes. This implies that the higher the
temperature, the faster phenol oxidation was achieved and this resulted in the rapid
formation of the free radicals and the active intermediates. AIso, as mentioned before
higher temperatures lead to higher oxygen solubility in the liquid phase.
0.9 • +T=200oc 0.8 • .T=220oc
0.7 • '" • ~ 0.6
U ... 0.5 ~ .. ~ 0.4 • U
0.3 • 0.2
0.1 • • • 0
0 5 10 15 20 25 30
Time (min)
Figure 6.8: Degradation of Benzene at Different Temperatures, 100% Excess O2, Initial Phenol Concentration= 0.27 mmol/L, Initial pH= 6.
35
98

~\ X
0.9 X XT=l600C
0.8 +. X • T=18O"C
.T=2000C 0.7
'" + • .T=2200C =a 0.6 U .. ~ 0.5 X
0 • ~ 0.4 U
0.3 • 0.2
0.1 • + • ~ • • ... 0
0 10 20 30 40 50 60 70
Time(min)
Figure 6.9: Degradation ofBenzene at Different Temperatures, 100% Excess O2, Initial Phenol Concentration= 0.53 mmol/L, Initial pH= 6.
6.2.3 Effect of Benzene on the Phenol Oxidation
Figure 6.10 shows the phenol profile at different temperatures when 0.53 mmol/L of
phenol was used as initial concentration. It is apparent from the Figure that at 220°C the
degradation of phenol was very fast. However, at 200°C the concentration of phenol
decreased during the first 5 minutes of the oxidation, followed by the slight increase, and
by final degradation of phenol. The same oxidation path can also be seen at 180°C. This
suggests that, at the beginning of the oxidation, the small amount of phenol was
degraded, and it was followed by the partial conversion of benzene to phenol which was
then degraded. However, the peaks were shifted to the right as the oxidation temperatures
decreased. At 160°C, the concentration of phenol increased with time, which implies that
the rate of oxidation of benzene to phenol was faster than the rate of degradation of
phenol during the duration of the experiment.
99
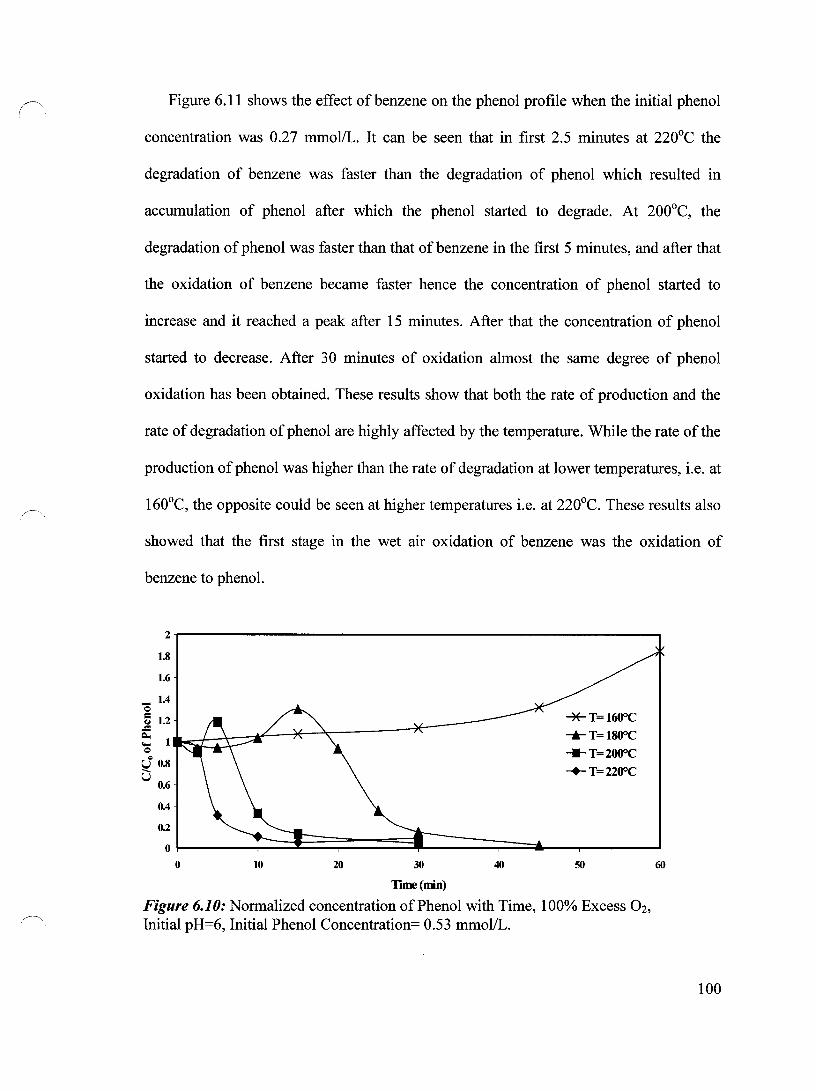
Figure 6.11 shows the effect of benzene on the phenol profile when the initial phenol
concentration was 0.27 mmollL. It can be se en that in first 2.5 minutes at 220°C the
degradation of benzene was faster than the degradation of phenol which resulted in
accumulation of phenol after which the phenol started to degrade. At 200°C, the
degradation of phenol was faster than that of benzene in the first 5 minutes, and after that
the oxidation of benzene became faster hence the concentration of phenol started to
increase and it reached a peak after 15 minutes. After that the concentration of phenol
started to decrease. After 30 minutes of oxidation almost the same degree of phenol
oxidation has been obtained. These results show that both the rate of production and the
rate of degradation of phenol are highly affected by the temperature. While the rate of the
production of phenol was higher than the rate of degradation at lower temperatures, i.e. at
160°C, the opposite could be se en at higher temperatures i.e. at 220°C. These results also
showed that the first stage in the wet air oxidation of benzene was the oxidation of
benzene to phenol.
2
1.8
1.6
_ 1.4 0
~ 1.2 ..c: ~
1 ... 0
U 0.8 --U 0.6
0.4
0.2
0
0 10 20 30
TIme(min)
40
......... T=lSOOC
-W--T=2000C
-+-T=2200C
50
Figure 6.10: Normalized concentration of Phenol with Time, 100% Excess O2,
Initial pH=6, Initial Phenol Concentration= 0.53 mmollL.
60
100

2~----------------------------------------------------~ 1.8
1.6
_1.4 Q
~ 1.2 .c !:' 1 Q
~., 0.8
U 0.6
0.4
-II- T=200°C -+-T=220°C
O.~ L-----.----~==:!:===:::====:::;:::====:::l o 5 10 15
Time (min)
20 25
Figure 6.11: Nonnalized concentration of Phenol with Time, 100% Excess 02, Initial pH=6, Initial Phenol Concentration= 0.27 mmollL.
6.3 Reaction Kinetics of Benzene Oxidation
30
The use oftwo first order reaction kinetics model represented well the WAO on many
phenolic compounds [33, 39]. Lin et al. [41] also showed that this model worked in their
study on the WAO ofhigh concentration wastewater. It can be seen from figure 6.12 that
this model fit our reaction well and it consists of 2 steps; namely the fast reaction step
and the slow reaction step. While at 220°C only the fast step can be detected, at 160°C
only the slow step exists. Figure 6.13 shows that the reaction follows the Arrhenius
correlation and the activation energy was calculated to be 21.1 kJ/mol and 1.2*102 kJ/mol
for the fast and slow step, respectively.
101
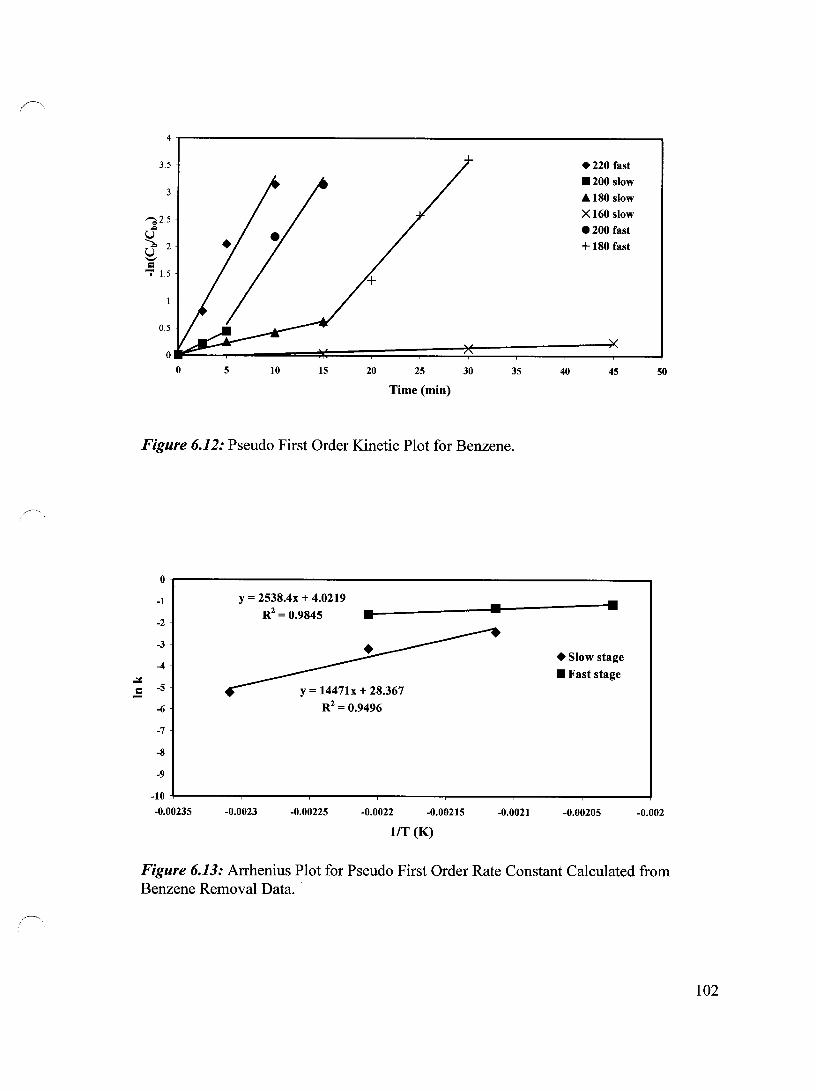
~
4
3.5
3
~2.5 ,Q
U -- 2 ,Q
U "-' = "'i' 1.5
o 5 10 15 20 25
Time (min)
30
.220 fast
.200 slow Â180 slow X160 slow .200 fast
+ 180 fast
35 40 45
Figure 6.12: Pseudo First Order Kinetic Plot for Benzene.
0
-1
-2
-3
-4
~
..5 -5
-6
-7
-8
-9
-10
-0.00235
y = 2538.4x + 4.0219 .I--____ -....-l .... -------. R
2= 0.9845. •
-0.0023
y = 14471x + 28.367
R2 = 0.9496
-0.00225 -0.0022 -0.00215
liT (K)
-0.0021
.Slow stage
• Fast stage
-0.00205
50
-0.002
Figure 6.13: Arrhenius Plot for Pseudo First Order Rate Constant Calculated from Benzene Removal Data ..
102

(-
6.4 Repeatability of the Experiments
The repeatability of both benzene and phenol has been tested. Figure 6.14 shows the
repeatability of benzene data at 220°C and 100% excess of oxygen pressure with an
initial pH of 6. The initial phenol concentration was 0.27 mmol/L. It is apparent that the
excellent repeatability was achieved. A good repeatability was also achieved for phenol
as appears in Figure 6.15.
6
5h
.-.. S4 0 e • A3 ~ = ~ N
~ 2 ~
• • .1 0
0 5 10 15 20 25 30
Time(min)
Figure 6.14: Repeatability of Benzene Result at 220°C, 100% Excess O2, Initial pH= 6, Initial Phenol Concentration= 0.27 mmollL.
103

0.7 -,------------------------------,
0.6
0.2
0.1
• • • •
• O~---~--~---~·---_r---~---~·--~
o 5 10 15 20 25 30 35
Time(min)
Figure 6.15: Repeatability of Phenol Result at 220°C, 100% Excess 02, Initial pH= 6, Initial Phenol Concentration= 0.27 mmol/L.
6.5 Proposed Simplified Pathway for Oxidation of Benzene
From the results obtained in this chapter it was obvious that the benzene first oxidized
to phenol and after that phenol further degraded. AIso, as mentioned earlier, the
benzoquinone has been identified by the GCMS. This means that the phenol was first
degraded to either hydroquinone or catechol, or both of them, which was further
degraded to the benzoquinone. The benzoquinone will further oxidized through many
intermediates that have not been identified in this study. Later, those intermediates were
degraded to low molecular weight organic acids. Sorne of these acids were identified in
this study. Accordingly, the following pathway was proposed:
104
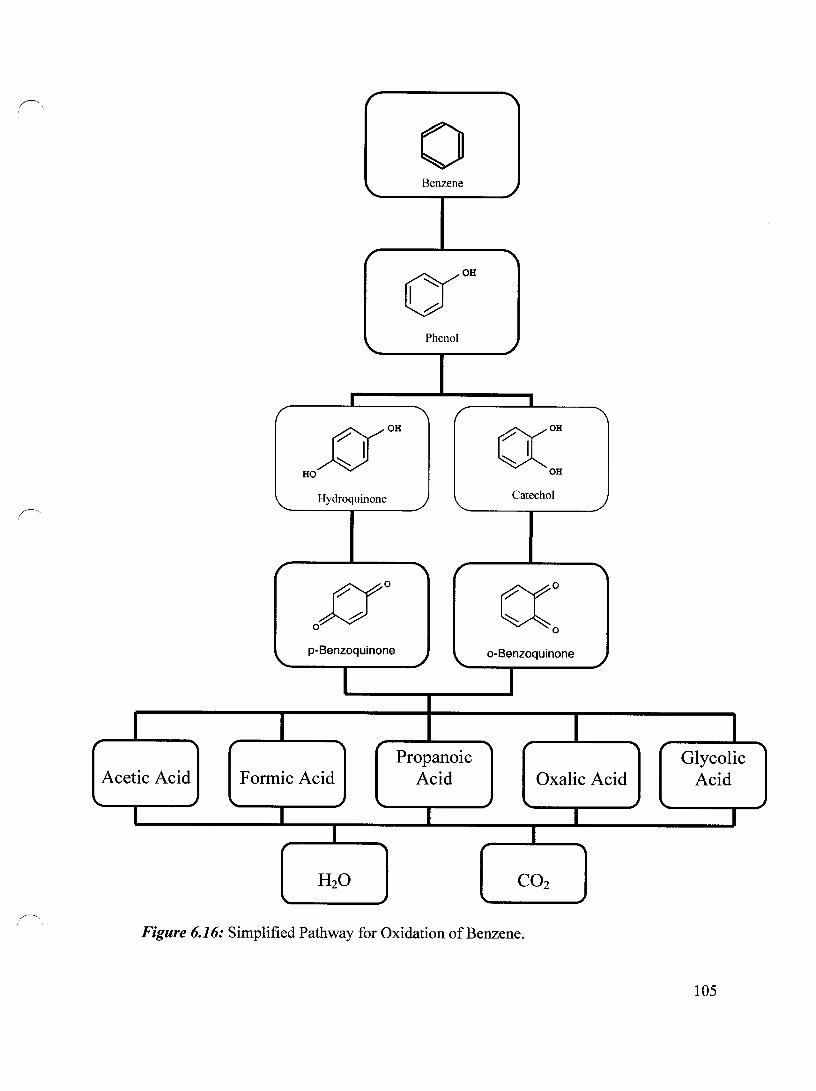
~. r
"
r
r ffO 0
" p-Benzoquinone
1
Acetic Acid Formic Acid
1 1
0 Benzene
cr OH
I~ ~
Phenol
" r
Propanoic Acid
"
~
C( o
o-Benzoquinone
1
1
Oxalic Acid
1 1
Figure 6.16: Simplified Pathway for Oxidation of Benzene.
l Glycolic
Acid
1
105

CHAPTER SEVEN
CONCLUSIONS AND RECOMMENDATIONS
7.1 Conclusions
The following can be conc1uded from the work:
• The rate of benzene degradation depends on temperature, pressure, pH and the
compositions of the reaction medium.
• At fixed temperature, the lower the pH the higher the rate of benzene degradation
because of the accumulation of the free radicals at the lower pH. However, the
major effect of pH was at lower oxidation temperatures.
• The pH of the solution kept changing throughout the reaction because of the
production and degradation of the interrnediates.
• Faster benzene degradation has been obtained with the increasing partial pressure
of oxygen, especially at the first 5 minutes of the reaction time. The main reason
is that the higher oxygen pressure resulted in the higher amount of oxygen
dissolved in the liquid phase.
• The results showed that the reaction can be represented by two first order reaction
with respect to benzene concentration and oxygen partial pressure. The reaction
occurs in two steps, a fast step followed by a slow step. Most of the benzene was
degraded during the fast step. When the initial pH was 4, the activation energy for
the fast step was found to be 10.3 kJ/mol.
106

• Considerable TOC reduction was achieved and the degree of TOC reduction
increased with temperature. This implies that the reaction tends to go to
completion.
• Lower amounts of intermediates were produced at higher oxidation temperatures
because at higher temperatures aIl reactions tend to go to completion.
• The main intermediates were found to be acetic acid and formic acid. Negligible
amounts of both propanoic acid and glycolic acid were also detected. In addition,
a negligible amount of benzoquinone was identified. Acetic acid was the most
stable product.
• The optimum conditions for benzene degradation were found to be 220°C and
oxygen partial pressure of 1.38 MPa in the pH range of 4-5. However at these
conditions higher amounts of acids was produced.
• Addition of phenol to the system enhanced the benzene degradation because the
free radicals that were produced during the phenol oxidation were used to initiate
the oxidation of benzene.
• Since phenol is a common component that can be found in many of the
wastewater streams and since it can enhance the degradation of benzene and sorne
other component, this can have a significant economic impact.
• The higher the concentration of phenol, the higher the benzene degradation at a
r'. given temperature. However, the addition of 1.59 mmol/L of phenol was found to
107

be the optimum concentration. Above 1.59 mmollL, the benzene degradation was
not increased.
• The degradation of benzene enhanced with phenol proceeds in two stages and the
activation energy was determined to be 21.1 kJ/mol and 1.2*102 kJ/mol for the
fast and slow step, respectively
• A simplified pathway for the reaction suggested that the benzene first oxidized to
phenol, followed by further phenol degradation.
7.2 Recommendations for future work
• Due to the present experimental setup, there was a limitation in the number of the
samples that could have been collected during the experiments. It is recommended
to modify the experimental setup so that more samples could be collected in order
to test the kinetic model.
• It is recommended to use the High Pressure Liquid Chromatography (HPLC) to
analyze the samples especially those that can be collected periodically when the
oxidation is fast in order to identify if there are another intermediates produced in
addition to those identified in this study.
• Different catalysts should be tried at different conditions to find out if they could
enhance the benzene degradation.
108
.~.
I~
• Since the metal wall can destroy the free radicals it is recommended to study the
effect of Pyrex liner.
• It is recommended to try different additives, other than phenol, which might
enhance the benzene degradation. An example of such an additive is
hydroquinone, which is known to be a free radical initiator.
• Oxidizing agent other than oxygen such as ozone and hydrogen peroxide can be
used for the reaction.
• Effect of impeller speed on the benzene degradation should be studied at different
experimental conditions.
7.3 Contributions to Knowledge
As to our knowledge, this is the first study that deals with the wet air oxidation of
benzene. The results that were obtained were very promising. The degradation ofbenzene
was enhanced by lowering the initial pH of the reaction medium and enhanced further by
the addition of phenol. From the results that were obtained, the optimum conditions were
found, such as the optimum temperature, pressure, pH and the amount of the initial
phenol. In addition, kinetic study was performed for the oxidation of benzene. Sorne of
the oxidation intermediates were identified and a simplified pathway for benzene
oxidation was proposed.
109

REFERENCES
1. Anderson, R. T.; Lovley, D. R. Ecology and biogeochemistry of in situ groundwater
bioremediation. Adv. Microb. Ecol., 1997, 15,289.
2. Annual book of ASTM standard, Water environmental technology, 2006, Il.02,
D1252, 38.
3. Baillod, C. R.; Faith, B. M.; Masi, O. Fate of specifie pollutants during wet oxidation
and ozonation. Environ. Progress 1982, 1 (3),217.
4. Baillod, C. R.; Lamparter, R. A.; Barna, B. A. Wet oxidation for industrial waste
treatment. Chem. Eng. Prog. 1985, 81 (3),52.
5. Banerjee, S; Yalkowsky, S. H.; Valvani, S. C. Water solubility and octanol/water
partition coefficients of organics. Limitations of the solubility-partition coefficient
correlation. Environ Sei Technol, 1980, 14, 1227.
6. Bhargava, S.K., Tardio, J., Prasad, J., Foger, K., Akolekar, D.B., and Grocott, S.C.,
Wet Oxidation and Catalytic Wet Oxidation.{ lnd. Eng. Chem. Res. 2006,
45 (4), 1221.
7. Birchmeier, M.J., Hill, c.G., Houtman, C.J., Atalla, R.H., Weinstock, LA., Enhanced
wet air oxidation: synergistic rate acceleration upon effluent recirculation. lnd. Eng.
Chem. Res.2000, 39, 55.
8. Chowdhury, A. K.; Copa, W. C. Wet air oxidation oftoxic and hazardous organics in
industrial wastewaters. lnd. Chem. Eng. 1986,28 (3), 3.
110

9. Christensen, T.; Kjeldsen, P.; Albrechtsen, H.; Heron, G.; Nielsen, P.; Bjerg, P;
Holm, P. Attenuation oflandfillleachate pollutant in aquifers. Crit. Rev. Environ.
Sei. Technol., 1994,24, 119.
10. Coates, J. D.; Chakraborty, R.; Lack, J. G.; O'Connor, S. M.; Cole, K. A.; Bender, K.
S.; Achenbach, L. A, Anaerobic benzene oxidation coupled to nitrate reduction in
pure culture by two strains of Dechloromonas, Nature, 2001, 411,1039.
Il. Collyer, M.J.; Kubes, G. J.; Berk, D. Catalytic wet oxidation of thermomechanical
pulping sludge. J. Pulp Pap. Sei. 1997,23, J522.
12. Earhart, J. P.; Won, K. W.; Wong, H. Y.; Prausnitz, J. M.; King, C. J. Recovery of
organic pollutants via solvent extraction. Chem. Eng. Progress 1977, 73 (5),67.
13. Emanuel, N. M.; Zaikov, G. E.; Maitus, Z. K. Oxidation of Organic Compounds.
Medium Effects in Radical Reactions; Pergamon Press: Oxford, D.K., 1984.
14. Fajerwerg, K.; Debellefontaine, H. Wet oxidation of phenol by hydrogen Peroxide
using heterogeneous catalysis Fe-ZSM-5: a promising catalyst. Appl. Catal. B 1996,
10, L229.
15. Fajerwerg, K.; Foussard, J. N.; Perrard, A; Debellefontaine, H. Wet oxidation of
phenol by hydrogen peroxide: The key role of pH on the catalytic behavior of Fe
ZSM-5. Water Sei. Technol. 1997,35 (4), 103.
16. Farhataziz, P. C.; Ross, A B. Selected specific rates of radicals of transients from
water in aqueous solutions. National Bureau of Standards, 1977, Washington, DC,
NSDRS-NBS59,.
17. Fisher, W. J. Oxidation of sewage with air at elevated temperatures. Water Res 1971,
5 (5), 187.
111
18. Foussard, J. N.; Debellefontaine, H.; Besombes-Vai1he, J. Efficient elimination of
organic liquid wastes: wet air oxidation. J Environ. Eng. (Reston, VA, US.) 1989,
115 (2), 367.
19. Friedman, A. A.; Smith, J. E.; DeSantis, J.; Ptak, T.; Ganley, R. C. Characteristics of
residues from wet air oxidation of anaerobic sludges. J Water Poilu Control Fed.
1988,60(11), 1971.
20. Fu, D., Chen, J., Liang, X., Wet air oxidation of nitrobenzene enhanced by phenol,
Chemosphere, 2005, 59, 905.
21. Glass, D. C.; Gray, C. N.; JoUey, D. J.; Gibbons, C.; Sim, M. R. Health Watch
exposure estimates: Do they underestimate benzene exposure? Chemico-Biological
Interactions, 2005, 153-154,23.
22. Greminger, D.C.; Burns, G.P.; Lynn, S.; Hanson D.N., King, C.J., Solvent extraction
of phenol from water. Ind. Eng. Chem. Process Des. Dev. 1982, 21, 51.
23. IARC. Evaluation of the carcinogenic risk of chemicals to humans, Vol. 29. Benzene.
International Agency for research on cancer, Lyon, 1982.
24. Imamura, S. Catalytic and Noncatalytic Wet Oxidation. Ind. Eng. Chem. Res. 1999,
38 (5), 1743.
25. Imamura, S.; Fukuda, 1.; Ishida, S. Wet oxidation catalyzed by ruthenium supported
on cerium (IV) Oxides. Ind. Eng. Chem. Res. 1988,27 (4), 718.
26.lmamura, S; Fukuhara, M.; Kitao,T. Wet oxidation of amides, J Chem. Soc. Jpn.
1980b,270.
112
27. Imamura, S.; Rirano, A.; Kawabata, N. The wet oxidation of organic compounds
catalyzed by Co-Bi complex oxide. Bull. Chem. Soc. Jpn. 1982,55 (11), 3679.
28. Imamura, S.; Nakamura, M.; Kawabata, N.; Yoshida, J.; Ishida, S. Wet Oxidation of
Poly (ethylene glycol) Catalyzed by Manganese-Cerium Composite Oxide. lnd. Eng.
Chem. Prod. Res. Dev. 1986, 25 (1), 34.
29. Imamura, S.; Shimai, J.; Kitao, T. wet air oxidation of dyes. Mizu Shori Gijutsu
1980a, 21, 109.
30. Imamura, S.; Tonomura, Y.; Kawabata, N.; Kitao, T. Wet oxidation ofwater soluble
polymers. Bull Chem. Soc. Jpn. 1981, 54, 1548.
31. Imamura, S.; Tonomura, Y.; Terada, M.; Kito, T., Oxidation of oxygen containing
organic compounds in water. Mizu Shori Gijutsu 1979,20,317.
32. Ingale, M. N.; Joshi, J. B.; Mahajani, V. V.; Gada. M. K. Waste treatment of an
aqueous waste stream from a cyclohexane oxidation unit: A case study. Pro cess
Safety Environ. Protec!. 1996, 74 (4), 265.
33. Joglekar, R.S.; Samant, S.D.; Joshi, J.B. Kinetics of wet air oxidation of phenol and
substituted phenols Water Research, 1991,25 (2), 135.
34. Keen, R.; Baillod C. R. Toxicity to daphnia of the end products of wet oxidation of
phenol and substituted phenols. Water Res. 1985, 19 (6), 767.
35. Kindzierski, W. B.; Jackson, L. G., Evaluation of Canadian drinking water guidelines
using probability modeling of population exposure, 1998, 38 (6), 229.
113
36. Kolaczkowski, S. T.; Beltran, F. J.; McLurgh, D. B.; Rivas, F. J. Wet air oxidation of
phenol: Factors that may influence global kinetics. Proeess Safoty Environ. Proteet.
1997, 75 (B4), 257.
37. Krajnc, M.; Levec, J. On the kinetics of phenol oxidation in supercritical water.
AIChE J. 1996,42 1977.
38. Li, L., Chen, P., Gloyna, E., Generalized kinetic model for wet oxidation of organic
compounds. AIChE Journal, 1991, 37 (11), 1687.
39. Lin, S. H.; Chuang, T. S. Combined Treatment of Phenolic Wastewater by Wet Air
Oxidation and Activated Sludge. Toxieol. Environ. Chem. 1994,44,243.
40. Lin, S.S.; Chang, D.J.; Wang, C.; Chen, C. C. Catalytic wet oxidation of phenol by
Ce02 catalyst - effect ofreaction conditions. Water Res. 2003, 37, 793.
41. Lin, S.H.; Ho, S.J.; Wu, c.L., Kinetic and performance characteristics of wet air
oxidation ofhigh-concentration wastewater., Ind Eng. Chem. Res., 1996,35 (1), 307.
42. Lin, S. H.; Wu, Y. F. Catalytic wet air oxidation of phenolic wastewaters. Environ.
Teehnol. 1996, 17 (2), 175.
43. Lovley, D. R. Potential for anaerobic bioremediation of BTEX lU petroleum
contaminated aquifers. J Ind Mierobiol., 1997, 18, 75.
44. Luck, F. A review of lndustrial Catalytic Wet air oxidation processes. Catal. Today
1996,27(1-2), 195.
45. Mantzavinos, D.; Hellenbrand, R.; Livingston, A. G.; Metcalfe, 1. S. Wet Oxidation
as a Pretreatment Method for Wastewaters Contaminated by Bioresistant Organics.
Water Sei. Teehnol. 1997,36 (2-3), 109.
114

46. Merchant, K. P. Studies in Heterogeneous Reactions. Ph.D. Dissertation, Department
ofChemical Technology, University of Bombay, India, 1992.
47. Metcalf & Eddy, Inc., Wastewater Engineering: Treatment, Disposai and Reuse.
(3rd. ed.), McGraw-Hill, New York 1991.
48. Mishra, V. S.; Mahajani, V. V.; Joshi, J. B. Wet Air Oxidation (Review). lnd. Eng.
Chem. Res. 1995,34 (1), 2.
49. Patterson, D. A.; Metcalfe, I. S.; Xiong, F.; Livingston, A. G. Wet Oxidation of
Linear Alkylbenzene Sulfonate 2. Effect of pH. lnd. Eng. Chem. Res. 2001, 40(23),
5517.
50. Peoples, R.F.; Krishnan, P.; Simonsen, R.N., Nonbiological treatment of refinery
wastewater. J water pollution control Fed 1972,44 (6), 2120.
51. Pintar, A.; Levec, J, Catalytic Liquid phase oxidation of phenol aqueous solutions. A
kinetic investigation. lnd. Eng. Chem. Res., 1994,33(12),3070.
52. Portela Miguélez, J.R.; Lopez BernaI, J.; Nobot Sanz, E.; Martinez de la Ossa, E.
Kinetics ofwet air oxidation of phenol. Chem. Eng. J 1997,67(2), 115.
53. Rivas, F. Javier; Beltnin, Fernando J.; Carvalho, Fatima; Alvarez, Pedro M. Oxone
Promoted Wet Air Oxidation of Landfill Leachates. lnd. Eng. Chem. Res., 2005,44
(4), 749
54. Rivas, F. J.; Kolaczkowski, S. T.; Beltran, F. J.; McLurgh, D. B. Development of a
model for the wet air oxidation of phenol based on a free radical mechanism. Chem.
Eng. Sei. 1998, 53 (14), 2575.
115

55. Rivas, F. Javier; Kolaczkowski, Stan T.; Beltran, Fernando J.; McLurgh, David B.
Hydrogen peroxide promoted wet air oxidation of phenol: influence of operating
conditions and homogeneous metal catalysts. Journal of Chemical Technology &
Biotechnology, 1999, 74(5), 390.
56. Robert, R.; Barbati, S.; Ricq, N.; Ambrosio, M. Interrnediates in wet oxidation of
cellulose: identification of hydroxyl radical and eharaeterization of hydrogen
peroxide. Water Res. 2002,36(19),4821.
57. Standard method for exarnination of water and wastewater, 21 st edition, 2005,
Chemieal Oxygen Demand (5220),5-14.
58. Shende, R. V.; Levee, J. Wet Oxidation Kinetics of Refraetory Low Moleeular Mass
Carboxylic Aeids. lnd. Eng. Chem. Res. 1999,38(10),3830.
59. Shende, R. V.; Mahajani, V. V. Kineties of Wet Oxidation of Forrnic Acid and
Aeetie.lnd. Eng. Chem. Res. 1997,36(11),4809.
60. Tardio, J. Low temperature wet oxidation and catalytic wet oxidation of specifie
organie eompounds in highly alkaline solution (synthetic Bayer liquor), Ph.D.
Dissertation, Department of Applied Chemistry, RMIT University, Melbourne,
Australia, 2002.
61. Tardio, James; Bhargava, Suresh K.; Eyer, Sharon; Akolekar, Deepak B. Low
temperature wet oxidation of sodium salts of low molecular weight mono- and
dicarboxylie aeids in synthetic Bayer liquor. lnd. Eng. Chem. Res. 2004,43 (3),669.
62. Thomsen, A. B. Degradation of quinoline by wet oxidation-kinetic aspects and
reaction mechanisms. Water Res. 1998,32 (1), 136.
116

63. Tromans, Desmond. Temperature and pressure dependent solubility of oxygen in
water: a thermodynamic analysis. Hydrometallurgy. 1998,48(3),327.
64. Vaidya, P. D.; Mahajani, V. V. Insight into sub-critical wet oxidation of phenol. Adv.
Environ. Res. 2002, 6(4),429.
65. Vicente, J., Diaz, M. Thiocyanate/phenol wet oxidation interactions. Environ. Sei.
Technol. 2003, 37(7), 1457.
66. Vicente, J.; RosaI, R.; Diaz, M. Noncatalytic Oxidation of Phenol ln Aqueous
Solutions. lnd. Eng. Chem. Res. 2002,41 (1),46.
67. Wakabayashi, T.; Okuwaki, A. Oxidation of coals in liquid phases. Kinetics of the
base-catalyzed oxidation of acetate ion by oxygen at elevated temperatures. Bull.
Chem. Soc. Jpn. 1988, 61 (12), 4329.
68. Ward, D. M.; Atlas, R. M.; Boehm, P. D.; Calder, J. A., Microbial biodegradation and
chemical evolution of oïl from the Amoco spill, AMBlO, 1980, 9 (6), 277.
69. Willms R.S.; Balinsky A. M.; Reible D.D.; Wetzel, D. M.; Harrison D.P. Analysis of
high-pressure, multiphase reactor design Environ. Prog. 1985, 4, 131.
70. Willms, R. S.; Balinsky, A. M.; Reible, D. D.; Wetzel, D. M.; Harrison, D. P.
Aqueous-Phase Oxidation: The Intrinsic Kinetics of Single Organic Compounds. lnd.
Eng. Chem. Res. 1987,26 (1), 148.
71. Willms, R. S., Reible, D. D., Wetzel, D.M., Harrison, D.P., Aqueous-phase oxidation:
rate enhancement studies. lnd. Eng. Chem. Res., 1987,26,606.
72. Wu, Y. C.; Hao, O. J.; Olmstead, D. G.; Hsieh, K. P.; Scholze, R. J. Wet air oxidation
ofanaerobically digested sludge. J. Water Poll Control Fed. 1987,59 (1), 39.
117

73. Yasaka, Yoshiro; Yoshida, Ken; Wakai, Chihiro; Matubayasi, Nobuyuki; Nakahara,
Masaru. Kinetic and Equilibrium Study on Formic Acid Decomposition in Relation
to the Water-Gas-Shift Reaction. Journal of Physical Chemistry A, 2006, 110 (38),
11082.
118
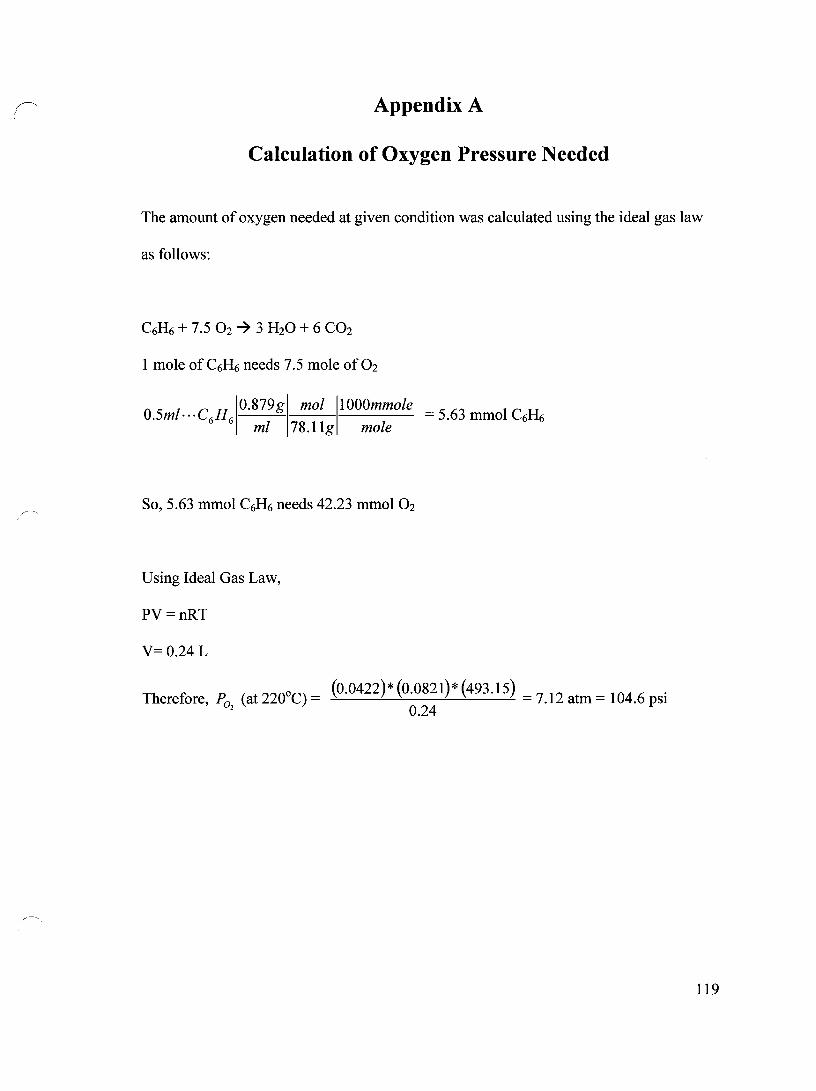
Appendix A
Calculation of Oxygen Pressure N eeded
The amount of oxygen needed at given condition was calculated using the ideal gas law
as follows:
1 mole of C6H6 needs 7.5 mole of 02
0.5ml ... C6H6IO.879g mol 11000mmole = 5.63 mmol C6H6
ml 78.11g mole
So, 5.63 mmol C6H6 needs 42.23 mmol O2
Using Ideal Gas Law,
PV=nRT
V= 0.24 L
Therefore, P02 (at 220°C) = (0.0422)* (0.0821)* (493.15) = 7.12 atm = 104.6 psi 0.24
119

Appendix B
Oxygen Solubility in Water
In order to calculate the amount of oxygen dissolved in water the following equation
that was developed by Tromans (63) was used:
{ 0.046T2 + 203.35Tlll(T /298) -(299.378+0.092T)(T -298)-20.591 X 10³
} C =P exp
aq °2 (8.3144)T
Where:
Caq: Molal concentration of dissolved O2 (mol! kg H20).
P02: Oxygen partial pressure (atm).
T: Temperature CK)
120

Appendix C
Calculation of TheoreticaI Amount of Carbon Dioxide
Generated
Since the benzene is not totally converted to H20 and CO2 and since acetic acid was
determined in the final product, the following equations were used to calculate the total
amount of carbon dioxide during the oxidation ofbenzene:
C6H6 + 5.5 02 -7 H20 + 4 C02 + CH3COOH
CH3COOH + 2 O2 -7 2 C02 + 2 H20
From the first equation it can be seen that
1 mole C6H6 produces 4 moles of C02
And 1 mole of C6H6 produces 1 mole of CH3COOH
'However, it can be seen from the second equation that
1 mole of CH3COOH produces 2 moles of C02.
The following results were obtained at 260°C and 1.38 MPa of oxygen pressure
Time mmol C6H6/L mmol CH3COOH
Original sample 3.83 0
Final product After 0.07 0.59
120 min
121
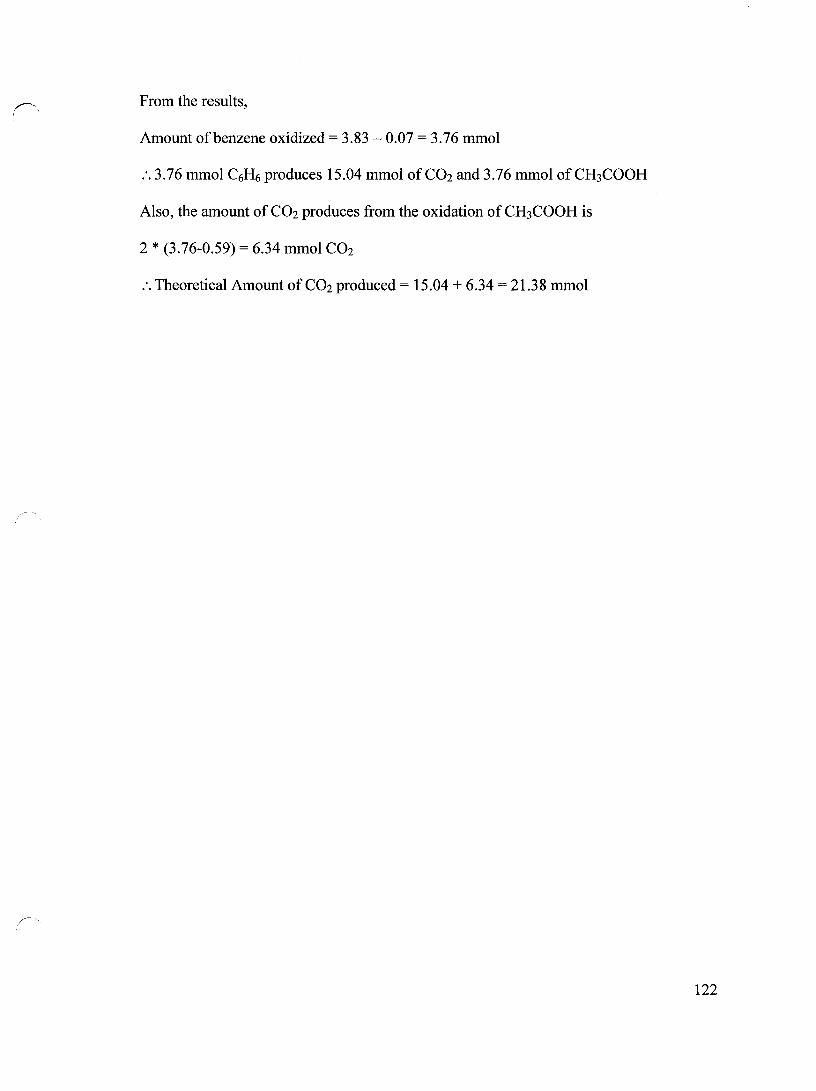
From the results,
Amount ofbenzene oxidized = 3.83 - 0.07 = 3.76 mmol
:.3.76 mmol C6H6 produces 15.04 mmol ofC02 and 3.76 mmol ofCH3COOH
Also, the amount of CO2 produces from the oxidation of CH3COOH is
2 * (3.76-0.59) = 6.34 mmol C02
:. Theoretical Amount ofC02 produced = 15.04 + 6.34 = 21.38 mmol
122