Determine steam properties and dryness fraction - Department ...
Evaluation of structural chemistry and isotopic signaturesof refractory soil organic carbon fraction isolated by wetoxidation methods
Sindhu Jagadamma Æ Rattan Lal Æ David A. N. Ussiri ÆSusan E. Trumbore Æ Silvia Mestelan
Received: 25 August 2008 / Accepted: 7 September 2009 / Published online: 22 September 2009
� Springer Science+Business Media B.V. 2009
Abstract Accurate quantification of different soil
organic carbon (SOC) fractions is needed to under-
stand their relative importance in the global C cycle.
Among the chemical methods of SOC fractionation,
oxidative degradation is considered more promising
because of its ability to mimic the natural microbial
oxidative processes in soil. This study focuses on
detailed understanding of changes in structural chem-
istry and isotopic signatures of SOC upon different
oxidative treatments for assessing the ability of these
chemicals to selectively isolate a refractory fraction of
SOC. Replicated sampling (to *1 m depth) of pedons
classified as Typic Fragiudalf was conducted under
four land uses (woodlot, grassland, no-till and con-
ventional-till continuous corn [Zea mays L.]) at
Wooster, OH. Soil samples (\2 mm) were treated
with three oxidizing agents (hydrogen peroxide
(H2O2), disodium peroxodisulfate (Na2S2O8) and
sodium hypochlorite (NaOCl)). Oxidation resistant
residues and the bulk soil from A1/Ap1 horizons of
each land use were further analyzed by solid-state 13C
nuclear magnetic resonance (NMR) spectroscopy and
accelerator mass spectrometry to determine structural
chemistry and 14C activity, respectively. Results
indicated that, oxidation with NaOCl removed signif-
icantly less SOC compared to Na2S2O8 and H2O2. The
NMR spectra revealed that NaOCl oxidation prefer-
entially removed lignin-derived compounds at 56 ppm
and at 110–160 ppm. On the other hand, the SOC
resistant to Na2S2O8 and H2O2 oxidation were
enriched with alkyl C groups, which dominate in
recalcitrant macromolecules. This finding was corrob-
orated by the 14C activity of residual material, which
ranged from -542 to -259% for Na2S2O8 resistant
SOC and -475 to -182% for H2O2 resistant SOC as
compared to relatively greater 14C activity of NaOCl
resistant residues (-47 to 61%). Additionally, H2O2
treatment on soils after light fraction removal was
more effective in isolating the oldest (14C activity of
-725 to -469%) SOC fraction. The D14C signature of
SOC removed by different oxidizing agents, calcu-
lated by mass balance, was more or less similar
irrespective of the difference in labile SOC removal
efficiency. This suggests that SOC isolated by many
fractionation methods is still a mixture of much
younger and older material and therefore it is very
important that the labile SOC should be completely
removed before measuring the turnover time of stable
and refractory pools of SOC.
S. Jagadamma (&) � R. Lal � D. A. N. Ussiri
Carbon Management and Sequestration Center, School of
Environment and Natural Resources, The Ohio State
University, 210 Kottman Hall, 2021 Coffey Road,
Columbus, OH 43210, USA
e-mail: [email protected]
S. E. Trumbore
Earth System Science, University of California, Irvine,
CA 92697, USA
S. Mestelan
College of Agriculture, Universidad Nacional, Centro de
la Provincia de Buenos Aires, Azul, Argentina
123
Biogeochemistry (2010) 98:29–44
DOI 10.1007/s10533-009-9374-0

Keywords 13C NMR � 14C age �Labile carbon � Land uses � Stable carbon �Wet oxidation
Abbreviations
ANOVA Analysis of variance
CT Conventional-till
CPMAS Cross polarization magic angle spinning
Na2S2O8 Disodium peroxodisulfate
HCl Hydrochloric acid
HF Hydrofluoric acid
H2O2 Hydrogen peroxide
LSD Least significant difference
NT No-till
NMR Nuclear magnetic resonance
OM Organic matter
SPIDER Saturation pulse induced dipolar
exchange with recoupling
NaHCO3 Sodium bicarbonate
NaCl Sodium chloride
NaOCl Sodium hypochlorite
SOC Soil organic carbon
Introduction
Soil organic carbon (SOC) is the third largest global
C pool comprising 1,550 PgC in the top 1 m of soil
(Batjes 1996; Lal 2007). Transferring atmospheric
CO2 into the SOC pool is an important option to help
mitigate global warming. The SOC exists as a
heterogeneous mixture of different fractions with
turnover times ranging from minutes to millennia.
The biological stability of SOC is influenced by
several factors including chemical structure of SOC,
soil environmental factors including temperature,
moisture and aeration, and soil physical and chemical
properties (Krull et al. 2003). Mechanisms of SOC
stabilization can be summarized as chemical recalci-
trance of the organic matter (OM), physical protec-
tion as a result of inaccessibility to microbes and/or
enzymes due to encapsulation of OM into aggregates,
and increased stability due to interaction of SOC with
mineral matrices (Sollins et al. 1996; Baldock and
Skjemstad 2000). These mechanisms, combined with
the input-loss ratio of C, determine the turnover rates
and subsequent pools of SOC in soils. The total SOC
pool can be compartmentalized into different frac-
tions or pools of varying stability. Unfortunately,
different authors use different terminology to
describe these SOC pools (Krull et al. 2003). In this
study, the term labile pool refers to easily mineral-
izable fraction with rapid turnover time ranging from
months to years (Krull et al. 2003). The term stable
pool is used to describe an intermediate fraction with
turnover rates in the range of decadal to centennial
time scale (Bruun et al. 2007; Baisden and Amundson
2003). The refractory pool refers to a fraction that
persists in soil for long time and has turnover time of
thousands of years (Krull et al. 2003). Global
estimates of rapidly cycling SOC pools range from
250 to 530 Pg C (Trumbore 1997), suggesting that
major part of the global SOC pool is assigned to the
stable and refractory fractions. Quantification of
different SOC pools is important for understanding
C dynamics and for increasing the accuracy of model
prediction. The turnover rates of different SOC
fractions have been successfully calculated by radio-
carbon technique, if samples at various times before
and after the peak atmospheric nuclear weapon
testing are available (Trumbore 1997; Baisden et al.
2002). The d13C values of soil organic matter (SOM)
can also be used as a tracer to study the SOC
dynamics in areas where C3 vegetation was replaced
by C4 plants or vice versa (e.g., Balesdent et al.,
1987). However, there is no consensus in the
literature on the appropriate chemical treatment for
the experimental isolation of SOC fractions with
distinct turnover rates.
Over the years, an array of physical and chemical
fractionation protocols have been used for separating
the SOC fractions with varying stability. Among the
chemical methods, acid hydrolysis (Trumbore and
Zheng 1996; Leavitt et al. 1996; Paul et al. 1997;
Silveira et al. 2008), and chemical oxidation by
various oxidizing agents including hydrogen peroxide
(H2O2) (Theng et al. 1999; Eusterhues et al. 2005),
disodium peroxodisulphate (Na2S2O8) (Eusterhues
et al. 2003; Lorenz et al. 2006), and sodium hypo-
chlorite (NaOCl) (Kleber et al. 2005; Siregar et al.
2005; Zimmermann et al. 2007) have been used
frequently. Both acid hydrolysis and chemical oxida-
tion preferentially remove labile organic compounds
such as proteins, nucleic acids, and polysaccharides
and retain relatively stable SOC fraction that is
enriched in alkyl and aromatic C components (Leavitt
30 Biogeochemistry (2010) 98:29–44
123
et al. 1996; Paul et al. 2001; Mikutta et al. 2006).
Ultimately, the residue remained after both acid
hydrolysis and chemical oxidation is a heterogeneous
mixture of different C inputs. However, chemical
oxidation causes changes in SOC composition sim-
ilar to that observed during natural microbial oxida-
tive processes (Cuypers et al. 2002; Eusterhues et al.
2003) and is more efficient at preferentially remov-
ing young SOC inputs than acid hydrolysis (Bruun
et al. 2007).
Though chemical oxidation procedures are prom-
ising methods of separating SOC fractions with
distinct stability, the relative efficiency of different
oxidizing agents in separating stabilized SOC is not
known. Most studies determine the efficiency of
oxidizing agents in separating SOC fractions based
on the content of residual OC remaining after
oxidation treatment. A few studies, which determined
mean 14C ages of oxidation-resistant OC showed a
wide variation of SOC age, ranging from modern to
several thousand years (e.g. Theng et al. 1992;
Balesdent 1996; Eusterhues et al. 2005; Kleber
et al. 2005). In addition, several studies (e.g. Bruun
et al. 2007; Helfrich et al. 2007; Favilli et al. 2008)
which compared the oxidation efficiency of different
chemicals in similar soil types and land uses have
produced contradictory results. Bruun et al. (2007)
oxidized soil samples (0–7.5 cm) from a similar soil
incubated with 14C-labelled barley (Hordeum vulg-
are L.) for 40 years (1964–2004) and 40 days
(1 June to 11 July, 2005) and found that both
Na2S2O8 and NaOCl are unlikely to isolate a stable
OC fraction as they consistently removed more
40-years-old C than 40-days-old C. Helfrich et al.
(2007) indicated that, among the several chemical
methods tested, Na2S2O8 and H2O2 were the most
efficient in isolating a refractory fraction of SOC.
According to Favilli et al. (2008), H2O2 was
superior to NaOCl in isolating the oldest and most
refractory SOC.
Since SOM contains multiple, and simple to
complex biomolecules with varying chemical nature
and function, a detailed understanding of the changes
in structural chemistry of SOM with different oxida-
tive treatments would be valuable for assessing the
ability of these oxidizing agents in selective removal
of labile SOC. The 13C nuclear magnetic resonance
(NMR) spectroscopy offers a unique opportunity to
examine the structural chemistry of SOC by
distributing the C among classes of compounds,
such as alkyl C, O/N-alkyl C, aromatic C, and
carboxyl C (Ussiri and Johnson 2007). During the
initial stages of SOC decomposition, O/N-alkyl C
(mostly derived from carbohydrates and proteins) is
selectively utilized by microbes followed by the
decomposition of aromatic C (derived from lignin
and phenols) (Baldock et al. 1997). As the degree of
decomposition progresses, the relative proportion of
alkyl C, which is dominantly present in aliphatic
macromolecules such as fats, waxes, resins, cutin and
suberin, increases (Baldock et al. 1992; Preston
1996). Thus, the alkyl C:O/N-alkyl C ratio, calculated
from 13C NMR data, has been used as an index for
estimating the biodegradability of SOC (Baldock and
Preston 1995). Another useful index is the %
aromaticity, which is the ratio of aromatic C (110–
160 ppm) to the sum of aromatic and total aliphatic C
(0–110 ppm) (Frund et al. 1994).
There are a few studies that have used NMR
spectroscopy to understand the structural composi-
tion of SOC resistant to chemical oxidation (Eus-
terhues et al. 2005; Mikutta et al. 2006). Moreover,
evaluation on how different oxidizing agents affect
the structural chemistry of oxidation resistant SOC
in similar soil types or land use regimes is
completely lacking. Therefore, the focus of this
study was to isolate SOC resistant to different
oxidizing agents (H2O2, Na2S2O8 and NaOCl) and
evaluate the changes in structural chemistry and
isotopic signatures (D14C, d13C) of the SOC resis-
tant to different oxidizing agents and their relative
implications as a refractory pool of SOC. The
specific objectives were to: (1) quantify the loss of
SOC upon oxidation in four land uses of a similar
soil type, (2) compare the structural chemistry of
SOC before and after oxidation using solid-state13C-cross polarization magic angle spinning
(CPMAS) NMR spectroscopy, and (3) evaluate the
isotopic signatures as influenced by the oxidative
treatments.
Materials and methods
Site description
This study was conducted at the Ohio Agricultural
Research and Development Center in Wooster, Ohio,
Biogeochemistry (2010) 98:29–44 31
123
USA (40�480N, 82�000W). The soils of this site
belong to Wooster series (mixed, mesic, Typic
Fragiudalf) with silt-loam texture (USDA-SCS
1984). The parent material is low-lime glacial till
with a discontinuous loess mantle of up to 51 cm in
thickness. These soils are well drained and contain a
fragipan at a depth of 50–90 cm (USDA-SCS, 1984).
The native vegetation was a continuous cover of
mixed, deciduous hardwood forest. Relic forest
remnants occur along creeks and as small woodlots
(USDA-SCS 1984). The mean annual temperature of
the site is 9.1�C with 173 frost-free days occurring
each year and the mean annual precipitation is
905 mm (Dick et al. 1998). The study included
woodlot, grassland and agricultural land uses. The
woodlot is part of the remnant hardwood forest,
which dominated the area prior to land clearing for
agriculture in the mid 1830s. The agricultural site is
part of a long-term tillage experiment (Triplett–van
Doren plots) initiated in 1962 to study the effects of
tillage and crop sequences (van Doren et al. 1976).
This site was maintained under grass meadow for
6 years before starting the experiment. For the
present study, no-till (NT) and conventional-till
(CT) management plots under continuous corn (Zea
mays L.) were sampled. Typically, NT is defined as
complete elimination of pre-plant tillage. The seeds
in the NT plots were sown using a planter with single
coulter to cut through the crop residues and loosen
the soil ahead of standard planter units. The CT
consisted of one moldboard plowing to a depth of
20–25 cm in spring of each season followed by two
10-cm deep secondary operations (disking, field
cultivator) prior to planting. The CT treatment resulted
in a complete soil surface inversion and nearly 100%
incorporation of crop residues. Fertilizer was applied
in the spring of every year based on soil test
recommendations, with the same rates of N, P and K
applied to both the tillage treatments. The fertilizer
materials were broadcasted on soil surface for NT and
incorporated for CT plots. Lime was broadcasted in the
fall as required to maintain pH close to 6.0 in the
Ap horizon. Herbicide types and rates were slightly
varied over the years. The cumulative amount of
herbicide application was reported as 119 kg a.i. ha-1
for NT and 111 kg a.i. ha-1 for CT soils (Dick
1984). The woodlot and grassland areas are located
very close to the Triplett–van Doren plots on the
similar soil type.
Soil sampling and processing
Three replicates of horizonwise samples were col-
lected from the pits dug down to the glacial till in
each of the four land uses during summer 2005. For
this study, five horizons (Ap1, Ap2, Ap3, Bt1 and
Btx1) were selected for all the land uses except
woodlot, where horizonation was slightly different
and samples of A1, A2, E and Bt1 horizons were
selected. No Btx horizon was present in the soil
profile of woodlot. In addition, woodlot profile
contained an E horizon, instead of Ap3 horizon in
other land uses (Table 1). The samples were air dried,
gently ground with a wooden roller, and sieved
through a 2-mm sieve. Triplicate samples per treat-
ment for initial C and N analyses and chemical
oxidation were roller ground to pass through a 250-
lm sieve.
Soil analyses
Soil pH was determined in 1:2 soil weight to water
volume ratio suspension using pH meter (Thomas
1996) and proportion of clay was calculated from the
textural analysis conducted by the hydrometer
method (Gee and Or 2002). The procedure for
H2O2 oxidation was slightly modified from Helfrich
et al. (2007). Briefly, 1 g of soil was wetted with
10 ml distilled water for 10 min. Then, 30 ml of 10%
H2O2 was added and at the end of sometimes intense
initial reaction at room temperature, the oxidation
was performed at 50�C in a water bath. After
2–3 days when the frothing subsided completely,
the suspension was centrifuged at 25009g for 15 min
and the supernatant was decanted. Oxidation with
H2O2 was repeated two more times. The samples
were then washed three times with 40 ml deionised
water and freeze-dried.
For Na2S2O8 oxidation, 0.5 g of soil was first
dispersed in 250 ml distilled water. Then, 20 g
Na2S2O8 buffered with 22 g sodium bicarbonate
(NaHCO3) was added and allowed to react for 2 days
at 80�C in a water bath. After oxidation, the
suspension was centrifuged at 25009g for 15 min
and the supernatant was decanted. The samples were
washed three times with 40 ml deionised water and
freeze dried (Helfrich et al. 2007). The Na2S2O8
oxidized samples were then acid washed to remove
the traces of carbonate remaining from the NaHCO3
32 Biogeochemistry (2010) 98:29–44
123
added during the oxidation process. Briefly, 3 g of
finely ground (\250 lm), Na2S2O8 resistant residue
were treated with 30 ml of 1 mol l-1 HCl for 24 h
with occasional stirring (Ussiri and Lal 2008). After
removing the supernatant by centrifugation, the
residue was washed with deionized water six times
and freeze dried.
Oxidation with NaOCl was achieved by treating
5 g of soil with 50 ml of 6% NaOCl, adjusted to pH 8
with concentrated hydrochloric acid (HCl). After 6 h
at 25�C, the suspension was centrifuged and the
supernatant was decanted. The extraction with NaO-
Cl was repeated two more times. Afterwards, the
samples were washed twice with 50 ml of 1 M
sodium chloride (NaCl), three times with deionised
water, and freeze-dried (Helfrich et al. 2007).
Concentrations of total C and N in soil samples
before and after oxidation were measured by the dry
combustion method (Vario Max CN Analyzer, Ele-
mentar GmbH, Hanau, Germany). The SOC was
assumed to be equal to the total C since inorganic C
concentrations were negligible and soil pH was\6.6.
The relative change in C:N ratios before and after
oxidative treatments was calculated as a percentage
(Schmidt and Gleixner 2005):
Relative change in C:N ratio
¼ 100 � ðC:Nafter oxidation
� C: Nbefore oxidationÞ=ðC:Nbefore oxidationÞ:
Solid-state 13C-CPMAS-NMR analysis
A composite sample from the three replications of
surface soil (A1/Ap1 horizon) before and after the
oxidative degradation was analyzed for chemical
composition using solid-state 13C-CPMAS-NMR
spectroscopy. Prior to the analysis, the oxidized
samples were treated with 10% hydrofluoric acid
(HF) to remove paramagnetic materials and to con-
centrate OC through dissolution of the mineral matrix
(Schmidt et al. 1997; Kiem et al. 2000). This was
achieved by treating 10 g of oxidized soil with 50 ml
of 10% HF in a polyethylene bottle. The suspension
was shaken horizontally for approximately 12 h. After
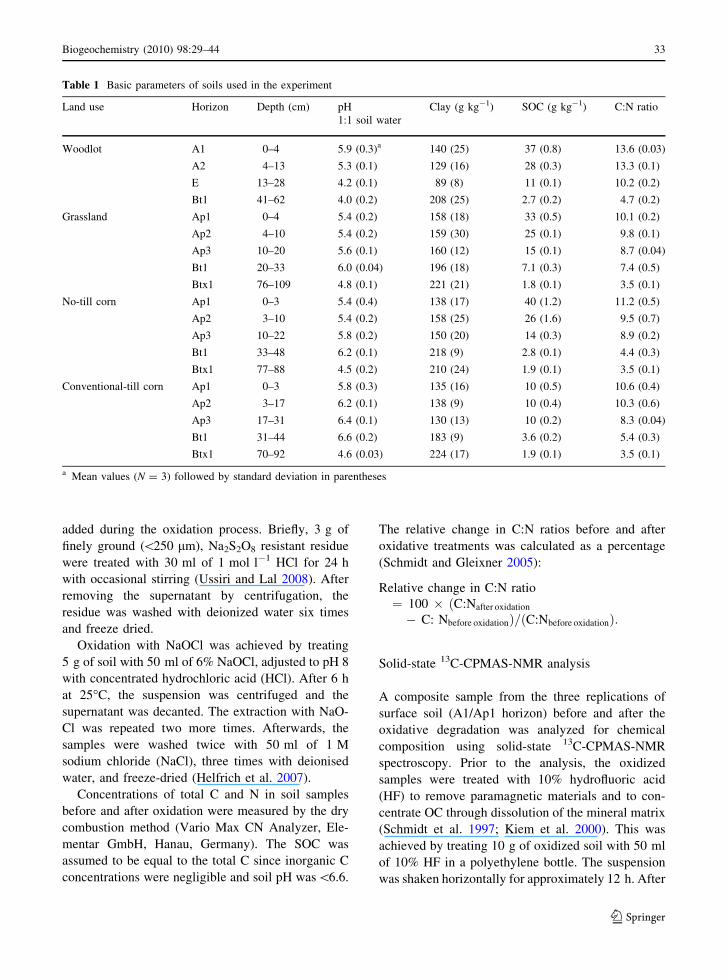
Table 1 Basic parameters of soils used in the experiment
Land use Horizon Depth (cm) pH
1:1 soil water
Clay (g kg-1) SOC (g kg-1) C:N ratio
Woodlot A1 0–4 5.9 (0.3)a 140 (25) 37 (0.8) 13.6 (0.03)
A2 4–13 5.3 (0.1) 129 (16) 28 (0.3) 13.3 (0.1)
E 13–28 4.2 (0.1) 89 (8) 11 (0.1) 10.2 (0.2)
Bt1 41–62 4.0 (0.2) 208 (25) 2.7 (0.2) 4.7 (0.2)
Grassland Ap1 0–4 5.4 (0.2) 158 (18) 33 (0.5) 10.1 (0.2)
Ap2 4–10 5.4 (0.2) 159 (30) 25 (0.1) 9.8 (0.1)
Ap3 10–20 5.6 (0.1) 160 (12) 15 (0.1) 8.7 (0.04)
Bt1 20–33 6.0 (0.04) 196 (18) 7.1 (0.3) 7.4 (0.5)
Btx1 76–109 4.8 (0.1) 221 (21) 1.8 (0.1) 3.5 (0.1)
No-till corn Ap1 0–3 5.4 (0.4) 138 (17) 40 (1.2) 11.2 (0.5)
Ap2 3–10 5.4 (0.2) 158 (25) 26 (1.6) 9.5 (0.7)
Ap3 10–22 5.8 (0.2) 150 (20) 14 (0.3) 8.9 (0.2)
Bt1 33–48 6.2 (0.1) 218 (9) 2.8 (0.1) 4.4 (0.3)
Btx1 77–88 4.5 (0.2) 210 (24) 1.9 (0.1) 3.5 (0.1)
Conventional-till corn Ap1 0–3 5.8 (0.3) 135 (16) 10 (0.5) 10.6 (0.4)
Ap2 3–17 6.2 (0.1) 138 (9) 10 (0.4) 10.3 (0.6)
Ap3 17–31 6.4 (0.1) 130 (13) 10 (0.2) 8.3 (0.04)
Bt1 31–44 6.6 (0.2) 183 (9) 3.6 (0.2) 5.4 (0.3)
Btx1 70–92 4.6 (0.03) 224 (17) 1.9 (0.1) 3.5 (0.1)
a Mean values (N = 3) followed by standard deviation in parentheses
Biogeochemistry (2010) 98:29–44 33
123
centrifugation, the supernatant was removed. The HF
treatment was repeated four times. Finally, the residue
was washed three times with deionised water and
freeze dried.
Solid-state 13C-CPMAS-NMR analyses were con-
ducted at the Department of Chemistry, Ohio State
University with a Bruker DSX 300 spectrometer
operating at a 13C resonance frequency of
75.48 MHz. Samples were packed into a 4 mm
(outside diameter) zirconium rotor with a Kel-F�
cap and spun at a frequency of 10 kHz using a
contact time of 1.5 ms and a recycle delay time of
1 s. In order to obtain the NMR spectra with an
acceptable signal to noise ratio, the unoxidized
samples and NaOCl resistant residues required
approximately 65,000 scans for a period of 18 h,
and the H2O2 and Na2S2O8 resistant residues required
approximately 1,46,600 scans for 42 h. The spectra
were divided into four major chemical shift regions,
representing alkyl C (0–45 ppm), O/N-alkyl C
(45–110 ppm), aromatic C (110–160 ppm) and car-
boxyl C (160–220 ppm). The relative intensities of
the chemical shift regions were determined by the
integration of 13C-CPMAS-NMR spectra over given
chemical shift ranges after phase and baseline
corrections. Chemical shift assignments were exter-
nally referenced to the adamantine resonance at
29.5 ppm.
Isotopic measurements
The 14C activity of a composite sample from three
replicates of surface soil (A1/Ap1 horizon) before
and after oxidation was measured at W.M. Keck
Carbon Cycle Accelerator Mass Spectrometer facility
at University of California-Irvine. The untreated and
oxidized samples containing approximately 1 mg of
C were combusted at 900�C to produce CO2 and the
evolved CO2 was cryogenically purified, reduced to
graphite using sealed zinc tube reduction and ana-
lyzed for radiocarbon content (Xu et al. 2007;
Nowinski et al. 2008). Radiocarbon data are reported
as D14C, which is the fractional deviation, in parts per
thousand (%), of the 14C/12C ratio of sample from
that of a standard of fixed isotopic composition (0.95
times the activity of an oxalic acid standard (OX1) in
1950, which is normalized to a d13C of -19%(Stuiver and Polach 1977):
D14C ¼ ðF14C � exp ð�k14C � ðy � 1950ÞÞ� 1Þ � 1000
where,
F14C ¼
14C12Cþ 13C
h isample
14C12Cþ 13C
h iOXI
k14C, radioactive decay constant for 14C, equal to
1/8,267 year-1; y = year of 14C measurement.
The D14C values are corrected to a d13C value of
-25% to account for the assumption that plants
discriminate twice as much against 14C as they do
against 13C (Stuiver and Polach 1977; Castanha et al.
2008). Negative D14C values indicate the predomi-
nance of SOC old enough for radioactive decay of14C (half-life = 5,730 years) to have occurred and
positive D14C values indicate the presence of bomb14C produced by atomic weapons testing during
1960s.
The radiocarbon age of the sample was calculated
from the F14C and Libby mean life of radiocarbon
(8,033 years) by the expression,
Radiocarbon age ðyears BPÞ ¼ �8; 033 ln ðF14CÞ
BP, means years before 1950, as the activity of OX1
standard is defined for 1950.
An aliquot of the purified CO2 obtained from
combustion samples used for the 14C analyses was
placed in a He-filled vial and analyzed for 13C using a
Gas Bench II interface coupled to a Delta Plus
continuous flow isotope ratio mass spectrometer (Xu
et al. 2007). The 13C data are expressed as d13C (%):
d13C ¼ 13C=12Csample � 13 C=12
Cstandard
� �=
13C=12Cstandard
� �� 103
Mass balance calculations
The percent of the original SOC that is retained after
oxidation was calculated based on the following equation:
% SOC in residue ¼ ðResidue wt:Þ ð% SOCresidueÞðOriginal soil wt:Þ ð% SOCsoilÞ
The radiocarbon signature of SOC removed by oxida-
tion is derived from the mass balance of SOC and 14C:
34 Biogeochemistry (2010) 98:29–44
123
A similar equation was used to calculate the d13C of
SOC removed by oxidation.
Density fractionation
The bulk soil samples from the surface horizon
(A1/Ap1) of four land uses were subjected to a density
fractionation to separate the light fraction (LF) from
heavy fraction (HF) (Golchin et al. 1994; John et al.
2005). Ten grams of soil was placed in a centrifugation
tube and 40 ml of sodium polytungstate (SPT) solution
with a density of 1.6 g cm-3 (Sometu, Berlin, Ger-
many) was added. The tubes containing the soil-SPT
mixture were shaken in a reciprocating shaker at
300 rpm for 15 min. After sedimentation for 30 min,
the solution was centrifuged at 51009g for 30 min.
The supernatant with floating LF was filtered using
Millipore AP20 glass-fiber filter under vacuum. Both
LF and the HF were washed thoroughly with deionised
water and oven dried at 50�C. Subsamples of LF and
HF from each land use were separately subjected to
chemical oxidation process.
Statistical analysis
The analysis of variance (ANOVA) for testing the
difference among the chemical oxidation methods for
SOC concentration within a horizon of each land use
was computed using PROC GLM (fixed effects model)
of SAS (SAS Institute Inc. 2002). The statistical
significance was evaluated at the P B 0.05 level and
the mean effects were separated using the F protected
least significant difference (LSD) test.
Results and discussion
Depth distribution of soil organic carbon and C:N
ratio
The SOC concentration within the selected horizons
ranged from 2.7 to 37 g kg-1 in woodlot, 1.8 to
33 g kg-1 in grassland, 1.9 to 40 g kg-1 in NT corn
and 1.9 to 10 g kg-1 in CT corn (Table 1). Among
the horizons, the SOC concentration was the highest
in A1/Ap1 horizon for all land uses, where C addition
from plant litter was the highest (Jobbagy and
Jackson 2000). A sharp decrease in SOC concentra-
tion with depth was observed in all land uses except
CT corn. The uniform SOC concentration from Ap1
to Ap3 horizons of CT corn is probably due to the
incorporation of crop residues by tillage operations.
Soil C:N ratios were also varied among different
horizons, ranging from 4.7 to 13.6 in woodlot, 3.5 to
10.1 in grassland, 3.5 to 11.2 in NT corn and 3.5 to
10.6 in CT corn (Table 1). Narrowing of C:N ratios
with depth, consistent among land uses, provided an
indication that SOM in subsoil is probably more
stabilized than that in surface soil (Kramer et al.
2003).
Soil organic carbon resistant to chemical
oxidation
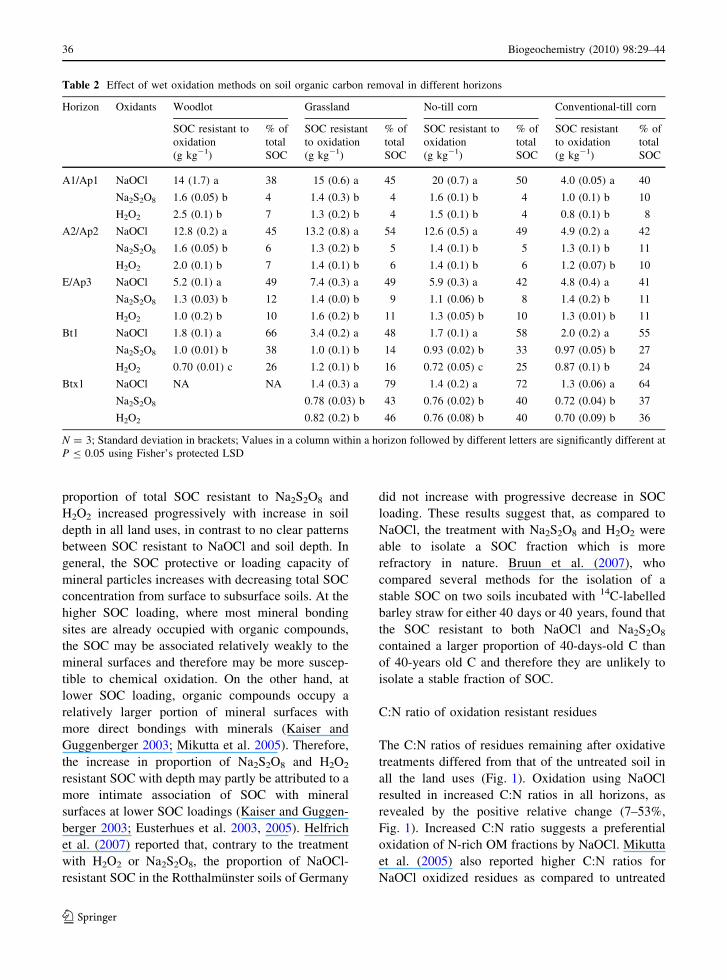
The amount of SOC resistant to oxidation signifi-
cantly differed among oxidizing agents in all hori-
zons of the four land uses (Table 2). Among the land
uses, SOC resistant to NaOCl ranged from 38 to 50%
of total SOC in A1/Ap1 horizon, 42 to 54% in A2/
Ap2 horizon, 41 to 49% in E/Ap3 horizon, 48 to 66%
in Bt1 horizon and 64 to 79% in Btx1 horizon; SOC
resistant to Na2S2O8 ranged from 4 to 10% in A1/Ap1
horizon, 5 to 11% in A2/Ap2 horizon, 8 to 12% in E/
Ap3 horizon, 14 to 38% in Bt1 horizon and 37 to 43%
in Btx1 horizon; and SOC resistant to H2O2 ranged
from 4 to 8% in A1/Ap1 horizon, 6 to 10% in A2/Ap2
horizon, 10 to 11% in E/Ap3 horizon, 16 to 26% in
Bt1 horizon and 36 to 46% in Btx1 horizon. These
results indicate that, irrespective of soil horizons and
land uses, oxidation with NaOCl removed signifi-
cantly less SOC compared to Na2S2O8 and H2O2. The
SOC removal efficiency of Na2S2O8 and H2O2 were
generally similar except in Bt1 horizons of woodlot
soils, where H2O2 removed significantly higher
amount of SOC than Na2S2O8. In addition, the
D14Coxidized ¼100% � D 14Coriginal SOC �% SOC in residue � D14CresidueSOC
ð100% � % SOC in residueÞ
Biogeochemistry (2010) 98:29–44 35
123
proportion of total SOC resistant to Na2S2O8 and
H2O2 increased progressively with increase in soil
depth in all land uses, in contrast to no clear patterns
between SOC resistant to NaOCl and soil depth. In
general, the SOC protective or loading capacity of
mineral particles increases with decreasing total SOC
concentration from surface to subsurface soils. At the
higher SOC loading, where most mineral bonding
sites are already occupied with organic compounds,
the SOC may be associated relatively weakly to the
mineral surfaces and therefore may be more suscep-
tible to chemical oxidation. On the other hand, at
lower SOC loading, organic compounds occupy a
relatively larger portion of mineral surfaces with
more direct bondings with minerals (Kaiser and
Guggenberger 2003; Mikutta et al. 2005). Therefore,
the increase in proportion of Na2S2O8 and H2O2
resistant SOC with depth may partly be attributed to a
more intimate association of SOC with mineral
surfaces at lower SOC loadings (Kaiser and Guggen-
berger 2003; Eusterhues et al. 2003, 2005). Helfrich
et al. (2007) reported that, contrary to the treatment
with H2O2 or Na2S2O8, the proportion of NaOCl-
resistant SOC in the Rotthalmunster soils of Germany
did not increase with progressive decrease in SOC
loading. These results suggest that, as compared to
NaOCl, the treatment with Na2S2O8 and H2O2 were
able to isolate a SOC fraction which is more
refractory in nature. Bruun et al. (2007), who
compared several methods for the isolation of a
stable SOC on two soils incubated with 14C-labelled
barley straw for either 40 days or 40 years, found that
the SOC resistant to both NaOCl and Na2S2O8
contained a larger proportion of 40-days-old C than
of 40-years old C and therefore they are unlikely to
isolate a stable fraction of SOC.
C:N ratio of oxidation resistant residues
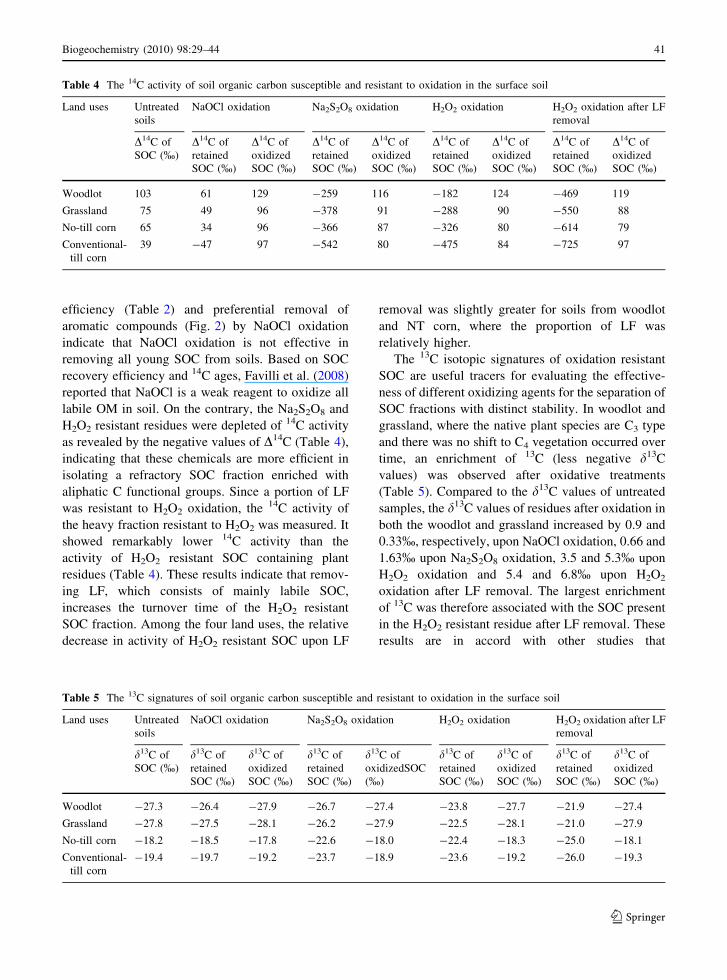
The C:N ratios of residues remaining after oxidative
treatments differed from that of the untreated soil in
all the land uses (Fig. 1). Oxidation using NaOCl
resulted in increased C:N ratios in all horizons, as
revealed by the positive relative change (7–53%,
Fig. 1). Increased C:N ratio suggests a preferential
oxidation of N-rich OM fractions by NaOCl. Mikutta
et al. (2005) also reported higher C:N ratios for
NaOCl oxidized residues as compared to untreated
Table 2 Effect of wet oxidation methods on soil organic carbon removal in different horizons
Horizon Oxidants Woodlot Grassland No-till corn Conventional-till corn
SOC resistant to
oxidation
(g kg-1)
% of
total
SOC
SOC resistant
to oxidation
(g kg-1)
% of
total
SOC
SOC resistant to
oxidation
(g kg-1)
% of
total
SOC
SOC resistant
to oxidation
(g kg-1)
% of
total
SOC
A1/Ap1 NaOCl 14 (1.7) a 38 15 (0.6) a 45 20 (0.7) a 50 4.0 (0.05) a 40
Na2S2O8 1.6 (0.05) b 4 1.4 (0.3) b 4 1.6 (0.1) b 4 1.0 (0.1) b 10
H2O2 2.5 (0.1) b 7 1.3 (0.2) b 4 1.5 (0.1) b 4 0.8 (0.1) b 8
A2/Ap2 NaOCl 12.8 (0.2) a 45 13.2 (0.8) a 54 12.6 (0.5) a 49 4.9 (0.2) a 42
Na2S2O8 1.6 (0.05) b 6 1.3 (0.2) b 5 1.4 (0.1) b 5 1.3 (0.1) b 11
H2O2 2.0 (0.1) b 7 1.4 (0.1) b 6 1.4 (0.1) b 6 1.2 (0.07) b 10
E/Ap3 NaOCl 5.2 (0.1) a 49 7.4 (0.3) a 49 5.9 (0.3) a 42 4.8 (0.4) a 41
Na2S2O8 1.3 (0.03) b 12 1.4 (0.0) b 9 1.1 (0.06) b 8 1.4 (0.2) b 11
H2O2 1.0 (0.2) b 10 1.6 (0.2) b 11 1.3 (0.05) b 10 1.3 (0.01) b 11
Bt1 NaOCl 1.8 (0.1) a 66 3.4 (0.2) a 48 1.7 (0.1) a 58 2.0 (0.2) a 55
Na2S2O8 1.0 (0.01) b 38 1.0 (0.1) b 14 0.93 (0.02) b 33 0.97 (0.05) b 27
H2O2 0.70 (0.01) c 26 1.2 (0.1) b 16 0.72 (0.05) c 25 0.87 (0.1) b 24
Btx1 NaOCl NA NA 1.4 (0.3) a 79 1.4 (0.2) a 72 1.3 (0.06) a 64
Na2S2O8 0.78 (0.03) b 43 0.76 (0.02) b 40 0.72 (0.04) b 37
H2O2 0.82 (0.2) b 46 0.76 (0.08) b 40 0.70 (0.09) b 36
N = 3; Standard deviation in brackets; Values in a column within a horizon followed by different letters are significantly different at
P B 0.05 using Fisher’s protected LSD
36 Biogeochemistry (2010) 98:29–44
123
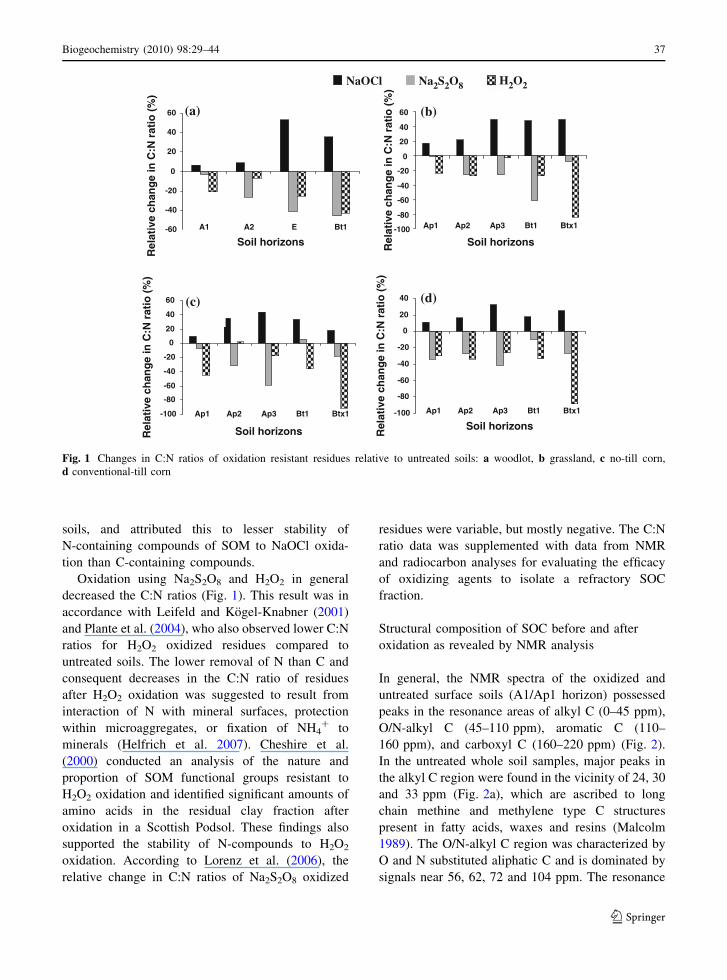
soils, and attributed this to lesser stability of
N-containing compounds of SOM to NaOCl oxida-
tion than C-containing compounds.
Oxidation using Na2S2O8 and H2O2 in general
decreased the C:N ratios (Fig. 1). This result was in
accordance with Leifeld and Kogel-Knabner (2001)
and Plante et al. (2004), who also observed lower C:N
ratios for H2O2 oxidized residues compared to
untreated soils. The lower removal of N than C and
consequent decreases in the C:N ratio of residues
after H2O2 oxidation was suggested to result from
interaction of N with mineral surfaces, protection
within microaggregates, or fixation of NH4? to
minerals (Helfrich et al. 2007). Cheshire et al.
(2000) conducted an analysis of the nature and
proportion of SOM functional groups resistant to
H2O2 oxidation and identified significant amounts of
amino acids in the residual clay fraction after
oxidation in a Scottish Podsol. These findings also
supported the stability of N-compounds to H2O2
oxidation. According to Lorenz et al. (2006), the
relative change in C:N ratios of Na2S2O8 oxidized
residues were variable, but mostly negative. The C:N
ratio data was supplemented with data from NMR
and radiocarbon analyses for evaluating the efficacy
of oxidizing agents to isolate a refractory SOC
fraction.
Structural composition of SOC before and after
oxidation as revealed by NMR analysis
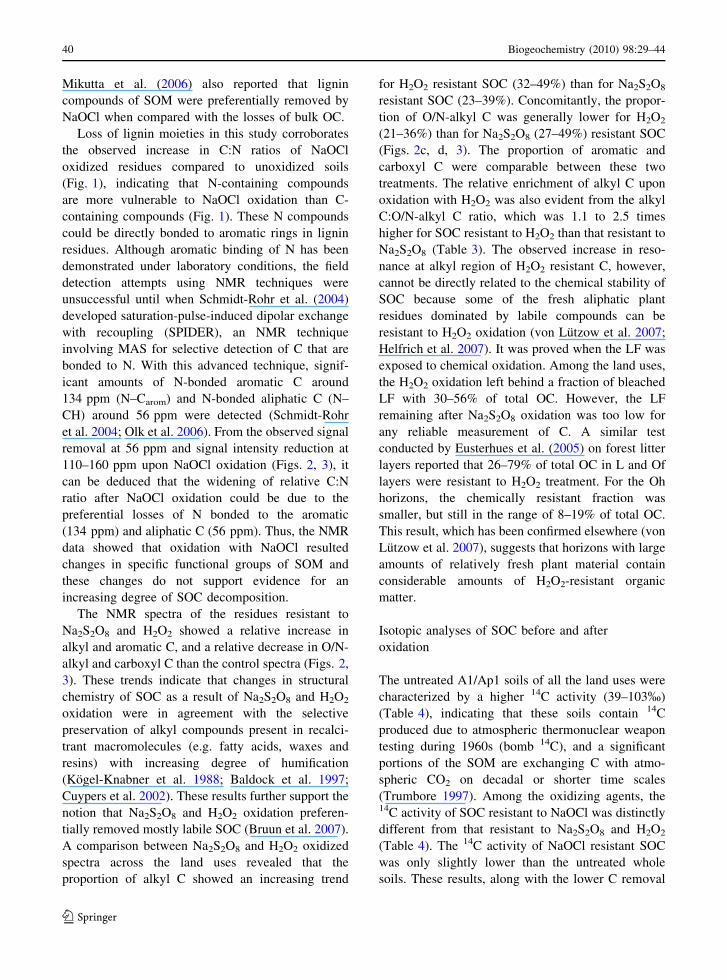
In general, the NMR spectra of the oxidized and
untreated surface soils (A1/Ap1 horizon) possessed
peaks in the resonance areas of alkyl C (0–45 ppm),
O/N-alkyl C (45–110 ppm), aromatic C (110–
160 ppm), and carboxyl C (160–220 ppm) (Fig. 2).
In the untreated whole soil samples, major peaks in
the alkyl C region were found in the vicinity of 24, 30
and 33 ppm (Fig. 2a), which are ascribed to long
chain methine and methylene type C structures
present in fatty acids, waxes and resins (Malcolm
1989). The O/N-alkyl C region was characterized by
O and N substituted aliphatic C and is dominated by
signals near 56, 62, 72 and 104 ppm. The resonance
-100
-80
-60
-40
-20
0
20
40
Soil horizons
Rel
ativ
e ch
ang
e in
C:N
rat
io (
%)
Ap2 Ap3 Bt1Ap1 Btx1-100
-80
-60
-40
-20
0
20
40
60
Soil horizonsRel
ativ
e ch
ang
e in
C:N
rat
io (
%)
Ap2 Ap3 Bt1Ap1 Btx1
-60
-40
-20
0
20
40
60
Soil horizons
Rel
ativ
e ch
ang
e in
C:N
rat
io (
%)
A2 E Bt1A1 -100
-80
-60
-40
-20
0
20
40
60
Soil horizonsRel
ativ
e ch
ang
e in
C:N
rat
io (
%)
Ap2 Ap3 Bt1Ap1 Btx1
NaOCl
(a) (b)
(c) (d)
Na2S2O8 H2O2
Fig. 1 Changes in C:N ratios of oxidation resistant residues relative to untreated soils: a woodlot, b grassland, c no-till corn,
d conventional-till corn
Biogeochemistry (2010) 98:29–44 37
123
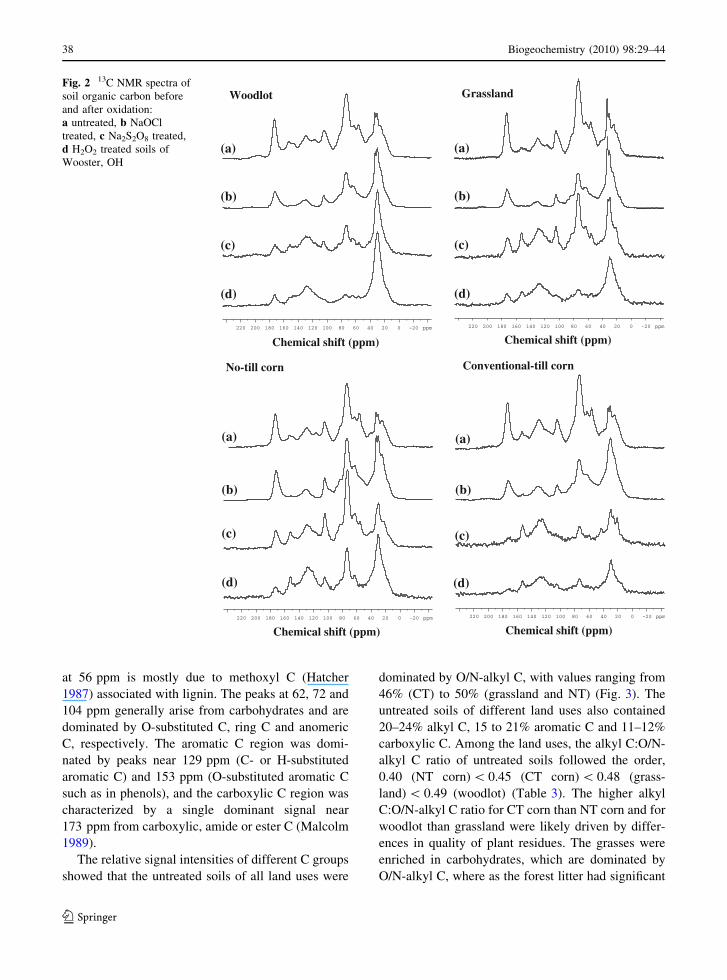
at 56 ppm is mostly due to methoxyl C (Hatcher
1987) associated with lignin. The peaks at 62, 72 and
104 ppm generally arise from carbohydrates and are
dominated by O-substituted C, ring C and anomeric
C, respectively. The aromatic C region was domi-
nated by peaks near 129 ppm (C- or H-substituted
aromatic C) and 153 ppm (O-substituted aromatic C
such as in phenols), and the carboxylic C region was
characterized by a single dominant signal near
173 ppm from carboxylic, amide or ester C (Malcolm
1989).
The relative signal intensities of different C groups
showed that the untreated soils of all land uses were
dominated by O/N-alkyl C, with values ranging from
46% (CT) to 50% (grassland and NT) (Fig. 3). The
untreated soils of different land uses also contained
20–24% alkyl C, 15 to 21% aromatic C and 11–12%
carboxylic C. Among the land uses, the alkyl C:O/N-
alkyl C ratio of untreated soils followed the order,
0.40 (NT corn) \ 0.45 (CT corn) \ 0.48 (grass-
land) \ 0.49 (woodlot) (Table 3). The higher alkyl
C:O/N-alkyl C ratio for CT corn than NT corn and for
woodlot than grassland were likely driven by differ-
ences in quality of plant residues. The grasses were
enriched in carbohydrates, which are dominated by
O/N-alkyl C, where as the forest litter had significant
-20220 200 180 160 140 120 100 80 60 40 20 0 ppm
-20220 200 180 160 140 120 100 80 60 40 20 0 ppm -20220 200 180 160 140 120 100 80 60 40 20 0 ppm
-20220 200 180 160 140 120 100 80 60 40 20 0 ppm
Woodlot Grassland
(a) (a)
(b) (b)
(c) (c)
(d) (d)
(d)
Chemical shift (ppm) Chemical shift (ppm)
Conventional-till corn No-till corn
(a) (a)
(b) (b)
(c) (c)
(d)
Chemical shift (ppm) Chemical shift (ppm)
Fig. 2 13C NMR spectra of
soil organic carbon before
and after oxidation:
a untreated, b NaOCl
treated, c Na2S2O8 treated,
d H2O2 treated soils of
Wooster, OH
38 Biogeochemistry (2010) 98:29–44
123
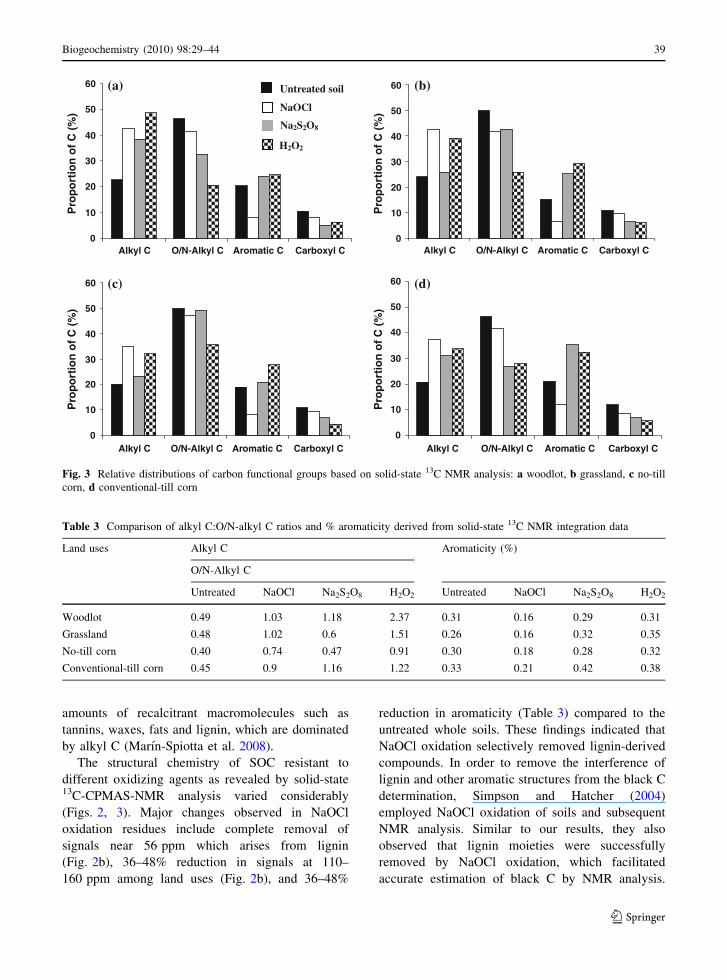
amounts of recalcitrant macromolecules such as
tannins, waxes, fats and lignin, which are dominated
by alkyl C (Marın-Spiotta et al. 2008).
The structural chemistry of SOC resistant to
different oxidizing agents as revealed by solid-state13C-CPMAS-NMR analysis varied considerably
(Figs. 2, 3). Major changes observed in NaOCl
oxidation residues include complete removal of
signals near 56 ppm which arises from lignin
(Fig. 2b), 36–48% reduction in signals at 110–
160 ppm among land uses (Fig. 2b), and 36–48%
reduction in aromaticity (Table 3) compared to the
untreated whole soils. These findings indicated that
NaOCl oxidation selectively removed lignin-derived
compounds. In order to remove the interference of
lignin and other aromatic structures from the black C
determination, Simpson and Hatcher (2004)
employed NaOCl oxidation of soils and subsequent
NMR analysis. Similar to our results, they also
observed that lignin moieties were successfully
removed by NaOCl oxidation, which facilitated
accurate estimation of black C by NMR analysis.
0
10
20
30
40
50
60
Alkyl C O/N-Alkyl C Aromatic C Carboxyl C
Pro
po
rtio
n o
f C
(%
)
0
10
20
30
40
50
60
Alkyl C O/N-Alkyl C Aromatic C Carboxyl C
Pro
po
rtio
n o
f C
(%
)
0
10
20
30
40
50
60
Alkyl C O/N-Alkyl C Aromatic C Carboxyl C
Pro
po
rtio
n o
f C
(%
)
0
10
20
30
40
50
60
Alkyl C O/N-Alkyl C Aromatic C Carboxyl C
Pro
po
rtio
n o
f C
(%
)
H2O2
Na2S2O8
(a)
(c)
(b)
(d)
NaOCl
Untreated soil
Fig. 3 Relative distributions of carbon functional groups based on solid-state 13C NMR analysis: a woodlot, b grassland, c no-till
corn, d conventional-till corn
Table 3 Comparison of alkyl C:O/N-alkyl C ratios and % aromaticity derived from solid-state 13C NMR integration data
Land uses Alkyl C Aromaticity (%)
O/N-Alkyl C
Untreated NaOCl Na2S2O8 H2O2 Untreated NaOCl Na2S2O8 H2O2
Woodlot 0.49 1.03 1.18 2.37 0.31 0.16 0.29 0.31
Grassland 0.48 1.02 0.6 1.51 0.26 0.16 0.32 0.35
No-till corn 0.40 0.74 0.47 0.91 0.30 0.18 0.28 0.32
Conventional-till corn 0.45 0.9 1.16 1.22 0.33 0.21 0.42 0.38
Biogeochemistry (2010) 98:29–44 39
123
Mikutta et al. (2006) also reported that lignin
compounds of SOM were preferentially removed by
NaOCl when compared with the losses of bulk OC.
Loss of lignin moieties in this study corroborates
the observed increase in C:N ratios of NaOCl
oxidized residues compared to unoxidized soils
(Fig. 1), indicating that N-containing compounds
are more vulnerable to NaOCl oxidation than C-
containing compounds (Fig. 1). These N compounds
could be directly bonded to aromatic rings in lignin
residues. Although aromatic binding of N has been
demonstrated under laboratory conditions, the field
detection attempts using NMR techniques were
unsuccessful until when Schmidt-Rohr et al. (2004)
developed saturation-pulse-induced dipolar exchange
with recoupling (SPIDER), an NMR technique
involving MAS for selective detection of C that are
bonded to N. With this advanced technique, signif-
icant amounts of N-bonded aromatic C around
134 ppm (N–Carom) and N-bonded aliphatic C (N–
CH) around 56 ppm were detected (Schmidt-Rohr
et al. 2004; Olk et al. 2006). From the observed signal
removal at 56 ppm and signal intensity reduction at
110–160 ppm upon NaOCl oxidation (Figs. 2, 3), it
can be deduced that the widening of relative C:N
ratio after NaOCl oxidation could be due to the
preferential losses of N bonded to the aromatic
(134 ppm) and aliphatic C (56 ppm). Thus, the NMR
data showed that oxidation with NaOCl resulted
changes in specific functional groups of SOM and
these changes do not support evidence for an
increasing degree of SOC decomposition.
The NMR spectra of the residues resistant to
Na2S2O8 and H2O2 showed a relative increase in
alkyl and aromatic C, and a relative decrease in O/N-
alkyl and carboxyl C than the control spectra (Figs. 2,
3). These trends indicate that changes in structural
chemistry of SOC as a result of Na2S2O8 and H2O2
oxidation were in agreement with the selective
preservation of alkyl compounds present in recalci-
trant macromolecules (e.g. fatty acids, waxes and
resins) with increasing degree of humification
(Kogel-Knabner et al. 1988; Baldock et al. 1997;
Cuypers et al. 2002). These results further support the
notion that Na2S2O8 and H2O2 oxidation preferen-
tially removed mostly labile SOC (Bruun et al. 2007).
A comparison between Na2S2O8 and H2O2 oxidized
spectra across the land uses revealed that the
proportion of alkyl C showed an increasing trend
for H2O2 resistant SOC (32–49%) than for Na2S2O8
resistant SOC (23–39%). Concomitantly, the propor-
tion of O/N-alkyl C was generally lower for H2O2
(21–36%) than for Na2S2O8 (27–49%) resistant SOC
(Figs. 2c, d, 3). The proportion of aromatic and
carboxyl C were comparable between these two
treatments. The relative enrichment of alkyl C upon
oxidation with H2O2 was also evident from the alkyl
C:O/N-alkyl C ratio, which was 1.1 to 2.5 times
higher for SOC resistant to H2O2 than that resistant to
Na2S2O8 (Table 3). The observed increase in reso-
nance at alkyl region of H2O2 resistant C, however,
cannot be directly related to the chemical stability of
SOC because some of the fresh aliphatic plant
residues dominated by labile compounds can be
resistant to H2O2 oxidation (von Lutzow et al. 2007;
Helfrich et al. 2007). It was proved when the LF was
exposed to chemical oxidation. Among the land uses,
the H2O2 oxidation left behind a fraction of bleached
LF with 30–56% of total OC. However, the LF
remaining after Na2S2O8 oxidation was too low for
any reliable measurement of C. A similar test
conducted by Eusterhues et al. (2005) on forest litter
layers reported that 26–79% of total OC in L and Of
layers were resistant to H2O2 treatment. For the Oh
horizons, the chemically resistant fraction was
smaller, but still in the range of 8–19% of total OC.
This result, which has been confirmed elsewhere (von
Lutzow et al. 2007), suggests that horizons with large
amounts of relatively fresh plant material contain
considerable amounts of H2O2-resistant organic
matter.
Isotopic analyses of SOC before and after
oxidation
The untreated A1/Ap1 soils of all the land uses were
characterized by a higher 14C activity (39–103%)
(Table 4), indicating that these soils contain 14C
produced due to atmospheric thermonuclear weapon
testing during 1960s (bomb 14C), and a significant
portions of the SOM are exchanging C with atmo-
spheric CO2 on decadal or shorter time scales
(Trumbore 1997). Among the oxidizing agents, the14C activity of SOC resistant to NaOCl was distinctly
different from that resistant to Na2S2O8 and H2O2
(Table 4). The 14C activity of NaOCl resistant SOC
was only slightly lower than the untreated whole
soils. These results, along with the lower C removal
40 Biogeochemistry (2010) 98:29–44
123
efficiency (Table 2) and preferential removal of
aromatic compounds (Fig. 2) by NaOCl oxidation
indicate that NaOCl oxidation is not effective in
removing all young SOC from soils. Based on SOC
recovery efficiency and 14C ages, Favilli et al. (2008)
reported that NaOCl is a weak reagent to oxidize all
labile OM in soil. On the contrary, the Na2S2O8 and
H2O2 resistant residues were depleted of 14C activity
as revealed by the negative values of D14C (Table 4),
indicating that these chemicals are more efficient in
isolating a refractory SOC fraction enriched with
aliphatic C functional groups. Since a portion of LF
was resistant to H2O2 oxidation, the 14C activity of
the heavy fraction resistant to H2O2 was measured. It
showed remarkably lower 14C activity than the
activity of H2O2 resistant SOC containing plant
residues (Table 4). These results indicate that remov-
ing LF, which consists of mainly labile SOC,
increases the turnover time of the H2O2 resistant
SOC fraction. Among the four land uses, the relative
decrease in activity of H2O2 resistant SOC upon LF
removal was slightly greater for soils from woodlot
and NT corn, where the proportion of LF was
relatively higher.
The 13C isotopic signatures of oxidation resistant
SOC are useful tracers for evaluating the effective-
ness of different oxidizing agents for the separation of
SOC fractions with distinct stability. In woodlot and
grassland, where the native plant species are C3 type
and there was no shift to C4 vegetation occurred over
time, an enrichment of 13C (less negative d13C
values) was observed after oxidative treatments
(Table 5). Compared to the d13C values of untreated
samples, the d13C values of residues after oxidation in
both the woodlot and grassland increased by 0.9 and
0.33%, respectively, upon NaOCl oxidation, 0.66 and
1.63% upon Na2S2O8 oxidation, 3.5 and 5.3% upon
H2O2 oxidation and 5.4 and 6.8% upon H2O2
oxidation after LF removal. The largest enrichment
of 13C was therefore associated with the SOC present
in the H2O2 resistant residue after LF removal. These
results are in accord with other studies that
Table 4 The 14C activity of soil organic carbon susceptible and resistant to oxidation in the surface soil
Land uses Untreated
soils
NaOCl oxidation Na2S2O8 oxidation H2O2 oxidation H2O2 oxidation after LF
removal
D14C of
SOC (%)
D14C of
retained
SOC (%)
D14C of
oxidized
SOC (%)
D14C of
retained
SOC (%)
D14C of
oxidized
SOC (%)
D14C of
retained
SOC (%)
D14C of
oxidized
SOC (%)
D14C of
retained
SOC (%)
D14C of
oxidized
SOC (%)
Woodlot 103 61 129 -259 116 -182 124 -469 119
Grassland 75 49 96 -378 91 -288 90 -550 88
No-till corn 65 34 96 -366 87 -326 80 -614 79
Conventional-
till corn
39 -47 97 -542 80 -475 84 -725 97
Table 5 The 13C signatures of soil organic carbon susceptible and resistant to oxidation in the surface soil
Land uses Untreated
soils
NaOCl oxidation Na2S2O8 oxidation H2O2 oxidation H2O2 oxidation after LF
removal
d13C of
SOC (%)
d13C of
retained
SOC (%)
d13C of
oxidized
SOC (%)
d13C of
retained
SOC (%)
d13C of
oxidizedSOC
(%)
d13C of
retained
SOC (%)
d13C of
oxidized
SOC (%)
d13C of
retained
SOC (%)
d13C of
oxidized
SOC (%)
Woodlot -27.3 -26.4 -27.9 -26.7 -27.4 -23.8 -27.7 -21.9 -27.4
Grassland -27.8 -27.5 -28.1 -26.2 -27.9 -22.5 -28.1 -21.0 -27.9
No-till corn -18.2 -18.5 -17.8 -22.6 -18.0 -22.4 -18.3 -25.0 -18.1
Conventional-
till corn
-19.4 -19.7 -19.2 -23.7 -18.9 -23.6 -19.2 -26.0 -19.3
Biogeochemistry (2010) 98:29–44 41
123
documented enrichment of heavier 13C compared to
lighter 12C with increasing degree of SOM decompo-
sition (Nadelhoffer and Fry 1988; Balesdent et al.
1993; Bernoux et al. 1998). Such a trend in d13C
signatures was not observed in soils from cultivated
sites, where the d13C signatures of contemporary plant
inputs are a mixture of both C3 native species (average
d13C of -27%) and C4 corn (average d13C of -12%)
(Table 5). The mean d13C signatures in two cultivated
sites are as follows: -18.8% for unoxidized soils,
-19.1% for SOC resistant to NaOCl oxida-
tion, -23.2% for SOC resistant to Na2S2O8 oxidation,
-23.0% for SOC resistant to H2O2 oxidation and
-25.5% for SOC resistant to H2O2 oxidation after LF
removal. These data showed that the significant
amount of young, corn-derived SOC that entered the
soil over decadal time scales were most susceptible to
oxidation with H2O2 (after LF removal) than with
Na2S2O8 and NaOCl.
Mass balance calculations
The D14C and d13C values of the SOC removed by
oxidation were estimated by mass balance calcula-
tions (Tables 4, 5). The data revealed that, irrespec-
tive of the differences in labile SOC removal
efficiency, the isotopic signatures of the SOC
removed by different oxidizing agents remained
more or less similar. The D14C activity of removed
SOC ranged from 116 to 129% for woodlots, 88 to
96% for grassland, 79 to 96% for NT corn and 80 to
97% for CT corn (Table 4), suggesting that many of
the millennial ages reported for organic matter indeed
represent mixtures of much younger and much older
material. Incomplete removal of labile SOC can thus
lead to an underestimation of the turnover time of
more stable fraction of SOC. Similarly the d13C data
of removed SOC, estimated by mass balance, ranged
from -27.4 to -27.9% for woodlots, -27.9 to
-28.1% for grassland, -17.8 to -18.3% for NT
corn and -18.9 to -19.3% for CT corn (Table 5).
Lower than expected d13C values (-12%) of
removed SOC from NT and PT corn suggests that
some relic C (C3 SOC) was also removed by the
oxidizing agents. Nonetheless, these results reiterate
that the isotopic signature of the rapidly cycling labile
SOC pool is influenced by the plant species from
which it was derived.
Conclusions
The data presented support the conclusion that
different chemicals commonly used for wet oxidation
of SOC (Na2S2O8, H2O2, NaOCl) react differently on
total SOC. The NaOCl oxidation resulted in a lower
SOC removal efficiency and left behind a residue
with wider C:N ratios than the untreated soils. On the
other hand, Na2S2O8 and H2O2 oxidized substantial
amounts of SOC and the residue remained had
narrower relative C:N ratios. The solid-state 13C
NMR analysis was useful in evaluating the chemical
transformations of SOC during the wet oxidation
processes. The NaOCl oxidation preferentially
removed the aromatic functional groups of SOM.
However, the SOC resistant to Na2S2O8 and H2O2
oxidation were enriched with alkyl C groups, which
dominate in recalcitrant macromolecules. The isoto-
pic analyses not only confirmed that Na2S2O8 and
H2O2 were more efficient than NaOCl in isolating a
refractory fraction of SOC, but also provided evi-
dence that H2O2 treatment after LF removal is more
effective in isolating the oldest SOC.
Results obtained from this study will strengthen
the current knowledge on the usefulness of different
oxidizing agents on identifying the SOC fractions
with homogeneous reactivity. Such information is
important for accurate quantification of the effects of
land use or management changes on longer term
sequestration of SOC. The experimental isolation and
quantification of SOC pool with homogeneous sta-
bility is also useful for validating the conceptual
pools of the SOM prediction models for improving
their process-based simulation accuracy.
Acknowledgments We would like to thank Prof. W.A. Dick
for rendering access to the Triplett–van Doren experiment at
Wooster, OH. We greatly appreciate the help from Mr. Sandy
Jones and Dr. K. Lorenz for laboratory analyses, and from
Dr. T. Young for NMR analysis. The senior author is thankful
to Ohio Agricultural Research and Development Center of
the Ohio State University for partially supporting this study
through a graduate student research grant.
References
Baisden WT, Amundson R (2003) An analytical approach to eco-
system biogeochemistry modeling. Ecol Appl 13:649–663
Baisden WT, Amundson R, Cook AC, Brenner DL (2002)
Turnover and storage of C and N in five density fractions
42 Biogeochemistry (2010) 98:29–44
123

from California annual grassland surface soils. Global
Biogeochem Cycles 16(4):1117
Baldock JA, Preston CM (1995) Chemistry of carbon decom-
position processes in forests as revealed by solid-state
carbon-13 nuclear magnetic resonance. In: McFee WW,
Kelly JM (eds) Carbon forms and functions in forest soils.
Soil Sci Soc Am, Madison, WI
Baldock JA, Skjemstad JO (2000) Role of the soil matrix and
minerals in protecting natural organic materials against
biological attack. Org Geochem 31:697–710
Baldock JA, Oades JM, Waters AG, Peng X, Vassallo AM,
Wilson MA (1992) Aspects of the chemical structure of
soil organic materials as revealed by solid-state 13C NMR
spectroscopy. Biogeochem 16:1–42
Baldock JA, Oades JM, Nelson PN, Skene TM, Golchin A,
Clarke P (1997) Assessing the extent of decomposition of
natural organic materials using solid-state 13C NMR
spectroscopy. Aust J Soil Res 35:1061–1083
Balesdent J (1996) The significance of organic separates to
carbon dynamics and its modeling in some cultivated
soils. Eur J Soil Sci 47:485–493
Balesdent J, Mariotti A, Guillet B (1987) Natural 13C abun-
dance as a tracer for studies of soil organic matter
dynamics. Soil Biol Biochem 19:25–30
Balesdent J, Girardin C, Mariotti A (1993) Site-related d13C of
tree leaves and soil organic matter in a temperate forest.
Ecology 74:1713–1721
Batjes NH (1996) Total carbon and nitrogen in the soils of the
world. Eur J Soil Sci 47:151–163
Bernoux M, Cerri CC, Neill C, de Moraes JFL (1998) The use
of stable carbon isotopes for estimating soil organic
matter turnover rates. Geoderma 82:43–58
Bruun S, Thomsen IK, Christensen BT, Jensen LS (2007) In
search of stable soil organic carbon fractions: a compar-
ison of methods applied to soils labeled with 14C for
40 days or 40 years. Eur J Soil Sci 59:247–256
Castanha C, Trumbore S, Amundson R (2008) Methods of
separating soil carbon pools affect the chemistry and
turnover time of isolated fractions. Radiocarbon 50:
83–97
Cheshire MV, Dumat C, Fraser AR, Hiller S, Staunton S
(2000) The interaction between soil organic matter and
soil clay minerals by selective removal and controlled
addition of organic matter. Eur J Soil Sci 51:497–509
Cuypers C, Grotenhuis T, Nierop KGJ, Franco EM, de Jager A,
Rulkens W (2002) Amorphous and condensed organic
matter domains: the effect of persulfate oxidation on the
composition of soil/sediment organic matter. Chemo-
sphere 48:919–931
Dick WA (1984) Influence of long-term tillage and crop
rotation combinations on soil enzyme activities. Soil Sci
Soc Am J 48:569–574
Dick WA, Blevins RL, Flye WW, Peters SE, Christenson DR,
Pierce FJ, Vitosh ML (1998) Impacts of agricultural
management practices on C sequestration in forest-
derived soils of the eastern Corn Belt. Soil Till Res
47:235–244
Eusterhues K, Rumpel C, Kleber M, Kogel-Knabner I (2003)
Stabilization of soil organic matter by interactions with
minerals as revealed by mineral dissolution and oxidative
degradation. Org Geochem 34:1591–1600
Eusterhues K, Rumpel C, Kogel-Knabner I (2005) Stabilization
of soil organic matter isolated via oxidative degradation.
Org Geochem 36:1567–1575
Favilli F, Egli M, Cherubini P, Sartori G, Haeberli W, Delbos E
(2008) Comparison of different methods of obtaining a
resilient organic matter fraction in Alpine soils. Geoderma
145:355–369
Frund R, Haider K, Ludemann HD (1994) Impact of soil man-
agement practices on the organic matter structure—inves-
tigations by CPMAS 13C NMR-spectroscopy. Zeitschrift
fur Pflanzenernahrung und Bodenkunde 157:29–35
Gee GW, Or D (2002) Particle-size analysis. In: Dane JH,
Topp GC (eds) Methods of soil analysis. Part 4: physical
methods. SSSA Book Series No. 5. SSSA, Madison, WI,
pp 255–289
Golchin A, Oades JM, Skjemstad JO, Clarke P (1994) Study of
free and occluded particulate organic matter in soils by
solid state 13C CP/MAS NMR spectroscopy and scanning
electron microscopy. Aust J Soil Res 32:285–309
Hatcher PG (1987) Chemical structural studies of natural lignin
by dipolar dephasing solid-state 13C nuclear magnetic
resonance. Org Geochem 11:31–39
Helfrich M, Flessa H, Mikutta R, Dreves A, Ludwig B (2007)
Comparison of chemical fractionations methods for iso-
lating stable soil organic carbon pools. Eur J Soil Sci
58:1316–1329
Jobbagy EG, Jackson RB (2000) The vertical distribution of
soil organic carbon and its relation to climate and vege-
tation. Ecol Appl 10:423–436
John B, Yamashita T, Ludwig B, Flessa H (2005) Storage of
organic carbon in aggregate and density fractions of silty
soils under different types of land use. Geoderma 128:63–
79
Kaiser K, Guggenberger G (2003) Mineral surfaces and soil
organic matter. Eur J Soil Sci 54:219–236
Kiem R, Knicker H, Korschens M, Kogel-Knabner I (2000)
Refractory organic carbon in C-depleted arable soils, as
studied by 13C NMR spectroscopy and carbohydrate
analysis. Org Geochem 31:655–668
Kleber M, Mikutta R, Torn MS, Jahn R (2005) Poorly crys-
talline mineral phases protect organic matter in acid
subsoil horizons. Eur J Soil Sci 56:717–725
Kogel-Knabner I, Zech W, Hatcher PG (1988) Chemical
composition of the organic matter in forest soils: the
humus layer. Zeitschrift fur Pflanzenernahrung und Bo-
denkunde 151:331–340
Kramer MG, Sollins P, Sletten RS, Swart PK (2003) N isotope
fractionation and measures of organic matter alteration
during decomposition. Ecology 84:2021–2025
Krull ES, Baldock JA, Skjemstad JO (2003) Importance of
mechanisms and processes of the stabilization of soil
organic matter for modeling carbon turnover. Funct Plant
Biol 30:207–222
Lal R (2007) Carbon sequestration. Phil Trans R Soc B
363:815–830
Leavitt SW, Follett RF, Paul EA (1996) Estimation of the slow
and fast cycling soil organic carbon pools from 6 N HCl
hydrolysis. Radiocarbon 38:230–231
Leifeld J, Kogel-Knabner I (2001) Organic carbon and nitrogen
in fine soil fractions after treatment with hydrogen per-
oxide. Soil Biol Biochem 33:2155–2158
Biogeochemistry (2010) 98:29–44 43
123
Lorenz K, Lal R, Shipitalo MJ (2006) Stabilization of organic
carbon in chemically separated pools in no-till and mea-
dow soils in northern Appalachia. Geoderma 137:205–211
Malcolm RL (1989) Applications of solid-state 13C NMR
spectroscopy to geochemical studies of humic substances.
In: Hayes et al (eds) Humic substances II: in search of
structure. Wiley, New York
Marın-Spiotta E, Swanston CW, Torn MS, Silver WL, Burton
SD (2008) Chemical and mineral control of soil carbon
turnover in abandoned tropical pastures. Geoderma
143:49–62
Mikutta R, Kleber M, Jahn R (2005) Poorly crystalline min-
erals protect organic carbon in clay subfractions from acid
subsoil horizons. Geoderma 128:106–115
Mikutta R, Kleber M, Torn MS, Jahn R (2006) Stabilization of
organic matter: association with minerals or chemical
recalcitrance? Biogeochem 77:25–56
Nadelhoffer KJ, Fry B (1988) Controls on natural nitrogen-15
and carbon-13 abundances in forest soil organic matter.
Soil Sci Soc Am J 52:1633–1640
Nowinski NS, Trumbore SE, Schuur EAG, Mack MC, Shaver
GR (2008) Nutrient addition prompts rapid destabilization
of organic matter in an arctic tundra ecosystem. Ecosys-
tems 11:16–25
Olk DC, Cassman KG, Schmidt-Rohr K, Anders MM, Mao JD,
Deenik JL (2006) Chemical stabilization of soil organic
nitrogen by phenolic lignin residues in anaerobic agro-
ecosystems. Soil Biol Biochem 38:3303–3312
Paul EA, Follett RF, Leavitt SW, Halvorson A, Peterson GA,
Lyon DJ (1997) Radiocarbon dating for determination of
soil organic matter pool sizes and dynamics. Soil Sci Soc
Am J 61:1058–1067
Paul EA, Collins HP, Leavitt SW (2001) Dynamics of resistant
soil carbon of Midwestern agricultural soils measured by
naturally occurring 14C abundance. Geoderma 104:239–
256
Plante AF, Chenu C, Balabane M, Mariotti A, Righi D
(2004) Peroxide oxidation of clay-associated organic
matter in a cultivation chronosequence. Eur J Soil Sci
55:471–478
Preston CM (1996) Applications of NMR to soil organic matter
analysis: history and prospects. Soil Sci 161:144–166
SAS Institute (2002) The SAS system for microsoft windows
release 8.2. SAS Institute, Cary, NC
Schmidt MWI, Gleixner G (2005) Carbon and nitrogen isotope
composition of bulk soils, particle-size fractions and
organic material after treatment with hydrofluoric acid.
Eur J Soil Sci 56:407–419
Schmidt MWI, Knicker H, Hatcher PG, Kogel-Knabner I
(1997) Improvement of 13C CPMAS NMR spectra of bulk
soils, particle size fractions and organic material by
treatment with 10% hydrofluoric acid. Eur J Soil Sci
48:319–328
Schmidt-Rohr K, Mao JD, Olk DC (2004) Nitrogen-bonded
aromatics in soil organic matter and their implications for
a yield decline in intensive rice cropping. Proc Nat Acad
Sci USA 101:6351–6354
Silveira ML, Comerford NB, Reddy KR, Cooper WT, El-Rifai
H (2008) Characterization of soil organic carbon pools by
acid hydrolysis. Geoderma 144:405–414
Simpson MJ, Hatcher PG (2004) Determination of black car-
bon in natural organic matter by chemical and solid-state13C nuclear magnetic resonance spectroscopy. Org Geo-
chem 35:923–935
Siregar A, Kleber M, Mikutta R, Jahn R (2005) Sodium
hypochlorite oxidation reduces soil organic matter con-
centrations without affecting inorganic soil constituents.
Eur J Soil Sci 56:481–490
Sollins P, Homann P, Caldwell BA (1996) Stabilisation and
destabilisation of soil organic matter: mechanisms and
controls. Geoderma 74:65–105
Stuiver M, Polach HA (1977) Reporting of C-14 data—dis-
cussion. Radiocarbon 19:355–363
Theng BKG, Tate KR, Becker-Heidemann P (1992) Towards
establishing the age, location, and identity of the inert soil
organic matter of a Spodosol. Zeitschrift fur Pflanzenernah-
rung und Bodenkunde 155:181–184
Theng BKG, Ristori GG, Santi CA, Percival HJ (1999) An
improved method for determining the specific surface
areas of topsoils with varied organic matter content, tex-
ture and clay mineral composition. Eur J Soil Sci 50:309–
316
Thomas GW (1996) Soil pH and soil acidity. In: Sparks DL
(ed) Methods of soil analysis. Part 3: chemical methods.
SSSA Book Series No. 5. SSSA, Madison, WI, pp 475–
490
Trumbore SE (1997) Potential responses of soil organic carbon
to global environmental change. Proc Nat Acad Sci USA
94:8284–8291
Trumbore SE, Zheng S (1996) Comparison of fractionation
methods for soil organic matter 14C analysis. Radiocarbon
38:219–229
USDA-SCS (United States Department of Agriculture-Soil
Conservation Service) (1984) Soil survey of Wayne
County, Ohio. US Government Printing Office, USDA,
Washington DC p 94
Ussiri DAN, Johnson CE (2007) Organic matter composition
and dynamics in a northern hardwood forest ecosystem
15 years after clear-cutting. Forest Ecol Manag 240:
131–142
Ussiri DAN, Lal R (2008) Method for determining coal carbon
in the reclaimed minesoils contaminated with coal. Soil
Sci Soc Am J 72:231–237
van Doren DM, Triplett GB, Henry JE (1976) Influence of
long-term tillage, crop-rotation, and soil type combina-
tions on corn yield. Soil Sci Soc Am J 40:100–105
von Lutzow M, Kogel-Knabner I, Ekschmitt K, Flessa H, Gug-
genberger G, Matzner E, Marschner B (2007) SOM frac-
tionation methods: relevance to functional pools and to
stabilization mechanisms. Soil Biol Biochem 39:2183–2207
Xu XM, Trumbore SE, Zheng SH, Southon JR, McDuffee KE,
Luttgen M, Liu JC (2007) Modifying a sealed tube zinc
reduction method for preparation of AMS graphite targets:
reducing background and attaining high precision. Nucl
Instrum Methods Phys Res B Beam Interact Mater Atoms
259:320–329
Zimmermann M, Leifeld J, Abiven S, Schmidt MWI, Fuhrer J
(2007) Sodium hypochlorite separates an older soil
organic matter fraction than acid hydrolysis. Geoderma
139:171–179
44 Biogeochemistry (2010) 98:29–44
123
Copyright © 2022 FDOKUMEN