Economic Impact Analysis of the Refractory Product ...
90
Economic Impact Analysis of the Refractory Product Manufacturing NESHAP - Final Rule
-
Upload
khangminh22 -
Category
Documents
-
view
3 -
download
0
Transcript of Economic Impact Analysis of the Refractory Product ...

Economic Impact Analysis of the RefractoryProduct Manufacturing NESHAP -Final Rule


EPA 452/R-03-004February 2003
Economic Impact Analysis of the Refractory ProductManufacturing NESHAP - Final Rule
Final Report
U.S. Environmental Protection AgencyOffice of Air Quality Planning and StandardsAir Quality Strategies and Standards DivisionInnovative Strategies and Economics Group
Research Triangle Park, North Carolina


CONTENTS
Section Page
Executive Summary . . . . . . . . . . . . . . . . . . . . . . . . . . . . . . . . . . . . . . . . . . . . . ES-1
1 Introduction . . . . . . . . . . . . . . . . . . . . . . . . . . . . . . . . . . . . . . . . . . . . . . . . . . . . 1-1
1.1 Introduction . . . . . . . . . . . . . . . . . . . . . . . . . . . . . . . . . . . . . . . . . . . . . . 1-1
1.2 Organization of this Report . . . . . . . . . . . . . . . . . . . . . . . . . . . . . . . . . . 1-2
2 Industry Profile . . . . . . . . . . . . . . . . . . . . . . . . . . . . . . . . . . . . . . . . . . . . . . . . . 2-1
2.1 The Supply Side . . . . . . . . . . . . . . . . . . . . . . . . . . . . . . . . . . . . . . . . . . . 2-1 2.1.1 Production Process, Inputs, and Outputs . . . . . . . . . . . . . . . . . . 2-1
2.1.1.1 Machines Used in the Production Process . . . . . . . . . 2-4 2.1.1.2 Final Commodities . . . . . . . . . . . . . . . . . . . . . . . . . . . 2-8 2.1.1.3 Emissions and Controls in Refractory
Manufacturing . . . . . . . . . . . . . . . . . . . . . . . . . . . . . . 2-10 2.1.1.4 Inputs to Production of Refractory Products . . . . . . 2-10
2.1.2 Types of Products . . . . . . . . . . . . . . . . . . . . . . . . . . . . . . . . . . 2-12 2.1.3 Costs of Production . . . . . . . . . . . . . . . . . . . . . . . . . . . . . . . . . 2-12
2.1.3.1 Cost Data . . . . . . . . . . . . . . . . . . . . . . . . . . . . . . . . . . 2-12
2.2 Industry Organization . . . . . . . . . . . . . . . . . . . . . . . . . . . . . . . . . . . . . 2-17 2.2.1 Refractory Manufacturing Facilities . . . . . . . . . . . . . . . . . . . . 2-17
2.2.1.1 Refractories Database Facilities . . . . . . . . . . . . . . . . 2-17 2.2.1.2 Facility Location . . . . . . . . . . . . . . . . . . . . . . . . . . . . 2-17
2.2.2 Capacity Utilization . . . . . . . . . . . . . . . . . . . . . . . . . . . . . . . . . 2-25 2.2.3 Industry Concentration and Market Structure . . . . . . . . . . . . . 2-27
2.2.3.1 Measures of Industry Concentration . . . . . . . . . . . . . 2-28 2.2.3.2 Market Structure . . . . . . . . . . . . . . . . . . . . . . . . . . . . 2-29 2.2.3.3 Small Businesses that Own Refractory Facilities . . . . 2-29
2.2.4 Current Trends in the Refractory Industry . . . . . . . . . . . . . . . . 2-33
2.3 The Demand Side . . . . . . . . . . . . . . . . . . . . . . . . . . . . . . . . . . . . . . . . . 2-33 2.3.1 Product Characteristics . . . . . . . . . . . . . . . . . . . . . . . . . . . . . . 2-34 2.3.2 Uses and Consumers . . . . . . . . . . . . . . . . . . . . . . . . . . . . . . . . 2-34 2.3.3 Substitution Possibilities in Consumption . . . . . . . . . . . . . . . . 2-37
2.4 Markets . . . . . . . . . . . . . . . . . . . . . . . . . . . . . . . . . . . . . . . . . . . . . . . . 2-37 2.4.1 Market Data . . . . . . . . . . . . . . . . . . . . . . . . . . . . . . . . . . . . . . . 2-37
v

2.4.1.1 Domestic Production . . . . . . . . . . . . . . . . . . . . . . . . . 2-38 2.4.1.2 International Trade . . . . . . . . . . . . . . . . . . . . . . . . . . 2-38
2.4.2 Market Prices . . . . . . . . . . . . . . . . . . . . . . . . . . . . . . . . . . . . . . 2-40 2.4.3 Industry Trends . . . . . . . . . . . . . . . . . . . . . . . . . . . . . . . . . . . . 2-40
3 Engineering Cost Analysis . . . . . . . . . . . . . . . . . . . . . . . . . . . . . . . . . . . . . . . . . 3-1
3.1 Overview of Emissions from Refractory Manufacturing . . . . . . . . . . . 3-1
3.2 Compliance Cost Estimates . . . . . . . . . . . . . . . . . . . . . . . . . . . . . . . . . . 3-2 3.2.1 Emission Control Costs . . . . . . . . . . . . . . . . . . . . . . . . . . . . . . 3-4 3.2.2 Compliance Testing Costs . . . . . . . . . . . . . . . . . . . . . . . . . . . . . 3-5 3.2.3 Monitoring, Recordkeeping, and Reporting Costs . . . . . . . . . . 3-5 3.2.4 Total Annualized Costs . . . . . . . . . . . . . . . . . . . . . . . . . . . . . . . 3-5
4 Economic Impact Analysis: Methods and Results . . . . . . . . . . . . . . . . . . . . . . 4-1
4.1 Markets Affected by the Proposed NESHAP . . . . . . . . . . . . . . . . . . . . 4-1
4.2 Conceptual Approach . . . . . . . . . . . . . . . . . . . . . . . . . . . . . . . . . . . . . . 4-2 4.2.1 Producer Characterization . . . . . . . . . . . . . . . . . . . . . . . . . . . . . 4-2 4.2.2 Consumer Characterization . . . . . . . . . . . . . . . . . . . . . . . . . . . . 4-3 4.2.3 Foreign Trade . . . . . . . . . . . . . . . . . . . . . . . . . . . . . . . . . . . . . . . 4-4 4.2.4 Baseline and With-Regulation Equilibrium . . . . . . . . . . . . . . . . 4-5
4.2.4.1 Bricks and Shapes Market . . . . . . . . . . . . . . . . . . . . . 4-5 4.2.4.2 Monolithics and RCF Markets . . . . . . . . . . . . . . . . . . 4-6
4.3 Economic Impact Results . . . . . . . . . . . . . . . . . . . . . . . . . . . . . . . . . . . 4-6 4.3.1 Market-Level Impacts . . . . . . . . . . . . . . . . . . . . . . . . . . . . . . . . 4-7 4.3.2 Industry-Level Impacts . . . . . . . . . . . . . . . . . . . . . . . . . . . . . . . 4-7
4.3.2.1 Facility Closures and Changes in Employment . . . . . 4-8 4.3.3 Social Cost . . . . . . . . . . . . . . . . . . . . . . . . . . . . . . . . . . . . . . . . . 4-9
vi

5 Small Business Impacts . . . . . . . . . . . . . . . . . . . . . . . . . . . . . . . . . . . . . . . . . . . 5-1
5.1 Identify Small Entities . . . . . . . . . . . . . . . . . . . . . . . . . . . . . . . . . . . . . . 5-1
5.2 Economic Analysis . . . . . . . . . . . . . . . . . . . . . . . . . . . . . . . . . . . . . . . . 5-2
5.3 Assessment . . . . . . . . . . . . . . . . . . . . . . . . . . . . . . . . . . . . . . . . . . . . . . . 5-3
References . . . . . . . . . . . . . . . . . . . . . . . . . . . . . . . . . . . . . . . . . . . . . . . . . . . . . . . . . . . R-1
Appendix A: Overview of Refractories Market Model . . . . . . . . . . . . . . . . . . . . . . . A-1 Appendix B: Economic Welfare Impacts on Refractory Industry . . . . . . . . . . . . . . . . B-1
vii

LIST OF FIGURES
Number Page
2-1a Refractory Manufacturing Process Flow Diagram . . . . . . . . . . . . . . . . . . . . . . 2-2 2-1b Specific Production Processes . . . . . . . . . . . . . . . . . . . . . . . . . . . . . . . . . . . . . . 2-3 2-2 Mixing and Kneading Machines . . . . . . . . . . . . . . . . . . . . . . . . . . . . . . . . . . . . 2-5 2-3 Vacuum Press (Friction, Hydraulic Press) . . . . . . . . . . . . . . . . . . . . . . . . . . . . . 2-6 2-4 Friction Press (A), and Hydraulic Screw Press (B) . . . . . . . . . . . . . . . . . . . . . . 2-6 2-5 Vibrating Press . . . . . . . . . . . . . . . . . . . . . . . . . . . . . . . . . . . . . . . . . . . . . . . . . . 2-6 2-6 Cross Section of CIP . . . . . . . . . . . . . . . . . . . . . . . . . . . . . . . . . . . . . . . . . . . . . 2-6 2-7 Tunnel Kiln . . . . . . . . . . . . . . . . . . . . . . . . . . . . . . . . . . . . . . . . . . . . . . . . . . . . 2-7 2-8 Round Kiln with Downdraft . . . . . . . . . . . . . . . . . . . . . . . . . . . . . . . . . . . . . . . 2-8 2-9 Shuttle Kiln . . . . . . . . . . . . . . . . . . . . . . . . . . . . . . . . . . . . . . . . . . . . . . . . . . . . 2-8 2-10 Clay and Nonclay Refractory Manufacturers’ Expenditures . . . . . . . . . . . . . . 2-13 2-11 Location of Refractory Manufacturing Facilities . . . . . . . . . . . . . . . . . . . . . . 2-26 2-12 Historical Refractory Production Trends . . . . . . . . . . . . . . . . . . . . . . . . . . . . . 2-38
4-1 Supply Curve for a Representative Directly Affected Facility . . . . . . . . . . . . . 4-3 4-2 Market Equilibrium for Bricks and Shapes Refractories without and with
Regulation . . . . . . . . . . . . . . . . . . . . . . . . . . . . . . . . . . . . . . . . . . . . . . . . . . . . . 4-4
viii

Number
2-1 2-2
2-3
2-4
2-5 2-6 2-7 2-8
2-9
2-10 2-11 2-12 2-13 2-14 2-15
3-1
4-1 4-2 4-3 4-4
5-1 5-2
LIST OF TABLES
Page
Types and Descriptions of Refractories Produced . . . . . . . . . . . . . . . . . . . . . . . 2-9 Types and Characteristics of Raw Materials used in Refractory Manufacture Type . . . . . . . . . . . . . . . . . . . . . . . . . . . . . . . . . . . . . . . . . . . . . . 2-11 Labor, Material, and New Capital Expenditures for Clay Refractory Manufacturers (NAICS 327124) ($106) . . . . . . . . . . . . . . . . . . . . . . . . . . . . . . 2-14 Labor, Material, and New Capital Expenditures for Nonclay Refractory Manufacturers (NAICS 327125) ($106) . . . . . . . . . . . . . . . . . . . . . . . . . . . . . . 2-15 Costs of Materials Used in Refractory Production and Manufacture . . . . . . . 2-16 Selected Refractory Manufacturers, by Type . . . . . . . . . . . . . . . . . . . . . . . . . 2-18 Number of Refractory Manufacturing Facilities by State . . . . . . . . . . . . . . . . 2-25 Full Production Capacity Utilization Rates for Clay and Nonclay Refractories: Fourth Quarters 1993 through 1998 . . . . . . . . . . . . . . . . . . . . . 2-27 Market Concentration Measures for SIC 3255 Clay Refractory Manufacturing and SIC 3297 Nonclay Refractory Manufacturing . . . . . . . . . 2-28 Characteristics of Small Businesses in the Refractory Industry . . . . . . . . . . . 2-30 Characteristics and Types of Refractories . . . . . . . . . . . . . . . . . . . . . . . . . . . . 2-35 Steel and Nonferrous Production (103 Metric Tons) . . . . . . . . . . . . . . . . . . . . 2-37 Production of Refractories: 1977–1998 ($106) . . . . . . . . . . . . . . . . . . . . . . . . 2-39 Exports and Imports of Refractories: 1993–1999 ($106 1998) . . . . . . . . . . . . 2-40 Average Price for Refractory Products ($/ton) . . . . . . . . . . . . . . . . . . . . . . . . 2-41
Summary of Revised Annual Compliance Costs for Refractory Products Manufacturing NESHAP . . . . . . . . . . . . . . . . . . . . . . . . . . . . . . . . . . . . . . . . . . 3-3
Market-Level Impacts: 1998 . . . . . . . . . . . . . . . . . . . . . . . . . . . . . . . . . . . . . . . 4-7 Industry-Level Impacts: 1998 . . . . . . . . . . . . . . . . . . . . . . . . . . . . . . . . . . . . . . 4-8 Distributional Impacts Across Facilities: 1998 . . . . . . . . . . . . . . . . . . . . . . . . . 4-9 Distribution of Social Costs: 1998 . . . . . . . . . . . . . . . . . . . . . . . . . . . . . . . . . 4-10
Summary of SBREFA Screening Analysis: 1998 . . . . . . . . . . . . . . . . . . . . . . 5-2 Small Business Impacts: 1998 . . . . . . . . . . . . . . . . . . . . . . . . . . . . . . . . . . . . . 5-3
ix

EXECUTIVE SUMMARY
The U.S. Environmental Protection Agency’s (EPA’s) Office of Air Quality Planning and Standards (OAQPS) has developed National Emission Standards for Hazardous Air Pollutants (NESHAP) under Section 112 of the 1990 Clean Air Act for the refractory manufacturing industry. This economic impact analysis (EIA) of the NESHAP for the refractory products manufacturing industry provides information about the estimated costs and economic impacts of the final rule. This section presents a summary of the costs of complying with the NESHAP and the estimated economic impacts resulting from these costs.
ES.1 Costs of Compliance
Out of 147 facilities producing refractory products, the Agency has identified eight refractory manufacturing facilities as possible major sources of HAPs. Of these eight, six are projected to incur emissions control costs to comply with the NESHAP and the other two are projected to incur only recordkeeping and reporting costs. Five facilities are estimated to incur costs to install and operate emissions control capital equipment. Based on the model, EPA expects the sixth facility will close its operation because the costs of control will exceed revenue. The capital costs of control technology range from $383,400 to $1.37 million and total $4.6 million. The total annualized costs of the NESHAP are $2.31 million, including $655,700 in annualized capital costs; $1,419,400 in annual operating and maintenance costs for emissions controls; and $239,100 in monitoring, recordkeeping, and reporting costs. Among the facilities incurring costs, the total annualized costs range from $1,200 to $677,600 and average $289,275 per facility.
ES.2 Estimated Economic Impacts of the Refractories NESHAP
EPA used a simulation model of the market for refractory products to estimate impacts of the NESHAP, including changes in market prices and quantities for refractory products; changes in costs, revenues, profits, and output for refractory manufacturers; and impacts on companies owning refractory manufacturing facilities, including impacts on small businesses.
EPA estimates that the price for refractory products will be essentially unchanged, and the quantity of refractory products produced domestically will decrease by less than 0.3 percent. One refractory manufacturing facility is projected to become unprofitable and shut down under the rule unless it chooses to become a nonmajor source by altering its production processes. Overall, eight facilities incurring compliance costs are projected to become less profitable and reduce their output, while 139 facilities not incurring costs are projected to remain
ES-1

as profitable as without the rule. Overall, the net effect of the rule is to decrease the industry’s profit. Despite a single facility closure, output and employment are projected to decline only slightly as a result of the rule. EPA estimates the social cost of the rule (computed as described in Appendix B) to be $2.09 million, representing entirely a loss in industry profitability.
For its analysis, EPA defined small businesses as those with 750 employees or fewer. EPA estimates that 56 of the 76 companies owning refractory manufacturing facilities may be small businesses. Three of the facilities incurring compliance costs are owned by small businesses, but none of them is projected to incur costs exceeding 1 percent of sales. Thus, the Agency does not project any significant adverse economic impacts for small businesses as a result of the rule.
ES-2

1.1
SECTION 1
INTRODUCTION
Introduction
A refractory is a material that retains its shape and chemical identity when subjected to high temperatures and is used in applications that require extreme resistance to heat. Specifically, refractories must be able to withstand temperatures above 538°C (1000°F). Refractories are mechanically strong and heat resistant to withstand rapid temperature change and corrosion and erosion by molten metal, glass, slag, and hot gas. Refractories are used in kilns, furnaces, boilers, incinerators, and other applications.
Section 112 of the Clean Air Act lists 189 hazardous air pollutants (HAPs) and requires EPA to develop a list of categories of industries that emit HAPs. Section 112 then states that every major source of HAPs emissions will be required to reduce emissions to levels that are equivalent to the average of the top 12 percent of the best performers. The Act defines major sources as those facilities that emit or have the potential to emit at least 10 tons per year of any single HAP or at least 25 tons per year of any combination of HAPs.
Refractory products manufacturing facilities have been identified as sources of several HAPs. The specific types and quantities of HAPs emitted from any particular facility are largely a function of the types of raw materials used and how those materials are processed. Many processes are used to produce refractory products. These processes can emit phenol, formaldehyde, methanol, and ethylene glycol, depending on the type of resin used. When used as binders or additives in the production of nonresin-bonded refractory shapes, ethylene glycol and methanol also are emitted from shape dryers and kilns. Pitch-bonded refractory heated pitch storage tanks, shape dryers, and kilns emit polycyclic organic matter (POM). The heated pitch storage tanks, shape preheaters, defumers, and coking ovens used to produce pitch-impregnated refractories also emit POM. Hydrogen fluoride (HF) and hydrochloric acid (HCl) are emitted from kilns that are used to fire clay refractory products. Exposure to these substances has been demonstrated to cause adverse health effects such as irritation of lung, skin, and mucous membranes; effects on the central nervous system; and damage to the liver, kidneys, and skeleton. Formaldehyde and POM have also been listed as probable human carcinogens. EPA estimates that, of 147 refractory manufacturing facilities currently in operation, eight facilities may be major sources of HAPs. The Agency estimates that six of the eight major sources of HAPs will incur incremental costs to comply with the NESHAP, beyond recordkeeping costs.
Emissions are treated as a free good but have a cost to society. These externalities include emission effects on humans and ecosystems. Environmental regulations such as this NESHAP reduce these externalities and attempt to assign some of the costs of the pollution to
1-1

1.2
the polluter. The major sources of HAPs in the refractory products industry that incur costs to reduce emissions will face economic consequences. The economic impacts to these eight facilities will also affect the prices and quantities of refractories in the industry’s market. This report evaluates the economic impacts associated with the NESHAP and reports estimated changes in price, production, profitability of facilities, and impacts to sensitive subsectors of the market, such as small businesses and foreign trade.
Organization of this Report
This EIA report is organized as follows. Section 2 provides a detailed description of the production process for refractories, with discussion of individual refractory products, inputs, costs of production, demand, industry organization, and market structure for the refractories industry. Section 3 describes the estimated costs of complying with the NESHAP. Section 4 discusses the economic impact analysis methodology and presents the results of the analysis. Section 5 presents the results of analyses to assess the impacts of the rule on small businesses. Appendix A describes the methodology in detail and Appendix B describes computation of social cost.
1-2

SECTION 2
INDUSTRY PROFILE
In this section, we provide a summary profile of the refractory products industry in the United States, including the technical and economic aspects of the industry that must be addressed in the economic impact analysis. Section 2.1 provides an overview of the production processes and the resulting types of refractory products. Section 2.2 summarizes the organization of the U.S. refractory products industry, including a description of U.S. manufacturing plants, the companies that own these plants, and the markets for refractory products. Finally, Section 2.3 presents historical data on the refractory product industry, including U.S. production and consumption and foreign trade.
2.1 The Supply Side
Estimating the economic impacts associated with the options to regulate the refractory manufacturing industry requires characterizing the industry. This section describes the production process and inputs to and outputs of this process. In addition, characterizing the supply side of the industry involves describing various types of refractory products, by-products, and input substitution possibilities. This section also describes costs of production and economies of scale.
2.1.1 Production Process, Inputs, and Outputs
The manufacturing process for refractories depends on the particular combination of chemical compounds and minerals used to produce a specified level of thermal stability, corrosion resistance, thermal expansion, and other qualities. Refractory manufacturing involves four processes: raw material processing, forming, firing, and final processing. Figure 2-1a illustrates the basic refractory manufacturing process, and Figure 2-1b depicts specific production processes for various refractory products. The production of refractories begins with processing raw material. Raw material processing involves crushing and grinding raw materials, classifying by size, calcining, and drying. The processed raw materials may then be dry-mixed with other minerals and chemical compounds, packaged, and shipped as product.
2-1
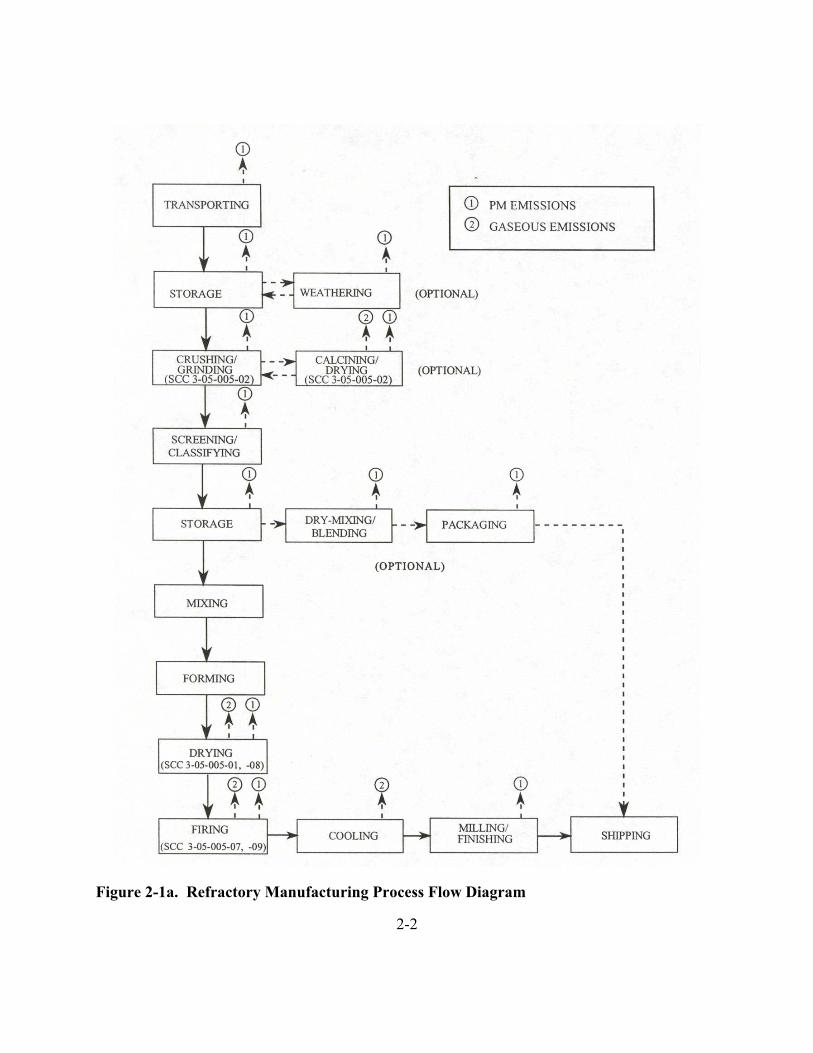
Figure 2-1a. Refractory Manufacturing Process Flow Diagram
2-2

Figure 2-1b. Specific Production Processes
2-3
Raw
Mat
eria
ls
Bulk
G
raph
ite
Gra
phite
G
raph
ite
Ref
ract
orie
s R
efra
ctor
ies
Gra
phite
M
ixin
g G
raph
ite
Ref
ract
orie
s M
achi
ning
Pu
rific
atio
n M
anuf
actu
ring
Ref
ract
ory
Cer
amic
Fi
ber
(RC
F)
Unf
orm
ed/M
onol
ithic
s/
Spec
ialti
es
(cla
y an
d no
n-cl
ay)
Mor
tars
R
efor
med
R
efra
ctor
ies
(cla
y an
d no
n-cl
ay)
Bulk
Fib
er
Cas
tabl
es
Fibe
r Bla
nket
s R
amm
ing
Mix
es
Form
ed F
iber
C
emen
ts
Prod
ucts
Res
in-B
onde
d Pi
tch-
Bond
ed
Oth
er O
rgan
ics
Org
anic
-Bon
ded
Inor
gani
c-Bo
nded
Fu
sed-
Cas
t
Bric
ks &
Br
icks
&
Dry
ing
Mel
ting
Shap
es
Shap
es
Slid
e ga
tes
Bric
ks &
Br
icks
&
Bric
ks &
Br
icks
&
Cur
ing
Dry
ing
Dry
ing
Firin
g Sh
apes
Sh
apes
Sh
apes
Sh
apes
Tube
s Sl
ide
gate
s Br
icks
&
Bric
ks &
Fi
ring
Firin
g Fi
ring
Shap
es
Shap
es
Shap
es
Bric
ks &
Pitc
h-Im
preg
nate
d Pr
oces
s O
pera
tions
Ref
ract
ory
Cla
sses
Br
icks
&
Impr
egna
tion
Shap
es
Prod
ucts
Br
icks
& S
hape
s
Slid
e ga
tes
Cok
ing
Oth
er S
hape
s

Following the mixing process, the raw materials are formed into desired shapes. Liquids are added to the dry raw materials to facilitate adhesion in the pressing/forming phase. After the refractory is formed, the material is fired. Firing involves heating the refractory material to high temperatures in a periodic batch or continuous tunnel kiln to form a ceramic bond. This process gives the raw materials their refractory properties. The final processing stage includes milling, grinding, and sandblasting the finished product. For some products, final processing may also include impregnation with tar and pitch and product packaging (EPA, 1994; The Technical Association of Refractories, Japan, 1998).
2.1.1.1 Machines Used in the Production Process
Several types of machines are used to produce refractories: mixing/kneading machines, presses, and kilns.
Mixing/Kneading Machines. Figure 2-2 illustrates different machines used to mix or knead refractory products. There are two types of mixing and kneading machines: fixed vessel and driven vessel. Mixing homogenizes more than two types of bulk materials, and kneading machines make a uniform coating layer. Mixing and kneading machines are equipped with mixing blades or muller wheels. Heating, cooling, or de-airing equipment may also be applied to the vessel. Mixing and kneading machines are used for manufacturing shaped and unshaped refractories. Unshaped refractories, however, are not processed any further (The Technical Association of Refractories, Japan, 1998).
Presses. Refractory pressing machines are broadly categorized into three groups: impact and static, vibrating, and cold isostatic press. Choosing between the three groups of presses largely depends on the type of raw materials used.
C Impact and Static Presses: Figure 2-3 illustrates a friction and a hydraulic screwpress, two types of impact presses. Figure 2-4 is a diagram of a hydraulic screw press, a type of static press. Impact and static presses are typically equipped with a vacuum deaerator. Impact presses have a higher allowable maximum compactingforce than static presses. However, static presses are finding increasing application inthe production of sophisticated refractories such as submerged nozzles and shroudsand in the production of industrial ceramics. Bricks formed with static presses areflat, uniform, and compact (The Technical Association of Refractories, Japan, 1998).
2-4

Figure 2-2. Mixing and Kneading Machines
C Vibrating Press: Vibrating presses, shown in Figure 2-5, are classified into two types: air cylinder type and hydraulic cylinder. The vibrator in the air cylinder typeis attached to the table, and the air cylinder compacts the material. The hydraulicvibrating press is constructed with the hydraulic pulse generator attached to thepressure block, and the hydraulic cylinder compacts the material. Vibrating pressesare typically used for the compaction of complexly shaped refractories (TheTechnical Association of Refractories, Japan, 1998).
C Cold Isostatic Press (CIP): A CIP, illustrated in Figure 2-6, is a molding device thatprovides homogeneous hydrostatic pressure over the entire surface of a
2-5

Figure 2-3. Vacuum Press Figure 2-4. Friction Press (A), and Hydraulic(Friction, Hydraulic Press) Screw Press (B)
Figure 2-5. Vibrating Press Figure 2-6. Cross Section of CIP
2-6

rubber mold filled with powder. This method, also referred to as a hydrostatic pressor a rubber press method, is a materials processing technique in which fluid pressureis applied to a powder part at ambient temperature to compact it into a predeterminedshape. The powder part is consolidated into a dense compacted shape. Water or oil is usually used as the presser medium. CIPs are based on either the wet bag method,where the mold is placed in pressurized liquid, or the dry bag method, in which themold does not touch the pressurized liquid. High pressurized molding providesuniform density, which leads to a reduction of internal stresses; the elimination ofcracks, strains, and laminations; the ability to make complex shapes; and the ability topress more than one shape at the same time (The Technical Association ofRefractories, Japan, 1998). Kilns. Refractories are fired to develop the materials’ refractory properties. The
unfired (“green”) refractories pass through a heat treatment, which results in a thermally stable refractory and or crystallization. The industry uses three types of kilns:
C Tunnel Kiln: In a tunnel kiln, refractory products consecutively pass throughpreheating, firing, and cooling zones (see Figure 2-7). The combustion gas from the firing zone is typically used to preheat the refractories. Heat can be recovered from cooling fired refractories and reused as combustion air. Approximately 80 percent ofshaped refractories are fired in tunnel kilns (The Technical Association ofRefractories, Japan, 1998).
Indirect Flame System Top Combustion System Side Combustion System
Figure 2-7. Tunnel Kiln
C Round Periodic Kilns: Round periodic kilns are typically used to fire silica bricks.Figure 2-8 is a diagram of a round periodic kiln. These kilns can be used to fire largerefractory products that cannot be fired in a tunnel kiln and can easily accommodatechanges in production (The Technical Association of Refractories, Japan, 1998).
C Shuttle Kilns: As illustrated in Figure 2-9, the design of a shuttle kiln resembles thefiring zone of a tunnel kiln. Shuttle kilns effectively store heat and are used to firefireclay and specialty bricks (The Technical Association of Refractories, Japan,1998).
2-7

Figure 2-8. Round Kiln with Downdraft Figure 2-9. Shuttle Kiln System
2.1.1.2 Final Commodities
Refractories are manufactured in two forms—shaped objects and unshaped, and unshaped refractories come in granulated or plastic compositions. Briefly described here, shaped and unshaped refractories are the two broad categories of refractories. Section 2.2 contains more information on the types of refractory products.
Shaped Refractories. Preshaped refractories include bricks, shapes, and crucibles. Shaped refractories are pre-fired to exhibit their ceramic characteristics. Table 2-1 lists each type of shaped refractory and a description of its use.
Unshaped Refractories. The unshaped products include mortars, gunning mixes, castables (refractory concrete), ramming mixes, and plastics. Unshaped refractories are often referred to as “monolithics.” The manufacture of unshaped refractories differs slightly from shaped refractories. Unshaped refractories typically do not go through a firing process until they reach the final consumer. These unshaped refractories can be installed by spraying, casting, molding, or ramming. Table 2-1 lists each type of refractory and a description of its use.
2-8

Table 2-1. Types and Descriptions of Refractories Produced
Kind Definition
Shaped Refractories
Bricks Refractories that have shapes and are used to line furnaces, kilns, glass tanks, incinerators, etc.
Insulating firebrick Low thermal conductivity firebrick.
Unshaped Refractories (Monolithic)
Mortar Materials for bonding bricks in a lining. The three types of mortar—heat-setting, air-setting, and hydraulic-setting—have different setting mechanisms.
Castables Refractories for which raw materials and hydraulic-setting cement are mixed. They are formed by casting and used to line furnaces, kilns, etc.
Plastics Refractories in which raw materials and plastic materials are mixed with water. Plastic refractories are roughly formed, sometimes with chemical additives.
Gunning mixes Refractories that are sprayed on the surface by a gun.
Ramming mixes Granular refractories that are strengthened by gunning formulation of a ceramic bond after heating. Ramming mixes have less plasticity and are installed by an air rammer.
Slinger mixes Refractories installed by a slinger machine.
Patching materials/coating Refractories with properties similar to refractory mortar. However, patching materials materials have controlled grain size for easy patching or coating.
Lightweight castables Refractories in which porous lightweight materials and hydraulic cement are mixed. They are mixed with water and formed by casting. Lightweight castables are used to line furnaces, kilns, etc.
Fibrous Materials
Ceramic fiber Man-made fibrous refractory materials. There are several different types of ceramic fiber, including blanket, felt, module, vacuum form, rope, loose fiber, etc.
Source: The Technical Association of Refractories, Japan. 1998. Refractories Handbook. Tokyo: The Technical Association of Refractories, Japan.
2-9

2.1.1.3 Emissions and Controls in Refractory Manufacturing
Refractory products manufacturing facilities are sources of several HAPs. At most refractory product manufacturing facilities, the primary sources of HAP emissions are the thermal process units, such as dryers, curing ovens, and kilns. The specific types and quantities of HAPs emitted from any particular facility are largely a function of the types of raw materials used and how those materials are processed. Among others, thermal process units used to produce resin-bonded, pitch-bonded, and pitch-impregnated bricks and shapes may be sources of HAP emissions. Resin-bonded refractory curing ovens and kilns can emit phenol, formaldehyde, methanol, and ethylene glycol, depending on the type of resin used. When used as binders or additives in the production of nonresin-bonded refractory shapes, ethylene glycol and methanol also are emitted from shape dryers and kilns. Pitch-bonded refractory heated pitch storage tanks, shape dryers, and kilns emit POM. The heated pitch storage tanks, shape preheaters, defumers, and coking ovens used to produce pitch-impregnated refractories also emit POM. HF and HCl are emitted from kilns that are used to fire clay refractory products.
2.1.1.4 Inputs to Production of Refractory Products
The inputs in the production process for refractories include general inputs, such as labor, capital, and raw materials such as clay and nonclay materials. Two specific raw material inputs are discussed below.
Clays. Clay is composed mainly of fine particles of hydrous aluminum silicates and other minerals and is plastic when moist but hard when fired. In 1998, approximately 3.09 million tons (Mt) of clays were used in the manufacture of refractories. Table 2-2 lists different clays used in refractory products and their characteristics. Fireclay is the predominant clay used in firebrick; bentonite, in foundry sand; common clay, in refractory mortar and cement; and kaolin, in calcine, grog, high alumina brick, kiln furniture, and plug, tap, and wad (Virta, 1998).
2-10

Table 2-2. Types and Characteristics of Raw Materials used in Refractory Manufacture Type
Type Characteristics
Clay Refractories
Fireclay Consists of kaolinite (Al2O32SiO22H2O) and minor amount of other clay materials. Fireclay refractories can be low, medium, high, or super-duty based on their resistance to high temperature or refractoriness. Fireclay refractories are used to produce bricks, insulating refractories, and two types of ladle brick.
High-alumina Composed of bauxite or other raw materials that contain 50 to 87.5 percent alumina. High-alumina refractories are generally multipurpose, offering resistance to chipping and higher volume stability. High-alumina refractories are used to produce brick and insulating refractories.
Nonclay Refractories
Basic Produced from a composition of dead-burned magnesite, dolomite, chrome ore, and small amounts of other minerals. Basic refractories can be further subdivided into magnesia, dolomite, chrome, and combination bricks. Basic refractories are typically used to line kilns used to make bricks.
Extra-high alumina Made predominately from bauxite or alumina (Al2O3), extra-high alumina refractories contain from 87.5 to 100 percent alumina and offer good volume stability. They are typically poured into special shapes using a fused casting process.
Mullite Made from kyanite, sillimanite, andalusite, bauxite, or mixtures of alumina silicate materials; mullite refractories are about 70% alumina. They maintain a low level of impurities and high resistance to loading in high temperatures.
Silica Silica refractories are characterized by a high coefficient of thermal expansion between room temperature and 500°C (930°F). Silica brick is available in three grades: super-duty (low alumina and alkali), regular, and coke oven quality. Silica compositions can be used for hot patching, shrouds, and bricks.
Silicon carbide Produced by the reaction of sand and coke in an electric furnace, silicon carbide refractories are used to make special shapes, such as kiln furniture, to support ceramicware as it is fired in kilns. It has high thermal conductivity, good load bearing characteristics at high temperatures, and good resistance to changes in temperatures.
Zircon Containing siconium silicate (ZrO2SiO2), zircon refractories maintain good volume stability for extended periods or exposure to high temperatures. Zircon refractories are widely used for glass tank construction.
2-11

Nonclays. Nonclay refractories are composed of alumina, mullite, chromite, magnesite, silica, silicon carbide, zircon, and other nonclays. Table 2-2 lists various minerals used in the production of nonclay refractories, the type of refractory produced, and characteristics of the refractory.
2.1.2 Types of Products
As noted earlier, Table 2-1 lists the different forms of refractories and describes them briefly. Refractories are generally categorized as either clay or nonclay products. To further classify the products, refractories are labeled as acidic or basic. Refractories are typically produced as shaped refractories, unshaped refractories, and fibrous materials. Shaped refractories include bricks, shapes, and crucibles. Bricks and shapes are formed by mixing raw materials with water and/or other binders and pressing or molding the mixture into a desired shape.1 Crucibles are ceramic containers used for melting metal. Unshaped refractories, also called monolithics, are unformed products that are dried to form a unified structure after application. These refractories can be used as mortars, plastics, ramming mixes, castables, and gunning mixes. Monolithic refractories are applied by either pouring, pumping, troweling, or gunning (spraying).
2.1.3 Costs of Production
In the production process, the costs incurred by refractory manufacturers include labor, materials, and capital. This section provides data on these costs and discusses economies of scale.
2.1.3.1 Cost Data
Between 1994 and 1998, on average clay refractory manufacturers spent more than 70 percent of expenditures on input materials and nonclay refractory producers spent almost 64 percent. Figure 2-10 illustrates the percentage breakdown of refractory manufacturing expenditures by refractory type. Tables 2-3 and 2-4 also provide expenditures in dollars for wages, materials, and new capital from 1977 to 1998 in both current and 1997 dollars. Costs of materials include all raw materials, containers, scrap, and supplies used in production, repair, or maintenance during the year, as well as the cost of all electricity and fuel consumed. Costs are included for materials whether they are purchased from outside the company or transferred from within the company. New capital expenditures include permanent additions and alterations to
1Refractory bricks and shapes can be formed by a variety of methods, including hand molding, air ramming,pressing, extruding, or casting.
2-12

Average Percentage (1994-1998)
New Capital New Capital 3% 6%
Wages Wages 27% 30%
Materials Materials 70% 64%
(a) Clay Refractory (b) Nonclay Refractory Manufacturers' Expenditures Manufacturers' Expenditures
Figure 2-10. Clay and Nonclay Refractory Manufacturers’ Expenditures
facilities and machinery and equipment used for expanding plant capacity or replacing existing machinery.
These tables show that the cost of materials is by far the greatest cost to refractory producers. Refractory producers spend as much as two and a half times more on materials than they do on labor. For 1998, the Annual Survey of Manufactures reported that the clay refractory industry spent $31.6 million and the nonclay refractory industry spent $52.7 million on energy, almost 6 and 8 percent, respectively, of the total materials cost for that year. Energy costs for manufacturers of refractory bricks and shapes are generally greater than energy costs for manufacturers of monolithic refractories because of the energy-intensive nature of operations that require using forming equipment, curing ovens, shape and coking ovens, pitch and brick pre-heaters, dryers, and kilns. Table 2-5 contains a more detailed breakdown of the costs of materials used in producing and manufacturing refractory materials.
2-13

Table 2-3. Labor, Material, and New Capital Expenditures for Clay RefractoryManufacturers (NAICS 327124)a ($106)
Wages Materials New Capital
Year Current 1997 Current 1997 Current 1997
1977 146.8 224.30 296.8 453.48 20.0 30.56 1978 171.8 254.08 364.6 539.21 23.1 34.16 1979 191.5 273.16 384.7 548.74 29.4 41.94 1980 183.6 253.02 363.1 500.39 31.5 43.41 1981 199.6 266.09 410.6 547.37 36.1 48.12 1982 155.2 204.68 339.0 447.07 21.2 27.96 1983 147.1 191.19 358.5 465.94 12.0 15.60 1984 176.6 226.17 438.2 561.20 22.0 28.18 1985 166.8 211.69 397.5 504.47 22.1 28.05 1986 160.4 202.68 412.6 521.36 15.8 19.96 1987 150.2 188.05 387.5 485.15 11.7 14.65 1988 160.0 193.46 401.7 485.70 14.0 16.93 1989 176.7 207.39 451.3 529.69 11.9 13.97 1990 168.8 196.28 475.3 552.68 15.2 17.67 1991 166.0 191.22 464.8 535.40 18.5 21.31 1992 183.8 196.57 452.8 484.27 24.6 26.31 1993 163.9 180.42 377.0 415.00 7.2 7.93 1994 179.0 191.44 494.0 528.33 16.5 17.65 1995 199.0 205.37 510.3 526.63 16.6 17.13 1996 196.4 200.88 510.7 522.34 18.6 19.02 1997 210.0 210.42 566.0 567.13 30.1 30.16 1998 201.8 201.80 536.5 536.50 25.6 25.60
a Prices were deflated using the producer price index (PPI) from the Bureau of Labor Statistics. 2001. <http://146.142.4.24/cgi-bin/surveymost>.
Sources: U.S. Department of Commerce, Bureau of the Census. 1994b. 1992 Census of Manufactures, Industry Series—Cement and Structural Clay Products. Washington, DC: Government Printing Office. U.S. Department of Commerce, Bureau of the Census. 1995. 1993 Annual Survey of Manufactures. M93(AS)-1. Washington, DC: Government Printing Office. U.S. Department of Commerce, Bureau of the Census. 1996a. 1994 Annual Survey of Manufactures. M94(AS)-1. Washington, DC: Government Printing Office. U.S. Department of Commerce, Bureau of the Census. 1997. 1995 Annual Survey of Manufactures. M95(AS)-1. Washington, DC: Government Printing Office. U.S. Department of Commerce, Bureau of the Census. 1998. 1996 Annual Survey of Manufactures. M96(AS)-1. Washington, DC: Government Printing Office. U.S. Department of Commerce, Bureau of the Census. 1999b. 1997 Census of Manufactures, Industry Series—Manufacturing: Clay Refractory Manufacturing. Washington, DC: Government Printing Office. U.S. Department of Commerce, Bureau of the Census. 2000. 1998 Annual Survey of Manufactures. M98(AS)-1. Washington, DC: Government Printing Office.
2-14

Table 2-4. Labor, Material, and New Capital Expenditures for Nonclay RefractoryManufacturers (NAICS 327125)a ($106)
Wages Materials New Capital
Year Current 1997 Current 1997 Current 1997
1977 134.3 205.20 336.4 513.99 37.1 56.69 1978 162.7 240.62 434.9 643.17 43.1 63.74 1979 172.5 246.05 434.6 619.91 24.4 34.80 1980 177.4 244.47 482.3 664.66 47.2 65.05 1981 196.5 261.95 484.7 646.15 69.7 92.92 1982 148.4 195.71 343.3 452.74 48.5 63.96 1983 129.5 168.31 312.8 406.55 20.8 27.03 1984 147.5 188.90 347.1 444.53 24.7 31.63 1985 152.0 192.90 369.2 468.55 32.5 41.25 1986 162.7 205.59 372.1 470.19 13.7 17.31 1987 202.5 253.53 443.5 555.26 16.3 20.41 1988 209.6 253.43 470.7 569.12 18.0 21.76 1989 232.6 273.00 480.4 563.85 36.3 42.61 1990 239.9 278.96 499.0 580.24 30.3 35.23 1991 241.3 277.95 500.6 576.64 26.5 30.53 1992 249.2 266.52 541.4 579.03 44.9 48.02 1993 279.3 307.45 578.8 637.14 62.5 68.80 1994 247.6 264.81 562.5 601.59 41.1 43.96 1995 274.9 283.70 588.3 607.13 35.9 37.05 1996 278.6 284.95 574.0 587.09 42.7 43.67 1997 288.4 288.98 621.3 622.54 88.8 88.98 1998 307.1 307.10 650.9 650.90 96.8 96.80
a Prices were deflated using the producer price index (PPI) from the Bureau of Labor Statistics. 2001. <http://146.142.4.24/cgi-bin/surveymost>.
Sources: U.S. Department of Commerce, Bureau of the Census. 1994a. 1992 Census of Manufactures, Industry Series—Abrasive, Asbestos, and Miscellaneous Mineral Products. Washington, DC: Government Printing Office. U.S. Department of Commerce, Bureau of the Census. 1995. 1993 Annual Survey of Manufactures. M93(AS)-1. Washington, DC: Government Printing Office. U.S. Department of Commerce, Bureau of the Census. 1996a. 1994 Annual Survey of Manufactures. M94(AS)-1. Washington, DC: Government Printing Office. U.S. Department of Commerce, Bureau of the Census. 1997. 1995 Annual Survey of Manufactures. M95(AS)-1. Washington, DC: Government Printing Office. U.S. Department of Commerce, Bureau of the Census. 1998. 1996 Annual Survey of Manufactures. M96(AS)-1. Washington, DC: Government Printing Office. U.S. Department of Commerce, Bureau of the Census. 1999c. 1997 Census of Manufactures, Industry Series—Manufacturing: Nonclay Refractory Manufacturing. Washington, DC: Government Printing Office. U.S. Department of Commerce, Bureau of the Census. 2000. 1998 Annual Survey of Manufactures. M98(AS)-1. Washington, DC: Government Printing Office.
2-15

Table 2-5. Costs of Materials Used in Refractory Production and Manufacturea
Material
1997
Delivered Cost Percentage of ($106) Material Costs
1992
Delivered Cost Percentage of ($106) Material Costs
Clay NAICS 327124 Materials, ingredients, containers, and supplies
35.2 6.22 26.7 6.55
Clay, ceramic, and refractory minerals
284 50.18 209 51.26
Dead-burned magnesia or magnesite
6.9 1.22 8.4 2.05
Refractories, clay or nonclay 90.8 16.04 79.6 19.52 Other stone, clay, glass, and concrete products
4.4 0.78 5.2 1.28
Industrial chemicals 6.5 1.15 2.2 0.53 All other materials and components, parts, containers, and supplies
65.1 11.50 76.8 18.83
Nonclay NAICS 327125 Materials, ingredients, containers, and supplies Clay, ceramic, and refractory minerals Dead-burned magnesia or magnesite Refractories, clay or nonclay Other stone, clay, glass, and concrete products Industrial chemicals All other materials and components, parts, containers, and supplies
50.4 8.11
224.2 36.09
38.7 6.23
NA NA NA NA
21.4 3.44 73.9 11.89
65.4 11.12
156.2 26.58
59.1 10.05
65.6 11.16 NA NA
21.1 3.58 75.3 12.82
NA = Not available. a Prices were deflated using the producer price index (PPI) from the Bureau of Labor Statistics. 2001.
<http://146.142.4.24/cgi-bin/srgate>.
Source: U.S. Department of Commerce, Bureau of the Census. 1999b. 1997 Census of Manufactures, Industry Series—Manufacturing: Clay Refractory Manufacturing. Washington, DC: Government Printing Office.
2-16

2.2 Industry Organization
This section examines the organization of the U.S. refractory industry, including plant location and production characteristics, commercial and captive producers, firm characteristics, market structure, and degree of integration. Understanding the industry’s organization helps determine how it will be affected by complying with the refractory production NESHAP.
2.2.1 Refractory Manufacturing Facilities
A facility is a site of land with a plant and equipment that combine inputs (mineral products, organic and inorganic liquids, fuel and labor) to produce an output (refractory products). Companies that own these facilities are legal business entities that conduct transactions and make decisions that affect the facility. The terms “facility,” “establishment,” and “plant” are synonymous in this analysis and refer to the physical location where products are manufactured. Likewise, the terms “company” and “firm” are used interchangeably to refer to the legal business entity that owns one or more facilities. This section presents information on the companies that own refractory plants.
2.2.1.1 Refractories Database Facilities
Table 2-6 presents a list of 117 refractory manufacturers obtained from a publicly available financial database, including the location of the facility, its estimated sales volume in millions of dollars, and its employment. This list includes many of the facilities potentially affected by the refractory products NESHAP but does not correspond precisely to the set of facilities EPA believes may be affected, because data on those facilities were provided to EPA in confidential questionnaire responses. EPA’s data indicate that the United States has 147 refractory manufacturing facilities.
2.2.1.2 Facility Location
Census data indicate that refractory materials are produced in 37 states. Table 2-7 lists the number of refractory facilities in the 50 states and Puerto Rico, based on the Census of Manufactures. The leading refractory-producing states are Pennsylvania and Ohio, which also contain a large number of steel mills. Figure 2-11 illustrates the distribution of the refractory-producing facilities in the United States, together with the location of plants in the
2-17

Tab
le 2
-6.
Sele
cted
Ref
ract
ory
Man
ufac
ture
rs, b
y T
ype
2-18
Sale
s C
ompa
ny
Sale
s C
ompa
ny
Loc
atio
n ($
106 )
Em
ploy
men
t T
ype
Ow
ning
Com
pany
($
106 )
Em
ploy
men
t C
lay
Abl
e Su
pply
Co.
H
oust
on, T
X
NA
N
A
NA
N
A
NA
N
A
Als
ey R
efra
ctor
ies C
o.
Als
ey, I
L 10
to 2
0 20
to 4
9 Pr
ivat
e B
&B
Ref
ract
orie
s, In
c.
Sant
a Fe
Spr
ings
, CA
2.
5 10
to 1
9 Pr
ivat
e to
5
Bay
Sta
te C
ruci
ble
Co.
Ta
uton
, MA
5
to 1
0 20
to 4
9 Pr
ivat
e
Blo
om E
ngin
eerin
g C
o.,
Pitts
burg
h, P
A
38
187
Subs
idia
ry
Ster
ling
Indu
strie
s PLC
, N
A
NA
In
c.
Engl
and
BN
Z M
ater
ials
, Inc
. Li
ttlet
on, C
O
25
150
Priv
ate
Car
pent
er E
PG C
erte
ch,
Wilk
es B
arre
, PA
14
15
0 Su
bsid
iary
C
arpe
nter
Tec
hnol
ogy
Cor
p.
1,00
0 5,
324
Inc.
Car
pent
er T
echn
olog
y R
eadi
ng, P
A
1,00
0 5,
324
Publ
ic
Cor
p.C
erad
yne,
Inc.
C
osta
Mes
a, C
A
26
300
Priv
ate
Cer
tech
, Inc
. W
ood
Rid
ge, N
J 62
75
8 Su
bsid
iary
C
arpe
nter
Tec
hnol
ogy
Cor
p.
1,00
0 5,
324
CFB
Indu
strie
s, In
c.
Chi
cago
, IL
23
176
Priv
ate
Chr
isty
Ref
ract
orie
s Co.
St
. Lou
is, M
O
14
80
Priv
ate
LLC
Cla
y C
ity P
ipe
Uhr
ichs
ville
, OH
14
20
0 Pr
ivat
e C
oope
rhea
t-MQ
S, In
c.
Hou
ston
, TX
12
0 1,
200
Priv
ate
ER A
dvan
ced
Cer
amic
s, Ea
st P
ales
tine,
OH
N
A
NA
N
A
NA
N
A
NA
In
c.Er
mha
rt G
lass
O
wen
svill
e, N
J N
A
NA
N
A
NA
N
A
NA
M
anuf
actu
ring,
Inc.
Fels
Ref
ract
orie
s, In
c.
Edis
on, N
J 1
to 2
.5
NA
Pr
ivat
e Fe
rro
Cor
p.
Cle
vela
nd, O
H
331
6,69
3 Pu
blic
Fr
eepo
rt A
rea
Ente
rpris
es,
Free
port,
PA
10
15
0 Pr
ivat
e In
c.Fr
eepo
rt B
rick
Co.
C
reig
hton
, PA
N
A
NA
N
A
NA
N
A
NA
(con
tinue
d)

Tab
le 2
-6.
Sele
cted
Ref
ract
ory
Man
ufac
ture
rs, b
y T
ype
(con
tinue
d)
Sale
s C
ompa
ny
Sale
s C
ompa
ny
Loc
atio
n ($
106 )
Em
ploy
men
t T
ype
Ow
ning
Com
pany
($
106 )
Em
ploy
men
t C
lay
(con
tinue
d)
Glo
bal I
ndus
trial
D
alla
s, TX
14
2 4,
262
Publ
ic
Tech
nolo
gies
, Inc
.G
reen
AP
Ref
ract
orie
s, In
c.
Mex
ico,
MO
25
30
0 Su
bsid
iary
R
HI A
G
1,58
0 14
,500
H
eate
r Spe
cial
ists
, Inc
. Tu
lsa,
OK
17
16
0 Pr
ivat
e H
olla
nd M
anuf
actu
ring
Dol
ton,
IL
2.5
20 to
49
NA
N
A
NA
N
A
Cor
p.
to 5
H
owm
et C
orp.
W
hite
hall,
MI
1,30
0 10
,350
Su
bsid
iary
C
orda
nt T
echn
olog
ies,
Inc.
2,
513
17,2
00
Indu
stria
l Cer
amic
C
olum
bus,
OH
N
A
NA
N
A
NA
N
A
NA
Pr
oduc
ts, I
nc.
Indu
stria
l Pro
duct
En
glew
ood,
CO
1
to 2
.5
5 to
9
Priv
ate
Inte
rnat
iona
lIn
land
Ent
erpr
ise,
Inc.
A
von,
OH
14
10
0 Pr
ivat
e In
sul C
o., I
nc.
East
Pal
estin
e, O
H
15
77
Priv
ate
Inte
rnat
iona
l Chi
mne
y W
illia
msv
ille,
NY
18
14
0 Pr
ivat
e C
orp.
Lous
ivill
e Fi
rebr
ick
Wor
ks
Gra
hm, K
Y
NA
N
A
NA
N
A
NA
N
A
Mar
tin M
arie
tta M
agne
sia
Ral
eigh
, NC
Su
bsid
iary
M
artin
Mar
ietta
Mat
eria
ls,
1,05
7 57
0 Sp
ecia
lties
, Inc
. In
c.
Mar
ylan
d R
efra
ctor
ies C
o.
Iron
dale
, OH
1
to 2
.5
NA
Pr
ivat
e M
ono
Cer
amic
s, In
c.
Ben
ton
Har
bor,
MI
11
45
Subs
idia
ry
Mon
ocon
Inte
rnat
iona
l N
A
NA
R
efra
ctor
ies,
Engl
and
Mor
gani
te C
ruci
ble,
Inc.
N
orth
Hav
en, C
T 15
75
Su
bsid
iary
M
orga
n C
ruci
ble
Co.
PLC
, 1,
394
16,8
85
Engl
and
Mt.
Sava
ge F
irebr
ick
Co.
Fr
ostb
urg,
MD
N
A
NA
N
A
NA
N
A
NA
N
atio
nal R
efra
ctor
ies &
Li
verm
ore,
CA
11
5 60
0 Su
bsid
iary
N
atio
nal R
efra
ctor
y H
oldi
ng
NA
81
0 M
iner
als C
orp.
C
o., I
nc.
New
Cas
tle R
efra
ctor
ies
Mas
sillo
n, O
H
14
122
Subs
idia
ry
Dix
on T
icon
dero
ga
115
1,35
4
(con
tinue
d)
2-19

Tab
le 2
-6.
Sele
cted
Ref
ract
ory
Man
ufac
ture
rs, b
y T
ype
(con
tinue
d)
2-20
Sale
s C
ompa
ny
Sale
s C
ompa
ny
Loc
atio
n ($
106 )
Em
ploy
men
t T
ype
Ow
ning
Com
pany
($
106 )
Em
ploy
men
t C
lay
(con
tinue
d)
Nor
th A
mer
ica
Ref
ract
orie
s C
leve
land
, OH
33
1 1,
500
Subs
idia
ry
Did
ier-
Wer
ke A
G, G
erm
any
448.
5 N
A
Co.
P-G
Indu
strie
s, In
c.
Pueb
lo, C
O
12
160
Priv
ate
Plib
rico
Co.
O
ak H
ill, O
H
10 to
20
20 to
40
Priv
ate
Porv
air C
orp.
H
ende
rson
ville
, NC
18
20
0 Pr
ivat
e Pr
emie
r Ref
ract
orie
s, In
c.
Kin
g of
Pru
ssia
, PA
64
77
8 Pr
ivat
e Pr
emie
r Ref
ract
orie
s K
ing
of P
russ
ia, P
A
90
900
Subs
idia
ry
Alp
ine
Gro
up, I
nc.
1,37
0 6,
600
Inte
rnat
iona
l, In
c.Pr
yote
ch, I
nc.
Spok
ane,
WA
45
65
0 Pr
ivat
e R
efco
, Inc
. B
oyls
ton,
MA
34
88
Su
bsid
iary
In
dust
rial D
istri
butio
n 27
3 1,
200
Gro
up, I
nc.
Ref
ract
orie
s Sal
es a
nd
Bes
sem
er, A
L N
A
NA
N
A
NA
N
A
NA
Se
rvic
e C
o., I
nc.
Ren
o R
efra
ctor
ies,
Inc.
M
orris
, AL
16
85
Priv
ate
Res
co P
rodu
cts,
Inc.
N
orris
tow
n, P
A
50
500
Priv
ate
RH
I Ref
ract
orie
s Am
eric
a Pi
ttsbu
rgh,
PA
N
A
NA
N
A
RH
I Ref
ract
orie
s AG
1,
580
14,5
00
Riv
ersi
de C
lay
Co.
, Inc
. Pe
ll C
ity, A
L 15
10
0 R
iver
side
Ref
ract
orie
s, In
c.
Pell
City
, AL
14
100
Subs
idia
ry
Riv
ersi
de C
lay
Co.
, Inc
. 15
10
0 R
utla
nd P
rodu
cts
Jack
sonv
ille,
FL
NA
N
A
NA
N
A
NA
N
A
Serv
stee
l, In
c.
Mor
gan,
PA
SG
L C
arbo
n C
orp.
C
harlo
tte, N
C
255
1,89
1 Su
bsid
iary
SG
L A
ktie
nges
ells
chaf
t,G
erm
any
Shen
ango
Ref
ract
orie
s, In
c.
New
Cas
tle, P
A
5 to
10
20 to
49
Priv
ate
Ster
ling
Indu
strie
s of
Pitts
burg
h, P
A
57
312
Subs
idia
ry
Ster
ling
Indu
strie
s PLC
,D
elaw
are,
Inc.
En
glan
d Th
e N
ock
and
Son
Co.
O
ak H
ill, O
H
2.5
10 to
19
Priv
ate
to 5
(con
tinue
d)

2-21
Tab
le 2
-6.
Sele
cted
Ref
ract
ory
Man
ufac
ture
rs, b
y T
ype
(con
tinue
d)
Com
pany
Sa
les
Com
pany
L
ocat
ion
Sale
s ($1
06 ) E
mpl
oym
ent
Typ
e O
wni
ng C
ompa
ny
($10
6 ) E
mpl
oym
ent
Cla
y (c
ontin
ued)
Th
e W
hita
cre-
Gre
er F
ire
Alli
ance
, OH
5
to 1
0 N
A
Priv
ate
Proo
fing
Co.
Ther
mal
Cer
amic
s, In
c.
Aug
usta
, GA
13
8 1,
200
Subs
idia
ry
Mor
gan
Cru
cibl
e C
o. P
LC,
1,39
4 16
,885
En
glan
d Th
orle
y R
efra
ctor
ies,
Inc.
So
uthg
ate,
CA
5
to 1
0 20
to 4
9 Pr
ivat
e
Tran
sit M
ix C
oncr
ete
Co.
, Inc
. C
olor
ado
25
210
Subs
idia
ry
Con
tinen
tal M
ater
ials
N
A
NA
Sp
rings
, CO
C
orp.
, Del
awar
e TY
K A
mer
ica,
Inc.
C
lairt
on, P
A
37
122
Subs
idia
ry
TYK
Cor
p., J
apan
13
3.5
NA
U
nifr
ax C
orp.
N
iaga
ra F
alls
, 85
28
5 Su
bsid
iary
K
irkla
nd C
apita
l Par
tner
s 90
80
8 N
Y
LP
Uni
vers
al R
efra
ctor
ies,
Inc.
W
ampu
m, P
A
24
130
Priv
ate
Uta
h R
efra
ctor
ies C
o.
Lehi
, UT
NA
N
A
NA
N
A
NA
N
A
Wah
l Ref
ract
orie
s, In
c.
Frem
ont,
OH
17
68
Su
bsid
iary
Th
erm
atex
Cor
p.
10
148
Zero
Ref
ract
orie
s, In
c.
Tayl
or M
I 0.
5 1
to 4
Pr
ivat
e N
oncl
ayA
dvan
ced
Cer
amic
s Cor
p.
Cle
vela
nd, O
H
25 to
50
NA
Pr
ivat
e A
dvan
ced
Cer
amic
s C
leve
land
, OH
21
17
5 Pr
ivat
e In
tern
atio
nal,
Inc.
Alli
ed M
iner
al P
rodu
cts,
Inc.
C
olum
bus,
OH
56
24
0 Pr
ivat
e A
lpin
e G
roup
, Inc
. N
ew Y
ork,
NY
1,
370
6,60
0 Pu
blic
A
lum
inum
Com
pany
of A
mer
ica
Pitts
burg
h, P
A
15,3
00
103,
500
Publ
ic
(ALC
OA
)A
MPA
C
Am
ster
dam
, NY
13
10
0 Pr
ivat
e B
S C
Hol
ding
, Inc
. Sh
awne
e 23
15
Pr
ivat
e M
issi
on, K
S B
aker
Hol
ding
Co.
, Inc
. Y
ork,
PA
19
0 1,
300
Publ
ic
Bak
er JE
Co.
Y
ork,
PA
19
0 1,
050
Subs
idia
ry
Bak
er H
oldi
ng C
o., I
nc.
190
1,30
0 B
artle
y C
ruci
ble
& R
efra
ctor
ies,
Tren
ton,
NJ
NA
N
A
NA
N
A
NA
N
A
Inc.
(con
tinue
d)

Tab
le 2
-6.
Sele
cted
Ref
ract
ory
Man
ufac
ture
rs, b
y T
ype
(con
tinue
d)
2-22
Sale
s C
ompa
ny
Sale
s C
ompa
ny
Loc
atio
n ($
106 )
Em
ploy
men
t T
ype
Ow
ning
Com
pany
($
106 )
Em
ploy
men
t
Non
clay
(con
tinue
d)
Bet
hleh
em A
dvan
ced
Kno
xvill
e, T
N
14
110
Subs
idia
ry
The
Bet
hleh
em C
orp.
14
11
7 M
ater
ials
Cor
p.
Bla
sh P
reci
sion
Cer
amic
s, H
oust
on, T
X
63
515
Priv
ate
Inc.
(Tex
as U
nite
d)
BN
Z M
ater
ials
, Inc
. Ze
lieno
ple,
PA
1
to 2
.5
5 to
9
priv
ate
CC
PI, I
nc.
Bla
nche
ster
, OH
25
to 5
0 N
A
priv
ate
Cer
com
, Inc
. V
ista
, CA
11
76
Pr
ivat
e C
erte
ch, I
nc.
Stre
etsb
oro,
OH
62
75
8 Su
bsid
iary
C
arpe
nter
Tec
hnol
ogy
Cor
p.
1,00
0 5,
324
CFB
Indu
strie
s, In
c.
Chi
cago
, IL
23
176
Priv
ate
Chi
cago
Fire
bric
k C
o., I
nc.
Chi
cago
, IL
18
58
Priv
ate
Coo
rs P
orce
lain
Co.
, Inc
. 30
4 2,
900
Subs
idia
ry
AC
X T
echn
olog
ies,
Inc.
98
8 5,
600
Dix
on T
icon
dero
ga C
o.,
Lake
Mar
y, F
L 85
1,
562
Publ
ic
Inc.
ETS
Scha
efer
Cor
p.
Mac
edon
ia, O
H
13
195
Subs
idia
ry
Alu
mite
ch, I
nc.
21
210
Fose
co, I
nc.
Cle
vela
nd, O
H
71
500
Subs
idia
ry
Fose
co H
oldi
ng B
V,
Net
herla
nds
Glo
bal I
ndus
trial
D
alla
s, TX
14
2 4,
262
Publ
ic
Tech
nolo
gies
, Inc
.H
arbi
son-
Wal
ker
Pitts
burg
h, P
A
263
1,61
5 Su
bsid
iary
R
HI A
G
1,58
0 14
,500
R
efra
ctor
ies C
o.In
sul C
o., I
nc.
East
Pal
estin
e, O
H
15
77
Priv
ate
JW H
icks
, Inc
. M
erre
llvill
e, IN
5
to 1
0 20
to 4
9 N
A
NA
N
A
NA
M
agne
co, I
nc.
Add
ison
, IL
19
150
Subs
idia
ry
Mag
neco
/Met
rel,
Inc.
34
M
artin
Mar
ietta
Mag
nesi
a R
alei
gh, N
C
Subs
idia
ry
Mar
tin M
arie
tta M
ater
ials
, 1,
057
570
Spec
ialti
es, I
nc.
Inc.
M
inco
Acq
uist
ion
Cor
p.
Mid
way
, TN
21
17
0 Pr
ivat
e M
inco
, Inc
. M
idw
ay, T
N
15
135
Subs
idia
ry
Min
co A
cqui
sitio
n C
orp.
21
17
0 M
iner
als T
echn
olog
ies,
Inc.
N
ew Y
ork,
NY
60
9 2,
260
Publ
ic
Min
teq
Inte
rnat
iona
l, In
c.
New
Yor
k, N
Y
205
1,80
0 Su
bsid
iary
M
iner
als T
echn
olog
ies,
Inc.
60
9 2,
260
(con
tinue
d)

Tab
le 2
-6.
Sele
cted
Ref
ract
ory
Man
ufac
ture
rs, b
y T
ype
(con
tinue
d)
Sale
s C
ompa
ny
Sale
s C
ompa
ny
Loc
atio
n ($
106 )
Em
ploy
men
t T
ype
Ow
ning
Com
pany
($
106 )
Em
ploy
men
t N
oncl
ay (c
ontin
ued)
M
itsub
ishi
Cem
ent C
orp.
O
ntar
io, C
A
74
619
Subs
idia
ry
Mits
ubis
hi M
ater
ials
Cor
p.,
9,35
4 6,
556
Japa
n M
ixed
Min
eral
Pro
duct
s, C
olum
bus,
OH
N
A
NA
N
A
NA
N
A
NA
In
c.M
onof
rax,
Inc.
Fa
lcon
er, N
Y
50 to
100
25
0 to
499
Pr
ivat
e M
orga
nite
Cru
cibl
e, In
c.
Nor
th H
aven
, CT
15
75
Subs
idia
ry
Mor
gan
Cru
cibl
e C
o. P
LC,
1,39
4 16
,885
En
glan
d N
atio
nal R
efra
ctor
ies &
Li
verm
ore,
CA
11
5 60
0 Su
bsid
iary
N
atio
nal R
efra
ctor
y H
oldi
ng
Min
eral
s Cor
p.
Co.
, Inc
.
New
Cas
tle R
efra
ctor
ies
Mas
sillo
n, O
H
14
122
Subs
idia
ry
Dix
on T
icon
dero
ga
115
1,35
4 N
ewpo
rt Sa
nd &
Gra
vel
New
port,
NH
13
10
0 Pr
ivat
e C
o., I
nc.
Nor
th A
mer
ican
C
leve
land
, OH
33
1 1,
500
Subs
idia
ry
Did
ier-
Wer
ke A
G, G
erm
any
NA
N
A
Ref
ract
orie
s Co.
Nor
ton
Co.
, Inc
. W
orce
ster
, MA
1,
500
9,00
0 Su
bsid
iary
Sa
int-G
obai
n, F
ranc
e 23
,113
16
5,00
0 O
sram
Syl
vani
a, In
c.
Dan
vers
, MA
5,
200
13,0
00
Subs
idia
ry
Siem
ans C
orp.
Osr
am S
ylva
nia
Prod
ucts
, D
anve
rs, M
A
1,80
0 1,
100
Subs
idia
ry
Siem
ans C
orp.
Inc.
Pell
Indu
strie
s G
rove
City
, PA
5
to 1
0 20
to 4
9 Pr
ivat
e Pr
efro
mix
Tec
hnol
ogie
s W
arre
n, O
H
10
75
Priv
ate
LTD
Prem
ier R
efra
ctor
ies
Kin
g of
Pru
ssia
, PA
90
90
0 Su
bsid
iary
A
lpin
e G
roup
, Inc
. 1,
370
6,60
0 In
tern
atio
nal,
Inc.
Prem
ier S
ervi
ces,
Inc.
B
etts
ville
, OH
N
A
NA
N
A
NA
N
A
NA
Pyro
tek
Inc.
Sp
okan
e, W
A
50 to
100
N
A
Priv
ate
Rex
Rot
o C
orp.
Fo
wle
rvill
e, M
I 14
80
Pr
ivat
e
(con
tinue
d)
2-23

Tab
le 2
-6.
Sele
cted
Ref
ract
ory
Man
ufac
ture
rs, b
y T
ype
(con
tinue
d)
2-24
Sale
s C
ompa
ny
Sale
s C
ompa
ny
Loc
atio
n ($
106 )
Em
ploy
men
t T
ype
Ow
ning
Com
pany
($
106 )
Em
ploy
men
t N
oncl
ay (c
ontin
ued)
Sa
int-G
obai
n A
dvan
ced
Loui
svill
e, K
Y
533
3,30
0 Su
bsid
iary
N
orto
n C
o., I
nc.
Mat
eria
ls C
orp.
Se
lee
Cor
p.
Hen
ders
onvi
lle, N
C
5 19
0 Su
bsid
iary
Po
rvai
r PLC
, Eng
land
Silic
on C
arbi
de P
rodu
cts,
Elm
ira, N
Y
1 to
2.5
5
to 9
Pr
ivat
e In
c.Sp
ar, I
nc.
Jack
sonv
ille,
FL
NA
N
A
NA
N
A
NA
N
A
Ther
mat
ex C
orp.
Fr
emon
t, O
H
10
148
Priv
ate
(The
rmal
ite)
TYK
Am
eric
a, In
c.
Cla
irton
, PA
37
12
2 Su
bsid
iary
TY
K C
orp.
, Jap
an
133.
5 N
A
UC
AR
Car
bon
Co.
D
anbu
ry, C
T 10
5 1,
506
Subs
idia
ry
UC
AR
Inte
rnat
iona
l, In
c.
947
4,95
2 U
nive
rsal
Ref
ract
orie
s, In
c.
Wam
pum
, PA
24
13
0 Pr
ivat
e V
arsa
l Ins
trum
ents
, Inc
. W
arm
inst
er, P
A
15
224
Priv
ate
Ves
uviu
s Cru
cibl
e C
o.
Cha
mpa
ign,
IL
400
2,50
0 Su
bsid
iary
C
ooks
on G
roup
PLC
, 3,
011
17,1
01
Engl
and
Ves
uviu
s USA
Cor
p.
Cha
mpa
ign,
IL
400
1,60
0 Su
bsid
iary
C
ooks
on G
roup
PLC
, 3,
011
17,1
01
Engl
and
Wul
frat
h R
efra
ctor
ies,
Inc.
Ta
rent
um, P
A
22
115
Priv
ate
Zirc
ar P
rodu
cts,
Inc.
Fl
orid
a, N
Y
12
85
Priv
ate
Zirc
oa, I
nc.
Solo
n, O
H
20
140
Subs
idia
ry
Did
ier-
Wer
ke A
G, G
erm
any
448.
5 4,
717
NA
= N
ot a
vaila
ble.
Sour
ce:
Dun
& B
rads
treet
. 20
00.
D&
B M
illio
n D
olla
r Dir
ecto
ry.
Serie
s 200
0. B
ethl
ehem
, PA
: D
un &
Bra
dstre
et, I
nc.
Not
e:
The
data
use
d to
ana
lyze
com
pany
impa
cts o
f the
NES
HA
P ar
e si
mila
r but
not
iden
tical
to th
ese
data
. Th
e ac
tual
dat
a us
ed in
clud
e co
nfid
entia
l sur
vey
resp
onse
s and
thus
can
not b
e m
ade
publ
ic.

Table 2-7. Number of Refractory Manufacturing Facilities by State
Number of Refractory Plants
State Clay (NAICS 327124) Nonclay (NAICS 327125) Alabama 8 California 10 6 Georgia 5 4 Illinois 7 7 Indiana 7 Kentucky 6 Maryland 4 Michigan 7 Missouri 9 3 New York 3 New Jersey 7 North Carolina 2 Ohio 27 24 Pennsylvania 30 22 Texas 7 West Virginia 3 Totals 107 101
Source: U.S. Department of Commerce, Bureau of the Census. 1999a. 1997 Census of Manufactures. Washington, DC: Government Printing Office.
industries that are the major consumers of refractory products. States with a large number of refractory plants typically also have substantial numbers of iron and steel, cement, and/or nonferrous metal plants, indicating that refractory plant location may depend at least in part on customer location. This is likely to be particularly true for unfired shaped refractories, because they have not undergone firing and are somewhat fragile and thus difficult to transport successfully.
2.2.2 Capacity Utilization
Capacity utilization indicates how well the current facilities meet demand, which can be measured by the capacity utilization rate. A capacity utilization rate is the ratio of actual production volumes to full-capacity production volumes. For example, if an industry is
2-25

2 1 3 27 0 1
1 10
0 0 0 0 0 0 2 6 0 1 0 1
1 3 1 16
0 0 1 1 0 0
1 0
0 3 0 10
0 5 0 29
7 15 5 33
6 12 3 12
0 0 0 1
3 2 0 0 0 3
7 17 12 26
0 0 2 2
1 2 2 7
1 4
5 2 3 3
0 2 1 1
2 0 4 3
1 3 3 2
11 5 5 8
8 38 4 20
37 58 8 25 3 39 4 15
3 11 1 14
3 9 1 4
28 59 11 32
1 1 1 9
1 13 0 1
4 4 0 12
0 1 3 5 0 5 3 5
0 0 0 0
3 6
3 11 0 10
0 2 1 2 2 15 2 14 0 0 3 9 1 8 1 9
1 6 1 13 3 13
0 3 1 12
7 10 5 23
3 5 2 20
8 21 11 49 1 2
0 0 1 29
0 8 1 6 6 9
0 0 1 2
Number of Number of Refractory Facilities Steel Mills
1 2Puerto Rico 3 4
1 0 Number of Number of 0 2 Cement Plants Nonferrous Plants
Figure 2-11. Location of Refractory Manufacturing Facilities
producing as much output as possible without adding new floor space for equipment, the capacity utilization rate would be 100 percent. On the other hand, if under the same constraints the industry were only producing 75 percent of its maximum possible output, the capacity utilization rate would be 75 percent. On an industry basis, capacity utilization is highly variable from year to year depending on economic conditions. It is also variable on a company-by-company basis depending not only on economic conditions, but also on the company’s strategic position, within its particular industry. While some plants may have idle production lines or empty floor space, others need additional space or capacity.
Table 2-8 lists the capacity utilization rates for clay and nonclay refractory manufacturers for 1993 though 1998. Reduction in the demand for refractory replacements parts led to lower capacity utilization rates throughout this time period. Nonclay refractories,
2-26

Table 2-8. Full Production Capacity Utilization Rates for Clay and Nonclay Refractories: Fourth Quarters 1993 through 1998
Clay (NAICS 327125) Nonclay (NAICS 327125)
1993 75 71
1994 80 75
1995 63 81
1996 61 82
1997 49 78
1998 54 72
Source: U.S. Department of Commerce, Bureau of the Census. 1999d. 1998 Survey of Plant Capacity. Washington, DC: Government Printing Office.
which include specialty refractory products, have seen increased demand, allowing that part of the industry to maintain an approximately 70 percent capacity utilization rate.
2.2.3 Industry Concentration and Market Structure
Market structure, which characterizes the level and type of competition among refractory producers, determines the behavior of producers and consumers in the industry, including their power to influence market price. If an industry is perfectly competitive, then the individual producers have little market power; they are not able to influence the price of the outputs they sell or the inputs they purchase. Perfectly competitive industries have large numbers of firms, the products sold are undifferentiated, and the entry and exit of firms are unrestricted.
Conversely, imperfectly competitive industries or markets are characterized by a smaller number of firms, differentiated products, and restricted entry or exit. Product differentiation can occur both from differences in product attributes and quality and from brand name recognition of products. Entry and exit of firms are restricted in industries when government regulates entry (e.g., through licenses or permits), when one firm owns the entire stock of critical input, or when a single firm is able to supply the entire market.
When compared across industries, firms in industries with fewer firms, more product differentiation, and restricted entry are more likely to have the power to influence the price they receive for a product by reducing output below perfectly competitive levels. At the extreme, a single monopolistic firm may supply the entire market and hence set the price of the output. On the input market side, firms may be able to influence the price they pay for an input if few firms, both from within and outside the industry, use that input.
2-27

2.2.3.1 Measures of Industry Concentration
To assess the competitiveness of an industry, economists often estimate four-firm concentration ratios (CR4), eight-firm concentration ratios (CR8), and Herfindahl-Hirschman indexes (HHI) for the subject market or industry. The CR4s and CR8s measure the percentage of sales accounted for by the top four and eight firms in the industry. The HHIs are the sums of the squared market shares of firms in the industry. Table 2-9 provides concentration ratios for the refractory industry.
Table 2-9. Market Concentration Measures for SIC 3255 Clay Refractory Manufacturingand SIC 3297 Nonclay Refractory Manufacturing
Value
Measure Clay Nonclay
Herfindahl-Hirschmann Index (HHI) 578 527
Four-firm concentration ratio (CR4) 40 36
Eight-firm concentration ratio (CR8) 62 58
Number of companies 95 102
Number of facilities 145 142
Value of shipments 886.8 1,203.8
Source: U.S. Department of Commerce, Bureau of the Census. 1996b. Concentration Ratios in Manufacturing. MC92-S-2. Washington, DC: Government Printing Office. Available at <http://www.census.gov/mcd/mancen/download/mc92cr.sum>.
Unfortunately, there is no objective criterion for determining market structure based on the values of these concentration ratios. However, there are criteria for determining market structure based on the HHIs for use in merger analyses, which are provided in the 1992 Department of Justice’s Horizontal Merger Guidelines (U.S. Department of Justice and the Federal Trade Commission, 1992). According to these criteria, industries with HHIs below 1,000 are considered unconcentrated (i.e., more competitive), and those with HHIs between 1,000 and 1,800 are considered moderately concentrated (i.e., moderately competitive). Firms in less-concentrated industries are more likely to be price takers, while firms in more-concentrated industries are more likely to be able to influence market prices. These measures of market concentration can be computed using four-digit Standard Industrial Classification (SIC) codes based on U.S. Bureau of the Census data (U.S. Department of Commerce, 1993). Based on the HHI criteria, the refractory industry is not concentrated, and, therefore, competitive in structure. These indices are measures of concentration of the industry at the national level.
2-28

2.2.3.2 Market Structure
The majority of products of the refractories industry are used as inputs for the steel industry. The relatively small numbers of steel companies that are prominent users of refractory products may result in the buyers maintaining some measure of control over the input price (monopsony or oligopsony).
A monopsony occurs when a firm is the sole purchaser of an input. The monopsonist has the market power in the input market and can reduce the price paid without losing all input. An oligopsony is characterized by the presence of a few large buyers (even though there may also be many small buyers of insignificant size). In oligopsony, large firms are aware of their competitors for purchasing inputs and determine their purchasing price and quantity based on their expectations of their competitors’ behavior. Although there may be some degree of market power exerted by steel companies on the demand side of the refractories market, our analysis treats the markets for refractory products as competitive.
2.2.3.3 Small Businesses that Own Refractory Facilities
To determine the possible impacts on small businesses, both clay and nonclay refractory manufacturers are categorized as small or large using the Small Business Administration (SBA) general size definitions (SBA, 1998). For clay refractory manufacturers, a small company has 500 or fewer employees. For nonclay refractory manufacturers, small is defined as having 750 or fewer employees.
Table 2-10 lists the employment and sales data for small companies that are owners of refractory-producing facilities. Again as in Table 2-6, these data are based on information available from publicly available sources. EPA’s database provides information on company size, and its analysis of small business impacts is based on the best data currently available
2-29

Table 2-10. Characteristics of Small Businesses in the Refractory Industry
Company Location Sales ($106) Employment
Organization Type
Able Supply Co. Houston, TX NA NA NA Alsey Refractories Co. Alsey, IL 10 to 20 20 to 49 Private B&B Refractories Inc. Santa Fe Springs, CA 2.5 to 5 10 to 19 NA Bay State Crucible Co. Taunton, MA 5 to 10 20 to 49 NA Ceradyne Inc. Costa Mesa, CA 26 300 Private Christy Refractories Co. LLC St. Louis, MO 14 80 Private Clay City Pipea Uhrichsville, OH 14 200 Private ER Advanced Ceramics Inc. East Palestine, OH NA NA NA Ermhart Glass Manufacturing Owensville, NJ NA NA NA Inc. Fels Refractories Inc. Edison, NJ 1 to 2.5 NA Private Freeport Area Enterprises Inc.a Freeport, PA 10 150 Private Freeport Brick Co. Creighton, PA NA NA NA Heater Specialists, Inc.a Tulsa, OK 17 160 Private Holland Manufacturing Corp. Dolton, IL 25 to 5 20 to 49 Private Industrial Ceramic Products Inc. Columbus, OH NA NA NA Industrial Product International Englewood, CO 1 to 2.5 5 to 9 Private Inland Enterprise Inc. Avon, OH 14 100 Private International Chimney Corp.a Williamsville, NY 18 140 Private Lousiville Firebrick Works Grahm, KY NA NA NA Maryland Refractories Co. Irondale, OH 1 to 2.5 NA Private Mt. Savage Firebrick Co. Frostburg, MD NA NA NA P-G Industries Inc. Pueblo, CO 12 160 Private Plibrico Co. Oak Hill, OH 10 to 20 20 to 49 NA Porvair PLC United Kingdom 88.2 658 Public Refractories Sales and Service Bessemer, AL NA NA NA Co. Inc. Reno Refractories Inc. Morris, AL 16 85 Private Resco Refractories, Inc. Norristown, PA 50 500 Private Riverside Clay Co. Inc. Pell City, AL 15 100 NA Rutland Products Jacksonville, FL NA NA NA
(continued)
2-30

Table 2-10. Characteristics of Small Businesses in the Refractory Industry (continued)
Company Location Sales ($106) Employment
Organization Type
Servsteel Inc. Morgan, PA Shenango Refractories, Inc. New Castle, PA 5 to 10 20 to 49 Private Nock and Son Co., The Oak Hill, OH 2.5 to 5 10 to 19 Private Whitacre-Greer Fire Proofing Alliance, OH 5 to 10 NA Private Co., The Thorley Refractories Inc. Southgate, CA 5 to 10 20 to 49 Private Utah Refractories Co. Lehi, UT NA NA NA Zero Refractories, Inc. Taylor MI 0.5 to 1 1 to 4 Private BNZ Materials Inc. Littleton, CO 25 150 Private CFB Industries Inc.a Chicago, IL 23 176 Private Insul Co. Inc. East Palestine, OH 15 77 Private Pyrotek Inc.a Spokane, WA 50 to 100 NA Private Thermatex Corp. (Thermalite) Fremont, OH 10 148 Private Universal Refractories Inc. Wampum, PA 24 130 Private Advanced Ceramicsa Cleveland, OH 21 175 Private International Inc. Allied Mineral Products Inc. Columbus, OH 56 240 Private Alumitech Inc.a Canada 77 447 Public AMPACa Amsterdam, NY 13 100 Private B S C Holding Inc.a Shawnee Mission, KS 23 15 Private Bartley Crucible & Refractories, Trenton, NJ NA NA NA Inc. Blash Precision Ceramics, Inc. Houston, TX 63 515 Private (Texas United) CCPI Inc. Blanchester, OH 25 to 50 NA Private Cercom Inc.a Vista, CA 11 76 Private Chicago Firebrick Co. Inc.a Chicago, IL 18 58 Private JW Hicks Inc. Merrellville, IN 5 to 10 20 to 49 Private Magneco/Metrel Inc. Addison, IL 34 150 Private Minco Acquistion Corp.a Midway, TN 21 170 Private
(continued)
2-31

Table 2-10. Characteristics of Small Businesses in the Refractory Industry (continued)
Company Location Sales ($106) Employment
Organization Type
Mixed Mineral Products Inc.a Columbus, OH NA NA NA Monofrax Inc.a Falconer, NY 50 to 100 250 to 499 Private Newport Sand & Gravel Co. Newport, NH 13 100 Private Inc.a
Pell Industries Grove City, PA 5 to 10 20 to 49 Private Prefromix Technologies LTDa Warren, OH 10 75 Private Premier Services, Inc. Bettsville, OH NA NA NA Rex Roto Corp. Fowlerville, MI 14 80 Private Silicon Carbide Products Inc. Elmira, NY 1 to 2.5 5 to 9 NA Spar, Inc. Jacksonville, FL NA NA NA Bethlehem Corporation, Thea Easton, PA 14 117 Private Varsal Instruments Inc.a Warminster, PA 15 224 Private Wulfrath Refractories Inc. Tarentum, PA 22 115 Private Zircar Products Inc. Florida, NY 12 85 Private
a These companies were listed by Ward’s Business Directory under the NAICS codes 327124 and 32712. However, they were not linked to a facility in the database. These companies are ignored in the remaining small business analysis.
about the size of companies owning refractory products manufacturing facilities, including both questionnaire responses and publicly available information. To avoid revealing confidential questionnaire data, however, we present only the publicly available data in this section. Data on employment and sales for many of these companies are difficult to acquire from public sources, because they are privately held. Publicly available data suggest that a total of 56 small businesses own 71 facilities that produce refractory products. These are shown in Table 2-10.
In its analysis of small business impacts, EPA has chosen to use a small business size criterion of 750 employees regardless of the primary North American Industry Classification System (NAICS) code of the company. EPA made this decision because some companies in the industry produce both clay and nonclay refractories, making it difficult to assign such companies to a single NAICS code. Using the higher 750 employee small business criterion for all affected companies may overstate the number of small businesses affected by the rule. EPA has obtained company employment and sales data from potentially regulated facilities, some of which are confidential. Based on this information and a small business size criterion of 750 employees, EPA has identified 56 small businesses that are potentially affected by the NESHAP, out of a total of 76 companies owning refractory manufacturing facilities.
2.2.4 Current Production Trends in the Refractory Industry
2-32

2.3
To remain competitive, refractory manufacturers have continued to improve raw materials and manufacturing and testing processes. The trend toward increased lining life in most applications has reduced the costs of repair and replacement to refractory consumers. Improvements in the production process of steel, glass, and petrochemicals in combination with improvements in refractory products and linings have culminated to reduce the amount of refractory consumption. Recently, the basic oxygen steelmaking furnace linings have exceeded 20,000 heats. The glass industry has experienced increased time between repairs in glass furnaces from every 4 years to 13 years, with little or no preventative maintenance (Sheppard, 2000; Ceramic Industry, 2000). From 1998 to 1999, the refractory industry reported a 6 percent decline in production and a 12 percent decline in turnover (DHAN, 1999).
Because of improved quality of refractory products, increased life span of refractory products, and the availability of cheaper refractory imports, the steel industry has decreased consumption of refractories from 25 to 30 kg per ton of steel to 10 kg in Japan and the United States (Semler, 2000). Other consumers of refractory products, including the petroleum industry and concrete industry, are following the steel industry’s pattern of reducing consumption of refractories.
The Demand Side
Estimating the economic impacts of the regulation on the refractory manufacturing industry requires characterizing various aspects of the demand for refractory products. This section describes the product characteristics desired by end users; the uses for refractories, including use in the glass, metal, and electronics industries; and possible substitutes for refractories.
2-33

2.3.1 Product Characteristics
Because the quality and characteristics of refractories vary considerably, consumers often employ chemical and physical tests to ensure that the refractories purchased meet their requirements. The American Society for Testing and Materials (ASTM) provides specifications and tests for various kinds and uses of refractory products. Depending on the intended end use, consumers may test refractories for thermal conductivity, resistance to abrasion and corrosion, permeability, oxidation resistance, pyrometric cone equivalence, and other characteristics (ASM International, 1987).
Most refractory products are sold as preformed shapes. However, they are also available in special purpose clays; bonding mortars; monolithic, plastic refractories; ramming mixes; and gunning mixes. A variety of processed refractory grains and powders are also produced (DHAN, 1999). From the physical form, refractory products can be further classified into oxide bricks, nonoxide bricks, and composites. Table 2-11 lists types of oxide, nonoxide, and composite refractories; their characteristics; and their applications.
2.3.2 Uses and Consumers
Principle end-use markets for refractory products include the iron and steel, cement, and nonferrous metal industries. The steel industry consumes the largest percentage of refractories, estimated between 50 and 80 percent of the refractory production (Semler, 2000).2
Table 2-12 presents metric ton production of raw steel and nonferrous metals for the period 1994 to 1999. Refractory products are used in the steel industry to line coke ovens, blast furnaces, blast furnace stoves, basic oxygen vessels, electric furnaces, open-hearth furnaces, and other heat-related manufacturing equipment (ASM International, 1987). As described above, refractory products are used by steel, cement, and nonferrous metals producers. Refractory products manufacturing facilities are typically located close to their consumers (see map in Figure 2-11).
2The U.S. International Trade Commission (USITC) estimated consumption of the steel industry at over 50 percent,and DHAN estimated it at 75 percent.
2-34

Table 2-11. Characteristics and Types of Refractories
Refractory Type General Characteristics Application
Oxide Bricks
Silica High strength at high temperatures, residual expansion, Glass tank crown, copper refining furnace, low specific gravity, high expansion coefficient at low electric arc furnace roof temperatures, low expansion coefficient at high temperatures
Fused silica Low thermal expansion coefficient, high thermal shock Coke oven, hot stove, soaking pit, glass resistance, low thermal conductivity, low specific tank crown gravity, low specific heat
Chamotte Low thermal expansion coefficient, low thermal Ladle, runner, sleeve, coke oven, annealing (fireclay) conductivity, low specific gravity, low specific heat, low furnace, blast furnace hot stove, reheating
strength at high temperatures, less slag penetration furnace, soaking pit
Alumina High refractoriness, high mechanical strength, high slag Hot stove, stopper head, sleeve, soaking pit resistance, high specific gravity, relatively high thermal cover, reheating furnace, glass tank, high-conductivity temperature kiln
High alumina High refractoriness, high mechanical strength, high slag Slide gate, aluminum melting furnace, skid resistance, high specific gravity, relatively high thermal rail, ladle, incinerator, reheating furnace conductivity hearth, skid rail, ladle, incinerator
Roseki Low thermal expansion coefficient, high thermal shock Ladle, runner, sleeve, coke oven, annealing resistance, low thermal conductivity, low specific furnace, blast furnace hot stove, reheating gravity, low specific heat furnace, soaking pit
Zircon High thermal shock resistance, high slag resistance, high Ladle, nozzle, stopper head, sleeve specific gravity
Zirconia High melting point, low wettability against molten metal, Nozzle for continuous casting, glass tank, low thermal conductivity, high corrosion resistance, high high-temperature furnace, crucible specific gravity
Alumina zirconia High slag resistance, high corrosion resistance against Glass tank, incinerator, ladle, nozzle for silica molten glass continuous casting
Lime High slag resistance, low hydration resistance Special refining surface
Magnesia High refractoriness, relatively low strength at high Hot-metal mixer, secondary refining temperature, high basic slag resistance, low thermal vessel, rotary kiln, checker chamber of shock resistance, low durability at high humidity glass tank, electric arc furnace
Magnesia-chrome High refractoriness, high refractoriness under load, high Hot-metal mixer, electric arc furnace, basic slag resistance, relatively good thermal shock secondary refining vessel, nonferrous resistance (low MgO bricks), high strength at high refining furnace, rotary cement kiln, lime temperature (direct bonded and fusion cast) and dolomite kiln, copper furnace, ladle,
checker chamber for glass tank, slag line of electric arc furnace, degasser for copper, nonferrous smelter
(continued)
2-35

Table 2-11. Characteristics and Types of Refractories (continued)
Refractory Type General Characteristics Application
Oxide Bricks (continued)
Chrome High refractoriness, low strength at high temperature, low thermal resistance
Buffer brick between acid and basic brick
Dolomite High refractoriness, high refractoriness under load, high basic slag resistance, low durability in high humidity, high thermal expansion coefficient
Basic oxygen furnace, electric arc furnace, secondary refining vessel, rotary cement kiln
Spinel High thermal shock resistance, high strength at high temperatures, high slag resistance
Rotary cement kiln, ladle
Nonoxide Bricks
Carbon High refractoriness, high slag resistance, low oxidation resistance
Blast furnace hearth, electric arc furnace
Silicon carbide High refractoriness, high strength at high temperature, high thermal conductivity, high thermal shock resistance, reduced oxidation resistance at high temperature, high slag resistance
Kiln furniture, incinerator, blast furnace
Silicon carbide-graphite
High refractoriness, high strength at high temperature, high thermal conductivity, high thermal shock resistance
Incinerator
Silicon nitride High strength, high thermal shock resistance, relatively high oxidation resistance
Kiln furniture, blast furnace
Composite
Silicon carbide Containing
High corrosion resistance against low iron oxide, high strength at high temperatures, high thermal shock resistance
Ladle, blast furnace, electric arc, torpedo ladle, iron ladle
Magnesia-carbon High slag resistance, high thermal shock resistance Basic oxygen furnace, electric arc furnace, ladle
Alumina-carbon High refractoriness, high thermal shock resistance, high corrosion resistance
Submerged entry nozzle, slide gate
Source: The Technical Association of Refractories, Japan. 1998. Refractories Handbook. Tokyo: The Technical Association of Refractories, Japan.
2-36

3 2.3.Table 2-12. Steel and Nonferrous Production (103 Metric Tons)
Su Year Raw Steel Production Nonferrous bsti 1994 91,300 11,216 tuti 1995 95,200 13,606 on Pos 1996 94,700 11,608
sibi 1997 98,500 14,501
liti 1998 98,700 14,811 es 1999 95,300 15,215in Co Source: U.S. Department of Commerce, and International Trade Administration. 1999. U.S. Industry & Trade nsu Outlook 2000. New York: The McGraw-Hill Companies and U.S. Department of Commerce. mp tion
Although there is no direct substitute for refractories, industries that use refractory products have reduced the amount of the product consumed. Since the 1980s, the steel industry has closed inefficient facilities and modernized remaining plants. The industry developed and implemented technologies, such as the basic oxygen furnace (BOF), that significantly reduced the amount of refractories used per ton of steel (USITC, 1994; DHAN, 1999). Also, the refractory industry has made significant strides in developing more durable refractories. These two factors have reduced the overall consumption of refractory materials.
2.4 Markets for Refractory Products
This section provides data on domestic production, domestic consumption, imports, exports of refractories, and gross margin growth in prices. It also discusses trends and projections for the refractory industry.
2.4.1 Market Data
This section provides data on volumes of refractory products produced and consumed in the United States, the quantities imported and exported, and prices. Figure 2-12 illustrates historic trends in refractory production.
2-37

1977
1978
1979
1980
1981
1982
1983
1984
1985
1986
1987
1988
1989
1990
1991
1992
1993
1994
1995
1996
1997
1998
0
50 0
1, 00 0
1, 50 0
2, 00 0
2, 50 0
3, 00 0
$106
Clay Nonclay Total
Figure 2-12. Historical Refractory Production TrendsNote: All financial figures are adjusted for inflation using the producer price index available from the U.S. Bureau
of Labor.
2.4.1.1 Domestic Production
During the last two decades, the refractory industry has been affected by declining demand per production of steel for traditional refractory products, such as bricks and shapes, and customer requirements for higher-quality special refractories. Accounting for nearly 40 percent of all shipments, bricks and shapes are the principal forms of refractory products produced in the United States (USITC, 1993). Table 2-13 illustrates the values of domestically produced clay and nonclay refractories from 1977 to 1998 in both current and 1998 dollars.
2.4.1.2 International Trade
As indicated in Table 2-14, international trade is not a major component of the U.S. market for refractory products. In 1999, refractory exports accounted for a little over 16 percent of shipped refractory products. Nations with significant iron, steel, cement, and nonferrous metal industries, including the United States, Europe, and Japan, are the major world markets for refractory products. From 1988 to 1992, Canada was the leading importer
2-38

Table 2-13. Production of Refractories: 1977–1998 ($106)
Year
Clay Nonclay Total
Current 1998 Current 1998 Current 1998 1977 607.2 848.9 680.2 950.9 1,287.4 1,799.8 1978 717.3 956.4 864.2 1,152.3 1,581.5 2,108.7 1979 776.9 983.5 934.9 1,183.5 1,711.8 2,167.0 1980 761.6 922.4 975.9 1,182.0 1,737.5 2,104.4 1981 864.2 976.0 1020.9 1,153.0 1,885.1 2,129.0 1982 670.3 738.4 691.0 761.2 1,361.3 1,499.5 1983 745.5 813.8 588.9 642.9 1,334.4 1,456.7 1984 868.6 920.1 701.4 743.0 1,570.0 1,663.1 1985 803.0 849.2 755.3 798.7 1,558.3 1,647.9 1986 843.5 931.4 768.5 848.6 1,612.0 1,780.0 1987 788.2 851.2 954.5 1,030.8 1,742.7 1,882.1 1988 836.7 851.0 1,078.1 1,096.5 1,914.8 1,947.5 1989 906.3 892.5 1,113.3 1,130.3 2,019.6 2,022.8 1990 922.9 927.0 1,077.6 1,082.4 2,000.5 2,009.5 1991 850.4 872.6 1,009.2 1,035.5 1,859.6 1,908.1 1992 886.8 930.6 1,203.5 1,263.0 2,090.3 2,193.6 1993 758.0 784.6 1,282.2 1,327.1 2,040.2 2,111.7 1994 938.8 929.5 1,232.2 1,220.0 2,171.0 2,149.5 1995 958.2 896.2 1,370.4 1,281.7 2,328.6 2,178.0 1996 977.3 953.6 1,459.4 1,424.0 2,436.7 2,377.6 1997 1,101.6 1,072.9 1,631.2 1,588.7 2,732.8 2,661.6 1998 1,082.8 1,082.8 1,535.8 1,535.8 2,618.6 2,618.6
Sources: U.S. Department of Commerce, Bureau of the Census. 1994b. 1992 Census of Manufactures, Industry Series—Cement and Structural Clay Products. Washington, DC: Government Printing Office. U.S. Department of Commerce, Bureau of the Census. 1995. 1993 Annual Survey of Manufactures. M93(AS)-1. Washington, DC: Government Printing Office. U.S. Department of Commerce, Bureau of the Census. 1996a. 1994 Annual Survey of Manufactures. M94(AS)-1. Washington, DC: Government Printing Office. U.S. Department of Commerce, Bureau of the Census. 1997. 1995 Annual Survey of Manufactures. M95(AS)-1. Washington, DC: Government Printing Office. U.S. Department of Commerce, Bureau of the Census. 1998. 1996 Annual Survey of Manufactures. M96(AS)-1. Washington, DC: Government Printing Office. U.S. Department of Commerce, Bureau of the Census. 1999b. 1997 Census of Manufactures, Industry Series—Manufacturing: Clay Refractory Manufacturing. Washington, DC: Government Printing Office. U.S. Department of Commerce, Bureau of the Census. 2000. 1998 Annual Survey of Manufactures. M98(AS)-1. Washington, DC: Government Printing Office.
2-39

Table 2-14. Exports and Imports of Refractories: 1993–1999 ($106 1998)
Year
Exports Imports Apparent Consumption
Clay Nonclay Total Clay Nonclay Total Clay Nonclay Total
1993 72.8 251.9 324.7 28.8 177.7 206.5 740.3 1,065.2 1,805.5
1994 62.1 262.9 325.5 26.4 183.7 210.1 843.3 992.8 1,836.1
1995 76.8 298.0 374.8 33.2 198.6 231.8 873.8 1,045.6 1,919.3
1996 71.7 314.7 386.4 27.0 211.1 238.2 856.9 1,077.4 1,934.3
1997 81.8 290.1 372.0 27.8 248.3 275.9 863.5 1,197.5 2,061.0
1998 59.6 278.9 338.6 30.9 225.1 256.0 942.0 1,113.3 2,055.3
1999 53.2 287.4 340.6 104.0 218.7 323.2 934.5 989.0 1,923.6
Source: U.S. Department of Commerce, Bureau of the Census. 1993–1999. Current Industrial Reports: Refractories. MA 32C. Available at <http://www.census.gov/industry/ma32c97>.
of U.S. refractory products, with over 38 percent of all exports, followed by Mexico. Emerging foreign markets for the United States include India, China, and other countries in Central and South America. Japan and Canada are the top suppliers of imports to the United States (USITC, 1994). Recently, exports of refractory products have fallen and imports of refractory products have increased.
2.4.2 Market Prices
Table 2-15 lists average prices for refractory products for 1989, 1993, and 1998. Monolithic refractory prices have decreased 2 percent and bricks and shapes have increased 4.8 percent since 1993. Most refractory products are typically used in kilns and ovens and are engineered for a particular use. Price is typically based on the consumer’s requirements.
2.4.3 Industry Trends
In the last decade, the refractory industry has experienced significant restructuring. Two large conglomerates, RHI and Vesuvius, dominated refractories markets (Sheppard, 2000). In 1999, Alpine Group sold its Premier Refractories unit to Cookson Group of the U.K., and Global Industrial Technologies (parent of Harbison-Walker Refractories) was acquired by RHI AG (formerly Radex Heraklith Industriebeteiligungs) of Austria. Other leading refractory producers are Allied Mineral Products, Baker Refractories, Minerals
2-40
Table 2-15. Average Price for Refractory Productsa ($/ton)
Form
1989 1993 1998
Current 1998 Current 1998 Current
Monolithics 451 526 491 544 533
Bricks and shapes 709 826 782 866 910
Otherb 394 459 442 490 497
a Prices were deflated using the producer price index (PPI) from the Bureau of Labor Statistics. 2001. <http://146.142.4.24/cgi-bin/surveymost>.
b Other refractory forms consist of ceramic fibers and refractory raw materials that are supplied in lump or ground form used to manufacture refractories “in-house.”
Source: Freedonia Group. September 1999. “Refractories in the United States to 2003.” Profound WorldSearch <http://www.profound.com>
Technologies (via MINTEQ), Morgan Crucible, National Refractories Holding Co., Resco Products, and Compagnie de Saint-Gobain.
In recent years, consumption of domestically produced refractory products has declined somewhat, as a result of several compounding trends. First, the quality of refractory products has increased, resulting in longer life and fewer replacements. Thus, the tons of refractory products consumed per ton of steel produced have declined somewhat. In addition, imports of refractory products have increased approximately 57 percent from 1993 to 1999, so a smaller share of the refractory products consumed domestically are produced domestically.
2-41

SECTION 3
ENGINEERING COST ANALYSIS
Control measures implemented to comply with the MACT standard will result in higher production costs for affected refractory facilities. The engineering analysis computed estimates of these compliance costs (annual capital, operating, testing, monitoring, reporting and record keeping) for each affected facility under baseline economic conditions. These estimates serve as key inputs to the economic model.3 The following section presents a brief overview of emissions from refractory products manufacturing and the estimated costs refractory products manufacturers are projected to incur to comply with the rule. More detailed information is provided in technical memoranda (Marinshaw and Fields, 2003a and 2003b).
3.1 Overview of Emissions from Refractory Manufacturing
Refractory products manufacturing facilities are sources of several HAPs. The specific types and quantities of HAPs emitted from any particular facility are largely a function of the types of raw materials used and how those materials are processed. Resin-bonded refractory curing ovens and kilns can emit phenol, formaldehyde, methanol, and ethylene glycol, depending on the type of resin used. When used as binders or additives in the production of nonresin-bonded refractory shapes, ethylene glycol and methanol also are emitted from shape dryers and kilns. Pitch-bonded refractory heated pitch storage tanks, shape dryers, and kilns emit POM. The heated pitch storage tanks, shape preheaters, defumers, and coking ovens used to produce pitch-impregnated refractories also emit POM. HF and HCl are emitted from kilns that are used to fire clay refractory products.
Section 112 of the Clean Air Act lists 189 HAPs and defines major sources as those facilities that emit or have the potential to emit at least 10 tons per year of any single HAP or at least 25 tons per year of any combination of HAPs. Area sources are those with potential uncontrolled emissions of less than 10 tons per year of any HAPs and less than 25 tons per year of combined HAPs. Synthetic area sources are area sources that would be major sources if existing controls at those facilities were not in place. In other words, synthetic area sources are those sources whose uncontrolled HAP emissions exceed the major source thresholds of 10 tons per year of a single HAP or 25 tons per year of combined HAPs. Synthetic area sources are of particular significance because those facilities are included in the MACT floor analysis for existing sources, whereas “true” area sources are not included in the floor determinations and are not subject to the requirements of the rule.
3In the market model, the engineering cost inputs are expressed per unit of refractory product ($/ton) and used toshift the refractory supply functions in the market model to predict the response in price and production levels. Details can be found in Section 4 and Appendix A.
3-1

Based on the HAP emission estimates within the refractory products manufacturing industry five facilities emit at least 10 tons per year of a single HAP and two other facilities emit more than 8.5 tons/yr of a single HAP. In view of the uncertainties in emission estimation techniques, these two facilities also could be major sources. One facility is a considered major source for co-located process operations. The Agency estimates that, of the 147 refractory products manufacturing facilities currently in operation in this source category, 133 are area sources, eight are major sources, and six are synthetic area sources.
The Agency estimates that of the eight major sources two emit major amounts of HF emissions and HCl emissions resulting from clay calcining and/or clay refractory manufacturing and are not expected to be subject to the rule (because only new clay kilns, and not existing kilns, would be subject to substantive requirements of the rule for reducing HF and HCl). New kilns used to fire chromium refractories would similarly be subject only to new source MACT and would not be required to control existing sources for reducing chromium emissions from kilns.
Therefore, six existing major sources would have costs associated with compliance with the standard for organic HAPs, in addition to two facilities required to do recordkeeping and reporting. Costs for these facilities are shown in Table 3-1.
3.2 Compliance Cost Estimates
Sources of emissions at refractory manufacturing facilities that are covered by the NESHAP for refractory manufacturing are
C new kilns that fire chromium refractories and clay refractories and
C heated processes that emit organic HAPs at new and existing sources, including
S curing ovens, drying ovens (shape dryers), and kilns used at refractory product manufacturing facilities that are major sources emitting organic HAPs from the affected sources, and
3-2

Tab
le 3
-1.
Sum
mar
y of
Est
imat
ed A
nnua
l Com
plia
nce
Cos
ts fo
r R
efra
ctor
y Pr
oduc
ts M
anuf
actu
ring
NE
SHA
P
3-3
Con
trol
Cos
ts
Ann
ual-
Ann
ual-
Tot
al
Ann
ual-
ized
iz
ed
Ann
ual
Ann
ual
Ann
ual
Ann
ual
Ann
ual
Ann
ualiz
ed
Ann
ual
ized
R
ecor
d-T
otal
In
itial
C
apita
l O
verh
ead
Tax
es, I
ns.,
Mai
nten
ance
E
nerg
y L
abor
C
ontr
ol
Tes
ting
Mon
itor-
keep
ing
Ann
ualiz
ed
Cap
ital C
ost
Cos
t C
ost
Adm
in. C
ost
Mat
eria
l Cos
t C
ost
Cos
t C
osts
C
ost
ing
Cos
t C
ost
Cos
t Pl
ant I
D
($)
($/y
r)
($/y
r)
($/y
r)
($/y
r)
($/y
r)
($/y
r)
($/y
r)
($/y
r)
($/y
r)
($/y
r)
($/y
r)
R00
4 $1
,115
,200
$1
58,8
00
$15,
600
$44,
600
$10,
300
$376
,000
$1
5,70
0 $6
21,0
00
$31,
800
$16,
800
$8,0
00
$677
,600
R01
2 $1
,368
,200
$1
94,8
00
$48,
300
$54,
700
$31,
900
$222
,200
$4
8,60
0 $6
00,5
00
$36,
500
$8,0
00
$8,0
00
$653
,000
R02
7 $9
44,1
00
$134
,400
$8
,500
$3
7,80
0 $5
,600
$7
2,70
0 $8
,600
$2
67,6
00
$14,
400
$4,8
00
$8,0
00
$294
,800
R06
5 $3
83,4
00
$54,
600
$12,
400
$15,
300
$8,2
00
$179
,600
$1
2,50
0 $2
82,6
00
$4,6
00
$1,6
00
$8,0
00
$296
,800
R11
1 $0
$0
$0
$0
$0
$0
$0
$0
$0
$0
$1
,200
$1
,200
R12
6 $0
$0
$0
$0
$0
$0
$0
$0
$0
$0
$1
,200
$1
,200
R12
8 $0
$0
$0
$0
$0
$5
0,20
0 $0
$5
0,20
0 $3
6,30
0 $1
2,80
0 $8
,000
$1
07,3
00
R17
8 $7
94,1
00
$113
,100
$1
9,90
0 $3
1,80
0 $1
3,10
0 $5
5,30
0 $2
0,00
0 $2
53,2
00
$16,
300
$4,8
00
$8,0
00
$282
,300
Tota
l $4
,605
,000
$6
55,7
00
$104
,700
$1
84,2
00
$69,
100
$956
,000
$1
05,4
00
$2,0
75,1
00
$139
,900
$4
8,80
0 $5
0,40
0 $2
,314
,200

S brick preheaters, pitch working tanks, defumers, and coking ovens used at pitch-impregnated refractory manufacturing facilities.
As noted above, HAPs that EPA has identified as being emitted from refractory manufacturing facilities include chromium, HF, HCl, phenol, POM, ethylene glycol, methanol, and formaldehyde.
The costs associated with improved emissions control are estimated based on what each plant may have to do to control organic HAP emissions. Controlled sources include thermal process units (i.e, dryers, curing ovens, kilns, coking ovens, defumers, and heated pitch storage tanks) that emit one or more organic HAPs. As shown in Table 3-1, the Agency estimates the nationwide costs of the rule are $2.31 million. EPA estimates that initial capital costs will total $4.6 million. These capital costs, annualized over a period of 20 years at a 7 percent rate of interest, result in annualized capital costs of approximately $655,700. The total annualized costs include these annualized capital costs, $1,419,400 of annual overhead, administrative, and operating and maintenance costs for emissions controls, and $239,100 of testing, monitoring, recordkeeping, and reporting costs. Among the six facilities incurring control costs, the total annualized costs range from $1,200 to $677,600 and average $289,300.
3.2.1 Emission Control Costs
Emission control costs include the costs of purchasing and installing emission control capital equipment and operating and maintenance costs including the costs of labor, materials, and energy to operate the controls, and any associated costs such as administrative costs, insurance, or taxes associated with the emission controls. Five facilities are projected to incur capital emissions control costs under the refractories NESHAP, ranging from $383,400 to $1.37 million. Because the cost of this capital equipment is a large lump-sum expenditure, companies typically finance the cost over a period of years. Thus, EPA estimates the annualized capital costs of the rule by annualizing the lump-sum capital costs over a period of 20 years at a 7 percent discount rate. The annualized capital costs range from $54,600 to $194,800. Among the annual emissions control costs, the highest costs are associated with incremental energy required to operate the controls. Energy control costs range from $50,200 to $376,000 per year and total $956,000. Total annualized emission control costs for the refractories NESHAP range from $50,200 to $621,000 and total $2.08 million, which is 90 percent of the total annualized costs of the rule. Of this total, $1.42 million represent annual operating and maintenance costs of the controls (61 percent of the rule’s total costs), and $655,700 represent the annualized cost of the control equipment (28 percent of the rule’s total annualized costs).
3.2.2 Compliance Testing Costs
Affected thermal process sources of organic HAP can demonstrate compliance with either the 20 ppmvd THC limit (testing for THC at the outlet of the control device or in the stack using Method 25A) or the 95 percent THC reduction limit (testing for THC at the control device inlet and outlet using Method 25A). The compliance test must be repeated every 5 years.
3-4

Testing costs were annualized over a 5-year period using a 7 percent discount rate. Testing costs at the six refractory manufacturing facilities incurring control costs range from $4,600 per year to $36,500 per year and total $139,900 or 6 percent of the total annualized costs of the regulation.
3.2.3 Monitoring, Recordkeeping, and Reporting Costs
Monitoring costs include the cost of installing and operating a system to measure and record control device operating temperatures on a continuous basis. System components include a thermocouple and a data acquisition system. Annualized costs were computed assuming a data acquisition system life of 15 years, a thermocouple life of 2 years, and a 7 percent discount rate. Monitoring costs for facilities incurring control costs range from $1,600 to $16,800 and total $48,800 or 2 percent of the rule’s total annualized costs. Annual reporting and recordkeeping costs were estimated using Standard Form 83 and were considered one-time costs annualized over a 5-year period at a 7 percent discount rate. Recordkeeping and reporting costs are estimated to range from $1,200 to $8,000 for facilities incurring costs. Overall, the $50,400 recordkeeping and reporting costs represent 2.2 percent of the rule’s total annualized costs.
3.2.4 Total Annualized Costs
Summing all categories of costs together, the six refractory manufacturing facilities are projected to incur total annualized costs ranging from $1,200 to $677,600. Total annualized costs for the rule are estimated to be $2,314,200.
3-5

SECTION 4
ECONOMIC IMPACT ANALYSIS: METHODS AND RESULTS
The underlying objective of the EIA is to evaluate the effect of the regulation on the welfare of affected stakeholders and society in general. Although the engineering cost analysis presented in Section 3 does represent an estimate of the respective plants’ resources required to comply with the regulation under baseline economic conditions, the analysis does not account for the fact that the regulations may cause the economic conditions to change. For instance, producers may elect to discontinue production rather than comply, thereby reducing market supply. Moreover, the control costs may be passed along to other parties through various economic exchanges (such as price increases). The purpose of this section is to develop and apply an analytical structure for measuring and tracking these effects as they are distributed across the stakeholders tied together through economic linkages.
4.1 Markets Affected by the NESHAP
Refractory products are in fact fairly specialized, and each batch could be considered a unique product. For modeling the impacts, however, EPA aggregated the refractory products produced by manufacturers in the industry into broad markets. We considered two aggregation schemes: by type of input or material (clay and nonclay) or by form of output. Although the Census of Manufactures divides refractories into clay and nonclay, we have concluded that the consumers of refractory products are more concerned about their form than their raw material. Therefore, EPA estimated impacts in three broad refractory product markets:
C bricks and shapes,
C monolithics (not directly affected by the NESHAP), and
C refractory ceramic fibers or RCF (not affected by the NESHAP).
These are the refractory products for which EPA’s database provides information. For each facility in the industry, EPA has estimated quantities of each of these products manufactured on-site.
4.2 Conceptual Approach
Industry comments on the rule indicated that the depressed condition of the steel industry, coupled with increased pressure from imported refractories, limit refractory manufacturers’ ability to pass cost increases along to their customers in the form of increased prices. In response to these comments, EPA has chosen to model the supply of imported refractories (in the bricks and shapes market) as perfectly elastic. That is, any decrease in domestic production will be offset by increased imports; thus, no price increase occurs. As a result, the Agency has adopted different methods to model the markets for each refractory
4-1

commodity. The bricks and shapes market is represented by a full-cost-absorption model, where costs are imposed on facilities and are added to baseline production costs at directly affected plants. Neither market price nor quantity is permitted to adjust in response to higher costs. Thus, the only impact of the higher costs is to reduce the profits of directly affected facilities. This model incorporates a perfectly elastic international supply component, which assumes that foreign producers expand output as affected firms reduce supply due to increased production costs. In the monolithics and RCF markets, simple national competitive market models were developed to estimate the economic impacts to society. In these markets, buyers and sellers exert no individual influence on market prices for refractory commodities potentially affected by the rule. Prices in these markets are set by the collective actions of producers and consumers, who take the market price as a given in making their production and consumption choices.
4.2.1 Producer Characterization
Many refractory plants produce multiple refractory products. Therefore, individual product-line supply decisions for existing domestic producers were modeled in this analysis. These decisions were modeled as intermediate-run decisions, assuming that the plant size, equipment, and technologies are fixed. Given the existence of these fixed production factors, each product line was characterized by an upward-sloping supply function (see Figure 4-1). A profit-maximizing firm will select its output level according to this schedule as long as the market price is sufficiently high to cover average variable costs (i.e., greater than C0 in Figure 4-1). Thus, in the short run, a profit-maximizing firm will not pass up an opportunity to recover even part of its fixed investment in plant and equipment. These individual supply decisions for domestic producers were aggregated (i.e., horizontally summed) to develop a market supply curve for each refractory product. The majority of the industry is not affected directly; however, they are affected indirectly by the decrease in the output of refractory
4-2

$/lb Sd
C0
short tons/year
Figure 4-1. Supply Curve for a Representative Directly Affected Facility
products by the industry. Foreign refractory producers, who are assumed in this model to have perfectly elastic supply curves, may respond to the decrease in refractories production in the U.S. by supplying more to the U.S. market.
4.2.2 Consumer Characterization
Demand for refractory products comes mainly from the iron and steel industry, cement industry, and nonferrous metals industry, although smaller shares are sold for use in glass manufacturing and oil refining. The U.S. International Trade Commission (1994) estimates that over 50 percent of refractories are used in the iron and steel industry; DHAN (1999) estimated this share to be 75 percent. There are no direct substitutes for refractory products. Nevertheless, over time, consumers of refractory products have reduced the amount of refractory products consumed. Over the past 20 years, the iron and steel industry has restructured, closing inefficient facilities and modernizing remaining plants. Newer steelmaking technologies significantly reduced the amount of refractories used per ton of steel. Given data limitations, each commodity market will be modeled as having a single aggregate consumer with a downward-sloping market demand curve (see Figure 4-2).
4-3

P/Q P/Q P/Q
p
qa qu Q
Affected Facilities
Su SM
DM
p p+ =
Indirectly Affected (including international) Market
a) Baseline Equilibrium (Bricks and Shapes Refractories)
+ =
Sa
P/QP/QP/Q
Q/TQ/TQ/T
Sa
qa
p′ p′ p′
S′ a S′ u
DM
SM′
=p
q′ q Q/T q q′ Q/T q′ Q′= Q Q/T aa a u u
Indirectly Affected Affected Facilities Market (including international b) With-Regulation Equilibrium
(Bricks and Shapes Refractories)
Figure 4-2. Market Equilibrium for Bricks and Shapes Refractories without and with Regulation
4.2.3 Foreign Trade
Although the NESHAP will directly affect domestic facilities that produce refractory products, the rule may have indirect foreign trade implications. Industry stakeholders have commented that foreign suppliers have lower prices than domestic suppliers. If this is true, affected refractory producers may be unable to increase their prices in response to the increased
4-4

costs associated with compliance. Thus, to characterize the refractory market for bricks and shapes, the Agency has developed a full-cost-absorption model that incorporates international trade. Under full-cost-absorption, foreign imports may become more attractive to U.S. refractory consumers and U.S. exports may become less attractive to foreign refractory consumers. On the import side, the model assumes that foreign firms that produce bricks and shapes refractories have perfectly elastic supply curves and thus can adjust output to meet demand by using excess capacity in their existing plants. On the export side, foreign demand for refractories produced in the United States may decrease if they become relatively more expensive because of the regulation. Finally, domestic facilities could relocate to foreign countries with laxer environmental regulations if domestic production costs increase. However, given the relatively small size of the expected compliance costs it is unlikely that the regulations will trigger industrial flight at least in the short run. This assumption is consistent with empirical studies in the literature that have found little evidence of environmental regulations affecting industry location decisions (Levinson, 1996).
4.2.4 Baseline and With-Regulation Equilibrium
Impacts of the Refractory Products NESHAP are concentrated in the market for Bricks and Shapes. The markets for other types of refractories, including monolithics and RCF, are unaffected.
4.2.4.1 Bricks and Shapes Market
Under the baseline scenario for bricks and shapes refractories (Figure 4-2[a]), a market price and quantity (p,Q) are determined by the intersection of the downward-sloping market demand curve (Dm) and the market supply curve (Sm). The individual supply curve for each affected domestic plant is defined as upward sloping to reflect factories’ willingness to produce additional units of output as the price of each unit rises. The market supply curve for affected plants (Sa) is constructed by summing horizontally across the individual supply curves. For indirectly affected firms (including foreign suppliers), output is characterized by a perfectly elastic market supply curve (Su), that reflects their ability to rapidly adjust production levels.
With the regulation, the costs of production increase for affected suppliers. These additional costs include a variable component consisting of the operating and maintenance costs and a fixed component that does not vary with output (i.e., expenditures for control-related capital equipment to comply with the regulatory alternative). The imposition of regulatory control costs is represented as an upward shift in the supply curve for each product line. The upward shift of individual supply curves causes the market supply curve for affected refractory products to contract as shown in Figure 4-2(b). Under a full-cost-absorption scenario, the costs that are imposed are added to baseline production costs at directly affected facilities. Market price and quantity do not adjust in response to the higher costs, because indirectly affected firms have the opportunity to expand output along their supply curve (from qu to qur) by an amount equivalent to the reduction in supply by affected producers.
4-5

In baseline without the standards, the bricks and shapes refractories industry produces total output at quantity, Q, and at price, p, with directly affected facilities producing the amount qa and indirectly affected facilities accounting for Q minus qa, or qu. With the regulation, the only impact of the higher regulatory costs is to reduce the profits of directly affected facilities. Indirectly affected firms are able to compensate for the loss of output at affected firms by increasing supply to the market. The net result is that market quantities (Q = QN) and prices (p = pr) remain constant for bricks and shapes refractories.
4.2.4.2 Monolithics and RCF Markets
The monolithic refractory sector and the RFC sector are not projected to be directly impacted under the regulation. Thus, prices are projected to remain constant and no change in quantity is anticipated as a result of the MACT standards.
4.3 Economic Impact Results
To develop quantitative estimates of these impacts, EPA developed a computer model using the conceptual approach described above.4 Using this model, EPA characterized supply and demand of three refractory commodities—bricks and shapes, monolithics, and refractory ceramic fiber (RCFs)—for the baseline year, 1998; introduced a policy “shock” into the model by using control cost-induced shifts in the supply functions of affected producers; and used a solution algorithm to determine a new with-regulation equilibrium in each refractory market. We report the market, industry, and societal impacts projected by the model below.
4.3.1 Market-Level Impacts
Under the regulation, the price and quantities of refractory products are expected to vary marginally from 1998 baseline levels. As shown in Table 4-1, regulatory costs will reduce domestic production of refractory products (bricks and shapes) by less than 1 percent. However, this reduction will be offset by an equal increase in the quantity of foreign imports; thus, the domestic price will remain unchanged. The regulation is not projected to have a measurable
4Appendix A includes a description of the baseline data set, model equations, and solution algorithm.
4-6

Table 4-1. Market-Level Impacts: 1998 Baseline With Regulation Change Absolute Relative
Bricks and Shapes
Price ($/ton) $910.00 $910.00 $0.00 0.00%
Quantity (short tons) 1,863,000 1,863,000 0 0.00%
Domestic 1,679,400 1,675,500 –3,970 –0.24%
Imports 183,500 187,300 3,970 2.16%
Monolithics
Price ($/ton) $533.00 $533.00 $0.00 0.00%
Quantity (short tons) 684,361 684,361 0 0.00%
RCF
Price ($/ton) $497.00 $497.00 $0.00 0.00%
Quantity (short tons) 34,490 34,490 0 0.00%
impact on the monolithics and RCF markets.
4.3.2 Industry-Level Impacts
Industry revenue, costs, and profitability change as prices and production levels adjust to increased production costs. As shown in Table 4-2, the economic model projects that profits for refractory producers will decrease by $2.1 million, or 2.38 percent reflecting the cost of implementing regulatory controls. Under the regulation, total revenues decline by $3.6 million, or a change of 0.2 percent below the baseline. Production costs decline by $3.5 million, as output is reduced at facilities incurring compliance costs. Overall, total costs decline by $1.5 million under the regulation, which represents less than 0.1 percent change from the baseline.
4-7

Table 4-2. Industry-Level Impacts: 1998 Change
Baseline With Regulation Absolute Relative
Total revenue ($106/yr) $1,910.2 $1,906.6 –$3.6 –0.19%
Total costs ($106/yr) $1,822.3 $1,820.7 –$1.5 –0.08%
Control $0.0 $2.0 $2.0 NA
Production $1,822.3 $1,818.8 –$2.1 –0.18%
Pre-tax earnings ($106/yr) $87.9 $86.1 –$1.8 –2.38%
Facilities (#) 147 146 –1 –0.68%
Employees (FTEsa) 12,440 12,382 –91 –0.73%
a FTEs = full-time equivalent employees.
Additional distributional impacts of the rule within each producer segment are not necessarily apparent from the reported decline or increase in their aggregate operating profits. The regulation creates both gainers and losers within each industry segment based on the distribution of compliance costs across facilities. As shown in Table 4-3, facilities incurring compliance costs (i.e., eight plants, or 5 percent) are projected to become less profitable under the regulation with a total loss of $2.1 million. However, 139 facilities are projected to experience no change in profit due to the NESHAP. Foreign producers will also experience increased revenues as they assume a slightly larger share of the refractories market.
4.3.2.1 Facility Closures and Changes in Employment
EPA estimates that one facility is likely to close prematurely as a result of the regulation. However, this facility has options to reduce the emissions or change the processes so that they would no longer be classified as a major source and not incur any compliance costs. The cost to this facility would then be the amount necessary to convert to nonmajor source status. Because we do not know how this facility will respond, our model imposes the MACT regulation costs on this facility and predicts a closure because the with-regulation cost of production exceeds revenue. This facility is estimated to employ fewer than 50 employees at baseline; other plants
4-8

Table 4-3. Distributional Impacts Across Facilities: 1998 Operating Profit
Lossa Gain or No Change Total
Facilities (#) 8 139 147
Compliance costs
Total ($106/yr) $2.31 $0 $2.31
Change in pre-tax earnings ($106/yr) –$2.09 $0.00 –$2.09
aThe loss column includes one projected facility closure.
incurring costs may reduce employment slightly as their output declines. On balance, EPA expects industry employment to change by less than 100 employees, less than 1 percent of industry employment.
4.3.3 Social Cost
The social impact of a regulatory action is traditionally measured by the change in economic welfare that it generates. The social costs of the rule will be distributed across producers of refractory products and their customers. Consumers of refractory products experience minimal welfare impacts due to minimal changes in market prices and consumption levels associated with the rule. Domestic producers experience welfare impacts resulting from changes in profits corresponding with the changes in production levels and market prices. However, it is important to emphasize that this measure does not include benefits that occur outside the market, that is, the value of reduced levels of air pollution with the regulation.
The national compliance cost estimates are often used as an approximation of the social cost of the rule. The engineering analysis estimated annual costs of $2.31 million. In cases where the engineering costs of compliance are used to estimate social cost, the burden of the regulation is measured as falling solely on the affected facilities, which experience a profit loss exactly equal to these cost estimates. Thus, the entire loss is a change in producer surplus with no change (by assumption) in consumer surplus, because all factors of production are assumed to be fixed and firms are unable to adjust their output levels when faced with additional costs.
In contrast, the economic analysis conducted by the Agency accounts for behavioral responses by producers and consumers to the regulation, as affected producers shift costs to other economic agents. This approach results in a social cost estimate that may differ from the engineering compliance cost estimate and also provides insights on how the regulatory burden is distributed across stakeholders. The computation of social costs is discussed in detail in Appendix B. As shown in Table 4-4, the economic model estimates the total social cost of the rule to be $2.09 million. Although society reallocates resources as a result of the increased cost of refractory production, only a relatively small change in social welfare occurs. Users of
4-9

refractory products (i.e., consumers such as the steel industry) are projected to incur no change in their social welfare, because prices of refractory products remain unchanged. Industrywide, refractory domestic producers experience a net loss of $2.09 million. This net loss includes welfare changes experienced by facilities incurring compliance costs (which experience increased costs and decreased output and profit) and welfare changes experienced by producers that do not incur compliance costs (who may produce more in response to declines in production at affected facilities). It also reflects the projected premature closure of one refractory manufacturing facility. Overall, however, the impacts on both refractory manufacturers and their customers are projected to be relatively small.
Table 4-4. Distribution of Social Costs: 1998 Value ($106/yr)
Consumer surplus –$0.00
Bricks and shapes –$0.00
Monolithics –$0.00
RCF $0.00
Producer surplus –$2.09
Domestic –$2.09
Foreign $0.00
Total social cost –$2.09
4-10

SECTION 5
SMALL BUSINESS IMPACTS
Environmental regulations like this rule potentially affect all businesses, large and small, but small businesses may have special problems complying with such regulations. The Regulatory Flexibility Act (RFA) of 1980 as amended in 1996 by the Small Business Regulatory Enforcement Fairness Act (SBREFA) generally requires an agency to prepare a regulatory flexibility analysis of a rule unless the agency certifies that the rule will not have a significant economic impact on a substantial number of small businesses, small governmental jurisdictions, and small organizations. This section examines the proposed rule’s impact on these entities.
5.1 Identify Small Entities
For purposes of assessing the impacts of the proposed rule on small entities, a small entity is defined as (1) a small business according to Small Business Administration (SBA) size standards for NAICS code 327124 (Clay Refractories) of 500 or fewer employees or NAICS code 327125 (Nonclay refractories) of 750 or fewer employees;5 (2) a small governmental jurisdiction that is a government of a city, county, town, school district, or special district with a population of less than 50,000; and (3) a small organization that is any not-for-profit enterprise that is independently owned and operated and is not dominant in its field.
The Agency collected data on facility and company employment from the industry; additional data were collected from publicly available sources such as financial databases. Based on this employment data, EPA determined that 56 small entities within this source category would be subject to this proposed rule. Of the 76 companies owning refractory manufacturing facilities in the EPA database, only 20 have company-level employment data showing that they have more than 750 employees. These are classified as large companies for purposes of this analysis. The remaining 56 companies are classified as small entities.
5.2 Economic Analysis
The Agency conducted a screening analysis to assess the impacts of the proposed rule on small businesses and to compare the impacts on small businesses with impacts on large businesses. These results are shown in Table 5-1. Three of the estimated 56 small businesses in the refractory manufacturing industry are projected to incur costs averaging $99,700 to comply
5For purposes of this analysis, small businesses were defined as having 750 or fewer employees. Some of the companies in the refractory industry produce both clay and nonclay refractories, which does not allow us toassign companies unambiguously to a single NAICS code. For this reason, we selected the higher NAICScriterion, 750 employees, as the small business criterion for all companies. Note that this conservative criterion may overstate the total number of small companies.
5-1

with the regulation. The five large companies projected to incur compliance costs experience costs averaging $403,000 (TACC) per company. Of the 33 small companies with sales data and 17 large companies with sales data, none of these companies is projected to experience costs exceeding 1 percent of baseline sales.
Table 5-1. Summary Statistics for SBREFA Screening Analysis: 1998 Small Large Total
Total number of companies 56 20 76
Total annual compliance costs (TACC) $299,200 $2,015,000 $2,314,200 ($/year)
Average TACC per company ($/year)a $99,700 $403,000 $289,000
Number Share Number Share Number Share
Companies with sales data 33 100% 17 100% 50 100%
Compliance costs <1% of sales 33 100% 17 100% 50 100%
Compliance costs 1% to 3% of sales 0 0% 0 0% 0 0%
Compliance costs are >3% of sales 0 0% 0 0% 0 0%
Compliance cost-to-sales ratios (CSRs)
Mean NR NR 0.018%
Median NR NR 0.000%
Maximum NR NR 0.369%
Minimum NR NR 0.000% aAverage over companies incurring compliance costs. NR = not reported to avoid revealing confidential data.
5-2

The Agency analyzed the economic impacts on small businesses under with-regulation conditions expected to result from implementing the proposed rule. This approach examines small business impacts in light of the expected behavioral responses of producers and consumers to the regulation. As shown in Table 5-2, overall revenue and operating profits for facilities owned by small businesses are projected to decline slightly under the recommended alternative. No small businesses will be significantly affected by the rule. In response to the projected increase in control costs for refractory production, most facilities owned by small businesses are projected to decrease their output slightly. As a result, they experience decreased production costs, and decreased revenues and profits, but essentially no change in employment.
Table 5-2. Small Business Impacts: 1998 With Change
Baseline Regulation Absolute Relative
Total revenue ($106/yr) $482.3 $482.0 –$0.3 –0.06%
Total costs ($106/yr) $465.5 $465.5 $0.0 0.00%
Control $0.0 $0.3 $0.3 NA
Production $465.5 $465.2 –$0.3 –0.06%
Pre-tax earnings ($106/yr) $16.8 $16.5 –$0.3 –1.77%
Facilities (#) 71 71 0 0.00%
Employees (FTEsa) 3,256 3,255 -1 –0.02% a FTEs = full-time equivalent employees.
5.3 Assessment
The proposed refractories NESHAP is only expected to result in increased costs for three small businesses. Because of the imposition of control costs, small companies are projected to decrease their production; revenues and profits are projected to decline slightly. Overall, they are expected to experience minor losses as a result of the proposed rule. No business, either large or small, is projected to incur costs exceeding 1 percent of sales. Thus the rule is not expected to result in significant adverse economic impacts to any small business.
5-3

REFERENCES
Allen, R.G.D. 1938. Mathematical Analysis for Economists. New York: St. Martin’s Press.
ASM International. 1987. Engineered Materials Handbook. Volume 4: Ceramics and Glasses. Metals Park, OH: ASM International.
Ceramic Industry. 2000. “U.S. Demand for Refractories to Reach $2.8 Billion through 2003.” Ceramic Industry. Available at <http://www.ceramicindustry.com/ci/cda/ articleinformation/features/bnp_features_item/0,2710,8359,00.html>.
Contos, George and Ellen Legel. 2000. Corporation Income Tax Returns, 1997. [Computer File]. Available at <http://www.irs.gov/tax-stats/soi/corp_id.html>. As obtained January 26, 2001.
DHAN. 1999. “Industry Report: Refractories Passing through Difficult Times.” Available at <http://dhan.com/moneyline/991016-refract.html>.
Dun & Bradstreet. 2000. D&B Million Dollar Directory. Series 2000. Bethlehem, PA: Dun & Bradstreet, Inc.
Freedonia Group. September 1999. “Refractories in the United States to 2003.” Profound WorldSearch <http://www.profound.com>.
Hicks, J.R. 1961. “Marshall’s Third Rule: A Further Comment.” Oxford Economic Papers 13:262-65.
Hicks, J.R. 1966. The Theory of Wages. 2nd Ed. New York: St. Martin’s Press.
Information Access Co. 2000. Ward’s Business Directory. Belmont, CA.
Lawson, A. 1997. “Benchmark Input-Output Accounts for the U.S. Economy, 1992: Requirements Tables.” Survey of Current Business. December, pages 22-47.
Levinson, Arik: 1996. “Environmental Regulations and Industry Location: International and Domestic Evidence.” In Fair Trade and Harmonization: Prerequisite for Free Trade? Jagdish Bhagwal; and Robert Hudec, eds. Washington, DC: MIT Press.
Marinshaw, R. and J. Fields. February 2003a. Memorandum from RTI, International to Fairchild, S., EPA/ESD. Revised Estimate of Major and Area Sources of HAP Emissions.
Marinshaw, R. and J. Fields. February 2003b. Memorandum from RTI, International to Fairchild, S., EPA/ESD. Revised Estimated Compliance Costs for the Refractory
R-1

Products Manufacturing Industry.
R.S. Means Company, Inc. 1997, 1998 Building Construction Cost Data. Kingston, MA: R.S. Means Company, Inc.
Semler, Charles E. 2000. “More about Industry Changes.” Ceramic Industry. Available at <http://proquest.umi.com/pdqweb?TS...Sid=1&Idx=21&Deli=1&RQT=309&Dtp=1>.
Sheppard, Laural M.. 2000. “Trends in Refractories Technology: Highlights of the AcerS Annual Meeting.” Refractories Applications.
Slade, M.E. 1996. “Uniform Compliance Costs for Mineral Commodities: Who Gains and Who Loses?” Land Economics 72(1):17-32.
The Technical Association of Refractories, Japan. 1998. Refractories Handbook. Tokyo: The Technical Association of Refractories, Japan.
U.S. Bureau of Labor Statistics. 2001. “Producer Price Index.” <http://146.142.4.24/cgi-bin/srga.
U.S. Department of Commerce, Bureau of the Census. 1993–1999. Current Industrial Reports: Refractories. MA 32C. Available at <http://www.census.gov/industry/ma32c97>.
U.S. Department of Commerce, Bureau of the Census. 1994a. 1992 Census of Manufactures, Industry Series—Abrasive, Asbestos, and Miscellaneous Mineral Products. Washington, DC: Government Printing Office.
U.S. Department of Commerce, Bureau of the Census. 1994b. 1992 Census of Manufactures, Industry Series—Cement and Structural Clay Products. Washington, DC: Government Printing Office.
U.S. Department of Commerce, Bureau of the Census. 1995. 1993 Annual Survey of Manufactures. M93(AS)-1. Washington, DC: Government Printing Office.
U.S. Department of Commerce, Bureau of the Census. 1996a. 1994 Annual Survey of Manufactures. M94(AS)-1. Washington, DC: Government Printing Office.
U.S. Department of Commerce, Bureau of the Census. 1996b. Concentration Ratios in Manufacturing. MC92-S-2. Washington, DC: Government Printing Office. Available at <http://www.census.gov/mcd/mancen/download/mc92cr.sum>.
U.S. Department of Commerce, Bureau of the Census. 1997. 1995 Annual Survey of Manufactures. M95(AS)-1. Washington, DC: Government Printing Office.
U.S. Department of Commerce, Bureau of the Census. 1998. 1996 Annual Survey of Manufactures. M96(AS)-1. Washington, DC: Government Printing Office.
U.S. Department of Commerce, Bureau of the Census. 1999a. 1997 Census of Manufactures. Washington, DC: Government Printing Office.
R-2

U.S. Department of Commerce, Bureau of the Census. 1999b. 1997 Census of Manufactures, Industry Series—Manufacturing: Clay Refractory Manufacturing. Washington, DC: Government Printing Office.
U.S. Department of Commerce, Bureau of the Census. 1999c. 1997 Census of Manufactures, Industry Series—Manufacturing: Nonclay Refractory Manufacturing. Washington, DC: Government Printing Office.
U.S. Department of Commerce, Bureau of the Census. 1999d. 1998 Survey of Plant Capacity. Washington, DC: Government Printing Office.
U.S. Department of Commerce, Bureau of the Census. 2000. 1998 Annual Survey of Manufactures. M98(AS)-1. Washington, DC: Government Printing Office.
U.S. Department of Commerce, and International Trade Administration. 1999. U.S. Industry & Trade Outlook 2000. New York: The McGraw-Hill Companies and U.S. Department of Commerce.
U.S. Environmental Protection Agency (EPA). 1994. AP-42, Fifth Edition, Volume I, Chapter 11: Mineral Products Industry. Washington, DC: Government Printing Office. Available at <http://www.epa.gov/ttn/chief/ap42/ch11>.
U.S. Environmental Protection Agency (EPA). 2001. Refractories Industry Database.
U.S. Department of Justice and the Federal Trade Commission. Horizontal Merger Guidelines. April 8, 1992. <http://www.ftc.gov/bc/docs/horizmer.htm>.
U.S. International Trade Commission (USITC). 1993. Industry & Trade Summary: Refractory Ceramic Products. USITC Publication 2692. Washington, DC: U.S. International Trade Commission.
U.S. International Trade Commission (USITC). 1994. Industry & Trade Summary: Refractory Ceramic Products. USITC Publication 2692. Washington, DC: U.S. International Trade Commission.
U.S. International Trade Commission. 2001. Trade Database. <http://dataweb.usitc.gov/ scripts/>.
U.S. Small Business Administration. 1998. “Small Business Size Regulations: Size Standards and the North American Industry Classification System.” 13 CFR Part 121.
Virta, Robert L. 1998. Minerals Information: Clay and Shale. Reston, VA: U.S. Department of the Interior, U.S. Geological Survey. Available at <http://minerals.usgs.gov/ minerals/pubs/commodity/clays>.
R-3

APPENDIX A
OVERVIEW OF REFRACTORIES MARKET MODEL
To develop estimates of the economic impacts on society resulting from the refractory product NESHAP, the Agency developed a computational model using a framework that is consistent with economic analyses performed for other rules. This approach employs standard microeconomic concepts to model behavioral responses expected to occur with the regulation. This appendix describes the spreadsheet model in detail and discusses how the Agency
C characterized the supply and demand of three refractory commodities—bricks andshapes, monolithics, and RCFs;
C introduced a policy “shock” into the model by using control cost-induced shifts in thesupply functions of affected producers; and
C used a solution algorithm to determine a new with-regulation equilibrium in eachrefractory market.
A.1 Baseline Data Set
Much of the data used in modeling the refractory industry come from the EPA Refractory Industry Database, which contains confidential survey responses from potentially affected facilities. Among the critical data included in this database are product-specific output. Table A-1 lists additional plant and company data elements and their sources. Table A-2 shows prices of refractory products obtained from Freedonia Group. Although “other” refractory forms include not only RCF but refractories that are shipped in bulk, EPA used this price for RCF.
A.2 Supply and Demand Elasticities
Unfortunately, empirical estimates of demand or supply elasticities for refractory products are limited. The option of estimating a system of demand and supply equations using three-stage least squares (3SLS) was not feasible because of limitations of time-series data. Although these limitations prevent estimation of these parameters, knowledge about the
A-1

Table A-1. Types and Sources of Refractory and Processing Facility Data
Data Category Data Element Data Source
Plant data Plant name EPA Refractory Industry Database
Plant location EPA Refractory Industry Database
Plant ownership EPA Refractory Industry Database
Types of refractory products EPA Refractory Industry Database produced
Employment EPA Estimate
Quantity produced of each EPA Refractory Industry Database refractory product
Company data Company name Ward’s Business Directory
Company sales Ward’s Business Directory
Employment Ward’s Business Directory
Market data Prices Freedonia Group
Sources: Freedonia Group. September 1999. “Refractories in the United States to 2003.” Profound WorldSearch <http://www.profound.com>. Information Access Co. 2000. Ward’s Business Directory. Belmont, CA U.S. Environmental Protection Agency (EPA). 2001b. Refractory Industry Database.
factors influencing the elasticity of derived demand makes it possible to develop informed assumptions about producer and consumer responses to price changes. Economic theory states that the elasticity of the derived demand for an input is a function of the following (Hicks, 1961; Hicks, 1966; and Allen, 1938):
C demand elasticity for the final good it will be used to produce,
C the cost share of the input in total production cost,
C the elasticity of substitution between this input and other inputs in production, and
C the elasticity of supply of other inputs.
Using Hicks’ formula,
A-2

Table A-2. Refractory Products Pricing ($/ton)
Form 1989$ 1998$ 1993$ 1998$ 1998$
Monolithics 451 526 491 544 533
Bricks and Shapes 709 826 782 866 910
Othera 394 459 442 490 497
a Other refractory forms consist of ceramic fibers and refractory raw materials that are supplied in lump or ground form used to manufacture refractories “in-house.”
Note: Prices were inflated using the producer price index for stone, clay, glass, and concrete products available through the Bureau of Labor Statistics at <http://146.142.4.24/cgi-bin/srgate>.
Source: Freedonia Group. September 1999. “Refractories in the United States to 2003.” Profound WorldSearch <http://www.profound.com>.
(A.1)
where
0i = elasticity of demand for the refractory product i,
s = elasticity of substitution between refractory product i and all other inputs to steel production,
n = elasticity of demand for final product (steel products),
e = elasticity of supply of other inputs, and
K = cost share of refractory product i in total production cost.
In the appendix to The Theory of Wages, Hicks (1966) shows that, if n > s, the demand for the input is less elastic the smaller its cost share. If the data were available, this formula could be used to actually compute the elasticity of demand for each refractory product. The final products for which the refractory is an input include iron and steel products, other nonferrous metal products, and cement. The iron and steel industry dominates the demand for refractory products, perhaps constituting as much as 75 percent of total refractory consumption. For this reason, EPA concentrated on the elasticity of demand for refractories in steelmaking. For the analysis of the Integrated Iron and Steel NESHAP, the Agency estimated the elasticity of demand for iron and steel products to be –0.59. Values in the literature have been in the same range, both for ferrous (–0.7) and nonferrous (–0.6) metals (Slade, 1996). Lacking estimates of other elasticities of final demand and of the other parameters in the formula makes direct computation of the elasticity of demand, 0, impossible. In spite of this, the formula is useful because it identifies factors that influence the magnitude of the elasticity of derived demand.
A-3

Knowledge of the general magnitude of those factors makes it possible to make an educated assumption about the magnitude of 0.
The elasticity of substitution, s, between refractory products and other inputs is likely to be very low but nonzero. Although there are no substitutes for refractories in the short run, over time, capital equipment has been substituted for refractories as technology has evolved requiring less use of refractories per ton of steel. We thus expect that n>s. This implies that the magnitude of 0 is proportional to the magnitude of K, the cost share of refractories in overall building construction. Based on the benchmark input–output accounts for the United States, stone and clay products (including refractories) are 1.5 percent of primary iron and steel manufacturing and 0.02 percent of primary nonferrous metals manufacturing (Lawson, 1997).
Given that the cost share of stone and clay products in the total production cost of ferrous and nonferrous primary metal manufacturing is small, the elasticity of demand for one of the final products (steel mill products) is relatively low and ease of substitution between inputs very limited, the elasticity of demand for refractory products would be inelastic (i.e., less than 1 in absolute value). In fact, we suspect it may be substantially lower. Assuming the elasticity of supply of other inputs is 1, and the elasticity of substitution between refractory and other inputs is 0.1, the elasticity of demand for refractories would be approximately 0.1 in absolute value.
A.3 Operational Model
The Agency developed an operational model of the refractories industry using spreadsheet software. This model characterizes market supply and demand, allows the analyst to introduce a policy “shock” into the model by using control cost-induced shifts in the supply functions of affected producers, and uses a solution algorithm to determine a new with-regulation equilibrium for each refractory market. This section describes the computer model in detail.
A.3.1 Market Supply
Domestic supply for product i can be expressed as
where
(A.2)
= product i supply from domestic plant (j) and
n = the number of domestic suppliers producing commodity i.
A.3.1.1 Product Line Supply
EPA used a simple Cobb-Douglas (CD) supply function for each facility product line
A-4

expressed as follows:
(A.3)
where
= the supply of product i for domestic plant (j),
Ai
Pi
=
=
=
a parameter that calibrates the supply equation to replicate the estimated 1998 level of production,
the 1998 market price for product i, and
the domestic supply elasticity.
Regulatory Induced Shifts in the Supply Function (cj). The upward shift in the supply function [of domestic facilities] (cj) is calculated by dividing the total annual compliance cost estimate by baseline output. Computing the supply shift in this manner treats the compliance costs as the conceptual equivalent of a unit tax on domestic output.
A-5

(A.3)
International Trade. In response to public comment, EPA analyzed economic impacts in the bricks and shapes market using a full cost absorption approach. To implement this approach, EPA’s model assumes that foreign suppliers of bricks and shapes increase their supply to offset any decreases in output by affected domestic suppliers. Thus, the model projects no change in the market price or quantity of bricks and shapes due to the regulation.
Plant Closure Analysis. One of the most sensitive issues to consider in the EIA is the possibility that the regulation may induce a producer to shut down operations rather than comply with the regulation. The data (i.e., direct observations of plant-level costs and profits) necessary to make definitive projections of these impacts are unavailable from the survey data. Therefore, EPA developed a crude method of identifying plant closure decisions using firm-specific or broad industry measures of profitability as described below.
The plant closure criterion used for this analysis is defined as follows:
(A.4)
where total revenue (TRj) is the sum of the product revenue from plant j’s product lines, and total cost (TCj) is the sum of the plant’s total variable production costs, total avoidable fixed production costs, and total control costs. The conceptually correct view would assume the plant also has some positive liquidation value or opportunity value in an alternative use that is not captured in the TC elements used to compute Bj. However, no data are available to estimate these opportunity costs. Therefore, the Agency has assumed they are exactly offset by the costs of closing a plant (i.e., equal to zero).
Given the estimated 1998 values of revenue and variable production costs implied by the calibrated product line supply functions, the Agency developed an estimate of the total avoidable fixed costs so that the profit ratio for each plant exactly matches either the parent company’s profit margin or an industry profit ratio reported by the U.S. Internal Revenue Service (Contos and Legal, 2000).
A.3.2 Market Demand
Domestic demand is expressed as follows:
(A.5)
A-6

where
= domestic demand for product i,
Bi = a parameter that calibrates the demand equation to replicate the 1998 level of domestic demand,
Pi = the 1998 market price for product i, and
= the domestic demand elasticity for product i.
A.3.3 With-Regulation Market Equilibrium Determination
Producer responses and market adjustments can be typically be conceptualized as an interactive feedback process. Plants facing increased production costs due to compliance are willing to supply smaller quantities at the baseline price. Typically, market supply would fall, price would rise, and suppliers would recompute their desired supply at the new price; this process would continue until both demanders and suppliers are satisfied at a given price. In the case of the refractories market, however, EPA is modeling foreign supply as perfectly elastic, so that it compensates for any reduction in domestic supply and no changes in price or market quantity result.
The algorithm for determining with-regulation equilibria can be summarized as:
1. Impose the control costs on all affected plants, thereby affecting their supplydecisions.
2. Recalculate the market supply in each product market.
3. Compute change in imports to offset reduction in domestic supply.
In the affected bricks and shapes market, because foreign supply is assumed to be perfectly elastic, the market achieves equilibrium immediately as increased foreign supply exactly offsets decreased domestic supply.
A-7

APPENDIX B
ECONOMIC WELFARE IMPACTS ON REFRACTORY INDUSTRY
The economic welfare implications of the market price and output changes with the regulation can be examined using two different strategies, each giving a somewhat different insight but the same implications: changes in the net benefits of consumers and producers based on price and quantity changes and changes in the total benefits and costs of these products based on the quantity changes. This analysis focuses on the first measure—the changes in the net benefits of consumers and producers. Figures B-1 and B-2 depict the change in economic welfare by first measuring the change in consumer surplus and then the change in producer surplus. In essence, the demand and supply curves previously used as predictive devices are now being used as valuation tools.
This method of estimating the change in economic welfare with the regulation divides society into consumers and producers. In a market environment, consumers and producers of the good or service derive welfare from a market transaction. The difference between the maximum price consumers are willing to pay for a good and the price they actually pay is referred to as “consumer surplus.” Consumer surplus is measured as the area under the demand curve and above the price of the product. Similarly, the difference between the minimum price producers are willing to accept for a good and the price they actually receive is referred to as “producer surplus” or profits. Producer surplus is measured as the area above the supply curve and below the price of the product. These areas can be thought of as consumers’ net benefits of consumption and producers’ net benefits of production, respectively.
In Figure B-1, baseline equilibrium occurs at the intersection of the demand curve, DM, and the supply curve, SM. Price is Pl with quantity Ql. The regulatory costs will cause the market supply curve for affected facilities (Sa1) to shift upwards to (Sa2). Indirectly affected firms will expand production along their supply curve by an amount equivalent to the reduction in supply from affected firms. The new equilibrium price of bricks and shapes refractories is P2, the same price that existed prior to the regulation. As shown in Figure B-1a, because market price and quantity do not change, there is no change in consumer welfare.
B-1

P/Q Sa S2 a1
SM
P1 = P2
DM
Q1 = Q2 Q/T
(a) Change in Consumer Surplus with Regulation
P/Q Sa S2 a1
SaSa
SaSa
SaSa
SaSa
SaSa
A
SM
P1 = P2
DM
qa qa Q1 = Q2 Q/T2 1
(b) Change in Producer Surplus with Regulation
P/Q Sa S2 a1
SM
A
P1 = P2
DM
qa qa Q1 = Q2 Q/T
2 1 (c) Net Change in Economic Welfare with Regulation
Figure B-1. Economic Welfare Changes with Regulation (Bricks and Shapes): Consumer and Producer Surplus
B-2

Producer welfare does change as a result of the regulation. Affected facilities are assumed to be unable to pass the regulatory costs they incur on to consumers in the form of higher prices. Thus, these facilities will restrict output to the level that maintains the original market price, Pl. In Figure B-1(b), area A represents the loss in producer surplus that the affected firms experience. It is the difference in the area under the supply curve up to the original market price. Indirectly affected facilities expand output to meet demand. However, since their supply curve is highly elastic, these firms do not experience any gain in producer surplus. Thus, the only change in producer welfare is represented by area A.
The change in economic welfare attributable to the compliance costs of the regulation is the sum of consumer and producer surplus changes. Under the assumption that bricks and shapes producers are unable to raise prices, the impacts are restricted to producers. The loss of area B represented the net (negative) change in economic welfare associated with the regulation. However, this analysis does not include the benefits that occur outside the market (i.e., the value of the reduced levels of air pollution with the regulation). Including this benefit may reduce the net cost of the regulation or even make it positive.
B-3

B-4

TECHNICAL REPORT DATA (Please read Instructions on reverse before completing)
1. REPORT NO.
EPA-452/R-03-004 2. 3. RECIPIENT'S ACCESSION NO.
4. TITLE AND SUBTITLE
Economic Impact Analysis of the Refractory Product Manufacturing NESHAP -Final Rule
5. REPORT DATE
February 2003
6. PERFORMING ORGANIZATION CODE
7. AUTHOR(S)
Lisa Conner, Innovative Strategies and Economics Group 8. PERFORMING ORGANIZATION REPORT NO.
9. PERFORMING ORGANIZATION NAME AND ADDRESS
U.S. Environmental Protection Agency Office of Air Quality Planning and Standards Air Quality Strategies and Standards Division Research Triangle Park, NC 27711
10. PROGRAM ELEMENT NO.
11. CONTRACT/GRANT NO.
12. SPONSORING AGENCY NAME AND ADDRESS
Steve Page, Director Office of Air Quality Planning and Standards Office of Air and Radiation U.S. Environmental Protection Agency Research Triangle Park, NC 27711
13. TYPE OF REPORT AND PERIOD COVERED
14. SPONSORING AGENCY CODE
EPA/200/04
15. SUPPLEMENTARY NOTES
16. ABSTRACT
This report presents a technical analysis of the economic impacts associated with the National Emissions Standard for HazardousAir Pollutants to control emissions of air toxic pollutants from Refractory Product Manufacturing. The analysis evaluatesadjustments in the refractory products market (through price and production changes), social cost, and the resulting affects onemployment, international trade, and small businesses.
17. KEY WORDS AND DOCUMENT ANALYSIS
a. DESCRIPTORS b. IDENTIFIERS/OPEN ENDED TERMS c. COSATI Field/Group
Economic Impact Analysis (EIA) Regulatory Flexibility Analysis (RFA)
Air Pollution control economic analysis small business analysis
18. DISTRIBUTION STATEMENT
Release Unlimited
19. SECURITY CLASS (Report)
Unclassified 21. NO. OF PAGES
20. SECURITY CLASS (Page)
Unclassified 22. PRICE
EPA Form 2220-1 (Rev. 4-77)PREVIOUS EDITION IS OBSOLETE


United States Office of Air Quality Planning and Standards Publication No. EPA 452/R-03-004 Environmental Protection Air Quality Strategies and Standards Division February 2003 Agency Research Triangle Park, NC