UV -visible pyrometry of refractory oxides at high temperature
19
HAL Id: hal-03463590 https://hal.archives-ouvertes.fr/hal-03463590 Submitted on 2 Dec 2021 HAL is a multi-disciplinary open access archive for the deposit and dissemination of sci- entific research documents, whether they are pub- lished or not. The documents may come from teaching and research institutions in France or abroad, or from public or private research centers. L’archive ouverte pluridisciplinaire HAL, est destinée au dépôt et à la diffusion de documents scientifiques de niveau recherche, publiés ou non, émanant des établissements d’enseignement et de recherche français ou étrangers, des laboratoires publics ou privés. UV -visible pyrometry of refractory oxides at high temperature V Sarou-Kanian, J.-C Rifflet, F Millot To cite this version: V Sarou-Kanian, J.-C Rifflet, F Millot. UV -visible pyrometry of refractory oxides at high temperature. High Temperatures-High Pressures, Old City Publishing, 2011. hal-03463590
-
Upload
khangminh22 -
Category
Documents
-
view
1 -
download
0
Transcript of UV -visible pyrometry of refractory oxides at high temperature
HAL Id: hal-03463590https://hal.archives-ouvertes.fr/hal-03463590
Submitted on 2 Dec 2021
HAL is a multi-disciplinary open accessarchive for the deposit and dissemination of sci-entific research documents, whether they are pub-lished or not. The documents may come fromteaching and research institutions in France orabroad, or from public or private research centers.
L’archive ouverte pluridisciplinaire HAL, estdestinée au dépôt et à la diffusion de documentsscientifiques de niveau recherche, publiés ou non,émanant des établissements d’enseignement et derecherche français ou étrangers, des laboratoirespublics ou privés.
UV -visible pyrometry of refractory oxides at hightemperature
V Sarou-Kanian, J.-C Rifflet, F Millot
To cite this version:V Sarou-Kanian, J.-C Rifflet, F Millot. UV -visible pyrometry of refractory oxides at high temperature.High Temperatures-High Pressures, Old City Publishing, 2011. �hal-03463590�

1
UV – visible pyrometry of refractory oxides at high temperature
V. Sarou-Kanian1,2,*, J.-C. Rifflet1,2 and F. Millot1,2
1. CNRS, UPR3079 CEMHTI, 1D avenue de la Recherche Scientifique, 45071 Orléans
cedex2, France
2. Université d'Orléans, Faculté des Sciences, Avenue du Parc Floral, BP 6749, 45067
Orléans cedex 2, France
* : to whom correspondence should be addressed
ABSTRACT
We report new experimental methods to determine temperatures of liquid and solid oxides in
the range T=2300-3500 K. The development of a UV pyrometer working at λ=224 or 313 nm
allows a comparison with more classical visible pyrometers. The principle consists of
calibrating first a monochromatic UV or visible pyrometer aiming at a self-contained liquid
pool of Y2O3 or Sc2O3 during its solidification respectively considered at T=2712 K and
T=2740 K. This method has then been applied to the analysis of the free cooling curves of self
contained liquid pools of 12 refractory simple di- and sesquioxides that have relatively well-
known properties. Particular attention has been paid to the comparison between recommended
and measured solidification apparent temperatures at 5 different wavelengths between
λ=224 and 800 nm. Comparable values are systematically obtained for apparent temperatures
in the range [300-550 nm]. These values are in good agreement with recommended values for
rare earth oxides.
Keywords: optical pyrometry, high temperature, melting point, refractory oxide, UV
2
1. INTRODUCTION
Optical pyrometry is a practical technique for measuring very high temperatures. However it
also requires the knowledge of the emissivity of materials to get a relation between emitted
light and temperature. Classes of materials are being studied for sharing specific optical
properties and also because they can be heated in specific ways. Refractory oxides belong to
such a class of materials and have been very much studied between 1930 and 1980.
Sophisticated black body cavities heated in solar or more classical furnaces have been
developed and have led to the recommendation or proposition of characteristic temperatures
such as solidification of some oxides [1-3].
In the present work the advantages and drawbacks of using monochromatic pyrometry at
different wavelengths in the range 0.2-0.8 µm are examined to evaluate the temperature of the
surface or near surface of a refractory oxide material. Measurements are finally performed on
well-known oxides that are compared with literature data. Conclusions that are specific to
oxides can then be drawn from these studies.
2. THEORETICAL CONSIDERATIONS
There are few basic equations that have to be considered to relate the light emitted by a
material and its temperature. The normal spectral radiance Lλ(T) of a material at the
temperature T and the wavelength λ is such as:
( ) ( ) ( ) ( ) ( ) 1TCexp
1CTTLTTL
251
−λλ⋅ε=⋅ε= λλλλ
o (Eq. 1)
with ελ(T) the normal spectral emissivity at T, ( )TLo
λ the spectral radiance of the black body,
and C1 (=1.191 10-16 W.m-2.sr-1) and C2 (=0.014388 m.K) respectively the first and second
radiation constant.
3
The normal spectral emissivity is of great importance as it represents the optical properties of
the material, and it has to be considered very carefully. From the first and second Kirchoff’s
laws, the normal spectral emissivity is expressed as:
( ) ( ) ( )TT1T λλλ τ−ρ−=ε (Eq. 2)
with ρλ(T) and τλ(T) respectively the normal-hemispherical spectral reflectance and the
normal-hemisperical spectral transmittance. In the case of a homogeneous and non-diffusive
material, both properties are also related to the spectral reflectivity Rλ(T) and the spectral
transmissivity Trλ(T) in the expressions [4]:
( ) ( ) ( ) ( )[ ]TTrT1TRT λλλλ ⋅τ+⋅=ρ (Eq. 3)
( ) ( )[ ]( ) ( ) ( )TTr
TTrTR1
TR1T
22
2
λλλ
λλ ⋅
⋅−−
=τ (Eq. 4)
Rλ(T) depends on the refractive index nλ(Τ) and the extinction coefficient kλ(Τ). For normal
incidence:
( ) ( )( ) ( )( )( ) ( )Tk1Tn
Tk1TnTR
2λ
2λ
2λ
2λ
λ
++
+−= (Eq. 5)
while Trλ(T) depends on the extinction coefficient and on the thickness d:
( ) ( )[ ] ( )[ ]dTexp/dTk4expTTr ⋅α−=λ⋅⋅π−= λλλ (Eq. 6)
with αλ(T) the absorption coefficient (in m-1).
By combining the equations 2-6, the normal spectral emissivity can be expressed as:
( ) ( )[ ] ( )[ ]( ) ( )
( )( ) ( )( )( ) ( )
( )( )[ ]
( )( ) ( )( )( ) ( )
( )( )λ⋅⋅π−⋅+++−
−
λ⋅⋅π−−⋅
+++−
−=
⋅−−⋅−
=ε
λ
λ
λλ
λλλ
/dTk4expTk1Tn
Tk1Tn1
/dTk4exp1Tk1Tn
Tk1Tn1
TTrTR1
TTr1TR1T
2λ
2λ
2λ
2λ
2λ
2λ
2λ
2λ (Eq. 7)
4
All these equations indicate that the spectral emissivity of a material may depend on various
parameters, and that it may depart from unity either if it is transparent, semi transparent or if it
reflects the light. On the one hand the transparency may be due to a low absorption coefficient
or/and a small thickness of the emitting material. On the other hand the reflexion process can
originate from a high refractive index value or from a strong extinction coefficient as well.
The examination of the dielectric function of refractory materials (oxides, nitrides, carbides)
at room temperature shows a strong electronic absorption in the UV range and a strong lattice
vibrational absorption in the mid-IR. In this latter spectral range is located the Christiansen
wavelength which corresponds to a refraction index nλ equal to 1 and an extinction coefficient
kλ<<1. Therefore the reflectivity tends to zero, and if the material is sufficiently thick to be
considered as opaque (Trλ=0), the material behaves as a blackbody (ελ=1) [5]. The
development of optical pyrometry at the Christiansen wavelength could be promising,
however it strongly depends on the materials (λChristiansen =6→50 µm).
Away from the Christiansen wavelength, the accuracy of the normal spectral emissivity has to
be carefully examined. The relative error on ελ(T) can be derived from Equation 1 as:
( )( ) ( )TC exp1
1T
T
C
T
T
22
2
λ−−⋅∆
λ=
εε∆
λ
λ (Eq. 8)
In the UV-visible range, Wien’s approximation (λT<<C2) can be applied and the exponential
term is negligible. Equation 8 shows that the temperature error is proportional to the
temperature squared, the wavelength and the relative error on spectral emissivity. As there is
generally a poor knowledge of the effects of temperature and wavelength on the spectral
emissivity of materials, the application of pyrometry at short wavelength seems to be
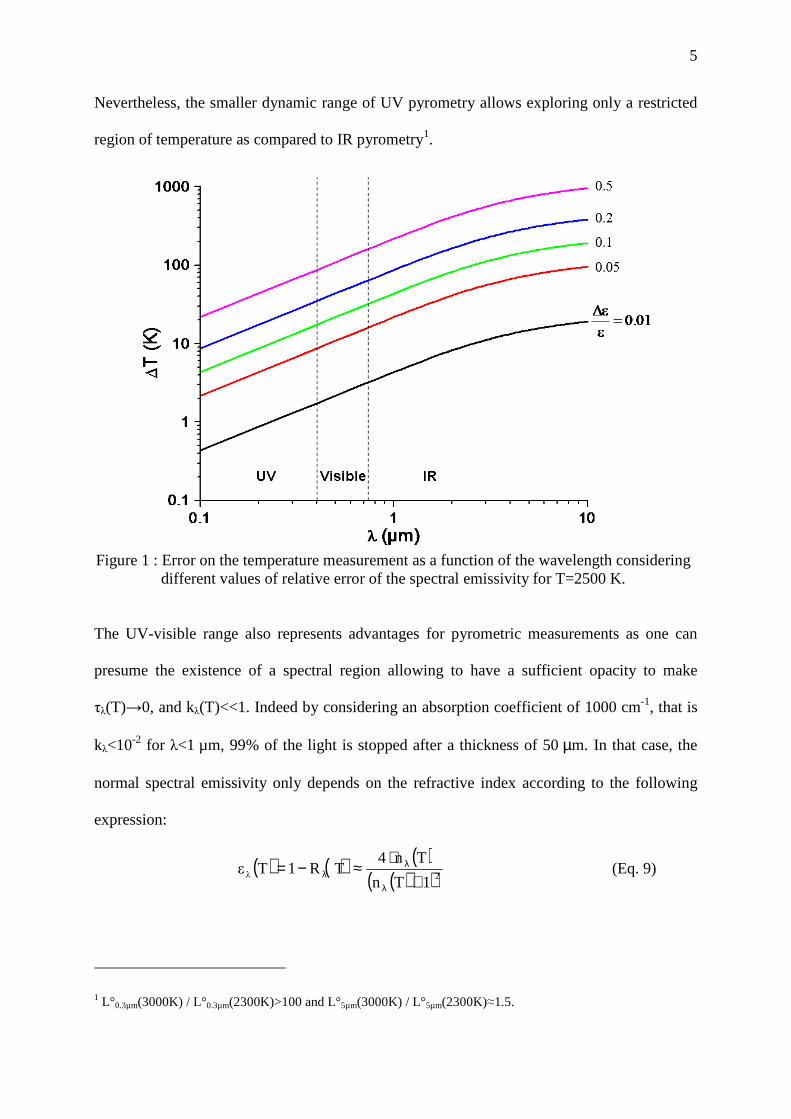
advantageous. Figure 1 clearly demonstrates that the temperature error would not exceed tens
of degrees in the UV range while it would rapidly reach one hundred degrees in the IR range.
5
Nevertheless, the smaller dynamic range of UV pyrometry allows exploring only a restricted
region of temperature as compared to IR pyrometry1.
Figure 1 : Error on the temperature measurement as a function of the wavelength considering
different values of relative error of the spectral emissivity for T=2500 K.
The UV-visible range also represents advantages for pyrometric measurements as one can
presume the existence of a spectral region allowing to have a sufficient opacity to make
τλ(T)→0, and kλ(T)<<1. Indeed by considering an absorption coefficient of 1000 cm-1, that is
kλ<10-2 for λ<1 µm, 99% of the light is stopped after a thickness of 50 µm. In that case, the
normal spectral emissivity only depends on the refractive index according to the following
expression:
( ) ( ) ( )( )( )2λ
1Tn
Tn4TR1Tε
+⋅
≈−=λ
λλ (Eq. 9)
1 L°0.3µm(3000K) / L°0.3µm(2300K)>100 and L°5µm(3000K) / L°5µm(2300K)≈1.5.
6
These arguments made us choose the near UV pyrometry as more promising for a general
approach of refractory oxides.
3. EXPERIMENTAL SET UP
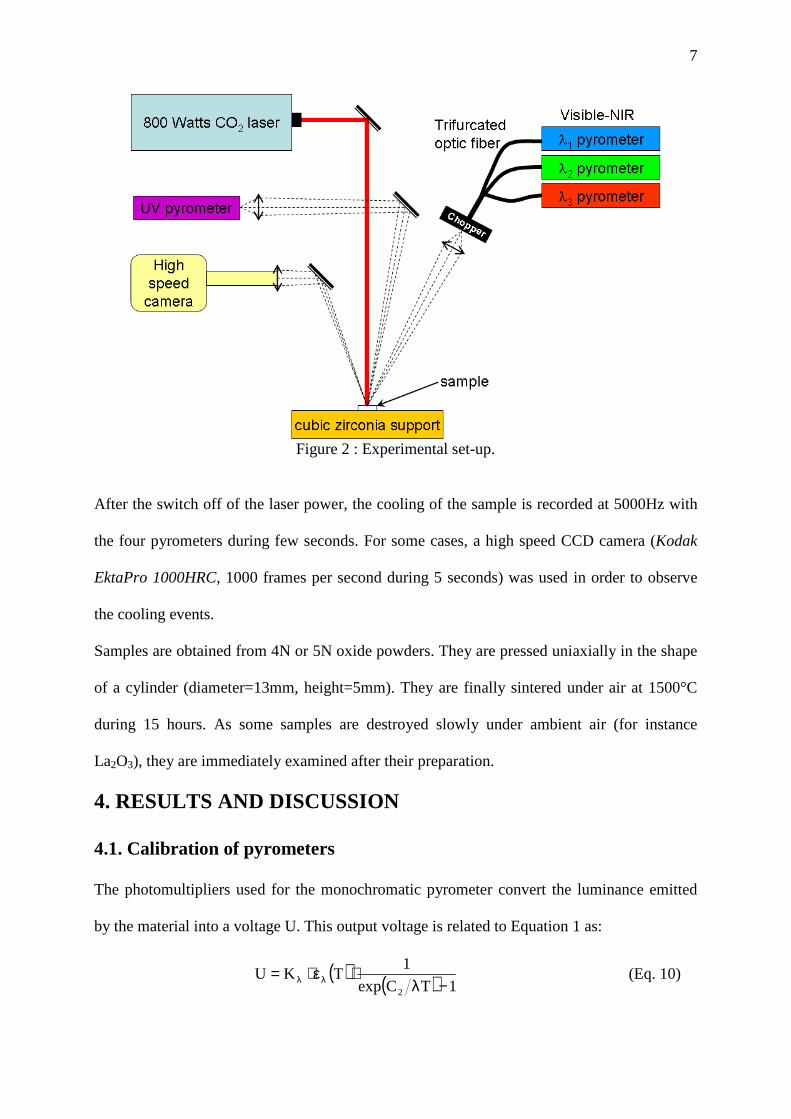
The experimental set up is shown on Figure 2. A 800 Watt Coherent CO2 laser operating at
λ=10.6 µm heats the surface of the sample. Its beam diameter is 13 mm and the power of the
laser is controlled in order to create a 5-10 mm liquid pool in the middle of the sample.
Pyrometers consist of a solar blind UV Hamamatsu photomultiplier tube and Radiotechnique
photomultiplier tubes for the visible and near IR. Optical filters with a spectral width of 1-
10% are used to select the wavelength domains. The effective wavelength of every pyrometer
was calculated by convoluting the spectral response of the filter with that of the
photomultiplier and the black body function at 2500 and 3000K. The signal of the visible and
near IR pyrometers is chopped and amplified with a lock in amplifier whereas that of the UV
pyrometer is directly amplified. The wavelength of the UV pyrometer is λ=224 nm for some
experiments and it is changed to λ=313 nm for some others by changing the optical filter. The
optical paths of the three visible pyrometers (λ=400-800 nm) are identical and they are also
isochronous.
7
Figure 2 : Experimental set-up.
After the switch off of the laser power, the cooling of the sample is recorded at 5000Hz with
the four pyrometers during few seconds. For some cases, a high speed CCD camera (Kodak
EktaPro 1000HRC, 1000 frames per second during 5 seconds) was used in order to observe
the cooling events.
Samples are obtained from 4N or 5N oxide powders. They are pressed uniaxially in the shape
of a cylinder (diameter=13mm, height=5mm). They are finally sintered under air at 1500°C
during 15 hours. As some samples are destroyed slowly under ambient air (for instance
La2O3), they are immediately examined after their preparation.
4. RESULTS AND DISCUSSION
4.1. Calibration of pyrometers
The photomultipliers used for the monochromatic pyrometer convert the luminance emitted
by the material into a voltage U. This output voltage is related to Equation 1 as:
( ) ( ) 1TCexp
1TKU
2 −λ⋅ε⋅= λλ (Eq. 10)

8
Kλ represents the apparatus function taking into account the photoelectric conversion of the
detector and the optical path.
The calibration of the pyrometers consists in determining Kλ or the product Kλ·ελ(T) by using
the known melting point of a high temperature material. Alumina (Al2O3) is the only high
temperature oxide which is an auxiliary reference in the international scale of temperatures
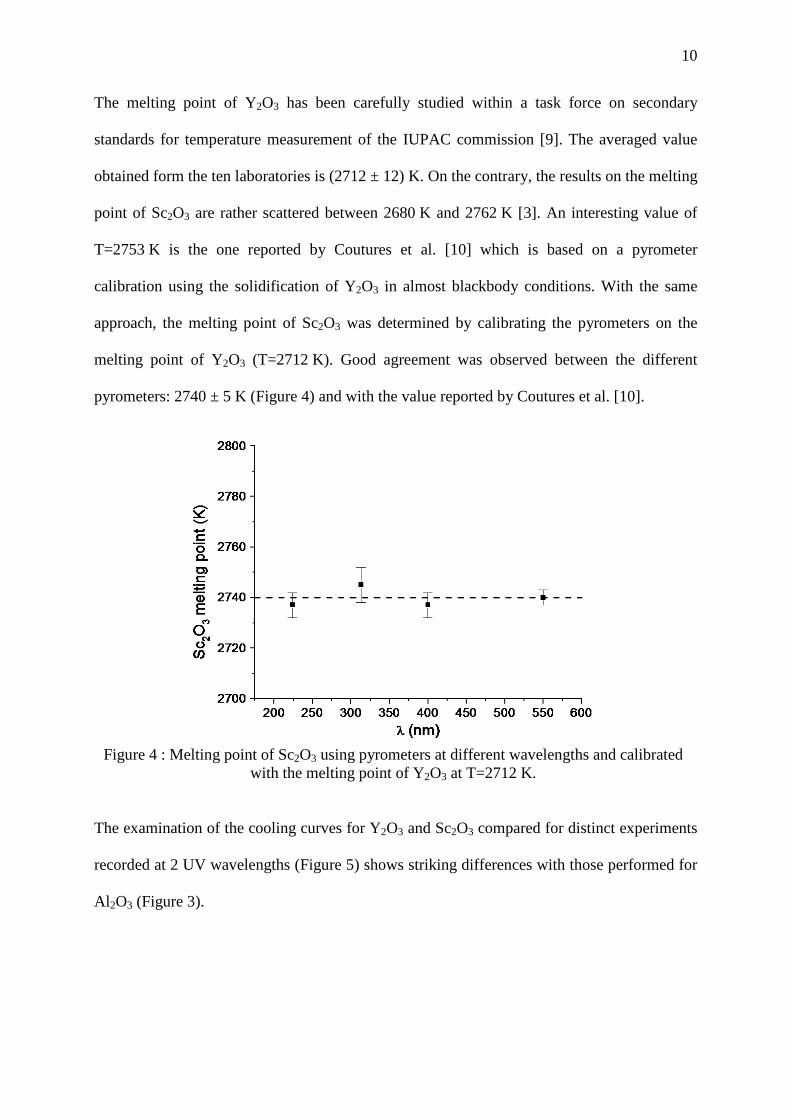
with a congruent melting point at T=(2327 ± 6) K [1,6]. Figure 3 illustrates the cooling curves
of alumina for four wavelengths (λ=313, 400, 550, 800 nm).
Figure 3 : Cooling curves of alumina for four different wavelengths. Regions – 1: laser on;
1/2: laser cut-off; 2: liquid cooling; 2/3: liquid-solid transition; 3-4: solidification.
The cooling curves show distinct regions where the temperatures are either the same (Fig. 3,
regions 2 and 3) or different (regions 1 and 4). When the laser heats the sample surface
(Fig. 3, region 1), the pyrometers indicate very different temperatures (∆T ≈ 200 K). Actually
as the laser radiation is very close to the Christiansen’s wavelength, the energy is completely
absorbed by alumina in few hundreds of microns (k10.6 µm ≈ 10-2, [7]). This results in
9
generating a strong temperature gradient between the extreme surface and the interior of the
liquid pool. Furthermore it can be assumed that the absorption coefficient varies with the
wavelength in such a way that the opacity increases as the wavelength decreases [8].
Therefore the UV pyrometer looks at the surface of an opaque liquid whereas the three visible
pyrometers integrate the light coming from some semitransparent layer near the surface that
present strong temperature gradients. Once the laser is switched off (transition 1/2), the
surface becomes the coldest point of the emissive liquid which is strongly convective.
Therefore internal convection tends to reduce the temperature gradient near the surface and
the four pyrometers indicate the same temperature during the cooling in the liquid state
(region 2). Then the liquid-solid transition occurs with the formation of a solid layer
(transition 2/3), and a plateau of several hundreds of milliseconds is observed which is used
for calibration (region 3). The duration of the plateau seems to depend on the pyrometer
wavelength. This behaviour indicates that the solid which is formed on top of the liquid is
almost transparent, particularly in the UV range, and it allows measuring the solidification at
the solid/liquid interface. The solidification of the sample stops the internal convection and
new temperature gradients form. In that case the UV pyrometer detects for longer time the
solidification plateau at 2327 K temperature of the solid/liquid interface. Finally a decrease of
the temperature is observed after a plateau of 1 s corresponding to the end of the solidification
process (region 4).
Although the liquid-solid transition Al2O3 seemed practical to calibrate the pyrometers, it
could not be used because of its relatively low temperature (T=2327 K). Indeed it did not
allow to measure temperatures as high as 3500 K particularly in the UV range without
changing the gain values of the amplifiers (→ the main drawback of the UV pyrometry, see
note 1, p. 2). Therefore it has been decided to examine a new reference suitable for higher
temperatures. Scandia (Sc2O3) and yttria (Y2O3) were good candidates for distinct reasons.
10
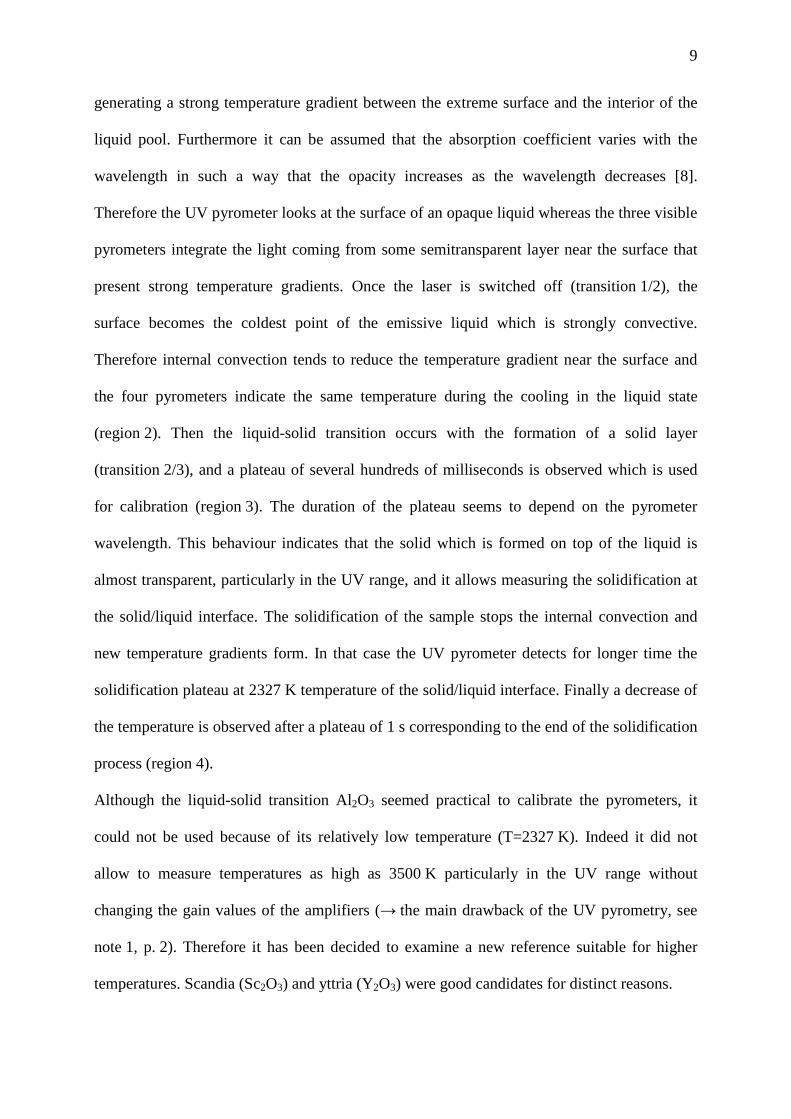
The melting point of Y2O3 has been carefully studied within a task force on secondary
standards for temperature measurement of the IUPAC commission [9]. The averaged value
obtained form the ten laboratories is (2712 ± 12) K. On the contrary, the results on the melting
point of Sc2O3 are rather scattered between 2680 K and 2762 K [3]. An interesting value of
T=2753 K is the one reported by Coutures et al. [10] which is based on a pyrometer
calibration using the solidification of Y2O3 in almost blackbody conditions. With the same
approach, the melting point of Sc2O3 was determined by calibrating the pyrometers on the
melting point of Y2O3 (T=2712 K). Good agreement was observed between the different
pyrometers: 2740 ± 5 K (Figure 4) and with the value reported by Coutures et al. [10].
Figure 4 : Melting point of Sc2O3 using pyrometers at different wavelengths and calibrated
with the melting point of Y2O3 at T=2712 K.
The examination of the cooling curves for Y2O3 and Sc2O3 compared for distinct experiments
recorded at 2 UV wavelengths (Figure 5) shows striking differences with those performed for
Al 2O3 (Figure 3).
11
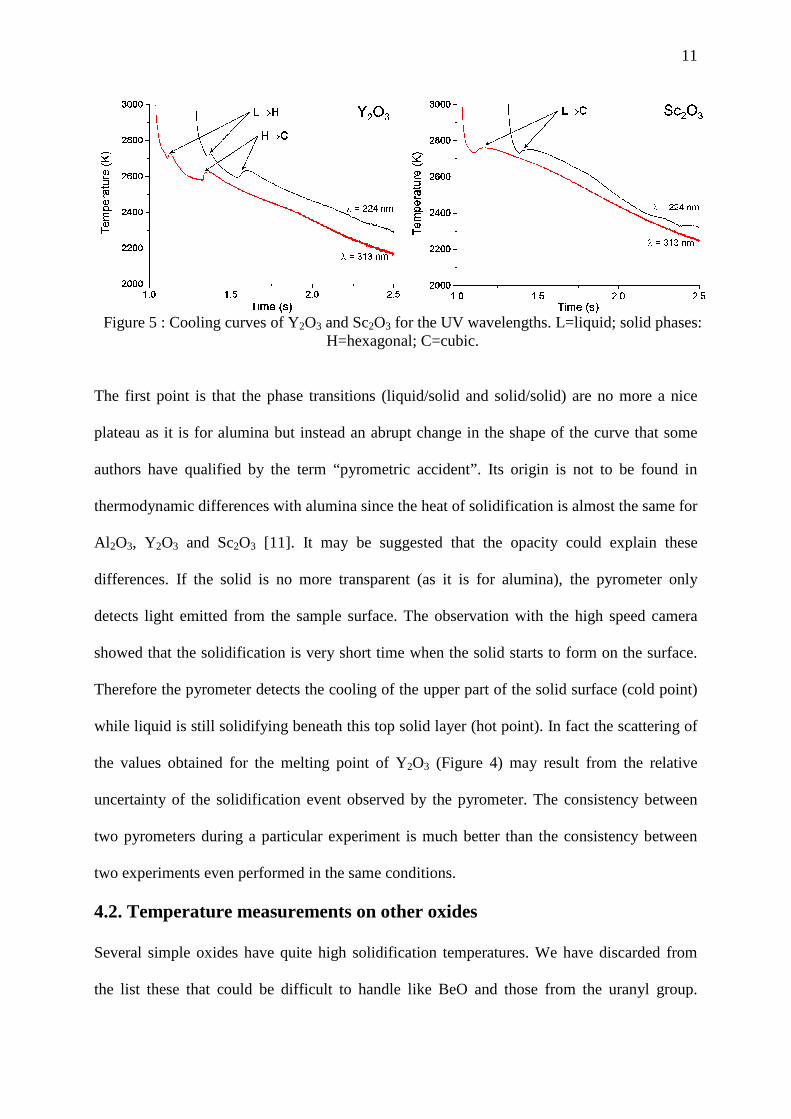
Figure 5 : Cooling curves of Y2O3 and Sc2O3 for the UV wavelengths. L=liquid; solid phases:
H=hexagonal; C=cubic.
The first point is that the phase transitions (liquid/solid and solid/solid) are no more a nice
plateau as it is for alumina but instead an abrupt change in the shape of the curve that some
authors have qualified by the term “pyrometric accident”. Its origin is not to be found in
thermodynamic differences with alumina since the heat of solidification is almost the same for
Al 2O3, Y2O3 and Sc2O3 [11]. It may be suggested that the opacity could explain these
differences. If the solid is no more transparent (as it is for alumina), the pyrometer only
detects light emitted from the sample surface. The observation with the high speed camera
showed that the solidification is very short time when the solid starts to form on the surface.
Therefore the pyrometer detects the cooling of the upper part of the solid surface (cold point)
while liquid is still solidifying beneath this top solid layer (hot point). In fact the scattering of
the values obtained for the melting point of Y2O3 (Figure 4) may result from the relative
uncertainty of the solidification event observed by the pyrometer. The consistency between
two pyrometers during a particular experiment is much better than the consistency between
two experiments even performed in the same conditions.
4.2. Temperature measurements on other oxides
Several simple oxides have quite high solidification temperatures. We have discarded from
the list these that could be difficult to handle like BeO and those from the uranyl group.
12
Others like CaO and MgO which evaporate at high temperature are also left aside. Rare earth
oxides as well as HfO2 and ZrO2 have been considered. Examples of cooling curves obtained
with the UV pyrometer (λ=224 nm or 313 nm) are presented on Figure 6 and Figure 7. The
cooling curves have very similar shapes to that of Y2O3 and Sc2O3, presenting “pyrometric
accidents” instead of plateaus as it is observed in the case of Al2O3.
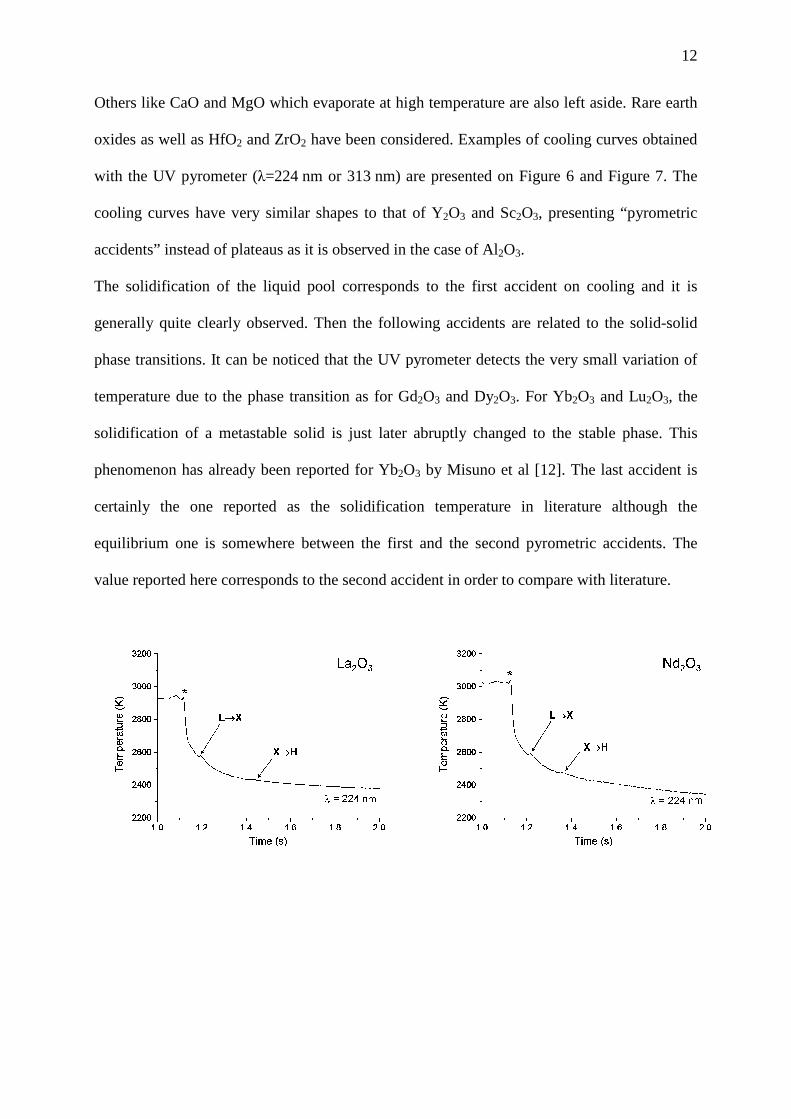
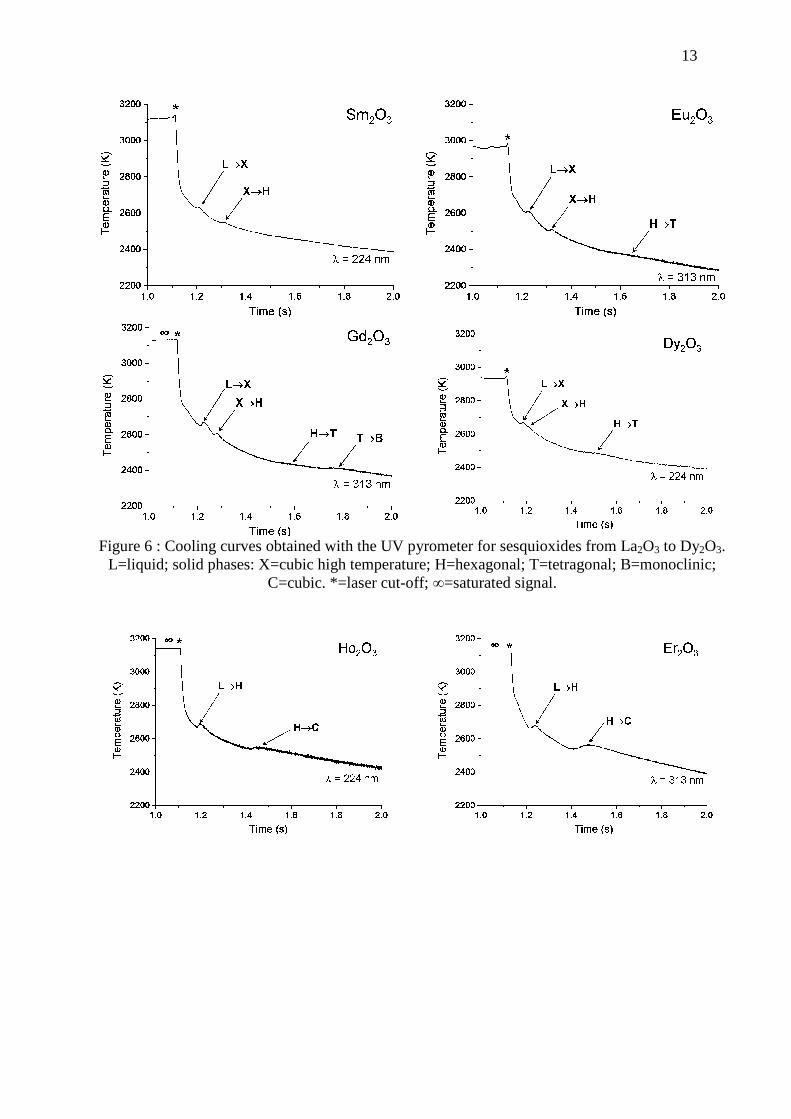
The solidification of the liquid pool corresponds to the first accident on cooling and it is
generally quite clearly observed. Then the following accidents are related to the solid-solid
phase transitions. It can be noticed that the UV pyrometer detects the very small variation of
temperature due to the phase transition as for Gd2O3 and Dy2O3. For Yb2O3 and Lu2O3, the
solidification of a metastable solid is just later abruptly changed to the stable phase. This
phenomenon has already been reported for Yb2O3 by Misuno et al [12]. The last accident is
certainly the one reported as the solidification temperature in literature although the
equilibrium one is somewhere between the first and the second pyrometric accidents. The
value reported here corresponds to the second accident in order to compare with literature.
13
Figure 6 : Cooling curves obtained with the UV pyrometer for sesquioxides from La2O3 to Dy2O3.
L=liquid; solid phases: X=cubic high temperature; H=hexagonal; T=tetragonal; B=monoclinic; C=cubic. *=laser cut-off; ∞=saturated signal.

14
Figure 7 : Cooling curves obtained with the UV pyrometer for sesquioxides from Ho2O3 to Lu2O3 and for ZrO2 and HfO2. L=liquid; solid phases: X=cubic high temperature; H=hexagonal; C=cubic.
*=laser cut-off; ∞=saturated signal.
The curves obtained with the UV pyrometer have also been recorded with the visible and IR
pyrometers giving similar cooling curves. The averaged apparent solidification temperatures
are shown on Figure 8 for some oxides and are compared with the values recommended by
the literature [2,3,13]. Good agreement is observed in the wavelength range λ=300-550 nm.
15
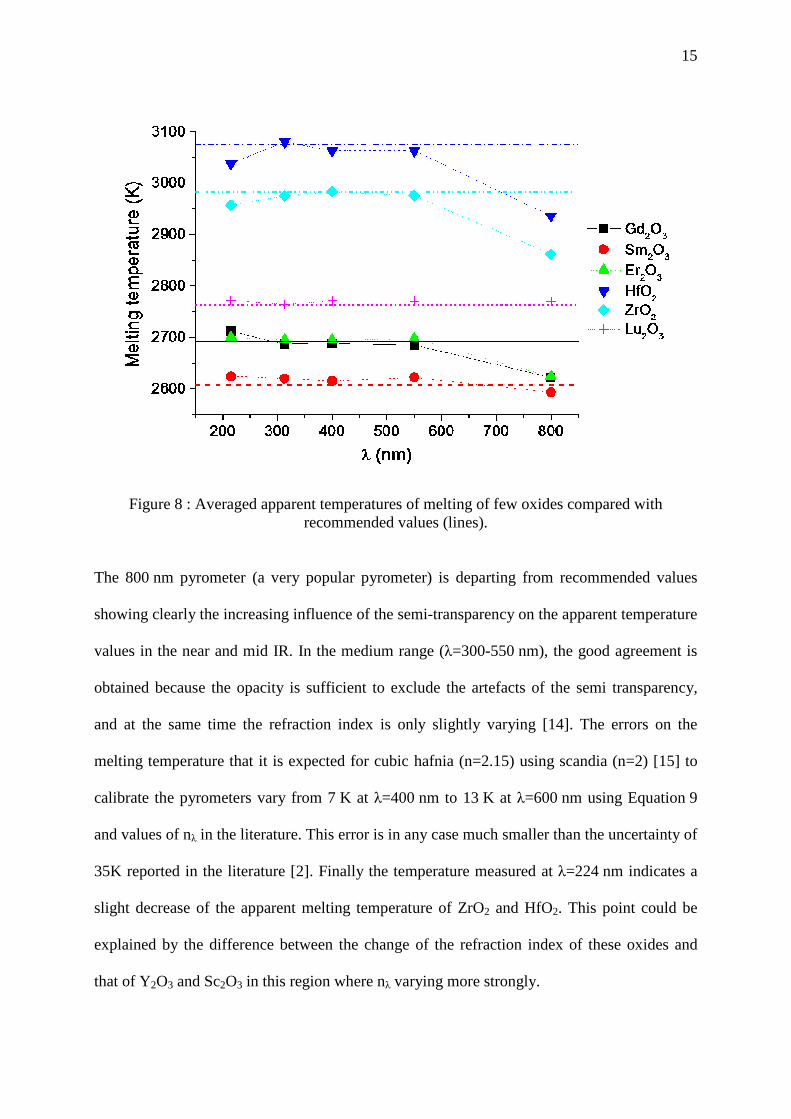
Figure 8 : Averaged apparent temperatures of melting of few oxides compared with
recommended values (lines).
The 800 nm pyrometer (a very popular pyrometer) is departing from recommended values
showing clearly the increasing influence of the semi-transparency on the apparent temperature
values in the near and mid IR. In the medium range (λ=300-550 nm), the good agreement is
obtained because the opacity is sufficient to exclude the artefacts of the semi transparency,
and at the same time the refraction index is only slightly varying [14]. The errors on the
melting temperature that it is expected for cubic hafnia (n=2.15) using scandia (n=2) [15] to
calibrate the pyrometers vary from 7 K at λ=400 nm to 13 K at λ=600 nm using Equation 9
and values of nλ in the literature. This error is in any case much smaller than the uncertainty of
35K reported in the literature [2]. Finally the temperature measured at λ=224 nm indicates a
slight decrease of the apparent melting temperature of ZrO2 and HfO2. This point could be
explained by the difference between the change of the refraction index of these oxides and
that of Y2O3 and Sc2O3 in this region where nλ varying more strongly.
16
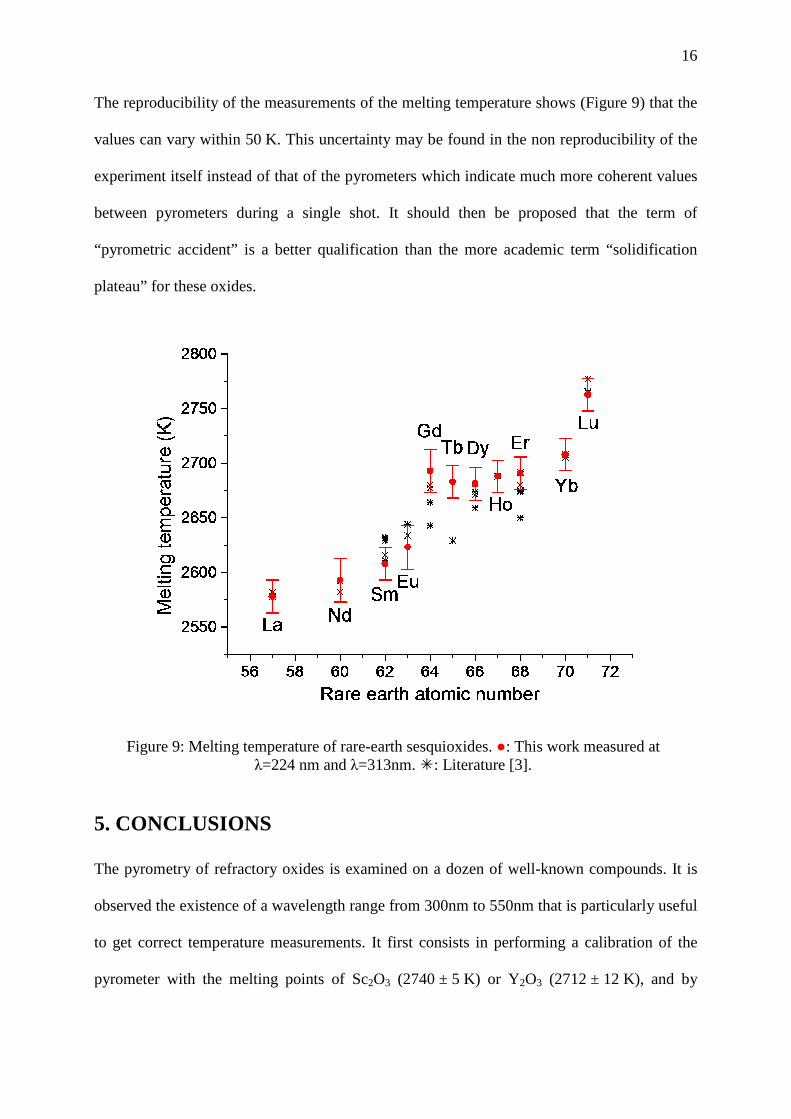
The reproducibility of the measurements of the melting temperature shows (Figure 9) that the
values can vary within 50 K. This uncertainty may be found in the non reproducibility of the
experiment itself instead of that of the pyrometers which indicate much more coherent values
between pyrometers during a single shot. It should then be proposed that the term of
“pyrometric accident” is a better qualification than the more academic term “solidification
plateau” for these oxides.
Figure 9: Melting temperature of rare-earth sesquioxides. ●: This work measured at
λ=224 nm and λ=313nm. �: Literature [3].
5. CONCLUSIONS
The pyrometry of refractory oxides is examined on a dozen of well-known compounds. It is
observed the existence of a wavelength range from 300nm to 550nm that is particularly useful
to get correct temperature measurements. It first consists in performing a calibration of the
pyrometer with the melting points of Sc2O3 (2740 ± 5 K) or Y2O3 (2712 ± 12 K), and by
17
considering that the spectral emissivity of any material is the same as the calibration one.
Although this latter assumption is generally not verified, this procedure does not introduce
important errors because the corrections (10 K) that are expected are in the range of the
precision of the method (10 K) as long as the surface of the emitting solid is sufficiently
opaque at the considered wavelength. It is also observed that the main problem of the
pyrometric measurement on refractory oxides is the non reproducibility of the solidification
event (50K). Finally, in the case of silicates and aluminates, it is recommended to shift the
wavelength range [300-550 nm] down to λ=224 nm since they are more transparent in the
near UV than the sesquioxides as well as zirconia and hafnia.
18
REFERENCES
[1] Schneider SJ. Pure & Appl. Chem. 21 (1970) 117.
[2] Hlavac J. Pure & Appl. Chem. 54 (1982) 681.
[3] Coutures JP, Rand MH. Pure & Appl. Chem. 61 (1989) 1461.
[4] Siegel R, Howel, JR. Thermal Radiation and Heat Transfer. Bristol P.A.:Taylor and
Francis; chapt. 2-3, 1992.
[5] Rousseau B, Brun JF, De Sousa Meneses D, Echegut P. Int J. Thermophys. 26 (2005)
1277.
[6] Bedford RE, Bonnier G, Mass H, Pavese F., Metrologia. 33 (1996) 133.
[7] Shigapov AB., High Temp. 36 (1996) 35.
[8] Anfimov NA, Karabadjak GF, Khmelinin BA, Plastinin YA, Rodionov AV. AIAA 28th
Thermophysics Conference, July 6-9 , Orlando:FL (1993).
[9] Foëx M. High Temp. High Press. 9 (1977) 269.
[10] Coutures JP, Verges R, Foëx M. Rev. Int. Htes Temp. Refract. 12 (1975) 181.
[11] Swamy V, Seifert H J, Aldinger F. J. Alloys & Comp. 269 (1998) 201.
[12] Masuno A, Arai Y, Yu J. Phase Transitions 81 (2008) 553.
[13] Yamada T, Yoshimura M, Somiya S. High Temp. High Press. 18 (1986) 377.
[14] Medenbach O, Dettmar D, Shannon RD, Fischer RX, Yen WM. J. Opt. A: Pure Appl.
Opt. 3 (2001) 174.
[15] Wood DL, Nassau K, Kometani TY, Nash DL. Appl. Opt. 29 (1990) 604.