Synthesis, Analysis and Modification of Microgels with ...
153
Synthesis, Analysis and Modification of Microgels with Functional Oligoglycidol Comonomers Der Fakultät für Naturwissenschaften der Rheinisch-Westfälischen Technischen Hochschule Aachen vorgelegte Dissertation zur Erlangung des akademischen Grades eines Doktors der Naturwissenschaften Vorgelegt von Diplom-Chemiker Christian Willems Aus Neuwied Berichter: Universitätsprofessor Dr. rer. nat. Andrij Pich Universitätsprofessor Dr. rer. nat. Martin Möller Tag der mündlichen Prüfung: 06.06.2017 Diese Dissertation ist auf den Internetseiten der Universitätsbibliothek online verfügbar.
-
Upload
khangminh22 -
Category
Documents
-
view
0 -
download
0
Transcript of Synthesis, Analysis and Modification of Microgels with ...

Synthesis, Analysis and Modification
of Microgels with Functional
Oligoglycidol Comonomers
Der Fakultät für Naturwissenschaften der Rheinisch-Westfälischen Technischen Hochschule Aachen
vorgelegte Dissertation zur Erlangung des akademischen Grades eines Doktors der
Naturwissenschaften
Vorgelegt von
Diplom-Chemiker
Christian Willems
Aus
Neuwied
Berichter:
Universitätsprofessor Dr. rer. nat. Andrij Pich
Universitätsprofessor Dr. rer. nat. Martin Möller
Tag der mündlichen Prüfung: 06.06.2017
Diese Dissertation ist auf den Internetseiten der Universitätsbibliothek online verfügbar.

II

III
The most exciting phrase in science, the one that heralds new discoveries, is not “Eureka!” but
“That´s funny…”
- Isaac Asimov
IV
Table of Contents
1. Motivation and Aim of the Work 1
2. General Experimental Part and Instrumental Analysis 4
3. Synthesis and Characterization of Polyvinylcaprolactam Microgels
Functionalized with Oligoglycidol Macromonomers 8
3.1 State of the Art 8
3.2 Aim 18
3.3 Experimental Part 19
3.4 Results and Discussion 29
3.5 Summary and Outlook 55
3.6 Literature 56
3.7 Appendix 61
4. Functionalization of PVCL/Oligoglycidol Microgels 63
4.1 State of the Art 63
4.2 Aim 65
4.3 Experimental Part 67
4.4 Results and Discussion 72
4.5 Summary and Outlook 84
4.6 Literature 86
5. Modification of the Microgel Surface with Polymer Brushes 88
5.1 State of the Art 88
5.2 Aim 93
5.3 Experimental Part 96
5.4 Results and Discussion 108
5.4.1 Grafting-From Polymerization on Microgels by
Cerium Induced Redox Polymerization 108
5.4.2 Grafting-from Single-Electron-Transfer Polymerization 128
5.5 Summary and Outlook 136
5.6 Literature 138
6. Summary 141
7. Nomenclature 144
Danksagung 147
Schlusserklärung 149

1
1. Motivation and Aim of the Work
Microgels are crosslinked colloidal polymer networks which find a useful application in many
different areas. They can be used as additives for functional coatings, drug delivery agents or
catalyst carriers. [1-3] This wide range of microgel applicability is ensured by the combination
of chemical functionality and ability to respond to changes in the environment. Microgels can
change their volume and density as response to external stimuli such as temperature, pH, ionic
strength, etc. [4-6] This intrinsic property can be further tuned to accommodate different
applications by introducing specific functional groups in the microgel structure. The real
challenge lies in the control over the amount and distribution of functional groups in the
microgel structure. For many applications it is important that the functional groups are located
in the microgel shell so as to guarantee an easy availability to other molecules or surfaces. Since
the microgel consists of a loose polymer network with a fuzzy surface, it is difficult to fix
functional groups at the periphery, as they can be distributed throughout the whole microgel
network.
The aim of this work is to develop new routes for the tailored surface decoration of microgels
by using oligoglycidol macromonomers. Oligoglycidol macromonomers exhibit a
polymerisable group that ensures their covalent attachment to microgels. Since they are
amphiphilic they will be located predominantly on the microgel surface, which makes them
more accessible for further modifications. [7] The presence of OH groups in the macromonomer
structure can be used to integrate different functionalities by post-modification processes.
Oligoglycidol macromonomers grafted on the microgel surface will provide efficient sterical
stabilization in aqueous media.
The specific focus of this work was on: a) the synthesis of oligoglycidol macromonomers with
controlled architecture and chemical structure; b) the synthesis of microgels with a controlled
amount of oligoglycidol macromonomers on the surface; c) the postmodification of
oligoglycidol-modified microgels by integration of various functional groups or polymer
chains.
This work is divided in three parts.
In the first part, N-vinylcaprolactam and oligoglycidol macromonomers were copolymerized in
a free radical precipitation polymerization to synthesize microgels with oligoglycidol shells.
Macromonomers with variable molecular weights were synthesized by using ethoxy ethyl

2
glycidyl ether in an anionic polymerization and subsequent deprotection of the OH groups. The
synthesis of the microgel by precipitation polymerization was investigated to determine the
incorporation efficiency and localization of oligoglycidol macromonomers in microgels.
Synthesized microgels were systematically characterized to evaluate the effect of the
comonomer type and amount on the microgel morphology, structure and behavior in aqueous
solutions.
The second part concerns the functionalization of the microgels with functional groups. Since
OH groups of oligoglycidol chains can be easily further modified, it was demonstrated that
various functional groups such as allyl, vinyl sulfonate- or thiol groups can be integrated into
the microgel shell. Modified microgels were analyzed to determine the change of their chemical
structure and properties.
The third part concerns the decoration of oligoglycidol-modified microgels with polymer brush-
like shells by polymerization of several monomers initiated from the microgel surface (grafting-
from). Two types of grafting-from polymerization processes were studied: a) a cerium salt
induced redox polymerization and b) the single-electron transfer living radical polymerization.
Different monomers were used and tested and the reaction conditions were optimized.

3
1.1 Literature
[1] Bradna, P.; Stern, P.; Quadrat, O.; Snuparek, J. Colloid Polym. Sci. 1995, 273, 324-330.
[2] Das, M.; Sanson, N.; Fava, D.; Kumacheva, E. Langmuir 2007, 23, 196-201.
[3] Schunicht, C.; Biffis, A.; Wulft, G. Tetrahedron 2000, 56, 1693-1699.
[4] Otake, K.; Inomata, H.; Konno, M.; Saito, S. Macromolecules 1990, 23, 283-289.
[5] Makhaeva, E.E.; Thanh, L. T. M.; Starodoubtsev, S. G.; Khoklov, A. R. Macromol.
Chem.Phys. 1996, 197, 1973-1982.
[6] Dupin, D.; Fujii, S.; Armes, S. P. Langmuir 2006, 22, 3381-3387.
[7] Mendrek, A.; Mendrek, S., Adler, H.-J.; Dworak, A.; Kuckling Polymer, 2010, 51, 342-
354.
4
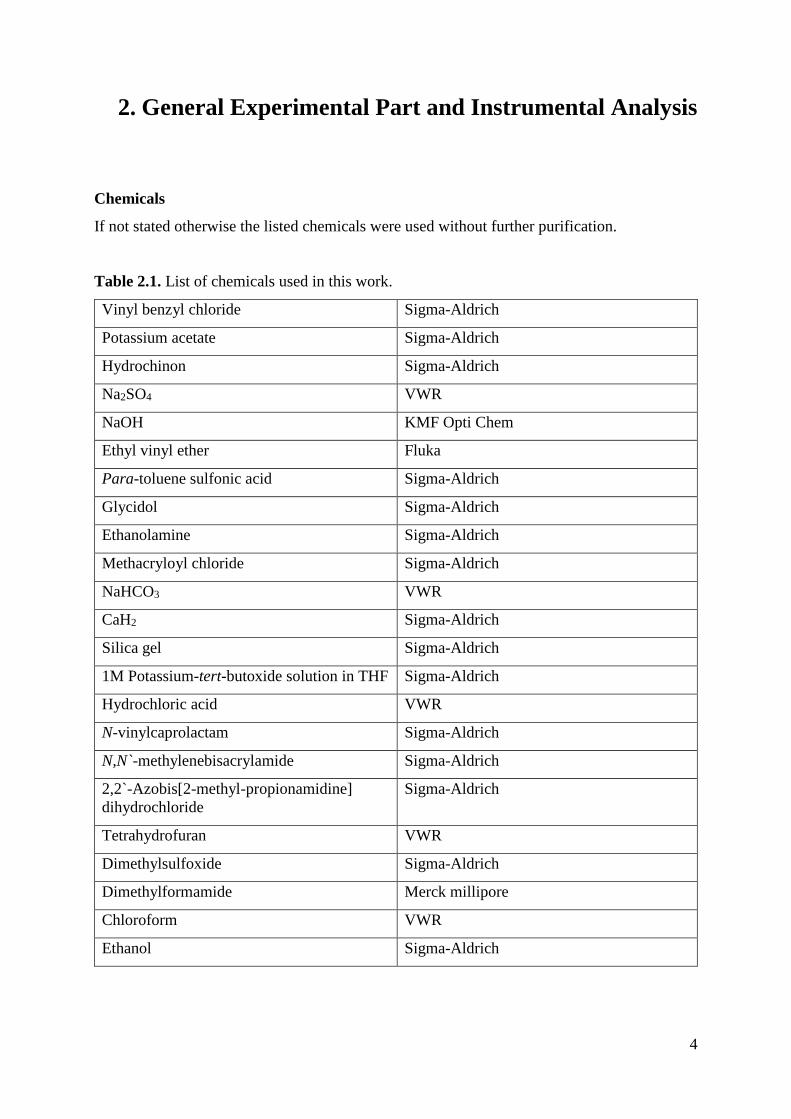
2. General Experimental Part and Instrumental Analysis
Chemicals
If not stated otherwise the listed chemicals were used without further purification.
Table 2.1. List of chemicals used in this work.
Vinyl benzyl chloride Sigma-Aldrich
Potassium acetate Sigma-Aldrich
Hydrochinon Sigma-Aldrich
Na2SO4 VWR
NaOH KMF Opti Chem
Ethyl vinyl ether Fluka
Para-toluene sulfonic acid Sigma-Aldrich
Glycidol Sigma-Aldrich
Ethanolamine Sigma-Aldrich
Methacryloyl chloride Sigma-Aldrich
NaHCO3 VWR
CaH2 Sigma-Aldrich
Silica gel Sigma-Aldrich
1M Potassium-tert-butoxide solution in THF Sigma-Aldrich
Hydrochloric acid VWR
N-vinylcaprolactam Sigma-Aldrich
N,N`-methylenebisacrylamide Sigma-Aldrich
2,2`-Azobis[2-methyl-propionamidine]
dihydrochloride
Sigma-Aldrich
Tetrahydrofuran VWR
Dimethylsulfoxide Sigma-Aldrich
Dimethylformamide Merck millipore
Chloroform VWR
Ethanol Sigma-Aldrich

5
Table 2.1. List of chemicals used in this work (continued).
Allyl bromide Sigma-Aldrich
Methanol VWR
Dichloromethan Sigma Aldrich
Potassium iodide Sigma-Aldrich
Triethylamine Sigma-Aldrich
2-Chloroethane sulfonyl chloride (CSC) Alfa Aesar
Dicyclohexylcarbodiimide (DCC) Sigma-Aldrich
Dimethylaminopyridine (DMAP) Sigma-Aldrich
3,3´-Dithiodipropionic acid (DTPA) Sigma-Aldrich
Dithiothreitol (DTT) Sigma-Aldrich
Phosphate buffered saline Sigma-Aldrich
Ceric ammonium nitrate (CAN) Sigma-Aldrich
Di (ethylene glycol) ethyl ether acrylate
(DEGA)
Sigma-Aldrich
2-Methoxy ethyl acrylate (MEA) Sigma-Aldrich
Nitric acid (65%) VWR Chemicals
[2-(Methacryloyloxy) ethyl]-dimethyl (3-
sulfopropyl) ammonium hydroxide
(sulfobetain-1)
Sigma-Aldrich
[2-(Methacryloylamino) ethyl]-dimethyl (3-
sulfopropyl) ammonium hydroxide
(sulfobetain-2)
Sigma-Aldrich
Sodium 4-styrenesulfonate (SSA) Sigma-Aldrich
1-Vinyl imidazole Sigma-Aldrich
N-isopropyl acryl amide (NIPAAM) Sigma-Aldrich
Acryl nitrile Sigma-Aldrich
Copper wire -
CuBr2 Sigma-Aldrich
2-Bromo propionyl bromide Sigma-Aldrich
Hydrazine hydrate Sigma-Aldrich
ME6TREN Sigma-Aldrich
6
N-Vinylcaprolactam (VCL) was purified by distillation under vacuum. Glycidol was dried with
CaH2 and purified by distillation under vacuum.
The solvents dimethylsulfoxide (DMSO), dimethylformamide (DMF), dichloromethane
(DCM), tetrahydrofuran (THF) and ethanol were stored under a nitrogen atmosphere over
molecular sieves (4 Å). Potassium-tert-butoxide solution was stored under a nitrogen
atmosphere.
Analytical Instrumentation
NMR spectra were measured using a Bruker DPX-400 FT-NMR spectrometer at 400 MHz.
Samples were prepared by dissolving 50 mg of the sample in 1 mL of the deuterated solvent.
The chemical shift is indicated in parts per million (ppm). The samples were analyzed using the
software MestReC 4.9.
Transversal relaxation measurements were performed using an AV700 NMR spectrometer at a
proton frequency of 700.2378 MHz. Samples were prepared by dissolving 20 mg in 0.8 mL
deuterated water. The transverse magnetization relaxation was measured using the classical
Hahn-echo experiment, 900x -t – 1800
x – t – Hahn echo – (acquisition), where t is the echo time.
Chromatographic measurements were done using size exclusion chromatography (SEC). For
measurements performed with THF as the eluent, a high pressure liquid chromatography pump
(ERC 6420) and a refractive index detector (WGE Dr. Bures ETA 2020) were used at a
temperature of 30°C. The flow rate of the eluent was 1.0 mL/min. Four columns with a MZ-
DVB gel were applied.
For measurements performed with DMF as eluent, a Bischoff HPLC high pressure liquid
chromatography compact pump with an RI Jasco RI-2031 plus detector was used. Three
columns with PSS GRAM gel were applied. The DMF contained 1 mg/mL LiBr.
The length of each column for THF and DMF measurements was 300mm while the diameter
was 8 mm. The diameter of the gel particles was 5 µm with pore widths of 50, 100, 1000 and
10000 Å. Poly (methyl methacrylate) or polystyrene was used as a standard to achieve a
calibration. The results were analyzed using the software WinGPC unity.
Dynamic light scattering measurements were done in seral water as solvent. Single dynamic
light scattering measurements were performed using an ALV/LSE-5004 spectrometer with an
ALV-5000/EPP multiple digital time correlator and the laser goniometry system ALV/CGS-8F
with a helium/neon laser (Uniphase 1145P, output power: 22mW, wavelength: 632.8 nm) as a
light source. Unless otherwise noted, the measurements were taken at an angle of 90°.

7
Dynamic light scattering measurements at different temperatures were performed using the
Zetasizer Nano ZS. Measurements were taken at an angle of 173°.
Field-Flow Fractionation measurements were performed using the AF 2000 MT separation
system by Postnova Analytics. The microgels were dispersed in deionized water and measured
at a concentration of 1 mg/mL. Regenerated Cellulose was used as a membrane.
Surface tension measurements were performed using a DSA instrument (Krüss).
Macromonomers were measured in water by applying the pendant drop method at an air/liquid
interface. Measurements were performed at room temperature with different macromonomer
concentrations.
Transmission electron microscopy (TEM) measurements were performed on two different
machines. One was the Zeiss LibraTM 120 (Carl Zeiss, Oberkochen, Germany). The electron
beam accelerating voltage was set at 120 kV. The second one was the Hitachi UHR-FE-SEM
SU 9000 (Hitachi). The acceleration voltage was 30 kV and the measurements were performed
in BFSTEM mode. A drop of the sample was trickled on a piece of Formvar and carbon-coated
copper grid. Before being placed into the TEM specimen holder, the copper grid was air-dried
under ambient conditions.
Sedimentation velocity measurements were performed using a Lumifuge and analyzed with the
program SEPView 6. The sedimentation velocity was calculated for a rotation speed of 2000
rpm.
The polymerization heat was measured in a reaction calorimeter by using a RCE1 high
performance Thermostat in an RTCal Glass reactor. Analysis was done with the program
iControl RC1e.
The syntheses of the microgels and their further treatment can be found in the respective
chapters.

8
3. Synthesis and Characterization of Polyvinylcapro-
lactam Microgels functionalized with Oligoglycidol
Macromonomers
3.1 State of the Art
Microgels
Microgels are colloidal particles, made up of polymer chains, which are crosslinked. The
polymer is usually able to form hydrogen bonds with the solvent. As a result, the microgels are
highly porous and rather soft and contain a high amount of solvent.
An exact definition for microgels is not easy to make, so it is usually said that they are spherical
particles with a size ranging from a few nanometers to 1000 micrometers which are able to take
up a lot of solvent. [1] Microgels were first prepared by Staudinger and Husemann in 1935 and
were comprised of polydivinylbenzene which could be dispersed in organic solvents like
benzene. [2]
Aqueous microgels are an important subgroup. They are porous and are filled with water.
Because of the crosslinker, they are not dissolved in water, but they form stable dispersions in
water. Because of the strong polymer/water hydrogen bonds the attractive van-der-Waals
interactions of the microgels are minimized. [3] The polymer chains are more inclined to develop
hydrogen bonds with water, as opposed to secondary valence bonds with each other. The
amount of water, which is contained in the microgel is dependent on the polymer/polymer and
the polymer/water interactions and the crosslinking density. Those interactions are different,
depending on the polymer. [4] But they can also be influenced, by changing the outside
conditions, such as the temperature, the pH-value, the ionic strength of the dispersion, the
strength of a magnetic field or the wavelength of incoming light. [5-10] Polyvinylcaprolactam
(PVCL)-microgels are a good example for temperature sensitive microgels. If the temperature
is increased above the volume phase transition temperature (VPTT = analogous to the lower
critical solution temperature (LCST) of water soluble polymers), the hydrophobic
polymer/polymer interactions increase, which in turn leads to the expulsion of water out of the
colloidal network. The polymer develops secondary valence bonds with each other. As a
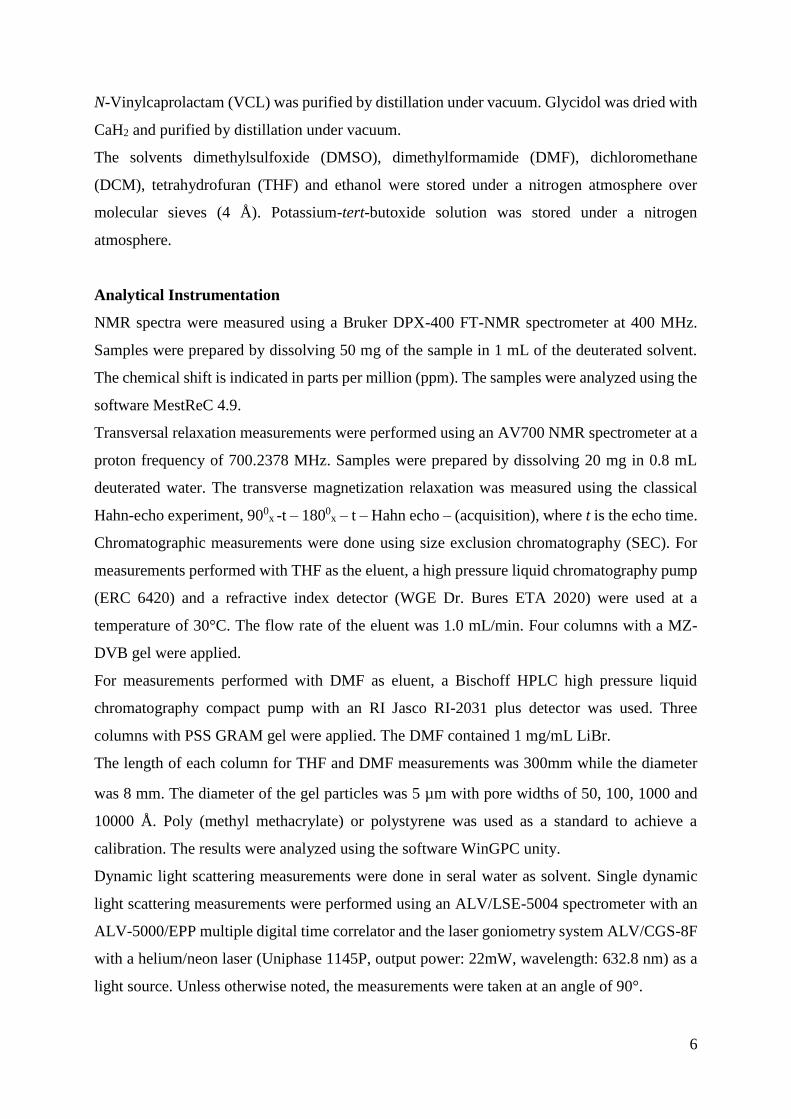
consequence the microgels shrink. [11] This is illustrated in figure 3.1.
9
Figure 3.1. Temperature sensitive behavior of a microgel.
The swollen microgels below the VPTT are similar to a statistical coil, whereas at temperatures
above the VPTT, they have a more spherical shape. [12]
Polymers, which show temperature sensitivity and can be synthesized to form microgels are
poly (N-isopropylacrylamide) (PNIPAAM), poly (N-isopropylmethacrylamide) or poly (N-
vinylcaprolactam). [4, 13]
As mentioned above, some microgels are not only responsive to changes in the temperature,
but to other changes in the environment as well. For example the copolymerization of VCL
with 4-vinylimidazole leads to pH-sensitive microgels. The imidazole group can be protonated,
so that the microgels contain charged groups, which repel each other. As a consequence, the
size increases at low pH values. [14]
Depending on the chemical structure, it is possible to synthesize microgels, which are
susceptible to a number of different stimuli, like temperature, pH or ionic strength of the
solution.
Synthesis of Microgels
There are several methods to prepare microgels. They can be synthesized by crosslinking
polymers either by creating covalent bonds between the polymer chains or through the
development of electrostatic interactions. They can also be produced via free radical or
controlled radical polymerization, which can be done as a microemulsion or a precipitation
polymerization.
Especially the precipitation polymerization is a simple and common way to produce microgels
composed of VCL or NIPAAM. The underlying theory is that the monomer is soluble in the
solvent, while the resulting polymer is insoluble so that it precipitates. A precipitation
polymerization works best in a solvent with a high dielectric constant, such as water.
T > VPTT
T < VPTT

10
Additionally, an ionic initiator should be used. A scheme of this method is presented in figure
3.2. [11]
Figure 3.2. Schematic representation of the particle growth process in a precipitation
polymerization. [1]
The monomer, crosslinker and a cationic initiator are dissolved in water at a temperature of 50
to 70°C. The monomers start to polymerize and form small oligoradicals which grow until they
reach a critical chain length. Because the temperature is above the LCST for the formed polymer
chains, they start to precipitate from the solvent and form precursor particles. There are now
two competing growth mechanisms in the polymerization. First, the chains continue to grow by
further polymerization of the monomer in the mixture. In addition, the precursor particles also
aggregate with each other via crosslinking and larger particles are gradually formed. The
collapsed particles still contain a lot of water. At a certain critical size, the aggregation is
hindered by the electrostatic interactions between the positive charges in the microgels, which
come from the cationic initiator fragments. After reducing the temperature below the VPTT,
the water enters the colloidal network and microgels are formed. They are sterically stabilized
through hydrogen bonding between the water and the polymer. A disadvantage of the
precipitation polymerization is the control of the size, since it is usually not possible to
synthesize microgels with a size smaller than 50 nm without a further stabilizing agent. There
are not enough charged initiator fragments to stabilize many small particles. [11]
To synthesize monomodal microgels, surfactants are often used. The surfactants stabilize the
precursor particles and prevent their aggregation. When the aggregation gets inhibited, the
Oligoradicals Precursor particles
Collapsed particles
Microgels
T<VPTT
T>VPTT
11
polymer chains only grow via normal polymerization of the monomers. The growth is more
evenly and the dispersity decreases. This also leads to smaller particles, since the aggregation
would lead to less, larger precursor agglomerates, which is now inhibited. [15] The size and
properties of the microgels can be easily controlled by changes in the amount and type of
crosslinker, initiator, surfactant and changes in the temperature or the stirring rate of the reaction
solution. [15-24] A comonomer can also be introduced during the polymerization
The swelling properties are directly connected to the internal microgel structure. The
crosslinker is usually not evenly distributed throughout the microgel, but is more concentrated
in the core and less in the shell. This is likely because the addition of a crosslinker leads to a
strong increase in the polymer weight by connecting polymer chains with each other, which in
turn quickly decreases its solubility in water. [25]
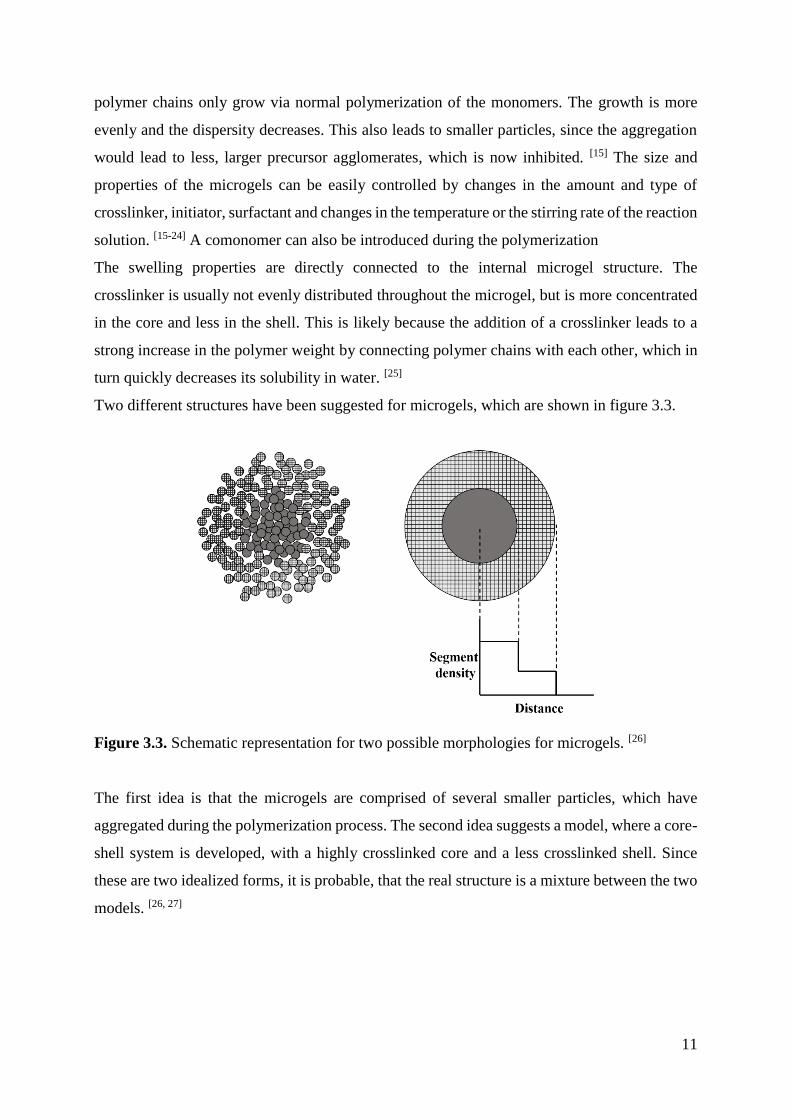
Two different structures have been suggested for microgels, which are shown in figure 3.3.
Figure 3.3. Schematic representation for two possible morphologies for microgels. [26]
The first idea is that the microgels are comprised of several smaller particles, which have
aggregated during the polymerization process. The second idea suggests a model, where a core-
shell system is developed, with a highly crosslinked core and a less crosslinked shell. Since
these are two idealized forms, it is probable, that the real structure is a mixture between the two
models. [26, 27]

12
Synthesis of Microgels by Copolymerization
The introduction of two monomers in microgels leads to a variety of properties. They can
influence the size and change the colloidal stability of the particles. In addition, they can also
introduce new functional groups into the system.
As stated above, the copolymerization of VCL and N-vinylimidazole (VIm) can lead to pH
sensitive microgels, while still retaining its temperature sensitive properties.
Microgels, which consist of NIPAAM and acrylic acid, show a sensitivity towards temperature,
pH and electrolyte concentration. They also show a change in their swelling behavior and a
change in the VPTT. [28]
By choosing aminoethyl methacrylate hydrochloride as a comonomer in the polymerization of
NIPAAM, it was possible to synthesize cationic microgels, which show a higher VPTT and
smaller size than common PNIPAAM microgels, because the cationic charge leads to a better
stabilization of the precursor particles. [29]
Comonomers can also lead to changes in the overall colloidal network structure. The
copolymerization of VCL and glycidyl methacrylate can lead to so-called core-shell structures.
The methacrylate is more hydrophobic and reacts faster than the VCL, which leads to a core,
which is composed mostly of the acrylate, while the shell is composed of VCL. [30]
Schachschal et al. could show that the copolymerization of VCL, dimethyl itaconate (DMI) and
N-vinylimidazole (VIm) leads to microgels, where the DMI is mainly located in the core and
the VIm is located in the shell. It can be hydrolyzed which leads to negatively charged
carboxylic acid groups so that the microgel ultimately possess an anionic core and a cationic
shell. The temperature sensitivity directly correlates with the pH value of the surrounding
solvent. [31]
PCVL/acetoacetoxyethyl methacrylate (AAEM) microgels, synthesized by Pich et al., contain
the AAEM in the core and are less temperature sensitive than pure PVCL microgels. [13]
Another way of creating core-shell microgels is based on sequential polymerization. The
polymerization of the first monomer forms the core while the addition of the second monomer
leads to the formation of the shell. [32-36]
Reactive macromonomers are a subgroup of monomers. The oligomeric or polymeric chain
determines the physical properties of the molecule. The head-groups are acrylate or vinyl
groups which can be copolymerized with other monomers or with each other to form new kinds
of polymers.

13
Copolymers, comprised of poly (ethylene glycol) and poly (lactic acid) lead to microgels which
are dispersible in hydrophilic and hydrophobic solvents. The poly (ethylene glycol) (PEG) part
is located in the shell and the microgels show good biocompatibility. [37]
PH-sensitive microgels with steric stabilization were prepared by the copolymerization of 2-
(diethylaminoethyl) methacrylate or 2-(diisopropylaminoethyl) methacrylate, with poly
(ethylene glycol) methacrylate (PEGMA) as a comonomer. It was shown that the PEGMA leads
to a higher colloidal stability of the microgels and inhibits flocculation during changes in the
pH-value of the dispersion. The steric stabilization was shown to provide superior stabilization
than charge or surface stabilization. [38]
PEGMA was also used as comonomer for VCL and acetoacetoxyethyl methacrylate (AAEM).
The resulting microgels are smaller, show a lower dispersity, a higher colloidal stability and
lower temperature sensitivity than microgels without the macromonomer. These changed
properties are directly proportional to the amount of comonomer used and the length of the PEG
tail. Since the macromonomer consists of a hydrophilic tail and a hydrophobic head, it tends to
act as a surfactant in water by stabilizing the more hydrophobic monomer during the
polymerization. A higher amount of PEGMA in the polymerization leads to more monomer
droplets which lead to more regular particles. It takes over the role of a surfactant but does not
have to be removed from the finished product. The enhanced colloidal stability is because of
steric stabilization, since the PEGMA is mainly located in the microgel shell. The resulting
particles have a more narrow size distribution than those, which have been synthesized in the
presence of sodium dodecyl sulfate as the stabilizing agent. In addition, functional OH groups
could be introduced into the microgel which now can be further functionalized. [39]
Polyglycidol
PEG is a hydrophilic building block with OH-groups at the chain end that can be further
functionalized. Polyglycidol (PG) can be used as alternative hydrophilic building block with
OH-groups in every repeating unit. It is a hydrophilic biocompatible polymer. [40] Figure 3.4
shows the glycidol monomer and the corresponding polymer.
Figure 3.4. Schematic description of glycidol and the corresponding polymer.

14
Polyglycidol is prepared by anionic polymerization. The direct polymerization of the glycidol
monomer leads to branched polymers, as is shown in figure 3.5. [41]
Figure 3.5. Functional polyglycidols obtained by post-polymerization modification of hydroxyl
side groups. [40]
To prepare linear polyglycidol the hydroxyl group of glycidol has to be temporally protected
(figure 3.6).
Figure 3.6. Glycidol, shown with different protective groups.

15
There are several options to protect glycidol: By etherification or acetalization. Tert-butylether
and allylether groups are easily formed but difficult to remove. Acetal groups are introduced
with ethyl-vinylether and can be easily removed after the polymerization under acidic
conditions. [42-47] The protected monomer ethoxyethyl glycidyl ether (EEGE) is polymerized in
an anionic polymerization and the ethoxyethyl protection group is subsequently removed. As
with PEG, polyglycidol is biocompatible. This makes it interesting for applications in medicine.
The many OH-groups can be modified with several different functional groups. Figure 3.7 gives
a brief overview of the possible modifications with different functional groups. [48]
Figure 3.7. Functional polyglycidols obtained by post-polymerization modification of hydroxyl
side groups. [48]

16
Because of its biocompatibility and ability to prevent unspecified protein absorption,
polyglycidol can be used in coatings for implants. [49] It is also often used as a macromonomer.
Oligoglycidol Macromonomers
Oligoglycidol (OG) macromonomers need a polymerizable group, to be copolymerized with
other vinylic monomers. The double bond can be introduced into the molecule via post- or
premodification.
Mostly, oligoglycidol macromonomers are used in combination with hydrophobic groups, so
that they possess amphiphilic properties. Because of this behavior, they can be easily
polymerized in water as opposed to organic solvents, where the degree of polymerization is
low, because of steric effects. [50, 51]
Because of their hydrophilicity they can be used to synthesize modified polystyrene (PS)
particles which form a stable dispersion in water. Typically, the hydrophobic parts of the
particle are located in the core while the more hydrophilic glycidol parts of the macromonomers
form the outer shell. The microspheres can be used in medical diagnostics because the
oligoglycidol on the surface protects them from unspecified protein adsorption. [52-54]
Synthesized PS/OG particles where the OG chains are functionalized with sulfate end groups
could be used to quantitatively determine Heliobacter pylori in the blood serum. H. pylori
antigens were immobilized on them and their electrophoretic mobility was strongly dependent
on the amount of H. pylori antibodies which bind to the antigen. [55]
Because of their high uniformity those particles can also be used as high-quality photonic
crystals. [56]
It has been observed that OG-macromonomer coated surfaces prevent the absorption of anti-
bovine serum albumin. [49] On the other hand, proteins can be covalently bound through
modification of the hydroxyl groups at the surface. It has been shown that proteins stay
biologically active after the binding process. [57]
Macromonomers can also be polymerized to form polymacromonomers which have a star- or
a brush-like microstructure and can be used in a multitude of ways, e.g. as impact resistant
materials. [58] Such brushes can also be modified to show temperature sensitivity and could be
used as nanoreactors. [59]

17
Applications of Microgels
Microgels find many applications in different areas, such as biology, medicine or mechanics.
Their dispersions can be used as automotive surface coatings because of their shear thinning
properties. [60] The microgels have a high contact surface and can be used as catalysts. [61-63]
Because of the high biocompatibility of some microgels, such as the ones based on PNIPAAM,
there are some applications in the field of biotechnology. For example, they can be used as
coatings for implants which are then used inside the human body to prevent the unspecified
protein absorption on the surface. [64]
Wang et al. synthesized PVCL microgels with methacrylic acid and poly (ethylene glycol)
methyl ether methacrylate as comonomer and N,N-bis (acryloyl) cystamine as a crosslinker.
The microgel can encapsulate doxorubicin and shows a stimuli-triggered drug release in an
acidic or reducing medium. The loaded microgel is non-toxic and shows an efficient anti-tumor
activity to HeLa cells. [65]
Microgels can be loaded with Ag nano particles which can then in turn be released and can act
as effective bacteria killers. [66]
Since the microgel size is directly dependent to an outside stimulus, such as the pH value or the
temperature, they are ideal as sensors or nano switches.
Yasui et al. developed a system where PNIPAAM chains which were functionalized with
Trypsin were anchored to a surface. While the enzyme is surrounded by the PNIPAAM at room
temperature, the chains contract when the temperature is raised so that the enzyme is free.
Consequently, the activity of the enzyme increases. [67]
Microgels can be used to transport active compounds to specific targets. Das et al. could show,
that they could be loaded with gold nano particles which can be released again if they are
irradiated by infrared light. Since infrared light can reach deeper human tissue, such a system
is ideal for targeted release in the human body. [68]
Because of their porosity they can in turn also be used as filtration systems. [69]
18
3.2 Aim
To synthesize pure N-vinylcaprolactam microgels with a low dispersity it is usually necessary
to add a surfactant during the microgel synthesis which is difficult to remove afterwards. In
addition, the microgels tend to aggregate at elevated temperatures which presents a bigger
obstacle in their application as temperature sensitive materials. The usage of surfactants can be
avoided by using a so called surfmer (surfactant and monomer), which acts as a surfactant
during the synthesis and gets incorporated into the nanogel like a comonomer.
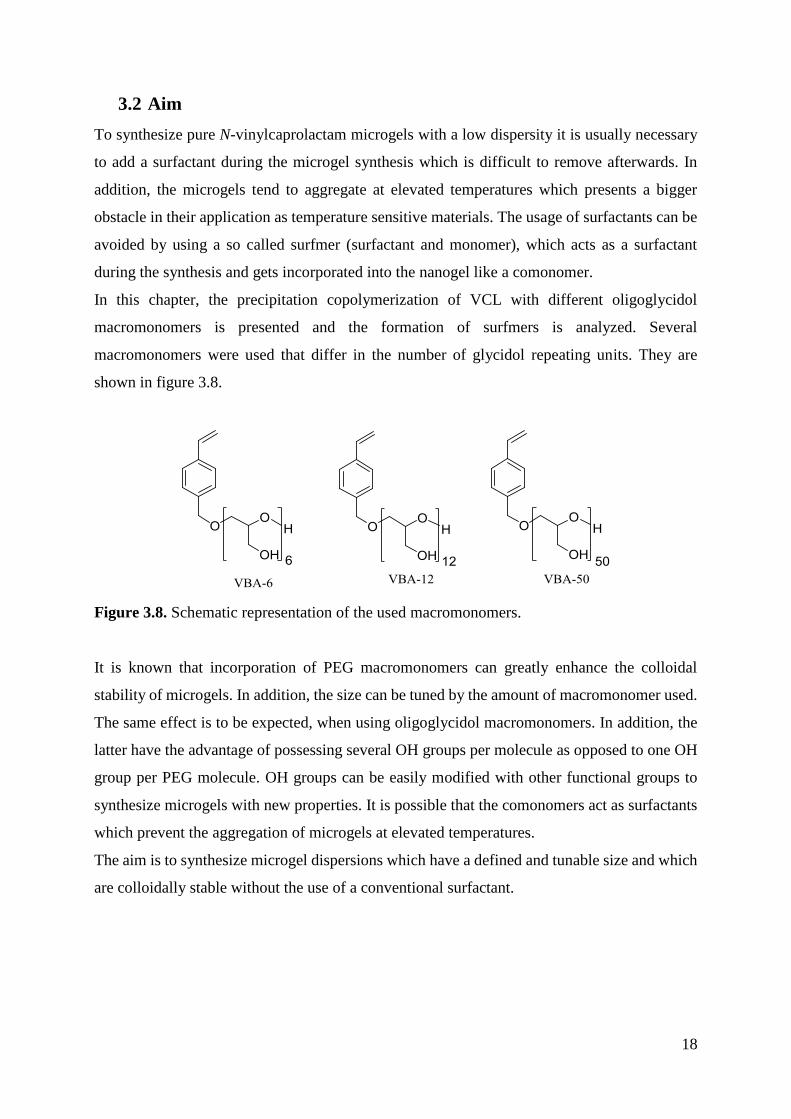
In this chapter, the precipitation copolymerization of VCL with different oligoglycidol
macromonomers is presented and the formation of surfmers is analyzed. Several
macromonomers were used that differ in the number of glycidol repeating units. They are
shown in figure 3.8.
Figure 3.8. Schematic representation of the used macromonomers.
It is known that incorporation of PEG macromonomers can greatly enhance the colloidal
stability of microgels. In addition, the size can be tuned by the amount of macromonomer used.
The same effect is to be expected, when using oligoglycidol macromonomers. In addition, the
latter have the advantage of possessing several OH groups per molecule as opposed to one OH
group per PEG molecule. OH groups can be easily modified with other functional groups to
synthesize microgels with new properties. It is possible that the comonomers act as surfactants
which prevent the aggregation of microgels at elevated temperatures.
The aim is to synthesize microgel dispersions which have a defined and tunable size and which
are colloidally stable without the use of a conventional surfactant.

19
3.3 Experimental Part
Synthesis of Vinyl Benzyl Alcohol (VBA)
Vinyl benzyl chloride (12.47 mL, 13.51 g, 0.09 mol) and potassium acetate (10.00 g, 0.10 mol)
are dissolved in dimethylsulfoxide (30 mL) and a small amount of hydrochinon is added. The
solution is stirred for 2 days at 40°C and subsequently filtered. The residue is extracted with
chloroform and the organic phase is washed three times with distilled water (100 mL). The
organic phase is dried with Na2SO4 and filtered. The solvent is removed by distillation and dried
in vacuo. The yellow liquid is now mixed with a solution of NaOH (6.25 g, 0.16 mol) in
H2O/ethanol (6.25 mL/40 mL). After the addition of a small amount of hydrochinon the solution
is stirred under reflux at 110°C for 90 minutes. The resulting suspension is filtrated and
extracted with chloroform. The organic phase is washed three times with distilled water (100
mL) and dried with Na2SO4. The solvent is subsequently removed in vacuo. The resulting liquid
is purified by fractional distillation at 110°C under reduced pressure and the product is received
as a clear liquid.
1H-NMR (DMSO):
δ (ppm) = 4.58 (d, 2H, H-7), 5.22 (d, 1H, H-1), 5.30 (t, 1H, OH), 5.81 (d, 1H, H1), 6.75 (dd,
1H, H-2), 7.36 (2H, H-5), 7.48 (d, 2H, H-4).
13C-NMR (DMSO):
δ (ppm) = 62.8 (C-7), 113.4 (C-1), 125.9 (C-4), 126.7 (C-5), 135.6 (C-3), 136.5 (C-2), 142.3
(C-6).
20
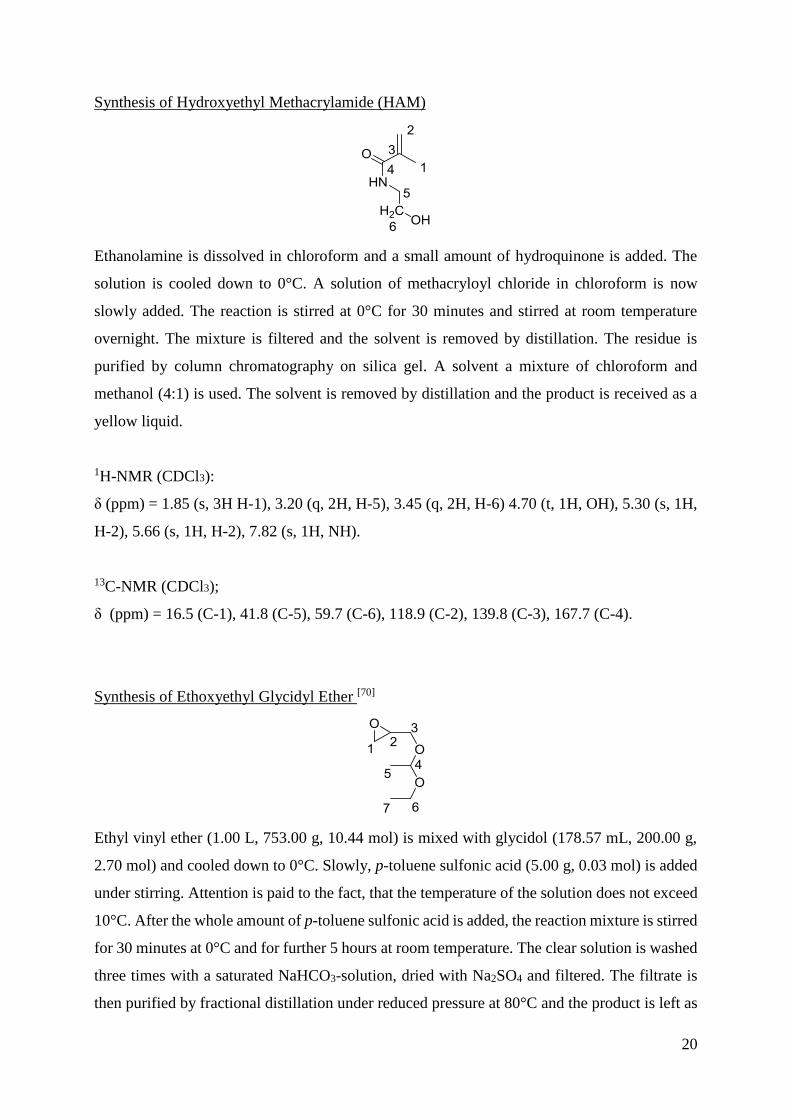
Synthesis of Hydroxyethyl Methacrylamide (HAM)
Ethanolamine is dissolved in chloroform and a small amount of hydroquinone is added. The
solution is cooled down to 0°C. A solution of methacryloyl chloride in chloroform is now
slowly added. The reaction is stirred at 0°C for 30 minutes and stirred at room temperature
overnight. The mixture is filtered and the solvent is removed by distillation. The residue is
purified by column chromatography on silica gel. A solvent a mixture of chloroform and
methanol (4:1) is used. The solvent is removed by distillation and the product is received as a
yellow liquid.
1H-NMR (CDCl3):
δ (ppm) = 1.85 (s, 3H H-1), 3.20 (q, 2H, H-5), 3.45 (q, 2H, H-6) 4.70 (t, 1H, OH), 5.30 (s, 1H,
H-2), 5.66 (s, 1H, H-2), 7.82 (s, 1H, NH).
13C-NMR (CDCl3);
δ (ppm) = 16.5 (C-1), 41.8 (C-5), 59.7 (C-6), 118.9 (C-2), 139.8 (C-3), 167.7 (C-4).
Synthesis of Ethoxyethyl Glycidyl Ether [70]
Ethyl vinyl ether (1.00 L, 753.00 g, 10.44 mol) is mixed with glycidol (178.57 mL, 200.00 g,
2.70 mol) and cooled down to 0°C. Slowly, p-toluene sulfonic acid (5.00 g, 0.03 mol) is added
under stirring. Attention is paid to the fact, that the temperature of the solution does not exceed
10°C. After the whole amount of p-toluene sulfonic acid is added, the reaction mixture is stirred
for 30 minutes at 0°C and for further 5 hours at room temperature. The clear solution is washed
three times with a saturated NaHCO3-solution, dried with Na2SO4 and filtered. The filtrate is
then purified by fractional distillation under reduced pressure at 80°C and the product is left as

21
a clear liquid which is stirred over night with CaH2. DRY EEGE is isolated by condensation
into a Schlenk flask with molar sieve.
1H-NMR (CDCl3):
δ (ppm) = 1.13 (t, 3H, H-7), 1.25 (t, 3H, H-5), 2.54-2.55 (m, 1H, H-1), 2.73 (t, 1H, H-1), 3.08
(m, 1H, H-2), 3.33-3.77 (m, 4H, H-3, H-6), 4,69 (m, 1H, H-4).
13C-NMR (CDCl3);
δ (ppm) = 15.1 (C-7), 19.7 (C-5), 44.5 (C-1), 50.7 (C-2), 60.8 (C-6), 65.7 (C-3), 99.6 (C-4).
Synthesis of Oligo-EEGE [54]
Vinyl benzyl alcohol (2.89 g, 0.02 mol) is dissolved in dimethylformamide (20 mL). Potassium-
tert-butoxide solution (4.34 mL, 1M in THF) is added and stirred for 30 minutes. Then, tert-
butanol and tetrahydrofuran are removed from the solution under reduced pressure. EEGE is
now slowly added to the solution, along with a small amount of hydrochinon. The reaction is
then heated to 80 °C and stirred overnight. Afterwards the dimethylformamide is removed under
reduced pressure. The product is obtained as a brown viscous liquid.
The synthesis of oligo-EEGE using HAM as a substrate is prepared using the same procedure.
The amount of EEGE added in each approach and the substrate used are listed in table 3.1.

22
Table 3.1. Amount of EEGE used for synthesizing the different macromonomers.
Sample Name Substrate /
g (mol)
Number of EEGE
Repeating Units
Amount EEGE /
g (mol)
VBA-EEGE-6 VBA
2.89 (0.02) 6 18.95 (0.13)
VBA-EEGE-12 VBA
2.89 (0.02) 12 37.90 (0.26)
VBA-EEGE-50 VBA
2.89 (0.02) 50 157.44 (1.05)
HAM-EEGE-12 HAM
2.58 (0.02) 12 37.90 (0.26)
The digit of the sample name stands for the number of EEGE repeating units in the
macromonomer with respect to the molar amount of vinyl benzyl alcohol.
VBA-EEGE-6:
1H-NMR (CDCl3):
δ (ppm) = 1.11 (t, 18H, H-14),1.22 (d, 18H, H-12), 3.32-3.70 (m, 42H, H-8-10, H-13), 4.45 (s,
2H, H-7), 4.62 (m, 6H, H-11), 5.15 (d, 1H, H-1), 5.69 (d, 1H, H-2), 6.62 (dd, 1H, H-3), 7.20 (d,
2H, H-4), 7.29 (d, 2H, H-5).
HAM-EEGE-12:
1H-NMR (DMSO):
δ (ppm) = 1.11 (t, 36H, H-13), 1.22 (d, 36H, H-11), 1.84 (s, 3H, H-1) 3.32-3.70 (m, 88H, H-5-
9, H-12), 4.62 (m, 6H, H-10), 5.33 (d, 1H, H-2), 5.69 (d, 1H, H-2).
Synthesis of Oligo-Glycidol [54]
The EEGE-x samples of the previous synthesis are used for this reaction. The protected
macromonomer is dissolved in tetrahydrofuran (ca. 30 mL per g macromonomer) and

23
concentrated hydrochloric acid is slowly added to the solution (ca. 1.5 mL per g
macromonomer). After 3 hours of intense stirring the THF is decanted and the residue is washed
with THF several times. Afterwards the remaining solvent is removed by distillation and the
residue is redissolved in water. With a 1M NaOH-solution the product solution is neutralized.
The solvent is removed again by distillation and the residue was redissolved in ethanol and
NaCl is filtrated. The solvent is removed again by distillation and the product is left as a brown,
viscous liquid.
The synthesis of oligo-glycidol using HAM as a starter molecule is prepared using the same
procedure. The products obtained by using VBA as a starter molecule are called VBA-x with x
being the number of glycidol repeating units in the macromonomer with respect to the molar
amount of vinyl benzyl alcohol. The product obtained by using HAM as a starter molecule is
called HAM-12 with 12 being the number of glycidol repeating units in the macromonomer
with respect to the molar amount of hydroxyethyl methacrylamide.
VBA-6:
1H-NMR (DMSO):
δ (ppm) = 3.36-3.68 (m, 24H, H-7-10), 5.29 (d, 1H, H-1), 5.90 (d, 1H, H-2), 6.78 (dd, 1H, H-
3), 7.35 (d, 2H, H-4), 7.50 (d, 2H, H-5).
HAM-6:
1H-NMR (DMSO):
δ (ppm) = 1.84 (s, 3H, H-1) 3.32-3.70 (m, 76 H, H-5-9), 5.33 (d, 1H, H-2), 5.69 (d, 1H, H-2).
24
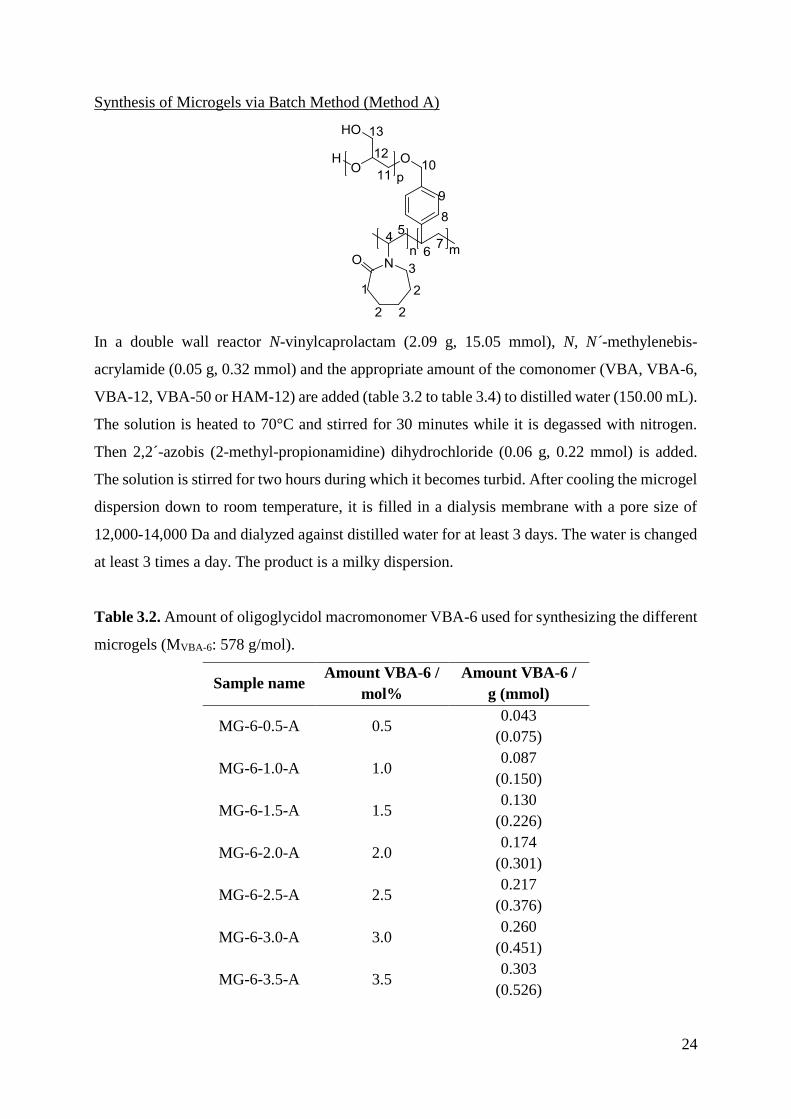
Synthesis of Microgels via Batch Method (Method A)
In a double wall reactor N-vinylcaprolactam (2.09 g, 15.05 mmol), N, N´-methylenebis-
acrylamide (0.05 g, 0.32 mmol) and the appropriate amount of the comonomer (VBA, VBA-6,
VBA-12, VBA-50 or HAM-12) are added (table 3.2 to table 3.4) to distilled water (150.00 mL).
The solution is heated to 70°C and stirred for 30 minutes while it is degassed with nitrogen.
Then 2,2´-azobis (2-methyl-propionamidine) dihydrochloride (0.06 g, 0.22 mmol) is added.
The solution is stirred for two hours during which it becomes turbid. After cooling the microgel
dispersion down to room temperature, it is filled in a dialysis membrane with a pore size of
12,000-14,000 Da and dialyzed against distilled water for at least 3 days. The water is changed
at least 3 times a day. The product is a milky dispersion.
Table 3.2. Amount of oligoglycidol macromonomer VBA-6 used for synthesizing the different
microgels (MVBA-6: 578 g/mol).
Sample name Amount VBA-6 /
mol%
Amount VBA-6 /
g (mmol)
MG-6-0.5-A 0.5 0.043
(0.075)
MG-6-1.0-A 1.0 0.087
(0.150)
MG-6-1.5-A 1.5 0.130
(0.226)
MG-6-2.0-A 2.0 0.174
(0.301)
MG-6-2.5-A 2.5 0.217
(0.376)
MG-6-3.0-A 3.0 0.260
(0.451)
MG-6-3.5-A 3.5 0.303
(0.526)

25
Table 3.3. Amount of oligoglycidol macromonomers VBA-12 and VBA-50 used for
synthesizing the different microgels (MVBA-12: 998 g/mol; MVBA-50: 3847 g/mol).
Sample name
Amount
VBA-12 /
mol%
Amount
VBA-12 /
g (mmol)
Sample name
Amount
VBA-50 /
mol%
Amount
VBA-50 /
g (mmol)
MG-12-0.5-A 0.5 0.075
(0.075) MG-50-0.25-A 0.25
0.145
(0.038)
MG-12-0.75-A 0.75 0.113
(0.113) MG-50-0.35-A 0.35
0.203
(0.053)
MG-12-1.0-A 1.00 0.150
(0.150) MG-50-0.5-A 0.50
0.289
(0.075)
MG-12-1.5-A 1.50 0.225
(0.226) MG-50-0.75-A 0.75
0.434
(0.113)
MG-12-2.0-A 2.00 0.300
(0.301) MG-50-1.0-A 1.00
0.579
(0.150)
MG-6-1.25-A 1.25 0.724
(0.188)
Table 3.4. Amount of comonomers VBA and HAM-12 used for synthesizing the different
microgels (MVBA: 134 g/mol; MHAM-12: 1017 g/mol).
Sample name
Amount
comonomer /
mol%
Amount
comonomer /
g (mmol)
MG-0.5-A 0.5 0.010
(0.075)
MG-2.0-A 2.0 0.040
(0.150)
HAM-12-2.0-A 2.0 0.130
(0.226)
HAM-12-4.0-A 4.0 0.174
(0.301)
The amount of VBA-x used is given as mol% with respect to the molar amount of the VCL
monomer (15.05 mmol). The synthesized microgel samples are further referred to as MG-x-y-
A. X stands for the number of repeating units in the macromonomer whereas y stands for the
amount of macromonomer used in mol%. A means that the microgel was synthesized by batch
synthesis.

26
1H-NMR (D2O):
δ (ppm) = 1.00-2.20 (m, 8H, H-2, H-5), 2.20-2.80 (m, 2H, H-1), 2.80-3.50 (m, 2H, H-3), 3.50-
3.80 (m, varying amounts, H-6, H-7, H-10-13), 4.00-4.58 (m, 1H, H-4), 7.31 (m, 4H, H8, H9).
Synthesis of Microgels via Continuous Feed-Method (Method B)
In a double wall reactor N-vinylcaprolactam (2.09 g, 15.05 mmol) and the appropriate amount
of the oligoglycidol-macromonomer (table 3.5 to table 3.7) is added to distilled water (148 mL).
The solution is heated to 70°C and stirred while being degassed with nitrogen. N, N´-
methylenebisacrylamide (0.05 g, 0.32 mmol) is dissolved in distilled water (2 mL) in a snap
cap vial. After 30 minutes of stirring, azobis (2-methyl-propionamidine) dihydrochloride (0.06
g, 0.22 mmol) was added to the monomer solution. The BIS solution was taken up in a syringe
and added to the reaction solution with a syringe pump. The start and duration of the BIS
addition is listed in the table 3.5 to 3.7. After the addition is complete the reaction is continued
for two hours. After cooling the microgel dispersion down to room temperature, it was filled in
a dialysis membrane with a pore size of 12,000-14,000 Da and dialyzed against distilled water
for at least 3 days. The water was changed at least 3 times a day. The product was a milky
dispersion.
1H-NMR (D2O):
δ (ppm) = 1.00-2.20 (m, 8H, H-2, H-5), 2.20-2.80 (m, 2H, H-1), 2.80-3.50 (m, 2H, H-3), 3.50-
3.80 (m, varying amounts, H-6, H-7, H-10-13), 4.00-4.58 (m, 1H, H-4), 7.31 (m, 4H, H8, H9).

27
Table 3.5. Amount of oligoglycidol macromonomer VBA-6 used for synthesizing the different
microgels (MVBA-6: 578 g/mol).
Sample name Amount VBA-6 /
mol%
Amount VBA-6 /
g (mmol)
Start of BIS
addition / s*
End of BIS
addition / s*
MG-6-0.5-B 0.5 0.043
(0.075) 0 550
MG-6-1.0-B 1.0 0.087
(0.150) 200 700
MG-6-1.5-B 1.5 0.130
(0.226) 250 750
MG-6-2.0-B 2.0 0.174
(0.301) 600 1200
MG-6-2.5-B 2.5 0.217
(0.376)
MG-6-3.0-B 3.0 0.260
(0.451) 800 1400
MG-6-3.5-B 3.5 0.303
(0.526) 850 1450
Table 3.6. Amount of oligoglycidol macromonomer VBA-12 used for synthesizing the
different microgels (MVBA-12: 998 g/mol).
Sample name Amount VBA-12 /
mol%
Amount
VBA-12 /
g (mmol)
Start of BIS
addition / s*
End of BIS
addition / s*
MG-12-0.5-B 0.5 0.075
(0.075) 0 550
MG-12-1.0-B 1.00 0.150
(0.150) 200 700
MG-12-1.5-B 1.50 0.225
(0.226) 300 850
MG-12-2.0-B 2.00 0.300
(0.301) 600 1100
MG-12-3.0-B 3.00 0.450
(0451) 850 1300

28
Table 3.7. Amount of oligoglycidol macromonomer VBA-50 used for synthesizing the
different microgels (MVBA-50: 3847 g/mol).
Sample name Amount VBA-50 /
mol%
Amount VBA-50 /
g (mmol)
Start of BIS
addition / s*
End of BIS
addition / s*
MG-50-0.25-B 0.25 0.145
(0.038) 0 500
MG-50-0.35-B 0.35 0.203
(0.053) 0 500
MG-50-0.5-B 0.50 0.289
(0.075) 0 550
MG-50-0.75-B 0.75 0.434
(0.113) 100 600
MG-50-1.0-B 1.00 0.579
(0.150) 250 750
MG-50-1.25-B 1.25 0.724
(0.188) 360 900
* The start and the end of the crosslinker addition refer to a time of x seconds after the addition of the initiator which is defined
as t=0.
The amount of VBA-x used is given as mol% with respect to the molar amount of the VCL
monomer (15.05 mmol). The synthesized microgel samples are further referred to as MG-x-y-
B. x stands for the number of repeating units in the macromonomer whereas y stands for the
amount of macromonomer used in mol%. B means that the microgel was synthesized by
continuous feed synthesis.

29
3.4 Results and Discussion
Oligoglycidol macromonomers with different chain lengths were synthesized and
copolymerized with VCL to form microgels. The synthetic process was analyzed and the
properties of different microgels such as size, temperature responsivity and colloidal stability
were determined.
Oligoglycidol Macromonomers
Oligoglycidol macromonomers with different chain lengths were prepared according to a
procedure developed by Sascha Pargen et al. [54] The successful synthesis was proven by 1H-
NMR spectroscopy and by size exclusion chromatography. The results are shown in table 3.8.
Table 3.8. SEC results for the protected and deprotected oligoglycidol macromonomers.
Sample Mn (theoretical) /
g/mol
Mn (GPC) /
g/mol PDI
VBA-EEGE-6 1010 1255 1.11
VBA-EEGE-12 1886 2442 1.07
VBA-EEGE-50 7434 12878 1.07
VBA-6 578 520 1.14
VBA-12 998 806 1.06
VBA-50 3847 4594 1.15
The actual molecular weight of all samples is similar to the theoretical one. They were now
used in the microgel synthesis. All further calculations were made with the theoretical
molecular weights.
Before they can be used in the microgel synthesis they have to be purified extensively. After
washing the macromonomer with THF, pentane and diethyl ether there is still a strong
possibility, that acid is left in the final solution. If this is the case, the usage of this solution in
the microgel synthesis leads to a low yield, because the acid causes hydrolytic degradation of
N-vinylcaprolactam (Scheme 3.1). [71, 72]
30
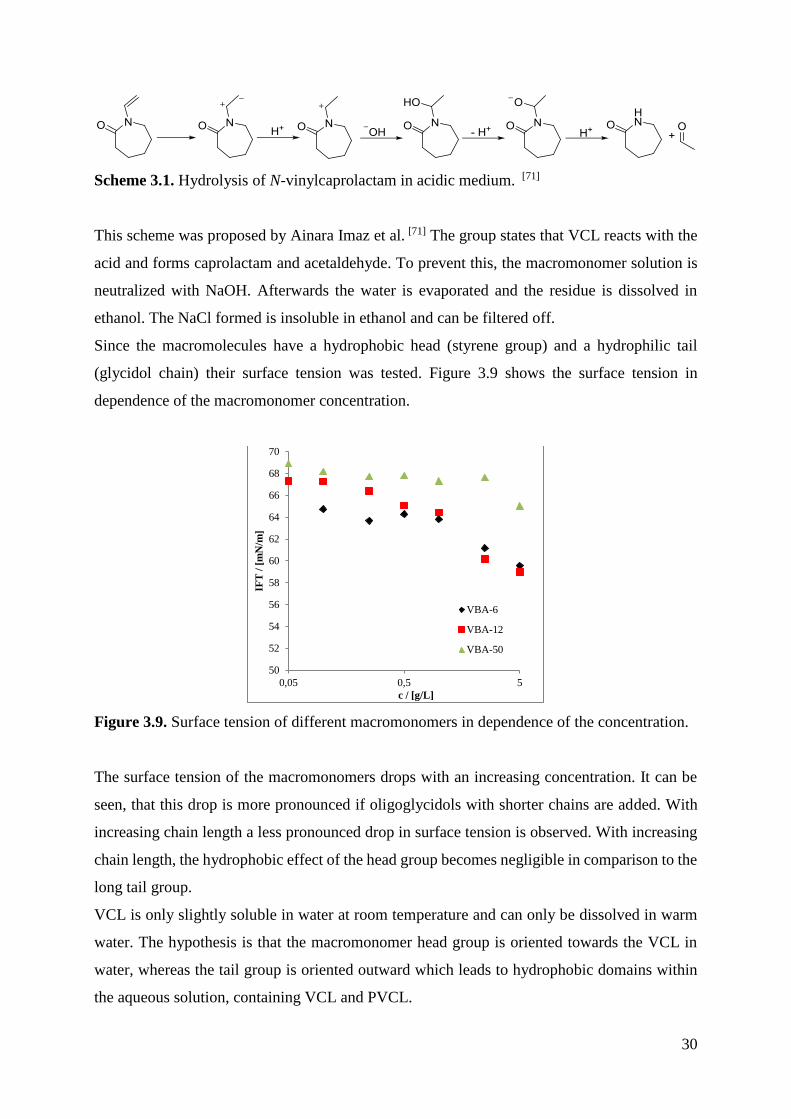
Scheme 3.1. Hydrolysis of N-vinylcaprolactam in acidic medium. [71]
This scheme was proposed by Ainara Imaz et al. [71] The group states that VCL reacts with the
acid and forms caprolactam and acetaldehyde. To prevent this, the macromonomer solution is
neutralized with NaOH. Afterwards the water is evaporated and the residue is dissolved in
ethanol. The NaCl formed is insoluble in ethanol and can be filtered off.
Since the macromolecules have a hydrophobic head (styrene group) and a hydrophilic tail
(glycidol chain) their surface tension was tested. Figure 3.9 shows the surface tension in
dependence of the macromonomer concentration.
Figure 3.9. Surface tension of different macromonomers in dependence of the concentration.
The surface tension of the macromonomers drops with an increasing concentration. It can be
seen, that this drop is more pronounced if oligoglycidols with shorter chains are added. With
increasing chain length a less pronounced drop in surface tension is observed. With increasing
chain length, the hydrophobic effect of the head group becomes negligible in comparison to the
long tail group.
VCL is only slightly soluble in water at room temperature and can only be dissolved in warm
water. The hypothesis is that the macromonomer head group is oriented towards the VCL in
water, whereas the tail group is oriented outward which leads to hydrophobic domains within
the aqueous solution, containing VCL and PVCL.
50
52
54
56
58
60
62
64
66
68
70
0,05 0,5 5
IFT
/ [
mN
/m]
c / [g/L]
VBA-6
VBA-12
VBA-50

31
A range from 0.05 to 5 g/L of macromonomer was chosen, as this is the range of oligoglycidol
concentration which is used in the synthesis of microgels. The oligoglycidol-macromonomers
are now used as comonomers in a precipitation polymerization with N-vinylcaprolactam.
Analysis of the Microgel Formation Process
PVCL/Oligoglycidol microgels were synthesized via precipitation polymerization, with N,N´-
methylenebisacrylamide as crosslinker and 2,2´-azobis (2-methyl-propionamidine)
dihydrochloride as a water soluble cationic initiator. The formation of the microgels was
analyzed with the help of a calorimeter. The amount of monomer, crosslinker and initiator was
kept constant while the amount of macromonomer was varied. The heat of reaction was
measured as a function of time. Figure 3.10 shows the heat flow during the microgel synthesis
with VCL as a monomer and VBA-6 as a comonomer.
Figure 3.10. Heat flow during the synthesis of PVCL microgels by copolymerization of VCL
and different amounts of VBA-6.
The time of 0 is the point of reaction when the initiator is added. With an increasing amount of
added comonomer the time between initiator addition and the development of heat increases.
This is supported by turbidity measurements (fig. 3.11) which show that with increasing amount
of macromonomer the time for the formation of microgels – the time at which the solution
becomes turbid – increases.
0
1
2
3
4
5
6
0 500 1000 1500
Hea
t F
low
/ W
t / sec
pure PVCL
MG-6-0.5-A
MG-6-1.0-A
MG-6-2.0-A
MG-6-3.0-A
MG-6-3.5-A

32
Figure 3.11. Turbidity measurements during the microgel synthesis. Used macromonomer:
VBA-6.
With pure VCL (without macromonomer) the formation of microgel starts earlier than in the
presence of oligoglycidol.
This means, that the macromonomer has a retarding effect on the microgel formation. In table
3.9 the heat of reaction heat for the formation of microgels as a function of added comonomer
is presented. Polymerization conversion was calculated using the polymerization heat of VCL,
which is 79 kJ/mol. [73]
Table 3.9. Reaction heat and yields for different microgels containing VBA-6.
Amount of VBA-6 /
mol%
Heat of
Polymerization /
kJ
Conversion /
%
Gravimetric yield /
%
0 1.186 99.6 99.0
0.5 1.029 86.5 69.5
1 1.151 96.8 69.4
1.5 1.170 98.6 83.9
2 1.124 91.3 62.7
3 1.098 92.3 79.9
3.5 1.081 90.9 81.0
The gravimetric yield describes the yield which was calculated by determining the amount of
product mass. The conversion is calculated through the reaction heat by comparing the ratio of
0
5
10
15
20
25
30
0 500 1000 1500
Tu
rb
idit
y /
%
t / sec
pure PVCL MG-6-0.5-A
MG-6-1.0-A MG-6-2.0-A
MG-6-3.5-A

33
the reaction heat to the reaction heat of a 100% conversion of VCL monomer which is 1.189
kJ. The reaction heat of the macromonomer was taken as negligible because of the low portion
which is used in the syntheses. Judging from the reaction enthalpy, the conversion of the
monomer is mostly nearly 100%. This proves that the addition of the macromonomer does not
inhibit the microgel formation, but merely retards it.
The gravimetric yield of the reactions was also measured. It was found, that the yield of the
functionalized microgels is significantly lower than from a pure PVCL microgel which does
not contain any glycidol. This leads to the conclusion that the presence of the macromonomers
leads to an increase in the noncrosslinked, soluble sol fraction, which gets washed out during
the purification of the microgel. The change in the yield does not seem to follow a specific
trend. Microgels copolymerized with VBA-12 and VBA-50 show matching results, as shown
in table 3.10.
Table 3.10. Reaction heat and yields for microgels containing VBA-12 or VBA-50.
Amount of
macromonomer /
mol%
Reaction heat /
kJ
Conversion /
%
Gravimetric yield /
%
VBA-12
0 1.186 99.6 99.0
0.5 1.054 88.6 92.3
1 1.075 90.4 74.4
1.5 1.027 86.3 74.3
2 1.140 95.9 63.6
3 1.049 88.2 80.4
VBA-50
0.25 1.150 96.7 71.9
0.35 1.133 95.2 71.5
0.5 1.126 94.7 83.3
0.75 1.040 87.4 61.1
1.00 1.101 92.6 95.0
1.25 1.172 98.5 59.7
Similar to the VBA-6 samples, the other samples show a high conversion, but the gravimetric
yield after the purification is relatively low.

34
It is noticeable, that immediately after the addition of the initiator, there is a small peak, which
is especially noticeable at the synthesis with the pure PVCL and the one with 0.5 mol% VBA-
6. It is assumed, that this peak can be assigned to the crosslinker N,N`-methylenebisacrylamide
(BIS), which polymerizes with a small fraction of the VCL. The presence of comonomer leads
to a retardation of the polymerization of the N-vinylcaprolactam, but the BIS is not affected by
this process. It is assumed, that the macromonomer has the same effect, as a surfactant on the
VCL. It encloses the monomer, so that the water-soluble initiator cannot reach it initially. But
since BIS is more soluble in water than VCL, it is not enclosed by the surfactant and can react
immediately with the initiator. This leads to a microgel, where the core is highly crosslinked,
while the outer part of the shell is only loosely crosslinked.
Influence of the Head Group on the Microgel Formation Process
The influence of the vinyl benzyl alcohol group of the macromonomer was examined. This was
done by performing a microgel synthesis with different amounts of pure vinyl benzyl alcohol.
The results are shown in figure 3.12a. In comparison, the heat flow of microgel syntheses with
0.5 mol% of different comonomers are shown. The results are shown in figure 3.12b.
Figure 3.12. Heat flow as a function of time for the VCL microgel synthesis in the presence of
0.5 and 2.0 mol% vinyl benzyl alcohol (a) and in the presence of 0.5 mol% VBA, VBA-6,
VBA-12 and VBA-50 (b).
It is shown, that the retardation of the reaction directly correlates with the amount of vinyl
benzyl alcohol, which is introduced into the synthesis. A higher amount of VBA leads to a
longer induction period until the main polymerization starts. A comparison with different
0
1
2
3
4
5
6
0 500 1000 1500
Hea
t F
low
/ W
t / sec
MG-0.5-A
MG-2.0-A
0
1
2
3
4
5
6
0 200 400 600 800 1000
Hea
t F
low
/ W
t / sec
MG-0.5-A
MG-6-0.5-A
MG-12-0.5-A
´MG-50-0.5-A
a b

35
macromonomers shows, that the same amount of macromonomer leads to the same induction
period. This means, that the oligoglycidol tail group has no influence on the polymerization
rate.
It is assumed that beside the radical addition to the C, C-double bond a side reaction occurs
leading to a hydrogen transfer reaction from the benzyl position and formation of a stable
radical. Figure 3.13 shows the proposed mechanism for this.
Figure 3.13. Hydrogen transfer side reaction from the benzyl position of the macromonomer
to a growing radical.
The head group functions as a retarder.
Macromonomer Incorporation Efficiency
After the synthesis, the microgels were purified via dialysis and analyzed. Figure 3.14 shows
several 1H-NMR-spectra of a PVCL-microgel without the macromonomer and with 1.0 and 2.0
mol% of VBA-6.

36
Figure 3.14. 1H-NMR spectra of PVCL microgels without macromonomer (top), with 1.0
mol% VBA-6 (middle) and with 2.0 mol% VBA-6 (bottom).
The signals at a chemical shift of 1.44 ppm, 1.98 ppm, 2.94 ppm and 3.94 ppm all can be
assigned to the N-vinylcaprolactam. The signal at 3.30 to 3.38 ppm corresponds to the
oligoglycidol chain. By comparing the intensity of the oligoglycidol signal with the signal at
3.94 ppm, it is possible to calculate the incorporated amount of the macromonomer. Table 3.11
shows the results for all macromonomers in comparison with the theoretically expected amount.
ppm (t1)
1.02.03.04.0
4.4
63
3.9
63
3.9
59
2.9
43
2.1
62
2.1
56
1.9
91
1.4
52
1.4
48
1.0
0
1.8
0
2.3
2
8.1
5
ppm (t1)
1.02.03.04.0
4.4
55
3.9
49
3.3
86
3.3
13
2.9
48
2.1
51
1.9
88
1.4
32
1.4
29
1.0
0
0.4
5
1.8
1
2.1
5
8.5
2
ppm (t1)
1.02.03.04.0
4.4
41
3.9
47
3.3
82
3.3
78
3.3
00
2.9
45
2.1
48
1.9
80
1.4
45
1.0
0
0.7
3
1.6
4
1.9
4
6.5
3
Oligo-
glycidol

37
Table 3.11. List of theoretically expected (Amounttheo) and found (Amountfound) amount of
macromonomer within the microgels prepared. Used macromonomer: VBA-6. Synthesis A.
Amounttheo /
mol%
Amountfound /
mol%
0.5 > 0.9
1 1.5
1.5 1.64
2 2.43
3 3.00
3.5 3.63
The calculated amount of the oligoglycidol roughly corresponds with the theoretical values.
Deviations from the theoretical values are mainly because the oligoglycidol signal and the
signal for a CH2-group at 2.9 ppm overlap, which makes an exact calculation difficult.
Nevertheless, it can be said that the incorporation of the macromonomer is successful. The
found amount of comonomer in the microgel is actually higher than the theoretically expected
one. This can be due to the fact that some noncrosslinked PVCL chains were washed out during
the dialysis of the samples. The results for the microgels synthesized with VBA-12 and VBA-
50 were similar. Specific amounts of oligoglycidol macromonomer can be introduced into the
microgel.
It is now important to know, whether the oligoglycidol macromonomer is located in the shell
or the core of the microgel or if it is evenly distributed throughout the particle. In order to
determine this, a transversal relaxation nuclear magnetization experiment has been done. By
isolating a signal that only corresponds to one specific part of the microgel, in this case the
oligoglycidol and the caprolactam, it is possible to determine the transversal magnetization
decay (T2) for both components. A higher decay means a higher mobility for the corresponding
molecule which in turn means a localization in the shell. [74, 75] The microgel, functionalized
with 2.0 mol% VBA-6 was used for the analysis. For analysis, the peak at 3.38 ppm was chosen
as signal for the oligoglycidol and the peak at 1.44 ppm was chosen for the VCL component.
Figure 3.15 shows the proton NMR transverse relaxation decay for the glycidol- and the VCL-
part of the microgel.

38
Figure 3.15. Transversal relaxation decay for the glycidol (a) and the VCL (b) component of
the microgel. The measurement was done, using a Hahn-echo pulse sequence.
The calculated values for the transverse relaxation times (T2(shell) and T2(core)) and the
corresponding relative coefficients (A(shell) and A(core)) for each component were calculated and
are listed in table 3.12. They are proportional to the number of protons which contribute to the
NMR signal.
Table 3.12. Determined variables for the transverse relaxation time and number of protons
Component A(shell) T2(shell) / ms A(core) T2(core) / ms
VCL 0.78 5.61 0.25 0.19
VBA-6 0.91 14.08 / /
For the VCL component, a biexponential fit gives the best results, whereas for glycidol a
monoexponential fit works best. For VCL, two values for T2 could be determined. This means
that it can be found in the core and the shell of the microgel. For glycidol, one single transverse
relaxation time of 14.08 ms was determined. A higher transverse relaxation time means a higher
mobility for the corresponding molecule which in turn means localization in the shell. The
relaxation time for glycidol is much higher than both values for VCL which means that the
glycidol component is located in the microgel shell. Similar results could be obtained for the
microgels copolymerized with VBA-12 and VBA-50.
0
0,2
0,4
0,6
0,8
1
0 10 20 30 40
Inte
gra
l In
ten
sity
/ A
rb
. U
nit
s
Echo Time / ms
a
0
0,2
0,4
0,6
0,8
1
0 5 10 15 20
Inte
gra
l In
ten
sity
/ A
rb
. U
nit
s
Echo Time / ms
b

39
Properties of N-Vinylcaprolactam/Oligoglycidol Microgels
The number of glycidol repeating units in the comonomer has no influence on the rate of
reaction of the microgels. But it shows a high influence on their size. This is shown in figure
3.16.
Figure 3.16. Size of microgels in dependence of the amount and kind of macromonomer used
in the synthesis. Y stands for the amount of macromonomer used.
With an increasing amount of macromonomer content in the microgel, its size decreases. This
is due to two effects. First, the application of pure VBA leads to a decrease in size. But it is also
noticeable, that the size decreases with an increase in the molecular weight of the glycidol chain.
Microgels, modified with 0.5 mol% VBA-50 are much smaller than the ones with 0.5 mol%
VBA-12 or 0.5 mol% VBA-6. This means, that the head group and the glycidol chain both have
an effect on the hydrodynamic radius. At 2 mol%, the size of PVCL/VBA-microgels is nearly
the same as the size of PVCL/VBA-6 microgels. Because the glycidol side chain is short, its
influence is negligible in comparison to the influence of the vinyl benzyl alcohol group. By
choosing the right amount of macromonomer with the right number of glycidol repeating units,
it is possible, to tune the size of microgels and incorporate a defined amount of hydroxyl groups.
Figure 3.17 shows the size distribution for the samples modified with VBA-6.
0
50
100
150
200
250
300
350
400
450
500
0 0,5 1 1,5 2 2,5 3
rH
/ n
m
Amount macromonomer / mol%
MG-y-A
MG-6-y-A
MG-12-y-A
MG-50-y-A

40
Figure 3.17. Size distribution of microgels prepared from VCL and VBA-6 in different
concentration.
With an increasing amount of VBA-6 (from 0.5 to 2.0 mol%), the dispersity of the microgels
decreases, while at 2.5 mol% of VBA-6 the size distribution increases again. The samples, made
with VBA-12 and VBA-50 show a similar trend, but in addition, there is the formation of
secondary smaller particles at very high concentrations of oligoglycidol, as can be seen in figure
3.18 a and 3.18 b.
Figure 3.18. Size distribution of microgels prepared from VCL and VBA-12 (a) and VBA-50
(b) in different concentration.
It is assumed, that the reduction of the nanogel size is due to the tendency of the
macromonomers to act as surfactants during the synthesis. The glycidol chains provide steric
stabilization, so that the aggregation of the precursor particles is prevented. The more
1 10 100 1.000rH / nm
pure PVCL
MG-6-0.5-A
MG-6-1.0-A
MG-6-1.5-A
MG-6-2.0-A
MG-6-2.5-A
1 10 100 1.000rH / nm
pure PVCL
MG-12-0.5-A
MG-12-0.75-A
MG-12-1.0-A
MG-12-1.5-A
MG-12-2.0-A
1 10 100 1.000rH / nm
pure PVCL
MG-50-0.25-A
MG-50-0.35-A
MG-50-0.5-A
MG-50-0.75-A
MG-50-1.0-A
MG-50-1.25-A
a b

41
macromonomer is used in the copolymerization, the better precursor particles are protected
against aggregation. Scheme 3.2 shows the assumed microgel formation mechanism during the
precipitation polymerization.
Scheme 3.2. Microgel formation process, with (bottom) and without (top) oligoglycidol
macromonomers. [1]
At very high macromonomer content the formation of secondary smaller particles below 50 nm
is favored.
To verify the existence of actual microgel particles, some selected samples were analyzed by
performing transmission electron microscopy (TEM) measurements. They are shown in figure
3.19.
Oligoradicals Precursor particles
Collapsed particles
Microgels
T<VPTT
T>VPTT
T<VPTT
T>VPTT
42
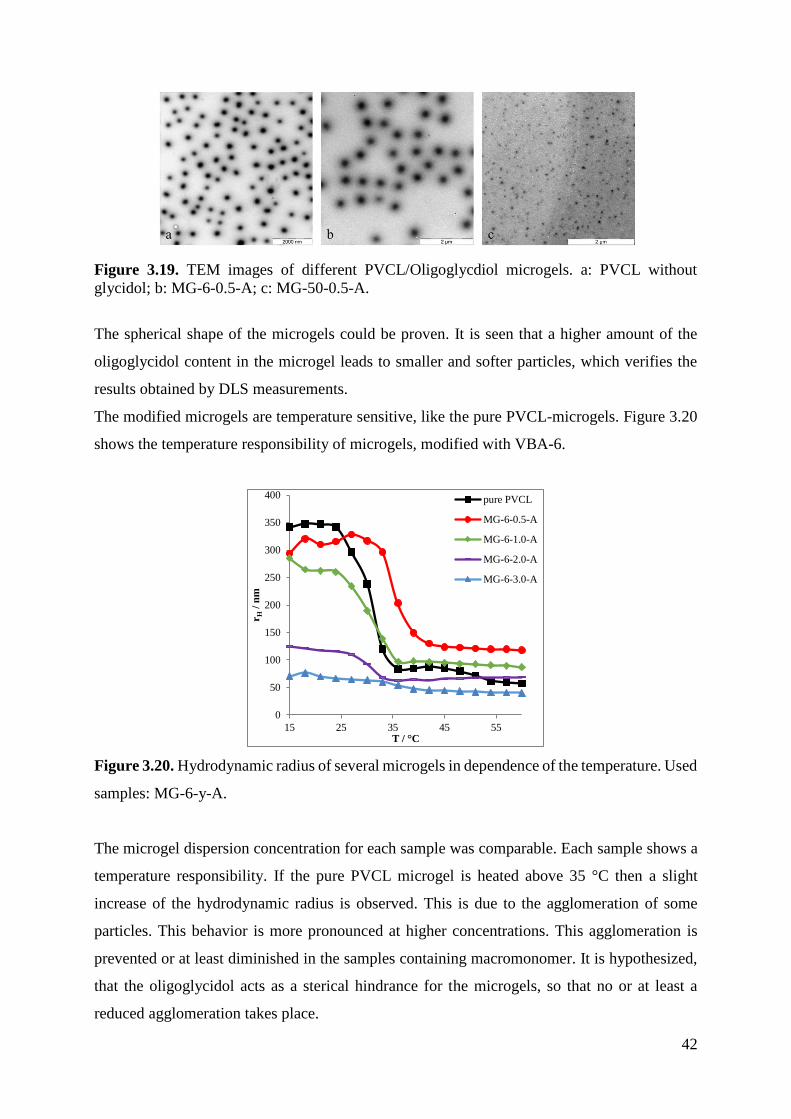
Figure 3.19. TEM images of different PVCL/Oligoglycdiol microgels. a: PVCL without
glycidol; b: MG-6-0.5-A; c: MG-50-0.5-A.
The spherical shape of the microgels could be proven. It is seen that a higher amount of the
oligoglycidol content in the microgel leads to smaller and softer particles, which verifies the
results obtained by DLS measurements.
The modified microgels are temperature sensitive, like the pure PVCL-microgels. Figure 3.20
shows the temperature responsibility of microgels, modified with VBA-6.
Figure 3.20. Hydrodynamic radius of several microgels in dependence of the temperature. Used
samples: MG-6-y-A.
The microgel dispersion concentration for each sample was comparable. Each sample shows a
temperature responsibility. If the pure PVCL microgel is heated above 35 °C then a slight
increase of the hydrodynamic radius is observed. This is due to the agglomeration of some
particles. This behavior is more pronounced at higher concentrations. This agglomeration is
prevented or at least diminished in the samples containing macromonomer. It is hypothesized,
that the oligoglycidol acts as a sterical hindrance for the microgels, so that no or at least a
reduced agglomeration takes place.
0
50
100
150
200
250
300
350
400
15 25 35 45 55
rH
/ n
m
T / °C
pure PVCL
MG-6-0.5-A
MG-6-1.0-A
MG-6-2.0-A
MG-6-3.0-A

43
Samples with VBA-12 and VBA-50 show a similar response, as seen in figure 3.21.
Figure 3.21. Temperature sensitivity of VBA-12 (left) and VBA-50 (right).
With an increase in the macromonomer content of the microgels, it becomes apparent, that the
size difference between swollen and shrunken microgels becomes smaller.
To get a value for the shrinking of the microgel with increasing temperature, the radius of the
swollen microgel at 15 °C was compared with the radius of a collapsed one at 51 °C. In order
to measure the microgels at 51°C the samples were extremely diluted to prevent an aggregation
which could distort the results. Table 3.13 lists the shrinking degrees for all samples.
Table 3.13. Degree of shrinking for microgels prepared by copolymerization of VCL with
VBA-6 (left), VBA-12 (middle) and VBA-50 (right).
Sample rH(51°C)/
rH(15°C) Sample
rH(51°C)/
rH(15°C) Sample
rH(51°C)/
rH(15°C)
Pure PVCL 0.32 Pure PVCL 0.32 Pure PVCL 0.32
MG-6-0.5-A 0.30 MG-12-0.5-A 0.47 MG-50-0.25-A 0.41
MG-6-1.0-A 0.32 MG-12-1.0-A 0.46 MG-50-0.35-A 0.35
MG-6-2.0-A 0.46 MG-12-1.5-A 0.39 MG-50-0.5-A 0.47
MG-6-3.0-A 0.60 MG-12-2.0-A 0.65 MG-0.75-A 0.56
MG-50-1.0-A 0.80
0
50
100
150
200
250
300
350
400
15 25 35 45 55
rH
/ n
m
T / °C
pure PVCL
MG-12-0.5-A
MG-12-1.0-A
MG-12-1.5-A
MG-12-2.0-A
0
50
100
150
200
250
300
350
400
15 25 35 45 55
rH
/ n
mT / °C
pure PVCL
MG-50-0.25-A
MG-50-0.35-A
MG-50-0.5-A
MG-50-0.75-A
MG-50-1.0-A

44
The difference between swollen and shrunken microgels becomes smaller, with an increasing
macromonomer amount. Pure PVCL shrinks to 30% of its size when heated while the samples
MG-6-3.0-A and MG-12-2.0-A only shrink to roughly 60% of their size. Comparing samples
copolymerized with 1.0 mol% of macromonomer the size difference between the swollen and
shrunken microgels decreases.
This is likely due to the following effect. The crosslinker and a small amount of VCL are getting
polymerized first, while the bulk of the monomer gets polymerized later. The later the monomer
starts to polymerize, the more crosslinker is already consumed in the reaction. This leads to
microgels with a strongly crosslinked core and a very loose shell. The crosslinked area is
smaller and the loose VCL chains are more mobile, so they don´t collapse as strongly, as the
crosslinked polymer, while the core becomes more and more rigid which inhibits its ability to
shrink or swell.
The phenomenon cannot be explained by the retardation of the polymerization alone.
Otherwise, the temperature sensitivity for the sample MG-50-1.0-A should be equally to the
sensitivity of the sample MG-6-1.0-A. The second reason is an increase in the hydrophilicity of
the microgel, because of a higher number of hydrophilic groups. At temperatures which are
higher than the VPTT, less water is ejected out of the microgel. The size and the temperature
sensitivity can be tuned to a certain degree.
Additionally, the sedimentation velocity of the microgels was measured with the Lumifuge
which is shown in figure 3.22.
Figure 3.22. Sedimentation velocity of microgels.
0
0,05
0,1
0,15
0,2
0,25
0,3
0,35
0,4
0,45
0 0,5 1 1,5
Sed
imen
tati
on
velo
cit
y / [
µm
/s]
Macromonomer content / mol%
MG-6-A
MG-12-A
MG-50-A

45
All samples were measured at a dispersion concentration of around 11 g/L. The Lumifuge
calculates the sedimentation velocity by measuring the change of transparency of the sample
over time. Not all synthesized samples could be measured, since samples containing a high
amount of glycidol are too transparent for the Lumifuge to obtain results. But it is clear that the
sedimentation velocity decreases with an increasing amount of glycidol in the microgel. This is
due to the increased hydrophilicity and the decreased size of the sample, so that the microgel is
colloidally more stable in water. It is assumed, that microgels which are too transparent to be
tested, are even more stable.
The overall data suggests that there is a limit of macromonomers which can be copolymerized
with VCL. If too much is used during the synthesis, the microgels become too small and show
a high dispersity. In order to solve this, an alternative polymerization method was employed, in
which the crosslinker is continuously added to the reaction medium.
Synthesis of PVCL/Oligoglycidol-Macromonomer-Microgels, with a Continuous
Addition of Crosslinker
It has been shown that the macromonomer retards the polymerization of the VCL while the
crosslinker BIS reacts almost immediately after the initiator addition. The start of the
polymerization of VCL can be pinpointed by analyzing the calorimetric data, which is shown
in figure 3.10. Instead of synthesizing the microgel in a batch procedure using a mixture of all
reagents, in this new procedure the crosslinker BIS is dissolved in distilled water and slowly
added to the reaction mixture with a syringe pump. The addition starts, after the initiator was
added and has initiated the copolymerization of VCL with the macromonomer. By adding the
BIS continuously, it is assumed, that the formed microgel is more evenly crosslinked than
samples in which all reagents are present from the beginning. Figure 3.23 now shows the
hydrodynamic radius of microgels in dependence of the amount of macromonomer.

46
Figure 3.23. Size of microgels in dependence of amount and type of macromonomer. Method
B.
With an increasing amount of macromonomer, the size decreases. However, this decrease is not
nearly as high as with microgels, synthesized with method A. At higher concentrations of the
macromonomer the size stays constant, regardless of the macromonomer content. There are
differences in size between the microgels, synthesized with different macromonomers. It can
be seen, that the size decreases, with an increase in the number of glycidol repeating units per
macromonomer.
For VBA-6 microgels, the size distribution can be seen in figure 3.24.
Figure 3.34. Size distribution of microgels obtained by copolymerization of VCL with VBA-6
(method B).
0
50
100
150
200
250
300
350
400
0 1 2 3
rH
/ n
m
Amount macromonomer / mol%
MG-6-B
MG-12-B
MG-50-B
10 100 1.000
rH /nm
pure PVCL
MG-6-0.5-B
MG-6-1.0-B
MG-6-1.5-B
MG-6-2.0-B
MG-6-2.5-B
MG-6-3.0-B
MG-6-3.5-B

47
The size distribution is still very broad. The dispersity of microgels with the macromonomer is
in most cases higher than the dispersity of the pure PVCL microgel. In addition to the major
population of particles, a second population of smaller particles – around 20 nm – is observed.
This behavior was to be avoided. 1H-NMR spectra of the synthesized samples were done, to
calculate the incorporation efficiency. Table 3.14 shows the found amounts of macromonomer
in comparison with the theoretically expected amount.
Table 3.14. List of theoretically expected (Amounttheo) and found (Amountfound) amount of
macromonomer within the microgels prepared. Used macromonomer: VBA-6. Synthesis B.
Sample Name Amounttheo /
mol%
Amountfound /
mol%
MG-6-0.5-B 0.5 0.73
MG-6-1.0-B 1.0 0.96
MG-6-1.5-B 1.5 1.16
MG-6-2.0-B 2.0 1.16
MG-6-3.0-B 3.0 1.70
MG-6-3.5-B 3.5 1.66
In comparison to method A, the incorporation efficiency is lower in this case. Only a fraction
of the macromonomer was actually incorporated into the microgel. There is a difference
between the amount of oligoglycidol that was theoretically expected and the found amount.
This difference gets higher with an increasing amount of the macromonomer.
In summary it can be concluded, that method B does not result in microgels with predetermined
amounts of VBA-6 in VCL. The reason might be that VBA-6 tends to prevent the
copolymerization of BIS with other monomers in the mixture. In comparison, the size
distribution for the systems with VBA-12 and VBA-50 is shown in figure 3.25.

48
Figure 3.25. Size distribution of microgels obtained by copolymerization of VCL with VBA-
12 (left) and VBA-50 (right).
A much more narrow size distribution can now be observed for both systems. There is no
formation of secondary smaller particles, as in the case of samples containing VBA-6. This
proves that the macromonomer length has a strong influence on the formation of the microgel
during the synthesis. The microgel size can be tuned better with method A while the systems,
synthesized by method B, all have a hydrodynamic radius between roughly 100 and 200 nm.
Nevertheless, it is possible to incorporate more glycidol into the colloidal network, than with
the batch method. In contrast to the microgels, synthesized with the batch method, even at very
high concentrations of the macromonomer, there is no formation of secondary smaller particles.
Figure 3.26 shows a 1H-NMR spectrum of a microgel synthesized with method B.
Figure 3.26. 1H-NMR spectrum of PVCL microgels with 3 mol% VBA-12, synthesized with
method B.
1 10 100 1.000rH / nm
pure PVCL
MG-12-0.5-B
MG-12-1.0-B
MG-12-1.5-B
MG-12-2.0-B
MG-12-3.0-B
1 10 100 1.000rH / nm
pure PVCL
MG-50-0.25-B
MG-50-0.35-B
MG-50-0.5-B
MG-50-0.75-B
MG-50-1.0-B
MG-50-1.25-B
ppm (t1)
1.02.03.04.0
4.4
52
3.9
45
3.5
36
3.5
27
3.3
02
2.9
25
2.1
37
1.9
65
1.4
21
1.4
17
1.0
0
1.9
7
1.7
1
2.1
1
7.8
7

49
Similar to the microgels from method A, the macromonomer was incorporated into the
microgel. Table 3.15 lists the theoretical and the experimentally found values of incorporated
glycidol.
Table 3.15. List of theoretically expected (Amounttheo) and found (Amountfound) amount of
macromonomer within the microgels prepared. Synthesis B.
Sample Name Amounttheo /
mol%
Amountfound /
mol%
MG-12-0.5-B 0.5 0.6
MG-12-1.0-B 1.0 0.9
MG-12-1.5-B 1.5 1.65
MG-12-2.0-B 2.0 2.26
MG-12-3.0-B 3.0 3.13
MG-50-0.25-B 0.25 0.26
MG-50-0.35-B 0.35 0.30
MG-50-0.5-B 0.5 0.42
MG-50-1.0-B 1.0 0.73
MG-50-1.25-B 1.25 0.95
The theoretical and the real amounts for both systems don´t differ much from each other. The
incorporation of the macromonomer is as successful as with method A.
The temperature sensitive behavior was also analyzed and is shown in figure 3.27 for samples
MG-12 and MG-50.

50
Figure 3.27. Temperature sensitivity of samples copolymerized with VBA-12 (left) and VBA-
50 (right).
All microgels show a temperature sensitive behavior. While microgels, synthesized with
method A show a decrease in the swelling degree with an increase of the macromonomer
amount, this is not the case for microgels synthesized with method B. Here, the swelling degree
stays nearly constant for all samples. In microgels synthesized with method A, the density of
the core increases which leads to a loss in the swelling degree. But in method B the microgels
are all equally crosslinked, so the swelling remains constant. It was assumed, that the change in
the swelling degree is partly due to the influence of the head group, as this retards the reaction
and leads to a denser core and a shell which is more loosely crosslinked. The synthesis with
method B supports this theory, as the microgels are now evenly crosslinked and the temperature
sensitivity is constant, regardless of the macromonomer amount.
The colloidal stability of the microgels could not be determined using the Lumifuge approach
since the resulting dispersions were too transparent. But it can be assumed, that the colloidal
stability is better than the one for pure PVCL microgels.
To analyze their morphology, TEM measurements were done. However, they show a very bad
contrast and can hardly be analyzed. So the measurements had to be done at the SU 9000 in
TEM mode. The results are shown in figure 3.28.
0
20
40
60
80
100
120
140
160
180
200
15 25 35 45 55
rH
/ n
m
T / °C
MG-12-0.5-B
MG-12-1.0-B
VBA-12-2.0-B
MG-12-3.0-B
0
20
40
60
80
100
120
140
160
180
200
15 25 35 45 55
rH
/ n
m
T / °C
MG-50-0.25-B MG-50-0.35-B
MG-50-0.5-B MG-50-0.75-B
MG-50-1.0-B MG-50-1.25-B

51
Figure 3.28. SU 9000 TEM images of sample MG-12-2.0-A (left) and MG-12-2.0-B (right).
The microgels, synthesized with method A, are clearly visible on the grid, while the ones
synthesized with method B are harder to identify. The microgels of method A have a dense
core, because the crosslinker is concentrated there. This increases their contrast. In method B it
is evenly distributed throughout the microgel so the overall density is lower, which leads to a
decline in the contrast. It is noticeable that the A microgels show a high dispersity while the B
microgels are comparable in size.
To summarize, two different methods were established to synthesize PVCL microgels with
oligoglycidol macromonomers as comonomer. Using method A, their size can be tuned,
dependent of the amount and number of repeating units of the macromonomer. The amount of
comonomer, which can be incorporated is limited. By using method B more oligoglycidol can
be introduced into the microgel, but their size cannot be controlled anymore. Furthermore
method B only works with oligoglycidol macromonomers, which have a chain that is longer
than six repeating units.
Influence of the Macromonomer Head Group
It has been shown, that vinyl benzyl alcohol, if used as a head group in the macromonomer has
a strong influence on the speed of the reaction and the size of the formed microgels. As a
comparison, a macromonomer containing hydroxyethyl methacryl amide as a head group and
12 repeating units of glycidol was synthesized and used as a comonomer in the microgel
synthesis. Figure 3.29 shows the macromonomer used.

52
Figure 3.29. The macromonomer HAM-12.
The name of the macromonomer is HAM-12. It was used as comonomer in a microgel synthesis
with VCL. 2 mol% and 4 mol% of HAM-12 were added to the synthesis. The used synthesis
method is method A. Figure 3.30 shows the heat flow for both reactions.
Figure 3.30. Heat flow of PVCL microgel syntheses, copolymerized with HAM-12 and VBA-
12 for comparison. The key describes the type and amount of macromonomer which was used
as a comonomer.
It is noticeable, that different amounts of HAM-12 show no influence of the rate of
polymerization. Even at high amounts of comonomer the reaction starts immediately after the
addition of the initiator. In comparison, if 2 mol% of VBA-12 are added the reaction starts much
later. This confirms the above stated theory that the vinyl benzyl alcohol group is responsible
for the retardation of the polymerization process.
The composition of the microgels was analyzed via 1H-NMR spectroscopy. The spectra are
shown in figure 3.31.
0
1
2
3
4
5
6
0 500 1000 1500
Hea
t F
low
/ W
t / sec
2 mol% HAM-12
4 mol% HAM-12
2 mol% VBA-12

53
Figure 3.31. 1H-NMR spectra of PVCL microgels, modified with 2 mol% (top) and 4 mol%
bottom) HAM-12.
The signals at a chemical shift of ca. 1.40 ppm, 2.0 ppm, 2.9 ppm and 3.9 ppm all can be
assigned to the N-vinylcaprolactam. The signal at 3.28 to 3.38 ppm corresponds to the
oligoglycidol chain. By comparing the intensity of the oligoglycidol signal with the signal at
3.9 ppm, it is possible to calculate the incorporated amount of the macromonomer. Even if high
amounts of HAM-12 are used in the microgel synthesis, only a fraction is actually incorporated
into the microgel. Table 3.16 lists the theoretical and the actual values for the glycidol content.
Table 3.16. List of theoretically expected (Amounttheo) and found (Amountfound) amount of
macromonomer within the microgels prepared. Used macromonomer: HAM-12. Synthesis A.
Sample Name Amounttheo /
mol%
Amountfound /
mol%
HAM-12-2.0-A 2 0.6
HAM-12-4.0-A 4 1.2
Only 30% of HAM-12 is incorporated into the microgel. The incorporation efficiency is much
lower, than comparable samples, synthesized with VBA-12.
ppm (t1)
1.02.03.04.0
4.4
75
3.9
83
3.3
43
2.9
58
2.1
76
2.0
08
1.4
54
1.0
0
0.3
6
1.7
5
2.0
1
8.5
0
ppm (t1)
1.02.03.04.0
4.4
24
3.9
33
3.3
59
3.2
88
2.9
25
2.1
28
1.9
56
1.4
09
1.0
0
0.7
2
1.7
2
2.0
2
8.3
4

54
In addition, table 3.17 lists the hydrodynamic radii and polydispersity indices for those samples.
Table 3.17. Hydrodynamic radius and polydispersity index for microgels, copolymerized with
HAM-12.
Sample Name Hydrodynamic radius /
nm
PDI
HAM-12-2.0-A 270.9 0.08
HAM-12-4.0-A 256.6 0.04
Even though the second sample has twice the amount of the glycidol incorporated in the
microgel, the actual size hardly changes. The amount of comonomer has no effect on the size.
HAM-12 does not influence the size of the microgel and its rate of incorporation into the
colloidal network is much lower than VBA-12. In conclusion it can be said, that hydroxyethyl
methacrylamide is not effective as a head group for the incorporation of glycidol into the PVCL-
microgels. The stabilizing effects of the macromonomer can only be achieved by using a fitting
head group. It was earlier shown, that the glycidol chain also has an effect on the size. However,
this effect occurs only in combination with the vinyl benzyl head group.

55
3.5 Summary and Outlook
In this chapter, oligoglycidol macromonomers were used as comonomers in the synthesis of
polyvinylcaprolactam microgels. Several macromonomers with different chain lengths and
different head groups were analyzed in their ability to copolymerize with VCL.
Their incorporation efficiency is highly dependent on the type of polymerizable head group.
While a hydroxyethyl methacrylamide head group shows only a very small incorporation
efficiency, the best results could be obtained with vinyl benzyl alcohol as a head group.
Calorimetric measurements show, that the usage of the comonomer leads to a retardation of the
polymerization process which influences the microgel structure.
Depending on the amount of incorporated macromonomer, the microgel size can be easily
controlled. Higher amounts lead to smaller microgel, while the dispersity stay constant. Smaller
microgels also show a higher colloidal stability. This is likely because of the steric stabilization
which is caused by the oligoglycidol chains. During the polymerization, the precursor particles
are getting stabilized by the macromonomers. This partly prevents the aggregation process
during the synthesis and leads to more particles which are smaller. At the same time, the
temperature sensitivity of the microgels decreases.
If too much oligoglycidol is used in method A, the microgels become very small (rH < 50 nm)
and the dispersity increasers. Therefore, another synthesis method was tested, where the
crosslinker was gradually added during the synthesis (method B). The optimal time for adding
the crosslinker was determined with the help of calorimetric measurements. These microgels
show a comparable hydrodynamic radius which is not dependent on the amount of
macromonomer used, but on the length of the oligoglycidol chain. The temperature sensitivity
stays constant regardless of the macromonomer amount, because microgels of different samples
are similarly crosslinked.
According to NMR studies, the oligoglycidol is located in the microgel shell. This result offers
the possibility for further functionalization of the OH-groups and introduction of functionalities
for new applications. This is shown in chapter 2.

56
3.6 Literature
[1] Pich, A.; Richtering, W.; Chemical Design of Responsive Microgels, 2010 Springer
Verlag
[2] Staudinger, H.; Husemann, E.; Ber. 1935, 68, 1618.
[3] Saunders, R. B; Laajam, N.; Daly, E.; Teow, S.; Hu, X.; Stepto, R.; Adv. Coll. Interf.
Sci 2009, 147-148, 251-262.
[4] Saunders, R. B.; Vincent, B. Adv. Coll. Interf. Sci. 1999, 80, 1-25.
[5] Otake, K.; Inomata, H.; Konno, M.; Saito, S. Macromolecules 1990, 23, 283-289.
[6] Makhaeva, E.E.; Thanh, L. T. M.; Starodoubtsev, S. G.; Khoklov, A. R. Macromol.
Chem. Phys. 1996, 197, 1973-1982.
[7] Dupin, D.; Fujii, S.; Armes, S. P. Langmuir 2006, 22, 3381-3387.
[8] Rodriguez, B. E.; Wolfe, M. S. Macromolecules 1994, 27, 6642-6647.
[9] Klinger, D.; Landfester, K.; Soft Matter 2011, 7, 1426-1440.
[10] Bhattacharya, S.; Eclert, F.; Boyko, V.; Pich, A. Small 2007, 3, 650-657.
[11] Pich, A.; Richtering, W. Adv. Polym. Sci. 2011, 34, 1-37.
[12] Dupin, D.; Fujii, S.; Armes, S. P. Langmuir 2006, 22, 3381-3387.
[13] Boyko, V.; Pich, A.; Lu, Y.; Richter, S.; Arndt, K. F.; Adler, H., J. Polymer 2003, 44,
7821-7827.
[14] Pich, A.; Tessier, A.; Boyko, V.; Lu, Y.; A; Adler, H.-J. Macromolecules 2006, 39,
7701-7707.
[15] McPhee, W.; Tam, K. C.; Pelton, R. J. Colloid Interface Sci. 1993, 156, 24-30.
[16] Imaz, A.; Miranda J. I.; Ramos, J.; Forcada, J. Eur. Polym. J. 2008, 44, 4002-4011.
[17] Hazot, P.; Delair, T.; Pichot, C.; Chapel, J. P. Elaissari, A. C. R. Chimie 2003, 6, 1417-
1424.

57
[18] Panayiotou, M.; Pöhner, C.; Vandevyver, C.; Wandrey, C.; Hilbrig, F.; Freitag, R.;
React. Funct. Polym. 2007, 67, 807.
[19] Kratz, K.; Lapp, A.; Eimer, W.; Helweg, T.; Colloids Surf. A 2002, 197, 55.
[20] Hazot, P.; Delair, T.; Pichot, C.; Chapel, J. P.; Elaissari, A. C. R. Chimie 2003, 6,
1417.
[21] Elmas, B.; Tuncel, M.; Senel, S.; Patir, S.; Tuncel, A. J. Coll. Interf. Sci. 2007, 313,
174.
[22] Meng, Z. Y.; Smith, M. H.; Lyon, L. A. Colloid Polym. Sci. 2009, 287, 277.
[23] Boyko, V.; Richter, S.; Pich, A.; Arndt, K. F. Colloidal Polym. Sci. 2003, 282, 127-
132.
[24] Chen, S.; Jiang, L.; Dan, Y. J. Macromol. Sci. B 2011, 51, 1057-1068.
[25] Schneider, F.; Balaceanu, A.; Feoktystov, A.; Pipich, V.; Wu, Y.; Allgaier, J.;
Pyckhout-Hintzen, W.; Pich, A.; Schneider, G. J. Langmuir 2014, 30, 15317-15326.
[26] Saunders, B. R.; Laajam, N.; Daly, E.; Teow, S.; Hu, X.; Stepto, R. Adv. Coll. Interf.
Sci. 2009, 147-148, 251-262.
[27] Varga, I.; Gilanyl, T.; Meszaros, R.; Filipcsei, G.; Zrinyi, M. J. Phys. Chem. B 2001,
105, 9071-9076.
[28] Kratz, K.; Helweg, T.; Eimer, W. Colloids Surf. A 2000, 170, 137-149.
[29] Lopez-Len, T.; Ortega-Vinuesa, J. L.; Bastos-Gonzalez, D.; Elaissari, A. J. Phys.
Chem. B 2006, 110, 4629-4636.
[30] Häntzschel, N.; Zhang, F.; Eckert, F.; Pich, A.; Winnik, M. A. Langmuir 2007, 23,
10793-10800.
[31] Schachschal, S.; Balaceanu, A.; Melian, C.; Pich, A. Macromolecules 2010, 43, 4331-
4339.
[32] Suzuki, D.; Kawaguchi, H. Langmuir 2005, 21, 8175-8179.

58
[33] Lapeyre V.; Ancla, C.; Catargi, B.; Rivaine, V. J. Coll. Interface Sci. 2008, 327, 316-
323.
[34] Berndt, I.; Richtering, W. Macromolecules 2003, 36, 8780.
[35] Berndt, I.; Pedersen, J. S.; Richtering, W. J. Am. Chem. Soc. 2005, 127, 9372-9373.
[36] Berndt, I.; Pedersen, J. S.; Richtering, W. Angew. Chem. Int. Ed. 2006, 45, 1737-1741.
[37] Riley, T.; Stolnik, S.; Heald, C. R.; Xiong, C. D. Garnett, M. C.; Illum, L.; Davis, S. S.
Langmuir 2001, 17, 3168-3174.
[38] Amalvy, J. I.; Wanless, E. J.; Li, Y.; Michailidou, V.; Armes, S. P. Langmuir 2004,
20, 8992-8999.
[39] Pich, A.; Berger, S.; Ornatsky, O.; Baranov, V.; Winnik, M. A. Colloid Polym. Sci.
2009, 287, 269-275.
[40] Kainthan, R. K.; Janzen, J.; Levin, E.; Devine, D. V.; Brooks, D. E.
Biomacromolecules 2006, 7, 703-709.
[41] Sunder, A.; Hanselmann, R.; Frey, H.; Mülhaupt, R. Macromolecules 1999, 32, 4240-
4246.
[42] Taton, D.; Leborgne, A.; Sepulchre, M.; Spassky, N. Macromol. Chem. Phys. 1994,
195, 139-148.
[43] Dworak, A.; Panchev, I.; Trzebicka, B.; Walach, W. Macromol. Symp. 2000, 153, 233-
242.
[44] Walach, W.; Kowalczuk, A.; Trzebicka, B.; Dworak, A. Macromol. Rapid Commun.
2001, 22, 1272-1277.
[45] Lapienis, G.; Penczek, S.; Biomacromolecules 2005, 6, 752-762.
[46] Hans, M.; Gasteier, P.; Keul, H.; Moeller, M. Macromolecules 2006, 39, 3184-3193.
[47] Erberich, M.; Keul, H.; Moeller, M. Macromolecules 2007, 40, 3070-3079.

59
[48] Keul, H.; Moeller, M. Journal of Polymer Science: Part A: Polymer Chemistry
2009, 47, 3209-3231.
[49] Gam-Derouich, S.; Gosecka, M.; Lepinay, S.; Turmine, M.; Carbonnier, B.; Basinska,
T.; Slomkowski, S.; Millot, C.-C.; Othmane, A.; Hassen-Chehimi, D. B.; Chehimi, M.
M. Langmuir 2011, 27, 9285.
[50] Mendrek, A.; Mendrek, S., Adler, H.-J.; Dworak, A.; Kuckling Polymer, 2010, 51, 342-
354.
[51] Mendrek, A.; Mendrek, S.; Trzebicka, B.; Kuckling, D.; Walach, W.; Adler, H.-J.;
Dworak, A. Macromol. Chem. Phys., 2005, 206, 2018-2026.
[52] Basinska, T.; Slomkowski, S.; Dworak, A.; Panchev, I.; Chehimi, M. M. Colloid Polym.
Sci., 2001, 279, 916-924.
[53] Basinska, T. J. Biomater. Sci. Polym. Ed. 2001, 12, 1359-1371.
[54] Pargen, S.; Willems, C.; Keul, H.; Pich, A.; Möller, M. Macromolecules, 2012, 45,
1230-1240.
[55] Basinska, T.; Wisniewska, M.; Chmiela, M. Macromol. Biosci. 2005, 5, 70.
[56] Gosecka, M.; Griffete, N.; Mangeney, C.; Chehimi, M. M.; Slomkowski, S.; Basinska,
T. Colloid Polym. Sci., 2011, 289, 1511-1518.
[57] Dworak, A.; Slomkowski, S.; Basinska, T.; Gosecka, M.; Walach, W.; Trzebicka, B.
Polimery 2013, 58, 641-649.
[58] Rathgeber, S.; Pakula, T.; Wilk, A.; Matyjaszewski, K.; Beers, K. L. J. Chem. Phys.,
2005, 122, 124904.
[59] Aleksandra Mendrek, Dissertation, Synthesis and characterization of
polymacromonomers based on polyethers, 2006, Dresden University of Technology.
[60] Bradna, P.; Stern, P.; Quadrat, O.; Snuparek, J. Colloid Polym. Sci. 1995, 273, 324-330.
[61] Schunicht, C.; Biffis, A.; Wulft, G. Tetrahedron 2000, 56, 1693-1699.
[62] Biffis, A.; Sperotto, E. Langmuir 2003, 19, 9548-9550.
60
[63] Xu, J.; Zeng, F.; Wu, S.; Liu, X.; Hou, C.; Tong, Z. Nanotechnology 2007, 18,
265704-265712.
[64] Fujimoto, K.; Mizuhara, Y.; Tamura, N.; Kawaguchi, H. J. Intelligent Mater. Syst.
Struct. 1993, 4, 184-189.
[65] Wang, Y.; Nie, J.; Chang, B.; Sun, Y.; Yang, W. Biomacromolecules 2013, 14, 3034-
3046.
[66] Häntzschel, N.; Hund, R. D.; Hund, H.; Schrinner, M.; Lück. C.; Pich, A. Macromol.
Biosci. 2009, 9, 444-449.
[67] Yasui, M.; Shiroya, T.; Fujimoto, K.; Kawaguchi, H. Colloids Surf. B: Biointerfaces
1997, 8, 311-319.
[68] Das, M.; Sanson, N.; Fava, D.; Kumacheva, E. Langmuir 2007, 23, 196-201.
[69] Bromberg, L.; Temchenko, M.; Hatton, T. A. Langmuir 2003, 19, 8675-8684.
[70] Fitton, A. O.; Hill, J.; Jane, D. E.; Millar, R. Synthesis-Stuttgart 1987, 12,1140.
[71] Imaz, A., Miranda, J. I., Ramos, J.; Forcada, J. Eur. Polym. J. 44, 4002–4011 (2008).
[72] Willems, C. Diploma Thesis, Herstellung und Charakterisierung von Polyglycidol-
modifizierten Mikrogelen 2011, Rheinisch-Westfälische Technische Hochschule
Aachen.
[73] Kalugin, D.I.; Talyzenkov, Y. A.; Lachinov, M. B. Polymer Science, Ser. B, 2008, 50,
299-304.
[74] Schachschal, S.; Balaceanu, A.; Melian, C.; Demco, D.E.; Eckert, T.; Richtering, W.;
Pich, A. Macromolecules, 2010, 43, 4331-4339.
[75] Balaceanu, A.; Demco, D. E.; Möller, M.; Pich, A. Macromolecules, 2011, 44, 2161-
2169.
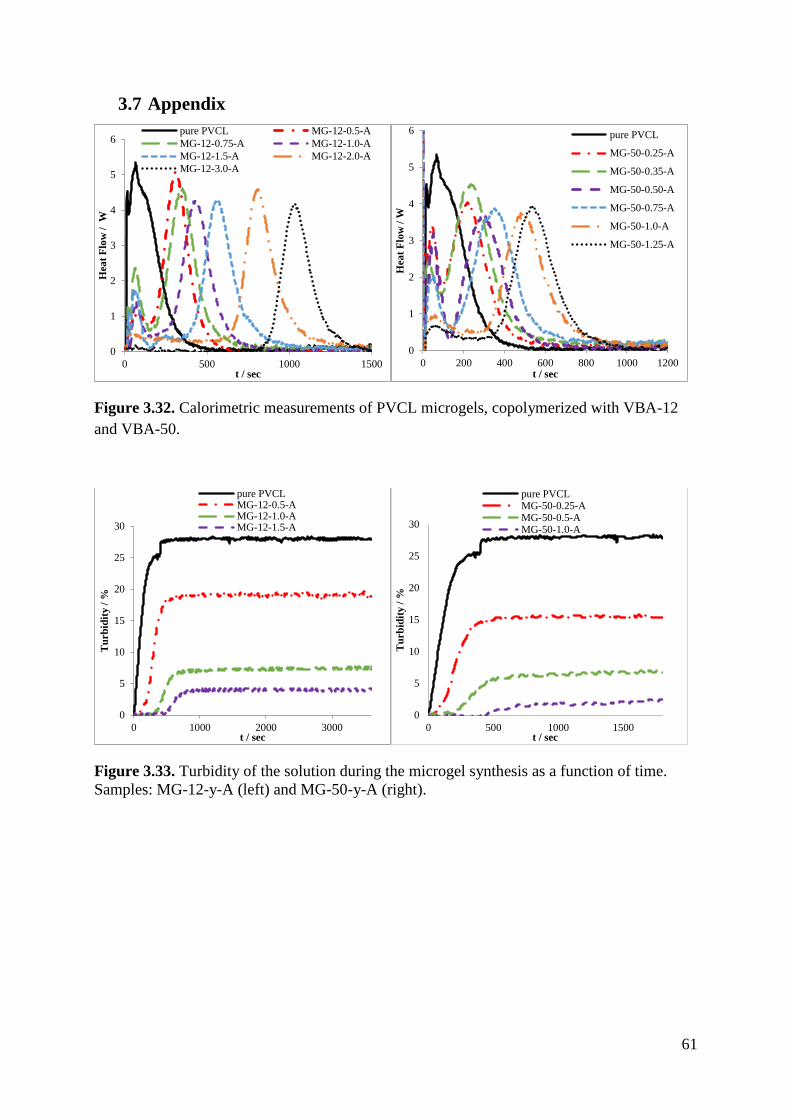
61
3.7 Appendix
Figure 3.32. Calorimetric measurements of PVCL microgels, copolymerized with VBA-12
and VBA-50.
Figure 3.33. Turbidity of the solution during the microgel synthesis as a function of time.
Samples: MG-12-y-A (left) and MG-50-y-A (right).
0
1
2
3
4
5
6
0 500 1000 1500
Hea
t F
low
/ W
t / sec
pure PVCL MG-12-0.5-A
MG-12-0.75-A MG-12-1.0-A
MG-12-1.5-A MG-12-2.0-A
MG-12-3.0-A
0
1
2
3
4
5
6
0 200 400 600 800 1000 1200
Hea
t F
low
/ W
t / sec
pure PVCL
MG-50-0.25-A
MG-50-0.35-A
MG-50-0.50-A
MG-50-0.75-A
MG-50-1.0-A
MG-50-1.25-A
0
5
10
15
20
25
30
0 1000 2000 3000
Tu
rb
idit
y /
%
t / sec
pure PVCLMG-12-0.5-AMG-12-1.0-AMG-12-1.5-A
0
5
10
15
20
25
30
0 500 1000 1500
Tu
rb
idit
y /
%
t / sec
pure PVCLMG-50-0.25-AMG-50-0.5-AMG-50-1.0-A
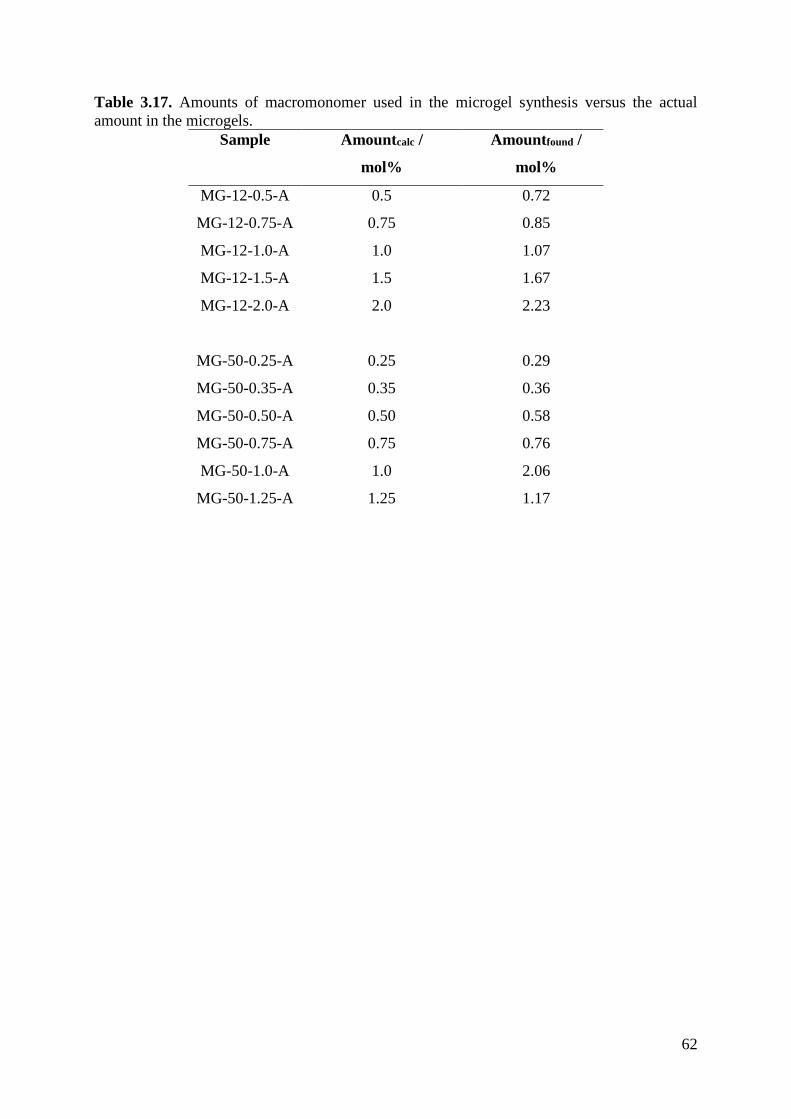
62
Table 3.17. Amounts of macromonomer used in the microgel synthesis versus the actual
amount in the microgels.
Sample Amountcalc /
mol%
Amountfound /
mol%
MG-12-0.5-A 0.5 0.72
MG-12-0.75-A 0.75 0.85
MG-12-1.0-A 1.0 1.07
MG-12-1.5-A 1.5 1.67
MG-12-2.0-A 2.0 2.23
MG-50-0.25-A
0.25
0.29
MG-50-0.35-A 0.35 0.36
MG-50-0.50-A 0.50 0.58
MG-50-0.75-A 0.75 0.76
MG-50-1.0-A 1.0 2.06
MG-50-1.25-A 1.25 1.17

63
4. Functionalization of PVCL/Oligoglycidol Microgels
4.1 State of the Art
Microgels can have several applications as already mentioned in chapter 1. In order to be
tailored to specific applications different functional groups must be introduced into their
structure.
PNIPAAM microgels could be modified by hydrolysis of the amide side groups to produce
carboxy groups. Or they can be modified by partial methylation resulting in a less hydrophilic
building block. [1, 2] The so-called Hoffmann rearrangement was used by Shiroya to
functionalize the NIPAAM polymer with primary amine groups. [3] With this, DNA can be
grafted onto the microgel shell. Terminal isocyanate groups of the DNA react with amino
groups incorporated into the shell. [4]
Richtering et al. used a layer-by-layer technique to deposit different layers of polyelectrolytes
on the microgel surface which lead to a change in their properties. [5]
Since NIPAAM and VCL give only limited options for functionalization it is possible to use
comonomers in the synthesis that can be modified later. A PNIPAAM/ poly (N-vinyl-
formamide) microgel was synthesized by Pelton where the formamide component can be
further functionalized to give amine groups, which are located in the microgel shell. [6] Glycidyl
methacrylate (GMA) can be used as a comonomer since the epoxy group can be easily
functionalized. It can be used to bind proteins to the microgel, to graft polymers onto it or to
functionalize the particle with amine groups. [7-9]
As already mentioned in chapter 1, poly (ethylene glycol) and polyglycidol are building blocks
often used in biomedical applications. Since they show a good biocompatibility, they can be
used as coating materials to prevent unspecified protein absorption. Especially the polyglycidol
building block can be used for additional applications, mainly by modifying the OH groups.
For example star-shaped poly (ethylene glycol) can be used as coating material and
functionalized with isocyanate groups. These groups readily hydrolyze in water to form amino
groups and the coating now shows a resistance against unspecified protein adsorption. The layer
can now be further modified with RGD peptides and seeded cells can now grow on the
functionalized surface, while there is no growth on the unfunctionalized one. [10]
In addition, the OH group can be further functionalized to get a cyanide group, which can be
reduced with a Raney-cobalt catalyst to produce amine groups. This is important for the
64
biological application, as ethanolamine is an important head group for phospholipids. There are
many more biological components which contain amino alcohols, consequently the polymer
may play a biomimetic role. [11]
It has been reported by Groll et al., that polyglycidol could be successfully crosslinked with
disulfide groups, to form degradable nanogels. The degradation results from the conversion of
the disulfide bond and formation of thiol groups. Cytotoxicity experiments show a low toxicity,
which makes these nanogels interesting systems for drug delivery. [12]
Star shaped polyglycidol was functionalized with vinyl sulfonate groups on their end by
Haamann et al. These groups are selective in the reaction with amine groups, so that peptides
can be bound to the polymer. Potentially, synthetic protein/ peptide-conjugates can be prepared.
[13]
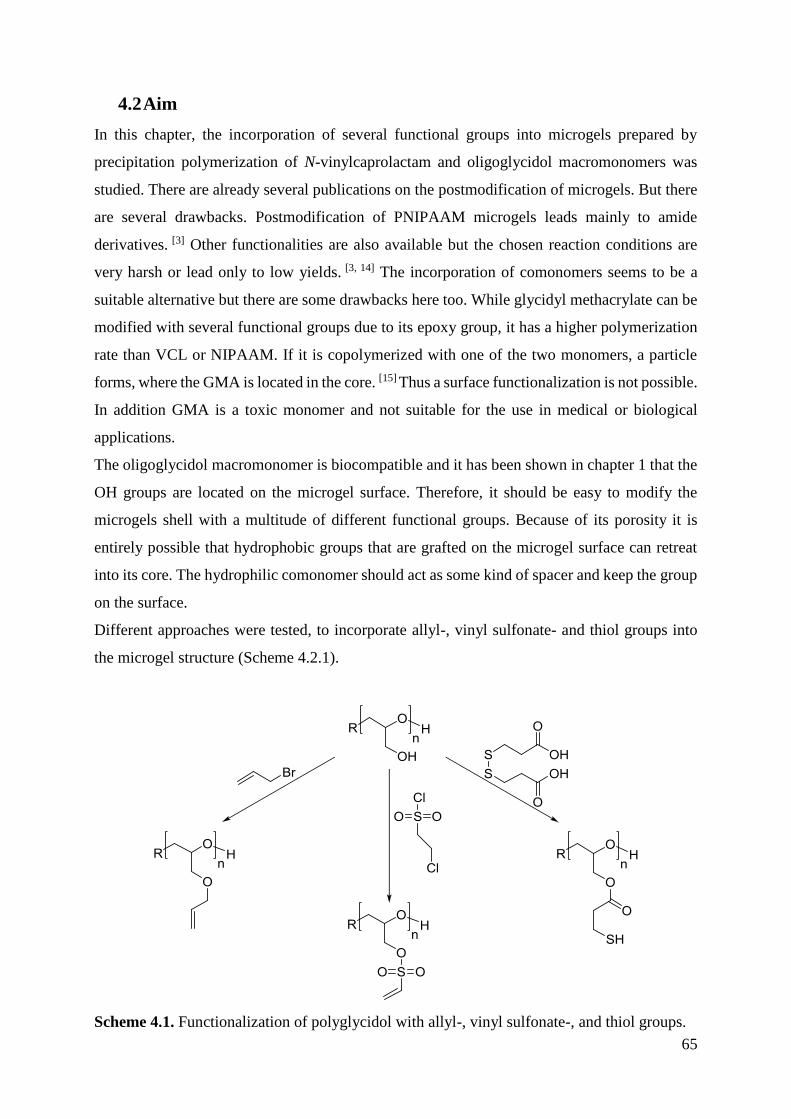
65
4.2 Aim
In this chapter, the incorporation of several functional groups into microgels prepared by
precipitation polymerization of N-vinylcaprolactam and oligoglycidol macromonomers was
studied. There are already several publications on the postmodification of microgels. But there
are several drawbacks. Postmodification of PNIPAAM microgels leads mainly to amide
derivatives. [3] Other functionalities are also available but the chosen reaction conditions are
very harsh or lead only to low yields. [3, 14] The incorporation of comonomers seems to be a
suitable alternative but there are some drawbacks here too. While glycidyl methacrylate can be
modified with several functional groups due to its epoxy group, it has a higher polymerization
rate than VCL or NIPAAM. If it is copolymerized with one of the two monomers, a particle
forms, where the GMA is located in the core. [15] Thus a surface functionalization is not possible.
In addition GMA is a toxic monomer and not suitable for the use in medical or biological
applications.
The oligoglycidol macromonomer is biocompatible and it has been shown in chapter 1 that the
OH groups are located on the microgel surface. Therefore, it should be easy to modify the
microgels shell with a multitude of different functional groups. Because of its porosity it is
entirely possible that hydrophobic groups that are grafted on the microgel surface can retreat
into its core. The hydrophilic comonomer should act as some kind of spacer and keep the group
on the surface.
Different approaches were tested, to incorporate allyl-, vinyl sulfonate- and thiol groups into
the microgel structure (Scheme 4.2.1).
Scheme 4.1. Functionalization of polyglycidol with allyl-, vinyl sulfonate-, and thiol groups.

66
The functionalization with allyl- and thiol groups on microgels has already been attempted to
synthesize hydrogels consisting of crosslinked microgels. [16] The functionalization with thiol
groups has also been researched in an effort to synthesize colloids which can be bound to hair.
[17] The aim was to synthesize microgels with a defined amount of specific functional groups
on the surface and to determine if the functionalization has an effect on the colloidal properties.

67
4.3 Experimental Part
The microgels used are presented in chapter 3. PVCL based microgels are copolymerized with
different oligoglycidol macromonomers with vinyl benzyl alcohol as a head group. The
synthesized microgel samples are further referred to as MG-x-y-A or MG-x-y-B. X stands for
the number of repeating units in the macromonomer whereas y stands for the amount of
macromonomer used in mol% in relation to the used molar amount of VCL. A means that the
microgel was synthesized by batch synthesis. B means that the microgel was synthesized by the
continuous method which means that the crosslinker was added over a certain time after the
addition of the initiator to the reaction mixture.
Functionalization of MG-6-2.5-A with allyl groups
MG-6-2.5-A (300 mg, 0.33mmol OH groups) is dispersed in DMF (25 mL). KOtBu (1M in
THF) is slowly added and the dispersion is stirred for 2 hours at room temperature. After
removing THF by applying vacuum, allyl bromide and a catalytic amount of potassium iodide
are added and the dispersion is stirred over night at room temperature. The microgel is cleaned
via dialysis and the product is obtained as a white powder after freeze drying.
The following table lists the different amounts of reagents, that were used and the yield.

68
Table 4.1. Amount of educts used in the functionalization of microgels with vinyl groups.
Sample
KOtBu / µL ( eq) Allyl bromide /
mg; mmol ( eq)
Gravimetric yield /
%
V-1 261.52 (0.8) 31.64; 0.26 (0.8) 95
V-2 261.52 (0.8) 47.46; 0.39 (1.2) 98
V-3 196.14 (0.6) 23.73; 0.20 (0.6) 96
V-4 196.14 (0.6) 35.59; 0.29 (0.9) 94
V-5 326.90 (1.0) 59.32; 0.49 (1.5) 57
V-6 326.90 (1.0) 39.55; 0.33 (1.0) 86
V-7 392.28 (1.2) 47.46; 0.39 (1.2) 87
V-8 392.28 (1.2) 59.32; 0.49 (1.5) 85
V-9 326.90 (1.0) 79.10; 0.65 (2.0) 96
V-10 653.80 (2.0) 79.10; 0.65 (2.0) 86
The equivalents (eq) of the educts in the table are given with respect to the molar amount of
hydroxyl groups in 300 mg of the microgel (MG-6-2.5-A).
1H-NMR (D2O):
δ (ppm) = 1.00-2.20 (m, 320H, H-2, H-5), 2.20-2.80 (m, 80H, H-1), 2.80-3.50 (m, 80H, H-3),
3.50-3.80 (m, 30H, H-6, H-7, H-10-13), 3.96 (m, varying amounts, H-14), 4.00-4.58 (m, 40H,
H-4), 7.31 (m, 4H, H8, H9), 5.16 (m, varying amounts, H-16), 5.84 (m, varying amounts, H-
15).

69
Functionalization of MG-12-3.0-B with vinyl sulfonate groups
MG-12-3.0-B (300 mg, 0.67 mmol OH groups) is dispersed in DCM (20 mL) overnight.
Triethylamine (TEA) is slowly added and the dispersion is cooled to 0°C with an ice bath. Then
2-chloroethane sulfonyl chloride (CSC) is slowly added. The dispersion is stirred at 0°C for 20
more minutes and afterwards stirred for two hours at room temperature. The reaction mixture
is dialyzed against ethanol for half a day and afterwards dialyzed against distilled water. The
product is obtained as a white powder after freeze drying.
The following table lists the different amounts of reagents, that were used and the yield.
Table 4.2. Amount of educts used in the functionalization of microgels with vinyl sulfonate
groups.
Sample TEA /
mg; mmol (eq)
CSC /
mg; mmol (eq)
Gravimetric yield /
%
VS-1 270.77; 2.68 (4) 216.59; 1.33 (2) 80
VS-2 270.77; 2.68 (4) 433.18; 2.66 (4) 91
VS-3 541.54; 5.35 (8) 433.18; 2.66 (4) 68
VS-4 270.77; 2.68 (4) 866.36; 5.31 (8) 17
VS-5* 270.77; 2.68 (4) 216.59; 1.33 (2) 90
VS-6** 270.77; 2.68 (4) 216.59; 1.33 (2) 93
* The reaction conditions were similar to VS-1 but in addition a surfactant was used to try to stabilize the product during
dispersion.
** The reaction conditions were similar to VS-1 but the reaction time was increased to 24 hours.
The equivalents (eq) of the educts in the table are given with respect to the molar amount of
hydroxyl groups in 300 mg of the microgel (MG-12-3.0-B).

70
1H-NMR (D2O):
δ (ppm) = 1.00-2.20 (m, 267H, H-2, H-5), 2.20-2.80 (m, 67H, H-1), 2.80-3.50 (m, 67H, H-3),
3.50-3.80 (m, 33H, H-6, H-7, H-10-13), 3.96 (m, 60H, H-14), 4.00-4.58 (m, 33H, H-4), 7.31
(m, 4H, H8, H9), 6.35 (m, varying amounts, H-15), 6.76 (m, varying amounts, H-14).
Functionalization of MG-12-2.5-B with Thiol Groups
MG-12-3.5-B (300 mg; 0.57 mmol OH groups) is dispersed in DMF (5 mL). Dicyclo-
hexylcarbodiimide (DCC) and dimethylaminopyridine are added and the whole dispersion is
cooled down in an ice bath to 0°C. 3,3´-dithiopropionic acid (DTPA) is dissolved in DMF (2
mL) and slowly added to the reaction. The mixture is stirred overnight at room temperature.
During this time, the dispersion turns turbid and slightly yellow. Afterwards PBS buffer
solution (pH = 7.4, 10 mL) is added to the reaction mixture and dithiothreitol is slowly added.
The reaction is stirred at room temperature for 2 hours. For purification, the mixture is filled in
a dialysis tube under an inert gas atmosphere and dialyzed for one day against HCl solution
with a pH between 3 and 4. The mixture is further dialyzed against water for 2 more days.
Afterwards, the mixture is further purified by centrifugation (1000 rpm, 3 minutes). The product
is obtained as white to slightly yellow powder.
The following table lists the different amounts of reagents that were use, and the corresponding
yield.

71
Table 4.3. Amount of educts used in the functionalization of microgels with thiol groups.
Sample DCC /
mg (mmol)
DMAP /
mg (mmol)
DTPA/
mg (mmol)
DTT /
mg (mmol)
Gravimetric
yield / %
T-1 63.00
(0.30)
37.00
(0.30)
29.00
(0.14)
32.00
(0.20) 47
T-2 125.00
(0.61)
74.00
(0.61)
58.00
(0.28)
63.00
(0.61) 38
T-3 187.00
(0.91)
111.00
(0.91)
87.00
(0.41)
96.00
(0.61) 26
T-4 250.00
(1.21)
148.00
(1.21)
116.00
(0.55)
128.00
(0.82) 48
1H-NMR (D2O):
δ (ppm) = 1.00-2.20 (m, 8H, H-2, H-5), 2.20-2.80 (m, 2H, H-1), 2.80-3.50 (m, 2H, H-3), 3.50-
3.80 (m, varying amounts, H-6, H-7, H-10-15), 4.00-4.58 (m, 1H, H-4), 7.31 (m, 4H, H8, H9).

72
4.4 Results and Discussion
When VCL is copolymerized with oligoglycidol macromonomers to form a microgel, it has
been shown that the OH groups of the glycidol repeating unit are mainly located on the microgel
surface. This makes them desirable to modify them with new functional groups. They would
also be located on the surface and would be easily accessible. The introduction of different
groups on the nanogel surface is discussed here.
Functionalization of Microgels with allyl groups
By using allyl bromide in a Williamson ether synthesis, it is possible to functionalize the
microgels with allyl groups. Scheme 4.4.1.1 shows the reaction scheme.
Scheme 4.2. Mechanism of a Williamson ether synthesis using an oligoglycidol building block
and allyl bromide.
By using potassium tert-butoxide as a proton acceptor, the negative charge shifts to the oxygen
atom at the microgel, which can now substitute the bromide within the allyl bromide. A catalytic
amount of potassium iodide is used, which replaces the bromide, so that the nucleophilic
substitution proceeds easier, analogous to a Finkelstein reaction. The reaction is performed in
dimethylformamide, because an aprotic solvent is needed. As a microgel, MG-6-2.5-A was
chosen in the functionalization reaction. The analysis of the product was done via 1H-NMR
spectroscopy. Figure 4.1 shows the spectrum for one product.

73
Figure 4.1. 1H-NMR spectrum of MG-6-2.5-A before (a) and after functionalization with allyl
bromide (b). Used amounts of KOtBu: 1.0 eq. Used amounts of allyl bromide: 1.5 eq (Sample
V-5).
The signals at ca. 1.69, 2.40, 3.19 and 4.20 ppm correspond to the protons of the VCL repeating
units while the signal at 4.7 ppm can be assigned to the solvent water. The signal at ca. 3.62
ppm is caused by the protons of the glycidol repeating chain. The signals at 3.96, 5.16 and 5.84
ppm do not appear in the spectrum for an unmodified microgel. These are caused by the allyl
groups, which are now incorporated into the microgel. The question now arises, if the allyl
groups are covalently bound to the microgel, or if the allyl bromide is just contained inside the
porous structure. The first clue is the broadness of the peak signal of the allyl groups. The
covalent bonding to the colloidal network leads to a loss of mobility for the allyl group, which
leads to a broadening of the NMR signals, which is the case here.
Nevertheless an experiment was done, where allyl bromide was mixed with a PVCL-
oligoglycidol microgel without adding KOtBu or KI. The mixture was dialyzed for a few days.
The hypothesis is, that if the allyl bromide is not covalently bound to the microgel, then it will
be washed out of the mixture. Analysis with 1H-NMR-spectroscopy shows, that there is no trace
of the allyl groups left. They could be washed out without a problem. This leads to the
conclusion that after the Williamson ether synthesis, the allyl groups are covalently bound to
ppm (t1)
1.02.03.04.05.06.0
4.7
00
4.2
00
3.7
84
3.7
80
3.6
29
3.5
46
3.1
85
2.4
00
2.2
27
1.6
98
1.0
0
0.7
5
1.6
7
2.0
8
6.4
6
ppm (t1)
1.02.03.04.05.06.0
5.8
45
5.1
62
4.7
00
4.2
01
3.9
61
3.6
23
3.5
40
3.1
94
2.4
02
2.2
27
1.6
96
1.0
0
0.6
3
1.5
6
1.8
8
5.8
0
0.1
3
0.0
7
0.0
4
a
b

74
the microgel. Since the oligoglycidol is located on the microgel surface, it is safe to say, that
the allyl groups are also located on the surface, which means they are more accessible to further
reactions.
Usually, it is possible, to calculate the degree of functionalization by comparing the signal
intensity of the allyl groups with the intensity of the glycidol groups. However, since the allyl
signals are very weak, it is very difficult to obtain a clear result. Therefore, a different
quantification method was employed. The amount of allyl groups was determined by
iodometric titration. In this redox titration, iodine monochloride is added to a small amount of
the functionalized microgel. In an addition reaction, the iodochloride adds to the vinyl groups,
as shown in scheme 4.3.
Scheme 4.3. Addition mechanism of iodine monochloride to a vinyl group.
The excess of ICl is now mixed with NaI, which forms elemental iodine. The iodine is then
titrated with sodium thiosulfate. Scheme 4.4 shows the reaction equation.
Scheme 4.4. Reaction of ICl with NaI and sodium thiosulfate.
After the addition of sodium iodide, the solution becomes yellow/orange. The color disappears
after enough sodium thiosulfate was added, to consume the whole amount of iodine. In addition
to the titration of the functionalized samples, the unfunctionalized microgel was also titrated as
a reference. Table 4.4 now lists the conversion of the OH groups along with the size and
dispersity of the microgels.

75
Table 4.4. List of different samples and conversion of OH groups.
Sample
Amount
KOtBu /
eq*
Amount
Allylbromide /
eq*
Conversion of
OH groups / % rH / nm PDI
0 0 0 / 57.85 0.18
V-1 0.8 0.8 21 72.64 0.29
V-2 0.8 1.2 36 77.67 0.32
V-3 0.6 0.6 0 80.78 0.33
V-4 0.6 0.9 21 75.58 0.31
V-5 1 1.5 37 78.04 0.33
V-6 1 1 22 74.44 0.29
V-7 1.2 1.2 38 84.90 0.59
V-8 1.2 1.5 39 84.90 0.69
V-9 1 2 43 82.70 0.79
V-10 2 2 64 80.10 0.68
*The equivalents (eq) of the educts in the table are given with respect to the molar amount of hydroxyl groups in the microgel
(MG-6-2.5-A).
According to the results, both KOtBu and allylbromide have an influence in the efficiency of
functionalization. In general, it seems that with increasing amount of both educts, the
conversion increases. An amount of 0.6 equivalents for both chemicals shows a conversion that
is too small to be detected with 1H-NMR spectroscopy or to be quantified by iodometric
titration. It can be concluded, that it is possible to control the efficiency of functionalization
(conversion of OH groups) by the ratio of reagents to substrate used.
In addition, the hydrodynamic radii and the PDI were also measured. As can be observed in
table 4.4 every sample shows an increase of the radius by 15-25 nm. The PDI also increases.
Especially if more than 1 equivalent of allyl bromide and KOtBu are used, there is a sharp
increase in the dispersity. This suggests, that some form of aggregation takes place, which
becomes stronger with increasing conversion of OH-groups on the surface of the microgels.
With the disappearance of the OH-groups the steric protection disappears and agglomeration,
induced by the hydrophobic groups is favored.

76
In figure 4.2 the size of a microgel sample was measured at different temperatures to check if
the microgels still show some temperature sensitivity. The sample concentration was
comparable in both experiments.
Figure 4.2. Temperature sensitivity of a microgel before and after the functionalization with
allyl groups.
After the functionalization the microgel shows a slightly changed temperature sensitivity
compared to the original one. Since the sensitivity of the original microgels is very low anyway,
the changes are negligible. The idea is, that only the microgel surface is modified with the allyl
group, so the VCL core remains unchanged in regard to the temperature sensitivity. But there
is now a slight aggregation visible at 33°C which suggests that the steric protection of the
oligoglycidol groups is diminished because of the functionalization.
In conclusion, the conversion of OH groups to allyl groups is successful, although the dispersity
of the microgels can be improved.
0
20
40
60
80
100
120
140
15 25 35 45 55
rH
/ n
m
T / °C
MG-6-2.5-A
V-7

77
Functionalization of Microgels with Vinyl Sulfonate Groups
The functionalization with vinyl sulfonate groups is done with triethylamine and 2-chloro-
ethyl-sulfonyl chloride, as shown in scheme 4.5.
Scheme 4.5. Functionalization of hydroxyl groups with vinyl sulfonate groups. [20]
An elimination reaction takes place, where hydrogen chloride is cleaved from the group and the
product is formed. Triethylamine is used to neutralize the formed hydrogen chloride.
Afterwards a nucleophilic substitution takes place which leads to a sulfonate ester. The alcohol
function reacts with the intermediate to form the vinyl sulfonate group. The triethylamine is
used again to neutralize the formed hydrogen chloride. [20] The analysis of the reaction product
was done via 1H-NMR spectroscopy (figure 4.3).
Figure 4.3. 1H-NMR spectrum of MG-12-3.0-B functionalized with vinyl sulfonate groups.
Sample: VS-2.
As with figure 4.1, the signals below 4.00 ppm can all be assigned to the protons of the PVCL
and the oligoglycidol. At 6.35 and 6.76 ppm new signals can be found. These signals can be
assigned to the protons of the vinyl sulfonate groups. The functionalization was successful.
ppm (t1)
1.02.03.04.05.06.07.0
6.7
64
6.3
50
4.7
56
4.2
36
3.6
07
3.6
04
3.6
01
3.2
32
2.4
38
1.7
24
1.0
0
1.8
6
1.7
7
2.1
1
0.0
4
0.0
6
7.4
7

78
However, due to the weak signal intensity, a quantification is difficult and cannot be done
precisely. The size of the modified microgels was analyzed and is shown in table 4.5.
Table 4.5. Size of the microgels functionalized with vinyl sulfonate groups.
Sample Triethylamine /
eq.
2-Chloroethane
sulfonyl chloride / eq. rH / nm PDI
Unmodified
microgel 0 0 149.0 0.14
VS-1 4 2 135.2 0.23
VS-2 4 4 153.4 0.35
VS-3 8 4 / /
VS-4 4 8 / /
VS-5 4 2 180.4 0.43
VS-6 4 2 110.2 0.32
The results indicate, that the size of the microgels does not change much. The highest size
difference to the unmodified sample is around 30 nm. But the dispersity is much higher. Also,
after the reaction and the cleaning process, the microgel is much harder to redisperse in water
than before. The samples VS-3 and VS-4 were not redispersible in water so the hydrodynamic
radius could not be determined.
Since vinyl sulfonate groups tend to react with OH groups under optimal conditions, interchain
reactions of different microgels leads to particle coupling. In addition, the number of hydroxyl
groups per particle is diminished which could lead to a decrease in the hydrophilicity of the
colloidal network and consequently to agglomeration by hydrophobic interaction. The
microgels aggregate during the drying process. When they are redispersed they are still
aggregated which in turn leads to the higher dispersity. To stabilize the colloidal network
sample VS-5 was synthesized. During the dialysis a surfactant was added to stabilize the
dispersion. But according to the light scattering data there is no change in the dispersity. The
effect of the reaction time was also analyzed by increasing the time to 24 h (sample VS-6). An

79
effect on the functionalization could not be observed, since the 1H-NMR spectrum of the sample
did not show a higher sulfonate signal intensity than sample VS-1. But the gravimetric yield
was slightly higher.
The temperature sensitivity was analyzed for a selected sample and is shown in figure 4.4.
Figure 4.4. Temperature sensitivity of microgel MG-12-3.0-B before and after the
functionalization with vinyl sulfonate groups.
The functionalized microgels are larger, however the ratio of rH of swollen and collapsed
microgels is similar to the non-functionalized ones. The temperature sensitivity was not
influenced by the modification with vinyl sulfonate groups. Since the functionalization happens
at the microgel surface, it is reasonable to assume, that the temperature sensitivity does not
change very much because it is mainly influenced by the PVCL part.
0
20
40
60
80
100
120
140
160
180
200
15 25 35 45 55
rH
/ n
m
T / °C
MG-12-3.0-B
VS-2

80
Functionalization with thiol groups
It is possible, to functionalize the microgels with thiol groups. Scheme 4.6 shows the reaction.
Scheme 4.6. Thiol functionalization of polyglycidol.
3,3´-dithiopropionic acid (DTPA) and the hydroxyl groups of the glycidol react in a Steglich
esterification and form an ester bond. Afterwards, the disulfide bond is cleaved via reduction to
thiol groups with dithiothreitol. The resulting samples were analyzed via Raman spectroscopy
(figure 4.5.).
Figure 4.5. Raman spectrum of thiol modified microgels.
The signal at 2570 cm-1 corresponds to the thiol groups, which are incorporated into the
microgel. With a higher degree of functionalization, the signal becomes stronger. In the non-
modified microgel this signal is absent. In addition, there is also a signal at 1750 cm-1 which is
caused by the ester group, which is formed during the Steglich esterification. Because of the
0
0,1
0,2
0,3
0,4
0,5
0,6
0,7
0,8
0,9
1
30080013001800230028003300
Ra
ma
n i
nte
nsi
ty
Wave number / cm-1
MG-12-2.5-BT-1T-2T-3T-4
0
0,05
0,1
0,15
2500260027002800
Ram
an
In
ten
sity
Wave number / cm-1
2570 cm-1
1750 cm-1

81
small amount of thiol groups, which are incorporated into the microgel, a quantitative analysis
of the samples via Raman spectroscopy is not possible. To calculate the amount of thiol groups
in the microgel, the samples were analyzed by Ellmann method. To the samples, a fixed amount
of 5,5´-dithiobis (2-nitrobenzoic acid), also known as Ellmanns reagent was added. The reagent
reacts with the thiol groups of the microgel, and the disulfide bond of the reagent is cleaved.
The resulting 2-nitro-5-thiobenzoate becomes ionized in water and shows a characteristic
yellow color, which can be measured via UV/VIS spectroscopy. [18, 19] To calculate the amount
of thiol groups in the samples, a calibration curve was measured, with fixed amounts of N-
acetyl L-cysteine, which is shown in figure 4.6.
Figure 4.6. Light absorption of fixed concentrations of N-acetyl L-cystein. Wavelength: 412
nm.
The slope of the trend line is given as:
y = 11.604x
From this, the amount of thiol groups for each sample could be calculated. They are shown in
table 4.6.
0
0,2
0,4
0,6
0,8
1
1,2
1,4
0 0,02 0,04 0,06 0,08 0,1
Ab
sorp
tio
n /
a. u
.
Concentration / mmol/L

82
Table 4.6. Calculated amount of thiol groups in the synthesized samples.
Sample eq. DTPA per OH-group
used
Amount thiol groups
(calculated)
T-1 0.5 9.79%
T-2 1.0 15.00%
T-3 1.5 25.97%
T-4 2.0 26.68%
The percentage relates to the amount of hydroxyl groups which were functionalized. Even the
lowest amount of 0.5 equivalents of DTPA per OH group should ideally lead to a
functionalization rate of 100%. The actual amount of thiol groups is much smaller, than the
desired one. With more equivalents of the DTPA used, the amount of thiol groups increases.
But the amount of sample 3 is not much higher than the amount of sample 4. This suggests, that
there is an upper limit to how much hydroxyl groups can be functionalized with thiol groups.
This could be because at high concentrations of DTPA, it can´t react with the OH groups
anymore, because of a steric hindrance.
After the functionalization, the size of the microgels was analyzed and compared with the
unmodified microgel. The results are shown in table 4.7.
Table 4.7. Hydrodynamic size and dispersity of the samples, functionalized with thiol groups.
Sample rH / nm PDI
MG-12-2.5-B 149.43 0.14
T-1 260.72 0.37
T-2 181.95 0.34
T-3 121.11 0.34
T-4 199.58 0.32
There is no clear trend visible. The size fluctuates around the original size of the unmodified
microgel. But it seems, that the hydrodynamic radius increases after the modification. In every
sample, the PDI more than doubles. During the modification process, the microgels might tend
to aggregate, which leads to the higher PDI. One aggregation process is possible, when the
esterification of the DTPA takes place and OH groups from two different microgels are
involved with the reaction. This leads to an entanglement of the particles which might be
permanent.
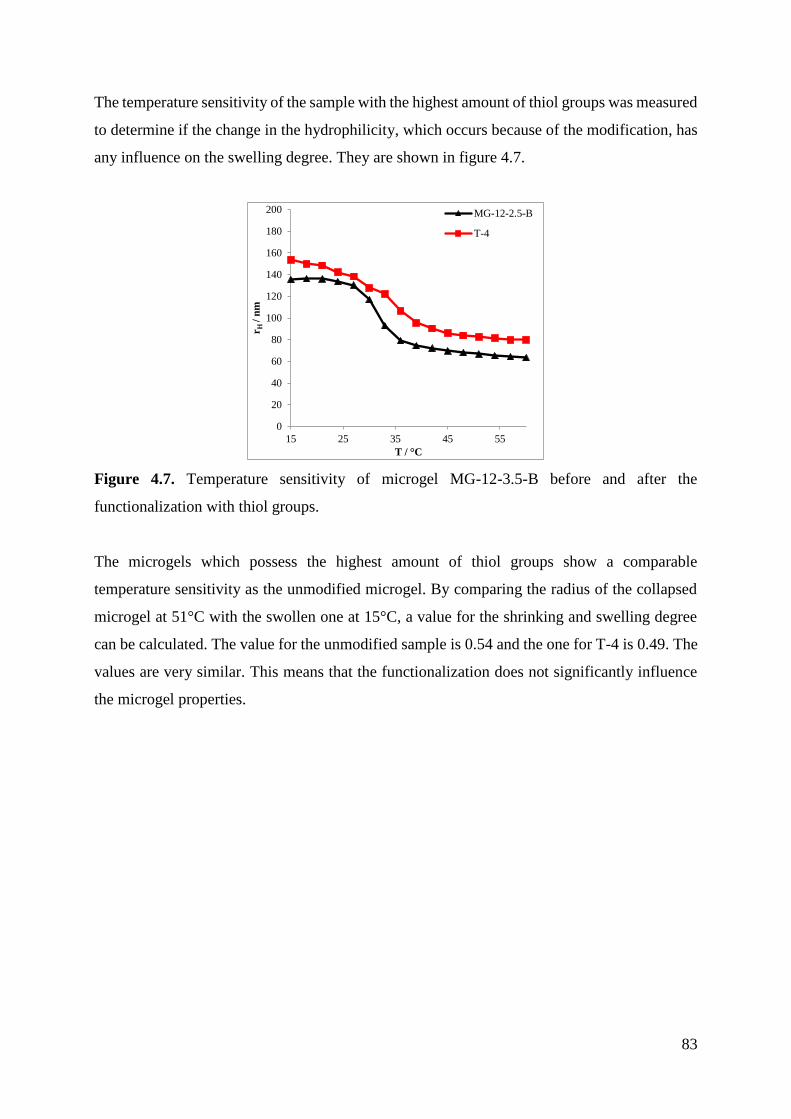
83
The temperature sensitivity of the sample with the highest amount of thiol groups was measured
to determine if the change in the hydrophilicity, which occurs because of the modification, has
any influence on the swelling degree. They are shown in figure 4.7.
Figure 4.7. Temperature sensitivity of microgel MG-12-3.5-B before and after the
functionalization with thiol groups.
The microgels which possess the highest amount of thiol groups show a comparable
temperature sensitivity as the unmodified microgel. By comparing the radius of the collapsed
microgel at 51°C with the swollen one at 15°C, a value for the shrinking and swelling degree
can be calculated. The value for the unmodified sample is 0.54 and the one for T-4 is 0.49. The
values are very similar. This means that the functionalization does not significantly influence
the microgel properties.
0
20
40
60
80
100
120
140
160
180
200
15 25 35 45 55
rH
/ n
m
T / °C
MG-12-2.5-B
T-4

84
4.5 Summary and Outlook
In conclusion, it is possible, to functionalize the microgels with several different functional
groups. The degree of functionalization can be varied in most cases. Because the OH-groups
are located on the microgel surface, the new functional groups are easily accessible for further
modifications. In addition, aside from changes in the dispersability, the microgel properties
such as the temperature sensitivity do not seem to change.
The functionalization with allyl groups follows a trend that with higher amounts of base and of
allyl bromide the number of functionalized OH-groups increases. The radius only changes
slightly for the modified microgels, but if the conversion is too high, then the dispersity sharply
increases. This is presumably because of particle aggregation as the stabilizing effect of the
dispersion decreases with conversion of the OH-groups.
Vinyl sulfonate groups could be successfully introduced into the colloidal network. The radius
and the dispersity increase slightly but if the amount of TEA and CSC is too high the microgels,
once isolated cannot be redispersed in water. Because of the low intensity of 1H-NMR signals
of the vinyl sulfonate groups formed, it was not possible to quantify these groups.
It is possible to functionalize the microgel with thiol groups. With an increasing amount of
DTPA the degree of ester formation increases up to an upper limit of 25% of functionalized OH
groups. The size of the modified samples varies highly while the dispersity increases.
The dispersity of all samples presumably also increases because the microgels are getting dried
and redispersed in different solvents several times during the reaction which can lead to
aggregation and entanglement of particles which can hardly be reversed. Since the hydroxy
groups are located on the shell, the functional groups are also located there. They can be easily
reached if they have to interact with other molecules for specific purposes.
There are several possible applications for functionalized microgels based on the properties of
the functional groups.
Thiol groups are used, to specifically bind to hair, which makes the application of microgels in
cosmetics possible. [17]
Thiol- and allyl groups react together in a click reaction by applying light of a certain
wavelength. By functionalizing microgels with those groups, hydrogels could be formed from
them. [16]
Vinyl sulfonate groups could help in the formation of collagen hydrogels. Since the microgels
usually have more than one vinyl sulfonate group per particle, they can readily react with the
amine groups of the collagen and act as crosslinkers. Based on experiments, it could be
observed, that the gelation time can be shortened.

85
In addition to the functional groups mentioned in this chapter, there are many more with which
the hydroxyl groups can be functionalized. Even enzymes and proteins could be grafted on the
microgel surface.
It is possible, to functionalize the microgels with relative ease. Not only can the OH groups be
used to introduce new groups into the microgel, they can also be used as initiators for new
polymerizations, extending from the surface.

86
4.6 Literature
[1] Hoare, T.; Pelton, R. Langmuir 2004, 20, 2123-2133.
[2] Snowden, M. J.; Marston, N. J.; Vincent, B. Colloid. Polym. Sci. 1994, 272, 1273-
1280.
[3] Shiroya, T.; Tamura, N.; Yasui, M.; Fujimoto, K.; Kawaguchi, H. Colloids and
Surfaces B-Biointerfaces 1995, 4, 267-274.
[4] Delair, T.; Meunier, F.; Elaissari, A.; Charles, M. H.; Pichot, C. Colloids Surf. A
Physiochem. Eng. Asp. 1999, 153, 341-353.
[5] Greinert, N.; Richtering, W. Colloid Polym. Sci. 2004, 282. 1146-1149.
[6] Xu, J.; Pelton, R. J. Colloid. Interf. Sci. 2004, 276, 113-117.
[7] Xu, F. J.; Cai, Q.; J.; Li, Y. L.; Kang, E. T.; Neoh, K. G. Biomacromolecules, 2005, 6,
1012-1020.
[8] Virtanen, J.; Baron, C.; Tenhu, H. Macromolecules 2000, 33, 336-341.
[9] Häntzschel, N.; Schrinner, M.; Hund, H.; Hund, R. D.; Lück, C.; Pich, A. Macromol.
Biosci. 2009, 9, 444-449.
[10] Groll, J.; Fiedler, J.; Engelhard, E.; Ameringer, T.; Tugulu, S.; Klok, H.-A.; Brenner, R.
E.; Moeller, M. J. Biomed. Mater. Res. Part A 2005, 74A, 607-617.
[11] Keul, H.; Möller, M. J. Polym. Sci. Part A: Polym. Chem. 2009, 47, 3209-3231.
[12] Groll, J.; Singh, S.; Albrecht, K.; Möller, M. J. Polym. Sci. Part A 2009, 47, 5543-
5549.
[13] Haamann, D.; Keul, H.; Klee, D.; Möller, M. Macromolecules 2010, 43, 6295-6301.
[14] Zhso, J. P.; Schlaad, H. Macromolecules 2011, 44, 5861-5864.
[15] Qui, X.; Sukhishvili, S. J. Polym. Sci. A Polym. Chem. 2006, 44, 183-191.
87
[16] Hoffmann, A. Diploma Thesis, Funktionalisierungen von N-vinylcaprolactam- und N-
isopropylmethacrylamid- basierten Mikrogelen zur Photovernetzung, 2013, Rheinisch-
Westfälische Technische Hochschule Aachen.
[17] Daleiden, N. J. E. Diploma Thesis, Synthese von thiolfunktionalisierten P(VCL-co-PG)
Mikrogelen, 2013, Rheinisch-Westfälische Technische Hochschule Aachen.
[18] Ellmann, G. L. Arch. Biochem. Biophys. 1959, 82, 70-77.
[19] Tsukamoto, Y.; Wakil, S. J. J. Bio. Chem. 1988, 263, 16225-16229.
[20] Whitmore, W. F.; Landau, E. F. J. Am Chem. Soc. 1946, 68, 1797-1798.
88
5. Modification of the Microgel Surface with Polymer
Brushes
5.1 State of the Art
The grafting of polymers onto surfaces can be used to synthesize composite materials. Those
can be used in different applications such as the immobilization of proteins or colloidal
stabilization of particles. [3, 4] Especially the modification of the particle surface has been
researched in the past.
There are two methods to modify a surface. It can be realized either by grafting-to or by grafting
from polymerization. The first method allows a better control over the grafted polymer chains.
However, because of sterical hindrance, the graft density is rather low. [5] The grafting-from
polymerization does not show this problem, as the monomers can more easily reach the active
sites.
Polymers can be grafted from different surfaces. Rühe et al. reported the formation of
polystyrene on the surface of a silica gel. The surface is covered with a monolayer of
azoinitiator, which is covalently bound to the surface and the polystyrene is synthesized by free
radical polymerization. [6] Silica particles could also be functionalized with poly (butyl acrylate)
by living free radical polymerization. [7]
It is also possible to modify the surface of organic colloidal systems like this. Zheng and Stöver
reported the grafting of polystyrene from disperse polydivinylbenzene particles. Remaining
vinyl groups on the surface were modified so that the styrene could be polymerized by atom
transfer radical polymerization (ATRP). [8] Ballauf et al. developed a colloidal system
consisting of a polystyrene core and different anionic or cationic polyelectrolyte chains grafted
onto it which could be used as nanoreactors for the synthesis of metal nanoparticles. [9, 10] Poly
(ethylene glycol methacrylate) (PEGMA) could be grafted from polystyrene particles that have
been functionalized with a photoinitiator. The PEGMA was synthesized by
photopolymerization and the resulting particles have been used as nanoreactors for the
generation of stable Ag nanoparticles. [11]
Most particles show a slight increase in their size which comes from the polymer brushes on
the surface while some systems show changed properties in different solvents. Depending on
Excerpts of this chapter have already been published elsewhere. [1, 2]
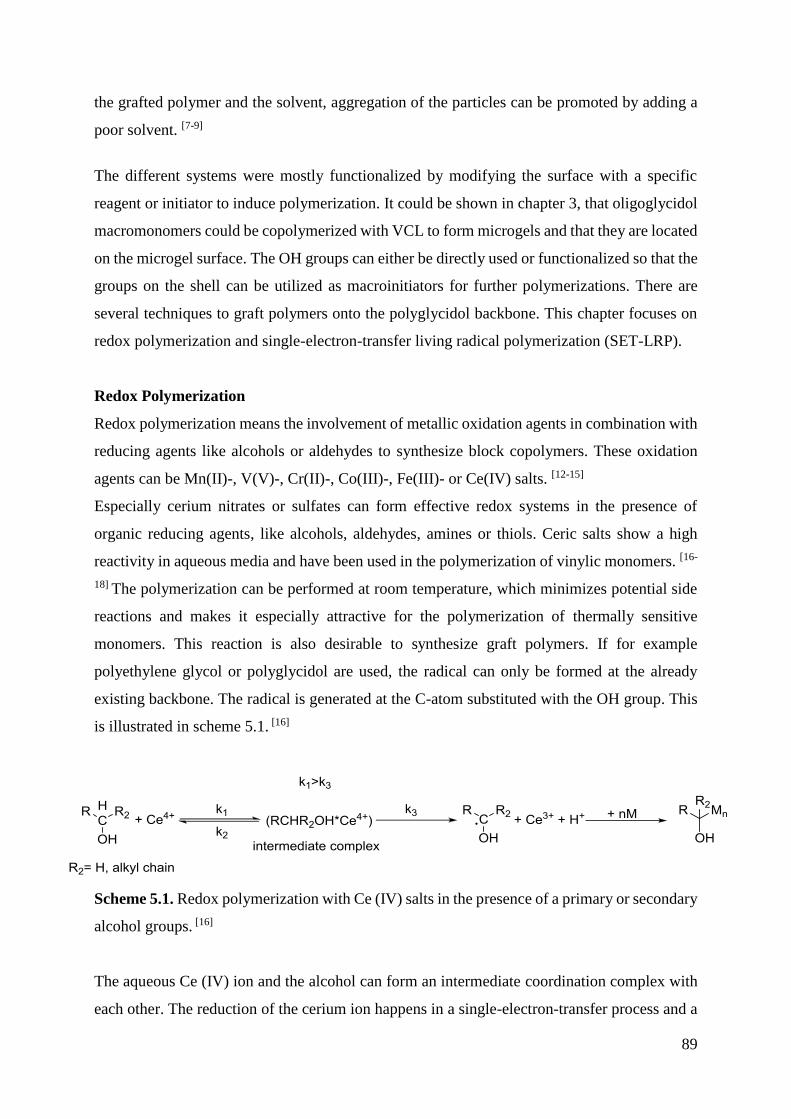
89
the grafted polymer and the solvent, aggregation of the particles can be promoted by adding a
poor solvent. [7-9]
The different systems were mostly functionalized by modifying the surface with a specific
reagent or initiator to induce polymerization. It could be shown in chapter 3, that oligoglycidol
macromonomers could be copolymerized with VCL to form microgels and that they are located
on the microgel surface. The OH groups can either be directly used or functionalized so that the
groups on the shell can be utilized as macroinitiators for further polymerizations. There are
several techniques to graft polymers onto the polyglycidol backbone. This chapter focuses on
redox polymerization and single-electron-transfer living radical polymerization (SET-LRP).
Redox Polymerization
Redox polymerization means the involvement of metallic oxidation agents in combination with
reducing agents like alcohols or aldehydes to synthesize block copolymers. These oxidation
agents can be Mn(II)-, V(V)-, Cr(II)-, Co(III)-, Fe(III)- or Ce(IV) salts. [12-15]
Especially cerium nitrates or sulfates can form effective redox systems in the presence of
organic reducing agents, like alcohols, aldehydes, amines or thiols. Ceric salts show a high
reactivity in aqueous media and have been used in the polymerization of vinylic monomers. [16-
18] The polymerization can be performed at room temperature, which minimizes potential side
reactions and makes it especially attractive for the polymerization of thermally sensitive
monomers. This reaction is also desirable to synthesize graft polymers. If for example
polyethylene glycol or polyglycidol are used, the radical can only be formed at the already
existing backbone. The radical is generated at the C-atom substituted with the OH group. This
is illustrated in scheme 5.1. [16]
Scheme 5.1. Redox polymerization with Ce (IV) salts in the presence of a primary or secondary
alcohol groups. [16]
The aqueous Ce (IV) ion and the alcohol can form an intermediate coordination complex with
each other. The reduction of the cerium ion happens in a single-electron-transfer process and a

90
radical is formed next to the hydroxyl group. In the presence of vinyl or acrylate groups, a
polymerization is initiated and the propagation follows the mechanism of a typical radical
polymerization. This can be done at room temperature. Titration of the Ce(IV) ions has shown,
that most of the ions are consumed in the first 5 minutes of the reaction. The reaction rate is not
decided by formation of the intermediate complex, but by the single-electron transfer happening
afterwards. [17] If the polymerization is carried out in water, the cerium ion can form a complex
with it, which leads to a form where the cerium ion is less reactive regarding the radical
formation. This complexation is illustrated in scheme 5.2. [19]
Scheme 5.2. Oxidation mechanism of Ce4+ in water. [19]
This has adverse effects on the polymerization reaction. The (Ce-O-Ce)6+ complex is unable to
form the intermediate complex with the reducing agent. To counter this, the reaction is carried
out in acidic medium, to shift the equilibrium to the Ce4+. A too high acid concentration also
has adverse effects on the polymerization, so the pH has to be chosen carefully. It is not only
dependent on the amount of acid in the medium. The nature of the acid is equally important for
the reaction rate. The rate of polymerization is highest with HClO4, lower with HNO3 and
lowest with H2SO4. This is because the oxidation potential for the Ce4+/Ce3+ is highest with
HClO4. [20]
Single Electron Transfer Living Radical Polymerization
In addition to the redox polymerization with metallic oxidation agents, it is possible to use a
single-electron-transfer living radical polymerization (SET-LRP) to graft polymers onto a
surface. Like a RAFT- or ATRP-reaction, SET-LRP is a controlled polymerization, in which
the presence of an active and a dormant species is used. [21] The active species is a radical and
the dormant species is commonly an alkyl halide species, which does not participate in the
polymerization. Contrary to a radical free polymerization, the course of the polymerization is
tightly controlled. Because the equilibrium between active and dormant species is shifted
towards the dormant species, there is always only a small amount of radicals active in the
reaction, which leads to a drastic reduction of side reactions or chain terminations. In such
reactions, metals with low oxidation states are used as activators or electron transfer agents,
such as iron, osmium, ruthenium or molybdenium compounds. In a SET-LRP copper is used as

91
the electron transfer agent. An overview over the polymerization mechanism has been reported
by Percec in 2006 and is shown in scheme 5.3. [22]
Scheme 5.3. Schematic description of the activation/deactivation process of the radical in a
SET-LRP. [22]
A copper (0) species is used which acts as an electron donor agent. The electron is transferred
to the dormant species and an intermediate radical anion is formed. It decomposes into a Cu(I)
complex and the active species which starts the polymerization in the presence of a monomer
M. The Cu(I) species disproportionates into a Cu(0) and Cu(II) species. The active species
reacts with the Cu(II) and gets deactivated. The resulting Cu(I) intermediate again
disproportionates again into Cu(0) and Cu (II) so that the activator and the deactivator are
constantly replenished. The disproportionation is benefitted by the usage of nitrogen containing
ligands, which stabilize the Cu(II) species. Polar solvents, dipolar aprotic liquids, ionic liquids,
alcohols or water also benefit this reaction. [22-26]
SET-LRP provides an excellent control over the molecular weight, dispersity, polymer
architecture or end group functionality and it shows several advantages to other controlled
living radical polymerizations. It is one of the more robust polymerizations and can be
performed in several solvents, like water, alcohols and even tequila. [26] It can be also used under

92
biological conditions like in sheep blood serum. [27] While monomers used in ATRP need to
have a group that stabilizes the radical like styrene or methacrylate, SET-LRP can also
polymerize non-activated monomers. So it is possible, to use monomers, which are not
polymerizable under ATRP conditions, like NIPAAM or vinyl chloride. [24, 25]
The mentioned methods can now be used to graft several different polymers to a microgel
surface. There are many polymers, which can be used, but this work only discusses a select few.

93
5.2 Aim
In this chapter, grafting experiments onto the surface of specific VCL based microgels are
reported. The goal is the formation of brush like structures on the microgel surface as shown in
scheme 5.4.
Scheme 5.4. Functionalization of the microgel shell.
Brush-like structures are formed when polymers are grafted from the microgel surface. When
the polymer is densely grafted onto the surface and crosslinked it is called a core/shell like
structure, since the brush polymers are not only located on the surface, they surround the
microgel as a continuous layer.
There are several advantages of the grafting from polymerization to synthesize core/shell
structures. The polymerization can be done at room temperature, when the core is still in a
swollen state. Since the reaction is initiated from oligoglycidol, the grafted polymers are
covalently bound to the core as opposed to a classic shell synthesis. In a classic shell synthesis,
a monomer and a crosslinker are polymerized to form a dense, crosslinked polymer shell around
the already existing particle core. The shell is not covalently bound to the core but merely
surrounds it. To form such a shell usually a crosslinker has to be added to the reaction while
this is not the case here.
As substrate a PVCL based microgel was chosen, which is copolymerized with oligoglycidol
macromonomers. The latter is located on the microgel shell. The primary alcohol groups can
be easily used or modified for the grafting-from polymerization.
PVCL
Oligoglycidol Macromonomer
Grafted Polymer

94
Several different monomers are used for the functionalization. They are shown in figure 5.1.
Figure 5.1. Different monomers that are used in the grafting from polymerization on PVCL
microgels.
One of these monomers is sulfobetain. Betains are zwitterionic molecules. They have a cationic
and anionic group within the molecule. The cation can be an ammonium group, while the anion
can be a carboxy-, a phosphonate- or a sulfonate group. There are already microgels, which
consist of zwitterionic molecules. They show several characteristics, which brings them
advantages in biological or medicinal applications.
For example, polycarboxybetain coated surfaces show a high resistance to unspecified protein
absorption. They can however easily be modified to let specific proteins bind to the surface,
while still having a high resistance to other proteins. [28, 29] Furthermore, zwitterionic microgels
can be used as reaction sites for the synthesis of metal nanoparticles. [30]
Styrene sulfonic acid (SSA) is another monomer, which can be used in a grafting-from
polymerization. Its polymer is a nonadsorbing polyelectrolyte and shows some antiviral
activity. [31] Because of its negative charge it is usually used in the deposition of multilayers on
a surface. Such layers can also be assembled on a microgel surface to modify its swelling degree
and behavior to an external stimulus. [32-34]
Di (ethylene glycol) ethyl ether acrylate (DEGA) and 2-methoxyethylacrylate (MEA) can also
be used. Like poly(ethylene glycol), those polymers show a very good biocompatibility.
Especially PMEA shows an excellent compatibility with blood, which is due to the mobility of
water in the polymer. [35-38]

95
NIPAAM is an attractive monomer, since its polymer shows temperature sensitive properties,
like PVCL, the building block of the used microgels. It can be used to synthesize core-shell
particles, since NIPAAM tends to self-crosslinking during the polymerization. [39]
Acrylonitrile is a monomer, which is commonly used in the production of fibers. Its polymer
can be modified with amidoxime groups which lead to fibers that show the ability to absorb
heavy metal ions. [40, 41] The fibers are also used as precursors in the formation of carbon fibers.
[42]
Several different grafting techniques are tried. The grafting-from redox polymerization with a
cerium species was used because the alkyl group next to the OH group can be converted to a
radical through the use of cerium ammonium nitrate. The second grafting technique is the
single-electron-transfer living radical polymerization. In a first step the alcohol group is
converted to an alkyl halide group which acts as an initiator in the second step, the actual SET-
LRP.
The aim is to incorporate different polymers into the microgel shell, which have different
properties and could thus lead to different applications. It is shown that the grafting of the
polymers from the surface is possible and that they are covalently bound to the microgel.

96
5.3 Experimental Part
The microgels used are presented in chapter 3. PVCL based microgels are copolymerized with
different oligoglycidol macromonomers with vinyl benzyl alcohol as head group. The
synthesized microgel samples are further referred to as MG-x-y-A. X stands for the number of
glycidol repeating units in the macromonomer whereas y stands for the amount of
macromonomer used in mol% in relation to the used molar amount of VCL. A means that the
microgel was synthesized by batch synthesis. B means that it was synthesized by the continuous
method, which means that the crosslinker was added over a certain time after the addition of
the initiator to the reaction mixture.
The letter N s in the following tables stands for the number of repeating units of the used
monomer in relation to the number of assumed radicals formed.
The gravimetric yield is determined by weighing the sample and comparing the mass with the
expected mass at a monomer conversion of 100%.
Grafting-from polymerization with DEGA
Reaction at room temperature using MG-50-0.50-A
MG-50-0.5-A (99.97 mg, 0.15 mmol OH groups) is dispersed in H2O (7.1 mL) in a Schlenk
flask. Nitric acid (65%, x mL (see table 5.1)) is diluted with H2O (13 mL) and added slowly
dropwise to the dispersion. The mixture is frozen in liquid nitrogen, degassed in vacuum and
thawed. The entire process is repeated 3 times. Ceric ammonium nitrate (CAN) (y g (see table
5.1) is dissolved in H2O (1 mL), degassed for 10 minutes and added to the reaction mixture.
After 3 minutes of stirring, the monomer DEGA is added. The mixture is stirred overnight and

97
purified via dialysis for 3 days. After freeze-drying, the product is obtained as a white to yellow
powder. Table 5.1 lists the used amounts of chemicals for the different samples.
Table 5.1. Amount of educts used in the redox polymerization of DEGA using MG-50-0.5-A*.
Sample Degree of
activation N
Amount
CAN / g
(mol)
Amount
DEGA /
g (mol)
V(HNO3) /
mL
Gravimetric
Yield / %
DEGA-
MG0 0 20 /
3.91∙10-1
(2.08∙10-3) 0.08 0
DEGA-
MG1 68.97 5
5.70∙10-2
(1.04∙10-4)
9.79∙10-2
(5.20∙10-4) 0.08 72.2
DEGA-
MG2 68.97 10
5.70∙10-2
(1.04∙10-4)
1.96∙10-1
(1.04∙10-3) 0.08 86.5
DEGA-
MG3 68.97 20
5.70∙10-2
(1.04∙10-4)
3.91∙10-1
(2.08∙10-3) 0.08 100
DEGA-
MG4 41.38 5
3.42∙10-2
(6.24∙10-5)
5.87∙10-2
(3.12∙10-4) 0.05 100
DEGA-
MG5 41.38 10
3.42∙10-2
(6.24∙10-5)
1.17∙10-1
(6.24∙10-4) 0.05 66.6
DEGA-
MG6 41.38 20
3.42∙10-2
(6.24∙10-5)
2.35∙10-1
(1.25∙10-3) 0.05 60.4
DEGA-
MG7 27.59 5
2.28∙10-2
(4.16∙10-5)
3.91∙10-2
(2.08∙10-4) 0.03 9.7
DEGA-
MG8 27.59 10
2.28∙10-2
(4.16∙10-5)
7.83∙10-2
(4.16∙10-4) 0.03 25.4
DEGA-
MG9 27.59 20
2.28∙10-2
(4.16∙10-5)
1.57∙10-1
(8.32∙10-4) 0.03 84.3
DEGA-
MG10 10.00 50
8.27∙10-3
(1.51∙10-5)
1.42∙10-1
(7.54∙10-4) 0.01 0
* 99.97 mg (0.15 mmol OH groups)

98
Reaction at elevated temperatures using MG-50-0.50-A
The grafting-from polymerization at elevated temperatures (40 or 50 °C) is done analogous to
the reaction at room temperature. The amount of CAN, nitric acid and DEGA is chosen similar
to sample DEGA-MG6. The reaction temperature is chosen as 40 or 50°C. The name of the
synthesized products is DEGA-MG6-xx°C where xx stands for the synthesis temperature.
Reaction at room temperature with a continuous monomer addition using MG-50-0.50-A
The amount of CAN, nitric acid and DEGA is chosen similar to sample DEGA-MG6. The
microgel dispersion is put in a Schlenk flask and diluted with H2O (20 mL). Nitric acid (65%,
0.05 mL) is diluted in H2O (13 mL) and added slowly dropwise to the dispersion. The whole
mixture is frozen in liquid nitrogen, degassed in vacuum and thawed. The entire process is
repeated 3 times. Ceric ammonium nitrate (3.42∙10-2 g, 6.24∙10-5 mol) is dissolved in H2O (1
mL) and degassed for 10 minutes. DEGA (2.35∙10-1 g, 1.25∙10-3 mol) is dissolved in H2O (10
mL) and degassed three times. The CAN-solution is added to the reaction mixture and after 3
minutes of stirring, the DEGA is slowly added to the reaction mixture with a syringe pump.
The DEGA solution is added with a speed of 0.5 mL per hour. The synthesized product is called
DEGA-MG6-syringe pump.
Reaction at room temperature using MG-50-0.25-A.
The reaction conditions are similar to the reactions with the sample MG-50-0.5-A. For the
reactions, 100.01 mg (0.08 mmol OH groups) microgel are used. The product is obtained after
freeze drying as a white powder. Table 5.2 lists the used amounts of the chemicals for the
different samples.

99
Table 5.2. Amount of educts used in the redox polymerization of DEGA using MG-50-0.25-
A*.
Sample Degree of
activation N
Amount
CAN /
g (mol
Amount
DEGA /
g (mol)
V (HNO3) /
mL
Gravimetric
Yield / %
DEGA-
MG11 68.97 10
3.03∙10-2
(5.53∙10-5)
1.03∙10-1
(5.48∙10-4) 0.04 /
DEGA-
MG12 68.97 20
3.03∙10-2
(5.53∙10-5)
2.05∙10-1
(1.09∙10-3) 0.04 53.6
DEGA-
MG13 41.38 10
1.82∙10-2
(3.32∙10-5)
6.25∙10-2
(3.32∙10-4) 0.02 3.1
DEGA-
MG14 41.38 20
1.82∙10-2
(3.32∙10-5)
1.25∙10-1
(6.65∙10-4) 0.02 61.1
* 100.01 mg (0.08 mmol OH groups)
1H-NMR (D2O):
δ (ppm) = 0.937-1-139 (m, 3H, H-22), 1.16-1.98 (m, 12H, H-2, H-5, H-7, H-14), 2.07-2.31 (m,
1H, H-6), 2.31-2.66 (m, 2H, H-1), 2.68-3.40 (m, 3H, H-11, H-15), 3.40-3.92 (m, 15H, H-3, H-
4, H-12, H-13, H-18-21), 3.99-4.40 (m, 4H, H-10, H-17).
Grafting-from polymerization with MEA using MG-50-0.50-A
MG-50-0.50-A (99.97 mg, 0.15 mmol OH groups) is dispersed in H2O (7.1 mL) in a schlenk
flask. Nitric acid (65% x mL (see table 5.3)) is diluted with H2O (13 mL) and added slowly
dropwise to the dispersion. The whole mixture is frozen in liquid nitrogen, degassed in vacuum

100
and thawed. The entire process is repeated 3 times. Ceric ammonium nitrate (y mL (see table
5.3) is dissolved in H2O (1 mL), degassed for 10 minutes and added to the reaction mixture.
After 3 minutes of stirring, the monomer MEA is added. The mixture is stirred overnight at
room temperature and purified via dialysis for 3 days. After freeze-drying, the product is
obtained as a white to yellow powder. Table 5.3 lists the used amounts of chemicals for the
different samples.
Table 5.3. Amount of educts used in the redox polymerization of MEA using MG-50-0.50-A*.
Sample Degree of
activation N
Amount
CAN /
g (mol)
Amount
MEA /
g (mol)
V(HNO3) /
mL
Gravimetric
Yield / %
MEA-
MG0 0 20 /
2.71∙10-1
(2.08∙10-3) 0.08 0
MEA-
MG1 68.97 5
5.70∙10-2
(1.04∙10-4)
6.77∙10-2
(5.20∙10-4) 0.08 57.4
MEA-
MG2 68.97 10
5.70∙10-2
(1.04∙10-4)
1.35∙10-1
(1.04∙10-3) 0.08 3.6
MEA-
MG3 68.97 20
5.70∙10-2
(1.04∙10-4)
2.71∙10-1
(2.08∙10-3) 0.08 86.1
MEA-
MG4 41.38 5
3.42∙10-2
(6.24∙10-5)
4.06∙10-2
(3.12∙10-4) 0.05 20.2
MEA-
MG5 41.38 10
3.42∙10-2
(6.24∙10-5)
8.12∙10-2
(6.24∙10-4) 0.05 190.1
MEA-
MG6 41.38 20
3.42∙10-2
(6.24∙10-5)
1.62∙10-1
(1.25∙10-3) 0.05 35.8
MEA-
MG7 27.59 5
2.28∙10-2
(4.16∙10-5)
2.71∙10-2
(2.08∙10-4) 0.03 39.2
MEA-
MG8 27.59 10
2.28∙10-2
(4.16∙10-5)
5.41∙10-2
(4.16∙10-4) 0.03 0
MEA-
MG9 27.59 20
2.28∙10-2
(4.16∙10-5)
1.08∙10-1
(8.32∙10-4) 0.03 79.3
*(99.97 mg, 0.15 mmol OH groups)

101
1H-NMR (D2O):
δ (ppm) = 1.12-2.06 (m, 12H, H-2, H-5, H-7, H-14), 2.11-2.35 (m, 1H, H-6), 2.35-2.69 (m, 2H,
H-1), 2.82-3.30 (m, 3H, H-11, H-15), 3.30-3.44 (m, 3H, H-19), 3.51-3.81 (m, 9H, H-3, H-4 H-
12, H-13, H-18), 4.02-4.47 (m, 4H, H-10, H-17).
Grafting-From Polymerization with Sulfobetain using MG-50-0.75-A.
MG-50-0.75-A (200.00 mg, 0.44 mmol OH groups) is dispersed in H2O (11.4 mL) in a Schlenk
flask. Nitric acid (65%, x mL (see table 5.4)) is diluted with H2O (13 mL) and added slowly
dropwise to the dispersion. The whole mixture is frozen in liquid nitrogen, degassed in vacuum
and thawed. The entire process is repeated 3 times. Ceric ammonium nitrate (y g (see table 5.4)
is dissolved in H2O (1 mL), degassed for 10 minutes and added to the reaction mixture. After 3
minutes of stirring, the monomer sulfobetain-1 (SB) is added. The mixture is stirred overnight
and purified via dialysis for 3 days. After freeze-drying, the product is obtained as a white to
yellow powder. Table 5.4 lists the used amounts of chemicals for the different samples
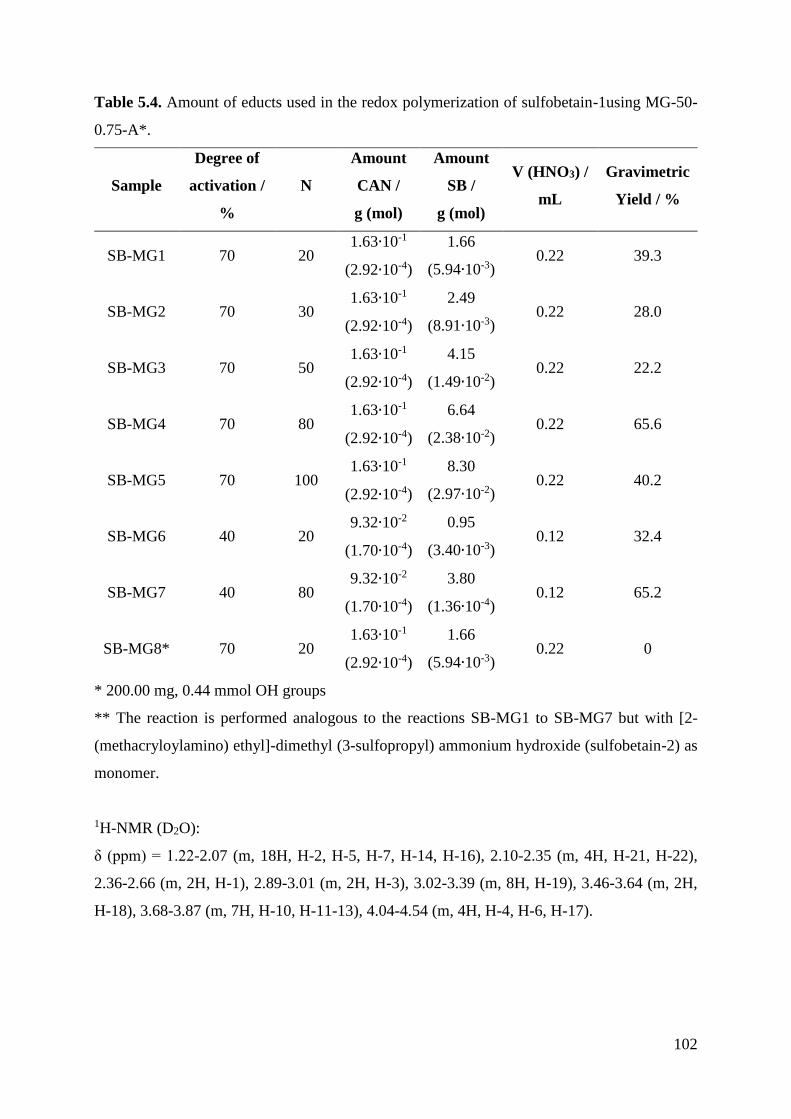
102
Table 5.4. Amount of educts used in the redox polymerization of sulfobetain-1using MG-50-
0.75-A*.
Sample
Degree of
activation /
%
N
Amount
CAN /
g (mol)
Amount
SB /
g (mol)
V (HNO3) /
mL
Gravimetric
Yield / %
SB-MG1 70 20 1.63∙10-1
(2.92∙10-4)
1.66
(5.94∙10-3) 0.22 39.3
SB-MG2 70 30 1.63∙10-1
(2.92∙10-4)
2.49
(8.91∙10-3) 0.22 28.0
SB-MG3 70 50 1.63∙10-1
(2.92∙10-4)
4.15
(1.49∙10-2) 0.22 22.2
SB-MG4 70 80 1.63∙10-1
(2.92∙10-4)
6.64
(2.38∙10-2) 0.22 65.6
SB-MG5 70 100 1.63∙10-1
(2.92∙10-4)
8.30
(2.97∙10-2) 0.22 40.2
SB-MG6 40 20 9.32∙10-2
(1.70∙10-4)
0.95
(3.40∙10-3) 0.12 32.4
SB-MG7 40 80 9.32∙10-2
(1.70∙10-4)
3.80
(1.36∙10-4) 0.12 65.2
SB-MG8* 70 20 1.63∙10-1
(2.92∙10-4)
1.66
(5.94∙10-3) 0.22 0
* 200.00 mg, 0.44 mmol OH groups
** The reaction is performed analogous to the reactions SB-MG1 to SB-MG7 but with [2-
(methacryloylamino) ethyl]-dimethyl (3-sulfopropyl) ammonium hydroxide (sulfobetain-2) as
monomer.
1H-NMR (D2O):
δ (ppm) = 1.22-2.07 (m, 18H, H-2, H-5, H-7, H-14, H-16), 2.10-2.35 (m, 4H, H-21, H-22),
2.36-2.66 (m, 2H, H-1), 2.89-3.01 (m, 2H, H-3), 3.02-3.39 (m, 8H, H-19), 3.46-3.64 (m, 2H,
H-18), 3.68-3.87 (m, 7H, H-10, H-11-13), 4.04-4.54 (m, 4H, H-4, H-6, H-17).

103
Grafting-From Polymerization with Other Monomers Using MG-50-0.75-A.
In addition to the reactions mentioned above, several grafting-from polymerizations are
performed with the other monomers N-isopropyl acryl amide (samples N) and acryl nitrile
(samples A).
MG-50-0.75-A (200.00 mg, 0.44 mmol OH groups) is dispersed in H2O (11.4 mL) in a Schlenk
flask. Nitric acid (65%, 0.22 mL) is diluted with H2O (13 mL) and added slowly dropwise to
the dispersion. The mixture is frozen in liquid nitrogen, degassed in vacuum and thawed. The
entire process is repeated 3 times. Ceric ammonium nitrate (1.63∙10-1 g, 2.97∙10-4 mol
corresponding to 70% activation) is dissolved in H2O (1 mL), degassed for 10 minutes and
added to the reaction mixture. After 3 minutes of stirring, the monomer is added. The mixture
was stirred overnight and purified via dialysis for 3 days. After freeze-drying, the product is
obtained as a white to yellow powder. Table 5.5 lists the used amounts of chemicals for the
different samples.

104
Table 5.5. Amount of educts used in the redox polymerization of NIPAAM or acryl nitrile
using MG-50-0.75-A*.
Sample N
Amount of
monomer /
g (mol)
Gravimetric
Yield / %
N-MG1 20 0.67
(5.95∙10-3) 90.3
N-MG2 80 2.69
(2.38∙10-2) 74.7
A-MG1 20 0.32
(5.95∙10-3) 35.4
A-MG2 80 1.26
(2.38∙10-2) 65.9
* 200.00 mg, 0.44 mmol OH groups
Grafting-from polymerization with DEGA and sulfobetain-1 using MG-50-0.75-A
MG-50-0.75-A (200.00 mg, 0.44 mmol OH groups) is dispersed in H2O (11.4 mL) in a Schlenk
flask. Nitric acid (65%, 0.22 mL) is diluted with H2O (13 mL) and added slowly dropwise to
the dispersion. The whole mixture is frozen in liquid nitrogen, degassed in vacuum and thawed.
The entire process is repeated 3 times. Ceric ammonium nitrate (8.16∙10-2 g, 1.49∙10-4 mol;
corresponding to 35% activation) is dissolved in H2O (1 mL), degassed for 10 minutes and

105
added to the reaction mixture. After 3 minutes of stirring sulfobetain (0.83 g, 2.97∙10-3 mol
corresponding to a degree of polymerization N=20) is added. The mixture is stirred overnight
and purified via dialysis for 3 days. After freeze-drying, the intermediate product, which is
labeled as SD-MG1, is obtained as a white to yellow powder.
Afterwards, the intermediate product is redispersed in H2O (15 mL). Nitric acid (65%, 0.22 mL)
is added and the sample was frozen in liquid nitrogen. After degassing the sample and letting it
thaw, the process is repeated 3 times. Ceric ammonium nitrate (8.16∙10-2 g, 1.49∙10-4 mol
corresponding to 35% activation) is dissolved in H2O (1 mL), degassed for 10 minutes and
added to the reaction mixture. After 3 minutes of stirring DEGA (0.56 g, 2.97∙10-3 mol
corresponding to a degree of polymerization N=20 is added. The mixture was stirred overnight
and purified for 3 days by dialysis. After freeze-drying, the product SD-MG2 is obtained as a
white-yellow powder.
Esterification of Microgel MG-12-3.0-B with 2-bromo propionyl bromide; Synthesis of a
Multifunctional Macroinitiator
MG-VBA-12-3.0-B (1.00 g, 2.21 mmol OH groups) is dispersed in dichloromethane (75 mL).
Triethylamine (0.68 g, 6.63 mmol) is added and afterwards, 2-bromo-propionyl bromide (1.43
g, 6.63 mmol) is slowly added to the mixture. The reaction is stirred at room temperature
overnight. The sample is cleaned by first dialyzing it against ethanol and then against water for
3 days. The product is obtained as a white powder. The sample is referred to as MG-Br.
Gravimetric yield: 84.7%
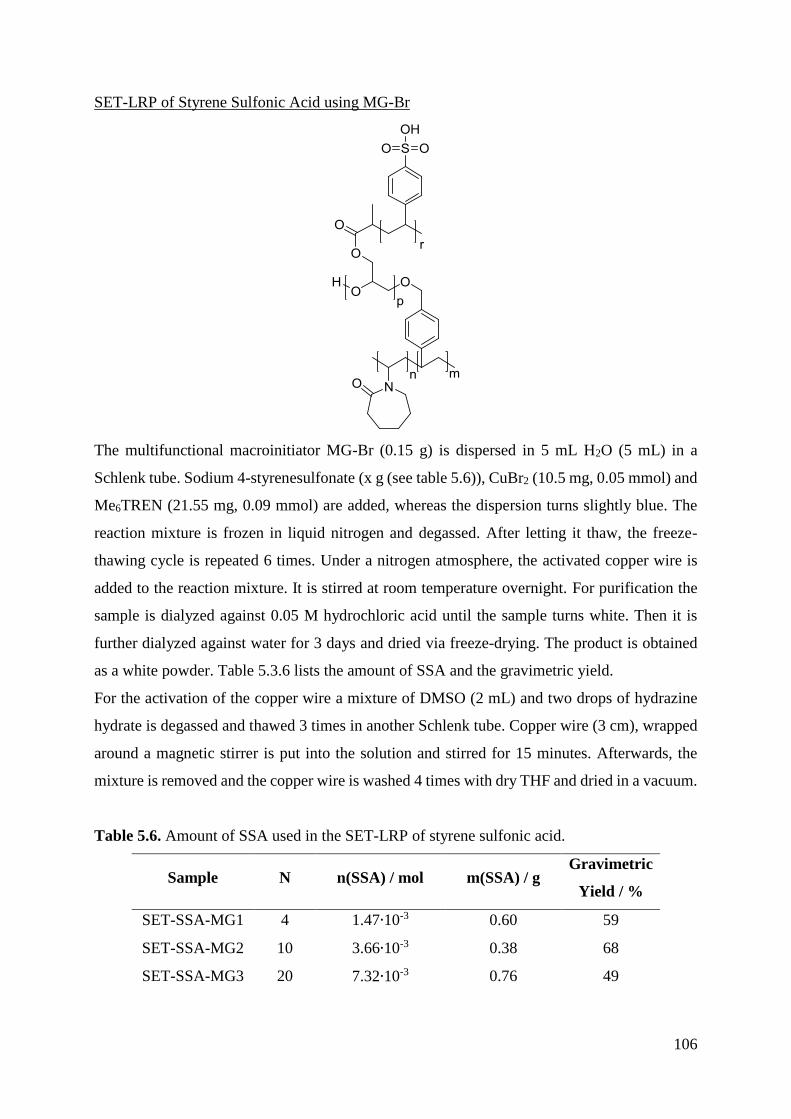
106
SET-LRP of Styrene Sulfonic Acid using MG-Br
The multifunctional macroinitiator MG-Br (0.15 g) is dispersed in 5 mL H2O (5 mL) in a
Schlenk tube. Sodium 4-styrenesulfonate (x g (see table 5.6)), CuBr2 (10.5 mg, 0.05 mmol) and
Me6TREN (21.55 mg, 0.09 mmol) are added, whereas the dispersion turns slightly blue. The
reaction mixture is frozen in liquid nitrogen and degassed. After letting it thaw, the freeze-
thawing cycle is repeated 6 times. Under a nitrogen atmosphere, the activated copper wire is
added to the reaction mixture. It is stirred at room temperature overnight. For purification the
sample is dialyzed against 0.05 M hydrochloric acid until the sample turns white. Then it is
further dialyzed against water for 3 days and dried via freeze-drying. The product is obtained
as a white powder. Table 5.3.6 lists the amount of SSA and the gravimetric yield.
For the activation of the copper wire a mixture of DMSO (2 mL) and two drops of hydrazine
hydrate is degassed and thawed 3 times in another Schlenk tube. Copper wire (3 cm), wrapped
around a magnetic stirrer is put into the solution and stirred for 15 minutes. Afterwards, the
mixture is removed and the copper wire is washed 4 times with dry THF and dried in a vacuum.
Table 5.6. Amount of SSA used in the SET-LRP of styrene sulfonic acid.
Sample N n(SSA) / mol m(SSA) / g Gravimetric
Yield / %
SET-SSA-MG1 4 1.47∙10-3 0.60 59
SET-SSA-MG2 10 3.66∙10-3 0.38 68
SET-SSA-MG3 20 7.32∙10-3 0.76 49
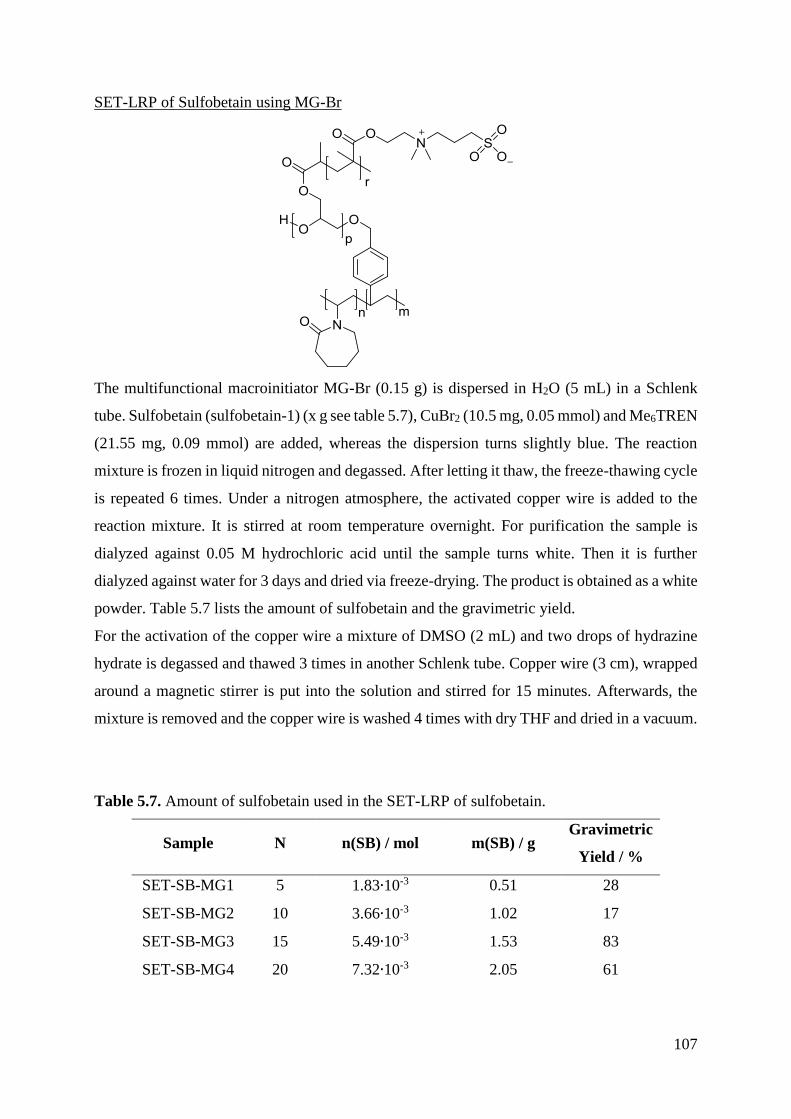
107
SET-LRP of Sulfobetain using MG-Br
The multifunctional macroinitiator MG-Br (0.15 g) is dispersed in H2O (5 mL) in a Schlenk
tube. Sulfobetain (sulfobetain-1) (x g see table 5.7), CuBr2 (10.5 mg, 0.05 mmol) and Me6TREN
(21.55 mg, 0.09 mmol) are added, whereas the dispersion turns slightly blue. The reaction
mixture is frozen in liquid nitrogen and degassed. After letting it thaw, the freeze-thawing cycle
is repeated 6 times. Under a nitrogen atmosphere, the activated copper wire is added to the
reaction mixture. It is stirred at room temperature overnight. For purification the sample is
dialyzed against 0.05 M hydrochloric acid until the sample turns white. Then it is further
dialyzed against water for 3 days and dried via freeze-drying. The product is obtained as a white
powder. Table 5.7 lists the amount of sulfobetain and the gravimetric yield.
For the activation of the copper wire a mixture of DMSO (2 mL) and two drops of hydrazine
hydrate is degassed and thawed 3 times in another Schlenk tube. Copper wire (3 cm), wrapped
around a magnetic stirrer is put into the solution and stirred for 15 minutes. Afterwards, the
mixture is removed and the copper wire is washed 4 times with dry THF and dried in a vacuum.
Table 5.7. Amount of sulfobetain used in the SET-LRP of sulfobetain.
Sample N n(SB) / mol m(SB) / g Gravimetric
Yield / %
SET-SB-MG1 5 1.83∙10-3 0.51 28
SET-SB-MG2 10 3.66∙10-3 1.02 17
SET-SB-MG3 15 5.49∙10-3 1.53 83
SET-SB-MG4 20 7.32∙10-3 2.05 61
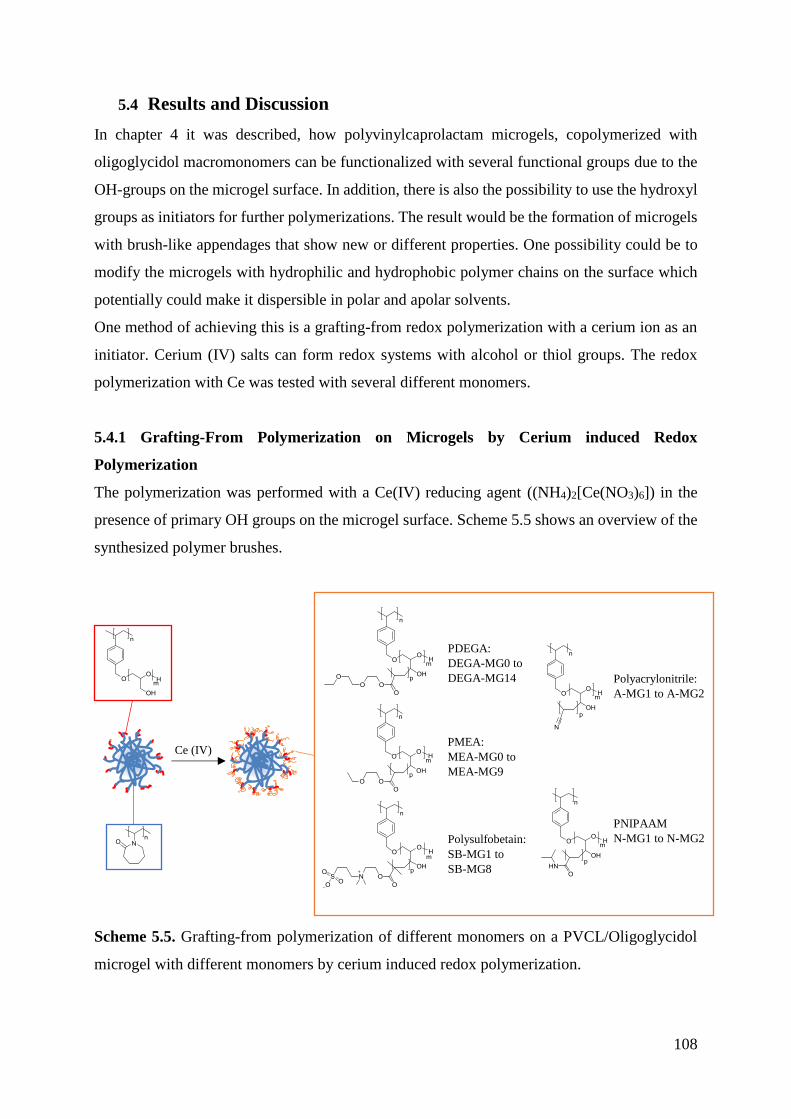
108
5.4 Results and Discussion
In chapter 4 it was described, how polyvinylcaprolactam microgels, copolymerized with
oligoglycidol macromonomers can be functionalized with several functional groups due to the
OH-groups on the microgel surface. In addition, there is also the possibility to use the hydroxyl
groups as initiators for further polymerizations. The result would be the formation of microgels
with brush-like appendages that show new or different properties. One possibility could be to
modify the microgels with hydrophilic and hydrophobic polymer chains on the surface which
potentially could make it dispersible in polar and apolar solvents.
One method of achieving this is a grafting-from redox polymerization with a cerium ion as an
initiator. Cerium (IV) salts can form redox systems with alcohol or thiol groups. The redox
polymerization with Ce was tested with several different monomers.
5.4.1 Grafting-From Polymerization on Microgels by Cerium induced Redox
Polymerization
The polymerization was performed with a Ce(IV) reducing agent ((NH4)2[Ce(NO3)6]) in the
presence of primary OH groups on the microgel surface. Scheme 5.5 shows an overview of the
synthesized polymer brushes.
Scheme 5.5. Grafting-from polymerization of different monomers on a PVCL/Oligoglycidol
microgel with different monomers by cerium induced redox polymerization.
PDEGA:
DEGA-MG0 to
DEGA-MG14
PMEA:
MEA-MG0 to
MEA-MG9
Polysulfobetain:
SB-MG1 to
SB-MG8
PNIPAAM
N-MG1 to N-MG2
Polyacrylonitrile:
A-MG1 to A-MG2
Ce (IV)

109
Functionalization of Microgels with Diethyleneglycol acrylate by Redox Poly-
merization[1]
Diethylene glycol acrylate is a water-soluble monomer. Different reactions were performed,
where the number of theoretical active sites and the number of theoretical repeating units was
varied. The analysis of the resulting products was done by Raman spectroscopy. Figure 5.2
shows Raman spectra of the unmodified microgel MG-50-0.5-A in comparison with the
modified sample DEGA-MG1.
Figure 5.2. Raman spectra of PDEGA and microgel before and after functionalization.
For the modified sample, there is a peak visible at 1730 cm-1, which corresponds to the ester
group of the DEGA repeating unit. The grafting-from polymerization is successful. To calculate
the exact amounts of the incorporated DEGA a calibration curve was prepared, by mixing the
sample MG-50-0.5-A with different amounts of the pure PDEGA. The mixture was analyzed
by Raman spectroscopy and the ratio of the intensity between the ester and the amide group
was plotted against the amount of substance ratio of both components. The curve is shown in
figure 5.3.
0
0,1
0,2
0,3
0,4
0,5
0,6
0,7
0,8
0,9
1
500100015002000250030003500
Inte
nsi
ty
Wave number / cm-1
MG-50-0.5-A
pure PDEGA
DEGA-MG1
1730 cm-1

110
Figure 5.3. Molar ester/amide ration in a mixture of MG-50-0.5-A and PDEG against the
intensity ratio.
The formula for the slope of the curve is given as
𝑛(𝐸𝑠𝑡𝑒𝑟)
𝑛(𝐴𝑚𝑖𝑑)= 0.930 ∗
𝐼(𝐸𝑠𝑡𝑒𝑟)
𝐼(𝐴𝑚𝑖𝑑) + 0.046.
With these results, the ratio of the intensity can be inserted and the actual amount of DEGA
groups relative to the VCL can be calculated and compared to the theoretical amount of DEGA.
Table 5.8 gives an overview for the different DEGA microgel samples.
y = 0,93x + 0,0458
0
0,5
1
1,5
2
2,5
3
3,5
4
4,5
0 1 2 3 4 5
n(E
ster)/
n(A
mid
e)
I(Ester)/I(Amide)
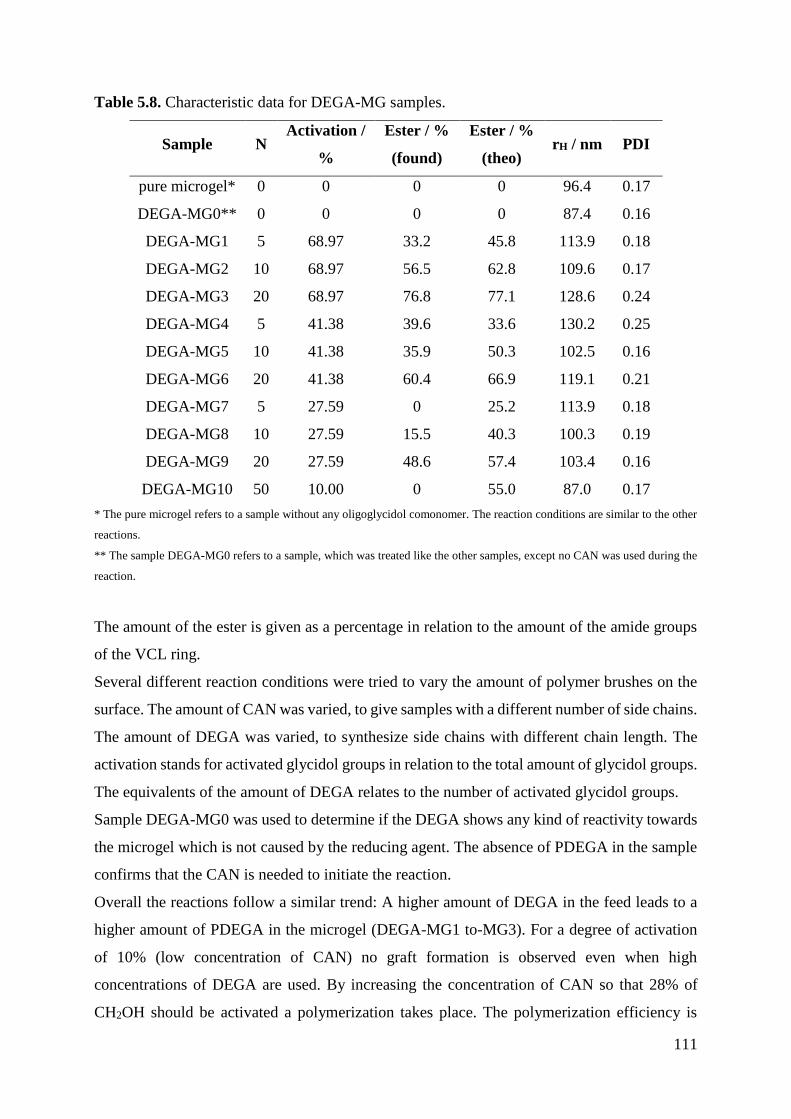
111
Table 5.8. Characteristic data for DEGA-MG samples.
Sample N Activation /
%
Ester / %
(found)
Ester / %
(theo) rH / nm PDI
pure microgel* 0 0 0 0 96.4 0.17
DEGA-MG0** 0 0 0 0 87.4 0.16
DEGA-MG1 5 68.97 33.2 45.8 113.9 0.18
DEGA-MG2 10 68.97 56.5 62.8 109.6 0.17
DEGA-MG3 20 68.97 76.8 77.1 128.6 0.24
DEGA-MG4 5 41.38 39.6 33.6 130.2 0.25
DEGA-MG5 10 41.38 35.9 50.3 102.5 0.16
DEGA-MG6 20 41.38 60.4 66.9 119.1 0.21
DEGA-MG7 5 27.59 0 25.2 113.9 0.18
DEGA-MG8 10 27.59 15.5 40.3 100.3 0.19
DEGA-MG9 20 27.59 48.6 57.4 103.4 0.16
DEGA-MG10 50 10.00 0 55.0 87.0 0.17
* The pure microgel refers to a sample without any oligoglycidol comonomer. The reaction conditions are similar to the other
reactions.
** The sample DEGA-MG0 refers to a sample, which was treated like the other samples, except no CAN was used during the
reaction.
The amount of the ester is given as a percentage in relation to the amount of the amide groups
of the VCL ring.
Several different reaction conditions were tried to vary the amount of polymer brushes on the
surface. The amount of CAN was varied, to give samples with a different number of side chains.
The amount of DEGA was varied, to synthesize side chains with different chain length. The
activation stands for activated glycidol groups in relation to the total amount of glycidol groups.
The equivalents of the amount of DEGA relates to the number of activated glycidol groups.
Sample DEGA-MG0 was used to determine if the DEGA shows any kind of reactivity towards
the microgel which is not caused by the reducing agent. The absence of PDEGA in the sample
confirms that the CAN is needed to initiate the reaction.
Overall the reactions follow a similar trend: A higher amount of DEGA in the feed leads to a
higher amount of PDEGA in the microgel (DEGA-MG1 to-MG3). For a degree of activation
of 10% (low concentration of CAN) no graft formation is observed even when high
concentrations of DEGA are used. By increasing the concentration of CAN so that 28% of
CH2OH should be activated a polymerization takes place. The polymerization efficiency is

112
dependent on the monomer concentration. By increasing the amount of DEGA the monomer
conversion increases (Samples DEGA-MG7, -8, -9). There are probably some side reactions,
like a reaction of CeIV with oxygen residue or some unforeseen reaction with the microgel or
impurities in the monomer, which can all lead to a decrease in the reaction efficiency. With
higher concentration of the Cerium or the DEGA, this side reaction become less significant. In
summary it can be said, that a higher degree of activation and a higher amount of monomer
leads to a higher monomer conversion.
The hydrodynamic radii of the samples were measured via dynamic light scattering. After the
treatment with the nitric acid, the microgel size slightly decreases (DEGA-MG0). After the
reaction, every sample except sample 10 has increased in size by 10 to 30 nm, while the PDI is
still low. It is assumed, that the size increase is due to the grafting of the PDEGA chains to the
microgel surface. Due to the relatively low number of repeating units per active center, the
increase in size should be negligible. The length of a C-C bond is 154 picometers which means
that samples with the highest amount of PDEGA (DEGA-MG3; DEGA-MG6: DEGA-MG9)
should merely show an increase in the radius of 6 nm. [43] But all samples show a higher increase
in the size. It is assumed that the microgels are poorly crosslinked in the shell which is not
properly detected during the DLS measurements. By adding the PDEGA side chains, the shell
becomes dense and can be detected better. This increase does not seem to follow any trend,
since samples with a higher amount of PDEGA do not show a larger microgel size. But it is
shown, that samples with the same number of repeating units become bigger with a higher
degree of activation.
The hydrodynamic radius of the modified microgels was measured dependent on the
temperature (figure 5.4).

113
Figure 5.4. Temperature sensitivity of microgels. Hydrodynamic radius in dependence of the
temperature before and after the modification with PDEGA.
Both samples show a comparable behavior in terms of temperature sensitivity.
Variation of the synthesis temperature
All polymerization reactions were performed at room temperature. In addition, several reactions
were performed at higher temperatures to analyze the influence on the conversion. The
conditions of sample DEGA-MG6 were chosen, but at 40 and 50°C. Table 5.9 shows the results.
Table 5.9. Results of the polymerization of PDEGA at different temperatures.
Sample Ester / %
(found)
Ester / %
(theo) rH / nm PDI
Gravimetric
yield / %
DEGA-MG6 60.4 66.9 119.1 0.212 72
DEGA-6-MG40°C 57.1 66.9 70.1 0.201 63
DEGA-6-MG50°C 62.2 66.9 1086 0.964 78
The reaction yield and the amount of ester in the sample don´t differ significantly from each
other. A higher temperature does not seem to influence the efficiency of the reaction. But the
hydrodynamic radii differ strongly. At a reaction temperature of 40°C, the size is actually
smaller than sample DEGA-MG6, which is synthesized at room temperature while at 50°C the
resulting microgels have an average size of 1 µm and a very high PDI. When the nanogels are
getting heated above the VPTT, they start to collapse. In addition, they also have a higher
tendency to aggregate, since the attracting van-der-Waals interactions are getting stronger.
0
20
40
60
80
100
120
140
15 25 35 45 55
rH
/ n
m
T / °C
MG-50-0.5-A
DEGA-MG-6

114
When the polymerization of the PDEGA chains starts, the microgel aggregates and it is
possible, that the polymerization leads to entanglements between singular particles. When the
temperature gets lowered below the VPTT; the particles cannot separate from each other,
because they are now physically connected to each other and the have formed large, hairy non-
spherical aggregates. The elevation of the temperature does not show any improvement so all
reactions were performed at room temperature.
Reaction at room temperature with a continuous monomer addition
Usually, the monomer is added to the reaction in a very short time. The addition time was
varied, to test if a continuous addition of the monomer leads to a more evenly distribution of
the PDEGA chains. The monomer was dissolved in water and slowly added to the activated
microgel dispersion with a syringe pump. The rate of addition is chosen as 0.5 mL per hour.
Table 5.10 shows the results.
Table 5.10. Results of the polymerization of PDEGA with different monomer addition
mechanisms.
Sample Ester / %
(found)
Ester / %
(theo)
rH /
nm PDI
Gravimetric
yield / %
DEGA-MG6 60.4 66.9 119.1 0.212 72
DEGA-MG6-
syringe pump 54.9 66.9 152.4 0.211 63
The results show a lower ester content in the sample and a lower yield, while the hydrodynamic
radius slightly increases. Since this is not a living polymerization, the termination reaction
increases with time, which leads to a decrease in the yield. So this method was not further
explored.
Reaction at room temperature using MG-50-0.25-A.
Another microgel, with a lower content of VBA-50 was also used in the polymerization, to
determine the influence of the amount of the available alkyl alcohol groups. For this, a microgel
sample with an amount of 0.25 mol% VBA-50 was used. Different amounts of CAN and DEGA
were used. The results are shown in table 5.11.

115
Table 5.11. Results of the polymerization of PDEGA with the microgel MG-50-0.25-A.
Sample N Activation /
%
Ester / %
(found)
Ester / %
(theo) rH / nm PDI
Gravimetric
yield / %
pure
microgel 0 0 0 0 178.51 0.097 /
DEGA-
MG11 10 68.97 32.1 45.3 125.5 0.401 53.6
DEGA-
MG12 20 68.97 6.1 62.4 186.7 0.380 3.1
DEGA-
MG13 10 41.38 24.7 33.2 157.2 0.377 61.1
DEGA-
MG14 20 41.38 12.3 49.8 153.0 0.371 12.4
Independent of the degree of activation, a high amount of DEGA leads to a very low yield in
the polymerization. Since there is now a lower number of active radicals in the mixture, the
influence of side reactions is stronger. It is assumed, that a high concentration of DEGA leads
to side reactions, which deactivate the active sites, without binding the DEGA to the microgel
surface.
With an increasing ester content, the hydrodynamic radius decreases. Because of the lower
amount of VBA-50, the size is bigger than the MG-50-0.5-A sample. Since PDEGA is more
hydrophobic, the functionalized microgel is more hydrophobic and it ejects more water, which
leads to shrinkage. This effect should in theory also be visible in samples with the higher VBA-
50 amount. At high amounts however, the overall swelling degree is lower, which is also caused
by a concentration of the crosslinker in the microgel core. So the change in hydrophilicity
caused by the PDEGA is less effective.
Functionalization of Microgels with 2-Methoxy Ethyl Acrylate by Redox Poly-
merization [1]
In addition to the modification with DEGA, samples were also polymerized with 2-methoxy
ethyl acrylate (MEA). The analysis of these microgels was also done by Raman spectroscopy
which is shown for one sample in figure 5.5.

116
Figure 5.5. Raman spectra of PMEA and microgel before and after functionalization.
A peak at 1730 cm-1 is visible for the modified sample which corresponds to the ester group of
the MEA molecule. The grafting-from polymerization is successful. Similar to DEGA, a
calibration curve was recorded. It is shown in figure 5.6.
Figure 5.6. Molar ester/amide ration in a PVCL/PMEA mixture against the intensity ratio.
The formula for the slope of the curve is given as
𝑛(𝐸𝑠𝑡𝑒𝑟)
𝑛(𝐴𝑚𝑖𝑑)= 0.907 ∗
𝐼(𝐸𝑠𝑡𝑒𝑟)
𝐼(𝐴𝑚𝑖𝑑) + 0.054.
With this, the ester content and the yield of the polymerization could be determined. In addition,
the hydrodynamic radius was measured for every sample. Table 5.12 gives an overview over
the obtained results
0,00
0,20
0,40
0,60
0,80
1,00
500100015002000250030003500
Inte
nsi
ty
Wave number / cm-1
MG-50-0.5-A
pure PMEA
MEA-MG1
0
0,5
1
1,5
2
2,5
3
3,5
4
0 1 2 3 4 5
n(E
ster)/
n(A
mid
e)
I(Ester)/I(Amide)
1730 cm-1

117
Table 5.12. Results from the polymerization with MEA.
N Activation /
%
Ester /
% (found)
Ester /
% (theo)
rH / nm PDI
pure
microgel*
0 0 0 0 96.4 0.17
MEA-MG0** 20 0 0 0 87.4 0.16
MEA-MG1 5 68.97 32.3 45.8 155.3 0.25
MEA-MG2 10 68.97 15.6 62.8 92.2 0.18
MEA-MG3 20 68.97 73.6 77.1 93.0 0.13
MEA-MG4 5 41.38 14.1 33.6 95.4 0.18
MEA-MG5 10 41.38 64.6 50.3 108.6 0.14
MEA-MG6 20 41.38 39.6 66.9 100.5 0.16
MEA-MG7 5 27.59 12.3 25.2 93.3 0.18
MEA-MG8 10 27.59 0 40.3 88.4 0.15
MEA-MG9 20 27.59 51.9 57.4 100.0 0.12
* The pure microgel refers to a sample without any oligoglycidol comonomer. The reaction conditions are similar to the other
reactions.
** The sample MEA-MG0 refers to a sample, which was treated like the other samples, except no CAN was used during the
reaction.
Contrary to the DEGA samples, there is no clear trend visible. Especially the sample with 10
repeating units deviate strongly from the theoretical values. But it is evident, that the
functionalization with PMEA chains is successful. Apart from sample MEA-MG1 where
possibly some aggregation has taken place, the hydrodynamic radius shows only minor
changes. If the radius is correlated with the amount of ester in the sample it becomes apparent,
that the hydrodynamic radius slowly increases with increasing ester content.
The impact of the PMEA on the size is less pronounced as with PDEGA. Because MEA is
shorter than DEGA the shell is now less dense and the impact on the DLS measurements is
smaller. It can be assumed that different amounts of PMEA can be introduced on the surface of
the microgel without a substantial change in the size or dispersity.
Functionalization of Microgels with Sulfobetain by Redox Polymerization [2]
The grafting-from polymerization was studied with sulfobetain as a monomer too. In this case,
the degree of activation was mainly 70%. Sulfobetain is a molecule which among other
properties is resistant to an unspecific protein absorption. The idea behind this is to realize

118
microgels in which the sulfobetain is only located in the shell, where the repellant properties
are more useful if the microgel is to be used as a coating.
Analysis of the samples was done by 1H-NMR- and Raman spectroscopy. Figure 5.7 shows the
NMR spectrum.
Figure 5.7. 1H-NMR-spectrum of sample SB-MG2.
According to the NMR-spectrum, the sample contains a high amount of sulfobetain. Especially
the signal at 2.92 ppm is characteristic for the sulfobetain since it is assigned to the CH3-groups
bound to the nitrogen atom. A further analysis of the microgel via NMR is difficult. The
sulfobetain and the PVCL signals overlap. Because of the high amount of sulfobetain the PVCL
signals are very weak but are still visible, especially at 4.19 ppm. This peak is mainly assigned
to the proton next to the nitrogen atom of the VCL.
There is a possibility that the sulfobetain did not react with the glycidol groups and is merely
adsorbed into the microgel. But in that case the NMR would show signals corresponding to the
C-C double bond of the monomer at a chemical shift of 5.5 to 6.0 ppm, which is not the case.
To test this theory, a polymerization was done with a pure PVCL microgel, without the
oligoglycidol-macromonomer. Figure 5.8 shows the 1H-NMR spectrum of this sample. In this
case, the sample was not cleaned via dialysis.
ppm (t1)1.02.03.04.05.0
4.4
53
4.1
98
3.5
03
3.3
01
2.9
25
2.6
72
2.1
55
1.9
69
1.6
78
1.3
90
0.8
19
0.6
93
1.0
0
2.1
7
4.1
5
1.6
1
0.6
7
2.2
3
1.4
9

119
Figure 5.8. 1H-NMR-spectrum of a pure PVCL microgel after the redox polymerization with
SB.
In this spectrum, the signals for the double bonds at a chemical shift of 5.69 and 6.07 ppm are
clearly visible. Afterwards the sample was cleaned via dialysis where it was found that all the
sulfobetain has been washed out. The polymerization was not successful. The oligoglycidol
component is therefore essential to induce this kind of polymerization and the sulfobetain is
covalently bound to the microgel after the successful polymerization.
Because of the overlap of the NMR signals, the samples were further analyzed via Raman
spectroscopy to quantify the amount of sulfobetain present in the microgels. Figure 5.9 shows
the Raman spectrum of a microgel before and after the functionalization with sulfobetain.
Figure 5.9. Raman spectra of a microgel before and after the SET-LRP with SB.
ppm (t1)1.02.03.04.05.06.0
6.0
73
5.6
92
4.7
01
4.5
55
4.4
51
3.9
63
3.7
48
3.5
19
3.1
77
3.1
33
2.8
88
2.2
03
1.8
53
1.0
83
0.9
43
3.0
0
3.1
6
2.1
5
3.0
6
8.4
9
0.2
5
2.9
7
3.3
6
2.3
0
0.3
2
0.3
2
0
0,1
0,2
0,3
0,4
0,5
0,6
0,7
0,8
0,9
1
500100015002000250030003500
Inte
nsi
ty
Wave number / cm-1
MG-50-0.75-A
SB-MG4
1728 cm-1
1036 cm-1

120
Noticeable are the two new signals at 1036 cm-1, which is caused by the ester group in the
sulfobetain and at 1728 cm-1, which is caused by the SO3- group. The Raman spectra confirm
the presence of the polysulfobetain and the PVCL. For quantification, a calibration curve was
prepared by mixing fixed amounts of the sulfobetain monomer and a pure PVCL microgel. This
mixture was measured by Raman spectroscopy and the signal intensity of the ester signal of the
sulfobetain and the amide signal of the PVCL was compared. [44] The VBA-50 would have no
discernible effect on those two signals and is therefore negligible. The curve is shown in figure
5.10.
Figure 5.10. Molar ester/amide ratio in a PVCL/PSB mixture against the intensity ratio.
The formula for the slope of the curve is given as
𝑛(𝐴𝑚𝑖𝑑𝑒)
𝑛(𝐸𝑠𝑡𝑒𝑟)= 0.839
𝐼(𝐴𝑚𝑖𝑑𝑒)
𝐼(𝐸𝑠𝑡𝑒𝑟)+ 0.0179
The size of the microgels was also measured via DLS. All results for the samples are now shown
in table 5.13.
0
2
4
6
8
10
12
14
16
18
20
0,00 5,00 10,00 15,00 20,00 25,00
n(A
mid
e)/
n(E
ster)
I(Amide)/I(Ester)

121
Table 5.13. Results of the grafting from redox polymerization with sulfobetain.
Sample N Ester / %
(found)
Ester / %
(theo) rH / nm PDI Gravimetric
Yield / %
pure
microgel 0 0 0 68.5 0.28 /
SB-MG1 20 68 82 72.09 0.40 39.3
SB-MG2 30 66 87 74.93 0.38 28.0
SB-MG3 50 73 92 85.11 0.44 22.2
SB-MG4 80 67 95 76.08 0.43 65.6
SB-MG5 100 77 96 73.08 0.45 40.2
The experimentally determined amount of ester is always lower, than the theoretical amount.
The highest possible amount is around 77%. As can be seen in table 5.13, the sulfobetain content
is relatively equal for all samples at around 70 to 80% regardless of the amount of used
monomer. This suggests, that there is an upper limit of how much sulfobetain can be grafted
onto the microgel. It might be, that the increasing amount of charges on the surface repels the
remaining monomers at some point, so that no additional sulfobetain molecule can be added.
All samples show a slight increase in the hydrodynamic radius. But this increase is between 4
and 17 nm which is negligible. The dispersity also increases. Presumably, the grafting process
was successful and the added chains now influence the microgel size. It is possible that the high
number of active sites can lead to a higher number of recombination reactions. In addition the
sulfobetain tends to form ionic bonds with each other. Thus it is possible that the PSB chains
on the surface tend to form bonds with each other or even with PSB chains from other particles,
which leads to aggregation. Because of the ionic nature of the polymer it is also possible that
some ionic cerium salts are still inside the sample which also contribute to a higher PDI. The
amount of sulfobetain on the surface does not seem to be correlating with the increase of the
dispersity. The temperature sensitivity of the samples was measured but no discernible trend
could be shown.
A sample was also analyzed via transmission electron microscopy (figure 5.11).

122
Figure 5.11. TEM image of sample SB-MG2.
Contrary to the samples of pure microgel (as seen in chapter 3), the analyzed microgels show a
good contrast because of the high concentration of polymers that is now grafted onto the
surface.
The gravimetric yield is rather low and does not correlate with the number of repeating units.
It ranges from 22 to 65%.
It is possible, that the high number of active sites leads to a low yield, which is why the reaction
was repeated with a lower degree of activation (40%). Table 5.14 shows the synthesized
samples.
Table 5.14. Results of the redox polymerization with sulfobetain with different amounts of
sulfobetain. Degree of activation: 40%.
Sample N Ester / %
(found)
Ester / %
(theo) rH / nm PDI
Gravimetric
yield / %
pure
microgel 0 0 0 68.50 0.28 /
SB-MG6 20 72 72 92.63 0.42 32.4
SB-MG7 80 81 91 175.42 0.50 65.2
Raman spectra show, that the functionalization was successful. Comparing the gravimetric
yield with the yield at higher degrees of activation, it can be seen, that the same number of
repeating units leads to a comparable conversion in both samples. This shows, that the number
of active sites does not influence the effectiveness of the reaction. But a stronger increase in the
hydrodynamic radius is visible. This is probable due to aggregation.

123
The redox polymerization does not seem to be usable on every kind of sulfobetain. A reaction
with [3-(methacryloyl amino) propyl]-dimethyl (3-sulfopropyl) ammonium hydroxide was
performed. Figure 5.12 shows the different sulfobetains.
Figure 5.12. Sulfobetain used in the samples SB-MG1-7 (left) and SB-MG8 (right).
Instead of an ester group, this molecule contains an amide group. The product was analyzed by
1H-NMR spectroscopy and showed no traces of the sulfobetain. Additionally the gravimetric
yield was around 0% which proves, that no reaction has taken place. This sulfobetain contains
an amide group. It is possible, that this group somehow suppresses the polymerization and
makes it unfavorable for the methacrylate group, to bind to the microgel.
Functionalization of Microgels with N-Isopropylacrylamide by Redox Polymerization
Two reactions with NIPAAm as a monomer were carried out. One with 20 equivalents and one
with 80 equivalents of monomer in relation to the amount of active sites. The analysis was done
via 1H-NMR spectroscopy. Figure 5.13 shows a spectrum for the sample N-MG2.
Figure 5.13. 1H-NMR spectrum of sample N-MG2.
ppm (t1)1.02.03.04.05.0
4.7
01
4.2
00
3.8
09
3.7
97
3.6
36
3.5
64
3.2
02
2.4
20
2.2
25
1.9
16
1.4
86
1.0
51
1.0
0
5.4
9
1.7
7
2.3
5
4.8
4
12.3
8
22.9
3

124
The signals at 1.05, 1.49, 1.92 and 3.81 ppm can be assigned to the PNIPAAM polymer, while
the signals at 2.22 and 2.42, 3.20 and 4.20 ppm belong to the PVCL microgel. The signal at
3.64 ppm is assigned to the oligoglycidol comonomer. The signals of the PVCL are weak in
comparison to the PNIPAAM because of the excess of the grafted polymer. There is no trace
of signals indicating the presence of vinyl groups which means that the NIPAM was
polymerized and is successfully grafted to the microgel as it would have been washed out during
the dialysis otherwise.
In addition, the hydrodynamic radii were measured. The results are shown in table 5.15.
Table 5.15. Hydrodynamic radius of the samples functionalized with NIPAAM.
Sample Repeating units rH / nm PDI
Pure microgel / 70.57 0.24
N-MG1 20 67.72 0.48
N-MG2 80 148.9 0.53
Sample N-1 shows negligible changes in the size. But the radius of sample N-2 is twice as big
as the original sample. This is in contrast to the hydrodynamic radius of the microgels, which
were modified with other monomers. It is possible, that this increase is due to the special nature
of the NIPAAm. When it polymerizes, it has a tendency for crosslinking. This means instead
of single brushes, which are formed with the other monomers, the NIPAAm forms a more shell
like structure. The dispersity increases, which might be a direct result of the self-crosslinking.
Functionalization of Microgels with Acrylonitrile by Redox Polymerization
Acrylonitrile sets itself apart from the other monomers used in the redox polymerization.
Acrylonitrile is soluble in water, while the corresponding polymer is not. It was used to test the
possibility of grafting hydrophobic polymers to the microgel surface.
It was shown, that during the reaction, the resulting product was insoluble and indispersable in
water, which is a clear indication that polyacrylonitrile has been formed. The product cannot be
analyzed via NMR spectroscopy, since it can no longer be dissolved or dispersed in any NMR
solvent. For analysis, a Raman spectrum of the samples was measured. Figure 5.14 shows the
Raman spectrum of sample A-MG2.

125
Figure 5.14. Raman spectra of a microgel before and after the redox polymerization with
Acrylonitrile.
At 2917 cm-1, there is a peak of high intensity visible, which is not shown in Raman spectra of
unmodified microgels. This peak can be assigned to the nitrile group of the acrylonitrile. It was
verified, that the polyacrylonitrile is bound to the microgel. The monomer has already been
washed out via dialysis in water. After that, the sample was dispersed in dimethyl formamide
and further dialyzed against DMF. The polymer is soluble in this solvent and should be washed
out, if it is not covalently bound to the microgel. After dialysis, the DMF was evaporated and
the residue was weighed, to check if any polymer has been washed out. No residue was found,
which means that the polymer is indeed bound to the microgel. In summary, it can be shown,
that in addition to hydrophilic polymers, also hydrophobic polymers can be grafted to the
microgel.
Functionalization of Microgels with DEGA and Sulfobetain by Redox Polymerization
The cerium induced polymerization can be used to functionalize the same microgel sample with
different polymers. If a CAN concentration is chosen which is sufficiently low then some
alcohol groups of the oligoglycidol macromonomer are not activated. After monomer A is
grafted on the microgel a second redox polymerization can be induced with monomer B with
the result that two varieties of polymer, each one consisting of a different repeating unit are
now located on the surface as is shown in scheme 5.6.
0
0,2
0,4
0,6
0,8
1
1,2
1,4
1,6
1,8
500100015002000250030003500
Inte
nsi
ty
Wave number / cm-1
A-MG1
A-MG2
2917 cm-1
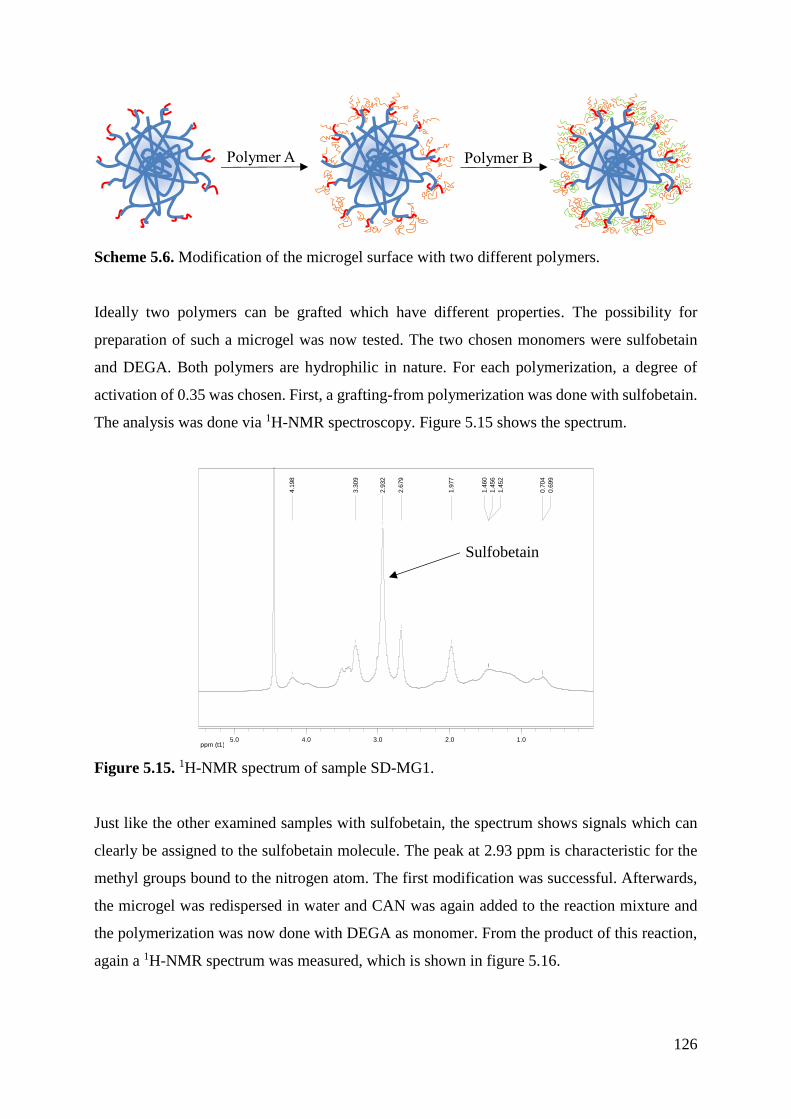
126
Scheme 5.6. Modification of the microgel surface with two different polymers.
Ideally two polymers can be grafted which have different properties. The possibility for
preparation of such a microgel was now tested. The two chosen monomers were sulfobetain
and DEGA. Both polymers are hydrophilic in nature. For each polymerization, a degree of
activation of 0.35 was chosen. First, a grafting-from polymerization was done with sulfobetain.
The analysis was done via 1H-NMR spectroscopy. Figure 5.15 shows the spectrum.
Figure 5.15. 1H-NMR spectrum of sample SD-MG1.
Just like the other examined samples with sulfobetain, the spectrum shows signals which can
clearly be assigned to the sulfobetain molecule. The peak at 2.93 ppm is characteristic for the
methyl groups bound to the nitrogen atom. The first modification was successful. Afterwards,
the microgel was redispersed in water and CAN was again added to the reaction mixture and
the polymerization was now done with DEGA as monomer. From the product of this reaction,
again a 1H-NMR spectrum was measured, which is shown in figure 5.16.
ppm (t1)1.02.03.04.05.0
4.1
98
3.3
09
2.9
32
2.6
79
1.9
77
1.4
60
1.4
56
1.4
52
0.7
04
0.6
99
Polymer A Polymer B
Sulfobetain

127
Figure 5.16. 1H-NMR-spectrum of sample SD-MG2.
The signals at 0.60 to 1.00 ppm can be assigned to the alkyl group of the sulfobetain and the
DEGA. The signals at 3.30 and 3.93 to 4.20 ppm can be assigned to the CH2-groups of the
DEGA. The characteristic SB signal at 2.92 ppm is still visible in the spectrum. Signals from
sulfobetain and DEGA are visible in the spectrum, which confirms the hypothesis, that the
grafting-from redox polymerization can be successfully performed by sequential addition of
CAN/monomer 1 and CAN/monomer 2. The hydrodynamic radius of the sample was measured
before the reaction, after the polymerization with sulfobetain and after the reaction with DEGA.
They are listed in table 5.16.
Table 5.16. Hydrodynamic radii of the samples labeled SD.
Sample rH / nm PDI
Unmodified microgel 70.57 0.24
SD-MG1 137.3 0.49
SD-MG2 108.4 0.31
After the first modification, the radius nearly doubles in size and the PDI increases. This is
likely due to some aggregation of the microgel, attributed to the sulfobetain groups. After the
second modification, the microgel size decreases again, along with the PDI. There are several
possible explanations. Due to the redispersion process and the reaction, aggregated microgels
could be separated again. Additionally it is possible that the first polymerization with
sulfobetain is distributed uneven on the microgel shell. The reaction with DEGA leads to a more
ppm (t1)0.01.02.03.04.05.0
4.4
56
4.1
98
4.1
95
3.9
38
3.2
97
2.9
32
2.6
78
1.9
73
1.6
67
0.8
58
Sulfobetain
DEGA

128
evenly modification of the surface. It could also be, that the grafting of PDEGA somehow
disturbs the ionic bonds between the SB molecules so that the aggregation of the particles which
is due to the bonds developed by the SB is reduced.
In conclusion it can be said that the grafting-from redox polymerization with a cerium salt as a
reducing agent is possible with different monomers. There is only slight change in the size of
the microgels but the dispersity increases. Successful grafting-from polymerization was
achieved with DEGA, MEA, sulfobetain, NIPAAM and acrylonitrile, while experiments with
styrene sulfonic acid and N-vinylimidazole were not successful.
5.4.2 Grafting-from Single-Electron-Transfer Polymerization
Several cases of the cerium induced polymerization show, that not every monomer can be
polymerized and grafted to microgels in water as a solvent Styrene Sulfonic acid for example
could not be grafted from the surface by cerium induced redox polymerization. So an alternative
method was employed: The single-electron-transfer living radical polymerization (SET-LRP).
It can be used with a variety of different monomers. Before the SET-LRP can take place, the
microgel has to be functionalized with an initiating group like a α-bromo-propionyl group
(scheme 5.7).
Scheme 5.7. Grafting-from polymerization of different monomers on a PVCL/oligoglycidol
microgel with different monomers by SET-LRP.
In contrast to the cerium induced polymerization, the SET-LRP cannot be controlled in regard
to the number of grafted polymer chains. The amount of cerium used correlates with the number
Polysulfobetain: SET-SB-MG1 to SET-SB-MG4
Polystyrene sulfonic acid: SET-SSA-MG1 to SET-SSA-MG3
SET-LRP

129
of active radicals, while during the SET-LRP every initiator group bound to the microgel is a
possible site for a side chain. To control the number of active sites, the number of initiating
groups introduced into the colloidal system has to be controlled.
Initiating groups are introduced via esterification of the hydroxyl groups on the surface of
PVCL/oligoglycidol microgels with 2-bromo propionyl bromide (scheme 5.8).
Scheme 5.8. Esterification of an OH-group with 2-bromopropionylbromide.
The carbonyl bromide readily reacts with the OH-group. The triethylamine is used to bind the
freed HBr molecules. The product is more hydrophobic than the unfunctionalized microgel and
partly precipitates during the dialysis. The analysis was done via Raman spectroscopy (figure
5.17).
Figure 5.17. Raman spectrum of a microgel modified with 2-bromopropionylbromide (used
microgel: MG-12-3.0-B).
At 1750 cm-1, there is now a small peak visible, which corresponds to the ester group, which is
formed during esterification. It is assumed that because of the ease of the reaction, the
conversion of the hydroxyl groups is 100%. The size of the microgels was analyzed and is
shown in table 5.17.
0
0,1
0,2
0,3
0,4
0,5
0,6
0,7
0,8
0,9
1
500100015002000250030003500
Inte
nsi
ty
Wave number / cm-1
1750 cm-1

130
Table 5.17. Hydrodynamic radius before and after the functionalization with isopropyl
bromide.
Sample rH / nm PDI
MG-12-3.0-B 121.96 0.26
MG-Br 67.48 0.49
After functionalization, the hydrodynamic radius decreases, while the dispersity increases. It is
assumed, that because of the increased hydrophobicity, the microgel expels more water and
shrinks. The dispersity increases because the hydroxyl and after functionalization the initiating
α-bromo-propionyl groups are unevenly distributed on the microgel surface. In addition the
dispersion in several different solvents and the drying process lead to aggregation.
Functionalization of Microgels with Styrene Sulfonic Acid by SET-LRP
A microgel with initiating sites was used for SET-LRP of styrene sulfonic acid (SSA) as
monomer. Different amounts of SSA were used to test, if the amount of monomer influences
the grafting. In addition, a reaction without initiating groups in the microgel was analyzed.
Figure 5.18 shows the Raman spectrum of several samples after modification with SSA.
Figure 5.18. Raman spectrum of samples after the SET-LRP with SSA.
There is a peak of large intensity at 1600 cm-1, which can be assigned to the phenyl group of
the styrene repeating units, while the signal at 1040 cm-1 correlates with the sulfonate vibration.
The reaction without an initiating group did not show the characteristic SSA peak; the reaction
0
0,1
0,2
0,3
0,4
0,5
0,6
0,7
0,8
0,9
1
500100015002000250030003500
Inte
nsi
ty
Wave number / cm-1
SET-SSA-
MG1
SET-SSA-
MG2
SET-SSA-
MG3
1600 cm-1

131
did not take place. Figure 5.19 gives an enhanced view of the phenyl ring vibration for all
samples.
Figure 5.19. Raman spectrum of the styrene signal of all SET-SSA-MG samples.
Since the amide and the styrene vibration overlap, it is not possible to exactly calculate the
microgel/SSA-ratio. But it can be seen, that the amount of SSA increases with the amount of
monomer used. Table 5.18 lists the hydrodynamic radii of the different samples.
Table 5.18. Results for the samples after the SET-LRP with SSA.
Sample N rH / nm PDI Zetapotential / mV
MG-Br / 67.48 0.49 0
SET-SSA-MG1 4 154.15 0.54 -31.4±4.0
SET-SSA-MG2 10 205.10 0.44 -54.4±3.8
SET-SSA-MG3 20 400.20 0.51 -51.8±5.4
With an increase in the number of repeating units, the hydrodynamic radius increases, which is
probably due to the polymer brushes, which are grafted onto the microgel shell. The dispersity
also increases. It can be assumed, that due to the high density of initiating groups on the surface,
some of them are more sterically hindered than other groups. This leads to polymer brushes
with differing and longer chain lengths and an uneven shell surface.
In addition, the zetapotential of the microgels was measured. While the sample without SSA
shows a zetapotential of around 0, the samples SET-SSA-MG1 to MG3 show a negative
potential ranging from 30 to 55 mV. This is probably due to the sulfonic acid groups of the SSA
0
0,1
0,2
0,3
0,4
0,5
0,6
0,7
0,8
0,9
1
15001550160016501700
Inte
nsi
ty
Wave Number / cm-1
SET-SSA-MG1
SET-SSA-MG2
SET-SSA-MG3

132
now located on the surface. This is a further proof for the success of the reaction. A temperature
sensitivity of the modified samples could not be measured.
Functionalization of Microgels with Sulfobetain by SET-LRP
The SET-LRP was also attempted with a sulfobetain monomer. As mentioned in 5.2 the
successful grafting of sulfobetain in controllable amounts is desired because of its antibacterial
properties. Several samples with different amounts of monomer were analyzed. Figure 5.20
shows several Raman spectra of the products.
Figure 5.20. Raman spectra of samples after the SET-LRP with SB.
What can be seen is a peak at 1750 cm-1, which corresponds with the signal, which is caused
by the ester group in the sulfobetain. In addition, there is also the signal at 1040 cm-1, which is
caused by the sulfonate group. Figure 5.21 shows the signal of the sulfonate group for all
samples.
0
0,1
0,2
0,3
0,4
0,5
0,6
0,7
0,8
0,9
1
500100015002000250030003500
Inte
nsi
ty
Wave number / cm-1
MG-Br
SET-SB-MG2
SET-SB-MG4
1750 cm-1
1040 cm-1

133
Figure 5.21. Raman spectra of the sulfonate signal of all SET-LRP-SB samples.
A higher amount of monomer in the reaction leads to signal of higher intensity in the spectra,
which in turn means that the amount of sulfobetain in the sample directly correlates with the
amount of sulfobetain in the feed. With the calibration curve from figure 5.10, it is now possible,
to calculate the amount of SB in the sample. This is listed in table 5.19, along with the microgel
sizes.
Table 5.19. Results for the samples after the SET-LRP with SB.
Sample N Ester / %
(found)
Ester / %
(theo) rH / nm PDI
Zetapotential /
mV
unmodified
microgel 0 0 0 67.48 0.491 0
SET-SB-MG1 5 10 66 189.17 0.416 -9.85±4.61
SET-SB-MG2 10 26 83 145.70 0.441 -2.62±3.74
SET-SB-MG3 15 80 87 109.14 0.398 -4.16±3.61
SET-SB-MG4 20 92 93 155.89 0.444 -9.35±4.24
After the polymerization, the hydrodynamic radius has increased significantly. There might be
several factors responsible. Since the brushes contain positive and negative ionic groups it is
possible, that the singular brushes crosslink through ionic interactions so that some particles
crosslink with each other. The zetapotential was measured but it was low in the functionalized
samples. They are around zero so the effect of the grafted polymers on the zetapotential is
negligible.
0
0,1
0,2
0,3
0,4
0,5
0,6
980 1000 1020 1040 1060 1080
Inte
nsi
ty
Wave number / cm-1
MG-Br
SET-SB-MG1
SET-SB-MG2
SET-SB-MG3
SET-SB-MG4
20
5
10
15

134
The temperature sensitivity of a sample was measured to test if the microgel behavior in
dependence of the temperature has changed after the modification. Figure 5.22 shows the
temperature sensitivity of a microgel before the modification with the alkyl halide and after the
SET-LRP with 20 equivalents of monomer.
Figure 5.22. Size (left) and polydispersity index (right) in dependence of temperature for the
microgel MB-12.3.0-B before and after SET-LRP with sulfobetain (SET-SB-MG4).
Both microgels show no difference in their temperature sensitivity. The sulfobetain is located
as brushes on the surface and is not temperature sensitive. Therefore it should not influence the
change in temperature of the VCL core. Since the core is not changed during the modification,
the temperature sensitivity remains unchanged unless a temperature sensitive polymer is grafted
on the surface. Sulfobetain does have a temperature sensitivity but the UCST is at 15°C so there
should be no discernible effect above this temperature. Even then, the sensitivity of the core
remains unchanged.
A sample was also analyzed via transmission electron microscopy (figure 5.23).
0
20
40
60
80
100
120
140
160
180
200
15 25 35 45 55
rH
/ n
m
T / °C
MG-12-3.0-B
SET-SB-MG4
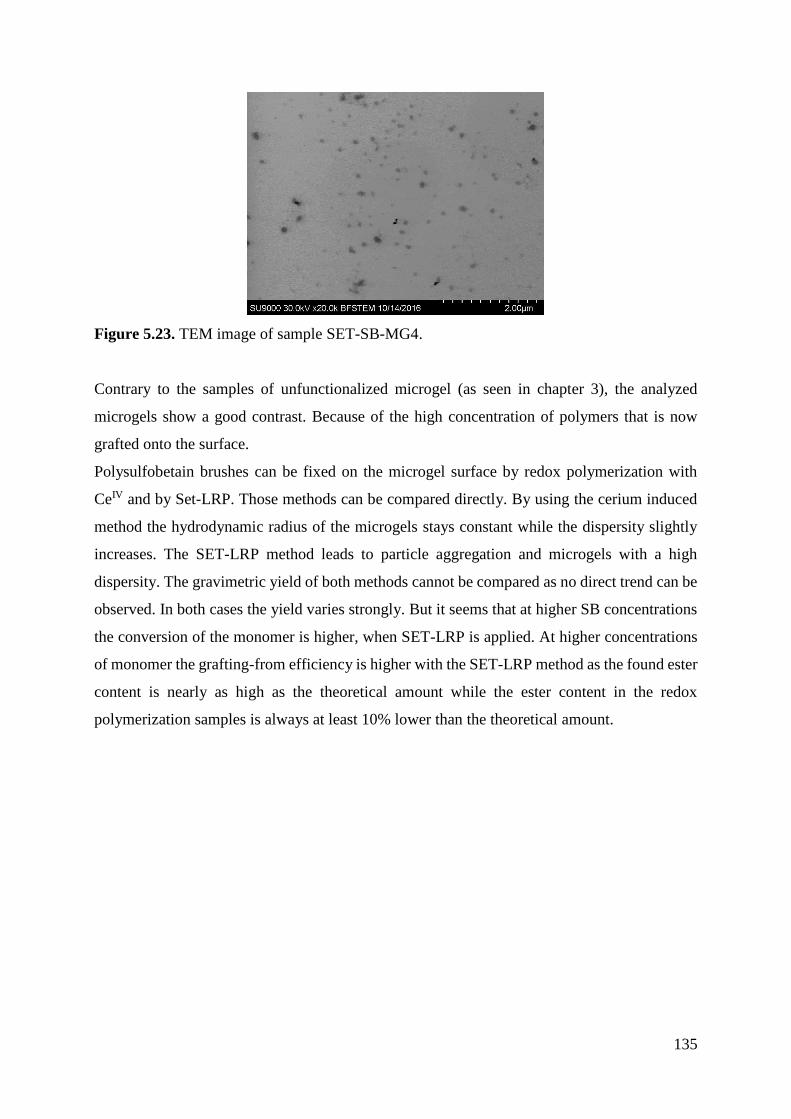
135
Figure 5.23. TEM image of sample SET-SB-MG4.
Contrary to the samples of unfunctionalized microgel (as seen in chapter 3), the analyzed
microgels show a good contrast. Because of the high concentration of polymers that is now
grafted onto the surface.
Polysulfobetain brushes can be fixed on the microgel surface by redox polymerization with
CeIV and by Set-LRP. Those methods can be compared directly. By using the cerium induced
method the hydrodynamic radius of the microgels stays constant while the dispersity slightly
increases. The SET-LRP method leads to particle aggregation and microgels with a high
dispersity. The gravimetric yield of both methods cannot be compared as no direct trend can be
observed. In both cases the yield varies strongly. But it seems that at higher SB concentrations
the conversion of the monomer is higher, when SET-LRP is applied. At higher concentrations
of monomer the grafting-from efficiency is higher with the SET-LRP method as the found ester
content is nearly as high as the theoretical amount while the ester content in the redox
polymerization samples is always at least 10% lower than the theoretical amount.

136
5.5 Summary and Outlook
It could be shown, that microgels modified with oligoglycidol macromonomers can be used for
further modification to graft polymer chains to the microgel surface. This can be done with
several different techniques. It is possible to use cerium salts for a redox polymerization to graft
different monomers, like DEGA, MEA, sulfobetain, NIPAAM or acrylonitrile but not styrene
sulfonic acid or vinyl imidazole. By changing the cerium content, it is possible to change the
number of polymer chains, grafted to the surface. The length of the chains can also be varied.
Apart from the acrylonitrile modified microgels, the other samples are dispersible in water.
In future works the synthesis of an amphiphilic colloidal system can be researched. It is possible
that hydrophilic (like PDEGA) and hydrophobic (like polyacrylonitrile) polymer chains can be
grafted on the same particle. These microgels should be stable in polar and apolar solvents.
Scheme 5.9 shows a schematic overview.
Scheme 5.9. Microgels with hydrophobic and hydrophilic chains in polar and apolar solvents.
The idea is, that the hydrophilic chains are soluble in the aqueous phase, while the hydrophobic
chains are collapsed in the microgel shell. By switching to an apolar solvent, the hydrophobic
chains stretch, while the hydrophilic ones collapse. The chains serve as some kind of stabilizing
agent, which leads to a colloidal system being dispersed in both kinds of solvents.
Beside a modification of microgels by CeIV catalyzed radical polymerization of suitable
monomers SET-LRP can be used for microgels functionalized with initiating sites (α-bromo-
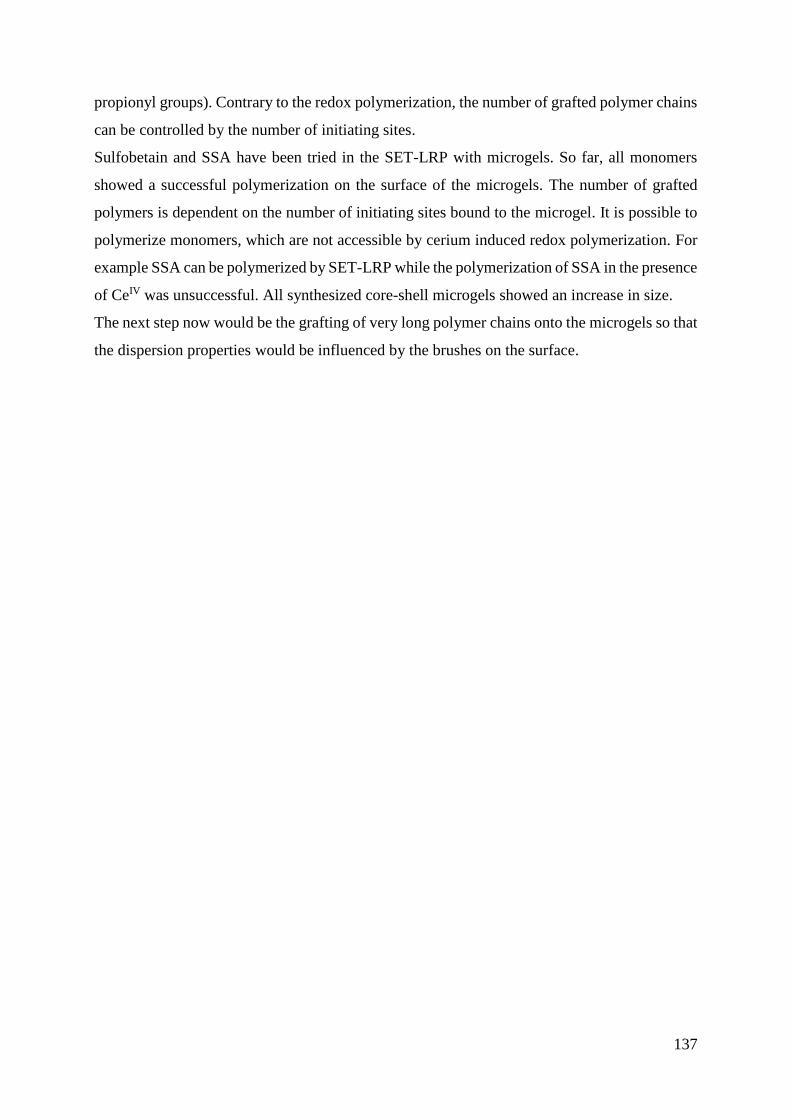
137
propionyl groups). Contrary to the redox polymerization, the number of grafted polymer chains
can be controlled by the number of initiating sites.
Sulfobetain and SSA have been tried in the SET-LRP with microgels. So far, all monomers
showed a successful polymerization on the surface of the microgels. The number of grafted
polymers is dependent on the number of initiating sites bound to the microgel. It is possible to
polymerize monomers, which are not accessible by cerium induced redox polymerization. For
example SSA can be polymerized by SET-LRP while the polymerization of SSA in the presence
of CeIV was unsuccessful. All synthesized core-shell microgels showed an increase in size.
The next step now would be the grafting of very long polymer chains onto the microgels so that
the dispersion properties would be influenced by the brushes on the surface.
138
5.6 Literature
[1] Gröer, S. I. C. Bachelor Thesis, Modifikation der Mikrogeloberfläche durch Ce(IV)-
initiierte „grafting-from“ Polymerisation, 2014, Rheinisch-Westfälische Technische
Hochschule Aachen.
[2] Fenger, B. Bachelor Thesis, Kern-Schale-Partikel durch Cer-initiierte grafting-from
Polymerisation, 2015, Rheinisch-Westfälische Technische Hochschule Aachen.
[3] Taylor, R. F. Protein Immobilization. Fundamentals and Applications 1991, Marcel
Dekker.
[4] Halperin, A.; Tirrell, M.; Lodge, T. P. Adv. Polym. Sci. 1992, 100, 31-71.
[5] Jordan, R.; Graf, K.; Riegler, H.; Unger, K. K. Chem. Commun. 1996, 9,. 1025-1026.
[6] Prucker, O.; Rühe, J. Macromolecules 1998, 31, 592-601.
[7] Inoubli, R.; Dagréou, S.; Khoukh, A.; Roby, F.; Peyrelasse, J.; Billon, L. Polymer 2005,
46, 2486-2496.
[8] Zheng, G.; Stöver, H. D. H. Macromolecules 2002, 35, 6828-6834.
[9] Sharma, G.; Ballauff, M. Macromol. Rapid Commun. 2004, 25, 547-552.
[10] Mei, Y.; Sharma, G.; Lu, Y.; Drechsler, M.; Ballauff, M.; Irrgang, T.; Kempe, R.
Langmuir 2005, 21, 12229-12234.
[11] Lu, Y.; Mei, Y.; Walker, R.; Ballauff, M.; Drechsler, M. Polymer 2006, 47, 4985-4995.
[12] Nagarajan, S.; Sudhakar, S.; Srinivasan, K. S. V. Colloid Polym. Sci. 1994, 272, 777-
783.
[13] Varaprasad, D. V. P. R.; Mahadevan, V. J. Polym. Sci. Part A: Polym. Chem. 1986, 24,
3279-3290.
[14] Samal, R. K.; Dash, P. C.; Mishra, B.; Suryanarayana, G. V.; Das, D. P.; Nayak, M. C.
J. Macromol. Sci. Chem. 1982, 17, 805-819.
[15] Lenka, S.; Nayak, P.L. J. Macromol. Sci. Chem. 1982, 18, 695-707.

139
[16] Mino, G.; Kaizerman, S. J. Polym. Sci. 1958, 122, 242-243.
[17] Topp, M. D. C.; Leunen, I. H.; Dijkstra, P. J.; Tauer, K.; Schellenberg, C.; Feijen, J.
Macromolecules 2000, 33, 4986-4988.
[18] Nagarajan, S.; Sabdham, K.; Srinivasan, V. J. Polym. Sci. Part A: Polym. Chem. 1995,
33, 2925-2933.
[19] Odian, G.; Kho, J. H. T. J. Macromol. Sci. Chem. 1970, 4, 317-330.
[20] Aanthanarayanan, V. S.; Santappa, M. J. Appl. Polym. Sci. 1965, 9, 2437-2449.
[21] Matyjaszewski, K.; Tsarevsky, N. V. J. Am. Chem. Soc. 2014, 136, 6513-6533.
[22] Percec, V.; Guliashvili, T.; Ladislaw, J. S.; Wistrand, A.; Stjerndahl, A.; Sienkowska,
M. J.; Monteiro, M. J.; Sahoo S. J. Am. Chem. Soc. 2006, 128, 14156-14165.
[23] Percec, V.; Popov, A. V.; Ramirez-Castillo, E.; Weichold, O. J. Polym. Sci. Part A:
Polym. Chem. 2003, 41, 3283-3299.
[24] Percec, V.; Popov, A. V.; Ramirez-Castillo, E.; Monteiro, M.; Barboiu, B.; Weichold,
O.; Asandei, A. D.; Mitchell, C. M. J. Am. Chem. Soc. 2002, 124, 4940-4941.
[25] Percec, V.; Popov, A. V.; Ramirez-Castillo, E.; Weichold, O. J. Polym. Sci. Part A:
Polym. Chem. 2004, 42, 6364-6374.
[26] Zhang, Q.; Wilson, P.; Li, Z.; McHale, R.; Godfrey, J.; Anastasaki, A.; Waldron, C.;
Haddleton, D. M. J. Am. Chem. Soc. 2013, 135, 7355-7363.
[27] Zhang, Q.; Li, Z.; Wilson, P.; Haddleton, D. M. Chem. Commun. 2013, 49, 6608-6610.
[28] Cheng, G.; Mi, L.; Cao, Z.; Xue, H.; Yu, Q.; Carr, L.; Jiang, S. Langmuir 2010, 26 (10),
6883-6886.
[29] Zhang, Z.; Chen, S.; Jiang, S. Biomacromolecules 2006, 7(12), 3311-3315.
[30] Das, M.; Sanson, N.; Kumacheva, E. Chem. Mater. 2008, 20, 7157-7163.
[31] Mohan, P.; Schols, D.; Baba, M.; De Clerco, E. Antivir. Res. 1992, 18, 139-150.
[32] Wong, J. E.; Diez-Pascal, A. M.; Richtering, W. Macromolecules 2009, 42, 1229-1238.
140
[33] Rasmusson, M.; Routh, A.; Vincent, B. Langmuir 2004, 20, 3536-3542.
[34] Gelissen, A. P. H.; Schmid, A. J.; Plamper, F. A.; Pergushov, D. V. Polymer 2014, 55,
1991-1999.
[35] Milton Harris, J. Poly (Ethylene Glycol) Chemistry, 1992, Plenum Press New York.
[36] Tanaka, M.; Motomura, T.; Kawada, M.; Anzai, T.; Kasori, Y.; Shiroya, T.; Shimura,
K.; Onishi, M.; Mochizuki, A. Biomaterials 2000, 21, 1471.
[37] Tanaka, M.; Motomura, T.; Kawada, M.; Anzai, T.; Kasori, Y.; Shimura, K.; Onishi,
M.; Mochizuki, A.; Okahata, Y. Jpn. J. Artif. Organs 2000, 9, 209.
[38] Tanaka, M.; Mochizuki, A.; Ishii, N.; Motomura, T.; Hatakeyama, T.
Biomacromolecules 2002, 3, 36-41
[39] Gao, J.; Frisken, B. J. Langmuir 2011, 27, 4142-4148.
[40] McComb, M. E.; Gesser, H. D. J. Appl. Polym. Sci. 1997, 65, 1175-1192.
[41] Saeed, K.; Haider, S.; Oh, T.-J.; Park, S.-Y. J. Membrane Sci. 2008, 322, 400-405.
[42] Zhang, L.; Aboagye, A.; Kelkar, A.; Lai, C.; Fong, H. J. Mater. Sci. 2014, 49, 463-480.
[43] Handbook of Chemistry & Physics, 65th Edition, 1984, CRC Press.
[44] Schröder, R. PhD Thesis, Ampholyte microgels with controlled distribution of ionizable
groups, 2016, Rheinisch-Westfälische Technische Hochschule Aachen.

141
6. Summary
The aim of this work was to realize a new route for a surface tailored microgels by
copolymerizing polyvinylcaprolactam with oligoglycidol macromonomers and to analyze the
microgels and modify them with different functional groups and polymers.
In the first part, microgels were synthesized and their properties like the size and the thermal
responsiveness were analyzed. It was shown, that with a higher amount of comonomer or a
longer oligomer chain, their size as well as the temperature sensitivity decrease, while the
colloidal stability increases. Calorimetric measurements were carried out and it was shown that
by using increasing amounts of macromonomer, the polymerization process gets retarded.
Specifically the vinyl benzyl head group is responsible for the retardation. Only the
polymerization of the VCL is retarded but not of the BIS, which leads to microgels which are
strongly crosslinked in the core but only very loosely in the shell. By using a variation of head
groups it was shown that the vinyl benzyl group shows the highest incorporation efficiency of
the analyzed samples.
The incorporation could only be done up to a certain amount, before the microgels became too
small. So a different synthesis method was employed in which the crosslinker was added during
the polymerization process after the addition of initiator. The first method leads to colloidal
networks, which are highly crosslinked in the core but less crosslinked in the shell, while the
second method leads to a network, which is evenly crosslinked throughout the whole microgel.
The latter method leads to systems, where the size is not controlled by the amount of
macromonomer, but the number of repeating units. The temperature sensitivity is also constant
regardless of the introduced oligoglycidol amount. It was possible, to introduce a larger amount
of macromonomer into the microgels than by using the first method. Both methods show
advantages and disadvantages over the other. Transverse relaxation measurements could prove,
that in any case, the oligoglycidol macromonomer was located in the microgel shell.
It could be shown that the microgel size, colloidal stability and temperature responsibility can
be tuned through the variation of the oligoglycidol macromonomer amount during the synthesis.
The location of the OH groups on the surface makes them available for further
functionalization.
The second part discusses the modification of the hydroxyl groups with several different
functional moieties, such as allyl-, vinyl sulfonate- and thiol groups. It was shown, that it was
possible to functionalize the OH groups with the mentioned groups. Furthermore, it could be
shown, that the amount of conversion could be controlled by the reaction conditions. Not every
142
OH-group has to be modified, so it is possible to introduce several different functionalities onto
the same particle. The properties of the modified microgels were analyzed. In almost all samples
the size and the dispersity increased. The increase in the dispersity is attributed to two reasons.
First the microgels are dried and redispersed in different solvents several times which leads to
the aggregation and entanglement of some particles which is hard to reverse. Second, because
of the conversion there are fewer OH groups on the surface that might provide steric protection
against aggregation. The modified microgels still displayed a temperature sensitivity similar to
the unfunctionalized microgel, suggesting that the functional groups have no effect on the
hydrophilicity of microgels. The modified microgels can now be used in several applications
for example as crosslinkers in the formation of hydrogels.
In the third part, the possibility of grafting polymers onto the microgel shell was investigated.
This was done by testing two different modes of grafting-from polymerization: A cerium
induced redox polymerization and a single-electron-transfer living radical polymerization, in
which copper is used as the activator. Several different monomers were tested with the different
polymerization techniques. One advantage is that the polymerization can be carried out in water
since the microgels are dispersible in this solvent.
It was possible to graft polymers onto the surface via cerium induced polymerization. It was
easily controllable, because the number of active sites could be tuned by the amount of used
Ce(IV) salts. The modification worked for the monomers sulfobetain, NIPAM, DEGA, MEA
and acrylonitrile while it was not successful for poly (styrene sulfonate). The modified
microgels always show an increase in their size. It is not dependent on the amount of polymer
grafted on the surface. The dispersity also increases slightly but is nearly constant for most
samples. Since the number of active sites can be controlled it is easy to introduce different
polymer chains onto the surface. A microgel could be modified with PDEGA chains first and
afterwards with hydrophobic polyacrylonitrile chains. But not every monomer can be
polymerized with that system.
In contrast, the SET-LRP mechanism works with monomers which did not polymerize under
redox polymerization conditions, such as sodium styrene sulfonate and sulfobetain. The
disadvantage over the redox polymerization is its lack of control. To induce a SET-LRP, the
microgel has to be modified with alkyl halide groups. The polymerization happens potentially
at every initiating site. So the control is only possible by controlling the amount of used
monomer or the number of converted hydroxyl groups. In order to bind different polymers on
the microgel with SET-LRP only a fraction of the OH groups has to be changed into alkyl halide
groups. This process has to be repeated after the first grafting-from polymerization. The

143
microgels can be easily modified with a propionyl bromide group but there is a high increase
in their dispersity afterwards. After the SET-LRP the hydrodynamic radius of the microgels has
increased significantly while the dispersity remains high.
PVCL microgels modified with oligoglycidol macromonomers are easily tunable as the size,
the colloidal stability and the temperature sensitivity as well as the morphology can be
controlled. They can be modified with several functional groups. It is also possible to graft
different polymer brushes onto the microgel surface.

144
7. Nomenclature
Å - Ångström
AAEM - Acetoacetoxy Ethyl Methacrylate
AGE - Allyl Glycidyl Ether
AMPA - 2, 2´-Azobis [2-Methyl-Propionamidine] Dihydrochloride
ATRP - Atomic Transfer Radical Polymerization
BIS - Methylenebisacrylamide
CAN - Ceric Ammonium Nitrate
CDCl3 - Deuterated Chloroform
CSC - 2-Chloroethane Sulfonyl Chloride
D2O - Deuterated Water
Da - Dalton
DCM - Dichloromethane
DEGA - Di (Ethylene Glycol) Ethyl Ether Acrylate
δ - Chemical Shift
DLS - Dynamic Light Scattering
DMF - N, N´-Dimethyl formamide
DMSO - Dimethyl sulfoxide
DTPA - 3,3´Dithiopropionic Acid
Eq - Equivalent
EEGE - Ethoxy Ethyl Glycidyl Ether
F-FFF - Flow Field-Flow Fractionation
g - Gram
GMA - Glycidyl Methacrylate
GPC - Gel Permeation Chromatography
h - Hour
H2O - Water
HCl - Hydrochloric Acid
HClO4 - Perchloric Acid
HAM - Hydroxy Ethyl Methacrylamide
HNO3 - Nitric Acid
HV - High Vacuum

145
Hz - Hertz
IADME - Itaconic Acid Dimethyl Ester
ICl - Iodo Chloride
KOtBu - Potassium-Tert-Butanolate
λ - Wavelength
LCST - Lower Critical Solution Temperature
M -Molar
MEA - 2-Methoxy Ethyl Acrylate
mg - Milligram
MHz - Megahertz
mm - Millimeter
Mexp - Experimentally Determined Macromonomer Content
Mn - Number Average Molecular Weight
Mtheo - Theoretical Incorporated Macromonomer Content
mV - MilliVolt
Mw - Weight Average Molecular Weight
N - Number of Repeating Units
NaCl - Sodium Chloride
NaI - Sodium Iodide
NaOH - Sodium Hydroxide
NIPAAm - N-Isopropyl acrylamide
nm - Nanometer
NMR - Nuclear Magnetic Resonance Spectroscopy
PBS - Phosphate Buffered Saline
PDEGA - Poly (Di Ethylene Glycol Ethyl Ether Methacrylate)
PDI - Polydispersity Index
PEG - Poly (Ethylene Glycol)
PEGMA - Poly [Ethylene Glycol-Methacrylate]
PG - Polyglycidol
PMEA - Poly 2-Methoxyethylacrylate
PNIPAAM - Poly (N-Isopropyl Acrylamide)
ppm - Parts per Million
PS - Polystyrene
PVCL - Poly (N-Vinylcaprolactam)

146
RAFT - Reversible Addition-Fragmentation Chain Transfer
rH - Hydrodynamic Radius
rpm - Rounds per Minute
SDS - Sodium Dodecyl Sulfate
SEC - Size Exclusion Chromatography
SET-LRP - Single-Electron-Transfer Living Radical Polymerization
SEM - Scanning Electron Microscopy
T - Temperature
tBGE - tert-Butylglycidylether
TEA - Triethylamine
TEM - Transmission Electron Microscopy
THF - Tetrahydrofuran
UCST - Upper Critical Solution Temperature
UV - Ultra Violet
VBA - Vinyl Benzyl Alcohol
VCL - N-Vinylcaprolactam
VIm - N-Vinylimidazole
VIS - Visible
VPTT - Volume Phase Transition Temperature
SB - [2-(Methacryloyloxy) Ethyl]-Dimethyl (3-Sulfopropyl) Ammonium
Hydroxide
SSA - Sodium 4-Styrenesulfonate
V - Volume

147
Danksagung
Ich möchte mich hier bei allen Leuten bedanken, die mir während meiner Promotion geholfen
und beigestanden haben.
Zuerst möchte ich Professor Dr. Andrij Pich danken, dass er mir die Möglichkeit gegeben hat,
unter ihm meine Arbeit anzufertigen. Desweiteren danke ich ihm für die Unterstützung, Hilfe
und Korrekturen, die er mir während meiner Arbeit hat zukommen lassen.
Zudem danke ich Professor Dr. Martin Möller für die Möglichkeit, am DWI zu promovieren
und dass er sich bereit erklärt hat, der Zweitkorrektor dieser Arbeit zu sein
Ein sehr großer Dank geht an Herr Keul, den ich nicht nur sehr oft wegen verschiedenster
Fragen zu Polyglycidol besuchen konnte, sondern der mir auch sehr mit der Korrektur meiner
Dissertation und Veröffentlichung geholfen hat.
Auch Dominik Schmitz und Andreea Balaceanu danke ich für die Hilfe mit der Korrektur
meiner Dissertation.
Sascha Pargen danke ich für die endlose Geduld bei meinen vielen Fragen zum Thema
Polyglycidol.
Rainer Haas danke ich für die große Hilfe in so vielen verschiedenen Dingen, dass ich sie gar
nicht alle aufzählen kann.
Herr Walter Tillmann denke ich für seine stete Hilfe bei der Messung und Auswertung von
Raman- und IR-Spektren.
Ich danke Justine Couthouis und Blanca Ines für ihre stete Hilfe bei Fragen zur SET-LRP.
Marina Richter und Huihui Wang danke ich für ihre Hilfe beim Umgang mit dem Tensiometer.
Danke an Claudia Formen für die Hilfe bei der UV/Vis Spektroskopie und auch ansonsten für
die angenehme Stimmung mit ihr.
Vielen Dank an Professor Demco und Andreea Balaceanu für deren Hilfe bei verschiedenen
NMR-Messungen.
Helga Thomas und Renate Jansen danke ich für die Möglichkeit, die Plasmaanalage zu
benutzen und deren Hilfe bei der Benutzung dieser.
148
Ich danke den Auszubildenden Fabian Deckwirth, Corinna Storck und Sabrina Mallmann dafür,
dass sie mich im Labor unterstützt haben und ich mit ihnen stets eine spaßige
Arbeitsatmosphäre genießen konnte. Besonders danke ich Sabrina für ihre Hilfe, um
erfolgreiche Bilder mit dem SU-9000 aufzunehmen.
Ich danke meinen unzähligen Bachelor- und Masterstudenten, die ich bei der Anfertigung ihrer
Arbeiten und Durchführung ihrer Praktika betreuen durfte. Das sind Ayse Yalcin, Valentin Fell,
Niklas Kinzel, Andrea Melle, Vi Tran, Thorsten Palmer, Bastian Fenger, Carel Kwamen, Anja
Hoffman, Lena Henkel, René Büttgen, Andreas Hoffmann, Nadine Daleiden, Thomas
Göttlinger und ganz besonders Saskia Inga Christamaria Gröer.
Ich danke wirklich allen Leuten des AK Pich und des DWI, nicht nur für die super
Arbeitsatmosphäre, sondern auch für die tolle Zeit überhaupt mit allen, die das Arbeiten und
meist auch die Freizeit immer zu einem Vergnügen gemacht haben, ganz besonders Dominik
Schmitz, Thomas Zosel, Andrea Melle, Christian Herbert und Dazril Phua. Danke für den
ganzen Spass.
Zum Abschluss danke ich den Leuten am meisten, mit denen ich jahrelang ein Labor geteilt
habe und die zu meinen Freunden wurden. Vielen Dank an Dominic Kehren, Andreea
Balaceanu, Ricarda Schröder, Thorsten Palmer und Wenjing Xhu. Ihr wart tolle Laborkollegen.
Mit euch war die Arbeitszeit immer spaßig und irgendwas zum Lachen oder Reden gab es
immer. Vielen Dank dafür, Labor 3.04/3.05!!!
Diese Arbeit wurde in Teilen am Center for Chemical Polymer Technology CPT durchgeführt,
welcher von der EU und dem Bundesland Nordrhein-Westfalen unterstützt wird (grant no.
EFRE 30 00 883 02).

149
Schlusserklärung
Hiermit erkläre ich, dass ich die vorliegende Arbeit selbstständig verfasst und keine anderen
als die hier angegebenen Quellen und Hilfsmitteln benutzt habe.
Ferner erkläre ich, dass ich nicht anderweitig mit oder ohne Erfolg versucht habe, eine
Dissertation einzureichen oder mich einer Doktorprüfung zu unterziehen.
Aachen, den 16.06.2017
……………………………………………………………………
Christian Willems