Beverage Sensory Modification - MDPI
106
Beverage Sensory Modification Manuel Malfeito Ferreira www.mdpi.com/journal/beverages Edited by Printed Edition of the Special Issue Published in Beverages beverages
-
Upload
khangminh22 -
Category
Documents
-
view
0 -
download
0
Transcript of Beverage Sensory Modification - MDPI

Beverage Sensory Modification
Manuel Malfeito Ferreira
www.mdpi.com/journal/beverages
Edited by
Printed Edition of the Special Issue Published in Beverages
beverages

Beverage Sensory Modification


Beverage Sensory Modification
Special Issue Editor
Manuel Malfeito Ferreira
MDPI • Basel • Beijing • Wuhan • Barcelona • Belgrade

Special Issue Editor
Manuel Malfeito Ferreira
University of Lisbon,
Portugal
Editorial Office
MDPI
St. Alban-Anlage 66
4052 Basel, Switzerland
This is a reprint of articles from the Special Issue published online in the open access journal Beverages
(ISSN 2306-5710) from 2017 to 2019 (available at: https://www.mdpi.com/journal/beverages/
special issues/sensory modification)
For citation purposes, cite each article independently as indicated on the article page online and as
indicated below:
LastName, A.A.; LastName, B.B.; LastName, C.C. Article Title. Journal Name Year, Article Number,
Page Range.
ISBN 978-3-03921-393-1 (Pbk)
ISBN 978-3-03921-394-8 (PDF)
c© 2019 by the authors. Articles in this book are Open Access and distributed under the Creative
Commons Attribution (CC BY) license, which allows users to download, copy and build upon
published articles, as long as the author and publisher are properly credited, which ensures maximum
dissemination and a wider impact of our publications.
The book as a whole is distributed by MDPI under the terms and conditions of the Creative Commons
license CC BY-NC-ND.

Contents
About the Special Issue Editor . . . . . . . . . . . . . . . . . . . . . . . . . . . . . . . . . . . . . . vii
Manuel Malfeito-Ferreira
Beverage Sensory ModificationReprinted from: Beverages 2019, 5, 45, doi:10.3390/beverages5030045 . . . . . . . . . . . . . . . . 1
Naomi Gotow, Shinji Esumi, Hirofumi Kubota and Tatsu Kobayakawa
Comparison of Temporal Profiles among Sucrose, Sucralose, and Acesulfame Potassium afterSwallowing Sweetened Coffee Beverages and Sweetened Water SolutionsReprinted from: Beverages 2018, 4, 28, doi:10.3390/beverages4020028 . . . . . . . . . . . . . . . . 3
Gloria Wang, John E. Hayes, Gregory R. Ziegler, Robert F. Roberts and Helene Hopfer
Dose-Response Relationships for Vanilla Flavor and Sucrose in Skim Milk: Evidence of SynergyReprinted from: Beverages 2018, 4, 73, doi:10.3390/beverages4040073 . . . . . . . . . . . . . . . . 15
Jordi Ballester, Mathilde Magne, Perrine Julien, Laurence Noret, Maria Nikolantonaki,
Christian Coelho and Regis D. Gougeon
Sensory Impact of Polyphenolic Composition on the Oxidative Notes of Chardonnay WinesReprinted from: Beverages 2018, 4, 19, doi:10.3390/beverages4010019 . . . . . . . . . . . . . . . . 29
Marcelo Miraballes, Natalia Hodos and Adriana Gambaro
Application of a Pivot Profile Variant Using CATA Questions in the Development of aWhey-Based Fermented BeverageReprinted from: Beverages 2018, 4, 11, doi:10.3390/beverages4010011 . . . . . . . . . . . . . . . . 46
Parpinello Giuseppina Paola, Meglioli Matteo, Ricci Arianna and Versari Andrea
Effect of Different Glass Shapes and Size on the Time Course of Dissolved Oxygen in Winesduring Simulated TastingReprinted from: Beverages 2018, 4, 3, doi:10.3390/beverages4010003 . . . . . . . . . . . . . . . . . 56
Casparus J. A. Machiels
Bittersweet Findings: Round Cups Fail to Induce Sweeter TasteReprinted from: Beverages 2018, 4, 12, doi:10.3390/beverages4010012 . . . . . . . . . . . . . . . . 63
Charles Spence and Qian (Janice) Wang
Assessing the Impact of Closure Type on Wine Ratings and MoodReprinted from: Beverages 2017, 3, 52, doi:10.3390/beverages3040052 . . . . . . . . . . . . . . . . 74
Manuel Malfeito-Ferreira
Two Decades of “Horse Sweat” Taint and Brettanomyces Yeasts in Wine: Where do WeStand Now?Reprinted from: Beverages 2018, 4, 32, doi:10.3390/beverages4020032 . . . . . . . . . . . . . . . . 81
v


About the Special Issue Editor
Manuel Malfeito-Ferreira is Professor at the Instituto Superior de Agronomia (ISA), University of
Lisbon. His research is mainly focused on food and wine spoilage yeasts, especially concerning
volatile phenol production by Brettanomyces bruxellensis. His more recent projects include consumer
studies on wine acceptance and the development of a new tasting approach based on emotional
responses. He is frequently invited to speak in technical seminars about wine microbial stability
and wine tasting all over the world.
vii


beverages
Editorial
Beverage Sensory Modification
Manuel Malfeito-Ferreira
Linking Landscape, Environment, Agriculture and Food (LEAF) Research Center, Instituto Superior deAgronomia (ISA), University of Lisbon, 1349-017 Lisboa, Portugal; [email protected]
Received: 22 May 2019; Accepted: 25 June 2019; Published: 3 July 2019
The Special Issue on “Beverage Sensory Modification” gathers a series of articles that featurethe broad sense of sensory modification, either by improving flavor, taste, and mouthfeel propertiesor by preventing their spoilage. The scope goes further than the usual technological measures thatmodulate sensory properties and includes the psychological and cross-modal influences, where thesensory modification is on the subject’s brain and not on the object’s physical-chemical properties.
The beverage industry usually addresses the question of modifying sensory characteristics bymeeting the innate attraction for sweetness either by adding different sweetening agents, differentaroma molecules, or changing dishware forms, which are known to increase the in-mouth sweetperception. Non-nutritive sweeteners have been used as substitutes for nutritive sweeteners with thegoal of preventing obesity and dental caries. The main factor responsible for the difference in tastebetween beverages containing a nutritive sweetener and those containing a non-nutritive sweetener isthe temporal profile of sensory attributes. However, Gotow et al. [1] demonstrated that this differencewas only observed in water and not in coffee beverages, probably because of flavor properties thatmasked the sweetener effect. The cross-modal flavor–taste interactions also revealed the importanceof the matrix effect as described by Wang et al. [2] using skim milk. These authors showed that avanilla aroma did enhance the perceived sweetness while this enhancing effect was lower than thatof sucrose on the vanilla flavor. The cross-modal interactions also include visual and taste senses.In particular, research indicates that roundness (as opposed to angularity) is consistently associatedwith an increased sweetness perception. However, Machiels [3] did not confirm these results usingtwo different cup forms (round versus angular) with a butter milk drink and a mate-based soft drink.Interestingly, a correspondence was found between the angular cup and a more bitter taste only for thesoft drink. The sweetener sucrose may also be used for other purposes than increasing sweetness [4].These authors showed that it also affects the texture and creaminess of a new product based on partiallydemineralized sweet whey and gelatin added to milk powder and cassava starch. Creaminess andfirmness were also promoted by the cassava starch. Overall, these four articles highlight that food orbeverage matrixes exert a significant effect on taste and mouth-feel studies and are indispensable tovalidate preliminary assessments using water solutions.
Wines are also a frequent object of sensory studies, gathering researchers with different scientificbackgrounds. The shape and size of the wine glass was shown to affect the different wine aromasin the headspace [5] Moreover, Spence and Wang [6] demonstrated that the quality of the wine wasrated as higher and the celebratory mood of the participant was also higher following the sound ofthe cork pop when compared with a screw-cap opening. The cross-modal interaction received hereof another input from the senses of hearing, smell, and taste influences hedonic responses. Under adifferent scope, off-flavors also deserve the attention of researchers. For instance, the world-famousChardonnay from Burgundy may be affected by oxidative notes that indicate premature aging [7] Thehighly debated “horse sweat” taint was also reviewed, encompassing technical preventive measuresand the influence of volatile phenols on sensory attributes [8].
This special issue enables consumers to be aware of the work that is being carried out byleading research teams in areas that may be regarded as case studies for the whole of the food andbeverage industries.
Beverages 2019, 5, 45; doi:10.3390/beverages5030045 www.mdpi.com/journal/beverages1

Beverages 2019, 5, 45
References
1. Gotow, N.; Esumi, S.; Kubota, H.; Kobayakawa, T. Comparison of Temporal Profiles among Sucrose, Sucralose,and Acesulfame Potassium after Swallowing Sweetened Coffee Beverages and Sweetened Water Solutions.Beverages 2018, 4, 28. [CrossRef]
2. Wang, G.; Hayes, J.; Ziegler, G.; Roberts, R.; Hopfer, H. Dose-Response Relationships for Vanilla Flavor andSucrose in Skim Milk: Evidence of Synergy. Beverages 2018, 4, 73. [CrossRef]
3. Machiels, C. Bittersweet Findings: Round Cups Fail to Induce Sweeter Taste. Beverages 2018, 4, 12. [CrossRef]4. Miraballes, M.; Hodos, N.; Gámbaro, A. Application of a Pivot Profile Variant Using CATA Questions in the
Development of a Whey-Based Fermented Beverage. Beverages 2018, 4, 11. [CrossRef]5. Parpinello, G.; Matteo, M.; Arianna, R.; Andrea, V. Effect of Different Glass Shapes and Size on the Time
Course of Dissolved Oxygen in Wines during Simulated Tasting. Beverages 2018, 4, 3. [CrossRef]6. Spence, C.; Wang, Q. Assessing the Impact of Closure Type on Wine Ratings and Mood. Beverages 2017, 3, 52.
[CrossRef]7. Ballester, J.; Magne, M.; Julien, P.; Noret, L.; Nikolantonaki, M.; Coelho, C.; Gougeon, R. Sensory Impact of
Polyphenolic Composition on the Oxidative Notes of Chardonnay Wines. Beverages 2018, 4, 19. [CrossRef]8. Malfeito-Ferreira, M. Two Decades of “Horse Sweat” Taint and Brettanomyces Yeasts in Wine: Where do We
Stand Now? Beverages 2018, 4, 32. [CrossRef]
© 2019 by the author. Licensee MDPI, Basel, Switzerland. This article is an open accessarticle distributed under the terms and conditions of the Creative Commons Attribution(CC BY) license (http://creativecommons.org/licenses/by/4.0/).
2

beverages
Article
Comparison of Temporal Profiles among Sucrose,Sucralose, and Acesulfame Potassium afterSwallowing Sweetened Coffee Beverages andSweetened Water Solutions
Naomi Gotow 1, Shinji Esumi 2, Hirofumi Kubota 2 and Tatsu Kobayakawa 1,*
1 Human Informatics Research Institute, National Institute of Advanced Industrial Science andTechnology (AIST), Tsukuba Central 6, 1-1-1 Higashi, Tsukuba, Ibaraki 305-8566, Japan;[email protected]
2 Products Research & Development Laboratory, Research & Development Headquarters,Asahi Soft Drink Co. Ltd., 1-1-21 Midori, Moriya, Ibaraki 302-0106, Japan;[email protected] (S.E.); [email protected] (H.K.)
* Correspondence: [email protected]; Tel.: +81-29-861-6730
Academic Editor: Manuel Malfeito FerreiraReceived: 5 December 2017; Accepted: 28 March 2018; Published: 2 April 2018
Abstract: Non-nutritive sweeteners have been used as substitutes for nutritive sweeteners withthe goal of preventing obesity and dental caries. The main factor responsible for the differencein taste between beverages containing a nutritive sweetener and those containing a non-nutritivesweetener is the temporal profile of sensory attributes. In this study, untrained panelists performed atime–intensity evaluation of sweetness, using one coffee beverage containing a nutritive sweetener(sucrose) and two coffee beverages containing non-nutritive sweeteners (sucralose or acesulfamepotassium (acesulfame K)). They evaluated continuously perceived intensity of sweetness for 150 safter swallowing each coffee beverage. We did not detect a significant difference in temporalprofiles among the three coffee beverages. To investigate why the temporal profiles of thethree coffee beverages followed similar traces, all untrained participants who had participatedin the coffee beverage session also performed a time–intensity evaluation of sweetness usingthree water solutions (sucrose-sweetened, sucralose-sweetened, and acesulfame K–sweeteneddeionized water). We observed a significant difference in temporal profiles among the three watersolutions. These results indicate that differences in the temporal profiles of coffee beverages might bemasked by factors other than the sweetness of the sweetener.
Keywords: temporal profile; time–intensity evaluation; sweetener; coffee beverage; water solution;untrained panelist
1. Introduction
Sucrose, a disaccharide, is one of the most common nutritive sweeteners used today, and providesmetabolizable energy [1]. Overconsumption of sucrose causes chronic diseases such as obesity,metabolic syndrome leading to diabetes, and cardiovascular diseases [2]. In order to prevent theseillnesses, non-nutritive sweeteners with very low or no calories have been used as substitutes fornutritive sweeteners [3,4].
Currently, the carbohydrate content of ordinary products such as coffee beverages is around7.5 g per 100 mL [5] in Japan. In order to use the term “low-sugar”, it is necessary to decrease thecarbohydrate content to less than 2.5 g per 100 mL of beverage [6], or to reduce the carbohydratecontent by more than 2.5 g per 100 mL relative to the content in ordinary products [5]. In the European
Beverages 2018, 4, 28; doi:10.3390/beverages4020028 www.mdpi.com/journal/beverages3

Beverages 2018, 4, 28
Union, a “low-sugar” product has been defined as one that contains less than 5 g of sugar per 100 g forsolids or 2.5 g of sugar per 100 mL for liquids [7]. The United States Food and Drug Administrationhas not defined the term “low-sugar” [8]. Non-nutritive sweeteners such as sucralose and acesulfamepotassium (acesulfame K) are mainly used to enhance the sweetness of “low-sugar” products thatcontain fewer carbohydrates than conventional products. Per unit mass, sucralose and acesulfame Kare several hundred times sweeter than sucrose [9,10].
The temporal profile of sensory attributes is the factor most responsible for a taste differencebetween a product sweetened with sucrose and one sweetened with a non-nutritive sweetener [11].The temporal profiles of currently used non-nutritive sweeteners are not consistent with that ofsucrose [12]. When investigating the temporal profiles of sensory attributes (i.e., sweetness) ofwater solutions and beverages, the measurement method used most frequently is a time–intensityevaluation [13,14]. This method records how the perceived intensity of sensory attributes changes overtime [15]. To compare the temporal profiles of sweetness among multiple sweeteners, time–intensityevaluations are performed using water solutions [16–20] or foods (i.e., espresso coffee [21], chocolatemilk [22], mixed fruit jam [23], milk chocolate [24], and snacks [25]). Melo and colleagues [26,27]sought to develop diabetic chocolate perceptually similar to ordinary chocolate in terms of its temporalprofile. Trained panelists performed a time–intensity evaluation of sweetness using ordinary chocolatecontaining sucrose, as well as diabetic chocolates containing sucralose or stevioside. Their resultsrevealed that the temporal profiles of sweetness were similar between ordinary and diabetic chocolates.Thus, time–intensity evaluation is considered to be a useful method for developing new products withtemporal profiles that are as similar as possible to those of ordinary products.
The purpose of this study was to investigate whether the temporal profiles of sweetnessdiffered between an ordinary coffee beverage containing nutritive sweetener (sucrose) and low-sugarcoffee beverages containing non-nutritive sweeteners (sucralose or acesulfame K). Participants alsoperformed a time–intensity evaluation of sweetness using sucrose-sweetened, sucralose-sweetened,and acesulfame K–sweetened water solutions as control samples. Gotow and colleagues [28] developeda time–intensity evaluation system for untrained panelists, which was used in this study.
2. Materials and Methods
2.1. Participants
This study was conducted in accordance with the revised version of the Declaration of Helsinki.All procedures in this study were approved by the ethical committee for ergonomic experimentsof the National Institute of Advanced Industrial Science and Technology, Japan. Informed writtenconsent was acquired from all participants. Ninety-four volunteers (39 female and 55 male) betweenthe ages of 20 and 29 years (mean age ± standard deviation = 22.29 ± 1.90 years) participated in theexperiments; volunteers contacted us after seeing our recruitment announcement on a website for thelocal community.
2.2. Materials
The experiments used eight types of non-released canned samples (Asahi Soft Drink, Tokyo,Japan): four sweetened coffee beverages and four sweetened water solutions. Sucrose, sucralose,and acesulfame K were used as sweeteners for the test trials, and stevia was used as the sweetener forthe exercise trial.
Sucralose, acesulfame K, and stevia are 600, 200, and 350 times sweeter per unit mass thansucrose, respectively; here, the sweetness of sucrose was defined as 1 [9,10,29]. Most low-sugarcanned coffee beverages available in Japan contain milk and have sweetness levels of 40–55.Therefore, we prepared a coffee beverage with milk that had a sweetness level of 50. More specifically,we calculated the concentrations satisfying the following equation: [sample concentration(g/L)] × [sweetness equivalence ratio of each sweetener, relative to sucrose] = 50. Accordingly, we
4

Beverages 2018, 4, 28
prepared samples sweetened with 5% sucrose, 8.33 × 10⁻³% sucralose, 2.50 × 10⁻²% acesulfame K,and 14.28 × 10⁻³% stevia.
For coffee beverages, we extracted components from 56.5 g of coffee beans (a blend of severalmedium-dark roasted Arabica beans), ground to a specified size, with deionized water at approximately95 ◦C; added sweetener and 120 g of milk (3.6% fat, sterilization at 130 ◦C, Ohayo Dairy Products,Okayama, Japan) to the coffee extract; and then diluted the mixture in a measuring cylinder to 1 L withdeionized water. After canning, each sample was subjected to retort sterilization. For water solutions,we canned deionized water containing each sweetener, and then performed retort sterilization.The canning process was completed using industrial equipment at the Asahi Soft Drink Co. Ltd.
We opened each package of canned sample, salt-free cracker (“Levain Classical non-salt topping”,Yamazaki-Biscuits, Tokyo, Japan), and mineral water (“Asahi oishii mizu Fujisan”, Asahi Soft Drink,Tokyo, Japan) 1 h before the start of the experiment. The salt-free cracker and mineral water were usedto clean the participant’s oral cavity [30,31]. A coffee sample or water solution (10 mL) was measuredusing a macropipette and poured into a paper cup (capacity 90 mL, Part Number SM-90-3, Tokan Kogyo,Tokyo, Japan). We poured one type of sample into each cup. In the interest of food sanitation andaroma retention, we covered the paper cup with a lid (Part Number SM-205-F, Tokan Kogyo), which wasremoved immediately before the sample was presented to the participants. The salt-free cracker was cutto a size of 2 cm × 2 cm, and one piece of cracker was served in a paper candy cup. Mineral water (10 mL)was measured using a macropipette and poured into a paper cup (capacity 90 mL, Part Number SM-90-3,Tokan Kogyo). Coffee beverages, water solutions, and mineral water were presented at room temperature(approximately 24 ◦C).
2.3. Time–Intensity Evaluation System
An outline of the time–intensity evaluation system is shown in Figure 1. The structure of this systemwas detailed by Gotow and colleagues [28,32]. However, to improve the portability of this system, wechanged how the voltage output from the load cell was processed. More specifically, after the outputvoltage was amplified, it was subjected to an analog-to-digital (A/D) conversion at a frequency of 1 kHzon a microprocessor (Part Number Arduino Uno SMD Rev3, Arduino S.r.l., Ivrea, Italy). Average voltagewas calculated in time windows of 50 milliseconds, and output to a personal computer via a serial port asa digital value corresponding to a six-point magnitude scale of perceived intensity.
2.4. Procedure
Time–intensity evaluation was performed by one participant at a time in a small room(width 165 cm × depth 275 cm × height 240 cm) shielded from outside noise. The door of the roomwas closed during measurement. A video camera and intercom were placed inside the room so that theexperimenter could monitor and communicate with participants from outside the room. An air cleanerlocated inside the room was operated continuously to prevent odor retention.
The order of coffee beverage and water solution sessions was alternated between participants.To ensure the reliability and stability of the time–intensity evaluation [33,34], we presented a samplecontaining stevia in the first trial of each session, which was considered as a training trial. The presentationorder of samples containing sucrose, sucralose, or acesulfame K in each session was counterbalancedamong participants. The participant rested for approximately 7 min between trials in each session, as wellas between the first and second sessions.
All instructions were displayed on the liquid crystal display (LCD) monitor placed in front of theparticipant. In the first trial of the first session, the participant performed the evaluation accordingto instructions displayed on the screen, while receiving oral instructions from experimenter. On thefirst screen of sequential trials, we instructed the participant to evaluate the continuously perceivedintensity of sweetness on the tongue after swallowing the samples. On the same screen, based on previousstudies [35,36] in which participants reported which part of their anatomy they used to perceived specificsensory attributes (e.g., some participants replied that they perceived vanilla aroma in their mouth), we
5

Beverages 2018, 4, 28
instructed the participant regarding the part of the anatomy to which they should direct their attention(i.e., “on the tongue”), using an illustration of the sagittal plane of the head with the name of the partlabeled (a display is shown in Figure 1). Next, the participant placed a cracker into their mouth to cleanthe oral cavity and continued masticating it for 15 s before the screen was switched. The participantswallowed the cracker remaining in their oral cavity, and then held 10 mL of mineral water in their mouth.After they transferred the water into the oral cavity, they swallowed it. The participant took 5 mL ofsample in their mouth, which they held without swallowing, and then placed the index finger of their righthand into the ring of the time–intensity evaluation system. A countdown was displayed three secondsbefore the screen showed visual feedback about perceived intensity. The participant swallowed thesample in their mouth at the same time that the countdown reached 0 s and started the time–intensityevaluation of sweetness.
Figure 1. Outline of the time–intensity evaluation system. Participants evaluated perceived intensityby operating a pull-ring, which was a component of the evaluation system. The movable range of thering was limited to 10 cm by a stopper. Positional information of the ring, synonymous with springtension, was measured by a load cell, with output expressed as voltage. After the output voltage wasamplified, it was subjected to analog-to-digital (A/D) conversion on a microprocessor at a frequencyof 1 kHz. Average voltage was calculated in time windows of 50 milliseconds, and then output to apersonal computer via a serial port as a digital value corresponding to a six-point magnitude scaleof perceived intensity. To provide visual feedback in real time, the value of perceived intensity wasdisplayed on a liquid crystal display (LCD) monitor as a black bar on a six-point magnitude scale(0: “not detectable” to 5: “very strong”). Furthermore, to inform the participant of the time remainingin the evaluation, an indicator of the extent of progress was shown on the screen.
For each sample, participants evaluated perceived intensity over 150 s. We instructed each participantto express the perceived intensity of sweetness by freely operating the pull-ring component of theevaluation system. Participants were not told the length of the evaluation time (i.e., how long they wereto evaluate perceived intensity). Instead, to inform the participant of the time remaining in each trial,the screen displayed an indicator showing the extent of progress.
2.5. Analysis
In this study, we regarded the time when the screen was switched to visual feedback of perceivedintensity as the starting point of the time–intensity evaluation (i.e., 0 s). We divided the evaluation periodfrom 0 s to 150 s into 75 windows of 2 s each, and calculated the average perceived intensity in each timewindow. We conducted statistical analysis using these average values.
To investigate whether temporal profiles of sweetness differed among the three types of samples(sucrose-sweetened, sucrose-sweetened, and acesulfame K–sweetened samples), two-way repeated
6
Beverages 2018, 4, 28
measures analysis of variance (ANOVA) for each solvent session (coffee beverage and water solutionsessions) was performed for average values of perceived intensity, with sweetener and time aswithin-subject factors. Simple effects tests were conducted based on the significance of results obtainedwith ANOVA. Additionally, when temporal profiles of sweetness did not differ among three types ofcoffee beverages, we performed two-way repeated measures ANOVA for each sweetener for the averagevalues of perceived intensity, with solvent session and time as within-subject factors.
We used IBM SPSS Statistics 23 (IBM Japan, Tokyo, Japan) for statistical analysis, and consideredp values less than 0.05 as statistically significant.
3. Results
3.1. Comparison of Temporal Profiles of Sweetness among Samples in Each Solvent Session
3.1.1. Sweetened Coffee Beverage
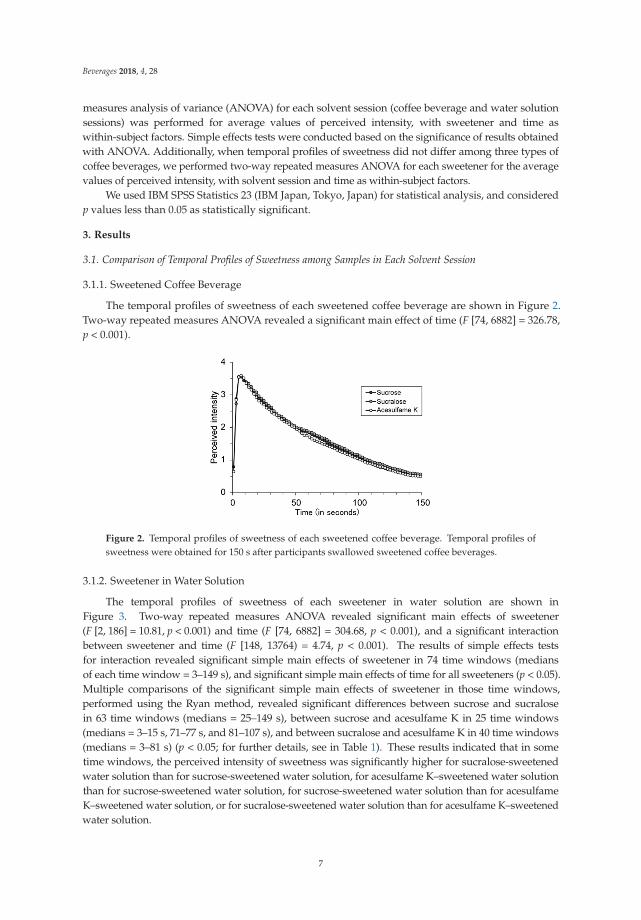
The temporal profiles of sweetness of each sweetened coffee beverage are shown in Figure 2.Two-way repeated measures ANOVA revealed a significant main effect of time (F [74, 6882] = 326.78,p < 0.001).
Figure 2. Temporal profiles of sweetness of each sweetened coffee beverage. Temporal profiles ofsweetness were obtained for 150 s after participants swallowed sweetened coffee beverages.
3.1.2. Sweetener in Water Solution
The temporal profiles of sweetness of each sweetener in water solution are shown inFigure 3. Two-way repeated measures ANOVA revealed significant main effects of sweetener(F [2, 186] = 10.81, p < 0.001) and time (F [74, 6882] = 304.68, p < 0.001), and a significant interactionbetween sweetener and time (F [148, 13764) = 4.74, p < 0.001). The results of simple effects testsfor interaction revealed significant simple main effects of sweetener in 74 time windows (mediansof each time window = 3–149 s), and significant simple main effects of time for all sweeteners (p < 0.05).Multiple comparisons of the significant simple main effects of sweetener in those time windows,performed using the Ryan method, revealed significant differences between sucrose and sucralosein 63 time windows (medians = 25–149 s), between sucrose and acesulfame K in 25 time windows(medians = 3–15 s, 71–77 s, and 81–107 s), and between sucralose and acesulfame K in 40 time windows(medians = 3–81 s) (p < 0.05; for further details, see in Table 1). These results indicated that in sometime windows, the perceived intensity of sweetness was significantly higher for sucralose-sweetenedwater solution than for sucrose-sweetened water solution, for acesulfame K–sweetened water solutionthan for sucrose-sweetened water solution, for sucrose-sweetened water solution than for acesulfameK–sweetened water solution, or for sucralose-sweetened water solution than for acesulfame K–sweetenedwater solution.
7

Beverages 2018, 4, 28
Figure 3. Temporal profiles of sweetness of each sweetener in water solution. Temporal profiles ofsweetness were obtained for 150 s after participants swallowed sweetened water solutions.
Table 1. Results of sweetener in water solution: multiple comparisons for the significant simple maineffects of sweetener in 74 time windows.
Time (s) Sucrose Sucralose Acesulfame K Time (s) Sucrose Sucralose Acesulfame K
3 2.78 a 2.81 a 2.56 b 77 0.89 a 1.23 b 1.06 c
5 3.43 a 3.44 a 3.16 b 79 0.86 a 1.19 b 1.02 a
7 3.44 a 3.45 a 3.16 b 81 0.82 a 1.15 b 0.99 c
9 3.28 a 3.34 a 3.03 b 83 0.78 a 1.11 b 0.97 b
11 3.10 a 3.21 a 2.88 b 85 0.75 a 1.09 b 0.95 b
13 2.97 a 3.05 a 2.76 b 87 0.72 a 1.06 b 0.93 b
15 2.85 a 2.92 a 2.67 b 89 0.69 a 1.02 b 0.90 b
17 2.71 a,b 2.81 a 2.56 b 91 0.67 a 0.99 b 0.89 b
19 2.60 a,b 2.71 a 2.46 b 93 0.64 a 0.95 b 0.85 b
21 2.51 a,b 2.62 a 2.36 b 95 0.62 a 0.90 b 0.81 b
23 2.41 a,b 2.54 a 2.30 b 97 0.59 a 0.87 b 0.79 b
25 2.30 a 2.46 b 2.23 a 99 0.56 a 0.84 b 0.76 b
27 2.20 a 2.41 b 2.16 a 101 0.53 a 0.82 b 0.74 b
29 2.11 a 2.35 b 2.11 a 103 0.53 a 0.79 b 0.71 b
31 2.04 a 2.31 b 2.04 a 105 0.51 a 0.76 b 0.68 b
33 1.97 a 2.25 b 1.97 a 107 0.49 a 0.75 b 0.66 b
35 1.90 a 2.18 b 1.91 a 109 0.48 a 0.73 b 0.63 a,b
37 1.86 a 2.12 b 1.84 a 111 0.47 a 0.71 b 0.60 a,b
39 1.77 a 2.07 b 1.80 a 113 0.45 a 0.69 b 0.58 a,b
41 1.70 a 2.03 b 1.73 a 115 0.43 a 0.67 b 0.56 a,b
43 1.63 a 2.00 b 1.67 a 117 0.42 a 0.66 b 0.54 a,b
45 1.59 a 1.94 b 1.61 a 119 0.41 a 0.65 b 0.53 a,b
47 1.55 a 1.89 b 1.57 a 121 0.39 a 0.63 b 0.50 a,b
49 1.49 a 1.84 b 1.54 a 123 0.36 a 0.61 b 0.48 a,b
51 1.45 a 1.80 b 1.51 a 125 0.34 a 0.59 b 0.47 a,b
53 1.42 a 1.74 b 1.46 a 127 0.32 a 0.57 b 0.46 a,b
55 1.37 a 1.68 b 1.43 a 129 0.30 a 0.56 b 0.45 a,b
57 1.33 a 1.64 b 1.40 a 131 0.29 a 0.55 b 0.44 a,b
59 1.27 a 1.60 b 1.36 a 133 0.28 a 0.52 b 0.42 a,b
61 1.23 a 1.56 b 1.33 a 135 0.28 a 0.49 b 0.41 a,b
63 1.17 a 1.51 b 1.27 a 137 0.27 a 0.48 b 0.41 a,b
65 1.12 a 1.46 b 1.23 a 139 0.26 a 0.47 b 0.41 a,b
67 1.07 a 1.42 b 1.20 a 141 0.26 a 0.46 b 0.40 a,b
69 1.03 a 1.38 b 1.17 a 143 0.25 a 0.45 b 0.40 a,b
71 0.99 a 1.33 b 1.15 c 145 0.24 a 0.44 b 0.39 a,b
73 0.95 a 1.29 b 1.12 c 147 0.24 a 0.43 b 0.38 a,b
75 0.92 a 1.26 b 1.09 c 149 0.23 a 0.42 b 0.37 a,b
Values for each time window are medians (e.g., 1 s means the time window from 0–2 s), and values for eachsweetener are sweetness intensities. In each time window, values with same letters did not differ statistically, butvalues with different letters differed significantly with p < 0.05.
8

Beverages 2018, 4, 28
3.2. Comparison of Temporal Profiles between Solvent Sessions for Each Sweetener
3.2.1. Sucrose
Two-way repeated measures ANOVA revealed significant main effects of solvent session(F [1, 93] = 41.28, p < 0.001) and time (F [74, 6882] = 344.18, p < 0.001), and a significant interactionbetween solvent session and time (F [74, 6882] = 4.74, p < 0.001). The results of simple effects tests forinteraction revealed significant simple main effects of solvent session in 70 time windows (mediansof each time window = 11–149 s) and significant simple main effects of time in both solvent sessions(p < 0.05). These results indicated that in some time windows, the perceived intensity of sweetness wassignificantly higher for sucrose-sweetened coffee beverage than for sucrose-sweetened water solution.
3.2.2. Sucralose
Two-way repeated measures ANOVA revealed significant main effects of solvent session(F [1, 93] = 16.72, p < 0.001) and time (F [74, 6882] = 301.38, p < 0.001), and a significant interactionbetween solvent session and time (F [74, 6882] = 2.43, p < 0.001). The results of simple effectstests for interaction revealed significant simple main effects of solvent session in 64 time windows(medians of each time window = 9–129 s and 133–137 s) and significant simple main effects of timein both solvent sessions (p < 0.05). These results indicated that in some time windows, the perceivedintensity of sweetness was significantly higher for sucralose-sweetened coffee beverage than forsucralose-sweetened water solution.
3.2.3. Acesulfame K
Two-way repeated measures ANOVA revealed significant main effects of solvent session(F [1, 93] = 36.17, p < 0.001) and time (F [74, 6882] = 300.36, p < 0.001), and a significant interactionbetween solvent session and time (F [74, 6882] = 4.48, p < 0.001). The results of simple effects tests forinteraction revealed significant simple main effects of solvent session in 67 time windows (mediansof each time window = 3–135 s) and significant simple main effects of time in both solvent sessions(p < 0.05). These results indicated that in some time windows, the perceived intensity of sweetness wassignificantly higher for acesulfame K–sweetened coffee beverage than for acesulfame K–sweetenedwater solution.
4. Discussion
4.1. Temporal Profiles of Sweetness of Sweetened Coffee Beverages
In this study, untrained panelists performed a time–intensity evaluation of sweetness usingthree coffee beverages and three water solutions. Temporal profiles of sweetness followed similartraces among all coffee beverages. To explain this result, we propose the following hypotheses.First, differences among sweeteners may have been masked by factors other than the sweetness of thesweeteners contained in the coffee beverages. This hypothesis would be supported by the observationof significant differences among sweeteners in the time–intensity evaluation of the sweetness of watersolutions. Second, untrained panelists might be unable to perceive differences among sweetenerswhen performing a time–intensity evaluation of the sweetness of coffee beverages or water solutions.However, this second hypothesis was not supported because temporal profiles significantly differedamong the water solutions, leaving the first hypothesis as a potential explanation. To further test thevalidity of the first hypothesis, for each sweetener we compared the temporal profiles of sweetnessbetween a coffee beverage and a water solution. The results demonstrated that for all sweeteners,the temporal profile was significantly higher for the coffee beverage than for the water solution.In other words, factors other than the sweetness of a sweetener might affect the temporal profiles ofsweetness of coffee beverages.
9

Beverages 2018, 4, 28
The following factors might affect the temporal profiles of sweetness of the coffee beverages.The first candidate is the sweetness of milk [37–39]. We hypothesized that the sweetness of the watersolutions was derived only from sweetener, whereas the sweetness of the coffee beverages was derivedfrom the addition of milk or the synergy between sweetener and milk. The second candidate isthe aroma of milk [40–44]. We hypothesized that addition of milk caused a decrease in coffee-likearoma [45,46] and an increase in sweet aroma [47], thereby enhancing the sweetness. The thirdcandidate is the “halo-damping effect” [48–50] of sensory attributes other than sweetness. When aparticipant performs psychophysical evaluation of a single sensory attribute per trial, the evaluationvalue might be biased by the effects of sensory attributes other than the one to which they wereinstructed to pay attention [13,14]. Therefore, we hypothesized that because participants performeda time–intensity evaluation of only sweetness in this study, the perceived intensity of sweetnessincreased due to the halo-damping effect. The fourth candidate is the novelty of the coffee beverages.We hypothesized that due to the use of unreleased products in this study, the novelty of the coffeebeverages distracted the untrained panelists and prevent them from discriminating sweetness amongsweeteners. The fifth candidate is the interactions between the sweetener and other ingredients.We hypothesized that such effects elicited a bitter taste. The sixth candidate is the viscosity of coffeebeverages. Because coffee beverages are more viscous than water solutions, sweeteners contained incoffee beverages might bind more strongly to taste receptors, and might not be washed out as rapidlyby the saliva. We hypothesized that this phenomenon might enhance lingering sweetness. The seventhcandidate is the natural sweetness of coffee. Some reducing sugars are present in roasted coffee, so thatthe water-soluble part of them may contribute to the overall flavor of the coffee [51]. We hypothesizedthat the sweetness of coffee beverages was derived from the addition of a sweetener or the synergybetween sweetener and coffee.
To model the temporal profiles of sweetness of beverages containing non-nutritive sweeteners onthe temporal profiles of sweetness of sucrose-sweetened beverages, multiple non-nutritive sweetenersare used in combination [52]. Specially, sucralose and acesulfame K have been combined in manylow-calorie foods and beverages to achieve a temporal profile of sweetness similar to that ofsucrose [53–55]. Based on this trend, in the near future, we intend to employ a time–intensity evaluationof sweetness with untrained panelists using coffee beverages containing combinations of sucraloseand acesulfame K.
4.2. Temporal Profiles of Sweetness of Sweeteners in Water Solutions
As controls in this study, we used three types of water solutions. The temporal profiles ofsweetness significantly differed among these water solutions. This result was inconsistent withthe results of some studies reporting that the duration of sweetness does not differ among sucrose,sucralose, and acesulfame K [17,18], and another study reporting that the duration of sweetness waslonger for sucrose than for sucrose and acesulfame K [56]. The temporal profiles of sweetness ofvarious sweeteners vary with concentration [57], and perceived intensities of sensory attributes differamong untrained and trained panelists [58,59]. These factors might explain why results differedbetween this and previous studies.
5. Conclusions
In this study, we investigated whether the temporal profiles of sweetness differed between anordinary coffee beverage containing a nutritive sweetener and low-sugar coffee beverages containingnon-nutritive sweeteners. A time–intensity evaluation of sweetness revealed that temporal profilesfollowed similar traces among sucrose-, sucralose-, and acesulfame K–sweetened coffee beverages.In other words, the result indicated that the sensory attributes of low-sugar products (coffee beveragescontaining non-nutritive sweeteners) are close to those of ordinary products (coffee beverage containingsucrose), at least from the viewpoint of lingering sweetness.
10

Beverages 2018, 4, 28
Additionally, to investigate why temporal profiles of sweetness did not differ among thethree coffee beverages, the untrained panelists performed a time–intensity evaluation of sweetnessusing three water solutions (sucrose-sweetened, sucralose-sweetened, and acesulfame K–sweeteneddeionized water) as control samples. We observed significant differences among the temporal profilesof the three water solutions, suggesting that differences in the temporal profiles of the three sweetenedcoffee beverages were masked by factors other than the sweetness of the sweeteners. Because thisstudy was performed using untrained panelists, who represent the end users of released beverages,the results may provide information useful for beverage development.
Acknowledgments: This study was mainly funded by Asahi Soft Drink Co., Ltd., which had no control over theinterpretation, writing, or publication of this work. This study was also partially supported by JSPS KAKENHIGrant Numbers 26245073 and 16K04418.
Author Contributions: Naomi Gotow participated in the study design and coordination, performed the statisticalanalysis, and drafted the manuscript; Shinji Esumi and Hirofumi Kubota conceived of the study and participatedin its design; Tatsu Kobayakawa, who is the corresponding author, conceived of the study, participated in itsdesign and coordination, undertook most of the revisions, and supervised the drafting of the manuscript.
Conflicts of Interest: This study was mainly funded by Asahi Soft Drink Co., Ltd.; this sponsor had no controlover the interpretation, writing, or publication of this work.
References
1. White, J.S. Sucrose, HFCS, and fructose: History, manufacture, composition, applications, and production.In Fructose, High Fructose Corn Syrup, Sucrose and Health; Rippe, J.M., Ed.; Humana Press: New York, NY,USA, 2014; pp. 13–33.
2. Clemens, R.A.; Jones, J.M.; Kern, M.; Lee, S.-Y.; Mayhew, E.J.; Slavin, J.L.; Zivanovic, S. Functionality ofsugars in foods and health. Compr. Rev. Food Sci. Food Saf. 2016, 15, 433–470. [CrossRef]
3. Gardner, C.; Wylie-Rosett, J.; Gidding, S.S.; Steffen, L.M.; Johnson, R.K.; Reader, D.; Lichtenstein, A.H.;on Behalf of the American Heart Association Nutrition Committee of the Council on Nutrition, PhysicalActivity and Metabolism, Council on Arteriosclerosis, Thrombosis and Vascular Biology, Council onCardiovascular Disease in the Young, & the American Diabetes Association. Nonnutritive sweeteners:Current use and health perspectives: A scientific statement from the American Heart Association and theAmerican Diabetes Association. Diabetes Care 2012, 35, 1798–1808. [PubMed]
4. Roberts, M.W.; Wright, J.T. Nonnutritive, low caloric substitutes for food sugars: Clinical implications foraddressing the incidence of dental caries and overweight/obesity. Int. J. Denti. 2012, 2012, 625701. [CrossRef][PubMed]
5. Japan Soft Drink Association. Question and Answer about Soft Drinks: Please Tell me the Difference between“Low Sugar” and “Non-Sugar” Coffee Beverages. Available online: http://www.j-sda.or.jp/ippan/qa_view.php?id=55&cat=1 (accessed on 5 December 2017).
6. Ministry of Health, Labor and Welfare. In Nutrition Labelling Standards. Available online: http://www.caa.go.jp/foods/pdf/syokuhin344.pdf (accessed on 5 December 2017).
7. European Union. Regulation (EC) No. 1924/2006 of the European Parliament and of the Council of20 December 2006 on nutrition and health claims made on foods. Off. J. Eur. Union 2006, 49, L404/9.
8. Institute of Medicine (US) Committee on Examination of Front-of-Package Nutrition Rating Systems andSymbols. Appendix B FDA regulatory requirements for nutrient content claims. In Front-of-Package NutritionRating Systems and Symbols; Wartella, E.A., Lichtenstein, A.H., Caitlin, S., Boon, C.S., Eds.; National AcademiesPress: Washington, DC, USA, 2010.
9. Insel, P.M.; Turner, R.E.; Ross, D. Carbohydrates: Simple sugars and complex chains. In Discovering Nutrition,3rd ed.; Jones and Bartlett Publishers: Sudbury, MA, USA, 2010; pp. 135–167.
10. Tharp, B.W.; Young, L.S. High-intensity sweeteners. In Tharp & Young on Ice Cream: An Encyclopedic Guide toIce Cream Science and Technology; DEStech Publications: Pennsylvania, PA, USA, 2013; pp. 176–177.
11. DuBois, G.E. Saccharin and cyclamate. In Sweeteners and Sugar Alternatives in Food Technology; Mitchell, H., Ed.;Blackwell Publishing: Oxford, UK, 2006; pp. 103–129.
12. Di Monaco, R.; Miele, N.A.; Volpe, S.; Picone, D.; Cavella, S. Temporal sweetness profile of MNEI andcomparison with commercial sweeteners. J. Sens. Stud. 2014, 29, 385–394. [CrossRef]
11

Beverages 2018, 4, 28
13. Meillon, S.; Urbano, C.; Schlich, P. Contribution of the temporal dominance of sensations (TDS) method tothe sensory description of subtle differences in partially dealcoholized red wines. Food Qual. Prefer. 2009,20, 490–499. [CrossRef]
14. Pineau, N.; Schlich, P.; Cordelle, S.; Mathonnière, C.; Issanchou, S.; Imbert, A.; Rogeaux, M.; Etiévant, P.;Köster, E. Temporal dominance of sensations: Construction of the TDS curves and comparison withtime–intensity. Food Qual. Prefer. 2009, 20, 450–455. [CrossRef]
15. Lee, W.E., III; Pangborn, M. Time–intensity: The temporal aspects of sensory perception. Food Technol. 1986,40, 71–78, 82.
16. Ayya, N.; Lawless, H.T. Potency of sweetness of aspartame, d-tryptophan and thaumatin evaluated by singlevalue and time–intensity measurements. Chem. Senses 1992, 17, 245–259. [CrossRef]
17. Duizer, L.M.; Bloom, K.; Findlay, C.J. The effect of line orientation on the recording of time–intensityperception of sweetener solutions. Food Qual. Prefer. 1995, 6, 121–126. [CrossRef]
18. Ketelsen, S.M.; Keay, C.L.; Wiet, S.G. Time–intensity parameters of selected carbohydrate and high potencysweeteners. J. Food Sci. 1993, 58, 1418–1421. [CrossRef]
19. Ott, D.B.; Ledwards, C.; Palmer, S.J. Perceived taste intensity and duration of nutritive and non-nutritivesweeteners in water using time–intensity (T-I) evaluations. J. Food Sci. 1991, 56, 535–542. [CrossRef]
20. Galmarini, M.V.; Zamora, M.C.; Chirife, J. Gustatory reaction time and time intensity measurements oftrehalose and sucrose solutions and their mixtures. J. Sens. Stud. 2009, 24, 166–181. [CrossRef]
21. Azevedo, B.M.; Schmidt, F.L.; Bolini, H.M.A. High-intensity sweeteners in espresso coffee: Ideal andequivalent sweetness and time–intensity analysis. Int. J. Food Sci. Technol. 2015, 50, 1374–1381. [CrossRef]
22. Rodrigues, J.B.; Paixão, J.A.; Cruz, A.G.; Bolini, H.M.A. Chocolate milk with chia oil: Ideal sweetness,sweeteners equivalence, and dynamic sensory evaluation using a time–intensity methodology. J. Food Sci.2015, 80, S2944–S2949. [CrossRef] [PubMed]
23. De Souza, V.R.; Pereira, P.A.P.; Pinheiro, A.C.M.; Bolini, H.M.A.; Borges, S.V.; Queiroz, F. Analysis of varioussweeteners in low-sugar mixed fruit jam: Equivalent sweetness, time–intensity analysis and acceptance test.Int. J. Food Sci. Technol. 2013, 48, 1541–1548. [CrossRef]
24. Palazzo, A.B.; Carvalho, M.A.R.; Efraim, P.; Bolini, H.M.A. The determination of isosweetness concentrationsof sucralose, rebaudioside and neotame as sucrose substitutes in new diet chocolate formulations using thetime–intensity analysis. J. Sens. Stud. 2011, 26, 291–297. [CrossRef]
25. Patil, S.; Ravi, R.; Saraswathi, G.; Prakash, M. Development of low calorie snack food based on intensesweeteners. J. Food Sci. Technol. 2014, 51, 4096–4101. [CrossRef] [PubMed]
26. De Melo, L.L.M.M.; Bolini, H.M.A.; Efraim, P. Equisweet milk chocolates with intense sweeteners usingtime–intensity method. J. Food Qual. 2007, 30, 1056–1067. [CrossRef]
27. Melo, L.; Bolini, H.M.A.; Efraim, P. Low-calorie chocolates and acceptability/sensory properties. In Chocolatein Health and Nutrition; Watson, R., Preedy, V.R., Zibadi, S., Eds.; Humana Press: New York, NY, USA, 2013;pp. 163–176.
28. Gotow, N.; Moritani, A.; Hayakawa, Y.; Akutagawa, A.; Hashimoto, H.; Kobayakawa, T. Development ofa time–intensity evaluation system for consumers: Measuring bitterness and retronasal aroma of coffeebeverages in 106 untrained panelists. J. Food Sci. 2015, 80, S1343–S1351. [CrossRef] [PubMed]
29. Japan Soft Drink Association. Question and Answer about Soft Drinks: Stevia. Available online: http://www.j-sda.or.jp/sp/qa_view.php?id=118&cat=8 (accessed on 5 December 2017).
30. Green, B.G.; Lim, J.; Osterhoff, F.; Blacher, K.; Nachtigal, D. Taste mixture interactions: Suppression, additivity,and the predominance of sweetness. Physiol. Behav. 2010, 101, 731–737. [CrossRef] [PubMed]
31. Lawless, H.T.; Schlake, S.; Smythe, J.; Lim, J.; Yang, H.; Chapman, K.; Bolton, B. Metallic taste and retronasalsmell. Chem. Senses 2004, 29, 25–33. [CrossRef] [PubMed]
32. Gotow, N.; Moritani, A.; Hayakawa, Y.; Akutagawa, A.; Hashimoto, H.; Kobayakawa, T. High consumptionincreases sensitivity to after-flavor of canned coffee beverages. Food Qual. Prefer. 2015, 44, 162–171. [CrossRef]
33. Lawless, H.L.; Heymann, H. Context effects and biases in sensory judgement. In Sensory Evaluation of Food:Principles and Practices, 2nd ed.; Springer: New York, NY, USA, 2010; pp. 203–225.
34. Plemmons, L.E.; Resurreccion, A.V.A. A warm-up sample improves reliability of responses in descriptiveanalysis. J. Sens. Stud. 1998, 13, 359–376. [CrossRef]
35. Lim, J.; Johnson, M.B. Potential mechanisms of retronasal odor referral to the mouth. Chem. Senses 2011,36, 283–289. [CrossRef] [PubMed]
12

Beverages 2018, 4, 28
36. Lim, J.; Johnson, M.B. The role of congruency in retronasal odor referral to the mouth. Chem. Senses 2012,37, 515–522. [CrossRef] [PubMed]
37. Chapman, K.W.; Lawless, H.T.; Boor, K.J. Quantitative descriptive analysis and principal component analysisfor sensory characterization of ultrapasteurized milk. J. Dairy Sci. 2001, 84, 12–20. [CrossRef]
38. Heymann, H.; Lawless, H.T. Context effects and biases in sensory judgment. In Sensory Evaluation of Food:Principles and Practices; Springer Science+Business Media: New York, NY, USA, 1999; pp. 301–340.
39. Lee, G.H.; Lee, J.S.; Shin, M.G. Sensory attribute comparison of consumer milk using descriptive analysis.Food Sci. Biotechnol. 2003, 12, 480–484.
40. Frank, R.A.; Byram, J. Taste–smell interactions are tastant and odorant dependent. Chem. Senses 1988,13, 445–455. [CrossRef]
41. Frank, R.A.; Ducheny, K.; Mize, S.J.S. Strawberry odor, but not red color, enhances the sweetness of sucrosesolutions. Chem. Senses 1989, 14, 371–377. [CrossRef]
42. Labbe, D.; Damevin, L.; Vaccher, C.; Morgenegg, C.; Martin, N. Modulation of perceived taste by olfaction infamiliar and unfamiliar beverages. Food Qual. Prefer. 2006, 17, 582–589. [CrossRef]
43. Schifferstein, H.N.; Verlegh, P.W. The role of congruency and pleasantness in odor-induced tasteenhancement. Acta Psychol. 1996, 94, 87–105. [CrossRef]
44. Stevenson, R.J.; Prescott, J.; Boakes, R.A. Confusing tastes and smells: How odours can influence theperception of sweet and sour tastes. Chem. Senses 1999, 24, 627–635. [CrossRef] [PubMed]
45. Bücking, M.; Steinhart, H. Headspace GC and sensory analysis characterization of the influence of differentmilk additives on the flavor release of coffee beverages. J. Agric. Food Chem. 2002, 50, 1529–1534. [CrossRef][PubMed]
46. Itobe, T.; Nishimura, O.; Kumazawa, K. Influence of milk on aroma release and aroma perception duringconsumption of coffee beverages. Food Sci. Technol. Res. 2015, 21, 607–614. [CrossRef]
47. Liu, J.; Liu, M.; He, C.; Song, H.; Guo, J.; Wang, Y.; Yang, H.; Su, X. A comparative study of aroma-activecompounds between dark and milk chocolate: Relationship to sensory perception. J. Sci. Food Agric. 2015,95, 1362–1372. [CrossRef] [PubMed]
48. Clark, C.C.; Lawless, H.T. Limiting response alternatives in time–intensity scaling: An examination of thehalo-dumping effect. Chem. Senses 1994, 19, 583–594. [CrossRef] [PubMed]
49. Prescott, J. Flavour as a psychological construct: Implications for perceiving and measuring the sensoryqualities of foods. Food Qual. Prefer. 1999, 10, 349–356. [CrossRef]
50. Prescott, J.; Johnstone, V.; Francis, J. Odor-taste interactions: Effects of attentional strategies during exposure.Chem. Senses 2004, 29, 331–340. [CrossRef] [PubMed]
51. Heath, H.B. The Physiology of Flavour: Taste and Aroma Perception. In Coffee: Volume 3, Physiology;Clarke, R.J., Macrae, R., Eds.; Elsevier Applied Science Publisher: Essex, UK, 1988; pp. 141–170.
52. Bakal, A.I. Mixed Sweetener Functionality. In Alternative Sweeteners, 3rd ed.; Revised and Expand;O’Brien-Nabors, L., Ed.; Marcel Dekker, Inc.: New York, NY, USA, 2001; pp. 463–480.
53. Kemp, S.E.; Lindley, M.G. Developments in sweeteners for functional and speciality beverages. In Functionaland Speciality Beverage Technology; Paquin, P., Ed.; Woodhead Publishing Limited: Cambridge, UK, 2009;pp. 39–54.
54. Kim, P. Sweetness sense. Sweeteners: Customizing Sweetness Profiles. In Food Product Design; Deis, R.C.,Ed.; Virgo Publishing: Phoenix, AZ, USA, 2006; Volume 15, Number 11; p. 1.
55. Karstadt, M.L. Testing needed for acesulfame potassium, an artificial sweetener. Environ. Health Perspect.2006, 114, A516. [CrossRef] [PubMed]
56. Goldsmith, L.A.; Merkel, C.M. Sucralose. In Alternative Sweeteners, 3rd ed.; Revised and Expand;O’Brien-Nabors, L., Ed.; Marcel Dekker, Inc.: New York, NY, USA, 2001; pp. 185–207.
57. Mahindru, S.N. High intensity-low calorie sweeteners. In Food Additives: Characteristics, Detection andEstimation; APH Publishing Corporation: New Delhi, India, 2008; pp. 53–104.
13

Beverages 2018, 4, 28
58. Losó, V.; Gere, A.; Györey, A.; Kókai, Z.; Sipos, L. Comparison of the performance of a trained and anuntrained panel on sweetcorn varieties with the panelcheck software. APSTRACT 2012, 1–2, 77–83.
59. Roberts, A.K.; Vickers, Z.M. A comparison of trained and untrained judges’ evaluation of sensory attributeintensities and liking of cheddar cheeses. J. Sens. Stud. 1994, 9, 1–20. [CrossRef]
© 2018 by the authors. Licensee MDPI, Basel, Switzerland. This article is an open accessarticle distributed under the terms and conditions of the Creative Commons Attribution(CC BY) license (http://creativecommons.org/licenses/by/4.0/).
14
beverages
Article
Dose-Response Relationships for Vanilla Flavor andSucrose in Skim Milk: Evidence of Synergy
Gloria Wang 1,2, John E. Hayes 1,2, Gregory R. Ziegler 1, Robert F. Roberts 1 and
Helene Hopfer 1,2,*
1 Department of Food Science, The Pennsylvania State University, University Park, PA 16802, USA;[email protected] (G.W.); [email protected] (J.E.H.); [email protected] (G.R.Z.); [email protected] (R.F.R.)
2 The Sensory Evaluation Center, The Pennsylvania State University, University Park, PA 16802, USA* Correspondence: [email protected]; Tel.: +1-814-863-5572
Received: 31 August 2018; Accepted: 26 September 2018; Published: 4 October 2018
Abstract: Regarding cross-modality research, taste-aroma interaction is one of the most studied areasof research. Some studies have reported enhancement of sweetness by aroma, although it is unclearas to whether these effects actually occur: depending on the cognitive strategy employed by panelists,the effects may disappear, e.g., forcing panelists into an analytical strategy to control for dumping maynot be able to reveal perceptual interactions. Previous studies have largely focused on solutions andmodel foods, and did not test stimuli or concentrations relevant to real food applications. This studyaddresses these gaps: 18 vanilla flavored sucrose milks, varying between 0–0.75% (w/w) two-foldvanilla, and 0–5% (w/w) sucrose, were rated by 108 panelists for liking and perceived sweetness,vanilla flavor, milk flavor, and thickness. Interactions between vanilla and sucrose were measuredusing deviations of real mixtures from additive models (via the isobole method), indicating vanillaaroma does enhance perceived sweetness. However, the sweetness enhancing effect of vanilla aromawas not as pronounced as that of sucrose on vanilla flavor. Measurable cross-modal interactionsoccur despite using an analytical cognitive strategy. More work is needed to investigate the influenceof perceptual strategy on the degree of taste-aroma interactions in real foods.
Keywords: cross-modality; taste-aroma interactions; sweetness enhancement; vanilla flavor; flavoredmilk; sugar; isoboles; synergy
1. Introduction
Flavor perception is the result of chemical and physical food properties, and how they interactwith our senses [1]. Flavor involves the integration of multiple modalities, including smell, taste, andtouch, and studying each in isolation does not reflect what humans experience during eating. As aresult, cross-modal interactions (i.e., the interaction of taste, aroma, vision, texture, and chemesthesis)are a popular area of study in flavor research. Taste-aroma interactions are the most commonlydescribed interaction between sensory modalities, and occur as a result of physical, physiological,cognitive, and psychological effects [2,3]. Research on multisensory processes, including taste-aromainteractions, has been used to better explain the processes humans use to assess food flavor [4–6].Due to the common confusion between smell and taste, taste perception is influenced by odor andvice versa [7–11]. In order for perceived taste intensity to be modified by an odor (or vice versa),not only are the method of stimulation and the instructions given important, but also the perceptualsimilarity between a tastant and odorant [3,10]. As defined by Schifferstein and Verlegh [12], the extentto which two stimuli interact in combination in a food is called congruency. Some work on taste-aromainteractions suggested that sweetness intensity can be enhanced by a congruent odor, although manyof these studies have only been done in model sucrose solutions [7,9–11,13–21] or model foods [22–26].
Beverages 2018, 4, 73; doi:10.3390/beverages4040073 www.mdpi.com/journal/beverages15

Beverages 2018, 4, 73
Due to the complexity of food products, only a few taste-aroma interaction studies have beenconducted in real foods, such as whipped cream, milk, fruit juices, ciders, custards and cherrydrinks [7,27–30]. Although these studies moved taste-aroma interaction research into a more realisticmatrix, the concentration ranges for both the odor and the taste component used in these studies wasnot always commercially relevant. This may be important since odor compounds have been shown toimpact flavor perception at both subthreshold and suprathreshold concentrations, i.e., taste-aromainteractions have also been shown to be concentration dependent [29,31–33]. The lack of studiesin real food products over a concentration range comparable to those used in commercial productsprevents a comprehensive understanding and utilization of such cross-modal interaction phenomenain real foods.
Fluid milk is a relatively simple food well suited for studying taste-aroma interactions. Whileplain milk consumption has been on the decline, flavored milk consumption has been increasing, andis expected to continue to grow as flavor becomes more important to consumers, notably in the US [34].A familiar congruent aroma-taste pair in Western cultures used in numerous dairy products is vanillaand sucrose. Vanilla is the most popular flavor for dairy applications such as yogurt and ice cream, andis a complementary ingredient in flavored milks [35]. The combination of vanilla and sucrose is alsocommonly studied in cross-modal research [36–38]; therefore, using vanilla and sucrose in a flavoredmilk application increases the ecological validity of studying cross-modal interactions in foods.
Despite an abundance of literature suggesting an enhancement of perceived sweetness by acongruent aroma (including vanilla), there are other contradictory studies as well. This discrepancyexists because assessment of taste-aroma interactions strongly depends on the cognitive task (i.e., testquestions and instructions) used by assessors when evaluating samples. Previous studies using ratingscales have shown reduced or no mixture-induced taste enhancement when assessors are asked toevaluate perceived sweetness as well as perceived aroma intensity [7,10]. Thus, some researchers haveattributed any sweetness enhancement to a “dumping effect” [37]. That is, when a scale for a pertinentflavor attribute is not provided in the test (e.g., vanilla flavor), assessors will “dump” their perceptionsinto another similar category (e.g., sweetness) instead, leading to an increase in attribute intensity [37].In contrast to this analytical mindset, adopting a synthetic mindset is more in-line with real eatingbehavior where the food is experienced as a whole and a hedonic and holistic evaluation of the foodoccurs. In the analytical mindset, enhancement effects have been found [7,13,15,17,18,27,39], but inmany of these early studies participants did not rate the intensity of all salient product attributes (taste,aroma, and texture), which may have resulted in dumping. This makes them somewhat inconclusive,raising the question of whether enhancements or any interactions truly occur.
To address these unresolved questions, additional experiments that provide a full range of relevantproduct attributes are needed. Several studies have found strong evidence for odor (but not taste)enhancements in aqueous solutions and food matrices, even when controlling for dumping. Forexample, Green and colleagues [30] found enhanced odor perception in solutions, vanilla custard, anda cherry drink, by the addition of sucrose. Lim’s group [40] found a similar effect for citral and sucrosesolutions, and later [41] for citral and coffee solutions. Although these studies demonstrated that ananalytical strategy did not prevent taste-aroma interactions, their use of a sip and spit procedure is notrepresentative of normal eating behavior, which has been shown to influence the sensory profile ofsamples, depending on the taste and flavor characteristics [42,43].
Separately, testing for interaction between mixture components also requires a different modelapproach above and beyond simple significance testing of mean attribute ratings. Instead, one needs totest whether the degree of interaction between two stimuli is above (or below) what would be predictedin an additive model. A common approach for testing drug interactions is the isobole method [44–48].The isobole approach uses concentrations, effects, and empirical concentration-effect relationships, andis independent of the mechanism of interaction; instead, it is based on the concept of concentrationaddition. The points on an isobole indicate the mixing values of multiple components at which aspecific quantitative effect is produced that is either synergistic, antagonistic, or simply additive.
16

Beverages 2018, 4, 73
Isoboles have been used in a few studies to measure the interaction between food ingredients onchemosensation [49–51]. As the isobole approach is a useful concept for evaluating the type and degreeof interactions between substances, regardless of their mechanisms of action [48], cross-modality of asweet tastant and a congruent aroma can thus also be described and tested with the isobole method.
This study aimed to address the gaps outlined above by: (i) conducting a dose-responseexperiment in fluid milk to measure the cross-modal interactions between a sweet tastant and acongruent aroma; (ii) using a complete concentration design space relevant for flavored milks; (iii)controlling for potential dumping effects; and (iv) using the isobole method to measure the type anddegree of interaction.
2. Materials and Methods
2.1. Experimental Design and Sample Production
Eighteen sucrose-vanilla combinations were generated to model human sensory responses to thevarious mixtures with higher-order models (Table A1). Part of the design was composed of four levelsacross each of the two ingredients (in half-log steps) to generate dose-response functions for sucrose(granulated cane sugar) in milk and vanilla in milk. Additionally, a 3 × 3 factorial design was overlaidto create sucrose-vanilla mixtures in milk to generate the response surfaces for each sensory attribute.Collectively, this provides a total of 17 milk samples at systematically varied combinations of vanillaand sucrose. An additional control (plain milk) was added to bring the total number to 18. Milkswere formulated with sucrose ranging 0–5% (w/w) and two-fold vanilla extract (i.e., twice the quantityof vanilla beans extracted in water and ethanol) ranging 0–0.75% (w/w), spanning a wide range ofsucrose and vanilla concentrations, including those used industrially [52]. Two-fold vanilla extract asopposed to single-fold was used to minimize the amount of extractives added to the samples.
All milks were mixed with varying levels of sucrose in eight 32 kg-batches for pasteurization.Following pasteurization, 10 kg batches of each sucrose-vanilla combination were produced for sensorytesting. Two-fold vanilla extract (David Michael & Co, now Tastepoint by International Flavors andFragrances; Philadelphia, PA, USA) was used as the vanilla flavor. Pasteurized skim milk (0.18%fat, 8.91% solids) and sucrose (Golden Barrel, Honey Brook, PA, USA) were provided by the BerkeyCreamery (University Park, PA, USA). Prior to pasteurization, all amounts of milk and sugar werepre-weighed into stainless steel milk cans and plastic tubs, respectively. On the day of pasteurization,sugar was dissolved into one third of the milk from each milk can and then transferred back to the milkcan for further mixing with metal agitators. Sucrose-milk premixes were then blended into each milkcan by mixing with metal agitators on high speed for 10 min for complete dispersion and dissolutionof the sugar. All mixes were pasteurized (high temperature short time (HTST), APV Junior Pasteurizer,APV Invensys, Woodstock, GA, USA) at 75 ◦C for 25 s, and homogenized (Gaulin, Lake Mills, WI,USA) in a two-stage process at 10.3 and 3.5 mPa (2000 and 500 psi), cooled (<7 ◦C), and collectedinto milk cans. From there, 13 mixes were flavored with pre-weighed vanilla extract and dividedinto 17 different sucrose-vanilla combinations. Each milk was packaged into 1
2 -gallon opaque plasticmilk jugs and stored at refrigeration temperature (<5 ◦C) for 5–7 days prior to sensory testing. All 18samples were collected for physical analysis (percent total solids and percent fat; SMART Trac, CEMCorporation, Matthews, NC, USA) to ensure sucrose concentrations were within the required ranges.All 18 samples were also tested for coliforms (high-sensitivity Petrifilm; 3M, Maplewood, MN, USA)to ensure samples were suitable for human consumption. Viscosity of all milk samples was tested toaccount for potential physicochemical interactions that may lead to differences in flavor perception.
The viscosity was calculated as the slope of the shear stress vs. shear strain rate flow curve withshear strain rate ranging from 0 to 100 s−1 at 5 ◦C to mimic sample serving temperature. The flowcurves were plotted with Trios Software (TA Instruments, New Castle, DE, USA), omitting stressovershoot/noise at low shear strain rate (0 to 15 s−1). Two measurements for each sample were takenon a Discovery H3 Hybrid rheometer (TA Instruments, New Castle, DE, USA), equipped with a double
17

Beverages 2018, 4, 73
wall concentric cylinder (inner diameter 40.77 mm, outer diameter 43.88 mm, cup diameter 30.21 mm;Table A1).
2.2. Consumer Acceptability and Intensity Ratings
A central location test was conducted with 108 participants (women = 76, age = 19–71) over threedays; panelists tasted six milk samples per day in complete block design. Sample presentation wascounterbalanced across panelists using a modified Williams-Latin Square design, presenting eachsample at each position 6–7 times, and all 18 samples were served on each day to avoid potentialconfounding between samples and test days. Approximately 45–50 mL of milk were poured into3.25-oz. (~96 mL) plastic cups (Fabri-Kal, Kalamazoo, MI, USA) and lidded; cups were labeled withrandom three-digit blinding codes. All data were collected with Compusense Cloud (CompusenseInc., Guelph, ON, Canada).
Participants were screened for dietary restrictions, food allergies and product use (i.e., thosewho consumed skim or 1% milk at least once a week, and indicated they would be interested intasting vanilla flavored milk). Procedures were exempted from institutional review board reviewby professional staff in the Penn State Office of Research Protections under the wholesome foodsexemption in 45 CFR 46.101(b) (protocol number 33164). Participants provided informed consentprior to testing and were compensated for their time. All samples were served at 5 ◦C and tasted inindividual tasting booths under red light and at ambient temperature (~21–22 ◦C). Panelists weregiven deionized water at room temperature (20 ◦C) to rinse before and in between each sample. Degreeof liking for each sample was measured first on a nine-point hedonic scale, with labels for each valueranging from “like extremely” to “dislike extremely” [53]. Panelists then rated the perceived intensitiesfor sweetness, vanilla flavor, milk flavor, and thickness on an unstructured line scale (valued from 0 to100), anchored with “very weak” on the left and “very strong” on the right.
2.3. Statistical Analysis
Data were analyzed using R (version 3.3.3) [54] and RStudio (version 1.1.453, Boston, MA,USA). A two-way Analysis of Variance (ANOVA) (p < 0.05) with all two-way interactions for sucroseand vanilla as fixed effects on viscosity and all sensory attributes was conducted, and followed bycalculation of Tukey’s honestly significant differences (HSD) with the agricolae package (version1.2-8) [55]. The rsm package (version 2.8) [56] was used to create 3D response-surface plots of percentsucrose, percent vanilla, and each sensory attribute, modelling up to a second-order regression modelby multiple linear regression, and using unaveraged responses from each assessor. Final equationswere chosen based on lack of fit testing (p > 0.05), variance explained and overall fit [57]. Usingthe isobole approach [58], the degree of interaction between sucrose and vanilla was calculated forperceived sweetness ratings. According to the criteria set by Suhnel, I = 1 indicates no interaction, I < 1indicates synergism, and I > 1 indicates antagonism. In the equation, “ci” denotes the concentration ofcomponent “i” in the mixture, and “Ci” represents the concentration of “i” that would individuallyproduce the same intensity as the mixture, calculated from the corresponding dose-response functionsof vanilla-only and sucrose-only milks as found by multiple linear regression of the non-mixturesamples. Since the milk samples consist of sucrose and vanilla, the general equation can be rewritten as:
[% Sucrose in mixture][% Sucrose to achieve same sweetness
as in mixture
] +[% Vanilla in mixture][
% Vanilla to achieve same sweetnessas in mixture
] = I (1)
Three-dimensional isobolograms were generated for perceived sweetness using OriginPro (OriginLab Corporation, version 2017 64-bit 94E, Northampton, MA, USA). To generate these plots, linearregression on the sweetness ratings found for the vanilla-only and sucrose-only samples was appliedto generate a 3D sweetness plane. The mean attribute ratings for each of the sucrose-vanilla mixtures
18

Beverages 2018, 4, 73
were then plotted onto the plane. Any points above the plane indicate synergism, while any valuesthat fall below the plane are indicative of antagonism, and any that contact the plane indicate nointeraction. Variation within the I values was accounted for by establishing a range of 0.9 < I < 1.1(=±10%) as the zero-interaction criterion, similar to Fleming et al. [49].
3. Results
3.1. Physical Characterization
Overall, milk samples differed significantly in instrumental viscosity (p < 0.05), but only betweenthe highest (5%) and lowest (0%) sucrose concentrations (Table A1). The observed viscosity differenceswere minor compared to the other factors, and were reflected in the sensory measurement of thickness,which also only differed significantly between the same high and low sucrose samples (Table A1).
3.2. Response Surface Models for Vanilla-Sucrose Milks
Three-dimensional response surface models were created for overall liking and perceivedsweetness, vanilla flavor, milk flavor, and thickness (Figure 1). In general, the experimental designspace used here was effective in quantifying potential interactions between sucrose and vanilla andtheir effects on sweet taste and liking in milk across a wide range of concentrations. Sweet taste,milk flavor, and thickness were all sufficiently modeled by a first-order model, indicating a linearrelationship, while for overall liking and perceived vanilla flavor intensity a second-order model bestrepresented the observed responses. Second-order models for liking and vanilla flavor perceptionwere expected as both often follow an inverted U-shaped optimum: at too high sugar concentrationsa product becomes too sweet for consumers. Likewise, vanilla dosing can have a strong effect on itsflavor profile. Prior reports suggest that at low levels, vanilla extract adds slight modification notes,regular dosages impart the characteristic and expected flavor profile, while at high levels, off-notes(e.g., woody, phenolic, and alcoholic notes) may negatively influence liking [59].
For the three linear models for sweetness, milk flavor, and thickness, an increase in sucrose wasaccompanied by a significant increase in sweetness (R2 = 0.37, F(2, 1941) = 567.5, p < 0.05; m = 10.54for sucrose, m = 5.11 for vanilla) and thickness (R2 = 0.022, F(2, 1941) = 23.2, p < 0.05; m = 1.97 forsucrose, m = −2.42 for vanilla), and a decrease in milk flavor (R2 = 0.015, F(2, 1941) = 16.24; m = −1.04for sucrose, m = −10.37 for vanilla) (Figure 1b,d,e). These findings were all expected and are similar tothose found for coffee-flavored milks [60], where both thickness and milk flavor were influenced bysucrose and coffee extract concentration, respectively. That is, increasing sugar concentration led tohigher viscosities, and both vanilla and coffee flavor extracts decreased/masked milk flavor.
For the two second-order models, both liking and vanilla flavor increased up to a concentrationafter which ratings for both decreased. For liking, the design space covered the preferred concentrationrange, as the optimal liking, i.e., the maximal point on the liking surface, was found at 3.79% sucroseand 0.53% vanilla (Figure 1a). When compared to the maximum liked sample served to participants,this optimum was quite close in terms of sucrose concentration (3.82%), but was slightly lower thanthe tasted sample’s vanilla concentration of 0.625%. The maximal point for the second-order modelfor vanilla flavor was found to be at 4.98% sucrose and 0.52% vanilla (Figure 1c), which is above thehighest tested sucrose-vanilla mixture in terms of sucrose concentration (3.82%) and just below thehighest tested sucrose concentration of 5%, but within the range of tested vanilla concentrations of0.3%, 0.435% and 0.625%.
Inspecting the response surfaces, it becomes apparent from the first-order model for sweetnessthat increasing the vanilla concentration leads to a slight but statistically significant enhancement ofsweetness (coefficient = 5.11; p < 0.05). This can be seen in Figure 1b as the bottom and top edges ofthe plane are tilted slightly upward as vanilla concentration increases). Conversely, the addition ofsucrose increased the perception of vanilla significantly and substantially in the regression model forvanilla flavor (coefficient = 11.25; p < 0.05) (Figure 1c). These findings are in agreement with Green
19

Beverages 2018, 4, 73
et al. [30] and Welge-Lussen et al. [61] who found that the perception of retronasal vanilla odor wasdriven to a larger degree by the addition of sucrose than the addition of more vanilla flavor. Similarly,Alcaire et al. [62] found a decrease in vanilla flavor perception when a vanilla flavored milk dessertwas reduced in sugar by 20%. The same pattern has been observed for other tastes: Linscott andLim [63] found that the tastes impacted odor perception more than the odors affected tastes whenpairing NaCl and monosodium glutamate (MSG) with chicken and soy sauce odors, respectively.Earlier, Pfeiffer et al. [14] reported synergistic effects of sucrose and acid on strawberry flavor, andthat strawberry flavor was perceived more intensely when sucrose and acid were used together.Furthermore, it seems unlikely that these findings could be explained by a physiochemical “salting out”effect from the addition of sugar, as three different studies found that instrumentally measured volatileconcentration and release profiles remained constant even when tastants concentrations (e.g., sucroseor acids) were varied [14,23,64]. Generally, our findings agree with others who reported significantodor enhancement by taste [40,41,65], and seem to indicate a cognitive basis for the observed flavorenhancement rather than physicochemical interactions that influence to the solubility of componentsin the vanilla milk mixtures.
(a)
(b) (c)
(d) (e)
Figure 1. 3D response surfaces established from the 18 samples evaluated by 108 consumers, for allsensory response variables and sucrose (S) and vanilla (V) concentration. Dose-response functionsare included for each surface: (a) overall liking OL = 4.40 + 0.669·S + 1.42·V + 0.198·S·V − 0.102·S2 −2.05·V2; R2 = 0.11, F(5, 1938) = 47.92, p < 0.05; (b) perceived sweetness SW = 18.1 + 10.5·S + 5.11·V; R2
= 0.37, F(2, 1941) = 567.5, p < 0.05; (c) perceived vanilla flavor VF = 13.8 + 11.3·S + 50.6·V − 1.17·S −1.07·S2 − 42.6·V2; R2 = 0.21, F(5, 1938) = 104.7, p < 0.05; (d) perceived milk flavor MF = 46.9 − 1.04·S −10.4·V; R2 = 0.02, F(2, 1941) = 16.24, p < 0.05; and (e) perceived thickness TH = 29.4 + 1.97·S − 2.42·V;R2 = 0.02, F(2, 1941) = 23.2, p < 0.05.
20

Beverages 2018, 4, 73
3.3. Testing for Interactions with the Isobole Approach
The response surface models indicated deviations from simple additive effects when sucroseand vanilla are combined; however, the degree of such interactions need to be formally tested with amethod that accounts for the shape of the zero-interaction response surface (i.e., the isobole method).In Table 1, the indices of interaction (I) for sweetness, as calculated by Equation (1), are shown for allnine sucrose-vanilla mixtures. If using Suhnel’s [58] liberal criterion for interaction (i.e., any I �= 1),every mixture except for two (S3.82V0.3 and S3.82V0.625) exhibited synergism for perceived sweetness(I < 1), with the other two showing antagonism (I > 1) and no interaction (I ~1). However, applying ourmore realistic cut-off criterion, four samples at the low to medium sugar concentrations (1.31% and2.24% sucrose at both 0.3% and 0.435% vanilla) showed evidence of synergy, with I values between0.776 and 0.886. Further, interactions between sucrose and vanilla were stronger at lower vanillaconcentrations, as observed for both sucrose concentrations. This indicates that lower levels of vanillainduce larger cross-modal interactions with sugar.
Table 1. Indices of interaction (I) for perceived sweetness in the nine sucrose-vanilla mixtures. S = sugar,V = vanilla, Cs and Cv represent the concentration of sugar and vanilla, respectively, that wouldindividually produce the same intensity as the vanilla-milk mixture. CS and CV were calculated usingthe dose-response functions for sweetness with the sucrose-only mixtures (Sweetness SWsugar =
17.35 + 10.52·S; R2 = 0.43, F(1, 538) = 406.24, p < 0.05) and the vanilla-only mixtures (SweetnessSWvanilla = 15.71 + 6.41·V; R2 = 0.007, F(1, 538) = 4.92, p < 0.05); I was calculated using Equation (1).
Sample Sucrose (% w/w) Vanilla (% w/w) Sweetness (-) Cs Cv I
S1.31V0.300 1.31 0.300 37.4 1.91 3.38 0.776 +
S1.31V0.435 1.31 0.435 37.2 1.89 3.35 0.823 +
S1.31V0.625 1.31 0.625 36.3 1.80 3.21 0.922 0
S2.24V0.300 2.24 0.300 46.8 2.80 4.85 0.862 +
S2.24V0.435 2.24 0.435 46.9 2.81 4.87 0.886 +
S2.24V0.625 2.24 0.625 44.8 2.61 4.54 0.997 0
S3.82V0.300 3.82 0.300 58.8 3.94 6.73 1.01 0
S3.82V0.435 3.82 0.435 60.9 4.14 7.06 0.984 0
S3.82V0.625 3.82 0.625 58.1 3.88 6.62 1.08 −+ synergistic interaction; 0 zero interaction, − antagonistic interaction.
A more intuitive, graphical representation of these interactions is provided in Figure 2. Here, azero-interaction response surface (the two-dimensional plane depicted in blue) was produced fromthe individual dose-response functions of the vanilla-only (Sweetness SWvanilla = 15.71 + 6.41·V)and sucrose-only (Sweetness SWsugar = 17.35 + 10.52·S) samples. Observed responses for specificvanilla-sucrose mixtures are visualized by individual dots; any mixtures that are located above theplane indicate synergism (I < 1), any mixtures below the plane are indicative of antagonism (I > 1), andany that lay on the zero-interaction surface demonstrate no interaction. Similar to the I-values shownin Table 1, all but two mixtures are above the additive plane, in line with Suhnel’s criteria, and four ofthese also satisfied our working criterion (mixtures circled in black).
Overall, synergism seems to occur at the lower to medium sucrose and vanilla concentrationranges as suggested by the lower interaction values, indicating a concentration dependence effect ofthe vanilla and sugar on sweetness perception.
21

Beverages 2018, 4, 73
Figure 2. Isobologram for the vanilla-sucrose milks determined from their respective dose-responsefunctions. Deviations above the zero-interaction surface correspond to I-values below 1 (synergy).Deviations below the surface correspond to I-values above 1 (antagonism). Those on or near the surfaceindicate no interaction (I = 1). Mixtures that satisfied the working criterion are circled in black.
4. Discussion
Overall, this study demonstrates in a real food product how closely sweet taste is associated withvanilla, i.e., the combination of vanilla and sugar creates a stronger vanilla flavor than vanilla alone.Vanilla also increases the perceived sweet taste of sugar, but the effect is smaller. It has consistentlybeen reported that vanilla odor smells “sweet”, at least by western participants, even though theolfactory system does not contain any receptors for sweet tastants [16,66]. This induction of sweetnessby odors, even when they cannot be detected by taste receptors, seems related to previous combinedexposure to vanilla aroma and a sweet tastant, such as those that could occur during eating [16,20,67].
Even when panelists were given a presumably complete list of attributes to rate (in an attemptto account for potential dumping effects), we still found evidence for interaction between the tasteand the aroma. That is, adopting an analytical perceptual strategy did not appear to prevent tasteenhancements from occurring. Aroma had a significant impact on taste and vice versa, though tasteinduced-odor enhancement appeared larger than odor induced-taste enhancement. Our findingsare similar to other studies in that increasing sucrose concentration resulted in higher ratings offlavor [32,33,36,68]. Further, it should be noted that although increasing vanilla led to a significantsweetness enhancement, the magnitude of this taste enhancement by a congruent odor may be smallin comparison to the use of a non-nutritive sweetener.
Despite results from other literature suggesting that any sweetness enhancement by an odormay be the result of a dumping artifact, our findings do not support that view. Rather, we were ableto measure a small, but significant effect of vanilla aroma on sweetness perception. Valentin andNguyen [69], when studying the effect of vanilla and lemon aroma on sourness ratings using twodifferent tasks, came to a similar conclusion: providing more appropriate scales decreases odor-inducedtaste enhancement, but does not completely suppress it. Tasks that do not depend on intensity ratingshave similarly found evidence of cross-modal interactions: in a sweet taste detection task, sucrosedetection was increased when combined with a congruent strawberry odor versus an incongruent ham
22
Beverages 2018, 4, 73
odor [70]. Similarly, in a categorization task, participants’ categorization performance was poorer whenthe concentration of vanillin changed along with the sucrose concentration, implying that participantswere unable to ignore the olfactory component when trying to categorize solutions according to thetastants [71]. Collectively, these studies and present results indicate that taste-odor interactions cannotbe explained solely by response biases [72].
We also provide novel evidence of synergistic effects of mixture components by testing forinteractions effects that go beyond the simple additivity by using the isobole method. Of thevanilla-sucrose milk mixtures we tested, four had indices of interaction (I-values) of less than 0.9 (aconservative cutoff), indicating a synergism when the two components were mixed together. As theisobole method was adapted from pharmacology, it would be important to determine where the indexof interaction (I) provides a meaningful sensory effect. Future experiments with mixtures of varying Ivalues are needed to determine differences that are perceivable by consumers. As Suhnel’s criterion iscalculated based on empirical data collected separately for each food matrix, it would be important totest whether the cut-off criteria used here generalizes across products. Based on our data, taste-aromainteractions are more likely to occur at low to medium sucrose-vanilla concentrations, which is in linewith others (e.g., [73]) who similarly have found a concentration dependence.
Since taste and smell involve distinct mechanisms and do not share receptors, any interactions thattake place would seem to be cognitive and not peripheral [3]. Neuroimaging studies have supportedthis view, in that certain brain regions are subsequently activated by taste-aroma combinations. Forexample, presenting a taste-odor combination activates the anterior region of the orbitofrontal cortex(OFC), a region that is not activated by taste or smell alone [38]. Similarly, blood oxygen leveldemand showed superadditivity in the OFC and amygdala for taste-odor combinations, comparedto the individual components [74], and superadditivity of neural activity was also found in the OFC,insula, and anterior cingulate cortex (ACC) regions when presented with bimodal stimulation [38].Additionally, congruency between tastants and odor further increases activation of these brain areas,suggesting that prior exposure is a necessary prerequisite for taste-aroma interactions [75]. Theseresults all indicate that the combination of taste and smell leads to effects that are larger than thesum of their perceptual parts [1]. Even when the mathematical determination of synergism might beunclear, synergistic effects of tastants and odors are supported by neuroimaging research.
While the enhancement of taste by a congruent odor in this study was not strong, this may alsobe attributed to the cognitive task used. Early evidence of the dependence on cognition was foundin 1984, when Lawless and Schlegel came to very different conclusions, depending on whether theirpanelists were given a direct or indirect scaling task to evaluate taste-odor mixtures. It was thoughtthat panelists treat flavor mixtures as integral sensations during discrimination tasks, rather thanas an analyzable pair of attributes during attribute rating [76]. This implies that the testing methodinduces different perceptual strategies: the discrimination task may reveal interactions between flavornotes, which would otherwise not be apparent when ratings are made of individual characteristics [11].McBurney [77] stated that whether a taste-odor mixture is perceived analytically or syntheticallycan be determined by the method of evaluation required from the subject. The resulting eliminationof or at least reduction in taste enhancement by the aroma occurs when one is forced to adopt ananalytical approach once ratings of multiple attributes of a sample are required (thereby supportingthe dumping phenomenon), whereas an overall evaluation of a food product encourages the synthesisof the common quality from both sensory modalities of odor and taste, causing enhancement [20].
Because the occurrence of an enhancement may result from scaling artifacts, a non-scaling methodmay be better suited for confirming the enhancement effects observed here. Using a more holistic(synthetic) testing method, consumers may perform more similarly to their “natural” behavior and, indoing so, reveal a greater taste enhancement. Such tests should be further explored, as the cognitivetask during rating of various attributes does not represent how we perceive flavor when we eat foodoutside of such a controlled setting. To our knowledge, only a single study [77] has employed sucha synthetic tactic to test for sweetness enhancement by using a matching task to control for possible
23

Beverages 2018, 4, 73
scaling biases. More non-scaling studies are needed in cross-modal interaction research, as flavor isexperienced as a singular percept rather than a series of individual components.
5. Conclusions
Even when controlling for potential dumping artifacts by providing all salient response categoriesto participants, significant interactions between vanilla and sugar were found for sweetness perceptionin a real food (skim milk). Use of a superadditive model, the isobole approach, provided furtherevidence for synergism in sweetness perception between a congruent taste-aroma pair, although theseeffects appear to be rather small in magnitude. Potential applications for sugar reduction in foodscould be accomplished with these findings, although it probably requires combination with othercurrent techniques, such as the use of non-nutritive sweeteners. Future work should test the mostsynergistic combinations with a holistic, non-scaling method, to better represent how we experienceflavor when eating.
Author Contributions: Conceptualization, G.W., J.E.H., G.R.Z., R.F.R. and H.H.; Methodology and Software,G.W., J.E.H. and H.H.; Formal Analysis, G.W. and H.H.; Investigation, G.W.; Resources, H.H.; Writing—OriginalDraft Preparation, G.W.; Writing—Review and Editing, J.E.H., G.R.Z., R.F.R. and H.H.; Supervision, G.R.Z., R.F.R.and H.H.; Project Administration, H.H.; Funding Acquisition, G.W. and H.H.
Funding: This work was supported by the College of Agricultural Sciences at The Pennsylvania State Universityand USDA National Institute of Food and Agriculture Federal Appropriations under Project PEN04624 andAccession number 1013412. The funders had no role in the design of the study; in collection, analyses, orinterpretation of data; in the writing of the manuscript, and in the decision to publish the results.
Acknowledgments: We thank the staff and students of the SEC and the Department of Food Science for assistancewith sample processing, preparation and sensory experiments, with a special thank you to Tiffany Murray, AlyssaBakke, Emily Furumoto, and Federico Harte. We are also thankful to Tastepoint by International Flavors andFragrances (formerly David Michael & Co.) for donating the vanilla extract.
Conflicts of Interest: The authors declare no conflict of interest.
Appendix A
Table A1. Mean sensory attributes (n = 108) and measured instrumental viscosities (n = 2) (Pa.s) of finalvanilla sucrose milks used in the dose-response study. S = sugar, V = vanilla, both in percent (w/w).
Sample S VOverallLiking
SweetTaste
VanillaFlavor
MilkFlavor
Thickness Viscosity (Pa.s)
S0V0 0.000 0.000 4.49 fg 14.8 g 12.9 i 50.5 a 30.3 bcde 2.77 × 10⁻³ ± 2.62 × 10⁻⁵ bcde
S0V0.25 0.000 0.250 4.81 defg 18.2 g 25.5 gh 44.9 abc 28.8 cde 2.71 × 10⁻³ ± 6.29 × 10⁻⁵ bcde
S0V0.36 0.000 0.360 4.49 fg 18.7 g 27.0 gh 41.8 bc 28.7 cde 2.66 × 10⁻³ ± 2.62 × 10⁻⁵ de
S0V0.52 0.000 0.520 4.44 g 19.0 g 28.2 gh 38.7 c 26.5 de 2.68 × 10⁻³ ± 6.3 × 10⁻⁶ cde
S0V0.75 0.000 0.750 4.39 g 20.0 fg 27.9 gh 38.1 c 26.2 e 2.61 × 10⁻³ ± 2.76 × 10⁻⁵ e
S1V0 1.00 0.000 4.74 efg 27.1 f 22.8 h 47.9 ab 28.8 cde 2.84 × 10⁻³ ± 6.93 × 10⁻⁵ abcde
S1.31V0.3 1.31 0.300 5.52 abcd 37.4 e 38.0 ef 40.3 bc 32.9 abcd 2.74 × 10⁻³ ± 2.69 × 10⁻⁵ bcde
S1.31V0.435 1.31 0.435 5.50 abcd 37.2 e 38.9 de 39.5 c 30.6 bcde 2.70 × 10⁻³ ± 3.61 × 10⁻⁵ bcde
S1.31V0.625 1.31 0.625 5.22 cdef 36.3 e 39.2 de 39.7 c 29.9 bcde 2.83 × 10⁻³ ± 2.83 × 10⁻⁶ abcde
S1.71V0 1.71 0.000 5.31 abcde 38.8 de 30.6 fg 44.8 abc 34.6 abc 2.82 × 10⁻³ ± 9.40 × 10⁻⁵ abcde
S2.24V0.3 2.24 0.300 5.86 abc 46.8 c 44.9 bcde 40.7 bc 35.1 abc 2.88 × 10⁻³ ± 1.89 × 10⁻⁴ abcd
S2.24V0.435 2.24 0.435 5.91 abc 46.9 c 46.6 bcd 42.3 bc 34.2 abc 2.83 × 10⁻³ ± 9.7 × 10⁻⁵ abcde
S2.24V0.625 2.24 0.625 5.81 abc 44.8 cd 47.8 abc 39.5 c 33.1 abcd 2.77 × 10⁻³ ± 2.40 × 10⁻⁵ bcde
S2.92V0 2.92 0.000 5.43 abcde 50.2 c 38.4 e 41.8 bc 35.2 abc 2.85 × 10⁻³ ± 1.41 × 10⁻⁶ abcde
S3.82V0.3 3.82 0.300 5.77 abc 58.8 b 50.3 abc 40.4 bc 35.4 ab 2.93 × 10⁻³ ± 7.64 × 10⁻⁵ abc
S3.82V0.435 3.82 0.435 6.00 ab 61.0 ab 51.9 ab 39.9 bc 35.4 ab 2.96 × 10⁻³ ± 4.95 × 10⁻⁵ ab
S3.82V0.625 3.82 0.625 6.04 a 58.1 b 54.7 a 37.8 c 36.4 ab 2.94 × 10⁻³ ± 1.41 × 10⁻⁶ ab
S5V0 5.00 0.000 5.27 bcde 67.7 a 43.4 cde 39.4 c 37.4 a 3.06 × 10⁻³ ± 9.90 × 10⁻⁶ a
Same superscript letters in columns do not differ by Tukey’s HSD (p < 0.05).
24

Beverages 2018, 4, 73
References
1. Delwiche, J. The impact of perceptual interactions on perceived flavor. Food Qual. Prefer. 2004, 15, 137–146.[CrossRef]
2. Knoop, J.E. Cross-Modal Interactions in Complex Food Matrices. Ph.D. Thesis, Wageningen University,Wageningen, The Netherlands, November 2011.
3. Noble, A.C. Taste-aroma interactions. Trends Food Sci. Technol. 1996, 7, 439–444. [CrossRef]4. Blake, A.A. Flavour Perception and the Learning of Food Preferences. In Flavor Perception; Taylor, A.J.,
Roberts, D.D., Eds.; Blackwell Publishing Ltd.: Oxford, UK, 2004; pp. 172–202.5. Gilbert, A.N.; Firestein, S. Dollars and scents: Commercial opportunities in olfaction and taste. Nat. Neurosci.
2002, 5, 1043–1045. [CrossRef] [PubMed]6. Shepherd, G.M. Smell images and the flavour system in the human brain. Nature 2006, 444, 316–321.
[CrossRef] [PubMed]7. Frank, R.A.; Byram, J. Taste-smell interactions are tastant and odorant dependent. Chem. Senses 1988, 13,
445–455. [CrossRef]8. Köster, M.A.; Prescott, J.; Köster, E.P. Incidental learning and memory for three basic tastes in food.
Chem. Senses 2004, 29, 441–453. [CrossRef] [PubMed]9. Prescott, J. Flavour as a psychological construct: Implications for perceiving and measuring the sensory
qualities of foods. Food Qual. Prefer. 1999, 10, 349–356. [CrossRef]10. Frank, R.A.; van der Klaauw, N.J.; Schifferstein, H.N.J. Both perceptual and conceptual factors influence
taste-odor and taste-taste interactions. Percept. Psychophys. 1993, 54, 343–354. [CrossRef] [PubMed]11. Lawless, H.T.; Schlegel, M.P. Direct and indirect scaling of sensory differences in simple taste and odor
mixtures. J. Food Sci. 1984, 49, 44–46. [CrossRef]12. Schifferstein, H.N.J.; Verlegh, P.W.J. The role of congruency and pleasantness in odor-induced taste
enhancement. Acta Psychol. 1996, 94, 87–105. [CrossRef]13. Djordjevic, J.; Zatorre, R.J.; Jones-Gotman, M. Odor-induced changes in taste perception. Exp. Brain Res.
2004, 159, 405–408. [CrossRef] [PubMed]14. Pfeiffer, J.C.; Hort, J.; Hollowood, T.A.; Taylor, A.J. Taste-Aroma interactions in a ternary system: A model of
fruitiness perception in sucrose/acid solutions. Percept. Psychophys. 2006, 68, 216–227. [CrossRef] [PubMed]15. Boakes, R.A.; Hemberger, H. Odour-modulation of taste ratings by chefs. Food Qual. Prefer. 2012, 25, 81–86.
[CrossRef]16. Stevenson, R.J.; Prescott, J.; Boakes, R.A. Confusing tastes and smells: How odours can influence the
perception of sweet and sour tastes. Chem. Senses 1999, 24, 627–635. [CrossRef] [PubMed]17. Labbe, D.; Rytz, A.; Morgenegg, C.; Ali, S.; Martin, N. Subthreshold olfactory stimulation can enhance
sweetness. Chem. Senses 2007, 32, 205–214. [CrossRef] [PubMed]18. Frank, R.A.; Ducheny, K.; Mize, S.J.S. Strawberry odor, but not red color, enhances the sweetness of sucrose
solutions. Chem. Senses 1989, 14, 371–377. [CrossRef]19. Stevenson, R.J. Is sweetness taste enhancement cognitively impenetrable? Effects of exposure, training and
knowledge. Appetite 2001, 36, 241–242. [CrossRef] [PubMed]20. Prescott, J.; Johnstone, V.; Francis, J. Odor-taste interactions: Effects of attentional strategies during exposure.
Chem. Senses 2004, 29, 331–340. [CrossRef] [PubMed]21. Bingham, A.F.; Birch, G.G.; De Graaf, C.; Behan, J.M.; Perring, K.D. Sensory studies with sucrose-maltol
mixtures. Chem. Senses 1990, 15, 447–456. [CrossRef]22. Arvisenet, G.; Guichard, E.; Ballester, J. Taste-aroma interaction in model wines: Effect of training and
expertise. Food Qual. Prefer. 2016, 52, 211–221. [CrossRef]23. Hewson, L.; Hollowood, T.; Chandra, S.; Hort, J. Taste-aroma interactions in a citrus flavoured model
beverage system: Similarities and differences between acid and sugar type. Food Qual. Prefer. 2008, 19,323–334. [CrossRef]
24. Jones, P.R.; Gawel, R.; Francis, I.L.; Waters, E.J. The influence of interactions between major white winecomponents on the aroma, flavour and texture of model white wine. Food Qual. Prefer. 2008, 19, 596–607.[CrossRef]
25. Lethuaut, L.; Weel, K.G.C.; Boelrijk, A.E.M.; Brossard, C.D. Flavor perception and aroma release from modeldairy desserts. J. Agric. Food Chem. 2004, 52, 3478–3485. [CrossRef] [PubMed]
25

Beverages 2018, 4, 73
26. Bult, J.H.F.; De Wijk, R.A.; Hummel, T. Investigations on multimodal sensory integration: Texture, taste, andortho- and retronasal olfactory stimuli in concert. Neurosci. Lett. 2007, 411, 6–10. [CrossRef] [PubMed]
27. Lavin, J.G.; Lawless, H.T. Effects of color and odor on judgments of Sweetness among children and adults.Food Qual. Prefer. 1998, 9, 283–289. [CrossRef]
28. Von Sydow, E.; Moskowitz, H.; Jacobs, H.; Meiselnan, H. Odor-taste interctions in fruit juices. Leb. Technol.1974, 7, 18–24.
29. Symoneaux, R.; Guichard, H.; Le Quéré, J.-M.; Baron, A.; Chollet, S. Could cider aroma modify cidermouthfeel properties? Food Qual. Prefer. 2015, 45, 11–17. [CrossRef]
30. Green, B.G.; Nachtigal, D.; Hammond, S.; Lim, J. Enhancement of retronasal odors by taste. Chem. Senses2012, 37, 77–86. [CrossRef] [PubMed]
31. Dalton, P.; Doolitle, N.; Nagata, H.; Breslin, P.A.S. The merging of the senses: Integration of subthresholdtaste and smell. Nat. Neurosci. 2000, 10–12. [CrossRef] [PubMed]
32. Valdes, R.M.; Simone, M.J.; Hinreiner, E.H. Effect of sucrose and organic acids on apparent flavor intensity.II. Fruit nectars. Food Technol. 1956, 10, 387–390.
33. Valdes, R.M.; Hinreiner, E.H.; Simon, M.J. Effect of sucrose and organic acids on apparent flavor intensity. I.Aqueous solutions. Food Technol. 1956, 10, 282–285.
34. Mintel US Dairy Milk Market Report. Available online: https://store.mintel.com/us-dairy-milk-market-report (accessed on 5 February 2018).
35. Havkin-Frenkel, D.; Belanger, F.C. Handbook of Vanilla Science and Technology; Wiley-Blackwell: Oxford, UK,2010; ISBN 9781405193252.
36. Kuo, Y.-L.; Pangborn, R.M.; Noble, A.C. Temporal patterns of nasal, oral, and retronasal perception of citraland vanillin and interaction of these odourants with selected tastants. Int. J. Food Sci. Technol. 1993, 28,127–137. [CrossRef]
37. Clark, C.C.; Lawless, H.T. Limiting response alternatives in time-intensity scaling: An examination of thehalo-dumping effect. Chem. Senses 1994, 19, 583–594. [CrossRef] [PubMed]
38. Small, D.M.; Voss, J.; Mak, Y.E.; Simmons, K.B.; Parrish, T.; Dana, M.; Voss, J.; Mak, Y.E.; Simmons, K.B.;Parrish, T.; et al. Experience-dependent neural integration of taste and smell in the human brain.J. Neurophsyiol. 2004, 92, 1892–1903. [CrossRef] [PubMed]
39. Sakai, N. Enhancement of sweetness ratings of aspartame by a vanilla odor presented either by orthonasalor retronasal routes. Percept. Mot. Skills 2001, 92, 1002–1008. [CrossRef] [PubMed]
40. Fujimaru, T.; Lim, J. Effects of stimulus intensity on odor enhancement by taste. Chemosens. Percept. 2013, 6,1–7. [CrossRef]
41. Lim, J.; Fujimaru, T.; Linscott, T.D. The role of congruency in taste-odor interactions. Food Qual. Prefer. 2014,34, 5–13. [CrossRef]
42. Running, C.A.; Hayes, J.E. Sip and spit or sip and swallow: Choice of method differentially alters tasteintensity estimates across stimuli. Physiol. Behav. 2017, 181, 95–99. [CrossRef] [PubMed]
43. Pizarek, A.; Vickers, Z. Effects of swallowing and spitting on flavor intensity. J. Sens. Stud. 2017, 32, 1–7.[CrossRef]
44. Suhnel, J. Evaluation of synergism or antagonism for the combined action of antiviral agents. Antiviral Res.1990, 13, 23–40. [CrossRef]
45. Suhnel, J. Zero interaction response surfaces, interaction functions and difference response surfaces forcombinations of biologically active agents. Arzneim. Forsch. 1992, 42, 1251–1258.
46. Tallarida, R.J. Revisiting the isobole and related quantitative methods for assessing drug synergism.J. Pharmacol. Exp. Ther. 2012, 342, 2–8. [CrossRef] [PubMed]
47. Berenbaum, M.C. Synergy, additivism and antagonism in immunosuppression: A critical review. Clin. Exp.Immunol. 1977, 28, 1–18. [PubMed]
48. Berenbaum, M.C. What is synergy? Pharmacol. Rev. 1989, 41, 93–141. [PubMed]49. Fleming, E.E.; Ziegler, G.R.; Hayes, J.E. Investigating mixture interactions of astringent stimuli using the
isobole approach. Chem. Senses 2016, 41, 601–610. [CrossRef] [PubMed]50. Wolf, P.A.; Bridges, J.R.; Wicklund, R. Application of agonist-receptor modeling to the sweetness synergy
between high fructose corn syrup and sucralose, and between high-potency sweeteners. J. Food Sci. 2010, 75.[CrossRef] [PubMed]
26

Beverages 2018, 4, 73
51. Reyes, M.M. Using Psychophysical, Physicohedonic, and Consumer Choice Responses to SweetenerTechnology to Support Milk Intake in Adolescent Women. Ph.D. Thesis, The Pennsylvania State University,State College, PA, USA, 2017.
52. Chandan, R.C. Manufacturing Yogurt and Fermented Milks; Blackwell Publishing: Victoria, Australia, 2006;ISBN 9780813823041.
53. Lawless, H.T.; Heymann, H. Acceptance Testing. In Sensory Evaluation of Food; Lawless, H.T., Heymann, H.,Eds.; Springer: New York, NY, USA, 2010; pp. 325–347.
54. R Core Team. R: A Langugage and Environment for Statistical Computing; R Foundation for StatisticalComputing: Vienna, Austria, 2018; ISBN 3900051070. Available online: http://www.r-project.org (accessedon 1 February 2018).
55. De Mendiburu, F. Package “Agricolae”. Available online: https://cran.r-project.org/package=agricolae(accessed on 5 February 2018).
56. Lenth, R. Package “rsm”. Available online: https://cran.r-project.org/package=rsm (accessed on5 February 2018).
57. Hayes, J.E.; Duffy, V.B. Oral sensory phenotype identifies level of sugar and fat required for maximal liking.Physiol. Behav. 2008, 95, 77–87. [CrossRef] [PubMed]
58. Suhnel, J. Evaluation of interaction in olfactory and taste mixtures. Chem. Senses 1993, 18, 131–149. [CrossRef]59. Grab, W. Blended Flavourings. In Flavourings: Production, Composition, Applications, Regulations; Ziegler, H.,
Ed.; Wiley-VCH: Weinheim, Germany, 2007; pp. 391–434. ISBN 9783527314065.60. Li, B.; Hayes, J.E.; Ziegler, G.R. Just-About-Right and ideal scaling provide similar insights into the influence
of sensory attributes on liking. Food Qual. Prefer. 2014, 37, 71–78. [CrossRef] [PubMed]61. Welge-Lüssen, A.; Husner, A.; Wolfensberger, M.; Hummel, T. Influence of simultaneous gustatory stimuli
on orthonasal and retronasal olfaction. Neurosci. Lett. 2009, 454, 124–128. [CrossRef] [PubMed]62. Alcaire, F.; Lucia, A.; Vidal, L.; Gimenez, A.; Ares, G. Aroma-related cross-modal interactions for sugar
reduction in milk desserts: Influence on consumer perception. Food Res. Int. 2017, 97, 45–50. [CrossRef][PubMed]
63. Linscott, T.D.; Lim, J. Retronasal odor enhancement by salty and umami tastes. Food Qual. Prefer. 2016, 48,1–10. [CrossRef]
64. Cayeux, I.; Mercier, C. Sensory evaluation of interaction between smell and taste-application to sourness.In Flavour Research at the Dawn of the Twenty-First Century; Le Quéré, J.-M., Etievant, P.X., Eds.; Editions Tec &Doc: Paris, France, 2003; pp. 287–292.
65. Isogai, T.; Wise, P.M. The effects of odor quality and temporal asynchrony on modulation of taste intensityby retronasal odor. Chem. Senses 2016, 41, 557–566. [CrossRef] [PubMed]
66. Dravnieks, A. Atlas of Odor Character Profiles; ASTM: Philadelphia, PA, USA, 1985.67. Stevenson, R.J.; Prescott, J.; Boakes, R.A. The acquisition of taste properties by odors. Learn. Motiv. 1995, 26,
433–455. [CrossRef]68. Bonnans, S.; Noble, A.C. Effect of sweetener type and of sweetener and acid levels on temporal perception
of sweetness, sourness and fruitiness. Chem. Senses 1993, 18, 273–283. [CrossRef]69. Valentin, D.; Chrea, C.; Nguyen, D.H. Taste-odour interactions in sweet taste perception. In Optimising Sweet
Taste in Foods Foods; Woodhead Publishing Ltd.: Cambridge, UK, 2006; pp. 1–18.70. Djordjevic, J.; Zatorre, R.J.; Jones-Gotman, M. Effects of perceived and imagined odors on taste detection.
Chem. Senses 2004, 29, 199–208. [CrossRef] [PubMed]71. Nguyen, D.H.; Dacremont, C.; Valentin, D. Taste-odour interactions and perceptual separability. Vietnam J.
Sci. Technol. 2011, 49, 73–82.72. Brossard, C.D.; Lethuaut, L.; Boelrijk, A.E.M.; Mariette, F.; Genot, C. Sweetness and aroma perceptions in
model dairy desserts: An overview. Flavour Fragr. J. 2006, 21, 48–52. [CrossRef]73. Small, D.M.; Jones-Gotman, M.K. Neural substrates of taste/smell interaction and flavor in the human brain.
Chem. Senses 2001, 26, 1034.74. De Araujo, I.E.T.; Rolls, E.T.; Kringelbach, M.L.; Mcglone, F.; Phillips, N. Taste-olfactory convergence, and
the representation of the pleasantness of flavour, in the human brain. Eur. J. Neurosci. 2003, 18, 2059–2068.[CrossRef] [PubMed]
75. Kuznicki, J.T.; Hayward, M.; Schultz, J. Perceptual processing of taste quality. Chem. Senses 1983, 7, 273–292.[CrossRef]
27

Beverages 2018, 4, 73
76. McBurney, D.H. Taste, smell, and flavor terminology: Taking the confusion out of fusion. In ClinicalMeasurement of Taste and Smell; Meiselman, H.L., Rivkin, R.S., Eds.; MacMillan: New York, NY, USA, 1986;pp. 117–125.
77. Van der Klaauw, N.J.; Frank, R.A. Matching and scaling of taste-smell mixtures: Individual differences insweetness enhancement by strawberry odor. Chem. Senses 1994, 19, 567.
© 2018 by the authors. Licensee MDPI, Basel, Switzerland. This article is an open accessarticle distributed under the terms and conditions of the Creative Commons Attribution(CC BY) license (http://creativecommons.org/licenses/by/4.0/).
28

beverages
Article
Sensory Impact of Polyphenolic Composition on theOxidative Notes of Chardonnay Wines
Jordi Ballester 1,*, Mathilde Magne 2, Perrine Julien 1 Laurence Noret 2, Maria Nikolantonaki 2,
Christian Coelho 2 and Régis D. Gougeon 2
1 Centre des Sciences du Goût et de l’Alimentation, UMR 6265 CNRS, UMR 1324 INRA-Université deBourgogne Franche Comté, 9 E Boulevard Jeanne d’Arc, F-21000 Dijon, France; [email protected]
2 UMR A 02.102 PAM, Université de Bourgogne Franche Comté, Institut Universitaire de la vigne et du vinJules Guyot, rue Claude Ladrey, BP 27877, 21078 Dijon CEDEX, France;[email protected] (M.M.); [email protected] (L.N.);[email protected] (M.N.); [email protected] (C.C.);[email protected] (R.D.G.)
* Correspondence: [email protected]; Tel.: +33-380-396-393
Academic Editors: Manuel Malfeito Ferreira and Richard Owusu-ApentenReceived: 29 November 2017; Accepted: 1 February 2018; Published: 1 March 2018
Abstract: Chardonnay wines have a long-standing reputation regarding their aging potential.However, in some cases, they face premature oxidation a few years after bottling. Scientific reportsare, for now, multiparametric and unclear. Polyphenols seem to be an important factor involvedin the oxidative stability of white wines, but their role has not yet been completely characterized.The present study aimed to investigate the link between polyphenol content and the emergenceof oxidative odors of bottle-aged Chardonnay wines. In order to obtain samples with noticeabledifferences in polyphenol content, as well as in sensory oxidative notes, wines from two differentvintages were used. For each vintage, three levels of must clarification and two wine closureswere implemented. Polyphenol content was analyzed chemically, and the oxidative character wasassessed sensorially by a trained panel using a specific intensity scale. The results showed significanteffects for closure type and turbidity. However, these effects were strongly affected by vintage.Concerning the polyphenol content, a clear difference was also found between vintages, closuresand turbidity levels. Significant linear regression models for REDOX scores pointed out Flavon-3-olsas the main negative predictor, and grape reaction product (GRP) as the main positive predictor.The enological implications are discussed.
Keywords: flavan-3-ols; reduction; oxidation; wine aging; oxidative stability; clarification
1. Introduction
Chardonnay wines have a long-standing reputation regarding their aging potential. During bottleaging, wine is exposed to relatively low quantities of oxygen, which are nevertheless sufficientto influence its sensory characteristics [1]. In particular, oxygen modulates the extent of differentreactions involving volatile and nonvolatile components, resulting in the formation/degradationof a number of powerful aroma compounds, with major consequences for the process of aromaevolution during bottle aging [2]. In addition, other chemical reactions taking place during bottleaging do not involve oxygen, meaning that, even in an environment completely devoid of oxygen,a certain form of aging will occur [3]. Wine aroma changes dramatically during bottle aging, througha complex array of chemical reactions that are only partly understood. In most cases, oxygen andpolyphenols contribute to the evolution of these key aroma compounds [4] where iron and copperact as oxidation catalyzers [5]. To date, the majority of studies dealing with premature oxidation
Beverages 2018, 4, 19; doi:10.3390/beverages4010019 www.mdpi.com/journal/beverages29

Beverages 2018, 4, 19
have focused on the characterization of potent oxidation markers of defective aroma (off-flavors).According to these studies, changes in wine aroma properties linked to oxidation were related tothe formation of off-flavors, mainly aldehyde compounds, such as phenylacetaldehyde, methional,trans-2-nonenal, o-aminoacetophenone and a lactone, the 3-hydroxy-4,5-dimethyl-2(5H)-furanone(sotolon) [6,7]. The aldehydes, methional and phenylacetaldehyde, are among the oxidation-relatedaroma compounds that have drawn the most attention, due to their supposedly higher aroma impactand possible contribution to the aroma of red and white wines [8]. For these aldehydes, formationfrom the amino acids methionine and phenylalanine, respectively, via Strecker reaction involvingthe presence of a dicarbonyl compound has been proposed [9]. Different o-diphenols have beenshown to form different quantities of aldehydes, with caffeic acid giving higher methional andphenylacetaldehyde compared to catechin and epicatechin [10], but this was observed at pH muchhigher than that of wine. More recently, it has been shown that in wine-like conditions, methionineand phenylalanine were not capable of reacting with a model quinone [11]. Finally, in a recent study,the polyfunctional thiol 3-ethylsulfanyl acetate was identified for the first time as a key contributor tooff-flavors in sauvignon blanc wines [12]. This compound was observed at higher levels in aged winesand in wines obtained from juices exposed to air, but the effect of post-bottling oxygen exposure onits concentration remains to be investigated. Overall, although many aroma compounds relevant towine oxidation have been identified, most studies have been aimed at understanding wine oxidativespoilage, and have often been carried out under conditions of extreme oxygen exposure. Conversely,oxidative processes taking place during bottle aging under normal conditions are rather “mild”, andthe sensory impact of such levels of oxidation to the aroma quality of wines remains to be established.
Many chemical approaches have been developed in the literature to understand whitewine oxidation. However, there are fewer studies dealing with white wine oxidation from a sensorypoint of view. Typically, the researchers use a tasting panel to generate relevant attributes, whichusually cover fresh fruit dimensions (depending on the grape variety at hand), oxidative aromanotes and a number of other descriptors unrelated with oxidation (such as spiciness, oakynessand other wine faults). Several authors have used descriptive analysis to characterize the typeof closure and the effect of ascorbic acid addition on the oxidative or reductive aromas of whitewine samples with several years of storage [13–15]. In Gooden et al. [13], fresh fruit attributes wereoverall fruit, pineapple, citrus/lime and tropical while the oxidation related attributes were oxidizedand developed. Interestingly, the authors aimed to differentiate two different nuances of oxidation,developed being probably a mild and not necessarily negative version of oxidized. As expected,the authors showed a clear opposition between all fresh fruit dimensions, and oxidized and developed.Ulterior studies [14–16] slightly modified the lexicon by including some oxidation notes such asaldehyde, glue-like or wet wool, and some reduction notes, such as struck flint/rubber, gunflint, rottenegg, cabbage or stagnant water. In the case of rosé wine, Guaita and coworkers [17] suggested, despitethe lack of significance of the results, that the closures with higher Oxygen Transfer Rate (OTR) valuesinduced a stronger intensity of acacia flower and rose aromas in the wines than more protective closures.In the same vein, Rodrigues and coworkers [18] used the attribute honey/wax as an oxidation marker.A different strategy was used by Brajkovich and coworkers [19], since they basically used sauvignonblanc varietal descriptors such as passion fruit, cat urine, grassy and capsicum, and showed that themost oxidized samples were those showing lower intensities for thiol-related attributes.
In that context, the goal of the present study is to investigate the oxidative note of bottle-agedChardonnay wines from a polyphenolic content perspective. To the best of our knowledge, no sensorystudies have so far examined the link between the occurrence of oxidative aromas and the polyphenolcontent in white wines, in particular hydroxycinnamic acids and flavanols. This is all the moreinteresting because previous studies reported contradictory results; some have considered that theantioxidant activity of white wines is related to its polyphenolic content [20–22], whereas othershave shown a direct correlation between the browning rate and the concentration of epicatechin [23].In order to ensure wide differences in the polyphenol concentrations and sensory characteristics
30
Beverages 2018, 4, 19
between the samples, two different vintages with three levels of must turbidity and two differenttypes of closure were used. The two kinds of stoppers chosen for this study (synthetic coextrudedstoppers and screw cap) presented extreme OTR values to ensure oxidation differences as previouslydescribed [3]. Synthetic coextruded stoppers are able to diffuse 10 to 100 times more oxygen thatscrew caps, and could possibly reveal oxidative deviations earlier in wine compared to more reductiveenvironments when screw caps are used [3,24].
2. Materials and Methods
2.1. WinesChardonnay dry white wines from Burgundy were elaborated following the same winemaking
process during vintages 2009 and 2010. Chardonnay grapes were hand-harvested and pressed witha pneumatic press. Must was protected with 4 g·hL−1 of SO2. Cold racking at 12 ◦C from 12 to24 h enabled to reach the three levels of must turbidity: 300 NTU (Low), 600 NTU (Medium) and800 NTU (High). Alcoholic and malolactic fermentations were conducted in oak barrels followed byoak aging for 6 months. Dry white wines were then filtered, and SO2 was adjusted to 40 mg·L−1 priorto bottling. Wine bottles were stored in a cellar with a constant temperature (12 ◦C) until required forchemical analysis (April 2015). Table 1 summarizes the characteristics of the samples used in this study.
Table 1. Characteristics of the white wines used in this study and their codes.
Sample Code Closure Turbidity (NTU)
S-L-2009 synthetic coextruded stopper LOWS-M-2009 synthetic coextruded stopper MEDIUMS-H-2009 synthetic coextruded stopper HIGHC-L-2009 screw cap LOWC-M-2009 screw cap MEDIUMC-H-2009 screw cap HIGHS-L-2010 synthetic coextruded stopper LOWS-M-2010 synthetic coextruded stopper MEDIUMS-H-2010 synthetic coextruded stopper HIGHC-L-2010 screw cap LOWC-M-2010 screw cap MEDIUMC-H-2010 screw cap HIGH
2.2. Sensory AnalysisSensory sessions took place between October and December 2015. After a training period, the
selected assessors performed a monadic assessment of the reductive and oxidative aromas of thesamples and a sensory description on frequency of citation [25]. Afterwards, a subset of the sampleswas analyzed again, not in monadic presentation, but in simultaneous presentations in order to inducea comparative assessment and therefore detect more subtle differences between samples.
2.2.1. Panel: Training and SelectionTwenty-six candidates were recruited from among the students at the enology school of
Dijon (France). As part of their enology training, they all attended a wine-tasting course (36 h), wherethey learned the main olfactory notes of wine. Apart from this general training, the panelists tookpart in 6 training sessions and 4 selection sessions organized as part of the present study. The generalgoal of the training was to familiarize the assessors to the common oxidation and reduction aromanotes, and to quantitatively calibrate their measurements. With this purpose, natural and spikedwines with a range of reduction or oxidation intensities were selected for the training. Also, several“clean” wines (with no obvious oxidation or reduction notes) were used as controls during the training.Sessions were conducted twice a week, in groups of 10–13 candidates and lasted about 40 min.The specific goals and the content of each session are summarized in Table 2. A specific structured scale(called here the REDOX odor scale) was created to assess the global oxidative or reductive odor of thesamples. This 11-point scale went from −5 (strong reduction) to +5 (strong oxidation), with 0 (neitherreduced nor oxidized) being in the middle of the scale. Expected REDOX odor levels of the trainingsamples were roughly determined by consensus by three experienced tasters as a guideline only.Systematic feedback was given at the end of each session or at the beginning of the subsequent session.
31

Beverages 2018, 4, 19
Ta
ble
2.
Sum
mar
yof
the
trai
ning
and
sele
ctio
nse
ssio
nspr
ior
tose
nsor
yde
scri
ptio
n.
Se
ssio
nN
um
be
rG
oa
lsa
nd
Pro
toco
lsM
ate
ria
ls
Sess
ion
1
Fam
iliar
izat
ion
wit
hph
enyl
acet
alde
hyde
and
met
hion
alin
flask
san
din
wat
er.
Fura
neol
(oak
yno
te)w
asus
edas
adi
stra
ctor
.A
sses
sors
’des
crip
tion
sw
ere
disc
usse
dan
dco
mpa
red
toth
ede
scri
ptor
sfr
omth
elit
erat
ure.
Phen
ylac
etal
dehy
de2,
2μ
g/L
Met
hion
al5
mg/
LFu
rfur
al,o
nedr
opon
aco
tton
ball
ina
flask
.
Sess
ion
2
Fam
iliar
izat
ion
wit
hso
tolo
n,2-
amin
oace
toph
enon
ean
dm
ethi
onal
infla
sks
and
inw
ater
.Tr
ans-
2-no
nana
l(ca
rdbo
ard
note
)was
used
asa
dist
ract
or.A
sses
sors
’des
crip
tion
sw
ere
disc
usse
dan
dco
mpa
red
toth
ede
scri
ptor
sfr
omth
elit
erat
ure.
Soto
lon
90μ
g/L
2-am
inoa
ceto
phen
one
10μ
g/L
Met
hion
al5
mg/
LTr
ans-
2-no
nana
l,on
edr
opon
aco
tton
ball
ina
flask
.
Sess
ion
3
Fam
iliar
izat
ion
wit
hre
duct
ion
note
s:H
2S,
Etha
nthi
ol,D
MS.
Rec
ogni
tion
of2-
amin
oace
toph
enon
ean
dph
enyl
acet
alde
hyde
.Ass
esso
rs’d
escr
ipti
ons
wer
edi
scus
sed
and
com
pare
dto
the
desc
ript
ors
from
the
liter
atur
e.Fa
mili
ariz
atio
nw
ith
the
redo
xsc
ale
onth
epr
evio
usso
luti
ons
H2S
40μ
g/L
Etha
nthi
ol20
0μ
g/L
DM
S55
μg/
L2-
amin
oace
toph
enon
e10
μg/
LPh
enyl
acet
alde
hyde
14μ
g/L
Sess
ion
4
Dis
crim
inat
ion
betw
een
oxid
atio
nan
dre
duct
ion
note
sin
spik
edw
ines
and
reco
gniti
onof
the
diff
eren
tm
olec
ules
and
thei
rde
scri
ptor
s.Fa
mili
ariz
atio
nw
ith
the
redo
xsc
ale
onth
epr
evio
ussp
iked
win
es
Base
win
e(M
usca
det,
2014
)Ba
sew
ine
+ph
enyl
acet
alde
hyde
14μ
g/L
Base
win
e+
met
hion
al5
mg/
LBa
sew
ine
+Et
hant
hiol
200μ
g/L
Base
win
e+
soto
lon
120μ
g/L
Base
win
e+
2-am
inoa
céto
phen
one
10μ
g/L
Sess
ion
5
Test
asse
ssor
s’di
scri
min
atio
nab
iliti
eson
oxid
ized
sam
ples
(spi
ked
win
es)b
ym
eans
ofa
tria
ngle
test
.O
dor
char
acte
riza
tion
of3
sam
ples
usin
gth
ere
dox
scal
ean
dth
eod
orde
scri
ptor
slis
t.
Base
win
e(M
usca
det,
2014
)U
sed
inth
etr
iang
lete
st:B
ase
win
e+
phen
ylac
etal
dehy
de2.
2μ
g/L
+so
tolo
n90
μg/
Lan
dBa
sew
ine
+2-
amin
oacé
toph
enon
e15
μg/
L+
soto
lon
90μ
g/L
Sess
ion
6
Test
asse
ssor
s’di
scri
min
atio
nab
iliti
esbe
twee
nan
oxid
ized
sam
ple
(spi
ked
win
es)a
ndth
eba
sew
ine.
Odo
rch
arac
teri
zati
onof
2sa
mpl
esus
ing
the
redo
xsc
ale
and
the
odor
desc
ript
ors
list.
Base
win
e(M
usca
det,
2014
)Ba
sew
ine
+so
tolo
n90
μg/
L
32

Beverages 2018, 4, 19
Ta
ble
2.
Con
t.
Se
ssio
nN
um
be
rG
oa
lsa
nd
Pro
toco
lsM
ate
ria
ls
Sess
ion
7
Qua
ntit
ativ
eca
libra
tion
ofth
ean
chor
sof
the
scal
e.R
edox
rati
ngpr
acti
cew
ith
the
redo
xsc
ale
onth
ree
win
espr
evio
usly
chec
ked
bytw
ow
ine
expe
rts
asre
pres
enta
tive
ofth
ree
oxid
atio
nle
vels
.
Use
dfo
rca
libra
tion
:R
educ
tion
anch
or(v
ery
redu
ced)
:H2S
40μ
g/L
Oxi
dati
onan
chor
(ver
yox
idiz
ed):
StA
ubin
1998
ina
dark
ISO
glas
sU
sed
for
prac
tice
wit
hth
ere
dox
scal
e:Sa
intA
ubin
1998
(ver
yox
idiz
ed)
Mar
sann
ay20
07(m
oder
atel
yox
idiz
ed)
Vir
éC
less
é20
14(n
eith
erre
duce
dno
rox
idiz
ed)
Sess
ion
8R
edox
rati
ngof
4w
ines
prev
ious
lych
ecke
dby
two
win
eex
pert
sas
repr
esen
tati
veof
thre
eox
idat
ion
leve
ls.
Bour
gogn
eA
ligot
é20
14(n
eith
erre
duce
dno
rox
idiz
ed)
Cha
rdon
nay
blen
dw
ith
7%of
StA
ubin
1998
(slig
htly
oxid
ized
)Pe
titC
habl
is20
09(m
oder
atel
yox
idiz
ed)
Cha
blis
1er
Cru
2012
(slig
htly
redu
ced)
Sess
ion
9
Red
oxra
ting
of6
win
espr
evio
usly
chec
ked
bytw
ow
ine
expe
rts
asre
pres
enta
tive
ofth
ree
oxid
atio
nle
vels
.The
last
thre
esa
mpl
esar
eta
sted
inse
ssio
n10
asw
elli
nor
der
toch
eck
cand
idat
es’r
epea
tabi
lity.
Cha
ssag
neM
ontr
ache
t,20
02(m
oder
atel
yox
idiz
ed)
Che
nin
Blan
c20
13(s
light
lyre
duce
d)M
âcon
Cle
ssé
1994
(ver
yox
idiz
ed)
Vir
éC
less
é20
14+
Peti
tCha
blis
2009
(mod
erat
ely
oxid
ized
)C
hard
onna
yPa
ysd’
Oc
2014
(cle
anor
just
slig
htly
oxid
ized
)C
hard
onna
yPa
ysd’
Oc
2014
+20
%Sa
intA
ubin
1er
Cru
1998
(mod
erat
ely
oxid
ized
)C
hard
onna
yC
alif
orni
a20
10(m
oder
atel
yox
idiz
ed)
Sess
ion
10
Red
oxra
ting
of6
win
espr
evio
usly
chec
ked
bytw
ow
ine
expe
rts
asre
pres
enta
tive
ofth
ree
oxid
atio
nle
vels
.The
last
thre
esa
mpl
esar
eta
sted
inse
ssio
n10
asw
ell,
inor
der
toch
eck
cand
idat
es’r
epea
tabi
lity.
Cha
blis
1er
Cru
2012
Alig
oté
Mar
sann
ay20
15(n
eith
erre
duce
dno
rox
idiz
ed)
Vir
é-C
less
é20
14+
20%
Ugn
iBla
nc19
69(m
oder
atel
yox
idiz
ed)
Vio
gnie
r20
13+
50%
Cha
rdon
nay
2013
(cle
anor
just
slig
htly
oxid
ized
)C
hard
onna
yPa
ysd’
Oc
2014
(cle
anor
just
slig
htly
oxid
ized
)C
hard
onna
yPa
ysd’
Oc
2014
+20
%Sa
intA
ubin
1er
Cru
1998
(mod
erat
ely
oxid
ized
)C
hard
onna
yC
alif
orni
a20
10(m
oder
atel
yox
idiz
ed)
33

Beverages 2018, 4, 19
The selection of the panelists was based on the results of sessions 7 to 10. Three main criteriawere considered in order to rank the candidates according to their sensory performance: recognition ofoxidation and reduction notes and proximity with the expected REDOX odor levels, repeatability, andconsensus with the rest of the panel. Panelists were ranked according to each of these three criteria,and then an average rank was computed for each candidate.
At the end of the selection process, 14 assessors were selected to form the final panel (threefemales and eleven males, average age 24.4; SD = 1.4). Among them, eleven (three females and eightmales, average age 24.3; SD = 1.3) participated in the monadic sensory sessions. All fourteen assessorsparticipated in the comparative REDOX odor assessment.
2.2.2. Monadic Sensory Description
Sensory analyses took place in a sensory room equipped with individual booths. Two bottlesof each sample were assessed in standardized black glasses coded by 3-digit numbers. Each samplecontained 20 mL of wine at ambient temperature and was covered with a plastic Petri dish. First,participants were asked to rate the intensity of oxidation-reduction of the samples orthonasally (i.e.,by smell only) and afterwards globally (nose and palate) using the REDOX odor scale. Finally,panelists were asked to describe the odor of the samples using a list of odor attributes (Figure 1) fromwhich assessors should select all the attributes they considered appropriate to describe each sample.The sensory terms aimed to cover varietal chardonnay aromas, oxidation and reduction notes andother wine faults (in order to control for false positives). The list was based on previous research onwhite wine oxidation [13–16], and the terms were listed in alphabetical order. If panelists neededan attribute that was missing from the list, two slots (other 1 and other 2) were allowed for theirown descriptors. During each session, the twelve samples (six wines replicated) were randomly splitinto three series of four samples. The tasting order within the series was specific to each participantand followed a William’s Latin square. In order to reduce sensory fatigue, panelists were asked to takea short break between series. Monadic sensory description took two sessions, one for 2009 samplesand another, the day after, for the 2010 samples.
Figure 1. Ballot used for the general odor description (translated from French).
2.2.3. Comparative REDOX Odor Assessment between Turbidity Levels with SyntheticCoextruded Stopper
This second descriptive analysis was carried out in order to focus specifically on the effectof turbidity. According to the results of the monadic description (see Section 3.1), the samples closedwith screw caps barely showed oxidative notes. In particular, for the 2010 samples, the differencesin redox score between closure types were really important which were assumed to mask subtle
34

Beverages 2018, 4, 19
differences between turbidity levels (see Section 3.1). Therefore, only the samples with syntheticcoextruded stoppers were chosen for the comparative REDOX odor assessment. Moreover, inspired byGodden and coworkers [13], a full comparative approach was carried out in order to accede to moresubtle differences.
Only one bottle of each treatment was used in this session. Comparative REDOX odor assessmenttook only one session, during which 6 samples were assessed. The three 2009 samples weresimultaneously presented to the assessors (instead of monadically), in order to facilitate the comparisonbetween samples. Panelists were allowed to freely retaste and compare the samples before scoring them.Then, after a short break, the three 2010 samples were presented for assessment, also simultaneously.As in the monadic descriptive analysis, participants were asked to rate the REDOX odor character ofthe samples orthonasally and, afterwards, globally, using the REDOX odor scale. In order to increasethe sensitivity of the REDOX odor scale, a continuous version of the scale was presented to the panelists(instead the discrete scale used in the monadic profile). A subsequent general description based onfrequencies of citation was not carried out in this case. Within each series, samples were presentedaccording to a specific order for each participant following a William’s Latin square.
2.3. Chemical Analysis
2.3.1. Reagents
Gallic acid, protocatechuic acid, hydroxybenzoic acid, tyrosol, hydroxytyrosol, salicylic acid,coumaric acid, ferulic acid, caffeic acid, caftaric acid, catechin, epicatehin, chlorogenic acid and gentisicacid were purchased from Sigma Aldrich. High-grade quality methanol and formic acid were used forchromatographic elutions.
2.3.2. Wine Polyphenols Analyses
Total polyphenols Index (TPI) measurements. Each wine sample was characterized by measuringthe absorbance at 280 nm with a spectrophotometer (UV-1800, Shimadzu, Kyoto, Japan), after dilution,representing the global content of wine polyphenols expressed as TPI index.
UPLC-DAD/FLD phenolic compounds analysis. An Acquity UPLC H-Class (Waters, Milford,MA, USA) with a quaternary pump and an autosampler were coupled to a fluorimetric and a diodearray detector. Under optimized conditions, the column oven was thermostated at 35 ◦C, and thesample system at 12 ◦C. The acquisitions, the solvent delivery and the detection were performedby Empower 2. About 2 mL of wine was filtered through a 0.45 μm PTFE filter (Restek, Lisses,France), of which 2 μL was injected into a reversed-phase BEH C18 (150 mm × 2.1 mm, 1.7 μm)Waters column. A binary solvent was run at a flow rate of 0.25 mL/min employing (A) H2O:methanol(95:5) v/v formic acid (0.1%) and (B) methanol (100%). The optimized elution system consisted of astepwise gradient as follows: from 3 to 5% B (0–4 min), 5 to 8% B (4–10 min), 8% B (10–12 min), 8 to10% B (12–14 min), 10 to 15% B (14–17 min), 15 to 30.1% B (17–19 min), 30.1 to 38% B (19–21 min),38 to 41% B (21–24 min), 41 to 50% B (24–30 min), 50 to 100% B (30–31 min), 100% B (31– 31.5 min),100 to 3% B (31.5–32.5 min), 3% B (32.5–35 min). The diode array detector was set at 320 nm fortrans-caftaric acid, gentisic acid, trans-caffeic acid, trans-coutaric acid, 2-S-glutathionylcaftaric acid(GRP), trans-ferulic acid, at 305 nm for salicylic acid, trans-coumaric acid, at 280 nm for gallic acidand at 260 nm for protocatechuic acid and hydroxybenzoïc acid. The fluorescence detector was set atλex = 270 nm and λem = 322 nm for hydroxytyrosol, tyrosol, catechin, epicatechin, proanthocyanidin B1,proanthocyanidin B2. Polyphenols were identified using a combination of commercial standards andthe UV-visible spectra associated to chromatographic peaks in comparison with published procedures,as described previously [26,27]. Trans-Coutaric acid and GRP were quantified via their respectiveabsorbance at 320 nm and expressed in trans-caftaric acid equivalents. Unknown concentrationswere determined from the regression equation, and the results were converted into milligramsper liter. The sum of each individual polyphenol concentration was calculated and defined as the
35

Beverages 2018, 4, 19
total polyphenol for five specific chemical families: phenolic acids, cinnamic acids, flavan-3-ols, Grapereaction product (GRP) and tyrosol.
2.4. Statistical Analysis
Differences in REDOX scores were tested statistically using analysis of variance (ANOVA) withα = 5%. Monadic data were subjected to three-way ANOVAs with wine closures (synthetic cork orscrew cap) and turbidity (LOW, MEDIUM and HIGH) as within-subject factors. Subjects (panelists)were considered a random factor. Turbidity × closure, panelists × closure, and panelists × turbidityinteractions were also tested. Main treatment effects (closure and turbidity) were tested using theirrespective interaction with panelists as the appropriate error term.
When a significant main effect was found, pairwise comparisons were carried out usingNewman-Keuls’ test (α = 5%). In the particular case of the comparative REDOX odor assessment, sinceall the samples had the same closure system, only the turbidity was set as a within-subject factor.
Concerning the general description, the frequency of citation of each term was determinedfor each wine. Only the descriptors cited at least 3 times for a given wine were considered insubsequent analyses; the other descriptors were discarded. The resulting contingency table containingthe frequency of citation of each term for each wine was submitted to Correspondence Analysis (CA).In order to identify wine clusters, wine coordinates on the two first factors (F1 and F2) on both CAswere submitted to a Hierarchical Cluster Analysis (HCA) with the Ward criterion. Orthonasal andglobal REDOX average scores were projected as supplementary variables in each CA.
The effect of vintage, closure and turbidity on wine polyphenolic content was analyzed statisticallyby a three-factor ANOVA with (α = 5%) for each phenolic family. All second-order interactions werealso included in the ANOVA model.
Relationships between polyphenol concentrations and REDOX odor scores were explored bymeans of multiple linear regressions (stepwise method), separately for 2009 and 2010. The addedconcentration of each family of polyphenols was used as predictors and the REDOX average intensityas the dependent variable.
All statistical analyses were carried out using XLStat 2017 (Addinsoft, Paris, France).
3. Results
3.1. Sensory Characterization by Monadic Profile
3.1.1. REDOX Odor Assessment
The results of the ANOVA performed on the orthonasal and global REDOX odor scores for 2009and 2010 samples are presented in Table 3. The factor panelists showed a significant effect in bothconditions and for both vintages. This is a common phenomenon in sensory evaluation, and indicatesthat the assessors used different parts of the scale.
Type of closure did not show significant effects for 2009 samples. Concerning the 2010 samples,significant panelists×closure interactions were found for both for orthonasal and global assessments,that some of the panelists did not achieve perfect concept alignment. The MS of panelists × closureinteractions was used as an error term to test the closure effect, which was still significant for bothassessment conditions (Table 3).
Turbidity level was significant for both conditions of the 2009 samples, but not for the 2010 ones.However, the interaction turbidity×closure was also significant, which means that it is not possible togeneralize the turbidity effect to all the closure types. A closer look at this interaction (Figure 2a,b)shows that, for screw caps, medium and high turbidity levels tend to show lower REDOX odor values.However, this pattern does not fit the results for synthetic corks, for which the lowest turbidity alsoshows the lowest REDOX odor score (Figure 2a,b). Further research needs to be carried out to betterunderstand the relationship between turbidity and oxidation.
36

Beverages 2018, 4, 19
Table 4 shows the results of the post-hoc mean comparison for Closure type and Turbidity level.Wines closed with synthetic cork showed significantly higher sensory oxidation than wines closedwith screw caps, but only for 2010 samples.
Table 3. Summary of the significance level of the ANOVAS performed on the orthonasal and globalREDOX odor scores for the 2009 and 2010 samples. Probabilities in bold are significant at α = 5%.
Assessment Condition Sources of Variation2009 Vintage 2010 Vintage
F p F p
OTHONASALPERCEPTION
PANELISTS 3.748 0.0003 3.633 0.0005CLOSURE 0.697 0.171 10.108 0.010
TURBIDITY 3.412 0.038 0.540 0.591PANELISTS ×CLOSURE 3.122 0.002 3.289 0.001
PANELISTS ×TURBIDITY 0.620 0.887 1.016 0.453TURBIDITY ×CLOSURE 5.880 0.004 2.081 0.131
GLOBAL PERCEPTION
PANELISTS 3.760 0.0003 3.812 0.0003CLOSURE 3.205 0.104 8.109 0.0173
TURBIDITY 7.044 0.005 1.574 0.2318PANELISTS ×CLOSURE 1.827 0.068 2.870 0.0039
PANELISTS ×TURBIDITY 0.683 0.832 0.994 0.4779TURBIDITY ×CLOSURE 3.182 0.046 0.287 0.7510
0
0.2
0.4
0.6
0.8
1
1.2
1.4
1.6
1.8
Turbidity L Turbidity M Turbidity H
REDO
X or
thon
asal
200
9
A TURBIDITY × WINE CLOSURE
C
S
0
0.2
0.4
0.6
0.8
1
1.2
1.4
1.6
1.8
Turbidity L Turbidity M Turbidity H
REDO
X gl
obal
200
9
B TURBIDITY × WINE CLOSURE
C
S
Figure 2. Turbidity*wine closure interaction plots for 2009 data (A) orthonasal evaluation and(B): global evaluation). S: synthetic coextruded stoppers; C: screw cap stoppers. L: low; M; medium;H: high.
37

Beverages 2018, 4, 19
Table 4. Results of the post-hoc Newman-Keuls’ tests (α = 0.05) on the REDOX odor intensitiescomparing the two closure types and the three turbidity levels for each vintage and each evaluationcondition. S: synthetic coextruded stoppers; C: screw cap stoppers. L: low; M: medium; H: high.
Factor Level 2009 Orthonasal 2009 Global 2010 Orthonasal 2010 Global
CLOSURES 0.97 a 1.045 a 1.62 a 1.35 aC 0.65 a 0.61 a 0.38 b 0.53 b
TURBIDITYM 1.182 a 1.14 a 1.16 a 1.045 aH 0.75 ab 0.89 ab 0.93 a 1.045 aL 0.5 b 0.45 b 0.91 a 0.73 a
Samples associated with the same letter were not significantly different.
Concerning the effect of turbidity and regardless the assessment condition, the REDOX odor scorefor the lowest level was significantly lower than the intermediate level, but wasn’t different from thehighest level. However, the significant closure*turbidity interactions found for 2009 samples preventus from generalizing the significant differences found for turbidity.
3.1.2. General Description
Correspondence Analyses were carried out on the matrix containing the frequencies of citationof the most cited attributes for each vintage separately. Moreover, the average orthonasal and globalREDOX odor scores were projected as supplementary variables, which were significantly correlatedfor both 2009 (r = 0.88, p < 0.05) and 2010 (r = 0.86, p < 0.05) vintages.
Concerning 2009 samples the CA followed by a HCA did not yield any meaningful or interpretableclusters (data not given). The four emerging clusters were not based on type of closure or turbiditylevel. Neither the samples nor the attributes seemed organized across a reduction–oxidation gradient(data not given).
Figure 3 shows the first and second dimensions of the CA on the frequencies of citation ofthe descriptors for the 2010 samples. Dimensions 1 and 2 accounted for 38.33% and 18.54% of theinertia, respectively.
According to cluster analysis, samples were sorted into two main groups. A first group, locatedin the negative values of the first dimension, was composed by samples with synthetic corks, and wasdescribed with oxidative terms such as “rancid honey”, “cooked vegetables”, “walnut/curry” and“bruised apple”. Wines with screw caps were located at positive values of the first dimension and weresplit into two sub groups. HCA yielded three groups, clearly segmenting the samples according totheir type of closure, but not according to their turbidity level. The samples C1 bottle1 and C3 bottle1were without any taint, and were characterized by the terms “woody”, “white fruits”, “yellow fruits”and “honey”. The other group (C1 bottle2, C3 bottle2, C2 bottle1 and C2 bottle2) was characterized bysome reduction terms as “dust/cardboard” or “rotten egg/cabbage” as well as “toasted”, “citrus” and“butter”. The separation between the two bottles of the samples C1 and C3 suggest a bottle effect ormaybe also a lack of repeatability of the panel for these two samples.
Contrary to the CA of the 2009 samples (data not given), the CA of the 2010 samples showeda better discrimination between samples and a better consistency between REDOX odor scores andgeneral attributes.
38
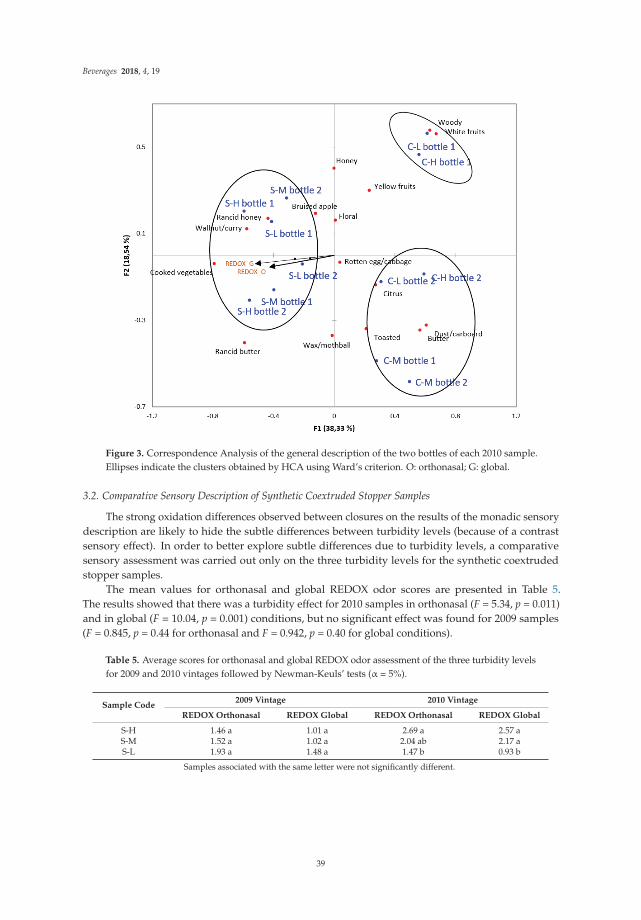
Beverages 2018, 4, 19
Figure 3. Correspondence Analysis of the general description of the two bottles of each 2010 sample.Ellipses indicate the clusters obtained by HCA using Ward’s criterion. O: orthonasal; G: global.
3.2. Comparative Sensory Description of Synthetic Coextruded Stopper Samples
The strong oxidation differences observed between closures on the results of the monadic sensorydescription are likely to hide the subtle differences between turbidity levels (because of a contrastsensory effect). In order to better explore subtle differences due to turbidity levels, a comparativesensory assessment was carried out only on the three turbidity levels for the synthetic coextrudedstopper samples.
The mean values for orthonasal and global REDOX odor scores are presented in Table 5.The results showed that there was a turbidity effect for 2010 samples in orthonasal (F = 5.34, p = 0.011)and in global (F = 10.04, p = 0.001) conditions, but no significant effect was found for 2009 samples(F = 0.845, p = 0.44 for orthonasal and F = 0.942, p = 0.40 for global conditions).
Table 5. Average scores for orthonasal and global REDOX odor assessment of the three turbidity levelsfor 2009 and 2010 vintages followed by Newman-Keuls’ tests (α = 5%).
Sample Code2009 Vintage 2010 Vintage
REDOX Orthonasal REDOX Global REDOX Orthonasal REDOX Global
S-H 1.46 a 1.01 a 2.69 a 2.57 aS-M 1.52 a 1.02 a 2.04 ab 2.17 aS-L 1.93 a 1.48 a 1.47 b 0.93 b
Samples associated with the same letter were not significantly different.
39

Beverages 2018, 4, 19
Ta
ble
6.
Res
ult
sof
the
AN
OV
AS
per
form
edon
the
conc
entr
atio
nof
pol
yphe
nols
for
2009
and
2010
sam
ple
s.P
roba
bilit
ies
inbo
ldar
esi
gnifi
cant
atα
=5%
.F:
Fish
erF-
rati
o;Pr
>F:
prob
abili
tyas
soci
ated
toth
eF-
rati
o.
So
urc
eo
fV
ari
ati
on
Ph
en
oli
cA
cid
sC
inn
am
icA
cid
sF
lav
an
-3-o
lsG
RP
Ty
roso
lT
ota
lP
oly
ph
en
ols
TP
I
FP
r>
FF
Pr
>F
FP
r>
FF
Pr
>F
FP
r>
FF
Pr
>F
FP
r>
F
vint
age
224.
9<0
.000
137
11.5
<0.0
001
161.
89<0
.000
113
34.9
<0.0
001
14.0
50.
002
3471
.11
<0.0
001
796.
39<0
.000
1cl
osur
e3.
30.
0915
.70.
001
26.0
50.
0001
1.63
0.22
1.10
0.31
20.2
10.
001
0.36
0.56
turb
idit
y32
.8<0
.000
10.
160.
850.
360.
7011
6.6
<0.0
001
309.
26<0
.000
135
.44
<0.0
001
6.68
0.00
9vi
ntag
e*cl
osur
e6.
50.
023
0.10
0.76
3.11
0.01
17.9
40.
001
14.0
70.
002
0.26
0.62
0.59
0.46
vint
age*
turb
idit
y2.
00.
1730
.0<0
.000
10.
360.
706
7.30
0.00
766
.77
<0.0
001
7.94
0.00
56.
380.
011
clos
ure*
turb
idit
y1.
00.
380.
280.
760.
760.
484
3.29
0.06
70.
468
0.64
0.15
0.87
1.27
0.31
Ta
ble
7.
Res
ults
ofth
eN
ewm
an-K
euls
’tes
t(α
=5%
)per
form
edon
the
conc
entr
atio
nof
poly
phen
ols
for
2009
and
2010
sam
ples
.
Main
Eff
ect
sP
hen
oli
cA
cid
sC
inn
am
icA
cid
sF
lav
an
-3-o
lsG
RP
Ty
roso
lT
ota
lP
oly
ph
en
ols
TP
I
vint
age
Ave
rage
(mg ·L
−1)
Ave
rage
(mg·L
−1)
Ave
rage
(mg·L
−1)
Ave
rage
(mg·L
−1)
Ave
rage
(mg·L
−1)
Ave
rage
(mg·L
−1)
Ave
rage
(mg·L
−1)
2009
4.54
a57
.47
a1.
30a
3.56
a23
.49
a90
.37
a8.
39a
2010
3.93
b43
.09
b0.
29b
2.88
b23
.156
b73
.36
b7.
29b
clos
ure
Ave
rage
(mg·L
−1)
Ave
rage
(mg·L
−1)
Ave
rage
(mg·L
−1)
Ave
rage
(mg·L
−1)
Ave
rage
(mg·L
−1)
Ave
rage
(mg·L
−1)
Ave
rage
(mg·L
−1)
C4.
27a
50.7
5a
1.00
a3.
21a
23.2
8a
82.5
a7.
85a
S4.
20a
49.8
2b
0.60
b3.
24a
23.3
7a
81.2
b7.
83a
turb
idit
yA
vera
ge(m
g·L−1
)A
vera
ge(m
g·L−1
)A
vera
ge(m
g·L−1
)A
vera
ge(m
g·L−1
)A
vera
ge(m
g·L−1
)A
vera
ge(m
g·L−1
)A
vera
ge(m
g·L−1
)L
4.13
b50
.28
a0.
84a
3.35
a24
.81
a83
.41
a7.
93a
M4.
47a
50.2
1a
0.77
a3.
29b
23.0
1b
81.7
5b
7.84
abH
4.11
b50
.37
a0.
78a
3.03
c22
.15
c80
.44
c7.
75b
Sam
ples
asso
ciat
edw
ith
the
sam
ele
tter
wer
eno
tsig
nific
antl
ydi
ffer
ent.
40

Beverages 2018, 4, 19
Table 5 shows that for 2010 samples and for both conditions, S-H was perceived as significantlymore oxidized than S-L but not than S-M. As for the monadic profile, orthonasal and global REDOXodor scores were significantly correlated (r = 0.95, p < 0.05).
As for the general description, the results suggest that 2010 samples presented wider oxidationdifferences than 2009.
3.3. Phenolic Composition
The results of the ANOVA carried out on the phenolic compositions from both 2009 and 2010vintages are presented in Table 6. Concerning the main effects, vintage reached significance for eachclass of polyphenols (phenolic acids, cinnamic acids, flavan-3-ols, tyrosol and GRP) and for totalpolyphenols and TPI. Table 7 shows the post-hoc Newman-Keuls’ mean comparison of the averageconcentrations of all polyphenolic families for each on the main ANOVA factors tested. Table 7 showsthat 2009 samples presented significantly higher concentrations for all the families of polyphenols afterseveral years of bottle aging.
Screw caps showed higher concentrations for cinnamic acid, total polyphenols and Flavo-3-ols.However, the latter showed a significant interaction with vintage. Cinnamic acids and totalpolyphenols showed significant interactions with vintage. On the other hand, phenolic acids andGRP, the major polyphenols in chardonnay wines, were fairly similar between wines under cork orscrew cap.
Concerning the effect of turbidity, significance was reached for the concentrations of phenolicacids, GRP, tyrosol, total polyphenols and TPI, but only phenolic acids showed an effect independentof the vintage, with the medium level of turbidity being slightly more concentrated than high andlow levels.
3.4. Relationships between Sensory Characteristics and Phenolic Composition
We tried to predict the REDOX scores for orthonasal and global conditions for every vintagefrom their phenolic concentrations by means of multiple linear regressions. Only variables showinga correlation with the corresponding REDOX scores higher than 0.3 were considered in thelinear regressions. The results of the stepwise linear regressions for both vintages and both conditionsare presented in Table 8.
Table 8. Results of the multiple regression analysis carried out to predict REDOX odor character byphenolic concentrations. R2: determination coefficient of the regression; t = Student value; Pr > |t|:probability associated with the absolute Student value. – indicates that the variable was not selectedfor the model because of an r < 0.3; ns indicates that the contribution of the variable to the predictivemodel was not significant. ns*: not significant.
Variable
REDOX 2009OrthonasalR2 = 0.26;
p = 0.086
REDOX 2009GlobalR2 = 0.61;
p = 0.014
REDOX 2010OrthonasalR2 = 0.94;
p < 0.0001
REDOX 2010GlobalR2 = 0.92;
p < 0.0001
t Pr > |t| t Pr > |t| t Pr > |t| t Pr > |t|
Phenol Acids ns* ns ns ns – – – –Cinnamic acids – – ns ns ns ns – –
Flavan-3-ols ns ns −3.12 0.012 −10.93 <0.0001 −8.06 <0.0001GRP – – 2.26 0.05 4.12 0.003 6.72 <0.0001
Tyrosol – – ns ns – – – –Total
polyphenols – – ns ns ns ns – –
TPI ns ns – – – – – –
Table 8 shows that no significant predictive model could be obtained from the 2009 orthonasal data.However, the predictive linear model for 2009 global was significant, and the ones for 2010 were verysignificant. The three significant predictive models were:
41

Beverages 2018, 4, 19
REDOX 2009-global = −3.54 − 0.93 × Flavan-3-ols + 1.56 × GRPREDOX 2010-orthonasal = −1.932 − 4.08 × Flavan-3-ols + 1.43 × GRPREDOX 2010-global = −3.63 − 2.35 × Flavan-3-ols + 1.82 × GRP
All three predictive models had basically the same pattern, with Flavan-3-ols as negativepredictors and GRP as positive predictors. These results suggest that the presence of Flavan-3-ol canpredict lower sensory oxidations, whereas high GRP levels predict higher oxidative notes. These resultsare particularly consistent between vintages for global perception.
4. Discussion
We implemented a combination of sensory and physicochemical analytical strategies in order tobetter understand the relationship between the wine polyphenol composition and the occurrence ofoxidative notes. First of all, it is interesting to note that orthonasal and global assessment conditionswere significantly correlated. This result is in agreement with previous findings [13]. However,as seen in Section 3.4, global evaluation enabled better regression models than orthonasal evaluations.One possible reason is that the in-mouth conditions in terms of temperature and contact surface withair favored the release of aroma compounds that were subsequently better perceived retronasally.
According to previous literature, strong vintage and closure effects were expected. Concerningturbidity, no particular hypothesis was formulated. The effects of the studied factors on the chemicaland sensory characteristics of the samples are discussed in the following sections.
4.1. Effect of Vintage, Closure and Turbidity on the Wines Polyphenolic Content
The results showed a clear effect of vintage on the concentrations of all of the phenolic classes.Previous studies have already pointed out that for each vintage, a unique polyphenolic compositionis conferred upon the resulting wine [26,28]. Flavan-3-ols, catechin and epicatechin were greatlyimpacted by closure compared to phenolic acids and GRP, likely due to their higher susceptibility toparticipation in slow oxidative processes during bottle storage [4]. Recent results have consistentlyshown that an unprecedented diversity of compounds could actually be involved in the discriminationof wine composition according to the type of closure [28]. Finally, must clarification level showeda significant effect on several polyphenolic classes, albeit largely modulated by vintage, but themechanisms involved are still unclear.
4.2. Vintage Effect on REDOX Perception
Since the two vintages tested were quite different in terms of polyphenolic composition, vintageswere analyzed separately for the sensory data. Taken together, the results confirm the importance ofthe composition of raw material, which is mostly vintage-dependent. Indeed, 2009 samples seemedmore resistant to oxidation than those from 2010, while the latter showed wider sensory differences.
4.3. Closure Effect on REDOX Perception
The monadic evaluation clearly showed significant differences between closure types for 2010samples, but not for 2009. It has been previously shown in the literature that wines closed withsynthetic cork are more prone to oxidation than wines closed with screw caps [14,16]. The choiceof the stoppers was made in order to increase the probability of having REDOX odor differencesbetween samples. Concerning the general description of the 2009 samples, no segmentation by closurewas shown. The 2010 samples showed a clear segmentation by closure type, with the samples closedwith screw cap described as fruitier, more oaky and even showing a slight reductive aroma. On theother hand, the samples closed with synthetic cork showed clear signs of oxidation (“rancid honey”,“cooked vegetables”, “walnut/curry” and “bruised apple”). These results are consistent with previousresearch [13,14].
42

Beverages 2018, 4, 19
4.4. Turbidity Effect on REDOX Perception
The monadic evaluation of 2009 samples showed significant differences in turbidity for bothconditions; unfortunately, significant turbidity*wine closure interactions prevent us from interpretingthe main effects.
However, concerning the 2010 samples, the panel failed to show a significant turbidity effect,probably because the important differences between types of closures masked more subtle differencesbetween turbidity levels.
A modification in the sensory protocol was implemented in a subsequent sensory session toconfirm the existence of significant REDOX odor differences between turbidity levels for both vintages.As a result, a comparative assessment of the synthetic closures showed significant differences only for2010 samples. Taken together, these results suggest for the first time that must turbidity could have animpact on the oxidative stability of white wines. To date, there are virtually no references concerningthe relationship between must clarification and the polyphenol composition of the resulting wine,so the mechanism of this effect is still unclear, and further research is needed. One possible explanationis that, as seen in Section 4.1, must clarification somehow changes the polyphenolic composition of thewine, which could impact its sensory REDOX characteristics.
4.5. Effect of the Phenolic Composition on REDOX Perception
Multiple linear regressions showed significant predictive models of REDOX perception scores for2010 data (both conditions) and for global perception of 2009 data. For all three models, our resultssuggest that the presence of Flavan-3-ol could predict lower sensory oxidations, whereas high GRPlevels predicts higher oxidative notes. Such results provide an unprecedented model of the oxidationsensory note of dry chardonnay wine based on the concentration of two major polyphenol-relatedcompounds, which is highly consistent with the literature. Flavan-3-ols and GRP have indeedalready been described as being involved in oxidation reactions in wine, but never subjected toa sensory analysis. GRP is a well-known polyphenolic compound that appears preferentially duringprefermentative steps, where non-protected musts lead to higher concentration of GRP due tothe nucleophilic attack of the quinone of caftaric acid with the reduced form of glutathione [29].Additionally, some studies have also shown that GRP continues to accumulate in wine during bottleaging under oxidative environments [30,31] without knowing exactly its origin. GRP is thus considereda final marker of an historical event of oxidation in must and/or wine. Similarly, the oxidation andbrowning of white musts have been shown to be largely correlated to the content of hydroxycinnamicacids and favored by the presence of Flavan-3-ols [32,33]. Additionally, Flavan-3-ols are slowlyoxidized in wine in presence of oxygen and metal catalysts as clearly described by Danilewicz [5].Therefore, our results shed new and interesting light on the impact that prefermentative managementof musts can have on the later REDOX sensory note of bottle-aged dry chardonnay wines. In particular,they suggest that actions that reduce the production of GRP and maintain high levels of flavanols,such as must protection before alcoholic fermentation, could lead to lower oxidation notes.
5. Conclusions
The present study showed that the sensory oxidative character of bottle-aged chardonnay winesresults from complex interactions between the different variables included in the experiment. It alsoshowed the difficulty of generalizing the effects to different vintages. The polyphenolic compositionwas also quite vintage-dependent, and could partially explain the sensory differences between vintages.The main result of this study is that concentrations of Flavan-3-ols and GRP could both be significantpredictors of wines oxidative sensory character, but with opposite effects.
Altogether, these results bring valuable new clues for questioning the impact of oenologicalpractices—from prefermentative steps to bottling—on the subsequent development of oxidation,through the combined analysis of bottle aged wines.
43
Beverages 2018, 4, 19
Supplementary Materials: The following are available online at www.mdpi.com/2306-5710/4/1/19/s1. Table S1:raw data corresponding to the sensory sessions; Table S2: raw data corresponding to the polyphenolschemical analysis.
Acknowledgments: The research was funded by the IABECA research federation working on Agriculture,Biodiversity, Environment, Behavior and Food. We thank the Bureau Interprofessionnel des Vins de Bourgognefor the white wine samples. We finally thank the first-year enology students (2015/2016), who kindly participatedin our sensory sessions for this experiment.
Author Contributions: Jordi Ballester: conceived and designed the sensory experiments, main writing contributor,sensory data discussion and interpretation. Mathilde Magne: trained the panel and collected the sensory data.Perrine Julien: analyzed the sensory data. Laurence Noret: performed polyphenol analyses. Maria Nikolantonaki:significant contribution in the introduction section. Christian Coelho: conceived and designed the chemicalanalyses, project leader. Régis D. Gougeon: significant contribution in the interpretation of the results, generalsupervisor and coordinator.
Conflicts of Interest: The authors declare no conflict of interest.
References
1. Roullier-Gall, C.; Witting, M.; Moritz, F.; Gil, R.B.; Goffette, D.; Valade, M.; Schmitt-Kopplin, P.;Gougeon, R.G.D. Natural oxygenation of champagne wine during ageing on lees: A metabolomics pictureof hormesis. Food Chem. 2016, 203, 207–215. [CrossRef] [PubMed]
2. Lopes, P.; Silva, M.A.; Pons, A.; Tominaga, T.; Lavigne, V.; Saucier, C.; Darriet, P.; Teissedre, P.-L.;Dubourdieu, D. Impact of oxygen dissolved at bottling and transmitted through closures on the compositionand sensory properties of a sauvignon blanc wine during bottle storage. J. Agric. Food Chem. 2009, 57,10261–10270. [CrossRef] [PubMed]
3. Ugliano, M. Oxygen contribution to wine aroma evolution during bottle aging. J. Agric. Food Chem. 2013, 61,6125–6136. [CrossRef] [PubMed]
4. Pons, A.; Nikolantonaki, M.; Lavigne, V.; Shinoda, K.; Dubourdieu, D.; Darriet, P. New insights into intrinsicand extrinsic factors triggering premature aging in white wines. In Advances in Wine Research; AmericanChemical Society: Washington, DC, USA, 2015; Volume 1203, pp. 229–251.
5. Danilewicz, J.C. Interaction of sulfur dioxide, polyphenols, and oxygen in a wine-model system: Centralrole of iron and copper. Am. J. Enol. Vitic. 2007, 58, 53.
6. Bueno, M.; Culleré, L.; Cacho, J.; Ferreira, V. Chemical and sensory characterization of oxidative behavior indifferent wines. Food Res. Int. 2010, 43, 1423–1428. [CrossRef]
7. Silva Ferreira, A.C.S.; Guedes de Pinho, P.; Rodrigues, P.; Hogg, T. Kinetics of oxidative degradation ofwhite wines and how they are affected by selected technological parameters. J. Agric. Food Chem. 2002, 50,5919–5924. [CrossRef]
8. Culleré, L.; Cacho, J.; Ferreira, V. An assessment of the role played by some oxidation-related aldehydes inwine aroma. J. Agric. Food Chem. 2007, 55, 876–881. [CrossRef] [PubMed]
9. Pripis-Nicolau, L.; de Revel, G.; Bertrand, A.; Maujean, A. Formation of flavor components by the reaction ofamino acid and carbonyl compounds in mild conditions. J. Agric. Food Chem. 2000, 48, 3761–3766. [CrossRef][PubMed]
10. Rizzi, G.P. Formation of strecker aldehydes from polyphenol derived quinones and α-amino acids in anonenzymic model system. J. Agric. Food Chem. 2006, 54, 1893–1897. [CrossRef] [PubMed]
11. Nikolantonaki, M.; Waterhouse, A.L. A method to quantify quinone reaction rates with wine relevantnucleophiles: A key to the understanding of oxidative loss of varietal thiols. J. Agric. Food Chem. 2012, 60,8484–8491. [CrossRef] [PubMed]
12. Nikolantonaki, M.; Darriet, P. Identification of ethyl 2-sulfanylacetate as an important off-odor compound inwhite wines. J. Agric. Food Chem. 2011, 59, 10191–10199. [CrossRef] [PubMed]
13. Godden, P.; Francis, L.; Field, J.; Gishen, M.; Coulter, A.; Valente, P.; HØJ, P.; Robinson, E. Wine bottleclosures: Physical characteristics and effect on composition and sensory properties of a semillon wine 1.Performance up to 20 months post-bottling. Aust. J. Grape Wine Res. 2001, 7, 64–105. [CrossRef]
14. Skouroumounis, G.; Kwiatkowski, M.; Francis, I.L.; Oakey, H.; Capone, D.L.; Duncan, B.; Sefton, M.A.;Waters, E.J. The impact of closure type and storage conditions on the composition, colour and flavour
44

Beverages 2018, 4, 19
properties of a riesling and a wooded chardonnay wine during five years’ storage. Aust. J. Grape Wine Res.2005, 11, 369–377. [CrossRef]
15. Skouroumounis, G.K.; Kwiatkowski, M.J.; Francis, I.L.; Oakey, H.; Capone, D.L.; Peng, Z.; Duncan, B.;Sefton, M.A.; Waters, E.J. The influence of ascorbic acid on the composition, colour and flavour propertiesof a riesling and a wooded chardonnay wine during five years’ storage. Aust. J. Grape Wine Res. 2005, 11,355–368. [CrossRef]
16. Silva, M.A. Closure Effect on Sensory Quality of Wine; Université Bordeaux 2: Bordeaux, France, 2011.17. Guaita, M.; Petrozziello, M.; Motta, S.; Bonello, F.; Cravero, M.C.; Marulli, C.; Bosso, A. Effect of the closure
type on the evolution of the physical-chemical and sensory characteristics of a montepulciano d’abruzzorosé wine. J. Food Sci. 2013, 78, C160–C169. [CrossRef] [PubMed]
18. Rodrigues, H.; Ballester, J.; Valentin, D. Ageing effect on minerality perception of Chablis wines.In Proceedings of the 10th International Symposium of Enology of Bordeaux, Bordeaux, France, 29 June–1July 2015; Vigne et vin Publications Internationales: Bordeaux, France; pp. 681–685.
19. Brajkovich, M.; Tibbits, N.; Peron, G.; Lund, C.M.; Dykes, S.I.; Kilmartin, P.A.; Nicolau, L. Effect of screwcapand cork closures on so2 levels and aromas in a sauvignon blanc wine. J. Agric. Food Chem. 2005, 53,10006–10011. [CrossRef] [PubMed]
20. Psarra, E.; Makris, D.P.; Kallithraka, S.; Kefalas, P. Evaluation of the antiradical and reducing propertiesof selected greek white wines: Correlation with polyphenolic composition. J. Sci. Food Agric. 2002, 82,1014–1020. [CrossRef]
21. Villaño, D.; Fernández-Pachón, M.S.; Troncoso, A.M.; García-Parrilla, M.C. Influence of enological practiceson the antioxidant activity of wines. Food Chem. 2006, 95, 394–404. [CrossRef]
22. Lachman, J.; Miloslav, Š.; Katerina, F.; Vladimír, P. Major factors influencing antioxidant contents andantioxidant activity in grapes and wines. Int. J. Wine Res. 2009, 1, 101–121. [CrossRef]
23. Sioumis, N.; Kallithraka, S.; Makris, D.P.; Kefalas, P. Kinetics of browning onset in white wines: Influence ofprincipal redox-active polyphenols and impact on the reducing capacity. Food Chem. 2006, 94, 98. [CrossRef]
24. Karbowiak, T.; Gougeon, R.D.; Alinc, J.-B.; Brachais, L.; Debeaufort, F.; Voilley, A.; Chassagne, D. Wineoxidation and the role of cork. Crit. Rev. Food Sci. Nutr. 2009, 50, 20–52. [CrossRef]
25. Campo, E.; Ballester, J.; Langlois, J.; Dacremont, C.; Valentin, D. Comparison of conventional descriptiveanalysis and a citation frequency-based descriptive method for odor profiling: An application to burgundypinot noir wines. Food Qual. Preference 2010, 21, 44–55. [CrossRef]
26. Roullier-Gall, C.; Lucio, M.; Noret, L.; Schmitt-Kopplin, P.; Gougeon, R.D. How subtle is the “terroir”effect? Chemistry-related signatures of two “climats de bourgogne”. PLoS ONE 2014, 9, e97615. [CrossRef][PubMed]
27. Carando, S.; Teissedre, P.L.; Cabanis, J.C. Hplc coupled with fluorescence detection for the determination ofprocyanidins in white wines. Chromatographia 1999, 50, 253–254. [CrossRef]
28. Roullier-Gall, C.; Hemmler, D.; Gonsior, M.; Li, Y.; Nikolantonaki, M.; Aron, A.; Coelho, C.; Gougeon, R.D.;Schmitt-Kopplin, P. Sulfites and the wine metabolome. Food Chem. 2017, 237, 106–113. [CrossRef] [PubMed]
29. Kritzinger, E.C.; Bauer, F.F.; du Toit, W.J. Role of glutathione in winemaking: A review. J. Agric. Food Chem.2013, 61, 269–277. [CrossRef] [PubMed]
30. Vallverdú-Queralt, A.; Verbaere, A.; Meudec, E.; Cheynier, V.; Sommerer, N. Straightforward method toquantify gsh, gssg, grp, and hydroxycinnamic acids in wines by uplc-mrm-ms. J. Agric. Food Chem. 2015, 63,142–149. [CrossRef] [PubMed]
31. Coetzee, C.; Van Wyngaard, E.; Šuklje, K.; Silva Ferreira, A.C.; du Toit, W.J. Chemical and sensory studyon the evolution of aromatic and nonaromatic compounds during the progressive oxidative storage of asauvignon blanc wine. J. Agric. Food Chem. 2016, 64, 7979–7993. [CrossRef] [PubMed]
32. Cheynier, V.; Basire, N.; Rigaud, J. Mechanism of trans-caffeoyltartaric acid and catechin oxidation in modelsolutions containing grape polyphenoloxidase. J. Agric. Food Chem. 1989, 37, 1069. [CrossRef]
33. Oszmianski, J.; Cheynier, V.; Moutounet, M. Iron-catalyzed oxidation of (+)-catechin in model systems.J. Agric. Food Chem. 1996, 44, 1712–1715. [CrossRef]
© 2018 by the authors. Licensee MDPI, Basel, Switzerland. This article is an open accessarticle distributed under the terms and conditions of the Creative Commons Attribution(CC BY) license (http://creativecommons.org/licenses/by/4.0/).
45
beverages
Article
Application of a Pivot Profile Variant Using CATAQuestions in the Development of a Whey-BasedFermented Beverage
Marcelo Miraballes *, Natalia Hodos and Adriana Gámbaro
Área Evaluación Sensorial, Departamento de Ciencia y Tecnología de Alimentos, Facultad de Química,Universidad de la República, General Flores 2124, Montevideo CP 11800, Uruguay; [email protected] (N.H.);[email protected] (A.G.)* Correspondence: [email protected]; Tel.: +598-292-457-35
Received: 15 November 2017; Accepted: 9 January 2018; Published: 1 February 2018
Abstract: During the development of a food product, the application of rapid descriptive sensorymethodologies is very useful to determine the influence of different variables on the sensorycharacteristics of the product under development. The Pivot profile (PP) and a variant of thetechnique that includes check-all-that-apply questions (PP + CATA) were used for the developmentof a milk drink fermented from demineralised sweet whey. Starting from a base formula of partiallydemineralised sweet whey and gelatin, nine samples were elaborated, to which various concentrationsof commercial sucrose, modified cassava starch, and whole milk powder were added. Differences insucrose content affected the sample texture and flavour and the modified starch was able to decreasethe fluidity and increase the texture of creaminess and firmness, of the samples. The two appliedsensory methodologies achieved good discrimination between the samples and very similar results,although the data analysis was clearly simplified in relation to the difficulty and time consumed inthe PP + CATA variant.
Keywords: whey; pivot profile; CATA; fermented beverage
1. Introduction
One of the main problems in environmental management of the small and medium dairy industryis the destination of by-products generated in the industrial activities, such as milk whey. Thus,in recent decades, there has been an increase in interest in the use of this by-product [1]. The highcontent in lactose makes milk whey a raw material (from the industrial viewpoint) with significantpotential for the development of fermented products [2]. This application has the advantage thatthe production process is very similar to the production of, for example, a conventional yoghurt,so the start-up and production cost is not high for a dairy company. The use of lactic acid bacteriain the fermentation of whey is associated with intense bacterial metabolic activity with respect tothe carbohydrates, lipids, proteins, and allergenic peptides present in it. Thus, bacteria promotedigestibility and preservation. In addition, their action increases the content of lactic acid and othermetabolites, such as aromatic compounds that contribute to the flavour, texture, and sweetness of thefinal product [3]. The sweet whey in its pure form presents a low sensory acceptability, which is due tothe unpleasant flavour caused by the high content of mineral salts. Although the fermentation processconsiderably improves the sensory profile and acceptability of the product, it is not sufficient to achieveacceptability values comparable to those obtained with milk drinks made with milk [4]. In this sense,it is also interesting to use the previously demineralised sweet whey as an input for fermentation,to obtain a product with greater acceptability. To solve this drawback, some authors have producedfermented beverages from sweet whey with the addition of milk at different levels, significantly
Beverages 2018, 4, 11; doi:10.3390/beverages4010011 www.mdpi.com/journal/beverages46

Beverages 2018, 4, 11
improving its aroma and flavour characteristics, thus causing an increase in the acceptability of theproducts [5–8]. In these articles, fermented beverages were made with a different degree of milksubstitution with sweet whey. The main limitation found was that, sensorially, the substitution ofmilk with sweet whey is only viable up to an average of 50% since the acceptability of the productfalls afterwards because the texture of the product is not adequate, and unwanted flavour is detected.Regarding the nutritional aspects, fermented milk is an important source of nutrients and providesbeneficial health effects, such as stimulation of the immune system, cholesterol reduction, appetiteregulation, and a decreased risk of some types of cancer [9,10]. In addition, the organic acids generatedduring the fermentation process, such as lactic acid, help the absorption of iron from other foods [11].
The sensory profile in the development of a food product is traditionally obtained using adescriptive analysis through a panel of trained assessors [12]. This methodology provides very accurateand reproducible results; however, it has the disadvantage of consuming significant amounts of timeand is relatively costly [13]. In this context, several rapid sensory characterisation methodologies havebeen developed in recent years. These have the advantage of reducing the time needed to obtain resultsand lower associated costs, in addition to being able to be performed by individuals without priortraining [14]. Pivot profile (PP) is a rapid descriptive methodology developed by Thuillier [15] to obtaindescriptive information based on the free description technique and is very commonly used in that area.The methodology has been used in the sensory characterisation of champagnes [16] and dairy products,such as chocolate ice cream [17] and Greek yoghurts [18]. Although this methodology allows a verygood description of the products evaluated, the data analysis is often very difficult and slow becauseall the text generated by the assessors must be analysed and interpreted [19]. Check-all-that-apply(CATA) questions are a quick and practical descriptive method to obtain information about how thecharacteristics of the products are perceived. These questions consist of a list from which individualschoose words or phrases that they consider appropriate for the product they are evaluating [20].This methodology has been widely used in sensory analysis due to its simplicity and because it is easy,intuitive, and requires less cognitive effort from the participants compared to other techniques [14,21].
In this context, the objective of this work was to compare the results of the PP techniqueapplications and a variant of the PP technique using CATA questions (PP + CATA) with panelsof semi-trained assessors in the development of a fermented milk drink from demineralised sweetwhey. In this way, we sought to automize the data analysis and avoid the generated text analysisstage, since the terms used to describe the samples in this variant of the technique would be selectedin advance and all the assessors would use the same vocabulary.
2. Materials and Methods
2.1. Formulations
For the processing of the samples as a base formula, the following were used: 8% partiallydemineralised (40% mineral content reduced) and dehydrated sweet whey (Conaprole, Montevideo,Uruguay) and 0.3% gelatin (Boom 220, Bloom, Leiner Davis, NY, USA). Nine samples weredeveloped varying the concentrations of commercial sucrose, modified cassava starch (SuperCorp 75,Horizonte Amidos, PR, Brazil), and whole milk powder (Conaprole, Uruguay), following a factorialdesign of three variables and two levels (Table 1). In each formulation, drinking water treated throughreverse osmosis was used to make up the solutions to 100%. The concentration ranges were selectedbased on preliminary trials. Sucrose concentrations were chosen to reflect those usually found incommercial fermented beverages, and reported articles in which milk was added to the whey as amethod for increasing the acceptability of fermented whey products [8,22–24]. In this way, sampleswith different sensory characteristics were obtained, both in texture and flavour.
47

Beverages 2018, 4, 11
Table 1. Concentrations used in the formulation of samples 1.
Samples Milk Powder (%) Starch (%) Sugar (%)
A 2.5 0 4B 2.5 0 6C 2.5 1 4D 2.5 1 6E 5.0 0 4P 5.0 0 6G 5.0 1 4H 5.0 1 6
1 Each formulation contained 8% partially demineralised and dehydrated sweet whey and 0.3% gelatin.
In the present work, sample P was randomly selected (Table 1) as the Pivot. According to [16],the selection of the Pivot sample generates a minimal effect on the results obtained using thismethodology and therefore is not a key aspect for the good performance of the method. This criterionwas used in a sensory characterisation study of ice cream, in which the Pivot sample was selected atrandom [17].
2.2. Elaboration Process
The water required for each formulation was heated at 50 ◦C and then mixed with the solidingredients for 5 min at 100 rpm. Next, the heat treatment was carried out, bringing the mixture toa temperature of 85 ◦C, which was maintained for 5 min, stirring at 200 rpm. The mixture was thenplaced in 1000 mL Durham glass bottles with sterile lids and cooled in a water bath until reaching atemperature of 42 ◦C. Then, the mixture was inoculated with a lactic ferment dispersion (Yo-Mix 205LYO 250 DCU, Danisco, France) to obtain an initial concentration in the mixture of 0.2 direct cultureunits/L. It was gently shaken manually with care so as not to add air. Fermentation was carried out ina temperature controlled oven at 42 ± 1◦ C. The process was monitored by means of pH and endedwhen a value of 4.5 was reached. The fermentation time depended on the corresponding formulaand was approximately 4 to 5 h. Then, the mixture was cooled to 25 ◦C in a water bath. Once thattemperature was reached, each sample was agitated at 100 rpm for 3 min. Subsequently, it was storedat 4 ◦C until its evaluation, which was carried out 24 h after. Both the heat treatment and the agitationof the mixture was performed using a Taurus My cook kitchen robot (Taurus S.A., Spain).
2.3. Panels of Semi-Trained Assessors
Twenty individuals were selected who had previous experience in participation as sensoryassessors of panels of descriptive analysis of different foods. These individuals were divided intotwo groups according to the previous experience of each individual in sensory evaluation. This wasdone so that there would be no difference in their sensory evaluation experience between bothgroups. Both panels evaluated the samples, but followed two different methodologies. One panelevaluated the samples following the PP methodology, while the other used PP + CATA. All evaluationswere conducted in duplicate in two different sessions in a standardised sensory evaluation roomaccording to [25]. RedJade software (RedJade, Redwood Shores, CA, USA) was used as an interface fordata collection.
2.4. Pivot Profile
Each panellist received samples in pairs (one identified as the Pivot and another coded withthree-digit numbers in alternate presentation order). For each pair, they were asked to write down(in the assessor´s own words) the sensory attributes that they thought the sample had in greater andlesser intensity than the pivot sample, focusing on the texture and flavour attributes. Between the
48

Beverages 2018, 4, 11
evaluation of samples, each panellist had to drink a little water and wait 30 s before continuing withthe next one.
2.5. Pivot Profile + CATA
The form of evaluation following this variant of the methodology was similar to that of PP exceptthat the panellists did not have to write the attributes. Each panellist received two lists of 23 sensoryattributes of flavour and texture (Table 2). In the first list, the assessor had to select the attributes theythought the sample had in greater intensity than the pivot. Then, in the second list, the panellist had toselect the attributes they thought the sample had in lesser intensity than the pivot.
Table 2. Attributes used in the PP + CATA methodology.
Flavour Texture
Aftertaste RoughButter flavour Firmness
Cooked LiquidCharacteristic flavour Melting speed
Artificial Mouth coatingDairy flavour Sticky
Strange flavour SoftSalty LumpySour FilamentousBitter GummySweet Gelatinous
Creamy
The attributes were selected based on a literature review on possible sensory descriptors present infermented milk drinks and yogurts, both traditional and with added dairy whey [22,23,26]. To evaluatethe reproducibility of both panels, the Pivot sample was used as a blind sample and is observed in theresults as P’ [27].
2.6. Data Analysis
2.6.1. Pivot Profile
The data were analysed according to [16]; all the attributes generated were grouped semanticallyinto two categories: flavour and texture. Then, words with the same meaning (synonyms) weregrouped within the same attribute, for example: astringent, rough, and shrivelled, using a dictionaryto identify them. Next, a data table was created as follows. For each sensory attribute defined in theprevious stage, we quantified the number of times that the attribute was mentioned as being moreintense than the pivot (positive frequency) and the times it was mentioned as less intense than the pivot(negative frequency). The negative frequency was subtracted from the positive frequency, resulting ina data table containing positive and negative values. To obtain a contingency table containing onlypositive values, the lowest value of the table was added to each value of the table. Thus, the lowestvalue of the table was transformed into absolute zero and all data in the table were converted to apositive value or zero. From this table, a correspondence analysis (CA) was performed.
2.6.2. Pivot Profile + CATA Data Analysis
In this case, it was not necessary to perform the grouping and classification of attributes becausethey were already established when using the CATA questions. The frequency of selection of eachterm of the CATA question used to describe the sample was calculated as more intense than the pivot(positive frequency) and as less intense than the pivot (negative frequency). The negative frequency
49

Beverages 2018, 4, 11
was subtracted from the positive frequency and the table was transformed so that it only containsvalues greater than or equal to zero. Then, from the obtained table, a CA was conducted.
2.6.3. Comparison of Obtained Sensory Maps
To compare the results obtained using the PP methodology and its variant using CATA questions,the correlation coefficient Rv between the coordinate matrices of the samples was determined in thefirst two dimensions of the respective correspondence analysis [28]. In addition, the significance ofthe Rv coefficient was determined using a permutation test [29]. To visually compare the similaritybetween the sensory configurations of the samples obtained through both methodologies, a multifactorial analysis (MFA) was performed on the coordinates of the samples in the first two dimensionsof the corresponding CA. All statistical analyses were performed using XL-Stat 2017 software(Addinsoft, Paris, France).
3. Results
3.1. Pivot Profile
Figure 1 shows the representation of the samples and attributes generated by the assessors inthe description of the samples using the PP technique in the first two factors of the CA. In this case,the first two factors explained almost 91% of the variability of the experimental data obtained.
sour
bitter
yellow
roughcookedcreamy
sweet
firmfatty
lumpy
homogeneous
fluid
dairy flavour
flavour intensitysalty
bland
mild
earthy
vanilla
H
E
DP´
A
B
C
G
P
-0.8
-0.6
-0.4
-0.2
0
0.2
-0.4 -0.2 0 0.2 0.4
F2 (4
2.13
%)
F1 (48.78 %)
Symmetric plot (axes F1 and F2: 90.91 %)
Figure 1. Representation of the samples and attributes in the first two factors of the correspondenceanalysis of sensory data obtained using Pivot profile (PP). Texture attributes are shown in italics andflavour attributes in regular type.
The attributes that explain the flavour differences found in the samples are the sourness andsweetness. As for the texture, they differed due to their creaminess, firmness, and fluidity.
The first factor, which explained 48.8% of the variability, was associated positively with the fluidityor liquid texture of the samples and negatively regarding creaminess and firmness. These results showcoherence in the sensory descriptions obtained, since they are opposing characteristics. On the otherhand, the second factor was associated positively with sourness, while negatively with the sweetness
50

Beverages 2018, 4, 11
of the samples, explaining a variability percentage of 42.1%. As observed in the first factor, the resultsshow relative coherence. As shown in Figure 1, the other attributes are located very close to the originof the graph coordinates, so these attributes did not serve to discriminate the samples.
Evident differences can be observed in the evaluated samples, since they are dispersed in thefour quadrants of the sensory map obtained from the CA (Figure 1). Samples A and B were themost liquid, least creamy, and least firm. In turn, they differed in terms of flavour, with being A thesame as C and with E being more sour than B. In addition, sample B was sweeter than the others.These results are consistent with the formulation of the samples shown in Table 1. Samples A andB were prepared with a low level of milk (2.5%) and without modified starch; the only differencewas in the sucrose content, which was higher in sample B. Regarding samples C and D, both werecharacterised as fluid but not as much as for samples A and B. Their difference was also given by thesweetness and sourness, which is consistent because these samples differed in their formulation onlyin their sucrose content. The difference in the sucrose content used in this study influences the sensoryprofile of the product. Moreover, the modified starch used reduces fluidity and increases the feeling ofcreaminess and firmness of the samples. Regarding the texture of samples G and H, these were thoseof a greater creaminess and firmness and less fluidity. This shows that the samples, when elaboratedwith a high level of milk (5%) and modified starch, have those characteristics. In turn, sample H wasperceived as having a greater sweetness intensity than G, which is consistent with the sucrose contentof both samples.
In this case, sample P’ is almost in the same position as the Pivot sample (P). The panel seeminglybehaved in a reproducible way.
3.2. Pivot Profile + CATA
The results obtained using the PP + CATA methodology are illustrated in Figure 2. The first twofactors explained 89.4% of the variability of the data. The first factor explained 63% of the variability inthis case, while the second factor explained 26.3% of the variability.
aftertasteartificial
bitterbutter flavour
characteristic flavour
firm
cooked
creamy
dairy flavour
filamentous
liquid
gelatinous
gummy lumpy
melting speed
mouth coatingrough
salty
soft
sour
stickystrange flavour
sweet
H
E
D
P´
A
B
C
G
P
-0.2
-0.1
0.0
0.1
0.2
0.3
0.4
0.5
0.6
-0.5 -0.4 -0.3 -0.2 -0.1 0.1 0.2 0.3 0.4 0.5
F2 (2
6.31
%)
F1 (63.03 %)
Symmetric plot (axes F1 and F2: 89.34 %)
Figure 2. Representation of the samples and attributes in the first two factors of the correspondenceanalysis of sensory data obtained using PP + CATA. Texture attributes are shown in italics and flavourattributes in regular type.
51

Beverages 2018, 4, 11
The attributes that most differentiated the samples in this case were liquid, creamy, firm, and sweet.The first factor was associated positively with the liquid texture attribute and negatively withthe creamy and firm attributes, while the second factor was associated positively with sweetness.With respect to the sensory description obtained from the samples, the methodology achieved gooddiscrimination between the samples because they are distributed in the four quadrants of the graph,and their sensory characterization is very similar to that obtained using PP. On the other hand,the positions of samples P and P’ are very close in the map; therefore, the panel behaved in areproducible way when using this sensory methodology.
3.3. Comparison of Obtained Sensory Maps
The sensory configurations obtained in both sessions are shown in Figure 3. They illustrate thatthe sensory spaces established through both methodologies are very similar because the samples inboth methodologies are located near one another in the plan. On the other hand, a highly significant(p = 0.001) value was obtained in the Rv coefficient (0.89) between both configurations.
H
E
D
P´
A
B
C
G
PH PPH PP+CATA
E PP
E PP+CATA
D PP
D PP+CATA
P´ PPP´PP+CATA
A PP
A PP+CATA
B PP
B PP+CATA
C PP
C PP + CATA
G PP
G PP+CATA
P PP
P PP+CATA
-2.5
-2
-1.5
-1
-0.5
0
0.5
1
1.5
2
-3.5 -3 -2.5 -2 -1.5 -1 -0.5 0 0.5 1 1.5 2 2.5 3
F2 (4
6.15
%)
F1 (49.41 %)
Coordinates of the projected points (axes F1 and F2: 95.56 %)
Figure 3. Representation of the superimposed samples in the MFA of both methodologies.All the samples are represented by two points corresponding to each applied methodology(PP and PP + CATA). In turn, a third point, which corresponds to the consensus representation andconsiders both instances of evaluation, is presented.
4. Discussion
The results obtained through both methodologies were very good in terms of the power ofdiscrimination of the samples. With the PP methodology, it was possible to explain 90.9% ofthe variability obtained, while this figure was 89.4% when using PP + CATA. At the same time,the attributes by which the samples were discriminated in both methodologies were practically thesame. For PP, these were sweetness, sourness, fluidity, creaminess, and consistency. For PP + CATA,the samples were discriminated by these same attributes except for sourness. In this case, the sournesswas not very well explained by any of the factors of the CA.
52

Beverages 2018, 4, 11
However, in both methodologies, the samples were perceived in a similar way from the sensorypoint of view and the configurations obtained in both CAs were also similar, which is evident,considering the obtained Rv value herein, 0.89. The Rv coefficient is used as a way of comparing twodifferent factorial configurations. When the value is closer to 1, the correlation these configurationswill have is higher, and the closer to 0, the lower it will be. This coefficient depends on the relativeposition of the points in the configuration and is independent of the rotation and translation [28].The minimum value to assert that two configurations are relatively similar that has been used indifferent articles when performing comparisons is between 0.65 and 0.90 and has been widely usedin the comparison of data obtained with consumers through PP, CATA questions and Napping [18],PP and free comments [17], Napping in different conditions [30], questions [23,31], different instancesof word associations [32], and in performance evaluations of panels of trained sensory assessors [33].
One of the advantages of the use of open response methodologies, such as PP, is the freedom in thelanguage used to describe the samples by the evaluators and the richness in their variety [34]. In thissense, this methodology has an advantage over the variant used in this study using CATA questions(PP + CATA) because, in the latter, it is very important to correctly select the attributes, which issomething typical of the CATA question methodology. In contrast, PP has a disadvantage in that theanalysis of the generated text to describe the sample stage can be complex and time-consuming, and ithas some degree of subjectivity due to researchers’ interpretation and categorisation of terms writtenby assessors [32]. This problem could be solved using the proposed variant (PP + CATA) because thedata analysis is clearly simplified, as it is not necessary to perform any text analysis due to the use ofthe previously predefined language.
The results obtained in this study are similar in terms of the sensory description of the samplesand the factorial spaces obtained using semi-trained judges; thus, the proposed PP variant is likely tobe useful for the evaluation of dairy products, such as those used in this study.
5. Conclusions
The application of a rapid descriptive sensory methodology, such as PP, enables the evaluationof the influence of different ingredients and concentrations of them in the sensory characteristics ofthe samples. With the variant used, which combines PP with CATA questions, the results were verysimilar to those obtained when using PP, but the data analysis was clearly simplified by eliminatingthe text analysis. Notwithstanding, future studies that compare the results obtained when using PPand the proposed variant (PP + CATA) in other products that compare the results of both techniquesobtained with semi-trained assessors and with consumers should be conducted.
Author Contributions: M.M. and A.G. conceived and designed the experiments; M.M. and N.H. performed theexperiments; M.M. and N.H. analyzed the data; M.M. and A.G. wrote the paper.
Conflicts of Interest: The authors declare no conflict of interest.
References
1. Ganju, S.; Gogate, P.R. A review on approaches for efficient recovery of whey proteins from dairy industryeffluents. J. Food Eng. 2017, 215, 84–96. [CrossRef]
2. Sanmartín, B.; Díaz, O.; Rodríguez-Turienzo, L.; Cobos, A. Composition of caprine whey protein concentratesproduced by membrane technology after clarification of cheese whey. Small Rumin. Res. 2012, 105, 186–192.[CrossRef]
3. Mauriello, G.; Moio, L.; Moschetti, G.; Piombino, P.; Addeo, F.; Coppola, S. Characterization of lactic acidbacteria strains on the basis of neutral volatile compounds produced in whey. J. Appl. Microbiol. 2001,90, 928–942. [CrossRef] [PubMed]
4. Soares, D.S.; Fai, A.E.; Oliveira, A.M.; Pires, E.M.; Stamford, T.L. Aproveitamento de soro de queijo paraprodução de iogurte probiótico. Arq. Bras. Med. Vet. Zootec. 2011, 63, 996–1002. [CrossRef]
53

Beverages 2018, 4, 11
5. Caldeira, L.A.; Ferrão, S.P.B.; Fernandes, S.A.D.A.; Magnavita, A.P.A.; Santos, T.D.R. Desenvolvimento debebida láctea sabor morango utilizando diferentes níveis de iogurte e soro lácteo obtidos com leite de búfala.Ciência Rural 2010, 40, 2193–2198. [CrossRef]
6. Moreira, R.W.M.; Madrona, G.S.; Branco, I.G.; Bergamasco, R.; Pereira, N.C. Avaliação sensorial e reológica deuma bebida achocolatada elaborada a partir de extrato hidrossolúvel de soja e soro de queijo. Acta Sci. Technol.2010, 32, 435–438.
7. Oliveira, G.I.C.; Resende, L.M.; Soares, E.M.; Matos, S.P. Alimentação e suplementação de ferro em umapopulação de lactentes carentes. Pediatria (Säo Paulo) 2006, 28, 18–25.
8. Rakin, M.; Bulatovic, M.; Zaric, D.; Stamenkovic-Djokovic, M.; Krunic, T.; Boric, M.; Vukasinovic-Sekulic, M.Quality of fermented whey beverage with milk. Hem. Ind. 2016, 70, 91–98. [CrossRef]
9. Haug, A.; Høstmark, A.T.; Harstad, O.M. Bovine milk in human nutrition—A review. Lipids Health Dis. 2007,6, 25. [CrossRef] [PubMed]
10. Wolf, I.V.; Vénica, C.I.; Perotti, M.C. Effect of reduction of lactose in yogurts by addition of β-galactosidaseenzyme on volatile compound profile and quality parameters. Int. J. Food Sci. Technol. 2015, 50, 1076–1082.[CrossRef]
11. Branca, F.; Rossi, L. The role of fermented milk in complementary feeding of young children: Lessons fromtransition countries. Eur. J. Clin. Nutr. 2002, 56, S16–S20. [CrossRef] [PubMed]
12. Delarue, J.J.; Lawlor, B.; Rogeaux, M. Rapid Sensory Profiling Techniques and Related Methods, Applications in NewProduct Development and Consumer Research; Woodhead Publishing: Sawston, UK, 2015; ISBN 9781845694760.
13. Varela, P.; Ares, G. Novel Techniques in Sensory Characterization and Consumer Profiling; CRC Press: Boca Raton,FL, USA, 2014; ISBN 978-1-4665-6630-9.
14. Varela, P.; Ares, G. Sensory profiling, the blurred line between sensory and consumer science. A review ofnovel methods for product characterization. Food Res. Int. 2012, 48, 893–908. [CrossRef]
15. Thuillier, B. Rôle du CO2 dans L’appréciation Organoleptique des Champagnes—Expérimentation et ApportsMéthodologiques; Université de Reims: Reims, France, 2007.
16. Thuillier, B.; Valentin, D.; Marchal, R.; Dacremont, C. Pivot© profile: A new descriptive method based onfree description. Food Qual. Prefer. 2015, 42, 66–77. [CrossRef]
17. Fonseca, F.G.A.; Esmerino, E.A.; Filho, E.R.T.; Ferraz, J.P.; da Cruz, A.G.; Bolini, H.M.A. Novel and successfulfree comments method for sensory characterization of chocolate ice cream: A comparative study betweenpivot profile and comment analysis. J. Dairy Sci. 2016, 99, 3408–3420. [CrossRef] [PubMed]
18. Esmerino, E.A.; Tavares Filho, E.R.; Thomas Carr, B.; Ferraz, J.P.; Silva, H.L.A.; Pinto, L.P.F.; Freitas, M.Q.;Cruz, A.G.; Bolini, H.M.A. Consumer-based product characterization using Pivot Profile, Projective Mappingand Check-all-that-apply (CATA): A comparative case with Greek yogurt samples. Food Res. Int. 2017,99, 375–384. [CrossRef] [PubMed]
19. Valentin, D.; Chollet, S.; Lelie, M.; Lelièvre, M.; Abdi, H. Quick and dirty but still pretty good: A review ofnew descriptive methods in food science. Int. J. Food Sci. Technol. 2012, 47, 1563–1578. [CrossRef]
20. Ares, G.; Jaeger, S.R. Check-all-that-apply (CATA) questions with consumers in practice: Experimental considerationsand impact on outcome. In Rapid Sensory Profiling Techniques; Elsevier: Amsterdam, The Netherlands, 2015;pp. 227–245, ISBN 9781782422488.
21. Dos Santos, B.A.; Bastianello Campagnol, P.C.; da Cruz, A.G.; Galvão, M.T.E.L.; Monteiro, R.A.; Wagner, R.;Pollonio, M.A.R. Check all that apply and free listing to describe the sensory characteristics of low sodiumdry fermented sausages: Comparison with trained panel. Food Res. Int. 2015, 76, 725–734. [CrossRef][PubMed]
22. Bruzzone, F.; Ares, G.; Giménez, A. Temporal aspects of yoghurt texture perception. Int. Dairy J. 2013,29, 124–134. [CrossRef]
23. Cadena, R.S.; Caimi, D.; Jaunarena, I.; Lorenzo, I.; Vidal, L.; Ares, G.; Deliza, R.; Giménez, A. Comparison ofrapid sensory characterization methodologies for the development of functional yogurts. Food Res. Int. 2014,64, 446–455. [CrossRef]
24. Zoellner, S.S.; Cruz, A.G.; Faria, J.A.F.; Bolini, H.M.A.; Moura, M.R.L.; Carvalho, L.M.J.; Sant’ana, A.S.Whey beverage with acai pulp as a food carrier of probiotic bacteria. Aust. J. Dairy Technol. 2009, 64, 177.
25. International Organization Standardization. Sensory Analysis: General Guidance for the Design of Test Rooms;International Organization Standardization: Geneva, Switzerland, 1988.
54

Beverages 2018, 4, 11
26. Gallardo-Escamilla, F.J.; Kelly, A.L.; Delahunty, C.M. Influence of starter culture on flavor and headspacevolatile profiles of fermented whey and whey produced from fermented milk. J. Dairy Sci. 2005, 88, 3745–3753.[CrossRef]
27. Liu, J.; Grønbeck, M.S.; Di Monaco, R.; Giacalone, D.; Bredie, W.L.P. Performance of Flash Profile and Nappingwith and without training for describing small sensory differences in a model wine. Food Qual. Prefer. 2016,48, 41–49. [CrossRef]
28. Robert, P.; Escoufier, Y. A unifying tool for linear multivariate statistical methods: The RV-coefficient.Appl. Stat. 1976, 25, 257–265. [CrossRef]
29. Josse, J.; Pagès, J.; Husson, F. Testing the significance of the RV coefficient. Comput. Stat. Data Anal. 2008,53, 82–91. [CrossRef]
30. Miraballes, M.; Fiszman, S.; Gámbaro, A.; Varela, P. Consumer perceptions of satiating and meal replacementbars, built up from cues in packaging information, health claims and nutritional claims. Food Res. Int. 2014,64, 456–464. [CrossRef]
31. Bruzzone, F.; Ares, G.; Giménez, A. Consumers’ texture perception of milk desserts. Comparison withtrained assessors’ data. J. Texture Stud. 2012, 43, 214–226. [CrossRef]
32. Pontual, I.; Amaral, G.V.; Esmerino, E.A.; Pimentel, T.C.; Freitas, M.Q.; Fukuda, R.K.; Sant’Ana, I.L.;Silva, L.G.; Cruz, A.G. Assessing consumer expectations about pizza: A study on celiac and non-celiacindividuals using the word association technique. Food Res. Int. 2017, 94, 1–5. [CrossRef] [PubMed]
33. Blancher, G.; Clavier, B.; Egoroff, C.; Duineveld, K.; Parcon, J. A method to investigate the stability of asorting map. Food Qual. Prefer. 2012, 23, 36–43. [CrossRef]
34. Ten Kleij, F.; Musters, P.A. Text analysis of open-ended survey responses: A complementary method topreference mapping. Food Qual. Prefer. 2003, 14, 43–52. [CrossRef]
© 2018 by the authors. Licensee MDPI, Basel, Switzerland. This article is an open accessarticle distributed under the terms and conditions of the Creative Commons Attribution(CC BY) license (http://creativecommons.org/licenses/by/4.0/).
55
beverages
Article
Effect of Different Glass Shapes and Size on the TimeCourse of Dissolved Oxygen in Wines duringSimulated Tasting
Parpinello Giuseppina Paola 1, Meglioli Matteo 2, Ricci Arianna 1 and Versari Andrea 1,*
1 Department of Agricultural and Food Sciences, University of Bologna, Piazza Goidanich 60,47521 Cesena (FC), Italy; [email protected] (P.G.P.); [email protected] (R.A.)
2 Mosti Mondiale Inc., 6865 Route 132, Sainte-Catherine, QC J5C 1B6, Canada;[email protected]
* Correspondence: [email protected]; Tel.: +39-0547-338-124
Academic Editor: Manuel Malfeito FerreiraReceived: 21 November 2017; Accepted: 20 December 2017; Published: 4 January 2018
Abstract: The different shapes and sizes of wine glass are claimed to balance the different winearomas in the headspace, enhancing the olfactory perception and providing an adequate level ofoxygenation. Although the measurement of dissolved oxygen in winemaking has recently receivedmuch focus, the role of oxygen in wine tasting needs to be further disclosed. This preliminary studyaims to explore, for the first time, the effect of swirling glasses of different shapes and sizes on theoxygen content of wine. Experimental trials were designed to simulate real wine tasting conditions.The O2 content after glass swirling was affected to a considerable extent by both the type of wineand the glass shape. A lack of correlation between the shape parameters of five glasses and the O2
content in wine was found which suggests that the nonequilibrium condition can occur during winetasting. The International Standard Organisation (ISO) glass—considered to be optimal for the winetasting—allowed less wine oxygenation than any other glass shapes; and the apparent superiority ofthe ISO glass is tentatively attributed to the more stable oxygen content with time; i.e., less variabilityin oxygen content than any other glass shape.
Keywords: glass swirling; glass shape; nonequilibrium conditions; oxygen sensor; wine tasting
1. Introduction
Although the critical role of oxygen in enology has recently been disclosed from a chemistry [1]and winemaking point of view [2–4], little information is available from the sensory perspective.
Before tasting, the glass of wine is usually “swirled” by holding the glass by the stem and gentlyrotating it. This action, technically called ‘orbital shaking’, increases the surface area of the wine byspreading it over the inner part of the glass and consequently enabling some evaporation to takeplace [5]. Moreover, it is also expected to draw in some oxygen from the air. The ingress estimated onthe undisturbed surface of a wine is about 200 mg/h/m2 [6].
The physics of wine swirling was recently investigated with an elegant fluid dynamic approach,which modelled the pumping mechanism induced by the wave propagation along the glass wall [7].Three factors seemed to determine whether the team spotted one big wave in the wine or severalsmaller ripples: (i) the ratio of the level of wine poured in to the diameter of the glass; (ii) the ratio ofthe diameter of the glass to the width of the circular shaking; (iii) and the ratio of the forces acting onthe wine. From a practical point of view, these findings suggest that the mixing and oxygenation maybe optimized with an appropriate choice of shaking diameter (d) and rotation speed (rpm). In thisview, the glass shape parameters (Figure S1) can play a key role as they may influence the perceived
Beverages 2018, 4, 3; doi:10.3390/beverages4010003 www.mdpi.com/journal/beverages56

Beverages 2018, 4, 3
volume of wine [8], and the perception of wine odors [9–11], and color [12–14], and therefore theconsumer’s preference [15,16] as well. Moreover, with time, the glass shape affects the change ofheadspace chemical composition of wine poured inside, and the D ratio (i.e., maximum diameterdivided by opening diameter) seems to be the most important parameter relating glass shape toheadspace composition [17].
Considering that both consumers and professional wine tasters usually swirl the glass of wine forapprox. 10 to 20 s to unlock odors, there is a need for information to disclose the effect of glass shapeon the oxygen content of wines during simulated tasting condition.
This preliminary trial aimed to study whether the glass shape can affect the oxygen content inwine under both static and dynamic conditions (i.e., swirling), the latter to simulate the standardprocedure of sensory evaluation of wine. The use of optical oxygen sensors (also called minisensors)allowed for the first time the on-line non-invasive and non-destructive oxygen measurements in aglass under dynamic conditions.
2. Materials and Methods
2.1. Samples
Both red and white wines were selected for this study, including (i) a Rebola ‘Nita’ white wineColli di Rimini DOP 2013, (ii) a Sangiovese red wine Carlo Leo Romagna DOP 2013, and (iii) aCabernet Sauvignon ‘Tano’ Colli di Rimini DOP 2013 (Az. Agric. Le Calastre, Rimini, Italy).Sangiovese is the main red grape in Italy, Cabernet Sauvignon is a well know international grapevariety, and Rebola is an emerging local white grape variety of great interest as well. The bottledwines were provided by the producer and were stored at room temperature (20 ± 1 ◦C) until theswirling trials. Preliminary characterization of wine composition (Table S1) was carried out accordingto endorsed methods (RESOLUTION OIV/OENO 390/2010).
2.2. Oxygen Measurement
Non-invasive dissolved oxygen (DO) in wine was measured using an OXY-4 oxygen meter(PreSens GmbH, Regensburg, Germany) equipped with a polymer optical fiber and PSt3 spot,also called minisensor (Presens GmbH). The PSt3 spot had a thickness of 1 mm, a diameter of 4 mm,and a response time (t90, the time for 90% of the change in signal to occur) of 10 s. In each glass,one minisensor was glued 5 mm below the wine level and calibrated with water at a controlledtemperature according to the manufacturer’s instructions (Figure S2). In each bottle, once uncorked,the dissolved O2 content of wine was directly measured with an oxygen-dipping probe (Presens GmbH)placed in the middle of the bottle in a dynamic regime (i.e., with stirring). Before bottling the wines,three glass bottles (750 mL) were equipped with two minisensors each to ascertain both the headspaceand the dissolved O2 content in static regime (i.e., bottled wines).
2.3. Glasses
Six different wine glasses were selected for this study, including the ISO official-tasting glass(Bormioli, Parma, Italy) (Table 1; Figure 1). Glass parameters were measured according to the literature(Hirson, Heymann and Ebeler 2012) and each glass was filled with a fixed volume of wine (50 mL) tofit the conditions commonly used during professional wine tasting [18].
2.4. Swirling Trials
To simulate the gesture of hand swirling during wine tasting, each glass of wine was placed ontoan orbital shaker (model 709/R ASAL, Cernusco s/N, Italy) with a shaking diameter of 3 cm and ashaking speed of 150 rpm (this value was optimized with preliminary screening trails from 100 to250 rpm). Each glass of wine was swirled for 10, 20 and 40 s, using independent wine samples.
57

Beverages 2018, 4, 3
Table 1. Glass shape parameters, sample volumes and mass transfer coefficient (kLa) for dissolvedoxygen trials.
No.GlassName
OpeningDiameter
(mm)
MaximumDiameter
(mm)
WineDiameter
(mm)
Height(mm)
HeadspaceHeight(mm)
D Ratio *Fill(mL)
HeadspaceVolume
(mL)
kLa(s-1)
1 ISO 45.2 63.9 63.5 94.5 68.1 1.41 50 165 0.00012 Fresh 49.7 79.0 71.7 116.1 89.2 1.59 50 330 0.00033 Mature 53.8 83.2 73.9 128.3 100.7 1.55 50 440 0.00024 Rich 67.6 89.8 78.2 130.6 105.7 1.33 50 540 0.00055 Reserve 73.0 95.8 81.6 142.5 115.8 1.31 50 710 0.00056 Super800 73.4 116.1 89.6 107.7 85.8 1.58 50 750 0.0003
* Maximum diameter divided by opening diameter.
Figure 1. Glasses tested for the experimental trials (see Table 1 for details).
2.5. Experimental Design and Statistical Analysis
The four variables (6 glass types, 3 wines, 3-time readings, 3 replicates for each glass) required162 independent measurements. Statistical analysis was based on a paired t-test (p-level < 0.05) usingthe Unscrambler X (v. 10.3, Camo ASA, Oslo, Norway).
3. Results and Discussion
The oxygen content was measured (i) before and after opening the bottle of wine and (ii) beforeand during the glass swirling trails, for which protocol was designed to simulate the usual winetasting by consumers and experts. As expected, the concentration of oxygen in bottled wine was verylow with an average range from 4 to 14 μg/L for headspace O2, and in the range of 3 to 29 μg/Lfor dissolved O2 in wine. In bottled wine, the rate of O2 dissolution was less than the consumption;however, once the bottles are opened the wine comes into contact with air and the oxygen contentis expected to rise. In fact, soon after opening the O2 content in bottled wine increased regularly upto 0.99 mg/L in 15 min (Figure 2). These findings are consistent with the initial oxygen absorptioncapacity of Madiran red wines with pH 3.78 [19]. The O2 accumulation in wine implied that the rate ofoxygen dissolution was higher than the rate of its uptake. The latter can be (indirectly) measured bythe drop in SO2. According to Boulton [20], the oxygen consumption reactions in wine involve thephenolic compounds as the main substrates and the oxygen consumption is the rate-limiting reaction.The rates of this reaction are first order in oxygen concentration and catalyzed by ferrous ion; therefore,the rate constant would be related to the ferrous ion concentration, but the rate law would dependonly on the oxygen concentration. The amount of oxygen found after 15 min most likely increasesthe wine redox value of ca. 25 mV and will theoretically consume ca. 4 mg/L of sulfur dioxide [21];both parameters could affect the sensory properties of wines to some extent [4,13].
58

Beverages 2018, 4, 3
Figure 2. Time course of dissolved oxygen in wine after opening (time zero).
As time progresses, the dissolved oxygen content in wine is expected to reach a plateauapproaching the saturation value of ca. 8.6 mg/L at 20 ◦C [22]. This postulate was confirmed bymonitoring with time the dissolved O2 in a wine glass under firm conditions, i.e., unstirred, unshaken,directly after pouring (Figure 3). The glass n. 5 showed a very fast O2 intake followed by the glass n. 4,whereas the wine poured on the ISO glass (No. 1), commonly used in professional wine tasting, showedthe lowest and most stable O2 content. Although dissolved oxygen mostly depends on the surface areaof wine exposed and the exposure time, a lack of significant correlation was found between the glassshape parameters and the O2 content in wine. To explain this result, the hypotheses of nonequilibriumconditions and complex interaction among parameters were formulated.
Figure 3. Time course of oxygen dissolution in wine glass under firm conditions. Legend: lines 1–6refer to different glass shapes (see Table 1 for details).
59

Beverages 2018, 4, 3
For any specific wine, the variation of the dissolved oxygen concentration with time can bearranged as:
dO2
dt= kLa·(O∗
2 − O2)
where: kLa: volumetric mass transfer coefficient (T−1); O2 Dissolved oxygen concentration in wine(mg O2 L−1); O∗
2 Oxygen equilibrium concentration in wine (mg O2 L−1).Therefore, the volumetric mass transfer coefficient is the aggregate result of both contributions:
the resistance to mass transport in the liquid side (kL) and the interfacial area (a).The oxygen transfer rate will decrease during the period of aeration as O2 approaches O∗
2 due tothe decline in the driving force (O∗
2 − O2). The experimental kLa values of wines in opened bottle andglasses were tentatively estimated upon monitoring the increase in the dissolved oxygen concentrationof a wine during aeration and agitation and by plotting of oxygen deficit (O∗
2 − O2) versus time (t)on a semilogarithmic graph. The slope of the regression line determined the overall mass transfercoefficient (kLa), which showed 5 times variation in the range 0.0001–0.0005 s−1 (Table 1), with kLa ofwine in open bottle at the low value of 0.0001 s−1. As the estimated kLa values refer to static conditions(i.e., non-agitated vessels—bottle or glass—and lack of gas supply, e.g., micro-oxygenation) the currentfindings are consistent with data from the literature. The mass transfer coefficient (kLa) in the aeratedmodel wine solution range between 0.00145 s−1 [23] and 0.013 s−1 [24], the values of which are affectedby several parameters, including the oxygen gas flow rate and the intensity of agitation. The bestestimate of the rotational speeds effect is given in terms of liquid side mass transfer coefficient (kL)which increases more than 9 times as rotational speed increases from 50 to 120 rpm [25]. Remarkably,kLa is found to increase following a power law with exponent rising from 0.5 to 3 due to significantincreases in the interfacial area due to vortex [26].
During professional wine tasting for appellation certification, the wine is held in a glass for about5–10 min and swirled for approx. 5–30 s before tasting. In this view, the swirling trails were designedto verify the likely occurrence of nonequilibrium conditions during the sensory evaluation of wine.The initial O2 content at time zero (T0) was always measured before each swirling trials for every glassshape. The O2 content after glass swirling was affected to a considerable extent by both the type ofwine and the glass shape. Short swirling time (up to 20 s) most often decreased the dissolved oxygen inglass wine (Table 2), while O2 significantly increased at T40 in Rebola white and Sangiovese red winesfor all glass shape, except for glass n. 1 in Sangiovese trial. In contrast, the O2 content in CabernetSauvignon wine increased only in glass n. 5 and n. 6 at T40. It seems that the Cabernet Sauvignonwould require more time to enhance the O2 content compared to the other two wines, which are lowerin polyphenolic compounds and SO2.
According to the Henry’s law, the oxygen uptake resulting from the presence of antioxidants inwine is rapid and follows a largely exponential form [20]. The alternative hypothesis that O2 is initiallystripped out from solution by the release of CO2 is postulated. Clearly, the ISO glass (No. 1)—usuallyconsidered to be optimal for wine tasting—allowed less wine oxygenation than any other glass shape.Considering that the O2 content of wine most likely affects the performance of sensory evaluation,based on our findings, the apparent superiority of the ISO glass is tentatively attributed to the morestable oxygen content with time, i.e., less variable than any other glass shape.
The current results under the dynamic regime substantiate the findings of Venturi et al. [27] whoalso investigated the influence of glass shape on the dissolved oxygen content of a rosé wine understatic conditions—using the polarographic ADI dO2 sensor—for which equilibration time was foundto be approx. 1 h.
In conclusion, the current preliminary study showed that pouring wine into a glass considerablyaffects the O2 content and the likely occurrence of nonequilibrium condition requires a carefulstandardization procedure during a real wine tasting.
60

Beverages 2018, 4, 3
Table 2. Heatmap plot of dissolved oxygen (mg/L) in wine glasses at time zero (T0) and after 10, 20and 40 s (T10, T20, T40). Legend: glass 1–6 refers to different shape (see Table 1 for details). The symbolin letters (a, b) refers to significant paired difference between samples (p-level = 0.05) if occurred.
Rebola White Wine: Dissolved O2 (mg/L)
Glass T0 T10 T0 T20 T0 T40
No. 1 3.0 2.9 2.9 3.0 2.7 3.1No. 2 3.1 a 2.2 b 4.3 4.1 3.4 a 4.2 b
No. 3 4.2 4.2 3.1 a 4.3 b 3.1 a 4.5 b
No. 4 3.0 3.0 3.1 3.2 3.8 a 4.7 b
No. 5 3.9 a 3.0 b 3.7 3.5 3.5 a 4.2 b
No. 6 2.8 2.5 3.0 3.3 4.5 a 6.0 b
Sangiovese Red Wine: Dissolved O2 (mg/L)
Glass T0 T10 T0 T20 T0 T40
No. 1 2.8 2.8 2.9 a 2.3 b 3.5 3.1No. 2 3.2 3.4 3.2 2.9 2.7 a 3.6 b
No. 3 2.8 3.3 3.3 3.0 3.3 a 4.0 b
No. 4 3.1 2.7 3.3 2.9 3.0 a 4.2 b
No. 5 3.4 2.8 3.2a 4.2 b 3.1 a 4.2 b
No. 6 2.8 3.0 3.1 3.1 3.8 a 5.0 b
Cabernet Sauvignon Red Wine: Dissolved O2 (mg/L)
Glass T0 T10 T0 T20 T0 T40
No. 1 2.8 2.8 2.9 2.3 2.9 3.0No. 2 4.2 a 3.0 b 3.9 a 2.8 b 4.2 a 3.3 a
No. 3 3.0 2.7 4.0 a 3.1 b 4.1 3.8No. 4 3.5 3.0 3.2 2.8 4.6 4.1No. 5 3.2 3.1 3.8 3.4 3.8 a 4.5 a
No. 6 3.4 3.5 3.4 3.8 4.3 a 5.5 a
Supplementary Materials: The following are available online at www.mdpi.com/2306-5710/4/1/3/s1. Figure S1:Glass parameters, Table S1: Chemical composition of wines, Figure S2: Experimental online measurement.
Acknowledgments: Authors thanks Martelli E. (Nomacorc Italia) for technical assistance.
Author Contributions: V.A. and P.G.P. conceived and designed the experiments; R.A. and M.M. performed theexperiments; V.A. analyzed the data; M.M. contributed reagents/materials/analysis tools; P.G.P. wrote the paper.
Conflicts of Interest: The authors declare no conflict of interest.
References
1. Danilewicz, J.C. Review of oxidative processes in wine and value of reduction potentials in enology. Am. J.Enol. Vitic. 2011, 63, 1–10. [CrossRef]
2. Calderón, J.F.; del Alamo-Sanza, M.; Nevares, I.; Laurie, F. The influence of selected winemaking equipmentand operations on the concentration of dissolved oxygen in wines. Cienc. Investig. Agric. 2014, 41, 273–280.[CrossRef]
3. Oliveira, V.; Lopes, P.; Cabral, M.; Pereira, H. Kinetics of oxygen ingress into wine bottles closed with naturalcork stoppers of different qualities. Am. J. Enol. Vitic. 2013, 64, 395–399. [CrossRef]
4. Ugliano, M. Oxygen contribution to wine aroma evolution during bottle aging. J. Agric. Food Chem. 2013,61, 6125–6136. [CrossRef] [PubMed]
5. Arakawa, T.; Iitani, K.; Wang, X.; Kajiro, T.; Toma, K.; Yano, K.; Mitsubayashi, K. A sniffer-camera for imagingof ethanol vaporization from wine: The effect of wine glass shape. Analyst 2015, 140, 2881–2886. [CrossRef][PubMed]
61

Beverages 2018, 4, 3
6. Mueller-Spath, H. Production of white table wines with minimal SO2. In Proceedings of the SecondAustralian Wine Industry Technical Conference Proceedings, Tanunda, South Australia, 7–9 August 1973;Australian Wine Research Institute: Tanunda, South Australia, 1973; pp. 51–52.
7. Reclari, M.; Dreyer, M.; Tissot, S.; Obreschkow, S.; Wurm, F.M.; Farhat, M. Surface wave dynamics in orbitalshaken cylindrical containers. Phys. Fluids 2014, 26. [CrossRef]
8. Pechey, R.; Attwood, A.S.; Couturier, D.-L.; Munafò, M.R.; Scott-Samuel, N.E.; Woods, A.; Marteau, T.M.Does glass size and shape influence judgements of the volume of wine? PLoS ONE 2015, 10, e0144536.[CrossRef] [PubMed]
9. Delwiche, J.F.; Pelchat, M.L. Influence of glass shape on wine aroma. J. Sens. Stud. 2002, 17, 19–28. [CrossRef]10. Hummel, T.; Delwiche, J.F.; Schmidt, C.; Hüttenbrink, K.B. Effects of the form of glasses on the perception of
wine flavors: A study in untrained subjects. Appetite 2003, 41, 197–202. [CrossRef]11. Vilanova, M.A.R.; Vidal, P.; Cortes, S. Effect of the glass shape on flavor perception of ‘toasted wine’ from
Ribeiro (NW Spain). J. Sens. Stud. 2008, 23, 114–124. [CrossRef]12. Cliff, M.A. Influence of wine glass shape on perceived aroma and colour intensity in wines. J. Wine Res. 2001,
12, 39–46. [CrossRef]13. Venturi, F.; Andrich, G.; Sanmartin, C.; Scalabrelli, G.; Ferroni, G.; Zinnai, A. The expression of a full-bodied
red wine as a function of the characteristics of the glass utilized for the tasting. CyTA J. Food 2014, 12, 291–297.[CrossRef]
14. Wan, X.; Woods, A.T.; Seoul, K.-H.; Butcher, N.; Spence, C. When the shape of the glass influences the flavourassociated with a coloured beverage: Evidence from consumers in three countries. Food Qual. Prefer. 2015,39, 109–116. [CrossRef]
15. Spence, C.; Wan, X. Beverage perception and consumption: The influence of the container on the perceptionof the contents. Food Qual. Prefer. 2015, 39, 131–140. [CrossRef]
16. Spence, C.; Van Doorn, G. Does the shape of the drinking receptacle influence taste/flavour perception?A review. Beverages 2017, 3, 33. [CrossRef]
17. Hirson, G.D.; Heymann, H.; Ebeler, S.E. Equilibration time and glass shape effects on chemical and sensoryproperties of wine. Am. J. Enol. Vitic. 2012, 63, 515–521. [CrossRef]
18. Jackson, R.S. Wine Tasting: A Professional Handbook, 2nd ed.; Academic Press: San Diego, CA, USA, 2009.19. Moutounet, M.; Mazauric, J.-P. L’oxygène dissous dans les vins. Revue Francaise d'Oenologie 2001, 186, 12–15.20. Boulton, R. Both White Wines and Red Wines Can Consume Oxygen at Similar Rates. 2011. Available online:
http://www.acenologia.com/enfoques/roger_boulton_enf0612_eng.htm (accessed on 7 December 2017).21. Ribéreau-Gayon, P.; Glories, Y.; Maujean, A.; Dubourdieu, D. Aging red wines in vat and barrel: Phenomena
occurring during aging. In Handbook of Enology; John Wiley & Sons, Ltd.: Hoboken, NJ, USA, 2006;pp. 387–428.
22. Kilmartin, P.A. The oxidation of red and white wines and its impact on wine aroma. Chem. N. Z. 2009,1, 18–22.
23. Adoua, R.; Mietton-Peuchot, M.; Milisic, V. Modelling of oxygen transfer in wines. Chem. Eng. Sci. 2010,65, 5455–5463. [CrossRef]
24. Saa, P.A.; Moenne, M.I.; Perez-Correa, J.R.; Agosin, E. Modeling oxygen dissolution and biological uptakeduring pulse oxygen additions in oenological fermentations. Bioprocess Biosyst. Eng. 2012, 35, 1167–1178.[CrossRef] [PubMed]
25. Hebrard, G.; Zeng, J.; Loubiere, K. Effect of surfactants on liquid side mass transfer coefficients: A newinsight. Chem. Eng. J. 2009, 148, 132–138. [CrossRef]
26. Scargiali, F.; Busciglio, A.; Grisafi, F.; Brucato, A. Oxygen transfer performance of unbaffled stirred vessels inview of their use as biochemical reactors for animal cell growth. Chem. Eng. Trans. 2012, 27, 205–210.
27. Venturi, F.; Andrich, G.; Sanmartin, C.; Taglieri, I.; Scalabrelli, G.; Ferroni, G.; Zinnai, A. Glass and wine:A good example of the deep relationship between drinkware and beverage. J. Wine Res. 2016, 27, 153–171.[CrossRef]
© 2017 by the authors. Licensee MDPI, Basel, Switzerland. This article is an open accessarticle distributed under the terms and conditions of the Creative Commons Attribution(CC BY) license (http://creativecommons.org/licenses/by/4.0/).
62

beverages
Communication
Bittersweet Findings: Round Cups Fail to InduceSweeter Taste
Casparus J. A. Machiels
Department A & F Marketing—Consumer Psychology, Faculty of Agricultural and Nutritional Sciences,Kiel University, Wilhelm-Seelig-Platz 6/7, 24098 Kiel, Germany; [email protected];Tel.: +49-430-880-5153
Received: 1 November 2017; Accepted: 17 January 2018; Published: 1 February 2018
Abstract: An increasing body of literature demonstrates that consumers associate visual informationwith specific gustatory elements. This phenomenon is better known as cross-modal correspondence.A specific correspondence that has received attention of late is the one between round forms andsweet taste. Research indicates that roundness (as opposed to angularity) is consistently associatedwith an increased sweetness perception. Focusing on two different cup forms (round versusangular), two studies tested this association for a butter milk drink and a mate-based soft drink.Results, however, were not able to corroborate the frequently suggested correspondence effect, but acorrespondence was found between the angular cup and a more bitter taste for the soft drink. Theseresults are discussed in light of previous findings matching sweetness with roundness and bitternesswith angularity, hopefully aiding researchers in this field in conducting future experiments.
Keywords: cross-modal correspondence; shape; taste; beverage
1. Introduction
Recent research in sensory marketing highlights the fact that forms and visuals can influenceperception of foods, a phenomenon known as cross-modal correspondence [1]. Specifically, perceptionthrough one or more senses, such as vision and touch, can influence perception in other modalities,such as taste [2] (see [3] for a recent review specifically related to beverages). Across a range of foodproducts, round forms are believed to be associated with a sweeter taste [1], which is corroboratedthrough a number of experiments [4]. Although such effects are readily discerned in exploratoryresearch and shape-taste matching studies [4,5], it also seems to hold for empirical research involvingactual food products. For instance, sweeter beers, as well as sweeter chocolate, are more stronglyassociated with round shapes [6,7]. These studies, however, rely mostly on controlled laboratoryconditions and within-participants designs, where consumers can carefully deliberate associationsbetween sweetness and roundness across shapes. Recent research, however, extends these laboratoryresults to actual retail settings by showing that consumers, in fact, perceive hot drinks (coffee andchocolate) consumed from cups with round surface patterns to be sweeter than when consumed fromcups with angular surface patterns [8].
Empirical evidence thus indicates the non-randomness of associations between round shapes andsweet tastes. Here, I report two studies concerning container shape effects, designed to corroborate the“round equals increased sweetness” heuristic using two different beverages; a butter milk drink and amate-based soft drink. Contrasting previous work, both studies failed to find differences in terms ofsweetness perception. The taste of the mate-based soft drink, however, was found to be bitterer whenconsumed from an angular cup. In reporting these results, I aim to aid cross-modal correspondenceresearchers in making better choices in designing future experiments, and as such advance science’scumulative nature in this important field.
Beverages 2018, 4, 12; doi:10.3390/beverages4010012 www.mdpi.com/journal/beverages63

Beverages 2018, 4, 12
2. Study 1
2.1. Materials and Methods
2.1.1. Design, Participants, Stimuli, and Procedure
The study used a one-factor (drinking cup: angular versus round) between-subjects design.A total of 86 consumers (58.1% female, mean age = 46.89, SD = 19.47, range = 18–79) were interceptedrandomly (i.e., every fifth visitor) upon entering a large, local supermarket, and were invited toparticipate in the tasting of a strawberry-flavored butter milk drink. Strawberry-flavored butter milkwas chosen for its general non-conspicuousness, its fruit-flavored sweetness, and with the intent toextend the evidence base of cross-modal correspondences to other product categories. No specificex- or inclusion criteria were applied, but, before participating, all participants were informed about theproduct and the voluntariness of their participation, and were fully debriefed afterwards. The drinkingcups were hard transparent polystyrene cups, chosen based on their similarity in measurements andvolume (see Figure 1 for the two cups). To ensure that participants were unaware of the manipulation,they were randomly assigned to either the round or the angular cup in batches of ten (i.e., first to tenthparticipant drank from the round, eleventh to twentieth from the angular cup, etcetera). Participantscompleted the questionnaire one after another using the same bar table situated near the entrance ofthe supermarket. In both conditions they sampled an identical premium brand of strawberry-flavoredbutter milk, and care was taken for all samples to include exactly the same amount of drink (40 mL).Temperature of the drink was kept at a constant 7 degrees Celsius.
Figure 1. The angular (above) and round (below) cups used in the Study. Note: ruler measurement ismetric (cm).
64

Beverages 2018, 4, 12
2.1.2. Measures and Analyses
To ascertain that participants held the cups long enough to get a feeling of the cup’s form, theywere first asked to answer questions regarding the smell of the product, assessed through the itemsstrong, powerful, and intense (α = 0.83 [8,9]). More importantly, perceived sweetness was assessedthrough a single item (i.e., this drink has a sweet taste). Since sweetened butter milk has both sweet aswell as sour taste components, and because angularity can be associated with sourness [10], a relatedquestion assessed how sour the drink was perceived (i.e., this drink has a sour taste). Complementingbasic taste perception, participants additionally assessed the strawberry flavor of the drink with theitems this drink . . . . . . tastes fruity, . . . has a dominant strawberry flavor, and . . . has a distinct strawberryflavor (α = 0.87). Given that product form angularity is also related to intensity [9], taste intensitywas assessed through the items strong, powerful, and intense (α = 0.82 [8,9]). Accounting for subjectivedifferences, general product liking was measured through the item this product tastes very good.To control for possible differences in taste experience based on the premise that angular cups arecommonly not used as drinking vessels, participants were asked to what extent they thought thedrinking experience was comical (reverse scored) and pleasant (α = 0.76). General preference for buttermilk was measured through the items I generally like butter milk and I often drink butter milk (α = 0.85).The questionnaire ended with questions regarding age and gender. All measures were 7-point Likertscales, ranging from 1 (completely disagree) to 7 (completely agree). Descriptives, frequencies, andbetween-group differences were calculated, where applicable, through analyses of variance, using IBMSPSS Statistics 22.
2.2. Results
Four consumers did not understand the questionnaire, or submitted non-usable answers(e.g., highlighting whole blocks of question items); their data sets were eliminated, reducing the analysissample to 82 (57.3% female, mean age in years = 45.91, SD = 19.37, range = 18–79, two participantsdid not report their age). Preliminary analyses of variance showed that there were no differencesbetween the two groups regarding age and gender (both F’s < 1), nor in general liking of butter milkand drinking experience (both F’s < 1).
Table 1 lists respondent age and gender distribution, together with means and standard deviationsfor all dependent variables, per group. Although slightly redundant (given these figures), a multipleanalysis of variance, testing differences in the dependent variables depending on the independentvariable (cup form: angular versus round) showed no differences between groups for any of thedependent variables (all F’s < 1). P- and F-values have been omitted from Table 1 due to the obviousnessof non-differences between the group means. Additional—explorative—analyses investigatingbetween-group differences showed no contingence on moderator variables (i.e., gender, butter milkliking, and drinking experience).
65

Beverages 2018, 4, 12
Ta
ble
1.
Age
and
gend
erdi
stri
buti
ons
acro
ssgr
oups
,and
mea
ns(s
tand
ard
devi
atio
ns)f
oral
ldep
ende
ntva
riab
les
(Stu
dy1)
.
Gro
up
Ch
ara
cteri
stic
sO
utc
om
es
Man
ipu
lati
on
N(F
em
ale
)A
ge
Sw
eetn
ess
So
urn
ess
Sm
ell
Inte
nsi
tyT
ast
eIn
ten
sity
Lik
ing
Str
aw
berr
yF
lav
or
Bu
tter
Mil
kP
refe
ren
ceD
rin
kE
xp
eri
en
ce
Rou
ndcu
p39
(23)
46.1
8(2
1.58
)14.
34(1
.84)
12.
72(1
.49)
4.16
(1.4
8)4.
14(1
.29)
34.
05(1
.84)
4.19
(1.6
0)3.
14(1
.78)
5.24
(1.6
1)3
Ang
ular
cup
43(2
4)45
.67
(17.
40)1
4.12
(1.7
9)2.
72(1
.55)
4.31
(1.5
4)4.
15(1
.20)
4.33
(1.6
7)4.
38(1
.39)
3.37
(1.7
7)5.
03(1
.58)
Ove
rall
82(4
7)45
.91
(19.
37)2
4.22
(1.8
0)1
2.72
(1.5
1)4.
24(1
.50)
4.14
(1.2
4)3
4.20
(1.7
5)4.
29(1
.48)
3.26
(1.7
7)5.
13(1
.58)
3
Not
e:su
pers
crip
tsde
note
num
ber
ofm
issi
ngva
lues
;Sta
tist
ical
valu
esar
eba
sed
onun
ivar
iate
anal
yses
toac
coun
tfor
mis
sing
valu
es.
66

Beverages 2018, 4, 12
2.3. Discussion
Eighty-two supermarket visitors sampled a strawberry-flavored butter milk drink from either around or an angular cup. Against expectations, consumer responses showed little sign of the cross-modalcorrespondence effect between round shapes and sweet taste. One reason for this unexpected findingcould lie with the product. Although the mean values for sweetness perception show no indication ofthis, the approximately 11% sugar content may have been too sweet, limiting variance for effects tooccur. Another possibility could trace back to the specific mouth feel associated with butter milk, forinstance its creamy consistency. There is evidence that creaminess correlates with sweetness [11,12], whichmay have influenced participants’ sweetness perception. At this point, however, both explanations arespeculative only.
Another reason could be that for round shapes to actually change taste perception, more is neededthan just the association between round shapes and sweet taste. This means that Study 1’s findingsare not meaningful with regard to whether consumers actually relied on this specific correspondence.It can only be concluded that no downstream influences on taste perception took place. Wang, ReinosoCarvalho, Persoone, and Spence [11] report on a study where pre-tasting evaluations of round versusangular pieces of chocolate indeed showed a round equals increased sweetness bias, but effectsvanished when participants actually tasted the food [11]. As Wang’s study manipulated the shape ofthe actual food, possible priming effects were lost when the food was eaten, indicating the possiblenecessity of multisensory feedback during consumption (i.e., haptic and visual; [8]). Their findings,together with the basic cross-modal correspondence claim as discussed in the Introduction here, might,then, indicate that this specific correspondence possibly exists on multiple levels. A ‘weak’ claim,associating round shapes with sweetness, and a ‘strong’ claim, that sweetness ratings are changeddue to exposure to roundness (cf. the different classes of correspondences in [1]). If this assumptionwere correct, consumers might have associated the round cups with sweetness, but the strength of thisassociation was insufficient to change sweetness perception.
These limitations motivated Study 2, which investigates a different product category, and additionallymeasures pre-consumption taste expectations in order to incorporate both the weak and strong claimdetailed above.
3. Study 2
3.1. Materials and Methods
Similar to Study 1, Study 2 used a one-factor (drinking cup: angular versus round) between-subjectsdesign. This time a convenience student sample was used (n = 89), consisting of students of twoIntroductory Marketing courses (73% female, mean age in years = 23.31, SD = 2.88, range = 18–32).As in Study 1, students were informed beforehand about the product and the voluntariness oftheir participation, and were fully debriefed afterwards. All students completed the questionnairesimultaneously, while seated in the same auditorium. They tasted a caffeinated soft drink based onmate extract from either a round or an angular cup. The cups were identical to the ones used in Study 1(see Figure 1). Choice of beverage was based on the premise that the soft drink constitutes anotherbeverage category, is non-creamy, would fit well with the student sample, and is less sweet (appr.5.7% sugar) than the buttermilk drink sampled in Study 1. Additionally, paralleling sweetness, thedrink also incorporates bitter taste notes. The drink is common in Germany, and is comparable tothe brands Materva and Club Mate available in the US. Samples were again standardized in volume(40 mL) and temperature (room temperature).
3.2. Measures and Analyses
One limitation of Study 1 was that it did not measure whether participants associated roundnesswith sweetness, in addition to possible downstream effects on taste perception. In an attempt toovercome this limitation, Study 2 required participants to rate their expectation of the taste of the drink
67
Beverages 2018, 4, 12
before tasting it [11]. Taste expectation was assessed through the items I expect this drink to taste . . . . . .sweet, . . . sour, and . . . bitter. Measures regarding the product’s smell (strong, powerful, and intense [8,9],α = 0.81), liking (this product tastes very good), taste intensity (strong, powerful, and intense [8,9], α = 0.89),mate-based soft drink preference (I generally like mate drinks and I often drink mate drinks, α = 0.83),and drinking experience (comical (reverse scored) and pleasant, α = 0.87) mirrored those of Study 1.It could be argued that the round cups might additionally be associated with smoothness. Therefore,two additional items assessed taste smoothness (i.e., smooth and rough (reverse scored), α = 0.70, notethat the German words used in the questionnaire were mild and herb. The adjective rough is used herein the absence of a better alternative.) The taste items (sweet and sour) were complemented with bitter.As in Study 1, all measures were Likert scales, ranging from 1 (completely disagree) to 7 (completelyagree), and statistical analyses (i.e., analyses of variance) were calculated using IBM SPSS Statistics 22.As such, Study 2 differed from Study 1 in its sample (students, versus supermarket visitors in Study 1)and beverage (soft drink, versus a buttermilk drink in Study 1).
3.3. Results
Preliminary analyses of variance indicated no differences between the two experimental groupsin terms of age (F(1,83) = 2.18, ns), gender, general liking of mate-based drinks, and drink experience(all F’s < 1).
Table 2 lists group characteristics, along with mean scores and standard deviations for all dependentvariables, separately for each group. No differences emerge between the two groups regardingexpected and actual sweet taste, or the intensity measures (all F’s < 1). However, two findings arenoteworthy; the taste of the drink consumed from the round (rather than the angular) cup is perceivedas being more smooth (difference of 0.40) and less bitter (difference of 0.76). Analysis of varianceshows the difference for bitter to be significant at α = 0.05 (F(1,87) = 4.45, p = 0.038, ηp
2 = 0.05; resultsfor smooth: F(1,87) = 1.33, p = 0.252, ηp
2 = 0.02).
68

Beverages 2018, 4, 12
Ta
ble
2.
Age
and
gend
erdi
stri
buti
ons
acro
ssgr
oups
,and
mea
ns(s
tand
ard
devi
atio
ns)f
oral
ldep
ende
ntva
riab
les
(Stu
dy2)
.
Gro
up
Ch
ara
cte
rist
ics
Ou
tco
me
s
Ma
nip
ula
tio
nN
(Fe
ma
le)
Ag
eE
xp
ect
ati
on
sA
ctu
al
tast
eS
me
llIn
ten
sity
Ta
ste
Inte
nsi
tyT
ast
eS
mo
oth
ne
ssL
ikin
gM
ate
Pre
fere
nce
Dri
nk
Ex
pe
rie
nce
Sw
ee
tne
ssS
ou
rne
ssB
itte
rne
ssS
we
etn
ess
So
urn
ess
Bit
tern
ess
Rou
ndcu
p48
(36)
322
.85
(3.2
0)2
5.29
(1.3
8)2.
92(1
.62)
3.08
(1.8
2)4.
38(1
.54)
2.54
(1.6
2)2.
83(1
.67)
4.11
(1.2
5)3.
75(1
.34)
4.02
(1.6
7)4.
17(1
.51)
3.14
(1.6
6)1
4.57
(1.8
1)
Ang
ular
cup
41(2
9)23
.83
(2.4
2)5.
07(1
.57)
2.80
(1.3
2)1
3.13
(1.5
1)4.
46(1
.60)
2.49
(1.7
2)3.
59(1
.69)
4.06
(1.3
2)4.
02(1
.32)
3.62
(1.5
8)3.
93(1
.83)
3.16
(1.9
9)4.
59(1
.84)
Ove
rall
89(6
5)3
23.3
1(2
.88)
25.
19(1
.47)
2.86
(1.4
9)1
3.10
(1.6
7)4.
42(1
.56)
2.52
(1.6
6)3.
18(1
.71)
4.09
(1.2
8)3.
87(1
.33)
3.84
(1.6
3)4.
06(1
.66)
3.15
(1.8
1)1
4.58
(1.8
2)
Not
e:su
pers
crip
tden
otes
num
ber
ofm
issi
ngva
lues
;Sta
tist
ical
valu
esar
eba
sed
onun
ivar
iate
anal
yses
toac
coun
tfor
mis
sing
valu
es.
69

Beverages 2018, 4, 12
3.4. Discussion
Using a beverage from a different category, the findings from Study 2 shed additional light onpossible cross-modal correspondence effects between shapes and tastes [1]. The round cup, as inStudy 1, failed to induce increased taste perception of sweetness and visual expectations based onlyon the cup’s shape were also not found. However, the drink in the angular cup was perceived asmore bitter in taste, a finding in line with the cross-modal correspondence effect relating angularshapes to bitterness [6,8]. Although the small effect size warrants caution, this positive finding mightbe interpreted as adding to the growing body of research on this topic. Additionally, although notsignificant, the difference of .40 for smoothness between the two groups might be interesting for futureresearch to explore in more depth.
4. General Discussion
Correspondences across modalities (i.e., between vision and taste) are increasingly being researchedand tested, with reports indicating a seemingly fundamental link between round shapes and sweettaste [1,13]. The goal of the studies reported here was to corroborate these findings by showing thatbeverages consumed from a cup with round design elements (i.e., a round cup) were perceived as sweeterthan an identical beverage consumed from a cup with angular design elements (i.e., an angular cup).However, the results of the two experiments showed little evidence for the correspondence betweenround shapes and sweet taste. Moreover, not only was the drink in the round cup not perceivedas sweeter, the angular cup failed to induce a more intense taste experience [8–10]. Additionally,the well-documented human preference for rounded designs and design features [14,15] did notincrease liking for consumers drinking from the round cup. Or, more accurately, if there indeed was anincreased liking for one of the cup’s shape, this did not spill over to liking for the actual product.
Although these studies were mainly focused on sweetness perception, the results of Study 2regarding bitterness show that drinking vessel shape has the ability to change basic taste perception.Hence, Study 2’s findings, positively equating angularity with a more bitter taste, may readily beinterpreted as additional evidence for this specific cross-modal correspondence [6], and the generaldiscernibility of such effects in between-subject experiments (that is, without a direct comparison [8]).Interestingly, these findings are in line with a recent study that was unable to find effects of round lattéart shapes on sweetness expectation in coffee, but where the effects of angular shapes on bitternesswere found ([16], experiment 3). It is possible that the effects of angular shapes might be more deeplyingrained in the human mind, due to their association with threat [15]. However, assuming that theeffect found is actually there, one has to conclude that individual cross-modal effects seem highlysusceptible to change depending on the beverage category or sample population. One also has towonder, then, why expectation effects (based on the beverage’s visual inspection) did not surfacehere [11,16]. It is possible that other influences, like beverage color, might have played a larger role [17].This limits the practical relevance of using shapes to communicate specific tastes, indicating thatfront-of-package design elements (i.e., typefaces [18,19] or simple shapes [14]) may not be sufficient tosteer consumer response (i.e., expectations of taste) at the point of sale.
This leaves us to account for the null results regarding shape and sweetness across the twobeverage categories. The first explanation involves the cups used; although it is to date unclear whycross-modal correspondences exist [13], it cannot be excluded that the round cup was insufficient toinduce (the expected) sweetness in taste (and for the angular cup to induce intensity, for that matter [9]).Some might even argue that the cups used were not round enough to engage participants in whatleads to cross-modality effects on sweetness perception. Indeed, although the round cups are probablyas round as they can get, the haptic properties of the round and angular cups might not have beendistinctively different. The 3D-molds used in van Rompay et al.’s study [8], where effects betweenround shapes and sweetness did show, had angular and round properties along the cups’ completeouter surface. Contrast this with the cups used here, where participants might not have experiencedthe different haptic feedback of angularity and roundness, but instead may have only felt the same
70

Beverages 2018, 4, 12
smooth surface in both conditions. This might imply that, without the ability to rely on explicitvisual contrasts (i.e., other, different shapes), visual perception alone is ineffective in establishingcross-modal correspondences between round shapes and sweet tastes without sufficient congruenthaptic information. This might also have been a reason for other null results reported in recent studiesinvestigating the relationship between round shapes and sweet taste in beverages [16,20].
A second explanation might lie within the product category. As mentioned, two recent studiesalso failed to confirm the hypothesized round equals increased sweetness correspondence [16,20], onefor curved (versus straight-edged) beer glasses [20], the other for round (versus angular) shapesof chocolate sprinkled on coffee [16]. Although butter milk (Study 1), mate-based soft drinks(Study 2), coffee ([16], cf. 8) and beer [20] constitute only a fraction of the possible beverage categories,finding null results across these four beverage categories might indicate that these beverages are notsuitable for investigating sweetness differences on the basis of visio-haptic information (roundness).Cross-modality effects between round shapes and sweet tastes might, of course, exist perhaps onlyfor food products where taste consists of an intricate interplay of sweet, sour, or bitter components.Positive results, not relying on direct comparisons of shapes, have been reported for coffee andchocolate milk [8], although it is unclear how prominent the role of haptic feedback may have been.Therefore, it cannot be excluded that shapes elicit specific tastes only when consumers are activelyengaging in taste searching on the basis of information provided, for example, when consciouslyexamining new products [1], or when specifically instructed to do so in a laboratory setting. Moreover,effects for beverages are bound to rely on product-extrinsic cues like cups or packaging elements(e.g., see [21] for an overview of the different ways beverage containers may influence perception,for instance by changing how the liquid flows through the mouth), whereas for other food categories,like chocolates [11,12], the shape of the product itself can be manipulated.
The third implication of these null results might be the non-replicability of this specific correspondenceeffect for beverages. Although this possibility does not imply that the general tendency to equate roundshapes with sweet taste is non-existent, it does limit the practical usefulness of varying shape propertiesto change taste perception. Moreover, effects of round shapes on increased sweetness perception havebeen reported to rely on boundary conditions such as color [17], hedonic preference [4], emotionalvalence [5], or even on the way answer scales are anchored [22], highlighting the difficulty of findingcorrespondence effects between shape and taste. As such, it might be a good idea for future researchto focus on replication studies—either direct or conceptual—to solidify the foundation of cross-modalcorrespondence research.
The main limitation of the studies reported here, admittedly, is their sample size. Dependingon effect size, in between-subjects experiments, the roughly forty participants per group may nothave been enough to discern effects where they exist [23,24]. This limitation, then, also extends to thepositive findings regarding bitterness in Study 2, which might either be easier discernable than effectsfor sweetness and therefore easier to find in smaller samples, or might constitute a statistical artifact.
5. Conclusions
Two studies focused on whether consumers’ sweetness perception of two drinks could be alteredby the shape of the cup the drinks were consumed from. Both studies failed to generate evidence forthe commonly reported correspondence between round shapes and sweet tastes, raising importantquestions for future cross-modal correspondence research. It still remains unclear how, and to whatextent, consumers use shapes as cues for a product’s (expected) taste [1].
Readers should note that, on the basis of these two experiments, I am not claiming that this particularcross-modal correspondence effect is nonexistent. I am, however, cautioning against an over-relianceon relative effects (i.e., explicit contrasts) for its practical relevance. As such, it appears importantthat results like the present ones are made available to aid cross-modal correspondence researchers infurther clarifying if, how, and when cross-modal effects are to be expected, notwithstanding makingits practical relevance more clear.
71

Beverages 2018, 4, 12
Acknowledgments: Special thanks go to Lasse Bahnsen for his excellent research assistance and to Ulrich R. Orthfor his helpful comments on previous versions of this manuscript. The author is also grateful for the very helpfulsuggestions of the anonymous Beverages reviewers.
Conflicts of Interest: The author declares no conflict of interest.
References
1. Velasco, C.; Woods, A.T.; Petit, O.; Cheok, A.D.; Spence, C. Crossmodal correspondences between taste andshape, and their implications for product packaging: A review. Food Qual. Prefer. 2016, 52, 17–26. [CrossRef]
2. Piqueras-Fiszman, B.; Spence, C. Sensory expectations based on product-extrinsic food cues: An interdisciplinaryreview of the empirical evidence and theoretical accounts. Food Qual. Prefer. 2015, 40, 165–179. [CrossRef]
3. Spence, C.; van Doorn, G. Does the shape of the drinking receptacle influence taste/flavour perception?A review. Beverages 2017, 3, 33. [CrossRef]
4. Velasco, C.; Woods, A.T.; Deroy, O.; Spence, C. Hedonic mediation of the crossmodal correspondence betweentaste and shape. Food Qual. Prefer. 2015, 41, 151–158. [CrossRef]
5. Salgado-Montejo, A.; Alvarado, J.A.; Velasco, C.; Salgado, C.J.; Hasse, K.; Spence, C. The sweetest thing:The influence of angularity, symmetry, and the number of elements on shape-valence and shape-tastematches. Front. Psychol. 2015, 6, 1382. [CrossRef] [PubMed]
6. Ngo, M.K.; Misra, R.; Spence, C. Assessing the shapes and speech sounds that people associate with chocolatesamples varying in cocoa content. Food Qual. Prefer. 2011, 22, 567–572. [CrossRef]
7. Deroy, O.; Valentin, D. Tasting liquid shapes: Investigating the sensory basis of cross-modal correspondences.Chemosens. Percept. 2011, 4, 80–90. [CrossRef]
8. Van Rompay, T.J.L.; Finger, F.; Saakes, D.; Fenko, A. “See me, feel me”: Effects of 3D-printed surface patternson beverage evaluation. Food Qual. Prefer. 2017, 62, 332–339. [CrossRef]
9. Becker, L.; van Rompay, T.J.L.; Schifferstein, H.N.; Galetzka, M. Tough package, strong taste: The influence ofpackaging design on taste impressions and product evaluations. Food Qual. Prefer. 2011, 22, 17–23. [CrossRef]
10. Velasco, C.; Salgado-Montejo, A.; Marmolejo-Ramos, F.; Spence, C. Predictive packaging design: Tastingshapes, typefaces, names, and sounds. Food Qual. Prefer. 2014, 34, 88–95. [CrossRef]
11. Wang, Q.J.; Reinoso Carvalho, F.; Persoone, D.; Spence, C. Assessing the effect of shape on the evaluation ofexpected and actual chocolate flavour. Flavour 2017, 6, 2. [CrossRef]
12. Reinoso Carvalho, F.; Wang, Q.J.; van Ee, R.; Persoone, D.; Spence, C. “Smooth operator”: Music modulatesthe perceived creaminess, sweetness, and bitterness of chocolate. Appetite 2017, 108, 383–390. [CrossRef][PubMed]
13. Spence, C.; Ngo, M. Assessing the shape symbolism of the taste, flavour, and texture of foods and beverages.Flavour 2012, 1, 12. [CrossRef]
14. Westerman, S.J.; Gardner, P.H.; Sutherland, E.J.; White, T.; Jordan, K.; Watts, D.; Wells, S. Product design:Preference for rounded versus angular design elements. Psychol. Mark. 2012, 29, 595–605. [CrossRef]
15. Bar, M.; Neta, M. Humans prefer curved visual objects. Psychol. Sci. 2006, 17, 645–648. [CrossRef] [PubMed]16. Van Doorn, G.; Colonna-Dashwood, M.; Hudd-Baillie, R.; Spence, C. Latté art influences both the expected
and rated value of milk-based coffee drinks. J. Sens. Stud. 2015, 30, 305–315. [CrossRef]17. Stewart, P.C.; Goss, E. Plate shape and colour interact to influence taste and quality judgments. Flavour 2013,
2, 27. [CrossRef]18. Karnal, N.; Machiels, C.J.A.; Orth, U.R.; Mai, R. Healthy by design, but only when in focus: Communicating
non-verbal health cues through symbolic meaning in packaging. Food Qual. Prefer. 2016, 52, 106–119.[CrossRef]
19. Velasco, C.; Woods, A.T.; Hyndman, S.; Spence, C. The taste of typeface. i-Perception 2015, 6. [CrossRef][PubMed]
20. Mirabito, A.; Oliphant, M.; van Doorn, G.; Watson, S.; Spence, C. Glass shape influences the flavour of beer.Food Qual. Prefer. 2017, 62, 257–261. [CrossRef]
21. Spence, C.; Wan, X. Beverage perception and consumption: The influence of the container on the perceptionof the contents. Food Qual. Prefer. 2015, 39, 131–140. [CrossRef]
22. Youssef, J.; Juravle, G.; Youssef, L.; Woods, A.; Spence, C. Aesthetic plating: A preference for oblique linesascending to the right. Flavour 2015, 4, 27. [CrossRef]
72

Beverages 2018, 4, 12
23. Simmons, J.P.; Nelson, L.D.; Simonsohn, U. False-positive psychology: Undisclosed flexibility in datacollection and analysis allows presenting anything as significant. Psychol. Sci. 2011, 22, 1359–1366. [CrossRef][PubMed]
24. Simmons, J.P.; Nelson, L.D.; Simonsohn, U. Life after p-hacking. SSRN Electron. J. 2013. [CrossRef]
© 2018 by the author. Licensee MDPI, Basel, Switzerland. This article is an open accessarticle distributed under the terms and conditions of the Creative Commons Attribution(CC BY) license (http://creativecommons.org/licenses/by/4.0/).
73

beverages
Article
Assessing the Impact of Closure Type on WineRatings and Mood
Charles Spence * and Qian (Janice) Wang
Crossmodal Research Laboratory, Department of Experimental Psychology, University of Oxford,South Parks Road, Oxford OX1 3UD, UK; [email protected]* Correspondence: [email protected]
Received: 7 October 2017; Accepted: 27 October 2017; Published: 3 November 2017
Abstract: We report on a preliminary study designed to assess the impact of the sound of the closureon the taste of wine. Given that people hold certain beliefs around the taste/quality of winespresented in bottles having different closure types, we expected that the sound of opening mightinfluence people’s wine ratings. In particular, if participants hear a cork being pulled vs. the sound ofa screw-cap bottle being opened then these two sounds will likely set different expectations that maythen affect people’s judgment of the taste/quality of the wine that they are rating. In order to test thishypothesis, 140 people based in the UK (and of varying degrees of wine expertise) rated two winesamples along four scales, three relating to the wine and one relating to celebratory mood. The resultsdemonstrated that the sound of a bottle being opened did indeed impact ratings. In particular,the quality of the wine was rated as higher, its appropriateness for a celebratory occasion, and thecelebratory mood of the participant was also higher following the sound of the cork pop. These resultsadd to the literature demonstrating that the sounds of opening/preparation of food and beverageproducts can exert a significant influence over the sensory and hedonic aspects of people’s subsequenttasting experience.
Keywords: closure type; opening sounds; wine perception; expectations; packaging
1. Introduction
A growing body of empirical research demonstrates that the sensory properties of the packagingin which drinks are presented can exert a significant influence over the ensuing tasting experience.This turns out to be true both when products are consumed direct from the packaging, but also when theproduct is first poured into a drinking vessel such as a glass, cup or mug [1]. Branding obviously plays arole here [2], but beyond that researchers have assessed the impact of everything from packaging/labelcolor [3–5], through weight and other material properties [6,7]. One factor that has, until recently,received less empirical interest, though, relates to the sound of opening. It is our belief that auditorycues provide information that may help set certain expectations and hence color the subsequent tastingexperience [8].
The general framework for interpreting such findings, showing as they do that the sensoryaspects of the packaging influence the tasting experience, has been in terms of expectations andsensation transference. According to the former account, we normally generate expectations prior totasting [9]. In terms of the expectations account, it is worth noting that expectations can be triggeredby what we see, but also by what we hear, feel, smell, read etc. Those expectations, both sensory andhedonic, can then anchor the subsequent tasting experience. According to the sensation transferenceaccount, what we feel about the packaging, e.g., that it is high quality, weighty, traditional, etc. is thentransferred to, or biases our ratings of, the contents [10].
In the present study, we were particularly interested in whether changing what people hear priorto tasting a wine would influence their sensory and hedonic expectations and hence their experience of
Beverages 2017, 3, 52; doi:10.3390/beverages3040052 www.mdpi.com/journal/beverages74

Beverages 2017, 3, 52
a wine. In this regard, one of the most iconic opening sounds is the pop of the cork being removed froma wine bottle. According to Hallgarten [11], cork bottle stoppers made from the cork oak tree werefirst introduced towards the end of the 18th Century. Apocryphally, Dom Perignon, the cellarmasterat the Abbey of Hautvilliers, was one of the first to plug his bottles with cork bark. For those winedrinkers who believe that wine from cork-stoppered bottles tastes better [12], we hypothesized thatthey would give a wine a higher quality rating after hearing the pop of a cork, compared to afterhearing the crack of the screw cap bottle [13]1. In the present study, we therefore investigated whetherthe sound of a cork-stoppered bottle being opened (i.e., the popping sound) versus the sound of ascrew-cap bottle being opened would influence people’s ratings of a wine, and/or their celebratorymood. The experiment was conducted in two parts. Initially, the participants heard only the sound ofbottle opening and rated two separate glasses of wine. In the second part of the study, the participantsactually opened the cork/screw-cap bottle and poured themselves a glass of wine from each bottletype before rating them. This aspect of the experimental design allowed us to assess the multisensorycontributions of actually opening and pouring the wine from either type of bottle (cork-closurevs. screw-cap) rather than just hearing the sound. Product experience is typically multisensory(involving sight, sound, touch, haptics, etc. [14]), and one might expect that the very action of pullingthe cork would have more of an effect on ratings than merely hearing the sound. By contrast, however,if it is just the knowledge (or, better said, belief) that a certain wine came from a bottle with a particulartype of closure that is doing the work, it may not matter whether that belief is based on unisensory(i.e., auditory) or multisensory (auditory plus haptic) cues.
The ratings were separated into questions concerning the quality of the wine (How intense?How would you rate the quality?) and the context/situation/mood around consumption(How appropriate is the wine for celebration? How much of a celebratory mood do you feel inright now?). The reason being that previous research suggests that the impact of product-extrinsicsounds such as sonic seasoning (i.e., musical compositions selected to accentuate a certain taste ina food) may be mediated, at least in part, by emotional valence [8,15]. Hence, in the present study,we wanted to try and ascertain by which route(s) people’s ratings of the wines may have been affected.
2. Methods
Participants. A convenience sample of 140 participants was tested in the experiment (92 maleand 47 female, 1 non-response). There were 115 right-handers, 19 left-handers, and 6 non-response.The participants indicated which age bracket they fell into (see Table 1). The participants also ratedtheir knowledge of wine on a 1–5 scale (see Table 2) from 1—Novice to 5—Expert.
Table 1. The age distribution of participants.
Age Bracket Number of Participants
18–25 2226–35 6136–45 2945+ 25
1 It is worth noting here, that people’s associations around the quality of screw-top bottles has changed in recent years,with some New World producers starting to change people’s mind-set, no longer necessarily associating screw-cap with alower quality product. Note that there has been something of a similar battle raging in the craft beer market between bottleand can format [1].
75

Beverages 2017, 3, 52
Table 2. The wine knowledge distribution of participants.
Wine Knowledge Number of Participants
1 (Novice) 82 363 674 17
5 (Expert) 10
Design and Procedure. The experiment was split into two parts. In each part, the participants weregiven two wines to taste and rate sequentially. In the first part of the experiment, the participantsrated one glass of wine after hearing the sound of a cork popping out of the bottle, and the other afterhearing the sound of a screw-top bottle being opened. In the second part of the study, the participantsactually opened a screw-top bottle themselves and rated the wine from that bottle and then pulled thecork on a stoppered wine bottle and rated the other wine. The bottle labels were obscured. In total,the participants gave ratings on four scales (see Table 3) for each of the four wines that they tasted.The two wines were Terrazas de los Andes, Malbec 2015, Argentina and a Catena, Malbec 2015, Argentina.Each wine was associated with the same closure type in each part of the study. Though, to be absolutelyclear, the wine-closure pairing was counterbalanced across days/participants. The two wines werechosen to be similar but not identical and hence to make sure that there was a meaningful differencebetween the wines in each of the two parts of the experiment. The wine that was associated witheach opening sound/opening action was counterbalanced across participants on the different days onwhich the study was conducted. For 91 of the participants (39 Press (including journalists and wineindustry reporters) plus 52 participants on Day 1), the cork opening sound and the cork bottle openingwere associated with the Terrazas de los Andes wine while the sound of the screw-cap opening and theaction of opening and pouring from a screw-top bottle with the Catena. This wine-condition matchwas reversed for the remaining 49 participants (who participated on Day 2). The cork opening alwayspreceded the screw-cap opening. Finally, the participants were asked “Do you prefer to buy a bottleof wine sealed with a cork or a screw cap?” The whole experiment took approximately 5–10 min tocomplete per person.
Table 3. The four ratings that participants were asked to give for each wine.
Least Most
How do you rate the intensity of the wine? 1 2 3 4 5How do you rate the quality of the wine? 1 2 3 4 5
How appropriate do you think this wine is for a celebration? 1 2 3 4 5How much of a celebratory mood do you feel in right now? 1 2 3 4 5
3. Results
In response to the question, “Do you prefer buying a bottle of wine sealed with a cork or ascrew cap?” 113 responded ‘cork’, 13 responded ‘screw-cap’, and 14 failed to respond. A Chi squaredtest of goodness of fit revealed a significant preference for cork closures, X2(3140) = 142.89, p < 0.001.This result is perhaps not surprising given that Argentine Malbec, and red wines in general, are typicallysealed with a cork closure in the UK, where the study was conducted.
Pearson’s correlations were calculated between the four measures of intensity, quality, celebrationappropriateness, and celebratory mood. There were significant positive correlations between all pairsof measures (see Table 4). Consequently, a multivariate analysis of variance (MANOVA) was conductedwith experimental condition (sound only or sound + touch), wine type (Terrazas de los Andes or Catena),and closure type (cork or screw-cap) as the between-participant factors. See Table 5 for average valuesof the four measures.
76

Beverages 2017, 3, 52
Table 4. Pearson correlation coefficients between wine ratings, over all conditions. * Indicatescorrelations that were significant at p < 0.01.
Intensity Quality Celebration Appropriateness Celebratory Mood
Intensity 1 0.34 * 0.19 * 0.15 *Quality 1 0.62 * 0.31 *
Celebration appropriateness 1 0.49 *Celebratory mood 1
Table 5. Mean ratings of Bonferroni-corrected pairwise comparisons between conditions (standard errorin parentheses). Bold typeface indicates significant difference between cork and screw-cap conditions(p < 0.05).
INTENSITY
SOUND ONLY cork screwcapTerrazas de los Andes 3.50 (0.09) 3.49 (0.12)
Catena 3.14 (0.12) 3.07 (0.09)SOUND + TOUCH cork screwcap
Terrazas de los Andes 3.41 (0.09) 3.27 (0.13)Catena 2.98 (0.13) 2.89 (0.09)
QUALITY
SOUND ONLY cork screwcapTerrazas de los Andes 3.30 (0.09) 3.25 (0.13)
Catena 3.35 (0.13) 2.90 (0.09)SOUND + TOUCH cork screwcap
Terrazas de los Andes 3.29 (0.09) 3.10 (0.13)Catena 3.40 (0.13) 2.98 (0.09)
CELEBRATION-APPROPRIATE
SOUND ONLY cork screwcapTerrazas de los Andes 3.04 (0.10) 3.02 (0.14)
Catena 3.31 (0.14) 2.86 (0.11)SOUND + TOUCH cork screwcap
Terrazas de los Andes 3.25 (0.10) 3.04 (0.14)Catena 3.35 (0.14) 2.80 (0.11)
CELEBRATORY MOOD
SOUND ONLY cork screwcapTerrazas de los Andes 3.32 (0.11) 2.86 (0.15)
Catena 3.31 (0.15) 2.99 (0.11)SOUND + TOUCH cork screwcap
Terrazas de los Andes 3.37 (0.11) 3.10 (0.15)Catena 3.25 (0.15) 3.03 (0.11)
Overall, there was a significant main effect of closure type (F(4542) = 4.83, p = 0.001, Wilk’s λ = 0.97;see Figure 1). Further univariate tests revealed that closure type significantly influenced theperceived quality of the wine (F(1542) = 12.44, p < 0.0005, ηp
2 = 0.022), celebration appropriateness(F(1542) = 12.27, p < 0.0005, ηp
2 = 0.022), and the celebratory mood of the participant (F(1542) = 11.86,p = 0.001, ηp
2 = 0.021). More specifically, wines with cork closures (or merely accompanied by thesound of a cork-stoppered bottle being opened) were rated as higher in quality (Mcork = 3.33, SE = 0.06,Mscrewcap = 3.06, SE = 0.06), more appropriate for celebrations (Mcork = 3.24, SE = 0.06, Mscrewcap = 2.93,SE = 0.06), and induced more of a celebratory mood (Mcork = 3.31, SE = 0.06, Mscrewcap = 3.00, SE = 0.06).However, there were no significant effect of closure type on ratings of wine intensity (F(1542) < 1, n.s.).
77

Beverages 2017, 3, 52
Figure 1. Mean values of wine intensity, wine quality, celebration appropriateness, and celebratorymood for wines with cork versus screw-cap enclosures. Error bars indicate standard error of means,and asterisks (*) indicate significant differences at p = 0.05. The y-axis reflects mean ratings on the5-point scale.
In addition, there was a main effect of wine type (F(4542) = 6.67, p < 0.0005, Wilk’s λ = 0.95). Furtherunivariate tests revealed the effect of wine type on ratings of intensity (F(1542) = 26.00, p < 0.0005,ηp
2 = 0.046), with the Terrazas de los Andes wine being perceived as more intense than the Catena(MTerrazas = 3.43, SE = 0.05, MCatena = 3.00, SE = 0.05). This latter result may help to explain whylarger differences were seen in ratings of quality for Catena than for the Terrazas de los Andes wine(i.e., there was more room for improvement in the former case).
Finally, it is worth noting that there was no effect of experimental condition (F(4542) = 1.48,p = 0.21). In other words, it did not seem to matter whether the knowledge of wine enclosure wasbased on unisensory (hearing alone) or multisensory (hearing plus touch) cues.
4. Discussion and Conclusions
The vast majority of those questioned in the present study reported that they preferred thetaste/flavor of the wine from a cork-stoppered bottle. One explanation for this preference emergesfrom the analysis of the results of the wine ratings: On average, the 140 participants tested in thepresent study rated the wine that they themselves served from a cork-stoppered bottle, or that theyheard being poured from a cork-stoppered bottle, as being of higher quality, as more appropriate forcelebrations, and as inducing a greater celebratory mood [16]. By contrast, there was no significanteffect of closure type on ratings of wine intensity. These results are consistent with the view thatthe effect on mood—rather than any changes in the perception of the wine itself—might be drivingpart of the change in the ratings elicited by the sound of the cork, as opposed to the screw-capclosure [15,17]. The results of the present study further suggest that it is knowledge about the closuretype, rather than how that knowledge was acquired (i.e., just from sound versus from sound plustouch—sight and action of opening and pouring the wine) that led to the ratings differences reportedhere. The suggestion is that distinctive packaging sounds, just as for the other aspects of the packaging,can set expectations in the mind of the consumer.
In future research, it would be interesting to try and replicate these findings using abetween-participants experimental design (rather than just a mixed-participants design, as conductedhere). This would help address one potential concern associated with the latter design, namely, that itdraws attention to the closure type in a way that might not necessarily be observed in everyday life.If possible, it may also be worth conducting future research under conditions that are more naturalistic(ecologically valid) and more conducive to celebration than the experimental setup used here. It mayalso be advantageous to randomize the order in which ratings are made in order to prevent any
78

Beverages 2017, 3, 52
order/sequential effects from coloring the results. Beyond that, it would obviously be beneficial torandomize the order in which the cork and screw-cap bottle sounds/actions were presented.
Of course, it should be noted that the effect size of the closure type differences on variousratings—as reported by partial eta squared values—are small [18,19]. In a practical sense, therefore,the decision to go with cork or screw-cap on the part of the manufacturer may not be expected to resultin a drastic change in the tasting experience. Nevertheless, the fact that an overwhelming proportionof participants (113 vs. 13) reported preferring to buy a cork-sealed bottle of wine over a screw-capbottle implies that small differences in perceived attributes of a wine may nevertheless still shapebuying decisions [20].
Finally, it is important to note that there is also a temporal aspect to people’s feelings aboutdifferent closure types: That is, people’s views likely changes over time. Indeed, as the years pass,there is a sense that screw-top bottles are starting to be associated with a better quality of productthan they once were. There may also be relevant cross-cultural variations in this regard too; forinstance, people from regions where screw-cap enclosures are more prevalent (e.g., Australia or NewZealand) might not necessarily show a preference for corks over screw-caps. Hence, the present results(showing a clear preference for wines served from a cork-stoppered bottle) should not, at least for themoment, be generalized beyond the mostly UK-based participants2 who took part in the present studyin 2017 and who rated two Argentinian red wines.
Nevertheless, having raised these various caveats/concerns, the key point remains that theseresults provide the first empirical demonstration that one and the same wine is rated more highly interms of its quality, it may be rated as more appropriate for celebrations, and also induces a greatercelebratory mood when served in a cork-stoppered rather than a screw-cap closure bottle. While suchclaims are certainly not new, the original part of this study resides in showing the effects can be elicitedby nothing more than the sound of the closure. These results help to emphasize the importance of thepackaging, and ‘the image mold’, to our experience of the contents [14].
Ultimately, though, these psychological benefits to the tasting experience associated with the corkclosure should be weighed against the cork taint that affects some small proportion of cork-stopperedbottles. Cork taint is associated with the presence of 2,4,6-trichloroanisole (TCA), which occurs asa reaction between a penicillium mold present in the cork and the chlorinated sterilants [21–23].Here, there are several important points to note. First, sensitivity to this fault varies widely across thepopulation [24]; it also varies as a function of the style of wine [25]. Second, innovations in enologymean that the incidence of this problem is much lower today than it has been in the past [12]. Third, it isimportant to note that cork taint also affects other closure types too [12] and can be transmitted to awine via contaminated winery equipment other than cork [21]. Nevertheless, despite any potentialtechnical limitations, it is clear that the sound of a cork-stoppered wine bottle being opened conveys apsychological impact that can help to enhance the ratings and experience of anyone who hears it.
Acknowledgments: Funding for this study was provided by Bompas & Parr. No funds were received to coverthe costs of publishing in open access.
Author Contributions: C.S. conceived and helped design the study; Q.W. analyzed the data from the study; C.S.and Q.W. wrote the paper.
Conflicts of Interest: C.S. has worked with APCOR and Clarion Communications on the psychologicalassociations with cork closures. Q.W. declares no conflict of interest.
References
1. Barnett, A.; Velasco, C.; Spence, C. Bottled vs. canned beer: Do they really taste different? Beverages 2016,2, 25. [CrossRef]
2 Although US-based participants showed a similar preference for cork [14].
79
Beverages 2017, 3, 52
2. Gates, P.W.; Copeland, J.; Stevenson, R.J.; Dillon, P. The influence of product packaging on young people’spalatability ratings for RTDs and other alcoholic beverages. Alcohol Alcohol. 2007, 42, 138–142. [CrossRef][PubMed]
3. Barnett, A.; Spence, C. Assessing the effect of changing a bottled beer label on taste ratings. Nutr. Food Technol.2016, 2. [CrossRef]
4. Cutler, L. Wine label design: What makes a successful label. Wine Business Monthly, 15 August 2006.5. Lick, E.; König, B.; Kpossa, M.R.; Buller, V. Sensory expectations generated by colours of red wine labels.
J. Retail. Consum. Serv. 2017, 37 (Suppl. C), 146–158. [CrossRef]6. Kampfer, K.; Leischnig, A.; Ivens, B.S.; Spence, C. Touch-taste-transference: Assessing the effect of the weight
of product packaging on flavor perception and taste evaluation. PLoS ONE 2017, 12, e0186121. [CrossRef][PubMed]
7. Piqueras-Fiszman, B.; Spence, C. The weight of the bottle as a possible extrinsic cue with which to estimatethe price (and quality) of the wine? Observed correlations. Food Qual. Preference 2012, 25, 41–45. [CrossRef]
8. Spence, C.; Zampini, M. Auditory contributions to multisensory product perception. Acta Acust. United Acust.2006, 92, 1009–1025.
9. Piqueras-Fiszman, B.; Spence, C. Sensory expectations based on product-extrinsic food cues:An interdisciplinary review of the empirical evidence and theoretical accounts. Food Qual. Preference 2015,40, 165–179. [CrossRef]
10. Spence, C.; Gallace, A. Multisensory design: Reaching out to touch the consumer. Psychol. Mark. 2011, 28,267–308. [CrossRef]
11. Hallgarten, F. Wine Scandal; Sphere Books: London, UK, 1987.12. Goode, J. Wine Science; Mitchell Beazley: London, UK, 2005.13. Spence, C.; Wang, Q.(J.). Sensory expectations elicited by the sounds of opening the packaging and pouring
a beverage. Flavour 2015, 4, 35. [CrossRef]14. Spence, C. Multisensory packaging design: Color, shape, texture, sound, and smell. In Integrating the
Packaging and Product Experience: A Road-Map to Consumer Satisfaction; Chen, M., Burgess, P., Eds.; Elsevier:Oxford, UK, 2016; pp. 1–22.
15. Wang, Q.(J.); Spence, C. Assessing the role of emotional associations in mediating crossmodalcorrespondences between classical music and wine. Beverages 2017, 3, 1. [CrossRef]
16. Marin, A.B.; Jorgensen, E.M.; Kennedy, J.A.; Ferrier, J. Effects of bottle closure type on consumer perceptionsof wine quality. Am. J. Enol. Vitic. 2007, 58, 182–191.
17. Spence, C.; Wang, Q.(J.). Wine & music (II): Can you taste the music? Modulating the experience of winethrough music and sound. Flavour 2015, 4, 33.
18. Cohen, J. Statistical Power Analysis for the Behavioral Sciences; Routledge Academic: New York, NY, USA, 1988.19. Lakens, D. Calculating and reporting effect sizes to facilitate cumulative science: A practical primer for
t-tests and ANOVAs. Front. Psychol. 2013, 4, 863. [CrossRef] [PubMed]20. Mueller, S.; Szolnoki, G. The relative influence of packaging, labeling, branding and sensory attributes on
liking and purchase intent: Consumers differ in their responsiveness. Food Qual. Preference 2010, 21, 774–783.[CrossRef]
21. Bird, D. Understanding Wine Technology; DBQA Publishing: Newark, UK, 2010.22. Buser, H.-R.; Zanier, C.; Tanner, H. Identification of 2,4,6-trichloroanisole as a potent compound causing cork
taint in wine. J. Agric. Food Chem. 1982, 30, 359–362. [CrossRef]23. Duncan, B.C.; Gibson, R.L.; Obradovic, D. 2,4,6-trichloroanisole and cork production. Wine Ind. J. 1997, 12,
180–184.24. Prescott, J.; Norris, L.; Kunst, M.; Kim, S. Estimating a “consumer rejection threshold” for cork taint in white
wine. Food Qual. Preference 2005, 16, 345–349. [CrossRef]25. Mazzoleni, V.; Maggi, L. Effect of wine style on the perception of 2,4,6-trichloroanisole, a compound related
to cork taint in wine. Food Res. Int. 2007, 40, 694–699. [CrossRef]
© 2017 by the authors. Licensee MDPI, Basel, Switzerland. This article is an open accessarticle distributed under the terms and conditions of the Creative Commons Attribution(CC BY) license (http://creativecommons.org/licenses/by/4.0/).
80

beverages
Review
Two Decades of “Horse Sweat” Taint andBrettanomyces Yeasts in Wine: Where do WeStand Now?
Manuel Malfeito-Ferreira
Linking Landscape, Environment, Agriculture and Food Research Centre (LEAF),Instituto Superior de Agronomia, University of Lisbon, Tapada da Ajuda, 1349-017 Lisboa, Portugal;[email protected]
Received: 19 February 2018; Accepted: 4 April 2018; Published: 10 April 2018
Abstract: The unwanted modification of wine sensory attributes by yeasts of the speciesBrettanomyces bruxellensis due to the production of volatile phenols is presently the mainmicrobiological threat to red wine quality. The effects of ethylphenols and other metabolites onwine flavor is now recognized worldwide and the object of lively debate. The focus of this reviewis to provide an update of the present knowledge and practice on the prevention of this problemin the wine industry. Brettanomyces bruxellensis, or its teleomorph, Dekkera bruxellensis, are rarelyfound in the natural environment and, although frequently isolated from fermenting substrates, theirnumbers are relatively low when compared with other fermenting species. Despite this rarity, theyhave long been studied for their unusual metabolical features (e.g., the Custers effect). Rising interestover the last decades is mostly due to volatile phenol production affecting high quality red winesworldwide. The challenges have been dealt with together by researchers and winemakers in aneffective way and this has enabled a state where, presently, knowledge and prevention of the problemat the winery level is readily accessible. Today, the main issues have shifted from technological tosensory science concerning the effects of metabolites other than ethylphenols and the over estimationof the detrimental impact by ethylphenols on flavor. Hopefully, these questions will continue to betackled together by science and industry for the benefit of wine enjoyment.
Keywords: wine; spoilage; Brettanomyces; Dekkera; volatile phenols; off-flavors
1. Introduction
The yeast genus Brettanomyces has been related with the production and characteristics ofEnglish beers since the beginning of the XX century [1]. It has been under the attention of earlyyeast physiologists due to its unusual fermentation stimulation by oxygen, coined as the Custer’seffect [2]. In wines, the first isolates were obtained by Krumholz and Tauschanoff in 1933 without anyparticular technological concern [1], and the investigation on the genus was relatively scarce until themid-nineties of last century. To understand the impact of these findings on Brett research, Figure 1shows the number of peer-reviewed references retrieved from the Scopus database (www.scopus.com,assessed on the 29 January 2018) using “brettanomyces or dekkera and wine” as search words inarticle titles, abstracts, and keywords from 1959 until 2017. The increase in the numbers coincidedwith the publication of seminal research by scholars at Bordeaux University [3]. In addition, the totalnumber was 339, which is more than half of the references that use only “brettanomyces or dekkera”(a total of 498). Although involved in other fermented foods, beverages, and ethanol production, mostpublications recognize that the role played by the species Brettanomyces bruxellensis (anamorph ofDekkera bruxellensis) in red wine spoilage is due to the production of “horse sweat” taint in bulk orbottled wines. Moreover, its effects are particularly notorious in high quality red wines aged in costly
Beverages 2018, 4, 32; doi:10.3390/beverages4020032 www.mdpi.com/journal/beverages81

Beverages 2018, 4, 32
oak barrels, which considerably increase the economic losses provoked by spoilage yeasts in the wineindustry. Presently, this species is regarded as the main threat posed by yeasts to wine quality [4],surpassing the research interest on the Zygosaccharomyces genus, which is another dangerous winespoilage yeast. To understand the significance of the relative value of these figures, when the Scopussearch executed using the key-words “zygosaccharomyces and wine” and “zygosaccharomyces”,the numbers were 128 and 1122, respectively.
Figure 1. Number of references related with “Brettanomyces” (black bars) and with “Brettanomyces orDekkera and wine” (white bars) retrieved from Scopus search engine (www.scopus.com).
The research of Brettanomyces gathers practically all fields of microbial research (physiology,metabolism, genomics, evolution, taxonomy, etc.) and has been regularly reviewed [1,5–13]. The aimof this review was to provide an additional approach that mainly concerns the most relevant scientificachievements and technological impacts, providing an update of the present knowledge and bestpractices on the prevention of this problem in the wine industry. Future challenges motivated bythe sensory perception of volatile phenols will also be addressed because this issue is the subject ofextensive debate among wine professionals and the general public.
2. Volatile Phenols (VPs): Their Incidence and Origin
The incidence of VPs in red wines is one of the most frequent wine defects alongside corkiness,reduced, and oxidized off-flavors [14]. The phenolic off-odors have been described as “medicinal”,“phenolic”, “rancid”, “sweaty”, “smoke”, “Band-aid®”, “barnyard” or “horse sweat”. The mostimportant VP is 4-ethylphenol (4-EP), followed by 4-ethylguaiacol (4-EG), and 4-ethylcathecol (4-EC).Earlier works by the team of Pascal Chatonnet during the 1990s provided values for sensory thresholdsthat are still a reference today. For instance, in Bordeaux red wines, the preference threshold for 4-EPis 620 μg/L, and for the mixture (10:1) of 4-EP and 4-ethylguaiacol is 426 μg/L [3]. However, otherthresholds have been published that reflect the influence of other factors among which the wine matrixis essential [15]. For instance, wine body and oak flavor are like buffers of the tainting effect of volatilephenols. In addition, other products of Brett metabolism like isovaleric and isobutyric acids [11] alsoinfluence the perception of “horse sweat”, which may explain why the smell of wines spiked with VPsis more objectionable than the smell of wines with the same concentrations but produced naturally.
The precursors of 4-EP, 4-EG, and 4-EC are hydroxycinnamic acids (p-coumaric, ferulic and caffeicacids, respectively), which are enzymatically decarboxylated by a cinnamate decarboxylase, leading tovinyl derivatives and reduced by a vinylphenol reductase, originating in the ethyl derivatives [11].
In grape juices those hydroxycinnamic acids are esterified, mainly to tartaric acid, inconcentrations higher than 10 mg/L. In wines they may be present in the free or esterified form, eitherwith tartaric acid [16,17], ethanol [18], hexoses [16] or polyphenols [7]. The release of hydroxycinnamicacids from anthocyanin esters during wine maturation may be only due to chemical reactions [7] butconversions of hydroxycinnamic acid precursors to VPs are typically dependent on enzyme or microbialactivity. In grapes or grape juices, the tartaric esters may be hydrolyzed by enzymes from contaminantfungi or from commercial pectolytic preparations, both with cinnamoyl decarboxylase activity, which
82

Beverages 2018, 4, 32
releases free hydroxycinnamic acid forms [11]. Ethyl and glucose esters of hydroxycinnamic acidsmay be metabolized by Brettanomyces [16,18] contrarily to tartaric acid esters [16,17]. Most of thesetartaric esters are hydrolyzed only after malolactic fermentation, and it has been hypothesized thatthe hydrolytic activity of the lactic acid bacteria follows the completion of malic conversion to lacticacid [19,20]. Thus, the pool of hydroxycinnamic acids’ precursors provides the substrate for theproduction of VPs that are higher than the preference thresholds depending on the presence of active B.bruxellensis populations [20,21]. S. cerevisiae may produce vinyl derivatives that may be later reducedby B. bruxellensis. This species is highly efficient in the conversion of p-coumaric acid with molar rateshigher than 90% [22]. Then, the natural pool of hydroxycinnamic acids (>10 mg/L) in wines are notlikely to be a limitation for the production of VPs higher than the preference thresholds. Therefore, allred wines may be affected by the taint, given that the yeasts are able to grow. The belief that there aresome grape varieties more susceptible to Brett growth has no scientific evidence [23].
The absence of “horse sweat” in white wines is probably due to the easier Brett inactivation,given that hydroxycinnamic acids are also present in concentrations similar to those of red wines [24].The yeast species Pichia guilliermondii and lactic acid bacteria (Lactobacillus spp., Pediococcus spp.) alsohave the ability to produce 4-EP, but their spoiling potential in wines is not comparable to that ofB. bruxellensis [25–27].
In conclusion, the natural concentrations of hydroxycinnamic acids in wines are high enoughto provide substrate for the production of volatile phenols much above the preference thresholds.Therefore, the key for the prevention of the problem is to understand the ecology and the behaviorof Brettanomyces in wines in order to apply the adequate control measures and avoid, or reduce,the conversion of hydroxycinnamic acids to VPs.
3. Brett Ecology: Infection Routes in the Winery
The Brettanomyces yeasts are mostly associated with fermented products, particularly with thepost-fermentation or aging period of alcoholic beverages, like wine, beer, cider, kombucha, and tequila.Some reports refer their isolation from cheeses or fermented milks. Besides the food industries,Dekkera/Brettanomyces spp. have also been reported in industrial ethanol fermentations. These yeastsare scarcely mentioned outside of fermentation environments. Occasional reports include isolationfrom olives, flours, carbonated beverages, and bees and air at ground level in fruit orchards, honeys,and tree exudates [5]. Being a fermenting species, Brett probably shares the same natural habitat asS. cerevisiae (e.g., soil, oak bark, decaying vegetal tissues, and tree exudates) but it is even rarer. Despitethe preference for fermented products, Dekkera/Brettanomyces spp. are usually not dominant and arereported in a low percentage of analyzed samples. Their occasional detection in sparkling winesmay be related with their resistance to carbon dioxide, which is higher than that of S. cerevisiae andZ. bailli [28]. Thus, Brett can be regarded as sporadic contamination yeast that appears in high numbersmainly when other microorganisms have been inhibited.
The dissemination of B. bruxellensis in wine related environments is hard to evidence from sourcescontaminated by other yeasts due to its low growth rate. As a consequence, the use of selective mediaand long incubation periods are essential to its recovery [29], although even when using selectivemedia, it has been rarely isolated from grapes [30] and clean winery environments. Rotten grapesappear to bear higher populations, which most likely explains the higher incidence of phenolic winesin vintages affected by this problem [31]. The frequency of isolation from cellar equipment increasesin the presence of juice, wine residues, and leftovers (husks and pomaces). Insects and air dusts areprobable vehicles of dissemination among infecting spots [32]. In contrast, it is a common contaminanteasily recovered from red wines where numbers may attain high levels (>104 cells/mL) if preventivemeasures are not taken [33].
The frequency of isolation in red wines explains why careful vigilance must be given to winespurchased from other sources or sold as bulk wines to other wineries. Once established in a winery,Brett is very difficult to eradicate, especially when it has contaminated the wooden vats.
83

Beverages 2018, 4, 32
Old Wooden Vats: A Well-Known Ecological Niche
The traditional wooden vats used for red wine, sherry, lambic beer or cider production are typicalniches of B. bruxellensis. In wines, the onset of problems related with its activity coincided with theworldwide increase in the utilization of oak barrels during the last 25 years. However, wines maturedin stainless steel tanks are also affected by these yeasts. The survival in barriques is facilitated by thediffusion of oxygen either by stimulating yeast growth [34] or by reducing the levels of molecularsulfite active against yeasts. In addition, it is believed that cell immobilization in the wood structurecontributes to the protection against preservatives. The ability to form pseudomycelium might as wellfavor the colonization of the porous structure of the wood and of the spaces between the staves andthe grooves. The wood of new barriques is not the source of Brett but it is readily contaminated if filledwith infected wine. On the contrary, high ethanol wines (>17% v/v) are not susceptible to these yeastseven if aged in old wooden vats, such as in the case of sherry or port-style wines.
Overall, the incidence of Brett increases during grape processing, from fermentation to red wineageing. The routes of contamination may not be perfectly known but this yeast easily finds the way toinfect stored red wines and initiates spoilage if not stopped in due time.
4. Brett Behavior and Tolerance in Wines
The practical absence of Brettanomyces from the early stages of grape processing is no longerobserved after the end of malolactic fermentation. In certain cases its activity may already begin inthe period between alcoholic and malolactic fermentations. It is not as tolerant to ethanol or sulfiteas S. cerevisiae or Zygosaccharomyces bailii [35] but it has the ability to remain viable for long periods.The increase in their predominance appears to be the result of an exceptional resistance to minimalnutrient conditions, which is seen as the determinant in their survival during the production andstorage steps and in their development once the environment becomes favorable (e.g., reduction infree sulfite during ageing) [11,30]. For instance, viable Brettanomyces have been reported in red winebottled for more than 50 years [33].
4.1. Attention to the Unnoticed Presence of Brett
The behavior of D. bruxellensis in co-culture with S. cerevisiae (molasses, grape juice, and syntheticmedium) is characterized by showing null or slow growth until about the end of fermentation. Inpost-fermentation it may grow, attaining levels as high as those observed with S. cerevisiae [22]. Afterinoculation in wines, D. bruxellensis growth shows a typical bell-shaped curve, with exponentialgrowth followed by cell death. When the stress imposed to cells is high, a sharp decrease in viabilityis frequently observed and the wine seems to be Brett-free [24]. In fact, cells may be in a viablebut non-culturable state (VBNC cells) [36]. However, these observations may well result from thefact the sample volume analyzed was too low to recover viable cells. Whatever the explanation,the technological significance of these observations is that after an apparent Brett-free period thegrowth may be re-initiated either by surviving or VBNC cells, as shown in Figure 2.
84

Beverages 2018, 4, 32
Figure 2. Effect of chitosan on the viability of growing cells D. bruxellensis (•) and on 4-ethylphenol (�)production. Arrow: moment of chitosan addition. Absence of viable cells (CFU <1/mL) is indicated as1 CFU/mL due to the logarithmic scale of the y-axis.
4.2. Resistance to Antimicrobials
Sulphur dioxide is the most common and effective preservative utilized in wineries. However,levels may be as high as 40 mg/L of free sulfite at pH 3.5, to control D. bruxellensis in wines aged inbarrels [24]. The active form is the molecular one, and so the lower the pH the higher the proportion ofmolecular sulfite. The effective free sulfite values in red wines may look somewhat high but probablyreflect the proportion of sulfite bound to the anthocyanins that are counted as free sulfite by the currenttitration methods. The strategy should be directed to increase the ratio of free to bound sulfite so thatinhibitory levels may be reached under a lower concentration of total sulfur dioxide.
Attempts to reduce sulfite utilization boosted the search for commercial alternatives. Sorbicacid has long been known to act against fermenting yeasts in bottled wines but D. bruxellensis isresistant to the maximum legal concentration of 200 mg/L in wines. Presently, the focus has beenturned to dimethyldicarbonate (DMDC) and chitosan, which are now commercially available. Otherantimicrobials, like killer proteins and peptides of microbial origin (e.g., zymocins) are reported aseffective in research articles but are not yet spread in the industry [37,38].
DMDC is an effective agent against Brett growth, depending on the initial cell concentration [39](Table 1). In wines matured in barrels it is an efficient tool to prevent blooms, being used in regularadditions up to the maximum permitted level of 200 mg/L. In the EU it is only authorized just beforebottling, in wines with more than 5 g/L of sugar, and it is claimed to be efficient if yeast countsthat are less than 500 CFU/mL. The efficiency also depends on adequate DMDC homogenization,which requires the use of specific equipment that makes the treatment cost high (>0.05 €/bottle). Inaddition, DMDC hydrolysis releases methanol that should be monitored if excessive concentrationsare suspected.
Table 1. Minimum lethal concentration of dimethyldicarbonate (DMDC) (mg/L) against several winerelated microbial species as a function of initial cellular inoculum (adapted from [39]).
Species 500 cells/mL >104 cells/mL Species 500 cells/mL >104 cells/mL
D. bruxellensis ISA 1791 100 300 S. pombe ISA 1190 100 >300P. guilliermondii ISA 2105 100 300 Z. bailii ISA 1307 25 200
S. cerevisiae ISA 1000 100 200 Lactic acid bacteria >300 >300S. cerevisiae ISA 1026 100 200 Acetic acid bacteria >300 >300
85

Beverages 2018, 4, 32
Chitosan is a natural derivative of chitin and prevents Brett growth in wines with variableefficiency [40]. As with sulfite or DMDC, the important is to ensure that cells do not recover viabilityafter the death phase as shown in Figure 2. The legal limit (0.1 g/L to inactivate Brett) is enough whencontaminations are low but it is not as effective when cells are present in high numbers and growing.The product is not cheap (>0.05 €/L) and careful examination of the balance between costs and benefitsshould be done before application.
4.3. The Hurdle Concept in Food and Wine Preservation
The judicious utilization of sulfite is the key to preventing the building up of D. bruxellensiscontaminations, however, sometimes the edge of its OIV guideline legal limit of utilization in red winesis reached (150 mg/L in red wines with less than 4 g/L reducing sugar, 300 mg/L in wines with morethan 4 g/L reducing sugar) (http://www.oiv.int, accessed on the 11 February 2018). Then, DMDC orchitosan may be used to minimize the utilization of sulfur dioxide. These chemical preservatives are notthe only options. The winemaker may also choose to control Brett using physical methods. The overallconcept of spoilage prevention is known as the hurdle concept in food microbiology. The idea is toweaken microbial populations by making them to “jump” several hurdles. The more hurdles to jumpthe easier it would be to prevent microbial growth. In wineries, these hurdles include environmentalfactors (e.g., storage temperature, dissolved oxygen) and processing factors (e.g., fining, filtration,heat treatments, high pressure, pulse electric fields, preservatives) [41–43] that when applied correctlycontribute to decreasing the utilization of sulfur dioxide.
In conclusion, Brett inactivation may be achieved by several alternative processes.The effectiveness of the different options must be ascertained under each real condition by appropriatemonitoring strategies.
5. Brett Prevention: How to Monitor Contaminations
Wine technologists have two different attitudes when facing the threat of D. bruxellensis. One,which we can call “optimistic”, results from the absence of wines spoiled by the yeasts and the thoughtthat it only happens to the others. The other, which we can call “pessimistic”, results from traumaticexperiences in the past. Naturally, neither are the correct attitudes. The first runs under high risksthat will, eventually, bring disastrous consequences. The second leads to exaggerated precautions andto high costs, either economically or in wine quality. Assuming that these yeasts are always present,although not detected, it is necessary to learn how to live with them in the winery and apply the bestpreventive measures.
5.1. To Know Where They Are and How Fit They Are
The first step to live with Brett is to know where it is. The proper prevention of Brett activitydepends on its detection by microbiological analysis and to decide the most adequate treatment.Today, several microbiological methods are available to monitor B. bruxellensis periodically, includinghighly specific molecular methods [44–46]. The most common and suitable technique is plate counting.However, many wineries do not have regular microbiological control. The small dimension of wineenterprises is a serious limitation to the development of a routine microbial control. The costs ofequipment from the simplest for plate counting to advanced instruments (e.g., fluorescence microscope,real-time polymerase chain reaction (PCR), flow cytometer) and the requirement for skilled labor arestill a burden for most small and medium enterprises. Therefore, the economic losses associated withD. bruxellensis activity have moved many companies to ask for external support, which may be easilyfound today.
In our lab routine, we currently apply a simplified detection technique based on growth in aselective solid or liquid medium. Serial dilutions of wine samples are inoculated in plates or testtubes, incubated at room temperature and the results checked after 4 to 15 days. These microbial
86

Beverages 2018, 4, 32
determinations are accompanied by 4-EP determination and gas chromatography as a measure of thespoiling activity.
The microbiological analysis should be regarded at two levels: (i) when the wines are stored inbulk, in oak barrels or in tanks; and (ii) when the wine is to be bottled. In the first situation, the mainpurpose is to avoid the production of VPs in levels high enough to produce off-flavors and off-tastes.Thus, it is not mandatory to eliminate Brett completely, but to assure that the level of contamination orof activity is low enough to keep 4-EP levels constant. In the second situation, the main purpose is tohave bottled wine free from these yeasts. Only one viable cell per bottle may be the cause for spoilagemuch later.
5.2. Microbial Guidelines
In bulk stored wines, it is satisfactory to detect B. bruxellensis monthly, bimonthly or even everythree months, depending on the contamination history. The sample volumes are from 100, 10, 1,to 0.1 mL, from a blend composed by wine from the interface air/liquid and from different depthsof the container. In case the result is positive for 1 mL, or less, and the level of 4-EP is higher than150 μg/L, it is recommended to reduce the microbial populations by fine filtration (<1 μm) immediately,accompanied by sulfite addition [35]. Negative results in 1 mL mean that contamination is low andonly fining followed by sulfite should be enough. Chitosan, when contamination is low, or thermaltreatments, when numbers are high, are two of the alternatives during wine ageing. The effectivenessof the treatments must be ascertained by microbiological analysis. When 4-EP levels are stable there isno need to reduce contamination because cells may be present but are not active, thus reducing theadditions of sulfite during storage.
For wines before bottling, the criteria are more stringent, and detection should be made on 100,10, and 1 mL of wine, sampled as described above. In case the result is positive in 1 or 10 mL, it isrecommended a very fine or sterilizing filtration. If positive detection is only obtained for 100 mL, it isadmissible to control viable cells only by the addition of preservatives (e.g., 40 mg/L of free sulfite, atpH 3.50). In this case, bottling must be technically correct and dissolved oxygen should be loweredto practically zero. Otherwise, it may be recommended to use DMDC or, as an alternative, a thermaltreatment to destroy viable cells [35].
5.3. The Question of Real Time PCR
Given the slow growth of these yeasts, cultured media can only give results after more than4–5 days and so early detection depends on the use of direct techniques. Presently, there areseveral real time PCR protocols that provide results in about 4–6 h and have a high sensitivity(<10 cells/mL) [45,46]. They have two main drawbacks. One is the cost, which is very high for aroutine analysis (>60 €/sample). The second is related with false positive responses given by the DNAof dead cells. In this case, protocols must be adapted to remove this DNA from the samples [47].
6. Brett Prevention: How to Control, Kill, and Cure
Knowing the monitoring and treatment options available, we will describe below our mainobservations and decisions during our empirical experience in wineries. The first idea is always toreduce cell numbers and growth so that treatments may be limited as much as possible. If thesemeasures are not taken in due time, VPs may attain high levels and curative measures may be used.
6.1. Reduction of Dissemination
The infections come into the winery through the grapes, wines, insects, and used barriques.In the case of grapes, it is not efficient to analyze and separate the infected grapes. Assuming thatthe prevalence of D. bruxellensis is higher in vintages of poor sanitary quality grapes, care shouldbe taken to (i) minimize the time between alcoholic and malolactic fermentation and (ii) avoid crosscontaminations that may jeopardize other finished wines. Outsourced red wines must be monitored
87

Beverages 2018, 4, 32
before blending and treated adequately (see below). Insect dissemination through winery atmosphere,during harvest or during bottling, must be minimized. New barriques do not contain Brettanomyces,but used barriques, when recovered, are a most probable infection source for the barreled wines.However, new barriques may be even more suitable to support Brett growth because of higher oxygenpermeability and nutrient release from the wood [6].
Once inside the winery, the most important factor to reduce dissemination is proper hygiene toavoid cross contaminations when moving wine. Common disinfectants used in the food industryare effective against yeast species and also against Brettanomyces [48]. The most efficient products arealkaline detergents, iodophors, and peracetic acid based sanitizers. Thus, the main concern is how tosanitize, properly, points of complex geometry or difficult access, particularly in bottling machines,like dead ends of filters, valves, gauges, or hoses. Pumps and hoses for wine transfer between tanks isanother concern. Less efficient, or virtually impossible, is the sterilization of wooden vats common intraditional fermentation processes and in modern fashionable wine ageing. Sanitation with hot wateror steam is essential, although not completely efficient. Even after steaming, Brett may be recoveredfrom wood layers up to 4–6 mm below the surface [49]. Whatever the treatment adopted in wineries,one should bear in mind that, in barrels, the critical factor is the inability of the disinfecting agent (e.g.,hot water, steam, ozone, microwaves, UV light) to reach the deeper layers of the wood.
6.2. Prevention of D. bruxellensis Growth and 4-EP Production
The prevention first depends on careful D. bruxellensis monitoring during all wine storage time.It should begin after malolactic fermentation or even before, when extended periods occur betweenthe end of wine fermentation and the onset of malolactic fermentation. During this period winesare left unprotected by sulfite and kept at higher temperatures to promote the bioconversion ofmalic acid, which stimulate premature Brett growth. After malolactic fermentation, the frequency ofanalysis depends on its detection, but even in the absence of contaminations at least three analysesper year (after winter, before harvest, after harvest) should be done to avoid unnoticed growth [35].This frequently happens during the harvest period, when temperatures are higher and attention isdirected to pick grapes and ferment wines.
The main concern when a contaminated sample appears is to avoid any cross contamination.This is especially important when processing products from external sources, such as purchased winesof unknown origin. The best solution, at first, is to detect the presence of D. bruxellensis to determinethe measures to be taken. In case wines are highly contaminated, the most efficient measure wouldbe to filter through pores tighter than 1.0 μm, or even 0.8 μm, given that sulfur dioxide reduces cellsize [50]. Even knowing the difficulty to sterilize by filtration young wines and the controversy of suchmeasures, our opinion is that it should be considered, particularly when wines are to be matured incostly oak barrels.
Concerning factors promoting wine colonization, special attention should be paid to the levelsof free sulfite, levels of dissolved oxygen, presence of residual sugars, and the storage temperature.Ideally, if wines could be stored at less than 10 ◦C there would be no yeast growth and concurrently nonoticeable 4-EP production (Figure 3).
Oxygen is essential to wine ageing but it also stimulates growth and the production of volatilephenols [34]. Even under the practical absence of oxygen D. bruxellensis grows and produces4-ethylphenol but at lower rates that are enough to affect wine quality. Therefore, all operationscontributing to oxygen diffusion must be minimized, or carefully monitored, like rackings, pumpings,toppings, bottling and, particularly, micro-oxygenation—a fashionable process to accelerate red wineageing. Oxygen also contributes to a quicker loss of free sulfites during storage, opening a window ofopportunity for Brett growth. In our experience, the most frequent reason for unexpected growth isthe drop of free sulfites below 20 mg/L (at pH 3.5).
Another aspect to keep in mind is the level of nutrients in the wine. These yeasts may growwell under very low levels of residual sugar (<2 g/L and in wines where no nutrients were added).
88

Beverages 2018, 4, 32
However, reducing nitrogen additions to the minimum required to finish fermentations is alwaysa wise strategy to minimize Brett growth during storage. The idea is to create a “nutrient desert”that turns the wine less susceptible to yeast growth. Most likely this is the mechanism underlyinginhibition by Metschnikowia pulcherrima, when this species, by producing pulcherriminic acid, depletesthe iron present in the medium, making it unavailable to the other yeasts [51]. During bottling, a sugaraddition to smooth mouth-feel up to 10 g/L does not increase susceptibility to spoilage in wines withhigh ethanol, and so extra doses of sulfur dioxide to compensate higher sugar are not required, whichis contrary to common knowledge [52]. However, if cells have the ability to grow, higher residualsugar stimulates proliferation [53].
Figure 3. Growth (A) and 4-EP production (B) by B. bruxellensis under wines stored at differenttemperatures (symbols: �, 3 ◦C; �, 10 ◦C; Δ, 15 ◦C; �, 20 ◦C). Cells were inoculated in 1 L Schott flasksand incubated without agitation to mimic tank storage conditions.
The option to kill actively growing populations through heat treatments using mild temperaturesin low volume tanks (35 ◦C overnight) or pasteurization regimes at bottling can be successful, becauseBrett is not heat resistant. A solution for contaminated bottled wine is to keep the bottles at 35 ◦C andcheck until viable counts fall to 0/bottle.
6.3. Curative Measures
When the wine is off-tainted, there are no effective curative measures without depreciating it. Inthis situation, we always weigh the possibility of blending tainted wine with “clean” wine. Althoughthis measure may attenuate the defect of the tainted wine by dilution, it cannot be seen as a curativemeasure. In fact, mixtures of wines free of 4-EP are only effective for small proportions of taintedwines, because large volumes of “clean” wine must be used to obtain a blend with 4-ethylphenol levelslower than the preference threshold.
The effective reduction of 4-EP levels may be obtained by adsorbents (e.g., yeast lees, fining agents,activated charcoal) [54] but wine favorable aroma compounds or color are also removed and a balancemust be drawn between the benefits and losses of wine attributes. Our experience with activatedcharcoal reveals that it may be an efficient option when preventive measures have failed (Figure 4).In this case, besides a reduction in VPs, the wine was also reduced in color and flavor intensity but itwas perfectly adequate for blending with un-tainted wines. The use of nanofiltration together withactivated charcoal (process accepted by the OIV) and reverse osmosis are other alternatives claimed tobe effective in VP reduction. It is also possible that esterified cellulose may be used in filtration sheetsto decrease volatile phenols [55].
89

Beverages 2018, 4, 32
Figure 4. Effect of activated charcoal on the reduction of 4-EP (μg/L) in two red different wines (A,B)after 3 ( ), 10 (�) and 21 days (Δ) of contact. Insertions: effect on color intensity (�) and hue (×10, )after 10 days of contact.
7. The Brett Sequel: from “Terroir” to “Terror”
The flavors responsible for the Brett character were certainly known for a long time. It is feasiblethat it contributed to the so-called “gout du terroir”, used to describe certain tainted wines in Franceby the mid 20th century. Bulk Californian red wines by 1960–1970 were also frequently affected bythis taint (Ralph Kunkee, personal communication). In our case, the awareness of the problem begunin the last decade of the last century, when some problematic red wines were tasted by Prof. DennisDubourdieu in a workshop organized by our faculty. Coincidently, wine became a fashionable product,worthy of global exposure in the USA. It was a time when noticeably tainted phenolic Bordeauxwines were taken as the expression of terroir by leading wine critics. In addition, barrique utilizationincreased worldwide to cope with consumer preferences and increasing Brett infection risks. Beforewinemakers could deal with the problem it was already the object of lively discussions in specializedjournals and consumer related websites.
A complex Brett aroma wheel was recently published [56], describing quite variable descriptors,not all unpleasant, such as earthy, leather, savory, spicy or woody, that may be found in high quality redwines. Despite this complexity, the result of generalized “horse sweat” awareness is that, today, everynose seems to be particularly appropriate to find an off-flavor. In fact, the recognition of volatile phenolsseems to be equivalent in individuals from very different origins or backgrounds [15]. However, thequestion is not the recognition of the flavor but the fact that at the least perception of animal notes,the wine may be readily incriminated as an excessively barnyard tainted wine. Particularly in finewines, bottled for decades, the aging bouquet may have notes resembling volatile phenols, albeitbeing present in low levels. In a world of uniform globalized taste, dominated by the pleasantness ofintense fruity-oak flavors and a full-sweet mouthfeel, there seems to be little tolerance to wines withleather-game scents. As a result, winemakers are haunted by the terror of having the slightest noteimparted by volatile phenols and become easy victims of technical alternatives that are frequentlyineffective to calm their nightmares.
The Issue of Chemical Limits
Given that volatile phenols, where 4-ethylphenol is by far the most relevant, are regarded asspoilage molecules, it is expected that the wine regulatory bodies and large retail companies will tryto establish limits for the acceptability of wines based on the average sensory detection threshold of500 μg/L of 4-ethylphenol. This can be compared with the classic limits for volatile acidity, which is achemical indicator of spoilage by acetic acid bacteria. However, threshold values for volatile phenolsmust be regarded only as indicative of horse-sweat taint. Given the different aromatic integrationof 4-ethylphenol smell in the overall wine flavor, well-known by wine professionals and a concept
90

Beverages 2018, 4, 32
explained by Clark Smith in his book Postmodern Winemaking [57], high concentrations are frequentlynot detected by trained tasters (Figure 5). Therefore, clearly tainted wines can only be determined bysensory analysis. The odorant chemical concentration can only be directly related with Brett activity,as described before.
Figure 5. Relation between the real chemical concentration of 4-ethylphenol and the respectivepredicted concentration given by two different tasting panels ((A) DOC certification office; (B) facultyenology students). Wines from 1 to 5 are commercial brands. Wine 6 is a blank sample spiked with of4-ethylphenol (2000 μg/L) and 4-ethylguaiacol (250 μg/L). Vertical bars indicate standard deviation.
8. Final Remarks
According to our experience, the control of B. bruxellensis spoilage is, presently, the most seriousmicrobial problem in red wine quality and poses serious constraints to sulfite reduction in itsproduction. There are several technical alternatives that prevent or kill contaminant populations,which contribute to a decrease in its utilization, but they are not fully effective when used alone.Winemakers should learn how to live with these yeasts by monitoring their activity, applyingappropriate inactivation measures only when necessary, and weighing the cost-benefit of each option.Besides their technical expertise, winemakers should also communicate to consumers and other wineprofessionals the difference between volatile phenol sensory detection and wine depreciation, enablingthem to understand the diversity and aptitudes of wines with animal-leather flavors.
Acknowledgments: Research was funded by the Fundação para a Ciêcnia e Tecnologia (FCT) trough projectUID/AGR/04129/2013.
Conflicts of Interest: The author has no conflict of interest. The founding sponsors had no role in the design ofthe study; in the collection, analyses, or interpretation of data; in the writing of the manuscript, and in the decisionto publish the results.
References
1. Schifferdecker, A.J.; Dashko, S.; Ishchuk, O.P.; Piškur, J. The wine and beer yeast Dekkera bruxellensis. Yeast2014, 31, 323–332. [CrossRef] [PubMed]
2. Scheffers, W.A.; Wikén, T.O. The Custers effect (negative Pasteur effect) as a diagnostic criterion for thegenus Brettanomyces. Antonie Leeuwenhoek 1969, 35, A31–A32.
91

Beverages 2018, 4, 32
3. Chatonnet, P.; Dubourdieu, D.; Boidron, J.-N.; Pons, M. The origin of ethylphenols in wines. J. Sci. Food Agric.1992, 60, 165–178. [CrossRef]
4. Curtin, C.; Varela, C.; Borneman, A. Harnessing improved understanding of Brettanomyces bruxellensisbiology to mitigate the risk of wine spoilage. Aust. J. Grape Wine Res. 2015, 21, 680–692. [CrossRef]
5. Loureiro, V.; Malfeito-Ferreira, M. Spoilage activities of Dekkera/Brettanomyces spp. In Food SpoilageMicroorganisms; Blackburn, C., Ed.; Woodhead Publishers: Cambridge, UK, 2006; Chapter 13; pp. 354–398.
6. Renouf, V.; Lonvaud-Funel, A.; Coulon, J. The origin of Brettanomyces bruxellensis in wines: A review. J. Int.Sci. Vigne Vin 2007, 41, 161–173. [CrossRef]
7. Suárez, R.; Suárez-Lepe, J.A.; Morata, A.; Calderón, F. The production of ethylphenols in wine by yeasts ofthe genera Brettanomyces and Dekkera: A review. Food Chem. 2007, 102, 10–21. [CrossRef]
8. Oelofse, A.; Pretorius, I.S.; du Toit, M. Significance of Brettanomyces and Dekkera during Winemaking:A Synoptic Review. S. Afr. J. Enol. Vitic. 2008, 29, 128–144. [CrossRef]
9. Wedral, D.; Shewfelt, R.; Frank, J. The challenge of Brettanomyces in wine. LWT Food Sci. Technol. 2010, 43,1474–1479. [CrossRef]
10. Zuehlke, J.M.; Petrova, B.; Edwards, C.G. Advances in the control of wine spoilage by Zygosaccharomyces andDekkera/Brettanomyces. Annu. Rev. Food Sci. Technol. 2013, 4, 57–78. [CrossRef] [PubMed]
11. Steensels, J.; Daenen, L.; Malcorps, P.; Derdelinckx, G.; Verachtert, H.; Verstrepen, K. Brettanomycesyeasts—From spoilage organisms to valuable contributors to industrial fermentations. Int. J. Food Microbiol.2015, 206, 24–38. [CrossRef] [PubMed]
12. Smith, B.D.; Divol, B. Brettanomyces bruxellensis, a survivalist prepared for the wine apocalypse and otherbeverages. Food Microbiol. 2016, 59, 161–175. [CrossRef] [PubMed]
13. Agnolucci, M.; Tirelli, A.; Cocolin, L.; Toffanin, A. Brettanomyces bruxellensis yeasts: Impact on wine andwinemaking. World J. Microbiol. Biotechnol. 2017, 33, 180. [CrossRef] [PubMed]
14. Goode, J.; Harrop, S. Wine Faults and Their Prevalence: Data from the World’s Largest Blind Tasting.In Proceedings of the 20th Entretiens Scientifiques Lallemand, Horsens, Denmark, 15 May 2008.
15. Schumaker, M.; Chandra, M.; Malfeito-Ferreira, M.; Ross, C. Influence of Brettanomyces ethylphenols on redwine aroma evaluated by consumers in the United States and Portugal. Food Res. Int. 2017, 100, 161–167.[CrossRef] [PubMed]
16. Hixson, J.; Hayasaka, Y.; Curtin, C.; Sefton, M.; Taylor, D. Hydroxycinnamoyl Glucose and Tartrate Estersand Their Role in the Formation of Ethylphenols in Wine. J. Agric. Food Chem. 2016, 64, 9401–9411. [CrossRef][PubMed]
17. Schopp, L.; Lee, J.; Osborne, J.; Chescheir, S.; Edwards, C. Metabolism of Nonesterified and EsterifiedHydroxycinnamic Acids in Red Wines by Brettanomyces bruxellensis. J. Agric. Food Chem. 2013, 61,11610–11617. [CrossRef] [PubMed]
18. Hixson, J.L.; Sleep, N.R.; Capone, D.L.; Elsey, G.M.; Curtin, C.D.; Sefton, M.A.; Taylor, D.K. HydroxycinnamicAcid Ethyl Esters as Precursors to Ethylphenols in Wine. J. Agric. Food Chem. 2012, 60, 2293–2298. [CrossRef][PubMed]
19. Cabrita, M.J.; Torres, M.; Palma, V.; Alves, E.; Patão, R.; Costa Freitas, A.M. Impact of malolactic fermentationon low molecular weight phenolic compounds. Talanta 2008, 74, 1281–1286. [CrossRef] [PubMed]
20. Chescheir, S.; Philbin, D.; Osborne, J.P. Impact of Oenococcus oeni on wine hydroxycinnamic acids and volatilephenol production by Brettanomyces bruxellensis. Am. J. Enol. Vitic. 2015, 66, 357–362. [CrossRef]
21. Madsen, M.G.; Edwards, N.K.; Petersen, M.A.; Mokwena, L.; Swiegers, J.H.; Arneborg, N. Influence ofOenococcus oeni and Brettanomyces bruxellensis on hydroxycinnamic acids and volatile phenols of aged wine.Am. J. Enol. Vitic. 2017, 68, 23–29. [CrossRef]
22. Dias, L.; Pereira-da-Silva, S.; Tavares, M.; Malfeito-Ferreira, M.; Loureiro, V. Factors affecting the productionof 4-ethylphenol by the yeast Dekkera bruxellensis in enological conditions. Food Microbiol. 2003, 20, 377–384.[CrossRef]
23. Chandra, M.; Madeira, I.; Coutinho, A.; Albergaria, M.; Malfeito-Ferreira, M. Growth and volatile phenolproduction by Brettanomyces bruxellensis in different grapevine varieties during fermentation and in finishedwine. Eur. Food Res. Technol. 2015, 242, 487–494. [CrossRef]
24. Barata, A.; Caldeira, J.; Botellheiro, R.; Pagliara, D.; Malfeito-Ferreira, M.; Loureiro, V. Survival patterns ofDekkera bruxellensis in wines and inhibitory effect of sulphur dioxide. Int. J. Food Microbiol. 2008, 121, 201–207.[CrossRef] [PubMed]
92

Beverages 2018, 4, 32
25. Barata, A.; Correia, P.; Nobre, A.; Malfeito-Ferreira, M.; Loureiro, V. Growth and 4-ethylphenol productionby the yeast Pichia guilliermondii in grape juices. Am. J. Enol. Vitic. 2006, 57, 133–138.
26. Dias, L.; Dias, S.; Sancho, T.; Stender, H.; Querol, A.; Malfeito-Ferreira, M.; Loureiro, V. Identification ofyeasts isolated from wine related environments and capable of producing 4-ethylphenol. Food Microbiol.2003, 20, 567–574. [CrossRef]
27. Martorell, P.; Barata, A.; Malfeito-Ferreira, M.; Fernández-Espinar, M.; Loureiro, V.; Querol, A. Moleculartyping of the yeast species Dekkera bruxellensis and Pichia guilliermondii recovered from wine related sources.Int. J. Food Microbiol. 2006, 106, 79–84. [CrossRef] [PubMed]
28. Ison, R.; Gutteridge, C. Determination of the carbonation tolerance of yeasts. Lett. Appl. Microbiol. 1987, 5,11–13. [CrossRef]
29. Rodrigues, N.; Gonçalves, G.; Pereira-da-Silva, S.; Malfeito-Ferreira, M.; Loureiro, V. Development and use ofa new medium to detect yeasts of the genera Dekkera/Brettanomyces spp. J. Appl. Microbiol. 2001, 90, 588–599.[CrossRef] [PubMed]
30. Renouf, V.; Lonvaud-Funel, A. Development of an enrichment medium to detect Dekkera/Brettanomycesbruxellensis a spoilage yeast, on the surface of grape berries. Microbiol. Res. 2007, 162, 154–167. [CrossRef][PubMed]
31. Guerzoni, M.E.; Marchetti, R. Analysis of yeast flora associated with grape sour rot and of the chemicaldisease markers. Appl. Environ. Microbiol. 1987, 53, 571–576. [PubMed]
32. Connell, L.; Stender, H.; Edwards, C.G. Rapid detection and identification of Brettanomyces from winery airsamples based on peptide nucleic acid analysis. Am. J. Enol. Vitic. 2002, 53, 322–324.
33. Renouf, V.; Perello, M.-C.; De Revel, G.; Lonvaud-Funel, A. Survival of wine microorganisms in the bottleduring storage. Am. J. Enol. Vitic. 2007, 58, 379–386.
34. Malfeito-Ferreira, M.; Rodrigues, N.; Loureiro, V. The influence of oxygen on the “horse sweat taint” in redwines. Ital. Food Beverage Technol. 2001, 24, 34–38.
35. Malfeito-Ferreira, M. Yeasts and wine off-flavours: A technological perspective. Ann. Microbiol. 2011, 61,95–102. [CrossRef]
36. Capozzi, V.; Di Toro, M.R.; Grieco, F.; Michelotti, V.; Salma, M.; Lamontanara, A.; Russo, P.; Orrù, L.;Alexandre, H.; Spano, G. Viable But Not Culturable (VBNC) state of Brettanomyces bruxellensis in wine: Newinsights on molecular basis of VBNC behaviour using a transcriptomic approach. Food Microbiol. 2016, 59,196–204. [CrossRef] [PubMed]
37. Albergaria, H.; Francisco, D.; Gori, K.; Arneborg, N.; Gírio, F. Saccharomyces cerevisiae CCMI 885 secretespeptides that inhibit the growth of some non-Saccharomyces wine-related strains. Appl. Microbiol. Biotechnol.2010, 86, 965–972. [CrossRef] [PubMed]
38. Oro, L.; Ciani, M.; Bizzaro, D.; Comitini, F. Evaluation of damage induced by Kwkt and Pikt zymocinsagainst Brettanomyces/Dekkera spoilage yeast, as compared to sulphur dioxide. J. Appl. Microbiol. 2016, 121,207–214. [CrossRef] [PubMed]
39. Costa, A.; Barata, A.; Malfeito-Ferreira, M.; Loureiro, V. Evaluation of the inhibitory effect of dimethyldicarbonate (DMDC) against wine microorganisms. Food Microbiol. 2008, 25, 422–427. [CrossRef] [PubMed]
40. Petrova, B.; Cartwright, Z.M.; Edwards, C.G. Effectiveness of chitosan preparations againstBrettanomyces bruxellensis grown in culture media and red wines. J. Int. Sci. Vigne Vin 2016, 50, 49–56.[CrossRef]
41. Fabrizio, V.; Vigentini, I.; Parisi, N.; Picozzi, C.; Compagno, C.; Foschino, R. Heat inactivation of winespoilage yeast Dekkera bruxellensis by hot water treatment. Lett. Appl. Microbiol. 2015, 61, 186–191. [CrossRef][PubMed]
42. Delsart, C.; Grimi, N.; Boussetta, N.; Miot-Sertier, C.; Ghidossi, R.; Vorobiev, E.; Mietton-Peuchot, M. Impactof pulsed-electric field and high-voltage electrical discharges on red wine microbial stabilization and qualitycharacteristics. J. Appl. Microbiol. 2016, 120, 152–164. [CrossRef] [PubMed]
43. Van Wyk, S.; Silva, F.V. High pressure processing inactivation of Brettanomyces bruxellensis in seven differenttable wines. Food Control 2017, 81, 1–8. [CrossRef]
44. Röder, C.; König, H.; Fröhlich, J. Species-specific identification of Dekkera/Brettanomyces yeasts byfluorescently labeled DNA probes targeting the 26S rRNA. FEMS Yeast Res. 2007, 7, 1013–1026.
45. Agnolucci, M.; Scarano, S.; Rea, F.; Toffanin, A.; Nuti, M. Detection of Dekkera/Brettanomyces bruxellensis inpressed Sangiovese grapes by real time PCR. Ital. J. Food Sci. 2007, 19, 153–164.
93

Beverages 2018, 4, 32
46. Longin, C.; Julliat, F.; Serpaggi, V.; Maupeu, J.; Bourbon, G.; Rousseaux, S.; Guilloux-Benatier, M.;Alexandre, H. Evaluation of three Brettanomyces qPCR commercial kits: Results from an interlaboratorystudy. J. Int. Sci. Vigne Vin 2016, 50, 223–230. [CrossRef]
47. Vendrame, M.; Manzano, M.; Comi, G.; Bertrand, J.; Iacumin, L. Use of propidium monoazide for theenumeration of viable Brettanomyces bruxellensis in wine and beer by quantitative PCR. Food Microbiol. 2014,42, 196–204. [CrossRef] [PubMed]
48. Tristezza, M.; Lourenço, A.; Barata, A.; Brito, L.; Malfeito-Ferreira, M.; Loureiro, V. Susceptibility of winespoilage yeasts and bacteria in the planktonic state and in biofilms to disinfectants. Ann. Microbiol. 2010, 60,549–556. [CrossRef]
49. Barata, A.; Laureano, P.; D’Antuono, I.; Martorell, P.; Stender, H.; Malfeito-Ferreira, M.; Querol, A.; Loureiro, V.Enumeration and identification of 4-ethylphenol producing yeasts recovered from the wood of wine ageingbarriques after different sanitation treatments. J. Food Res. 2013, 2, 140–149. [CrossRef]
50. Umiker, N.L.; Descenzo, R.A.; Lee, J.; Edwards, C.G. Removal of Brettanomyces bruxellensis from red wineusing membrane filtration. J. Food Process. Preserv. 2013, 37, 799–805. [CrossRef]
51. Oro, L.; Ciani, M.; Comitini, F. Antimicrobial activity of Metschnikowia pulcherrima on wine yeasts.J. Appl. Microbiol. 2014, 116, 1209–1217. [CrossRef] [PubMed]
52. Chandra, M.; Barata, A.; Ferreira-Dias, S.; Malfeito-Ferreira, M.; Loureiro, V. A response surface methodologystudy on the role of factors affecting growth and volatile phenol production by Brettanomyces bruxellensis ISA2211 in wine. Food Microbiol. 2014, 42, 40–46. [CrossRef] [PubMed]
53. Barata, A.; Pagliara, D.; Piccininno, T.; Tarantino, F.; Ciardulli, W.; Malfeito-Ferreira, M.; Loureiro, V. The effectof sugar concentration and temperature on growth and volatile phenol production by Dekkera bruxellensis inwine. FEMS Yeast Res. 2008, 8, 1097–1102. [CrossRef] [PubMed]
54. Milheiro, J.; Filipe-Ribeiro, L.; Cosme, F.; Nunes, F. A simple, cheap and reliable method for control of4-ethylphenol and4-ethylguaiacol in red wines. Screening of fining agents for reducing volatile phenolslevels in red wines. J. Chromatogr. B 2017, 1041–1042, 183–190. [CrossRef] [PubMed]
55. Larcher, R.; Puecher, C.; Rohregger, S.; Malacarne, M.; Nicolini, G. 4-Ethylphenol and 4-ethylguaiacoldepletion in wine using esterified cellulose. Food Chem. 2012, 132, 2126–2130. [CrossRef]
56. Joseph, L.; Albino, E.; Bisson, L. Creation and Use of a Brettanomyces Aroma Wheel. Catalyst 2017, 1, 12–30.57. Smith, C. Postmodern Winemaking, Rethinking the Modern Science of an Ancient Craft; University California
Press: Berkeley, CA, USA, 2013; ISBN 9780520282599.
© 2018 by the author. Licensee MDPI, Basel, Switzerland. This article is an open accessarticle distributed under the terms and conditions of the Creative Commons Attribution(CC BY) license (http://creativecommons.org/licenses/by/4.0/).
94

MDPISt. Alban-Anlage 66
4052 BaselSwitzerland
Tel. +41 61 683 77 34Fax +41 61 302 89 18
www.mdpi.com
Beverages Editorial OfficeE-mail: [email protected]
www.mdpi.com/journal/beverages


MDPI St. Alban-Anlage 66 4052 Basel Switzerland
Tel: +41 61 683 77 34 Fax: +41 61 302 89 18
www.mdpi.com ISBN 978-3-03921-394-8