development and preservation of a cocktail beverage
116
DEVELOPMENT AND PRESERVATION OF A COCKTAIL BEVERAGE PRODUCED FROM CARROT (Daucus carrota), PINEAPPLE (Ananas comosus) AND MANGO (Mangifera indica L,) A thesis presented to the SCHOOL OF NUCLEAR AND ALLIED SCIENCES UNIVERSITY OF GHANA By BOATENG, AKWESI APPIAH ID – 10362184 BSc. Food Science and Technology, KNUST In partial fulfillment of the requirements for degree of MASTER OF PHILOSOPHY IN RADIATION PROCESSING July, 2013 University of Ghana http://ugspace.ug.edu.gh
-
Upload
khangminh22 -
Category
Documents
-
view
1 -
download
0
Transcript of development and preservation of a cocktail beverage

DEVELOPMENT AND PRESERVATION OF A COCKTAIL BEVERAGE
PRODUCED FROM CARROT (Daucus carrota), PINEAPPLE (Ananas comosus)
AND MANGO (Mangifera indica L,)
A thesis presented to the
SCHOOL OF NUCLEAR AND ALLIED SCIENCES
UNIVERSITY OF GHANA
By
BOATENG, AKWESI APPIAH
ID – 10362184
BSc. Food Science and Technology, KNUST
In partial fulfillment of the requirements for degree of
MASTER OF PHILOSOPHY
IN
RADIATION PROCESSING
July, 2013
University of Ghana http://ugspace.ug.edu.gh

i
DECLARATION
I, Akwesi Appiah Boateng, hereby declare that this thesis is a compilation of research
results conducted by me and to the best of my knowledge, it contains no material
previously published by another person nor material which has been accepted for the
award of any other degree of the University, except where due acknowledgement has
been made in the text.
………………………………………………..
AKWESI APPIAH BOATENG (Student)
…………………………….
Date
…………………………………………………..
PROF. (MRS.) VICTORIA APPIAH (Principal Supervisor)
………………………………..
Date
……………………………………………………
DR. P. K. SAALIA (Co-Supervisor)
……………………………….
Date
University of Ghana http://ugspace.ug.edu.gh

ii
DEDICATION
I dedicate this work to Madam Adwoa Konadu Boateng and Miss Naa Anyankobea
Ofori, who have been of immense help throughout my education to this level. I am very
grateful for their involvement and encouragement in my life for which I know God will
surely bless them plentifully.
University of Ghana http://ugspace.ug.edu.gh

iii
ACKNOWLEDGEMENT
I am full of praise for Jehovah God for enabling me reach such a point like this in my
career, having bestowed on me grace and favour to go through this programme of study. I
am grateful to my supervisors; Prof. Victoria Appiah, Dr. F. K. Saalia and Mr. Abraham
Adu-Gyamfi for their dedication and unflinching support throughout this thesis. I am
grateful to them for all their inputs and corrections. I would also like to show my
appreciation to Mr. Derry Dontoh, Mr. Armah and all their colleagues in the Testing
Department of Ghana Standards Authority, Mr. Emmanuel Addo and his colleagues at
the Nutrition Department of Noguchi Memorial Institute for Medical Research for their
immense help in analysing the cocktail beverage. Finally, I would like to acknowledge all
who endeavoured to assist me one way or the other, God bless them all.
University of Ghana http://ugspace.ug.edu.gh

iv
TABLE OF CONTENTS
Declaration………………………………………………………………………………..i
Dedication………………………………………………………………………………..ii
Acknowledgement..……………………………………………………………………..iii
Table of Content………………………………………………………………………...iv
List of Appendices……………………………………………………………………...x
List of Tables………………………………………………………………………….xiii
List of Figures………………………………………………………………………….xiv
List of Plates…………………………………………………………………………….xv
Abstract………………………………………………………………………….……..xvi
CHAPTER ONE
TITLE PAGE
TITLE PAGE
1.0 INTRODUCTION……………………………………………………………...…….1
1.1 Rationale…………………………………………………………………………..…4
1.2 General Objective……………………………………………………………………4
1.2.1 Specific Objectives………………………………………………………………5
University of Ghana http://ugspace.ug.edu.gh

v
CHAPTER TWO
2.0 LITERATURE REVIEW…………………………………………………………….6
2.1 Beverages…………………………………………………………………………..6
2.1.1 Carbonated drinks……………………………………………………………..6
2.1.2 Nectar………………………………………………………………………….6
2.1.3 Sports Drink…………………………………………………………………...7
2.1.4 Energy Drinks…………………………………………………………………7
2.1.5 Juice………………………………………………………………………… 8
2.1.5.1 Health Benefits of Juices……………………..………..…………………8
2.1.5.2 Juice Blending………………………………………………………...….9
2.2 The role of beverages in obesity……………………………….............................10
2.3 Juice Microflora…………………………………………………………………..11
2.4 Safety of fruit and vegetable juices……………………………………………….14
2.5 Carrot (Daucus carota): Distribution, Nutrient Composition and Uses…………..16
2.6 Mango (Mangifera indica): Distribution, Nutrient Composition and Uses….…....17
2.7 Pineapple (Ananas comosus): Distribution, Nutrient Composition and Uses……..18
2.8 Preservation………………………………………………………………..………21
2.8.1 Chemical Preservation………………………………………………………...21
University of Ghana http://ugspace.ug.edu.gh

vi
2.8.1.1 Benzoates…………………………………………………………………..21
2.8.1.2 Sorbates…………………………………………………………………….21
2.8.2 Physical preservation………………………………………………………...22
2.8.2.1 Thermal Pasteurization………………………………………………….22
2.8.2.2 Pulsed Electric Field Treatment (PEF)………………………………….23
2.8.2.3 High Hydrostatic Pressure (HHP)……………………………………….24
2.8.2.4 Irradiation………………………………………………………………...24
2.8.2.4.1 Irradiation of juices…………………………………………………..25
2.9 Quality Issues…………………………………………………………………….26
2.10 Colour…………………………………………………………………………...26
2.11 Ghana Standards for Fruit Juices (GS 724:2003)……………………………….27
2.12 Ghana Standards for Vegetable Juices (GS 725:2003)………………………….27
CHAPTER THREE
3.0 MATERIALS AND METHODS……………………………………………….…..29
3.1 Source of Raw Materials…………………………………………………………29
3.2 Survey on the Beverage Consumption Patterns in the Anyaa-Sowutuom District in
the Greater Accra Region of Ghana………………………………………………….29
3.3 Juice Extraction………………………………………………………………..…30
University of Ghana http://ugspace.ug.edu.gh

vii
3.3.1 Carrot Juice…………………………………………………………………..30
3.3.2 Pineapple juice……………………………………………………………….30
3.3.3 Mango juice………………………………………………………………..…30
3.4 Development of Composite Juice Formulations………………………………….30
3.4.1 Consumer acceptance test………………………………………………...….33
3.4.2 Determination of the optimum components formulation…………………….34
3.5 Preservation treatments…………………………………………………………...35
3.5.1 Chemical preservation………………………………………………………..35
3.5.2 Irradiation…………………………………………………………………….36
3.6 Analytical Procedure for Shelf-life Study………………………………………...36
3.6.1 pH……………………………………………………………………………..36
3.6.2 Titratable Acidity……………………………………………………………...37
3.6.3 Mineral Analysis……………………………………………………………....37
3.6.4 Pro-Vitamin A (Beta carotene)………………………………………………..38
3.6.5 Vitamin C……………………………………………………………………..38
3.6.6 Colour Determination………………………………………………………...38
3.6.7 Microbial Analyses…………………………………………………………...38
3.6.7.1 Total plate Count……………………………………………………………38
3.6.7.2 Yeasts and Moulds………………………………………………………….39
3.6.7.3 Total Coliforms (Presumptive Test)………………………………………..39
University of Ghana http://ugspace.ug.edu.gh

viii
3.6.7.4 Staphylococcus aureus…………………………………………………….39
3.7 Experimental Design and Statistical Analysis……………………………………40
CHAPTER FOUR
4.0 RESULTS AND DISCUSSIONS…………………………………………………..41
4.1 Survey of Consumers about the Consumption Patterns of Beverages in the Anyaa-
Sowutuom District of Ghana…………………………………………………………41
4.1.1 Demographics of respondents……………………………………………….41
4.1.2 Consumption of beverage……………………………………………………41
4.1.3 Criteria for choice of juice as a beverage……………………………………42
4.1.3.1 Effect of gender…………………………………………………………42
4.1.3.2 Effect of consumers age………………………………………………..43
4.1.4 Summary of observation from consumer survey…………………………….43
4.2 Formulation of the cocktail beverage…………………………………………….44
4.2.1 Screening for proportions of components in formulation……………………44
4.2.2 Optimization of the component proportions in the formulations…………...44
4.2.3 Sensory analysis……………………………………………………………...45
4.2.3.1 Colour……………………………………………………………………45
4.2.3.2 Taste……………………………………………………………………...47
4.2.3.3 Flavour……………………………………………………………………48
University of Ghana http://ugspace.ug.edu.gh

ix
4.2.3.4 Aftertaste…………………………………………………………………..49
4.2.3.5 Overall acceptability……………………………………………………….50
4.2.4 Region of optimum formulation…………………………………………….51
4.3 Shelf-Life Analysis…………………………………………………………….…52
4.3.1 Minerals……………………………………………………………………...52
4.3.2 Vitamin C………………………………………………………………….…53
4.3.3 Pro – Vitamin A………………………………………………………………56
4.3.4 pH and Titratable acidity……………………………………………………...57
4.3.5 Total Soluble Solids (TSS)……………………………………………………60
4.3.6 Colour…………………………………………………………………………61
4.3.6.1 Colour L*……………………………………………………………………61
4.3.6.2 Colour a*……………………………………………………………………62
4.3.6.3 Colour b*……………………………………………………………………62
CHAPTER FIVE
5.0 CONCLUSIONS AND RECOMMENDATIONS…………………………………63
5.1 Conclusions………………………………………………………………………63
5.2 Recommendation…………………………………………………………………64
REFERENCES
List of References………………………………..……………………………………..65
University of Ghana http://ugspace.ug.edu.gh
x
APPENDICES
APPENDIX1A
QuestionnairetoestablishthebeverageconsumptionpatternintheAnyaa‐
SowutuomDistrictoftheGreaterAccraRegion………………………………………..............80
APPENDIX1B
Table1.1Frequenciesofsomeresponsesofsurvey…………………………….…….............82
APPENDIX1C
Crosstablesofrespondentsagainstproductcharacteristics
Table1.2Gender*HowOftenDoYouDrinkFruit/VegetableJuices?…...………...84
Table1.3Gender*WhyDoYouDrinkFruit/VegetableJuices?…………………...….84
Table1.4Gender*AreYouWillingToTryNewFruit/VegetableJuice
Product?.....…………….……………………………………………………………….................................85
Table1.5Gender*WhatCharacteristicAttributesDoYouLookForIn
Juices?………………………………………………………………………………………………………......85
Table1.6Gender*DoYouKnowOfAnyHealthProblemswithJuice
Consumption?………………………………………………………………………………………………..85
Table1.7Gender*DoYouKnowOfAnyGoodHealthClaimsWithJuice
Consumption?…………………………………………………………………………………………...........86
Table1.8AgeGroup*HowOftenDoYouDrinkFruit/VegetableJuices?……….…...86
Table1.9AgeGroup*WhyDoYouDrinkFruit/VegetableJuices?....…………………..86
University of Ghana http://ugspace.ug.edu.gh

xi
Table1.10AgeGroup*AreYouWillingToTryNewFruit/VegetableJuice
Products?………………………………………………………………………………………………….........87
Table1.11AgeGroup*WhatCharacteristicAttributesDoYouLookForIn
Juices?………………………………………………………………………………………………………........87
APPENDIX 2A
Sensory evaluation form………………………………………………….......................88
APPENDIX 2B
Protocol for Sensory Evaluation of Ten Formulations Using Balanced Incomplete Block
Design…………………………………………………………………………………..89
Appendix3A
AnovaSummaryforShelf‐LifeStudy
Table1.12AnalysisofVarianceforpH‐TypeIIISumsofSquares……………………....91
Table1.13AnalysisofVarianceforTTA‐TypeIIISumsofSquares…………………….91
Table1.14AnalysisofVarianceforTSS‐TypeIIISumsofSquares……………………..92
Table1.15AnalysisofVarianceforVitaminC‐TypeIIISumsofSquares…………….92
University of Ghana http://ugspace.ug.edu.gh

xii
Table1.16AnalysisofVarianceforcolourL*‐TypeIIISumsofSquares……………..92
Table1.17AnalysisofVarianceforcoloura*‐TypeIIISumsofSquares……………..93
Table1.18AnalysisofVarianceforcolourb*‐TypeIIISumsofSquares……………..93
Table1.19AnalysisofVarianceforPro‐VitaminA‐TypeIIISumsofSquares……....94
Table1.20Anovasummaryofformulation(optimizationphase)…………………………94
APPENDIX3B
Table1.21Microbialcounts(cfu/g)forthedifferenttreatmentsduringstorage…..95
University of Ghana http://ugspace.ug.edu.gh
xiii
LIST OF TABLES
Table 2.1 Microorganisms related to spoilage in fruit juices………………………..…13
Table 3.1 Lower and upper limits of compositional ratio of juice (optimization)…..….31
Table 3.2 Compositional ratio of ten possible formulations (optimization)……………32
Table 4.1 Mean score value (optimization phase)…………………………………...….45
Table 4.2 Proximate composition of final juice ( p e r 1 0 0 m l ) and corresponding
values for mango, pineapple and carrot based on literature (per 100g)………………...53
Table 4.3 Degradation rates for ascorbic acid in the Cocktail beverage during storage..56
University of Ghana http://ugspace.ug.edu.gh

xiv
LIST OF FIGURES
Figure 3.1 Design matrix for the 3-component mixture formulations…………………33
Figure 4.1 Mixture Contour Plots for Colour of the Composite Juice Formulation…...47
Figure 4.2 Mixture Contour Plots for Taste of the Composite Juice Formulation…….48
Figure 4.3 Mixture Contour Plots for Flavour of the Composite Juice Formulation…..49
Figure 4.4 Mixture Contour Plots for Aftertaste of the Composite Juice Formulation...50
Figure 4.5 Mixture Contour Plots for Overall Acceptability of the Composite Juice
Formulation…………………………………………………………………….……….51
Figure 4.6 Overlaid Contour Plot (Optimization) of the Composite Juice Formulation..52
Figure 4.7 Ascorbic Acid Content of Beverage Given Different Treatments during
storage period………………………………………………………………………...…55
Figure 4.8: Pro-Vitamin A Content of Beverage Given Different Treatments during
storage period…………………………………………………………………………...57
Figure 4.9: pH of Beverage Given Different Treatments during storage period………..59
Figure 4.10: Percentage Titratable Acidity of Beverage Given Different Treatments
during storage period…………………………………………………………….……...59
Figure 4.11: Total Soluble Solids of Beverage Given Different Treatments during storage
period…………………………………………………………………………….……...60
University of Ghana http://ugspace.ug.edu.gh

xv
LIST OF PLATES
Plate 1. Photograph of the optimised juice…………………..…………………………35
University of Ghana http://ugspace.ug.edu.gh

xvi
ABSTRACT
Carrot is known to have the potential of providing vital nutrition as well as health and
well-being to consumers. In this study, carrot juice was envisaged as a good vehicle for
spreading its nutraceutical benefits. The study was then designed in two parts: (a) Survey
to establish the beverage consumption pattern in the Anyaa-Sowutuom District in the
Greater Accra Region of Ghana and (b) Carrot juice formulation and optimisation. The
survey was conducted by administering a questionnaire to volunteer adult consumers. To
develop an acceptable carrot juice beverage, pineapple juice and mango juice were
included as components to improve taste and flavour respectively. A constrained, simplex
centroid mixture design for three components was employed to optimise the proportions
of the components in the final product based on sensory attributes. Chemical analyses as
well as shelf stability studies were conducted for the optimised beverage preserved by
chemicals and gamma radiation. Data obtained from the survey revealed that juices were
very popular among consumers. The choice of a particular beverage was dependent
on nutrition, taste and colour. Contour plots generated from sensory data of the products
were overlaid to determine the optimum ratios of the components of the cocktail
beverage. The optimised product consisted of 50-52 % Carrot, 18-20 % Pineapple and
28-30 % Mango. Analysis of the beverage revealed 223 mg/100ml Potassium, 3.92
mg/100ml Pro-vitamin A (Beta carotene) and 43 mg/100ml Vitamin C. After 8 weeks of
storage 77 % Pro-vitamin A was retained in products chemically treated and as well as
products irradiated at 1 kGy. However, about 60 % of this same nutrient was retained
even under relatively higher dose (2.5 kGy) of gamma radiation. The microbial quality of
the beverage was good under all conditions studied.
University of Ghana http://ugspace.ug.edu.gh

1
CHAPTER ONE
1.0 INTRODUCTION
High levels of fruit and vegetable consumption from epidemiological studies have
suggested a reduction in the risk of developing diseases, particularly cancers,
cardiovascular diseases (CVD), metabolic disorders and stroke (Sauvaget et al., 2003;
Joshipura et al., 2001; Knekt et al., 2001). Reduced overall risk of cancer mortality in
Japanese populations has been associated with increased consumption of fruit and
vegetables (Huang et al., 2004; Suzuki et al., 2002).
Fruit and vegetable juice intake has been recommended as healthy diet and has various
health effects (Song et al., 2006). Increased consumption of fruits and vegetable juices and
a reduced consumption of sweetened beverages are some healthy dietary behaviors related
to lower chronic disease risk (Pittler and Ernst, 2004 ) and body weight (Schulze et al.,
2004).
Carrot is a worldwide nutritional vegetable with immense health benefits (Karangwa et al.,
2010). It is a very good source of beta carotene, a vitamin A precursor (World Carrot
Museum, 2012; Theodosiou et al., 2010; Strube and OveDragsted, 1999; Novotny et al.,
1995), besides its appreciable amount of Vitamin C, Vitamin B6, thiamine, Vitamin K,
Vitamin D, Vitamin E, folic acid and minerals (Dutta, 2011; Lintas, 1992). One medium
size carrot provides four times the Daily Value of vitamin A (California Foundation for
Agriculture in the Classroom, 2011).
University of Ghana http://ugspace.ug.edu.gh

2
Dietary consumption of foods rich in beta carotene have been reported to result in the
elevation of beta carotene levels in the skin and a decreased sensitivity to stimulated
sunlight (Kopcke and Krutmann, 2008; Stahl et al., 2000). Increasing the beta-carotene
consumption from 1.7 to 2.7 milligrams a day has been reported to reduce lung cancer risk
by more than 40 % (Dutta, 2011; Stahl and Sies, 2005) and breast cancer is five to eight
times less likely to develop in women who eat raw carrots (Dutta, 2011; Health Online
Zine, 2010). Eating fiber rich carrots is also believed to reduce the risk of colon cancer by
as much as 24 % (Carrot Nutrition Facts and Health Benefits, 2012; Dutta, 2011).
Falcarinol, a polyacetylene found in carrots has been found to reduce the rate of cancerous
cells development (Purup et al., 2009). Carrot is also a very good source of phytonutrient
antioxidants such as alpha/beta-carotenes, lutein, ferulic acid and cyanidins which are
believed to suppress lipid peroxidation (Potter, 2011), fight against free radicals to slow
down the aging of cells and consequently other negative effects associated with aging
(California Foundation for Agriculture, 2011).
Calcium pectate, a pectin fibre that has been found to have cholesterol lowering properties
is also found in carrots (World Carrot Museum, 2012; Dutta, 2011). In a study on the
therapeutic value of carrots, cholesterol levels were reduced by 11% when seven ounces of
raw carrots a day were taken for three weeks (Organic Information Services, 2012). Dutta
(2011) and Metzger and Barnes (2009) found that people who consumed carrots daily had
one third the risks of heart attacks than those who did not.
University of Ghana http://ugspace.ug.edu.gh
3
Carrot juice has diuretic properties which help the body to eliminate excess fluid and keep
infections and diseases at bay as well as preventing thread worms in children (Dutta,
2011). Consumption of this juice can pull heavy metals from fatty tissues and detoxify the
body (Natural Home and Garden, 2011).
Carrot juice however is less acidic and has little flavour hence it is mostly blended with
other fruits to enhance its acidity and flavour.
Pineapple (Ananas comosus) has long been one of the most popular of the non-citrus
tropical and subtropical fruits, largely because of its immense vitamin C content, attractive
flavour and refreshing sugar–acid balance (Deka, 2000). Pineapple juice is largely
consumed around the world, mostly as a canning industry byproduct, concentrate and in
the blend composition to obtain new flavours in beverages and other products (Awsi and
Dorcus, 2012).
Mango (Mangifera indica L.) is a phytochemically dense fruit with high levels of
carotenoids (all-trans-violaxanthin and all-trans-beta-carotene) and phenolic compounds
(White gallic acids, Caffeic acids, Tannic acids) (Talcott et al., 2005; Schieber et al.,
2000). It is a widely consumed fruit particularly appreciated for its fresh flavour,
appreciable vitamins and antioxidants (Deka and Sethi, 2001).
Juice blending is one of the best methods to improve the nutritional quality of juices. It can
improve the vitamin and mineral content depending on the kind and quality of the fruits
and vegetables used (De Carvalho et al., 2007). Aside the nutritional quality improvement,
University of Ghana http://ugspace.ug.edu.gh

4
blending can also improve the sensory and flavour characteristics of the juice as well as
enhancing new product development (Jain and Khurdiya, 2004; Akinwale, 2000).
1.1 Rationale
Foods rich in beta-carotene are not only good sources of Vitamin A but may also help
prevent cancer and other diet related and lifestyle diseases (Purup et al., 2009). The
growing consumer awareness on the influence of eating habits to their health has increased
the demand for functional food products (Quarcoo, 2008). Gradually there has been a
paradigm shift as there is an overall increase in natural juice consumption as an alternative
to traditional caffeine containing and carbonated beverages (Adubofour et al., 2010).
Food manufacturers continue to seek for product innovations geared towards the
development and commercialization of functional foods. Production of fruits and vegetable
juices has become an increasing interest of the beverage industry all over the world due to
their low energy value and as an important source of vitamins and minerals (Awsi and
Dorcus, 2012).
In recent years, a steady increase in carrot juice consumption has been reported in many
countries (Schieber et al., 2001). Development of this cocktail beverage will not only
enhance the health of the people but create employment, wealth and also solve problems of
post-harvest losses.
1.2 General Objective
The main objective of this project was to develop a consumer acceptable, beta carotene rich
mixed fruit juice drink using carrots, mangoes and pineapples.
University of Ghana http://ugspace.ug.edu.gh

5
1.2.1 Specific Objectives
i. To carry out a survey to determine the beverage consumption pattern in the Anyaa-
Sowutuom district in the Greater Accra region.
ii. To formulate a mixed fruit beverage with carrots, mangoes and pineapples.
iii. To assess the acceptability of the product using a consumer panel.
iv. To enhance the keeping quality of the final composite juice using chemical
preservatives and gamma radiations.
University of Ghana http://ugspace.ug.edu.gh

6
CHAPTER TWO
2.0 LITERATURE REVIEW
2.1 Beverages
Beverages are simply drinks other than water (Encarta, 2009). They can be divided into
two main categories; alcoholic (Beer, wine) and non-alcoholic beverages (Juices, tea,
soda). The latter can further be subdivided into carbonated (coca cola, soda) and non-
carbonated beverages (Juices, energy drink, tea). They are very essential to the
physiological functions of the body as they are good sources of water and other stimulants
(Ihekoronye and Ngoddy, 1985).
2.1.1 Carbonated drinks
These are sweetened, non-alcoholic drinks containing carbon dioxide. It excludes tea-based
products and any products meeting specific sports or energy performance-enhancing
claims. Syrups for home and out-of-home carbonated soft drink dispensers can also be
grouped under carbonated drinks (www.wikipedia.org, 2008).
2.1.2 Nectar
This is a diluted fruit/vegetable juice and pulp, to which sweetening agents, permitted
minerals and vitamins for the purpose of fortification and permitted additives may be
added. If flavours or colourings from sources other than the reconstituted fruits are
included in the product, it cannot be categorized as nectar regardless of its juice content. It
may contain pulp and cells from the same kind of fruit. While juice content is required to
University of Ghana http://ugspace.ug.edu.gh

7
be equal to or in excess of 25% by volume, minimum juice content varies according to the
fruit in question (www.wikipedia.org, 2008).
2.1.3 Sports Drink
A sport drink is a beverage designed to help athletes rehydrate, as well as replenish
electrolytes, sugars and other nutrients that are lost or depleted after strenuous
exercise, training or competition (Berning et al., 1998). Sports drinks are performance-
enhancing products, described as isotonic (in balance with), hypotonic (lighter than) or
hypertonic (heavier than) to body fluids. They are popular among athletes because they
provide the necessary electrolytes to support extended exercise. They help keep the body
balanced and contain the right amount of electrolyte in the fluids (Berning et al., 1998).
Products must contain sodium citrate (acidity regulator), sweetening agents and either
glucose or dextrose, and minerals such as calcium dicitrate, potassium chloride,
magnesium phosphate or zinc sulphate (Sawka, 2007; www.wikipedia.org, 2008).
2.1.4 Energy Drinks
These are energy-enhancing products, mainly carbonated and containing taurine, guarana,
glucose, caffeine and other exotic herbs and substances, as well as added minerals and
vitamins. The category includes still or carbonated, ready to drink products, non-ready to
drink powders and concentrates (Finnegan, 2003; Reyner and Horne, 2002).
University of Ghana http://ugspace.ug.edu.gh

8
2.1.5 Juice
Codex Alimentarius (2005) defines juice as “the fermentable but unfermented juice,
intended for direct consumption, obtained by the mechanical processing of sound, ripe
fruits/vegetables, preserved exclusively by physical means. The juice must have the
characteristic colour, flavour and taste typical of the fruit/vegetable from which it comes. It
may be turbid or clear.
The juice may have been concentrated and later reconstituted with water suitable for the
purpose of maintaining the essential composition and quality factors of the juice. The
addition of sugars or acids can be permitted but must be endorsed in the individual
standard (Song et al., 2006; www.wikipedia.org, 2008).
2.1.5.1 Health Benefits of Juices
In many communities among the developed countries, juices are becoming an important
part of their diet. They act as a nutritious beverage and play a significant part in a healthy
diet as they offer good taste and a variety of nutrients found naturally in fruits and
vegetables.
Hundred percent (100%) fruit and vegetable juices provide a range of nutrients including
vitamins and minerals such as vitamin C, folate, potassium and antioxidants. They contain
many of the nutrients of their vegetable/fruit origin but have lower fibre contents.
Vegetable juices may be considered a healthier alternative to fruit juices as they have fewer
kilojoules (less carbohydrate) but usually have more sodium (Deanna and Jeffrey, 2007;
Franke et al., 2005).
University of Ghana http://ugspace.ug.edu.gh

9
Beta carotene, the famous ingredient in carrots, is an anti-oxidant that has powerful healing
virtues for many diseases and also lowers the risk of some lung and colon cancers. It is also
an excellent drinkable source of potassium, which is very important in helping to maintain
a healthy electrolyte balance and fluid level in the cells of the body. Lower cholesterol
levels in the serum have also been attributed to pectin in carrots (World carrot museum,
2012).
Orange juice is rich in vitamin C, folic acid, potassium, and an excellent source of
bioavailable antioxidant phytochemicals (Franke, et al., 2005). It significantly improves
blood lipid profiles in people affected with hypercholesterolemia (Reyner and Horne,
2002).
Cranberry juice has long been known to help prevent or even treat bladder infections, and
it is now known that a substance in cranberries prevents bacteria from binding to the
bladder (Kurowska et al., 2000).
Fruit juices are known to raise serum antioxidant capacity and offset the oxidative stress
and inflammation normally caused by high-fat and high-sugar meals (Ghanim et al., 2010).
Fruit juice intake has been consistently associated with reduced risk of many cancer types
(Brock et al., 1988) and delay the onset of Alzheimer's disease (Dai et al., 2006).
2.1.5.2 Juice Blending
Blending of fruits and vegetable juices has proven to improve the nutritional profile of
juices. Carrots are a very good source of beta carotenes, pineapples and oranges are rich in
University of Ghana http://ugspace.ug.edu.gh

10
vitamin C and other natural antioxidants (Karangwa et al., 2010), mangoes are rich in fibre
and moringa leaves have been reported to have high amounts of essential amino acid with
the right balance, as well as high amounts of minerals and vitamins (Fuglie, 1999). Mixing
two or more kinds of fruits/vegetables can result in a product with more vitamins and
minerals and with different sensory and flavour characteristics when compared to the raw
materials (Jain and Khurdiya, 2004; Rodrigo et al., 2003; Akinwale, 2000).
2.2 The role of beverages in obesity
Obesity has been described as having a body weight more than 20 percent greater than
recommended for the relevant height (Encarta, 2009). A decrease in the amount of calories
consumed while maintaining or increasing physical activity has been found to control this
condition (Baranowski et al, 2000). The cause of obesity is not a single food or food group
as often portrayed. While many factors can influence an individual’s weight, the
maintenance of body weight requires a balance between total energy ingested and total
energy expended. Increases in body weight and body fat content occur only when chronic
energy intake exceeds energy expenditures (Dietz, 1998).
The prevalence of overweight and obesity among children in Saudi Arabia has previously
been reported to be between 8-14% and 6-17% respectively (El-Hazmi and Warsy, 2002;
Farghaly et al., 2007). Obesity is a risk factor for cardiovascular disease (Bray and Gray,
1988), diabetes (Bray et al., 2008) and certain types of cancer (Fair and Montgomery,
2009). It can also be associated with non-fatal but debilitating illnesses such as respiratory
difficulties and infertility (Dietz, 1998).
University of Ghana http://ugspace.ug.edu.gh

11
Non-alcoholic beverages may also contain added natural or artificial sugars such as
sucrose, fructose, aspartame and sorbitol for purposes of preservation or taste
enhancement. In the United States of America where obesity is on the rise, a positive
correlation has been established between increased consumption of sugar sweetened
beverages and high calorie content (Ebbeling et al, 2006). Regular soft drinks and fruit
drinks contributed 7% of Americans’ total caloric intake during 1999-2000 (Block, 2004).
Again, caloric intake was positively associated with intake of non-diet carbonated soft
drinks in 1994 (Harnack et al., 1999).
As part of a prospective study conducted from 1991-1999 (Nurses’ Health Study II),
Schulze et al., (2004) collected self-reported weight and beverage intake information
multiple times from 51,603 women. Weight gains and increases in body mass index (BMI)
were highest among participants who increased their sugar-sweetened carbonated soft
drink intake from less than one drink per week to greater than one drink per day (P <
0.001). Weight gains and increases in BMI were lowest among women who decreased
their intake from more than one drink per day to less than or equal to one drink per week.
Similarly, increased intake of fruit punch was associated with significantly (P < 0.01).
greater weight gain than was decreased intake. Women who reported stable beverage
consumption had no significant weight gains (Schulze et al., 2004).
2.3 Juice Microflora
Fruit juices contain water, sugars, organic acids, vitamins, and trace elements which
provide an ideal environment for spoilage by microorganisms. They generally have a lower
pH (pH < 4.5), thus requiring their potential spoilage agents to be acid-loving
University of Ghana http://ugspace.ug.edu.gh

12
microorganisms (Keller and Miller, 2006). The most commonly encountered microbial
genera are Acetobacter, Alicyclobacillus, Bacillus, Clostridium, Gluconobacter,
Lactobacillus, Leuconostoc, Saccharobacter, Zymomonas, and Zymobacter (Vasavada,
2003).
Yeast are however predominant because of their high acid tolerance and the ability of
many species to grow anaerobically (Boekhout and Robert, 2003). Most spoilage yeasts are
highly fermentative, forming ethanol and CO2 from sugar, causing split cans and cartons,
and explosions in glass or plastic bottles. Amongst the spoilage yeasts, P. membranifaciens
is considered as the target microorganism for the optimization of thermal treatments of
juices because it is resistant to heat as well as to moderate amounts of salt, SO2, sorbic,
benzoic and acetic acids (Boekhout and Robert, 2003).
Acid-tolerant bacteria able to grow in juices include lactic acid bacteria (Lactobacillus and
Leuconostoc spp.) and acetic acid bacteria (Acetobacter and Gluconobacter spp.). Bacillus
species are known to cause flat-sour type spoilage in acidic fruit beverages. Production of
lactic acid without gas formation makes Lactobacillus plantarum, Lactobacillus brevis and
B coagulans resistant to thermal treatments (Vasavada, 2003; Boekhout and Robert, 2003).
Most spoilage incidents consist mainly of an off-flavour or odour production, with or
without sediment; sometimes discolouration or cloudiness occurs. Consumer complaints
are often the only reason for companies becoming aware of the problem, since the absence
of gas production make spoilage difficult to detect. The off-flavour and odour detected
have been attributed to the chemical compound guaiacal, (Steyn et al., 2011; Parish, 2006)
University of Ghana http://ugspace.ug.edu.gh

13
which has been described as medicinal, disinfectant-like, antiseptic, phenolic and smoky in
most cases. Alicyclobacillus acidoterrestris, a thermo-acidophilic endospore-forming
bacterium, emerged in large scale spoilage incidents in Germany, during which flat sour
type spoilage with offensive smelling medicinal or antiseptic characteristics were noted in
commercial pasteurized apple juice (Bevilacqua et al., 2011).
Table 2.1 Microorganisms related to spoilage in fruit juices. Microorganisms Spoilage Effects
Highly fermentative yeasts Production of ethanol and CO2 from sugar
Formation of biofilm
Bulging or exploding of containers
Acetobacter spp., Gluconobacter spp. Oxidation of ethanol
Fermentation
Turbidity
Lactobacillus spp., Leuconostoc spp. Sour or off-taste
Buttermilk off-flavour
Gummy slime or ropiness
Production of acetic acid, CO2, ethanol
Clostridium spp. Production of gas
Strong butyric odour
Increased acidity
A. acidoterrestris spp. Phenolic or antiseptic odour
Off-flavour with or without light sediment or
University of Ghana http://ugspace.ug.edu.gh

14
slight haze
Bacillus spp. Flat sour
Zymomonas spp., Saccharobacter
spp., Zymobacter spp.
Ethanol production
Heat resistant moulds Off-flavour or odour like “stale” or “old”
Development of a mycelial material
Reduction in sugar content
Mycotoxin production
Source: Bevilacqua et al.,(2011).
2.4 Safety of fruit and vegetable juices
Over 1700 people in North America fell ill in the last decade after consuming juice and
cider. Most of these outbreaks involved unpasteurized juices such as apple, orange, lemon,
pineapple, carrot, coconut, cane sugar, banana, acai and mixed fruit juices (Vojdani et al.,
2008). The most common pathogens were Escherichia coli O157:H7, Salmonella sp., and
Cryptosporidium. A few other outbreaks were due to Vibrio cholerae, Clostridium.
botulinum and yeasts (Keller and Miller, 2006).
Salmonella infections have most often been associated with animal derived foods, such as
seafood, egg products, meat, and dairy foods rather than juices. However, outbreaks
associated with fresh juice have occurred as far back as 1922. Early outbreaks resulting in
typhoid fever were associated with poor hygiene by food handlers (Vojdani et al., 2008).
University of Ghana http://ugspace.ug.edu.gh
15
Outbreaks of typhoid fever have become far less common in developed countries as
disinfection of water, sanitation procedures, and hygiene practices have improved.
Nonetheless, given the dramatic increase of fresh fruit imported from developing countries,
typhoid fever outbreaks associated with these commodities remain a concern (Parish,
2006).
More recent outbreaks of non-typhoidal salmonellosis in fresh juice have been attributed to
fecal-associated contamination of fruits and vegetables or poor processing practices. In
2005, 152 cases of Salmonella typhimurium infection associated with commercially
distributed unpasteurized orange juice were reported in the USA (Raybaudi-Massilia et al.,
2009).
Several species of moulds are capable of producing different mycotoxins in fruit juices.
Mycotoxins, particularly patulin, represent a potent food safety hazard. Some moulds, e.g.
Penicillium expansum, P. griseofulvum, P. roqueforti, P. funiculosum, P. claviforme, P.
granulatum, and Byssochlamys spp., produce patulin in apple juice, while others, such as
Neosartorya produce fumitremorgins, terrein, verruculogen, and fischerin. Byssochlamys
species also produce byssotoxin A and byssochlamic acid. Other mycotoxins produced in
fruit juice by moulds include ochratoxin A, citrinin, and penicillic acid (Vasavada, 2003).
Although not implicated in foodborne outbreaks associated with fresh juices, another
important pathogen is Listeria monocytogenes. It has the ability to grow at conventional
refrigeration temperatures and under acidic conditions. It is ubiquitous within the
environment, carried by animals, and frequently found on fruits (Keller and Miller, 2006).
University of Ghana http://ugspace.ug.edu.gh

16
The minimum pH for growth of L. monocytogenes is dependent on the acidulant. For malic
acid, the lowest pH value for growth is from 4.4 to 4.6 depending on the strain. This
pathogen causes listeriosis, a serious disease with complications including meningitis,
septicemia and spontaneous abortion in pregnant women (Keller and Miller, 2006;
Vasavada, 2003).
2.5 Carrot (Daucus carota): Distribution, Nutrient Composition and Uses
Carrot originates from the wild forms growing in Europe and southwestern Asia (Banga
and Simmonds, 1984). The western type of cultivated carrot is thought to derive from the
anthocyanin-containing forms found in Afghanistan. Cultivation of carrot spread to Europe
in the fourteenth century. The first cultivated carrot types were purple or violet, yellow
and later orange types were derived from this anthocyanin type by selection. The
orange-coloured form was selected in the Netherlands in the early seventeenth century.
In 1998, 18.5 million tonnes of carrots were produced worldwide in an area of 794,000
hectares (FAO 1999). On a global scale, carrot is only a minor crop, but in northern
countries of Europe, it is one of the major field vegetables. In Finland in 1995–1998, the
yearly production area of carrot ranged from 1650 to 1954 hectares, which makes carrot
the most common field vegetable after garden pea (Information Centre of the Ministry of
Agriculture and Forestry, 1999).
University of Ghana http://ugspace.ug.edu.gh

17
2.6 Mango (Mangifera indica): Distribution, Nutrient Composition and Uses
The mango fruit is one of the most popular fruits for millions of people in the world. It is
considered to be the choicest of all indigenous fruits in tropical areas. Mango as an
emerging tropical fruit is produced in over 90 countries worldwide with production of over
28.51 million metric tonnes in 2005. Asia accounts for approximately 77% of global
mango production, and the Americas and Africa account for approximately 13% and 9%,
respectively (FAOSTAT, 2007). Currently, only about 3% of the world production of
mango is traded globally representing a noticeable increase over the quantities traded 20
years ago (Evans, 2008).
Mango grows in a slightly acidic (5.5-7.5) and well-drained soil, whether it is sandy, loam
or clay (Botting et al., 1999). It is somewhat tolerant to alkalinity (Kadman et al., 1976).
Mango is also drought-tolerant, and can withstand occasional flooding (Singh, 1960). For
best flowering and fruit set, good timely rainfall is necessary rather than the total rain fall.
Temperature plays an important role in mango flowering and its influence varies with
cultivars (Schaffer et al., 1994). Temperatures in the range of 24-30 °C are required for
best flowering; however, during fruit development if sufficient water is provided the tree
can withstand up to 48 °C.
In Ghana, fruits and vegetables are abundantly produced during peak seasons but due to
lack of proper storage and preservation facilities, the market becomes overstocked during
such seasons and a large proportion get rotten before reaching the final consumer.
University of Ghana http://ugspace.ug.edu.gh

18
Alzamora et al., (2000) reported that about 30-50% of fruits and vegetables harvested in
developing countries including Ghana are never consumed due to spoilage during
transportation, storage and processing.
Mango is a phytochemically dense food with high levels of carotenoids and phenolic
compounds (Talcott et al., 2005; Schieber et al., 2001; Schieber et al., 2000). Gowda and
Huddar, (2000) examined eight (8) tropical fruits and showed that ripe mango had the
highest gallic acid content and total polyphenolics compared with the other fruits.
Mercandante and Rodriquez-Amaya (1998) found all-trans-violaxanthin to be the
predominant carotenoid in mangoes followed by all-trans-β-carotene. Botting et al., (1999)
examined the antimutagens in 25 plant foods, using the Salmonella typhimurium
mutagenicity assay against heterocyclic amine 2-amino-3-methylimidazo. Data obtained
from that study indicated strong antimutagenic properties in several plants, including
mango. The presence of polyphenolics, carotenoids, and antimutagens in mango suggests
significant anticancer activity.
2.7 Pineapple (Ananas comosus): Distribution, Nutrient Composition and Uses
Pineapple, a tropical plant with edible multiple fruit consisting of coalesced berries, is the
most economically important plant in the Bromeliaceae family (Mynott et al., 1999). It is
an herbaceous perennial which grows to 1.0 to 1.5 meters (3.3 to 4.9 ft) tall, although
sometimes it can be taller. The plant itself has a short, stocky stem with tough, waxy
leaves. When creating its fruit, it usually produces up to 200 flowers, although some large-
fruited cultivars can exceed this. The individual fruit of the flowers join together to form
University of Ghana http://ugspace.ug.edu.gh
19
what is commonly referred to as pineapple. After the first fruit is produced, side shoots
(suckers) are produced in the leaf axils of the main stem. These may be removed for
propagation or left to produce additional fruits on the original plant (Mynott et al., 1999).
Pineapples were discovered in South America and later dispersed into other regions of the
world by travelers and seafarers. It was introduced into the Philippines, Hawaii and Guam
during the early 16th century by Spaniards and reached India and the east and west coasts
of Africa by 1548. In 1594, it was reported growing in China and South Africa in 1655.
The successful dispersion of pineapples on a worldwide basis can be attributed to its ability
to tolerate drought and the relative ease with which vegetative propagation can be
established under cultivated conditions (Purseglove, 1972; Collins, 1960).
Pineapple is cultivated predominantly for its fruit that is consumed fresh or canned. It is a
good source of manganese and contains significant amounts of vitamins C and B1. It is
used as an ingredient in a variety of foods including pizzas, condiments, sweets, savouries,
cakes, pastries and ice creams (Medina and Garcia, 2005; Bartholomew et al., 2003;
Rohrbach et al., 2003; Purseglove, 1972).
Pineapples contain the proteolytic enzyme bromelain, which is used as a meat tenderizing
agent and for medical purposes. It has been reported to have valuable biological properties
such as interfering with the growth of malignant cells, inhibiting platelet aggregation,
fibrinolytic and anti-inflamatory action, enhancing drug absorption and removing skin
(Mynott et al., 1999; Gailhofer et al., 1998).
University of Ghana http://ugspace.ug.edu.gh

20
Ghana’s pineapple industry has grown significantly over the past twenty years.
Commercially produced pineapples are grown within a 50km radius of the capital, Accra.
From here they are shipped to export markets such as Germany, Holland and Italy by sea
or air. From 1994 to 1999, the total value of Ghana’s pineapple exports increased nearly
threefold, from US $5.3 million to US $15.5 million. Pineapple processing has also
increased, with a number of companies involved in manufacturing single-strength juice and
juice concentrate. In addition, Blue Skies Company recently established a plant for
processing pineapple into slices and mixed fruit salads
(www.freshplaza.com/news_detail.asp?id=704 , 2007).
2.8 Preservation
The high increase in food deterioration is due to contamination with micro-organisms since
the entire environment in which we live is colonized by micro-organisms (Nelson and
Tressler, 1981). Although micro-organisms are of great importance, these use human foods
as source of nutrient for their growth. This of course can result in the deterioration of food.
They do this by increasing their numbers, utilizing nutrients, producing enzymatic changes,
contributing to flavour by breaking down products and synthesis of new components.
To prevent this, micro-organisms must be eliminated from foods as this will aid in
preserving it (Ahmed et al., 1991).
University of Ghana http://ugspace.ug.edu.gh

21
2.8.1 Chemical Preservation
2.8.1.1 Benzoates
Benzoates, found naturally in cranberries, are bacteriostatic and fungistatic under acidic
conditions. They primarily inhibit growth of moulds, yeast and bacteria in acidic liquids
and drinks, such as vinegar, fruit juice, soda and carbonated beverages. Benzoates exist as
calcium, potassium and sodium salts. Sodium benzoate is used in foods with a pH below
3.6 such as soy sauce, duck sauce and salad dressings. Potassium benzoate is used to
preserve foods with a pH below 4.5 such as various fruit juices and soft drinks (FDA,
2009).
The FDA currently permits a maximum of 0.1% benzoate in foods. Soft drinks are the
number one source of sodium benzoate in the diet. On its own, it is not considered toxic,
and studies show no adverse health effects in humans under normal conditions. They
however form benzene which is carcinogenic when combined with ascorbic acid (Seager
and Slabaugh, 2000).
2.8.1.2 Sorbates
Sorbic acid and its salts (collectively known as sorbates) have antimicrobial activities and
also inhibit the growth of yeast and other fungi. Since the 1940s they have been found to
be effective antimicrobial agents and hence are used as preservatives in a wide range of
foods and drinks and, to a lesser extent, in certain cosmetics, pharmaceuticals and tobacco
products. The range includes foods such as cheese products, pickles, certain fish products,
carbonated beverages, margarine and certain fruit and vegetable products, including wine
(Dacosta, 1994; Thakur et al., 1994).
University of Ghana http://ugspace.ug.edu.gh

22
Sorbates are reported to be more efficient and less toxic than benzoate (Thakur et al.,
1994) and are classified as “Generally Recognized as Safe” (GRAS) additives by the
United States FDA (2005). They are also found in the list of additives permitted in foods
by the Food and Drugs Authority of Ghana (FDA Ghana, 2005).
Sorbic acid and its salts are practically tasteless and odourless in foods, when used at
reasonable levels (< 0.3 %) and their antimicrobial activity is generally adequate (Erich et
al., 2000).
Potassium sorbate, a white, fluffy powder, is very soluble in water and when added to acid
foods it is hydrolysed to the acid form. Sodium and calcium sorbates also have
preservative activities but their application is limited compared to that for the potassium
salt, which is employed because of its stability, general ease of preparation and water
solubility (Tulamait et al., 2005).
2.8.2 Physical preservation
2.8.2.1 Thermal Pasteurization
Pasteurization is the process of heating food, which is usually a liquid, to a specific
temperature for a predefined length of time and then immediately cooling it after it is
removed from the heat. This process slows spoilage due to microbial growth in the food.
Unlike sterilization, pasteurization is not intended to kill all micro-organisms in the food.
Instead, it aims to reduce the number of viable pathogens so they are unlikely to cause
disease. Commercial-scale sterilization of food is not common because it adversely affects
the taste and quality of the product (Montville and Matthews, 2005).
University of Ghana http://ugspace.ug.edu.gh

23
In the industry, fruit juices are currently treated with high temperature short time (HTST)
pasteurization in order to inactivate microorganisms and enzymes which cause food
deterioration. Conventional thermal pasteurization ensures safety and extends the shelf life
of juice, but it often leads to detrimental changes in the sensory qualities of the product
(Cortés et al., 2008). The FDA (2004) suggests pasteurizing fruit juice at 71°C for 3
seconds which results in a 5-log reduction of bacteria. Actual pasteurization conditions
should be chosen based on type of juice, pH, and sugar content which can all affect
microbial inactivation.
2.8.2.2 Pulsed Electric Field Treatment (PEF)
Pulsed electric field treatment (PEF) is an alternative preservation method primarily used
on fruit juice and milk (Heinz et al., 2002). The aims of PEF treatment are to inactivate
spoilage and pathogenic microorganisms, decrease the activity of enzymes, and extend the
shelf life of foods without undesirable heat and chemical effects (Cserhalmi et al., 2006).
PEF treatment applies extremely short (microsecond) and intense electric pulses which
create pores in the cell membranes of microorganisms in a process called electroporation.
Electroporation in a cell membrane can occur in both protein channels and lipid domains,
which lead to an osmotic imbalance and eventually, cell death (Tsong, 1991). The change
in membrane permeability can be reversible or irreversible, depending on the external
electric field strength (Cserhalmi et al., 2006). An increase in the demand for minimally
processed fresh-products has raised an interest in the development and implementation of
new techniques for food processing such as high-intensity pulsed electric fields (Aguiló-
Aguayo et al., 2007). In general, thermal pasteurization is the standard for juice processing
University of Ghana http://ugspace.ug.edu.gh

24
as it significantly reduces microorganisms, but it can adversely affect colour, taste, aroma,
appearance, and nutrient content of juice (Aguilar-Rosas et al., 2007).
2.8.2.3 High Hydrostatic Pressure (HHP)
High hydrostatic pressure (HHP) processing uses pressures up to 1000 MPa, with or
without heat, to inactivate harmful microorganisms in food products (Ramaswamy et al.
2005). High hydrostatic pressure has traditionally been used in non-food areas such as
ceramic and steel production. The application of HHP in the area of food started from
1900s when Hite and other researchers applied HHP on the preservation of milk, fruits and
vegetables. However, it took a long time for the commercial products to emerge in the
market. In 1990, the first HHP processed fruit jams were sold in the Japanese market.
Subsequently, HHP processed commercial products including fruit juices and beverages,
vegetable products, among others, have been produced in North America, Europe,
Australia, and Asia (Balasubramaniam et al., 2008).
2.8.2.4 Irradiation
Outbreaks of food borne diseases have been associated with consumption of poor quality
food. This is due to the presence of a large numbers of human pathogens in food.
Irradiation effectively inactivates food borne pathogens in contaminated foods.
High doses of irradiation may be required for the inactivation of some pathogens.
However, higher doses of radiation could have adverse effects on sensorial and nutritional
quality (Fan et al., 2004).
University of Ghana http://ugspace.ug.edu.gh

25
Gamma irradiation causes oxidative stress and affects biomolecules by causing
conformational changes, oxidation, rupture of covalent bonds and formation of free
radicals (Cheftel et al., 1985). The hydroxyl (HO•) and superoxide anion (O2•-) radicals
that are generated by radiation could modify the molecular properties of the proteins
and lipids causing oxidative modifications of the proteins and lipid peroxidation
(Halliwell and Gutteridge, 1989). Chemical changes of the proteins that are caused by
gamma irradiation are fragmentation, cross-linking, aggregation and oxidation caused
by oxygen radicals which are generated by water radiolysis (Cho and Song, 2000).
2.8.2.4.1 Irradiation of juices
Ionizing irradiation is a non-thermal technique that effectively inactivates human
pathogens and reduces spoilage in juice (Buchanan et al., 1998; Thakur and Arya, 1993)
and other foods (Thayur and Josephson, 1996). However, irradiated juice may develop
an off-flavour and become less acceptable than non-irradiated juices (Spoto et al., 1997;
Thakur and Arya, 1993; Roy, 1956; Proctor and Goldblith, 1951). Much of the flavour in
orange juice stems from volatile compounds, including volatile alcohols, aldehydes, esters,
ketones, and hydrocarbons (Moshonas and Shaw, 1994). Among the volatile compounds
important to orange juice flavour, esters and aldehydes are the primary contributors
(Bruemmer, 1975).
In another study, radiation sterilization of fresh vegetable juice and the effectiveness of
gamma irradiation for inactivating Salmonella typhimurium and Escherichia coli in carrot
and kale juice were investigated. The test organisms were eliminated by irradiation at 3
kGy. The antioxidant capacity of the irradiated carrot juice was higher than that of the non-
University of Ghana http://ugspace.ug.edu.gh

26
irradiated control. Therefore, it was concluded that irradiation of carrot and kale juice
improved the microbiological safety while maintaining or even enhancing the anti-
oxidative activity (Song et al., 2006).
Butchanan et al., (1998) investigated the effect of irradiation on inactivation of Escherichia
coli O157:H7 in apple juice by irradiation. It was concluded that a dose of 1.8 kGy should
be sufficient to achieve the 5D inactivation of Escherichia coli as recommended by the
National Advisory Committee for Microbiological Criteria for Foods.
2.9 Quality Issues
Quality includes all other attributes that influence a product’s value to the consumer. This
includes negative attributes such as spoilage, contamination with filth, discolouration, off-
odours and positive attributes such as the origin, colour, flavour, texture and processing
method of the food (FAO/WHO, 2008). Appearance, kinesthetic and flavour are some of
the factors involved in the evaluation of the quality of a product. Appearance involves the
sense of sight and is that which is perceived by the eye. Kinesthetic (or textural) factors are
evaluated by the sense of touch, hand or mouth feel. Flavour also involves the senses of
taste and smell. The quality of a food product can either be assessed through subjective
analysis such as sensory evaluation by one or more human observers or through objective
analysis by physical and chemical procedures (Joselyn and Heid, 1963).
University of Ghana http://ugspace.ug.edu.gh

27
2.10 Colour
The colour of fruit juice can have a huge influence on the type of juice products purchased
by consumers. Consumers may see colour as an indicator for freshness, a specific flavour,
a particular smell, and consumers may even use colour to determine the intensity of a
flavour or smell. Francis (1995) stated that colour influences other sensory characteristics,
which subsequently influences food acceptability, choice, and preference. Colour can be
defined as the impact of the wavelengths of light in the visual spectrum from 390 to 760
nm on the human retina (Francis, 1995). According to Francis (1995), if the colour of a
product is unacceptable to a consumer, the flavour and texture may not be considered at
all. Colour may also be used as an indicator to determine the types and quantities of
various carotenoids. Colour analysis is quick and simple and may provide more consistent
results compared to carotenoid analysis (Francis, 1995).
2.11 Ghana Standards for Fruit Juices (GS 724:2003)
Fruit juices are described by the Ghana Standards Authority, (2003) as unfermented but
fermentable juice, pulpy, turbid or clear, intended for direct consumption, obtained by
mechanical process, from sound ripe fruit or the flesh thereof, and preserved exclusively
by physical means. It is quite explicit about the strict hygienic standards expected of fruit
juices and it is stringent on tolerance for microbial counts (Yeast and moulds, Coliforms).
2.12 Ghana Standards for Vegetable Juices
Ghana Standards for vegetable juices (GS 725:2003) describes vegetable juice as the liquid
unfermented but fermentable product or lactic acid fermented product intended for direct
University of Ghana http://ugspace.ug.edu.gh

28
consumption obtained from the edible part of one or more sound vegetables and preserved
exclusively by physical means. The juice shall be free from skins, seeds and other coarse
parts of the vegetables. It may be clear, turbid or pulpy. Similar to the standards for Fruit
juices, the vegetable juices standards has very strict requirements for hygienic and
microbial standards.
University of Ghana http://ugspace.ug.edu.gh

29
CHAPTER THREE
3.0 MATERIALS AND METHODS
3.1 Source of Raw Materials
Fresh carrots (All season variety of average height 15 cm and weight of 200 g) and
pineapples (Sugar loaf variety, 0.5 - 1.5 Kg) were obtained from Wahab Farms in
Dzorwulu, Accra and Abrokwa Farms in Nsawam respectively. Mangoes (Kent variety,
500 – 600 g) were purchased at the Agbogboloshie market in Accra. These were packed
and sent to Fruito Foods Processing Limited in Sowutuom for processing and bottling.
Nutritional and quality control analyses were conducted at the Rad ia t ion
Technology Cen t re o f the Ghana Atomic Energy Commiss ion , Ghana
Standards Authority and the Noguchi Memorial Institute for Medical Research, Legon.
3.2 Survey on the Beverage Consumption Patterns in the Anyaa-Sowutuom District in
the Greater Accra Region of Ghana.
A survey was conducted in the Anyaa-Sowutuom district in the Greater Accra Region to
determine their beverage consumption patterns. Respondents were randomly chosen, based
on consent, during visits to homes, schools and work places. A semi-structured
questionnaire was used during the interviews to obtain information on background
characteristics of respondents, frequency of consumption, attitudes and perceptions of
beverages and juice consumption (Appendix 1A). The sample size of respondents required
for the study was based on the confidence level and margin of error, n = (z*/2m) 2,
where n is the sample size, z* is the level of confidence interval (95% = 1.96) and m
University of Ghana http://ugspace.ug.edu.gh

30
is the margin of error (10% = 0.10). The sample size was calculated to be 96 but because
of uncertainty, it was increased to 240.
3.3 Juice Extraction
3.3.1 Carrot Juice
Fresh carrots were washed in clean water and sliced into smaller pieces to enhance easy
mashing. It was blanched in hot water, 100 oC for 10 minutes (Luh and Woodroof, 1975)
and mashed in a plate attrition mill. Then 240 ml of treated water (Boiled at 100 oC and
cooled to room temperature, 26 ± 2) was added to 100 g of carrots and sent to the presser
to obtain the juice. The volume of water used in the extraction was determined after
preliminary experiments with different volumes (160, 180, 200, 220, 240, and 260 ml)
which showed that the resultant concentration was the most accepted by consumers.
3.3.2 Pineapple juice
Fresh pineapples were washed thoroughly in clean water. They were then dipped in hot
water at 90 oC for 5 min followed by peeling and juicing using a juice extractor.
3.3.3 Mango juice
Fresh mangoes were cleaned thoroughly in tap water. They were then washed in hot water
at 90oC for 5 min, peeled and juice extracted using a juice extractor.
University of Ghana http://ugspace.ug.edu.gh

31
3.4 Development of Composite Juice Formulations
To decide on plausible lower and upper levels for the three component mixture of
the extracts, a constrained mixture design (Cornell, 1983) was used with arbitrary lower
and upper bound levels (Table 3.1). For three components, the design yielded ten possible
formulations (Table 3.2 and Figure 3.1) based on the lower and upper limits (Table 3.1).
This was meant to be a screening design to help set realistic lower and upper limits of the
components’ amounts.
Table 3.1 Lower and upper limits of compositional ratio of juice (optimization)
Component name Lower limit Upper limit
Carrot Juice 0.5 0.7
Pineapple juice 0.2 0.4
Mango Juice 0.1 0.3
NB: (0.01=1%; 1.00=100%)
University of Ghana http://ugspace.ug.edu.gh

32
Table 3.2 Compositional ratio of ten possible formulations (Optimization)
Formulation Proportion of Ingredient (%)
Carrot(X1 ) Pineapple(X2 ) Mango(X3 )
1 50.00 40.00 10.00
2 53.33 33.33 13.34
3 56.67 26.67 16.66
4 60.00 30.00 10.00
5 50.00 30.00 20.00
6 63.33 23.33 13.34
7 70.00 20.00 10.00
8 53.33 23.33 23.34
9 60.00 20.00 20.00
10 50.00 20.00 30.00
University of Ghana http://ugspace.ug.edu.gh

33
Figure 3.1 Design matrix for the 3-component mixture formulations.
3.4.1 Consumer acceptance test
Untrained consumers who were familiar with the ingredients were randomly recruited
from among the staff of the Biotechnology and Nuclear Agriculture Research Institute,
Ghana Atomic Energy Commission and students of the D e p a r t m e n t o f N u c l e a r
A g r i c u l t u r e a n d R a d i a t i o n P r o c e s s i n g , University of Ghana. The criteria for
selection of panelists were that (a) they were available and willing to participate in
panel tests, (b) they were regular consumers of juices, and (c) they were of sound
health. A balanced incomplete block design (t=10, k=4, r=6, b=15, λ=2) (Appendix 2B)
described by Cochran and Cox, (1957), was used to assign the ten (10) products to fifteen
(15) panelists such that each panelist evaluated only four (4) products without the danger
of fatigue. Where, t= number of formulations; b= number of panelists for each set; r=
testing frequency of a formulation in each set; N= total number of panelist (4 sets); k=
Carrot (70, 20, 10)
50
70
Mango (50, 20, 30) 30
10
Pineapple (50, 40, 10)40
20
University of Ghana http://ugspace.ug.edu.gh

34
number of formulations tested by each panelist; λ = maximum number of panelist testing
the same formulation.
The sensory attributes considered for the evaluation were colour, taste, flavour,
aftertaste and overall acceptance. Panelists assessed and assigned scores to the attributes
using the 9 – point Hedonic scale where 1 represented dislike extremely and 9 represented
like extremely (Appendix 2A). Responses from the products’ sensory attributes were
analyzed using ANOVA and mixture regression techniques.
3.4.2 Determination of the optimum components formulation
The predictive regression models developed for each of the attributes (colour, taste,
flavour, aftertaste and overall acceptability) were used to generate ternary contour plots to
display the effects of the components on the attributes. Contour plots of each of the
attributes were overlaid based on the (consumer acceptable) limits of the attributes. The
optimum region was determined by superimposing the contour plots (Palomar et al., 1994)
of all sensory attributes that would meet the criteria for an acceptable prototype product
(Prinyawiwatkul et al., 1997).
University of Ghana http://ugspace.ug.edu.gh

Pl
3.5
Th
pr
tem
ch
Th
Ti
da
in
3.5
So
late 1. Photo
5 Preservat
he optimize
reserved, bo
mperature (2
hemicals and
he paramete
itratable acid
ata generated
Appendix 3
5.1 Chemica
odium benzo
ograph of th
ion treatme
d final com
ottled and w
26 ± 2 oC) f
d gamma rad
ers monitore
dity, pH, To
d from the at
3A.
al preservat
oate and pot
he optimised
ents
mposite juic
was closely
for eight (8)
diation at diff
ed during th
otal soluble s
ttributes wer
tion
tassium sorb
35
d juice.
ce (Plate 1)
y monitored
) weeks. The
ferent levels
his period in
solids, Colou
re subjected
bate were u
) was paste
d to determ
e final comp
s and doses r
ncluded; As
ur, Minerals
to Analysis
used to prese
eurized (62
mine the sh
posite juice
respectively.
scorbic acid
s and Micro
of Variance
erve the juic
oC for 30
helf life at
was preserv
d, Pro vitam
bial analysis
e, and summ
ce individua
min),
room
ved by
min A,
s. The
marized
ally as
University of Ghana http://ugspace.ug.edu.gh

36
well as a combination of both. The treatments were as follows
Treatment 1 – Control (Pasteurization at 62 oC, 30 min)
Treatment 2 – Pasteurization at 62 oC, 30 min + 0.1 % Sodium benzoate
Treatment 3 – Pasteurization at 62 oC, 30 min + 0.1 % Potassium sorbate
Treatment 4 – Pasteurization at 62 oC, 30 min + 0.05 % Sodium benzoate and 0.05 %
Potassium sorbate
3.5.2 Irradiation
The final composite juice after bottling and pasteurization (62 oC, 30 min) was treated with
60Co gamma radiations at the Radiation Technology Centre, Ghana Atomic Energy
Commission. Irradiation was carried out at 1, 1.5, 2 and 2.5 kGy at a dose rate of 2.43
kGy/hr.
Treatment 5 – Irradiation at 1 kGy
Treatment 6 – Irradiation at 1.5 kGy
Treatment 7 – irradiation at 2.0 kGy
Treatment 8 – Irradiation at 2.5 kGy
3.6 Analytical Procedure for Shelf-life Study
3.6.1 pH
The pH of ten milliliters (10 ml) of juice was determined using a pH meter (Mettler
Toledo) for the eight week storage period.
University of Ghana http://ugspace.ug.edu.gh

37
3.6.2 Titratable Acidity
Ten milliliters (10 ml) of juice was mixed with 50 ml distilled water. The mixture in
triplicates was then titrated against 0.1M NaOH using 1% phenolphthalein as indicator.
Acidity was calculated as acetic acid (%) (AOAC, 2003).
3.6.3 Mineral Analysis
A wet digestion method (AOAC, 2003) was used to eliminate all organic matter from the
sample before it was analyzed for the various minerals. About 1 ml of the sample was
measured into a 250 ml beaker. Twenty five milliliters (25 ml) concentrated HNO3 was
added and the beaker was covered with a watch glass. The sample was digested with care
on a hot plate in a fume chamber until all the organic matter had been oxidized (20-30
min). The pale yellow solution was cooled t o r o o m t e m p e r a t u r e ( 26 ± 2 oC) and 1
ml 70% HClO4 was added with care. Digestion was continued until the solution was
almost colourless (until all the HNO3 was removed). The solution was then cooled to room
temperature after the digestion process, and about 30 ml distilled water was added and
allowed to boil for about 10 mins then filtered when hot through No. 4 Whatman filter
paper into a 100 ml volumetric flask. The beaker was washed well with distilled water and
filtered. The flask was then cooled to room temperature and made up to the 100 ml mark.
This solution was used for all the mineral analyses. The following minerals; Magnesium
(Mg), Calcium (Ca), Potassium (K) and iron (Fe) were all determined using the
PerkinElmer Atomic Absorption Spectrophotometer (AAS; Model AAnalyst 400,
Minneapolis, U.S.A.) and results recorded in milligram (mg).
University of Ghana http://ugspace.ug.edu.gh

38
3.6.4 Pro-Vitamin A (Beta carotene)
Pro-Vitamin A analyses were determined by HPLC method as described by Pearson
(1987) and results recorded in milligram (mg).
3.6.5 Vitamin C
Titration procedures as described by Pearson (1987) and results were recorded in
milligram (mg).
3.6.6 Colour Determination
The colour of the juice was determined using the Minolta Chroma Meter (Minolta CR 300
series) using the L*a*b* colour system. The Chroma meter was calibrated with a standard
white tile (L* = 97.95, a* = -0.12, b* = +1.64).
3.6.7 Microbial Analyses
The beverage was tested for its microbiological safety by determining the Total Plate
Count (TPC), Yeasts/Moulds, Total Coliforms, Staphylococcus aureus, and Escherichia
coli using procedures outlined in the Quality Assurance Procedure Manual of the Ghana
Standards Authority (2003).
3.6.7.1 Total plate Count
The total population counts of the mesophilic bacteria were determined using the Total
Plate Count Method, on a plate Count Agar (pH 7.0 from Oxoid Ltd., Basingstoke,
Hampshire – England). The plate was incubated at 35 oC for 48 ± 2 hr. The number of
University of Ghana http://ugspace.ug.edu.gh

39
colonies developed were counted and recorded as colony forming units per gram of
sample (cfu/g) (King et al., 1986).
3.6.7.2 Yeasts and Moulds
Malt Extract Agar (pH 6.6 from Oxoid Ltd., Basingstoke, Hampshire – England) was used
to determine the yeasts and moulds population in the sample. The plates were incubated at
25 oC for 5 days. The number of colonies developed were counted and recorded as colony
forming units per gram of sample (cfu/g) (King et al., 1986).
3.6.7.3 Total Coliforms (Presumptive Test)
Lauryl Tryptose Broth (pH 6.8 from Oxoid Ltd., Basingstoke, Hampshire – England) was
used to determine the presence of Coliforms. Fermentation tubes with inverted Durham
tubes were used. The tubes were incubated at 35 oC for 48 ± 2 hr. The presence of gas
trapped in the Durham tubes would indicate a positive test for Coliforms (King et al.,
1986).
3.6.7.4 Staphylococcus aureus
Baird Parker Agar (pH 7.2 from Oxoid Ltd., Basingstoke, Hampshire – England) was
used to determine the presence of Staphylococcus areaus. The plates were incubated at
37 oC for 48 ± 2 hr. The number of colonies developed were counted and recorded as
colony forming units per gram of sample (cfu/g) (King et al., 1986).
University of Ghana http://ugspace.ug.edu.gh

40
3.7 Experimental Design and Statistical Analysis
Data obtained from the survey was analysed for frequencies and cross-tabulations using
SPSS version 16. Formulation of the cocktail beverage was done using a Simplex
Centroid Constrained Design (Cornell, 1983) for three components with the aid of
Minitab 14 statistical package. A Balanced Incomplete Block Design (BIBD) was used
(Cochran and Cox, 1957) to assign the 10 products obtained from the mixture design for
3 components to 15 panelists. Data for each sensory attribute were analysed using
Mixture Design Analyser in Minitab 14 statistical package. Ternary contour plots were
generated using MINITAB 14 for each of the sensory attributes. The ternary contour plots
of each of the attributes were overlaid in order to determine the optimum formulation
region. Data obtained from the quality control analyses were analysed using scatter plots
in Excel, ANOVA and LSD in Statgraphics C e n t u r i o n ( v e r s i o n X V I . I ) and
GenStat 12th Edition.
University of Ghana http://ugspace.ug.edu.gh

41
CHAPTER FOUR
4.0 RESULTS AND DISCUSSIONS
4.1 Survey of Consumers about the Consumption Patterns of Beverages in the Anyaa-
Sowutuom District of Ghana.
Analyses of the frequencies showed that the age distribution was very close and was
made up of three age groups such that ninety-six (96) of the respondents were aged
between 20-30 years, seventy-two (72) of the respondents were between 31-40 years and
the remaining seventy-two (72) were between 41-50 years. The frequency distribution
based on educational background of the respondents showed that only twelve (12) of them
had only elementary education (Appendix 1B, Table 1.1). Two hundred and twelve (212)
respondents had either secondary or tertiary education. The distribution of consumers
based on family life was skewed because only eighty-four (84) out of a total of two
hundred and forty (240) respondents were married.
4.1.2 Consumption of beverage
All two hundred and forty (240) of the respondents drank beverages and 238 (99.17% of
respondents) specifically indicated that they drank juices, while 178 (74.17% of
respondents) indicated that they drank carbonated drinks. The frequency of drinking
beverages showed that, 138 (57.5%) of the respondents drank juices more than once per
week, and that cost was not a consideration in their decisions to purchase juice. As many
as 193 (80.4%) respondents said they were willing to try a new juice product. There were
no significant differences (p ≤ 0.05) between males and females, or between the age
University of Ghana http://ugspace.ug.edu.gh

42
groups (20 - 30, 31 - 40 year groups) in their willingness to try new fruit juices (Appendix
1B, Table 1.1).
4.1.3 Criteria for choice of juice as a beverage
4.1.3.1 Effect of gender
Juice was mostly preferred as a food supplement or nutritional requirement by both males
and females. The criteria for choice and selection of juice as a food supplement did not
differ significantly (p > 0.05) between males and females using Pearson’s Chi-square (χ2)
analysis.
Taste was an important consideration for selection of juices. This was confirmed by the
number of respondents, 113 (47%), that looked out for taste in juices. Females (54 % of
female respondents) were however more likely to choose juices based on their taste than
their counterpart males (40.3 % of male respondents). Males (26.1 % of male respondents)
were also more likely to choose juices based on their colour than their counterpart females
(13.2 % of female respondents) (Appendix 1C, Table 1.5). Analyses of the data using
ANOVA and Pearson’s Chi-square (χ2), showed that there were significant differences (p ≤
0.05) between males and females in their characteristic choice of juices as beverage drinks
(Appendix 1C, Table 1.5).
4.1.3.2 Effect of consumer’s age
There were significant differences (p ≤ 0.05) in the frequency of drinking juices between
the age groups. Younger respondents in the age group of 20 - 30 years were less likely to
University of Ghana http://ugspace.ug.edu.gh

43
drink juice than the older age groups 31 - 50 years (Appendix 1C, Table 1.8). The reasons
were not clear but could be attributed to the working status of the age groups. People of
age groups 20 - 30 were mostly students and dependents, while those between 31 and 50
were usually independent and following a career and therefore more capable of purchasing
exactly what they wanted.
The three age groups are most likely to choose juices for its taste (Appendix 1C, Table
1.11) than for its colour. Analyses of the data using ANOVA and Pearson’s Chi-square (χ2)
showed that there are significant differences (p ≤ 0.05) between the three age groups in
their characteristic choice of juices as beverage drinks (Appendix 1C, Tables 1.8 – 1.11).
4.1.4 Summary of observation from consumer survey
Drinking of beverages was a popular practice among consumers in Anyaa-Sowutuom
Constituency in Accra. Juices were particularly popular, among the working class
consumers. Younger consumers (20 - 30 year olds) liked juices but did not drink as much
as older people (31-50 years) probably because of purchasing capabilities. Juices were
drunk as snack and as a nutritional supplement by health conscious consumers. The
choice of juice as a drink was dependent on nutrition, taste and colour on one hand and
gender and age of the consumer on the other hand. This information was important for
determining the attributes of the c o c k t a i l beverage that made it desirable among the
given target population.
University of Ghana http://ugspace.ug.edu.gh

44
4.2 Formulation of the cocktail beverage
4.2.1 Screening for proportions of components in formulation
As much as the objective was to develop a Carrot juice, the practical realities of an
agreeable product taste and flavour demanded the inclusion of other ingredients to serve
those functions.
4.2.2 Optimization of the components proportions in the formulations
The lower and upper percentage limits of the three ingredients were used to generate ten
possible formulations (Table 3.4), which were evaluated using sensory analyses. The
regression models for all sensory attributes were obtained based on means score values
presented in Table 4.1
University of Ghana http://ugspace.ug.edu.gh
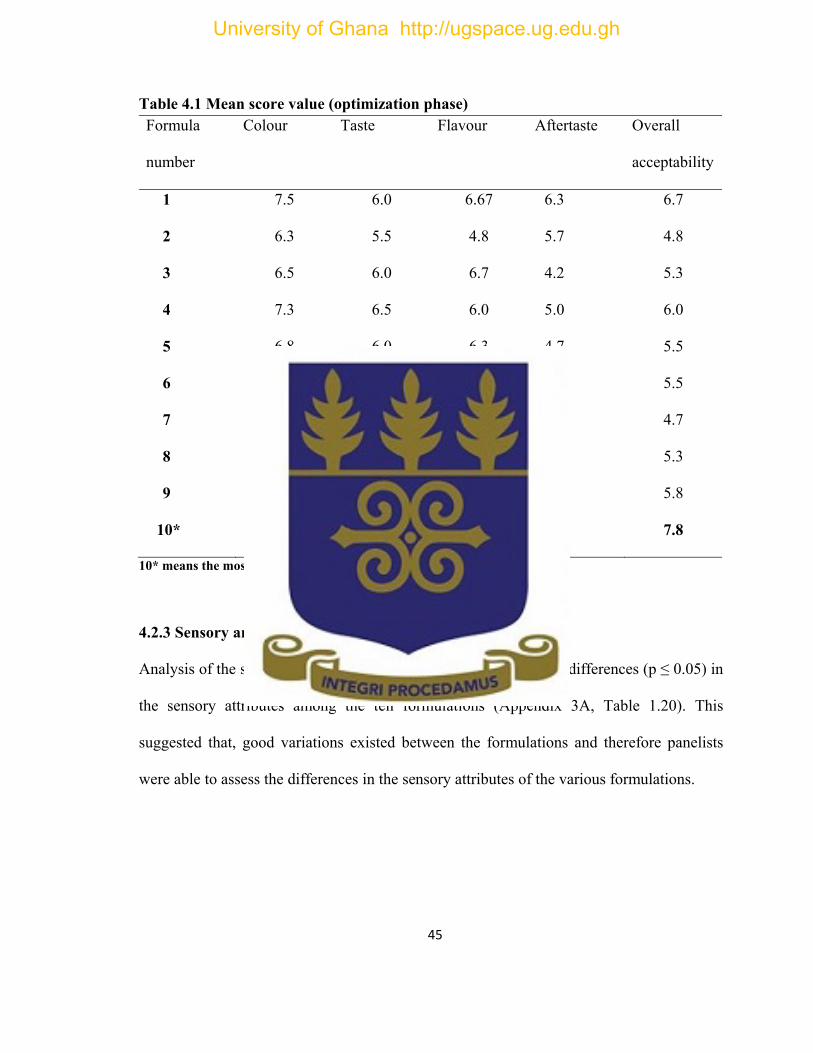
45
Table 4.1 Mean score value (optimization phase) Formula
number
Colour Taste Flavour Aftertaste Overall
acceptability
1 7.5 6.0 6.67 6.3 6.7
2 6.3 5.5 4.8 5.7 4.8
3 6.5 6.0 6.7 4.2 5.3
4 7.3 6.5 6.0 5.0 6.0
5 6.8 6.0 6.3 4.7 5.5
6 5.8 5.8 5.2 5.2 5.5
7 5.7 4.8 6.0 5.0 4.7
8 6.3 5.7 5.2 6.2 5.3
9 5.3 6.0 4.8 5.5 5.8
10* 7.3 8.2 7.5 7.7 7.8
10* means the most acceptable formulation
4.2.3 Sensory analysis
Analysis of the sensory data from optimization showed significant differences (p ≤ 0.05) in
the sensory attributes among the ten formulations (Appendix 3A, Table 1.20). This
suggested that, good variations existed between the formulations and therefore panelists
were able to assess the differences in the sensory attributes of the various formulations.
University of Ghana http://ugspace.ug.edu.gh

46
4.2.3.1 Colour
Colour which is a sensation that forms part of the sense of vision, judges the appearance of
a food (Jellinek, 1985). The mean score data for the various optimized formulations
(Table 4.1) showed that, product number one (1), was more highly rated for colour. This
formulation as shown in Table 3.2 had the minimum content of Carrots at 50%,
minimum mango at 10% and maximum pineapple content at 40%. ANOVA of the
regression for colour in Appendix 3A, Table 1.20 showed that the proportion of
Carrot/pineapple/mango significantly influenced (p ≤ 0.05) the colour of the juice. Ternary
contour plots were generated using the predictive model to graphically display the
influences of the components on colour (Figure 4.1). The figure showed that decreasing
the proportion of carrot juice in the formulation to its minimum improved the colour
appreciation by the panelists. This could be attributed to consumers not being familiar with
beverages that are orange in colour, and hence the less orange the colour of the juice the
higher it was scored.
The ingredients that were not orange, (i.e. pineapple) had a positive impact on the colour
score of the juice. This was shown by the increasing acceptance by consumers when
pineapple was at maximum amount (Product 1 in Table 3.2). The beverage scored the least
of 5.3 for colour when the compositional ratio for pineapple was minimum and carrot was
high (Figure 4.1). The highest mean score, >7.0, was obtained when pineapple and mango
were at maximum levels.
University of Ghana http://ugspace.ug.edu.gh

47
Figure 4.1 Mixture Contour Plots for Colour of the Composite Juice Formulation
4.2.3.2 Taste
The scale for rating the taste of the juices by panelists ranged from like
slightly to dislike slightly. Figure 4.2 represented the ternary contour plots for
taste and the model could explain 95 % of the variations due to taste. As carrot
levels decreased, the mean scores gradually increased with increasing mango levels. The
highest mean score, >8, for taste was obtained when mango was at its highest level
(Product number 10 in Table 3.2) whereas the least mean score, >5, was obtained when
carrots were at maximum levels (Product number 7 in Table 3.2). Again, the mean scores
were increasing when the levels of pineapple were increasing with a corresponding
decrease in carrot levels. The increase in mean scores were however significantly (p ≤
0.05) lower than when mango levels were increasing.
Carrot
50
70
Mango30
10
Pineapple40
20
7.086.87
6.87
6.66
6.45
6.24
6.03
5.82
5.61
University of Ghana http://ugspace.ug.edu.gh

48
Figure 4.2 Mixture Contour Plots for Taste of the Composite Juice Formulation
4.2.3.3 Flavour
Flavour includes tastes and the aroma perceived through tasting (Jellinek, 1985). The
panelists rated the flavour of the juices from like very much to neither like nor dislike.
Juice made from 50 % Carrot, 10 % Pineapple and 30 % Mango (Product 10, Table 3.2)
gave a flavour that was the most accepted at a mean score of 7.5 (Table 4.1).
Ternary contour plot was generated (Figure 4.3), which displays the relative influences of
each of the components on the juice flavour. The figure shows that increasing the amount
of carrots in the juice gave a flavour that was least liked by consumers. A reduction in the
amount of carrots to the minimum with a corresponding increase in pineapple and/or
mango levels registered acceptance for flavour. However, the product (product number 10,
Table 3.2) with the highest mango level (30 %) gave the most acceptable mean score of 7.5
(Table 4.1).
Carrot
50
70
Mango30
10
Pineapple40
20
6.9
6.6
6.3
6.3
6.0
6.0
5.7
5.7
5.4
University of Ghana http://ugspace.ug.edu.gh

49
Figure 4.3 Mixture Contour Plots for Flavour of the Composite Juice Formulation
4.2.3.4 Aftertaste
Aftertaste is the lingering of the sense of taste of a product on taste buds (Quarcoo, 2008).
The panelists rated the aftertaste of the cocktail beverage from dislike slightly to like very
much. Ternary contour plot was generated (Figure 4.4), which displayed the relative
influences of each of the components on the juice aftertaste. Mean scores were increasing
as carrot proportions were decreasing. Contour plots obtained from the model for aftertaste
(Figure 4.4) showed that as mango or pineapple levels increased, there were corresponding
increases in the mean score values. Increase in mango levels however significantly
recorded higher mean score values than increase in pineapple levels. The highest mean
score for aftertaste was obtained for product 10 (Table 3.2) which had the maximum
proportion of mango and minimum proportion of carrots. Thus high amounts of mangoes
Carrot
50
70
Mango30
10
Pineapple40
20
6.506.25
6.00
5.75
5.50
5.25
5.00
University of Ghana http://ugspace.ug.edu.gh
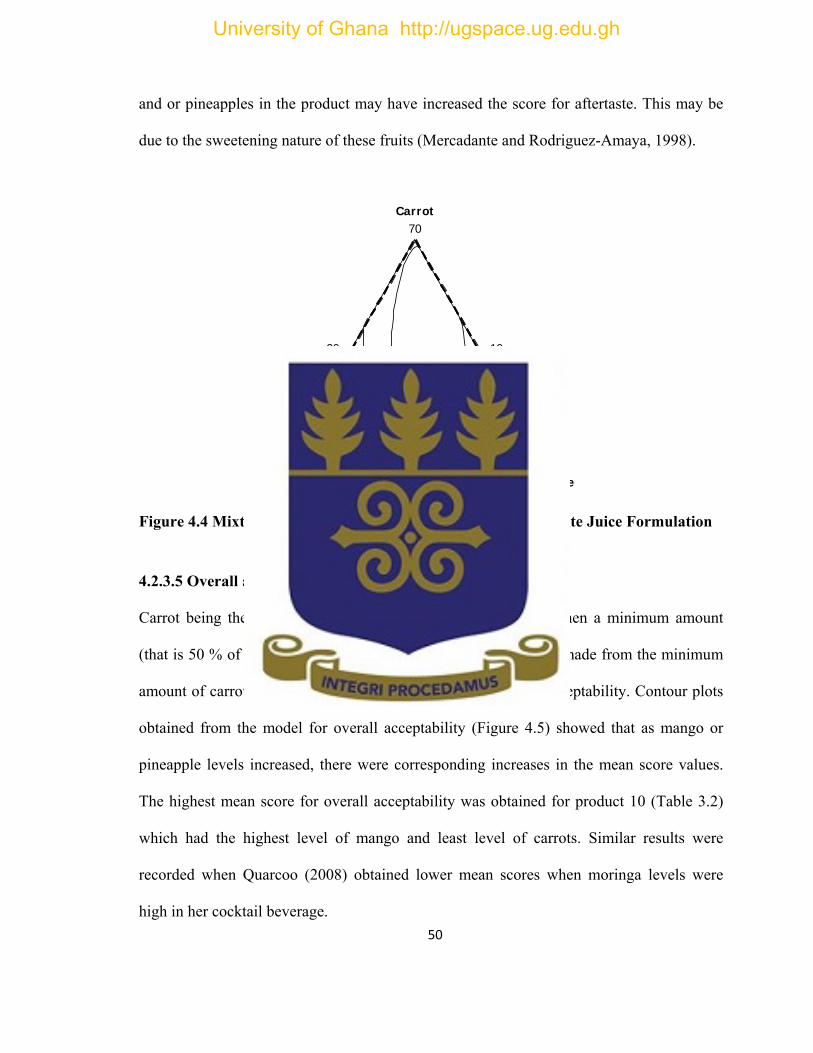
50
and or pineapples in the product may have increased the score for aftertaste. This may be
due to the sweetening nature of these fruits (Mercadante and Rodriguez-Amaya, 1998).
Figure 4.4 Mixture Contour Plots for Aftertaste of the Composite Juice Formulation
4.2.3.5 Overall acceptability
Carrot being the main ingredient was accepted by consumers when a minimum amount
(that is 50 % of the total volume of the mixture) was used. Juice made from the minimum
amount of carrots had the highest mean score (>7) for overall acceptability. Contour plots
obtained from the model for overall acceptability (Figure 4.5) showed that as mango or
pineapple levels increased, there were corresponding increases in the mean score values.
The highest mean score for overall acceptability was obtained for product 10 (Table 3.2)
which had the highest level of mango and least level of carrots. Similar results were
recorded when Quarcoo (2008) obtained lower mean scores when moringa levels were
high in her cocktail beverage.
Carrot
50
70
Mango30
10
Pineapple40
20
6.6
6.2
5.8
5.4
5.4
5.0
University of Ghana http://ugspace.ug.edu.gh

51
Figure 4.5 Mixture Contour Plots for Overall Acceptability of the Composite Juice Formulation
4.2.4 Region of Optimum formulation
Sidel and Stone (1983) defined optimization in sensory evaluation as a procedure for
developing the best possible product in its class. It is impossible to develop a product
with all sensory qualities that would satisfy consumers although an optimal formation
should maximize consumer acceptance (Moskowitz, 1994). To obtain the optimum region
therefore, and hence the ingredient formulation that would obtain optimum colour, taste,
flavour, aftertaste, overall acceptability for the cocktail beverage, the contour plots for all
the attributes (colour, taste, aftertaste, flavour and overall acceptability) were overlaid in a
single graph on same axis as shown in Figure 4.6. The optimum region in this overlaid
plot was where the criteria for all the five response variables were satisfied.
Carrot
50
70
Mango30
10
Pineapple40
20
6.56.2
5.9
5.9
5.6 5.6
5.3
5.3
5.0
University of Ghana http://ugspace.ug.edu.gh

52
Figure 4.6 Overlaid Contour Plot (Optimization) of the Composite Juice Formulation
4.3 Shelf-Life Analysis
4.3.1 Minerals
Storage time had no significant (p > 0.05) effect on the minerals (calcium, magnesium,
iron and potassium) analyzed. Neither irradiated nor chemically treated beverages
significantly (p > 0.05) differed from the control in mineral content.
The mineral analysis (magnesium, potassium, calcium and iron) revealed that there was
general reduction after the extraction of juice from the carrots. This was due to the
elimination of fibre and also dilution to obtain the juice. However, from literature (USDA
Nutrient Database, 2009 and www.nutritionanalyser.com, 2009) a good amount of
potassium, 115 mg/100 g and 240 mg/100 g, has been found in raw pineapple and carrot
respectively which helped boost the content of the minerals in the juice. This resulted in
Carrot
50
70
Mango30
10
Pineapple40
20
Carrot=50.1308Mango=29.7833Pineapple=20.0859Colour=7.32755Taste=7.94189Flavour=7.27028Aftertaste=7.66805OverallAcceptance=7.66598
Optimum Region
University of Ghana http://ugspace.ug.edu.gh
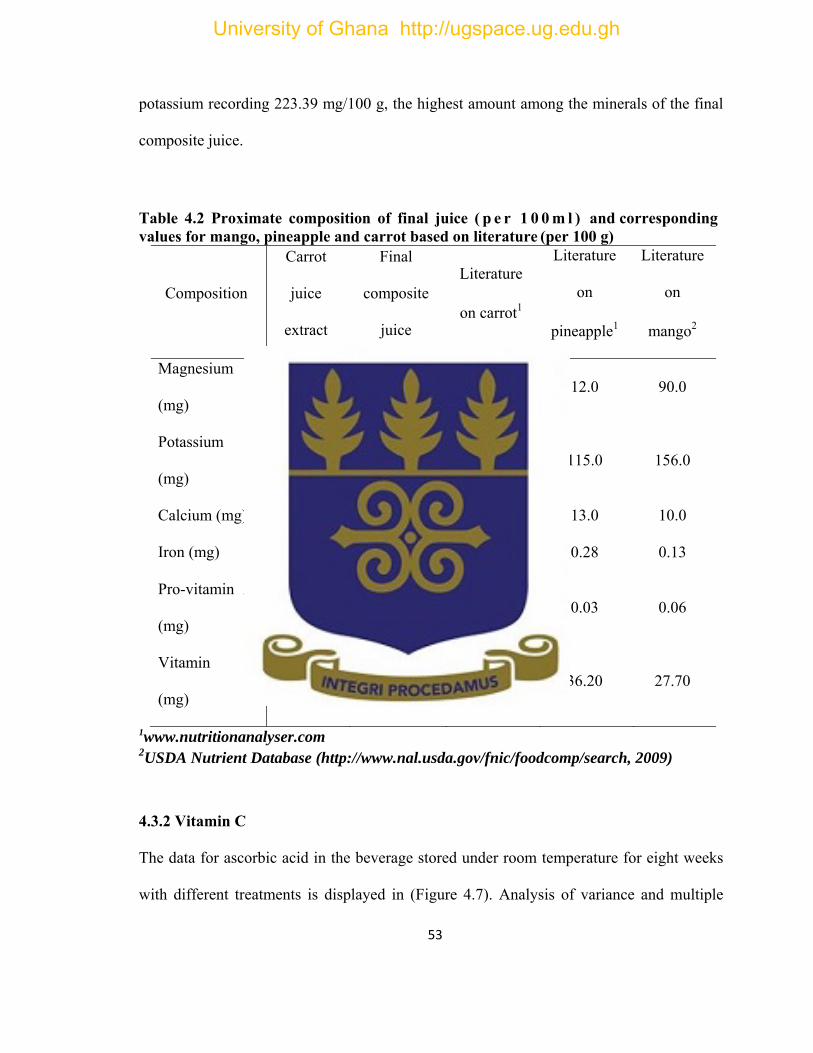
53
potassium recording 223.39 mg/100 g, the highest amount among the minerals of the final
composite juice.
Table 4.2 Proximate composition of final juice ( p e r 1 0 0 m l ) and corresponding values for mango, pineapple and carrot based on literature (per 100 g)
Composition
Carrot
juice
extract
Final
composite
juice
Literature
on carrot1
Literature
on
pineapple1
Literature
on
mango2
Magnesium
(mg) 10.46 7.68 18.0 12.0 90.0
Potassium
(mg) 231.17 223.39 240.0 115.0 156.0
Calcium (mg) 15.50 10.40 33.0 13.0 10.0
Iron (mg) 0.48 0.35 0.66 0.28 0.13
Pro-vitamin A
(mg) 6.21 3.92 8.29 0.03 0.06
Vitamin C
(mg) 9.03 43.01 7.0 36.20 27.70
1www.nutritionanalyser.com 2USDA Nutrient Database (http://www.nal.usda.gov/fnic/foodcomp/search, 2009) 4.3.2 Vitamin C
The data for ascorbic acid in the beverage stored under room temperature for eight weeks
with different treatments is displayed in (Figure 4.7). Analysis of variance and multiple
University of Ghana http://ugspace.ug.edu.gh

54
range tests by LSD (Appendix 3A, Table 1.15) showed that storage period as well as
treatments significantly (p ≤ 0.05) affected the ascorbic acid content of the final cocktail
beverage.
Dionisio et al., (2009) reported that ascorbic acid in mangoes and many other fruits are
highly sensitive to gamma radiation. Ascorbic acid content in the beverages was constantly
degrading with time for all the different treatments. The data was fitted into linear trend
line model and the trends showed that the rates of ascorbic acid degradation were lower
(≤ 2.8 mg/week) when the beverage was treated with chemical preservatives and with
lower gamma radiation doses (1 and 1.5 kGy). The rate of degradation increased to 3.5
mg/week when the beverage was preserved with relatively higher doses of gamma
radiation (2 and 2.5 kGy).
Beverages with chemical preservatives as well as those treated with lower radiation doses
preserved ascorbic acid levels better than those preserved with higher radiation doses.
Ascorbic acid under all treatments degraded with time, but chemical preservatives as well
as lower radiation doses could retain about 50 % of the original ascorbic acid content of the
beverage after eight weeks of storage (Potter, 2011).
University of Ghana http://ugspace.ug.edu.gh

Fisto Tr
Tr
Tr
Tr
Po
Tr
Tr
Tr
Tr
igure 4.7 Aorage perio
reatment 1 –
reatment 2 –
reatment 3 –
reatment 4 –
otassium sorb
reatment 5 –
reatment 6 –
reatment 7 –
reatment 8 –
0
5
10
15
20
25
30
35
40
45
Ascorbic Acid (mg/100ml)
Ascorbic Acid
– Control ( Pa
– Pasteurizati
– Pasteurizati
– Pasteuriza
bate
– Irradiation a
– Irradiation a
– irradiation a
– Irradiation a
0 1
id Content
asteurization
ion at 62 oC,
ion at 62 oC,
ation at 62 o
at 2.5 kGy
at 2.0 kGy
at 1.5 kGy
at 1.0 kGy
2 3
55
of Beverag
n at 62 oC, 3
, 30 min + 0
, 30 min + 0
oC, 30 min
4 5Week
ge Given D
0 min)
.1 % Sodium
.1 % Potassi
+ 0.05 % S
5 6
Different Tr
m benzoate
ium sorbate
Sodium benz
7 8
reatments d
zoate and 0
Treatme
Treatme
Treatme
Treatme
Treatme
Treatme
Treatme
Treatme
during
.05 %
ent 1
ent 2
ent 3
ent 4
ent 5
ent 6
ent 7
ent 8
University of Ghana http://ugspace.ug.edu.gh

56
Table 4.3 Degradation rates for ascorbic acid in the Cocktail beverage during storage. Treatment Linear model for ascorbic acid
Treatments 1,2,3,4,7 and 8 Y = -2.78X + 43
Treatments 5 and 6 Y = -3.5X + 43
Where, X= Storage time
Y= Total amount of ascorbic acid
4.3.3 Pro – Vitamin A
The analysis of the data for pro-vitamin A showed significant effects (p ≤ 0.05) for the
interaction of both treatments and time (Figure 4.8). Analysis of variance and multiple
range tests by LSD (Appendix 3A, Table 1.19) showed that pro – vitamin A was constantly
degrading with time for all the treatments.
The results indicated that irradiation had higher deteriorative effects on the pro - vitamin A
content of the juice beverage. The lowest dose (1 kGy) of gamma radiation used in the
preservation of the juice had significantly (p ≤ 0.05) higher levels of deterioration than any
of the chemical preservatives used as at week 6 of storage. However, it retained same
amount of this nutrient as the chemically treated products at the end of storage (week 8).
Although irradiation at the highest dose (2.5 kGy) had the highest deteriorative effect on
the pro-vitamin A content, it however retained about 60 % of this nutrient at the end of
storage (Andress et al., 1998).
University of Ghana http://ugspace.ug.edu.gh

Fisto
4.3
Ti
ref
20
Th
du
ind
20
lim
Th
bo
PVit
iA(
/100)
igure 4.8: Porage perio
3.4 pH and
itratable acid
flects on the
011).
here was a g
uring storage
duced degra
008). It could
mits (< 10).
he analysis o
oth treatment
0.00
0.50
1.00
1.50
2.00
2.50
3.00
3.50
4.00
Pro‐Vitam
in A (mg/100g)
Pro-Vitamind
Titratable a
dity and pH o
e stability of
general redu
e (Figure 4.
adation of oth
d not have b
of the data fo
ts and time
0 1
n A Content
acidity
of the juice i
f the product
ction in pH
9). The redu
her nutrients
been due to m
for pH show
(Appendix 3
2 3
57
t of Bevera
is a measure
t with regard
levels of th
uction could
s such as pro
microbial act
ed significan
3A, Table 1
4 5
Weeks
age Given D
e of the sourn
ds to deterio
he cocktail b
d have been
oteins leadin
tivity since g
nt effects (p
.12). The mu
5 6
Different Tr
ness of the p
oration durin
beverage for
n due to sto
ng to change
growth was
p ≤ 0.05) for
multiple range
7 8
reatments d
product and
ng storage (P
all the treat
orage environ
s in pH (Qu
within acce
the interact
e analysis sh
Treatme
Treatme
Treatme
Treatme
Treatme
Treatme
Treatme
Treatme
during
it also
Potter,
tments
nment
arcoo,
ptable
tion of
howed
ent 1
ent 2
ent 3
ent 4
ent 5
ent 6
ent 7
ent 8
University of Ghana http://ugspace.ug.edu.gh

58
that while there were no significant difference (p ≥ 0.05) in pH between the highly
irradiated (2.0 and 2.5 kGy) beverages (4.24 and 4.23), the pH of the beverages chemically
treated were significantly higher (4.31 - 4.32). Irradiation therefore had no effect on the pH
but the chemicals used for the treatment altered the ionic concentrations to affect the pH.
Results from the two-way analysis of variance revealed that treatment and storage time had
significant effects (p ≥ 0.05) on the total titratable acids content of the cocktail beverage.
There was significant (p ≥ 0.05) interaction between storage time and treatments on the
percentage titratable acidity of the beverages (Appendix 3A, Table 1.13).
Titratable acidity at the end of storage of the final composite beverage for all treatments
was significantly lower than the initial. This might be due to conversion of acids into salts
and sugars by enzymes particularly invertase (Bhardwaj and Mukherjee, 2010, Kumar et
al., 1992). Similar results were recorded by Dhaliwal and Hira (2001) in carrot juice blends
and Tiwari (2000) in guava and papaya blends. Though beverages treated with gamma
radiation recorded the least titratable acidity at the end of storage, its corresponding pH
was also the least. Quarcoo, (2008) also recorded similar results and concluded that the
trend is difficult to explain, but could be due to some buffering effects of the beverage
proteins.
University of Ghana http://ugspace.ug.edu.gh

Fi
Fidu
H
igure 4.9: pH
igure 4.10: uring storag
4.00
4.05
4.10
4.15
4.20
4.25
4.30
4.35
4.40
pH
0.00
0.05
0.10
0.15
0.20
0.25
0.30
0.35
0.40
0.45
0.50
Percentage Titratatble acidity
H of Bevera
Percentagege period
0 1
0 1
age Given D
Titratable
2 3
2 3
59
Different Tre
Acidity of
4 5
Weeks
4 5
Week
eatments du
Beverage G
5 6
6 7
uring storag
Given Diffe
7 8
8
ge period
erent Treatm
Treatme
Treatme
Treatme
Treatme
Treatme
Treatme
Treatme
Treatme
Treatment
Treatment
Treatment
Treatment
Treatment
Treatment
Treatment
Treatment
ments
nt 1
nt 2
nt 4
nt 4
nt 5
nt 6
nt 7
nt 8
1
2
3
4
5
6
7
8
University of Ghana http://ugspace.ug.edu.gh

4.3
An
tha
so
pa
po
by
du
T2
rec
Fisto
3.5 Total So
nalysis of va
at storage pe
olids of the
assage of st
olysaccharide
y Deka (200
uring storage
2 and T3 rec
cording the h
igure 4.11: orage perio
10.50
11.00
11.50
12.00
12.50
13.00
13.50
Total Soluble Solid
s
oluble Solid
ariance and
eriod as wel
final cockta
orage time.
es into mon
00) in juice
e at ambient
corded the l
highest (13.3
Total Solud
0 1
s (TSS)
multiple ran
ll as treatme
ail beverage
This gradu
osaccharides
blends as h
temperature
least (12.50,
38 and 13.34
uble Solids
2 3
60
nge tests by
ents significa
e. The TSS
ual increase
s and oligos
he found an
es. At the en
12.58 and
4 respectivel
of Beverag
4 5
Weeks
LSD (Appe
antly (p ≤ 0
of the beve
might hav
saccharides.
n increasing
nd of the eig
12.54 respe
ly) (Figure 4
ge Given D
5 6
endix 3A, Ta
.05) affected
erage increa
e been due
Similar resu
trend in to
ghth (8th) we
ctively) TSS
4.11).
Different Tr
7 8
able 1.14) sh
d the total so
ased with gr
to hydroly
ults were rep
otal soluble
eek of storag
S with T5 a
reatments d
Treatmen
Treatmen
Treatmen
Treatmen
Treatmen
Treatmen
Treatmen
Treatmen
howed
oluble
radual
ysis of
ported
solids
ge, T1,
and T6
during
t 1
t 2
t 3
t 4
t 5
t 6
t 7
t 8
University of Ghana http://ugspace.ug.edu.gh

61
4.3.6 Colour
One of the most important quality attributes of food is its colour. The first impression of
the quality and acceptability of a particular food is judged upon its appearance
(Neilsen, 1998). Results of the consumer survey (Appendix 1B, Table 1.1) indicated that
some consumers make choices of juices based on the colour.
The juices were yellowish-orange in colour. The Minolta Chroma Meter (Minolta
CR 300 series) measures L*a*b*. L* is a colour parameter that measures the extent of
lightness, thus L* when zero (0) would indicate black, and when one hundred (100)
would indicate white; a* when positive signifies reddish colour coordinate and when
negative signifies greenish colour coordinate; b* value when positive signifies yellowish
colour coordinate and bluish colour coordinate when negative (Quarcoo, 2008).
4.3.6.1 Colour L*
The L* values for the juice were significantly (p ≤ 0.05) affected by the treatments
as well as storage time. The Multiple Range Test by LSD at the end of storage showed that
the control treatment and irradiation at 2.0 kGy significantly (p ≤ 0.05) preserved the L*
value (37.20 and 37.21 respectively) of the juice better than the other treatments.
L* values for the different treatments were gradually decreasing with storage time. This
gradual darkening observed could be due to non-enzymatic browning in an aqueous
environment that has proteins and reducing sugars (Theodosiou et al., 2011). Though the
decrease observed was across all treatments, beverages treated chemically had
significantly lower L* values. Thus chemically treated beverages turned darker as
University of Ghana http://ugspace.ug.edu.gh

62
compared to the control and irradiation at 2 kGy.
4.3.6.2 Colour a*
Storage time as well as treatments had significant (p ≤ 0.05) effects on the a* values of the
beverage. A positive a* value suggested reddish colouration, and this for all treatments
was gradually decreasing with storage time. However, the reddish colour of the beverage
was significantly (p ≤ 0.05) better preserved by irradiation (a* range 7.72-8.34) than with
chemicals (a* range 7.10-7.16) at the end of storage (Theodosiou et al., 2011) (Appendix
3A, Table 1.17).
4.3.6.3 Colour b*
The positive b* values (12.56 – 12.59) were a measure of the yellowness of the product.
Analysis of variance showed that neither storage time nor treatments significantly affected
the yellowness of the juices (Theodosiou et al., 2011).
4.3.7 Microbial analyses
The results for growth of Coliforms, Staphylococcus areaus, Escherichia coli, Yeast
/Moulds and mesophilic bacteria (Appendix 3B, Table 1.21) revealed that microbial
growths for all the treatments during the eight weeks period of study were within
acceptable limits (0 to < 10) hence insignificant. Quarcoo, (2008) recorded similar results
when Moringa juice blends were pasteurized under same conditions as the former during
storage period.
University of Ghana http://ugspace.ug.edu.gh

63
CHAPTER FIVE
5.0 CONCLUSIONS AND RECOMMENDATIONS
5.1 Conclusions
Juice was very popular among beverage consumers in the Anyaa-Sowutuom
Constituency. It is particularly popular, among the working class consumers. The choice of
juice as a beverage was usually determined by its nutrition, colour and taste, and
consumers will try a new juice product if it meets their criteria.
High amounts of carrot juice in the composite juice impacted negatively on its sensory
acceptability. On the other hand high amounts of mango and/or pineapple juice strongly
improved the scores of the sensory attributes. Using constrained mixture optimization
techniques it was possible to obtain an acceptable juice that had a ratio of 50:20:30 for
Carrot: Pineapple: Mango.
Comparing the nutrient composition of some blended juices from literature with the final
composite juice, the latter is a more nutritious beverage considering the Pro-vitamin A
(3.01mg/100ml), Iron (0.35mg/100ml) and potassium content (223mg/100ml).
The keeping quality of the cocktail beverage at room temperature (26 ± 2oC) for eight
weeks was good. Vitamin C and Pro-Vitamin A were better retained when the beverage
was preserved chemically and at lower gamma radiation doses (1 and 1.5 kGy).
University of Ghana http://ugspace.ug.edu.gh

64
Colour of the juice was however best preserved by irradiation at 2.0 kGy. The rate
of degradation of vitamins C and A were slow even at lower gamma radiation doses, when
almost 50 % of vitamin C and 71 % of vitamin A were retained after 2 months of storage.
In sum, no one particular treatment was the most efficient during the shelf stability study
period. In terms of most of the parameters, the chemical preservatives (T1 – T4) as well as
irradiation at 1kGy were the best preservatives.
5.2 Recommendation
It is hereby recommended that:
i. A survey for the acceptability, competitiveness and consumer perceptions of the
optimized cocktail beverage is carried out.
ii. Further studies may be carried out to verify the medicinal potential of the juice,
particularly for diabetic and hypertensive conditions.
iii. Further studies of shelf-life beyond two months should be carried out to ascertain the
exact quality keeping period of the product.
iv. Study on packaging effect on storability to determine the type of packaging that can
best prevent interaction between the environment and product.
University of Ghana http://ugspace.ug.edu.gh

65
REFERENCES
Adubofour, J., Amankwah, E. A. and Appiah, F. (2010). Comparative study related to physic-chemical properties and sensory qualities of tomato juice and cocktail juice produced fromoranges, tomatoes and carrots. African journal of Food Science. Vol. 4(7), pp 427-433 Aguilar-Rosas, S. F., Ballinas-Casarrubias, M. L., Naverez-Moorillon, G. V., Martín-Belloso, O. and Ortega-Rivas, E. (2007). Thermal and pulsed electric fields pasteurization of apple juice: Effects on physicochemical properties and flavour compounds. Journal of Food Engineering. 83(1): 41-46. Aguiló-Aguayo, I. G., Soliva-Fortuny, R. and Martín-Belloso, O. (2007). Comparative study on colour, viscosity and related enzymes of tomato juice treated by high intensity pulsed electric fields or heat. European Food Research and Technology. 227(2): 599-606. Ahmed, S., Wedziche, B. L. and Zeb, A. (1991). Reactivity of Food Preservation in Disposed System, Royal Society of Chemistry, p. 105-115. Akinwale, T.O. (2000). Cashew apple juice: Its use in fortifying the nutritional quality of some tropical fruits. European Food Research Technology (211), pp 205–207. Alzamora, S. E., Tapia, M. S. and Lopez-Malo, (2000). Minimally processed fruit and vegetables. Fundamental aspects and applications. Aspen Publishing Company Inc. Maryland. pp 21-181. Andress, E., Delaplane, K. and Schuler, G. (1998). Food Irradiation. Athens University of Georgia Cooperative Extension Service. www.fcs.ug.edu/pubs/current/FDNS- E-3. (Downloaded 10/23/2008) AOAC, (2003). Official Methods of Analysis of Association of Official Analytical Chemists
International. In: Horwitz, W. (Ed.), 17th ed. AOAC Press, Arlington, VA, USA.
Awsi, J. and Dorcus M., (2012). Development and Quality Evaluation of Pineapple Juice Blend with Carrot and Orange juice. Food Process Engineering, Sam Higginbottom
University of Ghana http://ugspace.ug.edu.gh
66
Institute of Agricultural Technology and Sciences, Deemed-to-be-University, Allahabad (U.P). pp 23-30. Balasubramaniam, V. M., Farkas, D. and Turek, E. J. (2008). Preserving food through high pressure processing, Food Technology, 11: 33-38. Banga, O. and Simmonds, N. W. (1984). Evolution of crop plants. 3th ed. Longman, London. p. 291–293 Baranowski, T., Mendlein, J., Resnicow, K., Frank, E., Cullen, K. and Baranowski, J. J. (2000). Physical activity and nutrition in children and youth: an overview of obesity prevention. Preventive Medicine 2000, 31:S1-S10. Bartholomew, D. P., Paull, R. E. and Rohrbach, K. G. (2003). The pineapple: Botany, production and uses. CABI Publishing, Wallingford, UK. Pp 1-301. Berning, J., Coyle, E. F., Reinaldo, P. R., Orberta, S. and Terrados, N. (1998). Sports foods for athletes: what works? Retrieved October 02, 2007 http://gssiweb.com/reflib/refs/refs/71/d0000000200000221.cfm?pid=38 Bevilacqua, A., Corbo, M. R., Campaniello, D., D'Amato, D., Gallo, M., Speranza, B. and Sinigaglia, M. (2011). Shelf life prolongation of fruit juices through essential oils and homogenization: A review. Department of Food Science, Faculty of Agricultural Science, University of Foggia, via Napoli 25, 71122 Foggia, Italy. Bhardwaj, R. L. and Mukherjee, S. (2010). Effect of fruit juice blending ratios on kinnow juice preservation at ambient storage conditions. African Journal of Food Science Vol. 5(5), Pp. 281-286 Block, G. (2004). Foods contributing to energy intake in the US: data from NHANES III and NHANES 1999-2000. Journal of Food Composition and Analysis; 17:439-447. Boekhout, T. and Robert, V. (2003). Yeasts in food. Beneficial and detrimental aspects. Hamburg: Behr’s Verlag. Pp 15-21
University of Ghana http://ugspace.ug.edu.gh

67
Botting, K. J., Young, M. M., Pearson, A. E., Harris P. J. and Ferguson, L. R. (1999). Antimutagens in food plants eaten by Polynesians: micronutrients, phytochemicals and protection against bacterial mutagenicity of the heterocyclic amine 2-amino-3-methylimidazo[4,5-f]quinoline. Food and Chemical Toxicology; 37:95–103 Bray, G. A. and Gray, D. S. (1988). Obesity, Part I–Pathogenesis. Western Journal of Medicine; 1988, 149(4):429-441. Bray, G. A., Jablonski, K. A., Fujimoto, W. Y., Barrett-Connor, E., Haffner, S., Hanson, R. L., Hill, J. O., Hubbard, V., Kriska, A., Stamm, E. and Pi-Sunyer, F. X. (2008). Relation of central adiposity and body mass index to the development of diabetes in the Diabetes Prevention Program. Diabetes Prevention Program Research Group. American Journal of Clinical Nutrition, 2008, 87(5):1212-8 Brock, K. E., Berry, G., Mock, P. A., MacLennan, R., Truswell, A. S. and Brinton, L. A. (1988). Nutrients in diet and plasma and risk of in situ cervical cancer. Journal of the National Cancer Institute; 80 (8):580-5. Bruemmer, J. H. (1975). Aroma substances of citrus fruits and their biogenesis. In Symposium on Fragrance and Flavour Substances; Drawert, F., Ed.; Verlag Hans Carl: Nurnberg, Germany, 1975; pp 167-176. Buchanan, R. L., Edelson, S. G., Snipes, K. and Boyd, G. (1998) Inactivation of Escherichia coli O157:H7 in apple juice by irradiation. Applied Environmental Microbiology. 64, 4533-4535. California Foundation for Agriculture in the Classroom (CFAITC), California Fresh Carrot Advisory Board (2011), 531-D North Alta Avvenue, Dinuba CA 93618, (559) 591-5744.
Carrot nutrition facts and health benefits, (2012). http://carrotnutritionfacts.org/, 12-Sept-2012, 11:12 PM Cheftel, J. C., Cuq, J. L. and Lorient, D. (1985). Amino acids, peptides, proteins. In: Fennema, O.R. (Ed.), Food Chemistry. New York: Marcel Dekker, p 80 .
University of Ghana http://ugspace.ug.edu.gh

68
Cho, Y. and Song, K. B. (2000). Effect of γ-irradiation on the molecular properties of BSA and β- lactoglobulin. Journal of Biochemistry and Molecular Biology. 33, 133-137. Cochran, W.G. and Cox, G.M. (1957). Experimental Designs (2nd Edition). John Wiley & Sons, New York, NY. Pp 5-9 Codex General Standard for Fruit Juices and Nectars (CODEX STAN 247-2005)
Collins, J. L. (1960). The pineapple: Botany, cultivation and utilization. Collins, J.L (eds.) Leonard Hill, New York. Pp 294
Cornell, J.A. (1983). How to Run Mixture Experiments for product Quality. American Society for Quality Control, Milwaukee, WI. Pp 12-14
Cortés, C., Esteve, M. and Frígola, A. (2008). Colour of orange juice treated by high intensity pulsed electric fields during refrigerated storage and comparison with pasteurized juice. Food Control. 19(2): 151-158.
Cserhalmi, Z., Sass-Kiss, A., Toth-Markus, M. and Lechner N. (2006). Study of pulsed electric field treated citrus juices. Innovative Food Science and Emerging Technologies. 7(1-2): 49-54. Dacosta, Y. (1994). L’Acide Sorbique et les Sorbates; CDIUPA: Massy, France. Pp 26-29 Dai, Q., Borenstein, A. R., Wu, Y., Jackson, J. C. and Larson, E. B. (2006). Fruit and vegetable juices and Alzheimer's disease: the Kame Project. American Journal of Medicine. 119(9):751-9. De Carvalho, J. M., Maia, G. A. and De Figueredo, R. W. (2007). Development of a blended non-alcoholic beverage composed of coconut water and cashew apple juice containing caffeine. Journal of Food Quality., 30: 664-681
University of Ghana http://ugspace.ug.edu.gh

69
Deanna, M. M. and Jeffrey, S. B. (2007). Acid-alkaline Balance: Role in Chronic Disease and Detoxification. Alternative therapy 13(4):62-65. Deka, B. C., (2000). Preparation and storage of mixed fruit juice spiced beverage, ph.D Thesis, IARI, New Delhi Deka, B. C. and Sethi, V. (2001). Preparation of mixed fruit juice spiced RTS beverages. India Food Packer, 42(3): 58-61 Dhaliwal, M. and Hira, K. C. (2001). Effect of storage on physico-chemical and nutritional characteristics of carrot-beet root and carrot-black carrot juice. Journal of Food Science and Technology., 38(4): 343-347. Dietz, W. H. (1998). Health consequences of obesity in youth: Childhood predictors of adult disease. Pediatrics, 101(3 Pt 2):518-25. Dionisio, A. P. and Gomes, R. T., Oetterer, M. (2009). Ionizing Radiation Effects on Food Vitamins – A Review. Brazilian Archives of Biology and Technology. Pp 1267-1278
Dutta, R. (2011). Carrots Nutrition http://www.buzzle.com/articles/carrots-nutrition. html 11 - Sept-2012, 4:41 PM. Ebbeling, C. B., Feldman, H. A., Osganian, S. K., Chomitz, V. R., Ellenbogen, S. J. and Ludwig, D. S. (2006). Effects of decreasing sugar-sweetened beverage consumption on body weight in adolescents: A randomized, controlled pilot study. Pediatrics; 117(3):673-680. El-Hazmi, M. A.and Warsy, A. S. (2002). The prevalence of obesity and overweight in 1-18year old Saudi children. Annals of Saudi Medicine, 5-6: 303-307. Encarta, (2009). Retrieved from the Encarta English dictionary. Erich, L., Martin, J. and Nico, R. (2000). Sorbic Acid in Ullmann's Encyclopedia of Industrial Chemistry, Wiley-VCH, Weinheim. doi:10.1002/14356007.a24_507
University of Ghana http://ugspace.ug.edu.gh

70
Evans, E. A., (2008). Recent trends in world and U.S. mango production, trade and consumption. (Publication FE718). Gainesville, Florida: Available at: http://edis.ifas.ufl.edu/pdffiles/FE/FE71800.pdf [accessed 25 June 2009] Fair, A. M. and Montgomery, K. (2009). Energy balance, physical activity, and cancer risk. Methods in Molecular Biology, 472:57-88. Fan, X., Thayer, D. W. and Sokorai, K. J. B. ( 2 0 0 4 ) . Changes in Growth and Antioxidant Status of Alfalfa Sprouts during Sprouting as Affected by Gamma Irradiation of Seeds. Journal of Food Protection. 2004, 67, 561- 566. FAO. Fruit Juices and Related Products. Codex Alimentarius. Volume 6; 1992. FAO, (1999). FAOSTAT statistics database. Available at: http://apps.fao.org/default.htm. FAOSTAT, (2007). FAO Statistics, Food and Agriculture Organization of the United Nations. [Online]. Available at: http://faostat.fao.org/site/339/default.aspx . [accessed 25 June 2009] Farghaly, N. F., Ghazali, B. M., Al-Wabel, H. M., Sadek, A. A. and Abbag, F. I. (2007). Life style and nutrition and their impact on health of Saudi school students in Abha, Southwestern region of Saudi Arabia. Saudi Medicine Journal, 28(3):415-21. Finnegan, D. (2003). The health effects of stimulant drinks. Nutrition Bulletin 28: p 147-155. F. D. A., (2009). Benzoid Acid. United States Food and Drug Administration. Accessed August 3, 2009. http://www.accessdata.fda.gov/scri pts/fcn/fcnDetailNavigation.cfm?rpt=scogsListing&id=36 Food and Agriculture Organization and World Health Organization of the United Nations (2008). Assuring Food Safety and Quality: Guidelines for Strengthening National Food Control Systems.
University of Ghana http://ugspace.ug.edu.gh

71
Food and Drug Administration (FDA), (2004). Guidance for industry: Juice HACCP hazards and controls guidance first edition; final guidance. Food and Drug Administration, (U. S. A.), (2005). Center for Food Safety and Applied Nutrition. FDA List of Food Additives that are Generally Recognized as Safe (GRAS); U.S. GPO: Washington, DC. Food and Drugs Authority, (2005). Guide lines for the use of Food Additive. FDA L05/AAL/1-2005, Ghana. Francis, F. (1995). Quality as Influenced by Colour. Food Quality and Preference. 6(3): 149-155. Franke, A. A., Cooney, R. V., Henning, S. M. and Custer, L. J. (2005). Bioavailability and antioxidant effects of orange juice components in humans. Journal of Agriculture and Food Chemistry. 53 (13):5170-8. Fuglie, L. J. (1999) The Miracle Tree: Moringa oleifera: Natural Nutrition for the tropics. Church World Service, Dakar, pp 68. Gailhofer, G., Wilders-Truschnig, M., Smole, J. and Ludvan, M. (1998). Asthma caused by bromelain: An occupational allergy. Clinical Allergy 18: 445-450 Ghanim, H., Sia, C. L., Upadhyay, M., Korzeniewski, K., Viswanathan, P., Abuaysheh, S., Mohanty, P. and Dandona, P. (2010). Orange juice neutralizes the pro-inflammatory effect of a high-fat, high-carbohydrate meal and prevents endotoxin increase and Toll-like receptor expression. American Journal of Clinical Nutrition.;91(4):940-9. Gowda, I. N. D. and Huddar, A. G. (2000). Evaluation of mango hybrids for storage behavior and sensory qualities. Journal of Food Science and Technology (Mysore) 37:620–623. Halliwell, B. and Gutteridge, J. M. C. (1989). Free radicals in Biology and Medicine, Oxford: Science Publications, p 45. Harnack, L., Stang, J. and Story, M. (1999). Soft drink consumption among US children
University of Ghana http://ugspace.ug.edu.gh

72
and adolescents: nutritional consequences. Journal of the American Dietetic Association ;99(4):436-441. Health Online Zine, (2010). 7 Health Benefits of Carrots – Nutritional Value of Carrot http://www.healthonlinezine.info/7-health-benefits-of-carrots-nutritional-value-of-carrot.html 7:39 AM. Posted by Hezy, 09 Dec 2010. Heinz, V., Alvarez, I., Angersbach, A. and Knorr D. (2002). Preservation of liquid foods by high intensity pulsed electric fields- Basic concepts for process design. Trends in Food Science and Technology. 12(3-4): 103-111. Huang, X. E., Hirose, K., Wakai, K., Matsuo, K., Ito, H., Xiang, J., Takezaki, T., Tajima, K. (2004). Comparison of lifestyle risk factors by family history for gastric, breast, lung and colorectal cancer. Asian Pacific Journal of Cancer Prevention; 5:419-427.
Ihekoronye, A. I. and Ngoddy, P. O. (1985). Integrated Food Science and Technology for the tropics. Macmillan Publishers Limited, London, pp 312. Information Centre of the Ministry of Agriculture and Forestry, (1999). Horticultural Entreprise Register 1998 (Puutarhayritysrekisteri 1998). Agriculture and Forestry :2. P 108. Jain, S. K. and Khurdiya, D.S. (2004). Vitamin C enrichment of fruit juice based ready-to- serve beverages through blending of Indian gooseberry (Emblica officinalis Gaertn.) juice. Plant Foods Human Nutrition (59), pp 63–66. Jellinek, G. (1985). Sensory Evaluation of Food. Theory and Practice. Ellis Horwood international publishers in science and technology, Chichester England, pp 145,159. Joshipura, K. J., Hu, F. B., Manson, J. E., Stampfer, M. J., Rimm, E. B., Speizer, F. E., Colditz, G., Ascherio, A., Rosner, B., Spiegelman, D., Willett, W. C. (2001) The effect of fruit and vegetable intake on risk for coronary heart disease. Ann Intern Med;134: 1106-1114. Joselyn, M. A. and Heid, J. L. (1963). Food Processing Operations: The Management,
University of Ghana http://ugspace.ug.edu.gh

73
machines, materials and methods. The Avi publishing Company, Inc., Westport, USA, pp 94-95. Kadman, A., Gazit, S. and Ziv, G. (1976). Selection of mango rootstocks for adverse water and soil conditions in arid areas. Acta Horticulturae. 57: 81-88. Karangwa, E., Khizar, H., Rao, L., Nshimiyimana, D. S., Foh, M. B. K., Li, L., Xia, S. Q., Zhang, X. M., (2010). Optimization of Processing Parameters for Clarification of Blended Carrot-orange Juice and Improvement of its Carotene Content. Published September 25, 2010. Advance Journal of Food Science and Technology 2(5): 268-278, 2010 ISSN: 2042-4876 Keller, S. E. and Miller, A. J. (2006). Microbiological safety of fresh citrus and apple juices. In: Sapers G M, A systematic review. American Journal of Clinical Nutrition 79:523-532 King, A. D., Pitt, J. I., Beuchat, L. R. and Corry, J. E. L. (1986). Methods for the Mycological Examination of Food. Plenum Press, New York. Knekt, P., Jarvinen, R., Reunanen, A. and Maatela, J. (2001). Flavonoid intake and coronary mortality in Finland: a cohort study. British Medical Journal.;312:478-481 Kopcke, W. and Krutmann, J. (2008). Protection from Sunburn with b-carotene – a meta-analysis. Photochemistry and Photobiology; 84:284-288. Kumar, R., Kaushik, R. A. and Chharia, A. S. (1992). Effects of post-harvest treatments on the quality of mango during storage. Haryana Journal of Horticultural Science., 21(1-2): 49 Kurowska, E. M., Spence, J. D., Jordan, J., Wetmore, S., Freeman, D. J., Piché, L. A. and Serratore, P. (2000). HDL-cholesterol-raising effect of orange juice in subjects with hypercholesterolemia. American Journal of Clinical Nutrition.;72(5):1095-100. Lintas, C. (1992). Nutritional aspects of fruit and vegetable consumption, Istituto Nazionale della Nutrizione, Rome (Italy). Pp 13-18 Luh, B. S. and Woodroof, J.G. (1975). Commercial Vegetable Processing. The Avi
University of Ghana http://ugspace.ug.edu.gh

74
Publishing Comp., Inc., Westport, USA, pp 34.
Medina, J. D. and Garcia, H. S. (2005). Pineapples. http://www.fao.org/es/ESC/en/20953/21038/index.html; http://www.fao.org/inpho/content/compend/text/ch33/AE614e01.htm. Metzger, B., T. and Barnes, D. M. (2009). Polyacetylene diversity and bioactivity in orange market and locally grown colored carrots (Daucus carota L.). Journal of Agriculture Food Chem.; 57(23):11134-9.
Mercadante, A. Z. and Rodriguez-Amaya, D. B. (1998). Effects of ripening, cultivar differences, and processing on the carotenoid composition of mango. Journal of Agriculture and Food Chemistry. 1998;46:128–30. Montville, T. J. and Matthews, K. R. (2005). Food microbiology an introduction, p. 30. American Society for Microbiology Press Moshonas, M. G. and Shaw, P. E. (1994). Quantitative determina- tion of 46 volatile constituents in fresh unpasteurized orange juice using dynamic headspace gas chromatog- raphy. Journal of Agriculture and Food Chemistry, 42, 1525-1528. Moskowitz, H. R. (1994). Product Optimization: Approaches and Applications. Blackie Academic & Professional, London, U.K. pp 97 – 136. Mynott, T. L., Ladhams, A., Scarmato, P. and Engwerda, C. R. (1999). Bromelain, from pineapple stems, proteolytically blocks activation of extracellular regulated Kinase-2 in T Cells. The Journal of Immunology 163: 2568-2575.
Natural Home and Garden, (2011). Natural Health, 5 health benefits of eating carrots. http://www.naturalhomeandgarden.com/natural-health/5-health-benefits-of-eating-carrots.aspx. Nelson, P. E. and Tressler, D. K. (1981). Fruit and Vegetable Juice Processing Technology, Ail Publishing Co. Inc., New York, p. 342-370. Neilsen, S. S. (1998). Food analysis (2nd Edition). Aspen Publication, Maryland, pp 295.
University of Ghana http://ugspace.ug.edu.gh

75
Novotny, J. A., Dueker, S. R., Zech, L. A. and Clifford, A. J. (1995). Compartmental analysis of the dynamics of beta-carotene metabolism in an adult volunteer. Journal of Lipid Research 36(8): 1825-1838. PMID 7595103. Organic Information Services Pvt Ltd, (2012). Benefits of carrot. http://www.organicfacts.net/health-benefits/vegetable/health-benefits-of-carrot.html 9th September, 2012, 1:16pm. Palomar, L. S., Galvez, F. C. F., Resurrection, A.V. A. and Beuchat, L. R. (1994). Optimization of a peanut-sweet potato cookie formulatuion. LWT-Food Science & Technology 27:314-318. Parish, M. E. (2006). Spoilage of juices and beverages by Alicyclobacillus spp. In: Sapers, G. M., Gorny, J. R., Yousef, A. E., eds. Microbiology of fruit and vegetables. Boca Raton, FL: CRC Press Taylor and Francis Group:159-180. Pearson’s Chemical Analysis of foods, (1987). Longman Scientific and technical press, USA, Pp 212, 438. Pittler, M. H., and Ernst, E. (2004). Dietary supplements for body-weight reduction: A systematic review. American Journal of Clinical Nutrition 79:529-536 Potter, N. N. (2011). Food Science. The Avi Publishing Company, Inc., Westport, USA, pp 503-504. Prinyawiwatkul, W., McWatters, K. H., Beuchat, L. R., and Phillips, R. D. (1997). Physico-chemical and sensory properties of chicken nuggets extended with fermented cowpea and peanut flours. Journal Agric. Food Chemistry 45.:1891–1899. Proctor, B. E. and Goldblith, S. A. (1951). Electromagnetic radiation fundamentals and their applications in food technology. Advances in Food Research, 3, 119-196.
University of Ghana http://ugspace.ug.edu.gh

76
Purseglove, J. W. (1972). Tropical crops. Monocotyledons. Purseglove J. W (eds.) Longman London. Pp 75-91. Purup, S., Larsen, E. and Christensen, L. P. (2009). Differential Effects of Falcarinol and Related Aliphatic C17-Polyacetylenes on Intestinal Cell Proliferation. Journal of Agriculture and Food Chemistry; 57(18): 8290–8296.
Quarcoo, P. (2008). Development of Moringa Oleifera Leaf Beverage. Thesis (MSc.) Department Of Biochemistry and Biotechnology, College Of Science, Faculty Of Biosciences, KNUST. Ramaswamy, H. S., Chen, C. and Marcotte, M. (2005). Novel processing technologies for food preservation in Barrett, D. M., Somogyi, L. P. & Ramaswamy, H (ed.), Processing fruits: science and technology, Boca Raton, FL, USA, CRC Press, 211-214. Raybaudi-Massilia, R. M., Mosqueda-Melgar, J., Soliva-Fortuny, R. and Martìn-Belloso, O. (2009). Control of pathogenic and spoilage microorganisms in fresh-cut fruits and fruit juices by traditional and alternative natural antimicrobials. Comprehensive reviews in food science and food safety; 8:157-180. Reyner, L. A. and Horne, J. A. (2002). Efficacy of a functional energy drink in counteracting driver sleepiness. Journal of Applied Physiology; 75:331-335. Rodrigo, D., Barbosa –Canavas, G.V., Martinez, A. and Rodrigo, M. (2003). Pectinmethyl esterase and natural microflora of fresh mixedorange and carrot juice treated with pulsed electric fields. Journal Food Protein (66), P 2336 Rohrbach, K. G., Bartholomew, D. P. and Paull, R. E. (2003). Pests, diseases and weeds. In. CABI, New York. Pp 203-252. Roy, W. R. (1956). Irradiated juices. Quick Frozen Foods, 18:79. Sauvaget, C., Nagano, J., Allen, N. and Kodama, K. (2003). Vegetable and fruit intake and stroke mortality in the Hiroshima/Nagasaki Life Span Study; 34:2355-2360.
University of Ghana http://ugspace.ug.edu.gh

77
Sawka, M. N. (2007). American College of Sports Medicine position stand: Exercise and fluid replacement. Medical Science Sports Exercise 39, p 377–390. Schaffer, B., Whiley, A. W. and Crane, J. H. (1994). Mango. In: Schaffer B. & Andersen P.C. (eds). Handbook of environmental physiology of fruit crops, Vol. II, Subtroprical and Tropical Crops. CRC Press, Boca Raton, Florida. Pp. 165-197 Schieber, A., Berardini, N. and Carle, R. (2001). Identification of flavonol and xanthone glycosides from mango (Mangifera indica L. Cv. “Tommy Atkins”) peels by high-performance liquid chromatography-electrospray ionization mass spectrometry. Journal of Agriculture and Food Chemistry.; 51:5006–11. Schieber, A., Ullrich, W. and Carle, R. (2000). Characterization of polyphenols in mango puree concentrate by HPLC with diode array and mass spectrometric detection. Innovative Food Science and Emerging Technologies; 1:161–6. Schulze, M., Manson, J. and Ludwig, D. (2004). Sugar-sweetened beverages, weight gain, and incidence of type 2 diabetes in young and middle-aged women. Journal of the American Medical Association; 292(8):927-934. Seager, S. L. and Slabaugh, M. R. (2000). Chemistry for today. General, Organic and Biochemistry. 4th ed. Brooks/Cole. Thomson learning, USA. 820pp. Sidel, J. L. and Stone, H. (1983). An Introduction to Optimization Research. Food Technology 37(11): 36 – 38. Singh, L. B., (1960). The Mango-Botany, Cultivation and Utilization. Leonard Hill, London. Pp 21-30 Song, H. P., Kim, D. H., Jo, C., Lee, C. H., Kim, K. S. and Byun, M. W. (2006). Effect of gamma irradiation on the microbiological quality and antioxidant activity of fresh vegetable juice. PMID:16943027 PubMed - indexed for MEDLINE
University of Ghana http://ugspace.ug.edu.gh

78
Spoto, M. H. F., Domarco, R. E., Walder, J. M. M., Scarminio, I. S., Bruns, R. E. (1997). Sensory evaluation of orange juice concentrate as affected by irradiation and storage. Journal of Food Process and Preservation, 21, 179-191. Stahl, W. and Sies, H. (2005). Bioactivity and protective effects of natural carotenoids. Biochimica et Biophysica Acta; 1740:101-107. Stahl, W., Heinrich, U., Jungmann, H., Sies, H. and Tronnier, H. (2000). Carotenoids and carotenoids plus vitamin E protect against ultraviolet light-induced erythema in humans. American Journal of Clinical Nutrition; 71:795-798. Steyn, C. E., Cameron, M. and Witthuhn, R. C. (2011). Occurrence of Alicyclobacillus in the fruit processing environment — A review. International Journal of Food Microbiology; 147:1–11.
Strube, Michael and OveDragsted, Lars. (1999). Naturally occurring antitumourigens : 4 carotenoids except 03B2-carotene. Copenhagen: Nordic Council of Ministers. pp. 48. ISBN 9789289303422.
Suzuki, K., Ito, Y., Nakamura, S., Ochiai, J., Aoki, K. (2002). Relationship between serum carotenoids and hyperglycemia: A population-based cross-sectional study. Journal of Epidemiology; 12:357-366. 6.
Talcott, S. T., Moore, J., Lounds-Singleton, A. J. and Percival, S. S. (2005). Ripening associated phytochemical changes in mangos (Mangifera indica) following thermal quarantine and low-temperature storage. Journal of Food Science; 70:337–41. Thakur, B. R., Singh, K. and Arya, S. S. (1994). Chemistry of Sorbatess, A Basic Perspective. Food Review International. 10, 71-91. Thakur, B. R. and Arya, S. S. (1993). Effect of sorbic acid on irradiation-induced sensory and chemical changes in sweetened orange juice and mango pulp. International Journal of Food Science and Technology; 28, 371-376.
University of Ghana http://ugspace.ug.edu.gh

79
Thayur, D. W. and Josephson, E. S. (1996). Radiation pasteurization of food. Meat Focus International. 5, 271-277.
Theodosiou, M., Laudet, V. and Schubert, M. (2010). From carrot to clinic: An overview of the retinoic acid signaling pathway. Cellular and Molecular Life Sciences. Basel: Vol. 67, Iss. 9. Pp 1423-1445. Tiwari, R. B. (2000). Studies on blending of guava and papaya pulp for RTS beverages. India Food Packer, 54:68. Tsong, T. (1991). Electroporation of cell membranes. Biophysical Journal. 60(2): 297-306. Tulamait, A., Laghi, F., Mikrut, K., Carey, R. B. and Budinger, G. R. (2005). "Potassium sorbate reduces gastric colonization in patients receiving mechanical ventilization". Journal of Critical Care 20 (3): 281–287. USDA Nutrient Database, (2009). http://www.nal.usda.gov/fnic/foodcomp/search. Vasavada, P. C. (2003). Microbiology of fruit juice and beverages. In: Foster T, Vasavada C. P, eds. Beverage quality and safety. Boca Raton, FL: CRC Press. Vojdani, J. D., Beuchat, L. R. and Tauxe, R. V. (2008). Juice-associated outbreaks of human illness in the United States, 1995 through 2005. Journal of Food Protection; 71:356–364.
World Carrot Museum, (2012). The Benefits of Carrot Juice. http://www.carrotmuseum.co.uk/juicebenefits.pdf www.freshplaza.com/news, (2007). detail.asp?id=704. Retrieved on 22nd October, 2007. www.nutritionanalyser.com Retrieved 08-01-2009. www.wikipedia.org. Retrieved 22-09-2008.
University of Ghana http://ugspace.ug.edu.gh

80
APPENDIX1A
UNIVERSITYOFGHANASCHOOLOFNUCLEARANDALLIEDSCIENCES
DEPARTMENTOFNUCLEARAGRICULTUREANDRADIATIONPROCESSINGQuestionnairetoestablishthebeverageconsumptionpatternintheAnyaa‐SowutuomDistrictoftheGreaterAccraRegion.1.Date……………….
A. RESPONDENTS3.Sex………….M/F4.Age[]21‐30[]31‐40[]41‐50[]51‐605.Educationalstatus
a) None d)Elementaryb) Sec/Tech/Comm. e)Vocationalc) Tertiary f)other(specify)
6.Maritalstatus…………S/M/D/W 7.Familysize……………………8.Numberofchildren/dependent………… 9.Majoroccupation…………….B.PRODUCT10.Doyoudrinkbeverages?.......................................Y/N?Ifyes,indicatetheformofbeverage(s)youdrink.Product N/Y
Coffee
Tea
Fooddrinks(e.g.Milo,Soyamilk)
Juices(fruits,vegetables)
University of Ghana http://ugspace.ug.edu.gh

81
Energydrink
Carbonateddrinks
University of Ghana http://ugspace.ug.edu.gh

82
Ifyoudrinkfruit/vegetablejuices,pleaseanswerthefollowing:11.Howoftendoyoudrinkfruit/vegetablejuices?a)Onceaweekb)Morethanonceaweekc)Occasionallyd)Hardly
12.Whydoyoudrinkfruit/vegetablejuices?
a)Snackb)Nutrientrequirementc)Asfoodsupplementd)Inexpensive
e)Other(specify)……………………………………………
13.Areyouwillingtotrynewfruit/vegetablejuiceproducts?..............................Y/N
14.Whatcharacteristicattributesdoyoulookforinafruit/vegetablejuice?a)Flavor b)Color c)Tasted)After‐tastee)Overallacceptancef)AlloftheaboveC.HEALTH15. Do you know of any health problems associatedwith the consumption of f r u i t / v e g e t a b l e juices?…………..……….Y/NIfyeslistthem………………………………………………………………………………………………………………………………………………………………………………………………………………………………………………16.Doyouknowofanygoodhealthclaimsattributedtofruit/vegetablejuices?
………….........…Y/NIfyeslistthem
………………………………………………………………………………………………17.Dothosegoodhealthclaimsinfluenceyourchoiceoffruit/vegetablejuice?……………………….…Y/N
University of Ghana http://ugspace.ug.edu.gh

83
APPENDIX1B
Table1.1FrequenciesofsomeresponsesofsurveyParameters Category Percent(%)
Gender MaleFemale
49.6050.40
Age(years) 21‐3031‐4041‐50
40.030.030.0
Maritalstatus SingleMarriedWidowedDivorced
58.335.01.25.4
Educationalstatus Elementary
Sec/Tech/Comm.
Tertiary
5.020.867.5
Majoroccupation UnemployedStudentWorker
21.22058.8
Beverageconsumer YesNo
1000
Juiceconsumer YesNo
99.170.83
Carbonateddrinkconsumer YesNo
74.1726.83
University of Ghana http://ugspace.ug.edu.gh

84
Reasonforjuiceconsumption(Inexpensive)
YesNo
0.0100.0
Trynewjuicerecipe YesNo
80.419.6
FrequencyofdrinkingjuicesOccasionally/HardlyAtleastonceaweek
40.857.5
Reasonfordrinkingjuice SnackNutrientrequirement/Foodsupplement
36.262.1
Characteristicattributeslookedfor
AftertasteFlavourOverallacceptanceColourTaste
1.23.826.82047.1
University of Ghana http://ugspace.ug.edu.gh

85
APPENDIX1C
Crosstablesofrespondentsagainstproductcharacteristics Table1.2Gender*HowOftenDoYouDrinkFruit/VegetableJuices
HOWOFTENDOYOUDRINKFRUIT/VEGETABLEJUICES
Total
OCCASIONALLY/HARDLY
ATLEASTONCEAWEEK
SEX MALE 38 80 118
FEMALE 60 58 118
Total 98 138 236
Table1.3Gender*WhyDoYouDrinkFruit/VegetableJuices
WHYDOYOUDRINKFRUIT/VEGETABLEJUICES
Total
SNACK
NUTRIENTREQUIREMENT/F
OODSUPPLEMENT
SEX MALE 44 74 118
FEMALE 43 75 118
Total 87 149 236
University of Ghana http://ugspace.ug.edu.gh

86
Table1.4Gender*AreYouWillingToTryNewFruit/VegetableJuiceProducts
AREYOUWILLINGTOTRYNEWFRUIT/VEGETABLEJUICEPRODUCTS
Total YES NO 5
SEX MALE 97 21 0 118
FEMALE 95 20 1 116
Total 192 41 1 234
Table1.5Gender*WhatCharacteristicAttributesDoYouLookFor
InJuices
WHATCHARACTERISTICATTRIBUTESDOYOU
LOOKFORINJUICES
Total
AFTERTASTE
FLAVOUR
OVERALLACCEPTANCE COLOUR TASTE
SEX MALE 2 6 30 31 48 117
FEMALE
1 3 33 16 65 118
Total 3 9 63 47 113 235
Table1.6Gender*DoYouKnowOfAnyHealthProblemswithJuiceConsumption
DOYOUKNOWOFANYGOODHEALTHCLAIMSWITHJUICE
CONSUMPTION
Total YES NO
SEX MALE 88 30 118
FEMALE 97 21 118
Total 185 51 236
University of Ghana http://ugspace.ug.edu.gh

87
Table1.7Gender*DoYouKnowOfAnyGoodHealthClaimsWithJuiceConsumption
DOYOUDRINKBEVERAGES
Total YES
SEX MALE 119 119
FEMALE 121 121
Total 240 240
Table1.8AgeGroup*HowOftenDoYouDrinkFruit/VegetableJuices
HOWOFTENDOYOUDRINK
FRUIT/VEGETABLEJUICES
Total
OCCASIONALLY/HARDLY
ATLEASTONCEAWEEK
AGEGROUP 21‐30 37 58 95
31‐41 17 53 70
41‐50 34 37 71
Total 98 138 236
Table1.9AgeGroup*WhyDoYouDrinkFruit/VegetableJuices
WHYDOYOUDRINK
FRUIT/VEGETABLEJUICES
Total
SNACK
NUTRIENTREQUIREMENT/F
OODSUPPLEMENT
AGEGROUP 21‐30 36 59 95
31‐41 31 38 69
41‐50 20 52 72
Total 87 149 236
University of Ghana http://ugspace.ug.edu.gh
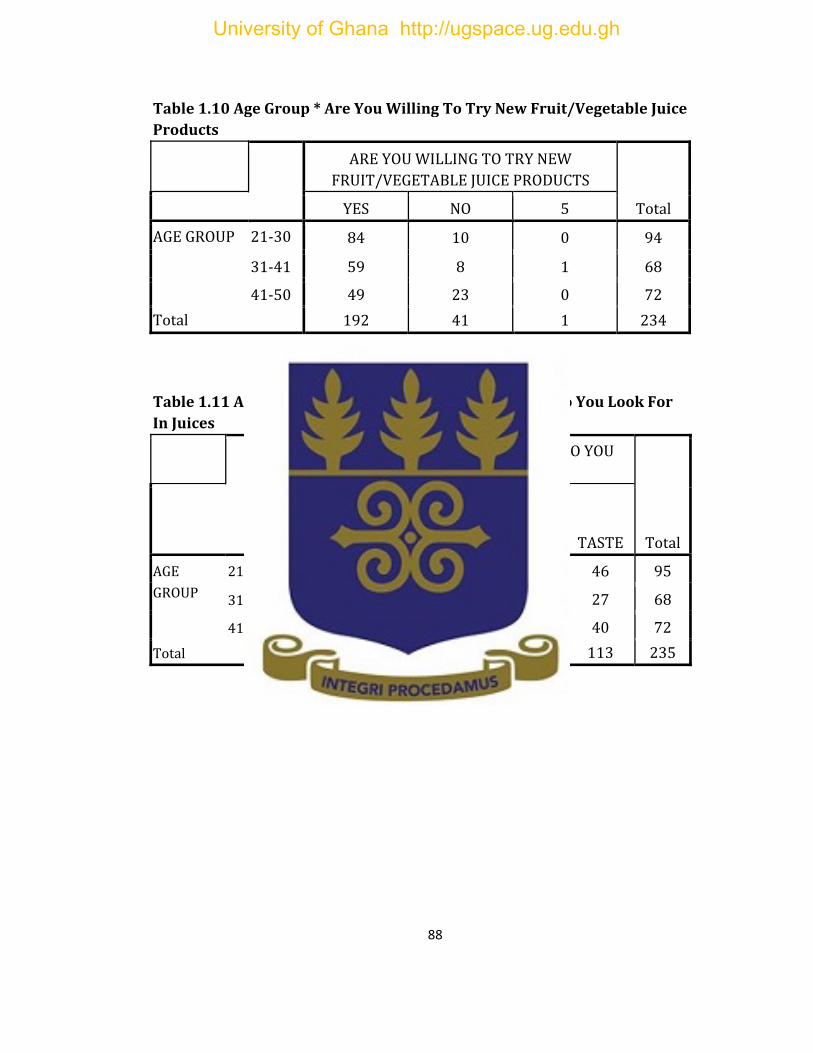
88
Table1.10AgeGroup*AreYouWillingToTryNewFruit/VegetableJuiceProducts
AREYOUWILLINGTOTRYNEW
FRUIT/VEGETABLEJUICEPRODUCTS
Total YES NO 5
AGEGROUP 21‐30 84 10 0 94
31‐41 59 8 1 68
41‐50 49 23 0 72
Total 192 41 1 234
Table1.11AgeGroup*WhatCharacteristicAttributesDoYouLookForInJuices
WHATCHARACTERISTICATTRIBUTESDOYOU
LOOKFORINJUICES
Total
AFTERTASTE
FLAVOUR
OVERALLACCEPTANCE COLOUR TASTE
AGEGROUP
21‐30 1 4 29 15 46 95
31‐41 2 4 14 21 27 68
41‐50 0 1 20 11 40 72
Total 3 9 63 47 113 235
University of Ghana http://ugspace.ug.edu.gh

89
APPENDIX 2A
UNIVERSITY OF GHANA LEGON
SENSORY EVALUATION FORM
NAME: ……………………
PRODUCT: Cocktail Beverage (Vegetable-Fruit) DATE:.…………………
INSTRUCTION:
Please, you are provided with various formulations of Carrot-Pineapple-Mango cocktail beverage. You are
requested to make independent and fair judgment on the following sensory attributes given below for
each coded product. Using the 9-point Hedonic scale with numbers 1, 2, 3 …9 (as shown below); please
indicate your preference by matching each attribute with an appropriate score or number.
A NINE POINT HEDONIC SCALE
1 – Dislike extremely 4 – Dislike slightly 7 – Like moderately
2 – Dislike very much
5 – Neither like nor dislike 8 – Like very much
3 – Dislike moderately
6 – Like slightly 9 – Like extremely
CODE COLOUR TASTE FLAVOUR AFTER TASTE OVERALL ACCEPTANCE
………. ……….. ………. …………… ……………….. …………………………….
………. .………. ………. …………… ……………….. …………………………….
………. ………. ………. …………… ……………….. …………………………….
………. ………. ………. …………… ……………….. …………………………….
Any other comment (s)…………………………………………………………………………………...
Thanks for your cooperation
University of Ghana http://ugspace.ug.edu.gh

90
APPENDIX 2B
PROTOCOL FOR SENSORY EVALUATION OF TEN FORMULATIONS USING
BALANCED INCOMPLETE BLOCK DESIGN
Panelist
1
BLOCK
1
Treatment
1
2 1 2 3 1 3 4 1 4 5 2 1 6 2 2 7 2 5 8 2 6 9 3 1
10 3 3 11 3 7 12 3 8 13 4 1 14 4 4 15 4 9 16 4 10 17 5 1 18 5 5 19 5 7 20 5 9 21 6 1 22 6 6 23 6 8 24 6 10 25 7 2 26 7 3 27 7 6 28 7 9 29 8 2 30 8 4
University of Ghana http://ugspace.ug.edu.gh

91
Panelist
31
BLOCK
8
Treatment
7 32 8 10 33 9 2 34 9 5 35 9 8 36 9 10 37 10 2 38 10 7 39 10 8 40 10 9 41 11 3 42 11 5 43 11 9 44 11 10 45 12 3 46 12 6 47 12 7 48 12 10 49 13 3 50 13 4 51 13 5 52 13 8 53 14 4 54 14 5 55 14 6 56 14 7 57 15 4 58 15 6 59 15 8 60 15 9
NB: (t=10, b=15, r=6, N=60, k=4 and λ=2)
Where, t= no. of formulations; b= no. of panelists for each set; r= testing frequency of
a formulation in each set; N= total no. of panelist (4 sets); k= no. of formulations
tested by each panelist; λ= maximum no. of panelist testing the same formulation.
University of Ghana http://ugspace.ug.edu.gh

92
Appendix3A
AnovaSummaryforShelf‐LifeStudy
Table1.12AnalysisofVarianceforpH‐TypeIIISumsofSquaresSource Sumof
SquaresDf MeanSquare F‐Ratio P‐Value
MAINEFFECTS A:Storageweek 0.65002 8 0.0812525 1281.06 0.0000*
B:Treatment 0.301281 7 0.0430402 678.59 0.0000*INTERACTIONS AB 0.104069 56 0.00185837 29.30 0.0000*RESIDUAL 0.00913333 144 0.000063425
9
TOTAL(CORRECTED) 1.0645 215
AllF‐ratiosarebasedontheresidualmeansquareerror.*Denotessignificantdifference(p≤0.05)Table1.13AnalysisofVarianceforTTA‐TypeIIISumsofSquaresSource Sumof
SquaresDf MeanSquare F‐Ratio P‐Value
MAINEFFECTS A:Storageweek 0.0820333 8 0.0102542 152.75 0.0000*
B:Treatment 0.0264 7 0.00377143 56.18 0.0000*
INTERACTIONS AB 0.0198333 56 0.000354167 5.28 0.0000*
RESIDUAL 0.00966667 144 0.0000671296
TOTAL(CORRECTED) 0.137933 215
AllF‐ratiosarebasedontheresidualmeansquareerror.*Denotessignificantdifference(p≤0.05)
University of Ghana http://ugspace.ug.edu.gh

93
Table1.14AnalysisofVarianceforTSS‐TypeIIISumsofSquaresSource Sumof
SquaresDf MeanSquare F‐Ratio P‐Value
MAINEFFECTS A:Week 41.0687 8 5.13359 1624.70 0.0000*
B:Treatment 3.4673 7 0.495329 156.76 0.0000*INTERACTIONS AB 1.91384 56 0.0341758 10.82 0.0000*RESIDUAL 0.455 144 0.00315972 TOTAL(CORRECTED) 46.9049 215 AllF‐ratiosarebasedontheresidualmeansquareerror.*Denotessignificantdifference(p≤0.05)Table1.15AnalysisofVarianceforVitaminC‐TypeIIISumsofSquaresSource Sumof
SquaresDf Mean
SquareF‐Ratio P‐Value
MAINEFFECTS A:Storageweek 11708.9 8 1463.61 1494.15 0.0000*B:Treatment 918.277 7 131.182 133.92 0.0000*INTERACTIONS AB 257.534 56 4.59881 4.69 0.0000*RESIDUAL 141.057 144 0.979561 TOTAL(CORRECTED) 13025.8 215 AllF‐ratiosarebasedontheresidualmeansquareerror.*Denotessignificantdifference(p≤0.05)Table1.16AnalysisofVarianceforcolourL*‐TypeIIISumsofSquaresSource Sumof
SquaresDf Mean
SquareF‐Ratio P‐Value
MAINEFFECTS A:Storageweek 6.21546 8 0.776933 11.19 0.0000*B:Treatment 30.2923 7 4.32747 62.34 0.0000*INTERACTIONS AB 3.91072 56 0.0698342 1.01 0.4762RESIDUAL 9.99587 144 0.0694157 TOTAL(CORRECTED) 50.4144 215 AllF‐ratiosarebasedontheresidualmeansquareerror.*Denotessignificantdifference(p≤0.05)
University of Ghana http://ugspace.ug.edu.gh

94
Table1.17AnalysisofVarianceforcolora*‐TypeIIISumsofSquaresSource Sumof
SquaresDf Mean
SquareF‐Ratio P‐Value
MAINEFFECTS A:Storageweek 4.94515 8 0.618144 1628.28 0.0000*B:Treatment 39.2429 7 5.60613 14767.3
60.0000*
INTERACTIONS AB 5.9412 56 0.106093 279.46 0.0000*RESIDUAL 0.0546667 144 0.00037963 TOTAL(CORRECTED) 50.1839 215 AllF‐ratiosarebasedontheresidualmeansquareerror.*Denotessignificantdifference(p≤0.05)Table1.18AnalysisofVarianceforcolorb*‐TypeIIISumsofSquaresSource Sumof
SquaresDf Mean
SquareF‐Ratio P‐Value
MAINEFFECTS A:Storageweek 1.63425E7 8 2.04281E6 1.00 0.4386B:Treatment 1.43014E7 7 2.04306E6 1.00 0.4336INTERACTIONS AB 1.14375E8 56 2.0424E6 1.00 0.4869RESIDUAL 2.94105E8 144 2.04239E6 TOTAL(CORRECTED) 4.39123E8 215 AllF‐ratiosarebasedontheresidualmeansquareerror.*Denotessignificantdifference(p≤0.05)
University of Ghana http://ugspace.ug.edu.gh

95
Table1.19AnalysisofVarianceforPro‐VitaminA‐TypeIIISumsofSquaresSource Sumof
SquaresDf Mean
SquareF‐Ratio P‐Value
MAINEFFECTS A:Week 1.70131E7 8 2.12664E6 527994.2
10.0000*
B:Treatment 1.58169E7 7 2.25956E6 560993.43
0.0000*
INTERACTIONS AB 1.35915E6 56 24270.6 6025.79 0.0000*RESIDUAL 580.0 144 4.02778 TOTAL(CORRECTED) 3.41898E7 215
AllF‐ratiosarebasedontheresidualmeansquareerror.*Denotessignificantdifference(p≤0.05)Table1.20Anovasummaryofformulation(optimizationphase)Sourceofvariance
Parameter
Colour Taste Flavor Aftertaste Overallacceptance
Betweengroups
3.17** 2.44** 1.20 1.49 1.76
*Significantat95confidenceinterval(CI);**significantat99%CI
University of Ghana http://ugspace.ug.edu.gh

96
APPENDIX3B
Table1.21Microbialcounts(cfu/g)forthedifferenttreatmentsduringstorage.Treatment Storage
time
Yeast &
Moulds
Staph
aureus
Total
Coliforms
E. coli Total plate
count
1 0 < 10 0 0 0 1
2 0 < 10 0 0 0 0
3 0 < 10 0 0 0 0
4 0 < 10 1 0 0 1
5 0 < 10 0 0 0 1
6 0 < 10 0 0 0 1
7 0 < 10 0 0 0 1
8 0 < 10 0 0 0 1
1 1 < 10 0 0 0 1
2 1 < 10 0 0 0 1
3 1 < 10 0 0 0 1
4 1 < 10 0 0 0 1
5 1 < 10 0 0 0 1
6 1 < 10 0 0 0 1
7 1 < 10 0 0 0 1
8 1 < 10 0 0 0 1
1 2 < 10 0 0 0 1
2 2 < 10 0 0 0 1
University of Ghana http://ugspace.ug.edu.gh

97
3 2 < 10 0 0 0 1
4 2 < 10 0 0 0 1
5 2 < 10 0 0 0 1
6 2 < 10 0 0 0 1
7 2 < 10 0 0 0 1
8 2 < 10 1 0 0 1
1 3 < 10 0 0 0 1
2 3 < 10 0 0 0 1
3 3 < 10 0 0 0 1
4 3 < 10 0 0 0 1
5 3 < 10 0 0 0 1
6 3 < 10 0 0 0 1
7 3 < 10 0 0 0 1
8 3 < 10 0 0 0 1
1 4 < 10 0 0 0 1
2 4 < 10 0 0 0 1
3 4 < 10 0 0 0 1
4 4 < 10 0 0 0 1
5 4 < 10 0 0 0 1
6 4 < 10 0 0 0 1
7 4 < 10 0 0 0 1
8 4 < 10 0 0 0 1
University of Ghana http://ugspace.ug.edu.gh

98
1 5 < 10 0 0 0 1
2 5 < 10 0 0 0 0
3 5 < 10 0 0 0 1
4 5 < 10 0 0 0 1
5 5 < 10 0 0 0 1
6 5 < 10 0 0 0 1
7 5 < 10 1 0 0 1
8 5 < 10 1 0 0 1
1 6 < 10 1 0 0 1
2 6 < 10 0 0 0 1
3 6 < 10 0 0 0 1
4 6 < 10 0 0 0 1
5 6 < 10 0 0 0 1
6 6 < 10 0 0 0 1
7 6 < 10 0 0 0 1
8 6 < 10 0 0 0 1
1 7 < 10 0 0 0 1
2 7 < 10 0 0 0 1
3 7 < 10 0 0 0 1
4 7 < 10 0 0 0 1
5 7 < 10 0 0 0 1
6 7 < 10 0 0 0 1
University of Ghana http://ugspace.ug.edu.gh

99
7 7 < 10 0 0 0 0
8 7 < 10 0 0 0 0
1 8 < 10 2 0 0 1
2 8 < 10 0 0 0 0
3 8 < 10 0 0 0 1
4 8 < 10 0 0 0 1
5 8 < 10 0 0 0 0
6 8 < 10 0 0 0 0
7 8 < 10 0 0 0 0
8 8 < 10 0 0 0 0
<10Meansnogrowthrecorded.Themethodand themediumused,Malt Extract Agar (pH 6.6 from Oxoid Ltd., Basingstoke, Hampshire – England) only records growth when there are 10 or more viable counts.
University of Ghana http://ugspace.ug.edu.gh