Beverage container investigation - National Environment ...
203
Prepared for the EPHC Beverage Container Working Group Beverage container investigation REVISED FINAL REPORT 28 April 2010 BDA Group Economics and Environment WRIGHT CORPORATE STRATEGY PTY LTD Focused Innovation ABN 23 650 712 705
-
Upload
khangminh22 -
Category
Documents
-
view
2 -
download
0
Transcript of Beverage container investigation - National Environment ...

Prepared for the
EPHC Beverage Container Working Group
Beverage container investigation
REVISED FINAL REPORT
28 April 2010
BDA Group Economics and Environment
WRIGHT CORPORATE STRATEGY PTY LTD Focused Innovation ABN 23 650 712 705

Beverage Container Investigation 28 April 2010
BDA Group and Wright Corporate Strategy 2
Acknowledgement
The NEPC Corporation, on behalf of the Environment Protection and Heritage Council (EPHC), has commissioned BDA Group in conjunction with Wright Corporate Strategy to conduct an assessment of potential options for national measures, including container deposit legislation, to address resource efficiency, environmental impacts and the reduction of litter from packaging wastes such as beverage containers.
The project team is grateful for the assistance and support provided by the NEPC and members of the Beverage Container Working Group and Stakeholder Reference Group. Despite every effort to verify data and clarify issues raised, any remaining errors or omissions are the responsibility of the authors. Accordingly, this report does not necessarily reflect the views of the EPHC or those who have provided information to us. CORRECTION: This revised report has been prepared as the material value of recovered containers attributable to a national container deposit scheme had been inadvertently calculated based on total recoveries rather than the additional recoveries attributable to the scheme over and above the base case.
Contact Details
Drew Collins Tony Wright Managing Director Joint Managing Director BDA Group Wright Corporate Strategy PO Box 4022 PO Box 176 Manuka ACT 2603 Crows Nest NSW 1585 Ph: 02 – 6282 1443 Ph: 02 – 9954 1200 Email: [email protected] [email protected]
Disclaimer: All surveys, forecasts, projections and recommendations made in reports or studies associated with the project are made in good faith on the basis of information available at the time; and achievement of objectives, projections or forecasts set out in such reports or studies will depend among other things on the actions of Australian governments and their agents, over which we have no control. Notwithstanding anything contained therein, neither BDA Group, Wright Corporate Strategy nor its servants or agents will, except as the law may require, be liable for any loss or other consequences arising out of the project.

Beverage Container Investigation 28 April 2010
BDA Group and Wright Corporate Strategy 3
SUMMARY OF KEY POINTS
Packaging waste is a highly visible part of the waste stream. It comprises around 15% of the municipal and commercial waste streams sent to landfill and includes paper/cardboard, glass, plastics, steel, and aluminium. Some 57% of waste packaging was recycled last year, with the target recycling rate under the National Packaging Covenant set at 65% by 2010.
Beverage containers are an important sub-set of all packaging waste and include mainly glass, plastics, aluminium and liquid paper board. Beverage container waste comprises around 25% of total packaging waste, or 4% of the municipal and commercial waste streams. Around 53% of beverage containers are recycled.
The impacts of used packaging are seen primarily in terms of foregone resource conservation and contribution to the litter stream.
Existing resource recovery systems, dominated by municipal kerbside collection, have been reviewed and found to be highly effective. Existing litter management programs have not been specifically investigated.
All assessed policy options can make a contribution to the twin objectives of increased resource recovery and reduced litter. Their resource recovery cost-effectiveness varies in the range $13 to $2,040 per tonne of packaging. The litter reduction effectiveness of the policy options is generally small.
The Container Deposit Scheme (CDS) is relatively expensive at an economic cost of $680 million per year. Unlike the other options which focus new investment only on the additional packaging and containers to be recovered, a national CDS would require significant changes to collection and handling systems for all beverage containers, including those already being more cost-effectively recovered through municipal kerbside systems. With an estimated additional annual recovery of around 333,000 tonnes of packaging materials (beverage containers) the cost-effectiveness of CDS is around $2,040 per additional tonne recycled. CDS could result in a 6% reduction in litter count or 19% by volume.
The Advance Disposal Fee (ADF) scheme, which can fund improved recycling schemes, is much less expensive, at around $42 million per year. The ADF annual recovery level is estimated as 611,000 tonnes of all packaging materials (including 130,000 tonnes of beverage containers) for a cost-effectiveness of $70 per additional tonne recovered. The expected litter reduction count is just 0.3%
Program-based options, including improved recovery from the hospitality and retail sectors, and in workplaces, require only minor system changes. Other policy options, such as extending kerbside recycling, and improving recovery at core consumption centres also indicate promising results. They could be aggregated to form a discrete program, and could be funded via an ADF revenue or as part of the next round of the National Packaging Covenant..

Beverage Container Investigation 28 April 2010
BDA Group and Wright Corporate Strategy 4
Direct comparison between CDS and ADF indicates that CDS is only superior if significant weight is given to litter benefits and little weight given to packaging other than beverage containers. Sensitivity analysis of key design parameters provides confidence in this finding. Further, the ADF design investigated in this study focussed on resource recovery, whereas an alternative strategy which invested at least some ADF revenue on litter reduction programs could be expected to deliver greater litter benefits.
The costs and effectiveness of the policy options considered are summarised at Table KP1.
Table KP1: Summary of costs and effectiveness of packaging recovery options
Policy Option Forecast additional packaging recovery post 2010
(tonnes/year)
Estimated scheme
economic cost
($m/year)
Approx. cost of additional recovery
($/tonne)
Container deposit scheme 333,000 680 2,040
Advance disposal fee 611,000 42 70
Improved workplace recycling
442,000 6 13
Improved recycling – core consumption centres
• Public place recovery 7,600 6 750
• Hospitality/retail 72,400 2 25
• Events recovery 7,400 11 1,500
Extended kerbside/drop-off 89,000 30 340
Voluntary glass levy 60,500 9 140
Residual waste processing 60,000 72 1,200

Beverage Container Investigation 28 April 2010
BDA Group and Wright Corporate Strategy 5
TABLE OF CONTENTS
SUMMARY OF KEY POINTS ...................................................................................................3
EXECUTIVE SUMMARY...........................................................................................................8
PART A: BACKGROUND AND SUMMARY RESULTS .........................................................28
A1 INTRODUCTION .............................................................................................................28
A2 SITUATION AND ANALYSIS..........................................................................................29
A2.1 Packaging waste and recycling performance data 29 A2.2 Beverage container recycling 30 A2.3 Location classifications 35 A2.4 Resource recovery systems 36 A2.5 Cost and effectiveness of resource recovery systems 39
A3 PACKAGING WASTE IMPACTS ....................................................................................42
A3.1 Range of upstream and downstream impacts 42 A3.2 Community desire for packaging waste measures 43 A3.3 Resource recovery 47 A3.4 Litter 49
A4 THE POLICY PROBLEM AND RATIONALE FOR NATIONAL ACTION .......................57
A5 EFFECTIVENESS OF EXISTING REGULATION/LEGISLATION ..................................59
A5.1 National packaging covenant framework 59 A5.2 CDS as implemented in South Australia 61 A5.3 Municipal kerbside recycling 61
A6 METHODOLOGY FOR ASSESSING NEW NATIONAL MEASURES ............................63
A6.1 Criteria and methodology for assessment 63 A6.2 Selection of options for assessment 65 A6.3 Base case 65
A7 SUMMARY ASSESSMENT OF POLICY OPTIONS........................................................69
A7.1 Option design and description 69 A7.2 Comparative assessment of options 72
A8 CONCLUSIONS ..............................................................................................................80
PART B: INDIVIDUAL POLICY ASSESSMENTS ..................................................................82

Beverage Container Investigation 28 April 2010
BDA Group and Wright Corporate Strategy 6
B1 CONTAINER DEPOSIT SCHEME...................................................................................82
B1.1 Assessment of CDS as national measure 84 B1.2 Summary of evaluation of CDS 97
B2 EXTENDED COVERAGE OF KERBSIDE RECYCLING / DROP-OFF ...........................99
B2.1 Extension of recycling services to poorly served LGAs 99 B2.2 Improvement of recovery rate in kerbside recycling 100 B2.3 Extension of kerbside recycling services to local small businesses 101 B2.4 Overall improvement 101 B2.5 Assessment of extended coverage of kerbside recycling/drop-off 102 B2.6 Summary of evaluation of improvements to kerbside and drop-off 103
B3 IMPROVED RECYCLING AT CORE CONSUMPTION CENTRES...............................105
B3.1 Core consumption centres 105 B3.2 Public places 106 B3.3 Events 108 B3.4 Hospitality, retail and institutions 111 B3.5 Assessment of improved recycling at core consumption centres 112 B3.6 Summary of assessment of improved recycling at core consumption centres 115
B4 IMPROVED RECYCLING AT WORKPLACES .............................................................117
B4.1 Recovery potential from workplaces 117 B4.2 Cost of recovery 118 B4.3 Assessment of improved recycling at workplaces 119 B4.4 Summary of evaluation of improved recycling at work 121
B5 RESIDUAL WASTE PROCESSING SYSTEMS............................................................122
B5.1 Mixed waste processing 122 B5.2 Tonnages processed and recoveries forecast 123 B5.3 Assessment of residual waste processing 124 B5.4 Summary of evaluation of mixed residual waste processing 126
B6 ADVANCE DISPOSAL FEE..........................................................................................127
B6.1 Assessment of an ADF 129 B6.2 Summary of evaluation of ADF 131
B7 VOLUNTARY INDUSTRY LEVY ...................................................................................133
B7.1 Assessment of voluntary industry glass levy 135 B7.2 Summary of evaluation of glass levy 137

Beverage Container Investigation 28 April 2010
BDA Group and Wright Corporate Strategy 7
B8 SENSITIVITY TESTING ................................................................................................139
B8.1 National CDS deposit level 139 B8.2 Base case container recovery levels 140 B8.3 Inconvenience costs 142 B8.4 Administrative costs 142 B8.5 Local government management costs 142 B8.6 Material prices 143 B8.7 Contamination 144
GLOSSARY ..........................................................................................................................145
REFERENCES ......................................................................................................................146
APPENDIX 1: System costs of the sa container deposit system ..................................149
APPENDIX 2: Methodology for estimating changes in packaging impacts .................150
APPENDIX 3: Impacts associated with resource recovery............................................154
APPENDIX 4: Impacts associated with litter ...................................................................181
APPENDIX 5: Rationale behind option selection............................................................190
APPENDIX 6: Base case data on containers by material & home / away split.............195
APPENDIX 7: Estimates of economic costs and benefits of a national CDS...............197
APPENDIX 8: Away from home consumption & recovery of containers by sector .....201

Beverage Container Investigation 28 April 2010
BDA Group and Wright Corporate Strategy 8
EXECUTIVE SUMMARY
This report presents the outcomes of an investigation of options for national measures to improve management of packaging wastes, with particular emphasis on beverage containers. The investigation was commissioned by the Environment Protection & Heritage Council (EPHC) in order to:
• clarify the scope and scale of problems arising from current approaches to managing packaging wastes;
• consider the effectiveness of existing measures and the rationale for further government action, at a national level; and
• assess the merits of promising alternative approaches.
The investigation was supervised by a Beverage Container Working Group (BCWG), sponsored by the EPHC, and comprising officials from Australian and State Governments. A Stakeholder Reference Group (SRG) formed by EPHC provided valuable information and advice through the course of the study.
Current arrangements for managing packaging waste
Packaging waste is a highly visible part of the waste stream and touches most citizens and business enterprises. According to the National Packaging Covenant, some 4.4 million tonnes of packaging waste were generated in Australia during 2006/071. Nearly 54% of this waste packaging was recycled2, up from 39% in 2002/033.
The target recycling rate under the National Packaging Covenant is 65% by 2010. This target carries the endorsement of the signatories to the National Packaging Covenant.
The main packaging materials based on weight are paper/cardboard (60% of consumption), glass (23%), plastics (13%), and steel/aluminium (4%). Overall consumption of each packaging material measured in tonnes, accompanied by recycling rates for these materials in 2005 and 2006-07 are set out in Table E1.
The data in the table demonstrate that recycling of plastics and aluminium packaging at 2005 is in line with the 2010 target. On the other hand, steel recycling is well below the 2010 target, while paper/cardboard and glass recycling is within reach of the target.
1 National Packaging Covenant, updated 2006/07 data. Data for 2007/08 indicate an increase to 57% recycling. 2 Ibid. 3 The (previously) “agreed” Covenant baseline

Beverage Container Investigation 28 April 2010
BDA Group and Wright Corporate Strategy 9
Table E1: Scale and recycling of packaging materials
Material 2005 Consumption
(tonnes)
2005 Recycling
performance (by material)
2007 Consumption
(tonnes)
2007 Recycling
performance (by material)
2010 Target recycling
(by material)
Paper/cardboard 2,608,000 66% 2,639,000 65% 70-80%
Glass 893,031 44% 1,011,700 39% 50-60%
Steel 92,399 38% 116,439 29% 60-65%
Aluminium 50,210 71% 48,791 70% 70-75%
Plastics 586,840 31% 585,296 30% 30-35%
Totals 4,230,480 56% 4,401,226 54% 65%
Source: National Packaging Covenant. Annual Report 2005-06 and updated 2006-07 data.
Beverage containers are a substantial sub-set of the full scope of packaging materials, though it is difficult to specify with precision the proportion of the segment occupied by beverage containers – data are usually collected for the entire packaging materials segment and not classified by sub-set. In any case, there is no broadly agreed definition of just what is regarded as a beverage container, at least at the edges of what is/is not included.
Beverages are consumed in various settings and performance in recovering beverage containers for recycling varies with the consumption setting. Two main beverage container consumption sectors are usually considered, at-home and away-from-home.
The at home (municipal) sector
The at-home consumption sector is largely catered for with organised recovery systems in the form of municipal kerbside recycling collections run by local government and depot drop-off services in more remote/lower density areas. In excess of 96% of Australian residential premises have access to either (or both) a kerbside collection service or a depot drop-off service for recyclables. Recovery performance for all recyclable materials discarded to municipal kerbside recycling collection service varies between LGAs in the range of around 60% to 80% - with 20% to 40% discarded to the residual waste bin.
Beverage container discards are a targeted resource in municipal kerbside recycling collections. As a result, they are now a small proportion of the municipal residual waste stream. However, packaging wastes, generally, are reportedly not as fully captured in municipal

Beverage Container Investigation 28 April 2010
BDA Group and Wright Corporate Strategy 10
kerbside recycling collections. They remain a substantial proportion of the municipal residual waste haul (generally in the range 15% to 25%)4.
Estimates of the scale and recycling of beverage containers, as distinct from all packaging materials, indicate that some 740,000 tonnes of beverage containers consumed and discarded from the at-home sector. The estimated recycling performance for the at-home beverage container sector is 61%.
The away from home sector
The away-from-home beverage consumption sector is far more diverse and includes the following types of beverage container consumption points:
• public places, such as parks, beaches on other open-air locations;
• organised events, some of which provide recycling options;
• work locations, including offices, factories, etc; and
• commercial premises such as hotels, cafes, restaurants, institutional settings, and shopping centres.
The away-from-home beverage consumption sector is estimated at around 30% of total consumption indicating that some 320,000 tonnes per annum would be consumed in the sector. Recovery drivers and systems are not well organised for recycling of beverage containers discarded away from home, with the exception of South Australia through its container deposit scheme. National recovery performance for the away-from-home sector is estimated to be in the range of 15% and 25% of consumption or 50,000 tonnes of actual recycling). This would leave possibly a further 255,000 tonnes per annum potentially available for recovery and recycling.
A summary of the estimates made in the above analysis is set out at Table E2. This Table indicates that current recovery effectiveness is 68% for the at-home sector and 20% for the away-from-home sector. Overall current beverage container recovery effectiveness is estimated to be 53%.
4 The above estimates are based on work undertaken by WCS for various State and Local Government entities.

Beverage Container Investigation 28 April 2010
BDA Group and Wright Corporate Strategy 11
Table E2: Summary of estimates of scale and recycling of beverage containers
Sector Estimated recovery
performance* (tpa)
Estimated recycling
performance*
(tpa)
Estimated potential further recovery
(tpa)
Estimated Consumption
(tpa)
At-home consumption
490,000 450,000 250,000
740,000
Away-from-home consumption
65,000 50,000 255,000 320,000
Total 555,000 500,000 505,000 1,060,000
Source: Estimated by BDA/WCS * The terms “Recovery performance” and ”Recycling performance” have the same definition and relate to the
data under the same headings as reported in the 2006/2007 State and Territory reports to NEPC on the Used Packaging Materials NEPM, while the difference between “recovery” and “recycling” represents the contamination removed during beneficiation.
In the municipal sector, which covers at-home consumption and beverage container discards at parks and other local government spaces, the further recovery potential of beverage containers at 0.25 million tonnes is only 3.6% of total municipal waste disposal.
Beverage containers are a similarly low proportion of the commercial waste (away-from-home) sector. Further beverage container recovery potential from this sector, at an estimated 0.255 million tonnes, is only 4.0% of total commercial disposal.
Resource recovery systems
Resource recovery systems were developed largely as a result of community and government concern that various items of post-consumer waste were potentially recyclable resources being lost through disposal to landfill. The main systems in place were initially applied to the municipal sector and continue largely to service household needs.
The C&I waste generating sector has been slow to seek arrangements for recycling, and waste contractors have largely declined the opportunity to promote recycling services to their C&I sector clients. Moreover, their contracts with clients generally exclude the scope for a third-party recycling collection contractor to provide specialised recycling services.
The main recovery systems in place that cover beverage containers and their relative capture quantities of beverage containers are set out at Table E3.

Beverage Container Investigation 28 April 2010
BDA Group and Wright Corporate Strategy 12
Table E3: Estimated scale of beverage container recycling through municipal kerbside collection and away-from-home recovery systems
Resource Recovery System Estimated contribution to recovery haul (tpa)
Proportion of total beverage container recovery
Municipal kerbside collection 430,000 78%
Recycling drop-off services 24,000 4%
SA container deposit scheme 36,000 6%
C&I collection services at events, work locations and commercial premises
65,000 12%
Total 555,000 100%
Source: Estimated by BDA/WCS
The estimated financial5 cost and recovery effectiveness for the main recovery systems currently in use for beverage containers and packaging more broadly are at Table E4. This indicates a weighted average cost across all recoveries might be in the order of $300 per tonne.
Table E4: Financial costs and effectiveness of current packaging recovery systems
Resource Recovery System Estimated contribution to
recovery haul (tpa)
Estimate cost of recovery ($/tonne)
Proportion of total beverage container
recovery
Municipal kerbside collection 430,000 $300 78%
Recycling drop-off services 24,000 $400 4%
SA container deposit scheme 36,000 $600 6%
C&I collection services 65,000 $250 12%
Total 555,000 $318 100%
Source: Estimated by BDA/WCS The policy problem and the rationale for national action
The rationale for government action to address the ‘packaging waste’ problem rests on a range of environmental impacts associated with packaging production, consumption and disposal that
5 Financial and economic costs reported differ to the extent that the latter may include non-financial impacts
such as inconvenience costs. No environmental impact values have been included in either case.

Beverage Container Investigation 28 April 2010
BDA Group and Wright Corporate Strategy 13
represent classic sources of market failure - the creation of greenhouse gases, air and water pollutants, landfill disamenity and so on are termed ‘externalities’, in that those who create them, in the absence of government action, do not incur the costs (or benefits). Accordingly they are not managed at optimal levels from a community perspective.
The rationale for a national measure could rest on its contribution in reducing these impacts. A further rationale for government action to address the ‘packaging waste’ problem could relate to a desire across all levels of government to seek changes in community attitudes and motivation towards ecologically sustainable development. Whether the marginal benefits of a national measure would outweigh the costs involved cannot be answered in this report as the valuation of benefits was outside the scope of the study.
To assist problem definition and option assessment objectives the BCWG, following a preliminary report, formed the view that both container recovery (as a proxy for upstream benefits notably resource conservation) and litter reduction impacts were to be given a similar depth of treatment in the report.
In forming this view the BCWG noted that even where the easily quantified values of reduced impacts (as covered in this report) could be expected to be minimal or insignificant, there remained a justification for inclusion ‘on the basis that greater (potentially significant) value may be placed on these reductions by individuals and communities’.
Potential policy options to tackle the packaging waste problem
A broad array of policy options was initially assessed in order to arrive at a manageable short-list. Seven options were selected for detailed assessment:
• Container deposit scheme.
• Advance disposal fee.
• Voluntary industry glass levy.
• Extended coverage of kerbside recycling/drop-off.
• Improved recycling at core consumption centres including the hospitality/ retail/institutions sector, public places and events.
• Improved recycling at workplaces.
• Residual waste processing systems.
Each policy option is described at Box E1.
Implementation of an improved National Packaging Covenant has not been considered as a stand-alone option. However, various options assessed are candidates to contribute to an improved Covenant scheme. The advanced disposal fee for instance has potential application, as do recovery schemes that target the away from home consumption sector.

Beverage Container Investigation 28 April 2010
BDA Group and Wright Corporate Strategy 14
Box E1: Option design and description
Container deposit scheme
A container deposit scheme (CDS) entails a fee levied on the sale of a container product that is refunded after the product has been used and when the container is returned for recycling. The national CDS scheme evaluated here has been developed in consultation with the BCWG and SRG. The scheme structure is based primarily on the CDS operating in California with the scheme administered by a government body. The scheme includes aluminium, glass, plastic, liquid paperboard and steel containers, including all containers for beer, soft drink, fruit juices, milk (both plain and flavoured), wine and spirits and flavoured water and sports drinks. A single deposit of 10 cents per container would apply under the scheme.
Extended coverage of kerbside recycling/drop‐off
Improvements to kerbside recycling are considered under this option including:
• Extension and improvement of the coverage of recycling opportunities throughout Local Government areas through seed funding for new/upgraded drop‐off depots in remote LGAs.
• Improvement in the beverage container recovery rate within the existing kerbside recycling network through additional local government education programs.
• Further extension of Local Government kerbside recycling services to provide access to local small businesses.
Improved recycling at core consumption centres
Core consumption centres are public places and event venues where consumption of food and beverages is concentrated in a small area and the waste stream generally contains large amounts of beverage containers and food packaging. The options evaluated in this sector include:
• Uniform national measures to address public place recycling implemented through existing local government ordinances.
• Uniform national measures to address event recycling implemented by amending existing local government minimum development approval requirements for promoters seeking permission to run events.
• Encouraging private sector operators in the hospitality, retail and institutions sector to increase recycling by providing seed funding support.
Improved recycling at workplaces
Initial seed funding support would be provided to kick‐start the collection of additional recyclables and to build collection runs into financially viable and productive services, such that in a relatively short period of time the services become sustainable and self‐funding and do not require on‐going subsidy from government.
Residual waste processing systems
Systems for handling and processing residual waste that might lead to increased recovery of packaging materials, and beverage container packaging in particular, are referred to as AWTs (alternative waste technologies) and are applied to mixed waste streams with the intent of

Beverage Container Investigation 28 April 2010
BDA Group and Wright Corporate Strategy 15
capturing potentially valuable resources.
With increasing efforts at resource recovery in major metropolitan centres, introduction of mixed residual waste processing systems is becoming more common. The policy option considered here is to accelerate the introduction of mixed waste processing via AWT schemes through a national initiative encouraging jurisdictions to use mixed waste processing to meet their waste reduction targets.
Advance disposal fee
There are many ways in which an advance disposal fee (ADF) could be crafted. We evaluate a uniform weight‐based fee applied per tonne of all packaging materials (not just beverage containers). The fee would have a legislative basis and would be managed by a government body. The revenues collected would be used to subsidise increased recovery of packaging materials, with the fund manager seeking the most cost‐effective recovery options. For the purpose of this illustrative analysis, a fee of $10 per tonne of packaging material has been used, with the revenues allocated to the policy options from the list above with the lowest cost per tonne of additional packaging recovery.
Voluntary industry levy
In mid‐2007 four major beverage companies in Australia – Coca Cola Amatil, Lion Nathan, Fosters and Cadbury Schweppes – developed a proposal for companies to pay a voluntary recycling levy of $10 per tonne of glass packaging used to raise funds to increase the collection of glass containers for recycling. We assess a voluntary levy on glass beverage containers with a similar structure to that proposed by the beverage companies. The levy would be payable by major beverage companies and other glass fillers. Voluntary administration would be undertaken by the beverage industry with revenues allocated to subsidise increased glass recovery. For the purpose of this illustrative analysis a fee of $10 per tonne of glass packaging is used with the revenues allocated to the options from the list above with the lowest cost per tonne of additional glass recovery.
Methodology for assessment of policy options
The comparative merit of each policy option was assessed against seven criteria – developed in consultation with the BCWG and SRG, namely:
• Suitability as a national measure;
• Effectiveness in achieving improvement in resource recovery and litter reduction in line with the defined problem;
• Compatibility with, and impact on, existing (or planned) waste and recycling systems;
• Cost and complexity of implementation and operation;
• Financial impacts on each affected stakeholder group;
• Likely performance across jurisdictions, and in defined location categories (metro, regional, remote); and,
• Cost-effectiveness in addressing the problem.
Beverage Container Investigation 28 April 2010
BDA Group and Wright Corporate Strategy 16
Comparative Assessment of Options
Criteria 1: Suitability as a national measure
Nationally operated schemes can provide consistent governance and system design across all jurisdictions, providing national clarity for industry and potential advantages over state based schemes.
A national CDS or ADF would require new regulatory arrangements, either through national legislation or parallel state/territory legislation. National CDS or ADF schemes could bring about scale efficiencies in industry compliance costs and regulatory effort as well as through national system administration. On the other hand, collection activities operate at a local level and some regional collection planning and system oversight would be necessary. The level of accuracy of this preliminary study does not provide a basis for a clear conclusion on the relative costs of a national versus a state/territory approach.
Extending coverage of kerbside recycling/drop-off could be achieved under the National Packaging Covenant (NPC) without change to legislation or institutions. Implementation would need to be tailored to specific priority areas (ie: remote areas and small business) and would need to integrate with existing local government services. Implementation at a national level would provide no particular advantage.
The voluntary glass levy could be efficiently implemented at a national level and beverage companies have already expressed a willingness to pursue this option. No new legislation or institutions would be required, most beverage companies operate at a national scale, and there is already co-operation at a national level through the NPC.
National implementation would not assist in improving recycling at workplaces or at core consumption centres. Nor would a national measure be superior to state-based action in implementing residual waste processing. However, market incentives could be provided at a national level under the NPC.
The assessment is summarised at Table E5.

Beverage Container Investigation 28 April 2010
BDA Group and Wright Corporate Strategy 17
Table E5: Policy suitability as a national measure
Policy Option Suitability
Container deposit scheme High
Advance deposit fee High
Extended kerbside and drop-off recycling Low
Improved recycling - core consumption centres Low
Improved recycling - workplaces Low
Residual waste processing Low
Criteria 2: Effectiveness in achieving improvement in resource recovery and litter reduction
Effectiveness for litter reduction
A national CDS is expected to provide the greatest reduction in overall litter levels, with the potential to provide a 6% reduction in the total national litter count and a 19% reduction in the total national litter volume. Table E6 summarises the possible outcomes.
Table E6: Potential reduction in total national litter count across options
Policy Option Sectors targeted Potential reduction national litter count
Container deposit scheme All sectors 6%
Extended kerbside and drop-off recycling
Residences and businesses serviced by kerbside drop/ off
Insignificant
Improved recycling - core consumption centres
• Public place recovery
Parks, gardens, beaches, etc
0.3%
• Events recovery Events 0.3%
• Hospitality/retail/institutions Hospitality/retail/ institutions Insignificant
Improved recycling- workplaces
Small commercial and industrial businesses
Insignificant
Residual waste processing systems
All sectors Insignificant
ADF Parks, gardens, beaches, etc 0.3%
Voluntary glass levy Hospitality/ retail/ institutions Insignificant
Beverage Container Investigation 28 April 2010
BDA Group and Wright Corporate Strategy 18
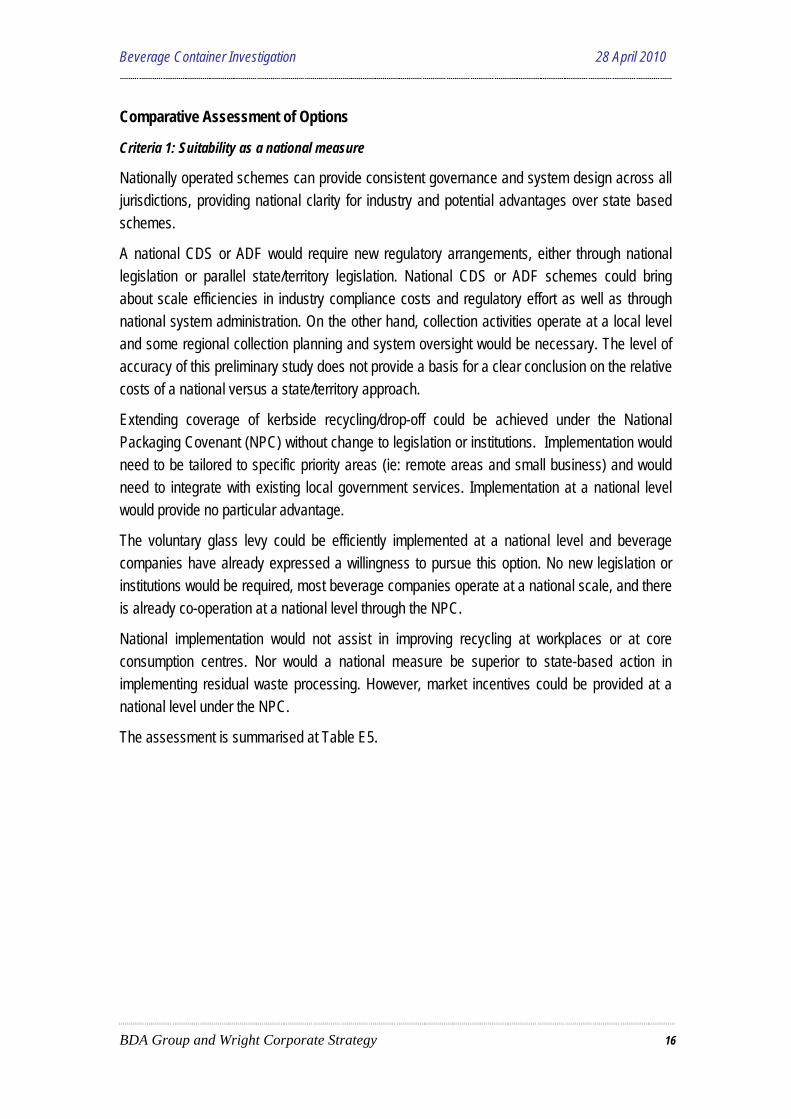
The only options other than CDS expected to provide significant litter outcomes are the public place and events recycling programs. The advance disposal fee, as assessed in this study, has some impact to the extent that programs for public places are funded with the revenues. An alternative strategy which invested ADF revenue more on litter reduction programs could be expected to deliver greater benefits.
Effectiveness for resource recovery
The options with the potential to achieve the greatest increase in overall packaging recovery are the ADF (around 610,000 tonnes per year), the workplace recovery option (around 440,000 tonnes per year) and the container deposit system (around 330,000 tonnes per year) as shown at Figure ES-1.
Figure E1: Packaging material recovered under each option
0
200,000
400,000
600,000
ADF
Workpla
ce rec
overy
CDS
Hospital
ity & re
tail re
covery
Volunta
ry glas
s levy
Residua
l wast
e proc
essing
syste
ms
Improve
kerbsi
de rate
Kerbsid
e for sm
all bus
iness
Extend
drop-o
ff
Public p
lace re
covery
Events r
ecover
y
Packaging material recovered
(ton
nes pa)
The potential for recovery of designated beverage containers (as distinct from all packaging) favours CDS, with around 3.1 billion containers per year (330,000 tonnes per year) followed by the ADF with 1.6 billion containers per year (around 130,000 tonnes per year). The improved recycling schemes, particularly when targeted to the hospitality/retail/institutions sector, also perform well (see Figure E2).

Beverage Container Investigation 28 April 2010
BDA Group and Wright Corporate Strategy 19
Figure E2: Beverage containers recovered under each option
0
1,000
2,000
3,000
4,000
Public p
lace re
covery
Events r
ecover
y
Workpla
ce rec
overy
Extende
d kerb
side /
drop o
ff
Residua
l wast
e proc
essing
syste
ms
Hospital
ity / re
tail / in
stitutio
ns rec
overy
Volunta
ry glas
s levy
Advance
dispos
al fee CDS
Beverage
con
tainers recovered (m
illion pa)
Table E6 summarises the expected outcomes for each option. It should be noted that the recovery numbers relate to the specific design selected for each of the option.
Table E6: Resource recovery outcomes for each option
Option Packaging material recovered (tonnes pa)
Beverage containers recovered (million pa)
Container deposit system 333,402 3,114
Extended kerbside / drop-off 89,000 348
Public place recovery 7,600 153
Events recovery 7,400 147
Hospitality / retail / institutions recovery 72,400 842
Workplace recovery 442,000 264
Residual waste processing systems 60,000 661
Advance disposal fee 611,000 1,608
Voluntary glass levy 60,500 931
Criteria 3: Compatibility with, and impact on, existing (or planned) waste and recycling systems
The policy options considered are broadly compatible with existing waste and recycling arrangements and systems. A CDS is expected to have a positive financial impact on existing

Beverage Container Investigation 28 April 2010
BDA Group and Wright Corporate Strategy 20
local government kerbside systems with financial saving arising in two main ways: reduced kerbside collection and recycling system costs; and reduced landfill and landfill levy costs.
The financial impact on local government kerbside systems is estimated at a net saving of $32m per year. The impacts are summarised in Table E7.
Table E7: Financial impact of national CDS on local government
Impact Total value
($m / yr)
Deposits collected by local government ($m) $78
Kerbside savings (see Table B1.7) $24
Landfill cost savings (for new recovery) $13
Landfill levy savings (for new recovery) $7
Material values lost by local government ($m) - $90
Net financial saving $32
The ADF, glass levy, and extended/improved recycling initiatives provide the greatest flexibility to pursue cost-effective approaches that integrate with existing systems. The residual waste processing option involves use of emerging technology that is primarily aimed at recovering biodegradable material, however this is becoming a main-stream alternative to waste disposal at landfill in a number of centres.
Criteria 4: Cost and complexity of implementation and operation
The highest cost option is CDS at nearly $680m per year. The mixed waste processing option costs around $72m per year. The ADF and extended kerbside/drop-off are substantially less costly at around $40m per year and $30m per year respectively. The lowest cost options are the hospitality / retail / institutions, workplace recovery and public place recovery (at around $5m per year or less). It should be noted that the options provide a range of recovery outcomes and this is considered further in the criteria on cost-effectiveness below.
CDS and ADF require the most complex institutional and regulatory arrangements, including the need for continuous compliance monitoring. Other options are free from administrative complexity. The residual waste processing scheme involves technical complexity, particularly in order to ensure that the container yield has value to reprocessors.

Beverage Container Investigation 28 April 2010
BDA Group and Wright Corporate Strategy 21
Table E8: Net economic cost of options (excludes environmental costs and benefits)
Option Economic cost ($ m per annum)
Container deposit system $680.0
Extended kerbside/drop-off $30.4
Public place recovery $5.7
Events recovery $11.2
Hospitality/retail/institutions recovery $1.5
Workplace recovery $5.8
Residual waste processing systems $72.0
Advance disposal fee $42.4
Voluntary glass levy $8.6
Criteria 5: Financial impacts
The CDS has the greatest impact on consumers of around $300m in total and also provides the greatest savings for local government of around $32m per year. The ADF and voluntary glass levy increase costs to the packaging / beverage industry and therefore consumers by $46m and $9m per year respectively.
The financial impact of the residual waste processing systems option is around $72m which would be borne by all three levels of government and passed on to taxpayers and ratepayers of the three major capital cities in line with a negotiated cost sharing program.
All options reduce landfill levies to State government in line with the increase in diversion from landfills. Increases in diversion from landfill take into account reductions in consumption or source reduction as well as increased recovery. Table E9 summarises the financial impacts.

Beverage Container Investigation 28 April 2010
BDA Group and Wright Corporate Strategy 22
Table E9: Incidence of financial impacts across community under each option ($m per year)
Initial incidence
Final incidence
CDS Kerbside options
Core cons.
centres
Workplace recovery
Residual waste
process
ADF Glass levy
Federal govt Taxpayers -$161 -$1 -$2 -<$6 -$1 -
State govt Taxpayers -$73 -$2 -$2 -<$9 -$144 -$24
Residents -$20 -$17 -
}
} - $722
}
} $06 $06 Local govt
Businesses
+$325
-$9 - - - - -
Beverage industry
Beverage consumers
-$55 - - - - - -$9
Beverage consumers
Beverage consumers
-$250
Packaging industry
Packaging consumers
- - - - - -$46 -
Notes: Figures rounded to nearest $1m. A negative number means a financial cost, a positive number means a financial benefit.
1. Administrative costs of system. 2. Shared across three levels of government under negotiated cost sharing arrangement. 3. Fall in revenue from landfill levies based on increased recovery. 4. Fall in revenue from landfill levies based on total packaging diverted from landfill taking into account increased
recovery as well as source reduction and reduced consumption from imposition of ADF / glass levy. 5. Savings for kerbside systems plus savings in landfill disposal costs and levies plus deposits collected less material
revenues lost. 6. For any ADF or glass levy programs to be implemented by local government, the administration costs will be
included in the ADF revenue allocation.
Criteria 6: Likely performance across jurisdictions and in defined location categories
A national CDS provides the best performance in terms of litter outcomes across the whole litter stream and all types of sites that are currently littered. Many options target specific sectors/locations for increased recovery of materials and therefore the outcomes are limited to those areas.
The outcomes of the ADF and glass levy would depend on how the funds were allocated. If funds were allocated based on the basis of potential cost-effectiveness, this would probably focus on metropolitan areas and other high yielding opportunities. Thus the activities may not be as broadly based as for options to extend kerbside/drop-off recycling.
Criteria 7: Cost-effectiveness in addressing the problem
Cost-effectiveness is a measure of the input expenditure necessary to secure a desired output or resolve a nominated problem – improved resource recovery and reduced litter. The

Beverage Container Investigation 28 April 2010
BDA Group and Wright Corporate Strategy 23
assessment of policy options culminates with comparisons of the cost-effectiveness of the options in addressing both aspects of the packaging problem.
Cost-effectiveness for resource recovery
The costs per tonne of packaging recovered vary across options from around $13 to $2,040. Figure E3 shows the cost per tonne for each option.
Figure E3: Economic cost per tonne of packaging recovered under each option
$0
$500
$1,000
$1,500
$2,000
$2,500
Hospital
ity & re
tail re
covery
Workpla
ce rec
overy ADF
Glass le
vy
Extende
d kerb
side /
drop-o
ff
Public p
lace re
covery
Residua
l wast
e proc
essing
syste
ms
Events r
ecover
yCDS
The cheapest options per tonne of materials recovered are the hospitality sector and workplace recovery options, followed by the ADF and voluntary glass levy (that utilise a mix of programs to achieve increased resource recovery). It should be noted that some options may confer substantial benefits other than recovery of packaging (eg. residual waste processing).
Sensitivity testing of key parameters was undertaken and is reported in Table E10. No change in the ranking of options by cost-effectiveness was found within the range of tested parameters.

Beverage Container Investigation 28 April 2010
BDA Group and Wright Corporate Strategy 24
Table E10: Sensitivity testing of key option parameters
Parameter change Impact on estimated cost-effectiveness
CDS deposit level increase from 10 to 20 cents Economic cost per tonne of CDS falls from $2,040 to $1,670
Assumed beverage container recovery levels remained at 2007 levels and the CDS deposit was set at:
• 10 cents
• 20 cents
Economic cost per tonne of CDS falls from $2,040 to
• $1,267
• $1,125
Assumed inconvenience cost under CDS scheme omitted
Economic cost per tonne of CDS falls from $2,040 to $1,370
Ten-fold increase in the assumed administrative costs of an ADF
The economic cost per tonne of the ADF increases from $69 per tonne to $83 per tonne
If the costs of the program options were increased by 20% to account for costs to local government
The change does not impact on the relative cost-effectiveness ranking of options
Recyclate prices 50% lower than the longer term averages assumed to prevail
• CDS
• ADF
Economic cost per tonne of
• CDS increases from $2,040 to $2,120
• ADF increases from $70 to $447
Glass contamination benefits attributable to CDS are realised
Economic cost per tonne of CDS falls from $2,040 to $2,010
The packaging, beverage container and litter outcomes per $1m spent under each option are shown in Table E11.

Beverage Container Investigation 28 April 2010
BDA Group and Wright Corporate Strategy 25
Table E11: Outcomes per $1m economic cost under each option
Option Cost-effectiveness (for each $1m cost)
Packaging recovered (tonnes)
Containers recovered (million)
Container deposit system 490 5
Extended kerbside / drop-off 2,928 11
Public place recovery 1,333 27
Events recovery 661 13
Hospitality / retail / institutions 47,013 547
Workplace recovery 75,815 45
Residual waste processing 833 9
Advance disposal fee 14,408 38
Voluntary glass levy 7,010 108
Cost-effectiveness for litter reduction
The litter outcomes per $1m spent under each option are shown in Table E12.
Table E12: Litter outcome per $1m economic cost under each option
Policy option Reduction in litter count
Container deposit system 0.01%
Extended kerbside / drop-off negligible
Public place recovery 0.05%
Events recovery 0.02%
Hospitality / retail / institutions negligible
Workplace recovery negligible
Residual waste processing negligible
Advance disposal fee 0.01%
Voluntary Glass Levy negligible
These results are summarised in Figure E4. The figure plots the efficiency of each option in delivering the two key objectives of recovering containers and reducing litter. Options in top right corner have relatively high recovery of both containers and litter for every $1m spent.

Beverage Container Investigation 28 April 2010
BDA Group and Wright Corporate Strategy 26
Options in the bottom left corner have relatively low levels of recovery of both containers and litter for every $1m spent.
Figure E4: Relative efficiency of options in achieving key objectives
0.00%
0.01%
0.02%
0.03%
0.04%
0.05%
0 20 40 60 80 100 120
Million containers recovered per $1m
Redu
ctio
n in
litte
r cou
nt p
er $1
m
The figure shows that the hospitality sector recovery option is the most efficient for recovering containers and the public place recovery option is the most efficient for recovering litter.
Assessment of policy options
All assessed policy options can contribute to the objective of increased resource recovery. Their resource recovery economic cost-effectiveness varies in the range $13 to $2,040 per tonne of recycling. CDS sits at around $2,040 per tonne while an ADF has a cost-effectiveness of $70 per tonne.
The litter reduction effectiveness of the policy options is at best small, with only CDS making a modest contribution of a 6% reduction in litter count or 19% in litter volume.
A national CDS would require significant changes to collection and handling systems for beverage containers and would bring about a moderate increase in resource recovery. The scheme would add significant system costs to the national recycling bill as well as a financial impost on consumers due to the value of unredeemed deposits. Inconvenience in returning beverage containers would represent another impost.
Program-based options to improve on present recycling systems require only minor system changes (and costs) to handle additional containers recovered. This supports their superior cost-competitiveness.
Public place
CDS Glass levy
Hospitality / retail etc
◆ 550
ADF Work place
Events
RWP
Kerbside //

Beverage Container Investigation 28 April 2010
BDA Group and Wright Corporate Strategy 27
These initiatives, such as improved recycling from the hospitality and retail sectors, and in workplaces, could be pursued individually, but as a national measure these options could be aggregated as a new stand alone program, extended NPC or ADF (with use of ADF revenue to fund programs via NPC or new program). An ADF is cost-effective and capable of application to the entire packaging stream. It introduces higher administrative costs than programs pursued through the NPC to collect revenue, but offers greater certainty in revenue collection over time and perhaps greater equity.
Residual waste processing with the emerging AWT schemes would involve changes to the processing of several million tonnes of residual waste to capture only a moderate number of beverage containers. Experience to date indicates that the quality of the resource harvest is often compromised by contact with biodegradable waste. Further, the uptake of AWT systems is likely to increase over the next ten years in any case as the need to process biodegradable residual waste becomes more pressing.
Beverage Container Investigation 28 April 2010
BDA Group and Wright Corporate Strategy 28
PART A: BACKGROUND AND SUMMARY RESULTS
A1 INTRODUCTION
On 17 April 2008, the Environment Protection and Heritage Council (EPHC) agreed to conduct an assessment of potential options for national measures, including container deposit legislation, to address resource efficiency, environmental impacts and the reduction of litter from packaging wastes such as beverage containers. The NEPC Corporation has commissioned BDA Group in conjunction with Wright Corporate Strategy to conduct the assessment.
The purpose of the study is to provide EPHC with information to assess the merits of developing a national measure to manage packaging waste. The study developed a statement of the problem to be managed, identified possible options and provides a comparative analysis and short list of the most promising national measures. However, it does not provide a detailed evaluation or recommend a preferred measure. The study has also identified key issues and data needed for the more exhaustive assessment process that would be required if the EPHC decided to pursue the development and implementation of a national measure.
An Issues Paper was circulated to stakeholders in September 2008 which provided a preliminary analysis of packaging waste recovery and recycling, an overview of the range of packaging waste impacts, brief description of potential options for national measures and tentative criteria for the assessment of measures. A Preliminary Report was also circulated in November 2008 providing an assessment of the scale and scope of the packaging waste problem. Valuable stakeholder feedback was received on both the Issues Paper and Preliminary Report.
This report contains two parts. Part A provides the background work on the nature and extent of impacts of packaging waste, summary results of the assessment of new national policy measures and conclusions and recommendations of the study. Part B provides the detailed assessment of policy options including container deposit legislation, extended coverage of kerbside recycling/drop-off, improved recycling at core consumption centres, improved recycling at workplaces, residual waste processing systems, advance disposal fee, and voluntary glass levy.

Beverage Container Investigation 28 April 2010
BDA Group and Wright Corporate Strategy 29
A2 SITUATION AND ANALYSIS
This section provides a brief situation analysis for packaging waste, covering packaging waste and recycling performance data, beverage container recycling from the municipal and away from home sectors and resource recovery systems. Information on the overall packaging materials situation is presented first to provide context and scale for the subsequent data on beverage containers.
A2.1 Packaging waste and recycling performance data
Packaging waste is a highly visible part of the waste stream and touches most citizens and business enterprises. According to the National Packaging Covenant, some 4.23 million tonnes of packaging waste were generated in Australia during 20056. Some 56% of this waste packaging was recycled7, up from 48% in 20038.
In contrast, the Mid-Term Review of the Covenant involved re-calculation of both the 2003 baseline data and some of the recently reported consumption and recycling rates, and for 2006-07 reported consumption at 4.26 million tonnes with a recycling rate similar to that previously reported for 2005-06 at 56%9.
The target recycling rate under the National Packaging Covenant is 65% by 2010. This target carries the endorsement of the signatories to the National Packaging Covenant.
The main packaging materials based on weight are paper/cardboard (62% of consumption), glass (21%), plastics (14%), and steel/aluminium (3%). Overall consumption of each packaging material measured in tonnes, accompanied by recycling rates for these materials in 2005 and 2006-07 are set out in Table A2.1.
The data in the table demonstrate that recycling of plastics and aluminium packaging at 2005 is in line with the 2010 target. On the other hand, steel recycling is well below the 2010 target, while paper/cardboard and glass recycling is within reach of the target.
6 National Packaging Covenant. Annual Report 2005-06, pp 30. 7 Ibid. 8 The (previously) “agreed” Covenant baseline 9 National Packaging Covenant. Mid-Term Review 2006-07, pp 45.
Beverage Container Investigation 28 April 2010
BDA Group and Wright Corporate Strategy 30
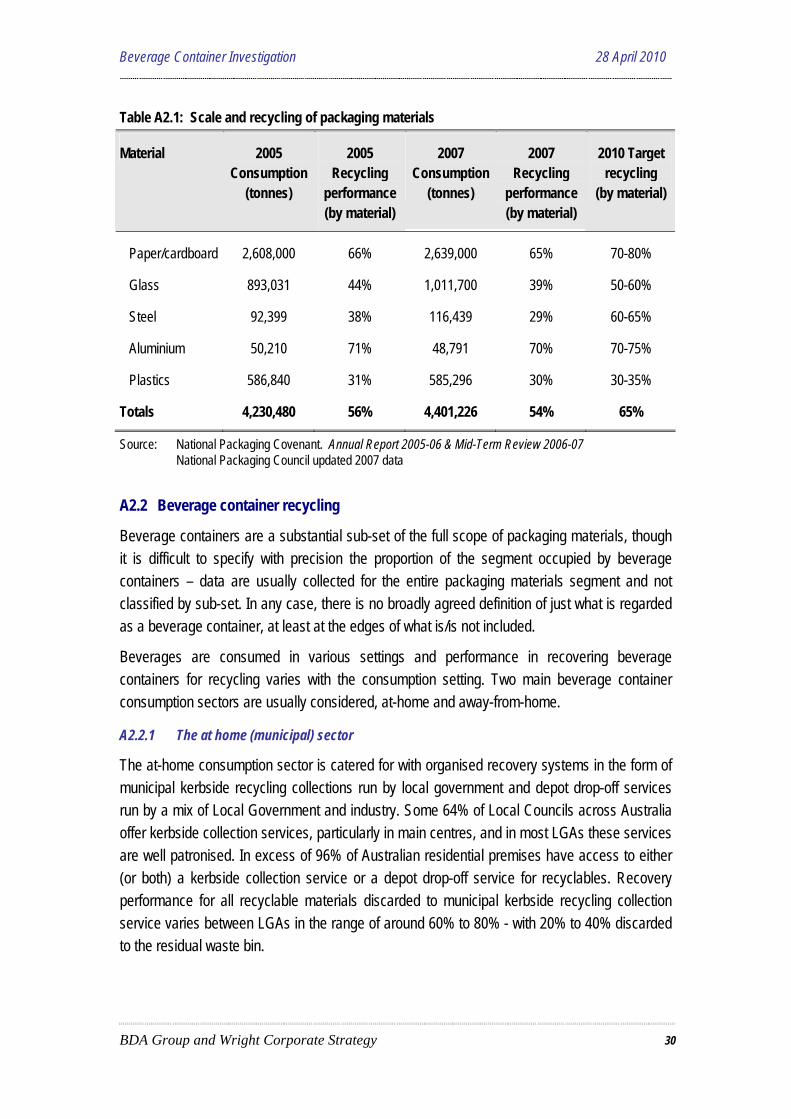
Table A2.1: Scale and recycling of packaging materials
Material 2005 Consumption
(tonnes)
2005 Recycling
performance (by material)
2007 Consumption
(tonnes)
2007 Recycling
performance (by material)
2010 Target recycling
(by material)
Paper/cardboard 2,608,000 66% 2,639,000 65% 70-80%
Glass 893,031 44% 1,011,700 39% 50-60%
Steel 92,399 38% 116,439 29% 60-65%
Aluminium 50,210 71% 48,791 70% 70-75%
Plastics 586,840 31% 585,296 30% 30-35%
Totals 4,230,480 56% 4,401,226 54% 65%
Source: National Packaging Covenant. Annual Report 2005-06 & Mid-Term Review 2006-07 National Packaging Council updated 2007 data
A2.2 Beverage container recycling
Beverage containers are a substantial sub-set of the full scope of packaging materials, though it is difficult to specify with precision the proportion of the segment occupied by beverage containers – data are usually collected for the entire packaging materials segment and not classified by sub-set. In any case, there is no broadly agreed definition of just what is regarded as a beverage container, at least at the edges of what is/is not included.
Beverages are consumed in various settings and performance in recovering beverage containers for recycling varies with the consumption setting. Two main beverage container consumption sectors are usually considered, at-home and away-from-home.
A2.2.1 The at home (municipal) sector
The at-home consumption sector is catered for with organised recovery systems in the form of municipal kerbside recycling collections run by local government and depot drop-off services run by a mix of Local Government and industry. Some 64% of Local Councils across Australia offer kerbside collection services, particularly in main centres, and in most LGAs these services are well patronised. In excess of 96% of Australian residential premises have access to either (or both) a kerbside collection service or a depot drop-off service for recyclables. Recovery performance for all recyclable materials discarded to municipal kerbside recycling collection service varies between LGAs in the range of around 60% to 80% - with 20% to 40% discarded to the residual waste bin.

Beverage Container Investigation 28 April 2010
BDA Group and Wright Corporate Strategy 31
Beverage container discards are a targeted resource in municipal kerbside recycling collections. As a result, they are now a small proportion of the municipal residual waste stream (generally regarded as less than 5%). However, packaging wastes, generally, are reportedly not as fully captured in municipal kerbside recycling collections. They remain a substantial proportion of the municipal residual waste haul (generally in the range 15% to 25%)10.
To make estimates of the scale and recycling of beverage containers, as distinct from all packaging materials, the project team has analysed the 2006/2007 State and Territory reports to NEPC on the Used Packaging Materials NEPM. These reports provide information on which some tentative estimates can be made of several important statistics. The first estimate is the proportion of beverage containers in the overall amounts of packaging materials collected in municipal kerbside recycling. These estimates were made in two steps - first, by considering the likely volume of packaging containers within the overall State and Territory data on Residential Kerbside Recycling (which include data on packaging materials and non-packaging materials recovered and recycled); then considering the likely proportion of beverage containers within the volume of packaging containers.
The estimates for various beverage container materials are set out at Table A2.2.
Table A2.2: Estimated beverage container recycling through municipal kerbside collection
Beverage container material
Kerbside collected proportion relative to total packaging materials
Estimated national kerbside collected beverage container
recycling (tpa)
Liquid Paper Board 3% of packaging paper/cardboard 10,000
Glass 65% of glass containers 295,000
Aluminium 100% of aluminium cans 15,000
Plastics 65% of plastics or 90% of PET & HDPE 70,000
Total 390,000
Source: Estimated by BDA/WCS
An important finding of this analysis is that an estimated 390,000 tonnes of beverage container materials are recycled annually in the municipal system. Of special interest are the large proportion of glass in the kerbside collected stream (70%) and the small proportion of liquid paper board (2%) in the overall quantity of beverage container materials captured in municipal kerbside recycling services.
10 The above estimates are based on work undertaken by WCS for various State and Local Government entities.

Beverage Container Investigation 28 April 2010
BDA Group and Wright Corporate Strategy 32
It is stressed that these estimates are indicative and have been prepared to consider the national scale and recycling of beverage containers for broad study purposes rather than as a basis for conclusions.
Beverage containers apparently rank well in the set of packaging materials recycled through kerbside services, though the data limitations referred to above preclude clear assertions about beverage container recycling performance in comparison to total consumption. However, we have estimated, from waste audits, that 20% to 25% by weight of the overall municipal kerbside recycling haul comprises beverage containers. And the national kerbside recycling haul is around 2 million tonnes per annum. It follows that some 400,000 to 500,000 tonnes of beverage container materials are recycled annually through the kerbside collection system. Within the order of accuracy of these estimates this result is consistent with the estimate of 390,000 tonnes per annum cited above, providing a level of confirmation of reasonableness of the estimate. (These estimates broadly align with the updated 2007 data from the National Packaging Council which estimates that the at home recovery rate for beverage containers was 451,391 tonnes in the 2007 financial year.)
The next question revolves around how well municipal kerbside recycling of beverage containers is performing in relation to total beverage container discards from the at-home sector. It is necessary to start by considering the amount of beverage containers that are discarded to the municipal residual waste bin. As noted above, it is estimated that the overall amount of potentially recyclable materials discarded to the residual waste bin is between some 20% and 40% of the bin contents (and the major cities are in a 20% to 30% range).
More importantly, around 5 percentage points within this potentially recyclable haul is estimated to be beverage containers11. And approximately 5 million tonnes of municipal waste is disposed to landfill each year from LGAs that are reported to have kerbside recycling collections. It follows that, at a minimum, around a further 250,000 tonnes per annum of potentially recyclable beverage containers are likely to be available in the residual waste bin.
A further category of at-home sector recycling is the material dropped off to recycling centres and transfer stations. On the basis of the 2006/2007 State and Territory reports to NEPC on the Used Packaging Materials NEPM, this amounts to approximately 5% of the at-home kerbside recovery total or around 24,000 tonnes per annum, not including South Australia, which adds a further 36,000 tonnes to the drop-off haul as a direct result of the CDS system in place in South Australia.
Putting together the annual estimates:
• the annual estimates of beverage container recycling from the at-home sector (390,000 tonnes);
11 Based on analysis of over 8,000 residual waste bin audits made available to BDA/WCS on a confidential basis
by DECC

Beverage Container Investigation 28 April 2010
BDA Group and Wright Corporate Strategy 33
• estimated disposal of potentially recoverable beverage containers from the at-home sector (250,000 tonnes); and
• adding a contaminant allowance of around 10% (say 40,000 tonnes) on the at-home recycling estimate;
• the estimate of drop-off beverage container recovery of 60,000 tonnes for a net recycling total of (say) 50,000 tonnes
These assumptions provide an indicative estimate of 745,000 tonnes of beverage containers consumed and discarded from the at-home sector. This indicates a 61% at-home sector beverage container recycling performance and a 68% recovery performance (see notes at Table A2.3 for definitions of these terms used in NEPC reports). (These estimates broadly align with the updated 2007 data from the National Packaging Council which estimates that the at home consumption rate for beverage containers was 823,523 tonnes in the 2007 financial year.)
A2.2.2 The away from home sector
The away-from-home beverage consumption sector is far more diverse. The extent of beverage container consumption in this sector is less clear. In a 2008 report for the Packaging Stewardship Forum of the Australian food and Grocery Council, the away-from-home consumption was estimated at 25%12, while in the 2001 report for the NSW Government Stuart White indicated that it might be as high as 50%13.
If the away-from-home beverage consumption sector is taken at 30% then some 320,000 tonnes per annum would be consumed in the away-from-home sector. (This estimates broadly align with the updated 2007 data from the National Packaging Council which estimates that the at away from home consumption rate for beverage containers was 346,167 tonnes in the 2007 financial year.)
The sector includes the following diverse types of beverage container consumption points:
• public places, such as parks, beaches on other open-air locations;
• organised events, some of which provide recycling options;
• work locations, including offices, factories, etc; and
• commercial premises such as hotels, cafes, restaurants and shopping centres.
Recovery drivers and systems are not well organised for recycling of beverage containers discarded away from home, with the exception of South Australia where the CDS system is in 12 Australian Beverage Packaging, Consumption, Recovery and Recycling Quantification Study, September 2008,
pp2 13 White 2001 Independent Review of Container Deposit Legislation in NSW, Report to the Minister for the
Environment prepared by the Institute for Sustainable Futures UTS, November

Beverage Container Investigation 28 April 2010
BDA Group and Wright Corporate Strategy 34
place. National recycling performance for the away-from-home sector is likely to be considerably less than the estimated 61% recycling performance developed above for the at-home sector, and less than the aggregate 56% recycling performance recorded by the National Packaging Covenant for all packaging materials for 2005.
The lack of data on this sector prevents anything but a stab at recovery and recycling rates. It is unlikely however that recovery performance is any better than between 15% and 25% of consumption or 50,000 to 80,000 tonnes per annum (say 65,000 tonnes). This would leave possibly a further 255,000 tonnes per annum potentially available for recovery and recycling. A high contamination rate could be expected with away-from-home recovery, reducing recycling to around (say) 50,000 tonnes per annum.
A2.2.3 Summary and context
A summary of the estimates made in the above analysis is set out at Table A2.3. This Table indicates that current recovery effectiveness is 68% for the at-home sector and 20% for the away-from-home sector. Overall current beverage container recovery effectiveness is estimated to be 53%. (At Table A2.3(a) the comparable updated 2007 data from the National Packaging Council for the 2007 financial year is presented).
Table A2.3: Summary of estimates of scale and recycling of beverage containers
Sector Estimated recovery
performance* (tpa)
Estimated recycling
performance* (tpa)
Estimated potential further recovery
(tpa)
Estimated Consumption
(tpa)
At-home consumption
490,000 450,000 250,000
740,000
Away-from-home consumption
65,000 50,000 255,000 320,000
Total 555,000 500,000 505,000 1,060,000
Source: Estimated by BDA/WCS * The terms “Recovery performance” and ”Recycling performance” have the same definition and relate to the
data under the same headings as reported in the 2006/2007 State and Territory reports to NEPC on the Used Packaging Materials NEPM, while the difference between “recovery” and “recycling” represents the contamination removed during beneficiation.

Beverage Container Investigation 28 April 2010
BDA Group and Wright Corporate Strategy 35
Table A2.3(a): Summary of estimates of scale and recycling of beverage containers – updated NPC 2007 data
Sector Estimated recycling
performance (tpa)
Estimated potential further recovery
(tpa)
Estimated Consumption
(tpa)
At-home consumption
451,391 372,132
823,523
Away-from-home consumption
50,155 296,012 346,167
Total 501,545 505,000 1,169,690
How large is the beverage container segment in the total waste disposal and resource recovery context? This question is best considered for each sector.
In the municipal sector, which covers at-home consumption and beverage container discards at parks and other local government spaces, total national waste generated is around 10.772 million tonnes per annum14, with estimated annual beverage container consumption of 0.775 million tonnes, or 7.2% of total municipal waste generated. The estimated further recovery potential, at 0.250 million tonnes, is only 3.6% of total municipal waste disposal of 6.921 million tonnes.
Beverage containers are a similarly low proportion of the C&I (away-from-home) sector. With total waste generated at around 12.556 million tonnes per annum, beverage container consumption is estimated at 320,000 tonnes per annum or about 2.6% of total C&I waste generation. Further recovery potential, at an estimated 0.265 million tonnes, is 4.2% of total C&I disposal of around 6.3 million tonnes.
A2.3 Location classifications
Where used beverage containers are recycled into new beverage containers, the supply (or value) chain in beverage container recovery is greatly affected by the cost of transporting collected containers to reprocessing centres where they form an input material for manufacture of new beverage containers. In this closed-loop recycling, the proximity of container sorting and consolidation points to beverage container manufacturing centres is a critical factor in the financial and environmental viability of recycling ventures targeting beverage containers.
14 WCS Market Intelligence/WME. The Blue Book Australian Waste Industry 2007/08 Industry and Market
Report. 2008

Beverage Container Investigation 28 April 2010
BDA Group and Wright Corporate Strategy 36
Offsetting factors include the environmental benefits accruing from the recycling effort and the market value of recovered materials. Where used beverage containers are recycled into other products using other processes, this logistics issue may be less critical.
Other logistics issues include the cost of physically collecting discarded packaging and beverage containers, and the cost of sorting and collating like-materials. The relative quality of the post-consumer beverage containers recovered from various types of discard points can also affect their value as feedstock for manufacture of new products. For instance, the yet to be perfected public place and event recycling disciplines may result in some recovered materials being of inferior quality and/or elevated contamination rates, requiring higher cost for beneficiation and greater disposal of materials to landfill.
With these issues in mind, three main broad location categories appear to be relevant as points of interest for recovery systems:
• Main capital cities which host reprocessing facilities;
• Regional cities and towns within accessible transport distance from reprocessing facilities;
• Remote cities, towns and outback areas.
A2.4 Resource recovery systems
Resource recovery systems were developed largely as a result of community and government concern that various items of post-consumer waste were potentially recyclable resources being lost through disposal to landfill. The main systems in place were initially applied to the municipal sector and continue largely to service household needs.
The C&I waste generating sector has been slow to seek arrangements for recycling, and waste contractors have largely declined the opportunity to promote recycling services to their C&I sector clients. Moreover, their contracts with clients generally exclude the scope for a third-party recycling collection contractor to provide specialised recycling services.
The main recovery systems in place that cover beverage containers include:
• Municipal kerbside collection;
• Recycling drop-off services at waste management and resource recovery facilities;
• Extension of municipal kerbside collection in some LGAs to the small business segment of the C&I waste sector. This recovery haul is classified as part of the municipal sector rather than the C&I sector and is already included in the Municipal data analysis;
• The container deposit scheme operating in South Australia; and
• Recycling collection services operated by waste contractors for C&I clients, including commercial building owners, event managers and commercial premises.

Beverage Container Investigation 28 April 2010
BDA Group and Wright Corporate Strategy 37
The relative capture quantities of beverage containers of each system for beverage container recycling can be seen from the summary set out at Table A2.4.
Table A2.4: Estimated scale of beverage container recycling through municipal kerbside collection and away-from-home recovery systems
Resource Recovery System Estimated contribution to recovery haul (tpa)
Proportion of total beverage container recovery
Municipal kerbside collection 430,000 78%
Recycling drop-off services 24,000 4%
SA container deposit scheme 36,000 6%
C&I collection services at events, work locations and commercial premises
65,000 12%
Total 555,000 100%
Source: Estimated by BDA/WCS
The municipal kerbside recycling service clearly dominates and according to the 2006/2007 State and Territory reports to NEPC on the Used Packaging Materials NEPM some 353 LGAs across Australia provide a kerbside recycling service (see Table A2.5). The main merits of the system are the ease of recycling, its reliability, and moderate cost – around $50 per household per annum. The system is well accepted and reported participation rates are between 80% and 90%.
Recycling drop-off services are offered by many local councils, either in lieu of a kerbside collection service or in addition, to provide improved opportunity for recycling. According to the 2006/2007 State and Territory reports to NEPC on the Used Packaging Materials NEPM some 173 LGAs across Australia provide a recycling drop-off service only (that is, no kerbside collection (see Table A2.5). The main merits of the kerbside collection system are its low cost, especially when operated as part of waste disposal or transfer facilities. In conjunction with kerbside recycling services, easily accessible drop-off depots that facilitate sorting by material type produce a rich, low contamination harvest.

Beverage Container Investigation 28 April 2010
BDA Group and Wright Corporate Strategy 38
Table A2.5: Local government recycling services
State / Territory Kerbside recycling service
Drop off service
No service
Total Councils reporting
%
Premises with access to recycling
%
New South Wales 119 23 10 152 100 94.2
Victoria 78 1 0 79 100 95
Queensland 46 70* 10* 126 80 96
Western Australia 50* 78* 128 88 95*
South Australia 38 0 0 38 56 95.8*
Tasmania 19 1 0 20 69 87.1*
ACT 1 0 0 1 100 100
Northern Territory 2 0 0 2 3 100*
Total 353 173
Source: 2006/2007 State and Territory reports to NEPC on the Used Packaging Materials NEPM. * Estimated / postulated
The extension of municipal kerbside collection to the small business segment of the C&I waste sector varies between jurisdictions. For instance, in Victoria some 75,000 non-residential premises access the municipal kerbside recycling system, and in South Australia, 49,000 non-residential premises are served by recycling collections. In NSW, a reported 6,600 services are provided to businesses by extension of local government kerbside recycling collections. While, in Queensland, three major regional councils extend kerbside recycling services to the small business segment, and Brisbane City Council is reported to be about to commence roll-out of this service extension. There is no detailed reporting of LGAs in the remaining States and Territories providing services for business customers.
The use of the established municipal system by small business customers assists local councils in defraying collection costs and enables these small businesses to use a service that is largely not provided to small business by waste contractors.
Recycling services for the C&I sector are not provided on an organised basis that is repeated across Australia. They are increasingly offered at special events in response to community demand. Recycling services are provided at increasing numbers of work locations, and by special arrangement, to commercial premises at which large volumes of beverages are consumed. However there are no triggers in place to drive uptake of C&I sector recycling and,

Beverage Container Investigation 28 April 2010
BDA Group and Wright Corporate Strategy 39
as noted above, the waste contractors have not moved to capture used packaging materials, other than cardboard.
A2.5 Cost and effectiveness of resource recovery systems
Each of the five main recovery systems discussed above that aim to recover beverage containers are discussed in terms of broad cost implications and general effectiveness. In these discussions, the issue of general effectiveness is represented by the amount of beverage container material recovered through each system, while the issue of cost is represented by a best estimate of the cost to achieve the recovery.
Municipal kerbside collection – the quantum of beverage container packaging recovered through the kerbside recycling system is estimated at Table A2.4 to be in the order of 430,000 tonnes per annum.
Data on the cost of kerbside recycling is difficult to analyse since the multiple reports that purport to identify the cost fail to clearly identify the elements that are included in the quoted cost. For this assessment we have resorted to the 2006/2007 State and Territory reports to NEPC on the Used Packaging Materials NEPM which contain indicative costs of kerbside collection systems across the country in the range $170 to $525 per tonne for collection only. Using a weighted average across all jurisdictions a collection only cost of $205 appears to be a reasonable estimate.
MRF processing costs are equally difficult to estimate as until recently, the charge for processing recyclables has been bundled in with the charge for collection at kerbside, making separation of the two elements difficult. In the last 12 to 18 months, charges for receipt and processing of recyclables at MRFs have been tendered at between zero and +$25 per tonne of material received, reflecting the relatively high value of the recyclate once processed. In the Mid Term Review of the NPC15, Hyder estimated that typical recyclate value to a MRF may be in the order of $121 per tonne of received recyclate, including the cost for disposal of contamination material. Estimates made by the authors for the cost of owning and operating a medium sized MRF are in the order of $90 per tonne of recyclable material received, indicating that MRF operators might be achieving a margin in the order of 30% on the $121 per tonne for the mix of recyclate.
Using these estimates, it might be reasonable to assume, the recovery of beverage container packaging materials through the kerbside recycling system might cost in the order of $300 per tonne.
Recycling drop-off services – there are multiple forms for drop-off services for the recovery of products and resources including the ancillary services provided at waste transfer stations and landfills, drop-off recycling centres provided by local government either in lieu or supplementary 15 National Packaging Covenant Mid Term Review: Contextual Review, Oct 2008, pp 73

Beverage Container Investigation 28 April 2010
BDA Group and Wright Corporate Strategy 40
to kerbside services, and the dedicated beverage container collection centres operated in South Australia as a part of the CDS system in that State. Invariably, the cost of recovery of packaging materials through these different systems will differ significantly.
For one NSW regional Council operating nine village depots receiving recyclables and wastes and transferring materials to a central facility, the average cost for depot operation is in the order of $260 per tonne of material received and transferred – excluding any amortisation of capital associated with land space for the depot. If the cost of processing the recyclables used earlier is added to this, then a cost estimate for regional council drop-off depots might be in the region of $350 per tonne, plus a small additional amount, say $40 per tonne16, to account for the cost of the land, bringing the cost to approximately $400 per tonne recovered.
Extension of municipal kerbside to small business – if this service is a true extension of existing residential kerbside recycling services, then the cost would, not unreasonably, be the same as that for kerbside recycling from residential properties.
Container deposit scheme operating in South Australia – in a May 2008 submission to the Senate Standing Committee inquiry into Management of Australia’s Waste Streams and in Particular Consideration of the Drink Container Recycling Bill 200817, Recyclers of South Australia put forward data representing the average cost model for CDS in South Australia, based on 40 million dozen containers being sold annually and a deposit rate of 5 cents per containers.
Analysis of that data, in consultation with parties in South Australia, combined with estimates of the tonnage of beverage containers recovered through the South Australian CDS scheme indicate that the financial system cost for CDS in South Australia at that time might be in the order of $545 per tonne of beverage containers recovered (see Appendix 1).
The data from Recyclers of South Australia appears to make provision for the main system operating costs, plus a notional allowance for depot profit; however it does not appear to make any allowance for amortisation of any capital associated with the collection depots and infrastructure – which, in the case of South Australia might reasonably be said to have been fully amortised over the +30 years that a CDS system has been in operation in that State.
If a nominal one percent were added to the system operating cost to account for capital, then a system cost in the order of $550 per tonne might be a reasonable estimate for comparative performance purposes.
Recycling collection services for the C&I sector – data on recycling collections for events and businesses are poorly covered in available literature in respect of either cost or performance. 16 Based on in-house estimates for a regional NSW Local Government client 17 Recyclers of South Australia, Senate Inquiry Submission May 2008
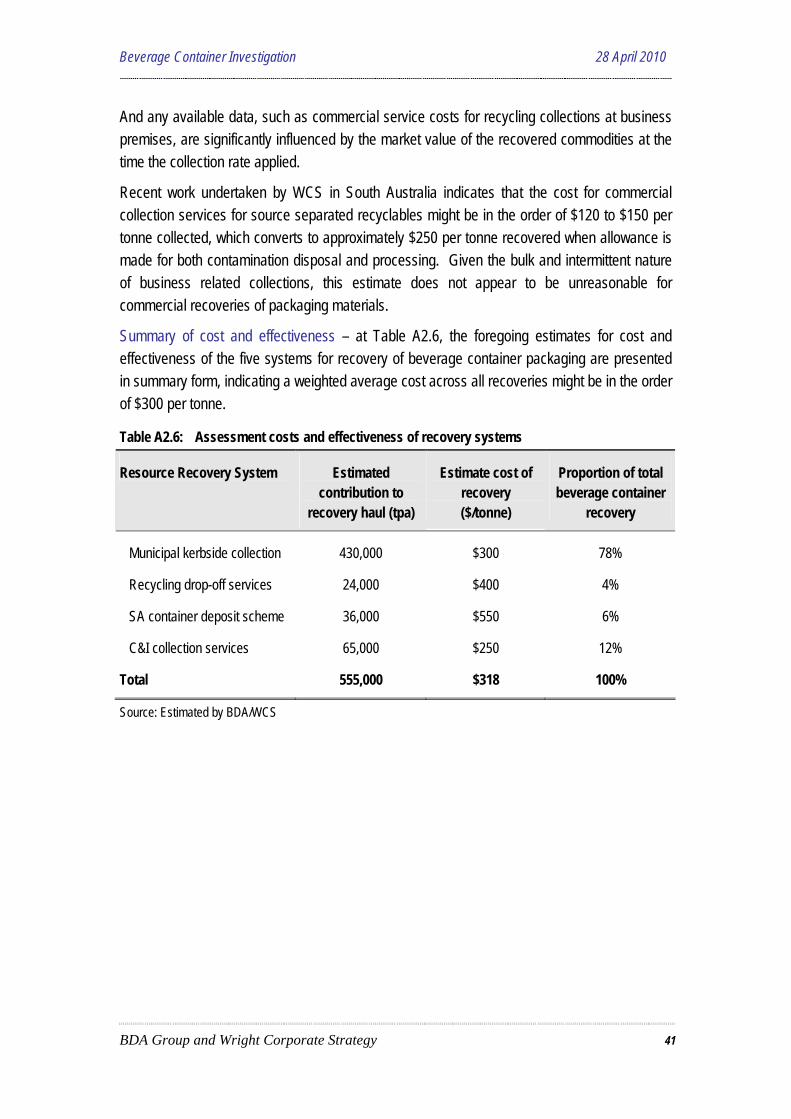
Beverage Container Investigation 28 April 2010
BDA Group and Wright Corporate Strategy 41
And any available data, such as commercial service costs for recycling collections at business premises, are significantly influenced by the market value of the recovered commodities at the time the collection rate applied.
Recent work undertaken by WCS in South Australia indicates that the cost for commercial collection services for source separated recyclables might be in the order of $120 to $150 per tonne collected, which converts to approximately $250 per tonne recovered when allowance is made for both contamination disposal and processing. Given the bulk and intermittent nature of business related collections, this estimate does not appear to be unreasonable for commercial recoveries of packaging materials.
Summary of cost and effectiveness – at Table A2.6, the foregoing estimates for cost and effectiveness of the five systems for recovery of beverage container packaging are presented in summary form, indicating a weighted average cost across all recoveries might be in the order of $300 per tonne.
Table A2.6: Assessment costs and effectiveness of recovery systems
Resource Recovery System Estimated contribution to
recovery haul (tpa)
Estimate cost of recovery ($/tonne)
Proportion of total beverage container
recovery
Municipal kerbside collection 430,000 $300 78%
Recycling drop-off services 24,000 $400 4%
SA container deposit scheme 36,000 $550 6%
C&I collection services 65,000 $250 12%
Total 555,000 $318 100%
Source: Estimated by BDA/WCS

Beverage Container Investigation 28 April 2010
BDA Group and Wright Corporate Strategy 42
A3 PACKAGING WASTE IMPACTS
Packaging performs a range of important functions which deliver positive benefits to the community and environment. It:
• serves many useful purposes and plays an important role in preserving, protecting and marketing products during their storage, transport and use;
• reduces damage or wastes and plays an important public health function by protecting and preventing the contamination of food and beverages; and
• through it's labelling, informs consumers about a product's characteristics and qualities and can help them make informed purchasing decisions18.
However the production, use and disposal of packaging may also contribute to a number of environmental problems. For this reason, post-consumer management of packaging has been of interest to government and communities more broadly for some time. Notwithstanding this interest, the exact nature and significance of suspected problems is far from clear.
A3.1 Range of upstream and downstream impacts
There are a range of possible impacts associated with packaging material waste. Detrimental impacts of landfill disposal may include consumption of urban land, potential contamination of waters from leachates, release of methane from the decomposition of organic wastes, noise and odours impacting local amenity as well as air emissions and amenity impacts through the transportation of wastes to landfills.
For many packaging materials, waste disposal per se may create few environmental impacts, although a range of environmental impacts associated with the production and consumption of packaging materials may be observed in product supply chains. These include:
• Environmental impacts during resource extraction, including the depletion of finite resources or degradation of renewable resources;
• Pollution associated with the processing of virgin or recycled materials;
• Material and product transport and marketing impacts;
• Impacts directly arising from consumption activities (such as greenhouse gases); and
• Impacts associated with the illegal disposal of used packaging (such as littering).
It is useful to categorise these impacts according to where they occur in the packaging supply chain. Two key categories are:
18 As outlined in the 1999 Impact Statement for the draft National Environment Protection Measure for Used
Packaging Materials

Beverage Container Investigation 28 April 2010
BDA Group and Wright Corporate Strategy 43
• Upstream impacts. These are impacts higher in supply chains that result from the production and consumption of packaging waste - for example, the depletion of non-renewable resources used in packaging manufacturing or greenhouse gas emissions from the transport of packaging to users; and,
• Downstream impacts. These are impacts related to the disposal of used packaging waste - for example, air and water emissions associated with the landfilling or incineration of waste, or health, biological and amenity impacts from littering.
Figure A3.1 shows the supply chain for the production, consumption and disposal of packaging and the major environmental impacts that may be associated with each stage. Two different sets of impacts can be aggregated: firstly those that can be mitigated through packaging resource recovery and secondly those that can be mitigated through removing packaging waste from the litter stream.
A3.2 Community desire for packaging waste measures
A number of surveys have been conducted in Australia on community attitudes to the environment, waste and recycling. Included among these are comprehensive surveys undertaken by the NSW Department of Environment and Climate Change (DECC). The 2006 survey was the fifth in DECC’s ‘Who Cares about the Environment?’ series of social research, and included responses from a cross-section of 1,724 people in NSW19. Pertinent findings include:
• 8% of respondents cited waste as one of the top two environmental issues of concern;
° 2% of people cited litter and dumping of rubbish as one of the top two environmental issues of concern.
• 5% of respondents cited measures to deal with waste as the single most important thing that the NSW Government could do to protect and look after the environment over the next few years;
• 46% of people think that over the preceding three years the community had become better at minimizing waste the community produces (25% saw little change and 26% believed the community was doing worse);
• 40% of respondents indicated that they regularly made an effort to avoid products with excess packaging;
• 60% of respondents agreed with the statement: ’Recycling paper, cardboard and glass saves on materials but doesn’t help with saving water, energy and fuel’.
19 The more recent 2007 survey focussed specifically on climate change and water

Beverage Container Investigation 28 April 2010
BDA Group and Wright Corporate Strategy 44
Figure A3.1: Environmental impacts of packaging waste
Extraction of raw materials
Material manufacture
Product manufacture
Use of products
Upst
ream
activ
ities
Downstream activities
Stage in supply chain Major impacts
• Depletion of finite resources • Degradation of renewable
resources • Greenhouse emissions • Air, water and noise pollution • Biological impacts
Landfill
• Greenhouse emissions • Air & water pollution • Amenity impacts (visual,
odour, noise etc) • Alienation of land • Biological impact
Litter
• Glass injury • Visual amenity • Soil & water
contamination • Biological impact
Disposal options
Impacts
• Greenhouse emissions • Air and water pollution
Transport
Transport
Transport
Transport
• Greenhouse emissions • Air and water pollution
• Greenhouse emissions • Air and water pollution
Recycling
Tran
spor
t
Reuse
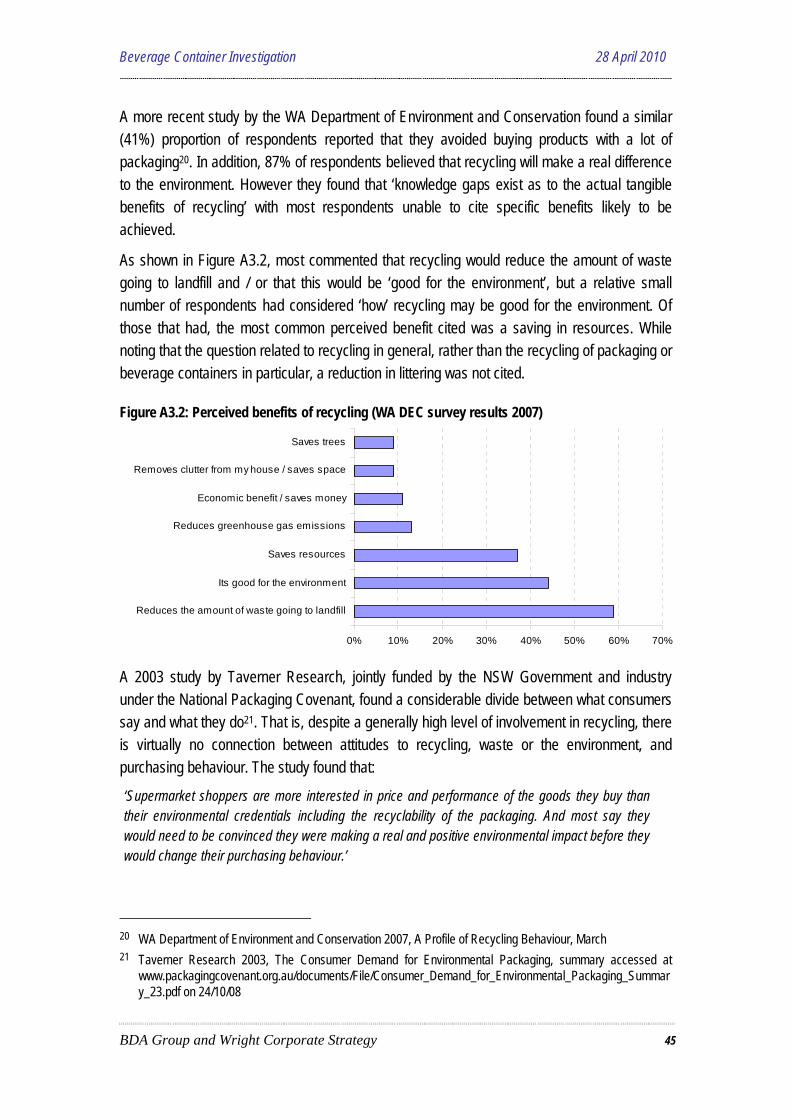
Beverage Container Investigation 28 April 2010
BDA Group and Wright Corporate Strategy 45
A more recent study by the WA Department of Environment and Conservation found a similar (41%) proportion of respondents reported that they avoided buying products with a lot of packaging20. In addition, 87% of respondents believed that recycling will make a real difference to the environment. However they found that ‘knowledge gaps exist as to the actual tangible benefits of recycling’ with most respondents unable to cite specific benefits likely to be achieved.
As shown in Figure A3.2, most commented that recycling would reduce the amount of waste going to landfill and / or that this would be ‘good for the environment’, but a relative small number of respondents had considered ‘how’ recycling may be good for the environment. Of those that had, the most common perceived benefit cited was a saving in resources. While noting that the question related to recycling in general, rather than the recycling of packaging or beverage containers in particular, a reduction in littering was not cited.
Figure A3.2: Perceived benefits of recycling (WA DEC survey results 2007)
0% 10% 20% 30% 40% 50% 60% 70%
Reduces the amount of waste going to landfill
Its good for the environment
Saves resources
Reduces greenhouse gas emissions
Economic benefit / saves money
Removes clutter from my house / saves space
Saves trees
A 2003 study by Taverner Research, jointly funded by the NSW Government and industry under the National Packaging Covenant, found a considerable divide between what consumers say and what they do21. That is, despite a generally high level of involvement in recycling, there is virtually no connection between attitudes to recycling, waste or the environment, and purchasing behaviour. The study found that:
‘Supermarket shoppers are more interested in price and performance of the goods they buy than their environmental credentials including the recyclability of the packaging. And most say they would need to be convinced they were making a real and positive environmental impact before they would change their purchasing behaviour.’
20 WA Department of Environment and Conservation 2007, A Profile of Recycling Behaviour, March 21 Taverner Research 2003, The Consumer Demand for Environmental Packaging, summary accessed at
www.packagingcovenant.org.au/documents/File/Consumer_Demand_for_Environmental_Packaging_Summary_23.pdf on 24/10/08

Beverage Container Investigation 28 April 2010
BDA Group and Wright Corporate Strategy 46
Only 4% of 1,188 supermarket shoppers surveyed mentioned recyclable packaging, biodegradable, recycled materials, re-usable packaging or anything else in relation to packaging or the environment as a factor when choosing products.
This hypothesis was supported by the Southern Waste Strategy Authority who in 2006 commissioned a perception and behaviour survey on 400 householders in the Greater Hobart Area22. The study results were consistent with those by DECC and others who surveyed people away from the point of purchasing. For example they found that 48% of people claimed to make a conscious effort to buy goods without lots of packaging.
However they noted that such claims directly contradict point-of-sale surveys (that typically identify only some 5% of purchasing decisions being motivated by environmental issues), and agree that peoples’ aspirations and self-image regarding environmental responsibility are not always matched by their actions. And this is consistent with their findings on household motivations for recycling, namely that it ‘appears to be primarily driven by a desire to do what is perceived as being right for the environment’23.
It is beyond the scope of this study to elicit directly from the community the values they hold for increased packaging / beverage container recovery and recycling. Such a study, if undertaken by government, would need to be careful in ensuring that the community’s true willingness to pay was canvassed rather than a broader desire for environmental stewardship. In addition, robust community valuations would only be possible if the community held good information on the actual benefits that could be realised from increased packaging / beverage container recovery and recycling – which currently appears lacking.
In this study, our focus is on identifying the physical extent of the underlying benefits that increased packaging / beverage container recovery and recycling could deliver and which may provide grounds for government intervention. That is, those benefits associated with market or regulatory failure or the realization of a specific social equity goal.
The overall value the community may hold for increased packaging / beverage container recovery and recycling may also incorporate other secondary costs and benefits. This could include benefits arising from reductions in litter clean-up costs, avoided costs in waste disposal (such as in kerbside collection costs), inconvenience costs and so on. It may also include social values related to the incidence of recovery and recycling costs that would vary between policies that placed the onus on manufacturers, retailers or consumers.
Finally, the community may also hold an intrinsic satisfaction from recycling (or guilt avoidance) and a preference for a less ‘wasteful’ society or sense of communal responsibility that may bear little relationship to the underlying benefits such as canvassed in this report. 22 Southern Waste Strategy Authority 2006, Perception Survey, draft Report, August. Cited at
http://www.packagingcovenant.org.au/documents/File/Perception_Survey_Summary_22_08_06.pdf 23 ibid

Beverage Container Investigation 28 April 2010
BDA Group and Wright Corporate Strategy 47
Subsequent valuation of the underlying environmental benefits and any secondary or social benefits that may be held by the community for increased packaging / beverage container recovery and recycling will be a matter for the EPHC.
A3.3 Resource recovery
A range of community ‘problems’ have been canvassed that can be attributed to the unrecovered / recycled fraction of packaging material consumed in Australia. The exact extent of these problems is open to some conjecture due to data limitations and concomitant assumptions required in preparing estimates. Nevertheless, the analysis presented in Appendix 3 has identified a reasonable order of magnitude in relation to each (using the methodology outlined in Appendix 2).
The magnitude of impacts that could potentially be mitigated through packaging resource recovery are summarised in Table A3.1 which shows the contribution of packaging consumption, net of current packaging waste recovery and recycling, to a range of environmental issues in Australia. The contribution to the ‘upstream’ problems of resource use and pollution generation will be overstated to the extent that packaging production impacts incurred overseas (associated with imported packaging) have not been netted out.24
Importantly, increased post-consumer packaging recovery and recycling could only mitigate some of these impacts as:
• some recovered packaging is likely to be exported for reprocessing;
• material losses (of up to 35%) occur due to recyclate contamination and during recyclate reprocessing, and in some instances some virgin materials must still be used to maintain product quality;
• most Australian resource industries are export orientated and price takers on world markets, meaning that some virgin materials displaced by additional packaging recyclate will simply be redirected to export markets;
• some environmental problems are managed through resource extraction or pollution ‘caps’, meaning that some ‘savings’ arising from additional packaging recovery and recycling may be taken up by other sectors; and
• limits on the amount of additional packaging waste that could practically be recovered with any new policy measure.
Greenhouse gases attributable to the production of packaging from virgin materials rather than recyclate represent around 0.2% of national emissions, and the premises involved are subject to a range of regulations and are likely to be incorporated in a national emissions trading scheme (the proposed Carbon Pollution Reduction Scheme – CPRS). 24 Preliminary figures suggest about 92% of packaging consumed in Australia is sourced within Australia

Beverage Container Investigation 28 April 2010
BDA Group and Wright Corporate Strategy 48
Table A3.1: Summary of environmental impacts of all un-recycled packaging
Environmental Issue Contribution from packaging (%)
Comment
Resource use Silica sand 5.5 a
Bauxite 0.1 a
Iron ore < 0.1 b
Oil 1.2 b
} } Mining permits are used to manage } sustainable resource use and externalities. } }
Wood 15.7 a Sustainable forestry yields have been established and industry is operating within this framework.
Energy 0.5 b Future energy management will be directly influenced by national emissions trading scheme for greenhouse gases.
Water < 0.1 c Sustainable yields and extraction caps have been / are being established in key catchments.
Air and water pollution NOx 0.2
PM10 0.1
VOCs < 0.1
} A regulatory framework operates in each } jurisdiction resulting in general compliance } with ambient goals.
TSS 0.5 d Catchment plans being established to determine and manage sustainable loads
Greenhouse gases 0.2 – 0.5 e Emissions to be capped in future under national emissions trading scheme to meet agreed emission reduction targets.
Notes: a. Relative to total Australian production b. Relative to total Australian consumption c. Relative to total urban water consumption d. Relative to discharges from licensed sources in only NSW e. Upper bound estimate includes downstream emissions
While the final design of the CPRS is yet to be agreed, overall emissions will be capped and tradeable, meaning that any reduction in greenhouse gas emissions from packaging manufacture would allow an expansion by other industries – potentially changing overall compliance costs but not environmental outcomes. Similarly, the contribution of packaging waste to greenhouse gas emissions from landfills is small (particularly from beverage containers), there is significant and growing capture and use of these emissions and they may also be incorporated in the national trading scheme.

Beverage Container Investigation 28 April 2010
BDA Group and Wright Corporate Strategy 49
Other air and water pollutants attributable to the production of packaging from virgin materials rather than recyclate are very small. In addition, there are extensive regulatory controls in each jurisdiction to minimise potential impacts on the community or environment, and in the case of air pollutants, ambient air quality goals in Australia have been consistently met. If governments did however seek to further reduce pollutant loads, a range of direct policy instruments are available to governments.
Increased recovery and recycling of packaging could also reduce demands on virgin materials. However the extent of resources used in packaging manufacture relative to broader production and consumption levels in Australia is very small. The potential exceptions are wood fibre used in paper manufacturing and silica sand used in the production of glass.
In the case of wood fibre, additional paper packaging recovered would be sent to domestic and overseas reprocessors (currently split 80:20), which after allowing for contamination and processing losses (at around 35%), could substitute for virgin wood fibre used in paper production. That part of the additional wastepaper recycled domestically would reduce demand for imported woodpulp (currently providing 39% of wood fibre used domestically for paper production) as well as domestic virgin wood fibre. Of the latter, much of the displaced production would be redirected to export markets (which currently take 21% of domestic wood fibre production) while the residual reduction in domestic virgin wood fibre use would predominantly be from renewable plantation forests (currently the source of 77% of wood used for domestic pulp production). Given the currently high level of paper packaging recycling (66%25), the modest additional volumes that could be recovered under a new measure could not be expected to make an appreciable impact on the management of Australia’s forest resources once allowances for the above factors is made.
In the case of silica sand, all glass recyclate is reprocessed in Australia. However as described in Appendix 3, the likelihood that additional recyclate would substitute for virgin materials cannot be assured as domestic production of silica sand is geared to international markets in which Australian producers are price takers. Therefore a reduction in domestic consumption of silica sand associated with increased glass recycling may largely be offset by an increase in export volumes rather than a reduction in overall silica sand production.
A3.4 Litter
Litter is waste that is improperly disposed of in the environment, whether deliberately, negligently or accidentally. It excludes material ‘illegally dumped’, that is, material transported specifically to a site for the purpose of disposal.
25 National Packaging Covenant (2006)

Beverage Container Investigation 28 April 2010
BDA Group and Wright Corporate Strategy 50
The Keep Australia Beautiful (KAB) visible litter count surveys are the most comprehensive and provide longitudinal litter count data by state and territory, as well as disaggregated by site type.
Notably, the National Litter Index (NLI) is intended only as an assessment of the presence of litter objects within surveyed regions. No corrections for population densities or other demographic factors are carried out. The information therefore provides no indication of whether residents of a particular region litter more or less frequently than those in a different region (McGregor Tan Research 2008). In addition, no inferences to total litter incidence and volumes in a state and territory can be made can be made as the areas surveyed are not based on statistically representative samples. That is, despite the NLI data being disaggregated by ‘typical’ site types and presented on an average area basis, the data cannot be scaled up.
A3.4.1 Impacts associated with litter
Littering can impose costs on the community via:
• danger to wildlife
• loss of aesthetic value
• the costs of litter clean-up
• danger to human health
The impact of littering on wildlife has been raised by several commentators such as the Boomerang Alliance. Information on impacts is anecdotal in nature, and overall impacts are likely to be relatively small compared to other pressures such as from the loss of habitat, feral animals, road kill, and so on.
Little information on the amenity impact associated with beverage container litter is available. However values are likely to differ given the nature of sites littered. The largest numbers of items identified in the KAB counts were located within retail sites, industrial sites and shopping centres, with relatively small numbers of items found in recreational parks and beaches.
Amenity impacts are mitigated to an extent through the collection of litter by councils and other groups. The majority of direct litter management costs identified in Appendix 4 are borne by Local Government. The average annual expenditure was calculated at just under $100,000 per year per Council, with the amount spent annually increasing in proportion to population size.
The potential reduction in glass in the litter stream from any new beverage container management policies is of particular interest, as this material contributes significantly to glass cutting injuries. KAB litter data indicates that glass from beverage containers represented around half the glass items counted in the litter stream nationally over recent years. However

Beverage Container Investigation 28 April 2010
BDA Group and Wright Corporate Strategy 51
as shown in Figure A3.3, beverage container glass represents nearly all the glass in the litter stream on a volume basis.
Figure A3.3: Beverage container contribution to total litter by volume, May 2008
0%
20%
40%
60%
80%
100%
Glass Metals Plastics Paperboard All litter
Source: KAB NLI
The removal of beverage containers from the litter stream could be expected to reduce the incidence of injury associated with broken glass, particularly at beaches and other outdoor recreational settings. A summary of estimated annual unintentional glass cutting injuries that could be attributable to broken beverage containers is shown in Table A3.2, with its derivation described in Appendix 4.
Table A3.2: Annual unintentional glass cutting injuries attributable to broken containers
Injury type Assumed rate / 100,000 population
Estimated total Australian injuries 2008
Injuries requiring hospitalisation 1 215
Injuries requiring non-hospitalisation medical treatment
24 5,150
Injuries requiring only home-based medical treatment
159 34,120
A3.4.2 Litter incidence by jurisdiction
The recorded incidence of beverage container and general litter by count in 2007/08 across jurisdictions is shown in Figure A3.4. It is based on the KAB National Litter Index results standardised by area.

Beverage Container Investigation 28 April 2010
BDA Group and Wright Corporate Strategy 52
Figure A3.4: Litter incidence by jurisdiction 2007/08 (count per '000m3)
Source: Average of KAB NLI results from November 2007 and May 2008
As can be seen, the average count of total litter and beverage container litter varies significantly between jurisdictions. WA has the highest count of total litter and is the only jurisdiction to have a higher overall litter count than SA. The incidence of beverage container litter is also highest in WA, but is lowest in SA.
The contribution of beverage containers by both count and volume to total litter is shown in Figure A3.5.
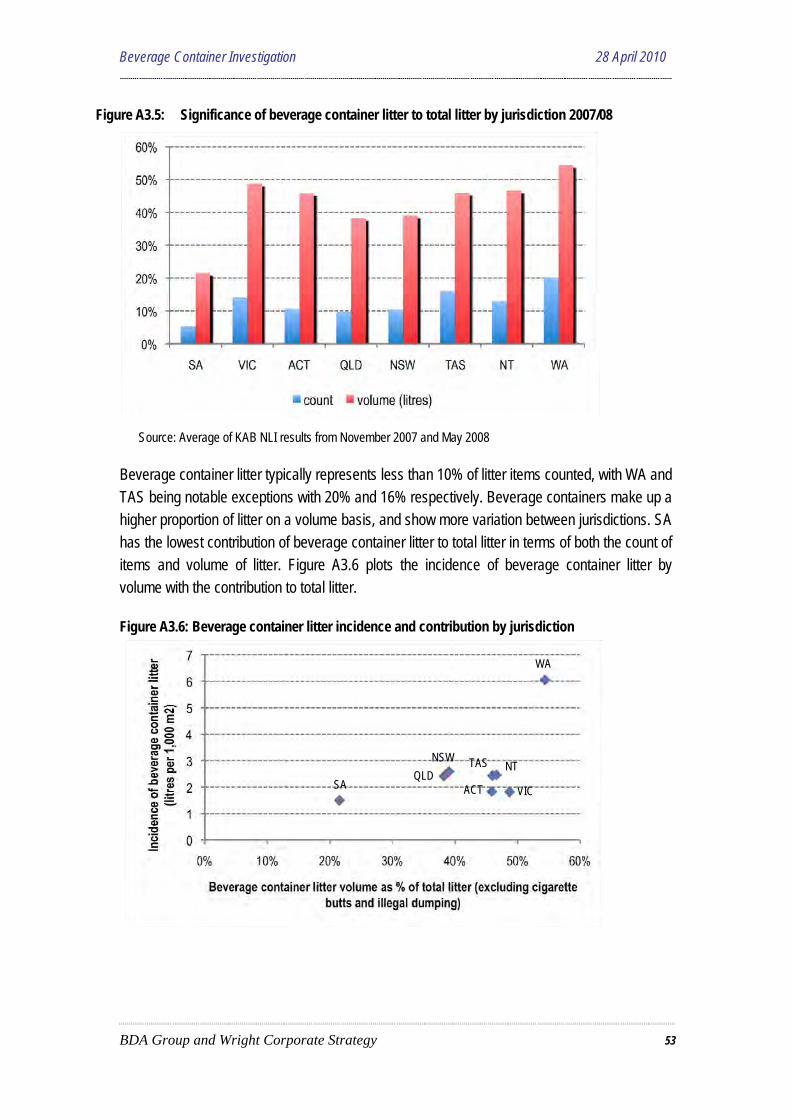
Beverage Container Investigation 28 April 2010
BDA Group and Wright Corporate Strategy 53
Figure A3.5: Significance of beverage container litter to total litter by jurisdiction 2007/08
Source: Average of KAB NLI results from November 2007 and May 2008
Beverage container litter typically represents less than 10% of litter items counted, with WA and TAS being notable exceptions with 20% and 16% respectively. Beverage containers make up a higher proportion of litter on a volume basis, and show more variation between jurisdictions. SA has the lowest contribution of beverage container litter to total litter in terms of both the count of items and volume of litter. Figure A3.6 plots the incidence of beverage container litter by volume with the contribution to total litter.
Figure A3.6: Beverage container litter incidence and contribution by jurisdiction
NT
WA
SA QLD
TAS
VIC
NSW
ACT
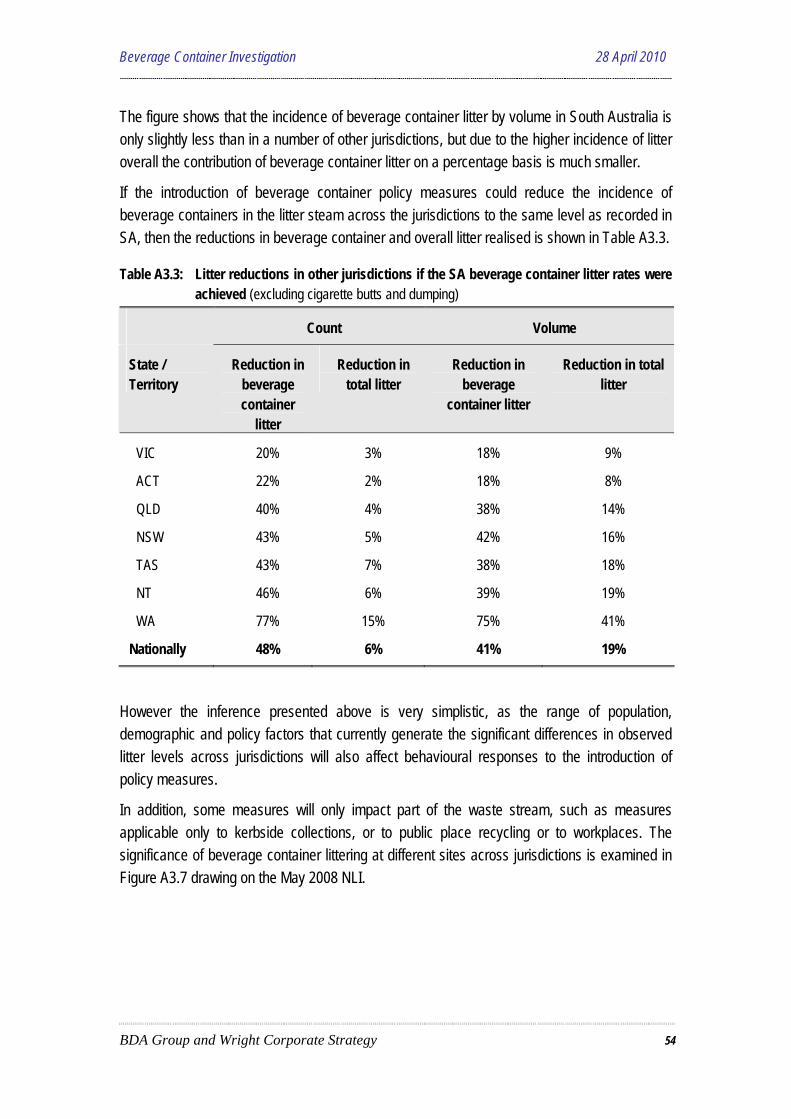
Beverage Container Investigation 28 April 2010
BDA Group and Wright Corporate Strategy 54
The figure shows that the incidence of beverage container litter by volume in South Australia is only slightly less than in a number of other jurisdictions, but due to the higher incidence of litter overall the contribution of beverage container litter on a percentage basis is much smaller.
If the introduction of beverage container policy measures could reduce the incidence of beverage containers in the litter steam across the jurisdictions to the same level as recorded in SA, then the reductions in beverage container and overall litter realised is shown in Table A3.3.
Table A3.3: Litter reductions in other jurisdictions if the SA beverage container litter rates were achieved (excluding cigarette butts and dumping)
Count Volume
State / Territory
Reduction in beverage container
litter
Reduction in total litter
Reduction in beverage
container litter
Reduction in total litter
VIC 20% 3% 18% 9%
ACT 22% 2% 18% 8%
QLD 40% 4% 38% 14%
NSW 43% 5% 42% 16%
TAS 43% 7% 38% 18%
NT 46% 6% 39% 19%
WA 77% 15% 75% 41%
Nationally 48% 6% 41% 19%
However the inference presented above is very simplistic, as the range of population, demographic and policy factors that currently generate the significant differences in observed litter levels across jurisdictions will also affect behavioural responses to the introduction of policy measures.
In addition, some measures will only impact part of the waste stream, such as measures applicable only to kerbside collections, or to public place recycling or to workplaces. The significance of beverage container littering at different sites across jurisdictions is examined in Figure A3.7 drawing on the May 2008 NLI.

Beverage Container Investigation 28 April 2010
BDA Group and Wright Corporate Strategy 55
Figure A3.7 Beverage containers by site, May 2008 (count per '000m3)
0
5
10
15
20
25
Beach Car park Highway Industrial Recreationalpark
Residential Retail Shoppingcentre
SA
Vic
ACT
NSW
NT
QLD
TAS
WA
Source: KAB NLI. Excludes cigarette butts and illegal dumping
The NLI data indicates that the incidence of beverage container litter is significantly higher at highway and industrial sites, particularly in WA and TAS. The incidence of beverage container litter at beach and recreational sites is relatively low, which is notable as these sites may be have higher litter impact values associated with visual amenity and risks of glass cutting injuries. It is therefore possible that significant reductions in the overall incidence of beverage container litter could occur with less than proportional reductions in litter impacts if gains were not evenly spread across site types.
Also notable is that the incidence of beverage containers at highway sites in VIC, the ACT and NSW are similar to that recorded in SA. While caution is needed in making inferences to causal factors, the combination of litter management strategies in those jurisdictions may be proving as effective as the strategies in SA (which includes a container deposit scheme) in preventing beverage container litter along highways. Whether or not the similarity in beverage container litter incidence at highway sites across these jurisdictions is due to policy or demographic factors, the introduction of a container deposit scheme in these jurisdictions may not lead to further and significant reductions in this litter.
In summary, packaging has been identified as a significant part of the litter stream with beverage containers alone representing 12% of total litter by count or 42% by volume in 2007/08 at the national level (excluding cigarette butts and illegal dumping). Beverage container litter is also the dominant source of glass litter which is responsible for a large number of glass cutting injuries each year.
Rather than establishing ‘acceptable’ levels of litter, governments work towards litter minimisation within the constraint of program costs and community amenity preferences (which will vary between regions and site types), which together with differences in population demographics has led to a range in the incidence of litter recorded across jurisdictions. Due to

Beverage Container Investigation 28 April 2010
BDA Group and Wright Corporate Strategy 56
these differences, the introduction of a litter reduction measure in one jurisdiction may lead to very different outcomes in other jurisdictions.

Beverage Container Investigation 28 April 2010
BDA Group and Wright Corporate Strategy 57
A4 THE POLICY PROBLEM AND RATIONALE FOR NATIONAL ACTION
The primary rationale for government action to address the ‘packaging waste’ problem rests on economic efficiency criteria:
• Establishing the existence of a market failure(s) in the management of packaging waste;
• Demonstrating that existing legislation is not (or could not) adequately address the problem;
• Establishing that government action on packaging waste would lead to a net benefit from a whole of community perspective; and
• That a packaging waste initiative would be the most efficient means by which government could overcome the market failure – that is, that it would provide greater net benefits than other courses of action.
The range of environmental impacts associated with packaging production, consumption and disposal canvassed in this report represent classic sources of market failure. The creation of greenhouse gases, air and water pollutants, landfill disamenity and so on are termed ‘externalities’, in that those who create them, in the absence of government action, do not incur the costs (or benefits). Accordingly they are not managed at optimal levels from a community perspective.
Due to the significance of these problems, governments have introduced a range of regulatory instruments to limit the incidence and / or impacts associated with the problems. And while government responses to some (such as greenhouse gases and water) remain works in progress, generally a legislative platform exists to limit each identified problem. Further, as most are being managed within the established limits, additional government measures on packaging waste to further reduce these problems would only be warranted if the cost of the measures was less than the benefits from lowering the established limit for each problem – such that the marginal benefits of the measure outweighed marginal costs and a net benefit was achieved.
Whether this is possible cannot be answered in this report as the valuation of benefits is outside the scope of the study. However the rationale for a national measure could rest on its contribution in reducing beverage container litter and related impacts such as glass cutting injuries, and / or benefits associated with increased resource recovery. A further rationale for government action to address the ‘packaging waste’ problem could relate to a desire across all levels of government to seek changes in community attitudes and motivation towards ecologically sustainable development (ESD). This requires systemic change in values and behaviour towards the environment across the multiple intersections of daily life and environmental impact.

Beverage Container Investigation 28 April 2010
BDA Group and Wright Corporate Strategy 58
The beverage container working group (BCWG) undertook, as part of the project brief, to work with the consultants on an appropriate problem definition to guide the analysis of options. Following a preliminary report from the consultants on this, the BCWG formed the view that both container recovery (as a proxy for upstream benefits notably resource conservation) and litter reduction impacts were to be given a similar depth of treatment in the report.
In forming this view the BCWG noted that even where the easily quantified values of reduced impacts (as covered in the report) could be expected to be minimal or insignificant, there remained a justification for inclusion ‘on the basis that greater (potentially significant) value may be placed on these reductions by individuals and communities’.

Beverage Container Investigation 28 April 2010
BDA Group and Wright Corporate Strategy 59
A5 EFFECTIVENESS OF EXISTING REGULATION/LEGISLATION
At Section 2.5 above in the Situation Analysis, the cost effectiveness of a number of packaging waste policy initiatives was presented. Here, relevant data from that section is used and presented in a form that allows for comparisons to be made between the various intervention options, and for uplift, where appropriate, of relevant data for use in the subsequent evaluation of possible new intervention options.
A5.1 National packaging covenant framework
The National Packaging Covenant is the voluntary component of a co-regulatory arrangement for managing the environmental impacts of consumer packaging in Australia through better design and production processes and to facilitate the re-use and recycling of used packaging materials. It is an agreement based on the principles of shared responsibility through product stewardship, between key stakeholders in the packaging supply chain and all spheres of government.
Of particular importance is the adoption of product stewardship policies and practices by all participants in the packaging supply chain that contribute to the minimisation of the environmental impacts of consumer packaging within their individual spheres of influence, the optimisation of packaging to balance resource efficiency and maximise resource re-utilisation and where applicable and sustainable, the provision of used packaging and paper recovery systems. 26
A 2008 mid-term review of the National Packaging Covenant27 has found that:
• progress has been made towards the achievement of the Covenant’s targets through a combination of regulatory action by jurisdictions, market forces and Covenant projects;
• the recycling level for post-consumer packaging increased from 40% in 2003 to 56% in 2007 and the 65% target for 2010 is likely to be met - (Target 1);
• the recycling rate for plastics which are designated as ‘non-recyclable packaging’ under the Covenant increased from 11% in 2003 to 24% in 2007, and the 25% target for these materials is also likely to be met by 2010 - (Target 2); and
• there has been no increase in the amount of packaging disposed to landfill - (Target 3).
In respect of assessing the effectiveness of the Covenant as an instrument to bring about change in the recovery of used packaging materials, the mid-term review states:
“the extent to which the Covenant has been responsible for outcomes such as improvements in packaging efficiency and increased levels of recycling, which have also been influenced by
26 The National Packaging Covenant 2005 to 2010 27 National Packaging Covenant Mid-Term Performance Review, October 2008

Beverage Container Investigation 28 April 2010
BDA Group and Wright Corporate Strategy 60
commercial, political and economic factors, is difficult to establish. However, progress to date appears to have been driven, at least in part, by the cooperative efforts of signatories to improve the recyclability and recycled content of packaging and to improve collection and reprocessing systems for post-consumer packaging. Covenant-funded projects are expected to make a significant contribution to the amount of recyclable material which will be diverted from landfill by 2010.”
Clearly, in light of the complex nature of the market for recovering used packaging, it is difficult to attribute direct responsibility for specific outcomes against the cost of implementing the Covenant initiatives. In a supporting report to the mid-term review28, costs of the Covenant were computed at $18.6 million and reduced to a per capita basis for comparison with the cost impost of packaging instruments in other jurisdictions.
Table A5.1: Indicative cost of packaging instruments
Jurisdiction Instrument Cost per capita per annum
Germany Packaging Ordinance $32.30
Netherlands Decree $5.10
Australia NPC $0.89
Source: Hyder October 2008
In a subsequent analysis of project expenditures for the National Packaging Covenant mid-term review, Hyder provide data on the cost of project initiatives, the potential diversion expected from the initiative and the packaging material where the gains are to be expected. This data allows computation of an indicative marginal cost for packaging material recovery under the NPC.
The data is summarised at Table A5.2.
28 National Packaging Covenant Mid-Term Review – Contextual Review, Hyder October 2008

Beverage Container Investigation 28 April 2010
BDA Group and Wright Corporate Strategy 61
Table A5.2: Indicative marginal cost of recovery through NPC projects
Material Potential Recovery (tonnes)
Project cost Recovery cost per tonne
Paper/cardboard 145,300 $2,450,235 $16.86
Glass 230,400 $3,615,219 $15.69
Plastics 33,300 $897,778 $26.96
Steel cans 12,700 $213,376 $16.80
Aluminium cans 4,300 $72,753 $16.92
Total 426,000 $7,249,361 $17.02
Source: Hyder October 2008
A5.2 CDS as implemented in South Australia
An assessment of the cost of the South Australian container deposit scheme presented at Section 2.5 was based on material submitted to the Senate inquiry on waste management during 2008 by Recyclers of South Australia. At Table A5.3, data on the South Australian scheme is summarised along with an estimate of the indicative economic costs for the scheme.
Table A5.3: Indicative cost and effectiveness of the SA CDS scheme
Scheme parameter
Container drop-off 32,000 tonnes
Containers thru kerbside and MRFs 8,000 tonnes
Cost of containers thru CDS system $20.44 million
Cost of containers thru kerbside and MRFs $ 1.45 million
Nominal cost of capital investment $ 0.24 million
Population served thru CDS 1.5 million
Cost per tonne recovered $550 per tonne
Cost per capita $14 to $15 per head
Source: Recyclers of SA & WCS estimates
A5.3 Municipal kerbside recycling
The reports from jurisdictions under the National Packaging Covenant on recycling activities provide a basis for assessing the effectiveness of kerbside recycling and for investigating
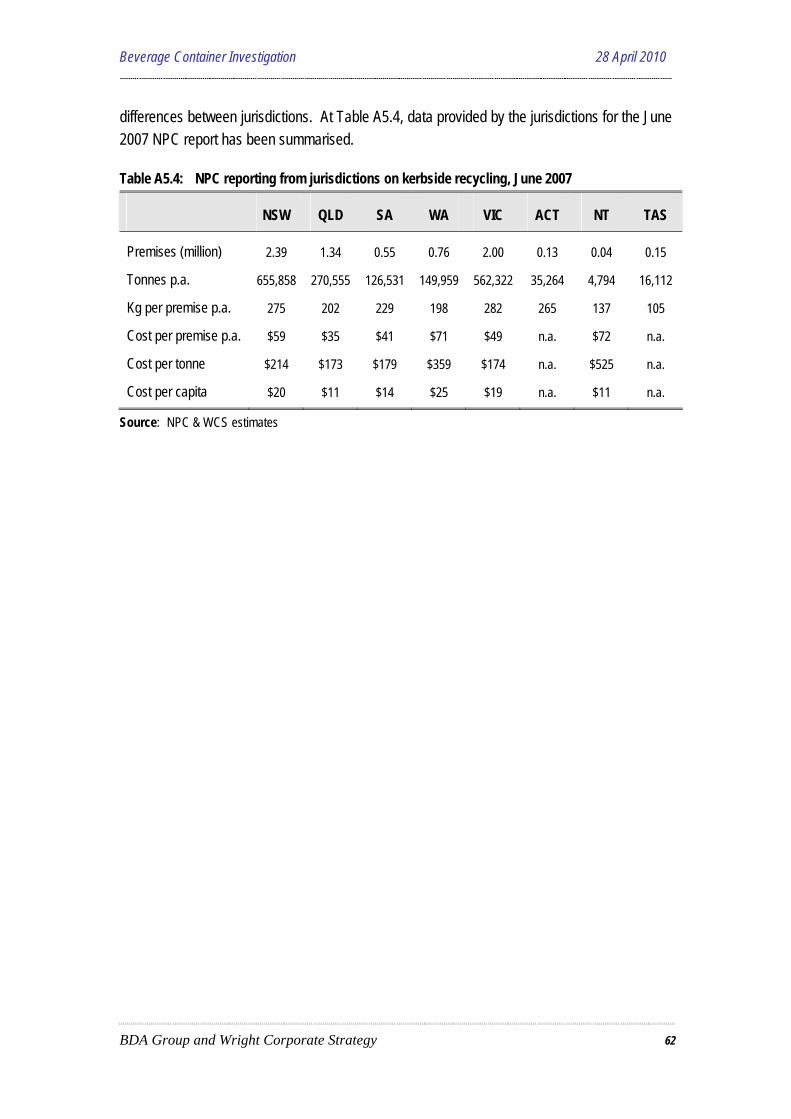
Beverage Container Investigation 28 April 2010
BDA Group and Wright Corporate Strategy 62
differences between jurisdictions. At Table A5.4, data provided by the jurisdictions for the June 2007 NPC report has been summarised.
Table A5.4: NPC reporting from jurisdictions on kerbside recycling, June 2007
NSW QLD SA WA VIC ACT NT TAS
Premises (million) 2.39 1.34 0.55 0.76 2.00 0.13 0.04 0.15
Tonnes p.a. 655,858 270,555 126,531 149,959 562,322 35,264 4,794 16,112
Kg per premise p.a. 275 202 229 198 282 265 137 105
Cost per premise p.a. $59 $35 $41 $71 $49 n.a. $72 n.a.
Cost per tonne $214 $173 $179 $359 $174 n.a. $525 n.a.
Cost per capita $20 $11 $14 $25 $19 n.a. $11 n.a.
Source: NPC & WCS estimates

Beverage Container Investigation 28 April 2010
BDA Group and Wright Corporate Strategy 63
A6 METHODOLOGY FOR ASSESSING NEW NATIONAL MEASURES
This section introduces the criteria and methodology for assessing options to achieve reductions in packaging litter (particularly beverage container litter) and improve resource recovery. It also discusses the selection of options for assessment in this report and the base case situation assumed for the assessment.
The purpose of the assessment is to examine the relative merits of different options and the relativities between options. Both qualitative and quantitative measures are used to assess the options against the criteria. The methodology for the quantitative assessment is a comparison of the incremental costs of implementing each of the options. The analysis is illustrative only and the estimated costs of options therefore do not represent forecasts of likely costs. Rather, the analysis has been developed to inform option selection and more precise cost estimates would need to be developed during detailed design of any individual option for implementation.
A6.1 Criteria and methodology for assessment
Seven criteria were developed in consultation with the BCWG and SRG for assessing the options. These are:
• Suitability as a national measure.
• Effectiveness in achieving improvement in line with the defined problem.
• Compatibility with, and impact on, existing (or planned) waste and recycling systems.
• Cost and complexity of implementation and operation.
• Financial impacts on each affected stakeholder group.
• Likely performance across jurisdictions, and in defined location categories (metro, regional, remote).
• Cost-effectiveness in addressing the problem.
Table A6.1 explains each criteria and how it will be applied to evaluate each option. Both qualitative and quantitative indicators are used for the assessment. Some quantitative measures of the performance of options have been designed to allow comparisons across options with different types of outcomes. For example the cost-effectiveness of the option will be assessed by the number of additional containers recovered and % reduction in the national litter count that would be delivered for each $1m economic cost under the option.

Beverage Container Investigation 28 April 2010
BDA Group and Wright Corporate Strategy 64
Table A6.1 Explanation of criteria for assessing options
Criteria for assessing options
Type of assessment
Key questions / quantitative indicators
Suitability as national measure
Qualitative How easy is it to implement at a national level? Where in the supply chain is it implemented? How many participants are required to comply? Could the Commonwealth act unilaterally? How does it fit with current institutional arrangements at the national level? What variations in implementation would be needed across states, regions and remote areas?
Effectiveness in litter reduction and resource recovery
Quantitative Can the option directly target litter? Can it target resource recovery? What level of certainty is there that litter reduction and resource recovery outcomes would be achieved? Quantitative indicators: Expected % reduction in national litter incidence by volume (litres per 1000m2). Tonnes of packaging materials recovered.
Compatibility with existing waste & recycling management systems
Qualitative How would it fit with the NPC? How would it fit with existing kerbside recycling schemes? What existing systems could be used for implementation? What impact (positive or negative) would the policy have on existing systems?
Net economic cost and complexity
Quantitative and qualitative
What is the overall magnitude of net economic costs? How complex is the policy? Are new institutions / new organisational structures required? Quantitative indicators: Total national annual net economic costs to government, industry and broader community including compliance and administrative costs.
Financial impacts Quantitative Who bears the costs of the option? Who receives any financial benefits? Quantitative indicators: Breakdown of financial costs and savings to federal, state and local governments, industry, consumers and broader community.
Performance across jurisdictions & in defined locations
Qualitative and quantitative
How would litter reduction and resource recovery vary by jurisdiction? By metro/regional/remote locations? (given existing systems eg CDS and kerbside, differences in recyclate processing, transport costs etc) Quantitative indicators: Breakdown of financial costs by jurisdiction, by metro, regional and remote areas and across consumption sectors.
Cost-effectiveness - combines economic cost and effectiveness from above
Quantitative Quantitative indicators: Total net economic cost per tonne of resources recovered. For each $1m economic cost: number of additional containers recovered and % reduction in national litter count.

Beverage Container Investigation 28 April 2010
BDA Group and Wright Corporate Strategy 65
A6.2 Selection of options for assessment
The issues paper canvassed a broad range of possible policy initiatives for consideration in the project. A short listing of options was carried out by the project team, reported in the preliminary report and considered by the BCWG & SRG in subsequent meetings.
Seven options have been selected for assessment including:
• container deposit scheme (CDS)
• advance disposal fee
• voluntary industry levy
• extended coverage of kerbside recycling/drop-off
• improved recycling at core consumption centres
• improved recycling at workplaces
• residual waste processing systems
The options rejected for assessment were landfill bans, intercepting waste before disposal, education as a standalone intervention policy and product charges. Landfill bans were rejected because they are generally used for bulky materials and would be very challenging to implement for packaging materials. The option of intercepting waste before disposal duplicated other options. Education is considered an essential element of many of the intervention policy to be evaluated and is considered in that context. A product charge would impose higher costs on consumers than an advance disposal fee or voluntary levy to achieve an equivalent outcome and would be unlikely to be supported by stakeholders.
The option of an improved national packaging covenant has not been considered as a stand alone option. Given that it is intended that the away from home sector will be a key focus for resource recovery and litter reduction initiatives under the 2005 to 2010 Covenant, the assessment of an improved National Packaging Covenant initiative will be considered under the relevant options where away from home improvements are being sought.
Further comment on the rationale for rejecting these options is provided in Appendix 5.
A6.3 Base case
In order to assess the outcomes of the options in terms of reduction in litter and increase in resource recovery it is necessary to define what would happen in the absence of any new policies. There are a number of existing policies affecting packaging including a range of programs under the National Packaging Covenant as well as litter programs and resource recovery initiatives in individual jurisdictions. This section provides the litter and resource recovery levels assumed for the base case.

Beverage Container Investigation 28 April 2010
BDA Group and Wright Corporate Strategy 66
Estimates of the volume of beverage container litter in each jurisdiction in May 2008 and the percentage contribution to total litter is provided in Table A6.2. There is a range of ongoing legislative provisions and campaign activities used across jurisdictions and litter levels have been steady for the last three years29. As there appear to be no significant new initiatives planned it is assumed that the volume of litter would remain at similar levels in the absence of the policy options being considered.
Table A6.2 Volume of litter by jurisdiction in May 2008*
State / Territory Volume of beverage container litter (litres per 1,000m2)
% of total litter volume
ACT 1.79 44%
NSW 2.02 34%
NT 1.93 53%
QLD 2.47 39%
SA 1.41 19%
TAS 3.28 43%
VIC 1.61 45%
WA 6.75 55%
Source: McGregor Tan Research 2008, National Litter Index, Annual Report 2007/08 * Excluding cigarette butts & illegal dumping
Estimates of the consumption and recovery of packaging materials in 2010 are shown in Table A6.3. The estimates draw on up-to-date information provided by the National Packaging Covenant on consumption as well as recovery associated with covenant funded projects that will be undertaken between now and 201030. Table A6.3 sets out the assumed annual consumption and recovery of packaging in the absence of any other new policy interventions.
Some options to be evaluated relate specifically to beverage containers. The projected consumption and recovery of beverage containers have been derived by the project team for 2010 to represent annual consumption / recovery under the base case for these options. The estimates are summarised in Table A6.4.
29 Litter Management in Australia, Report to the Environment Protection and Heritage Council, November 2008 30 Data provided by NPC in March 2009

Beverage Container Investigation 28 April 2010
BDA Group and Wright Corporate Strategy 67
Table A6.3 Projected consumption and recovery of packaging (tonnes)
Material Consumption 2007
Recovery 2007
Consumption 2010
Recovery 2010
Paper/cardboard 2,639,000 1,720,000 2,726,678 1,899,720
Glass packaging 1,011,700 397,000 1,045,312 525,130
Plastics packaging 585,296 178,351 604,742 239,781
Steel cans 116,439 34,129 120,308 37,559
Aluminium beverage cans
48,791 34,300 50,412 43,830
TOTAL 4,401,226 2,363,780 4,547,451 2,746,020
Source: Based on data provided by National Packaging Covenant March 2009, assumes 3% increase in consumption between 2007 and 2010
Table A6.4 Projected consumption and recovery of beverage containers (tonnes)
Material Consumption
2007
Recovery
2007
Consumption
2010
Recovery
2010
Glass 890,296 397,000 919,875 509,754
Aluminium 47,791 34,300 49,379 43,830
PET 88,137 43,670 91,065 59,028
HDPE 69,260 12,854 71,561 28,212
Steel 1,264 183 1,306 183
LPB 61,853 11,480 63,908 12,680
Other 11,090 2,058 11,458 2,058
TOTAL 1,169,690 501,545 1,208,552 655,744
Source: Based on data provided by National Packaging Covenant March 2009 and Hyder Australian Beverage Packaging Consumption, Recovery and Recycling Quantification Study 2008. Consumption projections assumed 3% increase in consumption between 2007 and 2010.
Table A6.5 below shows the number of beverage containers assumed for each tonne of material. These estimates are used to allow a comparison of the number of beverage containers recovered under each option.
Appendix 6 shows the background data used for 2010 consumption and recovery by material container type and location.

Beverage Container Investigation 28 April 2010
BDA Group and Wright Corporate Strategy 68
Table A6.5: Assumed number of beverage containers per tonne
Material Containers per tonne
Glass 4,784
Aluminium 66,821
PET 29,205
HDPE 20,008
Steel 13,875
LPB 24,060
Other 24,060

Beverage Container Investigation 28 April 2010
BDA Group and Wright Corporate Strategy 69
A7 SUMMARY ASSESSMENT OF POLICY OPTIONS
This section provides a brief description of the design for each policy option and a summarised comparative assessment of the options according to the criteria set out in Table A6.1. Part B provides the detailed assessment of each option against each of the criteria. The expected performance and costs of options is also compared to that for current policies.
A7.1 Option design and description
The design of each option is outlined below. More detailed information on the options is included in Part B.
Container deposit scheme
A container deposit scheme (CDS) entails a fee levied on the sale of a container product that is refunded after the product has been used and when the container is returned for recycling. The national CDS scheme evaluated here has been developed in consultation with the BCWG and SRG. The scheme structure is based primarily on the CDS operating in California with the scheme administered by a government body. The scheme includes aluminium, glass, plastic, liquid paperboard and steel containers including all containers for beer, soft drink, fruit juices, milk (both plain and flavoured), wine and spirits and flavoured water and sports drinks. A single deposit of 10 cents per container would apply under the scheme. Section B1 below discusses the main elements of the national CDS scheme and the differences between this scheme and the one currently operating in South Australia.
Extended coverage of kerbside recycling/drop-off
Further improvements to kerbside recycling are considered under this option including:
• Extension and improvement of the coverage of recycling opportunities throughout Local Government areas by providing seed funding for new/upgraded drop-off depots in remote LGAs to cover capital costs.
• Improvement in the beverage container recovery rate within the existing kerbside recycling network through additional local government education programs.
• Further extension of Local Government kerbside recycling services to provide access to local small businesses. This option relies on the willingness of small businesses to opt for recycling services and pay higher fees.
Improved recycling at core consumption centres
Core consumption centres are public places and event venues where consumption of food and beverages is concentrated in a relatively small area and the waste stream generally contains relatively large amounts of beverage containers and food packaging. The options evaluated in this sector include:

Beverage Container Investigation 28 April 2010
BDA Group and Wright Corporate Strategy 70
• Uniform national measures to address public place recycling implemented through existing local government ordinances.
• Uniform national measures to address event recycling implemented through by amending existing local government minimum development approval requirements for promoters seeking permission to run events.
• Encouraging private sector operators in the hospitality, retail and institutions sector to increase recycling by providing seed support under the existing National Packaging Covenant framework to build financial viable recycling services. Many institutions are government owned and operated and therefore also present an opportunity for government leadership.
Improved recycling at workplaces
The policy mechanism for implementation of improvements to recycling from small commercial and industrial enterprises is likely to be through an existing instrument, such as the National Packaging Covenant, - as with the Covenant supported Harvest initiative being implemented by Transpacific Industries in a number of jurisdictions. Alternatively the initiative could be implemented through a jurisdictional program, as is the case in South Australia with the Recycling at Work initiative.
Initial seed support would be provided to kick-start the collection of additional recyclables and to build collection runs into financially viable and productive services, such that in a relatively short period of time the services become sustainable and self-funding and do not require on-going subsidy from government.
Residual waste processing systems
Systems for handling and processing residual waste that might lead to increased recovery of packaging materials, and beverage container packaging in particular, are referred to as AWTs (alternative waste technologies) and are applied to mixed waste streams with the intent of capturing potentially valuable resources.
With increasing efforts at resource recovery in major metropolitan centres, introduction of mixed residual waste processing systems is becoming more common. The policy option considered here is to accelerate the introduction of mixed waste processing via MBT technology through a national initiative encouraging jurisdictions to use mixed waste processing to meet their waste reduction targets.
Advance disposal fee
There are many ways in which an advance disposal fee (ADF) could be crafted. We evaluate a uniform weight based fee per tonne on all packaging materials. The fee would have a legislative basis and would be managed by a government body. The revenues collected would be used to subsidise increased recovery of packaging materials, with the fund manager

Beverage Container Investigation 28 April 2010
BDA Group and Wright Corporate Strategy 71
seeking the most cost effective recovery options. For the purpose of this illustrative analysis a fee of $10 per tonne of packaging material has been used with the revenues allocated to the options from the list above with the lowest cost per tonne of additional packaging recovery.
Voluntary industry levy
In mid-2007 four major beverage companies in Australia - Coca Cola Amatil, Lion Nathan, Fosters and Cadbury Schweppes – developed a proposal for companies to pay a voluntary recycling levy of $10 per tonne of glass packaging used to raise funds to increase the collection of glass containers for recycling31. We assess a voluntary levy on glass beverage containers with a similar structure to that recently considered by beverage companies. The levy would be payable by major beverage companies and other glass fillers. Voluntary administration would be undertaken by the beverage industry with revenues allocated to subsidise increased glass recovery. For the purpose of this illustrative analysis a fee of $10 per tonne of glass packaging is used with the revenues allocated to the options from the list above with the lowest cost per tonne of additional glass recovery.
Table A7.1 summarises the types of policies to be assessed.
Table A7.1: Summary of types of policies assessed
Option Regulatory Market based Administrative Suasive
Container deposit system √ √ New / improved drop-off in remote areas
√
Improve kerbside recovery rates
√
Extend kerbside to small business
√
Public place recovery √ Events recovery √ Hospitality / retail / institutions recovery
√
Workplace recovery √ Residual waste processing systems
√
Advance disposal fee √ √ √ √ Voluntary glass levy √ √ √
31 Environmental Manager Issues 633 and 634, 17 July and 24 July 2007

Beverage Container Investigation 28 April 2010
BDA Group and Wright Corporate Strategy 72
A7.2 Comparative assessment of options
Part B of this report provides the individual evaluations of each option according to the criteria set out in Table A6.1. This section draws together the results of Part B to provide a comparative assessment of the options consolidating the results for each criteria.
Criteria 1 - Suitability as national measure
The voluntary glass levy would be easiest to implement at a national level as no new legislation or institutions would be required, most beverage companies operate at a national scale, there is already co-operation at a national level through the NPC and beverage companies have already expressed a willingness to pursue this option.
Extending coverage of kerbside recycling / drop-off could also be achieved under the national packaging covenant without change to legislation or institutions. Implementation would need to be tailored to specific priority areas (ie. remote areas and small business) and would need to integrate with existing local government services.
New legislation and supporting institutions would be required to implement CDS and the ADF either within or alongside the NEPM framework. National legislation would not be suitable for improving recycling at workplaces, however market incentives could be provided at a national level under the national packaging covenant.
A national CDS would have a broad group of participants including consumers of beverage containers, manufacturers, distributors and wholesalers. A national CDS would provide industry with a consistent national system and would have many advantages over individual state based schemes.
Criteria 2a - Effectiveness for litter reduction
Among the options considered the national CDS is expected to provide the greatest reduction in overall litter levels, with the potential to provide a 6% reduction in the total national litter count and a 19% reduction in the total national litter volume. Table A7.2 summarises the possible outcomes.

Beverage Container Investigation 28 April 2010
BDA Group and Wright Corporate Strategy 73
Table A7.2: Potential reduction in total national litter count across options
Option Sectors targeted Potential reduction in total national litter count
Container deposit system All sectors 6% Extended kerbside / drop-off
Residences and businesses serviced by kerbside drop / off
Insignificant
Public place recovery Parks, gardens, beaches, highways
0.3%
Events recovery Events 0.3% Hospitality / retail / institutions recovery
Hospitality / retail / institutions Insignificant
Workplace recovery Small commercial and industrial businesses
Insignificant
Residual waste processing systems
All sectors Insignificant
ADF Parks, gardens, beaches, highways
0.3%
Voluntary glass levy Hospitality / retail / institutions Insignificant
The only options other than CDS expected to provide significant litter outcomes are the public place and events recycling programs. The advance disposal fee has some impact to the extent that programs for public places are funded with the revenues.
Some of the options target sites where beverage container litter is currently relatively high and therefore have the potential to make an important contribution. For example, public place recovery has the potential to reduce litter around highways. The type of beverage container reduced is also important in considering litter impacts, with glass having a significant impact in the litter stream as a result of glass cutting injuries.
Criteria 2b - Effectiveness for resource recovery
The options that can deliver the greatest increase in the tonnes of packaging recovered are the advance disposal fee (611,000 tonnes per year), workplace recovery option (around 442,000 tonnes per year) and the container deposit system (around 330,000 tonnes per year). Table A7.3 summarises the expected outcomes for each option. It should be noted that the recovery numbers relate to the specific design selected for each of the options.

Beverage Container Investigation 28 April 2010
BDA Group and Wright Corporate Strategy 74
Table A7.3: Resource recovery outcomes for each option
Option Packaging material recovered (tonnes pa)
Beverage containers recovered (million pa)
Container deposit system 333,402 3,114
Extended kerbside / drop-off 89,000 348
Public place recovery 7,600 153
Events recovery 7,400 147
Hospitality / retail / institutions 72,400 842
Workplace recovery 442,000 264
Residual waste processing 60,000 661
Advance disposal fee 611,000 1,608
Voluntary glass levy 60,500 931
In terms of the specific outcomes for recovery of beverage containers, the greatest increase in containers recovered is expected from the container deposit system (around 3 billion containers) followed by the advance disposal fee.
The level of certainty around the expected resource recovery outcomes differs depending on the type of approach. The options involving regulation or new administrative rules have higher levels of certainty. Approaches using market incentives alone would have less certainty than regulatory approaches, but greater certainty than relying on education or voluntary action alone. Figure A7.1 ranks the options in order of decreasing certainty over outcomes.

Beverage Container Investigation 28 April 2010
BDA Group and Wright Corporate Strategy 75
Figure A7.1: Level of certainty over resource recovery outcomes under each option
0
200,000
400,000
600,000
CDS
Public p
lace re
covery
Events r
ecover
y
Workpla
ce rec
overy
Hospital
ity & re
tail re
covery
Extend
drop-o
ffADF
Improve
kerbsi
de rate
Residua
l wast
e proc
essing
syste
ms
Kerbsid
e for sm
all bus
iness
Volunta
ry glas
s levy
Higher level of certainty ......................... lower level of certainty
Tonn
es o
f pac
kagi
ng re
cove
red
pa
Criteria 3 - Compatibility with existing waste and recycling arrangements and systems
Most options are considered compatible with existing waste and recycling arrangements and systems. The CDS is expected to have a positive financial impact on existing local government kerbside systems. Section B1.1 in Part B of the report includes more discussion on the compatibility of CDS with existing kerbside systems and the magnitude of the financial savings expected for local governments with a national CDS.
The ADF and glass levy provide the greatest flexibility to pursue cost-effective approaches that integrate with existing systems. The residual waste processing option involves use of newer technology, however this is becoming a main-stream alternative to waste disposal at landfill in a number of centres.
Criteria 4 - Net economic cost and complexity
The highest cost option is CDS at around $680m per year. The options with the lowest total costs are the hospitality / retail / institutions program, public places and workplace recovery (at around $5m per year or less). It should be noted that the options provide a range of outcomes and this is considered further in the criteria on cost-effectiveness.

Beverage Container Investigation 28 April 2010
BDA Group and Wright Corporate Strategy 76
Table A7.4: Net economic cost of options (excludes environmental costs and benefits)
Option Economic cost ($ m per annum)
Container deposit system $680.0
Extended kerbside / drop-off $30.4
Public place recovery $5.7
Events recovery $11.2
Hospitality / retail / institutions $1.5
Workplace recovery $5.8
Residual waste processing $72.0
Advance disposal fee $42.4
Voluntary glass levy $8.6
Criteria 5 - Financial impacts
The CDS has the greatest impact on consumers of around $300m in total and also provides the greatest savings for local government of around $32m per year. The ADF and voluntary glass levy increase costs to the packaging / beverage industry and therefore consumers by $46m and $9m per year respectively.
The financial impact of the residual waste processing systems option is around $72m which would be borne by all three levels of government and passed on to taxpayers and ratepayers of the three major capital cities in line with a negotiated cost sharing program.
All options reduce landfill levies to State government in line with the increase in diversion from landfills. Increases in diversion from landfill take into account reductions in consumption or source reduction as well as increased recovery. Table A7.5 summarises the financial impacts.

Beverage Container Investigation 28 April 2010
BDA Group and Wright Corporate Strategy 77
Table A7.5: Incidence of financial impacts across community under each option ($m per year)
Initial incidence
Final incidence
CDS
Kerbside options
Core cons.
centres
Workplace recovery
Residual waste
process
ADF Glass levy
Federal govt Taxpayers -$161 -$1 -$2 -<$6 -$1 -
State govt Taxpayers -$73 -$2 -$2 -<$9 -$144 -$24
Residents -$20 -$17 -
}
} - $722
}
} $06 $06 Local govt
Businesses
+$325
-$9 - - - - -
Beverage industry
Beverage consumers
-$55 - - - - - -$9
Beverage consumers
Beverage consumers
-$250
Packaging industry
Packaging consumers
- - - - - -$46 -
Notes: Figures rounded to nearest $1m. A negative number means a financial cost, a positive number means a financial benefit.
1. Administrative costs of system. 2. Shared across three levels of government under negotiated cost sharing arrangement. 3. Fall in revenue from landfill levies based on increased recovery. 4. Fall in revenue from landfill levies based on total packaging diverted from landfill taking into account increased
recovery as well as source reduction and reduced consumption from imposition of ADF / glass levy. 5. Savings for kerbside systems plus savings in landfill disposal costs and levies plus deposits collected less material
revenues lost. 6. For any ADF or glass levy programs to be implemented by local government, the administration costs will be
included in the ADF revenue allocation. Criteria 6 - Performance across jurisdictions and in defined locations
A national CDS provides the best performance in terms of litter outcomes across the whole litter stream and all types of sites that are currently littered. Many options target specific sectors / locations for increased recovery of materials and therefore the outcomes are limited to specific areas. The outcomes of the ADF and glass levy would depend on how the funds were allocated. If funds were allocated based on cost-effectiveness this would probably focus on metropolitan areas and high yielding opportunities and the activities may not be as broadly based as for some other options.
Criteria 7 - Cost-effectiveness
The costs per tonne of packaging recovered vary across the options from around $13 per tonne to around $2,040 per tonne. Figure A7.2 shows the cost per tonne for each option.

Beverage Container Investigation 28 April 2010
BDA Group and Wright Corporate Strategy 78
Figure A7.2: Cost per tonne of packaging recovered under each option
$0
$500
$1,000
$1,500
$2,000
$2,500
Hospital
ity & re
tail re
covery
Workpla
ce rec
overy ADF
Glass le
vy
Extende
d kerb
side /
drop-o
ff
Public p
lace re
covery
Residua
l wast
e proc
essing
syste
ms
Events r
ecover
yCDS
The cheapest options per tonne of materials recovered are the hospitality sector and workplace recovery options, followed by the ADF and voluntary glass levy (that utilise a mix of programs to achieve increased resource recovery). It should be noted that some options may confer substantial benefits other than recovery of packaging (eg. residual waste processing).
The packaging, beverage container and litter outcomes per $1m spent under each option are shown in Table A7.6.
Table A7.6: Outcomes per $1m economic cost under each option
Option Cost-effectiveness (for each $1m cost)
Packaging recovered (tonnes)
Containers recovered (million)
Reduction in litter count
Container deposit system 490 5 0.01%
Extended kerbside / drop-off 2,928 11 -
Public place recovery 1,333 27 0.05%
Events recovery 661 13 0.02%
Hospitality / retail / institutions 47,013 547 -
Workplace recovery 75,815 45 -
Residual waste processing 833 9 -
Advance disposal fee 14,408 38 0.01%
Voluntary Glass Levy 7,010 108 -

Beverage Container Investigation 28 April 2010
BDA Group and Wright Corporate Strategy 79
The results in Table A7.6 are summarised in Figure A7.3 below. The figure plots the efficiency of each option in delivering the two key objectives of recovering containers and reducing litter. Options in top right corner have relatively high recovery of both containers and litter for every $1m spent. Options in the bottom left corner have relatively low levels of recovery of both containers and litter for every $1m spent.
Figure A7.3: Relative efficiency of options in achieving key objectives
0.00%
0.01%
0.02%
0.03%
0.04%
0.05%
0 20 40 60 80 100 120
Million containers recovered per $1m
Redu
ctio
n in
litte
r cou
nt p
er $1
m
The figure shows that the hospitality sector recovery option is the most efficient for recovering containers and the public place recovery option is the most efficient for recovering litter.
Public place
CDS
Glass levy
Hospitality / retail etc
◆ 550
ADF Work place
Events
RWP
Kerbside //

Beverage Container Investigation 28 April 2010
BDA Group and Wright Corporate Strategy 80
A8 CONCLUSIONS
The purpose of this study is to provide EPHC with a preliminary assessment of potential options for national measures, including container deposit legislation, to address resource efficiency, environmental impacts and the reduction of litter from packaging wastes such as beverage containers. For many areas of the assessment data is scarce and extrapolation fraught with difficulties. We have therefore focused on exploring the best candidates among potential options for more detailed assessment.
A national CDS is likely to be able to recover more litter and beverage containers relative to other options. However, the assessment suggests there are a number of alternative options that can recover packaging and / or litter more efficiently.
Introduction of a national CDS, based on the design parameters outlined above, is expected to increase recovery of beverage containers by around 333,000 tonnes per year above the 656,000 tonnes of beverage containers expected to be recovered in 2010 under the base case. In total around 989,000 tonnes per year equating to around 11 billion beverage containers are predicted to go through a national CDS. The net economic cost of a national CDS is estimated at around $680m per annum.
In terms of recovery of packaging material overall, improving recovery from workplaces is estimated to have the potential to provide more packaging recovery for a fraction of the cost of a national CDS. The advance disposal fee is estimated to have the potential to recover almost twice as much packaging material at less than 10% of the cost of CDS.
In terms of recovery of beverage containers, the CDS provides the greatest overall recovery, with the ADF expected to recover half the number of containers. The hospitality / retail / institutions option is by far the most efficient for recovery of beverage containers, estimated to recover 30% of the containers for less than 1% of the cost of CDS.
For litter recovery, the CDS option is estimated to have the potential to reduce the national litter count by around 6%. The outcome for all other options is less than 1%. The public place recovery option is more efficient, providing greater reductions in the national litter count compared with CDS per $1m spent. However, the absolute reduction in the total national litter count is very small given the small scale of the public place recovery option.
The cheapest resource recovery options of improvements for the hospitality sector and workplace recovery could be pursued under the existing National Packaging Covenant without legislative change. While the data is uncertain and there are large confidence intervals these options are an order of magnitude cheaper than options with a higher cost per tonne recovery such as CDS or residual waste processing systems.
We also expect that there would be greater certainty in achieving resource recovery outcomes under the options with regulatory frameworks (such as CDS). The ADF would also have a

Beverage Container Investigation 28 April 2010
BDA Group and Wright Corporate Strategy 81
regulatory framework for the imposition of the fee resulting in certainty over revenue collection, however the certainty over resource recovery outcomes would depend on the programs funded. In our example ADF option, the funds would be used for a range of activities including administrative programs, provision of market incentives and education for increasing recovery from workplaces, the hospitality sector, public places and kerbside recycling / drop-off systems.

Beverage Container Investigation 28 April 2010
BDA Group and Wright Corporate Strategy 82
PART B: INDIVIDUAL POLICY ASSESSMENTS
B1 CONTAINER DEPOSIT SCHEME
A container deposit scheme (CDS) entails a fee levied on the sale of a container product that is refunded after the product has been used and when the container is returned for recycling. A CDS for beverage containers currently operates in SA primarily to reduce the incidence of littering. Other schemes implemented overseas have been designed to capture a wider range of containers to increase resource recovery.
This section evaluates one scheme developed in consultation with the BCWG and SRG. The scheme structure is based primarily on the CDS operating in California. The scheme includes aluminium, glass, plastic, liquid paperboard and steel containers including all containers for beer, soft drink, fruit juices, milk (both plain and flavoured), wine and spirits and flavoured water and sports drinks. A single deposit of 10 cents per container would apply under the scheme.
The collection system includes collection depots and convenience zones. Convenience zones in California are typically a half-mile radius circle with the centre point originating at a supermarket. They provide an opportunity to redeem containers near where beverages are purchased. Some convenience zones would be similar to small depots, others would be unmanned with reverse vending machines.
Figure B1.1 provides a schematic of the main elements of the national CDS scheme.
The scheme would be administered by a government body. Fillers and distributors would charge retailers the deposit and pay the deposit plus handling fees to the government body. The government body would pay deposits and handling fees to supercollectors, who would act as intermediaries between the government fund and the recyclers. The supercollectors would pay deposits and handling fees to the depots and convenience zones. Sorting would be carried out by material, with pre-sorting by customers. The depots and zones would refund deposits to consumers / kerbside systems / charity groups etc.
There would also be the option of payment of refunds by weight for larger quantities. Supercollectors would sell the recyclate to material recyclers and end users. It has also been assumed that revenues from unredeemed deposits would be used to defray system operating costs by refunding handling fees and other operating costs paid by industry, with any surplus revenues kept by government to meet its own costs or go into consolidated revenue. Clearly this design element has significant financial implications for industry and government but not for the overall economic performance of the scheme.

Beverage Container Investigation 28 April 2010
BDA Group and Wright Corporate Strategy 83
Figure B1.1: Schematic of the main elements of a National CDS scheme
Notes: D = deposit, HF = handling fee, C = container to be recycled, RVM = reverse vending machine
While not illustrated in the diagram, it is likely that the consumer ultimately pays the handling fee, reflected in higher prices for beverages.
The main differences between the scheme being evaluated here and the South Australian scheme are:
• the wider set of beverage containers covered compared to SA
• supercollectors are intermediaries between the government and depots / recyclers (rather than between fillers / distributors and collection depots as in SA)
• handling fees are paid by the filler / distributor to the government fund (rather than to the supercollector as in SA)
• the use of convenience zones – some small depot style, others with reverse vending machines
C
D
Material recycler
Supercollector Filler/ Distributor
Retailer
Consumer
Depot Convenience Zone - depot
Convenience Zone - RVM
Government fund
COLLECTION CENTRES
D
D, HF
D,HF
D
D, HF
C
Kerbside recycling
C
C C
C

Beverage Container Investigation 28 April 2010
BDA Group and Wright Corporate Strategy 84
• the lower density of recycling centres (56 centres per million of population compared with 79 collection depots per million of population in SA)
• sorting is by material (whereas there is sorting by supercollector for some materials in SA).
Section B8 reports the results of sensitivity analysis to examine how variations in the base case level of recovery and the major features of the scheme would impact on its outcomes. For example, with a higher deposit of 20 cents per container or with administration by industry or an independent organisation.
B1.1 Assessment of CDS as national measure
Criteria 1 - Suitability of CDS as national measure
Implementation of a national CDS would require regulation, which may be possible through parallel legislation in each state and territory (under the NEPM framework) or directly through national legislation (although no legal advice in this regard has been sought). The point of application of a CDS is at the consumer with a requirement to pay a deposit that is refunded if the consumer returns the container to a collection depot. The participants of the scheme are all consumers of beverage containers as well as beverage manufacturers, distributors and wholesalers.
The CDS scheme described above would require the establishment of a government fund either within a current government department or as a new entity to manage the operation of the scheme. The Fund would need to meet key governance criteria including the authority to receive and pay the deposits and be accountable for the distribution of the funds through standard requirements including financial and management reporting and auditing.
A number of individual state jurisdictions are currently investigating the merits of introducing a CDS. Disparate state-based CDS schemes would impose additional compliance costs on industry as well as government. This would be due to the absence of scale efficiencies, duplication and need to enforce potential transfers of containers between schemes due to differential incentives (currently a problem for South Australia with the trucking in of containers from Victoria). A CDS is suitable as a national measure and would have many advantages over individual state based schemes.
Criteria 2a - Effectiveness of CDS for litter reduction
A national CDS could be expected to reduce beverage container litter levels. The magnitude of the reduction is expected to vary in different jurisdictions depending on the litter management measures currently in place and subject to demographic, social and environmental circumstances.
South Australia is the only jurisdiction with a CDS and has the lowest incidence of beverage container litter (by both count and volume per ‘000m2). For the purpose of this illustrative

Beverage Container Investigation 28 April 2010
BDA Group and Wright Corporate Strategy 85
analysis it is assumed that a national CDS could reduce the incidence of beverage containers in the litter stream across the jurisdictions to the same level recorded in SA. Table A3.3 in section A3.4.2 showed the potential percentage reductions in litter by state if a national CDS could deliver this and important qualifications with this assumption noted in the accompanying text.32
The potential impact of introducing a national CDS is estimated at a 48% reduction in the national beverage container litter count and a 41% reduction in the national beverage container litter volume. In terms of total litter it could deliver a 6% reduction in the total national litter count and a 19% reduction in the total national litter volume.
Criteria 2b - Effectiveness of CDS for resource recovery
A national CDS is also expected to increase resources recovered. There has been considerable debate in Australia about the performance of CDS systems both here in Australia and overseas. The South Australian CDS was achieving an overall return rate for beverage containers of 84% prior to the extension of the set of beverage containers covered in 2003. Since the extension, overall recoveries have increased but return rates have fallen to 70% due to return rates on newly introduced materials being much lower than for existing materials33. The rate for newly introduced materials such as liquid paperboard at about 42 per cent compared to 80 per cent for glass beer bottles which were part of the original scheme34. The approach used in this study is to estimate the potential recovery levels that could be achieved by a national CDS in the longer term once the scheme is well established.
A range of factors affect recovery levels under a CDS scheme including the level of deposit, convenience of return, container material, beverage contained, location of consumption and extent of kerbside collection coverage. A review of the performance of a range of schemes was undertaken to develop predicted recovery rates for this study including CDS systems in Canada, New York, South Australia and Hawaii. Table B1.1 shows the predicted recovery rates used in this study for a national CDS. Note that we have not assumed an “overall recovery rate” for each deposit level, but rather we have taken into account the type of material and location in predicting recovery levels.
32 No adjustment to assumed litter reductions has been made due to the recent increase in the SA deposit level
and associated increases in container recoveries which could be expected to further reduce container litter. Estimated recoveries for the national CDS has been based on experiences across a range of schemes (see Table B1.1) and the assumed litter benefit, although related to experiences in SA, provides only an ‘order-of-magnitude’ estimate. Any ‘fine-tuning’ would imply a level of confidence in the estimate that is unwarranted.
33 Senate Standing Committee on the Environment, Communication and the Arts, Management of Australia’s Waste Streams including consideration of the Drink Container Recycling Bill 2008
34 Ibid.

Beverage Container Investigation 28 April 2010
BDA Group and Wright Corporate Strategy 86
Table B1.1: Recovery rates predicted under CDS schemes according to deposit, material and location of consumption
Consumed at home or on licensed premises
Consumed mainly away from home
Traditional materials
10 cents 86% 76%
20 cents 95% 85%
Non-traditional materials
10 cents 71% 61%
20 cents 80% 70%
Notes: Traditional = glass, aluminium and PET Non-traditional = HDPE, Steel, LPB and other plastics
Introduction of a national CDS, based on the design parameters outlined above, is expected to increase recovery of beverage containers by around 333,000 tonnes per year compared to the base case (or around 3,100 million containers35). This is in addition to around 656,000 tonnes of beverage containers expected to be recovered in 2010 under the base case. In total around 989,000 tonnes per year equating to around 11 billion beverage containers are predicted to go through a national CDS. Table B1.2 shows the fate of containers expected in 2010 with and without a national CDS.
35 Section A6.3 Base Case provides the assumed number of containers per tonne for each material type

Beverage Container Investigation 28 April 2010
BDA Group and Wright Corporate Strategy 87
Table B1.2: Fate of beverage containers in 2010 (approximate tonnes)
Without a national CDS
(tonnes per year)
With a national CDS
(tonnes per year)
Recovered at kerbside / drop-off 540,000 70,000
Recovered at commercial 80,000 100,000
Recovered directly at CDS collection centres (SA / national)
40,000 820,000
Total recovery 660,000 990,000
Landfilled 550,000 220,000
Total consumed 1,210,000 1,210,000
Notes: Consumption figures NPC data Without CDS: Total recovery figures from NPC data, split for recovery without CDS from Table A2.4 increased in
proportion with overall increase expected in recovery With CDS: Total recovery under CDS estimated using base case data section A6.3 and Appendix 6, return rates in
Table B1.1 above, 7% of CDS returns expected through kerbside, 10% of CDS returns expected through commercial.
The CDS would result in an increase in the packaging recycling rate from the forecast 54% in 2010 under the base case to 82%. Table B1.3 shows the extra recovery by material type. The bulk of the increased volume recovered is glass (around 77%) and plastics (around 13%).

Beverage Container Investigation 28 April 2010
BDA Group and Wright Corporate Strategy 88
Table B1.3: Additional recovery over and above the base case estimated under a national CDS
Material Extra resource recovery (tonnes per year)
Glass 258,300
Aluminium 1,300
PET 19,000
HDPE 19,100
Steel 500
LPB 29,600
Other 5,500
Total 333,400
Notes: Additional recovery figures generated from 2010 base case data in section A6.3 and Appendix 6, return rates in Table B1.1 above
There is also potential for a national CDS to encourage reduction in resources used to make beverage containers (ie: source reduction) if minimum requirements for container design were used as part of the scheme. The South Australian scheme requires approval for containers covered by the beverage container legislation and the EPA issues guidelines that need to be complied with. The reductions from source reduction are unlikely to be significant, and given difficulties in postulating potential reductions they have not been quantified here.
While there is some uncertainty about the exact level of returns that may be achieved under a national CDS, it is a regulatory measure capable of achieving additional resource recovery outcomes with a relatively high level of certainty.
Criteria 3 - Compatibility of CDS with existing waste and recycling arrangements and systems
There has been significant debate about the compatibility of CDS with existing kerbside systems. Container deposit legislation and kerbside systems have operated side by side in South Australia since the introduction of the legislation in 1975.
Some commentators have argued that deposit-refund schemes would have a negative impact on kerbside recycling systems with a reduction in volumes of materials resulting in reduced revenues for recyclables. However, the reduction in materials going through kerbside and drop-off recycling systems to material recovery systems also reduces the costs of running kerbside systems.
The main cost savings for existing kerbside systems with the introduction of CDS are:
• Reduced kerbside recycling collection costs due to reduced volumes of containers.

Beverage Container Investigation 28 April 2010
BDA Group and Wright Corporate Strategy 89
• Reduced sorting costs at materials recovery facilities.
• Reduction in contamination of paper from glass breakage.
The South Australian EPA has recently summarised evidence that CDS does not adversely impact on kerbside systems36. They note the Local Government Association of South Australia’s support for the recent increase in the deposit in South Australia and refer to a US Congressional report showing that CDS has resulted in cost savings for local governments in Seattle and Cincinnati. There are also a number of studies evaluating CDS proposals that predict overall cost savings for local government in NSW, New Zealand, and Victoria.
Part of the cost savings relate to lower glass contamination in kerbside recyclate for South Australian councils. However evidence of glass contamination more broadly is equivocal. For example, a recent Australian report assessing the significance of contamination by glass in recovered fibre packaging material found that most companies in the fibre packaging and recovery sector report that glass is not a contamination issue37. Further, a general move away from co-mingled recycling bins will significantly reduce contamination opportunities. On balance we have not included a value for reduced glass contamination.
It is expected that the national CDS under consideration in this study would have a positive financial impact on local government kerbside systems. The estimated savings are provided below under Criteria 5 – Financial impacts of CDS.
Criteria 4 - Net economic cost and complexity of CDS
Relative to other options, a CDS scheme involves a greater degree of complexity. This is because there are a large number of players in the deposit market – consumers, retailers and manufacturers. A CDS scheme requires establishing the government body to manage deposits and handling fees, setting up recording systems, establishing / modifying sites as collection centres, labelling and other administrative adjustments for beverage manufacturers and retailers, and delivery of education for consumers and industry on the operation of the scheme.
The primary costs of a CDS include system operating costs (including the capital costs of establishing collection centres and costs of container handling, transport and administration), costs of commercial collection and the inconvenience costs associated with redemption of deposits. The value of the additional material recovered provides a direct economic benefit. There are also cost savings associated with reduced materials in existing kerbside systems and drop-off recycling and avoided landfill costs.
36 The Case for a National Beverage Container Deposit System as a Product Stewardship Scheme, Paper
presented by South Australian EPA to the Environment Protection and Heritage Council, April 2008 37 Assessment of the Significance of Contamination by Glass in Recovered Fibre Packaging Material in Australia,
prepared by Industry Edge for the Packaging Stewardship Forum, February 2009.

Beverage Container Investigation 28 April 2010
BDA Group and Wright Corporate Strategy 90
The total national annual net economic costs to government, industry and broader community including compliance and administrative costs are estimated to be $680m million. This comprises $786 million in economic costs and $106 million in economic benefits.
Economic cost
The most significant economic cost of the scheme is the operating cost estimated at $517 million annually. Scheme operating costs include capital and collection costs for depots and convenience zones, supercollector costs and transport costs. Table B1.4 shows the main components of these costs.
Table B1.4: Components of the system operating costs
Cost item Cents per container
Total $m / year
Handling costs 4 445
Super collector costs 0.4 44
Transport costs 0.3 28
Total 517
Notes: Derivation of costs discussed in Appendix 7.
There are also the costs of implementation and administration of the scheme covering:
• Administration including management of deposits, handling fees, auditing, fraud and unredeemed deposits;
• Government costs associated with implementing and administering legislation, ensuring proper labeling, ensuring collection centres meet required standards;
• Education costs including initial education of the public and on-going targeted education; and
• Business costs – including setting up internal systems and management, accounting and labeling.
The estimates for these cost items are broken down in Table B1.5.

Beverage Container Investigation 28 April 2010
BDA Group and Wright Corporate Strategy 91
Table B1.5: Components of implementation / administration costs
Cost item $M/yr
System administration 9.7
Regulatory costs 2
Business 4.5
Education 4.5
Total 21
Notes: Derivation of costs discussed in Appendix 7. Other economic costs include commercial collection costs and inconvenience costs. Commercial collection costs are estimated at $26 million. The inconvenience costs that consumers face when they collect, store and transport containers are estimated at around $223m per year. The assumptions behind both of these estimates are covered in Appendix 7.
Economic benefits
The primary economic benefit of the scheme is the value of the additional 333,000 tonnes of container materials recovered, estimated to be $54 million annually. Material values are based on medium term prices (shown in Table B1.6) rather than current prices which have fallen markedly with the global financial crisis.
Table B1.6: Material values
Material Value ($ per tonne)
Glass $70
Aluminium $2,000
PET $700
HDPE $750
Steel $75
LPB $150
Other plastics $135
Other paper $120
Source: Hyder 2008 National Packaging Covenant mid-term review and BDA/WCS estimates
Other economic benefits include the reduction in the costs to kerbside systems as a result of reduced containers through kerbside systems. It is estimated that around 380,000 tonnes per

Beverage Container Investigation 28 April 2010
BDA Group and Wright Corporate Strategy 92
year of beverage containers would be diverted from the kerbside system to CDS depots with the introduction of a 10 cent deposit (current kerbside recovery is estimated at 454,000 and is expected to fall to around 70,000 with a national CDS). This will reduce collection, sorting and transport costs. Collection costs would also be avoided for around 310,000 tonnes of containers diverted from landfill to the CDS depots (this 93% of the extra recovery with CDS that does not come through the kerbside system). Table B1.7 summarises the total annual kerbside benefits. The total benefit is estimated to be around $24 million annually.
Table B1.7: Economic benefits for kerbside systems
Kerbside item Economic benefit ($m/yr)
Collection $10.6
Sorting $3.8
Transport $9.3
Total $23.7
Notes: see Appendix 7 for assumptions
Avoided landfill costs for the extra 333,000 tonnes of containers diverted from landfill are estimated to be $13.3 million annually and are based on an average $40 per tonne gate fee (excluding government levies).
Finally, there is the benefit obtained from unredeemed deposits from overseas tourists estimated at $15 million annually. All other unredeemed deposits have been excluded from the economic analysis as they represent transfers (but are included below under financial impacts).
Note that any savings in litter cleanup costs that may result from introducing the scheme have not been included as economic benefits as they are captured in the litter outcomes canvassed in Section A3.4.
Summary of economic costs and benefits
The net economic cost of introducing a national CDS is estimated at around $680 m per year. Table B1.8 summarises the estimated major economic costs and benefits and Figure B1.2 provides a visual comparison of the magnitude of major impacts.

Beverage Container Investigation 28 April 2010
BDA Group and Wright Corporate Strategy 93
Table B1.8: Summary of economic costs and benefits
Economic Impact $m/yr
Costs
Handling / supercollectors / transport $517
Administration / implementation $21
Inconvenience costs $223
Commercial collection costs $26
Benefits
Material values $54
Savings for kerbside $24
Avoided landfill costs $13
Unredeemed deposits – tourists $15
Total $680
Notes: See Appendix 7 for assumptions
Figure B1.2 summarises the major economic impacts of the national CDS.
Figure B1.2: Composition of economic impacts of a national CDS
-$600
-$500
-$400
-$300
-$200
-$100
$0
$100
$200
Handling / superco
l lector
s / tran
sport
Inconve
nience
costs
Commercial co
llection co
sts
Administr
ation / im
plementation
Material values
Savings
for kerbs
ide syst
ems
Un-redeem
ed deposi
ts - touris
ts
Avoided lan
dfill co
sts
$m p
er ye
ar
Criteria 5 - Financial impacts of CDS
This section considers the incidence of scheme costs between levels of government, industry, consumers and broader community.

Beverage Container Investigation 28 April 2010
BDA Group and Wright Corporate Strategy 94
Impacts of CDS on industry
Under the scheme all beverage manufacturers and distributors would pay into an Australian government managed fund, recyclers would be reimbursed from the fund, and unredeemed deposits would be used to defray the costs of the scheme. The business costs include costs of setting up internal systems and management accounting and labeling.
The annual breakdown of the financial operating costs and benefits of the scheme to industry are shown in Table B1.9.
Table B1.9: Financial operating costs to the beverage supply chain
Costs and benefits $m / year
Handling costs $445
Other operating costs $72
Commercial collection costs $26
Business costs $5
Total material value (benefit) $242
Net financial costs $305
Notes: Handling costs include operating costs for depots and convenience zones, other operating costs include supercollector costs and transport costs. Estimates covered in Tables B1.4 and B1.5 above.
The financial operating costs equates to around $309 per tonne of containers recovered (based on all containers recovered) which can be compared with the $550 per tonne estimated in section A5.2 for the SA scheme. The cost per tonne is lower than for South Australia due to the use of convenience zones, lower density of recycling centres and sorting by material. Note that the economic cost per tonne of additional containers recovered is around $2,040, and it is this cost-effectiveness which is relevant for a comparative assessment of options.
Ultimate financial impacts on industry depend on the use of revenues from unredeemed containers. It is estimated that around 13.6 billion containers will be sold in 2010. With total recovery under a national CDS of around 11 billion containers the total unredeemed deposits are estimated at around $250 million per year resulting in a net cost to industry of $55m per year.
Impacts of CDS on government
The costs to the Australian Government would include resources for administration of the scheme, enforcement and education. The total costs are estimated to be around $16 million

Beverage Container Investigation 28 April 2010
BDA Group and Wright Corporate Strategy 95
per year. These include system administration, regulatory costs and education costs identified in Table B1.5.
Similar to the operation of the SA CDS, it is assumed that GST is included in the deposit amount. Therefore most of this is returned when the container deposits are redeemed. Outstanding GST revenue therefore relates to that incorporated into unredeemed deposits, which are retained by the Commonwealth. GST implications are therefore captured in the analysis of deposits and are not analysed separately.
State governments will see a reduction in landfill levies due to smaller volumes of beverage containers sent to landfill in general waste. Table B1.10 summarises the estimated financial impacts by jurisdiction. The net cost to state governments is generally below $1m, with the exception of NSW ($5m) where landfill levy rates are significantly higher.
Table B1.10: State government landfill levy losses under the national CDS
NSW VIC QLD SA WA TAS NT ACT TOTAL
Extra containers recovered (m/yr)
1,019 771 622 234 313 73 32 50 3,114
Extra tonnes recovered (‘000/yr)
109 82.6 66.6 25 33.5 7.8 3.4 5.4 333.4
Revenue lost through landfill levy ($m/yr)
$5.1 $0.7 $0.0 $0.6 $0.2 $0.0 $0.0 $0.0 $6.7
Notes: The number of containers recovered and tonnes recovered in each state are estimated based on the proportion of the Australian population in that state.
Population figures for each state obtained from ABS Catalogue 3239.0.55.001, Population Australian States and Territories, December 2007.
Assumes all recovered material does not end up in landfill.
Local government will collect deposits for containers recovered from kerbside systems and make savings as a result of less materials going through kerbside systems and to landfills. However, they will also lose the value of containers currently recovered through kerbside systems. And again, any savings in litter cleanup costs that may result from introducing the scheme have not been included here as they are captured in the litter outcomes canvassed in Section A3.4.
The total financial impact on local government is estimated to be a cost saving of $32m per year. Table B1.11 provides a breakdown of these impacts for local government.

Beverage Container Investigation 28 April 2010
BDA Group and Wright Corporate Strategy 96
Table B1.11: Financial impact of national CDS on local government
Impact Total value
($m / yr)
Deposits collected by local government ($m) $78
Kerbside savings (see Table B1.7) $24
Landfill cost savings (for new recovery) $13
Landfill levy savings (for new recovery) $7 Material values lost by local government ($m) $90
Net financial saving $32
Notes: Assumes 7% of CDS returns are through kerbside systems, landfill costs of $40 per tonne and average levies of $20 per tonne.
Impacts of CDS on consumers
The increased costs to industry of around $55m / yr are likely to be passed on to consumers through higher beverage container prices (equating to around 0.4 cents per container sold). In addition, consumers of beverage containers will pay a deposit which is refunded when the container is returned. The value of unredeemed deposits each year is estimated to be around $250m per year. The total impact on consumers is therefore estimated at around $305m per year.
Criteria 6 - Performance of CDS across jurisdictions and in defined locations
The potential for litter reduction varies widely across jurisdictions as was shown in Table A3.3. The litter reduction is likely to be much greater in jurisdictions with higher current rates of beverage litter (such as Western Australia) and lower in those with lower rates such as Victoria and the ACT. However, a national CDS is likely to provide benefits across the whole litter stream and across all types of sites that are commonly littered compared with other options that may encourage a focus on specific resource recovery initiatives in specific locations to deliver the desired outcomes.
The primary costs that are likely to vary by location are those associated with the set-up and running costs of the collection centres as well as the transport costs from collection centres to reprocessing facilities.
For a Californian style scheme there will be a mix of large scale depots and convenience zones (20% using reverse vending machines and 80% small depots). It is possible that the collection costs per container will not vary significantly between metropolitan and regional areas. Lower transport distances and costs in metropolitan areas will largely be offset by higher establishment costs, particularly the higher costs of land.

Beverage Container Investigation 28 April 2010
BDA Group and Wright Corporate Strategy 97
Collection costs per container may be much higher in remote areas, and the collection method and transport arrangements would need to be modified to limit recovery costs per container.
Criteria 7 - Cost-effectiveness of CDS
The economic cost of the national CDS is estimated at around $680 million per year. The expected outcomes include a reduction in national litter incidence by count of 6%, a reduction in national litter incidence by volume of 19% and an additional 333,000 tonnes of materials recovered (or around 3,100 million containers).
The cost-effectiveness of the option of implementing a national CDS is around $2,040 per additional tonne of material recovered.
Alternatively, for each $1 million economic cost imposed on the Australian economy the national CDS would recover an extra 5 million beverage containers (around 490 tonnes of packaging material) and reduce overall litter incidence (by count) by 0.01%.
B1.2 Summary of evaluation of CDS
A CDS is suitable as a national measure. There would be significant implementation costs in terms of establishing regulations and the government body to manage the system, changes for beverage manufacturers and retailers, and delivery of education for consumers and industry on the operation of the scheme. It is expected to provide additional resource recovery and litter reduction outcomes across the whole litter stream with a relatively high level of certainty through a legislative base. Table B1.12 summarises the assessment of the national container deposit scheme against the assessment criteria.

Beverage Container Investigation 28 April 2010
BDA Group and Wright Corporate Strategy 98
Table B1.12: Evaluation of CDS against criteria
Criteria Assessment
Suitability as national measure • New legislation required and may be possible under NEPM framework
• Would require establishment of government fund
• Would provide industry a consistent national system
Effectiveness in litter reduction and resource recovery
• 6% reduction in national litter count
• 19% reduction in national litter volume
• Additional 333,000 tonnes recovered per year (3.1 billion containers primarily plastic and glass)
• High level of certainty of outcomes
Compatibility with existing waste and recycling management arrangements and systems
• Compatible with kerbside
• New infrastructure required
Net economic cost and complexity • $680m per year
• Many players, regulation & enforcement required throughout system
Financial impacts • Industry - increased costs of $55m/yr which are likely to be passed on to consumers
• Consumers – costs of $305m/yr (comprising costs above as well as unredeemed deposits)
• Local Governments - reduced costs of $32m/yr
• State Governments - loss of levies of $7m/yr
• Australian Government - admin cost of $16m/yr
Performance across jurisdictions & in defined locations
• Likely to provide broad litter benefits across whole litter stream and types of sites
• Collection costs per container not likely to vary significantly across metropolitan and regional areas
• Higher costs or reduced services in remote areas
Cost-effectiveness • $2,040 per additional tonne recovered
For each $1m economic cost:
• 5m beverage containers recovered (490 tonnes)
• 0.01% reduction in national litter count
Beverage Container Investigation 28 April 2010
BDA Group and Wright Corporate Strategy 99
B2 EXTENDED COVERAGE OF KERBSIDE RECYCLING / DROP-OFF
Local Government kerbside recycling services are the dominant resource recovery scheme across Australia for packaging materials. Based on reports by State and Territory Governments38, around 85% of households have access to a kerbside recycling service. Hyder Consulting estimate kerbside recycling coverage at 91%39. As demonstrated at Chapter A5, this service (together with Local Government operated drop-off facilities) is effective in capturing around 68% of beverage containers consumed in the at home sector.
Further improvements to kerbside recycling may be an attractive option for increasing the recovery of packaging materials and beverage containers in particular. Further improvements to kerbside recycling are considered under this option including:
• Extension and improvement of the coverage of recycling opportunities throughout Local Government areas by providing seed funding for new/upgraded drop-off depots in remote LGAs to cover capital costs.
• Improvement in the beverage container recovery rate within the existing kerbside recycling network through additional local government education programs.
• Further extension of Local Government kerbside recycling services to provide access to local small businesses. This option relies on the willingness of small businesses to opt for Local Government provided kerbside recycling services in lieu of commercial waste services, and possibly paying higher fees.
The policy mechanism for implementation of such improvements to kerbside recycling could be through the existing National Packaging Covenant. Initial seed support could be provided through Covenant funding mechanisms to kick-start the improvement in services where new infrastructure is required. Local government would recoup additional ongoing costs directly from ratepayers through increased waste service charges.
B2.1 Extension of recycling services to poorly served LGAs
This strategy is aimed at tapping those, mainly remote, LGAs with potential for improved recycling performance that is currently not fulfilled because of infrastructure limitations. The focus of the strategy is LGAs that do not have and could not support a kerbside recycling service. The extension could in the first instance provide new drop-off depots within LGAs that currently have no recycling drop-off facilities. A further level of improvement could be gained by providing increased numbers of drop-off depots in poorly serviced LGAs, and upgraded drop-off recycling depots where current depots have a poor contamination record. 38 Compiled by the project team from information contained in State and Territory reports to National
Environment Protection Council on implementation of the Used Packaging NEPM. 39 Hyder Consulting, for National Packaging Covenant Council. National Packaging Covenant Structural Barriers
Investigation. May 2008.
Beverage Container Investigation 28 April 2010
BDA Group and Wright Corporate Strategy 100
As most of these poorly serviced LGAs are in remote locations, it would be appropriate to consider rationalising the types of beverage container materials collected. Priority could be given to selected materials on the basis of value, transport cost to reprocessing centre and/or potential for local use in secondary applications.
Around 10 – 15% of households have either poorly organised drop-off or no drop-off facilities (according to the NEPM reports). If the number of un-serviced properties could be cut to (say) 5%, then the recycling rate may be lifted by a further 20,000 tonnes per annum.
The main costs associated with these service additions are:
Kerbside collection extension – contract collection and sorting or consolidation costs; long-haul transport from remote locations; and selling cost net of revenue, where applicable. Based on kerbside services costs in semi rural regions, and depending on the beverage container types and transport distances involved, these costs could be in the range $300 to $350 per tonne, net of any benefits associated with reduced tipping costs.
Improved drop-off opportunities in remote areas – collection from drop-off facility and sorting or consolidation costs; long-haul transport from remote locations; and selling cost net of revenue, where applicable. Depending on the beverage container types, contamination rates, and transport distances involved, these costs are also likely to be in the range $300 to $350 per tonne to account for depot costs plus the extended transport. An additional capital cost allowance for new or improved drop-off facilities of say $5 million would be appropriate.
The estimated total cost is $7.6 million per annum for 20,000 tonnes per annum of packaging which includes a $5 million capital requirement (amortised over five years) and costs of 10% of the total subsidy allocation for administration.
B2.2 Improvement of recovery rate in kerbside recycling
Recovery rates in established kerbside recycling services vary between LGAs, with a substantial proportion of potentially recyclable materials discarded to the residual waste bin40. The high performing LGAs demonstrate the feasibility of achieving a general lift in the overall recycling rate, and therefore the recovery level for beverage containers.
It was estimated at Section A2 that current beverage container kerbside recycling performance amounts to around 68% of at-home consumption. Recognising the voluntary nature of kerbside recycling, education and persuasion appear to be the most logical stimulus to increase recovery. If the recycling rate could be lifted by (say) 10 percentage points to 78%, then a further 39,000 tonnes per annum of beverage containers would be recycled.
The main costs associated with this service improvement are:
40 NSW Department of Environment and Climate Change. Confidential information on NSW Local Council waste
and recycling bin audits for 2003-2007.
Beverage Container Investigation 28 April 2010
BDA Group and Wright Corporate Strategy 101
Increased kerbside collection recovery – marginal collection and sorting or consolidation costs; long-haul transport from more distant locations; and selling cost net of revenue, where applicable. Depending on the beverage container types and transport distances involved, and using typical metropolitan and outer metropolitan kerbside recycling costs, these costs could be in the range $200 to $250 per tonne recognising that many collection contracts are framed on a “per lift” basis and the focus of this initiative is improved contribution to existing recycling bins rather than introduction of new services. This cost is net of any benefit from reduced disposal costs. Estimated total cost $8.8 million per annum.
Community education and persuasion – the cost of community engagement aimed at lifting recovery rates across a broad array of LGAs is untested. Discussions with local government waste managers indicate that continuous reinforcement would be required through field work and local advertising. The cost of this effort is difficult to estimate, but could be in the order of $5 million per annum of additional expenditure on education.
Estimated total cost is $13.8 million per annum for an increase of 39,000 tonnes per annum.
B2.3 Extension of kerbside recycling services to local small businesses
The small business sector is increasingly able to access kerbside recycling services in some jurisdictions: in Victoria, some 75,000 non-residential, mostly retail, premises presently access municipal kerbside recycling services; in NSW, services are provided to some 6,600 non-residential premises; and in South Australia, some 38,000 services are provided to non-residential customers41. This makes good sense because C&I waste contractors are generally not geared up to collect small quantities of recycling materials, and the municipal recycling trucks are well positioned to collect from these premises at minimal marginal cost.
If the penetration of recycling services to small retail business premises could be lifted from the current 2% to (say) 5% of the number of household services, then a further 200,000 services would be provided to business premises that are likely to contribute to the beverage container recycling haul. Assuming that the beverage container recycling contribution from each business was, on average, 150 kg, an extra 30,000 tonnes per annum may be recycled through the extension of services.
Based on current recycling costs of $300/tonne net of any benefit from reduced disposal costs, the increased cost is around $9 million per annum for a yield of 30,000 tonnes per annum.
B2.4 Overall improvement
In summary, the indicative, plausible overall improvement from the above moderately challenging improvements to municipal recycling services is in the order of 89,000 tonnes per
41 State and Territory reports to National Environment Protection Council on implementation of the Used
Packaging NEPM.

Beverage Container Investigation 28 April 2010
BDA Group and Wright Corporate Strategy 102
annum through all three initiatives. The indicative cost is estimated at $29.8 million amounting to around $330/tonne. These results are set out at Table B2.1.
Table B2.1: Indicative improvement potential
Service Initiative Estimated improvement potential in recycling
(tonnes per annum)
Estimated annual cost of improvement
($m)
Improved service coverage 20,000 7.6
Improved kerbside recovery rate 39,000 13.8
Extension of kerbside services to small business premises
30,000 9.0
Total 89,000 30.4
B2.5 Assessment of extended coverage of kerbside recycling/drop-off
Criteria 1- Suitability as a national measure
Extension of kerbside recycling and drop-off services is suitable for application at a national level without change to legislation or regulation. Effective resource recovery systems and practices are in place, and extensive cooperative relationships exist across local government aimed at maximising service efficiency and critical mass.
Criteria 2a - Effectiveness for litter reduction
Increasing or extending kerbside collection to promote a shift from waste entering disposal bins to recycling bins is not expected to have any significant impact on litter outcomes.
Criteria 2b - Effectiveness for resource recovery
The estimated additional packaging recovery is 89,000 tonnes per annum including 350 million beverage containers.
The seed funding for new/upgraded drop-off depots in remote LGAs would provide a moderate level of certainty that outcomes could be achieved. A lower level of certainty needs to be attached to the outcomes of education programs to increase the beverage container recovery rate within the existing kerbside recycling network and extension of kerbside to local small businesses who would need to opt in voluntarily and pay higher fees.
Criteria 3 - Compatibility with existing waste and recycling arrangements and systems
The scheme is entirely compatible with existing arrangements and is essentially an extension of current services.

Beverage Container Investigation 28 April 2010
BDA Group and Wright Corporate Strategy 103
Criteria 4 - Net economic cost and complexity
The net economic cost of this option in total is around $30m per year (breakdown shown in Table B2.1 above).
Criteria 5 - Financial impacts
The financial impacts on remote local governments would be around $7m per annum passed on to ratepayers. Local governments with existing kerbside systems would incur net financial impacts of $13.8m per annum and would also pass this on to ratepayers. Local small business would incur financial impacts of up to $9m per annum.
The financial impact for the Australian Government is the capital cost subsidy for the remote LGAs of $1m per annum as well as associated administrative costs of $100,000 per annum.
The reduction in packaging waste to landfills from all three initiatives would reduce landfill levies paid to State Governments. The impacts would depend on how where the reductions occurred, however the overall magnitude of the reduction is estimated at around $1.78m per annum42.
Criteria 6 - Performance across jurisdictions and in defined locations
The initiatives considered would have an important effect in bringing improved resource recovery opportunities to some locations that are presently under-serviced. Efforts to lift recovery performance in areas already receiving kerbside recycling services would undoubtedly improve recovery of non-packaging materials as well.
Criteria 7 - Cost-effectiveness
The estimated cost of the initiatives tested is $30.4 million for an expected outcome of an additional 89,000 tonnes per annum of packaging materials representing some 350 million beverage containers recovered. The cost-effectiveness of the option is therefore around $340 per additional tonne of material recovered.
For each $1 million economic cost imposed on the Australian economy the improvements to kerbside and drop-off would recover 12 million beverage containers (2,900 tonnes of packaging material).
B2.6 Summary of evaluation of improvements to kerbside and drop-off
Extension of kerbside services and drop-off facilities offers an option that is compatible with existing waste and recycling systems and does not require any additional legislation.
Table B2.3: Evaluation of improvements to kerbside and drop-off against criteria
42 Allocated by State according to population.

Beverage Container Investigation 28 April 2010
BDA Group and Wright Corporate Strategy 104
Criteria Assessment
Suitability as national measure • Suitable without change to legislation or regulation.
Effectiveness in litter reduction and resource recovery
• Negligible impact on litter reduction
• 89,000 tonnes of packaging recovered (350 million containers)
Compatibility with existing waste and recycling management arrangements and systems
• Fully compatible with existing systems.
Net economic cost and complexity • $30.4 million/year.
• Uses familiar, proven systems.
Financial impacts • $7m/y cost for remote local governments and residents
• $13.8m/yr cost for local governments with existing services
• up to $9m/yr cost for small local businesses
• Costs to Australian government for subsidy and administration $1.1m/yr
• Reduced landfill levies to State governments $1.78m/yr
Performance across jurisdictions & in defined locations
• Increases opportunities to participate in recycling, particularly in remote areas
Cost-effectiveness • $340 per additional tonne recovered.
For each $1m economic cost
• 12 million beverage containers
• 2,900 tonnes of packaging

Beverage Container Investigation 28 April 2010
BDA Group and Wright Corporate Strategy 105
B3 IMPROVED RECYCLING AT CORE CONSUMPTION CENTRES
B3.1 Core consumption centres
Core consumption centres are public places and event venues where consumption of food and beverages is concentrated in a relatively small area and the waste stream generally contains relatively large amounts of beverage containers and food packaging.
The types of core consumption centres differ significantly in respect of opportunities for influencing recovery of used packaging and beverage containers in particular. Three classes are considered.
Public places in this context taken to be represented by parks, gardens, beaches, and roadside or streetscape locations – i.e. informal locations, predominantly out of doors, relatively unsupervised and extensive in geographical extent.
Events on the other hand are opportunities where large numbers of people congregate in a relatively localised place for some form of entertainment or activity that is often accompanied by the consumption of packaged food and beverages. At fenced events, barrier controls are used to limit the ingress and egress of participants, leading to some measure of control on both the food and beverages consumed as well as the disposal options made available for used packaging. Unfenced, or open events do not have barrier controls and therefore less control over consumption and discard options for participants.
Hospitality, retail and institutions represent premises where significant quantities of food and beverages are consumed in relatively confined areas and with the potential for relatively high levels of control over the generation and disposal of wastes and recyclables. Typical examples of the hospitality premises are hotels, clubs and restaurants; for the retail venues, shopping centres, general retail areas and food courts would be included; and the institutional premises would include hospitals, hostels and canteens/cafeterias/dining halls associated with large residential accommodation areas such as university colleges, military barracks etc.
Studies and investigations have identified that opportunities for increased recovery of packaging, and beverage container packaging in particular, in these core centres of consumption represent attractive target areas. Multiple investigations and trials have been undertaken, and in a number of jurisdictions case studies publicised.
In spite of numerous trials and considerable expenditure through the Covenant and other entities, there are only limited instances where full-scale adoption of schemes is in place and there remains a significant shortage of reliable and meaningful data on recovery quantities, even less data on costs, and little on either the numbers of people involved or the consumption.
Historical analysis of away from home consumption and recovery has been exceptionally fragmented with little obvious attempt by the various researchers to look at the away from

Beverage Container Investigation 28 April 2010
BDA Group and Wright Corporate Strategy 106
home sector holistically. Studies and reviews have been undertaken on silo-segments without “sensibility checks” back to a whole of system limit. Accordingly, some reports on potential recovery rates from the away from home sector may be grossly misleading.
In an effort to overcome this significant shortcoming in reliable data, and to produce a reasonable basis for estimates for the potential to recover beverage containers, independent estimates were carried out by WCS using the updated NPC data for consumption and recovery for the 2007 financial year. The detail of those calculations is included at Appendix 8 and uplifted for each of the core consumption areas considered.
Policy interventions to improve recovery of packaging materials, and beverage containers in particular, from core consumption centres are most likely to be achieved though the existing National Packaging Covenant. Some possible policy interventions and potential recovery opportunities are discussed below.
B3.2 Public places
Local Government Ordinances are a tool for establishing practice codes for recycling of packaging materials in public places. Introducing uniform national measures for such codes and ordinances could typically be implemented under the existing National Packaging Covenant mechanism. An assessment of the possible effectiveness and cost of such intervention measures is discussed below.
In a recent report for the National Packaging Covenant Council, Hyder Consulting reported on the key risks, structural barriers and challenges that may prevent the Covenant delivering to its full potential and achieving set targets which now embrace away from home recovery objectives.43 In that report a clear barrier to improved public place recovery of used packaging materials was the lack of defined and allocated responsibility for managing waste diversion. In most instances, multiple parties are involved across the chain from generation through management, and on to disposal, causing fragmented responsibility and allowing for responsibility shifting.
In an earlier report under the National Packaging Covenant, Hyder44 assessed a number of public place recycling initiatives and concluded that there were significant differences in the cost per tonne of packaging recovered, and that future expenditure under the Covenant on away from home recovery of used packaging should be restricted to only those areas where the cost per tonne was attractive and within reason.
The lack of traction in away from home recycling efforts and the (sometimes) discard of recycled materials once collected, would indicate that:
43 National Packaging Covenant Structural Barriers Investigation, Hyder, May 2008 44 Independent Assessment of Public Place Recycling, Hyder, July 2007

Beverage Container Investigation 28 April 2010
BDA Group and Wright Corporate Strategy 107
• the intervention approaches trialled individually or in combination are insufficient,
• there is little or no compelling reason for the interventions to work,
• there are no immediately available processing systems for recyclables with relatively high contamination levels, and
• there is no social pressure for participation.
Uniform national measures would need to address these systemic failures if there is to be forward movement in improving packaging recovery in public places.
Using data from the analysis at Appendix 8, it is estimated that there might be up to 35,100 tonnes of beverage containers in the waste stream from public places that might be considered as being available for recovery.
Local Government Ordinances can place obligations on organisations to maintain the immediate precincts over which they have responsibility, influence or control, and the ordinances can stipulate the type of disposal receptacles that are to be used for managing discards and capturing recyclables. Notwithstanding these ordinances and requirements, in open public places the behaviour of individuals will be the dominant dictating factor in the degree of separation of recyclables from wastes.
In the Hyder (2007) independent assessment on public place recycling it was estimated that between 4,000 and 8,000 receptacles for public place recycling initiatives might be required on a national scale, based on coverage at that time in Victoria, with each yielding 25 kg of packaging material per service, of which maybe 50% might be beverage containers. This might indicate that up to 7,500 tonnes of beverage containers could be collected for processing and resource recovery. At Table B3.1 an estimate of the recovery potential is presented.

Beverage Container Investigation 28 April 2010
BDA Group and Wright Corporate Strategy 108
Table B3.1: Estimate of beverage container recovery for public place recycling
Material Tonnes p.a.
Containers p.a. (million)
Glass 3,200 15.31
Aluminium 600 40.09
PET 1,500 43.81
HDPE 400 8.00
Steel 0 0
LPB 1,900 45.71
Total 7,600 152.93
This material might be collected and processed in a recycling MRF at a cost in the order of $400 per tonne, assuming relatively high contamination rates and more intense sorting.
On this basis a capital cost for equipment could be in the order of $15 million with an annual servicing cost of $3 million.
Additional administrative costs can be expected on the part of Local Government for implementation and enforcement of the relevant ordinances.
B3.3 Events
Uniform national measures to address event recycling could be implemented through Local Government Ordinances. Councils could amend minimum development approval requirements for promoters seeking permission to run events. Introducing uniform national measures for such codes and ordinances could typically be implemented under the existing National Packaging Covenant mechanism. An assessment of the possible effectiveness and cost of such intervention measures is discussed below.
Using data from the analysis at Appendix 8, it is estimated that there might be up to 24,000 tonnes of beverage containers in the waste stream from events that might be considered as being available for recovery.
The majority of initiatives trialled at event-based efforts for improved resource recovery have comprised technology systems such as discard/collection bins, supervision at bins and/or information dissemination and awareness raising campaigns. The approach deemed most successful in terms of recovery and contamination rates involves supervision of bins, but this approach adds an extra layer of cost to the recovery effort. Two supervisory approaches are typically used:

Beverage Container Investigation 28 April 2010
BDA Group and Wright Corporate Strategy 109
• event staff policing recycling bins, and
• shop-based recovery where either table service or dispensing service enable shop staff to capture beverage containers for recovery.
There are anecdotal reports45 that materials disposed at unsupervised, general recycling bins at major un-fenced events have unacceptably levels of contamination (upwards of 50%) and invariably are disposed to landfill. In addition, there are reports that some conventional kerbside recycling MRFs will not process event and public place recycling materials where contamination levels exceed industry acceptance levels for typical kerbside collected recyclables. On the other hand, materials recovered through supervised bins at events are reported to have contamination rates below 10% and even approaching kerbside quality.
Local Government ordinances can place very specific and enforceable obligations on event organisers including mandatory recycling facilities, acceptable beverage containers to be permitted and the level of supervision expected at disposal points.
The Hyder 2007 report laments the paucity of data on both costs and quantities of materials recovered, in spite of many case studies being funded through jurisdictional initiatives and involving circumstances where closing the loop on costs and performance should be a relatively simple control tool. In their 2007 assessment, Hyder report data from a very limited number of case studies where costs vary as much as $800 per tonne to over $5,000 per tonne, with the higher cost examples appearing to be instances where the total capital cost of the equipment used is amortised over the single event concerned.
In 2008, the Gold Coast City Council provided 150 recycling stations near food outlets at the Nikon Indy 300, a four-day event attracting over 500,000 patrons46. The recycling rate was approximately 18.7 kg per bin per day and the contamination rate reported at 8%. The indicative cost of the recycling effort is in the order of $1,100 per tonne recovered, including a depreciation allowance for the cost of the bin systems over several event years.
Also in 2008, the Queensland EPA partnered the Royal National Agricultural and Industrial Association of Queensland at the Brisbane Exhibition in a resource recovery effort that yielded over 60 tonnes of recyclables over ten days of the event involving approximately 500,000 participants with an average bin utilisation or yield rate of 20.5 kg per bin per day.47
Drawing on some of this information, it might be postulated that with ordinances requiring specific discard receptacles, container material types and a limited degree of supervision, up to one third of the available beverage containers might be recovered after processing and removal of contamination at a suitable MRF.
45 Personal communication, Wingecarribee Shire Council, Baulkham Hills Shire Council 46 Personal communication, Gold Coast City Council 47 Personal communication, Queensland EPA
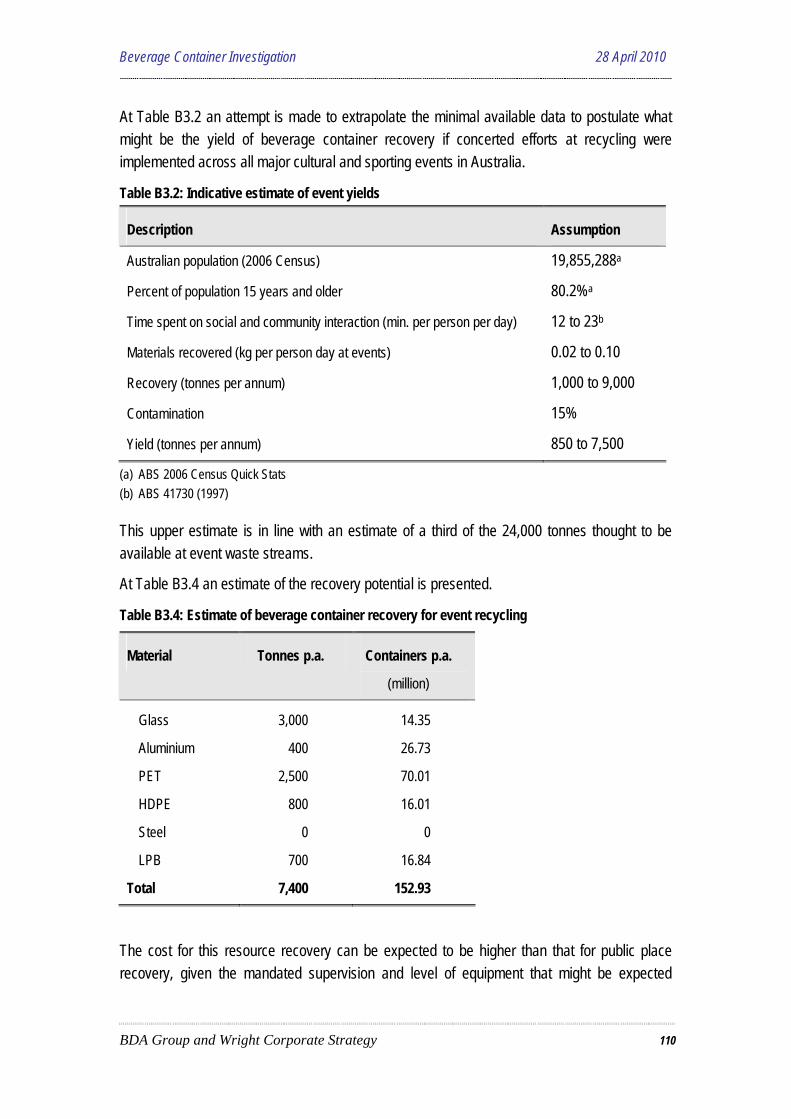
Beverage Container Investigation 28 April 2010
BDA Group and Wright Corporate Strategy 110
At Table B3.2 an attempt is made to extrapolate the minimal available data to postulate what might be the yield of beverage container recovery if concerted efforts at recycling were implemented across all major cultural and sporting events in Australia.
Table B3.2: Indicative estimate of event yields
Description Assumption
Australian population (2006 Census) 19,855,288a
Percent of population 15 years and older 80.2%a
Time spent on social and community interaction (min. per person per day) 12 to 23b
Materials recovered (kg per person day at events) 0.02 to 0.10
Recovery (tonnes per annum) 1,000 to 9,000
Contamination 15%
Yield (tonnes per annum) 850 to 7,500
(a) ABS 2006 Census Quick Stats (b) ABS 41730 (1997)
This upper estimate is in line with an estimate of a third of the 24,000 tonnes thought to be available at event waste streams.
At Table B3.4 an estimate of the recovery potential is presented.
Table B3.4: Estimate of beverage container recovery for event recycling
Material Tonnes p.a. Containers p.a.
(million)
Glass 3,000 14.35
Aluminium 400 26.73
PET 2,500 70.01
HDPE 800 16.01
Steel 0 0
LPB 700 16.84
Total 7,400 152.93
The cost for this resource recovery can be expected to be higher than that for public place recovery, given the mandated supervision and level of equipment that might be expected
Beverage Container Investigation 28 April 2010
BDA Group and Wright Corporate Strategy 111
through ordinance requirements. Drawing on the from the work of Hyder in 2007 and the indicative data from Gold Coast City Council, the cost of this recovery of additional beverage container materials might be taken to be around $1,000 per tonne, implying an annual cost in the order of $7.5 million nationally, plus an estimated $4 million per annum for the cost of receptacles that will be need to be replaced on an on-going basis.
B3.4 Hospitality, retail and institutions
The policy mechanism for implementation of improvements to recycling from this sector could be through the existing National Packaging Covenant. Initial seed support could be provided to kick-start the collection of additional recyclables and to build runs into financially viable and productive services. Many institutions are government owned and operated and therefore also present an opportunity for government leadership.
The National Packaging Covenant supported Harvest initiative and Zero Waste SA recycling at work initiative are both examples where incentive-based intervention within the existing National Packaging Covenant framework might get this resource recovery activity started.
Using data from the analysis at Appendix 8, it is estimated that there might be up to 181,200 tonnes of beverage containers in the waste stream from events that might be considered as being available for recovery.
In 2008, Wright Corporate Strategy reported to Zero Waste SA (ZWSA) on commercial and industrial waste recycling potential in metropolitan Adelaide48, with a specific focus on the front lift and rear load collection market sectors. The objective of the study was to determine the potential to improve resource recovery from small to medium sized businesses that typically use rear load and front lift collection services, rather than focus on the major industrial and commercial businesses where resource recovery was most likely already in place.
A key finding of the analysis in that study was that of the available target resources in the waste stream, a maximum of 40 percent might be recovered if collection conditions permit.
On this basis, a maximum recovery rate of 72,500 tonnes of beverage containers might be expected from this combines industry sector representing some 842 million containers.
At Table B3.5 an estimate of the recovery potential is presented.
48 Assessment of potential for improving collection systems for the C&I sector, ZWSA 2008

Beverage Container Investigation 28 April 2010
BDA Group and Wright Corporate Strategy 112
Table B3.5: Estimate of beverage container recovery for event recycling
Hospitality Retail Institutions Material
Tonnes p.a.
Containers million p.a.
Tonnes p.a.
Containers million p.a.
Tonnes p.a.
Containers million p.a.
Glass 29,400 140.65 8,300 39.71 11,800 56.45
Aluminium 700 46.77 700 46.77 0 0
PET 1,800 52.57 3,200 93.46 1,200 35.05
HDPE 2,200 44.02 3,200 64.03 3,700 74.03
Steel 100 1.39 0 0 0 0
LPB 1,900 45.71 2,500 60.15 1,700 40.90
Total 36,100 331.11 17,900 304.11 18,400 206.43
Initial seed funds to provide incentive for increasing recycling services to this sector might be in the form of a time-limited incentive subsidy on additional recyclables collected and recovered. The quantum of seed funding might be in the order of $50 to $70 per tonne of new recyclable packaging materials recovered.49 On this basis, to stimulate a further 72,500 tonnes of beverage container recycling, an indicative kick-start cost might be in the order of $4.3 million.
Industry data would indicate that the cost of uplift and processing of a co-mingled recyclables bin using front lift services might be in the order of $130 to $150 per tonne. This indicates that the additional beverage containers might be recovered at a direct cost to waste generators of $10.2m per annum plus the indirect cost of internal bins and facilities within the workplace for the recyclables to be discarded by workers prior to cleaners relocating the materials to the collection bins. This cost will to a considerable degree be off-set by a reduction in waste disposal fees as less waste is discarded.
With steadily increasing waste disposal levies, moderate commodity prices, and commercial collection services that are financially stable and sustainable, it is very conceivable that the net cost to the waste generators is neutral, with the additional collection costs for recyclables off-set by reduced waste disposal costs.
B3.5 Assessment of improved recycling at core consumption centres
The common feature grouping of the three sectors discussed above is “away from home” resource recovery. However, a single national measure aimed at improving away from home recycling and covering all three sectors discussed above (public places, events, and hospitality,
49 Estimate based on personal communication relating to current initiatives in a number of jurisdictions

Beverage Container Investigation 28 April 2010
BDA Group and Wright Corporate Strategy 113
retail and institutions) would be implausible, given the significant differences between the sectors. Therefore, in the discussion that follows, each is mentioned individually, as appropriate.
Criteria 1 Suitability as a national measure
Opportunity exists for introducing uniform national measures to address public place and event recycling since both sectors are, to a large degree managed under local government ordinances. Councils could be required to roll-out open space measures and implement minimum DA requirements on promoters seeking permission to run events.
For the hospitality, retail and institutions sector a national initiative could provide seed funding for increasing recycling under the existing National Packaging Covenant framework. Many institutions are government owned and operated and therefore also present an opportunity for government leadership.
Criteria 2a Effectiveness for litter reduction
Measures to increase recovery at public places and events have a high potential to reduce beverage container litter in the vicinity of the public place or event. However, the impact on the total litter stream is likely to be small. Reducing the amount of beverage containers that could potentially enter the litter stream from public places by around 7,600 tonnes per year is estimated to reduce the total national litter count by 0.3%. For events the reduction of 7,400 tonnes per year is also estimated to reduce the total national litter count by 0.3%.
Increased recovery of beverage containers consumed in the hospitality, retail and institutions sector is less likely to provide litter benefits given the predominant indoor and enclosed nature of these venues.
Criteria 2b Effectiveness for resource recovery
The measures proposed to increase recycling at public places and events is estimated to increase recovery by up to 7,600 tonnes per year and 7,400 tonnes per year of packaging material respectively. This may include up to 153 million and 147 million beverage containers per annum respectively for each initiative.
The seed finding proposed for the hospitality, retail and institutions sector may achieve additional packaging recovery of up to 72,400 tonnes per year or around 842 million beverage containers per annum.
The level of certainty that these outcomes can be achieved varies. Even with administrative changes by local councils to encourage greater resource recovery, achieving these outcomes in uncontrolled public open spaces is likely to be quite challenging. With more events being controlled to some degree, promoters have some opportunity to exert suasion over vendors and patrons in respect of resource recovery objectives. There would be a higher degree of certainty about resource recovery outcomes in the hospitality, retail and institution sector

Beverage Container Investigation 28 April 2010
BDA Group and Wright Corporate Strategy 114
subsidies given the enclosed and controlled nature of the consumption. However, the outcomes depend on the level of uptake of the program as well as market conditions over time.
Criteria 3 Compatibility with existing waste and recycling arrangements and systems
All three sectors discussed in the away from home resource recovery area fit neatly within existing waste management and recycling frameworks and systems.
Criteria 4 Net economic cost and complexity
The cost of increasing recycling at public places and events are estimated at $6m per year and $11.5m per year respectively. The diversion from landfill will also provide savings in disposal costs of around $300,000 and $295,000 per annum respectively. The net economic cost of these options is therefore $5.7m and $11.2m per annum respectively.
The cost of the hospitality sector option is estimated at $6.9 million or $1.4 million per year (amortised over five years) for start-up. Provision of the ongoing services is expected to be cost neutral. The cost of administration associated with the start-up subsidy program is estimated at around $140,000 per year (10% of the funds to be allocated). This option therefore has a net economic cost of around $1.54m per annum.
Criteria 5 Financial impacts
The financial impacts of the public place and events initiatives include around $17m per annum borne by local governments and passed on to ratepayers. The hospitality sector initiative is expected to be neutral for the businesses concerned. Depending on commodity prices and disposal levies, over time there may be financial advantage to recycling over disposal.
The financial impact for the Australian Government is the cost of the start up subsidy for the hospitality sector of $1.4m per annum as well as the administrative costs of $140,000 per annum.
The reduction in packaging waste to landfills from all three initiatives would reduce landfill levies paid to State Governments. The impacts would depend on how where the reductions occurred, however the overall magnitude of the reduction is estimated at around $1.7m per annum50.
Criteria 6 Performance across jurisdictions and in defined locations
All these initiative are directed towards high volume centres and therefore the outcomes are most likely to occur in metropolitan areas.
Criteria 7 Cost-effectiveness
Public places – the cost effectiveness of improving beverage container resource recovery at public places is estimated at around $750 per tonne. At an estimated cost of around $5.7 50 Allocated by State according to population.

Beverage Container Investigation 28 April 2010
BDA Group and Wright Corporate Strategy 115
million to recover 7,600 tonnes of packaging including 153 million beverage containers, the cost equates to 1,300 tonnes of packaging and 27 million containers per $1 million of cost.
Events – the cost effectiveness of improving beverage container resource recovery at events is estimated at around $1,514 per tonne. At an estimated cost of around $11.2 million to recover 7,400 tonnes of packaging including 147 million beverage containers, the cost equates to 660 tonnes of packaging and 13 million containers per $1 million of cost.
Hospitality, retail and institutions – the cost effectiveness of improving beverage container resource recovery in this sector is estimated at around $21 per tonne. At an estimated cost of around $1.5 million to recover 72,400 tonnes of packaging including 842 million beverage containers, the cost equates to 47,000 tonnes of packaging and 547 million containers per $1 million of cost.
B3.6 Summary of assessment of improved recycling at core consumption centres
The public place and events recycling strategies have the potential to provide modest resource recovery outcomes and contribute to reducing litter. Additional recovery from the hospitality sector has the potential to provide significant increases in recovery of packaging and in particular beverage containers at relatively low cost. At Table B3.7 the assessments for the away from home sector are summarised.

Beverage Container Investigation 28 April 2010
BDA Group and Wright Corporate Strategy 116
Table B3.7: Evaluation of improved recycling at core centres against criteria
Criteria Assessments
Public Places Events Hospitality & Institutions
Suitability as national measure
• Suitable through local government controls • Suitable as national initiative providing start-up funding
Effectiveness in litter reduction and resource recovery
• Potential for small reduction in litter (0.3%)
• 7,600 tonnes of packaging
• 153 m containers
• Potential for small reduction in litter (0.3%)
• 7,400 tonnes of packaging
• 147 m containers
• Little or no impact on litter
• 72,400 tonnes of packaging
• 842 m containers
Compatibility with existing waste and recycling management arrangements and systems
• All away from home sector initiatives fit well with existing systems
Net economic cost and complexity
• Net costs of $5.7m/yr and $11.2m/yr
• Simple to implement and run
• Net cost $1.5m/yr
• Complex
Financial impacts • Cost to Australian government of $1.5 m for start-up subsidy/admin
• Cost to local government of $16.9m passed on to ratepayers
• Reduction in landfill levies for State governments of $1.7m per yr
Performance across jurisdictions & in defined locations
• Outcomes concentrated in high consumption areas
Cost-effectiveness • 1,300 tonnes of packaging and 27 m containers per $1 m of cost
• 0.05% reduction in national litter count per $1m
• 660 tonnes of packaging and 13 m containers per $1 m of cost
• 0.02% reduction in national litter count per $1m
• 47,000 tonnes of packaging and 547 m containers per $1 m of cost
Beverage Container Investigation 28 April 2010
BDA Group and Wright Corporate Strategy 117
B4 IMPROVED RECYCLING AT WORKPLACES
B4.1 Recovery potential from workplaces
The challenge with the C&I sector is that the waste service contractors dictate many of the conditions and performance levels within the market. This makes intervention difficult. However, waste collection operators are fundamentally interested in improving the productivity of collection logistics and driving down their collection costs.
A barrier to additional recycling in the C&I sector has been the inefficiency and cost associated with establishing and building new collection runs. In the early days of a new run the costs significantly out-weigh the fees that the contractor is able to recover from generators.
Initiatives such as the one in South Australia and the National Packaging Covenant that aim to support the collection run building process are showing interesting signs for success. Such initiatives have potential to be implemented across all jurisdictions.
The policy mechanism for implementation of improvements to recycling from the commercial sector is likely to be through an existing instrument, such as the National Packaging Covenant, - as with the Covenant supported Harvest initiative being implemented by Transpacific Industries in a number of jurisdictions. Alternatively the initiative could be implemented through a jurisdictional program, as is the case in South Australia with the Recycling at Work initiative.
In these two instances, some initial seed support is provided to kick-start the collection of additional recyclables and to build collection runs into financially viable and productive services, such that in a relatively short period of time the services become sustainable and self-funding and do not require on-going subsidy from government.
Using data from the analysis at Appendix 8, it is estimated that there might be up to 55,200 tonnes of beverage containers in the waste stream from business premises that might be considered as being available for recovery.
In 2008, Wright Corporate Strategy reported to Zero Waste SA (ZWSA) on commercial and industrial waste recycling potential in metropolitan Adelaide51, with a specific focus on the front lift and rear load collection market sectors. The objective of the study was to determine the potential to improve resource recovery from small to medium sized businesses that typically use rear load and front lift collection services, rather than focus on the major industrial and commercial businesses where resource recovery was most likely already in place.
A key finding of the analysis in that study was that of the available target resources in the waste stream, a maximum of 40 percent might be recovered if collection conditions permit.
51 Assessment of potential for improving collection systems for the C&I sector, ZWSA 2008

Beverage Container Investigation 28 April 2010
BDA Group and Wright Corporate Strategy 118
On this basis, a maximum recovery rate of 22,100 tonnes of beverage containers might be expected from this combined industry sector representing some 264 million containers.
At Table B4.1 an estimate of the recovery potential is presented.
Table B4.1: Estimate of beverage container recovery for event recycling
Material Tonnes p.a. Containers p.a. (million)
Glass 15,000 71.76
Aluminium 500 33.41
PET 2,300 67.17
HDPE 2,800 56.02
Steel 0 0
LPB 1,500 39.06
Total 22,100 264.45
The option is also estimated to have the potential to recover an additional 419,900 tonnes per year of other packaging (mainly paper / cardboard).
B4.2 Cost of recovery
(a) Kick-start – initial seed funds to provide incentive for increasing recycling services to the commercial sector might be in the form of a subsidy for the container and a time-limited incentive subsidy on additional recyclables collected and recovered. The quantum of seed funding might be in the order of $50 to $70 per tonne of new recyclable packaging materials recovered.52 On this basis, to stimulate a further 442,000 tonnes of packaging material recycling, an indicative kick-start cost might be in the order of $26.5 million.
(b) On-going - rates for collection of wastes and recyclables from the C&I sector vary considerable on the collection system and market conditions and competition level. The rates quoted allow for three basic elements – the hire or use of the bin by the client, the fee to lift the bin for unloading into the collection vehicle, and the fee to receive and process recyclables or receive and dispose of wastes. Thus the cost per tonne to a client will be affected by the frequency of service in addition to the cost of the fate of the materials collected.
Industry data would indicate that the cost of uplift and processing of a co-mingled recyclables bin using front lift services might be in the order of $130 to $150 per tonne.
52 Estimate based on personal communication relating to current initiatives in a number of jurisdictions

Beverage Container Investigation 28 April 2010
BDA Group and Wright Corporate Strategy 119
This indicates that the additional beverage containers might be recovered at a direct cost to waste generators of $61.9m plus the indirect cost of internal bins and facilities within the workplace for the recyclables to be discarded by workers prior to cleaners relocating the materials to the collection bins. This cost will to a considerable degree be off-set by a reduction in waste disposal fees as less waste is discarded.
With steadily increasing waste disposal levies, moderate commodity prices, and commercial collection services that are financially stable and sustainable, it is very conceivable that the net cost to the waste generators is neutral, with the additional collection costs for recyclables off-set by reduced waste disposal costs.
B4.3 Assessment of improved recycling at workplaces
As with the municipal sector, the C&I sector already has in place collection services for wastes and recyclables, and these services are widely available across the country. Therefore, there is a good case to put that the existing services for collection of recyclables might be improved to capture more recyclables and thereby more beverage containers without the need for additional infrastructure.
Criteria 1 Suitability as a national measure
The challenge with the C&I sector is that the waste service contractors dictate many of the conditions and performance levels within the market, and generally governments have been unwilling and unable to step in to influence the outcomes. It is conceivable that measures might be taken on a jurisdiction-by-jurisdiction basis, as is happening with the TPI-Harvest program and the Recycling at Work program in South Australia, but co-ordinated nationally through an instrument such as the National Packaging Covenant.
Criteria 2a Effectiveness for litter reduction
This option is not expected to provide any significant litter outcomes as where recyclables are disposed in the workplace in a recycling bin as opposed to a waste bin, only the mode of disposal has been changed.
Criteria 2b Effectiveness for resource recovery
Introducing new and/or improved recycling systems into the workplace has been demonstrated to improve the efficiency of resource recovery. In the South Australian data used above, the potential for additional packaging waste recovery (paper, cardboard, plastics) is some 12% of the C&I waste stream currently disposed to landfill. An additional 22,100 tonnes of beverage container packaging materials could be recovered, possibly containing 264 million beverage containers.
Given the experiences in other states with this type of initiative, there is a moderate level of certainty that the resource recovery outcomes could be achieved.

Beverage Container Investigation 28 April 2010
BDA Group and Wright Corporate Strategy 120
Criteria 3 Compatibility with existing waste and recycling arrangements and systems
Improving or rolling out new recycling systems for workplaces fits well with existing systems, since it is already a part of the main-stream waste and recycling management systems. The kick-start financial incentive scheme could be relatively complex in the verification phase, but this is relatively short-lived.
Criteria 4 Net economic cost and complexity
The net economic cost of this option is estimated at $26.5 million or $5.3 million per year (amortised over five years) for start-up. There would also be some administrative costs associated with the start-up program – estimated at around $530,000 per year (or 10% of the funds to be allocated).
Provision of the ongoing services is expected to be cost neutral. Fees are already charged for recycling and waste services to the C&I sector, and thus no new systems of arrangements need to be introduced. There would be some additional in-house work associated with discarding unwanted wastes to a recycling bin rather than a disposal bin.
The net economic cost of this option is $5.83m per year.
Criteria 5 Financial impacts
The workplace recovery initiative is expected to be neutral for the businesses concerned. Depending on commodity prices and disposal levies, over time there may be financial advantage to recycling over disposal.
The financial impact for the Australian Government is the cost of the start up subsidy of $5.3m per annum as well as the administrative costs of $530,000 per annum.
The reduction in packaging waste to landfills would reduce landfill levies paid to State Governments. The impacts would depend on where the reductions occurred, however the overall magnitude of the reduction is estimated at around $8.8m per annum53.
Criteria 6 Performance across jurisdictions and in defined locations
The workplace initiative is directed towards small commercial and industrial businesses and therefore the outcomes will occur in commercial and industrial areas.
Criteria 7 Cost-effectiveness
The estimated cost of the initiatives tested is $5.83 million per year for an expected outcome of an additional 442,000 tonnes per annum of packaging materials representing some 264 million beverage containers recovered. The cost-effectiveness of the option is therefore around $13 per additional tonne of packaging material recovered.
53 Allocated by State according to population.

Beverage Container Investigation 28 April 2010
BDA Group and Wright Corporate Strategy 121
For each $1 million economic cost imposed on the Australian economy the workplace initiatives would recover 75,814 tonnes of packaging and 45.3 million beverage containers.
B4.4 Summary of evaluation of improved recycling at work
Improving recycling services to the C&I sector has potential to be very cost effective and to yield significant amounts of packaging including beverage containers.
Table B4.2: Evaluation of improved recycling at work against criteria
Criteria Assessment
Suitability as national measure • Not suitable for legislative intervention but does suit market stimulation
Effectiveness in litter reduction and resource recovery
• Negligible impact on national litter outcomes
• 442,000 tonnes of packaging & 264 m containers
Compatibility with existing waste and recycling management arrangements and systems
• Fully compatible with main-stream systems
Net economic cost and complexity • Net costs of $5.83m per year
Financial impacts • Australian government cost of $5.83m per year for subsidies and administration
• Reduced landfill levies to State governments of $8.8m per year
Performance across jurisdictions & in defined locations
• Outcomes in commercial / industrial areas
• Can be implemented in all jurisdictions
Cost-effectiveness • Cost of $13 per tonne
For each $1m economic cost
• 75,800 tonnes of packaging
• 45 million containers

Beverage Container Investigation 28 April 2010
BDA Group and Wright Corporate Strategy 122
B5 RESIDUAL WASTE PROCESSING SYSTEMS
B5.1 Mixed waste processing
Systems for handling and processing residual waste that might lead to increased recovery of packaging materials, and beverage container packaging in particular, are referred to as AWTs (alternative waste technologies) and are applied to mixed waste streams with the intent of capturing potentially valuable resources.
Where mechanical-biological processing systems have been introduced for the treatment of mixed waste streams, the pre-sorting phase and mechanical pre-treatment phase often afford opportunity for containers to be exposed and become available for recovery. This has been noted at facilities such as UR3R at Eastern Creek in Sydney, Bedminster in Cairns, Raymond Terrace and South Perth, the Remondis facility at Kempsey and the new facilities at Jacks Gully and Coffs Harbour in NSW.
The extent of discovery will depend on the extent of bag opening and the nature of the waste separation technologies used; while the extent of recovery will depend to a significant degree on the mix of wastes being processed, efficiency of the separation technology and the ability of technologies to “pluck” the targeted items from the separated waste stream.
Where biosolids are added to the waste stream to enhance biological degradation of the organic fraction in the waste stream, recovery of rigid containers after the pre-treatment phase becomes very problematic and subject to special occupational health and safety issues. In these instances, a pre-sort and bag opening station might afford the best opportunity for container recovery.
One approach still in the proving stage involves steam treatment of the mixed waste in a pressure autoclave vessel to achieve sterilisation, homogenisation and general separation of materials such that recovery may take place through physical means such as screens, magnets etc. The first of these tested in Australia was at the Brightstar facility at Whites Gully, near Wollongong, which has now been decommissioned. The second autoclave system is currently undergoing proving trials at Coffs Harbour.
The use of autoclave pre-treatment will only permit recovery of rigid packaging and beverage materials as paper, cardboard and soft plastics are transformed into a pulp like material.
Packaging materials recovered whole through AWT systems are typically plastic and metal containers, which are recovered relatively early on in the process. Glass containers are typically broken in the pre-treatment phase and the fragments recovered in a separation process usually involving the final product at the end of the process. Paper and cardboard materials are generally contaminated and degraded during the mechanical pre-treatment phase and are usually only available for recovery through the subsequent biological treatment phase where they are decomposed along with other organic matter.

Beverage Container Investigation 28 April 2010
BDA Group and Wright Corporate Strategy 123
With increasing efforts at resource recovery in major metropolitan centres, introduction of mixed residual waste processing systems is becoming more common. Introduction of mixed waste processing has been an industry response to increasing costs of waste disposal. The decision on recovery of the recyclables is an internal financial decision made by the process plant operator based on the additional net cost to recover the materials and the alternative cost of disposal at landfill.
One policy option would be to accelerate the introduction of mixed waste processing via MBT technology through a national initiative encouraging jurisdictions to use mixed waste processing to meet waste reduction targets. This is likely to require some form of cost sharing across all three levels of government.
B5.2 Tonnages processed and recoveries forecast
It is estimated that upwards of half a million tonnes of mainly municipal residual waste are currently subject to the type of processing technology that might afford opportunity for additional beverage container packaging recovery. With some 5 percent of residual municipal waste being beverage container packaging, perhaps some 25,000 tonnes per annum of packaging – the vast majority of which will be beverage containers might be found in these waste processing systems.
In the Issues Paper, the proportions of the beverage container packaging were estimated while at Table B5.1 estimates are made of possible recoveries that might be possible for these materials from a mechanical-biological process plant (MBT plants) where shredding is not used as part of the preparatory process – as is the case at the Kempsey facility in NSW.
Table B5.1: Estimates of material recovery at existing MBT plants
Material Proportion of containers
Percent in feed
Possible recovery
Tonnes recovery
Glass 78% 3.90% 70% 13,700
Plastics 17% 0.85% 50% 2,100
Aluminium 4% 0.20% 100% 1,000
LPB 1% 0.05% nil -
Total 5.00% 67.20% 16,800
Information on actual recoveries and the condition of the recovered materials is treated by the industry on a very commercial in confidence basis, so no public data is available to test these estimates, but anecdotal information indicates that they may be in the right order of magnitude.

Beverage Container Investigation 28 April 2010
BDA Group and Wright Corporate Strategy 124
The price obtained for these materials is equally not known publicly, and again it is necessary to rely on anecdotal information which indicates that the quality and cleanliness of the materials is significantly lower than that for kerbside collected recyclables.
In the 2007 edition of the Blue Book54, it was estimated that between 2005 and 2015, if all jurisdictions delivered on their publicly stated recovery targets MBT mixed waste processing may grow by a factor of ten from around 165,000 tonnes in 2005 to approximately 1.8 million tonnes by 2015.
On this basis, possible packaging material recovery – virtually all of which will be beverage containers – might reach 60,000 tonnes per annum, equivalent to 660 million beverage containers per annum.
B5.3 Assessment of residual waste processing
Criteria 1 - Suitability of CDS as national measure
A national initiative could be used to encourage jurisdictions to adopt mixed waste processing as a waste reduction strategy. Current moves towards mixed residual waste processing are being driven by issues such as increasing disposal levies, shortage of putrescible waste landfill capacity and the sustainability aspirations of some local Councils who chose processing over disposal. Residual waste processing could be pursued as a national measure through a cost sharing initiative.
Criteria 2a Effectiveness for litter reduction
This option would have a negligible impact on litter as it deals with waste already in the waste disposal system. Mixed residual waste processing involves enclosed unloading of collection and transfer vehicles pre-treatment, thus eliminating any litter associated with these transfers. Post-treatment, residuals that need to be disposed have been sufficiently transformed in the treatment process such that these materials contain very little matter that might become litter during the disposal phase.
Criteria 2b Effectiveness for resource recovery
AWT facilities involve relatively large tonnage throughput, upwards of 100,000 tonnes per annum in major cities. In the treatment phase, the material flows are rarely small enough to permit clear discovery of beverage packaging materials, in which case ready recovery of these materials becomes problematic.
With beverage containers constituting only 5 percent of the material flow, these systems are unlikely to represent an effective primary recovery system, however, they do afford a final recovery option for some of the beverage containers discarded to the waste stream, prior to disposal of residuals. From existing facilities an additional 17,000 tonnes of packaging 54 Australian Waste Industry – Industry and Market Update, WCS-WME 2007

Beverage Container Investigation 28 April 2010
BDA Group and Wright Corporate Strategy 125
materials might be recovered, all of which is likely to be beverage containers. By 2015 this could potentially be increased to around 60,000 tonnes per annum.
Criteria 3 Compatibility with existing waste and recycling arrangements and systems
Mixed residual waste processing is becoming a main-stream alternative to waste disposal at landfill in a number of centres. As such, the application of these technologies fits well within the matrix of waste and recycling arrangements.
Criteria 4 Net economic cost and complexity
The cost of mixed waste processing in major metropolitan centres is estimated to be in the order of $120 per tonne over and above an average landfill disposal gate fee in those centres of around $80 per tonne. For the potential 1.8 million tonnes per year that could go through AWTs if jurisdictions used this mechanism to deliver recovery targets the extra cost would be around $72m per year.
There would also be avoided costs of landfill disposal for the projected 60,000 tonnes of recyclables recovered, on the assumption that if they are not recovered they will be disposed to landfill with other residuals from the AWT. With disposal costs of around $80 per tonne in capital cities this would provide an economic benefit of $4.8m per year. The increased sorting / reprocessing of the recyclables (primarily glass) is estimated to cost around $150 per tonne or $9m per year in total over and above the recovery cost at the AWT facility. The value of the recovered materials (primarily glass) is estimated at around $70 per tonne providing an additional economic benefit of $4.2m per year.
The net economic cost of this option is therefore $72m per year.
Recovery of beverage containers through mixed residual waste processing would not involve any complex financial arrangements beyond those already in place for the payment of fees for landfill disposal.
Criteria 5 Financial impacts
The financial impact of the net cost of mixed waste processing of $72m per year would be borne by all three levels of government and passed on to taxpayers and ratepayers of the three major capital cities in line with a negotiated cost sharing program.
There would also be a reduction in landfill levies for State governments estimated to be around of $1.38m per year.
Criteria 6 Performance across jurisdictions and in defined locations
The outcomes of this option would occur in major metropolitan cities.
Criteria 7 Cost-effectiveness

Beverage Container Investigation 28 April 2010
BDA Group and Wright Corporate Strategy 126
It is estimated that the cost will be in the order of $72 million per annum to recover 60,000 tonnes of packaging or around $1,200 per tonne of packaging recovered. For each $1 million economic cost imposed on the Australian economy the residual waste processing option would recover 830 tonnes of packaging and 9 million beverage containers.
There would be a fairly low level of certainty that these outcomes would be achieved from a national initiative to encourage adoption (without any regulation) given the high costs involved.
B5.4 Summary of evaluation of mixed residual waste processing
The application of mixed residual waste processing is a main-stream waste management approach that is being pursued as an alternative to landfill disposal of wastes. However, it would be a high cost method for recovery of beverage containers.
Table B5.3: Evaluation of mixed residual waste processing against criteria
Criteria Assessment
Suitability as national measure • Not suited for national policy intervention
Effectiveness in litter reduction and resource recovery
• Negligible impact on national litter outcomes, but would reduce litter associated with transfers/disposal
• 60,000 tonnes of packaging & 660 m containers by 2015
• Low level of certainty that outcomes would be achieved
Compatibility with existing waste and recycling management arrangements and systems
• Fully compatible with existing systems
Net economic cost and complexity • Net cost of $72 million per year
Financial impacts • All three levels of government incur extra costs of $72 m per annum (passed on to taxpayers/ratepayers)
• Reduced landfill levies of $1.38m/yr
Performance across jurisdictions & in defined locations
• Outcomes in major capital cities
Cost-effectiveness • $1,200 per tonne
• 60,000 tonnes of packaging and 660 million beverage containers
For each $1m economic cost
• 830 tonnes of packaging
• 9 million beverage containers recovered

Beverage Container Investigation 28 April 2010
BDA Group and Wright Corporate Strategy 127
B6 ADVANCE DISPOSAL FEE
There are many ways in which an advance disposal fee (ADF) could be crafted. We evaluate a uniform weight based fee per tonne on all packaging materials. The fee would have a legislative basis and would be managed by a government body. The revenues collected would be used to subsidise increased recovery of packaging materials, with the fund manager seeking the most cost effective recovery options.
For the purpose of this illustrative analysis a fee of $10 per tonne of packaging material has been used. There are three ways an ADF would reduce packaging waste being sent to landfill:
• Source reduction by packaging manufacturers and brand owners
• Reduction in consumption of packaging
• Increased recovery of used packaging
We have assumed that a weight based ADF could provide an additional incentive for light weighting and achieve a small additional reduction (over and above other initiatives) of around 2% of the weight of packaging sold55.
Any resulting increase in beverage prices from the introduction of an ADF will result in a reduction in consumption of beverage products and in turn packaging products, with the magnitude of the change dependant on the price elasticity of demand. For the purpose of this illustrative analysis we assess the price response for beverage products using a price elasticity of demand of -0.556.
After accounting for the expected source reduction and reduced beverage consumption in response to price increases, the $10 per tonne ADF is expected to generate revenues of $46m per year. These revenues would be used to fund programs to increase the recovery of packaging materials as well as cover the administrative costs of collection of fees and allocation.
The administrative costs include the setup of the scheme, annual collection of fees and auditing initiatives. For the purpose of this illustrative analysis we assume that around 450 of the 600 signatories of the National Packaging Covenant would be required to pay the ADF. The estimated administrative costs are summarised in Table B6.1.
55 This is consistent with the assumption for weight based fees in the analysis of complementary economic
mechanisms for the national packaging covenant - BDA/MMA 2007 National Packaging Covenant Complementary Economic Mechanisms Investigation, Report for National Packaging Covenant Jurisdictional Working Group, December.
56 Elasticity for beverage containers from White 2001 Independent Review of Container Deposit Legislation in NSW, Report to the Minister for the Environment prepared by the Institute for Sustainable Futures UTS, November. Price impacts on other products have not been assessed.

Beverage Container Investigation 28 April 2010
BDA Group and Wright Corporate Strategy 128
Table B6.1: Administrative costs of the ADF
Task Unit cost Total annualised cost ($ / yr)
Setup (including development of regulations)
6 FTE over 1 year (4 people over a year and a half) @ $100,000 pa
$120,000
Fee collection $200 per company $90,000
Fee auditing 20 % of companies @ $2000 per company $180,000
Funds management 5 FTE @ $100,000 pa $500,000
Total $890,000
Notes: FTE = full time equivalent
The sensitivity of the results to the estimates of administrative costs is considered in section B8 below.
The level of additional recovery that can be achieved with the remaining revenues will depend on the costs of proposals from proponents. An ADF would provide flexibility to build on the achievements of the NPC. As an illustrative example we assume the funds are used for the most cost-effective of the programs described in sections B2-B5. While these individual programs may not be appropriate at that time they are used as representative of the possible recovery levels and costs for each sector. The level of additional recovery that could be funded using these programs would be around 611,000 tonnes annually. Table B6.2 below summarises the example.
Table B6.2: Example of program funding under ADF
Report section
Recovery cost per tonne
Amount recovered
Total funds ($m per yr)
Workplace recovery B4 $13 442,000 $5.83
Hospitality / retail / institutions
B3 $21 72,400 $1.5
Small business kerbside
B2 $300 30,000 $9.0
Education for kerbside B2 $354 39,000 $13.8
Extending drop-off B2 $380 20,000 $7.6
Public place recovery B3 $750 7,600 $5.7
Total 611,000 $43
Beverage Container Investigation 28 April 2010
BDA Group and Wright Corporate Strategy 129
B6.1 Assessment of an ADF
Criteria 1 - Suitability of an ADF as national measure
An advance disposal fee is suitable for application at the national level. The National Packaging Covenant framework already establishes a mechanism for the collection of monies from packaging producers. Implementation of an ADF would require regulation, which may be possible through parallel legislation in each state and territory (under the NEPM framework) or directly through national legislation (although no legal advice in this regard has been sought).
Criteria 2a - Effectiveness of ADF for litter reduction
The litter outcomes of the ADF would depend on how the funds are used. Assuming the initiatives listed in Table B6.2 were funded the option would reduce the total national litter count by 0.3%.57. It should also be noted that this outcome assumes the ADF revenues are prioritised to maximise resource recovery. Litter outcomes may be more significant if litter reduction was the priority for funding allocation.
Criteria 2b - Effectiveness of ADF for resource recovery
The ADF of $10 per tonne is estimated to result in increased recovery of 611,000 tonnes per year of packaging including around 1,608 million beverage containers per year. There would be certainty that revenues would be generated given that the scheme has legislative backing. However, the success of different programs would depend on whether they were regulations, market incentives or suasive policies.
Criteria 3 - Compatibility of ADF with existing waste and recycling arrangements and systems
The ADF levy would be entirely compatible with existing waste and recycling arrangements and systems. The ADF would give greater flexibility compared to CDS allowing for recovery efforts to focus on low cost packaging recovery opportunities. The legislation supporting the ADF would need to address baseline issues to prevent allocation of ADF funds to existing recovery and recycling efforts.
Criteria 4 - Net economic cost and complexity of ADF
The main costs of the ADF include the administrative costs to industry of collection and management of revenues, the costs of the source reduction undertaken in response to the fee and the costs of additional recovery and recycling of packaging materials.
The administrative costs were outlined in Table B6.1 and are estimated at around $0.9 million per annum in total. Source reduction was estimated at around 2% of the weight of all packaging material sold, at around 90,000 tonnes annually. For the purpose of this illustrative analysis we
57 Where total litter excludes cigarette butts and illegal dumping.

Beverage Container Investigation 28 April 2010
BDA Group and Wright Corporate Strategy 130
have assumed the same source reduction cost as for the glass levy, of $20 per tonne58. The total cost of source reduction is therefore estimated at around $1.8 million per year.
The costs of implementing the programs outlined in Table B6.2 are estimated at around $43m per year. This is net of the reduction in disposal costs from avoided landfilling as a result of the recovery of additional packaging wastes.
There are also avoided landfill costs as a result of source reduction and the reduction in consumption of packaging products from the introduction of the ADF. This benefit is estimated at around $3.8m per year (based on an average $40 per tonne gate fee excluding government levies).
The net economic cost of the ADF option is therefore estimated at around $42.4m per year.
The complexity of the scheme depends on how the ADF is structured and implemented. We have assessed a simple weight based ADF structure, a structure designed to encourage changes in product design would be more complex to administer.
Criteria 5 - Financial impacts of an ADF
The financial impacts of the option include the ADF itself which will be passed on to consumers, as well as the costs of source reduction. The total ADF revenues are estimated at around $45m per year resulting in higher prices of packaged goods, with prices increasing by on average < 1 cent per item59.
The financial impact for the Australian Government is the administrative costs of $0.9m. If GST revenues were applied to the ADF this would increase costs to consumers and provide additional revenue to the Australian Government.
The reduction in packaging waste to landfills would reduce landfill levies paid to State Governments. The impacts would depend on how where the reductions occurred, however the overall magnitude of the reduction is estimated at around $14m60.
There would be no cost to local government under the scheme. For any programs to be implemented or administered by local government these costs would be captured in the proposal process and would be funded from ADF revenue allocations.
Criteria 6 - Performance of the ADF across jurisdictions and in defined locations
The increase in recovery and litter outcomes could vary widely across jurisdictions depending on the way the revenues are allocated. If they were allocated according to the lowest recovery cost per tonne this may mean a focus on metropolitan areas and high yielding opportunities
58 BDA/MMA 2007 National Packaging Covenant Complementary Economic Mechanisms Investigation, Report
for National Packaging Covenant Jurisdictional Working Group, December 59 Based on a price elasticity of -0.5. 60 Allocated by State according to population.

Beverage Container Investigation 28 April 2010
BDA Group and Wright Corporate Strategy 131
and the activities may not be as broadly based as for some other options. For example, if extra kerbside collection and events were the focus there would be no impact on reducing littering along highways which may be priorities for states like Western Australia and Tasmania. However, the allocated of revenues could be used to target particular outcomes if desired.61
Criteria 7 - Cost-effectiveness of the ADF
The economic cost of the ADF option is estimated at around $42.4 million per year. The expected outcomes include an additional 611,000 tonnes of packaging materials recovered and a potential reduction the total national litter count by 0.3%. The cost-effectiveness of the option is therefore around $69 per additional tonne of material recovered.
For each $1m economic cost imposed on the Australian economy, the ADF option would recover around 14,408 tonnes of packaging material and reduce the overall litter incidence (by count) by 0.01% nationally.
B6.2 Summary of evaluation of ADF
An ADF is suitable as a national measure and would be simple to administer. It has the potential to provide additional resource recovery outcomes at low cost and would provide a high level of certainty through a legislative base. The ADF provides flexibility to the government fund to seek out low cost recovery opportunities. It would be less effective in achieving litter reduction outcomes than CDS in terms of both the scale of the outcomes as well as the breadth of changes. Table B6.3 summarises the assessment of the advance disposal fee against the assessment criteria.
61 For example, the product stewardship scheme for used oil distributes benefits to promote higher value
recycling

Beverage Container Investigation 28 April 2010
BDA Group and Wright Corporate Strategy 132
Table B6.3: Evaluation of ADF against criteria
Criteria Assessment
Suitability as national measure • New legislation required within or alongside NEPM framework
Effectiveness in litter reduction and resource recovery
• 0.3% reduction in national litter count
• Additional 611,000 tonnes recovered per year (1,600 m beverage containers)
• Certain revenue base with legislative backing, certainty of recovery dependent on individual programs funded
Compatibility with existing waste and recycling management arrangements and systems
• Compatible with existing systems (incl. kerbside)
• Provides maximum flexibility for increasing recovery
Net economic cost and complexity • $42.4m per year
• Less complex than CDS
Financial impacts • Increased costs to industry and therefore consumers of $46m per year
• Increased administrative costs to Australian Government of $0.9m per year
• Reduced landfill levies to State Governments of $14m per year
• Any additional cost to Local Governments funded through ADF revenue allocations
Performance across jurisdictions & in defined locations
• Location of litter benefits will depend on where projects are funded
Cost-effectiveness • $69 per additional tonne recovered
For each $1m imposed on economy:
• 14,400 tonnes recovered or 38 m beverage containers
• 0.01% reduction in national litter count

Beverage Container Investigation 28 April 2010
BDA Group and Wright Corporate Strategy 133
B7 VOLUNTARY INDUSTRY LEVY
In mid-2007 four major beverage companies in Australia - Coca Cola Amatil, Lion Nathan, Fosters and Cadbury Schweppes – developed a proposal for companies to pay a voluntary recycling levy of $10 per tonne of glass packaging used to raise funds to increase the collection of glass containers for recycling62.
This section assesses a voluntary levy on glass beverage containers with a similar structure and level to that recently considered by beverage companies. The levy would be payable by major beverage companies and other glass fillers. Voluntary administration would be undertaken by the beverage industry with revenues allocated to subsidise increased glass recovery. The levy structure would be a uniform weight based levy of $10 per tonne of glass packaging used.
There are three ways a glass levy would reduce glass container waste being sent to landfill:
• Source reduction by glass packaging manufacturers and brand owners
• Reduction in consumption of glass packaging
• Increased recovery of used glass packaging
Each of the three impacts is explored below.
It is difficult to determine the amount of source reduction that may result from introducing a glass levy. The recent mid-term review of the National Packaging Covenant found some evidence of packaging design improvements63. It was noted that this was not likely to be solely as a result of the covenant and could be explained at least in part by ongoing packaging trends such as light weighting. For the purpose of this illustrative analysis we have assumed that a weight based glass levy could provide an additional incentive for light weighting and achieve a small additional reduction (over and above other initiatives) of around 2% of the weight of glass packaging sold64.
Any resulting increase in beverage prices from the introduction of a glass levy will result in a reduction in consumption of beverage products and the magnitude of the change will depend on the price elasticity of demand. For the purpose of this illustrative analysis we have assumed a price elasticity of demand of -0.5 for glass packaging products65.
62 Environmental Manager Issues 633 and 634, 17 July and 24 July 2007 63 Lewis 2008 National Packaging Covenant Mid-Term Review, October 2008 64 This is consistent with the assumption for weight based fees in the analysis of complementary economic
mechanisms for the national packaging covenant - BDA/MMA 2007 National Packaging Covenant Complementary Economic Mechanisms Investigation, Report for National Packaging Covenant Jurisdictional Working Group, December.
65 White 2001 Independent Review of Container Deposit Legislation in NSW, Report to the Minister for the Environment prepared by the Institute for Sustainable Futures UTS, November.

Beverage Container Investigation 28 April 2010
BDA Group and Wright Corporate Strategy 134
After accounting for the expected source reduction and reduced beverage consumption in response to price increases, the $10 per tonne glass levy is expected to generate revenues of $9m per year.
The glass levy would also be required to cover the administrative costs of the setup of the levy scheme, annual collection of levies and any industry auditing initiatives. For the purpose of this illustrative analysis we assumed that around 50% of the 600 signatories of the National Packaging Covenant are brandowners and / or manufacturers of glass packaging and would be required to pay the levy. The estimated administrative costs are summarised in Table B7.1.
Table B7.1: Administrative costs of voluntary glass levy
Task Unit cost Total annualised cost ($ / yr)
Setup 0.5 FTE for 6 months @ $100,000 pa $10,000 (over five years)
Levy collection $200 per company $60,000
Levy auditing 10 % of companies @ $1,000 per company
$30,000
Funds management 5 FTE @ $100,000 pa $500,000
Total $600,000
Notes: FTE = full time equivalent
The sensitivity of the results to the estimates of administrative costs is considered in section B8.
The level of additional recovery that can be achieved with the remaining revenues will depend on the costs of proposals from proponents. The levy system would provide flexibility to build on the achievements of the NPC. As an illustrative example we assume the funds are used for the most cost-effective of the programs described in sections B2-B5 for glass recovery. While these individual programs may not be appropriate at that time they are used as representative of the possible recovery levels and costs. The level of additional recovery of glass beverage containers that could be funded using these programs would be around 60,500 tonnes annually. Table B7.2 summarises the example.

Beverage Container Investigation 28 April 2010
BDA Group and Wright Corporate Strategy 135
Table B7.2: Example of program funding under glass levy option
Report section
Recovery cost per tonne of glass
Amount recovered
Total funds ($m per yr)
Hospitality / retail / institutions
B3 $31 49,500 $1.5
Kerbside for small business B2 $625 11,000 $6.9
$8.4
B7.1 Assessment of voluntary industry glass levy
Criteria 1 - Suitability of glass levy as national measure
A voluntary glass levy could easily be applied at a national level. No new legislation or regulation would be required. Most beverage companies operate at a national scale and no new institutions would be required. There is already co-operation at the national level through the National Packaging Covenant and the major companies have already expressed a willingness to consider a voluntary levy.
Criteria 2a - Effectiveness of glass levy for litter reduction
If the funding focused on the hospitality / retail / institutions and kerbside for small business initiatives, there would not be any significant litter outcomes. This outcome assumes the levy revenues are prioritised to maximise resource recovery. Litter outcomes could obviously be more significant if litter reduction was the priority for funding allocation and different programs were chosen (for example the public place recycling program).
Criteria 2b - Effectiveness of glass levy for resource recovery
The analysis of effectiveness for resource recovery is predicated on the assumption that the glass levy would be implemented with full compliance. A levy of $10 per tonne of glass packaging is estimated to have the potential to achieve an increase in recovery of 60,500 tonnes per year of glass packaging (930m glass containers). There would be a lower level of certainty that this outcome could be achieved compared with regulatory options.
Criteria 3 - Compatibility of glass levy with existing waste and recycling arrangements
The glass levy would be entirely compatible with existing waste and recycling arrangements and systems. This would provide flexibility for the beverage industry to use the revenues in the most suitable way to increase glass recovery.
Criteria 4 - Net economic cost and complexity of glass levy
The main costs of the glass levy include the administrative costs to industry of collection and management of revenues, the costs of any source reduction undertaken in response to the levy and the costs of additional recovery and recycling of glass packaging.

Beverage Container Investigation 28 April 2010
BDA Group and Wright Corporate Strategy 136
The administrative costs were outlined in Table B7.1 and are estimated at around $600,000 per annum in total. Source reduction was assumed at around 2% of the weight of glass packaging sold, and for the purpose of this illustrative analysis we have assumed a source reduction cost of $20 per tonne66. The total cost of source reduction is therefore estimated at around $370,000 per year.
The net costs of additional glass recovery (after taking into account the value of the materials recovered and avoided landfill disposal cost) is estimated at $8.4m per year. There is also an economic benefit of the reduction in glass packaging sent to landfill as a result of source reduction and the drop in consumption in response to the levy. This saving is estimated at $0.8m per year (assuming average landfill costs of $40 per tonne excluding government levies).
The net economic cost of the glass levy option is therefore estimated at around $8.6m per year.
One major advantage of the glass levy option is in providing flexibility to industry to find lowest cost ways to achieved increased resource recovery and litter reduction outcomes. However, as a result the option is also susceptible to the free rider problem (that prompted the development of the National Packaging Covenant).
Criteria 5 - Financial impacts of glass levy
The financial impacts of the levy include the levy itself incurred by glass beverage manufacturers and fillers and passed on to consumers, as well as the costs of source reduction. The total levy revenues are estimated at around $9m per year resulting in an average increase in the price of glass containers of < 1 cent67. The total financial impact on industry is $9.4m per year.
If GST revenues were applied to the glass levy this would increase costs to consumers and provide additional revenue to the Australian Government.
The reduction in glass packaging to landfills would reduce landfill levies paid to State Governments. The impacts would depend on how where the reductions occurred, however the overall magnitude of the reduction is estimated at around $1.6m68.
There would be no cost to local government under the glass levy option. For any programs to be implemented or administered by local government these costs would be captured in the proposal process and would be funded from glass levy revenue allocations. 66 BDA/MMA 2007 National Packaging Covenant Complementary Economic Mechanisms Investigation, Report
for National Packaging Covenant Jurisdictional Working Group, December 67 Assuming an average beverage container price of $2.17. This is derived from spirits and wine making up 4%
of the beverage market @$15 per container, other large containers making up 14% @ $2.50 per container and other small containers making up 82% @ $1.50 per container
68 Allocated by State according to population.

Beverage Container Investigation 28 April 2010
BDA Group and Wright Corporate Strategy 137
Criteria 6 - Performance of glass levy across jurisdictions and in defined locations
The increase in glass recovery and litter outcomes could vary widely across jurisdictions depending on the way the revenues are used by industry. Under this option you would expect industry to seek the lowest cost compliance approach which is likely to result in a focus on metropolitan areas and high yielding opportunities, and the activities may not be as broadly based as for some other options. For example, if only the hospitality sector and small business initiatives in this example were funded there would be no impact on littering along highways.
Criteria 7 - Cost-effectiveness of glass levy
The cost of the glass levy option is estimated at around $8.6 million per year. The expected outcome is an additional 60,500 tonnes of glass materials recovered (930m containers). The cost-effectiveness of the option is therefore around $140 per additional tonne of glass recovered.
For each $1m economic cost imposed on the Australian economy, the glass levy option would recover 7,000 tonnes of glass packaging (110 million containers).
B7.2 Summary of evaluation of glass levy
A glass levy is suitable as a national measure, no new legislation would be required and it would be simpler to administer than a CDS. It has the potential to provide increased resource recovery of glass, however the level of certainty that the outcomes would be achieved would be moderate as it is a voluntary instrument. The levy would provide maximum flexibility to industry to seek out low cost recovery opportunities for glass recovery. It would be less effective in achieving litter reduction outcomes than CDS in terms of both the scale of the outcomes as well as the breadth of changes. Table B7.3 summarises the assessment of the glass levy against the assessment criteria.

Beverage Container Investigation 28 April 2010
BDA Group and Wright Corporate Strategy 138
Table B7.3: Evaluation of glass levy against criteria
Criteria Assessment
Suitability as national measure • No new legislation required
• Beverage companies have already expressed willingness
Effectiveness in litter reduction and resource recovery
• Additional recovery of 60,500 tonnes per year (930m glass containers)
• Litter outcomes not significant in this example (although would depend on funding priorities)
• Outcomes uncertain given voluntary status
Compatibility with existing waste and recycling management arrangements and systems
• Compatible and provides maximum flexibility to industry to seek cost-effective recovery opportunities
Net economic cost and complexity • $8.6m per year
• Implementation straightforward
Financial impacts • Increased costs to industry and therefore beverage consumers of $9.4m/yr
• Reduced landfill levies to State Governments of $1.6m per year
• Any additional cost to Local Governments funded through glass levy revenue allocations
Performance across jurisdictions & in defined locations
• Litter outcomes confined to specific areas of focus for additional recovery
Cost-effectiveness • $140 per additional tonne recovered
For each $1m economic cost:
• 110 million glass containers recovered (7,000 tonnes of glass)

Beverage Container Investigation 28 April 2010
BDA Group and Wright Corporate Strategy 139
B8 SENSITIVITY TESTING
This section provides sensitivity testing for important assumptions and key design parameters of different options. The list of factors tested includes issues raised by stakeholders in response to a draft of this report. The focus of the sensitivity analysis is the extent to which each factor impacts the cost-effectiveness and therefore relative ranking of the different options.
B8.1 National CDS deposit level
With a deposit level of 20 cents the total amount of material estimated to be recovered under a national CDS is estimated to increase by 9% from 989,000 tonnes to 1,077,000 tonnes per year. This would take the packaging recovery rate from 82% (with a 10 cent deposit) to 89%.
The litter outcomes are not expected to improve significantly with a higher deposit level. The extra recovery is estimated to reduce the national litter count by another 1.6% (on top of the 6% estimated with a 10 cent deposit).
The costs and benefits of the system move in line with the changes in total tonnes through the system (+9%), total containers through the system (+5%) or additional tonnes recovered (+25%) depending on the impact. For a 20 cent deposit rate we also assume that the amount though existing kerbside systems would reduce from 7% to 6.6% in line with the overall percentage increase in containers going through the CDS with a higher deposit. Table B8.1 below summarises the changes in costs and benefits with a 20c deposit scheme.
Table B8.1: Change in costs and benefits of CDS with 20c deposit
Cost / benefit $m /yr % change
Handling / supercollectors / transport -$545 + 5%
Inconvenience costs -$235 + 5%
Commercial collection costs -$27 + 5%
Administration / implementation -$21 + 2%
Material values $65 + 21%
Savings for kerbside systems $25 + 4%
Un-redeemed deposits - tourists $16 + 5%
Avoided landfill costs $17 + 26%
Total -$705 + 4%
It is likely that inconvenience costs would increase with a higher deposit rate - with higher personal costs for containers returned for a 20 cent deposit that were not returned for a 10 cent deposit. However, we have assumed the same level of inconvenience costs per container to

Beverage Container Investigation 28 April 2010
BDA Group and Wright Corporate Strategy 140
provide a conservation estimate of overall costs under this system. The administration / implementation costs have a fixed component unrelated to the number of containers and therefore a lower percentage increase in costs. The material values are based on total tonnes of materials recovered, however they are also influenced by the mix of materials recovered with the increase mostly glass (with a lower value per tonne compared to the rest of the materials). The avoided landfill costs increase in line with the additional tonnes of materials recovered.
Overall the net economic cost of the scheme would increase by around 4% to $705m per year. On a per tonne basis, the CDS would become cheaper with the economic cost per tonne falling from around $2,040 to $1,670.
The financial costs of the scheme would increase from $305m per year to $324m per year with a 20 cent deposit rate. With total recovery of 11.7 billion containers the total unredeemed deposits are estimated to increase from $250 million per year to $379 million per year (with the doubling of the deposit rate). Instead of a net cost to industry of $55m per year there would be excess unredeemed deposits of $55m per year.
The financial savings to local government are expected to treble with the higher deposit rate with savings increasing from $32m per year to $107m per year. The main change in the impact is the increase in deposits collected by local government. Table B8.2 provides a breakdown of the impacts.
Table B8.2: Financial impact of CDS on local government with 20 cent deposit rate
Impact Total value ($m / yr)
Deposits collected by local government $147
Kerbside savings $25
Landfill cost savings $17
Landfill levy savings $9
Material values lost by local government $91
Net financial saving $107
Notes: Assumes 6.6% of CDS returns are through kerbside systems, landfill costs of $40 per tonne and average levies of $20 per tonne.
B8.2 Base case container recovery levels
The level of recovery of beverage containers on the CDS is impacted by the assumptions made about recovery in 2010 under the base case (in the absence of any new policy interventions). The results of sensitivity testing examining how CDS would outcomes vary if we assumed recovery levels remained at 2007 levels in the absence of CDS is summarised below.

Beverage Container Investigation 28 April 2010
BDA Group and Wright Corporate Strategy 141
Table B8.3: Estimated CDS recovery rates under alternative base case assumptions
Reference year for base case recovery 2010 2007
Deposit level 10 c 20 c 10 c 20 c
Recovery without national CDS (tonnes / yr) 655,744 655,744 501,545 501,545
CDS outcomes
Extra recovery estimated under CDS (tonnes / yr) 333,402 421,688 479,808 575,236
Recovery rate without national CDS 54% 54% 41% 41%
Recovery rate with national CDS 82% 89% 81% 89%
Notes: Although recovery rates for schemes with similar deposit levels are likely to be similar, there are small differences in the modelled outcomes. Using the 2010 base case, the expected recovery for aluminium and PET at home are already higher than the rates estimated to be achieved under CDS. As a result the overall recovery rate is slightly higher with a 2010 base case than a 2007 base case.
Changing the base case recovery data also affects the economic costs and benefits of the scheme to the extent that there is any change to the total tonnes through the system. However, the estimated total tonnes though the system is driven by the estimated recovery rates for CDS (from Table B1.1) and the 2010 consumption data which remains the same for all scenarios below. To the extent that some individual material / location recovery rates are exceeded under 2010 but not in 2007 the total recovery will differ.
The costs and benefits will change in line with the changes in total tonnes through the system, total containers through the system or additional tonnes recovered. The avoided landfill costs change with the amount diverted from landfill under CDS (expected to be greater with 2007 base case recovery data compared to 2010 base case recovery data). Table B8.4 shows the impact of the base case on the net economic costs of the scheme and the cost per tonne of additional recovery.
Under the settings with the lowest cost per tonne of around $1,125, CDS still has a relatively high cost per tonne compared with other options

Beverage Container Investigation 28 April 2010
BDA Group and Wright Corporate Strategy 142
Table B8.4: CDS cost per tonne under alternative base case assumptions
Reference year for base case recovery 2010 2007
Deposit level 10 c 20 c 10 c 20 c
Extra recovery estimated under CDS (tonnes / yr) 333,402 421,688 479,808 575,236
Total recovery estimated under CDS (tonnes / yr) 989,146 1,077,432 981,353 1,076,781
Net economic cost of scheme ($m/yr) 680 705 608 647
Economic cost of additional recovery ($ per tonne) 2,040 1,670 1,267 1,125
B8.3 Inconvenience costs
It has been argued by some commentators that some consumers can have “negative” inconvenience costs, particularly consumers that do not currently have access to recycling facilities – that is, the personal satisfaction from contributing to recycling to some may exceed any inconvenience costs such that they would be willing to pay to recycle containers. In this case the inconvenience costs associated with the CDS option would be lower than we have estimated. It has also been suggested that there are inconvenience costs that are relevant for other options which should also be included.
In order to test the importance of inconvenience costs for the overall ranking of options we report the results of a scenario where inconvenience is omitted from the analysis of CDS. The total economic costs of the CDS option are reduced by 30% to around $563m. The net economic cost (after offsetting scheme benefits) is reduced by 33%. The net economic cost per tonne is reduced from around $2,040 to $1,370 per tonne. Without the inconvenience costs the CDS option is still at the higher end of the costs per tonne for the options considered.
B8.4 Administrative costs
This section tests the importance of the estimation of administrative costs for the ADF. It has been suggested that the costs of administering a levy may be up to ten times higher than has been estimated in the report.
Increasing the administrative costs of the ADF from $890,000 to $8.9m per year increases the economic cost of the option by around 19%. The economic cost per tonne increases from $69 per tonne to $83 per tonne. This does not affect the ranking of the cost-effectiveness of options.
B8.5 Local government management costs
The cost to local government of implementing the program based options is difficult to estimate. Figure B8.2 below shows the relative cost-effectiveness if the costs of the program options are increase by around 20%.

Beverage Container Investigation 28 April 2010
BDA Group and Wright Corporate Strategy 143
Figure B8.2: Cost-effectiveness of options with greater local government program costs
The change does not impact on the relative ranking of options in terms of cost-effectiveness.
B8.6 Material prices
The value of materials recovered has declined recently due to the global economic downturn. In the short to medium term, this means that some markets for recycled products are virtually non-existent. For example, there is no market for recycled paper and steel currently. Longer term averages have been used in our analysis to reflect the fact that the global economy is likely to have recovered by the time the policy options would be introduced.
This section examines the impact of lower material prices on two key options – the CDS and ADF. The scenario looks at the impact of prices 50% lower than the longer term averages used in the study (and shown in Table 1.6).
We assume that options involving seed funding to kick start commercially viable recycling such as the hospitality and workplace initiatives would not be pursued under the ADF because of the higher risk that ongoing recovery may not be viable. For the other program based options we assume that the costs of the options increase in line with the decline in material values. The results are shown in Table B8.5.

Beverage Container Investigation 28 April 2010
BDA Group and Wright Corporate Strategy 144
Table B8.5: Impact of material prices 50% lower on CDS and ADF options
CDS Change ADF Change
Net economic cost ($m/yr) $707 4% $43 0%
Increase in recovery of packaging (tonnes/yr) 333,402 0% 96,600 -84%
Increase in recovery of beverage containers (million/yr) 3,114 0% 501 -69%
Cost of increased packaging ($ per tonne) $2,120 4% $447 548%
Under this scenario the cost and cost-effectiveness of the CDS increases by 4%, but the level of recovery remains the same. The overall costs of the ADF remain the same, however the cost per tonne increases substantially and the overall levels of recovery are substantially reduced.
B8.7 Contamination
There are two areas relating to glass contamination where there is debate over whether any significant benefits would accrue under a CDS. These have been omitted from the analysis of CDS above and the impact of including them is tested here. They are:
• greater paper recovery with less glass contamination - assuming a 2% increase in paper recovery (or around 40,000 tonnes per year) the CDS the benefit could be around $3.6m per year (assuming a material value of $150 per tonne and reprocessing costs of $60 per tonne).
• less broken glass in compost generated from MSW - assuming CDS could add between $5-10/tonne of compost produced the total benefit could be around $6m per year.
The inclusion of these values would reduce the net economic costs of the CDS by around $10m per year (1.5%) but would not change the overall ranking of options.

Beverage Container Investigation 28 April 2010
BDA Group and Wright Corporate Strategy 145
GLOSSARY
ACOR Australian Council of Recyclers ADF Advance Disposal Fee AWT Alternative Waste Technology BA Boomerang Alliance BCWG Beverage Container Working Group BDA BDA Group CAL California CDS scheme CDS Container Deposit Systems CPRS Carbon Pollution Reduction Scheme C&I Commercial and Industrial CZ Convenience Zone DECC NSW Department of Environment and Climate Change EPHC Environment Protection and Heritage Council EPR Extended Producer Responsibility FTE Full time equivalent GST Goods and Services Tax GL 1 billion litres HDPE High density polyethylene KAB Keep Australia Beautiful kt Kilotonne (1,000 tonnes) LGA Local Government Authority or council LPB Liquidpaperboard LCA Life-cycle Assessment MMA McLennan Magasanik Associates MRF Materials Recycling Facility Mt Million tonnes NEPC National Environment Protection Council NEPM National Environment Protection Measure NGOs Non-government organizations NLI National Litter Index (prepared by KAB) NPC National Packaging Covenant PET Polyethylene terephthalate POS Point of sale PPR Public Place Recycling PVC Polyvinyl chloride a material used for plastic cordial containers RVM Reverse Vending Machine or Reverse Vending Machine CDS scheme SRG Stakeholder Reference Group VOC Volatile Organic Compounds WCS Wright Corporate Strategy

Beverage Container Investigation 28 April 2010
BDA Group and Wright Corporate Strategy 146
REFERENCES
ABARE 2006, Australia Commodity Statistics, Canberra
ABS 2006, National Health Survey 2004-05: Summary of Results, catalogue number 4364.0
Ajani 2008, Australia’s transition from native forests to plantations: The Implications for woodchips, pulpmills, tax breaks and climate change, Agenda Volume 15, No 3, 2008 ANU E-press
Australian Beverage Packaging, Consumption, Recovery and Recycling Quantification Study, September 2008
Australian State of the Environment Committee 2006, Independent Report to the Australian Government Minister for the Environment and Heritage, Australia State of the Environment 2006.
BDA/MMA 2007 National Packaging Covenant Complementary Economic Mechanisms Investigation, Report for National Packaging Covenant Jurisdictional Working Group, December
Berry and Harrison 2007, Hospital separations due to injury and poisoning, Australia 2003-04, Injury Research and Statistics Series No 30, Australian Institute of Health and Welfare, Flinders University, Adelaide
Boomerang Alliance 2008, The Carbon Pollution Reduction Scheme: Implications and Opportunities from Waste Management and Recycling, submission to Carbon Pollution Reduction Scheme Green Paper July 2008
Cassell and Clapperton 2005, Injury profile, Victoria 2002, Victorian Injury Surveillance and Applied Research, Accident Research Centre, Monash University
Clark, Cassell, Ashby and Sherrard 2002, Unintentional cutting and piercing injury in the home, Hazard No 52, Victorian Injury Surveillance and Applied Research, Accident research Centre, Monash University.
Department Of Climate Change 2006a, National Inventory by Economic Sector 2006, accessed from http://www.climatechange.gov.au/inventory/2006/economic-sector.html, 12 September 2008.
Department of Climate Change 2006b, National Greenhouse Gas Inventory 2006, accessed from http://www.climatechange.gov.au/inventory/2006/economic-sector.html, 12 September 2008.
Department of Environment and Climate Change NSW 2006, Environmental Benefits of Recycling Calculator, accessed from www.environment.nsw.gov.au
Environmental Manager Issues 633 and 634, 17 July and 24 July 2007
Environment Protection and Heritage Council Report 2008, Litter Management in Australia, November
Grant, James, Lundle and Sonneveld 2001, Life Cycle Assessment for Paper and Packaging Waste Management Scenarios in Victoria, by RMIT, Victoria University & UNSW for Ecorecycle Victoria, January.
Grant, James and Partl 2003, Life Cycle Assessment of Waste and Resource Recovery Options (Including Energy Recovery), by RMIT & Nolan ITU for Ecorecycle Victoria, April.
Hyder Consulting 2008, Australian Recycling Values, prepared for the Australian Council of Recyclers, July

Beverage Container Investigation 28 April 2010
BDA Group and Wright Corporate Strategy 147
Hyder Consulting 2008b, National Packaging Covenant Structural Barriers Investigation, May
Hyder 2008c National Packaging Covenant Mid-Term Review - Contextual Review
KESAB Environmental Solutions 2006, Submission 20 to the Productivity Commission Waste Inquiry
Lewis 2008, National Packaging Covenant Mid-Term Review, Report to the National Packaging Covenant Council, October
McGregor Tan Research 2008, KAB National Litter Index 2007/08
National Packaging Covenant 2006, Annual Report 2005-06
National Packaging Covenant. Mid-Term Review 2006-07
Nolan-ITU 2002, Western Australian Local Government Association Litter Management Options in Western Australia
Office of Best Practice Regulation 2007, Best Practice Regulation Handbook, Canberra
OECD 2008, Environmental Performance Reviews: Australia, March.
Perchards 2008, Status of Packaging Sustainability in Australia, prepared for the Packaging Council of Australia, July
Perchards 2008, Boomerang Alliance Paper, Financial Analysis for Costs and Benefits of a National Container Deposit System: A Feasibility Review, prepared for the Commonwealth Department of Environment, Water Heritage and the Arts, November.
Productivity Commission 2006 Waste Management, Report No. 38, Canberra.
RMIT & NSW Cooperative Research Centre for Waste Management and Pollution Control 1998, Australian data inventory project, life Cycle Inventories for Transport, Energy and Commodity Materials.
Senate Standing Committee on the Environment, Communication and the Arts 2008, Management of Australia’s Waste Streams including consideration of the Drink Container Recycling Bill 2008
South Australian EPA 2008, The Case for a National Beverage Container Deposit System as a Product Stewardship Scheme, Paper presented to the Environment Protection and Heritage Council, April
Southern Waste Strategy Authority 2006, Perception Survey, draft Report, August. accessed at www.packagingcovenant.org.au
Staines and Ozanne-Smith 2002, Feasibility of identifying family friendly beaches along Victoria’s coastline, Accident Research Centre, Monash University
Steel Can Recycling Council (undated), Steel Recycling Sustainability for the Future, 2003-04 Steel Packaging Recycling Rate, accessed from www.cansmart.org/Facts/research/CS_handout.pdf
Taverner Research 2003, The Consumer Demand for Environmental Packaging, summary accessed at www.packagingcovenant.org.au on 24/10/08
TEC 2007, Australia’s Climate Change “Time Bomb”, TEC Briefing Note, August

Beverage Container Investigation 28 April 2010
BDA Group and Wright Corporate Strategy 148
Warnken ISE 2007 The Potential for Greenhouse Gas Abatement from Waste Management and Resource Recovery Activitiy in Australia, prepared for SITA Environmental Solutions September 2007
Watson and Ozanne-Smith (1997), The cost of injury to Victoria, Accident research Centre, Monash University, Report No 124, December
Watson and Ozanne-Smith 2006, Consumer product-related injuries in Australia hospital and medical costs to Government, Accident Research Centre, Monash University, Report No 83.
White 2001, Independent Review of Container Deposit Legislation in NSW, Report to the Minister for the Environment prepared by the Institute for Sustainable Futures UTS, November
WA Department of Environment and Conservation 2007, A Profile of Recycling Behaviour, March
WCS Market Intelligence/WME. The Blue Book Australian Waste Industry 2007/08 Industry and Market Report. 2008.
Zero Waste SA 2006, South Australia’s Waste Strategy 2005 to 2010, Adelaide
Zero Waste SA 2007, Disposal Based Audit, Adelaide

Beverage Container Investigation 28 April 2010
BDA Group and Wright Corporate Strategy 149
APPENDIX 1: System costs of the SA container deposit system
The estimated cost for the South Australian contained deposit scheme has been based on the following assumptions:
Depot handling fee (as per RSA) $ 13,140,000
Transport processing and administration (as per RSA) $ 1,460,000
Proceeds from sale of recyclate retained by super collectors $ 5,840,000
Kerbside collection & MRF sorting of 8,098 tpa containers $ 1,446,951
Total cost to system $ 21,886,951
Total tonnes recovered 40,131
Average cost per tonne recovered $545.39
These assumptions assess the cost of the system as operated in SA, where:
• some 20 percent of containers are recovered at recycling centres after they have been collected and processed in a MRF through the kerbside recycling system, which operates in SA at an average cost across the State of $178.68 per tonne, based on the 2006 – 2007 NEPM report, which costs must be added to the overall cost for recovering containers through the system, and
• the proceeds from the sale of recyclate is retained by super collectors and not returned to the “system”.
• In a system operated by a government agency, it might be argued that the proceeds from sale of recyclate will reduce the net cost of the system, provided those proceeds are retained within the system to off-set costs. This is not the case in the current SA system.

Beverage Container Investigation 28 April 2010
BDA Group and Wright Corporate Strategy 150
APPENDIX 2: Methodology for estimating changes in packaging impacts
In Section 3.1 a range of environmental impacts associated with the production, consumption and disposal of packaging were canvassed. Government policy interventions that promote changes in packaging production, consumption and disposal – such as through increased packaging waste recovery and reprocessing – will in turn lead to changes in environmental impacts. The differences in impacts before and after the policy can be attributed as benefits (or costs) from the intervention.
Impact assessment falls largely into two areas:
• Identification, through life-cycle assessment (LCA), of the upstream impacts associated with the recovery and reuse / reprocessing of packaging waste, and landfill impacts associated with the diversion of waste from landfill disposal to reprocessing; and
• identification of changes in littering and associated impacts.
The use of life-cycle assessment inventories and related studies to identify upstream and landfill impacts are addressed in this Appendix. The approach to identify litter impacts is relatively straightforward and is provided with results in Section 3.4.
Not all potential impacts identified in Section 3.1 have been investigated. Notably, the impact inventories used in LCA capture changes in greenhouse gas emissions that contribute to global warming and climate change, and they also capture changes in air and water pollutants that contribute to losses in regional (largely urban) air and water quality. They do not include assessments of how pollutant emissions or other industrial practices (such as land clearing) associated with mine, manufacturing and landfill sites may contribute to local acute impacts on human, flora or fauna populations. These contributions are however likely to be small as:
• the resource volumes involved (as shown later in report) to total volumes being mined / manufactured / landfilled are very small and hence only likely to affect rates of site utilisation or longevity, rather than whether sites are used at all;
• changes in rates of site utilisation / longevity are unlikely to affect site management practices and the potential generation of local acute impacts;
• potential local ‘acute’ impacts on human, flora or fauna populations are controlled through development approvals, environmental regulations and on-going environmental licensing which tailor controls to context specific circumstances, largely negating potential impacts.
For these reasons, changes in packaging waste management and recovery by themselves are unlikely to materially affect industrial, site-specific impacts, and therefore are not considered further in this report.
Beverage Container Investigation 28 April 2010
BDA Group and Wright Corporate Strategy 151
2.1 Use of life cycle assessment
LCA analysis is a modelling technique that traces the impact of a product over its entire life, from virgin materials extraction to final disposal. If waste management practices lead to changes in upstream activities through the use of recyclate rather than the use of virgin materials, or through changes in production levels or patterns (including processing types, energy and resource use, etc), then some upstream external impacts may arise. The most commonly identified impacts are pollution emissions and implications for resource use.
In this report we summarise best available information on the life-cycle impacts of packaging wastes and the extent to which these impacts can be avoided through packaging waste recovery and recycling. The key studies drawn on are:
The assessment of Australian Recycling Values prepared by Hyder Consulting for the Australian Council of Recyclers, published in July 2008.
This contains estimates of upstream savings from recycling including reductions in resource use, including energy and water use, and greenhouse emissions by drawing on a range of life cycle studies. The estimates are made for all recycling activity (not just recycling of packaging materials) and include savings providing benefits overseas as well as in Australia. The main LCA inventory data used was existing data from the SimaPro proprietary software; the Life Cycle Assessment for Paper and Packaging Waste Management Scenarios in Victoria prepared by Grant et al in 2001 for Eco Recycle Victoria; the RMIT & Nolan ITU Life Cycle Assessment of Waste Management Options in Victoria 2003; and the RMIT and the UNSW Co-operative Research Centre for Waste Management and Pollution Control 1998 Life Cycle Inventories for Transport, Energy and Commodity Materials.
The report on the Status of Packaging Sustainability in Australia, prepared by Perchards for the Packaging Council of Australia, published in July 2008.
This report presents indicative environmental benefits for packaging recycling in the year 2007 including greenhouse reductions and water savings. The environmental benefits have been derived using the NSW DECC’s Environmental Benefits of Recycling Calculator (DECC 2006) and are based on recycling materials from a typical Sydney metropolitan domestic kerbside collection system. The DECC Calculator is based predominantly on the Life Cycle Assessment for Paper and Packaging Waste Management Scenarios in Victoria prepared by Grant et al in 2001 for Eco Recycle Victoria.
Life cycle inventories developed by RMIT and the UNSW Co-operative Research Centre for Waste Management and Pollution Control
We have also developed our own estimates for comparative purposes for some impacts. Estimates of the impacts of packaging production are based directly on the life cycle inventories developed by RMIT and the UNSW Co-operative Research Centre for Waste

Beverage Container Investigation 28 April 2010
BDA Group and Wright Corporate Strategy 152
Management and Pollution Control in 1998 under the Australian data inventory project. Estimates of the impacts of recycling different packaging materials are based on this data set as well as the Life Cycle Assessment for Paper and Packaging Waste Management Scenarios in Victoria by Grant et al prepared in 2001 for Eco Recycle Victoria. Appendix 2 summarises the key sources of information used in these studies by packaging material.
2.2 Issues associated with the application of LCA
The Productivity Commission (2006) outlines a range of concerns with applications of LCA to estimate upstream physical impacts associated with waste policies. These concerns include a common assumption that all recycling is ‘closed loop’ and that the production of goods from recyclate will always displace the extraction and use of a similar quantity of virgin materials.
Closed loop recycling simply means that collected waste materials are reprocessed into the same materials. So for example:
• Recycled paper replaces unbleached kraft pulp used in paper manufacture;
• Recycled plastics (PET and HDPE) replace plastic resin made of virgin materials;
• Recycled metals (aluminium and steel) replace metals made of virgin materials ; and
• Recycled glass replaces silica sand and other virgin materials used to make glass.
In many instances however, recyclate is reprocessed into other commodities which may have very different implications for the use of virgin materials and generation of pollutant emissions. Accordingly, some applications of LCA have differentiated end uses for recyclate rather than simply assuming all material is subject to closed loop reprocessing
The second issue relates to the assumption that the production of goods from recyclate will displace the extraction and use of a similar quantity of virgin materials. In brief, it is erroneous to assume that recyclate will, in all instances, replace production based on the use of virgin materials (ie: 1 for 1 substitution after taking into account material losses etc).
As well as this ‘substitution effect’, the supply of competitively priced recyclate can also generate a ‘consumption effect’, where total consumption of the material increases. While the substitution effect may lead to lower resource use and upstream pollution emissions (compared to production based on virgin materials), the consumption effect will not reduce resource consumption and may actually increase overall pollution. The extent to which one effect is greater than the other will depend upon how responsive prices are to the quantity of materials available to the market. Where price is not responsive, the substitution effect will dominate; where price is responsive, the consumption effect will dominate. In economic terms, the price responsiveness of material demand is called the price elasticity of demand.
Most resource markets are highly competitive and Australian producers are price takers – that is they face a highly elastic demand for their product and therefore any additional product they
Beverage Container Investigation 28 April 2010
BDA Group and Wright Corporate Strategy 153
can supply at a competitive cost to the market will be purchased without impacting other suppliers to the market. Therefore some new resources provided to the market through recycling may not displace production using virgin materials but rather allow an expansion in consumption.
A third consideration is the location of manufacturing based on virgin materials relative to that of recyclate processing. Some recyclate may be exported and therefore make no contribution to reducing pressures on Australia’s resource base. In addition, there is a need to differentiate pollution impact values based on the location of emissions related to manufacturing based on virgin materials relative to that of recyclate processing. The former may for example occur in large metropolitan areas where human health costs from pollution may be relatively higher than emissions from recyclate processing (say in a regional area). Similarly, domestic recyclate processing that displaces imported materials processed overseas would lead to an increase in pollution emissions in Australia, while the converse would also be true with the processing of Australian recyclate overseas that displaced domestic production leading to larger net reductions in domestic pollution emissions.
Finally, consideration of expected versus potential upstream benefits is required. That is, some risk adjustment of potential benefits is required to take into account broader planning, environmental and industrial regulations that are employed to ensure toxic pollutants do not impose actual harm on the community or that resource exploitation activities do not threaten the sustainability of resource industries or cause localized impacts as previously discussed.
In the following sections the potential benefits of increased packaging recovery and recycling are identified using LCA and without any adjustments for the issues raised above. While this could lead to either an under or over-estimation of potential benefits depending on the specific impacts and circumstances, we believe omission of these considerations will generally lead to an over-estimation of potential benefits.

Beverage Container Investigation 28 April 2010
BDA Group and Wright Corporate Strategy 154
APPENDIX 3: Impacts associated with resource recovery
3.1 Resource depletion
This appendix examines the likely order of magnitude of key resources used to produce packaging, the savings in resources implied by current levels of recycling and the residual resource savings that may be achievable through further increases in packaging recycling levels. Where alternate LCA analyses have produced varying estimates, we highlight possible reasons for these differences and report mid point estimates in related figures and in the summary provided in section 3.3 above.
3.1.1 Resources used to make packaging
A range of virgin materials are used to produce packaging materials. However, no studies are available that comprehensively document the level of virgin materials used. In order to assess the extent of key resources used to produce packaging materials in Australia we have derived estimates drawing on life cycle analyses used by ACOR in their recent assessment of Australian Recycling Values (Hyder Consulting 2008) and the estimates of total packaging materials consumed for the year 2006 (from the National Packaging Covenant Council and published in Perchards (2008) - the Packaging Council of Australia’s report on the status of packaging sustainability in Australia).
The project team has also developed direct estimates for comparative purposes using the data described in Appendix 1. For both sets of estimates we have used 2006 data on the consumption of packaging in Australia by material. The project team estimates are used to provide some confidence in the order of magnitude of the other estimates.
Table 3.1 shows the results of an indicative analysis of some of the key resources that would be used to make packaging materials consumed in Australia if all packaging was produced with virgin materials. As most packaging is sourced within Australia (preliminary figures from Perchards (2008) suggest 92%) most of these resources would also be consumed in Australia.
The resource requirements estimated by Hyder are similar to those estimated by the project team for sand and bauxite but are higher for wood and iron ore. Some differences are expected given that the project team estimates focus on packaging, whereas the Hyder estimates focus on recycling of materials more broadly and different versions of the LCA datasets have been used. The main differences arise from the mix of products taken as representative of the production of packaging/recycled materials (highlighted in the footnotes to Table 3.1).
The LCA estimates suggest that around 10-13 million tonnes of wood, 650,000 tonnes of sand, 100,000-130,000 tonnes of iron ore, 280,000 tonnes of bauxite and 460,000 tonnes of oil would be used annually if all packaging materials consumed in Australia were made with virgin materials.

Beverage Container Investigation 28 April 2010
BDA Group and Wright Corporate Strategy 155
Table 3.1: Virgin material equivalent of resources used to make packaging consumed in Australia in 2006
Packaging Material
Virgin material
Resource requirement (per
tonne of packaging material)
Total consumption of packaging material 2006
(tonnes)b
Resources used to make
packaging (tonnes)
BDA/WCS estimate for comparison
(tonnes)
Paper Wood 4.3 m3 pulp a 2,639,000 13,617,000 c 9,992,000 d
Glass Sand 0.72 t 893,031 643,000 655,000
Ferrous Iron ore 1.4 t e 92,399 129,000 96,000 f
Aluminium Bauxite 5.7 t 48,791 278,000 280,000
Plastics Oil - - - 462,000
Notes: Resource estimates rounded to nearest thousand tonnes. Sources: a. Hyder 2008 – the resource requirement for wood is based on an average for cardboard, tissue paper
and office paper production b. The consumption figures are shown here as they have been used in the derivation of the last two
columns (source: Perchards 2008) c. Ratio of timber to pulp 2:1, conversion to tonnes based on 60% softwood / 40% hardwood d. Based on production of cardboard e. Covers local car parts, cans, rolled steel for export and includes iron ore, iron ore for sinter and pellet
production as well as iron ore behind recycled material added to melting furnaces f. Based on production of rolled steel
The Packaging Council of Australia’s report on the status of packaging sustainability in Australia by Perchards (2008) has also examined the energy and water consumption used to produce packaging. This study estimated that:
• energy consumption for domestic packaging production in Australia in 2005/06 was around 22 million GJ (or around 0.4% of total Australian energy consumption69). This was based on usage by the five major Australian packaging companies.
• water consumption for domestic packaging production in Australia in 2005/06 was around 7.2 GL or around 0.04% of total Australian water consumption. This was based on consumption by the five major Australian packaging companies. Urban consumption was around 35% of total water use in 04/0570 which would make packaging consumption around 0.11% of total urban water consumption.
69 Hyder indicated that a comparable total Australian consumption estimate was not available. We have used
ABARE 2007, Energy Update, July 70 ABS 4610.0 Water Account Australia 2004/05

Beverage Container Investigation 28 April 2010
BDA Group and Wright Corporate Strategy 156
The project team’s direct estimate of energy consumption for packaging consumed in 2005/06 from the available LCA datasets is around 58 million GJ71 or around 1% of total Australian energy consumption (sources described in Appendix 2). This estimate covers feedstock energy, process heat, electricity consumption, energy losses and other energy inputs. The project team’s direct estimate of water consumption for packaging consumed in 2005/06 from the available LCA datasets is 200 GL or around 1% of total water consumption and 3% of urban water consumption. This estimate includes process waters which may be recycled72.
There are a number of potential reasons for the differences in the estimates developed by the project team and Perchards:
• firstly, a wider set of energy and water inputs may have been included in the project team estimates. For example, it is unclear whether the Perchards estimates include process heat, energy losses and process water.
• secondly, a wider set of possible packaging products may have been included in the project team estimates. For example, the Perchards estimates are based on the major Australian packaging companies: Amcor, Carter Holt, Huhtamaki, Visy and O-I Australia. However, Perchards notes that these companies cover all domestic paper/cardboard and glass manufacturing and significant volumes of aluminium, plastic and other materials.
• thirdly, the LCA estimates provide a “theoretical” estimate based on representative products and production processes (developed originally in 1998 and refined in 2001) whereas the Perchards estimates are based on actual reported energy and water usage by Australian companies.
• fourthly, the Perchards estimates relate to Australian production of packaging, whereas the project team estimates have been developed based on consumption of all packaging (however it has already been noted that most packaging is sourced within Australia).
3.1.2 Resource savings implied from current packaging recycling
The previous section provided estimates of resource use if all packaging consumed in Australia was made with virgin materials. However, to the extent that recycled packaging materials are used in the production of packaging the use of virgin resources is potentially reduced. This section focuses on examining the likely order of magnitude of the resource savings implied by the current level of packaging recycling. The estimates of resource savings take into account the differences between recoveries and recycling volumes by accounting for contamination and processing losses.
71 Derived from LCA datasets described in Appendix 1 72 If process waters are excluded this figure would be around 40 GL per annum. The total estimate including
process waters is used in the report to be consistent with the estimates of water savings shown in the next section.

Beverage Container Investigation 28 April 2010
BDA Group and Wright Corporate Strategy 157
Appendix 2.2 discussed why it cannot be assumed that recyclate will, in all instances, replace production based on the use of virgin materials (ie: 1 for 1 substitution after taking into account material losses etc). The estimates in this section are therefore likely to overestimate the resource savings associated with current packaging recycling.
Table 3.2 provides examples of what virgin materials are potentially displaced through recycling of key types of beverage containers.
Table 3.2: Examples of virgin materials potentially displaced from recycling packaging materials
Recyclate Potentially displaces … Major virgin materials …
Glass containers Some raw materials in glass production
Silica sand, soda ash, limestone
Aluminium cans Production of aluminium ingots Bauxite
Steel tin plate containers
Pig Iron production in blast furnace Iron
Liquid paperboard containers
Bleached kraft pulp for office paper
Unbleached kraft pulp for cardboard
Wood (primarily eucalypt and pine trees from plantation forests)
HDPE containers HDPE production Crude oil, natural gas
PET containers Production of bottle grade PET overseas
Crude oil, natural gas
PVC containers PVC production Crude oil, natural gas, sea salt
Source: Grant et al 2001
Hyder Consulting (2008) provides estimates of savings in the use of virgin materials from recycling of all materials across all waste streams. However, not all of these benefits relate to recycling of packaging materials and the benefits differ for different types of materials.
To provide an indication of the proportion of resource savings that relate to packaging materials we have used the percentage of packaging materials recycling as a proportion of total materials recycled. The project team has also developed direct estimates for comparative purposes using the data described in Appendix 2. For both sets of estimates we have used 2006 data on the recycling of packaging in Australia by material. Table 3.3 summarises the indicative analysis of resource savings applicable to recycling of packaging waste materials.

Beverage Container Investigation 28 April 2010
BDA Group and Wright Corporate Strategy 158
Table 3.3: Estimated resource savings implied by recycling packaging materials in Australia
Packaging Material
Units for resource benefits
Benefit from all recycling in
Australia
(tonnes)1
% related to
packaging2
Estimated benefit from recycling packaging in
Australia
(tonnes)
Comparison with
BDA/WCS estimate
(tonnes)
Paper Wood 10,774,000 4 65% 7,005,000 3,440,000
Glass Sand 364,670 71% 258,000 296,000
Ferrous Iron ore 4,153,948 1% 41,000 51,000
Aluminium Bauxite 1,555,134 10% 153,000 177,000
Plastics Oil3 151,677 100% 151,000 138,000
Notes: Resource estimates rounded to nearest thousand tonnes. Sources: 1. Hyder 2008 2. This % has been derived by taking the quantity of each packaging material recycled in 2006 (from
the NPCC) as a proportion of the total recycling of that material in 2006 (from the Hyder 2008 report).
3. Tonnes of oil equivalent. 4. Based on average tree mass of around 3.6 tonnes (2/3 cardboard etc using 60% softwood / 40%
hardwood and 1/3 newsprint with 85% softwood / 15% hardwood).
Most estimates of the resource savings by Hyder and the project team are similar – apart from the wood savings. This may be explained by different representative products and the fact that the Hyder estimates have been derived from broader estimates and assume the benefits are evenly spread across packaging materials and other materials. The indicative analysis suggests that current levels of recycling could reduce resource use by up to some 3 – 7 million tonnes of wood, 260,000-290,000 tonnes of sand, 40,000-50,000 tonnes of iron ore and 150,000-180,000 tonnes of bauxite and 140,000-150,000 tonnes of oil equivalent.
The tables below provide estimates of energy and water savings possible through recycling of packaging materials consumed in Australia.

Beverage Container Investigation 28 April 2010
BDA Group and Wright Corporate Strategy 159
Table 3.4: Estimated energy savings from recycling packaging materials in Australia
Energy savings Savings for all recycling by Hyder
20081
(GJ)
% relate to packaging2
Energy savings for packaging recycling derived from Hyder
2008
(GJ)
Energy savings for packaging
recycling BDA/WCS estimate
(GJ)
Paper 37,474,585 65% 24,366,000 9,390,000
Glass 1,209,115 71% 854,000 1,609,000
Ferrous 104,958,763 1% 1,046,000 44,000
Aluminium 54,971,726 10% 5,405,000 6,434,000
Plastics 3,434,847 100% 3,435,000 10,848,000
Total 35,106,000 28,326,000
Notes: Resource estimates rounded to nearest thousand GJ. Sources: 1. Hyder 2008, 2. This % has been derived by taking the quantity of each packaging material recycled in 2006 (from
the NPCC) as a proportion of the total recycling of that material in 2006 (from Hyder 2008).
Table 3.5: Estimated water savings from recycling packaging materials in Australia
Water savings Savings for all recycling by Hyder
(2008)
(ML)
% related to packaging2
Water savings for recycling packaging
materials derived from Hyder (2008)
(ML)
Comparison with water savings by Perchards (2008)
(ML)
Paper 33,233 65% 22,000 41,000
Glass 1,078 71% 800 800
Ferrous -13,727 1% -100 <100
Aluminium 73,018 10% 7,200 8,000
Plastics -1,971 100% -2,000 -1,000
Total 27,900 48,000
Notes: Resource estimates rounded to nearest hundred ML. Sources: 1. Hyder 2008 2. This % has been derived by taking the quantity of each packaging material recycled in 2006 (from
the NPCC) as a proportion of the total recycling of that material in 2006 (from Hyder 2008).

Beverage Container Investigation 28 April 2010
BDA Group and Wright Corporate Strategy 160
The indicative analysis suggests that current levels of recycling could potentially reduce energy use by around 30-35 GJ and water use by around 30-50 GL per year.
3.1.3 Residual resource savings achievable from increased packaging recycling
This section draws together the results of sections 3.1.1 and 3.1.2 to provide an assessment of the further savings that could potentially be achieved through additional packaging recycling. Figures 3.1 and 3.2 summarise the results comparing current resource use with the level of resource use if all packaging materials were produced with virgin materials.
Figure 3.1: Indicative estimates of wood use for packaging consumed in Australia
Notes: Derived from mid point of estimates in Tables 2.1 and 2.3.
Figure 3.2: Indicative estimates of virgin material use for packaging consumed in Australia
Notes: Derived from mid point of estimates in Tables 2.1 and 2.3.

Beverage Container Investigation 28 April 2010
BDA Group and Wright Corporate Strategy 161
The figures show that the implied savings for these resources with current levels of recycling are estimated to be between 30% and 60% (with the highest percentage saving for bauxite and the lowest for oil).
In order to assess the further potential for savings in virgin resources from increased recovery of packaging, predictions of future consumption and recovery in 2010 are used from the national Packaging Covenant mid-term review. Table 3.6 summarises this data.
Table 3.6: Estimated remaining packaging to be recovered in 2010
Recyclate Current packaging
recovery 2007 (tonnes)
Estimated consumption 2010
(tonnes)
Estimated recovery 2010
(tonnes)
Remaining packaging to be recovered 2010
(tonnes)
Paper 1,720,000 2,726,677 1,891,913 834,764
Glass 410,700 922,701 605,452 317,249
Steel 34,760 95,469 37,351 58,118
Aluminium 34,300 50,412 42,317 8,095
Plastics 178,351 604,742 241,283 363,459
Total 4,400,001 2,818,316 1,581,685 2,378,111
Source: Lewis 2008, Report to the National Packaging Covenant Mid-term review, October.
The data above has been combined with estimates of the current resource savings from recovery of packaging in Table 3.7. The midpoints of the resource savings derived earlier in this section have been applied on a per tonne basis to the remaining packaging to be recovered.

Beverage Container Investigation 28 April 2010
BDA Group and Wright Corporate Strategy 162
Table 3.7: Potential future resource savings from additional recovery
Packaging material
Type of resource
Potential tonnes saved with current recovery (tonnes)1
Tonnes saved per tonne of
current recovery (tonnes)
Potential savings from further
recovery in future (tonnes)
Paper Wood 5,222,500 3.0 2,534,625
Glass Sand 277,000 0.7 213,971
Steel Iron Ore 46,000 1.3 76,911
Aluminium Bauxite 165,000 4.8 38,941
Plastics Oil 144,500 0.8 294,475
Source: Derived from Tables 3.3 and 3.6. Note 1: Midpoint of resource savings estimates in Table 3.3.
The indicative assessment suggests that the ‘gross’ extent of further potential savings for virgin resources through increased recovery may be around:
• 2.5 million tonnes of wood
• 210,000 tonnes of sand
• 77,000 tonnes of iron
• 39,000 tonnes of bauxite
• 290,000 tonnes of oil
A similar approach was used to assess the potential for further savings in energy and water through increased recovery. The estimates of energy and water use vary widely across different sources and may include different components as discussed in section 3.1.1. They should therefore be treated as indicative only. Figures 3.3 and 3.4 show the estimates of energy and water use.

Beverage Container Investigation 28 April 2010
BDA Group and Wright Corporate Strategy 163
Figure 3.3: Indicative estimates of net energy use for packaging consumed in Australia
Notes: Energy use from BDA/WCS estimate in section 3.1.1 (as Perchards estimate of use is lower than estimated savings with current recycling levels). Energy savings from mid-point estimates reported in table 3.4.
Figure 3.4: Indicative estimates of net water use for packaging consumed in Australia
Notes: Water use from BDA/WCS estimate in section 3.1.1 (as Perchards estimate of use is lower than estimated savings with current recycling levels). Water savings from mid-point estimates reported in table 3.5. Note the estimates include process waters which may be recycled.

Beverage Container Investigation 28 April 2010
BDA Group and Wright Corporate Strategy 164
The analysis suggests that the implied savings from current recycling levels are around 55% for energy and 20% for water use. The indicative assessment suggests that the further gains possible with increased recycling may be around 26 million GJ of energy (0.46% of total Australian consumption) and 14 GL of water (0.08% of total Australian consumption or 0.2% of urban water consumption).
3.1.4 Implications for Australian resource use
This section explores the implications of current and any future increases in the recovery and recycling of packaging materials for Australian resource use.
Wood fibre
There are three types of paper based packaging – paper (both for office use and unbleached paper for packaging), paperboard (from simple cartons to complex containers containing liquids) and corrugated paperboard. The primary material used in paper production is wood fibre, which is transformed into pulp ahead of paper manufacture.
Australian production of paper and paper products in 2004/05 was about 3.1 million tonnes73, of which some 1.9 million tonnes was packaging and industrial paper. Apparent consumption of packaging and industrial paper (that is, production plus imports less exports) was 1.6 million tonnes. In Australia, fibre from recycled products currently represents about 50% of the total fibre used for paper production74.
In 2004/05 Australia produced around 27 million m3 of wood fibre and consumed around 23 million m3 (ABARE 2006). Section A2.1.3 indicated that an extra 2.5 million tonnes of wood could potentially be saved by the recycling of all packaging. This represents around 15.7% of Australia’s total production of wood fibre75.
Around 20% of paper/board recyclate is reprocessed overseas76. Recycled paper replaces softwood and hardwood pulp. The materials replaced will depend on the application that the paper will be used for. Softwood pulp (from conifer plantations) is used to make coarse packaging paper, tissues and newsprint and hardwood pulp produces fine paper for use in office environments.
Pulp produced in Australia is made from native and plantation hardwoods, plantation softwood and sawmill residues. In 2004/05, Australian production of pulp was at about 1.4 million tonnes, which was provided as an input into domestic paper production, which also consumed some 0.4 million tonnes of imported pulp and 1.7 million tonnes of wastepaper. Ajani (2008) estimates that around 77% of wood for domestic pulp production is from plantation forests. 73 The latest complete set of figures available was for 2004/05, sourced from ABARE 2006 74 http://www.a3p.asn.au/keyissues/recycling.html. 75 Based on 60% softwood / 40% hardwood resulting in average density of 600 kg/m3 76 Derived from Hyder 2008

Beverage Container Investigation 28 April 2010
BDA Group and Wright Corporate Strategy 165
While Australia is a very small producer of pulp (less than 1% of world supply), Australia is a significant exporter of wood fibre in the form of (largely native hardwood) chips used in markets such as Japan for the production of fine writing papers. In 2004/05 Australia exported almost 5.6 million tonnes woodchips (ABARE 2006).
While Australia participates in significant trade in wood fibre (including wastepaper exports), Australia is a relatively small producer of pulp in the world market place and is likely to be a price taker. Hence, any increase in volumes of recycled pulp in Australia is not likely to have a significant impact on world pulp prices.
Governments have introduced policies to address the growth in demand for renewable resources such as forests. These policies are aimed at creating sustainable development, so that resources are harvested at rates that are sustainable in the longer term and also protect the quality of remaining resources.
The proportion of land remaining to native vegetation has steadily declined in Australia as land has been cleared for agricultural use and commercial plantations. There has been an increasing focus on the objectives of creating a sustainable forestry sector. Most states ended broadscale vegetation clearing between 2001 and 2006 (Australian State of the Environment Committee 2006). The Regional Forestry Agreements have also been an important tool to protect areas of native vegetation, by placing limits on areas of old growth forests that could be logged and adding areas of land to both informal and formal reserves. While the area of commercial forestry plantations is still expanding, the trend is to create plantations on former agricultural land rather than native forest land (Australian State of the Environment Committee 2006). These policy reforms have now created a situation where sustainable forestry yields have been established, levels of protection have been set and the industry is operating within this framework.
Silica sand
The primary use of recycled glass (glass cullet) in Australia is in the production of new glass containers. The use of the cullet replaces some of the virgin materials used in the production of glass such as silica sand, soda ash and limestone (Grant et al 2001). Owens-Illinois (O-I) Australia and Amcor are the only manufacturers of packaging glass in Australia and use between 25 to 80 per cent of recycled cullet in new glass container manufacture, depending on the colour of the glass. All glass recyclate is reprocessed within Australia77.
The main use of silica sand is in the production of flat glass, glass containers and for moulds and castings in metal foundries. ABARE indicates that silica production in Australian in 2002/3 was 3.9MT78 (compared to world production of around 120 MT per year79). Section A2.1.3
77 Derived from Hyder 2008 78 www.abareconomics.com/interactive/ACS_2005/htmlversion/htm/minerals_energy.html 79 www.pir.sa.gov.au/minerals/geology/commodities/silica

Beverage Container Investigation 28 April 2010
BDA Group and Wright Corporate Strategy 166
indicated that an extra 210,000 tonnes of sand could potentially be saved by increasing recycling of packaging. This represents around 5.5% of Australia’s total production.
With about 70% of Australian production of silica sand exported, extraction rates are being largely driven by world demand and supply conditions rather than domestic consumption. And given Australia is such a small producer on the world market (about 3.25%), the Australian industry are likely to be “price takers”. This means that all production that can be made available at the world price will be taken up by export markets (that is, they face a highly elastic demand for silica). Therefore a reduction in domestic consumption of silica associated with increased glass recycling may in part lead to an increase in export volumes rather than a 1:1 reduction in overall silica sand production in Australia.
Iron ore
Australian production of iron ore and concentrate was 264 MT in 2005/06 (ABARE 2006). Exports of iron ore and steel were about 241 MT, with Australia being the largest exporter of iron ore and steel in the world. 95% of the total export volume from Australia is destined for Asia, with China and Japan the main customers. Imports of iron ore and steel were 7.2 MT in 2005/06. Australian total consumption of iron ore and steel (that is, production minus exports plus imports) is about 30.2 MT.
In 2003/04 it was estimated that about 108 kT of steel (Steel Can Recycling Council, undated), was available for recycling from household steel can packaging and steel cans from the food services industry (industrial use was not included). This total was made up of steel from both post-consumer steel and also from scrap from can-makers and can-fillers. It was estimated that in the same year, about 56% of steel cans were recycled. Around 62% of ferrous metal recyclate is reprocessed within Australia and 38% is sent overseas80.
Section A2.1.3 indicated that an extra 77,000 tonnes of iron ore could potentially be saved by increasing recycling of packaging. This represents around 0.03% of Australia’s total production.
Total world production of iron ore was estimated to be 1,312 MT in 2005/06 (ABARE 2006). Australian exports represent nearly 20% of world production, so Australia may be in a position to have some influence on price. However, the proportion of total Australian consumption of iron ore that is used for packaging material is likely to be small given that iron ore is used to produce steel for construction of many types of infrastructure. Hence, any increase in the volume of recycled steel available is not going to significantly change total Australian production volumes.
Bauxite
In Australia used beverage cans are melted down with other scrap to produce aluminium ingots which are sent to rolling mills to be made into new can sheets. The recycling of these cans 80 Derived from Hyder 2008

Beverage Container Investigation 28 April 2010
BDA Group and Wright Corporate Strategy 167
replaces the virgin aluminium used in can production and can also be used to replace virgin aluminium in other applications (such as products created from reprocessing through other metal recyclers). Around 54% of aluminium recyclate is reprocessed within Australia and 46% is sent overseas81.
Aluminium is produced from bauxite which is mined in Australia. Bauxite is then supplied to alumina refineries, which in turn supply to aluminium smelters and the export market. Australia is a large producer of bauxite, alumina and aluminium. In 2004 Australia was the largest producer of bauxite (59 Mt) and the largest producer (17.2 Mt) and exporter of alumina in the world. Australia was the world's fifth largest producer of primary aluminium metal (1.9 Mt) in 2004. Most of the primary aluminium produced in Australia is exported (about 80%)82.
Aluminium is the most plentiful metallic element in the Earth's crust and Australia has large demonstrated reserves of bauxite, estimated as the second greatest in the world83. Global aluminium recycling rates are high, approximately 90% for transport and construction applications and about 60% for beverage cans. At the global level, one-third of all aluminium metal entering the market is from recycled and post-consumer material84. The current amount of recycled aluminium in Australia is 10% of the total aluminium produced85.
Section A2.1.3 indicated that an extra 39,000 tonnes of bauxite could potentially be saved by increasing recycling of packaging. This represents around 0.07% of Australia’s total production.
Crude oil
Australian crude oil production was about 17,251 ML in 2005/06 (ABARE 2006). Exports of crude oil and other refinery feedstock amounted to about 13,078 ML and imports about 24,429 ML. This makes Australian consumption of crude oil and other refinery feedstock (that is, production minus exports plus imports) at around 28,602 ML.
Section A2.1.3 indicated that an extra 290,000 tonnes of oil could potentially be saved by increasing recycling of packaging. This represents around 2.0% of Australia’s total production and 1.2% of total consumption.
World production of crude oil is estimated to be 84.5 million barrels per day in 2005, with OPEC countries producing about 40% of the total and Asia Pacific contributing only a small proportion to the total (3%). Given that Australia is such a small producer on global markets, it is unlikely that Australian producers will be able to have any impact on world prices. Hence, any increase
81 Derived from Hyder 2008 82 www.aluminium.org.au 83 http://www.australianminesatlas.gov.au/education/fact_sheets/aluminium.jsp 84 www.aluminium.org.au/Page.php?d=1115 85 www.australianminesatlas.gov.au/education/fact_sheets/aluminium.jsp

Beverage Container Investigation 28 April 2010
BDA Group and Wright Corporate Strategy 168
in crude oil availability through increased recycling of plastics in Australia may see a growth in the market for crude oil.
In 2004 plastics production in Australia was 1.3 MT86 and about 48% was used for packaging products. About 22% (140, 585 t) of the total volumes of plastics used in packaging was recycled in 2004. Around 82% of PET and 62% of HDPE recyclate is reprocessed within Australia and 18% and 38% respectively is sent overseas87.
Sustainable development and the management of climate change are elements of the Australian government’s management of energy resources88. The primary focus is on how the energy sector will respond to a carbon constrained economy. Other sustainability issues of relevance to the energy sector include water, waste and air quality management.
Water
Demand for water in Australia is growing (Australian State of the Environment Committee 2006). The agricultural sector is by far the greatest user of water, at about 67% with urban and industrial use at about 9%. Some important river and aquifer systems are over-allocated. In order to limit the growth in agricultural water use to sustainable levels, entitlements to water in the Murray Darling Basin have been capped. Under the National Water Initiative governments have agreed to manage overused river systems by placing limits on water use89.
Sustainable yields and extraction caps on urban water supplied to metropolitan areas have been a priority in most states over recent years. Supply augmentation and demand management initiatives are being widely progressed. Reductions in water consumption by the packaging industries would allow a reallocation of water to other industries and / or delay investment in additional water supply initiatives.
A3.2 Greenhouse gas emissions
This section examines the likely order of magnitude of upstream greenhouse emissions from current consumption of packaging, the savings in emissions implied by current levels of recycling and the significance of the residual emissions from packaging. It also examines the quantity and significance of downstream emissions. The management framework being developed for managing greenhouse gas emissions in Australia is also discussed.
A3.2.1 Upstream greenhouse gas emissions
Perchards 2008 estimated that greenhouse emissions from domestic packaging in Australia were around 3.7 Mt CO2-eq. or less than 0.7% of total Australian emissions. The project team
86 Information obtained from www.sita.com.au/media/21643/plastic.pdf, accessed 25 October 2008. 87 Derived from Hyder 2008 88 Information sourced from www.ret.gov.au, 2 October 2008. 89 Information sourced from www.nwc.gov.au, accessed 18 September 2008.

Beverage Container Investigation 28 April 2010
BDA Group and Wright Corporate Strategy 169
has also developed direct estimates of greenhouse emissions if all packaging consumed in Australia was produced with virgin materials for comparative purposes using the data described in Appendix 2. The total estimated through this method is 5.9 Mt CO2-eq. (or around 1% of total Australian emissions).
Estimates of the savings implied from current recycling of packaging materials are shown in Table 3.8, comparing estimates derived from Hyder 2008 with those from Perchards 2008.
Table 3.8: Implied savings in greenhouse emissions from recycling packaging materials
Greenhouse savings
Savings from all recycling Hyder
20081
(tonnes CO2e)
% related to packaging2
Greenhouse savings for
packaging derived from Hyder 20083
(tonnes CO2e)
Comparison with greenhouse
savings - Perchards 2008
(tonnes CO2e)
Paper / cardboard
1,215,448 65% 790,000 688,000
Glass 524,064 71% 370,000 144,000
Ferrous 2,107,031 1% 21,000 28,000
Aluminium 4,933,503 10% 485,000 520,000
Plastics 62,972 100% 63,000 108,000
Total 1,729,000 1,488,000
Notes: Emission estimates rounded to nearest thousand t CO2-e. Sources: 1. Hyder 2008 2. This % has been derived by taking the quantity of each packaging material recycled in 2006 (from
the NPCC) as a proportion of the total recycling of that material in 2006 (from Hyder 2008). 3. Note that Hyder 2008 includes all life cycle impacts (not just upstream impacts).
A3.2.2 Likely significance of upstream greenhouse emissions
As discussed in Appendix 2 life cycle analyses typically assume that the production of goods from recyclate will displace the extraction and use of a similar quantity of virgin materials (ie: 1:1 substitution after taking into account material losses etc). However, the implied savings in greenhouse emissions identified in section A.3.2.1 would be lower if the supply of competitively priced recyclate also generates a ‘consumption effect’, increasing resource consumption and greenhouse emissions.
If recycling did provide the 1:1 substitution, the remaining impacts from packaging consumption in Australia may be in the order of 2 – 4 Mt CO2 equivalent per annum or around 0.4% - 0.8% of total greenhouse emissions. The savings possible from additional packaging recycling (after

Beverage Container Investigation 28 April 2010
BDA Group and Wright Corporate Strategy 170
accounting for contamination losses) would be around 0.89 Mt CO2 equivalent per annum or 0.17% of total Australian emissions (using the midpoint of estimates shown in this section).
Warnken ISE (2007) also estimate the level of greenhouse gas abatement possible from increasing resource recovery in Australia. They estimate that an additional 3 million tonnes of dry recyclables could deliver greenhouse abatement of around 11 million tonnes CO2 equivalent per annum. Applying the Warnken estimates of abatement per tonne to our data on additional packaging recycling possible (after accounting for contamination losses) provides savings of around 3.6 Mt CO2 equivalent per annum – much higher than our estimates above of less than 1 Mt CO2 equivalent per annum. This equates to 0.68% of total Australian emissions. The Warnken report highlights that their estimates of greenhouse savings per tonne of recycled material are much higher than those in the NSW DECC calculator and suggest the use of the NSW DECC estimates as a lower bound and the Warnken estimates as an indication of potential savings. The Warnken estimates are reported here to provide a comparison.
A3.2.3 Downstream greenhouse gas emissions
Landfilling of waste produces methane and carbon dioxide as anaerobic decomposition breaks down part of the organic content in the waste. The waste sector contributes 16.6 million tonnes of carbon dioxide equivalent, which represents about 3% of the total emissions in Australia (Department of Climate Change 2006b). Packaging waste represents about 23% of total solid waste produced in Australia90, however landfilling of many packaging waste materials does not produce greenhouse gases (eg; glass, aluminium and plastics).
The main material of concern is paper / cardboard. In 2007 around 920,000 tonnes of packaging paper / cardboard was landfilled. Recent data from the landfill division of the Waste Management Association of Australia suggests that around 42% of waste sent to landfill in Australia is subject to gas capture and a gas collection efficiency of around 60%91. Using these assumptions and the Technical Guidelines for the Estimation of Greenhouse Emissions and Energy at Facility Level for waste sectors published by the Department of Climate Change in 2007, this would result in around 1.7 million tonnes of CO2-e per annum. This represents around 10% of total emissions from landfills and 0.3% of total emissions from all sources.
Total Environment Centre has highlighted that deterioration of gas capture systems and delays in the decomposition of waste materials at landfills mean that the theoretical maximum capture rates of gas collection systems will fall over time. They argue that even with a 75% collection 90 Total solid waste figures for 2002/3 from
www.environment.gov.au/soe/2006/publications/drs/indicator/346/index.htm, accessed 12 September 2008. Packaging waste figures obtained from National Packaging Covenant for 2005.
91 WMAA Landfill Division response to Discussion Paper on a Possible Design for a National Greenhouse Gas Emissions Trading Scheme, National Emissions Trading Taskforce, August 2006 at www.emissionstrading.nsw.gov.au/ __data/assets/pdf_file/0014/5342/WMAA_-_National_LandfillDivision.pdf

Beverage Container Investigation 28 April 2010
BDA Group and Wright Corporate Strategy 171
efficiency the whole of life capture would be around 55% (TEC 2007). Reducing the effectiveness of the gas capture assumptions above by a similar proportion would increase greenhouse emissions from landfills due to paper / cardboard to around 11.5% of total emissions from landfills and 0.35% of emissions from all sources.
A3.2.4 Greenhouse gas management framework
In order to manage greenhouse gas emissions the Australian Government has committed to introducing a national Carbon Pollution Reduction Scheme, to commence in 2010. The scheme will operate as a “cap and trade” system, that is, an overall environmental cap will be set, permits to emit will be established and those permits will be able to be traded. The principle is to ensure the most comprehensive coverage possible, to the extent that is practical92. At this stage it is proposed that the scheme will cover stationary energy, transport, fugitive emissions, industrial processes, waste and forestry sectors, and all six greenhouse gases counted under the Kyoto Protocol. There is currently a public process underway to develop the details of how the scheme will operate, including the coverage of sectors, and to set the overall cap on emissions.
Upstream impacts from manufacturing of packaging materials are likely to be covered under the proposed carbon pollution trading scheme through direct obligations on large emitters. There is some debate about the impact on recycling of proposed free permits to trade-exposed industries (including paper and packaging) but not to competing recycling industries (Boomerang Alliance 2008).
Downstream impacts from landfilling of packaging materials would also be addressed directly if the waste sector is covered by the scheme. If landfills were excluded they may be able to participate voluntarily by providing offsets to sectors that are covered directly. However, their exclusion would strengthen the case for complementary measures to manage this impact.
A3.3 Air and water pollution
This section examines the likely order of magnitude of upstream air and water emissions from current consumption of packaging, the savings in emissions implied by current levels of recycling and the significance of the residual emissions from packaging. It also examines the quantity and significance of downstream air and water emissions. The management framework for managing air and water pollution in Australia is also discussed.
92 Information sourced from www.climatechange.gov.au, accessed 18 September 2008.

Beverage Container Investigation 28 April 2010
BDA Group and Wright Corporate Strategy 172
A3.3.1 Upstream air and water pollution
Grant et al 2001 examine the life cycle benefits of kerbside recycling including the upstream impact of recycling activities on smog precursors in the Victorian context. Table 3.9 shows the upstream benefit for smog precursors for different materials.
Table 3.9 Reduction in smog precursors per tonne of recycling
Recyclate Savings in smog precursors per tonne of recyclate
(grams of C2H4 eq.)
Paper -25
Glass -120
Steel 770
Aluminium 140
HDPE 9,230
PET 2,470
Source: Grant et al 2001
Applying the estimates of savings in smog precursors per tonne to our data on additional packaging recycling possible (after accounting for contamination losses) provides total potential savings of around 1,900 tonnes per annum of C2H4 equivalent (assuming 50% of additional plastics recovery is HDPE and PET). The bulk of these benefits accrue from recycling of plastics. Without plastics in the mix, there would be a net increase in smog precursors primarily as a result of emissions associated with reprocessing glass.
The project team has also developed estimates of key air and water emissions if all packaging consumed in Australia was produced with virgin materials using the LCA data described in Appendix 2. Table 3.10 summarises the likely order of magnitude of pollutant loads.

Beverage Container Investigation 28 April 2010
BDA Group and Wright Corporate Strategy 173
Table 3.10: Other emissions from packaging consumption in Australia
Pollutant Emissions with virgin material production (tonnes)
Net change implied from current recycling
Nitrogen oxides to air 21,000 -3,900
Particulates to air 6,000 -2,300
Organic matter to water 33,000 -9,300
Suspended solids to water 1,600 -500
Notes: 1. Data on consumption of packaging materials from National Packaging Covenant Council for 2006. 2. Estimates of emissions for key packaging containers have been drawn primarily from the Life Cycle
Analysis Australian Data Inventory Project April 1999 by RMIT and the Cooperative Research Centre for Waste Management and Pollution Control. The emissions estimates cover those associated with extraction of raw materials, primary processing and manufacturing (up to the factory gate).
3. Assumes containers in LCA study above are representative of order of magnitude of emissions for all packaging materials.
4. All pollution emissions assumed to be in Australia. Estimates rounded to nearest 100 tonnes.
An indicative assessment of the potential for further reductions in key air and water pollutants through increased recycling of packaging has been developed using the estimates of current packaging recovery and likely levels of packaging remaining to be recovered in 2010 from Table 3.6. The analysis suggests the following reductions may be possible through further recovery and recycling:
• 2,600 tonnes of nitrogen oxides
• 1,500 tonnes of particulates
• 6,200 tonnes of organic matter
• 300 tonnes of suspended solids
Hyder 2008 estimate the water pollutant load savings from recycling in Australia using a toxicity equivalence factor expressed as 1,4 dichlorobenzene equivalents. However, these are difficult to compare to the load figures as their impact depends on the context.
Perchards 2008 note that 56 packaging manufacturers and converting facilities reported 24 different toxic substances to the NPI in 2005/06. All were ranked as low emitters except O-I’s Adelaide glass plant which had the highest emissions of organo-tin in Australia.
A3.3.2 Likely significance of upstream air and water pollution
The contribution of packaging production to total loads of nitrogen oxides and particulates in Australia is estimated at around 1.2% and 0.3% respectively (derived from the LCA estimates Table 3.10 and total emissions from the National Pollutant Inventory). Further potential

Beverage Container Investigation 28 April 2010
BDA Group and Wright Corporate Strategy 174
reductions from increasing recycling of packaging represent 0.2% and 0.1% of total emissions respectively.
For comparative purposes estimates of the contribution of packaging production to air pollution have also been developed directly from the National Pollutant Inventory93. While there is no single category that would contain all beverage and packaging manufacturing or waste treatment a number of ANZSIC industry sectors have substantial packaging production components.
The sectors used for estimates of air and water pollution from the NPI are:
• Pulp, paper and paperboard manufacturing (2331) includes manufacturing of cardboard, newsprint, paper, paper pulp, paperboard, solid fibreboard sheets and wood pulp.
• The plastic blow moulded product manufacturing sector (2561) was included but did not generate any emissions according to the NPI. The primary activities in this sector are the manufacture of plastic bottles and other plastic products.
• Glass and glass products manufacturing sector (2610) includes the manufacture of bottles and containers but also includes the production of domestic glassware, glass sheets, laminated sheet glass, mirrors, optical glass, window, windscreen and scientific glass.
• The following ANZSIC groups have been included in the waste sector classification: waste treatment, disposal and remediation sector (292), waste collection services (291) and landfill (diffuse sources).
The figures derived below need to be treated as order of magnitude estimates only because each of the ANZSIC groups used include some production unrelated to beverage or packaging production or waste management. The indicative contributions for some key air pollutants are:
• Nitrogen oxide emissions to air (NOx) – in 2006/7 around 0.6% of total Australian emissions may be attributed to the beverage container and packaging production sector. The contribution from the waste sector (defined as waste treatment, disposal and remediation) was less than 0.1%.
• Fine particulate emissions to air (PM10) – in 2006/7 around 0.1% of total Australian emissions may be attributed to the production of beverage containers/packaging materials. The contribution from the waste sector (defined as waste treatment, disposal and remediation) was less than 0.1%.
• Emissions of volatile organic compounds to air – in 2006/7 around 0.1% of total Australian emissions may be attributed to the production of beverage containers/packaging materials. The contribution from the waste sector (which included waste treatment,
93 Information obtained from on-line searches of the National Pollutant Inventory, accessed 16 September 2008.

Beverage Container Investigation 28 April 2010
BDA Group and Wright Corporate Strategy 175
disposal and remediation, landfilling and solid waste collection) was about three times as much as the beverage and packaging production sector.
There are no estimates available from the National Pollutant Inventory for the total discharges of organic matter or suspended solids. However, the NSW State of the Environment Report for 2006 reported total suspended solids discharged from licensed sources to NSW inland, estuarine and marine waters at 62,250 tonnes in 2004. The reductions that may be possible from increased recycling of packaging are around 0.5% of this NSW figure.
A3.3.3 Downstream air and water pollution
Landfilling waste creates potential for small amounts of air pollutants such as benzene, H2S, mercury, NOx, PM10, SO2 and VOCs. Leachate is also generated when soluble components of the waste stream are transported through water. Leachate can enter groundwater potentially resulting in environmental and / or health issues, particularly if it enters the food chain. In Australia, 70% of waste disposed to landfill is managed to best practice94.
Around 170 waste treatment and disposal facilities in Australia are required to report on emissions to the National Pollutant Inventory. Table 3.11 provides estimated emissions for some key pollutants. Note that the emissions relate to treatment and disposal of all wastes – not just packaging wastes.
94 Ibid

Beverage Container Investigation 28 April 2010
BDA Group and Wright Corporate Strategy 176
Table 3.11: Emissions from Australian waste treatment and disposal facilities
Substance Emissions to air (kg/yr) Emissions to land / water (kg/yr)
Ammonia 1,500 362,000
Benzene 7,600 57
Chlorine 1,800 881,500
Hydrogen sulfide 17,000 0.46
Mercury 250 0.93
NOx 330,000 -
Particulate matter 160,000 -
Sulfur dioxide 42,000 -
VOCs 1,100,000 -
Zinc 240 1,100
Source: NPI database accessed October 2008 for Waste Treatment and Disposal Services
It is also relevant to note here that these estimates based on the potential impacts of pollution without any risk adjustment for the expected impact. Broader environmental regulations are used to ensure toxic pollutants do not impose actual harm on the community.
A3.3.4 Air and water pollution management framework
This section briefly discusses the management frameworks in place for air and water pollution in Australia
Air pollution management
Air pollution is managed by both the Commonwealth and States. National air quality standards which set ambient concentration limits for six air pollutants, through a National Environment Protection Measure (NEPM) have been established (see Table 2.12). Ambient concentrations of carbon monoxide, sulphur dioxide, nitrogen dioxide, and lead are generally below NEPM levels (OECD 2008). The regulatory framework has been further strengthened through an advisory reporting standard on fine particulates.
Vehicle emission standards have also been in place since the early 1970s, and a voluntary agreement has been concluded to raise fuel efficiency standards by 2010 (OECD 2008). Fuel quality standards for sulphur and benzene content have been tightened (OECD 2008). Australian Design Rules for motor vehicles are also used (Australian State of the Environment Committee 2006).

Beverage Container Investigation 28 April 2010
BDA Group and Wright Corporate Strategy 177
Table 3.12: Performance against ambient air quality standards
Pollutant Averaging period
Maximum ambient
concentration
Goal (maximum allowable
exceedence)
Performance
Carbon monoxide
8 hours 9.0ppm 1 day a year Met in all cities in Australia
Nitrogen dioxide
1 hour
1 year
0.12ppm
0.03ppm
1 day a year
None
Met in all urban areas
Photochemical oxidants (as ozone)
1 hour
4 hours
0.10ppm
0.08ppm
1 day a year
1 day a year
Not met in some urban areas, particularly Sydney
Sulfur dioxide 1 hour
1 day
1 year
0.20ppm
0.08ppm
0.02ppm
1 day per year
1 day per year
None
Met in urban areas
Not met in some limited rural areas
Lead 1 year 0.50 µg/m3 None Met in urban areas
Not met in some limited rural areas
Particulates (PM10)
1 day 50 µg/m3 5 days a year Dust and fine particulates are a problem in some areas
Source: Australian State of the Environment Committee 2006 and DEWHA web site, www.environment.gov.au/atmosphere/airquality/standards.html, accessed 2 October 2008.
Australian states also have well defined standards and goals, strategies and regulatory frameworks to protect both regional and local air quality. For example, NSW has a 25 year air quality management plan in place which targets photochemical smog and particulate pollution95. Policies are focused on achieving the air quality standards which were established under the NEPM.
Air quality in urban and regional areas in most cases is meeting national standards (Australian State of the Environment Committee 2006). However, in certain areas, ambient concentrations of fine particulates and ozone exceed the allowable national limits, with the worst examples arising from events such as bushfires. Adjacent to some specific smelters and power plants, air pollution hotspots pose serious local health risks (OECD 2008). Energy-related emissions of a 95 Information obtained from www.environment.nsw.gov.au/air/actionforair/actionforair-06.htm, accessed 18
September 2008.
Beverage Container Investigation 28 April 2010
BDA Group and Wright Corporate Strategy 178
number of air pollutants, including greenhouse gases have continued to grow with GDP. Emissions intensities (i.e. emissions per unit of GDP) of SOx, NOx and CO2 are the highest, or among the highest, in the OECD (OECD 2008).
The controls on carbon monoxide, nitrogen oxide and volatile organic compounds through fuel quality standards indicate that total motor vehicle emissions in 2020 will probably be below those of 2006, but this is unlikely to be the case with total particulate matter emissions (Australian State of the Environment Committee 2006).
The policy reforms introduced over the past decade or so have established the sustainable loads through air and fuel quality standards and governments are now operating within this agreed framework. Ambient air quality standards established under the NEPM are being met to a large extent, with the only on-going air quality issues based on a number of hot spot locations.
Water pollution management
At the national level, the National Water Quality Management Strategy (NWQMS), the National Action Plan for Salinity and Water Quality and Natural Heritage Trust all contain elements that seek to manage water quality. The primary process under the NWQMS is the establishment of catchment management plans, which set out the policies for management at the local and regional level. The plans set out goals, objectives, guidelines and standards96.
The continued urban expansion of Australia’s coastline has placed pressures on coastal water quality, with nutrients, chemicals and sediments entering the sea from urban developments (as well as agricultural catchments). The Coastal Catchments Initiative was established by governments to tackle this issue, with the objective of achieving significant reductions in the discharge of pollutants to water quality hotspots97. Water quality improvement plans developed under the initiative include load reductions to be achieved under the plan and the setting of maximum loads of pollutants for point and diffuse sources.
Water quality management is a component of local landfill management. Large, modern landfills are required to install liners and systems to collect and store leachate (Productivity Commission 2006). For example, in Tasmania landfills must be designed to contain leachate over the time that the waste poses a risk to protected environmental values for groundwater (Productivity Commission 2006). There is still a risk that groundwater will be contaminated and if it does become so, there is very little chance of water quality being restored. In an effort to reduce the risks of groundwater contamination even further, in Victoria there is an additional requirement for landfills to be sited two metres above the groundwater table.
96 Information obtained from www.mincos.gov.au/__data/assets/pdf_file/0012/316101/nwqmsdoc1.pdf, accessed
18 September 2008. 97 Information obtained from www.environment.gov.au/coasts/pollution/cci/index.html, accessed 18 September
2008.

Beverage Container Investigation 28 April 2010
BDA Group and Wright Corporate Strategy 179
A3.4 Landfill amenity / alienation impacts
This section discusses landfill amenity and alienation impacts which packaging wastes may contribute to.
A3.4.1 Landfill amenity impacts
Landfills can result in negative impacts to those people who live near them, including impacts of noise, odour, vermin, dust and litter. These amenity impacts are local in natural and will be specific to characteristics of the landfill including how close it is to residential areas, the population densities in those areas, the average waste input to the site, the type of waste and the management of the landfill (including whether buffer zones are required). Recycling of materials will also cause some disamenity impacts so it is important to understand these in order to determine the net disamenity impacts of landfilling versus recycling.
State governments regulate landfills through a mix of licensing and generic regulations. Regulatory requirements include measures to minimise the impact of landfills on amenity, for example relating to vehicle traffic, visual aspects, odour, litter and dust.
As there is no meaningful physical measure for disamenity, a likely valuation of the impact is reported here. Disamenity impacts are often valued by studying the way in which house prices close to landfill sites are affected. The Productivity Commission (2006) reviewed a number of studies and concluded that the external disamenity costs of Australian landfills could range from $0 to $24/tonne of waste. The Commission concluded that the average cost for a properly located, engineering and well managed site would be less than $1.00/tonne.
A3.4.2 Landfill land alienation impacts
Prices in land markets are generally accepted as a reasonable reflection of the economic scarcity or opportunity value of land. However, some argue that the long term legacy of landfills in limiting future uses of land and potential future environmental problems is a sustainability issue (ie: involving intergenerational equity considerations) that may not be fully captured in land prices.
Landfilling can limit the subsequent uses of land and pose a threat to groundwater. Because of this, suitable virgin land is limited in some regions (such in and around the Perth metropolitan area).
However often landfills are created in voids created by other activities (such as mines). In these cases the land is disturbed by the previous activity rather than the landfill and it can result in beneficial rehabilitation of orphaned sites (eg: Woodlawn). There is no data available on the area of land used for landfilling in Australia (although this data will be collected in the future for the State of the Environment report). However, it is likely to be a small proportion of available land area.

Beverage Container Investigation 28 April 2010
BDA Group and Wright Corporate Strategy 180
While state government objectives for landfill management may vary slightly, they all have the goal of ensuring long term environmental impacts post closure are acceptable (Productivity Commission 2006).
A range of policy requirements have been introduced by state governments to meet this objective and they include the rehabilitation practices, restriction on use of the land, landfill caps and environmental monitoring and management (Productivity Commission 2006). In most states and territories legislation requires that landfill operators provide upfront financial assurances. These can be used for two purposes, the first is for known costs such as remediation of the site and the second is for unknown but possible eventualities, such as the remediation of the consequences of pollution. Whether this is an effective approach depends on whether these financial assurances are set at an appropriate level to cover both types of costs. In the US analysis has demonstrated that in some cases the post closure period and liabilities were underestimated (Productivity Commission 2006).
There have been some instances of alienation of landfills, for example the recent methane issues at the closed landfill in Cranbourne in Melbourne. However, the Productivity Commission recently concluded that although landfill regulation varies from jurisdiction to jurisdiction, in the main, it now appears that modern, fully-compliant landfills in Australia are effectively dealing with waste disposal externalities (Productivity Commission 2006).

Beverage Container Investigation 28 April 2010
BDA Group and Wright Corporate Strategy 181
APPENDIX 4: Impacts associated with litter
Litter is waste that is improperly disposed of in the environment, whether deliberately, negligently or accidentally. It excludes material ‘illegally dumped’, that is, material transported specifically to a site for the purpose of disposal.
Many commentators who have reviewed available litter data from a number of sources have concluded that no one dataset is representative of all litter streams, but from those available, the Keep Australia Beautiful (KAB) visible litter count surveys are the most comprehensive and provide longitudinal litter count data (see for example Nolan-ITU 200298).
KAB National Litter Index counts are conducted in November and May each year, and following expansion to the ACT and Northern Territory now cover 983 sites. Each count records all items of litter present, and illegal dumping is quoted separately. Sites surveyed within the research program are sampled primarily from urban and near-urban areas (that is, generally within 50km of the urban areas surrounding each state capital). These sites are divided into eight site types - beaches, car parks, highways, industrial, recreational parks, residential, retail and shopping centres. All sites have been selected to be ‘typical’ for that site category, and are not varied from count to count. Each site has been measured to determine its area, and final data is provided against a standardized 1,000 square metre area to allow comparisons between states99.
Notably, the National Litter Index is intended only as an assessment of the presence of litter objects within surveyed regions. No corrections for population densities or other demographic factors are carried out. The information therefore provides no indication of whether residents of a particular region litter more or less frequently than those in a different region100.
4.1 General incidence of litter
Littering recorded by recent KAB counts is shown in Table 4.1. There is significant variability in the counts from year to year, although some states such as SA have consistently performed better than the national average while NSW has performed worse.
The litter counts are dominated by cigarette butts, which represent almost half the items found. However on a volume basis, as shown in Figure 4.1, plastic and paperboard dominate.
98 Nolan-ITU (2002), Western Australian Local Government Association Litter Management Options in Western
Australia 99 KAB 2008, National Litter Index Annual Report 2007/08 100 ibid

Beverage Container Investigation 28 April 2010
BDA Group and Wright Corporate Strategy 182
Table 4.1: Litter counts by state
Items per 1,000m2 Volume (litres) per 1,000m2
2005 / 06 2006 / 07 2007 / 08 2005 / 06 2006 / 07 2007 / 08
National 70 74 68 8.86 9.68 8.58
ACT - 68 56 - 7.04 6.06
NSW 80 71 77 14.95 14.69 11.90
NT - 64 60 - 5.32 7.24
QLD 89 86 76 7.66 7.59 7.44
SA 60 61 68 7.23 11.08 9.55
TAS 59 70 61 5.15 6.68 5.90
VIC 71 80 48 7.87 7.74 4.19 WA 60 83 85 8.57 12.19 13.06
Source: KAB 2008, page 2
Figure 4.1: Contribution of main material types in national litter
Items and Volume per 1000 Square Metres by Main Material Type - NATIONAL - 2006/ 2007
CIGARETTE BUTTS
GLASS
METAL
PAPER/ PAPERBOARD
PLASTIC
0.0
0.5
1.0
1.5
2.0
2.5
3.0
0 5 10 15 20 25 30 35
Items
Vol
ume
- Litr
es
Source: KAB 2008, page 25
Despite seasonal fluctuations in the absolute numbers of items identified, the proportional contributions of items within main material types, and representations of the material categories within the litter stream, do not show significant annual fluctuations (KAB 2008).

Beverage Container Investigation 28 April 2010
BDA Group and Wright Corporate Strategy 183
4.2 Beverage container litter
Disaggregated KAB data can be used to identify the contribution of beverage containers to total litter. The number of beverage containers to total litter identified by KAB from 2005 to 2008 is shown in Figure 4.2. Note that the ACT and NT were not included in the 2005 and 2006 counts.
Beverage containers identified in the 2007 and 2008 KAB counts have represented 10 and 12% of total litter at the national level, down from 15-17% in the previous two years. However significant variation between the states and territories can be seen, with beverage container litter representing only some 5% of total litter in SA in 2008, compared with over 20% in WA and TAS in the same year.
Figure 4.2: Beverage container contribution to total litter (by count)*
0%
5%
10%
15%
20%
25%
National Qld NSW SA VIC WA ACT TAS NT
2005 (Nov) 2006 (May) 2007 (Nov) 2008 (May)
Source: KAB * Excluding cigarette butts and illegal dumping

Beverage Container Investigation 28 April 2010
BDA Group and Wright Corporate Strategy 184
Figure 4.3: Beverage container contribution to total litter (by volume)*
0%
20%
40%
60%
80%
100%
Glass Metals Plastics Paperboard All litter
4.3 Impacts from littering
Littering can impose costs on the community via:101
• danger to wildlife
• danger to human health
• loss of aesthetic value
• the costs of litter clean-up
The impact of littering on wildlife has been raised by several commentators such as the Boomerang Alliance. Information on impacts is anecdotal in nature, and overall impacts are likely to be relatively small compared to other pressures such as from the loss of habitat, feral animals, road kill, and so on.
The potential reduction in glass in the litter stream from any new beverage container management policies is of particular interest, as this material contributes significantly to glass cutting injuries. Figure 4.4 provides KAB litter count data which indicates that glass from beverage containers (and largely those included in the SA container deposit scheme) represented around half the glass identified in the litter stream nationally in 2008.
101 Productivity Commission 2006

Beverage Container Investigation 28 April 2010
BDA Group and Wright Corporate Strategy 185
Figure 4.4: Source of glass litter by state (2008)
0%
20%
40%
60%
80%
100%
National Qld NSW SA VIC WA ACT TAS NT
CDS Other beverage Non-beverage
The removal of beverage containers from the litter stream could be expected to reduce the incidence of injury associated with broken glass, particularly at beaches and other outdoor settings. The Boomerang Alliance for example cite a US study which claims outdoor glass related injuries to children treated at a children’s hospital in Boston dropped by 60% in the year after CDs was introduced, while other childhood injuries remained steady.
Injuries requiring hospitalisation
Watson and Ozanne-Smith (1997)102 from the Accident Research Centre, Monash University estimated using Victorian data from 1993/94 unintentional cutting injuries leading to hospitalisation was in the order of 75 / 100,000.
Cassell and Clapperton (2005)103 using more recent Victorian data were able to narrow down the cause of injuries, estimating unintentional cutting injuries from sharp glass leading to hospitalisation was in the order of 25 / 100,000. This accords with an estimate by Berry and Harrison (2007)104 who estimated that nationally, there were 5,383 unintentional injuries from contact with sharp glass in 2003-04 requiring hospitalisation, or 27 / 100,000 of the population.
102 Watson and Ozanne-Smith (1997), The cost of injury to Victoria, Accident research Centre, Monash
University, Report No 124, December 103 Cassell and Clapperton (2005), Injury profile, Victoria 2002, Victorian Injury Surveillance and Applied
Research, Accident Research Centre, Monash University 104 Berry and Harrison (2007), Hospital separations due to injury and poisoning, Australia 2003-04, Injury
Research and Statistics Series No 30, Australian Institute of Health and Welfare, Flinders University, Adelaide

Beverage Container Investigation 28 April 2010
BDA Group and Wright Corporate Strategy 186
More recently, Watson and Ozanne-Smith (2006)105, have estimated the incidence of unintentional cutting injuries leading to hospitalisation arising from incidents involving consumer products. Their category 2 injuries – product proximity related – ‘involves cases in which the person was injured by falling over or against a manufactured object or architectural fixture…’. Based on their findings, unintentional cutting injuries from consumer product related causes could be put in the order of 23 / 100,000. However as identified by Clark, et al (2002)106, over half of unintentional cutting injuries presenting to hospital emergency departments occur in the home, only 20% of these are due to glass injury, and of this only 9% are from bottles and jars. And most bottle and jar injuries in the home context are likely to be associated with product use rather than disposal.
From the available data, the extent of unintentional cutting injuries requiring hospitalisation that could be attributable to injuries arising from broken containers each year appears < 1 / 100,000.
Injuries requiring non-hospitalisation medical treatment
Watson and Ozanne-Smith (1997) estimated unintentional cutting injuries leading to non-hospitalisation medical treatment such as at a hospital emergency department or general practitioner was in the order of 918 / 100,000.
Watson and Ozanne-Smith (2006), estimated that 25% of unintentional cutting injuries leading to non-hospitalisation arose from incidents involving consumer products. Based on the Watson and Ozanne-Smith (1997) incidence of unintentional cutting injuries, this equates to some 229 / 100,000.
As indicated earlier, Clark, et al (2002) found that less than 1% of cutting injuries presenting to hospital emergency departments could be attributable to glass bottles and jars in the home context. Other locations of unintentional cutting injuries include at work (21%), sport and recreation (5%), and transport (2%).
The extent of glass container injuries away from home requiring non-hospitalisation medical treatment may however also not be high. For example, Staines and Ozanne-Smith (2002)107 estimate that the annual incidence of beach related cutting injuries presenting to hospital emergency departments in Victoria between 1995 to 2001 attributable to glass and shells was only 0.1 / 100,000 population.
105 Watson and Ozanne-Smith (2006), Consumer product-related injuries in Australia: hospital and medical costs
to Government, Accident Research Centre, Monash University, Report No 83 106 Clark, Cassell, Ashby and Sherrard (2002), Unintentional cutting and piercing injury in the home, Hazard No
52, Victorian Injury Surveillance and Applied Research, Accident research Centre, Monash University 107 Staines and Ozanne-Smith (2002), Feasibility of identifying family friendly beaches along Victoria’s coastline,
Accident Research Centre, Monash University

Beverage Container Investigation 28 April 2010
BDA Group and Wright Corporate Strategy 187
In the absence of more specific data, we conservatively assume 20% of away from home unintentional cutting injuries leading to non-hospitalisation arise from glass bottles and jars. With home based injuries this equates to 24 / 100,000 population.
Injuries requiring only home-based medical treatment
The ABS National Health Survey 2004-05108 reports 18.4% of respondents sustained injuries where medical attention (including home-based treatment such as a band-aid) was required over the 4 weeks prior to the survey. Cuts from tools and implements are separately reported but not cuts from broken glass, which fall into the ‘other’ injury category which represented 3.1% of reported injuries. If only 10% of the ‘other’ injuries were due to broken glass, this would still represent some 159 incidents per 100,000 population annually. In the absence of more specific data this level of injury is postulated as an ‘order-of-magnitude’ estimate.
A summary of estimated annual unintentional glass cutting injuries that could be attributable to broken containers is shown in Table 4.2.
Table 4.2: Annual unintentional glass cutting injuries attributable to broken containers
Injury type Assumed rate / 100,000 population
Estimated total Australian injuries 2008*
Injuries requiring hospitalisation 1 215
Injuries requiring non-hospitalisation medical treatment
24 5,150
Injuries requiring only home-based medical treatment
159 34,120
* Based on a population of 21,457,721 (Source: www.abs.gov.au, accessed 14/10/08)
4.4.1 Loss of aesthetic value
Little information on the amenity impact associated with beverage container litter is available. The community’s willingness-to-pay for reduced beverage container litter could be elicited through survey-based valuation techniques. These studies would need to separate out values associated with improved amenity and other litter related impacts as discussed above. Importantly, the values associated with improved amenity will be strongly influenced by the location of litter reductions.
The largest numbers of items per 1,000m2 in the KAB counts were located within retail sites, industrial sites and shopping Centres. Site characteristics which are evident include:
108 ABS (2006), National Health Survey 2004-05: Summary of Results, catalogue number 4364.0

Beverage Container Investigation 28 April 2010
BDA Group and Wright Corporate Strategy 188
• Industrial sites are associated with both large numbers of items as well as large estimated litter volume.
• Highway sites are associated with large volumes of litter but only moderate numbers of items.
• Retail sites are associated with large numbers of items but only small volumes of litter.
• Recreational Parks contribute both a small number of items and a low volume to the overall litter stream109.
Figure 4.5: Location of litter
Items and Volume per 1000 Square Metres by Site Type - NATIONAL - 2007/ 2008
SHOPPING CENTRE
RETAIL
RESIDENTIAL
RECREATIONAL PARK
INDUSTRIAL
HIGHWAY
CAR PARK
BEACH
0
2
4
6
8
10
12
14
16
18
20
0 20 40 60 80 100 120 140
Items
Vol
ume
- Litr
es
Source: KAB 2008, page 21
4.4.2 Clean-up costs
Nolan-ITU110 in 2002 undertook an investigation of the costs borne by key players in WA litter abatement, including Local Government, State Government and non-government organisations (NGOs) with a litter-related mandate. An estimate of funding allocated to litter abatement programs and clean up efforts in WA was calculated, and is reported in Table 4.3.
109 KAB 2008, page 20 110 Nolan-ITU (2002), Western Australian Local Government Association Litter Management Options in Western
Australia

Beverage Container Investigation 28 April 2010
BDA Group and Wright Corporate Strategy 189
Table 4.3: Litter management costs in WA in 2002/03
Stakeholder programs Estimated expenditure
State Government $1,891,620
Local Government $13,822,642
Industry $717,200
NGOs $35,000
Total $16,466,462
Nolan-ITU caution that the estimate of direct costs to managing litter in WA is conservative as ‘it does not take into account many other direct costs associated with litter management such as those incurred by special event organisers, shopping centres, transport authorities and National Parks to name a few’.
The majority of direct litter management costs identified were borne by Local Government. The average annual expenditure was calculated at just under $100,000 per year per Council, with the amount spent annually increasing in proportion to population size.
To guide judgements on the veracity of the estimates prepared, Nolan-ITU provide a comparison of Local Government expenditure on litter abatement made by them with a previous survey of Local Government expenditure on litter abatement conducted by McGregor Marketing in 1994 (McGregor, 1994). Between the two survey-based estimated, Nolan-ITU identified several significant methodological differences and differences in results across councils of different sizes. Nevertheless, the McGregor (1994) CPI adjusted Australian council average of $105,061 compares favourably with the Nolan-ITU estimate of $99,994.
As well as direct costs incurred by various groups, it has been estimated that the Australian community provided 2 to 3 million volunteer hours to KAB litter reduction programs each year111.
111 PC 2006, KESAB Environmental Solutions (sub. 20)

Beverage Container Investigation 28 April 2010
BDA Group and Wright Corporate Strategy 190
APPENDIX 5: Rationale behind option selection
This appendix provides background information on the rational for rejecting some options for further assessment.
5.1 Landfill bans
Preventing the disposal of targeted materials at landfills might be implemented via either/or both:
• voluntary refusal on the part of landfill operators to accept the materials, and/or
• regulatory intervention by way of landfill licence conditions.
Banning the disposal of specific materials at landfills through both mechanisms has been successfully implemented in a number of notable instances as indicated at Table 5.1.
In each of the instances noted above, the material targeted is relatively bulky or large, highly likely to be visually discovered as a vehicle presents at the weighbridge for inspection and payment of gate fees, and decidedly obvious when discharged from the vehicle. This high probability of discovery is an essential element in the banning process.
Table 5.1: Examples of implemented landfill bans
Basis of ban Examples
Regulatory Intervention
• Prevention of hazardous wastes being disposed to inappropriately licensed facilities.
• Prevention of liquid wastes being disposed to inappropriately licensed facilities.
• Elimination of co-disposal practices.
Voluntary Non-Acceptance
• Rejection of whole tyres.
• Rejection of bulk loads of polystyrene.
• Rejection of mattresses.
Recent landfill disposal audits in South Australia indicate that packaging wastes in the commercial and industrial (C&I) sector are relatively small in comparison with other non-packaging wastes (Zero Waste SA 2007). At Table 5.2, the eight most common materials despatched to transfer stations and landfills in Adelaide in the C&I waste stream are listed, and collectively represent over 75% of the total C&I waste stream audited.

Beverage Container Investigation 28 April 2010
BDA Group and Wright Corporate Strategy 191
Table 5.2: Predominant materials discarded in C&I waste in Adelaide
Material Percent1 Cumulative %
Food & kitchen 32.01% 32.01%
Paper2 8.67% 40.68%
Cardboard2 8.11% 48.79%
Wood & timber 7.94% 56.73%
Plastic bags & film2 6.42% 64.15%
Clean fill & soil 4.44% 68.59%
Vegetation & garden 4.59% 73.18%
Textiles 4.55% 77.73%
Source: ZWSA 2007. Notes: 1. These percentage results are after bags of garbage have been opened for audit of contents. 2. These streams will include packaging materials, but unlikely beverage containers
In the 2007 audit referenced, the following should be noted in respect of where beverage container packaging might present for disposal:
• the sum of all rigid plastics represented 3.54% of the audit,
• all glass materials represented 1.11%,
• all ferrous metals represented 1.05%, and
• all non-ferrous metals represented 0.71%.
In addition, it is also worthy noting that in the 2007 audits, the proportion of material delivered in closed garbage bags was 21%, which, if unopened would not permit for discovery of any included beverage container packaging materials.
From this data, packaging wastes would appear to represent a relatively small fraction of the total C&I waste stream presenting for disposal in Adelaide, and it is clear from the data that beverage container packaging will be unlikely to be included in the fractions of the waste stream listed in the eight most significant fractions that cover over 75% of all C&I waste disposed to landfill in metropolitan Adelaide.
On this basis, packaging materials and paper represent a relatively high proportion of the total amount of C&I waste disposed at landfill – perhaps upwards of 35% - but the discovery of beverage container packaging and enforcement of a ban on disposal of beverage container packaging would be challenging to implement and police given its dispersed nature in the C&I waste stream as presented for disposal.
This option was therefore not recommended for further investigation.

Beverage Container Investigation 28 April 2010
BDA Group and Wright Corporate Strategy 192
5.2 Intercepting waste before disposal
An alternative to landfill bans could be intercepting waste before it is dispatched to landfill and subjecting it to intermediate transfer and/or processing. This approach could apply equally to municipal wastes and wastes from the C&I sector and may be relevant either close to the point of generation of the waste or at a transfer and consolidation stage in the route to disposal.
As landfills become further removed from population centres, and as landfill tipping face practices evolve, opportunity for direct disposal of wastes from delivery vehicles right at the landfill tipping face are being reduced. With remote landfills, urban transfer stations allow for consolidation and transfer to bulk long-haul vehicles for delivery to the landfill. And, as vehicles are progressively prevented from direct discharge at the tipping face, internal transfer facilities are becoming common at many landfills.
These intermediate transfer stations represent an opportunity for discovery and recovery of targeted materials, including packaging wastes, prior to the discarded wastes being consolidated and transferred for disposal – provided garbage bags (representing some 21% in C&I waste in SA) have been opened.
In this regard, it is worth noting that an objective in South Australia is to eliminate all direct disposals to landfill and require all wastes to be transited through intermediate transfer or processing facilities (Zero Waste SA 2006).
Implementation of the intermediate interception of discarded wastes is likely to occur naturally, as near-urban landfills are closed and more distant landfills are utilised, or it may be introduced through regulatory intervention.
Policy intervention options near the point of waste generation are considered as part of the options for improving recycling at core consumption centres and workplaces. The ramifications of the gradual introduction of waste processing technologies for mixed residual waste streams is considered as a separate option involving technology intervention.
5.3 Education as an intervention option
Education, in the absence of enabling technologies and systems, is unlikely to be considered as an appropriate intervention policy. However, education, awareness raising and on-going reinforcement are essential elements of intervention policies where enabling technologies and systems are available.
Therefore, education as a standalone intervention policy has not been assessed – rather the education, awareness raising and on-going reinforcement initiatives required of each of the other policy options will be considered along with the discrete policy intervention option.
5.4 Product charge

Beverage Container Investigation 28 April 2010
BDA Group and Wright Corporate Strategy 193
A product charge is similar to the ADF and voluntary industry levy discussed separately as other options. The main difference is that there is no hypothecation of revenues for resource recovery or litter programs with the product charge. Therefore a reduction in consumption of the product(s) is needed to drive a reduction in packaging waste to landfill.
The success of a product charge depends entirely on the price responsiveness of demand for the product. Unless product demand was very responsive (‘elastic’), then a high product charge would be needed to reduce consumption of the product and associated packaging. The economic and financial impact of this option would therefore be significant to achieve a reasonable outcome in terms of a reduction in packaging waste to landfill.
Product charges would impose higher costs on consumers than similar options to achieve an equivalent litter or resource recovery outcome. It is also unlikely to receive support from stakeholders without hypothecation of the revenues to resource recovery or litter programs.
5.5 Improved national packaging covenant
The National Packaging Covenant is the voluntary component of a co-regulatory arrangement for managing the environmental impacts of consumer packaging in Australia through better design and production processes and to facilitate the re-use and recycling of used packaging materials. It is an agreement based on the principles of shared responsibility through product stewardship, between key stakeholders in the packaging supply chain and all spheres of government.
In the 2005 to 2010 Covenant, the signatories recognised that over recent years there had been significant growth in the consumption of packaging in the ‘Away from home’ sector in locations such as:
• businesses and workplaces including commercial, industrial and government premises,
• shopping centres,
• institutions, and
• event venues etc.
This away from home consumption of packaging is considered to provide a major opportunity to increase recovery of packaging for recycling. 112
To assist the Covenant’s capacity to deliver on this goal, the Covenant has been broadened to include the expansion of recovery systems and re-use of consumer packaging and paper to include material generated away from home and in workplaces as well as in the home.
Substantial increases in recovery of post consumer packaging can only come through a substantial expansion in away from home collection infrastructure. Collection and recycling 112 The National Packaging Covenant 2005 to 2010

Beverage Container Investigation 28 April 2010
BDA Group and Wright Corporate Strategy 194
systems will need to be established and expanded in high traffic areas. High volume opportunities will also need to be identified in commercial offices, government buildings, parks and gardens and strip shopping areas.
Given that it is intended that the away from home sector will be a key focus for resource recovery and litter reduction initiatives under the 2005 to 2010 Covenant, the assessment of the Improved National Packaging Covenant initiative will be considered under the relevant options where away from home improvements are being sought.
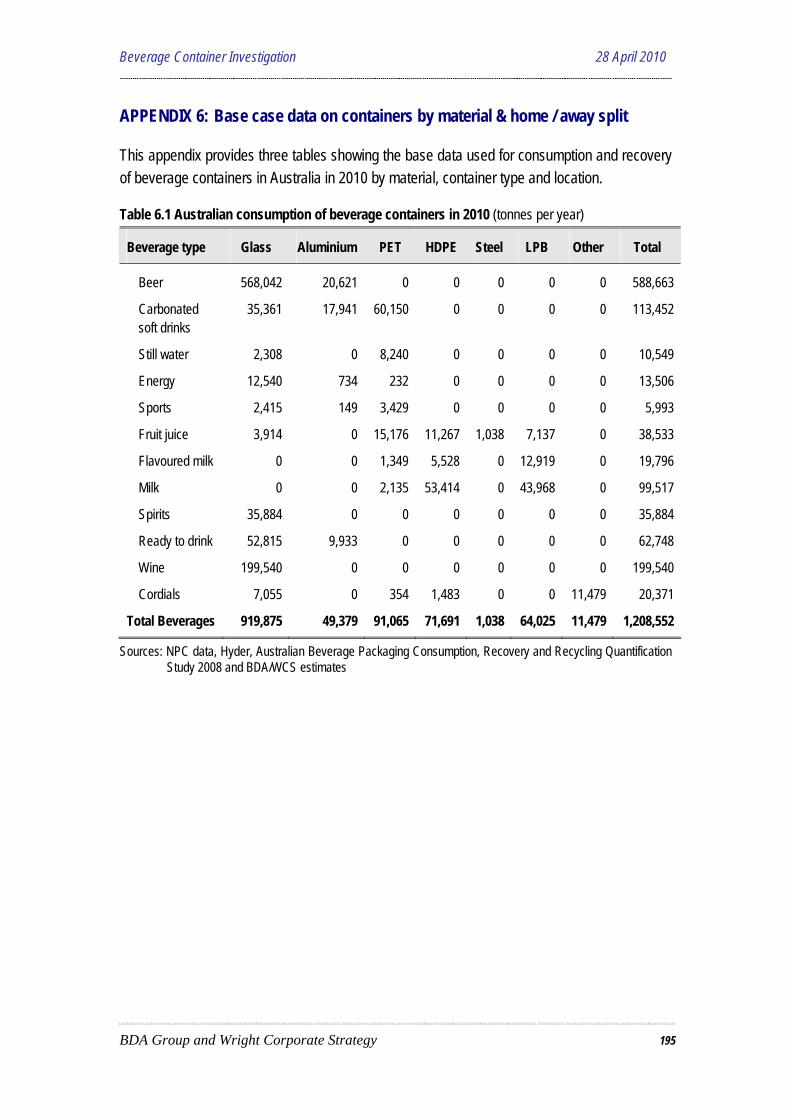
Beverage Container Investigation 28 April 2010
BDA Group and Wright Corporate Strategy 195
APPENDIX 6: Base case data on containers by material & home / away split
This appendix provides three tables showing the base data used for consumption and recovery of beverage containers in Australia in 2010 by material, container type and location.
Table 6.1 Australian consumption of beverage containers in 2010 (tonnes per year)
Beverage type Glass Aluminium PET HDPE Steel LPB Other Total
Beer 568,042 20,621 0 0 0 0 0 588,663
Carbonated soft drinks
35,361 17,941 60,150 0 0 0 0 113,452
Still water 2,308 0 8,240 0 0 0 0 10,549
Energy 12,540 734 232 0 0 0 0 13,506
Sports 2,415 149 3,429 0 0 0 0 5,993
Fruit juice 3,914 0 15,176 11,267 1,038 7,137 0 38,533
Flavoured milk 0 0 1,349 5,528 0 12,919 0 19,796
Milk 0 0 2,135 53,414 0 43,968 0 99,517
Spirits 35,884 0 0 0 0 0 0 35,884
Ready to drink 52,815 9,933 0 0 0 0 0 62,748
Wine 199,540 0 0 0 0 0 0 199,540
Cordials 7,055 0 354 1,483 0 0 11,479 20,371
Total Beverages 919,875 49,379 91,065 71,691 1,038 64,025 11,479 1,208,552
Sources: NPC data, Hyder, Australian Beverage Packaging Consumption, Recovery and Recycling Quantification Study 2008 and BDA/WCS estimates

Beverage Container Investigation 28 April 2010
BDA Group and Wright Corporate Strategy 196
Table 6.2: Australian consumption of beverage containers in 2010 by location under the base case (tonnes per year)
Container type Home Away Total
Glass 689,906 229,969 919,875
Aluminium 36,776 12,603 49,379
PET 50,086 40,980 91,065
HDPE 35,846 35,846 71,691
Steel 519 519 1,038
LPB 32,012 32,012 64,025
Other 5,740 5,740 11,479
Total 850,883 357,668 1,208,552
Sources: As for Table 6.1. Key assumptions are away from home consumption of 25% for glass, 26% for aluminium, 45% for PET (Hyder 2008) and 50% for all other materials.
Table 6.3: Estimated material recovery in 2010 by location under the base case (tonnes per year)
Material Home Away Total
Glass 413,119 96,635 509,754
Aluminium 35,588 8,242 43,830
PET 46,906 12,122 59,028
HDPE 19,171 9,040 28,212
Steel 165 18 183
LPB 10,926 1,754 12,680
Other 1,852 206 2,058
Total 527,727 128,017 655,744
Sources: As for Table 6.1. Key assumptions are away from home recovery of 10% for current recovery of all materials and 50% for new recovery of all materials between 2007 and 2010.
Beverage Container Investigation 28 April 2010
BDA Group and Wright Corporate Strategy
APPENDIX 7: Estimates of economic costs and benefits of a national CDS
The following appendix provides key assumptions used to estimate the economic costs and benefits of a national CDS scheme.
7.1 Handling / supercollector / transport costs
In estimating the collection costs it has been assumed that an Australian scheme will have the same density of collection centres as occurs in California113. It is assumed that 63% of individual returns to CDS collection points are from depots and 37% from convenience zones.
The capital and operating costs for depots and convenience zones are explained below.
Depot systems
Capital costs have been estimated using the general methodology in White (2001) for the three regions of metro, regional and rural and small, medium and large facilities. Capital costs include the costs of plant (forklifts, pick line, conveyor, baler and compactors and storage bins), the average land size, planning and approvals, building works and after hours security and fencing. Capital costs have been annualised over ten years using a 7% discount rate.
Operating costs have been estimated using the general methodology in White (2001) for the three regions of metro, regional and rural and small, medium and large facilities. Operating costs include wages costs, maintenance and overheads for plant and equipment.
Convenience zones
Convenience Zones are a mix of small depot style collection together with some RVMs. It was assumed that for a Convenience Zone return system 80% of the containers would be returned to a manual depot style Convenience Zone and 20% of the containers will be returned to a RVM.
Manual convenience zone
The capital costs for a manual Convenience Zone were calculated according to the methodology presented in White (2001) for depots for the 3 regions of metro, regional and rural. The only difference to the costs presented for depots above is the small space required for a Convenience Zone of 4 car park spaces and fewer staff.
The operating costs were calculated according to the methodology in White (2001) for the 3 regions of metro, regional and rural and for the 3 sizes of small, medium and large. These costs included are wages costs, maintenance and overheads for plant and equipment.
113 There are about 800 depots and 1200 convenience zone recyclers giving a density of 56 recycling centres per
million (California Fact Sheet, Depertment of Conservation at http://www.conservation.ca.gov)

Beverage Container Investigation 28 April 2010
BDA Group and Wright Corporate Strategy
Convenience zone RVMs
Small, medium and large RMV costs were estimated. A small system was based on 2 machines that could process 4.4 million containers per year, a medium system of 3 machines that could process 6.6 million containers per year and a large system that could process 8.8 million containers per year. The fixed costs and operating costs for the small, medium and large RVMs are as follows.
Table 7.1: RVM fixed and overhead costs for an unmanned RVM ($/yr)
Cost item Small Medium Large
Total fixed costs 135,525 188,981 248,123
Overheads 16,954 19,489 21,605
It is assumed that the capital and operating costs associated with depots and convenience zones are the most significant business start up costs. Annual business costs are included in the implementation costs covered separately below.
Supercollector costs
Costs covered include land and equipment for setup and wages for operation. The estimates assume pre sorting of containers.
Transport costs
Transport costs from collection point to supercollector derived based on distance travelled and depends on whether materials are loose or compacted. They assume that glass does not go to a supercollector but direct to a beneficiator. Costs of transport to market are based on distance travelled and assumes material is compacted. Based on available data from SA and WA.
7.2 Administration / implementation costs
The main administration / implementation costs are:
• Administration of the scheme, including management of deposits, handling fees, auditing, fraud and unredeemed deposits.
• Government costs associated with implementing and administering legislation, ensuring proper labeling, ensuring collection centres meet required standards.
• Education costs – initial education of the public and then on-going targeted education.
• Business costs – the costs involved in setting up internal systems and management, accounting and labeling.
In the analysis of implementing CDS in WA (MMA/BDA 2007) these four components of costs were estimated using the White (2001) study. The estimates for CDS schemes covering all

Beverage Container Investigation 28 April 2010
BDA Group and Wright Corporate Strategy
beverage containers has been used here. The administration costs have been extrapolated on a per container basis (at around 0.09 cents per container). The government, education and business costs relate mainly to setup activities rather than ongoing costs. For these categories the costs of the national CDS have been estimated at three times the level estimated for WA.
7.3 Inconvenience costs
Inconvenience costs are the costs associated with rinsing, storing and transporting containers to collection centres. There is some contention about whether to include inconvenience costs in a cost benefit analysis with some arguing that individuals get satisfaction from contributing to recycling and this effort should not be counted as a cost.
Nevertheless, in an economic cost benefit analysis, there is a cost associated with the use of these resources and a need to account for these costs.
The approach we have taken is to estimate inconvenience costs as a function of the deposit level, using a number of previous studies. So for a deposit level of 10 cents, the inconvenience cost was estimated at 2 cents per container recovered.
7.4 Commercial collection costs
Assumes 10% of returns are through commercial collections (from anecdotal evidence of experience in SA). Based on a cost of 2.3 cents per container (drawn from analysis of implementing a Californian style CDS in WA in MMA/BDA 2007). Doesn’t include avoided landfill and MRF costs as these are handled separately.
7.5 Material values
Based on estimates of medium term prices – drawn from estimates from 2005-2008 from MMA/BDA 2007 and Hyder 2008 PNC mid-term review.
7.6 Savings for kerbside systems
Assumes a 10 cent deposit rate results in 93% of additional containers collected coming through the CDS system and 7% through existing kerbside systems.
Table 7.2 shows the assumed costs per tonne for recovery of different materials.

Beverage Container Investigation 28 April 2010
BDA Group and Wright Corporate Strategy
Table 7.2: Costs of kerbside recovery ($ per tonne)
Cost item Paper Glass Plastics Steel Aluminium
Collection $25 $11 $62 $40 $35
Sorting $61 $88 $220 $73 $1,470
Transport $40 $26 $23 $26 $40
Source: BDA/MMA 2007 National Packaging Covenant Complementary Economic Mechanisms Investigation, Report for National Packaging Covenant Jurisdictional Working Group, December
7.7 Avoided landfill costs
Landfill costs are estimated at an average $40 per tonne based on the average distance to landfill, landfill gate fee, truck costs and wages costs. Landfill costs do not include the landfill levy, which is a transfer cost between parties, not an economic cost.
7.8 Unredeemed deposits - tourists
Only unredeemed deposits from overseas tourists are included in the economic analysis for a national CDS scheme (the rest are transfers between states). Unredeemed deposits for tourists are estimated at 0.14 cents per container. The analysis assumes 50% of deposits are not redeemed by overseas tourists, 2.23% of the population is made up of overseas tourists and the average number of containers consumed per person per year is 540.

Beverage Container Investigation – Final Report 28 April 2010
BDA Group and Wright Corporate Strategy 201
APPENDIX 8: Away from home consumption & recovery of containers by sector
Historical analysis of away from home consumption and recovery has been exceptionally fragmented with little obvious attempt by the various researchers to look at the away from home sector holistically. Studies and reviews have been undertaken on silo-segments without “sensibility checks” back to a whole of system limit. Accordingly, some reports on potential recovery rates from the away from home sector may be grossly misleading
Recent National Packaging Covenant data updating the financial year 2007 information, which is used for the 2007 base case data, provides beverage container consumption and recovery data for both the at home and away from home sectors as shown at Table 8.1 below, along with forecast data for 2010:
Table 8.1: Beverage container consumption, recovery and discard 2007 and 2010
Consumption Recovery Discarded & Available
2007
• At Home 823,523 451,391 372,132
• Away from home 346,167 50,155 296,013
2010
• At Home 850,883 527,727 288,304
• Away from home 357,668 128,017 194,101
Source: NPC and BDA/WCS estimates
This data effectively sets upper limits on total away from home consumption and recovery, and by implication the remaining beverage containers, that are currently discarded, that might be available for recovery. On this basis, the total maximum indicated potential further recovery of beverage container materials from the away from home sector as at 2007 is 296,013 tonnes. And for 2010, the maximum indicated potential further recovery of beverage container materials from the away from home sector is only 194,000 tonnes.
This appears at odds with earlier reports that indicate significantly higher quantities of beverage materials may be available for recovery.
Therefore, for the two away from home options tested in this report – core consumption centres, and improves recycling at workplaces, it is necessary to make some assumptions on how the 2007 update data from NPC might be allocated against the various away from home locations. That set of assumptions is presented below and forms the starting point for assessments of potential recovery in the body of the report at Sections B3 and B4
In the analysis, away from home locations have been grouped as follows:

Beverage Container Investigation – Final Report 28 April 2010
BDA Group and Wright Corporate Strategy 202
Public places parks, gardens, beaches, and roadside or streetscape locations
Events where large numbers of people congregate in a relatively localised place for some form of entertainment or activity
Hospitality hotels, clubs, cafes and restaurants
Retail shopping centres, general retail areas and food courts
Institutions hospitals, hostels and canteens/cafeterias/dining halls associated with large residential accommodation areas such as university colleges, military barracks etc.
Workplaces Commercial and industrial work sites and offices
In the absence of definitive and reliable data on consumption distribution in the away from home sector, estimates were made of consumption levels for each beverage material against each of the localities by pooling a series of informed and intuitive estimates of the distributions. The percentage allocations of consumption against each material type and location are presented at Table 8.2, while the 2007 tonnage estimates are presented at Table 8.3.
Table 8.2: Estimates of consumption percent distribution for AfH beverage packaging at 2007
Glass Alum. PET HDPE Steel LPB Other
Public Places 7% 22% 17% 5% 17% 28% 20%
Events 5% 12% 20% 8% 17% 7% 20%
Hospitality 42% 31% 17% 18% 50% 17% 20%
Retail 10% 15% 20% 23% 17% 20% 20%
Institutions 18% 7% 10% 27% 0% 15% 11%
Workplaces 18% 12% 15% 20% 0% 13% 11%
Total 100% 100% 100% 100% 100% 100% 100%

Beverage Container Investigation – Final Report 28 April 2010
BDA Group and Wright Corporate Strategy 203
Table 8.3: Estimates of consumption tonnage distribution for AfH beverage packaging at 2007
Glass Alum. PET HDPE Steel LPB Other Total
Public Places 16,700 2,700 6,900 1,700 100 8,500 1,100 37,700
Events 11,100 1,500 7,900 2,600 100 2,300 1,100 26,600
Hospitality 94,600 3,700 6,900 6,100 300 5,400 1,100 118,100
Retail 22,300 1,800 7,900 7,800 100 6,200 1,100 47,200
Institutions 39,000 900 4,000 9,500 0 4,600 600 58,600
Workplaces 39,000 1,500 5,900 6,900 0 3,900 600 57,800
Total 222,700 12,100 39,500 34,600 600 30,900 5,600 346,000
Further intuitive estimates were made for the distribution of the existing recovery for each material across the away from home localities, which then permitted calculation of a reasonable estimate of the remaining beverage materials by type for each locality, which are presented at Table 8.4, and represent a maximum limit on the available beverage materials that might be recovered from each locality.
Table 8.4: Estimates of available tonnage distribution for AfH beverage packaging at 2007
Glass Alum. PET HDPE Steel LPB Other Total
Public Places 14,700 2,500 6,700 1,600 100 8,400 1,100 35,100
Events 9,100 1,300 7,700 2,500 100 2,200 1,100 24,000
Hospitality 72,800 1,800 4,500 5,400 300 4,800 1,000 90,600
Retail 20,300 1,600 7,700 7,700 100 6,100 1,100 44,600
Institutions 29,100 0 2,900 9,200 0 4,300 500 46,000
Workplaces 37,000 1,300 5,700 6,800 0 3,800 600 55,200
Total 183,000 8,500 35,200 33,200 600 29,600 5,400 295,500