A CRAFT BEVERAGE FEASIBILITY STUDY FOR THE FIVE ...
54
A CRAFT BEVERAGE FEASIBILITY STUDY FOR THE FIVE COUNTY REGION AROUND CHARLESTON AND HUNTINGTON, WEST VIRGINIA DSG Advisors February 2020 v5.0 • 03/05/20
-
Upload
khangminh22 -
Category
Documents
-
view
2 -
download
0
Transcript of A CRAFT BEVERAGE FEASIBILITY STUDY FOR THE FIVE ...
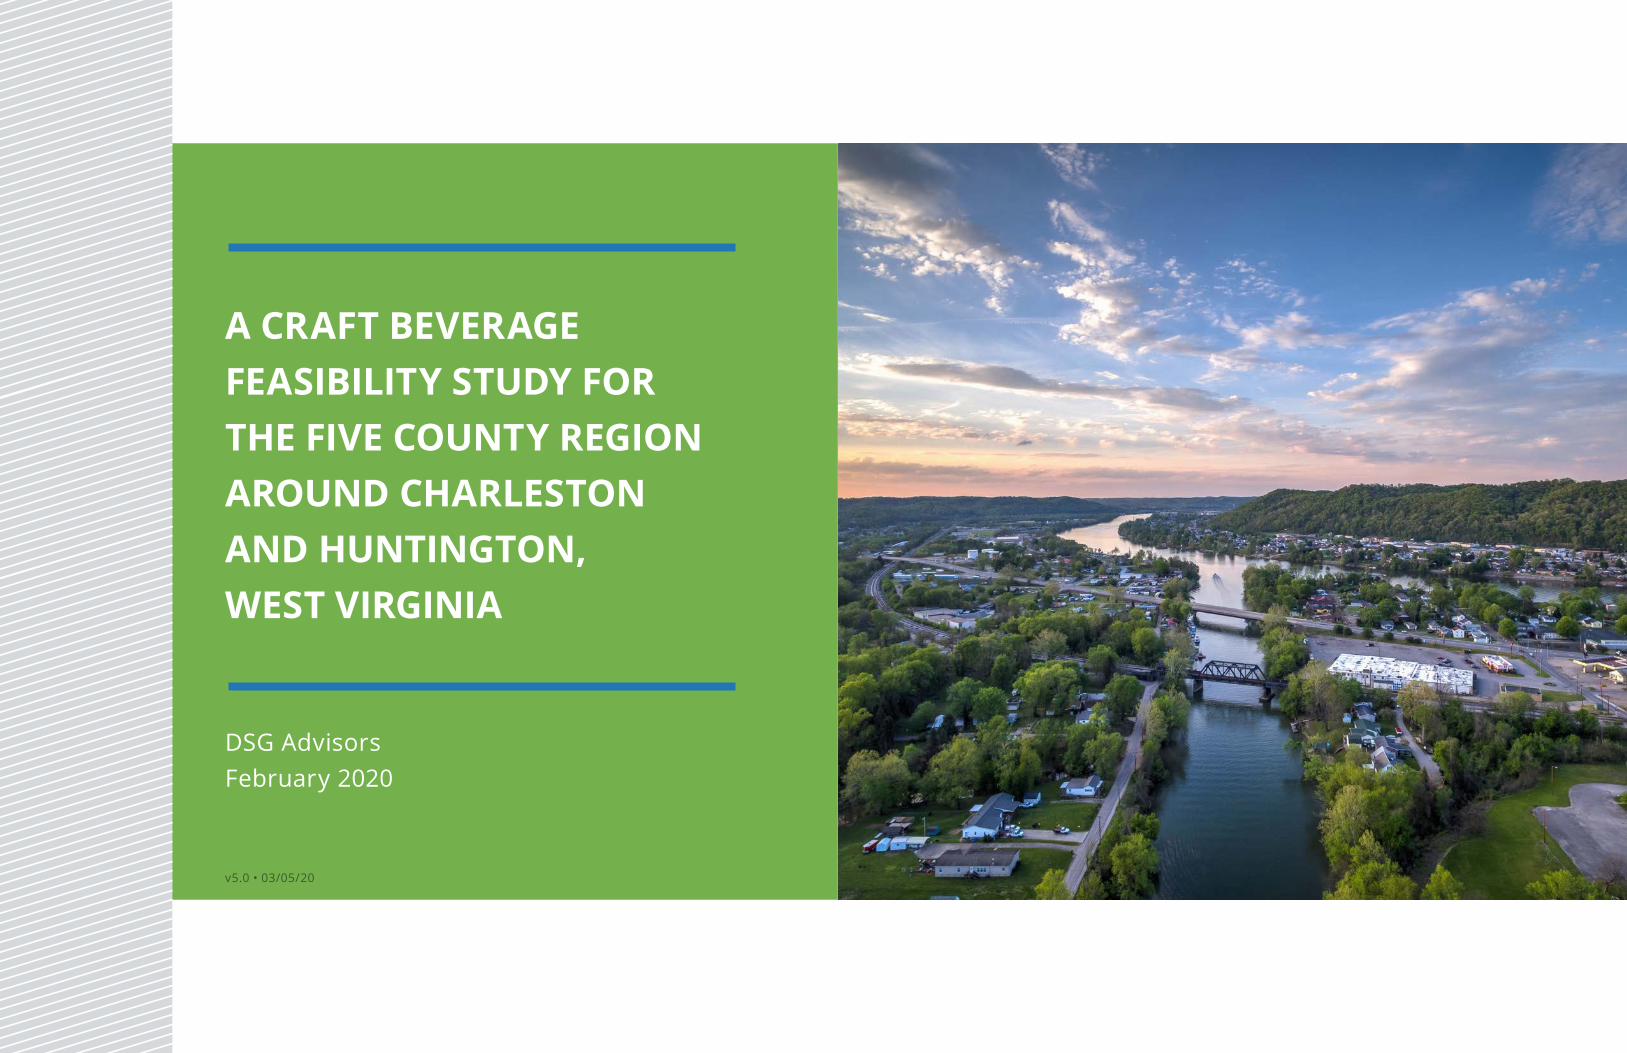
A CRAFT BEVERAGE FEASIBILITY STUDY FOR THE FIVE COUNTY REGION AROUND CHARLESTON AND HUNTINGTON, WEST VIRGINIA
DSG AdvisorsFebruary 2020
v5.0 • 03/05/20

CRAFT BEVERAGE FEASIBILITY REPORT | I
TABLE OF CONTENTS
ACKNOWLEDGMENTS III
EXECUTIVE SUMMARY IV
I. INTRODUCTION 1
Approach 2
II. TRAIL CASE STUDIES 3
Industry Insights 3
Case Studies 3
Best Practices 7
III. INVENTORY OF ASSETS 9
Existing Craft Beverage Assets in the Five-County Region 9
Farms and Farmers Markets Contributing to the Local Economy 11
Bars & Restaurants Contributing to the Local Craft Beverage Economy 12
Visitor Attractions for the Five-County Area 13
Summary of Visitor Assets 15
IV. GROWTH POTENTIAL 17
Craft Beverage Market Overview 17
The Consumer Market Profile 18
Market Demand and Supply 22
V. ROADMAP 28
1. Define/Package the Brand Vision and Product Scope 30
2. Expand the Product Offerings to Fill In and Support the Brand 32
3. Market and Promote the Trail 36
4. Create and Commit to Organizational Structure With Champions for Each of the Priority Initiatives 38
Potential Funding Sources 40
APPENDICES (separate document) A Brief History of Craft Beer Industry
B WV Trail Craft Overview for Charrette (presentation)
C East Gorge Food Trail Brochure
D Template - Placemaking Around Craft Beer Production
E Market Trends for Craft Beverages
F Polk County Criteria
G Polk County CATS Flyer
H Guild Functions
I Starting a Guild
J Food Hub in One
K Beverage Cross Marketing
II | CRAFT BEVERAGE FEASIBILITY REPORT
LIST OF FIGURES
FIG 1 Existing Craft Beverage Assets in 5-County Region (map) 10
FIG 2 Farms and Farmers Markets (map) 11
FIG 3 Bars and Restaurants (map) 12
FIG 4 Visitor Attractions (map) 13
FIG 5 Regional Attractions (map) 16
FIG 6 Beer, Wine and Spirits Consumers 17
FIG 7 Average Expenditures on WV Overnight Trips 20
FIG 8 Activities and Experiences 20
FIG 9 Total Direct Spending 20
FIG 10 Growth in Direct Spending 20
FIG 11 Local Visitor Market (map) 21
FIG 12 SE Ohio Region 25
FIG 13 Spending by Category 27
FIG 14 Spending by Type of Accommodation 27
FIG 15 Organization Chart 39
LIST OF TABLES
TABLE 1 Craft Beer Trail Features 10
TABLE 2 Regional Events – A Sampling 14
TABLE 3 Overview of Craft Beverage Market Consumers 17
TABLE 4 Local (5-County) Snapshot 19
TABLE 5 Total Business and Employees, 2019 19
TABLE 6 Regional Snapshot 20
TABLE 7 Craft Beer Sales and Production (Nearby States) 22
TABLE 8 Craft Beer Sales and Production (West Virginia) 23
TABLE 9 Benchmark for 5-County Area Brewery Target 24
TABLE 10 Travel Spending (Region) 26
TABLE 11 Consumer Demand (Region) 27
TABLE 12 Potential Funding Resources for Craft Beverage Project 42
CRAFT BEVERAGE FEASIBILITY REPORT | III
ACKNOWLEDGMENTS
* Ashley Alford, Putnam County Chamber of Commerce
Jeff Arthur, Mountain State Distillery
Cindy Bailey, West Virginia National Guard
* Matt Ballard, Charleston Area Alliance
Eunice Bellinger, BridgeValley Community and Technical College
* Charles Bockway, Brilliant Stream
* Bill Bissett, Huntington Regional Chamber of Commerce
* Jane Bostic, City of Charleston
Sarah Bostic, Unlimited Future
Tim Brady, Charleston CVB
John Bullock, The Bullock Distillery
Tighe Bullock, The Bullock Distillery
* Brad Cochran, West Virginia National Guard
* Tyson Compton, Cabell-Huntington CVB
* Kelli S. Dailey, Putnam County CVB
* Drew Dunlap, Putnam County Development Authority
* Terrell Ellis, Advantage Valley
* Chris Ferro, Charleston Area Alliance
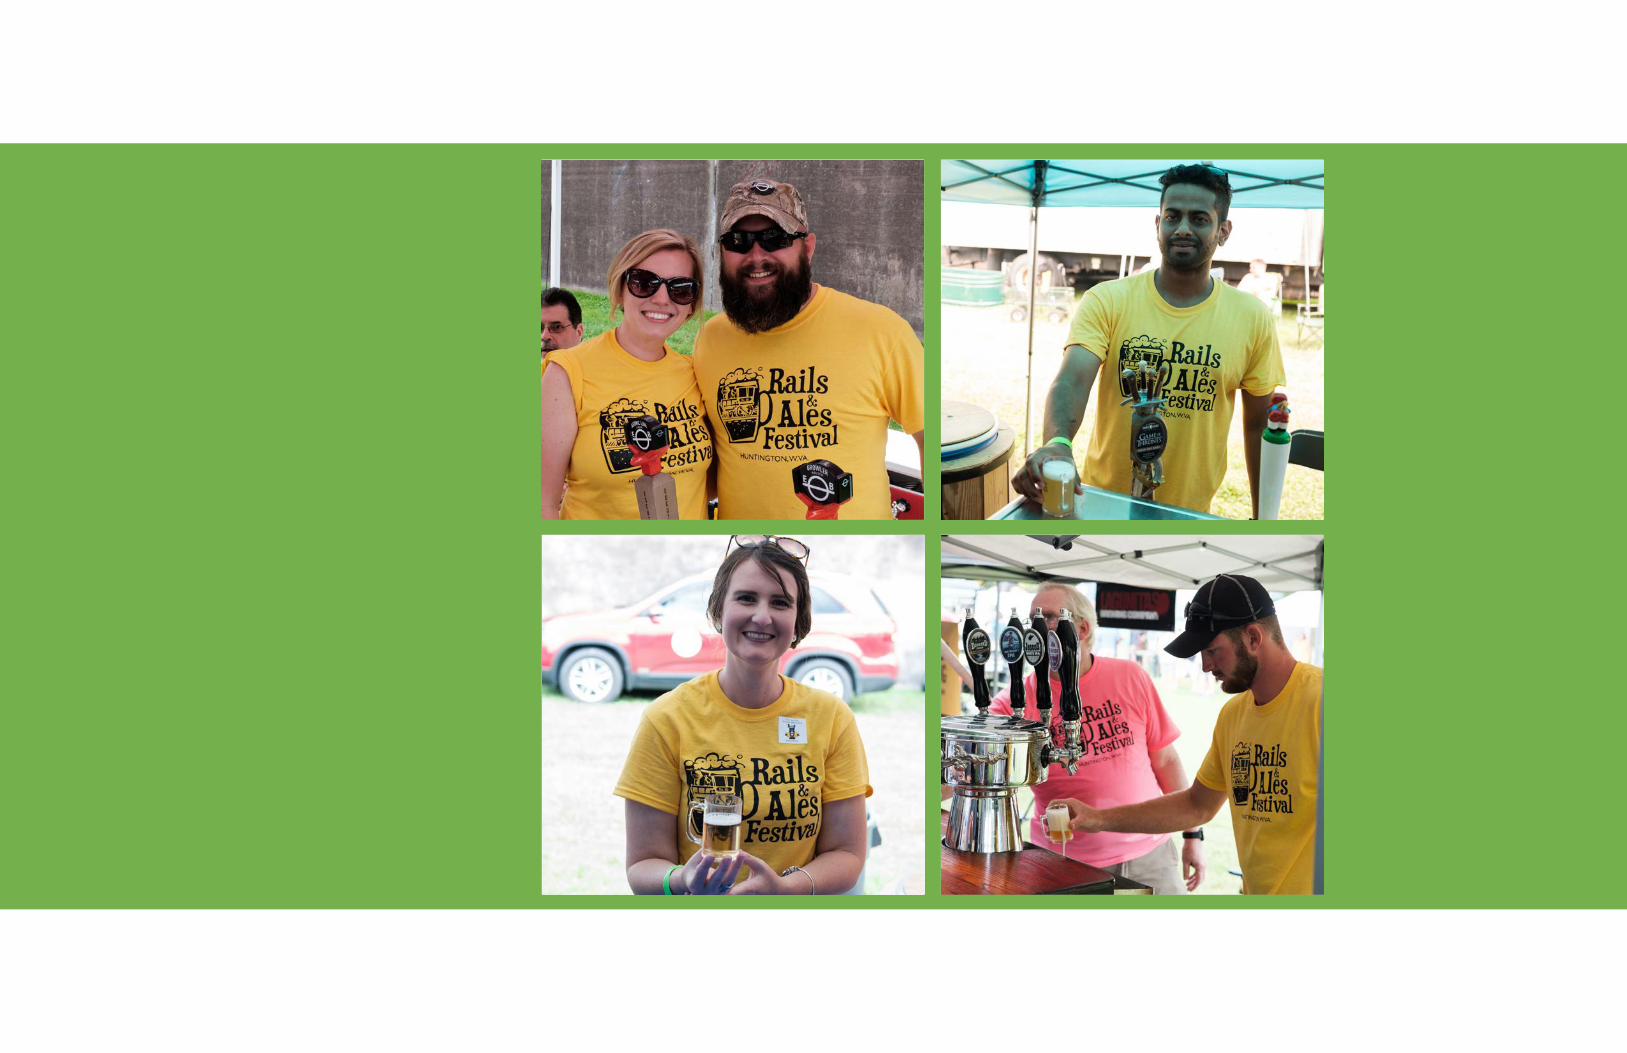
Jay Fox, Head Brewer at The Peddler/Co-Founder Rails & Ales Festival
Dwayne Freeman, Appalachian Distillery
Nikki and Matt Holbert, Bricks & Barrels/Axes & Ales
Lauren Kemp, Unlimited Future/The Wild Ramp
Brad Gritt, Gritt’s Farm
Maggie Gritt, Gritt’s Farm
Kelly Grose, BridgeValley Community and Technical College
Brenda and Mark Hatfield, Sweeter Side of the Feud
Teresa and Phil Holcomb, Chestnut Ridge Winery
* Dave Lieving, Huntington Area Development Corporation
Jeff McKay, Summit Beer Station/Co-Founder Rails & Ales Festival
* Gail Patton, Unlimited Future
Chelsea Ruby, West Virginia Tourism
Andrew and Ashley Stewart, Bridge Café & Bistro
Melissa Stewart, West Virginia National Guard
Rob Sydenstricker, Fireside Grille
Dusta Tanner, The Bullock Distillery
Emily Wall, Live Nation Entertainment
* Mark Whitley, Jackson & Roane County Development Authority
* Bill Woodrum, Robert C. Byrd Institute Marshall University
Bruno Young, Sleepy Hollow Golf Club/Putnam County Craft Beer Festival
* Member of Steering Committee
This report was prepared by
DSG Advisors
with
Marketek, Inc.
Urban Scenarios
IV | CRAFT BEVERAGE FEASIBILITY REPORT
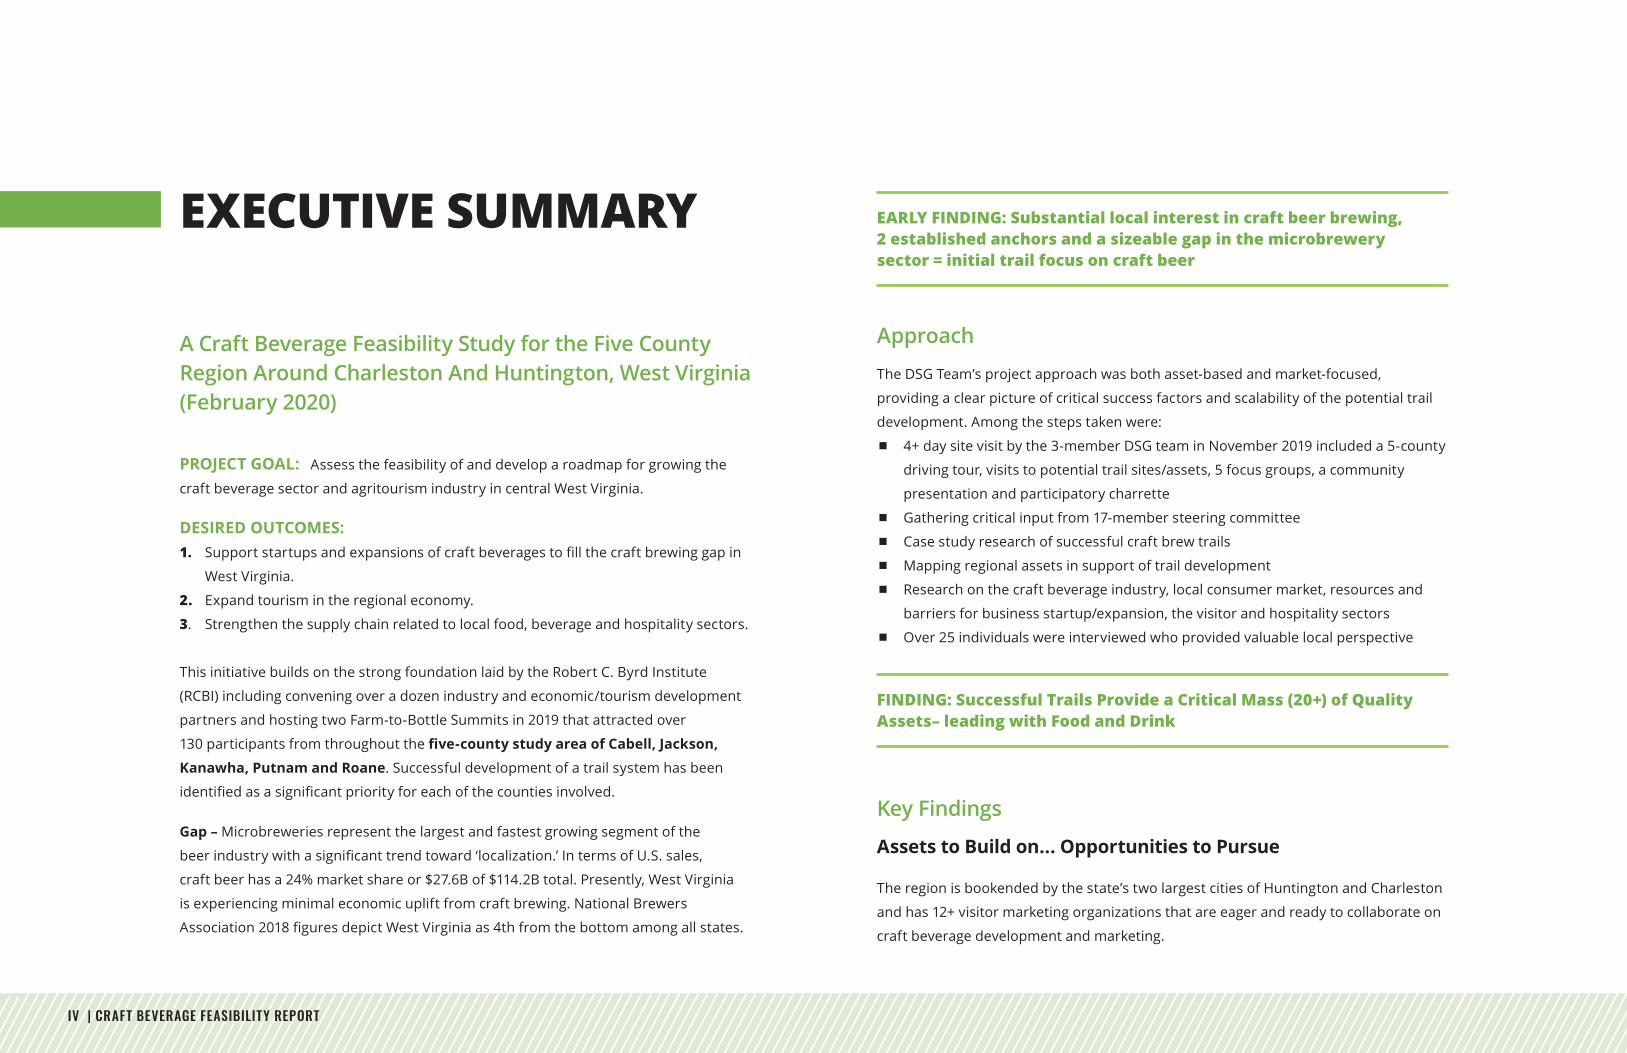
EXECUTIVE SUMMARY
A Craft Beverage Feasibility Study for the Five County Region Around Charleston And Huntington, West Virginia (February 2020)
PROJECT GOAL: Assess the feasibility of and develop a roadmap for growing the
craft beverage sector and agritourism industry in central West Virginia.
DESIRED OUTCOMES: 1. Supportstartupsandexpansionsofcraftbeveragestofillthecraftbrewinggapin
West Virginia.
2. Expand tourism in the regional economy.
3. Strengthen the supply chain related to local food, beverage and hospitality sectors.
This initiative builds on the strong foundation laid by the Robert C. Byrd Institute
(RCBI) including convening over a dozen industry and economic/tourism development
partners and hosting two Farm-to-Bottle Summits in 2019 that attracted over
130 participantsfromthroughoutthefive-county study area of Cabell, Jackson,
Kanawha, Putnam and Roane. Successful development of a trail system has been
identifiedasasignificantpriorityforeachofthecountiesinvolved.
Gap – Microbreweries represent the largest and fastest growing segment of the
beerindustrywithasignificanttrendtoward‘localization.’IntermsofU.S.sales,
craft beer has a 24% market share or $27.6B of $114.2B total. Presently, West Virginia
is experiencing minimal economic uplift from craft brewing. National Brewers
Association2018figuresdepictWestVirginiaas4thfromthebottomamongallstates.
EARLY FINDING: Substantial local interest in craft beer brewing, 2 established anchors and a sizeable gap in the microbrewery sector = initial trail focus on craft beer
Approach
The DSG Team’s project approach was both asset-based and market-focused,
providing a clear picture of critical success factors and scalability of the potential trail
development. Among the steps taken were:
4+ day site visit by the 3-member DSG team in November 2019 included a 5-county
driving tour, visits to potential trail sites/assets, 5 focus groups, a community
presentation and participatory charrette
Gathering critical input from 17-member steering committee
Case study research of successful craft brew trails
Mapping regional assets in support of trail development
Research on the craft beverage industry, local consumer market, resources and
barriers for business startup/expansion, the visitor and hospitality sectors
Over 25 individuals were interviewed who provided valuable local perspective
FINDING: Successful Trails Provide a Critical Mass (20+) of Quality Assets– leading with Food and Drink
Key Findings
Assets to Build on... Opportunities to Pursue
The region is bookended by the state’s two largest cities of Huntington and Charleston
and has 12+ visitor marketing organizations that are eager and ready to collaborate on
craft beverage development and marketing.
CRAFT BEVERAGE FEASIBILITY REPORT | V
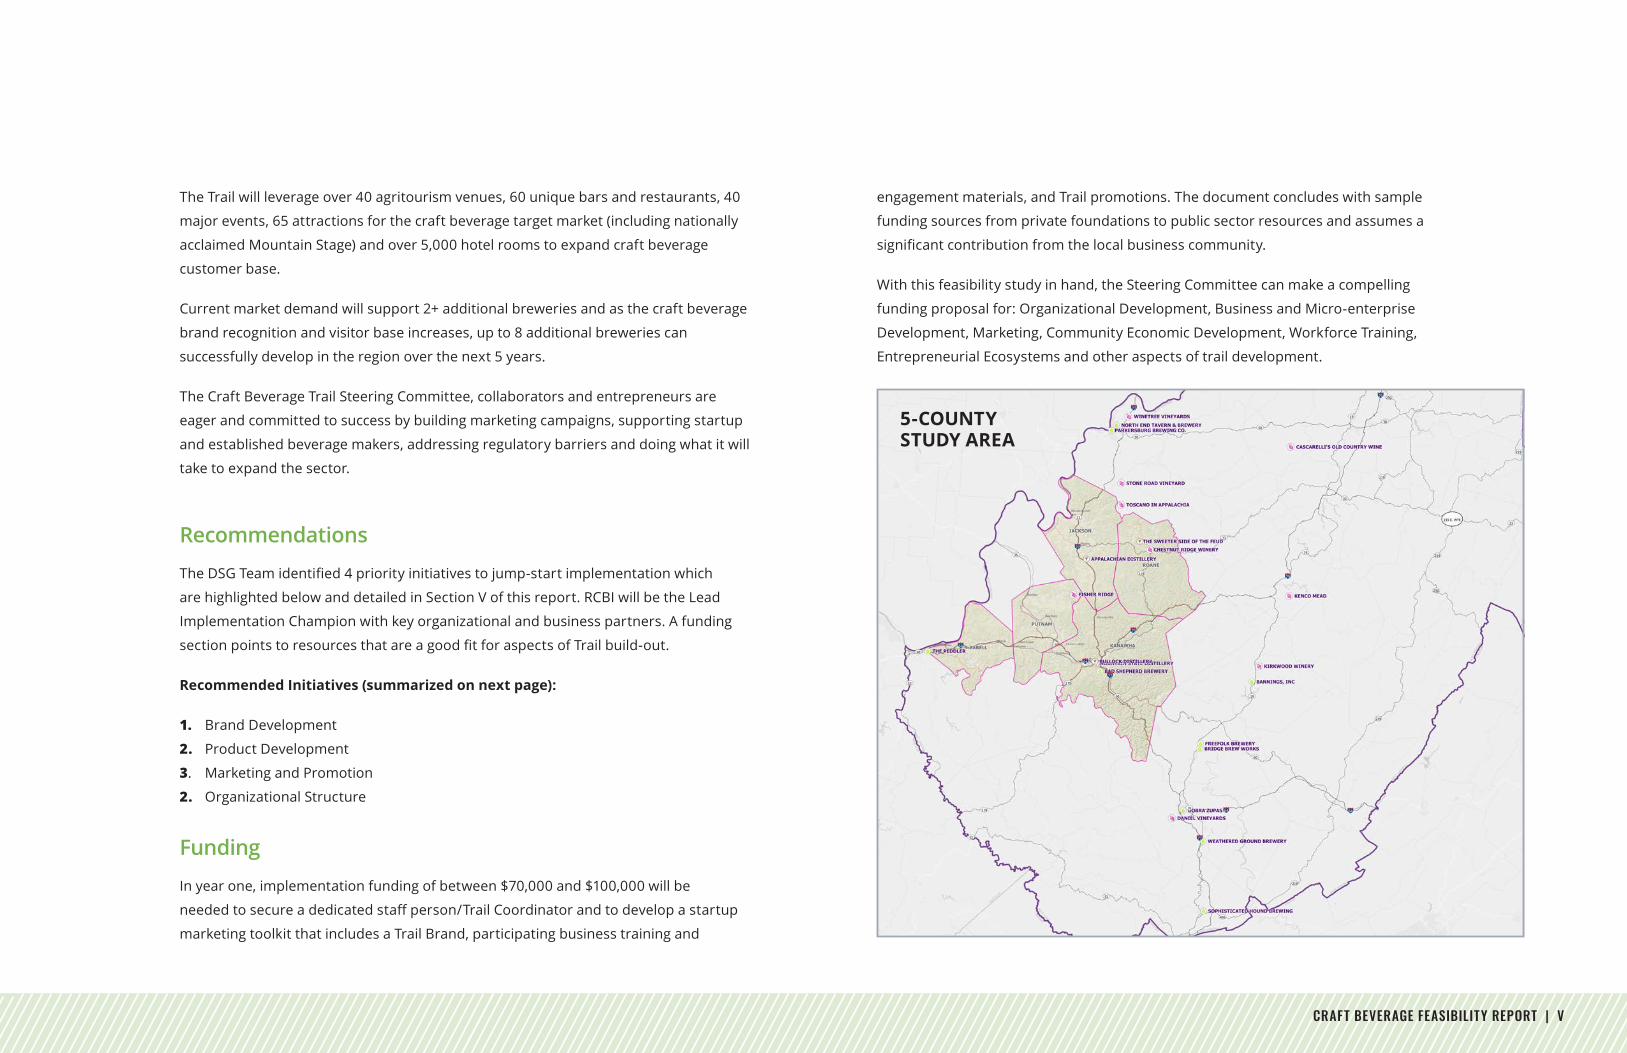
The Trail will leverage over 40 agritourism venues, 60 unique bars and restaurants, 40
major events, 65 attractions for the craft beverage target market (including nationally
acclaimed Mountain Stage) and over 5,000 hotel rooms to expand craft beverage
customer base.
Current market demand will support 2+ additional breweries and as the craft beverage
brand recognition and visitor base increases, up to 8 additional breweries can
successfully develop in the region over the next 5 years.
The Craft Beverage Trail Steering Committee, collaborators and entrepreneurs are
eager and committed to success by building marketing campaigns, supporting startup
and established beverage makers, addressing regulatory barriers and doing what it will
take to expand the sector.
Recommendations
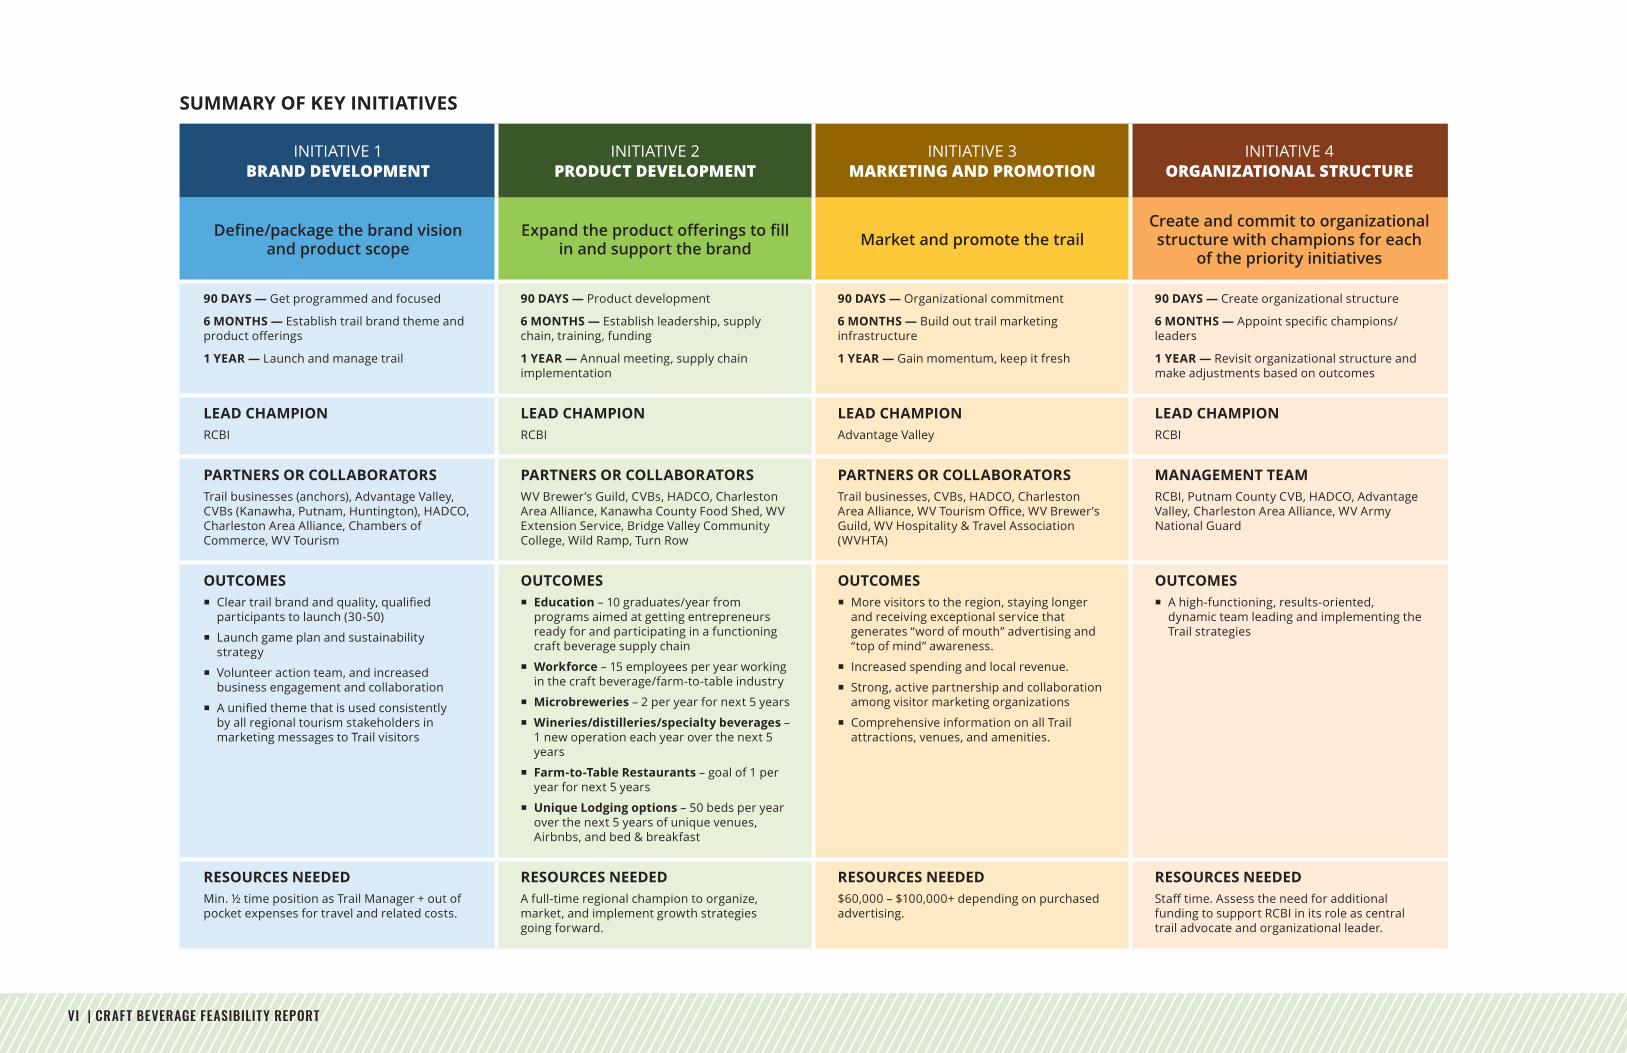
TheDSGTeamidentified4priorityinitiativestojump-startimplementationwhich
are highlighted below and detailed in Section V of this report. RCBI will be the Lead
Implementation Champion with key organizational and business partners. A funding
sectionpointstoresourcesthatareagoodfitforaspectsofTrailbuild-out.
Recommended Initiatives (summarized on next page):
1. Brand Development
2. Product Development
3. Marketing and Promotion
2. Organizational Structure
Funding
In year one, implementation funding of between $70,000 and $100,000 will be
neededtosecureadedicatedstaffperson/TrailCoordinatorandtodevelopastartup
marketing toolkit that includes a Trail Brand, participating business training and
engagement materials, and Trail promotions. The document concludes with sample
funding sources from private foundations to public sector resources and assumes a
significantcontributionfromthelocalbusinesscommunity.
With this feasibility study in hand, the Steering Committee can make a compelling
funding proposal for: Organizational Development, Business and Micro-enterprise
Development, Marketing, Community Economic Development, Workforce Training,
Entrepreneurial Ecosystems and other aspects of trail development.
5-COUNTY STUDY AREA
VI | CRAFT BEVERAGE FEASIBILITY REPORT
INITIATIVE 1BRAND DEVELOPMENT
INITIATIVE 2 PRODUCT DEVELOPMENT
INITIATIVE 3MARKETING AND PROMOTION
INITIATIVE 4ORGANIZATIONAL STRUCTURE
Define/package the brand vision and product scope
Expand the product offerings to fill in and support the brand Market and promote the trail
Create and commit to organizational structure with champions for each
of the priority initiatives
90 DAYS — Get programmed and focused
6 MONTHS — Establish trail brand theme and productofferings
1 YEAR — Launch and manage trail
90 DAYS — Product development
6 MONTHS — Establish leadership, supply chain, training, funding
1 YEAR — Annual meeting, supply chain implementation
90 DAYS — Organizational commitment
6 MONTHS — Build out trail marketing infrastructure
1 YEAR — Gain momentum, keep it fresh
90 DAYS — Create organizational structure
6 MONTHS —Appointspecificchampions/leaders
1 YEAR — Revisit organizational structure and make adjustments based on outcomes
LEAD CHAMPIONRCBI
LEAD CHAMPIONRCBI
LEAD CHAMPIONAdvantage Valley
LEAD CHAMPIONRCBI
PARTNERS OR COLLABORATORSTrail businesses (anchors), Advantage Valley, CVBs (Kanawha, Putnam, Huntington), HADCO, Charleston Area Alliance, Chambers of Commerce, WV Tourism
PARTNERS OR COLLABORATORSWV Brewer’s Guild, CVBs, HADCO, Charleston Area Alliance, Kanawha County Food Shed, WV Extension Service, Bridge Valley Community College, Wild Ramp, Turn Row
PARTNERS OR COLLABORATORSTrail businesses, CVBs, HADCO, Charleston AreaAlliance,WVTourismOffice,WVBrewer’sGuild, WV Hospitality & Travel Association (WVHTA)
MANAGEMENT TEAMRCBI, PutnamCountyCVB,HADCO,AdvantageValley, Charleston Area Alliance, WV Army National Guard
OUTCOMES � Cleartrailbrandandquality,qualified
participants to launch (30-50)
� Launch game plan and sustainability strategy
� Volunteer action team, and increased business engagement and collaboration
� Aunifiedthemethatisusedconsistentlyby all regional tourism stakeholders in marketing messages to Trail visitors
OUTCOMES � Education – 10 graduates/year from
programs aimed at getting entrepreneurs ready for and participating in a functioning craft beverage supply chain
� Workforce – 15 employees per year working in the craft beverage/farm-to-table industry
� Microbreweries – 2 per year for next 5 years
� Wineries/distilleries/specialty beverages –1 newoperationeachyearoverthenext5years
� Farm-to-Table Restaurants – goal of 1 per year for next 5 years
� Unique Lodging options – 50 beds per year over the next 5 years of unique venues, Airbnbs, and bed & breakfast
OUTCOMES � More visitors to the region, staying longer
and receiving exceptional service that generates “word of mouth” advertising and “top of mind” awareness.
� Increased spending and local revenue.
� Strong, active partnership and collaboration among visitor marketing organizations
� Comprehensive information on all Trail attractions, venues, and amenities.
OUTCOMES � A high-functioning, results-oriented,
dynamic team leading and implementing the Trail strategies
RESOURCES NEEDEDMin. ½ time position as Trail Manager + out of pocket expenses for travel and related costs.
RESOURCES NEEDEDA full-time regional champion to organize, market, and implement growth strategies going forward.
RESOURCES NEEDED$60,000 – $100,000+ depending on purchased advertising.
RESOURCES NEEDEDStafftime.Assesstheneedforadditionalfunding to support RCBI in its role as central trail advocate and organizational leader.
SUMMARY OF KEY INITIATIVES
CRAFT BEVERAGE FEASIBILITY REPORT | 1
I. INTRODUCTION
The goal of the Recreational Trail Feasibility Study is to develop a roadmap for growing
the craft beverage gastro-tourism and agritourism industry in central West Virginia.
The desired outcomes include supporting startups and expansions of craft beverages,
expanding tourism in the regional economy and strengthening the supply chain related
to local food, beverage and hospitality sectors.
The term craft beverage most often refers to small batch and independently produced
beverages—both alcoholic and non-alcoholic—including beer, wine, hard ciders,
kombucha,coffeeanddistilledbeverages.Theseartisandrinksareattheheartofthe
locally sourced and created food movement ablaze across the U.S.
The craft trail initiative builds on the strong foundation laid by the Robert C. Byrd
Institute (RCBI) including convening over a dozen industry and economic/visitor
development partners and hosting two Farm-to-Bottle Summits in 2019 that attracted
over130participantsfromthefive-countyregionofCabell,Jackson,Kanawha,Putnam
andRoane.Fromtheseevents,RCBIidentifiedpotentialsupplychainstakeholders.
In addition, Advantage Valley has targeted and actively promotes Food and Beverage
Manufacturing opportunities within the region and is helping raise awareness of this
growing industry. Craft brewers, farmers, retailers and other possible supply chain
stakeholdershavebeenidentifiedbyRCBIthroughtheApril8thCraft:AFarmtoBottle
Summit.Successfuldevelopmentofatrailsystemhasbeenidentifiedasasignificant
priority for each of the counties involved.
The overall potential for the proposed regional trail is directly linked to the insatiable
consumer demand for local food and drink and authentic experiences and unique
settings. Market conditions favor dining out and consumers are eager to try unique
food/drink options found locally. Even as U.S. consumers are drinking less alcohol as
a whole, sales of craft beverages themselves are up. Craft/premium drinks are seeing
growth across beverage types (including beer, wine, cider, spirits, and kombucha,
amongothers).What’smore,experientialdrinkingplacesofferwhatyounger
consumers want: a place with local stories and meaningful community connections;
event-like experience with “Instagrammable” scenery, and perceived (or true) higher
quality and transparency in ingredients.
SpecifictobeertheU.S.breweryindustryhashadexplosivegrowthoverthelast
decade with the total number increasing from 3,869 in 2014 to 7,450 in 2018. At 60%
of the total, microbreweries represent the largest and fastest growing segment with a
significanttrendtoward‘localization’ofthissector.IntermsofU.S.sales,craftbeerhas
a 24% market share or $27.6B of $114.2B total. Presently, West Virginia is experiencing
minimal economic uplift from craft brewing. National Brewers Association 2018
figuresdepictWestVirginiaas4thfromthebottomamongallstatesintermsofcraft
brewing economic impact and 6th lowest for employment. Further impetus for craft
brewexpansioninthefive-countystudyareaisthatthereareonlytwocraftbreweries
presently operating with conceivably large pent up demand for many more. A history
of the craft brewing industry in the U.S. completed by project team leader, Don
Schjeldahl, appears in Appendix A.
2 | CRAFT BEVERAGE FEASIBILITY REPORT
APPROACHThe DSG Team’s approach for achieving desired outcomes from the Recreational Trail
Feasibility Study is both asset-based and market-focused, providing a clear picture
of success and scalability of the potential trail development market with a goal of
long term sustainability. Underpinning DSG’s work has been critical input from the
17-member Steering Committee and bi-weekly telephone meetings with a core team.
Team leader, Don Schjeldahl participated in the October 2019 Farm-to-Bottle
Summit in Fairmont, WV.
A 4+ day site visit by the 3-member DSG team in early November included a
5-county driving tour, visits to potential trail sites/assets and 5 focus groups and
culminated in a community presentation and charrette (see Appendix B)
Throughouttheproject,theteamconductedsignificantresearchonthecraft
beverage industry, resources for business startup/expansion, the visitor and
hospitality sectors, local and regional markets, successful craft beverage and food
trails and potential regulatory barriers to craft beverage development in West
Virginia.
Over25individualswereinterviewedwhoprovidedsignificantlocalperspective
and understanding.
Our three-phase project approach is outlined below.
PHASE 1: Inventory Assets Appropriate to Trail Development – The team
prepared a multi-dimensional inventory of existing assets that can
support or be brought to support, growth of the gastro-tourism and
agritourism industry related to craft beverage industries in central West
Virginia.
PHASE 2: Identify Potential Market Opportunity and Asset Gaps – The team
estimated the size and makeup of the central West Virginia resident and
tourism market and agritourism industry as indicated through study of
proven best practices for taking existing assets along with added visitor
infrastructure to achieve maximum market size.
PHASE 3: Develop Roadmap for Implementation – In the concluding phase, the
consultants outlined an action roadmap guiding stakeholders through
steps in support of four initiatives focused on achieving the trail model
definedinPhase2andwithanunderstandingofthelocalorganizational
capacity.
AprojectpresentationtounveilthefinalreportisplannedforMarch2020.The
presentation will occur for all interested community stakeholders. This document is
the culmination of all aspects of work noted above and is the result of the collaborative
endeavor with the RCBI Steering Committee. Each strategic initiative contains actions
to be undertaken toward the creation of a Craft Beverage (and larger Food) Trail and a
recommendation on the group that is best positioned to champion the implementation
with support of additional volunteers and organizations. The pathway to economic
revitalization through trail development is dependent on a collaborative approach and
shared resources.
“West Virginia has assets that could make for a successful craft beverage trail. The challenge has always been bringing these assets together in a
logical fashion and marketing effectively.”Charles Brockway, Brill iant Stream
CRAFT BEVERAGE FEASIBILITY REPORT | 3
II. TRAIL CASE STUDIES
To better understand craft beverage trail models and guide trail development for
the 5-county region, the DSG team examined established trails to identify common
characteristics, keys to success and best practices. While winery trails and a few
cidery and distillery trails also exist, DSG focused on brew trails as the “best bet” for
the project region to leverage existing assets and quickly establish name recognition.
Across the U.S. craft brew trails number in excess of 130. They range in geographic
focus (local, regional, state) and scale (from hubs of 6+ breweries in urban areas
toseveraldozenacrossastate).Organizedtrailsarenotablyeffectivetoolsfor
promoting the craft beverage and visitor industry and connecting to a wide range
of tourists. So successful are trails in raising awareness and growing the customer
base of craft brewers, in August 2018, the Craft Beverage Tour Operators Association
(CBTOA) launched. Its mission is to support tour operators and grow their business
opportunities.
INDUSTRY INSIGHTSBeverage Industry magazine reports that people are willing to travel to experience
drinking a beer at the place of production because craft breweries conspicuously
promote traditional, wholesome brewing styles, highlight their use of local ingredients,
make connections to clean, local water sources, and name their beers in relation to
local folklore and cultural events. The most successful craft breweries clearly match
their identities with local culture and brands.
Undeniably, tourism agencies aggressively advertise local breweries as an experiential
activity. In most cases, beer trails are as widely promoted as local parks, museums,
historic buildings, festivals, and other prominent tourist attractions. Of important note
for the study area trail during the startup phase is the augment that travel to breweries
and consumption of craft beverages is part of a much larger farm-to-table movement.
With so few craft brewers in the 5-county region, cross-marketing with agritourism
assets and farm-to-table dining will be imperative.
Successful breweries fully embrace their connections with the local history and
geography and engage in sustainable practices that support other local farmers and
businesses. Experiential tourism and craft beverages are both witnessing an economic
resurgence.
CASE STUDIESTo provide practical and relevant guidance for project area trail organizers, DSG sought
to identify several craft beverage trails blending rural and city settings, with a critical
mass of breweries or some scale of product, marketed with complementary products
(food, cideries, distilleries, etc.), cross-promoted with recreation adventures and
managed by a centralized, funded marketing organization. Proximity to market is of
course important. What follows are summary case studies of select trails, and a topline
best practices/insights overview. The trails include: Central New York Craft Brew Trail
(part of a larger Food and Beverage Trail); Laurel Highlands Pour Tour (beer, wine,
spirits)/SW Pennsylvania; North Coast Food and Drink Trail, Oregon; and the Maine
Beer Trail.
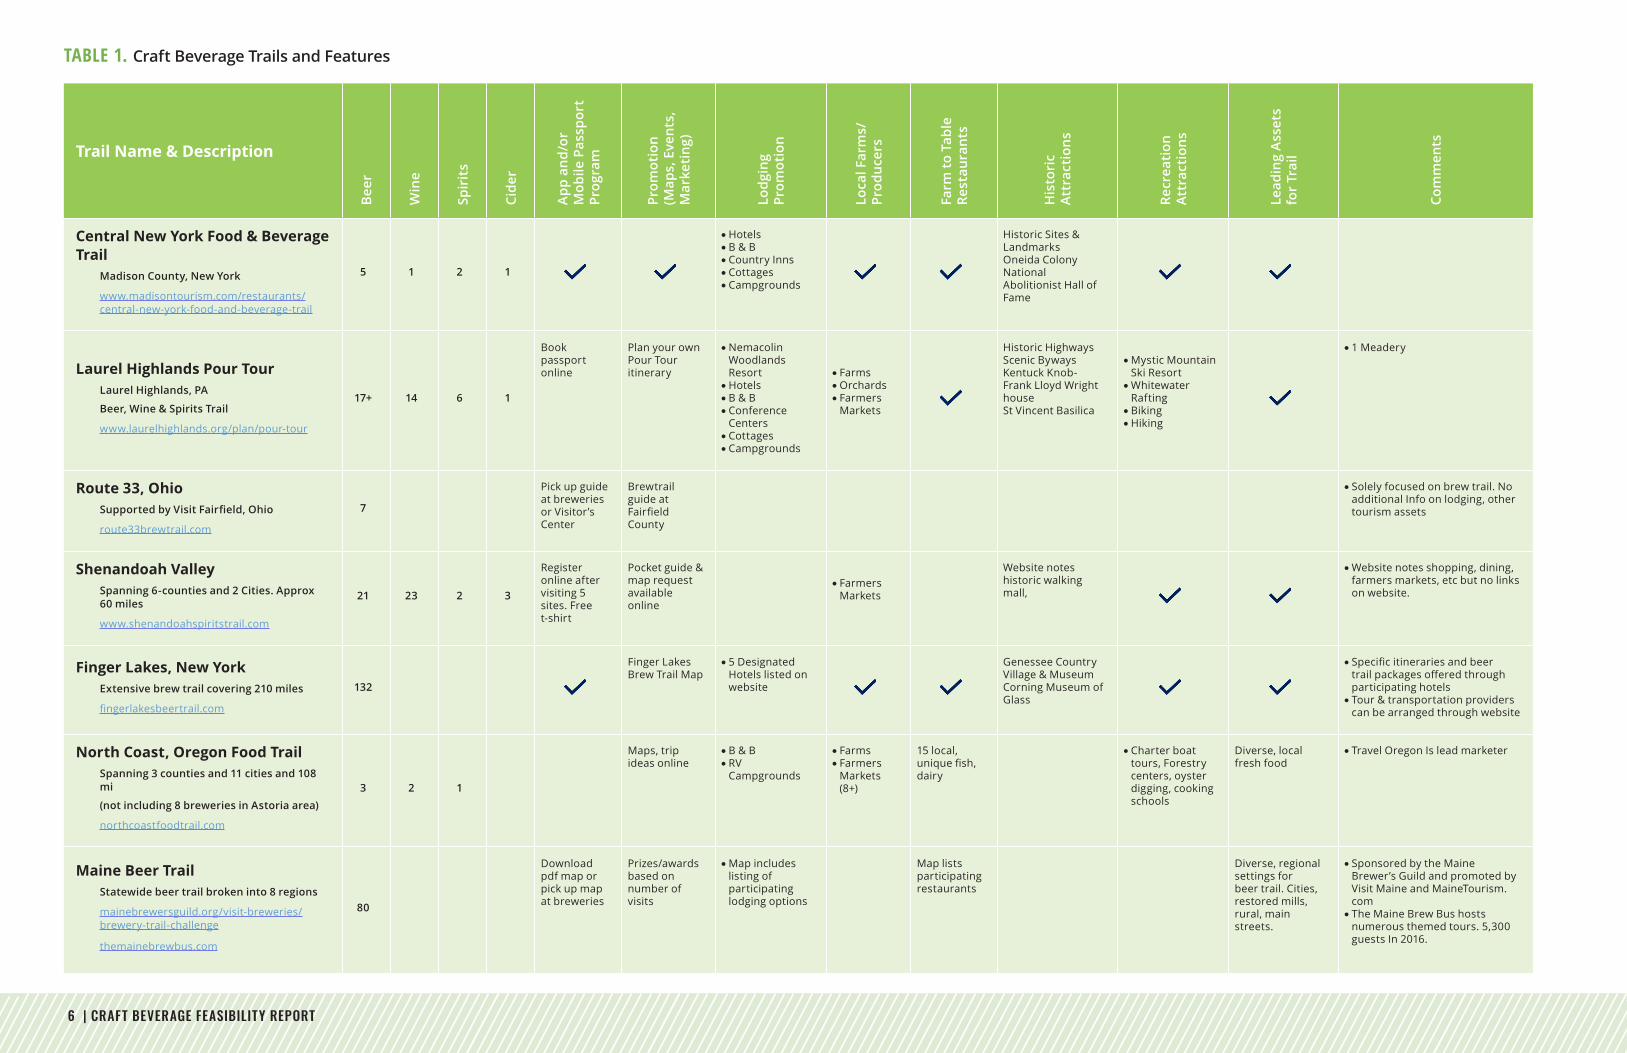
Table 1 that follows compares the key features and elements of the case studies above
as well as three other trails of interest: Route 33 OH, Shenandoah Valley, VA and Finger
Lakes, NY.
4 | CRAFT BEVERAGE FEASIBILITY REPORT
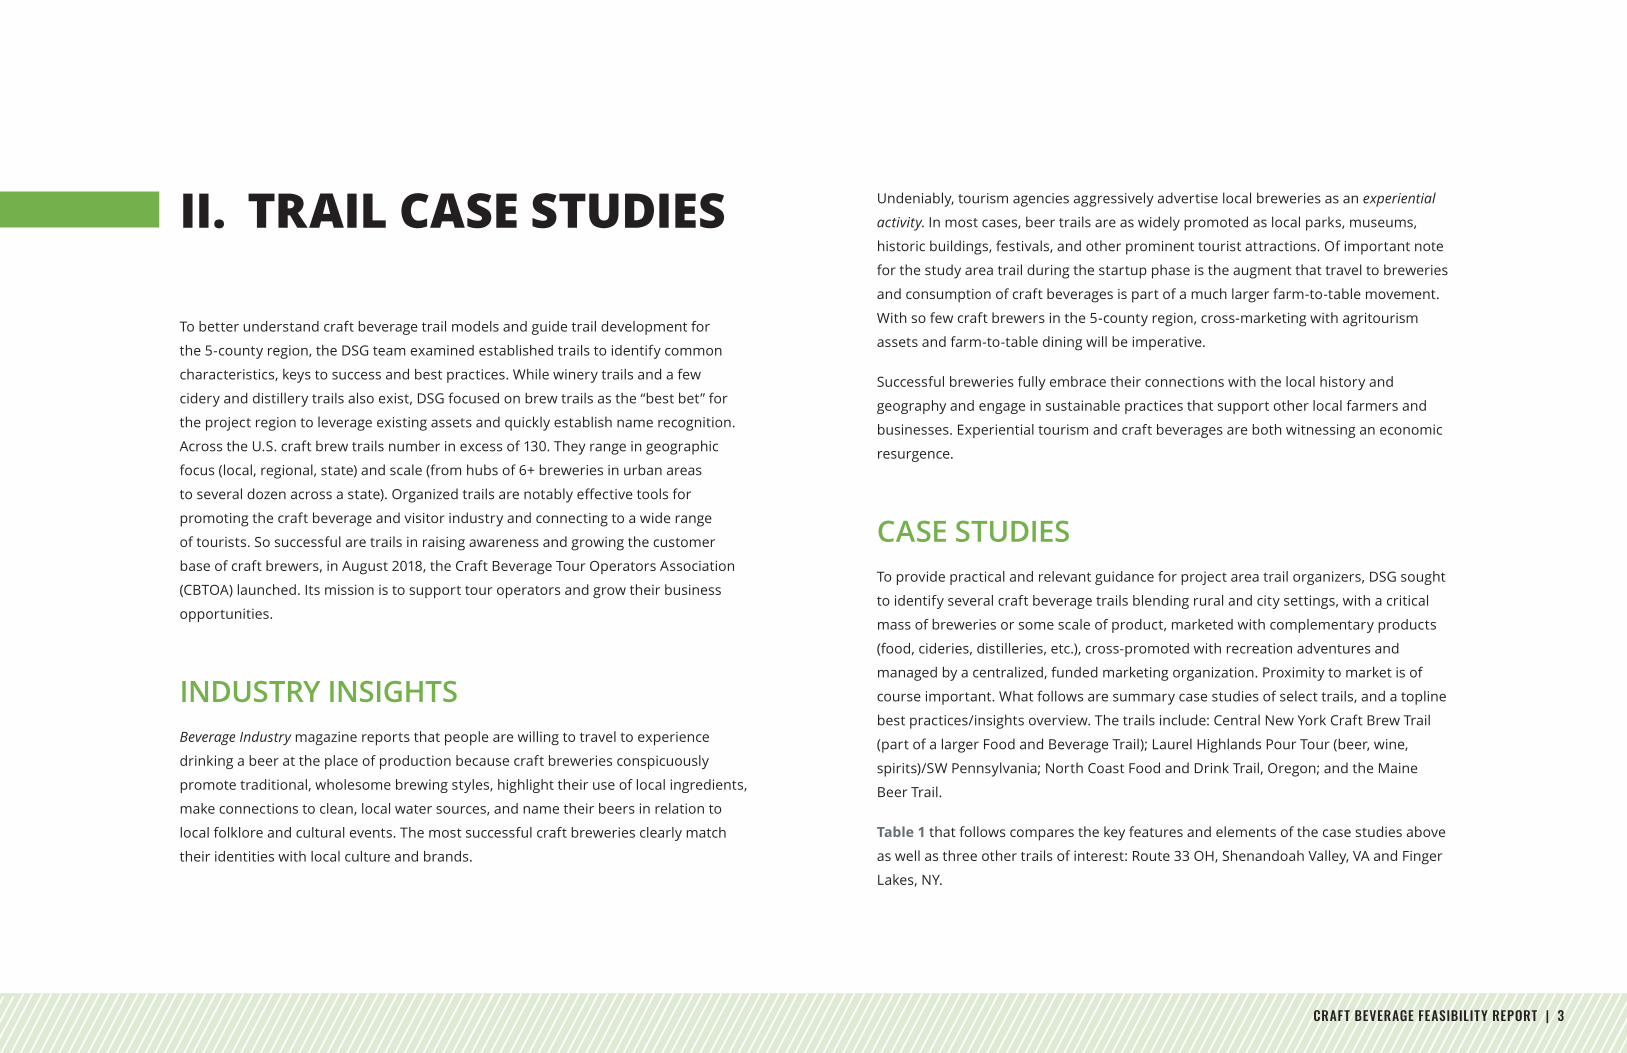
Central New York Food and Beverage Trail
Overview Part of a larger Central NY Food and Beverage Trail – 27 farm-sourcing restaurants, craft beverages (9), and other snack and dessert vendors
Location Madison County, New York
Size 5 beer, 1 wine, 2 spirits, 1 cider
Target Audience Foodies, drinkers
Features & Marketing Passport program
Trail is promoted on multiple sites (state tourism, upstate tourism, several cities and counties)
Brewer stories and videos are prominent on marketing sites, it’s often about the people/entrepreneurs
Lodging promotions: Hotels, B&B, Country Inns, Cottages, Campgrounds
Historic attractions: Historic Sites and Landmarks, Oneida Colony, National Abolitionist Hall of Fame
Site www.madisontourism.com/restaurants/central-new-york-food-and-beverage-trail/
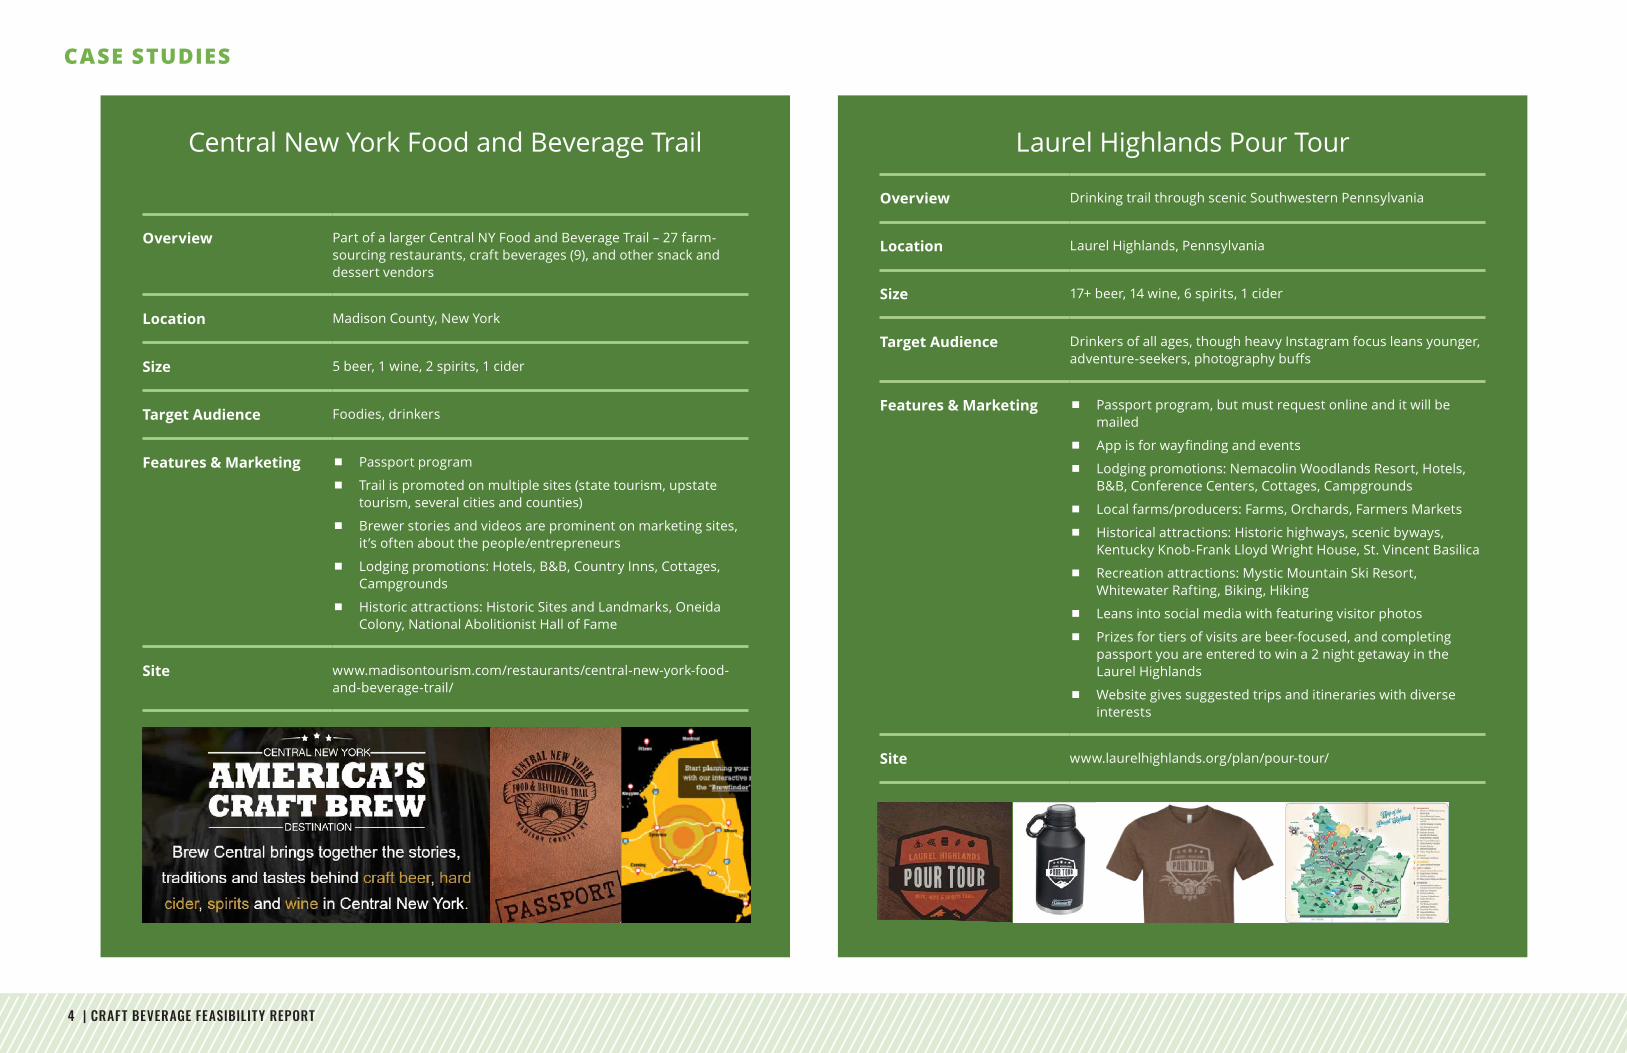
Laurel Highlands Pour Tour
Overview Drinking trail through scenic Southwestern Pennsylvania
Location Laurel Highlands, Pennsylvania
Size 17+ beer, 14 wine, 6 spirits, 1 cider
Target Audience Drinkers of all ages, though heavy Instagram focus leans younger, adventure-seekers,photographybuffs
Features & Marketing Passport program, but must request online and it will be mailed
Appisforwayfindingandevents
Lodging promotions: Nemacolin Woodlands Resort, Hotels, B&B, Conference Centers, Cottages, Campgrounds
Local farms/producers: Farms, Orchards, Farmers Markets
Historical attractions: Historic highways, scenic byways, Kentucky Knob-Frank Lloyd Wright House, St. Vincent Basilica
Recreation attractions: Mystic Mountain Ski Resort, Whitewater Rafting, Biking, Hiking
Leans into social media with featuring visitor photos
Prizes for tiers of visits are beer-focused, and completing passport you are entered to win a 2 night getaway in the Laurel Highlands
Website gives suggested trips and itineraries with diverse interests
Site www.laurelhighlands.org/plan/pour-tour/
CASE STUDIES
CRAFT BEVERAGE FEASIBILITY REPORT | 5
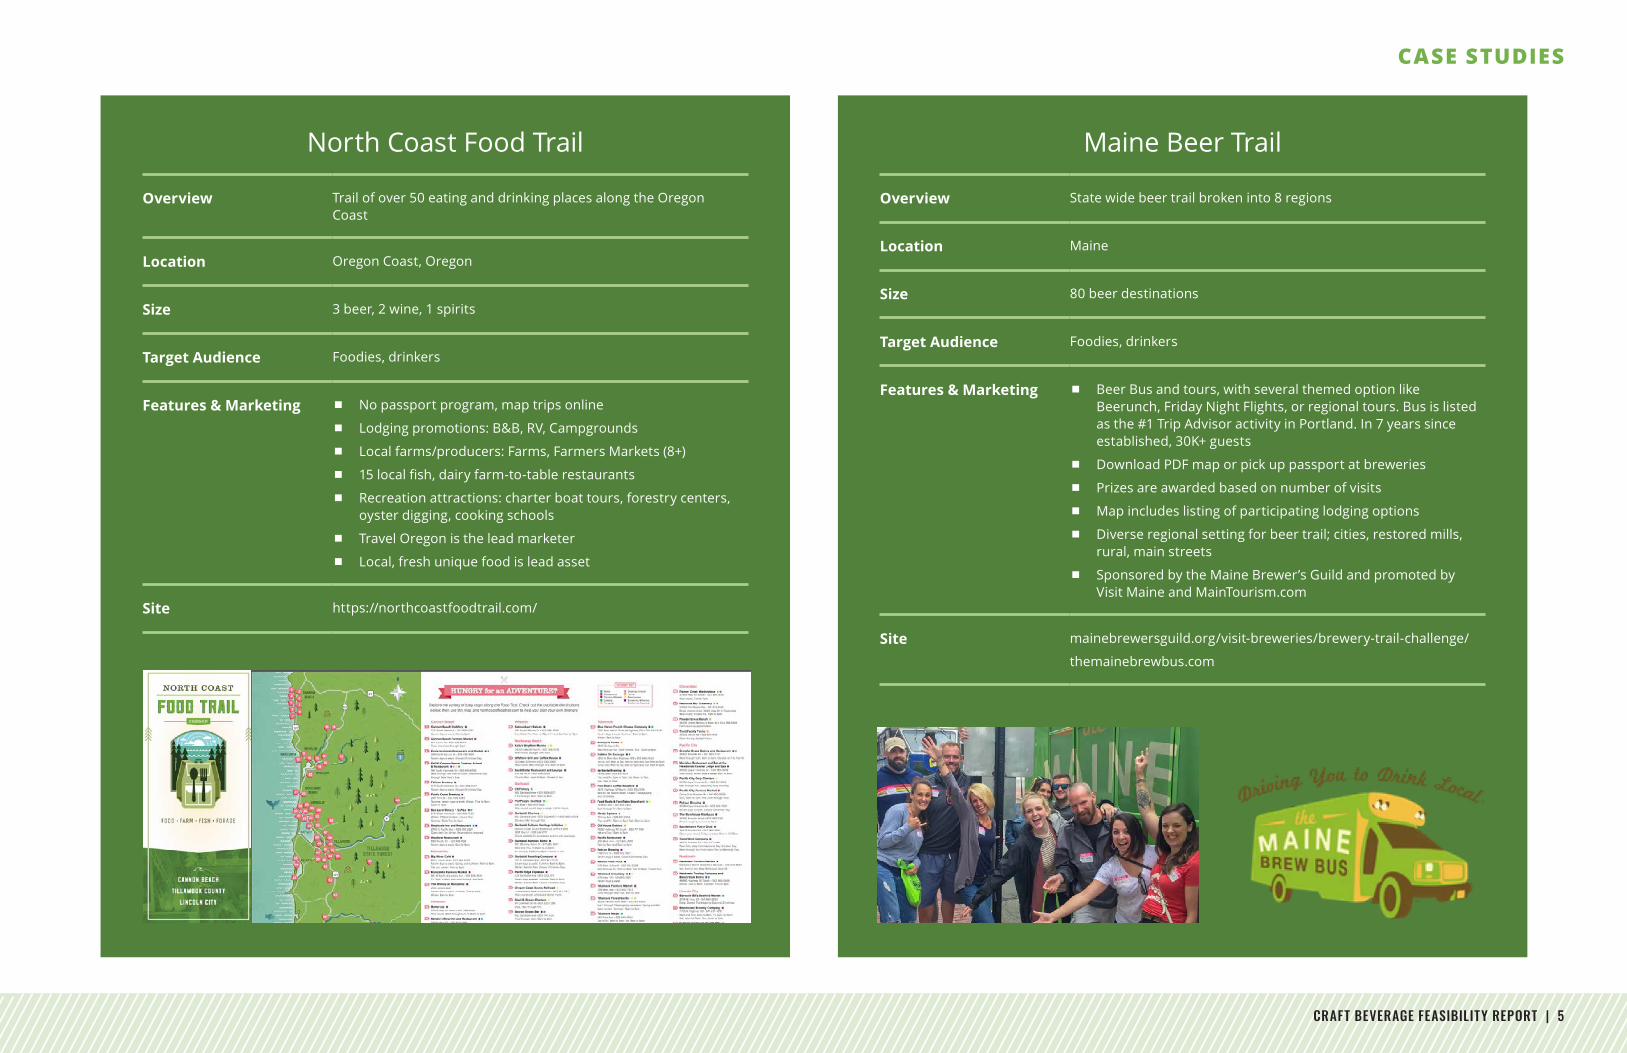
Maine Beer Trail
Overview State wide beer trail broken into 8 regions
Location Maine
Size 80 beer destinations
Target Audience Foodies, drinkers
Features & Marketing Beer Bus and tours, with several themed option like Beerunch, Friday Night Flights, or regional tours. Bus is listed as the #1 Trip Advisor activity in Portland. In 7 years since established, 30K+ guests
Download PDF map or pick up passport at breweries
Prizes are awarded based on number of visits
Map includes listing of participating lodging options
Diverse regional setting for beer trail; cities, restored mills, rural, main streets
Sponsored by the Maine Brewer’s Guild and promoted by Visit Maine and MainTourism.com
Site mainebrewersguild.org/visit-breweries/brewery-trail-challenge/
themainebrewbus.com
North Coast Food Trail
Overview Trail of over 50 eating and drinking places along the Oregon Coast
Location Oregon Coast, Oregon
Size 3 beer, 2 wine, 1 spirits
Target Audience Foodies, drinkers
Features & Marketing No passport program, map trips online
Lodging promotions: B&B, RV, Campgrounds
Local farms/producers: Farms, Farmers Markets (8+)
15localfish,dairyfarm-to-tablerestaurants
Recreation attractions: charter boat tours, forestry centers, oyster digging, cooking schools
Travel Oregon is the lead marketer
Local, fresh unique food is lead asset
Site https://northcoastfoodtrail.com/
CASE STUDIES
6 | CRAFT BEVERAGE FEASIBILITY REPORT
Trail Name & Description
Bee
r
Win
e
Spir
its
Cide
r
App
and
/or
Mob
ile P
assp
ort
Prog
ram
Prom
otio
n (M
aps,
Eve
nts,
M
arke
ting
)
Lodg
ing
Prom
otio
n
Loca
l Far
ms/
Prod
ucer
s
Farm
to T
able
Re
stau
rant
s
His
tori
c At
trac
tion
s
Recr
eati
on
Attr
acti
ons
Lead
ing
Ass
ets
for
Trai
l
Com
men
ts
Central New York Food & Beverage Trail
Madison County, New York
www.madisontourism.com/restaurants/central-new-york-food-and-beverage-trail
5 1 2 1
•Hotels•B & B•Country Inns•Cottages•Campgrounds
Historic Sites & LandmarksOneida ColonyNational Abolitionist Hall of Fame
Laurel Highlands Pour TourLaurel Highlands, PA
Beer, Wine & Spirits Trail
www.laurelhighlands.org/plan/pour-tour
17+ 14 6 1
Book passport online
Plan your own Pour Tour itinerary
•Nemacolin Woodlands Resort
•Hotels•B & B•Conference
Centers•Cottages•Campgrounds
•Farms•Orchards•Farmers
Markets
Historic HighwaysScenic BywaysKentuck Knob- Frank Lloyd Wright houseSt Vincent Basilica
•Mystic Mountain Ski Resort
•Whitewater Rafting
•Biking•Hiking
•1 Meadery
Route 33, OhioSupported by Visit Fairfield, Ohio
route33brewtrail.com
7
Pick up guide at breweries or Visitor’s Center
Brewtrail guide at FairfieldCounty
•Solely focused on brew trail. No additional Info on lodging, other tourism assets
Shenandoah ValleySpanning 6-counties and 2 Cities. Approx 60 miles
www.shenandoahspiritstrail.com
21 23 2 3
Register online after visiting 5 sites. Free t-shirt
Pocket guide & map request available online
•Farmers Markets
Website notes historic walking mall,
•Website notes shopping, dining, farmers markets, etc but no links on website.
Finger Lakes, New YorkExtensive brew trail covering 210 miles
fingerlakesbeertrail.com
132
Finger Lakes Brew Trail Map
•5 Designated Hotels listed on website
Genessee Country Village & MuseumCorning Museum of Glass
•Specificitinerariesandbeertrailpackagesofferedthroughparticipating hotels
•Tour & transportation providers can be arranged through website
North Coast, Oregon Food TrailSpanning 3 counties and 11 cities and 108 mi
(not including 8 breweries in Astoria area)
northcoastfoodtrail.com
3 2 1
Maps, trip ideas online
•B & B•RV
Campgrounds
•Farms•Farmers
Markets (8+)
15 local, uniquefish,dairy
•Charter boat tours, Forestry centers, oyster digging, cooking schools
Diverse, local fresh food
•Travel Oregon Is lead marketer
Maine Beer TrailStatewide beer trail broken into 8 regions
mainebrewersguild.org/visit-breweries/brewery-trail-challenge
themainebrewbus.com
80
Download pdf map or pick up map at breweries
Prizes/awards based on number of visits
•Map includes listing of participating lodging options
Map lists participating restaurants
Diverse, regional settings for beer trail. Cities, restored mills, rural, main streets.
•Sponsored by the Maine Brewer’s Guild and promoted by Visit Maine and MaineTourism.com
•The Maine Brew Bus hosts numerous themed tours. 5,300 guests In 2016.
TABLE 1. Craft Beverage Trails and Features
CRAFT BEVERAGE FEASIBILITY REPORT | 7
BEST PRACTICESThe craft beverage trail case study research revealed several themes and best practice
insights that will be useful in the development of a successful study area trail and that
aresummarizedbelow.Mostidentifiedthemesareapplicabletoanycraftfoodand
beverage trail’s success.
1. Focus on Key Target Customers – active, adventurous, with disposable income
According to Nielsen, a weekly craft drinker is predominantly male, ages 21-34, and makes
between $75,000 and $99,000 annually. They typically have higher disposable income
and prefer to spend it on food and drinks (See #4 below). Additionally, common links
between brew trails and this target demographic include sporting events, adventure
outdoor sports (from kayaking to rock climbing), hunting and music/brew festivals.
However, opportunities to attract more female drinkers (31% of the market) are strong
particularly if breweries and food/beverage trails cross-promote with music/artisan/
craft events/activities, outdoor recreation, local culture and other place-based features
of a trail’s geography (See #4 below).
2. Seek Partnership and Collaboration
By their nature, beer and food/beverage trails are highly collaborative wherein the
participants must agree on the geographic breadth, the product focus and critical
marketing tools. The most successful trails are ones actively partnering with and
promoted by local/regional visitor marketing organizations, like the state tourism
agencies and convention and visitor bureaus (CVBs) that are dominant in West Virginia.
Other examples of collaboration include linking to other locally crafted goods and
services through connection with restaurant and lodging associations, for example,
craft beverage groups such as wineries and distilleries and farm experiences. As noted,
linking recreation/park attractions to local craft beverages can be a highly productive
collaboration. One West Virginia example is that of Greenbrier Valley Brewing Company
that partnered with Pipestem Resort State Park in collaboration with West Virginia
State Parks. The brewery released 35 Parks Pale Ale and a portion of proceeds are
donated to the Nature Conservancy’s work in West Virginia. Perhaps one of the most
important but understated collaborations stems from the spark and inspiration
of entrepreneurs working together and added creativity, ingenuity and value to
the craft beverage sector at the local level. Local economies are the winners when
entrepreneurial success attracts more of the same.
3. Provide Critical Mass (20+) of Quality Assets– leading with Food and Drink
Easilyimaginedistheneedforandbenefitofacraftbeverageorfoodanddrink
trail of at least 20 participants to become a true visitor magnet. Yet visitor industry
professionals also agree that a trail can quickly become saturated with too many
destinations—often of uneven quality and an over-abundance of choices for visitors.
The visitor development organization, Travel Oregon has successfully branded
the state as a national and international culinary (food and beverage) destination
for travelers. In so doing, it has helped local communities and regions with the
creationofovereightculinarytrailsthatarecarefullycuratedwithsignificantlocally-
generated products and services. These include breweries and wineries, farm-to-table
restaurants, farms and ranches, farmers markets and retail, cafes and bakeries, and
unique lodging.
4. Lean in to Community and Placemaking
Brewtrailsandbreweriesthemselvesarefrequentlynotedassignificantcontributors
to a community and region’s sense of place, identity and authentic, sustainable local
economies. Often breweries locate in historic, underutilized or quaint buildings
that may be rough around the edges but are aesthetically appealing, adaptable and
affordable–andlendasenseofauthenticity.Manybrewerieshavebeenknownto
help catalyze downtown or neighborhood district development—especially as they
activate blocks during evening hours. In the right location, breweries connect with and
impact the community in multiple ways – shopping, services, entertainment, history
andculture—reinforcingtolocalresidentsandvisitorsallthings‘localanddistinctive’
that American consumers now crave. The second and third level of impact of brewery
trail development is often that they directly or indirectly encourage visiting additional
experiential activities that contribute to a regional sense of place and brand with
potentialbenefitstomultipletraveldestinations.
8 | CRAFT BEVERAGE FEASIBILITY REPORT
5. Creative Marketing and Promotions from maps, events, cooperative marketing
There are a handful of consistently used marketing tools and promotions across case
trails.
Maps provide a framework for marketing a sense of place. Mass-
produced beer companies have engaged in overt forms of advertising for decades;
tourism agencies should seek assistance from cartographers to advertise craft
beveragecompaniesaswell.Awell-designed,effectivemapcouldpromotenot
only the lure of craft beverages, but also persuade visitors to travel to a region,
enjoy the local environs, explore back roads, engage in a range of experiential
activities,andinshort,influencethesuccessofaregion.(Intheageofmobile
maps,it’slessaboutthewayfindingandmoreaboutprovidingacohesivetrip-
planning tool).
Overall,thereare3keypurposesforabrewerytrailmap:Wayfinding,Trip
Planning,orMarketing.Effectivelylinkingtoothertraveldestinationsiskeyfor
brewery maps, in particular, connecting to wineries and distilleries.
Why include more than other drinking spots? If most people using the internet to
view a tourism website are in the initial stages of gathering ideas and planning a
trip,designingamapthateffectivelypromotesthegenerallocationsofbreweries
andassistsindiscoveringadditionaloff-the-beatenpathactivitiesmaypotentially
generate regional development. A good illustration of a trail map that links craft
breweries with food and other destinations is the East Gorge Food Trail Guide
promoting a rural region of Oregon. See Appendix C. In an era of readily available
in-car navigation systems and smart phones, communicating what else a visitor
can do, eat, or see in an area may be much more important than knowing how to
get there.
Passport Programs (Mobile and Paper). Nielsen’s research on the typical
craft beer drinker shows that this group enjoys the prestige factor and feeling like
an‘insider,’likelyadriverbehindthesuccessofpassportprogramsandtiered
rewards, another marketing tool found to be common and encourage repeat visits.
Apps and Mobile Capabilities reach your target audience where they already are – on their phone! Just like websites were marketing staples 10
years ago, mobile apps have emerged as substitutes, especially for consumer-
oriented products and services. Beer trail participants use creative ways to get
and keep users on the app including maps, mobile passports, special promotions,
eventsand‘deals’oftheday.
Itinerary plans – one, two and three day are most popular. Making trip
planningeasierforusersarethepre-madeitineraries.Sometrailsofferedplans
bydaycount,othersbypersonalityortripgoals(outdoorsvs.historybuffs).See
Charleston, WV CVB’s very good itineraries on the Hip, Historic, Almost Heaven
site.
Social media, especially Instagram where photos do the talking. The target demographic will already be taking and sharing pictures and tagging
locations. Trails that leverage social media with a #hashtag, or a “place” to check in
gain free name recognition and marketing.
Craft Beverage Producer Stories, Videos and Media coverage offer a more authentic connection to place. Insider access and insight to the
people behind the beer, wine and distilled spirits lends prestige and helps to forge
a connection.
CRAFT BEVERAGE FEASIBILITY REPORT | 9
III. INVENTORY OF ASSETS
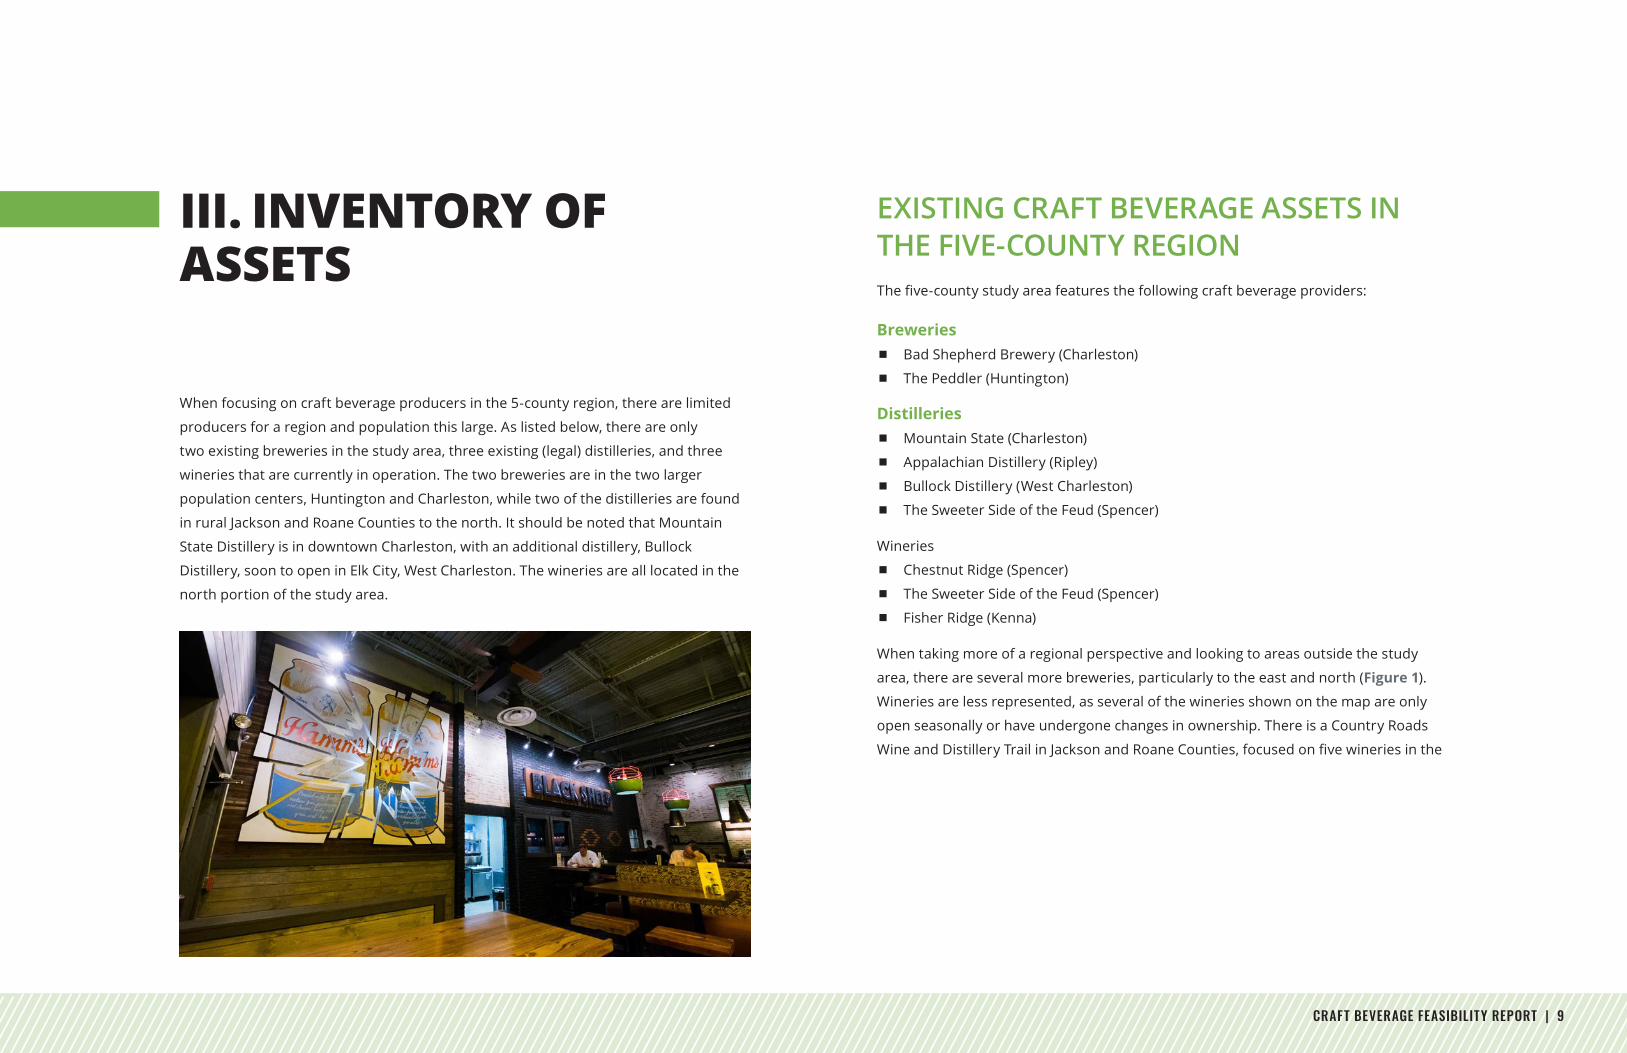
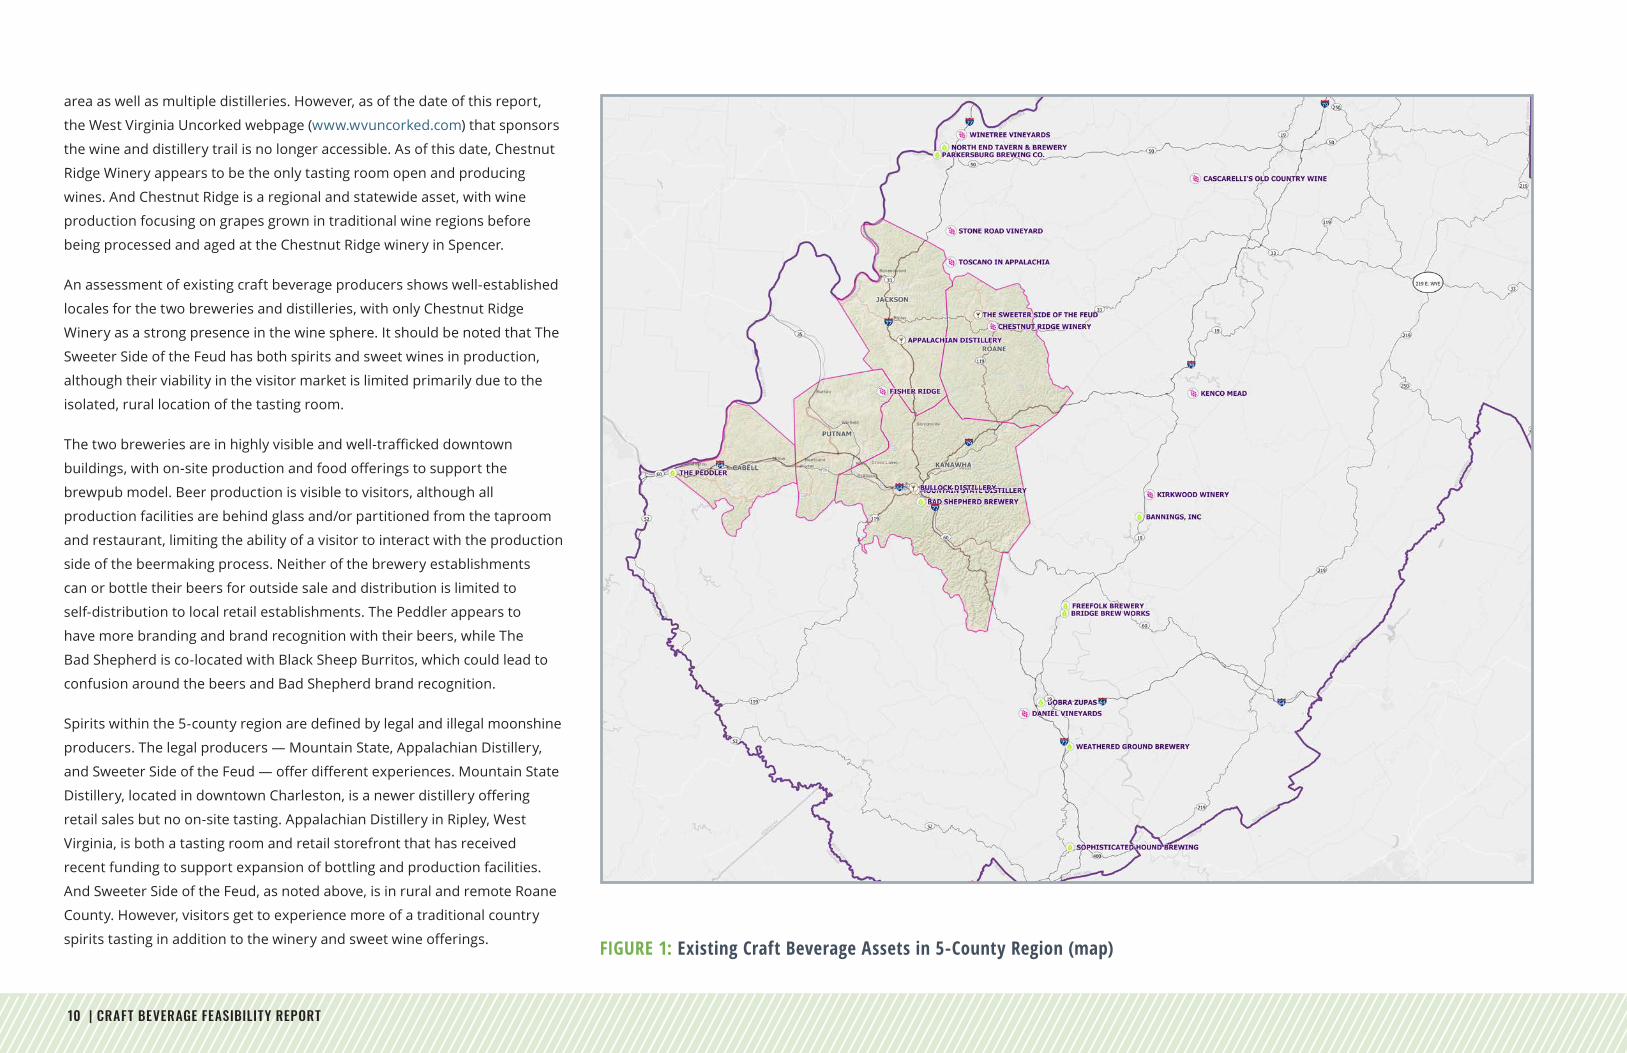
When focusing on craft beverage producers in the 5-county region, there are limited
producers for a region and population this large. As listed below, there are only
two existing breweries in the study area, three existing (legal) distilleries, and three
wineries that are currently in operation. The two breweries are in the two larger
population centers, Huntington and Charleston, while two of the distilleries are found
in rural Jackson and Roane Counties to the north. It should be noted that Mountain
State Distillery is in downtown Charleston, with an additional distillery, Bullock
Distillery, soon to open in Elk City, West Charleston. The wineries are all located in the
north portion of the study area.
EXISTING CRAFT BEVERAGE ASSETS IN THE FIVE-COUNTY REGIONThefive-countystudyareafeaturesthefollowingcraftbeverageproviders:
Breweries Bad Shepherd Brewery (Charleston)
The Peddler (Huntington)
Distilleries Mountain State (Charleston)
Appalachian Distillery (Ripley)
Bullock Distillery (West Charleston)
The Sweeter Side of the Feud (Spencer)
Wineries
Chestnut Ridge (Spencer)
The Sweeter Side of the Feud (Spencer)
Fisher Ridge (Kenna)
When taking more of a regional perspective and looking to areas outside the study
area, there are several more breweries, particularly to the east and north (Figure 1).
Wineries are less represented, as several of the wineries shown on the map are only
open seasonally or have undergone changes in ownership. There is a Country Roads
WineandDistilleryTrailinJacksonandRoaneCounties,focusedonfivewineriesinthe
10 | CRAFT BEVERAGE FEASIBILITY REPORT
area as well as multiple distilleries. However, as of the date of this report,
the West Virginia Uncorked webpage (www.wvuncorked.com) that sponsors
the wine and distillery trail is no longer accessible. As of this date, Chestnut
Ridge Winery appears to be the only tasting room open and producing
wines. And Chestnut Ridge is a regional and statewide asset, with wine
production focusing on grapes grown in traditional wine regions before
being processed and aged at the Chestnut Ridge winery in Spencer.
An assessment of existing craft beverage producers shows well-established
locales for the two breweries and distilleries, with only Chestnut Ridge
Winery as a strong presence in the wine sphere. It should be noted that The
Sweeter Side of the Feud has both spirits and sweet wines in production,
although their viability in the visitor market is limited primarily due to the
isolated, rural location of the tasting room.
Thetwobreweriesareinhighlyvisibleandwell-traffickeddowntown
buildings,withon-siteproductionandfoodofferingstosupportthe
brewpub model. Beer production is visible to visitors, although all
production facilities are behind glass and/or partitioned from the taproom
and restaurant, limiting the ability of a visitor to interact with the production
side of the beermaking process. Neither of the brewery establishments
can or bottle their beers for outside sale and distribution is limited to
self-distribution to local retail establishments. The Peddler appears to
have more branding and brand recognition with their beers, while The
Bad Shepherd is co-located with Black Sheep Burritos, which could lead to
confusion around the beers and Bad Shepherd brand recognition.
Spiritswithinthe5-countyregionaredefinedbylegalandillegalmoonshine
producers. The legal producers — Mountain State, Appalachian Distillery,
andSweeterSideoftheFeud—offerdifferentexperiences.MountainState
Distillery,locatedindowntownCharleston,isanewerdistilleryoffering
retail sales but no on-site tasting. Appalachian Distillery in Ripley, West
Virginia, is both a tasting room and retail storefront that has received
recent funding to support expansion of bottling and production facilities.
And Sweeter Side of the Feud, as noted above, is in rural and remote Roane
County. However, visitors get to experience more of a traditional country
spiritstastinginadditiontothewineryandsweetwineofferings. FIGURE 1: Existing Craft Beverage Assets in 5-County Region (map)
CRAFT BEVERAGE FEASIBILITY REPORT | 11
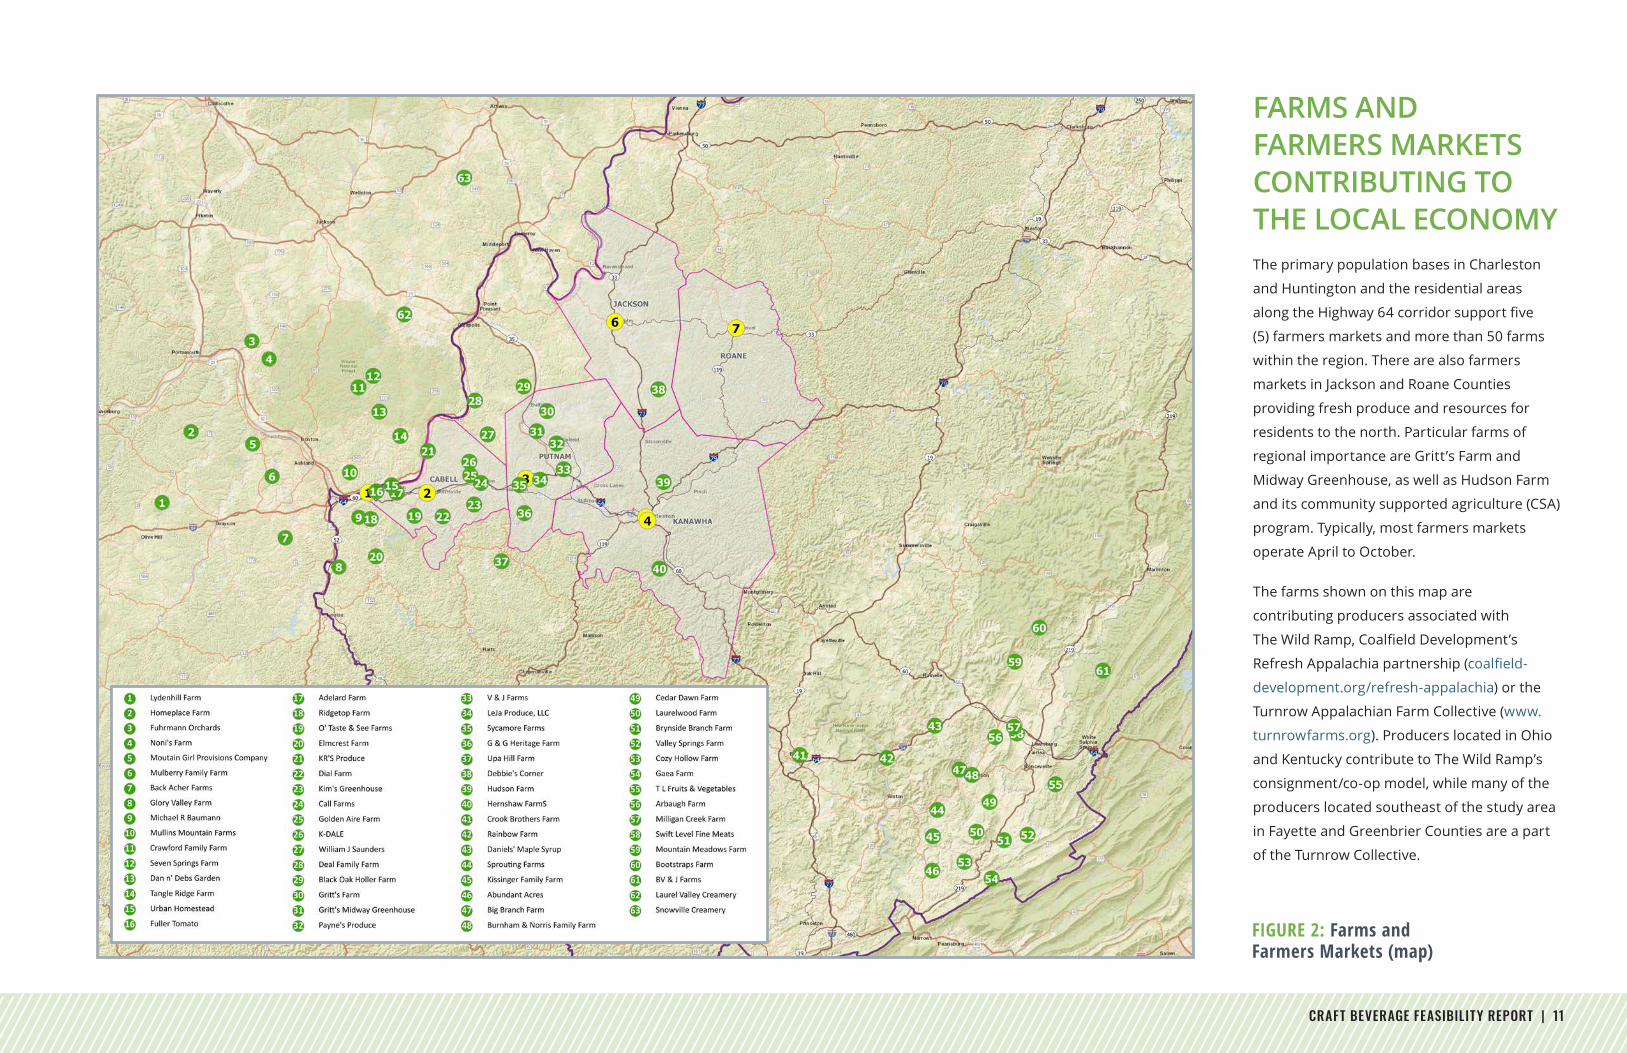
FARMS AND FARMERS MARKETS CONTRIBUTING TO THE LOCAL ECONOMYThe primary population bases in Charleston
and Huntington and the residential areas
alongtheHighway64corridorsupportfive
(5) farmers markets and more than 50 farms
within the region. There are also farmers
markets in Jackson and Roane Counties
providing fresh produce and resources for
residents to the north. Particular farms of
regional importance are Gritt’s Farm and
Midway Greenhouse, as well as Hudson Farm
and its community supported agriculture (CSA)
program. Typically, most farmers markets
operate April to October.
The farms shown on this map are
contributing producers associated with
TheWildRamp,CoalfieldDevelopment’s
Refresh Appalachia partnership (coalfield-
development.org/refresh-appalachia) or the
Turnrow Appalachian Farm Collective (www.
turnrowfarms.org). Producers located in Ohio
and Kentucky contribute to The Wild Ramp’s
consignment/co-op model, while many of the
producers located southeast of the study area
in Fayette and Greenbrier Counties are a part
of the Turnrow Collective.
FIGURE 2: Farms and Farmers Markets (map)
12 | CRAFT BEVERAGE FEASIBILITY REPORT
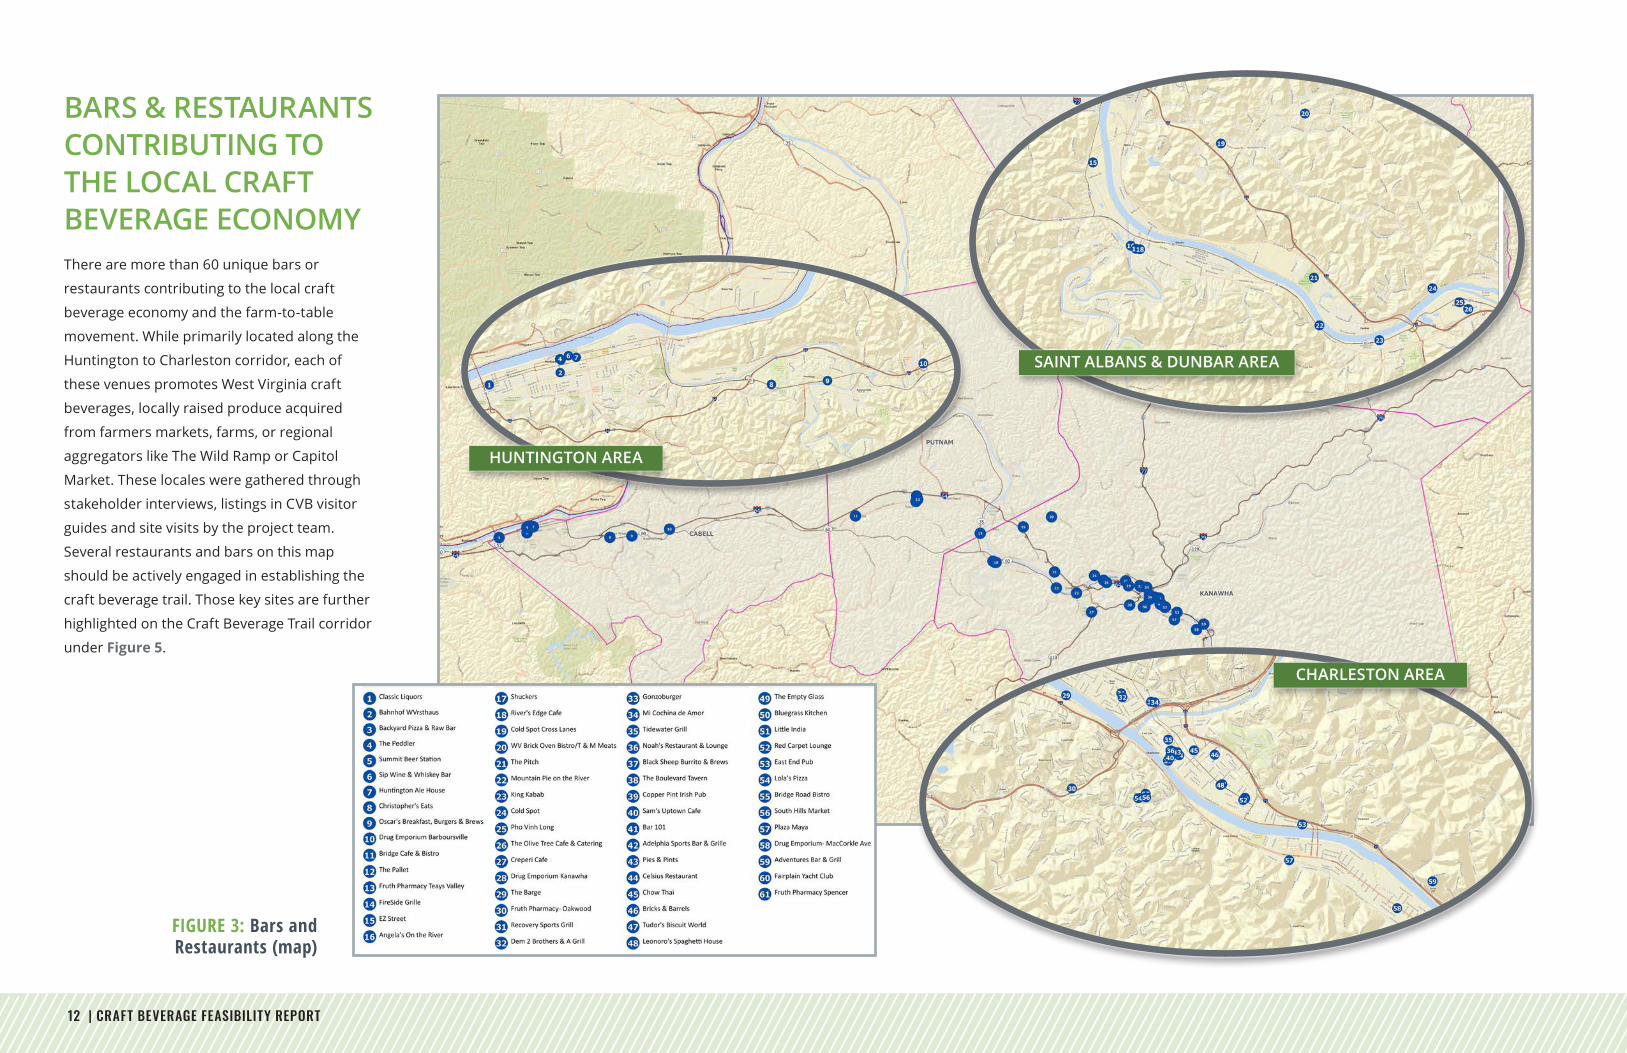
BARS & RESTAURANTS CONTRIBUTING TO THE LOCAL CRAFT BEVERAGE ECONOMYThere are more than 60 unique bars or
restaurants contributing to the local craft
beverage economy and the farm-to-table
movement. While primarily located along the
Huntington to Charleston corridor, each of
these venues promotes West Virginia craft
beverages, locally raised produce acquired
from farmers markets, farms, or regional
aggregators like The Wild Ramp or Capitol
Market. These locales were gathered through
stakeholder interviews, listings in CVB visitor
guides and site visits by the project team.
Several restaurants and bars on this map
should be actively engaged in establishing the
craft beverage trail. Those key sites are further
highlighted on the Craft Beverage Trail corridor
under Figure 5.
FIGURE 3: Bars and Restaurants (map)
SAINT ALBANS & DUNBAR AREA
HUNTINGTON AREA
CHARLESTON AREA
CRAFT BEVERAGE FEASIBILITY REPORT | 13
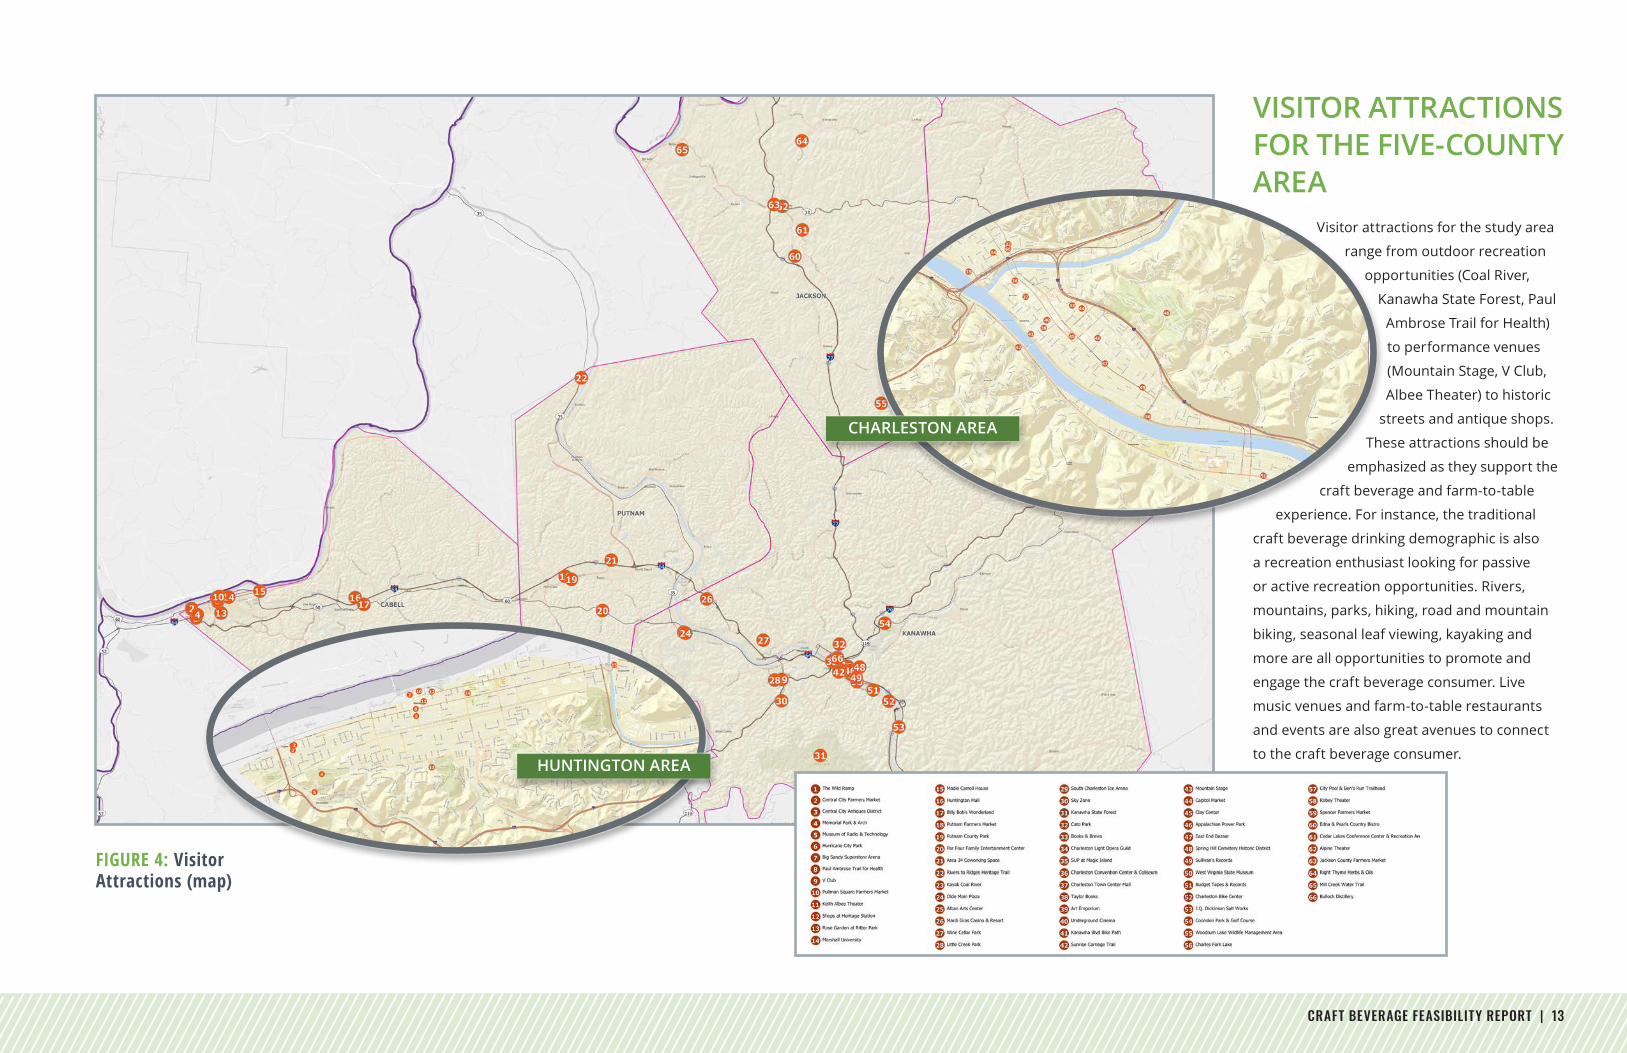
VISITOR ATTRACTIONS FOR THE FIVE-COUNTY AREA
Visitor attractions for the study area
range from outdoor recreation
opportunities (Coal River,
Kanawha State Forest, Paul
Ambrose Trail for Health)
to performance venues
(Mountain Stage, V Club,
Albee Theater) to historic
streets and antique shops.
These attractions should be
emphasized as they support the
craft beverage and farm-to-table
experience. For instance, the traditional
craft beverage drinking demographic is also
a recreation enthusiast looking for passive
or active recreation opportunities. Rivers,
mountains, parks, hiking, road and mountain
biking, seasonal leaf viewing, kayaking and
more are all opportunities to promote and
engage the craft beverage consumer. Live
music venues and farm-to-table restaurants
and events are also great avenues to connect
to the craft beverage consumer.
CHARLESTON AREA
HUNTINGTON AREA
FIGURE 4: Visitor Attractions (map)
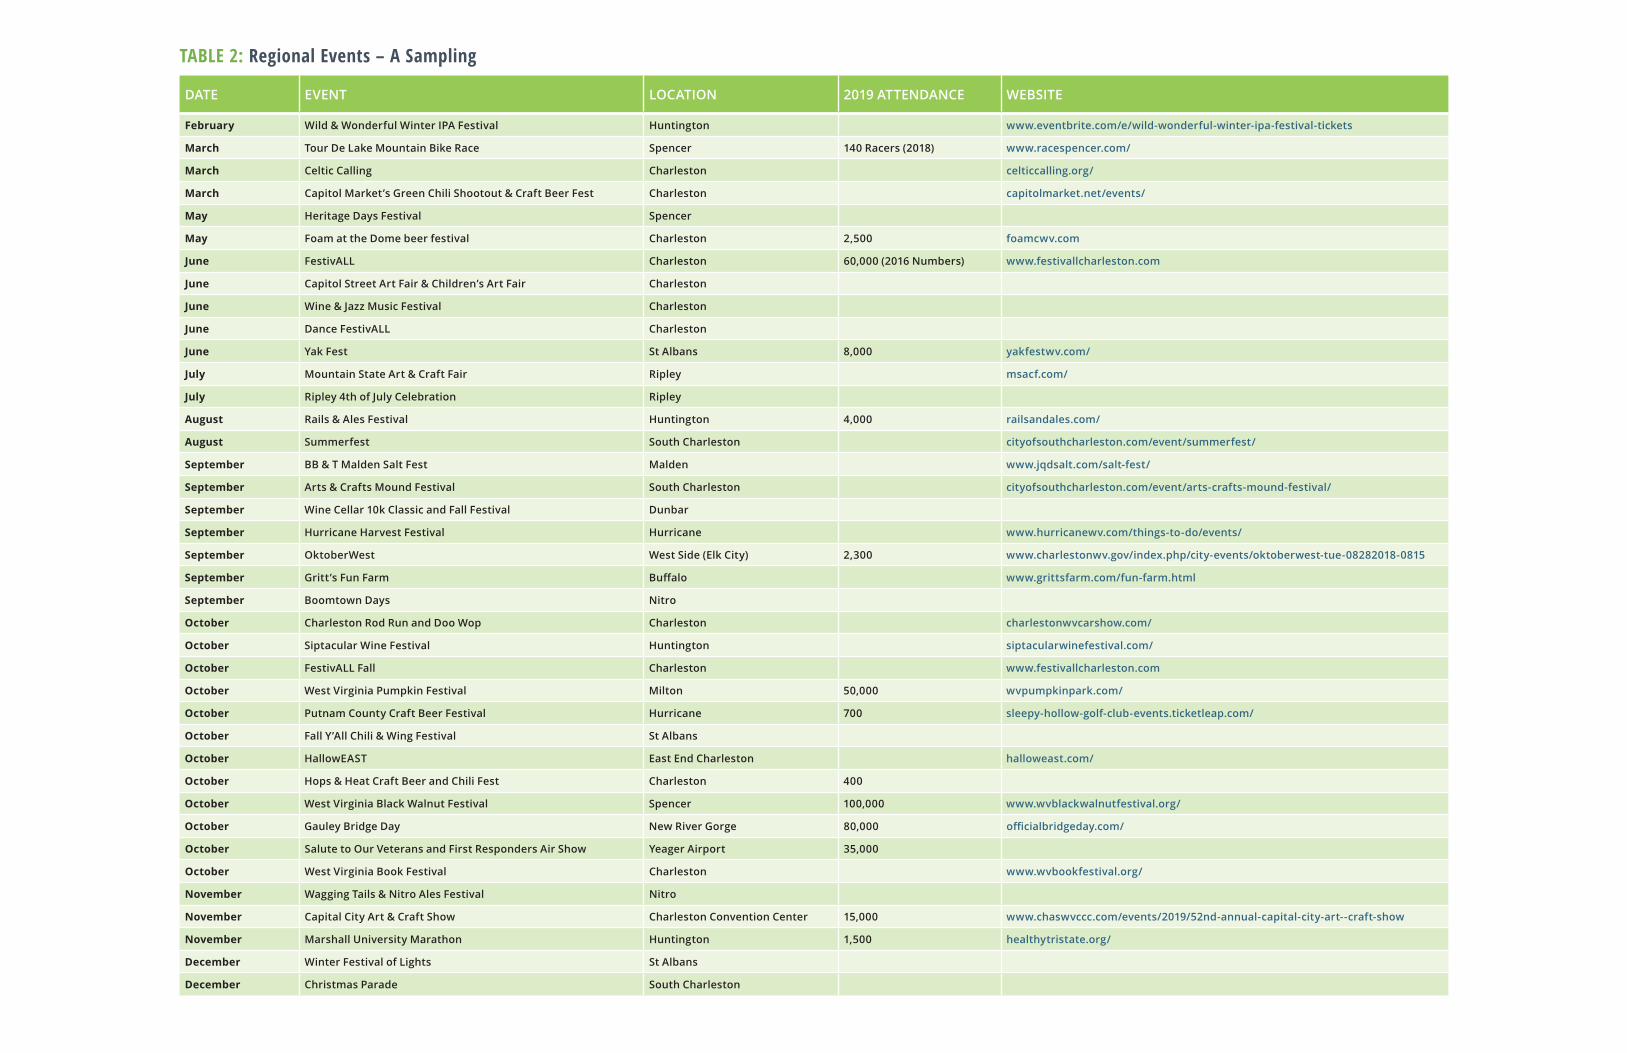
DATE EVENT LOCATION 2019 ATTENDANCE WEBSITE
February Wild & Wonderful Winter IPA Festival Huntington www.eventbrite.com/e/wild-wonderful-winter-ipa-festival-tickets
March Tour De Lake Mountain Bike Race Spencer 140 Racers (2018) www.racespencer.com/
March Celtic Calling Charleston celticcalling.org/
March Capitol Market’s Green Chili Shootout & Craft Beer Fest Charleston capitolmarket.net/events/
May Heritage Days Festival Spencer
May Foam at the Dome beer festival Charleston 2,500 foamcwv.com
June FestivALL Charleston 60,000 (2016 Numbers) www.festivallcharleston.com
June Capitol Street Art Fair & Children’s Art Fair Charleston
June Wine & Jazz Music Festival Charleston
June Dance FestivALL Charleston
June Yak Fest St Albans 8,000 yakfestwv.com/
July Mountain State Art & Craft Fair Ripley msacf.com/
July Ripley 4th of July Celebration Ripley
August Rails & Ales Festival Huntington 4,000 railsandales.com/
August Summerfest South Charleston cityofsouthcharleston.com/event/summerfest/
September BB & T Malden Salt Fest Malden www.jqdsalt.com/salt-fest/
September Arts & Crafts Mound Festival South Charleston cityofsouthcharleston.com/event/arts-crafts-mound-festival/
September Wine Cellar 10k Classic and Fall Festival Dunbar
September Hurricane Harvest Festival Hurricane www.hurricanewv.com/things-to-do/events/
September OktoberWest West Side (Elk City) 2,300 www.charlestonwv.gov/index.php/city-events/oktoberwest-tue-08282018-0815
September Gritt’s Fun Farm Buffalo www.grittsfarm.com/fun-farm.html
September Boomtown Days Nitro
October Charleston Rod Run and Doo Wop Charleston charlestonwvcarshow.com/
October Siptacular Wine Festival Huntington siptacularwinefestival.com/
October FestivALL Fall Charleston www.festivallcharleston.com
October West Virginia Pumpkin Festival Milton 50,000 wvpumpkinpark.com/
October Putnam County Craft Beer Festival Hurricane 700 sleepy-hollow-golf-club-events.ticketleap.com/
October Fall Y’All Chili & Wing Festival St Albans
October HallowEAST East End Charleston halloweast.com/
October Hops & Heat Craft Beer and Chili Fest Charleston 400
October West Virginia Black Walnut Festival Spencer 100,000 www.wvblackwalnutfestival.org/
October Gauley Bridge Day New River Gorge 80,000 officialbridgeday.com/
October Salute to Our Veterans and First Responders Air Show Yeager Airport 35,000
October West Virginia Book Festival Charleston www.wvbookfestival.org/
November Wagging Tails & Nitro Ales Festival Nitro
November Capital City Art & Craft Show Charleston Convention Center 15,000 www.chaswvccc.com/events/2019/52nd-annual-capital-city-art--craft-show
November Marshall University Marathon Huntington 1,500 healthytristate.org/
December Winter Festival of Lights St Albans
December Christmas Parade South Charleston
TABLE 2: Regional Events – A Sampling
CRAFT BEVERAGE FEASIBILITY REPORT | 15
SUMMARY OF VISITOR ASSETS The 5-county study area has very strong visitor assets to leverage, promote and grow
in support of a collaborative marketing campaign to successfully expand the attraction
of this target market to a craft beverage/culinary trail. A synopsis of the chief attractors
follows, with a broader assessment including challenges and opportunities in the
Roadmap section.
>40 Agritourism venues: 5 Farmer’s Markets and 50 Farms.
61 unique Bars and Restaurants
Nearly 40 events throughout the region that attract thousands of visitors year-
round
65 Attractions of interest to beer drinkers from national/state parks and theatres
to unique retailers
Performance destinations: e.g., Culture Center Theatre, Charleston, WV with over
50 performances/year, anchored by Mountain Stage weekly PBS broadcast and the
Keith Albee Performing Arts Center, Huntington
Charleston Convention Center- recently completed a $100M remodel and is rapidly
growing the convention/meeting market, stimulating potential for extended stays
or repeat visitation.
Excellent supply of hotels/lodging venues, including over 100 AirBnB rentals in the
region. Cabell County is home to 1500 rooms with >60% occupancy in 2018 and in
Kanawha County/Charleston, 3500 rooms and >65% occupancy.
12+Visitor Marketing orgs– CVBs, Campaigns, Trails. The Charleston brand of Hip,
Historic, Almost Heaven marketing campaign is an excellent example of how to
package and cross-promote local/regional assets toward the visitor market.
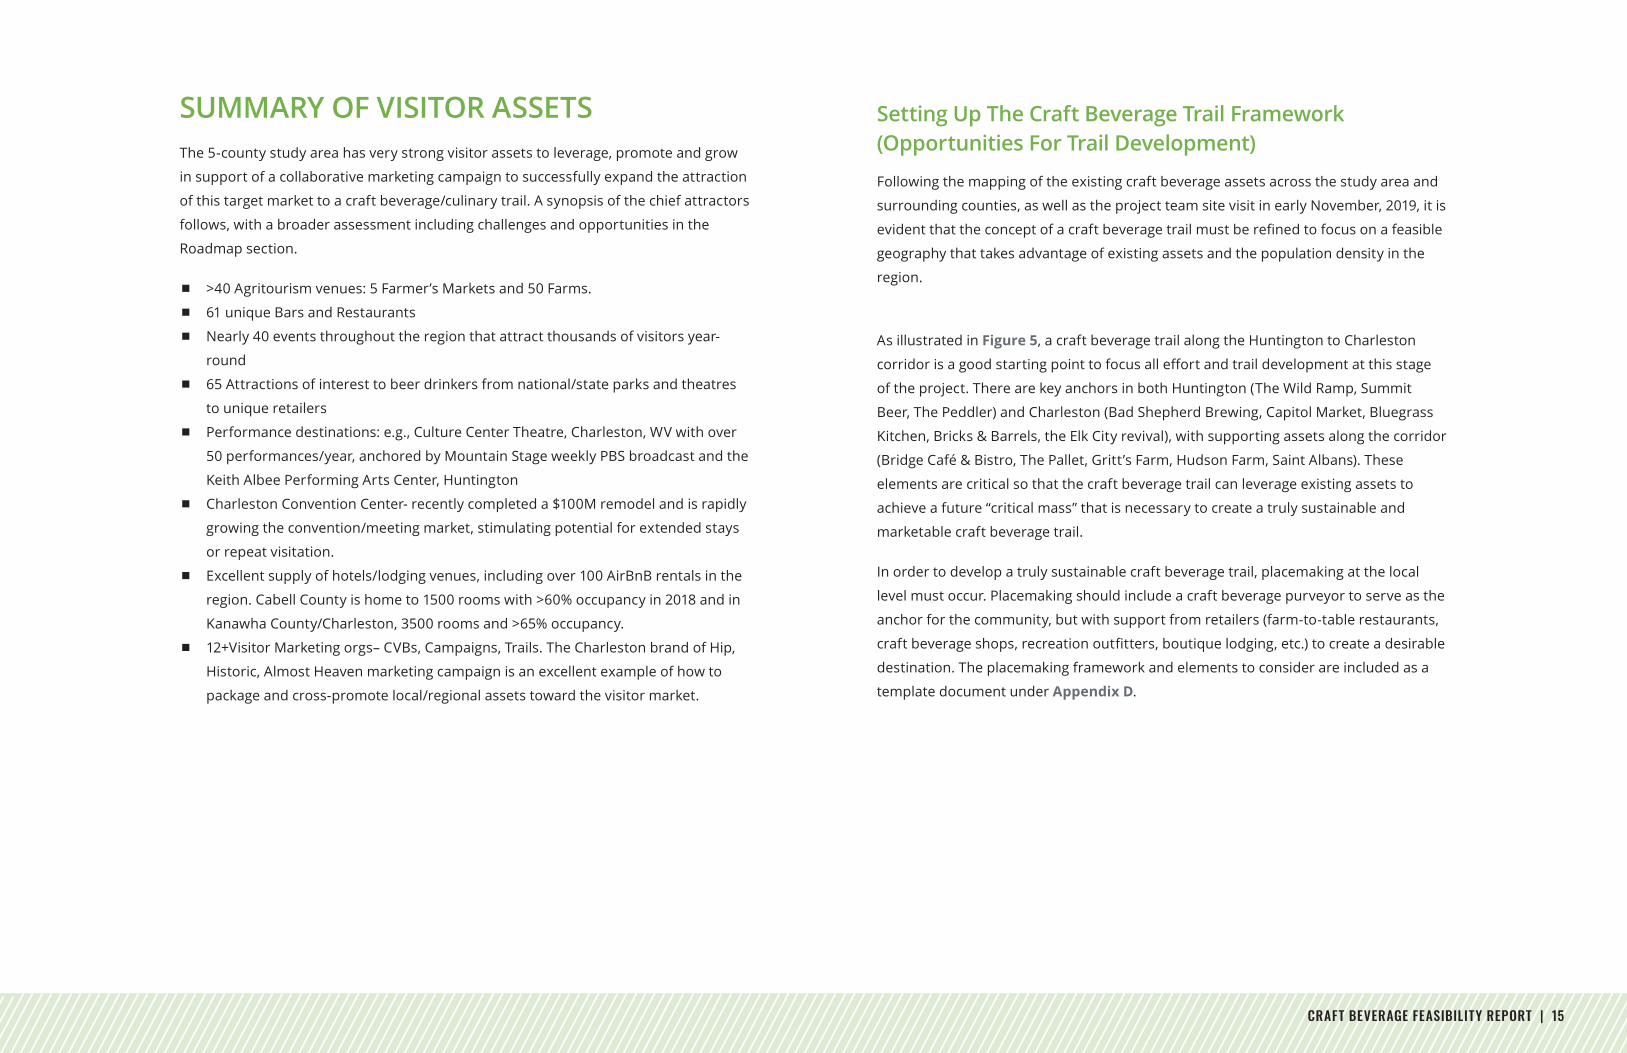
Setting Up The Craft Beverage Trail Framework (Opportunities For Trail Development)
Following the mapping of the existing craft beverage assets across the study area and
surrounding counties, as well as the project team site visit in early November, 2019, it is
evidentthattheconceptofacraftbeveragetrailmustberefinedtofocusonafeasible
geography that takes advantage of existing assets and the population density in the
region.
As illustrated in Figure 5, a craft beverage trail along the Huntington to Charleston
corridorisagoodstartingpointtofocusalleffortandtraildevelopmentatthisstage
of the project. There are key anchors in both Huntington (The Wild Ramp, Summit
Beer, The Peddler) and Charleston (Bad Shepherd Brewing, Capitol Market, Bluegrass
Kitchen, Bricks & Barrels, the Elk City revival), with supporting assets along the corridor
(Bridge Café & Bistro, The Pallet, Gritt’s Farm, Hudson Farm, Saint Albans). These
elements are critical so that the craft beverage trail can leverage existing assets to
achieve a future “critical mass” that is necessary to create a truly sustainable and
marketable craft beverage trail.
In order to develop a truly sustainable craft beverage trail, placemaking at the local
level must occur. Placemaking should include a craft beverage purveyor to serve as the
anchor for the community, but with support from retailers (farm-to-table restaurants,
craftbeverageshops,recreationoutfitters,boutiquelodging,etc.)tocreateadesirable
destination. The placemaking framework and elements to consider are included as a
template document under Appendix D.
THE WILD RAMP/CENTRAL CITY
Located in Huntington’s Historic Central City, The Wild Ramp is a year-round, non-profit farmers market with a missionto support a vibrant local economy and community. The Wild Ramp works with regional producers on a consignment model, offering top value to supportfarmers and artisans. The market is a prime anchor for Central City and a key player in the regional craft beverage and farm-to-table movement.
http://wildramp.org/
2 THE PEDDLERLocated at 835 3rd Avenue, The Peddler is a microbrewery/restaurant in the heart of downtown Huntington. Owners Drew & Megan Hetzer are experienced entrepreneurs that have teamed with Head Brewer Jay Fox to create a brewery and restaurant that is both a community and regional draw. Jay is also on the Rails & Ales Beer Festival committee. Now in its second year, The Peddler is ready to expand distribution into the Charleston and Huntington markets.
https://www.facebook.com/The-Peddler-389850314486735/
3 SUMMIT BEER STATIONSummit Beer Station is a craft beer bar focused on promoting local and regional producers.OwnerJeffMcKayhasrootedhis business on the higher end of the craft beer market in West Virginia. As co-founder of the Rails & Ales Beer Festival, Jeffhas establishedwhat is consistentlythe best beer festival in the state. Summit Beer Station is located around the corner from the Peddler at 321 9th Street in Huntington.
https://www.facebook.com/summitbeerstation
4 BRIDGE CAFÉ & BISTROBridge Café & Bistro in Hurricane serves breakfast, lunch and dinner focused on promoting regional producers. This farm-to-table restaurant has been in operation since January 2017. Owners Andrew and Ashley Stewart are active partners in the community; each month the café has a “Farm to Table Wine and Dine” event with a five-coursemeal andwine pairings. Aportion of those proceeds are donated to the local farmer’s market.
https://www.facebook.com/bridgecafebistro
5 THE PALLETA craft beer bar in Teays Valley serving unique and sought after West Virginia beers. This bar attracts both locals and regional visitors with creative game nights, holiday celebrations, and a strong presence on social media.
https://www.facebook.com/thepalletbarwv/
6 GRITT’S FARMSince 1927, Gritt’s Farm has been a landmark in the Kanawha Valley. The farm offers pick your own produce,agritourism, and a community supported agriculture (CSA) model. The farm has a relationship with other growers and suppliers to support a local movement. Most providers are within a 50-mile radius of the farm. The farm hosts an annual farm-to-table dinner series supporting regional chefs and showcasing the seasonal harvest.
http://www.grittsfarm.com/
7 HISTORIC ELK CITY NEIGHBORHOOD
Charleston’s West Side aka “Elk City” is experiencing a renaissance with new businesses and beautification projectspopping up throughout the district. Recent investment has created a hip, artistic vibe for the corridor. The Bullock Distillery is set toopen thefirstquarter2020, providing further energy and visitor attraction to the area. The annual OktoberWest craft beer and music festival in the fall is a huge draw for Elk City. There are several vacant, historic buildings with the potential to support a craft beverage producer.
https://www.facebook.com/elkcitycharlestonwv/
8 BAD SHEPHERD BREWING
Housed at the Black Sheep Burrito restaurant in Charleston, Bad Shepherd is an award-winning brewery in operation since 2016. Centrally located in downtown Charleston, Bad Shepherd has brewedmorethan202differentbeersforboth the Black Sheep Burrito locations in Charleston and Huntington. The brewery has begun canning several of their beers for purchase on-site. Also, Bad Shepherd is a monthly participant in the Pints for a Purpose cause, raising money for local charities. http://blacksheepwv.com/charleston/bad-shepherd-brewery/
9 CAPITOL MARKETLocated in a former train depot at the edge of downtown Charleston, the Capitol Market is a year-round indoor/outdoor market promoting local farms and seasonal produce. Within the indoor market there is fresh seafood and meat, acoffeebar,cheeseandwinebar, freshproduce, artisan chocolates and Soho’s Italian restaurant. The Capitol Market has been a staple in the Charleston area for 20 plus years. The market supports more than 40 West Virginia farmers and artisans through both the indoor and outdoor market.
http://capitolmarket.net/
10 BRICKS & BARRELSJust down the street from Capitol Market and Appalachian Power Park, Bricks & Barrels is a steak and seafood restaurant with a beer tap list promoting West Virginia local and regional beers. Owners Matt and Nicky Holbert are active in the community and passionate about supporting local producers. Matt and Nicky have both been involved in the regional craft beverage movement and recently opened Axes & Ales in downtown Charleston.
http://www.bricksnbarrels.com/
11 BLUEGRASS KITCHENLocated near the West Virginia State Capitol, Bluegrass Kitchen is a longstanding institution focused on farm-to-table comfort food made from ingredients sourced within West Virginia and the Appalachians. The beer menu at the restaurant features West Virginia beers and ciders. Bluegrass Kitchen serves as the perfect example for a restaurant supporting the craft beverage and local farm-to-table economy!
http://bluegrasswv.com/
12 HUDSON FARMOver the course of the last 20 years, Hudson Farms has been providing local, organically-produced vegetables and farm products for consumers in the Charleston area. Located just 20 minutes north of Charleston, Hudson Farms features a CSA program, several farm-to-table events per year and ongoing workshops and mentorships for young farmers throughout West Virginia. Terry Hudson, the farm founder, is a biodynamic farmer deeply invested in promoting the local farm economy.
http://www.hudsonfarmswv.com/
1 2 3 4 5 6
7 8 9 10 11 12
FIGURE 5: Regional Attractions Map
CRAFT BEVERAGE FEASIBILITY REPORT | 17
FIGURE 6: Beer, Wine, & Spirits Consumers
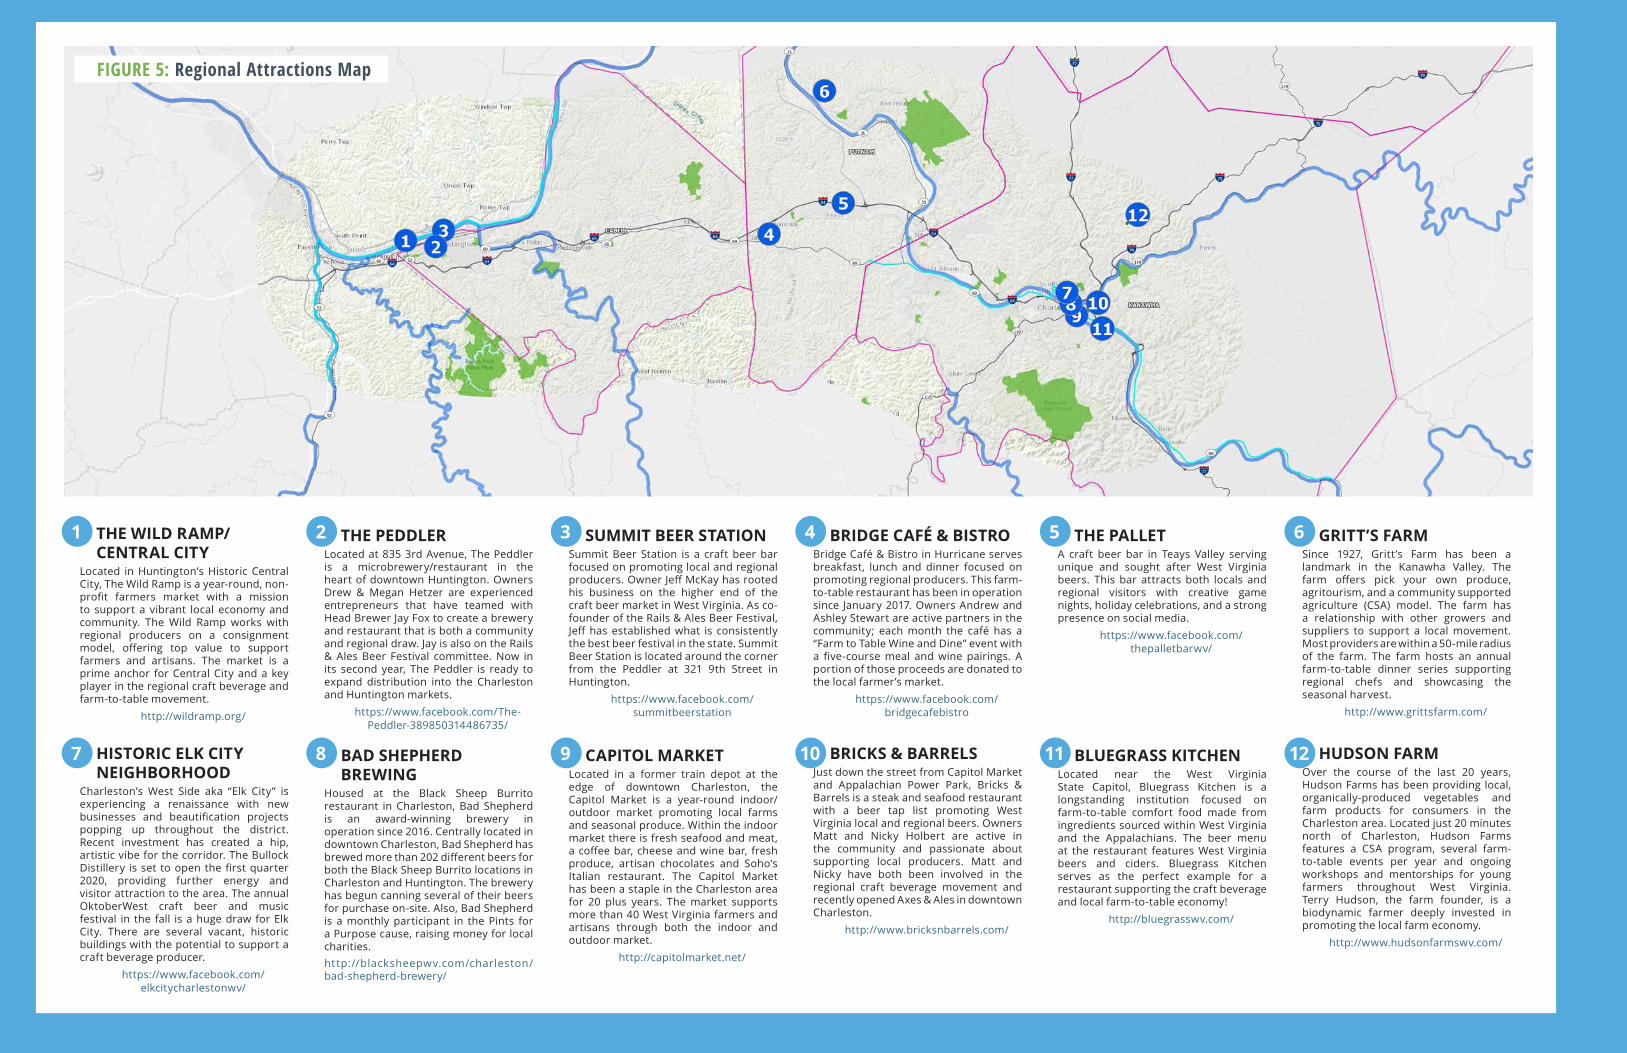
TABLE 3: Overview of Craft Beverage Market Consumers
Beverage Market Overview Consumer Overview (as available)
BeerGrowing – with microbreweries representing the fastest growing beer segment
Younger,moremales,highaffinityforoutdoor activities, upper incomes
WineOverall sales stalling but direct-to-consumer sales (including tasting rooms) seeing high growth
Older, more females, upper incomes
Spirits High growth Younger, more males
Cider Local brands showing growth Younger, gender-split equally, health and wellness interests
Kombucha Growing interest linked to healthy eating
Younger, health and wellness interests
Source: Marketek
IV. GROWTH POTENTIALHOW BIG CAN IT BE?
To begin, craft beverage consumer segments are highlighted below followed by details
on the consumer market for the 5-county trail.
CRAFT BEVERAGE MARKET OVERVIEWWhile there is strong interest among project Trail champions in developing and
promoting a wide range of craft beverages, it is important to note that industry trend
watchers observe that crossover among drink types is relatively low, with just 27%
of drinkers saying they drink wine, beer and spirits. The exhibits below illustrate the
uniqueconsumergroupsaffiliatedwithleadingcraftbeverages.
Additional details on market trends for craft beverage segments may be found in
Appendix E.
Wine
Beer
Spirits
Wine category includes still and sparkling wines. Beer category includes flavoredmaltbeveragesandciders.
Source: Nielsen Homescan Panel, total US 52 weeks ending June 29, 2019.
“We believe we can do great things in West Virginia, but we must take chances to make it happen.”
Melissa Stewart, Patriot Guardens Program, WV National Guard
Exclusively spirits6% of people/
2% of $
Exclusively wine15% of people/
4% of $
Wine and Beer
19% of people/ 7% of $
Beer and Spirits
8% of people/ 9% of $
Wine/Beer/Spirits
27% of people/ 55% of $Wine
and Spirits7% of people/
7% of $
Exclusively beer18% of people/
7% of $
18 | CRAFT BEVERAGE FEASIBILITY REPORT
THE CONSUMER MARKET PROFILEThe success of a craft beverage and food trail is directly linked to the size and
characteristicsofthecustomermarket.TheDSGteamidentifiesanddefinesthetarget
market groups as:
1. Local— residents and employees
2. Visitors—recreation and business
3. Region—A larger base of potential day and overnight visitors.
Thissectionprofileseachofthesemarketsectorsfollowedbyanoverviewoftheir
expected spending on craft brews or beverages. The demand discussion sets the stage
foridentificationofthepotentialforadditionalcraftbreweries
1. Local Residents and Employees of the 5-County Market Area
Currently, over half of the region’s households are at or above the median income,
with 45% at or above average income. Over one-third of the population is between the
ages of 25 and 54 – a group who typically eats and drinks out more than their younger
or older neighbors. However, forecasts show an anticipated negative population
growth of -0.44% over the next 5 years. The region’s employment base and population
are on a slow but steady decline and incomes are modest—making visitor market
expansion imperative to the craft brew trail’s success. Table 4 is a snapshot of the
local marketplace. Note however that 58% of the population is at or above the median
income,adefiningcharacteristicofcraftbeveragedrinkers.
Employees working in the 5-county region are an important captive market for a
variety of retail, service and entertainment businesses and have been estimated to
spend about 15% of their expendable income close to their work location.
The potential growth and impact of employee retail spending is directly linked to
theAdvantageValley’sefforttoexpandtheregion’semploymentparticularlyin20
key business opportunities in agriculture, manufacturing, services and healthcare.
Businessandjobdiversificationandgrowthwillhelpstimulateopportunitiesinand
enhance the area’s restaurant, retail and entertainment base.
At present, within the 5-county region, there are 13,100 businesses employing about
205,400 people. Many of these employees reside outside the market area but have the
potential to contribute to sales re: beverage, food and entertainment services provided
within the area. Area businesses also generate overnight guests who spend on retail
and restaurants and are a large share of the hotel and craft beverage customer base.
Table 5 provides a breakdown of business and employees by type. The largest share
of business type and employees are considered White Collar (66% of all businesses
andemployeesinthearea).WhiteCollarincludesOffice,clerical,administrative,sales,
professional, and technical employees.
The unemployment rate is about 5%, 0.3% higher than the West Virginia state’s
unemployment. Over the last decade, the civilian workforce has steadily declined in the
5-county area and both the Huntington and Charleston MSAs (Source: Workforce West
Virginia).
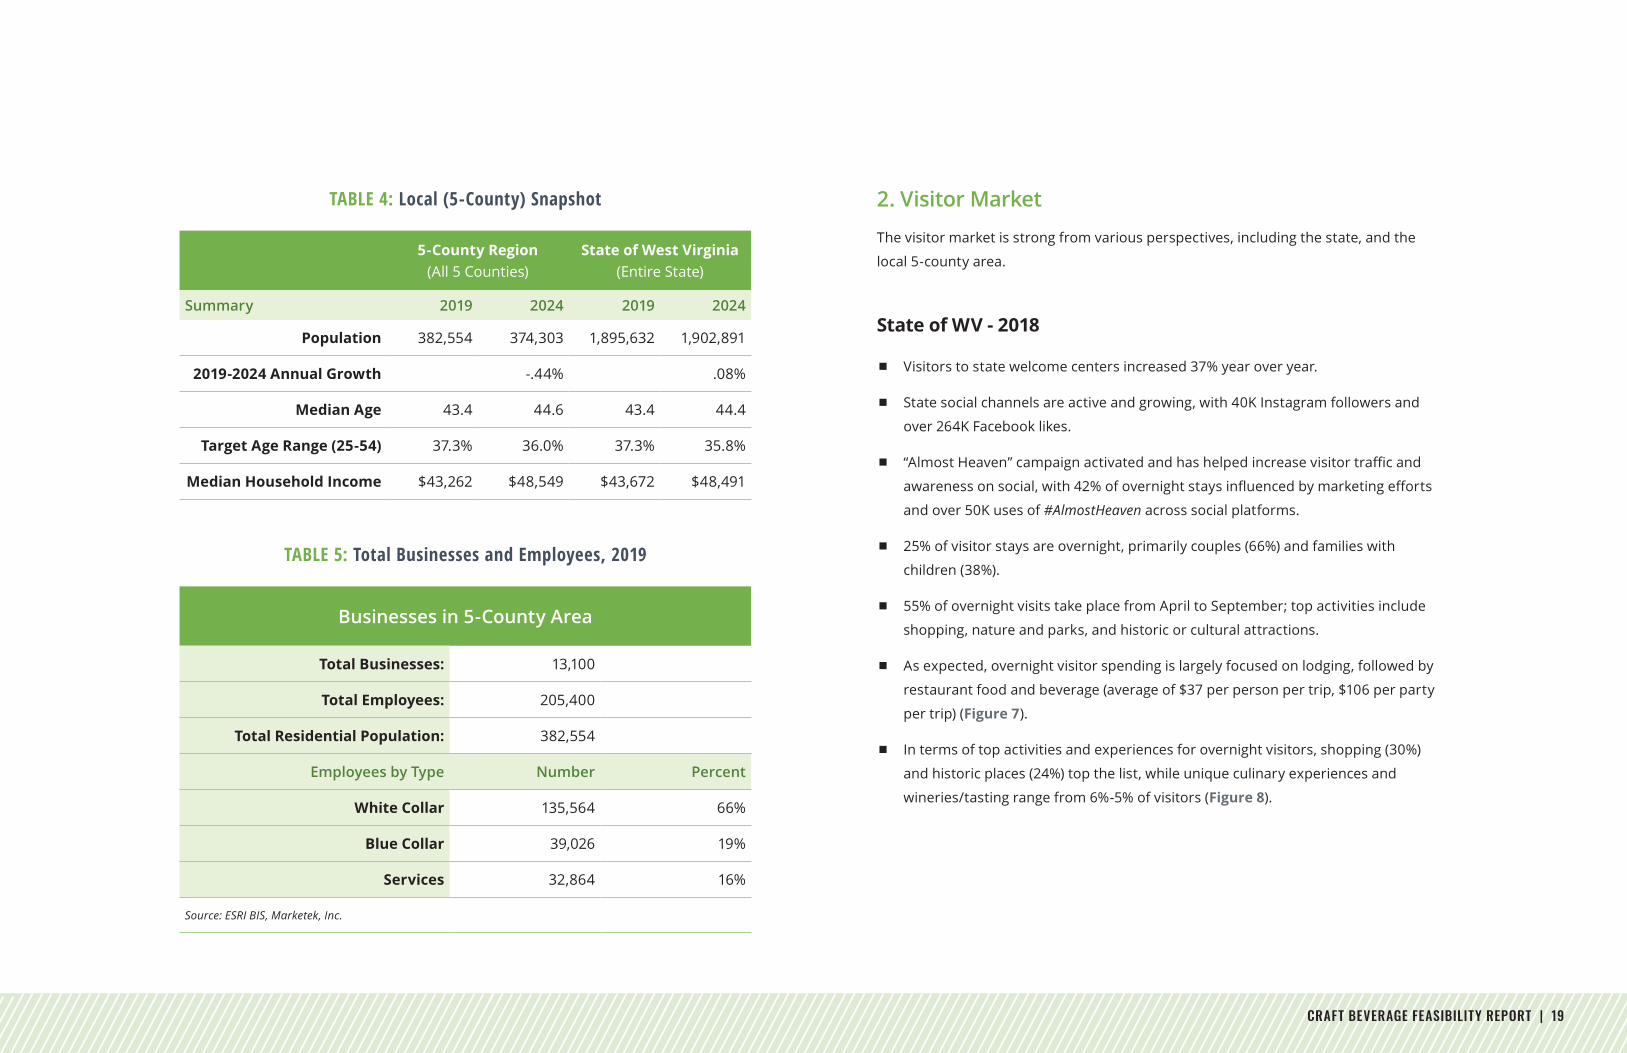
CRAFT BEVERAGE FEASIBILITY REPORT | 19
TABLE 4: Local (5-County) Snapshot
5-County Region(All 5 Counties)
State of West Virginia(Entire State)
Summary 2019 2024 2019 2024
Population 382,554 374,303 1,895,632 1,902,891
2019-2024 Annual Growth -.44% .08%
Median Age 43.4 44.6 43.4 44.4
Target Age Range (25-54) 37.3% 36.0% 37.3% 35.8%
Median Household Income $43,262 $48,549 $43,672 $48,491
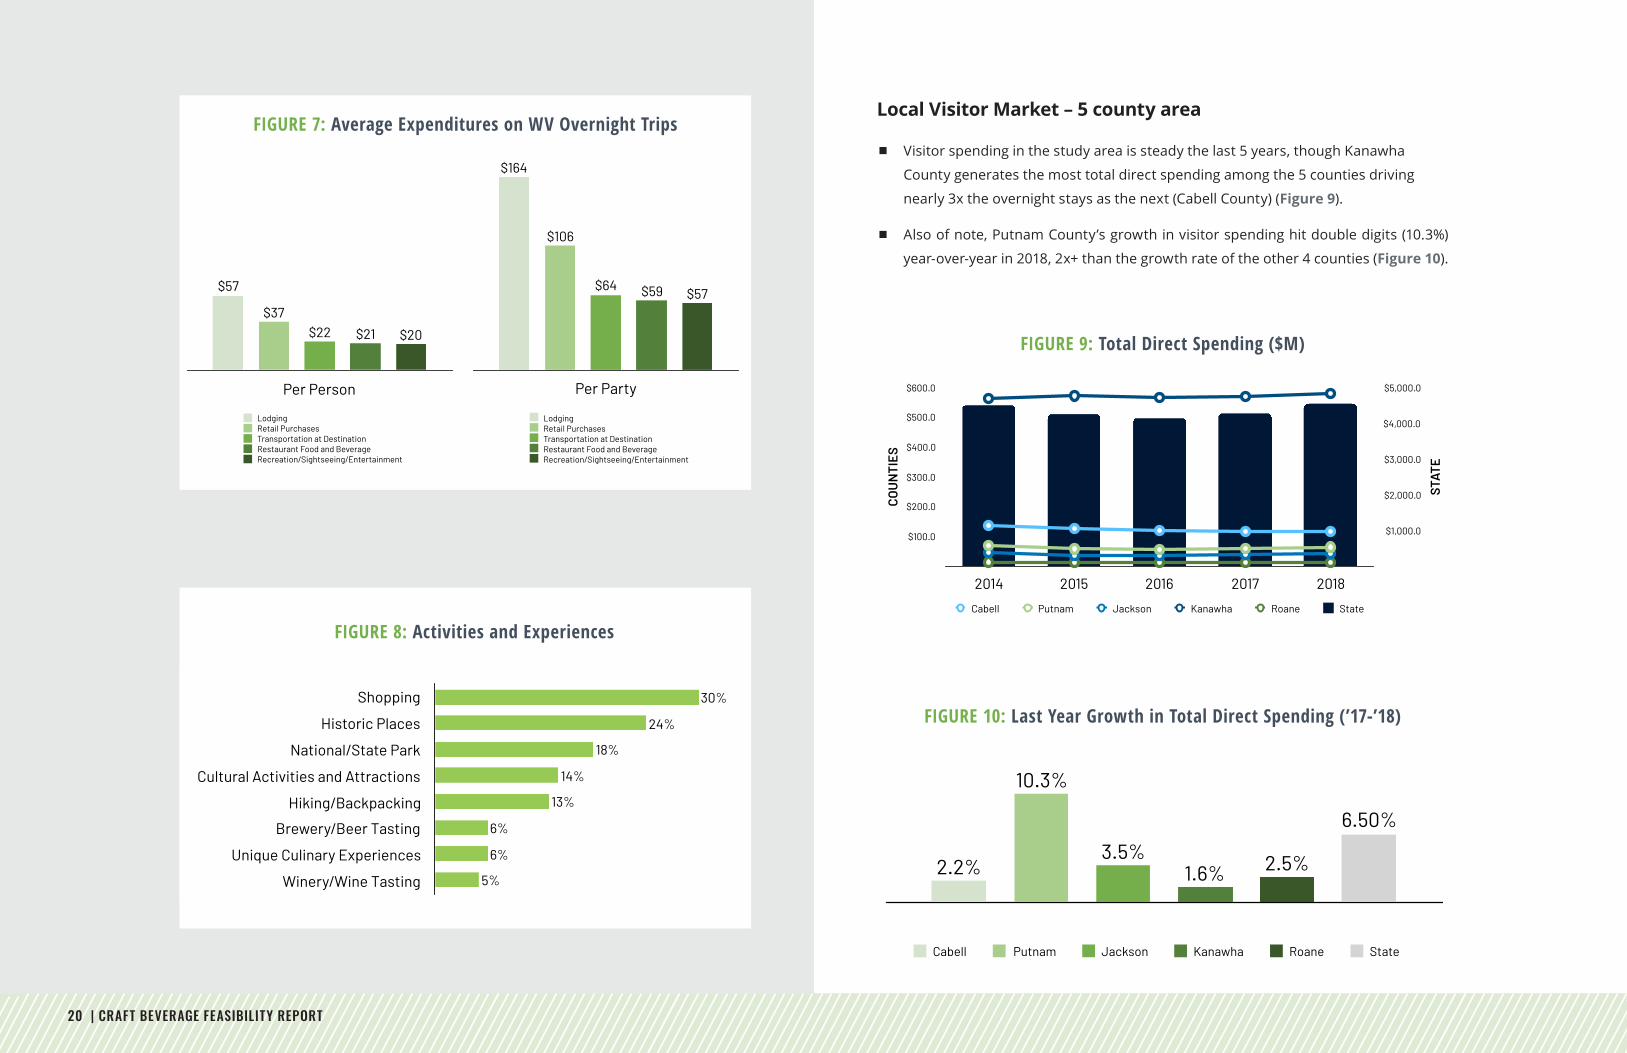
2. Visitor Market
The visitor market is strong from various perspectives, including the state, and the
local 5-county area.
State of WV - 2018
Visitors to state welcome centers increased 37% year over year.
State social channels are active and growing, with 40K Instagram followers and
over 264K Facebook likes.
“AlmostHeaven”campaignactivatedandhashelpedincreasevisitortrafficand
awarenessonsocial,with42%ofovernightstaysinfluencedbymarketingefforts
and over 50K uses of #AlmostHeaven across social platforms.
25% of visitor stays are overnight, primarily couples (66%) and families with
children (38%).
55% of overnight visits take place from April to September; top activities include
shopping, nature and parks, and historic or cultural attractions.
As expected, overnight visitor spending is largely focused on lodging, followed by
restaurant food and beverage (average of $37 per person per trip, $106 per party
per trip) (Figure 7).
In terms of top activities and experiences for overnight visitors, shopping (30%)
and historic places (24%) top the list, while unique culinary experiences and
wineries/tasting range from 6%-5% of visitors (Figure 8).
TABLE 5: Total Businesses and Employees, 2019
Businesses in 5-County Area
Total Businesses: 13,100
Total Employees: 205,400
Total Residential Population: 382,554
Employees by Type Number Percent
White Collar 135,564 66%
Blue Collar 39,026 19%
Services 32,864 16%
Source: ESRI BIS, Marketek, Inc.
20 | CRAFT BEVERAGE FEASIBILITY REPORT
Local Visitor Market – 5 county area
Visitor spending in the study area is steady the last 5 years, though Kanawha
County generates the most total direct spending among the 5 counties driving
nearly 3x the overnight stays as the next (Cabell County) (Figure 9).
Also of note, Putnam County’s growth in visitor spending hit double digits (10.3%)
year-over-year in 2018, 2x+ than the growth rate of the other 4 counties (Figure 10).
CABELL PUTNAM JACKSON KANAWHA ROANE STATE
2014 $136.2 $70.5 $44.4 $561.9 $13.7 $4,505.0
2015 $125.6 $57.7 $36.9 $571.7 $11.9 $4,258.0
2016 $119.8 $54.8 $37.3 $565.5 $11.4 $4,142.0
2017 $115.2 $58.2 $39.7 $571.2 $11.8 $4,277.0
2018 $117.7 $64.2 $41.1 $580.2 $12.1 $4,554.0
STAT
E
$1,000.0
$2,000.0
$3,000.0
$4,000.0
$5,000.0
COU
NTI
ES
$100.0
$200.0
$300.0
$400.0
$500.0
$600.0
2014 2015 2016 2017 2018
Cabell Putnam Jackson Kanawha Roane State
3Growth by County
Cabell 2.17%
Putnam 10.31%
Jackson 3.53%
Kanawha 1.58%
Roane 2.54%
State 6.50%
6.50%
2.5%1.6%3.5%
10.3%
2.2%
Cabell Putnam Jackson Kanawha Roane State
4
Per Party
Activities and Experiences
Shopping 30%
Historic Places 24%
National/State Park 18%
Cultural Activities and Attractions 14%
Hiking/Backpacking 13%
Brewery/Beer Tasting 6%
Unique Culinary Experiences 6%
Winery/Wine Tasting 5%
Shopping
Historic Places
National/State Park
Cultural Activities and Attractions
Hiking/Backpacking
Brewery/Beer Tasting
Unique Culinary Experiences
Winery/Wine Tasting 5%
6%
6%
13%
14%
18%
24%
30%
7
Per Party
Per Party
Lodging $164
Retail Purchases $106
Transportation at Destination $64
Restaurant Food and Beverage $59
Recreation/Sightseeing/Entertainment $57
Per Party
$57$59$64
$106
$164
LodgingRetail PurchasesTransportation at DestinationRestaurant Food and BeverageRecreation/Sightseeing/Entertainment
6
Per Person
Per Person
Lodging $57
Retail Purchases $37
Transportation at Destination $22
Restaurant Food and Beverage $21
Recreation/Sightseeing/Entertainment $20
Per Person
$20$21$22$37
$57
LodgingRetail PurchasesTransportation at DestinationRestaurant Food and BeverageRecreation/Sightseeing/Entertainment
5
FIGURE 7: Average Expenditures on WV Overnight Trips
FIGURE 9: Total Direct Spending ($M)
FIGURE 10: Last Year Growth in Total Direct Spending (’17-’18)
FIGURE 8: Activities and Experiences
CRAFT BEVERAGE FEASIBILITY REPORT | 21
FIGURE 11: Local Visitor Market (map)
Business Visitors
Of the 15.7M overnight person-trips to WV in 2017, 10% (1.6M) were driven by
business as the main purpose, and another 3% (0.5M) were business-leisure. While
the percentage driven by conference/conventions has not changed since 2015,
they are expected to with aggressive marketing by the Charleston CVB of the
newly remodeled convention center. “Other” business trips have increased by 2%,
possibly stimulated by other draws in the WV area.
Similarly, of the 47.5M day person-trips to WV in 2017, 8% (3.8M) were driven by
business, and 3% (1.4M) were by business-leisure.
Longwoods International’s research (2017) shows that the origin of overnight
business visitors is: 21%,WV; 13%, OH; 12%, VA; and 10%, PA.
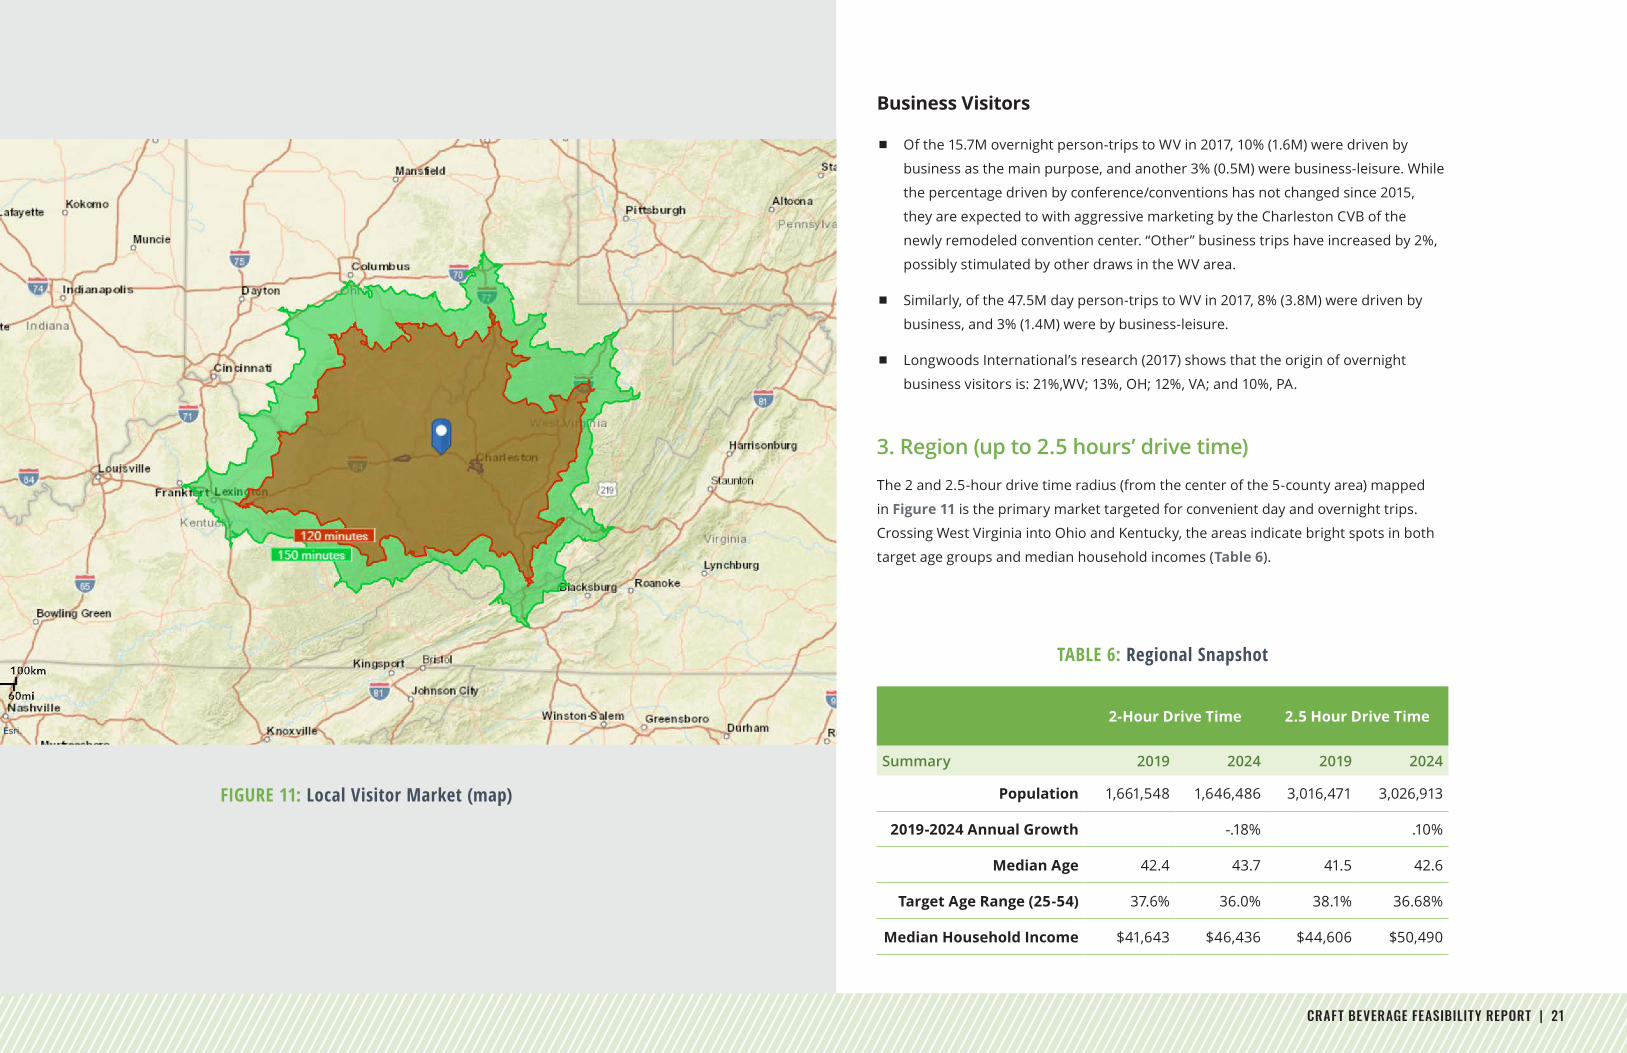
3. Region (up to 2.5 hours’ drive time)
The 2 and 2.5-hour drive time radius (from the center of the 5-county area) mapped
in Figure 11 is the primary market targeted for convenient day and overnight trips.
Crossing West Virginia into Ohio and Kentucky, the areas indicate bright spots in both
target age groups and median household incomes (Table 6).
TABLE 6: Regional Snapshot
2-Hour Drive Time 2.5 Hour Drive Time
Summary 2019 2024 2019 2024
Population 1,661,548 1,646,486 3,016,471 3,026,913
2019-2024 Annual Growth -.18% .10%
Median Age 42.4 43.7 41.5 42.6
Target Age Range (25-54) 37.6% 36.0% 38.1% 36.68%
Median Household Income $41,643 $46,436 $44,606 $50,490
2 hr & 2 1/2 Hr Drive Times from Hurricane, WV
Source: ©2019 Esri.
October 25, 2019
©2019 Esri Page 1 of 1
22 | CRAFT BEVERAGE FEASIBILITY REPORT
MARKET DEMAND AND SUPPLYIn determining the potential for additional craft brewers and brewpubs, DSG
considered a range of variables related to market supply and consumer demand within
the 5-county study area.
1. Nationwide
As noted in the report introduction, Brewers’ Association data shows that overall U.S.
beer volume sales were down 1% in 2018, whereas craft brewer sales continued to
grow at a rate of 4% by volume, reaching 13.2% of the U.S. beer market by volume.
Retail dollar sales of craft increased 7%, up to $27.6B, which now accounts for more
than 24% of the $114.2B U.S. beer market. It should be noted that craft production
grew the most for microbreweries.
Of the nearly 8,000 breweries in the U.S. at the end of 2019, 5,000 were microbreweries
Microbreweries are those that produce less than15,000 barrels per year. While
microbreweries represent the largest market segment (60.7% of all craft breweries),
they produced only 22.5% of all craft beer. There are lots of microbreweries, but they
are small and serve a local market. The average production for a microbrewery is
around 1,000 barrels per year.
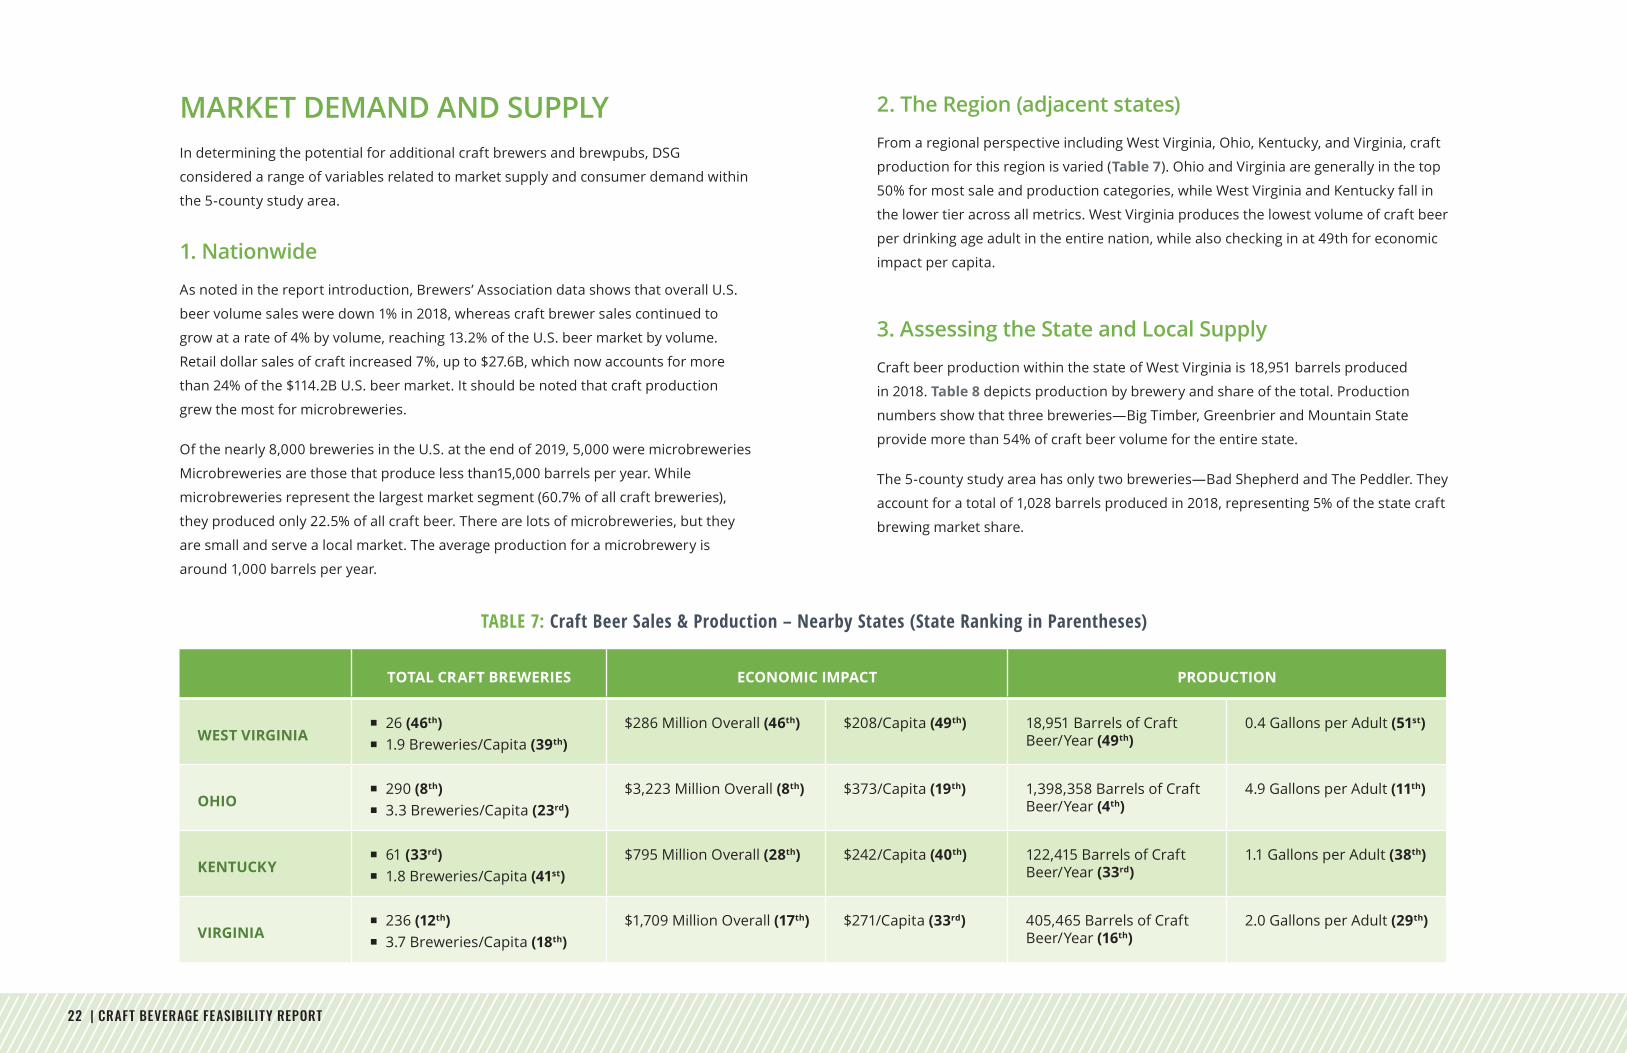
TOTAL CRAFT BREWERIES ECONOMIC IMPACT PRODUCTION
WEST VIRGINIA � 26 (46th) � 1.9 Breweries/Capita (39th)
$286 Million Overall (46th) $208/Capita (49th) 18,951 Barrels of Craft Beer/Year (49th)
0.4 Gallons per Adult (51st)
OHIO � 290 (8th) � 3.3 Breweries/Capita (23rd)
$3,223 Million Overall (8th) $373/Capita (19th) 1,398,358 Barrels of Craft Beer/Year (4th)
4.9 Gallons per Adult (11th)
KENTUCKY � 61 (33rd) � 1.8 Breweries/Capita (41st)
$795 Million Overall (28th) $242/Capita (40th) 122,415 Barrels of Craft Beer/Year (33rd)
1.1 Gallons per Adult (38th)
VIRGINIA � 236 (12th) � 3.7 Breweries/Capita (18th)
$1,709 Million Overall (17th) $271/Capita (33rd) 405,465 Barrels of Craft Beer/Year (16th)
2.0 Gallons per Adult (29th)
2. The Region (adjacent states)
From a regional perspective including West Virginia, Ohio, Kentucky, and Virginia, craft
production for this region is varied (Table 7). Ohio and Virginia are generally in the top
50% for most sale and production categories, while West Virginia and Kentucky fall in
the lower tier across all metrics. West Virginia produces the lowest volume of craft beer
per drinking age adult in the entire nation, while also checking in at 49th for economic
impact per capita.
3. Assessing the State and Local Supply
Craft beer production within the state of West Virginia is 18,951 barrels produced
in 2018. Table 8 depicts production by brewery and share of the total. Production
numbers show that three breweries—Big Timber, Greenbrier and Mountain State
provide more than 54% of craft beer volume for the entire state.
The 5-county study area has only two breweries—Bad Shepherd and The Peddler. They
account for a total of 1,028 barrels produced in 2018, representing 5% of the state craft
brewing market share.
TABLE 7: Craft Beer Sales & Production – Nearby States (State Ranking in Parentheses)
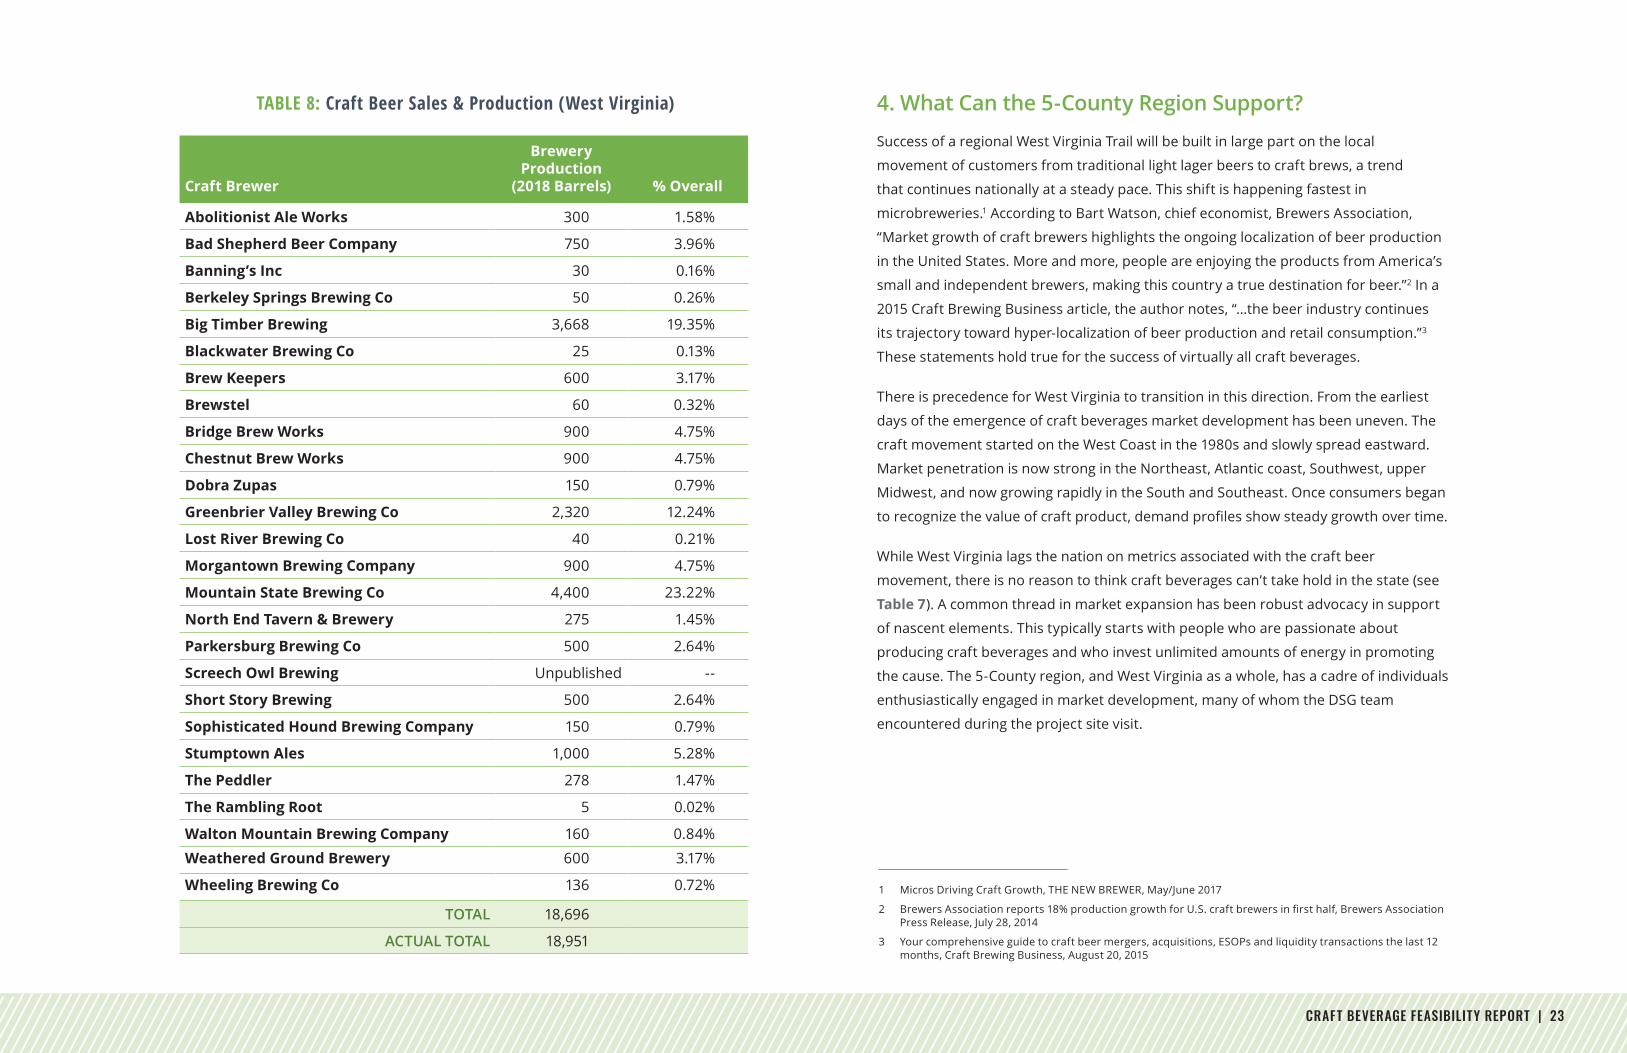
CRAFT BEVERAGE FEASIBILITY REPORT | 23
Craft Brewer
Brewery Production
(2018 Barrels) % Overall
Abolitionist Ale Works 300 1.58%
Bad Shepherd Beer Company 750 3.96%
Banning’s Inc 30 0.16%
Berkeley Springs Brewing Co 50 0.26%
Big Timber Brewing 3,668 19.35%
Blackwater Brewing Co 25 0.13%
Brew Keepers 600 3.17%
Brewstel 60 0.32%
Bridge Brew Works 900 4.75%
Chestnut Brew Works 900 4.75%
Dobra Zupas 150 0.79%
Greenbrier Valley Brewing Co 2,320 12.24%
Lost River Brewing Co 40 0.21%
Morgantown Brewing Company 900 4.75%
Mountain State Brewing Co 4,400 23.22%
North End Tavern & Brewery 275 1.45%
Parkersburg Brewing Co 500 2.64%
Screech Owl Brewing Unpublished --
Short Story Brewing 500 2.64%
Sophisticated Hound Brewing Company 150 0.79%
Stumptown Ales 1,000 5.28%
The Peddler 278 1.47%
The Rambling Root 5 0.02%
Walton Mountain Brewing Company 160 0.84%
Weathered Ground Brewery 600 3.17%
Wheeling Brewing Co 136 0.72%
TOTAL 18,696
ACTUAL TOTAL 18,951
4. What Can the 5-County Region Support?
Success of a regional West Virginia Trail will be built in large part on the local
movement of customers from traditional light lager beers to craft brews, a trend
that continues nationally at a steady pace. This shift is happening fastest in
microbreweries.1 According to Bart Watson, chief economist, Brewers Association,
“Market growth of craft brewers highlights the ongoing localization of beer production
in the United States. More and more, people are enjoying the products from America’s
small and independent brewers, making this country a true destination for beer.”2 In a
2015 Craft Brewing Business article, the author notes, “…the beer industry continues
its trajectory toward hyper-localization of beer production and retail consumption.”3
These statements hold true for the success of virtually all craft beverages.
There is precedence for West Virginia to transition in this direction. From the earliest
days of the emergence of craft beverages market development has been uneven. The
craft movement started on the West Coast in the 1980s and slowly spread eastward.
Market penetration is now strong in the Northeast, Atlantic coast, Southwest, upper
Midwest, and now growing rapidly in the South and Southeast. Once consumers began
torecognizethevalueofcraftproduct,demandprofilesshowsteadygrowthovertime.
While West Virginia lags the nation on metrics associated with the craft beer
movement, there is no reason to think craft beverages can’t take hold in the state (see
Table 7). A common thread in market expansion has been robust advocacy in support
of nascent elements. This typically starts with people who are passionate about
producing craft beverages and who invest unlimited amounts of energy in promoting
the cause. The 5-County region, and West Virginia as a whole, has a cadre of individuals
enthusiastically engaged in market development, many of whom the DSG team
encountered during the project site visit.
TABLE 8: Craft Beer Sales & Production (West Virginia)
1 Micros Driving Craft Growth, THE NEW BREWER, May/June 2017
2 BrewersAssociationreports18%productiongrowthforU.S.craftbrewersinfirsthalf,BrewersAssociationPress Release, July 28, 2014
3 Your comprehensive guide to craft beer mergers, acquisitions, ESOPs and liquidity transactions the last 12 months, Craft Brewing Business, August 20, 2015
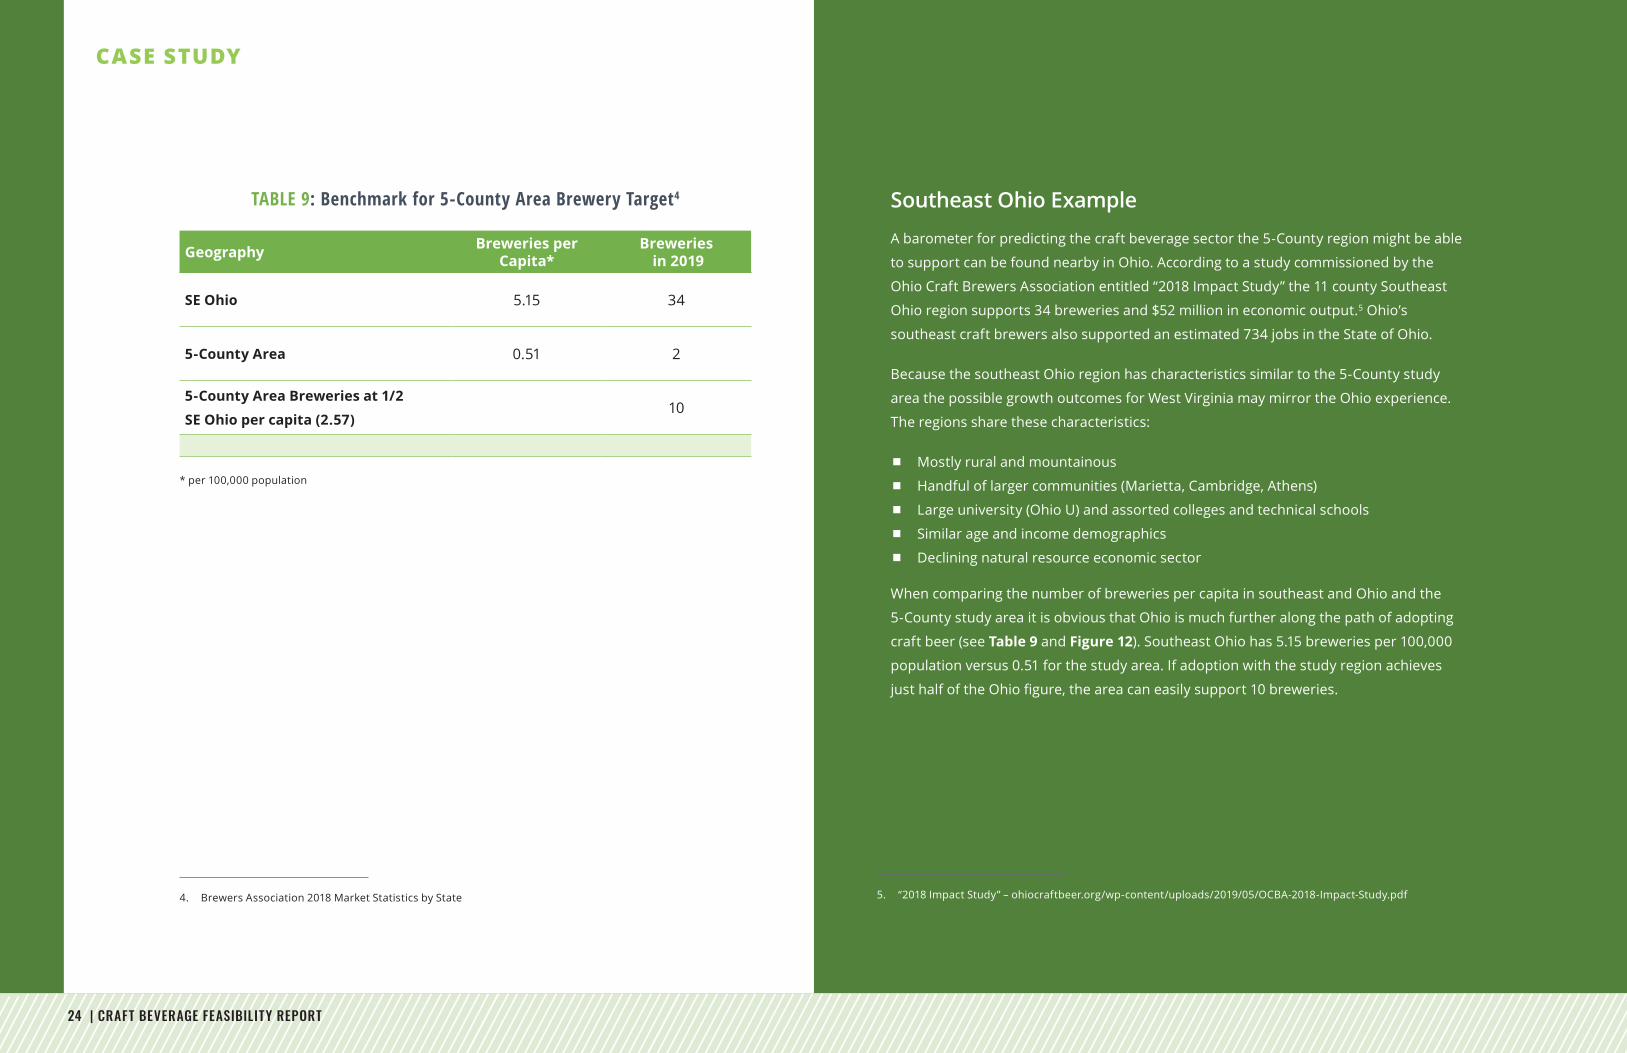
24 | CRAFT BEVERAGE FEASIBILITY REPORT
Southeast Ohio Example
A barometer for predicting the craft beverage sector the 5-County region might be able
to support can be found nearby in Ohio. According to a study commissioned by the
Ohio Craft Brewers Association entitled “2018 Impact Study” the 11 county Southeast
Ohio region supports 34 breweries and $52 million in economic output.5 Ohio’s
southeastcraftbrewersalsosupportedanestimated734jobsintheStateof Ohio.
Because the southeast Ohio region has characteristics similar to the 5-County study
area the possible growth outcomes for West Virginia may mirror the Ohio experience.
The regions share these characteristics:
Mostly rural and mountainous
Handful of larger communities (Marietta, Cambridge, Athens)
Large university (Ohio U) and assorted colleges and technical schools
Similar age and income demographics
Declining natural resource economic sector
When comparing the number of breweries per capita in southeast and Ohio and the
5-County study area it is obvious that Ohio is much further along the path of adopting
craft beer (see Table 9 and Figure 12). Southeast Ohio has 5.15 breweries per 100,000
population versus 0.51 for the study area. If adoption with the study region achieves
justhalfoftheOhiofigure,theareacaneasilysupport10breweries.
TABLE 9: Benchmark for 5-County Area Brewery Target4
Geography Breweries per Capita*
Breweries in 2019
SE Ohio 5.15 34
5-County Area 0.51 2
5-County Area Breweries at 1/2
SE Ohio per capita (2.57)10
* per 100,000 population
5. “2018 Impact Study” – ohiocraftbeer.org/wp-content/uploads/2019/05/OCBA-2018-Impact-Study.pdf
CASE STUDY
4. Brewers Association 2018 Market Statistics by State
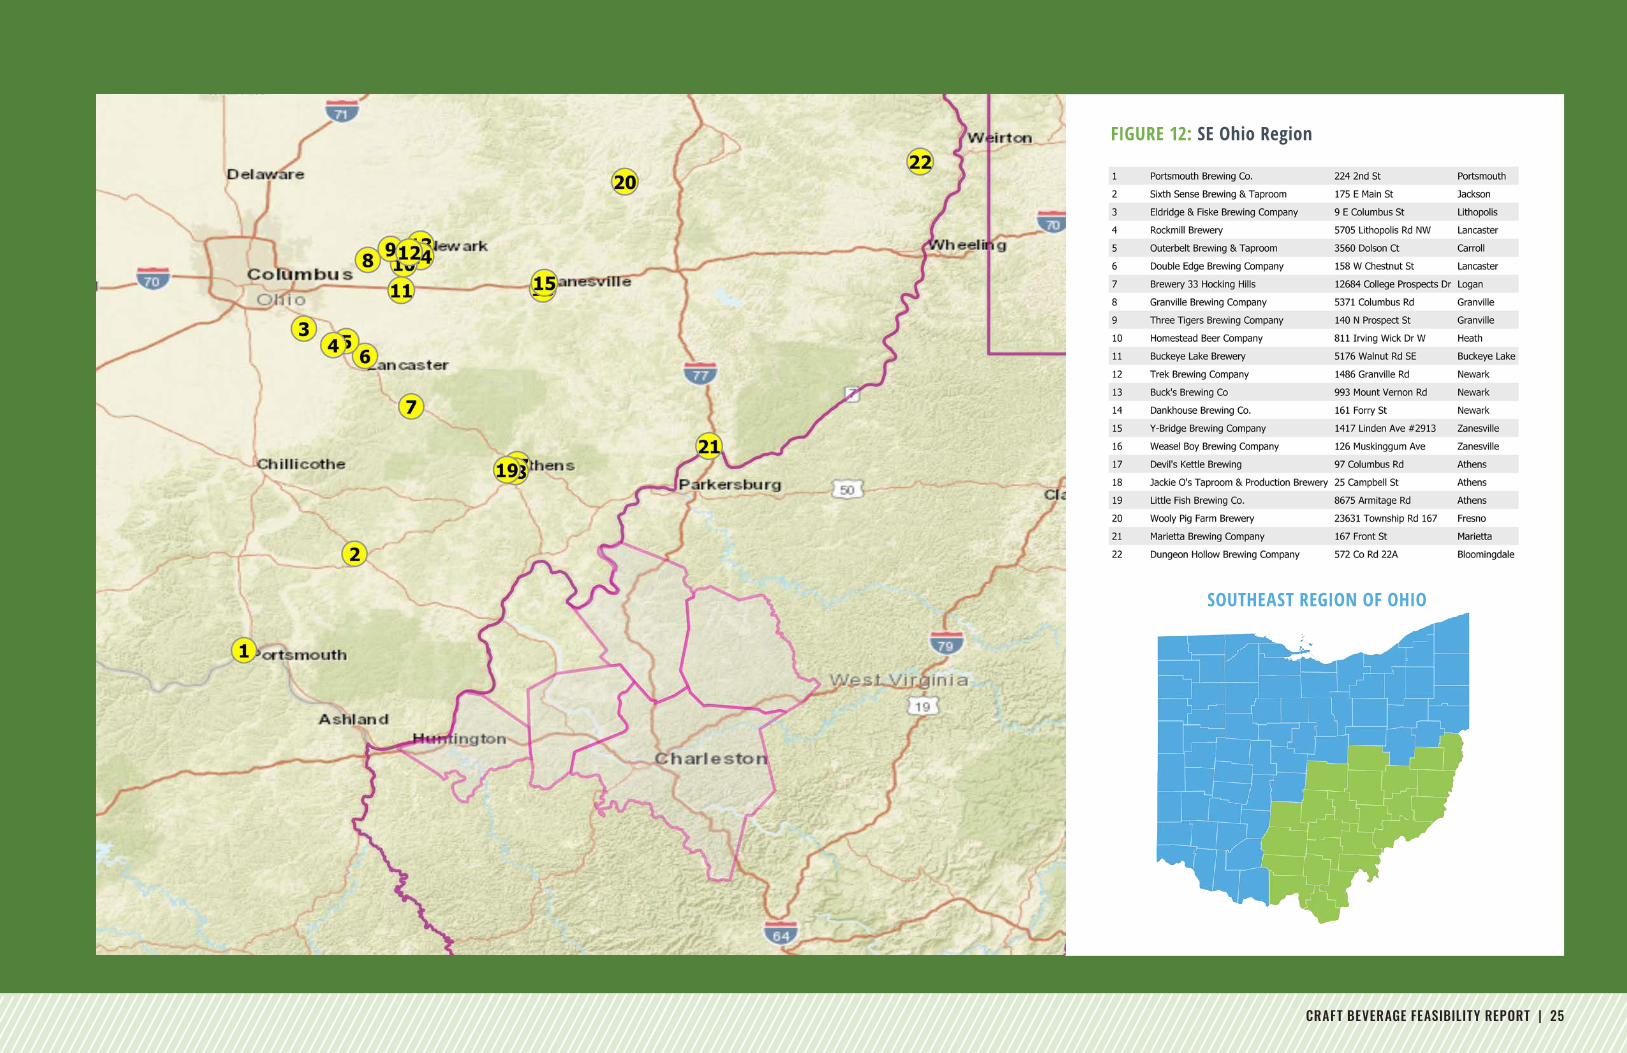
CRAFT BEVERAGE FEASIBILITY REPORT | 25
FIGURE 12: SE Ohio Region
SOUTHEAST REGION OF OHIO
26 | CRAFT BEVERAGE FEASIBILITY REPORT
5. Local Consumer Demand
Consumerdemandforbeercanbeestimatedspecificallyforlocalarea/resident
populations and estimated generally for visitor populations.
Resident Demand
Retail sales leakage or surplus is a measure of supply and demand variables that
provides a snapshot of retail opportunity. Supply (retail sales) estimates sales to
consumers by establishments. Demand (retail potential) estimates the expected
amount spent by consumers at retail establishments in current dollars based on
factors including households, incomes and the U.S. Consumer Expenditure Survey.
Retail marketplace data (2019) for the 5-county study area provided by ESRI analytics
depictssolidretailleakageorasalesgapintwokeycategoriesaffectingcraftbeverage
consumption:
Drinking Places – drinking alcohol away from home: $1.3M
Grocery Stores – $47M – of which $14.1M or 30% is estimated as beer and wine
sales
Note: Grocery stores typically target 30% of their revenue from alcohol beverage
sales. Within the grocery retail category nationwide, 2011-2018 sales have increased by
30 percent,averaginganincreaseofroughly4.3percentperyear.
Another demand beer consumption indicator is the Market Potential Index (MPI) which
measurestherelativelikelihoodoftheadultsorhouseholdsinthespecifiedtradearea
to possess certain consumer behavior or purchasing patterns. Within the 5-county
studyarea,39%ofadultsorover120,000specificallydrankbeeroraleinthelast
6 months(MPI)atnearlythenationalaverage.
Visitor Demand
State of West Virginia. The 2018 annual report of the West Virginia Tourism
Officenotesthatthestateisinagrowthtrajectoryinpartstemmingfromits26craft
breweries and 20 wineries and distilleries. Also prominently promoted is the state’s
significantrecreationassetsincluding45stateparksandforests,over5majorski
resorts and 164,000 acres of scenic public land. Overall, the state experienced a
36.5%increasein2018visitorsover2017.TheTourismOfficerightlytoutsthattourism
spending helps more than just tourism. Research shows tourism advertising improves
West Virginia’s image as a place to live, start a business, go to college, and retire.
As such, the state is actively investing in tourism marketing, branding and product
development. This work will enable immediate links to and leverage for a new craft
beverage trail.
Overnight Visitor Population.AsidentifiedintheConsumerMarketProfile
section, the target craft beverage-drinking population within a 2 to 2.5-hour drive time
issignificant.
2 hour – 1,661,548 population; 670,450 households; $41,643 median hh income; 25%
have $75k median hh income or higher
2.5 hour – 3,011,647 population; 1,208,019 households; med hh income $44,606 median
hh income and >28% have $75k median hh income or higher
Theprimeagegroup(25-54)identifiedasregularcraftbeveragedrinkerstotals624,742
people within 2 hours and an additional 522,257 (or total of 1.15 million) people within
2.5 hours. Conservatively, the developing Craft Brew Trail could expect that 6% of this
population group (68,820) would be willing to travel to the Metro V alley region for a
uniquecraftfoodandbeverageexperience.Thisfigureisbasedonstatevisitordata
indicating that 6% of visitors are enjoying brewery visits and beer tasting.
In all likelihood, these will be overnight visitors spending an average
of $37/person/trip on food and beverages, as earlier noted. While
only a portion of this spending is on craft brews (40% est’d or
$15),usingthisspendingfigureandthe2.5-hourtargetpopulation
figure(68.8k),thetotalannualpotentialfood/drinkspendingfrom
this target visitor group is $1.02M in with 2019 as basis.
Study Area Visitors. Dean Runyan Associates’ annual WV travel
report indicates that in 2018, the 5-county study area generated
$2.83B in direct travel spending or 62% of all travel spending
($4.5B) in West Virginia. With $580M in 2018 travel spending,
Kanawha County dominates the region’s impact and exhibits the
fastest growth among the counties (Table 10).
TABLE 10: 2018 Travel Spending
(millions) County 2018
County 2018
Cabell 117.7
Putnam 64.2
Jackson 41.1
Kanawha 580.2
Roane 12.1
TOTAL $2,833
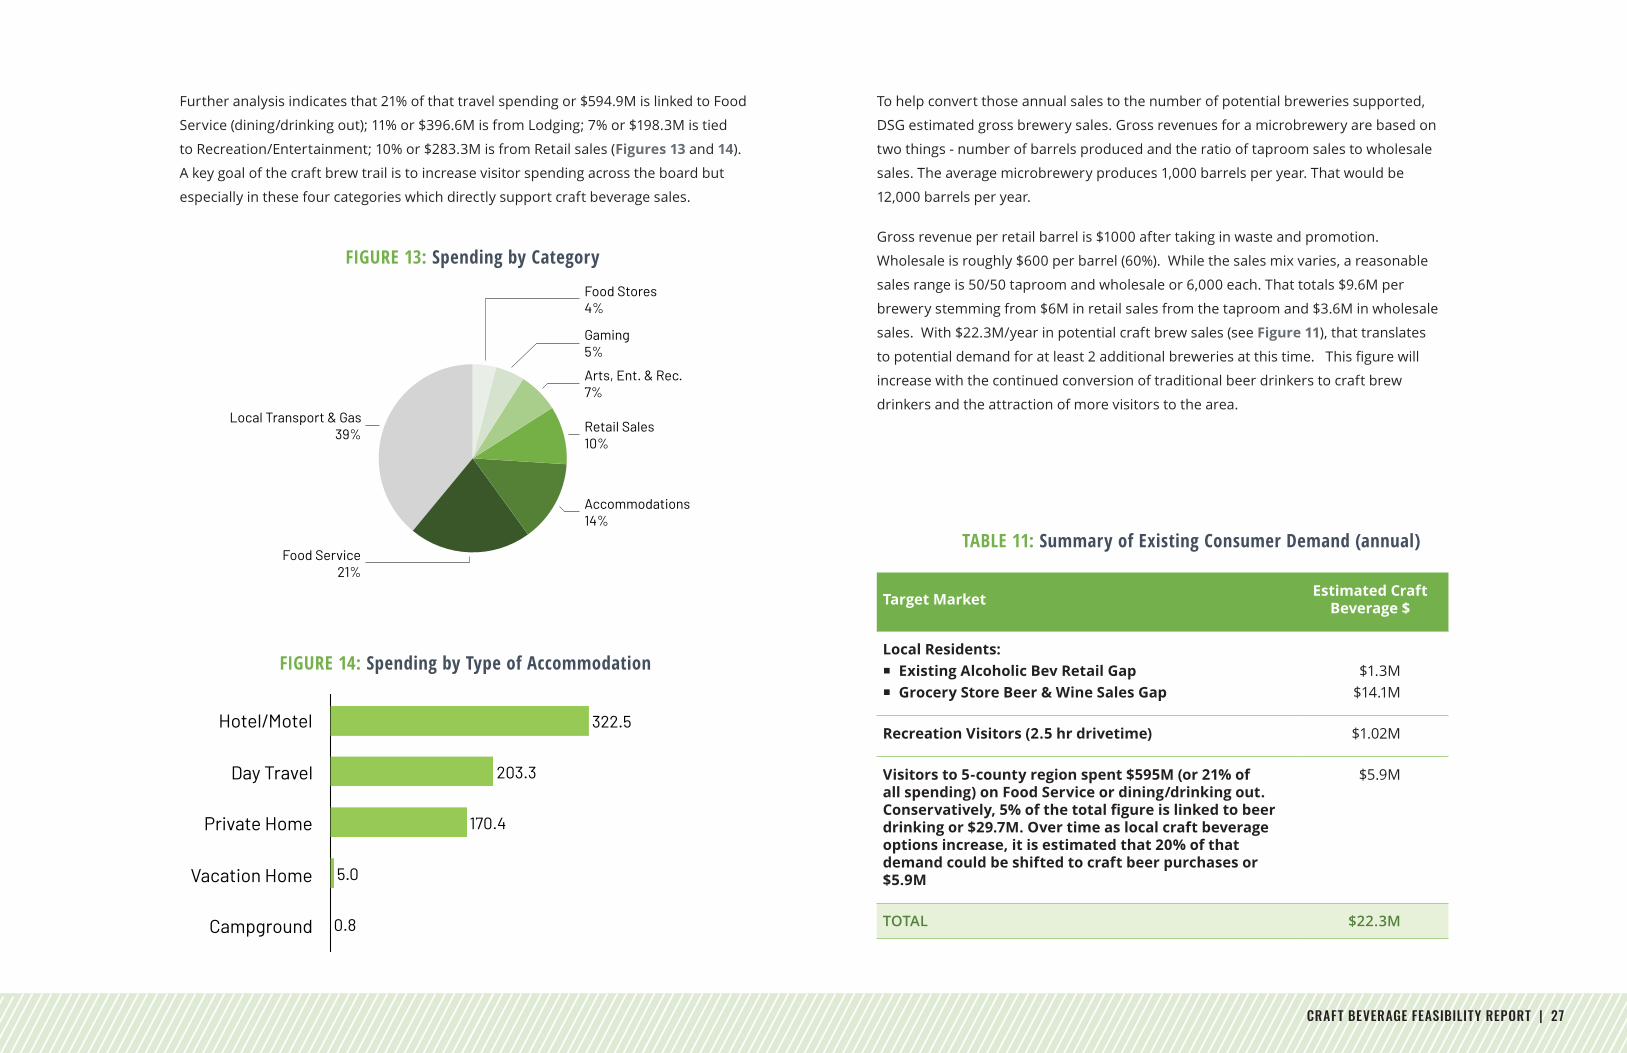
CRAFT BEVERAGE FEASIBILITY REPORT | 27
Per Party
Activities and Experiences
Food Stores 4%
Gaming 5%
Arts, Ent. & Rec. 7%
Retail Sales 10%
Accommodations 14%
Food Service 21%
Local Transport & Gas 39%
Local Transport & Gas39%
Food Service21%
Accommodations14%
Retail Sales10%
Arts, Ent. & Rec.7%
Gaming5%
Food Stores4%
9
TABLE 11: Summary of Existing Consumer Demand (annual)
Target Market Estimated Craft Beverage $
Local Residents: � Existing Alcoholic Bev Retail Gap � Grocery Store Beer & Wine Sales Gap
$1.3M$14.1M
Recreation Visitors (2.5 hr drivetime) $1.02M
Visitors to 5-county region spent $595M (or 21% of all spending) on Food Service or dining/drinking out. Conservatively, 5% of the total figure is linked to beer drinking or $29.7M. Over time as local craft beverage options increase, it is estimated that 20% of that demand could be shifted to craft beer purchases or $5.9M
$5.9M
TOTAL $22.3M
Further analysis indicates that 21% of that travel spending or $594.9M is linked to Food
Service (dining/drinking out); 11% or $396.6M is from Lodging; 7% or $198.3M is tied
to Recreation/Entertainment; 10% or $283.3M is from Retail sales (Figures 13 and 14).
A key goal of the craft brew trail is to increase visitor spending across the board but
especially in these four categories which directly support craft beverage sales.
To help convert those annual sales to the number of potential breweries supported,
DSG estimated gross brewery sales. Gross revenues for a microbrewery are based on
two things - number of barrels produced and the ratio of taproom sales to wholesale
sales. The average microbrewery produces 1,000 barrels per year. That would be
12,000 barrels per year.
Gross revenue per retail barrel is $1000 after taking in waste and promotion.
Wholesale is roughly $600 per barrel (60%). While the sales mix varies, a reasonable
sales range is 50/50 taproom and wholesale or 6,000 each. That totals $9.6M per
brewery stemming from $6M in retail sales from the taproom and $3.6M in wholesale
sales. With $22.3M/year in potential craft brew sales (see Figure 11), that translates
topotentialdemandforatleast2additionalbreweriesatthistime.Thisfigurewill
increase with the continued conversion of traditional beer drinkers to craft brew
drinkers and the attraction of more visitors to the area.
Per Party
Activities and Experiences
Hotel/Motel 322.5
Day Travel 203.3
Private Home 170.4
Vacation Home 5.0
Campground 0.8
Hotel/Motel
Day Travel
Private Home
Vacation Home
Campground 0.8
5.0
170.4
203.3
322.5
8
FIGURE 13: Spending by Category
FIGURE 14: Spending by Type of Accommodation
28 | CRAFT BEVERAGE FEASIBILITY REPORT
Summary of Assessment Findings for Regional Craft Beverage Trail
ASSETS TO BUILD ON
5 Large region with the State’s major cities of Huntington and Charleston as bookends
5 State and regional visitor and industry marketing efforts emphasize and reinforce similar goals as the Advantage Valley region for visitor and craft beverage development
5 Brewing Technology and Entrepreneurship Curriculum expanding at Bridge Valley Community College
5 The 5-county study area has very strong visitor assets to leverage, promote and grow in support of a collaborative marketing campaign to successfully attract visitors to this target market to a craft beverage/culinary trail. Among these are:
>40 Agritourism venues: 7 Farmer’s Markets and 35 Farms; 61 unique Bars and Restaurants; nearly 40 events throughout the region that attract thousands of visitors year-round; 65 Attractions of interest to beer drinkers from national/state parks and theatres to unique retailers; Performance destinations: e.g., Culture Center Theatre, Charleston, WV with over 50 performances/year, anchored by Mountain Stage weekly PBS broadcast and the Keith Albee Performing Arts Center, Huntington; renovated/expanded Charleston Convention Center; Excellent supply of hotels/lodging venues
5 12+Visitor Marketing orgs—CVBs, Campaigns, Trails. The Charleston brand of Hip, Historic, Almost Heaven marketing campaign is an excellent example of how to package and cross-promote local/regional assets toward the visitor market.
5 Energetic, eager and passionate entrepreneurs and organizations within the region ready to enhance/expand the visitor product and capture more visitors
CHALLENGES TO WORK THROUGH
5 The region’s employment and population base is on a slow but steady decline and incomes are modest—making visitor market expansion imperative to the craft beverage trail’s success
5 The region lacks name recognition or a brand identity tied to craft food and drink and will need to come out of the gate hard and fast to get a foothold in this competitive sector
V. ROADMAP KEY INITIATIVES FOR ACTION
In preparation for this plan, research was completed to document substantial
assets, challenges and opportunities for development of the Craft Brew Trail and
implementation of the following roadmap.
With the assets, challenges and opportunities as a foundation, 4 key initiatives
emergedtobringtheTrailtofruition.Theseinitiativesreflectthecollaborativethinking
oftheDSGconsultantteamandlocalprojectcommittee.Efforts,resultsandpriorities
should be evaluated and refreshed annually.
The following tables present action steps to implement these key initiatives to ensure
trail development with an organization chart at the conclusion. Note that Robert C.
Byrd Institute (RCBI) will continue to champion and lead the Trail project as it moves
to implementation. In addition to RCBI, the project management team charged
with project development includes Advantage Valley, Putnam County CVB, HADCo,
Charleston Area Alliance and the WV Army National Guard. It’s a given that these
organizations are actively engaged with each initiative below and for this reason, they
are not included as partners.
Key Initiatives for Craft Brew Trail Development
1. Define and Package the Brand Vision and Product Scope
2. Expand the Product Offerings to Fill in and Support the Brand
3. Market and Promote the Trail: establish, coordinate and implement a phased Trail Marketing Strategy at the local, regional and state levels
4. Create and Commit to a coordinated organizational structure with champions for each of the priority initiatives.
CRAFT BEVERAGE FEASIBILITY REPORT | 29
5 The absence of a professionally managed craft beverage organization to coordinate sector participants, amass resources to promote the industry and advocate for fair regulation affects the growth of the sector both statewide and within the region. The existing WV Craft Brewers Guild appears to be inactive and unable to add value to the industry.
5 Regulatory barriers to craft beverage expansion in WV persist and are linked to manufacturing, retail sales, ,, licensing and other facets of business expansion. A recent industry roundtable through the WV Beer Roads podcast resulted in a Legislative wish list to improve the state’s alcohol beverage laws.
5 The temptation “to be all things to all people” in establishing the region as an artisan/craft food and drink destination is a marketing challenge and potential barrier to success. The craft beverage market is not homogenous and target customers like craft brew drinkers want product authenticity, have niche interests and enjoy feeling like insiders. Yet, with just a few breweries, a craft trail lift-off will most likely require promoting multiple craft products (food and drink).
5 Limited capital for business startup and expansion is a chronic barrier in West Virginia that demands external resources be tapped and innovative investment funds be encouraged.
KEY OPPORTUNITIES TO PURSUE
5 Visitor demand is on the rise as measured by overall spending and lodging occupancies
5 The Craft Beverage Trail Steering Committee, collaborators and entrepreneurs are hungry to organize, build marketing campaigns and develop/expand the sector, i.e., excellent timing for implementing the project strategy.
5 Despite the many barriers within the ABCA laws of WV, the recent passage of the Growler and Sunday Brunch bills in the legislature demonstrates the state is moving a positive direction and is an opportunity for industry growth. This success is the result of many organizations working in unison and should be actively promoted to regional businesses to capitalize on expanded sales.
30 | CRAFT BEVERAGE FEASIBILITY REPORT
KEY INITIATIVES
1. DEFINE/PACKAGE THE BRAND VISION AND PRODUCT SCOPE
Why Important?
Thecasestudyresearchemphasizedtheimportanceofdefiningthe
trail experience and perceptions, organizing the businesses around
the‘promise’tothemarketplaceandconsistentlycommunicatingand
delivering on the promise. Successful launch of a new trail depends
onbringingkeytrailstakeholderstogethertoidentifythedefining
attribute or central theme of the trail around which products/
servicesandthe‘experience’youaresellingwillbeorganized.
As noted throughout this research, the limited number of craft
breweries and beverages necessitates that the trail include a
broaderspectrumofofferings—e.g.,agritourism,locally-sourced
food. Sample themes or brands from the case studies include: Craft
Food and Beverage; a focus on Local Bounty (promoting products
grown, raised, created in a given region), Creative Economy and
Entrepreneurs, Culinary Craftsmanship– unique food experiences.
Relatedtogainingclarityonthe‘brandpromise’ofthetrailisthe
need to promote a common name for the region. State tourism uses
MetroValley;Rivers-Valleysregionisanothertermidentifiedatthe
charrette; and Advantage Valley is used for economic development.
While it is not imperative the trail have a strong geographic
reference, it would certainly aid in creating a unique and refreshed
identity.
Action Steps
90 DAYS • Get Organized and Focused
1. Identify partner organizations, form a core steering committee and determine roles
and responsibilities. Appoint a “trail champion.” Launch with an organizing meeting
and create/commit to action plan with key steps and task leaders.
2. In preparation for the launch meeting, review case study best practices, asset maps,
key conclusions and recommendations including narrowing the geographic scope from
5 counties to 3 counties at the outset.
3. Get grounded and inspired by the steps to be a successful agritourism destination
region. Download and review the Agritourism Handbook produced by Travel Oregon, a
national leader in this tourism section:
ohiocraftbeer.org/wp-content/uploads/2019/05/OCBA-2018-Impact-Study.pdf
6 MONTHS • Establish the Trail Brand/Theme and Product Offerings
1. Identify and evaluate top 3 brand themes based on existing unique assets and
passionsandinterestsofkeystakeholdersandselect/definebrand:overallname,
theme, key attributes of participating businesses, key messages to consumer. The
obviousemphasisison‘CraftFoodandBeverage’,butotherapproachesmaybe
‘HandmadeandHomegrown,’‘LocalMusic,FoodandArtisanGoods,’andrelated
concepts. See Appendix F for an example of criteria used by Polk County, Oregon to
define‘localandlocally-sourced.’
2. Assuming a broad framework, identify at least 30 existing businesses in the 3-counties
(Cabell,PutnamandKanawha)thatareapotential‘fit’/anchorsforthetrail:craft
beverages, farm-to-table eateries, farms and ranches, farmer’s markets, local retail,
unique lodging. Begin mapping the Trail contents.
CRAFT BEVERAGE FEASIBILITY REPORT | 31
KEY INITIATIVES
Lead Champion
Robert C. Byrd Institute (RCBI)
Partners or Collaborators
Trail businesses (anchors), Advantage Valley, CVBs (Kanawha,
Putnam, Huntington), HADCO, Charleston Area Alliance, Chambers of
Commerce, WV Tourism
Outcomes
Cleartrailbrandandquality,qualifiedparticipantstolaunch(30-50),
launch game plan and sustainability strategy, volunteer action team,
andincreasedbusinessengagementandcollaboration.Aunified
theme that is used consistently by all regional tourism stakeholders
in marketing messages to Trail visitors.
Resources Needed
Minimum ½ time position as Trail Manager + out of pocket expenses
for travel and related costs
3. Host a Trail Development Workshop inviting the target businesses and anyone
who may be candidates for participation. See sample agenda for this workshop
(Appendix G) which is part-educational about the visitor marketplace/hospitality, the
trail brand and culinary/agritourism sector and part-recruitment of trail participants.
Encourage understanding of and participation in trail. Recruit action team (6-8 or
more) to work with Brand Steering Committee on moving forward.
4. Following this workshop, invite all interested businesses to complete an application
for participation, with built-in criteria around customer service and marketing to
ensureafitwithandcommitment to the brand, and to providing the consumer an
authentic experience consistent with themes and messages. (See sample application in
Appendix F)
1 YEAR+ • Launch and Manage the Trail
1. Conductvisitstotrailparticipantsforscreeningandfinalacceptance.
2. Identify, develop and implement assistance to individual Trail participants and the
group overall, e.g., Hospitality/Customer Service training, business operations,
regulatory requirements.
3. Map out other actions to ensure an excellent Trail experience and maximize
sustainability.
4. Meet 2x/year to bring focus to continuous Trail improvements, marketing initiatives,
product development and impact evaluation.
32 | CRAFT BEVERAGE FEASIBILITY REPORT
KEY INITIATIVES
Action Steps
Product Development
1. Develop alliances and partnerships with craft beverage industry members and
trade associations to promote the interests of craft beverage/farm-to-table
participants.Amongthoseidentifiedare:theWVCraftBrewersGuild,WVGrape
Growers Association, WV Beer and Wine Association, WV Distillers Guild and the
WV Spirits Council. With a goal to strengthen the craft beverage sector, there may
bemanysharedinterestsandthepossibilityofmergingtobe‘strongertogether.’
2. Learn from craft beverage guild programs and models found in other states to
create a properly scaled version that can apply to WV’s unique assets. Because
WV is starting from a relatively small base, a hybrid model that supports craft
brewing, distilleries, wineries, and other niche players would likely help grow the
market for many. See Appendix I for more information on starting a guild.
3. Either through a merged craft beverage association or another new alliance,
identify common challenges and advocate for changes in state laws and
regulations that will help expand production and distribution of craft beverages
in the state.
4. Identify and help secure new grant funding for WV craft beverage industry trade
group(s) that would further mutual interests (steps 1-3 above).
5. Work with Spriggs Distributors to create a craft beer education program that
will transition small craft brewing operators to the 3-tier model through staged
adoption.
2. EXPAND THE PRODUCT OFFERINGS TO FILL IN AND SUPPORT THE BRAND
Why Important?
As noted, a critical mass of craft beverage and food options are
essential to creating a destination draw for both locals and visitors.
Product expansion and development of new product is needed in the
5-countyregiontoreachthatcriticalmassthreshold.Specificneeds
include:
Fill gaps in the craft brewing sector by expanding the number of
craft breweries
Build elements of a functioning supply chain from sustainable
farmers to:
Craft beverage production facilities
Distribution channels that serve beverage producers,
restaurants and retail sales
Service of visitor infrastructure such as Airbnb/bed &
breakfasts, festivals, and tourist destinations
A support structure is key to generating a sustainable craft beverage
program. Needed development and investment range from technical
assistance and regulatory advocacy to exploration of new resources
to expand and strengthen trail assets. A priority should be given to
strengthening organized support from a craft beverage guild as this
is proven to be to everyone’s advantage. Appendix H summarizes
thefunctionsandbenefitsofatypicalguild.
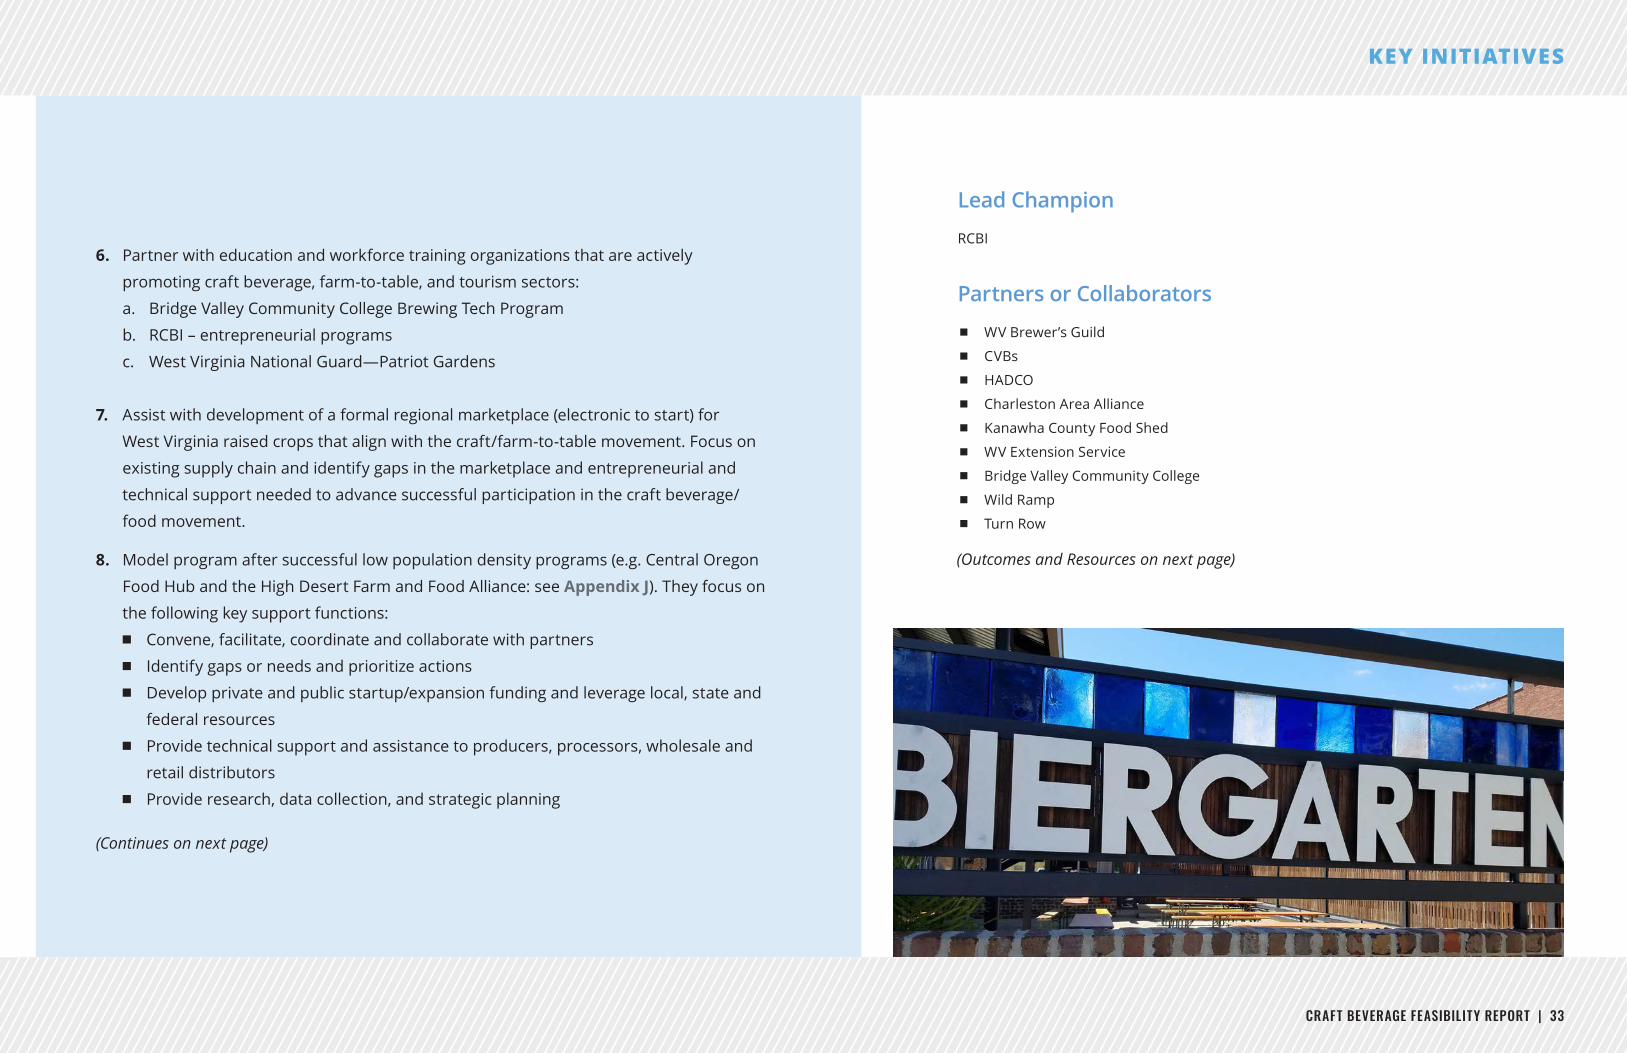
CRAFT BEVERAGE FEASIBILITY REPORT | 33
KEY INITIATIVES
6. Partner with education and workforce training organizations that are actively
promoting craft beverage, farm-to-table, and tourism sectors:
a. Bridge Valley Community College Brewing Tech Program
b. RCBI – entrepreneurial programs
c. West Virginia National Guard—Patriot Gardens
7. Assist with development of a formal regional marketplace (electronic to start) for
West Virginia raised crops that align with the craft/farm-to-table movement. Focus on
existing supply chain and identify gaps in the marketplace and entrepreneurial and
technical support needed to advance successful participation in the craft beverage/
food movement.
8. Model program after successful low population density programs (e.g. Central Oregon
Food Hub and the High Desert Farm and Food Alliance: see Appendix J). They focus on
the following key support functions:
Convene, facilitate, coordinate and collaborate with partners
Identify gaps or needs and prioritize actions
Develop private and public startup/expansion funding and leverage local, state and
federal resources
Provide technical support and assistance to producers, processors, wholesale and
retail distributors
Provide research, data collection, and strategic planning
Lead Champion
RCBI
Partners or Collaborators
WV Brewer’s Guild
CVBs
HADCO
Charleston Area Alliance
Kanawha County Food Shed
WV Extension Service
Bridge Valley Community College
Wild Ramp
Turn Row
(Continues on next page)
(Outcomes and Resources on next page)
34 | CRAFT BEVERAGE FEASIBILITY REPORT
KEY INITIATIVES
INITIATIVE 2 (CONTINUED) INITIATIVE 2 (ACTION STEPS CONTINUED)
90 DAY
Convene WV Craft Beverage Guild roundtable meeting and steering committee
Establish goals and objectives
Outline action item priorities
Development management approach
Secure seed funding
RCBI
Create a strategic plan for Wild Ramp/Turn Row to solidify supply chain
connections, funding
Identify entrepreneur training opportunities around craft beverage/farm-to-table
initiatives
6 MONTHS
Establish Guild leadership team
Create organizational plan
Outline near term action steps
Secure commitments to implement programs
Secure funding
RCBI and partners
Secure funding for training programs
Roll out training programs
Finalize supply chain strategy
Outcomes
Education – 10 graduates per year from programs aimed at
getting entrepreneurs ready for the market and participating
in a functioning craft beverage supply chain. These can include
workshops and credited course work (50 total over 5 years)
Workforce – 15 employees per year working in the craft
beverage/farm-to-table industry with employment multipliers
realized in the hospitality industry (75 total over next 5 years)
Microbreweries – 2 per year for next 5 years (10 total)
Wineries/distilleries/specialty beverages – 1 new operation
each year over the next 5 years (5 total)
Farm-to-Table Restaurants – goal of 1 per year for next 5 years
(5 total)
Unique Lodging options – bring on line 50 beds per year over
the next 5 years of boutique/unique venues, Airbnbs, and bed &
breakfast (250 beds total)
Resources Needed
A full-time regional champion to organize, market, and implement
growth strategies going forward.
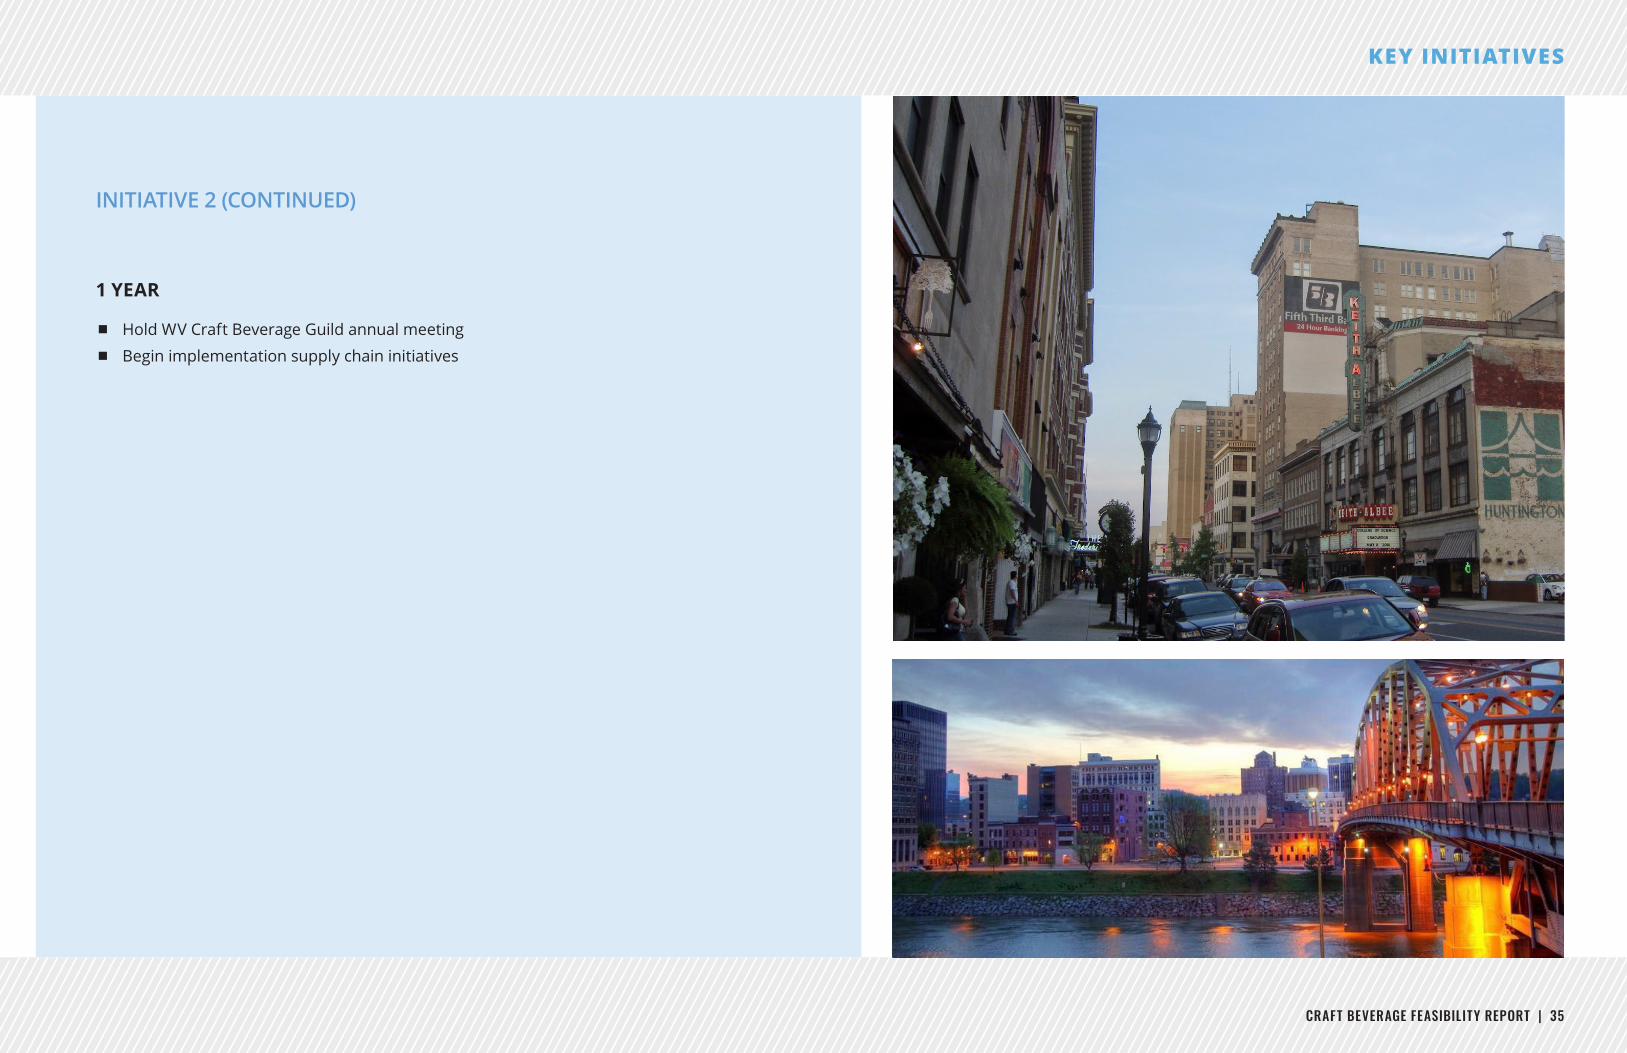
CRAFT BEVERAGE FEASIBILITY REPORT | 35
KEY INITIATIVES
INITIATIVE 2 (CONTINUED)
1 YEAR
Hold WV Craft Beverage Guild annual meeting
Begin implementation supply chain initiatives
36 | CRAFT BEVERAGE FEASIBILITY REPORT
KEY INITIATIVES
3. MARKET AND PROMOTE THE TRAIL
Why Important?
Actively marketing the Trail/assets is critical to the Trail’s growth
and success as a truly regional attraction that fuels visitor trips
and provides economic stimulus. Further, any quality promotion
campaign will go beyond economic gain to Trail businesses and
inspire visitors toexplorebusinessesthattheymightnotfindon
their own – lifting up the whole visitor sector/economy. Aggressive
Trailmarketingcanhavetheaddedbenefitofencouraginglonger
visitor stays and visiting in shoulder seasons when retail and lodging
businesses have lower sales.
A comprehensive Trail marketing program will have a balanced mix
of promotional and sales campaigns through both independent
marketing and direct links to and cross-promotions with key
organizations and attractions at local, regional and state levels. Many
of these actions dove-tail with or follow the Trail Branding initiative.
Action Steps
90 DAYS • Organizational Commitment
1. Create a Trail Marketing Team. Convene key local, regional and state partners (RCBI,
CVBs,City/County,WVTourism)togainbuy-in,participationandfinancialorin-kind
support for the Trail and to create a single Trail marketing organization/coordinator and
implementation plan. Advantage Valley (AV) is well positioned to play the role of Trail
champion. AV is the regional economic development marketing organization already
actively promoting Food and Beverage industry development and tourism infrastructure
projects. Develop clear expectations of and agreements with all involved.
2. Consolidate all Trail marketing strategies and activities into one game plan. Build out
timeline incorporating reasonable expectations.
3. Secure resources to implement key tactics and support ongoing Trail success.
4. Finalize the Trail map with logo, business listings and info access channels.
5. Develop and implement consistent signage/window decals marking Trail businesses.
6. Outline steps to roll out the Trail and enlist partner and business community
commitment to marketing and promotion. Incorporate tactics to develop positivity and
pride among key local business and civic leaders for Trail success.
7. Initiate one cross-marketing activity/campaign to get the promotions going and to
engage the wider business community. As a fast out-of- the-gate one, engage restaurants
and craft beverage/brew venues in a Burger & Beer Week or a Craft Food & Drink Month
featuring as many participating venues throughout the region. See Appendix K for other
ideas.
6 MONTHS • Build Out the Trail Marketing Infrastructure
1. Establish Trail itineraries connected to regional recreation and cultural assets
2. Develop website and social media platforms (FB, Instagram, Twitter, YouTube)
3. Link and actively cross promote with other established trails like the Country Roads Wine
&DistilleryTrail,Rivers-ValleyTrail,Hatfield-McCoyTrails,WVBeer&BarrelTrail
CRAFT BEVERAGE FEASIBILITY REPORT | 37
KEY INITIATIVES
Lead Champion
Advantage Valley
Partners or Collaborators
Trail businesses, CVBs, HADCO, Charleston Area Alliance, WV Tourism
Office,WVBrewer’sGuild,WVHospitality&TravelAssociation
(WVHTA)
Outcomes
More visitors to the region, staying longer and receiving
exceptional service that generates “word of mouth” advertising
and “top of mind” awareness.
Increased spending and local revenue.
Strong, active partnership and collaboration among visitor
marketing organizations
Comprehensive information on all Trail attractions, venues, and
amenities.
Resources Needed
$60,000 - $100,000+ depending on purchased advertising
Note: Grants from WV Tourism Promotion Fund can be leveraged for
marketing programs.
4. Establish Trail welcome/info centers
Capitol Market – Charleston
Heritage Station – Huntington
5. Produce a calendar of marketing/promotion events including activities along the Trail,
sponsored by Trail businesses
6. Prepare a schedule of PR story ideas – individual entrepreneurs, family businesses, etc.
7. Develop a media list and press packet
8. Organize a Trail Launch Event bringing all the businesses and partners together for a
celebration
1 YEAR + • Gain Momentum; Keep it Fresh!
1. Link and actively cross promote the Trail with regional visitor draws like Mountain Stage,
Clay Center, State Parks/national recreation areas and established beer / other festivals
and events
2. Build the Marketing Communications contact database of complementary
organizations, event, tour and meeting planners, hotels/motels, etc.
3. Develop performance metrics to measure the results. Hotel occupancy tax revenues
Website and social media visits
Media coverage
Tour bus stops
Event/destination attraction attendance
Numbers of visitors at key attractions
4. Provide marketing and technical assistance to Trail participants and training on
e-platforms for regular customer contact like GoogleMyBusiness
5. Encourage Trail expansion and Trail business success by helping develop new events like
a series of Farm-to-Table events, beer & music festivals, bikes & brews, to name a few.
6. Actively engage with the WV Brewers Association/Guild.
7. JointhenationalCraft BeverageTourOperatorsAssociation (CBTOA)tostayabreastof
trends and cutting edge in marketing
38 | CRAFT BEVERAGE FEASIBILITY REPORT
KEY INITIATIVES
Action Steps
90 DAYS • Organizational Structure
Createacollaborativeorganizationalstructurewithaspecificchampionforeach
of the priority initiatives, as suggested in preceding outline.
6 MONTHS • Specific Champion
Committothatorganizationalstructureandensurethatthespecificchampion
for each of the priority initiatives is willing to commit to lead that initiative. Clarify
responsibilities in that regard.
1 YEAR • Adjustments
Establish a regular meeting schedule, work teams, project milestones and
accountabilities to keep momentum behind Trail development.
4. CREATE AND COMMIT TO ORGANIZATIONAL STRUCTURE WITH CHAMPIONS FOR EACH OF THE PRIORITY INITIATIVES1.
Why Important?
Developingasuccessfultrailrequiresasustainedeffortof
commitment from both partner organizations and participating
businesses. Understanding the roles and responsibilities of each
is crucial to ensure the viability and continued success of a craft
beverage trail. See organization (Figure 15).
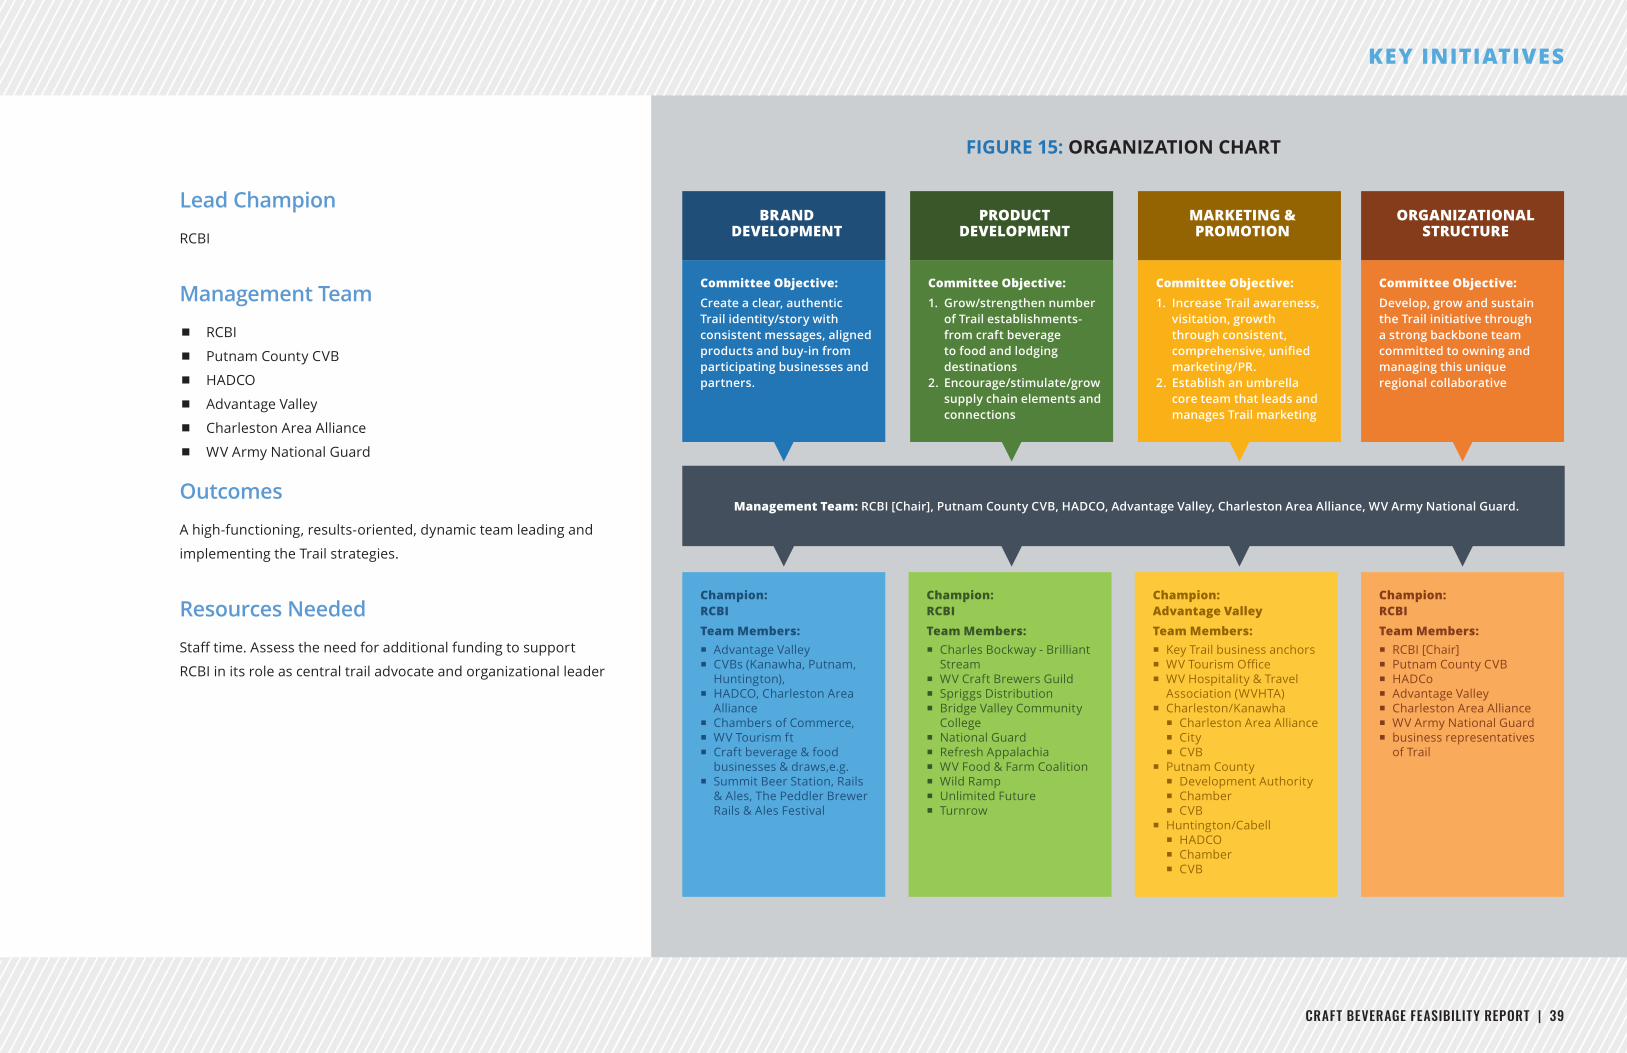
CRAFT BEVERAGE FEASIBILITY REPORT | 39
Lead Champion
RCBI
Management Team
RCBI
Putnam County CVB
HADCO
Advantage Valley
Charleston Area Alliance
WV Army National Guard
Outcomes
A high-functioning, results-oriented, dynamic team leading and
implementing the Trail strategies.
Resources Needed
Stafftime.Assesstheneedforadditionalfundingtosupport
RCBI in its role as central trail advocate and organizational leader
KEY INITIATIVES
Committee Objective: Create a clear, authentic Trail identity/story with consistent messages, aligned products and buy-in from participating businesses and partners.
Management Team: RCBI [Chair], Putnam County CVB, HADCO, Advantage Valley, Charleston Area Alliance, WV Army National Guard.
BRAND DEVELOPMENT
Champion: RCBITeam Members:
� Advantage Valley � CVBs (Kanawha, Putnam,
Huntington), � HADCO, Charleston Area
Alliance � Chambers of Commerce, � WV Tourism ft � Craft beverage & food
businesses & draws,e.g. � Summit Beer Station, Rails
& Ales, The Peddler Brewer Rails & Ales Festival
Committee Objective: 1. Grow/strengthen number
of Trail establishments-from craft beverage to food and lodging destinations
2. Encourage/stimulate/grow supply chain elements and connections
PRODUCT DEVELOPMENT
Champion: RCBITeam Members:
� Charles Bockway - Brilliant Stream
� WV Craft Brewers Guild � Spriggs Distribution � Bridge Valley Community
College � National Guard � Refresh Appalachia � WV Food & Farm Coalition � Wild Ramp � Unlimited Future � Turnrow
Committee Objective:1. Increase Trail awareness,
visitation, growth through consistent, comprehensive, unified marketing/PR.
2. Establish an umbrella core team that leads and manages Trail marketing
MARKETING & PROMOTION
Champion: Advantage Valley Team Members:
� Key Trail business anchors � WVTourismOffice � WV Hospitality & Travel
Association (WVHTA) � Charleston/Kanawha
� Charleston Area Alliance � City � CVB
� Putnam County � Development Authority � Chamber � CVB
� Huntington/Cabell � HADCO � Chamber � CVB
Committee Objective:Develop, grow and sustain the Trail initiative through a strong backbone team committed to owning and managing this unique regional collaborative
ORGANIZATIONAL STRUCTURE
Champion: RCBITeam Members:
� RCBI [Chair] � Putnam County CVB � HADCo � Advantage Valley � Charleston Area Alliance � WV Army National Guard � business representatives
of Trail
FIGURE 15: ORGANIZATION CHART
40 | CRAFT BEVERAGE FEASIBILITY REPORT
POTENTIAL FUNDING SOURCES
Funding Resources
A breadth of funding resources exists in the public and private realms to propel the
Craft Beverage Trail’s implementation success. With this feasibility study in hand,
the Steering Committee can make a compelling funding proposal for: Organizational
Development, Business and Micro-enterprise Development, Marketing, Community
Economic Development, Workforce Training, Entrepreneurial Ecosystems and other
aspects of trail development.
The list below provides a solid start for putting together a funding plan starting from
thegeneralandmovingtothelocalandspecific.Mostofthesefundingorganizations
have guidelines and criteria posted on their websites and allow for online applications.
Of note is that successful grant applications often require matching resources. Local
andregionalbusinessesarecriticalbeneficiariesofthetrailinitiativeandshouldbe
tapped for funding assistance.
Funding Databases
Grants.gov — The U.S. Department of Health and Human Services is the managing
partner for this extensive database of federal grants. Free registration will enable you
tosearchandapplyforfederalgrantsfrommanydifferentagencies.
GSP Grant Works — A web-based tool to monitor grant-related news and current
Federal and State funding opportunities in a variety of areas. You can subscribe to the
RSS feed to get daily notices of funding opportunities and other grant-related news.
Youcanalsokeywordsearchforopportunitiesandnewsonspecifictopicsorareasof
interest.
Grant Station — An online subscription-based database of funding resources
including federal, state, and private grants, loans, and charitable giving organizations.
Membership is approximately $700/year with discounts for multiple year subscriptions.
Attimesmembershipsalesordiscountsareoffered.
Foundation Center — Subscription-based database that tracks all major foundations
andmaintainsafairlycomprehensivedatabaseofU.S.(andsomeglobal)grantoffers.
Center for Nonprofit Excellence (CNE)—Varietyofresourcestosupportnonprofits
and communities.
Wells Fargo Philanthropic Services — Funding resources database searchable by
program area, state, foundation name.
Council on Foundations — Database searchable by program and location (state or
city).
Foundations
Project for Public Spaces — Funding ideas and resources for public art projects.
The Ford Foundation — Supported activities are charitable, educational and/
orscientific.Programareasfocusonchallenginginequality:civicengagementand
government, creativity, future of work, justice, internet freedom, just cities and regions,
natural resources and climate change. Past grants are available on the website for
review.
Bill and Melinda Gates Foundation — While not a typical economic development
resource, the Gates Foundation does fund: community projects, public policy
advocacy, agricultural development, general operating support for community-based
organizations, libraries, etc.
Surdna Foundation—Grantstononprofitorganizationsforthreepriorityareas:
sustainable environments, strong local economies, and thriving cultures.
The Foundation for Enhancing Communities — The Foundation works with
individuals,nonprofits,andbusinessestoimprovecommunitiesandcreatepositive
change through collective philanthropy.
Community Reinvestment Fund—Nationalnonprofitorganizationsupporting
mission-drivenorganizationsbyincreasingtheflowofcapitaltounderserved
communities.
CRAFT BEVERAGE FEASIBILITY REPORT | 41
Banks
Bank of America Charitable Foundation — Priorities are economic health and
sustainability, workforce development, education, community development; grants are
providedto501c3nonprofits.
Chase Bank Foundation — Priority funding to collaborative projects with community
support and sustainability. Focus is on education, substance abuse, domestic violence,
community enhancement, charity infrastructure, youth programs, emergency and
human services. Grants are made to tax exempt charitable organizations on an
ongoing basis.
Citi Foundation — Promotes economic progress and improving the lives of people
inlow-incomecommunities;economicdevelopment;innovation;affordablehousing;
environmentalsustainability;financialinclusion,jobopportunitiesandcareerguidance
for youth (ages 16-24).
US Bank — Grants are focused on funding economic development issues: workforce
education and economic prosperity, neighborhood stability and revitalization, artistic
and cultural enrichment, learning through play.
Corporate
Walmart Foundation—Forprojectsthatbenefitthecommunityatlarge;low
income; hunger relief; healthy eating; supporting military families; medical screening
or treatment; social services; shelters; access to recreation, arts, culture; after school
programs; community and economic development; public safety; recycling. Eligible
applicants are government and non-government agencies and organizations operating
within the Walmart facility service area.
PepsiCo Foundation — Funding opportunities (grants, product, and volunteers) for
nonprofitorganizations.Supportforsustainablepartnerships,health,environment,
and education, positive nutrition, water safety, reduce and eliminate waste, and spur
prosperity.
AT&T Foundation — Funding for education, climate sustainability, community
development.
Sprint Foundation — Funding priorities: K-12 education and character development;
arts and culture; youth development (mentoring, leadership, social skills, business and
economic education); community development; disaster relief.
The Kresge Foundation — Funding to support community and economic
development, knowledge exchange, seeding and scaling community development.
Previous grants awarded are available for viewing online.
Other
Additional information and resources are available at Funding Entrepreneurial
Ecosystems Building from Energizing Entrepreneurs.
Local Funding Opportunities
Table 12 outlines a working list of potential funding resources for a Craft Beverage
project in the 5-county area. Most source are locally specialized and primarily
supporting Business Development or Marketing activities.
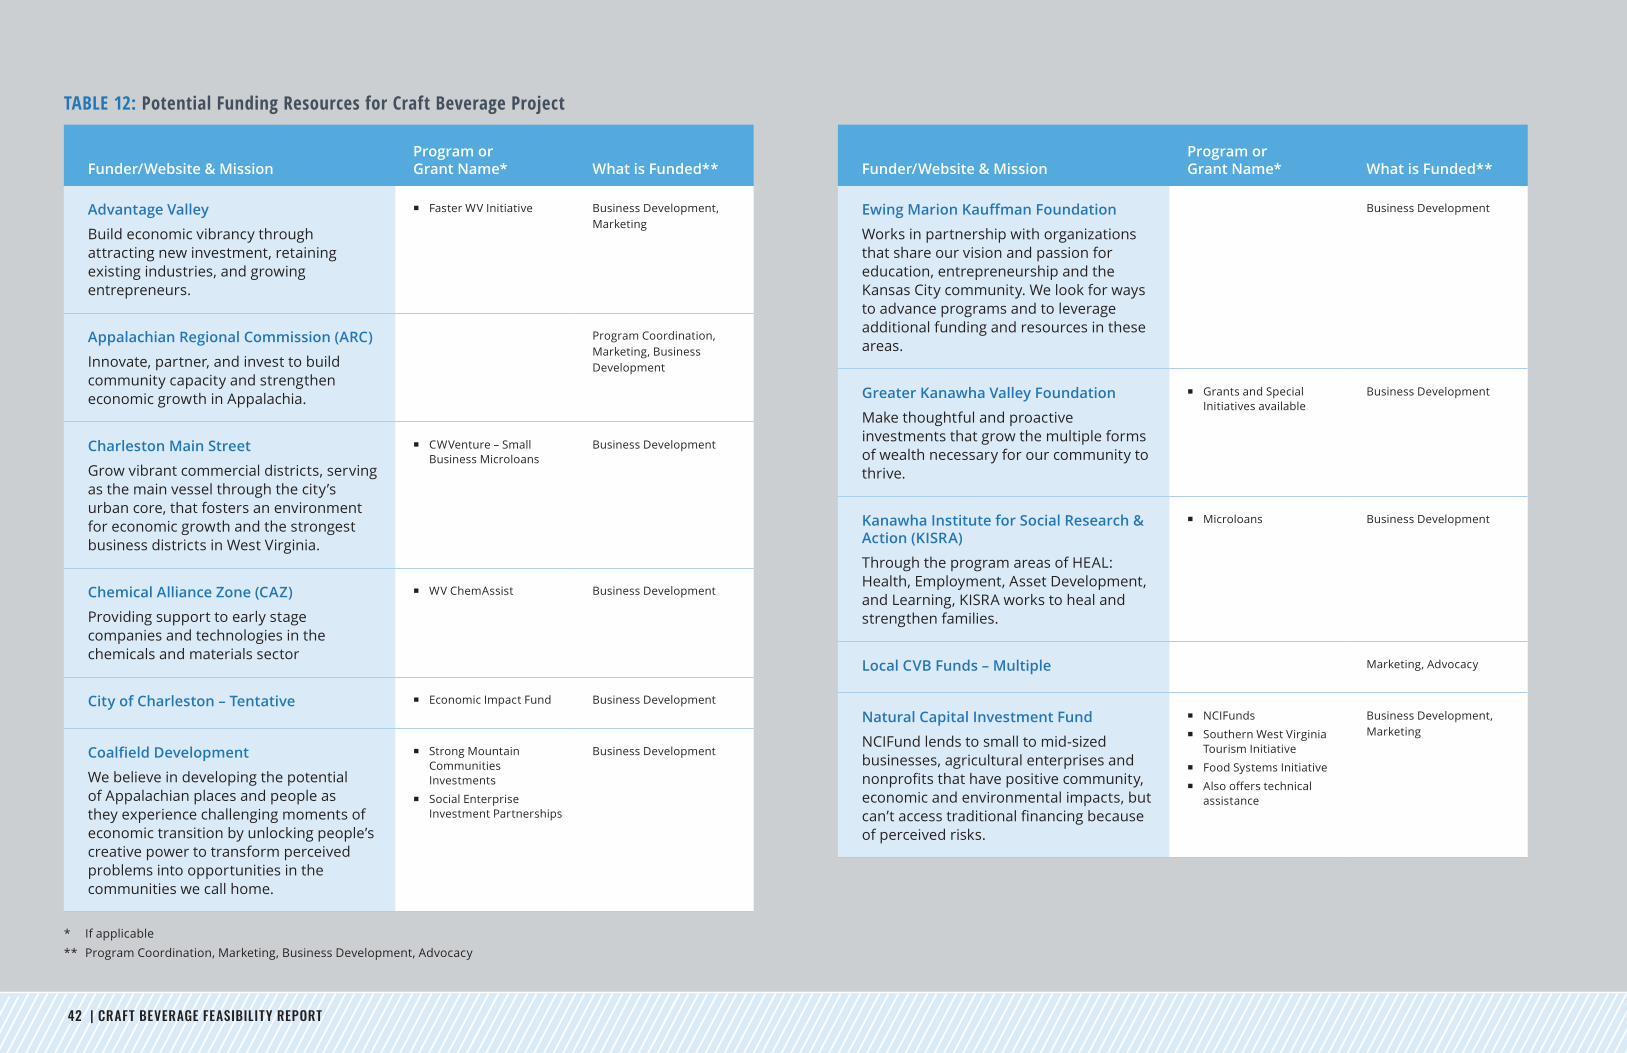
42 | CRAFT BEVERAGE FEASIBILITY REPORT
Funder/Website & MissionProgram or Grant Name* What is Funded**
Advantage Valley
Build economic vibrancy through attracting new investment, retaining existing industries, and growing entrepreneurs.
� Faster WV Initiative Business Development, Marketing
Appalachian Regional Commission (ARC)
Innovate, partner, and invest to build community capacity and strengthen economic growth in Appalachia.
Program Coordination, Marketing, Business Development
Charleston Main Street
Grow vibrant commercial districts, serving as the main vessel through the city’s urban core, that fosters an environment for economic growth and the strongest business districts in West Virginia.
� CWVenture – Small Business Microloans
Business Development
Chemical Alliance Zone (CAZ)
Providing support to early stage companies and technologies in the chemicals and materials sector
� WV ChemAssist Business Development
City of Charleston – Tentative � Economic Impact Fund Business Development
Coalfield Development
We believe in developing the potential of Appalachian places and people as they experience challenging moments of economic transition by unlocking people’s creative power to transform perceived problems into opportunities in the communities we call home.
� Strong Mountain Communities Investments
� Social Enterprise Investment Partnerships
Business Development
Funder/Website & MissionProgram or Grant Name* What is Funded**
Ewing Marion Kauffman Foundation
Works in partnership with organizations that share our vision and passion for education, entrepreneurship and the Kansas City community. We look for ways to advance programs and to leverage additional funding and resources in these areas.
Business Development
Greater Kanawha Valley Foundation
Make thoughtful and proactive investments that grow the multiple forms of wealth necessary for our community to thrive.
� Grants and Special Initiatives available
Business Development
Kanawha Institute for Social Research & Action (KISRA)
Through the program areas of HEAL: Health, Employment, Asset Development, and Learning, KISRA works to heal and strengthen families.
� Microloans Business Development
Local CVB Funds – Multiple Marketing, Advocacy
Natural Capital Investment Fund
NCIFund lends to small to mid-sized businesses, agricultural enterprises and nonprofitsthathavepositivecommunity,economic and environmental impacts, but can’taccesstraditionalfinancingbecauseof perceived risks.
� NCIFunds � Southern West Virginia
Tourism Initiative � Food Systems Initiative � Alsoofferstechnical
assistance
Business Development, Marketing
TABLE 12: Potential Funding Resources for Craft Beverage Project
* If applicable** Program Coordination, Marketing, Business Development, Advocacy
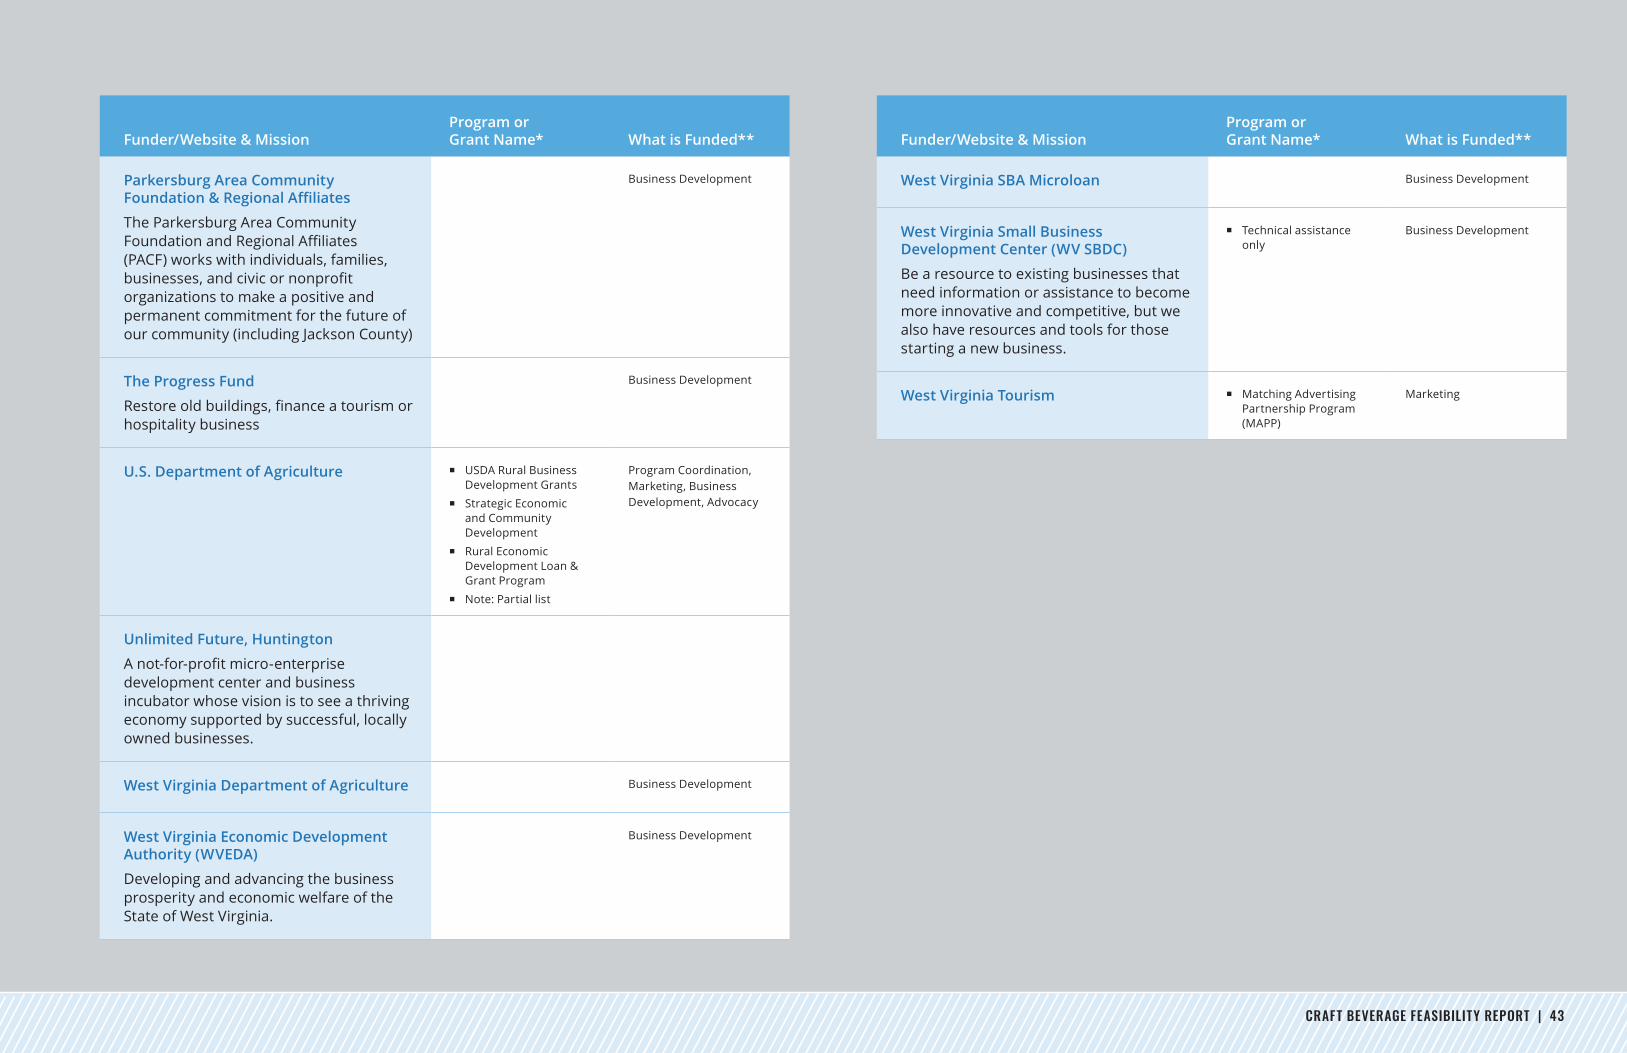
CRAFT BEVERAGE FEASIBILITY REPORT | 43
Funder/Website & MissionProgram or Grant Name* What is Funded**
Parkersburg Area Community Foundation & Regional Affiliates
The Parkersburg Area Community FoundationandRegionalAffiliates(PACF) works with individuals, families, businesses,andcivicornonprofitorganizations to make a positive and permanent commitment for the future of our community (including Jackson County)
Business Development
The Progress Fund
Restoreoldbuildings,financeatourismorhospitality business
Business Development
U.S. Department of Agriculture � USDA Rural Business Development Grants
� Strategic Economic and Community Development
� Rural Economic Development Loan & Grant Program
� Note: Partial list
Program Coordination, Marketing, Business Development, Advocacy
Unlimited Future, Huntington
Anot-for-profitmicro-enterprisedevelopment center and business incubator whose vision is to see a thriving economy supported by successful, locally owned businesses.
West Virginia Department of Agriculture Business Development
West Virginia Economic Development Authority (WVEDA)
Developing and advancing the business prosperity and economic welfare of the State of West Virginia.
Business Development
Funder/Website & MissionProgram or Grant Name* What is Funded**
West Virginia SBA Microloan Business Development
West Virginia Small Business Development Center (WV SBDC)
Be a resource to existing businesses that need information or assistance to become more innovative and competitive, but we also have resources and tools for those starting a new business.
� Technical assistance only
Business Development
West Virginia Tourism � Matching Advertising Partnership Program (MAPP)
Marketing