Study and characterisation of surface integrity modification ...
277
HAL Id: tel-02061706 https://tel.archives-ouvertes.fr/tel-02061706 Submitted on 8 Mar 2019 HAL is a multi-disciplinary open access archive for the deposit and dissemination of sci- entific research documents, whether they are pub- lished or not. The documents may come from teaching and research institutions in France or abroad, or from public or private research centers. L’archive ouverte pluridisciplinaire HAL, est destinée au dépôt et à la diffusion de documents scientifiques de niveau recherche, publiés ou non, émanant des établissements d’enseignement et de recherche français ou étrangers, des laboratoires publics ou privés. Study and characterisation of surface integrity modification after ultrasonic vibration-assisted ball burnishing Ramon Jerez Mesa To cite this version: Ramon Jerez Mesa. Study and characterisation of surface integrity modification after ultrasonic vibration-assisted ball burnishing. Mechanics of materials [physics.class-ph]. Université Paul Sabatier - Toulouse III, 2018. English. NNT : 2018TOU30024. tel-02061706
-
Upload
khangminh22 -
Category
Documents
-
view
2 -
download
0
Transcript of Study and characterisation of surface integrity modification ...

HAL Id: tel-02061706https://tel.archives-ouvertes.fr/tel-02061706
Submitted on 8 Mar 2019
HAL is a multi-disciplinary open accessarchive for the deposit and dissemination of sci-entific research documents, whether they are pub-lished or not. The documents may come fromteaching and research institutions in France orabroad, or from public or private research centers.
L’archive ouverte pluridisciplinaire HAL, estdestinée au dépôt et à la diffusion de documentsscientifiques de niveau recherche, publiés ou non,émanant des établissements d’enseignement et derecherche français ou étrangers, des laboratoirespublics ou privés.
Study and characterisation of surface integritymodification after ultrasonic vibration-assisted ball
burnishingRamon Jerez Mesa
To cite this version:Ramon Jerez Mesa. Study and characterisation of surface integrity modification after ultrasonicvibration-assisted ball burnishing. Mechanics of materials [physics.class-ph]. Université Paul Sabatier- Toulouse III, 2018. English. �NNT : 2018TOU30024�. �tel-02061706�

THÈSEEn vue de l’obtention du
DOCTORAT DE L’UNIVERSITÉ DE TOULOUSEDélivré par:
Université Toulouse III Paul Sabatier (UT3 Paul Sabatier)Cotutelle internationale avec Universitat Politècnica de Catalunya
Présentée et soutenue par :Ramón JEREZ MESA
le 2 Mars 2018Titre :
Study and characterisation of surface integrity modification after ultrasonicvibration-assisted ball burnishing
École doctorale et discipline ou spécialité :ED MEGEP : Génie mécanique, mécanique des matériaux
Unité de recherche :Institut Clément Ader, CNRS UMR 5312
Directeurs de Thèse :Yann Landon Université Toulouse III Paul Sabatier DirecteurJosé Antonio Travieso Universitat Politècnica de Catalunya DirecteurGilles Dessein École Nationale d’Ingénieurs de Tarbes Co-Directeur
Jury :Mehdi Chérif ENSAM de Bordeaux RapporteurGuillermo Reyes IQS, Universitat Ramon Llull RapporteurPhilippe Darnis IUT de Bordeaux ExaminateurIrene Buj Corral Universitat Politècnica de Catalunya ExaminatriceGiovanni Gómez Gras IQS, Universitat Ramon Llull Examinateur


Title: Study and characterisation of surface integrity modi�cationa�er ultrasonic vibration-assisted ball burnishing
Author: Ramon JEREZ MESA
Advisors: J. Antonio TRAVIESO-RODRIGUEZYann LANDONJordi LLUMA-FUENTESGilles DESSEIN
Date: February 2018
Abstract: �is dissertation is an experimental research project into themechanical e�ects of the ultrasonic vibration-assisted ballburnishing process on the surface integrity of surfaces ma-chined through ball-end milling.First, a prototype able to perform the process is designed andcharacterised. �en, it is tested on AISI 1038 and Ti-6Al-4V surfaces, following an experimental campaign based ona Taguchi orthogonal array. �e preload, number of passes,feed velocity, strategy and initial surface texture are includedas factors. Results are analysed in terms of topological char-acteristics, residual stress and hardness. �e original tex-ture proves to be the most in�uential parameter on all out-comes. Texture results show that the vibrations can enhancethe roughness and texture results, as long as they have su�-cient low initial amplitude.�e main conclusion arising from the study are di�erent pa-rameter sets that can deliver the best results from the perfor-mance of the vibration-assisted ball burnishing process, ac-coding to a speci�c desired optimisation target.
Keywords: vibration-assisted ball burnishing; surface integrity; surfacetexture; residual stress; hardness; steel; titanium

�is thesis was wri�en in LATEX.Figures were drawn using Inkscape.

Dissertation presented by Ramon Jerez Mesa in partial ful�llment of therequirements for the degrees of
Doctor per la Universitat Politecnica de Catalunyaand
Doctorat de l’Universite de Toulouse


Fur Harald


Acknowledgements
Fist of all, I would like to sincerely thank all professors that honour me by partici-pating of the evaluation of this dissertation: Irene Buj, Medi Cherif, Philippe Darnis,Giovanni Gomez and Guillermo Reyes.
Por supuesto, me gustarıa dar las gracias a mis directores espanoles, Jose AntonioTravieso y Jordi Lluma, tanto por vuestra implicacion para con esta tesis, como porla amistad compartida, forjada en el dıa a dıa. Juntos, siempre llegamos.
Je voudrais bien aussi remercier mes directeurs francais Yann Landon et GillesDessein, ainsi comme mon encadrant Vincent Wagner. Vos aportations a ce�e theseont ete plus qu’enrichissant. Mais, surtout, je remercie sincerement de m’avoir ouvertles portes de chez vous pendant mes sejours en France. Je me rejouis de ces amitiesimprevues de l’autre cote des Pyrenees.
Esta tesis es la culminacion de un camino que tome hace mucho tiempo, luegoaparque, pensando que de forma permanente, y al que volvı hace pocos aos sin haberloesperado. Todo este proceso tiene diversos nombres propios asociados a el. En primerlugar, debo agradecer a los profesores de mi alma mater, la Universidad Politecnica deCartagena, que, seguramente sin saberlo, atizaron la llama de mi vocacion academica:Jose Ramon Navarro, con sus vectores deslizantes, y Marıa Dolores Bermudez y AnaEva Jimenez con sus lıquidos ionicos. Por ultimo, ya en la Universitat Politcnica deCatalunya, debo agradecer a Toni Travieso, quien me regalo la oportunidad de viviresta maravillosa aventura.
I would not like to forget my colleagues in UPC, ENIT and UPS, who have beenin di�erent ways a support in this fascinating, however sometimes arid, trip of de-veloping a dissertation, and who have accompanied me when I was far from home.Giovanni, David, Eva, Joan, Silvia, Francesc Pozo, Marta, los Maneles y los Orioles,

�entin-Tarantino, Marcos and Landry. I would like to make special reference to Is-mael Fernandez, for his inestimable help during the acoustic emission measurements,and Cyrus Amini for his support for the �nite element model. My gratitude also forSerge Tovar, Anis Hor, Abdallah Bouzid, and Mehdi Salem for their technical and op-erational support during my working days in Toulouse.
Por supuesto, quiero dedicar unas palabras a mis padres Juana y Ramon, porquede pequeno nunca me dejaron conformarme, y me ensenaron el valor de esfuerzo paraconseguir las metas. Sin este aprendizaje tan valioso, esta tesis no podrıa haberse cul-minado. Tambien a mi hermana Patricia, cuya con�anza ciega en mi no tiene lımites.
Und schließlich, danke, Hari fur deine ewige Geduld und unbedingte Großzugigkeit.Weil du immer fur mich da warst, und weil du mich immer wieder auf den Boden derWirklichkeit zuruckgeholt hast.
J

Summary
�is dissertation is an experimental research project into the mechanical e�ects ofthe ultrasonic vibration-assisted ball burnishing process on the surface integrity ofsurfaces machined through ball-end milling. Due to the lack of commercial tools ableto perform this process, the study includes �rstly the design and characterisation ofa prototype to that e�ect. An experimental analysis is then undertaken, applyingthe process to AISI 1038 and Ti-6Al-4V surfaces of high industrial and aeronauticalvalue. �e experimental campaign is designed based on a Taguchi orthogonal arraythat includes �ve factors, namely: preload, number of passes, feed velocity, strategyand initial surface texture. Results are analysed in terms of topological characteris-tics, residual stress and hardness, in order to identify and understand the impact ofprocess parameters on surface integrity, to de�ne the best parameters for performingthe process and to assess the positive e�ects caused by the introduction of vibrationsas a means of assistance.Results reveal that the initial texture is the most in�uential parameter on all outcomes.Texture results show that the vibrations can enhance the roughness and texture re-sults, as long as they have su�cient low initial amplitude. Furthermore, only thepreload and number of passes in�uence the results, with a pair of values being foundin all cases that serve a threshold from which further plastic strain is detrimental forthe �nal surface topology. In terms of residual stress, all parameters are in�uentialin the results, especially the burnishing strategy, through which a certain componentof the residual stress tensor can be adequately reinforced. Finally, the burnishingoperation proves to modify the hardness of deep layers down to 0.5 mm, applyingthe vibration-assisted process. �e main conclusion is that the optimal parametersfor performing the process are di�erent with regards to the optimisation objective.Some useful combinations are proposed for performing the process depending on thedesired target.

Resume
Ce�e these etudie les e�ets du processus de brunissage a bille assiste par vibra-tions ultrasoniques sur l’integrite surface des surfaces usinees par fraisage hemispherique.Compte tenu de l’inexistence d’outils commerciaux capables de realiser ce proces-sus, l’etude debute par la conception et la caracterisation d’un prototype capable del’executer. Par la suite, une analyse experimentale est menee, en utilisant le procedesur les surfaces de deux alliages d’interet industriel et aeronautique, AISI 1038 et Ti-6Al-4V. Pour cela, un plan d’experiences est elabore a base d’une matrice orthogo-nale Taguchi. Cinq facteurs sont inclus dans le modele : la precharge, le nombrede passes, la vitesse d’avance, la strategie de brunissage et la texture initiale de lasurface prealablement usinee. Les resultats sont evalues en termes de texture �-nale, de contrainte residuelle et de durete, pour identi�er et comprendre l’impactde ce procede et des parametres operatoires sur l’integrite de surface, pour de�nirles meilleurs parametres a appliquer pour chaque materiau, et pour evaluer les e�etspositifs provoques par l’introduction de vibrations comme moyen d’assistance. Pourcela, la notion d’integrite de surface est rappelee, voire rede�nie dans le cas de latexture de surface. En e�et, les criteres classiquement utilises se revelent inaptes acaracteriser les surfaces obtenues, et une nouvelle methodologie d’analyse des topolo-gies de surface est proposee.Les resultats obtenus suite a la realisation du plan d’experiences revelent que la tex-ture initiale est le parametre preponderant. Les resultats de la topologie de sur-face montrent que les vibrations peuvent ameliorer la rugosite et la texture des sur-faces dans la mesure ou letat de surface initial est su�samment �n. Ensuite, seulela precharge et le nombre de passes in�uencent le resultat, avec, dans tous les cas,un couple de valeurs limites a partir desquelles les surfaces sont endommagees. Lesresultats des contraintes residuelles montrent que tous les parametres in�uent surle resultat �nal, en particulier la strategie de brunissage, avec laquelle la directionpreferentielle du tenseur de la contrainte super�cielle peut etre modi�ee. En�n, lebrunissage montre une modi�cation positive de la durete a des couches d’environ0,5 mm en appliquant le processus assiste avec vibrations. Nous concluons que lesparametres de processus optimaux sont di�erents en fonction de l’objectif d’optimisation,et que certaines combinaisons peuvent etre utiles en fonction de ces objectifs.
L

Resumen
Esta tesis es un estudio experimental que versa sobre los efectos del proceso de bru nido con bola asistido por vibraciones ultrasonicas sobre la integridad super�-cial de super�cies mecanizadas mediante fresa hemisferica. Dada la indisponibilidad de herramientas comerciales capaces de efectuar este proceso, el estudio incluye en primer lugar el dise no y caracterizacion de un prototipo a tal efecto. Posteriormente, se realiza un analisis experimental aplicando el proceso sobre super�cies de dos alea-ciones de interes industrial y aeronautico, AISI 1038 y Ti-6Al-4V, siguiendo un dise no de experimentos parcial basado en una matriz ortogonal de Taguchi. Para ello, cinco factores son incluidos en el modelo, a saber: la precarga, el numero de pasadas, la velocidad de avance, la estrategia de bru nido, y la amplitud de textura inicial. Los re-sultados se evaluan en terminos de textura, tensiones residuales y dureza, para de�nir los mejores parametros a aplicar para cada material, y con el �n de evaluar los efectos positivos provocados por la introduccion de las vibraciones como medio de asistencia. Los resultados revelan que la textura inicial es el parametro que de�ne en mayor me-dida el estado de las super�cies �nales. Los resultados de textura evidencian que las vibraciones pueden mejorar en mayor medida la textura de las super�cies objetivo, siempre que estas sean su�cientemente �nas. Ademas, solo la precarga y el numero de pasadas in�uyen en el resultado, encontrando en todo caso un par de valores limıtrofe a partir del cual las super�cies se ven da nadas. Los resultados de tensiones residuales muestran que todos los parametros son in�uyentes en el resultado �nal, especial-mente la estrategia de bru nido, con la que puede modi�carse la direccion preferen-cial del tensor de tensiones super�cial. Finalmente, el bru nido demuestra modi�car la dureza positivamente hasta capas de aproximadamente 0,5 mm, aplicando el pro-ceso asistido con vibraciones. Se concluye que los parametros optimos de proceso son diferentes en funcion del objetivo de optimizacion, y deben de�nirse en base a dos variables de partida: el material objetivo y la textura que este presenta antes del proceso.
M

Resumen
Aquesta tesi es un estudi experimental que tracta sobre els efectes del proces debrunyit amb bola assistit per vibracions ultrasoniques sobre la integritat super�cialde superfıcies mecanitzades amb fresa hemisferica. Degut a la indisponiblitat d’einescomercials capaces d’aplicar aquest proces, l’estudi inclou en primer lloc el dissenyi la caracteritzacio d’un prototip capa d’executar-lo. Posteriorment, es realitza unaanalisi experimental aplicant el proces sobre superfıcies de dues aliatges d’interes in-dustrial i aeronautic, AISI 1038 i Ti-6Al-4V, seguint un disseny d’experiments basaten una matriu ortogonal Taguchi. Per aixo, cinc factors son inclous en el model: laprecarrega, el nombre d passades, la velocitat d’aven, l’estrategia de brunyit i la tex-tura de la superfıcie inicial. Els resultats s’avaluen en termes de textura �nal, tensionsresiduals i duresa, per identi�car i comprendre l’impacte d’aquest proces i dels seusparametres d’operacio sobre la integritat super�cial, de�nir els millors parametres aaplicar per a cada material, i amb l’objectiu d’avaluar els efectes positius provocatsper la introduccio de les vibracions com a mitja d’assistencia.Els resultats evidencien que la textura inicial es el parametre que de�neix en majormesura l’estat de les superfıcies �nals. Els resultats de textura indiquen que les vibra-cions poden millorar en major mesura la rugositat i textura de les superfıcies, sempreque aquestes siguin su�cientment �nes. A mes, nomes la precarrega i el nombre depassades in�ueixen sobre el resultat, trobant en tot cas un parell de valors lımit apartir del qual les superfıcies son empitjorades. Els resultats de tensions residualsmostren que tots els parametres son in�uents sobre el resultat �nal, especialmentl’estrategia, amb la que es pot millorar la direccio preferencial del tensor de tensionssuper�cial. Finalment, el brunyit demostra modi�car la duresa positivament �ns acapes d’aproximadament 0.5 mm de profunditat, aplicant el proces assistit amb vi-bracions. Es conclou que els parametres optims de proces son diferents en funcio del’objectiu d’optimitzacio, i es proposen algunes combinacions que poden ser utils enfuncio del mateix.
N

Contents
List of Symbols xvii
1 Introduction 11.1 Motivations and antecedents . . . . . . . . . . . . . . . . . . . . . . . . . . 11.2 Research contributions . . . . . . . . . . . . . . . . . . . . . . . . . . . . . . 41.3 This dissertation in brief . . . . . . . . . . . . . . . . . . . . . . . . . . . . . 5
2 State of the art 92.1 General aspects of the burnishing operation . . . . . . . . . . . . . . . . . 10
2.1.1 An overview of burnishing tooling . . . . . . . . . . . . . . . . . . . . . . 122.1.2 General description of ball burnishing parameters . . . . . . . . . . . . . 14
2.2 Experimental results on surface integrity after ball burnishing . . . . . 192.2.1 Geometrical parameters: surface roughness and texture . . . . . . . . . . 222.2.2 Metallurgical parameters: hardness and metallography . . . . . . . . . . . 262.2.3 Mechanical parameters: residual stress . . . . . . . . . . . . . . . . . . . 28
2.3 Vibration-assisted ball burnishing . . . . . . . . . . . . . . . . . . . . . . . . 332.3.1 Description of the acoustoplastic effect . . . . . . . . . . . . . . . . . . . 342.3.2 Experimental results of ultrasonic burnishing . . . . . . . . . . . . . . . . 38
2.4 Objectives arising from the state of the art . . . . . . . . . . . . . . . . . 41
3 Design and characterisation of the VABB tool 433.1 Mechanical construction . . . . . . . . . . . . . . . . . . . . . . . . . . . . . 44
3.1.1 Force regulation unit . . . . . . . . . . . . . . . . . . . . . . . . . . . . 453.1.2 Vibration transmission unit . . . . . . . . . . . . . . . . . . . . . . . . . 483.1.3 Force transmission unit . . . . . . . . . . . . . . . . . . . . . . . . . . . 53
3.2 Frequency measurement through acoustic emission . . . . . . . . . . . . . . 533.2.1 Acoustic emission experimental setup . . . . . . . . . . . . . . . . . . . . 55
i

CONTENTS
3.2.2 Frequency of the ultrasonic signals recorded by AE . . . . . . . . . . . . . 573.3 Dynamometric characterisation . . . . . . . . . . . . . . . . . . . . . . . . . 58
3.3.1 Dynamometric experimental setup . . . . . . . . . . . . . . . . . . . . . 593.3.2 Quantification of the superimposed vibratory force . . . . . . . . . . . . . 61
3.4 Preliminary validation tests . . . . . . . . . . . . . . . . . . . . . . . . . . . 663.5 Synthesis . . . . . . . . . . . . . . . . . . . . . . . . . . . . . . . . . . . . . . 71
4 Description of the experimental methodology 734.1 Experimental design . . . . . . . . . . . . . . . . . . . . . . . . . . . . . . . . 74
4.1.1 Fractional design of experiments . . . . . . . . . . . . . . . . . . . . . . 744.1.2 Factors included in the study . . . . . . . . . . . . . . . . . . . . . . . . 764.1.3 Taguchi array . . . . . . . . . . . . . . . . . . . . . . . . . . . . . . . . 784.1.4 Particular DOE arrays for the studied materials . . . . . . . . . . . . . . 794.1.5 Unvaried process factors . . . . . . . . . . . . . . . . . . . . . . . . . . 814.1.6 Results assessment through Analysis of Variance . . . . . . . . . . . . . . 82
4.2 Measurement of the surface integrity parameters . . . . . . . . . . . . . . 854.2.1 Acquisition of topological data . . . . . . . . . . . . . . . . . . . . . . . 854.2.2 Metallurgical characterisation of subsurface layers . . . . . . . . . . . . . 954.2.3 Residual stress measurement . . . . . . . . . . . . . . . . . . . . . . . . 98
4.3 Material characterisation . . . . . . . . . . . . . . . . . . . . . . . . . . . . 1024.3.1 AISI 1038 alloy . . . . . . . . . . . . . . . . . . . . . . . . . . . . . . . 1024.3.2 Ti-6Al-4V alloy . . . . . . . . . . . . . . . . . . . . . . . . . . . . . . . 104
4.4 Experimental execution . . . . . . . . . . . . . . . . . . . . . . . . . . . . . . 1074.4.1 Machining of the original surfaces . . . . . . . . . . . . . . . . . . . . . . 1084.4.2 Burnishing force measurement . . . . . . . . . . . . . . . . . . . . . . . 109
4.5 Recapitulation . . . . . . . . . . . . . . . . . . . . . . . . . . . . . . . . . . . 111
5 Experimental results and discussion 1135.1 Geometrical parameter: surface texture . . . . . . . . . . . . . . . . . . . 114
5.1.1 AISI 1038 . . . . . . . . . . . . . . . . . . . . . . . . . . . . . . . . . . 1145.1.2 Ti-6Al-4V . . . . . . . . . . . . . . . . . . . . . . . . . . . . . . . . . . 1425.1.3 Comparison of topological results of AISI 1038 and Ti-6Al-4V . . . . . . . 1555.1.4 Approach to the surface-ball interface through a finite element model . . . 161
5.2 Mechanical parameter: residual stress . . . . . . . . . . . . . . . . . . . . . 1675.2.1 AISI 1038 . . . . . . . . . . . . . . . . . . . . . . . . . . . . . . . . . . 1675.2.2 Ti-6Al-4V . . . . . . . . . . . . . . . . . . . . . . . . . . . . . . . . . . 178
ii

CONTENTS
5.3 Optimal parameter sets according to texture and RS criteria: synthesis 1865.4 Metallurgical parameter: hardness and metallography . . . . . . . . . . . 190
5.4.1 AISI 1038 . . . . . . . . . . . . . . . . . . . . . . . . . . . . . . . . . . 1905.4.2 Ti-6Al-4V . . . . . . . . . . . . . . . . . . . . . . . . . . . . . . . . . . 195
5.5 Synthesis of metallurgical results . . . . . . . . . . . . . . . . . . . . . . . 198
6 Conclusions and perspectives 1996.1 Future works . . . . . . . . . . . . . . . . . . . . . . . . . . . . . . . . . . . . 2026.2 Publications derived from this dissertation . . . . . . . . . . . . . . . . . . 203
A L27 Taguchi arrays for experimental design 205A.1 Compliance of the sufficient degrees of freedom condition . . . . . . . . 209A.2 Compliance of the orthogonality condition . . . . . . . . . . . . . . . . . . 210
B VABB AISI 1038 texture �gures 211
C VABB Ti-6Al-4V texture �gures 217
D S/N ratios of residual stress ANOVA 223
Bibliography 227
iii

CONTENTS
iv

List of Figures
1.1 Hemispherical milling of engineering surfaces. A�er Fontaine et al.,2006 [38]. a. Overview of a ball-end milled surface. b. Ball-end millingkinematic parameters and scheme of the process. . . . . . . . . . . . . . 3
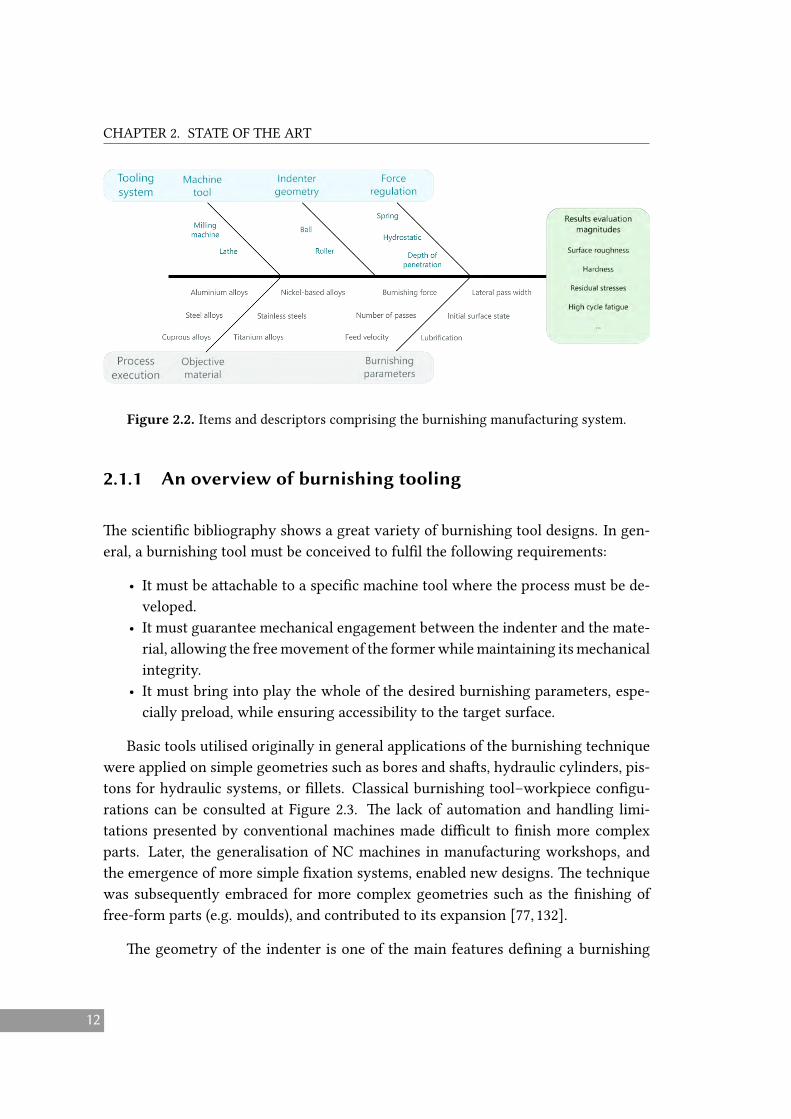
2.1 Schematic representation of the ball burnishing process. . . . . . . . . . 102.2 Items and descriptors comprising the burnishing manufacturing system. 122.3 Classical burnishing tool con�gurations on lathe and milling machines.
A�er Murthy, 1981 [103] . . . . . . . . . . . . . . . . . . . . . . . . . . . . 132.4 Special burnishing tool con�gurations. a. Milling & burnishing tool
[127] b. Center rest multi-ball tool [28] c. Multi-roller tool [141] d.Multi-ball tool [41] e. Adjustable roller tool [107] f. Multi–ball tool [140] 15
2.5 Force regulation systems in classical burnishing tools. a. Depth-of-penetration tool [80]. b. Hydrostatic tool [119]. c. Spring-regulatedtool [52] . . . . . . . . . . . . . . . . . . . . . . . . . . . . . . . . . . . . . . 16
2.6 Experimental measure of force unevenness during a burnishing pro-cess. A�er Lye & Leong, 1990 [91]. . . . . . . . . . . . . . . . . . . . . . . 18
2.7 𝑅𝑎 results of burnished INCONEL 718 surfaces. a. In�uence of bur-nishing pressure [70]. b. In�uence of ball diameter [70]. c. In�uenceof burnishing pressure [128]. d. In�uence of ball diameter [128] . . . . 25
2.8 SEM images of the surface microstructure of burnished specimens atdi�erent pressure levels, and surface Vickers hardness. A�er Lopezde la Calle et al., 2007 [87]. a. Inconel 718. b. AISI P20 pre-heated steel 28
2.9 SEM images of 20Cr4 steel specimens. a. 200-N normal force. b. 400-N normal force. c. Subsurface shear instability caused by excessiveplastic deformation. A�er Kuznetsov et al., 2015 [75] . . . . . . . . . . . 29
2.10 Microstructure and hardness of turned (𝑣𝑐 = 150 m/min, 𝑓 = 0.18
mm/rev, 𝑎𝑝 = 0.6 mm) and turned+burnished (250 N, 𝑛𝑏 = 1 pass, 6-mm diameter ball) 15-5PH specimens. A�er Chomienne et al., 2016 [18]. 29
v

LIST OF FIGURES
2.11 a. Di�erent residual stress scales 𝑙0,𝐼 , 𝑙0,𝐼𝐼 and 𝑙0,𝐼𝐼𝐼 . b. Examples ofsources of macro and micro residual stress states. A�er Withers &Bhadeshia, 2001 [157] . . . . . . . . . . . . . . . . . . . . . . . . . . . . . . 31
2.12 Mechanical surface integrity results of ball burnished AISI 1045 spec-imens. A�er Aviles et al., 2015 [4]. a. Depth dependence of residualstress. b. S-N fatigue diagram of burnished specimens. . . . . . . . . . . 32
2.13 Deep residual stress measured on Inconel 718. a. In�uence of pressure.b. In�uence of ball diameter. A�er Klocke et al., 2009 [70] . . . . . . . . 32
2.14 Comparison of residual stress measurement of ball burnished surfacesthrough X-ray di�raction and incremental hole drilling. a. Results byKlocke et al. (2009) on Inconel 718 [70]. b. Results by Garcıa-Granadaet al. (2017) [40]. . . . . . . . . . . . . . . . . . . . . . . . . . . . . . . . . . 33
2.15 E�ect of superimposed 800 kHz ultrasound on zinc crystal specimensdeformation. without, and - - - - with vibrations. A�er Blaha &Langenecker, 1955, [7] . . . . . . . . . . . . . . . . . . . . . . . . . . . . . . 35
2.16 Stress reduction during compressive tests due to acoustoplasticity withdi�erent amplitudes. a. Mild steel. b. Copper. c. Al-Al2O3 alloy. A�erIzumi et al., 1966 [62] . . . . . . . . . . . . . . . . . . . . . . . . . . . . . . . 36
2.17 Linear correlation between the vibration sensitivity, 𝑘, and work-hardeningcoe�cient, acoustic impedance and Young’s module. A�er Izumi et al.1966 [62] . . . . . . . . . . . . . . . . . . . . . . . . . . . . . . . . . . . . . . 36
2.18 Interaction of the burnishing force and the vibrations amplitude ina. ultrasonic burnishing (a�er Marakov, 1973 [94]) and b. vibratoryburnishing (a�er Pande & Patel, 1984 [109]) on mild steel specimens. . 39
2.19 In�uence of burnishing force and frequency on a. surface roughnessand b. surface hardness, a�er Pande & Patel, 1984 [109]). . . . . . . . . 39
2.20 Deep residual stress pro�le comparison a�er conventional (CDCR)and ultrasonic burnishing (UDCR). A�er Bozdana, 2008 [12]. . . . . . . 40
3.1 Structure of the ultrasonic vibration-assisted ball burnishing tool. . . . 453.2 Diagram of the FTU. a. Exploded view. b. Assembled parts and spring
compression. . . . . . . . . . . . . . . . . . . . . . . . . . . . . . . . . . . . . 463.3 Calibration of the VABB prototype. a. Overview of experimental
setup. b. Curve obtained by compression at 100-mm/min velocity. . . . 473.4 Stacked piezoelectric plates inside the VTU of the VABB prototype. . . 493.5 Frequency sweep and register of electrical impedance of the circuit
which excites the tool. . . . . . . . . . . . . . . . . . . . . . . . . . . . . . . 53
vi

LIST OF FIGURES
3.6 Schematic representation of the force transmission unit. a. Detail ofbearing balls on hemispherical track machined on the sonotrode tip.b. Assembled section of FTU components. . . . . . . . . . . . . . . . . . 54
3.7 Experimental setup for the measurements through acoustic emission. . 563.8 Time history and frequency spectrum of signals registered the bur-
nishing line tests 270 N, 𝐴 = 50% . . . . . . . . . . . . . . . . . . . . . . . 573.9 Experimental setup for the dynamometric measurements. . . . . . . . . 603.10 Comparison of calibration lines measured through continuous force
acquisition and Kitsler dynamometric measurements. . . . . . . . . . . . 603.11 Sinus �t calculated for the recorded signal at 𝐹𝑝 = 600 N and 𝐴 = 100%. 623.12 Half-cycle vibratory force variation, and extreme values, for di�erent
preload levels. a. 𝐴 = 50%. b. 𝐴 = 100%. . . . . . . . . . . . . . . . . . . . 633.13 Half-cycle vibratory force variation, and extreme values, for di�erent
preload levels. a. 𝐹𝑝 = 300 N. b. 𝐹𝑝 = 600 N. . . . . . . . . . . . . . . . . . 653.14 Preliminary burnishing imprints performed on a milled AISI 1038 sur-
face. . . . . . . . . . . . . . . . . . . . . . . . . . . . . . . . . . . . . . . . . . 673.15 Meshes I-IV de�ned on the tool for the image treatment routine. . . . . 683.16 Points composing the mesh of part I. . . . . . . . . . . . . . . . . . . . . . 683.17 Raw and smoothed curves representing the slope presented by the
mesh of part I with a 90-N preload. . . . . . . . . . . . . . . . . . . . . . . 693.18 Angle and slope nomenclature related to the calculation of the relative
angle between tool sections. . . . . . . . . . . . . . . . . . . . . . . . . . . 70
4.1 Burnishing strategies included in the DOE and nomenclature of thedirections referenced in the text. . . . . . . . . . . . . . . . . . . . . . . . . 78
4.2 Linear graph associated to the L27 Taguchi array. Balls: factors. Lines:interactions. . . . . . . . . . . . . . . . . . . . . . . . . . . . . . . . . . . . . 79
4.3 Schematic representation of the VABB (non-contoured yellow patches)and NVABB (contoured blue patches) tests performed on a generalworkpiece and reference directions considered in this work. . . . . . . . 81
4.4 Planned experimental tests represented on the three di�erent ma-chined 𝑆0. Striped patches: VABB tests. a. AISI 1038. b. Ti-6Al-4V. . . 83
4.5 Measurement of burnished track width on Ti-6Al-4V applying 150 N. . 844.6 Sampled 3D surface transformed into a height function. A�er Dong
et al., 1992 [23] . . . . . . . . . . . . . . . . . . . . . . . . . . . . . . . . . . 86
vii

LIST OF FIGURES
4.7 Surface pro�les and height distributions showing the e�ects of skew-ness and kurtosis. Top to bo�om: positively skewed, negatively skewed,leptokurtic and platykurtic distributions. A�er �omas, 1981 [146] . . 88
4.8 Main V parameters related to the bearing area curve, represented in2D. Extrapolation to 3D can be easily visualised. . . . . . . . . . . . . . . 90
4.9 Evolution of some S parameters with respect to the sampling size. a.𝑆𝑠𝑘 and 𝑆𝑘𝑢. b. 𝑆𝑞 and 𝑆𝑧10. . . . . . . . . . . . . . . . . . . . . . . . . . . . 92
4.10 Overview of specimen positioned on the encapsulating machine plate. 954.11 Vickers microindentation hardness test scheme. . . . . . . . . . . . . . . 964.12 X-ray di�raction in a non-deformed crystal (le�) and a deformed crys-
tal (right). . . . . . . . . . . . . . . . . . . . . . . . . . . . . . . . . . . . . . . 994.13 X-ray di�raction spectrum showing a di�raction peak at 2𝜃𝜓 position,
with regards to the spectrum registered for the reference material, 2𝜃0. 1004.14 Linear representation of the sin2𝜓 method. A�er Guillemot (2010) [49]. 1014.15 Metallographic observations of the AISI 1038 specimen at 50x. a. Di-
rection I. b. Direction II (lamination). . . . . . . . . . . . . . . . . . . . . . 1034.16 . a. SEM image of pearlite nucleation. b. Imprints a�er Vickers in-
dentation spanning ferrite and pearlite structures. . . . . . . . . . . . . . 1044.17 Metallographic observations of the Ti-6Al-4V specimen along direc-
tion I (a) and direction II (b). . . . . . . . . . . . . . . . . . . . . . . . . . . 1064.18 Detail of Vickers indentation performed on the Ti-6Al-4V. . . . . . . . . 1064.19 Experimental setup. a. Detail of workpiece a�ached to a Kistler dy-
namometer. b. HURON KX10 milling machine where experimentswere developed. . . . . . . . . . . . . . . . . . . . . . . . . . . . . . . . . . . 107
4.20 Hemispherical front milling geometric system. . . . . . . . . . . . . . . . 1094.21 𝐹𝑥 and 𝐹𝑧 measurement during the VABB and NVABB tests #25 in
Ti-6Al-4V workpiece. a. Identi�cation of burnishing cycles through��ed signal (red). b. Extracted forces at two burnishing cycles. . . . . . 110
4.22 Mean 𝐹𝑧 registered for all burnishing cycles, and maximum and min-imum forces registered. a. AISI 1038. b. Ti-6Al-4V. . . . . . . . . . . . . 111
5.1 Summary of items included in the result analysis. . . . . . . . . . . . . . 1135.2 Two-dimensional descriptors of original surfaces (AISI 1038). . . . . . . 1165.3 𝑆 parameters describing the initial surfaces of AISI 1038. a. Amplitude
parameters. b. Spatial and hybrid parameters. . . . . . . . . . . . . . . . 1175.4 𝑉 parameters describing the initial surfaces of AISI 1038. a. Volumet-
ric parameters. b. AF parameters. . . . . . . . . . . . . . . . . . . . . . . . 117
viii

LIST OF FIGURES
5.5 AF curves for the three original surfaces on AISI 1038. . . . . . . . . . . 1185.6 Topological images of VABB tests #25 and #18 performed on AISI 1038. 1195.7 VABB mean e�ects, S/N ratios and interaction plots. ANOVA response
variable: 𝑅𝑞 of AISI 1038. . . . . . . . . . . . . . . . . . . . . . . . . . . . . 1205.8 VABB mean e�ects, S/N ratios and interaction plots. ANOVA response
variable: 𝑆𝑞 of AISI 1038. . . . . . . . . . . . . . . . . . . . . . . . . . . . . 1215.9 𝑆𝑞 and 𝑆10𝑧 amplitude parameters of AISI 1038 VABB patches. . . . . . 1225.10 Procedure to �nd the best VABB parameters based on 𝑆𝑞 reduction. . . 1235.11 𝑆𝑠𝑘 and 𝑆𝑘𝑢 amplitude parameters of AISI 1038 VABB patches. . . . . . 1255.12 AISI 1038 height histograms of VABB tests on 𝑆0
1 (top), 𝑆02 (middle),
and 𝑆03 (bo�om), optimal results (framed), and another reference test. . 126
5.13 𝑆𝑎𝑙 and 𝑆𝑡𝑟 spatial parameters and 𝑆𝑑𝑞 hybrid parameter of AISI 1038VABB patches. . . . . . . . . . . . . . . . . . . . . . . . . . . . . . . . . . . . 128
5.14 Optical images of 𝑆03 and #27VABB surfaces. . . . . . . . . . . . . . . . . 128
5.15 Singular AF curves with convexity change linked to platykurtic sur-faces, and detail showing 𝑆𝑠𝑘 related to 𝑥 intersection point. . . . . . . 130
5.16 AF curve slopes of all 𝑆01 and 𝑆0
3 tests. . . . . . . . . . . . . . . . . . . . . 1315.17 Linear correlation between 𝑆𝑘𝑢 and Σ𝑠VABB tests. . . . . . . . . . . . . 1315.18 Volumetric parameters of AISI 1038 burnishing patches. . . . . . . . . . 1325.19 AF amplitude parameters of AISI 1038 burnishing patches. . . . . . . . 1335.20 AF bearing percentages parameters of AISI 1038 burnishing patches. . 1345.21 Nomenclature of parameters describing the AF curve and the least
slope method applied to obtain the core area. . . . . . . . . . . . . . . . . 1355.22 Correlation between AF parameters and the least slope curve traced
to calculate them. Surfaces: 𝑆01 : ○𝑆0
2 : ×𝑆03 : △. Descriptors: Blue: 𝑚𝑚𝑖𝑛.
Green: 𝑀𝑚𝑖𝑛. . . . . . . . . . . . . . . . . . . . . . . . . . . . . . . . . . . . 1355.23 Secant according to ISO 10350 to calculate the AF descriptive param-
eters. . . . . . . . . . . . . . . . . . . . . . . . . . . . . . . . . . . . . . . . . 1365.24 Correlation between AF parameters with a. 𝑆𝑘𝑢, and b. 𝑆𝑞. . . . . . . . 1375.25 Direct comparison of the 𝑆𝑞 parameter of VABB and NVABB tests on
AISI 1038. . . . . . . . . . . . . . . . . . . . . . . . . . . . . . . . . . . . . . . 1385.26 SEM images of the 𝑆0
1 surface burnished by 5 passes and the nb strat-egy. NVABB surfaces show scratches along the feed direction. . . . . . 139
5.27 Skewness and kurtosis amplitude parameters represented for all VABBand NVABB tests. . . . . . . . . . . . . . . . . . . . . . . . . . . . . . . . . . 140
5.28 Bidimensional descriptors of original surfaces (Ti-6Al-4V). . . . . . . . 142
ix

LIST OF FIGURES
5.29 S parameters describing the initial surfaces of Ti-6Al-4V. a. Amplitudeparameters. b. Spatial and hybrid parameters. c. AF parameters. d.Volumetric parameters. . . . . . . . . . . . . . . . . . . . . . . . . . . . . . 143
5.30 VABB mean e�ects, S/N ratios and interaction plots. ANOVA responsevariable: 𝑆𝑞 of Ti-6Al-4V. . . . . . . . . . . . . . . . . . . . . . . . . . . . . 144
5.31 a. 𝑆𝑞 and 𝑆10𝑧 amplitude parameters of Ti-6Al-4V burnishing patches.b. Detail of 𝑆0
1 results. . . . . . . . . . . . . . . . . . . . . . . . . . . . . . . 1455.32 𝑆𝑠𝑘 and 𝑆𝑘𝑢 amplitude parameters of Ti-6Al-4V burnishing patches. . . 1475.33 Ti-6Al-4V height histograms of VABB tests on 𝑆0
1 (top), 𝑆02 (middle),
and 𝑆03 (bo�om), optimal results (framed), and another reference test. . 148
5.34 𝑆𝑎𝑙 and 𝑆𝑡𝑟 spatial parameters and 𝑆𝑑𝑞 hybrid parameter of Ti-6Al-4Vburnishing patches. . . . . . . . . . . . . . . . . . . . . . . . . . . . . . . . . 149
5.35 Optical images of 𝑆01 surface, and VABB tests #18 and #25. . . . . . . . . 150
5.36 Colour map of heights composing the VABB surfaces of singular tests. 1505.37 Correlation between Σ𝑠 and 𝑆𝑘, 𝑉𝑚𝑐 and 𝑉𝑣𝑐 of VABB tests on Ti-6Al-4V. 1515.38 Volumetric parameters of Ti-6Al-4V burnishing patches. . . . . . . . . . 1525.39 Abbot-Firestone amplitude parameters of Ti-6Al-4V burnishing patches. 1525.40 AF bearing percentages parameters of Ti-6Al-4V burnishing patches. . 1535.41 Slopes of AF curves resulting from VABB on the Ti-6Al-4V material,
on 𝑆01 (le�) and 𝑆0
3 (right). . . . . . . . . . . . . . . . . . . . . . . . . . . . . 1535.42 a. Direct comparison of the 𝑆𝑞 parameter of VABB and NVABB tests
on Ti-6Al-4V. b. Detail of 𝑆01 results. . . . . . . . . . . . . . . . . . . . . . 155
5.43 Amplitude parameters de�ning the surfaces. . . . . . . . . . . . . . . . . 1575.44 Colour maps of NVABB and VABB tests performed on 𝑆0
0 , applying270N-5passes . . . . . . . . . . . . . . . . . . . . . . . . . . . . . . . . . . . 158
5.45 AF curves of 𝑆00 tests on the AISI 1038 material. Discontinuous lines:
VABB process. . . . . . . . . . . . . . . . . . . . . . . . . . . . . . . . . . . . 1595.46 𝑆𝑠𝑘 - 𝑆𝑘𝑢 plot of VABB and NVABB results obtained on AISI 1038 and
Ti-6Al-4V tests. . . . . . . . . . . . . . . . . . . . . . . . . . . . . . . . . . . 1595.47 Position of the VABB and NVABB process with respect to other �n-
ishing process. A�er data found at Gri�ths (1986) [47]. . . . . . . . . . 1605.48 2D periodical texture pro�le used by Sartkulvanich et al. (2007) [124]. . 1625.49 3D periodical textures modelling 𝑆0
1 and 𝑆03 . Red line: spline curves
modelling the initial texture peaks. . . . . . . . . . . . . . . . . . . . . . . 1645.50 Steps comprising the FEM and boundary conditions imposed on the
material. . . . . . . . . . . . . . . . . . . . . . . . . . . . . . . . . . . . . . . 165
x

LIST OF FIGURES
5.51 Texture a�er burnishing modelled by vertical displacement of the FEMnodes due to plastic deformation on 𝑆0
1 (top) and 𝑆03 (bo�om). Scale in
m. . . . . . . . . . . . . . . . . . . . . . . . . . . . . . . . . . . . . . . . . . . 1655.52 Contact areas between ball and 𝑆0
1 and 𝑆03 surfaces in di�erent stages
during lateral displacements. . . . . . . . . . . . . . . . . . . . . . . . . . . 1665.53 Residual stress descriptors at 𝑆0
1 , 𝑆02 and 𝑆0
3 AISI 1038 surfaces. . . . . . 1685.54 Normal components of the residual stress tensor measured for all VABB
and NVABB patches of the AISI 1038 workpiece. . . . . . . . . . . . . . . 1705.55 Correlation between 𝜎𝐼𝐼 and 𝜎𝑣𝑚. . . . . . . . . . . . . . . . . . . . . . . . 1715.56 Procedure to �nd the best ball burnishing parameters to maximise
residual stress. . . . . . . . . . . . . . . . . . . . . . . . . . . . . . . . . . . . 1725.57 VABB and NVABB mean e�ects. ANOVA response variable: RS stress
components of AISI 1038. . . . . . . . . . . . . . . . . . . . . . . . . . . . . 1735.58 VABB and NVABB mean e�ects, S/N ratios and interaction plots. ANOVA
response variable: �nal-to-initial stress components ratio of AISI 1038. 1745.59 VABB interaction charts. ANOVA response variables: RS components
of AISI 1038. . . . . . . . . . . . . . . . . . . . . . . . . . . . . . . . . . . . . 1755.60 AISI 1038 experimental tests with highest compressive residual stress. 1775.61 Residual stress descriptors at 𝑆0
1 , 𝑆02 and 𝑆0
3 Ti-6Al-4V surfaces. . . . . 1795.62 Normal components of the residual stress tensor measured for all VABB
and NVABB patches of the Ti-6Al-4V workpiece. . . . . . . . . . . . . . 1805.63 VABB and NVABB mean e�ects. ANOVA response variable: RS stress
components of Ti-6Al-4V. . . . . . . . . . . . . . . . . . . . . . . . . . . . . 1825.64 VABB and NVABB mean e�ects, S/N ratios and interaction plots. ANOVA
response variable: �nal-to-initial stress components ratio of Ti-6Al-4V. 1835.65 VABB and NVABB interaction charts. ANOVA response variables: RS
components of Ti-6Al-4V. . . . . . . . . . . . . . . . . . . . . . . . . . . . . 1845.66 Ti-6Al-4V experimental tests with highest compressive residual stress. 1865.67 Hardness pro�les of VABB and NVABB 𝑆0
1 AISI 1038 surfaces. a.Along direction I. b. SEM view of the Vickers microindentation ma-trix performed on the subsurface layers of the non-burnished AISI1038 specimen. . . . . . . . . . . . . . . . . . . . . . . . . . . . . . . . . . . 191
5.68 Hardness pro�les of VABB and NVABB 𝑆01 AISI 1038 surfaces. a.
Along direction I. b. Along direction II. . . . . . . . . . . . . . . . . . . . 1925.69 HV ratio between VABB and NVABB tests of 𝑆0
1 AISI 1038 surfaces. a.Along direction I. b. Along direction II. . . . . . . . . . . . . . . . . . . . 194
5.70 x2000 SEM observations of ball-burnished AISI 1038. . . . . . . . . . . . 195
xi

LIST OF FIGURES
5.71 Hardness pro�les of VABB and NVABB 𝑆01 Ti-6Al-4V surfaces. a.
Along direction I. b. Along direction II. . . . . . . . . . . . . . . . . . . . 1965.72 x2000 SEM observations of ball-burnished Ti-6Al-4V. . . . . . . . . . . . 197
6.1 Summary of the conclusions regarding VABB. . . . . . . . . . . . . . . . 202
B.1 Sequential height colour map of all VABB tests on AISI 1038 𝑆01 surfaces. 212
B.2 Sequential height colour map of all VABB tests on AISI 1038 𝑆02 surfaces. 213
B.3 Sequential height colour map of all VABB tests on AISI 1038 𝑆03 surfaces. 214
B.4 VABB height distributions of AISI 1038 surfaces. . . . . . . . . . . . . . . 215B.5 VABB Abbo�-Firestone curves of AISI 1038 surfaces. . . . . . . . . . . . 216
C.1 Sequential height colour maps of all VABB tests on Ti-6Al-4V 𝑆01 sur-
faces. . . . . . . . . . . . . . . . . . . . . . . . . . . . . . . . . . . . . . . . . 218C.2 Sequential height colour maps of all VABB tests on Ti-6Al-4V 𝑆0
2 sur-faces. . . . . . . . . . . . . . . . . . . . . . . . . . . . . . . . . . . . . . . . . 219
C.3 Sequential height colour maps of all VABB tests on Ti-6Al-4V 𝑆03 sur-
faces. . . . . . . . . . . . . . . . . . . . . . . . . . . . . . . . . . . . . . . . . 220C.4 VABB height distributions of Ti-6Al-4V surfaces. . . . . . . . . . . . . . 221C.5 VABB Abbo�-Firestone curves of Ti-6Al-4V surfaces. . . . . . . . . . . . 222
D.1 S/N ratios for the ANOVA analysis of RS in AISI 1038 surfaces. . . . . . 224D.2 S/N ratios for the ANOVA analysis of RS in TA6V surfaces. . . . . . . . 225
xii

List of Tables
2.1 Ball burnishing references on steel, aluminium and cuprous alloys.Light grey: milling-machine tools. White: lathe tools. . . . . . . . . . . . 21
2.2 Ball burnishing references on stainless steel, titanium and nickel al-loys. Light grey: milling-machine tools. White: lathe tools. . . . . . . . . 23
3.1 Spring calibration parameters calculated at di�erent compression ve-locities. . . . . . . . . . . . . . . . . . . . . . . . . . . . . . . . . . . . . . . . 48
3.2 Dynamic speci�cations imposed for the VABB prototype. . . . . . . . . 483.3 Properties of hard PZT8 material used for the piezoelectric actuators
in the VABB tool. . . . . . . . . . . . . . . . . . . . . . . . . . . . . . . . . . 513.4 Measuring conditions tested during the acoustic emission acquisitions. 553.5 Fundamental frequency found for each measured signal and its am-
plitude. . . . . . . . . . . . . . . . . . . . . . . . . . . . . . . . . . . . . . . . 583.6 Conditions measured during the dynamometric tests. . . . . . . . . . . . 593.7 Average goodness of �t of𝐹𝑣 sine �ts through the Pearson𝑅2 parameter. 633.8 Average descriptors of sine �ts of 𝐹𝑣 and maximum and minimum
values registered. . . . . . . . . . . . . . . . . . . . . . . . . . . . . . . . . . 643.9 Average frequency of all sine �ts that model the 𝐹𝑣, and standard de-
viation (𝑆𝐷). . . . . . . . . . . . . . . . . . . . . . . . . . . . . . . . . . . . . 663.10 Mesh size for the image processing of the tool. . . . . . . . . . . . . . . . 683.11 Absolute and relative pivoting angles of each part of the prototype for
both preload levels. . . . . . . . . . . . . . . . . . . . . . . . . . . . . . . . . 71
4.1 NC codes for every absolute strategy pa�ern resulting from the com-bination of the 𝑛𝑝 and St. factors. In brackets the Taguchi run in whichthey are to be executed. . . . . . . . . . . . . . . . . . . . . . . . . . . . . . 78
4.2 Experimental design derived from a 𝐿27(313) Taguchi orthogonal array. 80
xiii

LIST OF TABLES
4.3 Factors and levels at the Taguchi array for AISI 1038 and Ti-6Al-4Vspecimens. . . . . . . . . . . . . . . . . . . . . . . . . . . . . . . . . . . . . . 82
4.4 Descriptors and factors kept constant in the tests. . . . . . . . . . . . . . 824.5 Calculation of the signal-to-noise ratio in function of the goal of the
experiment. . . . . . . . . . . . . . . . . . . . . . . . . . . . . . . . . . . . . 844.6 12 S parameter set for surface topography assessment, as de�ned in
the ISO 25178. . . . . . . . . . . . . . . . . . . . . . . . . . . . . . . . . . . . 874.7 Central moments of a surface height distribution. A�er King & Davis
(1982) [69] . . . . . . . . . . . . . . . . . . . . . . . . . . . . . . . . . . . . . 874.8 �e 13 V parameter set, as de�ned in the ISO 25178. . . . . . . . . . . . . 914.9 Errors calculated from the repeatability of S parameters on the ma-
chined surfaces. . . . . . . . . . . . . . . . . . . . . . . . . . . . . . . . . . . 934.10 Retained topological parameters from the S set. . . . . . . . . . . . . . . 944.11 Experimental characteristics of X-ray di�raction measurements. . . . . 1024.12 AISI 1038 weight composition. . . . . . . . . . . . . . . . . . . . . . . . . . 1024.13 AISI 1038 properties, as characterised by Travieso-Rodrıguez (2010)
[148]. . . . . . . . . . . . . . . . . . . . . . . . . . . . . . . . . . . . . . . . . 1034.14 Hardness measurements performed on the AISI 1038 specimens. . . . . 1044.15 Ti-6Al-4V weight composition according to AFNOR L14-601. . . . . . . 1054.16 Grade 23 Ti-6Al-4V properties. . . . . . . . . . . . . . . . . . . . . . . . . . 1054.17 Hardness measurements performed on the Ti-6Al-4V specimens. . . . . 1054.18 Machining parameters applied to obtain the three original surface
topologies. . . . . . . . . . . . . . . . . . . . . . . . . . . . . . . . . . . . . . 108
5.1 Summary of retained two- and three-dimensional topological param-eters. . . . . . . . . . . . . . . . . . . . . . . . . . . . . . . . . . . . . . . . . 115
5.2 Parameters to apply VABB on AISI 1038 end-milled surfaces, based onANOVA mean results. Optimisation target: minimum texture amplitude. 124
5.3 Recommended parameters to ball-burnish AISI 1038 end-milled sur-faces. Optimisation target: Gaussian surface with minimum textureamplitude. . . . . . . . . . . . . . . . . . . . . . . . . . . . . . . . . . . . . . 141
5.4 Parameters to apply VABB on Ti-6Al-4V end-milled surfaces, based onANOVA mean results. Optimisation target: minimum texture amplitude. 146
5.5 Recommended parameters to ball-burnish Ti-6Al-4V ball-end milledsurfaces. Optimisation target: Gaussian surfaces with minimum tex-ture amplitude. . . . . . . . . . . . . . . . . . . . . . . . . . . . . . . . . . . 156
xiv

LIST OF TABLES
5.6 Main topology descriptors of machined surfaces, including 𝑆00 (AISI
1038). . . . . . . . . . . . . . . . . . . . . . . . . . . . . . . . . . . . . . . . . 1565.7 60Cr3 chromium steel mechanical properties. . . . . . . . . . . . . . . . . 1635.8 Optimal parameters to apply VABB on AISI 1038 surfaces according
to di�erent RS targets, based on ANOVA mean e�ects. . . . . . . . . . . 1765.9 Optimal parameters to ball burnish AISI 1038 surfaces based on real
experimental results . . . . . . . . . . . . . . . . . . . . . . . . . . . . . . . 1775.10 Optimal parameters to ball burnish Ti-6Al-4V surfaces according to
di�erent RS targets, based on ANOVA mean e�ects. . . . . . . . . . . . . 1855.11 Optimal parameters to ball burnish Ti-6Al-4V surfaces based on real
experimental results . . . . . . . . . . . . . . . . . . . . . . . . . . . . . . . 1875.12 Summary of optimal parameters to ball burnish AISI 1038 surfaces
based on texture and RS criteria. . . . . . . . . . . . . . . . . . . . . . . . . 1885.13 Summary of optimal parameters to ball burnish Ti-6Al-4V surfaces
based on texture and RS criteria. . . . . . . . . . . . . . . . . . . . . . . . . 1895.14 Tested conditions for hardness tests on AISI 1038 𝑆0
1 . . . . . . . . . . . . 1915.15 Tested conditions for hardness tests on Ti-6Al-4V 𝑆0
1 . . . . . . . . . . . . 195
A.1 L27(313) Taguchi orthogonal array. A�er Taguchi et al., 2005 [142] . . 206A.2 Taguchi array followed for the experimental testing of AISI 1038. . . . 207A.3 Taguchi array followed for the experimental testing of Ti-6Al-4V. . . . 208A.4 Actions included in the model and their degrees of freedom. . . . . . . 209A.5 Sisson-Vigier incidence matrix of orthogonality of the experimental
design. ∪: coupled actions. . . . . . . . . . . . . . . . . . . . . . . . . . . . 210
xv

LIST OF TABLES
xvi

List of Symbols
General parameters𝐴 Piezoelectric amplitude𝐴0 Fundamental frequency amplitude . . . . . . . . . . . . . . . . . . . . . . . . . . . . . . . . . 58𝛥𝐹𝑣 Half-cycle amplitude of the vibratory component . . . . . . . . . . . . . . . . . . . . 61𝛥𝑧 Spring compression length . . . . . . . . . . . . . . . . . . . . . . . . . . . . . . . . . . . . . . . . 46𝐸 Young’s module . . . . . . . . . . . . . . . . . . . . . . . . . . . . . . . . . . . . . . . . . . . . . . . . . . 51𝑓0 Fundamental frequency transmi�ed by VABB prototype . . . . . . . . . . . . . 58𝐹0 Spring precompression force . . . . . . . . . . . . . . . . . . . . . . . . . . . . . . . . . . . . . . . 46𝐹𝑏 Burnishing force . . . . . . . . . . . . . . . . . . . . . . . . . . . . . . . . . . . . . . . . . . . . . . . . . . 44𝐹𝑝 Burnishing preload . . . . . . . . . . . . . . . . . . . . . . . . . . . . . . . . . . . . . . . . . . . . . . . 44𝐹𝑣 Vibratory component of burnishing force . . . . . . . . . . . . . . . . . . . . . . . . . . . 44𝜑0 Sine phase of ��ed ultrasonic signal . . . . . . . . . . . . . . . . . . . . . . . . . . . . . . . . 61ℎ𝑝 Depth of penetration . . . . . . . . . . . . . . . . . . . . . . . . . . . . . . . . . . . . . . . . . . . . . . 16𝜂 Low-frequency burnishing force variation . . . . . . . . . . . . . . . . . . . . . . . . . . 45𝑘 Spring elastic constant . . . . . . . . . . . . . . . . . . . . . . . . . . . . . . . . . . . . . . . . . . . . 48𝜔 Sine angular frequency of ��ed ultrasonic signal . . . . . . . . . . . . . . . . . . . . 61𝜌 Density . . . . . . . . . . . . . . . . . . . . . . . . . . . . . . . . . . . . . . . . . . . . . . . . . . . . . . . . . . 51
PiezoelectricityD Electric displacement . . . . . . . . . . . . . . . . . . . . . . . . . . . . . . . . . . . . . . . . . . . . . 50𝑑𝑖𝑗 Piezoelectric strain constant along 𝑗 due to electric �eld along 𝑖 . . . . . . 50𝐼 Intensity . . . . . . . . . . . . . . . . . . . . . . . . . . . . . . . . . . . . . . . . . . . . . . . . . . . . . . . . . 52𝑞 Number of piezoelectric disks in a stack . . . . . . . . . . . . . . . . . . . . . . . . . . . . 51SE Piezoelectric compliance coe�cient matrix . . . . . . . . . . . . . . . . . . . . . . . . . . 50𝜎 Piezoelectric stress vector . . . . . . . . . . . . . . . . . . . . . . . . . . . . . . . . . . . . . . . . . 50𝑡 Piezoelectric thickness . . . . . . . . . . . . . . . . . . . . . . . . . . . . . . . . . . . . . . . . . . . . 50𝑉 Voltage . . . . . . . . . . . . . . . . . . . . . . . . . . . . . . . . . . . . . . . . . . . . . . . . . . . . . . . . . . 51
xvii

LIST OF TABLES
𝜉𝜎 Piezoelectric electric permi�ivity matrix . . . . . . . . . . . . . . . . . . . . . . . . . . . . 50𝑍 Impedance . . . . . . . . . . . . . . . . . . . . . . . . . . . . . . . . . . . . . . . . . . . . . . . . . . . . . . . 52
X-ray di�raction parameters𝜓 Tilt angle of the collimator with regards to surface . . . . . . . . . . . . . . . . . . 99𝜑 Position of X-ray collimator goniometer . . . . . . . . . . . . . . . . . . . . . . . . . . . . 99𝜃 Bragg’s re�ective angle . . . . . . . . . . . . . . . . . . . . . . . . . . . . . . . . . . . . . . . . . . . . 99
Texture and roughness parameters𝜆𝑐 Cut-o� length for roughness �ltering . . . . . . . . . . . . . . . . . . . . . . . . . . . . . . 115𝑚𝑚𝑖𝑛 Least slope in AF curves . . . . . . . . . . . . . . . . . . . . . . . . . . . . . . . . . . . . . . . . . . 134𝑀𝑚𝑖𝑛 𝑀𝑟 value of point in least slope point of AF curves . . . . . . . . . . . . . . . . . 134𝑀𝑟 AF curve material ratio . . . . . . . . . . . . . . . . . . . . . . . . . . . . . . . . . . . . . . . . . . . . 91𝑀𝑟1 Peak material ratio . . . . . . . . . . . . . . . . . . . . . . . . . . . . . . . . . . . . . . . . . . . . . . . . 91𝑀𝑟2 Valley material ratio . . . . . . . . . . . . . . . . . . . . . . . . . . . . . . . . . . . . . . . . . . . . . . 91𝑅𝑎 Average surface roughness . . . . . . . . . . . . . . . . . . . . . . . . . . . . . . . . . . . . . . . . 24𝑅𝑞 RMS roughness . . . . . . . . . . . . . . . . . . . . . . . . . . . . . . . . . . . . . . . . . . . . . . . . . . . 26𝑆𝑎 Arithmetical mean surface height . . . . . . . . . . . . . . . . . . . . . . . . . . . . . . . . . . 87𝑆𝑎𝑙 Fastest decay autocorrelation length . . . . . . . . . . . . . . . . . . . . . . . . . . . . . . . . 87𝑆𝑑𝑞 RMS gradient . . . . . . . . . . . . . . . . . . . . . . . . . . . . . . . . . . . . . . . . . . . . . . . . . . . . . 87𝑆𝑑𝑟 Developed interfacial area ratio . . . . . . . . . . . . . . . . . . . . . . . . . . . . . . . . . . . . 87𝑆𝑘 Abbot-Firestone core distance . . . . . . . . . . . . . . . . . . . . . . . . . . . . . . . . . . . . . 91𝑆𝑘𝑢 Surface texture kurtosis . . . . . . . . . . . . . . . . . . . . . . . . . . . . . . . . . . . . . . . . . . . 87𝑆𝑚𝑞 Abbot-Firestone relative material ratio . . . . . . . . . . . . . . . . . . . . . . . . . . . . . . 91𝑆𝑝 Surface maximum peak height . . . . . . . . . . . . . . . . . . . . . . . . . . . . . . . . . . . . . 87𝑆𝑝𝑘 Abbot-Firestone peak height . . . . . . . . . . . . . . . . . . . . . . . . . . . . . . . . . . . . . . . 91𝑆𝑝𝑞 Abbot-Firestone plateau RMS . . . . . . . . . . . . . . . . . . . . . . . . . . . . . . . . . . . . . . 91𝑆𝑞 Surface RMS height . . . . . . . . . . . . . . . . . . . . . . . . . . . . . . . . . . . . . . . . . . . . . . . 87Σ𝑠 Area under the AF curve slope function . . . . . . . . . . . . . . . . . . . . . . . . . . . 130𝑆𝑠𝑘 Surface texture skewness . . . . . . . . . . . . . . . . . . . . . . . . . . . . . . . . . . . . . . . . . . 87𝑆𝑡𝑑 Surface texture direction . . . . . . . . . . . . . . . . . . . . . . . . . . . . . . . . . . . . . . . . . . 87𝑆𝑡𝑟 Surface texture aspect ratio . . . . . . . . . . . . . . . . . . . . . . . . . . . . . . . . . . . . . . . . 87𝑆𝑣 Surface maximum valley depth . . . . . . . . . . . . . . . . . . . . . . . . . . . . . . . . . . . . 87𝑆𝑣𝑘 Abbot-Firestone valley depth . . . . . . . . . . . . . . . . . . . . . . . . . . . . . . . . . . . . . . 91𝑆𝑣𝑞 Abbot-Firestone dale RMS . . . . . . . . . . . . . . . . . . . . . . . . . . . . . . . . . . . . . . . . . 91𝑆𝑥𝑝 Abbo�-Firestone peak extreme height . . . . . . . . . . . . . . . . . . . . . . . . . . . . . . 91𝑆10𝑧 Surface ten-point height . . . . . . . . . . . . . . . . . . . . . . . . . . . . . . . . . . . . . . . . . . . 87
xviii

LIST OF TABLES
𝑉𝑚𝑐 Abbo�-Firestone core material volume . . . . . . . . . . . . . . . . . . . . . . . . . . . . . 91𝑉𝑚𝑝 Abbo�-Firestone peak material volume . . . . . . . . . . . . . . . . . . . . . . . . . . . . . 91𝑉𝑣𝑐 Abbo�-Firestone core void volume . . . . . . . . . . . . . . . . . . . . . . . . . . . . . . . . . 91𝑉𝑣𝑣 Abbo�-Firestone valley void volume . . . . . . . . . . . . . . . . . . . . . . . . . . . . . . . 91
Abbreviations𝐴𝑁𝑂𝑉 𝐴Analysis of Variance . . . . . . . . . . . . . . . . . . . . . . . . . . . . . . . . . . . . . . . . . . . . . . 84𝐴𝐴𝐶𝐹 Areal autocorrelation function of a surface . . . . . . . . . . . . . . . . . . . . . . . . . . 89𝐴𝐹 Abbo�-Firestone . . . . . . . . . . . . . . . . . . . . . . . . . . . . . . . . . . . . . . . . . . . . . . . . . . 90𝐹𝐸𝑀 Finite element model . . . . . . . . . . . . . . . . . . . . . . . . . . . . . . . . . . . . . . . . . . . . . 161𝐹𝑅𝑈 Force regulation unit . . . . . . . . . . . . . . . . . . . . . . . . . . . . . . . . . . . . . . . . . . . . . . 46𝐹𝑇𝑈 Force transmission unit . . . . . . . . . . . . . . . . . . . . . . . . . . . . . . . . . . . . . . . . . . . 53𝑁𝑉 𝐴𝐵𝐵Non-vibration-assisted ball burnishing . . . . . . . . . . . . . . . . . . . . . . . . . . . . . 33𝑃&𝑉 Peak & valley set . . . . . . . . . . . . . . . . . . . . . . . . . . . . . . . . . . . . . . . . . . . . . . . . . 92𝑅𝑆 Residual stress . . . . . . . . . . . . . . . . . . . . . . . . . . . . . . . . . . . . . . . . . . . . . . . . . . . . 98𝑆𝐷 Standard deviation . . . . . . . . . . . . . . . . . . . . . . . . . . . . . . . . . . . . . . . . . . . . . . . . 64𝑆⇑𝑁 Signal-to-noise ratio . . . . . . . . . . . . . . . . . . . . . . . . . . . . . . . . . . . . . . . . . . . . . . 82𝑉 𝐴𝐵𝐵 Vibration-assisted ball burnishing . . . . . . . . . . . . . . . . . . . . . . . . . . . . . . . . . . 33𝑉 𝑇𝑈 Vibrations transmission unit . . . . . . . . . . . . . . . . . . . . . . . . . . . . . . . . . . . . . . . 48
xix

LIST OF TABLES
xx

Science is organised knowledge; wis-dom is organised life.
Immanuel Kant
1Introduction
1.1 Motivations and antecedents
�e introduction of new materials has been one of the major historical facilitatorsfor the enhancement of industrial products. For instance, a big leap forward in theaerospace manufacturing industry has been the expansion of composites in crucialcomponents and parts such as the fuselage or major control surfaces. However, metal-lic components shall never be totally replaced, as they provide unique a�ributes dif-�cult to be substituted by other materials.
Metallic parts are predominantly shaped from raw materials through machiningroutines. Although chip removal processes are nowadays highly reliable due to theexpertise acquired during the last decades, innovation can always be achieved bydeveloping alternative �nishing methods to enhance the surface integrity of engi-neering parts. Indeed, today the term enhancement contemplates additional metricsother than adequate dimensioning or accurate material selection. In that respect,tailor-made surface integrity on workpieces is determinant to optimise product per-formance, and maximise the longevity and reliability of engineering parts. For in-
1

CHAPTER 1. INTRODUCTION
stance, about 56% of catastrophic failure in turbine blades are caused by cracks initi-ated in positively stressed machined surfaces under high-frequency fatigue regimes,and can be prevented with adequate �nishing treatments a�er machining, accordingto Prevey et al. (2002) [113]. In this �eld, ball burnishing has proved to deliver bet-ter results in terms of surface roughness, residual stress and hardness of objectivesurfaces, when compared to other processes long integrated in the manufacturing in-dustry such as laser shock peening (Altenberger et al., 2012) [2], electropolishing orshot peening (Shepard et al., 2004) [129]. �us the necessity to increase the knowledgerelated to it.
Surface integrity management is remarkably important when special alloys areused to manufacture relevant parts. Advanced materials such as titanium or nickelalloys pose a high di�culty of surface integrity preservation a�er machining, as notenumerous authors such as Ulutan et al. (2011) [155]. Consequently, thorough post-processing techniques are required to rectify the surface integrity. Manufacturinginnovation through �nishing processes development is not in contradiction with newmaterial application. Much on the contrary, it can contribute to develop a mainstreamof manufacturing technology enhancement.
One typical engineering surface that exempli�es the importance of surface in-tegrity control are typically found in the transportation industry, formed by complexforms, conformed by juxtaposed curved surfaces. We can think about turbine bladesor landing gears, but also moulds and dies for upse�ing operations. �is kind of partsare o�en manufactured through 3 or 5 axis machining with the aid of successive adja-cent passes of hemispherical tools (Figure 1.1). Whereas this ball-end milling strategyallows to achieve complex surfaces by following the desired shape through NC inter-polations generated by a CAM, it also has deep constraints. Guillemot (2010) [49]highlighted the importance of the tilt angle of the hemispherical tool during machin-ing to guarantee a good surface integrity. However, these scienti�c recommendationsare not taken into account by many manufacturers, who o�en use automatised CAMsystems in which hemispherical milling is performed perpendicular to the surface, i.e.with tilt angle equal to zero. �at type of machining execution is very o�en forcedby the context de�ned by the only availability of 3-axis machines with no possibilityof adjusting a speci�c tilt angle for the tool, thus generating a detrimental surfaceintegrity.
In this context, ball burnishing can contribute to improve the described surfacesin industrial parts. �e process is known for a�aining a comprehensive surface im-
2

1.1. MOTIVATIONS AND ANTECEDENTS
(a) (b)
Figure 1.1. Hemispherical milling of engineering surfaces. A�er Fontaine et al., 2006 [38]. a.Overview of a ball-end milled surface. b. Ball-end milling kinematic parameters and schemeof the process.
provement in terms of texture, residual stress and hardness, as well as for being easilymanoeuvrable from a procedural point of view. Spring-based ball burnishing toolsare easily a�achable to NC machines through custom commercial holders, simplify-ing the whole manufacturing system and equipment. �at means that ball burnishingtools can be used at the same NC machines were previous machining has been per-formed, hence the reduction of handling and processing times, as well as an increasein the automation easiness. Burnishing tools, on the other hand, could be likely to beimplemented on advanced automated systems such as robotic arms.
�e presented pros a�ributed to ball burnishing makes it an interesting option toconsider as an advanced �nishing process for today’s industry. On the other hand, thephenomenon of process assistance is today a highly extended strategy in manufactur-ing engineering innovation systems [14], since it allows to obtain emergent advan-tages from operations that are already totally integrated in manufacturing workshops.Taking this fact into account, it is worth questioning whether the ball burnishing op-eration can be enhanced by vibration-assistance, in search of emergent e�ects onindustrial materials. In this thesis, the incorporation of ultrasonic vibrations is pro-posed to improve the ball burnishing process. �e evidence that this combination canlead to interesting results is based on the physical phenomenon of acoustoplasticity,that is, the reduction of the quasi-static stress required to deform a material by the si-multaneous propagation of waves inside it, while causing a residual hardening e�ect.Isolated results performed by other researchers have lead to think that this combina-
3

CHAPTER 1. INTRODUCTION
tion can be positive, as shall be presented in the state-of-the-art chapter [13]. As nocomprehensive and consistent research has been developed previously, the followingsubsection presents the contributions expected to be delivered by this dissertation.
1.2 Research contributions
In this dissertation, a new �nishing process resulting from modifying the ball bur-nishing process is executed on ball-end milled �at surfaces. At sight of the previouslydescribed surfaces, applying experimental design on �at surfaces means that we aredealing with surface states that are not necessarily realistic. However, they are ob-tained through a mastered machining strategy that allows to excerpt control on thesurface topology by varying the peaks and amplitudes of the surface texture. On theother hand, they can be considered as preliminary results that shall eventually serveto characterise the process on curved more realistic surfaces.
�e modi�cation of the ball burnishing process is to be carried out by overlap-ping an oscillating force on the static burnishing preload, which allows to transmitan ultrasonic wave inside the material that makes it easier to deform plastically. �ecombination of ball burnishing with the acoustoplastic e�ect referred in this disser-tation as vibration-assisted ball burnishing (VABB), in contrast to the non-vibrationassisted process (NVABB), that is, conventional ball burnishing. �e physical basis ofthe process enhancement is the acoustoplastic or Blaha e�ect [7]. �is e�ect showsthat acoustic and ultrasonic waves propagated inside a material while it is being de-formed, reduce the quasi-static stress required to achieve a certain level of strain. �issort of metal so�ening has a transient e�ect, as is only present during the transmis-sion of the wave inside the metal. In other words, when that irradiation stops, mostmaterials show a residual hardening e�ect. As a process based on plastic deformation,ball burnishing is expected to be a recipient of enhancement through acoustoplastic-ity, which leads to enunciate the main hypothesis posed for this thesis:
�e application of acoustoplasticity to enhance the ball burnishing operationleads to a technically feasible technology enabling the successful enhancement of thesurface integrity of milled surfaces from topological, mechanical and metallurgicalpoints of view.
To test that hypothesis, this dissertation must tackle with diverse scienti�c issues,
4

1.3. THIS DISSERTATION IN BRIEF
that are due to be answered by a set of well-se�led and properly formulated questions,as follows:
1. To what extent can the surface integrity of ball-end milled surfaces be enhancedby the introduction of the acoustoplastic e�ect in the ball burnishing operation?
2. Is surface texture essentially modi�ed by the vibration-assisted ball burnishingprocess? Are 𝑅𝑎 and 𝑅𝑡, as the classical surface roughness parameters, enoughto describe that change?
3. What are the e�ects of the vibration-assisted ball burnishing process on the sur-face and sub-surface layers of the material from a mechanical and metallurgicalperspective?
4. What is the impact of the original surface state on the results?
At sight of the described scienti�c issues, and due to the lack of comprehensiveresults of the VABB process on surface integrity, this dissertation adopts fundamen-tally an experimental scope that shall allow to provide comprehensive data about itsresults.
Furthermore, to ful�l the objectives of this dissertation, some technical issues canalso be identi�ed, and must be tackled to succeed in assessing the e�ects of the VABBprocess, and compare it to the non-vibration-assisted one. �ese technical issues canbe described as follows:
1. No VABB tool is currently commercially available. For that reason, an innova-tive ultrasonic VABB prototype must be designed, protected by a patent, man-ufactured and characterised.
2. During the characterisation process, special instrumentation systems shall berequired to sample and reconstruct the ultrasonic signals implicated in the pro-cess.
1.3 This dissertation in brief
�e reader shall �nd in this text an extensive analysis of bibliographical studies andtheoretical approaches that justify the application of VABB, along with extensive ex-
5

CHAPTER 1. INTRODUCTION
perimental results obtained from the application of the process on steel and titaniumsurfaces. �e chapters of which it is composed are structured as follows.
Chapter 2 presents a review of bibliographical references that tackle with theissues at stake in this dissertation. �ree main parts can be di�erentiated. �e �rstone presents a de�nition of the ball burnishing process and di�erent tooling con�gu-rations. Secondly, the e�ects of the ball burnishing process on the surface integrity ofdi�erent materials is presented. �e third section of this chapter focuses on explainingacoustoplasticity mechanisms as proposed by some authors, and the few referencesdealing with it to assist the ball burnishing process.
As no VABB prototype is available commercially, it must be designed, charac-terised and tested. Chapter 3 shows all activities undertaken to this aim. Piezoelec-tricity is presented as the driver of vibration transmission on which the functioningof the prototype is based. A mechanical construction composed of three units is pro-posed in this chapter, and materialised in a prototype which is tested by applyingacoustic emission, dynamometric measurements and motion track. �ese techniquesultimately deliver the characteristics of the vibratory force transmi�ed by the piezo-electric module installed inside the tool casing.
�e prototype is then tested on Ti-6Al-4V and AISI 1038 surfaces. �ese materialshave been chosen due to their industrial interest for applications on workpieces ex-pected to function in highly demanding environments, such as fatigue regimes, thusrequiring thorough �nishing surface states. Speci�cally, the �rst one is known forits generalised presence in various aeronautical workpieces, whereas the AISI foundsextended applications in gears, axes or power shovels. With that aim, an experimen-tal design based on Taguchi orthogonal arrays is proposed, as explained in Chapter4. �at chapter also includes the set of techniques which are deployed to evaluatethe surface integrity results on both materials. Specially interesting is the proposal oftexture measurement through a comprehensive set of three-dimensional parameters,which has no precedents in the analysis of ball burnishing results.
Finally, the experimental results are compiled and explained in chapter 5. First,topological results are shown for both materials. �e incorporation of surface param-eters, in contrast to the two-dimensional parameters traditionally used to characteriseburnished surface, is introduced. �en, the residual stress generated on the di�erentVABB and NVABB patches is analysed. Finally, mechanical parameters describing thesurface are presented to ful�l a comprehensive surface integrity characterisation of
6

1.3. THIS DISSERTATION IN BRIEF
the VABB e�ects, including both metallography analysis and deep hardness measure-ment.
�e knowledge developed along the referred chapters leads to formulate �nal con-clusions and expected future works at the end of the text, which also includes appen-dices with relevant data not included in the report.
7

CHAPTER 1. INTRODUCTION
8

2State of the art
�is chapter includes the results emerging from an extensive bibliographical researchwhich tackles with di�erent burnishing references. Burnishing itself is a generic pro-cess that comprises innumerable versions de�ned by the contextual conditions thatgovern its execution, such as the geometry and construction of the burnishing tool.�e �rst section of this chapter is a descriptive one, exposing the di�erent burnishingversions by analysing di�erent burnishing tools and the parameters governing theoperation. �e second section in this chapter establishes a de�nition of surface in-tegrity, and includes the results found by ball burnishing on di�erent materials. �e�rst descriptive references found for the process were published in the 80’s, and focuson steel, aluminium and copper alloys. �e following years brought a breakthroughof the burnishing knowledge through the exploration of further similar alloys, andthe incorporation of stainless steel to the system. Still today, the lack of results onthe burnishing operation performed on titanium alloys or superalloys leaves a vastexploration territory for new research.
�e VABB operation is de�ned and introduced in next section. �e Blaha e�ect,which justi�es its e�ectiveness, also known as acoustoplasticity, is presented alongwith a historical review of di�erent explanations proposed by di�erent authors. Last
9

CHAPTER 2. STATE OF THE ART
of all, the scarce references found related to the VABB process are presented.
2.1 General aspects of the burnishing operation
Burnishing is a general term that referes to a surface �nishing operation based onlocal plastic deformation a�ained through the action of an indenter with a cylindricalor spherical geometry, which rolls over the objective surface while transmi�ing apreload [103]. Plastic deformation during the feed motion is successfully performedas a result of frictional engagement of the indenter and the surface irregularities.
�e process is performed along successive adjacent passes with the aim of cov-ering the whole target surface, as shown schematically in Figure 2.1. During themovement of the tool, the indenter makes contact with the peaks of the texture irreg-ularities. At �rst, the peak material is deformed elastically, but the extended contactand deformation leads to the �nal plasti�cation of the material, and its residual strainthat is translated into a holistic modi�cation of the surface. Indeed, this process modi-�es the surface integrity of the workpiece, as e�ects on surface topography, hardness,and residual stresses of subsurface layers are signi�cant [64].
Figure 2.1. Schematic representation of the ball burnishing process.
Conceptually, the plasti�cation process is gradual. �e instantaneous contact areabetween the indenter and the surface can be described as a tear-shaped region, cov-ering the wide range of strain states, starting from the elastic deformation in the en-gagement zone, until the super�nishing zone at the points with longer contact withthe indenter. �is mechanism provides the general roughness improvement alongthe burnishing direction [79]. Surface roughness is a fundamental feature of the sur-
10

2.1. GENERAL ASPECTS OF THE BURNISHING OPERATION
face integrity of the part, not solely for outer aspect ma�ers, but also for its generalperformance. Poor surface �nish disables geometric tolerances, and it a�ects wearresistance, fatigue life, and load-carrying capacity.
On the other hand, as the instantaneous application of the burnishing force islocal, the topological changes are hardly larger than 10 µm, so that general geometryof the part is not changed. �erefore, form errors and the general shape of the partare not signi�cantly recti�ed through burnishing. �is makes the process suitablefor the �nishing of parts manufactured until their �nal dimensions, and is especiallyinteresting in manufacturing contexts where high precision results are required. Itis the case, for instance, of mould manufacturing, �lleted bearing components, orcurved surfaces.
Burnishing can be found in the bibliography a�er diverse designations. Practi-cally, the main di�erence among the di�erent processes based on di�erent tools isthe objective that justi�es the execution of the process. Deep Rolling (DR) is usedto refer to the execution of ball or roller burnishing with the aim of inducing highcompressive residual stresses and increasing cold work on the part surface. Whenthe sought objective is decreasing the surface roughness of the objective part, theprocess is generally denoted as Low Plasticity Burnishing (LPB) [2].
From a systemic point of view, burnishing can be de�ned as a set of interrelatedresources, whose function is to perform the �nishing of an objective workpiece, andwhose combination de�ne a singular burnishing system. Under this perspective, Fig-ure 2.2 shows a �shbone diagram of the di�erent aspects which de�ne burnishingsystems. Items belonging to the tooling system categories allow to establish a certainclassi�cation of di�erent burnishing operations. �at is, by varying the shape of theindenter, the force regulation method, or the mechanical composition of a tool to bea�ached to di�erent machines, diverse burnishing operations are feasible.
Burnishing tooling is therefore highly important when the implementation of aspeci�c burnishing operation must be carried out. It plays a fundamental role in thede�nition of the burnishing system, as it enables the application of the process on oneor several speci�c machines, and allows to regulate and control most of the burnishingparameters governing the process, and that determine the burnishing results. �enext subsections present di�erent burnishing tooling con�gurations, as a �rst step todecide the general features of the design of the VABB tool.
11
CHAPTER 2. STATE OF THE ART
Figure 2.2. Items and descriptors comprising the burnishing manufacturing system.
2.1.1 An overview of burnishing tooling
�e scienti�c bibliography shows a great variety of burnishing tool designs. In gen-eral, a burnishing tool must be conceived to ful�l the following requirements:
• It must be a�achable to a speci�c machine tool where the process must be de-veloped.
• It must guarantee mechanical engagement between the indenter and the mate-rial, allowing the free movement of the former while maintaining its mechanicalintegrity.
• It must bring into play the whole of the desired burnishing parameters, espe-cially preload, while ensuring accessibility to the target surface.
Basic tools utilised originally in general applications of the burnishing techniquewere applied on simple geometries such as bores and sha�s, hydraulic cylinders, pis-tons for hydraulic systems, or �llets. Classical burnishing tool–workpiece con�gu-rations can be consulted at Figure 2.3. �e lack of automation and handling limi-tations presented by conventional machines made di�cult to �nish more complexparts. Later, the generalisation of NC machines in manufacturing workshops, andthe emergence of more simple �xation systems, enabled new designs. �e techniquewas subsequently embraced for more complex geometries such as the �nishing offree-form parts (e.g. moulds), and contributed to its expansion [77, 132].
�e geometry of the indenter is one of the main features de�ning a burnishing
12

2.1. GENERAL ASPECTS OF THE BURNISHING OPERATION
Figure 2.3. Classical burnishing tool con�gurations on lathe and milling machines. A�erMurthy, 1981 [103]
tool. Roller tools have been classically more widespread, for its higher simplicityin terms of preparatory activities and force adjustment [32, 33, 90, 92]. Regardingthe roller geometry, dimensions and pro�les are also diverse. Rollers with highercylindrical land would allow the execution of the process by selecting higher feeds,as the contact surface between the tool and the part is higher. However, rollers lackof the versatility that balls o�er to burnish, since they are ine�cient to treat complexsurfaces, extensively found in the advanced manufacturing industry.
However, roller burnishing tools are also known for their lower e�ectiveness inhardness improvement, and require higher forces to obtain the same improvementsas with sphere shape indenters. Consequently, ball burnishing can be presented as a
13

CHAPTER 2. STATE OF THE ART
more advantageous process in terms of absolute results. Comparative research hasproved that ball burnishing is able to achieve signi�cantly lower surface roughnessand higher hardness with lower forces in materials such as AISI 1335 steel [50], andnon-ferrous alloys [53]. For that reason, the tool that shall be designed in this disser-tation shall be based on a ball-burnishing con�guration.
2.1.1.1 Special burnishing tool configurations
�e development of tools with speci�c con�gurations is one of the innovative ap-proaches to burnishing development (Figure 2.4). Multi-roller tools can be found atseveral bibliographical references. �amizhmanii et al. (2009) [145] tested a frontalmultiroller tool on TA6V speciments, and Tadic et al. (2013) [141] designed and suc-cessfully tested a multiroller tool on aluminium parts. Multi-ball tools can also befound at Gharbi et al. (2010) [41] and Tadic et al. (2016) [140]. In general, multi-indenter tools show a remarkable stability of the process due to higher surface con-tact of the burnishing indenters and the workpiece, although the range of objectivegeometries is not so wide.
More complex con�gurations have been also conceived and prototyped. El–Axir& Ibrahim (2005) [28] designed and mounted a multi-ball tool embedded in a centrerest, being able to burnish on a lathe through a steadier regime, and showing be�erresults in terms on �nal roundness, compared to conventional burnishing. Okada etal. (2015) [107] designed a roller tool able to adapt at will the burnishing angle, anda�er testing it on ASTM 2017 aluminium and ASTM 1055 carbon steel specimens,concluded that burnishing at a 45 degrees angle is the optimum process in terms ofsurface roughness. Integrating cu�ing tools and �nishing burnishing tools on onesingle piece has also been explored by Segawa et al. [127].
2.1.2 General description of ball burnishing parameters
In manufacturing engineering, controlling the parameters of any process is necessaryto comply with design speci�cations, guarantee the repeatability of results, and theirreproducibility from a small-scale research context to a real manufacturing workshop.Burnishing is no exception, as proves the preponderance of bibliographical referenceswhich focus on testing di�erent levels of burnishing parameters on a great variety ofobjective materials. �is subsection explains the di�erent parameters that govern the
14

2.1. GENERAL ASPECTS OF THE BURNISHING OPERATION
(a) (b) (c)
(d) (e) (f)
Figure 2.4. Special burnishing tool con�gurations. a. Milling & burnishing tool [127] b.Center rest multi-ball tool [28] c. Multi-roller tool [141] d. Multi-ball tool [41] e. Adjustableroller tool [107] f. Multi–ball tool [140]
operation.
2.1.2.1 Plastic strain parameters: burnishing force and number of passes
�e most in�uential parameter on ball burnishing results is the burnishing force, thatis, the normal force transmi�ed by the burnishing tool to the workpiece surface inorder to deform plastically its microtopology. �e speci�c pressure applied on theworkpiece to achieve that plastic deformation is the direct result of this force, andmust exceed the yield point of the material to succeed in achieving good results. Itcan be therefore considered as the essential physical driver of plastic strain.
�e constructive con�guration of the burnishing tool de�nes the way throughwhich the force is controlled and transmi�ed to the workpiece. In other words, ac-cording to the technical solution adopted to apply the force on the surface through theball on the surface, the force is controlled di�erently. From this point of view, mainly
15

CHAPTER 2. STATE OF THE ART
three kind of tool can be distinguished, as can be observed in Figure 2.5. �ese threesolutions are explained below.
(a) (b) (c)
Figure 2.5. Force regulation systems in classical burnishing tools. a. Depth-of-penetrationtool [80]. b. Hydrostatic tool [119]. c. Spring-regulated tool [52]
Depth of penetration �is solution appears to be the original force regulationmethod, as is found in all the oldest references (Figure 2.5.a). �e tools based onthis force transmission principle are ended by a spherical shape in which the ball ishoused, allowing its free rolling. In order to regulate the force, the tool tip is pressedonto the target surface. �e force is exerted by screwing the supporting rod in whichthe burnishing ball is embedded. �e linear length along which the screw is tightenedalong the supporting rod is called depth of penetration ℎ𝑝 . �e burnishing force orpreload, 𝐹𝑝, derived from this mechanism can be therefore deduced from the approx-imate solution of slipping of a rigid sphere over a plastic semi-plane, as shown in Eq.2.1 [103].
𝐹𝑝 =𝜋
4ℎ𝑝𝐻𝑉 𝑅 (2.1)
where 𝐻𝑉 is the Vickers hardness of the material,and 𝑅 is the indenter radius.
�e fact that the preload is calculated through this indirect method does not allowits accurate regulation. �erefore, the actual values of the burnishing force appliedduring the burnishing process can only be known if the machine is equipped with aforce measuring device. Consequently, this solution is advisable to burnish compli-cated geometries, which do not allow the application of other pressing systems [29].
Hydrostatic pressure �ese kind of tools o�en use a ceramic or chrome-steel ballembedded inside a support piece at the tip, which is connected to an inner channel
16

2.1. GENERAL ASPECTS OF THE BURNISHING OPERATION
which traverses the tool (Figure 2.5.b). �e tool is fed by an auxiliary pump of theburnishing machine, which propels lubricant �uid through that channel. �e �uidreaches the ball bed, and supports it due to the excerpted hydrostatic pressure. �elubricant acts therefore as a hydrostatic bearing, allowing the ball to roll freely. �eburnishing pressure is regulated by adjusting the hydrostatic pressure of the lubri-cant, as a result of simple equilibrium of forces along the longitudinal axis of the tool.Due to the constructive solution, these tools cannot be applied on surfaces showinga degree higher than ±28○. Celaya et al. [16] estimated the burnishing force, 𝑃𝑏, bydeducing it from the pressure delivered by the pump (Eq. 2.2), considering a 89%e�ciency according to the results shown by a FEM.
𝑃𝑏 = 0.89𝜋
4𝐷2 𝑝ℎ (2.2)
where𝐷 is the ball diameter, and 𝑝ℎ is the hydrostatic pressure delivered by the pump.
Calibrated spring A linear spring is lodged inside this kind of tools, and accountsfor the normal force regulation (Figure 2.5.c). A�er the ball contacts the target sur-face, the burnishing force increases as the spring is progressively compressed. �etotal axial force is ruled by Hooke’s law (Eq. 2.3). �e tool can be calibrated by know-ing the sti�ness of the spring, so that the burnishing force can be easily controlledby managing the 𝑧 coordinate with the NC programme managing the burnishing op-eration, provided that the origin o�set on the workpiece surface has been accuratelydetermined. For that reason, the force regulated in this kind of tools can speci�callybe referred to as preload, 𝐹𝑝. �rough these tools, the force regulation can be easilyintegrated in the process inside the NC code.
𝐹𝑝 = 𝑘𝛥𝑧 (2.3)
where 𝐹𝑝 is the axial preload transmi�ed by the spring, 𝑘 is the elastic constant ofthe tool due to the spring, 𝛥𝑧 is the compressed length of the spring, being the re-sult of the total compression executed by the NC and the microvariation due to thetranslation of the ball along the roughness pro�le.
Despite the capability of controlling the nominal force applied during the bur-nishing process, its actual value varies during its execution. �is is mainly becauseof the friction present during the feed movement of the tool over the surface, as wellas su�ciently prominent surface irregularities that oppose that movement. �e con-
17

CHAPTER 2. STATE OF THE ART
sequence is that tangential components of the burnishing force appear during theexecution of the process, diminishing the strain e�ect, as observed by Lye & Leong(1990) [91]. Figure 2.6 shows both tangential and normal burnishing forces, exempli-fying the described e�ect.
Figure 2.6. Experimental measure of force unevenness during a burnishing process. A�erLye & Leong, 1990 [91].
�e burnishing force is not the only parameter de�ning the degree of plastic straina�er burnishing. It is also dependent on the number of passes, which quanti�es thenumber of overlay passes performed over the burnished surface. �is parameter isalso a productivity parameter, as more passes require more processing time, but itshigher relevance on the strain is undeniable.
Generally, the increase of the burnishing force and number of passes derive in ahigher level of plastic deformation, so that both parameters are equivalent in termsof burnishing e�ectiveness. Both of them must be chosen correctly, as excessive coldhardening through plastic strain can also derive in detrimental results, as shall befurther analysed in following sections of this chapter.
2.1.2.2 Productivity parameters: feed and lateral pass width
Productivity parameters a�ect the total time required to burnish a surface. Refer-ences dealing with burnishing from a productivity point of view are scarce. It can bejusti�ed by the fact that these productivity parameters have not proved to positivelya�ect the potential enhancement of burnishing as a �nishing process.
�e feed parameter refers to the linear speed at which the tool is displaced, whichis usually programmed inside the NC code implemented on the machine tool where
18

2.2. EXPERIMENTAL RESULTS ON SURFACE INTEGRITY AFTER BALL BURNISHING
the process is applied. A study by Rodrıguez et al. (2012) [119] proved that no in�u-ence is observed in terms of surface roughness, but the lack of further evidence leadsto think that a certain in�uence could eventually be detected.
�e second productivity parameter is the lateral pass width, that is, the o�setlength between two adjacent burnishing passes. Most authors do not pay a�entionto �x a speci�c value for this parameter, and take conservative values to guarantee thea�ectation of the whole surface. Obviously, although this is a compromise solution toachieve uniform results, the use of a too small lateral pass width increases the numberof passes required to treat a surface, thus increasing burnishing time and harnessingthe overall productivity.
In this regards, the works of Gomez-Gras et al. (2015) [44] concluded that to min-imise burnishing time without harnessing the burnishing results, a standard lateralpass width could be established in function of the burnishing force, the type of bur-nishing which is applied (vibration-assisted or not), and the objective material. �ela�er is introduced in the model through its self-hardening coe�cient. In e�ect, ma-terials experiencing high strain hardening tend to form pile-ups at the limits of theplastically deformed area [59]. �ey conclude that the optimal lateral pass widthshould be included inside an interval (0.5 𝑙, 𝑙⌋, being 𝑙 the width of a burnishing lineperformed by a certain set of parameters. �e minimum limit of the interval wasestablished by considering that smaller values would lead to redundant passes dur-ing the burnishing operation, with the consequent detrimental e�ect on productivity.On the other hand, the maximum boundary was established as a means of limitingthe o�set between passes, which would leave non-deformed material on the surface,diminishing the burnishing e�ects. Consequently, these values can be taken into ac-count as a means of optimising the burnishing time without causing any harm on thesurface �nishing.
2.2 Experimental results on surface integrity a�erball burnishing
�e e�ect of ball burnishing a�ects exclusively surface and near-surface layers ofa workpiece, as the bulk material is not modi�ed by it. Consequently, burnishingresults should be studied and quanti�ed from a comprehensive scope by consideringdi�erent surface parameters. In this regard, the concept of surface integrity can be
19

CHAPTER 2. STATE OF THE ART
presented as an adequate contextual reference to characterise the e�ects of the VABBprocess.
Surfaces confer unique properties to engineering parts besides their outward ap-pearance. �e realisation that minor and catastrophic failures of engineering partscannot always be explained by detrimental properties of the bulk material, but theyare the consequence of the inadequacy of the surface integrity of the part itself,was late embraced by engineers. Until this statement was acknowledged, numerousmechanical failures were being erroneously identi�ed as uncontrollable, and conse-quently unmanaged. For instance, fatigue failure identi�ed and characterised exper-imentally by Wohler in the end of the 19th century, was not modelled until Irwinsucceeded in the 50’s to relate it to surface roughness by means of a stress concentra-tion factor, 𝐾𝐼 , as follows:
𝐾𝐼 = 𝜎𝑛𝑜𝑚𝑌⌋𝜋𝑎 (2.4)
where 𝜎𝑛𝑜𝑚 is the maximum stress, 𝑌 is a geometrical factor, and 𝑎 is the crack’slength.
As 𝑌 can be linked to surface roughness, Irwin acknowledged in publishing thismodel the link between surface integrity and fatigue failure. �e same as fatigue, to-day, we know that, other phenomena such as corrosion, contact mechanics or weardepend upon the surface state of the part, and not on the bulk material. Surface engi-neering was born as an extended branch of surface science, to characterise the relationbetween the design of surfaces and their functionality and cost e�ectiveness [20]. �eASTM Handbook de�nes it as the treatment of surface and near-surface regions ofa material to provide unique properties that enable it to perform functions that aredistinct from the ones delivered by the bulk material [36]. In this context, surfaceintegrity can be described as the group of parameters that describe the comprehen-sive state of a �nished surface. �is de�nition exhibits that surface integrity can bedescribed as an inherent consequence of materials processing techniques and param-eters, as has been proved by numerous authors [35, 110, 155, 156].
Following the same principle, ball burnishing has been treated in the bibliographyas an e�ective method to modify surface integrity. Historical ball burnishing refer-ences deal mainly with steel, aluminium and cuprous alloys. �is is logical if onethinks of the kind of applications for which burnishing was originally applied –the�nishing of sha�s, moulds, dies and tubes. Table 2.1 summarises the most relevantreferences related to ball burnishing of these alloys.
20

2.2. EXPERIMENTAL RESULTS ON SURFACE INTEGRITY AFTER BALL BURNISHING
Table 2.1. Ball burnishing references on steel, aluminium and cuprous alloys. Light grey:milling-machine tools. White: lathe tools.
Reference Material ForceLoh et al., 1989,1990 [80, 82] AISI 1045 d.o.p.Loh et al., 1989,1990,1991 [81, 83, 84] AISI 1045 d.o.p.Morimoto et al., 1991 [102] JIS–S38C d.o.p.Loh et al., 1993 [85, 86] ASSAB XW–5 d.o.p.Hassan et al., 1996 [54, 55] pure Al & brass springLee & Loh, 1996 [77] AISI P20 d.o.p.Hassan, 1997 [53] pure Al & AS 1573 brass springHassan, 1998 [52] unde�ned brass springHassan, 1999 [56] unde�ned brass springHassan et al., 2000 [57] brass & Al-Cu alloy springHassan et al., 2000 [58] pure Al & AS 1573 brass springNemat & Lyons, 2000 [104] ASTM A113 & AA6463-E springShiou & Chen, 2003 [132] PDS5 mould steel springPrevey et al., 2001 [112] AA7075-T6 HBouzid et al., 2004 [11] AISI 1042 springEl–Axir et al., 2005 [28] unde�ned steel d.o.p.Luca et al., 2005 [89] unde�ned steel HBasak et al., 2007 [6] AA7075-T6 & H62 brass HHamadache et al., 2006 [50] Rb40 steel springRao et al., 2008 [115] unde�ned steel d.o.p.Seemikieri et al., 2008 [126] AISI 1045 HShiou & Cheng, 2008 [131] NAK80 mould steel d.o.p.Gharbi et al., 2008 [41] AISI 1010 springEl–Axir et al., 2008 [29] AW 2014 d.o.p.El–Axir et al., 2008 [30] AW 2014 d.o.p.Sagbas, 2008 [121] AA 7178 springMajzoobi et al., 2009 [92] AA 7075-T6 springEl–Taweel et al., 2009 brass springShiou & Chuang, 2010 [133] PDS5 mould steel springUgur, 2010 [154] AA 7075 millL. de la Calle et al., 2011 [88] AISI 1045 & DIN 1.2379 HTravieso-Rodriguez et al., 2011 [149] A92017 & G10380 HGrzesik & Zak, 2012 [48] EN 41Cr4 springRodriguez et al., 2012 [48] 41Cr4 steel springAviles et al., 2015 [4] AISI 1045 HKuznetsov et al., 2015 [75] EN 20Cr4 & EN X20Cr13 HTadic et al., 2016 [140] AW6082 d.o.p.Amdouni et al., 2017 [3] AW2017-T4 d.o.p.d.o.p.: depth of penetration; H: hydrostatic tool
21

CHAPTER 2. STATE OF THE ART
�e visual inspection of that table leads to the conclusion that the majority of ballburnishing references have focused on lathe burnishing. Although a certain corre-lation between lathe and milling burnishing can be found –for instance, lateral passwidth in mill burnishing is the feed in lathe burnishing–, the kinematics of both pro-cesses are quite di�erent, and should be treated as two independent processes. �etool to be designed in this thesis shall be used in a milling machine. �erefore, thisstate of the art shall focus mainly on this type of setup conditions, whereas lathe bur-nishing is referred only in speci�c cases where it is u�erly necessary. Lathe referencesare also omi�ed if possible due to the limitations of lathe burnishing to treat complexsurface geometries, such as warped surfaces, un��ed for the potential applicationsof the system which is being considered in this dissertation.
On the other hand, Table 2.2 gathers those references that focus on the studyof ball burnishing on stainless steel, titanium and nickel-based alloys. �ese are con-spicuously scarcer than the ones represented above, for two main reasons. Firstly, theneed of developing special �nishing processes for advanced materials in the industryis a relatively recent topic. Secondly, these materials are applied in the manufacturingof special parts, expected to function in highly demanding environments. �erefore,most of these studies tackle with the comparison of ball burnishing with other �nish-ing processes that are already validated at an industrial level, such as shot peening,which exceeds the object of this dissertation.
At sight of the previous tables, it can be concluded that spring-based tools havebeen scarcely studied in the bibliography, and that there is an evident lack of informa-tion about ball burnishing of titanium alloys. Along the next subsections, results areclassi�ed in function of geometrical, mechanical and metallurgical parameters a�erball burnishing. All materials are included in the analysis.
2.2.1 Geometrical parameters: surface roughness and texture
�e presence of irregularities on a surface is the inherent result of the transforma-tion process to which any material is subjected a�er a manufacturing operation. �eDIN 4760 standard di�erentiates between macrogeometric –high scale deviations andwaviness– and microgeometric deviations –cracks, grooves, texture or roughnesspro�les– on a surface. Engineering applications require the limitation of macroge-ometric topological irregularities to guarantee, for example, the interchangeability ofparts and the assembly of di�erent components. On the other hand, many authors
22

2.2. EXPERIMENTAL RESULTS ON SURFACE INTEGRITY AFTER BALL BURNISHING
Table 2.2. Ball burnishing references on stainless steel, titanium and nickel alloys. Light grey:milling-machine tools. White: lathe tools.
Reference Material ForceStainless steel
Lee et al., 1993 [78] 316L d.o.p.Prevey et al., 2003 [114] 17-4PH HJayaraman et al., 2003 [65] 17-4PH HZhang et al., 2014 [161] 17-4PH HChomienne et al., 2016 [18] 15-5PH H
Titanium alloysSchuh et al., 2007 [125] Ti-6Al-7Nb HTsuji et al., 2008 [152] Ti-6Al-4V HRevankar et al., 2014 [117, 118] Ti-6Al-4V H
Nickel-based alloysLopez de la Calle et al., 2007 [87] Inconel 718 HKlocke et al., 2009 [70] Inconel 718 HSequera et al., 2014 [128] Inconel 718 HFu et al., 2014 [39] Nitinol Hd.o.p.: depth of penetration; H: hydrostatic tool
have proved the impact of microgeometric deviations on the mechanical behaviourof parts [69]. �is includes fatigue life [106] or tribological mechanisms [139].
Controlling surface geometry means, in practice, quantifying its features throughdi�erent descriptors. Texture and roughness measurement methods are based on theidea of modelling the surface as a mathematical function formed by height points,and the calculation of parameters based on this function to make that data pro�tablefor decision making. One of the original methods based on this idea was proposed byAbbo� & Firestone (1933) [1]. �ey proposed transforming the heights of a surfaceinto a bearing-area curve representing its as an accumulated function. On that repre-sentation, three parameters which described the bearing area and lubricant retentioncapabilities of the surface were calculated.
�e evolution of height registration equipments to devices based on high-sensitivitydiamond styli, supposed a considerable evolution in texture assessment. In the sec-ond half of the 20th century, pro�lometer diamond tips became actuated by a mo-tor, through which they could automatically traverse the target surface along a linethat shall represent the whole surface. �is leap forward allowed the generalisationof an automatic surface characterisation method, and new standards de�ning two-
23

CHAPTER 2. STATE OF THE ART
dimensional descriptors of the surface were published. �e pro�le method de�nedin ISO 4287 is the most generalised one. It establishes a methodology to �lter andarranged the acquired height dataset with respect to a mean line obtained my leastsquares deviation. On that pro�le, di�erent two-dimensional R parameters can becalculated to de�ne the surface features based on the registered dataset [146]. �eseparameters can also be associated to speci�c processes [105], and are a good indicatorto trace the manufacturing history of a surface [162]. �e literature shows extensivework which interpret the roughness results through the R parameter set [130, 138],and the interrelation among some of their parameters as skewness or kurtosis [46,99].
Despite the diversity of parameters in that R set, the average surface roughness,𝑅𝑎, is the most extended one to represent surface texture, as it o�ers an average indi-cator of the overall surface topological state. Originally, it could be easily calculatedby primitive pro�lometer devices with low computing capacity. It is established inthe ISO 1302 as the reference value to represent roughness in technical drawings. Asit happens, 𝑅𝑎 has been the most extensively chosen parameter to evaluate ball bur-nishing results, as show, for instance, the works of Shiou et al. on di�erent mouldsteels [131–133]. �ey concluded that the force and the ball diameter had a high in-�uence on burnishing results. Other researchers, such as Loh et al. (1989) [80], haveevaluated the ball burnishing results on a AISI 1045 alloy in terms of 𝑅𝑡. In all cases,the inverse proportionality between burnishing force and roughness parameters iscon�rmed.
Adopting a di�erent scope, the in�uence of the target surface shape on the topo-logical e�ects of ball burnishing have also been studied. Travieso-Rodrıguez et al.(2011) [149] compared the in�uence of di�erent curvature radius on concave andconvex parts made of AISI 1038 and EN AW 2017 aluminium. Both the 𝑅𝑎 and 𝑅𝑡
improvement along and perpendicular to the burnishing direction were higher as theradius of curvature increased. Curved surfaces have also been burnished by Lopez dela Calle et al (2011) [88]. A 5-axis machine was used, by following two di�erent strate-gies: continuous burnishing and patch strategy. Both of them lead to 𝑅𝑎 decrease,although the continuous proved to be more e�ective while being less productive dueto the limited feed of the rotary axes of the machine.
Studies have also proved that there is a threshold preload level for which rough-ness is actually harmed. Klocke et al. (2009) [70] studied the dependence of 𝑅𝑎 as afunction of the preload and the ball diameter, on Inconel 718 specimens (Figures 2.7.aand 2.7.b). In that case, increasing the burnishing pressure from 150 bar to 250 bar
24

2.2. EXPERIMENTAL RESULTS ON SURFACE INTEGRITY AFTER BALL BURNISHING
(a) (b)
(c) (d)
Figure 2.7. 𝑅𝑎 results of burnished INCONEL 718 surfaces. a. In�uence of burnishing pres-sure [70]. b. In�uence of ball diameter [70]. c. In�uence of burnishing pressure [128]. d.In�uence of ball diameter [128].
proved to be detrimental to surface roughness. Furthermore, the surface exhibitedroughness increase when the ball diameter was increased from 6 to 13 mm.
�erefore, the burnishing force and the diameter of the ball are limited by thresh-old values that should not be surpassed to prevent harmful e�ects on the surface.Sequera (2014) [128] rati�ed the same results for the burnishing pressure, althoughdid not �nd a detrimental in�uence of the ball diameter (Figures 2.7.c and 2.7.d).
In all the evaluated cases, the topological assessment of ball burnishing is basedon the evaluation of a limited number of parameters calculated on linear pro�les, es-pecially𝑅𝑎 and𝑅𝑡. However, the limitation of these 2D parameters to represent a 3Dsurface must not be neglected, as surfaces actually interact in the three directions ofthe space [24]. Although nowadays the calculation potential of computers and equip-
25

CHAPTER 2. STATE OF THE ART
ment are highly advanced, the surface topology assessment methods are the heritageof old-fashioned two-dimensional height analysis marked by low computation capa-bility which is no longer limiting factor in presently available systems. In fact, manyauthors have highlighted that the only reason why 𝑅𝑎 parameter exists is becauseof the original computing limitations of roughness measurement devices [116], as itlacks of statistical meaning, and is insensitive to re�ect changes in the shape of thepro�le [130]. As an alternative, Sherrington et al. (1987) proposed 𝑅𝑞 as an alterna-tive to 𝑅𝑎. While still being a two-dimensional parameter, its statistical meaning asthe root mean square of the height pro�le, and its capability to describe any possibleredistribution of material from one side of the mean line to the other. It is remark-able that no reference has been found considering other two-dimensional parameters,such as 𝑊 or 𝑃 , to analyse burnishing results. Nevertheless, could they provide fur-ther information about the e�ects of the process?
All these reasons lead to conclude that the parameters that have been traditionallyused to describe surface topography can be upgraded to obtain further informationabout ball burnished surfaces. A new methodology shall be proposed to tackle withthis objective in the following chapters.
2.2.2 Metallurgical parameters: hardness and metallography
�e metallurgical state of a surface can be described by numerous factors, such asphase change a�er a surface treatment, or the presence of a phase gradient towardsdeeper layers. �ese parameters are of high importance to de�ne surface integrity,as they are the result of the combination of mechanical or thermal mechanisms. Asball burnishing is not a thermal process, microstructure change is not due to occur.Consequently, other metallurgical factors must be more adequate to describe the pro-cess e�ects. �at is the reason why the measurement of strain hardening is relevantto study the metallurgical state of the material, as it is the direct consequence of theplastic deformation caused by the ball.
Strain hardening is the phenomenon whereby ductile metals become harder andstronger as they are plastically deformed, whereas their ductility falls [15]. A practicalway to de�ne the degree of plastic deformation is by the calculation of the percent
26

2.2. EXPERIMENTAL RESULTS ON SURFACE INTEGRITY AFTER BALL BURNISHING
cold work experienced by the solid:
%𝐶𝑊 = 𝐴0 −𝐴𝑑𝐴0
× 100 (2.5)
where 𝐴0 is the initial area of the cross section and 𝐴𝑑 is the same section a�er de-formation.
�e direct consequences of strain hardening on a material is the increase of itsyield and tensile strengths, caused by dislocation propagation due to stress. �at mul-tiplication of la�ice defects results in an increase of resistance to further dislocationmotion, which is subsequently revealed at a macro scale as an increase of hardness.�erefore, the quanti�cation of the hardness can describe the microstructural sur-face integrity of burnished surfaces. For instance, Lopez de la Calle et al. (2007) [87]determined the depth of a�ectation of burnishing in the order of 10 µm, in both In-conel 718 and AISI P20 preheated steel alloys. �e resulting hardness increased asmore burnishing pressure was applied during the process. In all cases, the hardnessobtained a�er machining was improved (Figure 2.8). �e direct relationship betweenburnishing force and surface hardness had already been reported by Loh et al. [81,82],from experiments executed on AISI 1045 specimens.
Albeit the positive e�ect of the burnishing force on the metallurgical integrity ofthe burnished surface, if the force is too high, severe strain hardening may occur dueto overplasti�cation. �is was reported by Kuznetsov et al. (2015) [75], who detectedevident harm on the surface of a 20Cr4 steel alloy due to shear instability duringburnishing as the burnishing force was increased (Figure 2.9). �e extreme e�ect ofthis excessive force is the �aking of the surface material, which leads to a clear surfaceintegrity degradation and unsuitability of the process.
Rao et al. (2008) [115] observed that this �aking phenomena due to excessive forcehas also detrimental e�ects on the surface hardness, and proposes the application oflubricants to decrease the shear stress that appears during burnishing due to frictiondynamics.
Results also show that the maximum hardness improvement is not registered di-rectly on the surface. Although their work is based on lathe burnishing, it is worthmentioning the results of Chomienne et al. (2016) [18] on 15-5PH stainless steel bars.Figure 2.10 shows not only a hardness improvement at the surface, but a substantialincrease is conspicuous until a 0.3-mm depth. �ey also �nd that no recrystallisation
27

CHAPTER 2. STATE OF THE ART
(a) (b)
Figure 2.8. SEM images of the surface microstructure of burnished specimens at di�erentpressure levels, and surface Vickers hardness. A�er Lopez de la Calle et al., 2007 [87]. a.Inconel 718. b. AISI P20 pre-heated steel
takes place at the surface, probably because not enough thermomechanical energy isadded in the system by burnishing.
Ball burnishing has proved its positive e�ects for the improvement of corrosionresistance, not only on industrial parts [108], but also on biocompatible materialssuch as magnesium alloys used for implants, where it proves to be a very a�ractivealternative to coatings or chemical alloys [123, 153].
2.2.3 Mechanical parameters: residual stress
Residual stress is what remains in a material volume which is stationary and at equi-librium with its surroundings [158]. �e reason why this internal stress state appears,is to balance the various mis�ts occurring between di�erent regions of the body itself.�ey can have di�erent physical origins, such as thermal gradients or mechanical dis-parities. �e length or scale over which the equilibrium is achieved is usually taken
28

2.2. EXPERIMENTAL RESULTS ON SURFACE INTEGRITY AFTER BALL BURNISHING
(a) (b) (c)
Figure 2.9. SEM images of 20Cr4 steel specimens. a. 200-N normal force. b. 400-N normalforce. c. Subsurface shear instability caused by excessive plastic deformation. A�er Kuznetsovet al., 2015 [75]
Figure 2.10. Microstructure and hardness of turned (𝑣𝑐 = 150 m/min, 𝑓 = 0.18 mm/rev, 𝑎𝑝 =0.6 mm) and turned+burnished (250 N, 𝑛𝑏 = 1 pass, 6-mm diameter ball) 15-5PH specimens.A�er Chomienne et al., 2016 [18].
29

CHAPTER 2. STATE OF THE ART
as a reference to classify the di�erent types of residual stress (Figure 2.11). Based onthat classi�cation, residual stress can be typi�ed as follows:
• Type I or macrostresses vary continuously over large distance range, 𝑙0,𝐼 , origi-nated by non-uniform plastic deformation, or the presence of bending momentswhich subject �bres at one side of the neutral plane to compression.
• Type II act in an intergranular domain, and are usually present in materialswhich are formed by adjacent grains with heterogeneous mechanical and ther-mal properties. �erefore, tend to be slightly higher in multiphase materialswhere that heterogeneity is much more abrupt. �at is what origins an inter-nal stress state to set the achieve the equilibrium of the volume.
• Type III have an atomic scale, 𝑙0,𝐼𝐼𝐼 , typically due to lack of coherency at graininterface and dislocation stress �elds.
From the perspective of manufacturing technology, all types are of interest, de-pending on the research focus. For instance, types II and III are interesting for com-posite materials designers, to learn how stress is transmi�ed from the matrix to thereinforcement. For this dissertation, only type I shall be measured, as are the onesrelated to fatigue performance. In this sense, the e�ect of residual stress on themechanical behaviour of components is various depending on the stress distribu-tion.Normally, compressive residual stress are associated to positive e�ects, as theyprevent the initiation and propagation of cracks, as stated Novovic et al. (2004) [106].�is observation can be extended to di�erent materials. For instance, Koster & Field(1973) [71] found that the fatigue life shown by Ti-6Al-4V specimens was dependenton the residual stress provoked by the applied �nishing operation, and not its surfaceroughness. El-Helieby et al. (1980) [31] reached the same conclusion in AISI 52100specimens.
�e measuring technique used to quantify the residual stress of parts must usu-ally be chosen according to the type which is desired to be measured. For instance,material removal techniques such as hole drilling tend to remove macroscopic layersof material, neglecting therefore types II and III, whereas other such as neutron straingauges are sensitive enough to detect those residual stress types [157].
�e assessment of residual stress is clearly oriented in the bibliography as a meansof understanding its in�uence on the fatigue behaviour of materials with regards toother �nishing processes. Furthermore, results focusing on the in�uence of burnish-ing parameters on the residual stress of materials are mainly focused on lathe bur-
30

2.2. EXPERIMENTAL RESULTS ON SURFACE INTEGRITY AFTER BALL BURNISHING
(a) (b)
Figure 2.11. a. Di�erent residual stress scales 𝑙0,𝐼 , 𝑙0,𝐼𝐼 and 𝑙0,𝐼𝐼𝐼 . b. Examples of sources ofmacro and micro residual stress states. A�er Withers & Bhadeshia, 2001 [157]
nished surfaces, and do not tackle with the process exclusively. Below these lines, theresidual stress results are partially presented, whereas the ones related to comparisonwith other �nishing processes are included in the following subsection.
Aviles et al. (2013) [4] observed remarkable higher values of compressive residualstress on hourglass ASI 1045 specimens (Figure 2.12.a), in line with previous essaysperformed by Rodrıguez et al. (2012) [119]. �e same burnished specimens were thentested to rotative bending tests, concluding that ball burnishing increases high cyclefatigue lifespan to a maximum of 21.25%. On the contrary, fatigue improvement atlow cycle fatigue is not remarkable (Figure 2.12.b). �e authors also alert of the riskof crack nucleation at the boundaries caused between two burnished paths, as they
31

CHAPTER 2. STATE OF THE ART
behave as stress concentration points.
(a) (b)
Figure 2.12. Mechanical surface integrity results of ball burnished AISI 1045 specimens.A�er Aviles et al., 2015 [4]. a. Depth dependence of residual stress. b. S-N fatigue diagram ofburnished specimens.
�e ball burnishing process executed via a milling machine by Klocke et al. (2009)[70] on Inconel 718 surfaces showed the positive e�ect of the burnishing force on themagnitude and maximum depth of residual stress. However, 150 bar is found as acritical value from which residual stress do not increase (Figure 2.13.a). �e in�uenceof the ball diameter can also be observed at Figure 2.13.b, where an increase of residualstress and depth are present at the surface as the ball diameter increases.
(a) (b)
Figure 2.13. Deep residual stress measured on Inconel 718. a. In�uence of pressure. b.In�uence of ball diameter. A�er Klocke et al., 2009 [70]
32

2.3. VIBRATION-ASSISTED BALL BURNISHING
Another relevant result found by Klocke et al. (2009) [70] is related to the com-parison of two di�erent measurement methods. �e incremental hole drilling methodand the X-Ray di�raction on a cut-o� burnished material are performed, and showa very good correlation of both methods. �e hole drilling method was also per-formed by Garcıa-Granada et al. (2017) [40] on ball burnished AA 2017-T4 and AISI1038 surfaces. Results were compared to residual stress measured on the surface byX-ray di�raction. A satisfactory correlation of results between both methods wascon�rmed.
(a) (b)
Figure 2.14. Comparison of residual stress measurement of ball burnished surfaces throughX-ray di�raction and incremental hole drilling. a. Results by Klocke et al. (2009) on Inconel718 [70]. b. Results by Garcıa-Granada et al. (2017) [40].
2.3 Vibration-assisted ball burnishing
Innovation in the manufacturing industry o�en comes from improving already exist-ing processes, instead of developing brand new operations based on radically di�erentworking principles. One possible way to undertake this innovative approach is basedon the assistance of processes by combining a conventional operation with an exter-nal power source which triggers additional e�ects in the system, facilitating the cutor deformation of the objective material. �is approach to manufacturing innovationis called process assistance.
�e assistance source can be very varied, and includes laser beams [147], elec-tric currents [72], current pulses [159] or magnetic �elds [100]. �is thesis is based
33

CHAPTER 2. STATE OF THE ART
on the assistance of the ball burnishing process by overlapping ultrasonic vibrationson a force preloaded on the target surface by controlled spring compression. �ehypothesis of improvement is based on the acoustoplasticity principle, which is ex-plained below in this section, along with successful case studies and some isolatedapplications on ball burnishing that have been found in the bibliography.
2.3.1 Description of the acoustoplastic e�ect
�e hypothesis that the superposition of ultrasonic vibrations can improve the execu-tion and results of the burnishing process is based on an physical phenomenon calledacoustoplasticity, or Blaha e�ect, a�er the �rst researcher who observed it on an ex-perimental basis. It consists on the overall reduction of the quasi-static stress requiredto deform a material as a result of the superimposition of vibrations on the deformingagent. As a process based on plastic deformation, the ball burnishing process can besusceptible of improvement by this principle.
Acoustoplasticity was �rst observed by Blaha & Langenecker in 1955 [7]. It wasreported at sight of the results undertaken on pure zinc crystal specimens submergedin a carbon tetrachloride solution, and subjected to a 800 kHz ultrasonic wave. �etests were performed in two ways, as shows Figure 2.15. On one hand, the intermi�entconnection of the ultrasonic source proved to reduce the tensile stress by about 40%,whereas it returned to its value prior to insonation –curve A–. A second experimentaldevelopment showed that continuous application of ultrasound from the beginningof the essay –curve B– lowered the stress to the same extent. Both strategies weredeclared equivalent, as they lead to the same approximate stress value at about 1.5%deformation with no signi�cant increase of temperature of the liquid environment.
�e acoustoplastic e�ect can be universally observed in metals, but its a�ectationdepends on their physical characteristics. Izumi et al. (1966) [62] performed tests onannealed copper, brass, mild steel, Al-Al2O3 alloy and magnesium specimens. �eyobserved a divergent behaviour according to the vibration amplitude, as shows Figure2.16. Whereas mild steel showed a regular evolution of the stress as the amplitudeincreased, copper and aluminium alloy showed a higher sensitivity by the e�ect. Es-pecially for high amplitudes, they showed a change in the behaviour, with an abruptfall of stress as strain grew higher. �is amplitude dependency has been con�rmedby other authors [73, 74].
34

2.3. VIBRATION-ASSISTED BALL BURNISHING
Figure 2.15. E�ect of superimposed 800 kHz ultrasound on zinc crystal specimens deforma-tion. without, and - - - - with vibrations. A�er Blaha & Langenecker, 1955, [7]
�e di�erent reaction of materials to acoustoplastic strain can be quanti�ed. Izumiet al. (1966) [63] de�ned the vibration sensitivity factor, 𝑘, that is, the material con-stant showing the decrease of �ow stress per unit of the vibration amplitude, accord-ing to Eq. 2.6.
𝜎 = 𝜎0 − 𝑘𝑠 𝑢0 (2.6)
where 𝜎 is the �ow stress a�ected by the superimposed vibration, 𝜎0 is the �ow stresswith no vibration, 𝑘𝑠 is the vibration sensitivity, and 𝑢0 is the vibration amplitude.
Furthermore, they found a correlation with some of the main physical character-istics of the alloys, such as the acoustic impedance, Young’s modulus, melting point,work-hardening and stacking-fault energy. Materials with higher acoustic impedanceand higher elastic modulus showed a higher sensitivity to strain through vibration su-perposition, and therefore, so�ening by acoustoplasticity. A lower work-hardeningcoe�cient also favours the process, as can be seen in Figure 2.17.
Acoustoplasticity is described in the literature to have dual e�ect on materials, asit causes so�ening during the application of the ultrasounds, but also residual hard-ening [76]. �is result is actually the most interesting one to justify the assistance ofball burnishing by this e�ect, as it can eventually facilitate plastic deformation duringthe process, while causing a remnant hardness on the workpiece which can improveits wear during in-service functioning.
35

CHAPTER 2. STATE OF THE ART
(a) (b) (c)
Figure 2.16. Stress reduction during compressive tests due to acoustoplasticity with di�erentamplitudes. a. Mild steel. b. Copper. c. Al-Al2O3 alloy. A�er Izumi et al., 1966 [62]
(a) (b) (c)
Figure 2.17. Linear correlation between the vibration sensitivity, 𝑘, and work-hardeningcoe�cient, acoustic impedance and Young’s module. A�er Izumi et al. 1966 [62]
36

2.3. VIBRATION-ASSISTED BALL BURNISHING
2.3.1.1 Brief insight into acoustoplasticity causality
Albeit the observation of acoustoplasticity on di�erent materials, its actual physicalcausality is still controversial, due to the lack of agreement about whether it has anextrinsic or intrinsic nature. �at is, whether it is caused by the reaction of the ma-terial microstructure to the external source of ultrasonic energy, or by the increase–by the e�ect of ultrasounds– of the amount of input energy into the system, withno change in the intrinsic properties of the material.
In summary, it can be stated that the extrinsic approach based on an additive stresssuperposition, has been rejected by numerous authors due to the inconsistency ofthe proposed modes with experimental results [93, 143]. Another intrinsic approach,based on thermal causality, has already been rejected by Endo et al. (1979) [34]
On the contrary, the intrinsic approach based on preferential absorption of theultrasonic wave by la�ice defects has had more continuity in time and acceptationamong researchers. It is based on the hypothesis that ultrasonic energy is preferen-tially absorbed by dislocations and defects in the metal la�ice. As la�ice defects de�nethe plastic deformation mechanisms of a material, this approach can easily explainthe facilitation of the process. �is idea was suggested by Blaha & Langenecker [7,8].Mason (1955) [98] argued that the preferential absorption of ultrasonic energy by lat-tice defects derived in an increase in dislocation mobility which enabled the metal todeform at a lower load. �is theory allowed Gindin et al. (1972) [42] to justify theobserved residual hardening a�er acoustoplasticity, as a consequence of the newlyformed stable vacancy accumulations and dislocation loops in the material la�ice.
A steady discussion about the source of acoustoplasticity has been recently re-activated, enabled by the advances in technology for microstructure analysis. Siuet al. (2011) [137] used a vertical 30-kHz vibrating Vickers microindenter to per-form hardness tests on pure aluminium. �e so�ening-residual hardening dual e�ectof acoustoplasticity was observed on the resulting prints. SEM observations provedthat indentation prints showed residual subgrain formation, an undetected e�ect onspecimens which were quasi-statically indented. �ese e�ects were later con�rmedexperimentally on copper, molybdenum and aluminium specimens [135].
�e explanation for acoustoplasticity resulting from the combined extrinsic andintrinsic theories, seems to be the most complete approach. Neither is acoustoplastic-ity a mere stress addition e�ect, nor a simple preferential absorption by la�ice defects.
37

CHAPTER 2. STATE OF THE ART
It also justi�es the fact that no frequency dependence has been detected on the so�-ening e�ect [136]. On the contrary, Cheng et al. (2015) found that so�ening duringvibratory deformation and residual hardening depends on the amplitude, existing athreshold value which has to be surpassed to observe the e�ect [17]. Recent resultsestablished that subgrain formation is not always observed, and, therefore, cannot beconsidered as the ultimate acoustoplasticity explanation [27].
Regardless of the lack of de�nition of the actual source of the acoustoplastic ef-fect, its experimental application has been long proved, and are to be incorporated tothe ball burnishing operation to enhance its surface integrity results. �e followingsubsection presents the results that have been already reported about the vibration-assisted process in the bibliography.
2.3.2 Experimental results of ultrasonic burnishing
�e acoustoplasticity e�ect as the basis for the assistance of processes has been testedon some traditional operations such as polishing [134] or impact peening [101, 120].�e VABB process was �rst reported during the 70’s under the designation of ultra-sonic burnishing, assisted by vibrations characterised by 41.5 kHz frequency, and anamplitude ranging from 5 to 10 µm. Marakov (1973) [94] found a remarkable inter-action between the amplitude of the oscillation and the surface roughness results, asthe expected positive e�ect of higher forces on surface roughness was only detectedif the amplitude of the vibration was higher than 2 µm (Figure 2.18.a), at mild steelspecimens.
�is result would be later contradicted by Pande & Patel (1984), as shows Figure2.18.b. In this case, the process was assisted by vibrations with frequencies rangingfrom 10 to 70 Hz, and amplitudes from 0.2 to 2.5 µm. Accordingly, the process wascalled vibratory burnishing, in contrast to the high-frequency ultrasonic burnishing.Results revealed a reverted interaction between the force and the amplitudes, obtain-ing lower surface roughness for amplitudes lower than 0.5 µm [109].
Pande & Patel (1984) [109] also analysed the in�uence of the frequency on theresults, through an experimental design with other three parameters, namely: bur-nishing force, feed and spindle speed. Both result variables, surface roughness andhardness, showed a positive direct relation with the vibration frequency. However,that positive e�ect was remarkable higher in terms hardness, as it can be enhanced
38

2.3. VIBRATION-ASSISTED BALL BURNISHING
(a) (b)
Figure 2.18. Interaction of the burnishing force and the vibrations amplitude in a. ultrasonicburnishing (a�er Marakov, 1973 [94]) and b. vibratory burnishing (a�er Pande & Patel, 1984[109]) on mild steel specimens.
by applying the lowest burnishing force assisted with the highest analysed frequencyof 60 Hz.
(a) (b)
Figure 2.19. In�uence of burnishing force and frequency on a. surface roughness and b.surface hardness, a�er Pande & Patel, 1984 [109]).
�e literature review undertaken for the composition of this state of the art hasnot evidenced any other research source about ultrasonic burnishing until the 2000,
39

CHAPTER 2. STATE OF THE ART
evidencing a long timespan since the results by Pande & Patel were published in1984. Ti-6Al-4V specimens were subjected to ultrasonic burnishing by Bozdana etal. (2005,2008) [12, 13]. �e experimental setup was composed of a hydrostatic toola�ached to a milling machine. It was excited by a piezoelectric transducer that trans-mi�ed a 20 kHz and 6.75µm vibration.
According to the same author, surface roughness results are very modest and notespecially promising for the ultrasonic burnishing process.�e average surface rough-ness is improved to a higher extent through the non-assisted process, probably be-cause in situ so�ening caused by acoustoplasticity may act as a harming phenomenain this material [12]. Results in terms of hardness and residual stress are much moreencouraging. Figure 2.20 exempli�es that the ultrasonic process allows the result ofhigher surface hardness, whereas the deep residual stress pro�le shows the positivee�ects of ultrasonic burnishing, while applying half the force with respect to the con-ventional process.
Figure 2.20. Deep residual stress pro�le comparison a�er conventional (CDCR) and ultra-sonic burnishing (UDCR). A�er Bozdana, 2008 [12].
�e major in�uence of ultrasonic burnishing on work hardening and super�cialresidual stress was con�rmed by Huuki et al. (2014) [61] on AW 6082-T6 aluminium,34CrNiMo6-M tempering steel and S355J2 structural steel. �e materials were pre-pared as cylindrical specimens mounted on a lathe. �e experimental setup was con-stituted by using a spring-regulated tool, 3-mm ball and assisting the process with 20kHz vibrations, the maximum static force level was 195 N. Ultrasonic burnishing re-
40

2.4. OBJECTIVES ARISING FROM THE STATE OF THE ART
vealed to be a highly repeatable process, and results on surface roughness and out-of-roundness improved, regardless of the initial super�cial state of the workpieces [60].
Within the framework of this thesis, the most relevant results about vibrations-assisted ball burnishing are those published by Gomez-Gras (2014) [43], since theyrepresent the direct antecedent of the work to be developed throughout the next chap-ters. �e results presented at that thesis are based on the application of the processthrough 2.4 kHz vibrations transmi�ed by a thin plate excited by a coil. When thecoil was excited with a variable magnetic �eld, it caused an alternative de�ection inthose plates, which was transmi�ed to the burnishing ball [45].
�is tool was tested on AISI 1038 and EN AW 7078, and results were compared tothose derived from the conventional process. �is characterisation was performed byanalysing the surface roughness, hardness pro�le and compressive residual stress. Inthis case, the average surface roughness was substantially enhanced by the introduc-tion of vibrations on both materials, and the authors concluded that one pass of theassisted process delivered a similar surface roughness as �ve passes of conventionalburnishing. Nonetheless, although the improvement is also conspicuous in terms ofresidual stress and micro-hardness, results were not so determinant, especially in thesteel specimens [150, 151]. �e authors explain this fact because of an unsatisfac-tory frequency or amplitude transmission of the vibration, which scarcely reachesthe minimum threshold to activate acoustoplasticity mechanisms, and propose fur-ther work to improve the process, which can be at last ful�lled with the developmentof this thesis.
2.4 Objectives arising from the state of the art
From the initial state of the art revision, the following conclusions can be drawn:
• �ere is enough evidence to think that the superposition of an ultrasonic vibra-tion signal on a conventional ball burnishing process can deliver positive resultson the surface integrity of the target material, due to a generalised residualhardening e�ect, and a lower quasi-static stress required to succeed in deform-ing metals plastically, on the basis of empirical works.
• �ere is no commercial tool able to apply the described process. In fact, al-though a few publications can be found by authors who claim to execute it,
41

CHAPTER 2. STATE OF THE ART
references about the tooling and working principle are vague due to the lackof information shared with the scienti�c community. Consequently, a new toolshould be design to apply the process successfully.
• �e classical evaluation strategy followed by researchers with regards to thee�ects of traditional ball burnishing does not tackle the issue through a com-prehensive approach. Speci�cally for the texture e�ects of ball burnishing, onlythe𝑅𝑎, and eventually𝑅𝑡, have been used to quantify the e�ects of the process.However, are these two-dimensional precise enough to characterise an opera-tion that spans a whole surface?
At sight of those observations, the following speci�c objectives can be formulated.�ey shall drive the activities undertaken inside the framework of this dissertation:
1. To design, manufacture, and test a burnishing tool capable to execute the vibration-assisted ball burnishing process, that is, to deform plastically a surface througha preload force on which a vibratory component is overlapped.
2. To test the prototype on di�erent engineering surfaces �nished through ball-end milling.
3. To assess the e�ects of the VABB process on the surface integrity of two work-pieces made of AISI 1038 and Ti-6Al-4V alloys, including topological, metallur-gical and mechanical parameters to describe it.
4. To propose an alternative set of parameters to describe the topological e�ects ofthe VABB process, considering three-dimensional parameters and descriptorsother than amplitude ones.
5. To evaluate the improvement delivered by the vibration-assistance by compar-ing the results to those obtained by complementary tests using the non-assistedprocess.
42

3Design and characterisation of the
VABB tool
�e implementation and validation of innovative tool design for manufacturing is thebasis for the development of this thesis. With that aim, the conception of a prototypeenabling the execution of the VABB process plays a decisive role in the quanti�cationand characterisation of its e�ects on the surface integrity enhancement. �is chapterpresents the mechanical design of a VABB tool, structured in three di�erent func-tional units which work together to execute the process. In this design, the role ofpiezoelectric transducers is fundamental to achieve the vibratory component of theburnishing force required for the VABB process.
A prototype manufactured based on the presented design is then validated throughdi�erent techniques. However, the high frequency and low amplitude characteris-tic movement of the burnishing ball poses a remarkable technical challenge. Hencethe need of deploying a set of di�erent techniques to register and reconstruct thewave generated by the ultrasonic prototype. �ese tests include motion track withHD images, acoustic emission and dynamometric measurements with high samplingfrequency to quantify the actual functioning of the tool when the piezoelectric are
43

CHAPTER 3. DESIGN AND CHARACTERISATION OF THE VABB TOOL
excited.
3.1 Mechanical construction
�e tool presented herea�er is based on a design patented in Spain, and published on2017 June 2 in the Spanish O�cial Bulletin of the Industrial Property with number2615002 [66]. Obtaining the PCT extension is a work-in-progress due to be se�led bymid 2018.
�e prototype is based on spring compression to control the burnishing preload,and incorporates an innovative system of support of the burnishing ball. To suc-cessfully execute the burnishing process, the new prototype must comply with thefollowing basic speci�cations:
• Guarantee the constant rolling of the burnishing ball during the process.• Control with a certain reliability the burnishing preload magnitude through a
calibrated spring.• Enable the interchangeability of the tool on di�erent machine tools.
Besides, to enable the tool to execute the VABB process, additional requirementsmust be demanded, as follows:
• Ensure that all electronic devices are separated from inside the humid machinetool environment.
• Transmit the vibratory movement originated at the piezoelectric thickness al-ternative change to the burnishing ball.
Beyond the cited practical aspects, the actual key feature that must be satis�edby the conceived tool is to deliver an oscillating burnishing force 𝐹𝑏, product of asuperposition of two main components: a preload, 𝐹𝑝, applied during the preliminaryphase of the burnishing operation by means of the controlled spring compression, andan oscillatory force, 𝐹𝑣, delivered by the vibration of a piezoelectric stack. Duringthe process, the actual burnishing force shall be the result of a composition of both,modi�ed by an uncontrolled variation due to the interaction of the ball with surfaceirregularities, as follows:
𝐹𝑏 = 𝐹𝑝 + 𝐹𝑣 + 𝜂 (3.1)
where 𝐹𝑏 is the total burnishing force, 𝐹𝑝 is the preload, 𝐹𝑣 is the vibratory force
44

3.1. MECHANICAL CONSTRUCTION
originated from the piezoelectric vibration dynamics, and 𝜂 is the low-frequency forcevariations due to the topological irregularities found during the feed motion of thetool.
�e force perturbation, 𝜂, shall be neglected for the analysis undertaken in thisdissertation, as shall be justi�ed in the next subsection. All technical requirementsconsidered, the �nal design consists of a tool composed of three di�erent units (Fig-ure 3.1). Conjointly, all three modules allow a feasible preload regulation, introducethe vibratory component in the system, and overlap and transmit both of them tothe workpiece. Further explanation about them is presented along the subsequentsubsections.
Figure 3.1. Structure of the ultrasonic vibration-assisted ball burnishing tool.
3.1.1 Force regulation unit
�e force regulation unit is composed of the parts responsible for the selection andcontrol of the preload, 𝐹𝑝, applied during a ball burnishing operation. �is force is
45

CHAPTER 3. DESIGN AND CHARACTERISATION OF THE VABB TOOL
the main driver of plastic strain during both the NVABB and VABB processes. �ecalibrated spring responsible for force control is housed inside a ø25 AISI 1045 cylin-drical case, which glides freely along a rod, in turn coaxial to the central axis of thetool (Figure 3.2). �e steel case also serves to perform the �xation of the tool to themachine, by clamping it to the tool holder.
(a) (b)
Figure 3.2. Diagram of the FTU. a. Exploded view. b. Assembled parts and spring compres-sion.
�e compression length experimented by the spring de�nes the burnishing preload,as it is the Hooke’s law (Eq.3.2) that governs the elastic force exerted by the spring in-side the unit. �e compression of the spring is possible due to the described free axialmovement of its case, which pushes on it so that preload can be regulated during theburnishing operation as follows. Once the tool is a�ached to the machine spindle,its head is approached to the workpiece until the ball makes contact with the sur-face. From that point on, further plunge of the tool head shall revert in compressionof the spring. �is force transmission is possible on account of the rigid connectionbetween the rod base and the case of the central body of the tool (i.e. the vibrationtransmission unit).
𝐹𝑝 = 𝐹0 + 𝑘𝛥𝑧 (3.2)
where 𝐹0 is the precompression force, 𝑘 is the spring sti�ness, 𝛥𝑧 is the compression
46

3.1. MECHANICAL CONSTRUCTION
length of the spring.
For the realisation of the prototype, a drawn AISI 5160 die spring with rectan-gular section, according to ISO 10243, was mounted on the FRU. It has a nominal100-N/mm sti�ness. To accurately control the preload, a previous calibration phasewas undertaken to de�ne the actual sti�ness and preload of the spring. �e tool pro-totype used for the essays was tested through a universal testing machine equippedwith a 2-kN load cell. �e tool was supported on an auxiliary part which emulatesthe tool holder. �e testing machine compressed then the spring at constant veloc-ity, while the force was registered by a Spider8 data acquisition device, with a 60-Hzsampling rate (Figure 3.3.a).
(a) (b)
Figure 3.3. Calibration of the VABB prototype. a. Overview of experimental setup. b. Curveobtained by compression at 100-mm/min velocity.
�e recorded set of time data was translated into displacement, as the compressionwas performed at constant velocity. �is calibration operation was performed at threedi�erent compression velocities: 1 mm/min, 10 mm/min and 100 mm/min. All datasetdescribe a rectilinear graph, as expected due to the nature of Hooke’s Law. As anexample, Figure 3.3.b shows the calibration curve for the 100 mm/min test.
�e respective resulting calibration lines were calculated using a Microso� Excelworksheet and the INTERCEPT and SLOPE native functions (Table 3.1). �e 𝑦-intercept coordinate corresponds to the precompression force, due to the initial com-pression caused by the pressure exerted by the case as a result of a top nut screwed onthe base support. Parameters are similar, although slightly di�erent due to the varia-tion in the sample size introduced taken by the so�ware to perform the calculation.
47

CHAPTER 3. DESIGN AND CHARACTERISATION OF THE VABB TOOL
Table 3.1. Spring calibration parameters calculated at di�erent compression velocities.
𝑣𝑐𝑜𝑚𝑝 (mm/min) Calibration parameters Pearson’s 𝑅2
𝐹0 (N) 𝑘 (N/mm)1 30.33 83.12 0.999110 29.26 83.65 0.9999100 28.31 84.34 0.9992
Results also show that the actual elastic constant of the spring, 𝑘 , has an averagevalue of 83.70 ± 0.61 N/m, inside the tolerance interval o�ered by the manufacturerin its catalogue. Only this physical spring is used for the experimental proceduresincluded in this thesis. On the other hand, due to the variability of the precompres-sion force depending on the thread length of the nut, a calibration operation wasperformed before every experimental test to verify its value. However, it will not bespeci�ed in this memoir, as it is considered a trivial preliminary operation.
At this point, it is easy to justify the omission of 𝜂 in the quanti�cation of theburnishing force, due to its negligible value with regards to the preload level. Indeed,the source of this variation is the absorption of the spring inside the tool of the surfacetopological features as the ball rolls over them during the process. Since they haveunits of µm, considering the sti�ness of the spring used for this tool, 𝜂 shall have unitsof mN according to Hooke’s law. Consequently, this perturbation can be ignored.
3.1.2 Vibration transmission unit
�is module is composed of the elements necessary to generate the ultrasonic vibra-tory component of the burnishing force, 𝐹𝑣. �e design speci�cations describing theforce that this unit must be able to deliver are shown in Table 3.2.
Table 3.2. Dynamic speci�cations imposed for the VABB prototype.
item valueFrequency 40 kHzAmplitude (unloaded tool) 10 µm
�e principle on which the generation of𝐹𝑣 is based, is the change of the thicknessof a polarized piezoelectric material when it is subjected to a di�erence of potential.
48

3.1. MECHANICAL CONSTRUCTION
Figure 3.4. Stacked piezoelectric plates inside the VTU of the VABB prototype.
�ese piezoelectric transducers deform accordingly at the same frequency as the elec-trical �eld which excites it. �is is the principle on which this VTU is based, and isbased on previous successful applications on vibration-assisted machining tools [14].
�e design contemplates the installation of a piezoelectric transducer stack insidean enclosed case along with the corresponding counterweight, and �xed on a thin sur-face extended at top of the sonotrode to ensure the connection with the FTU. Screwedat the top of that case is the spring support, and, therefore, the whole FRU describedabove. �e electrical excitation of the vibration transmission unit is achieved by aBNC external plug that connects the electrodes among the piezoelectric disks and theelectronic circuit (Figure 3.4).
�e FRU explained above made reference to the static force supplied by the toolthrough spring compression. However, the di�erential feature of the prototype is theability to overlay a vibratory movement on the burnishing ball by means of a set ofpiezoelectric ceramic parts a�ached conjointly to the burnishing ball. �e principleof piezoelectricity justi�es and explains the tool behaviour and its potential to imple-ment the VABB process. Piezoelectricity describes the property of certain materialsto transform mechanical energy in electrical energy –direct piezoelectric e�ect–, andvice versa –inverse e�ect–. �is property can be arti�cially induced by polling in
49

CHAPTER 3. DESIGN AND CHARACTERISATION OF THE VABB TOOL
arti�cial materials such as lead zirconate titanate (PZT) for engineering applications.
�e constitutive model of a piezoelectric transducer, comprising both the inverseand the direct e�ects, is composed of the electromechanical equations representedat Eq. 3.3. �e second one models the inverse e�ect, and explains the utilisation ofpiezoelectric ceramics as actuators. It shows that the deformation experienced by apiezoelectric is the result of an external electric �eld forced on it and, eventually, theapplication of a stress on its surface.
⌊D𝜀} = ⌊𝜉
𝜎 d
d SE} ⌊E𝜎} (3.3)
where D is the vector of electric displacement , 𝜀 is the strain vector, E is the vector ofapplied electric �eld, 𝜎 is the stress vector, 𝜉𝜎 is the permi�ivity matrix measured atconstant stress, d is the matrix of piezoelectric strain constants and SE is the matrixof compliance coe�cients measured at constant electric �eld.
�is equation can be particularised for the case study. �e vibratory displacementis desired along the longitudinal axis of the tool, that is, the direction 3 of the space,performed by an anisotropic piezoelectric polled along that same direction, with noexternal stress applied on it. Considering these requisites, Eq. 3.3 can be simpli�edto Eq. 3.4, which allows the calculation of the total elongation of the piezoelectricmaterial.
𝛥𝑡 = 𝑑33𝑉 (3.4)
where 𝛥𝑡 is the piezoelectric thickness variation.
�is equation calculates the displacement that any element a�ached to the piezo-electric volume is due to experience when the la�er is excited, and does not dependon the original thickness.
�e technical solution for the VTU was developed in collaboration with an in-dustrial �rm that manufactures and distributes piezoelectric sonotrodes. �e result-ing con�guration inside the ball burnishing prototype consisted of four stacked hardPZT8 piezoelectric disks, whose properties are summarised in Table3.3. �e disksare separated by metallic electrodes connected alternatively to an oscillating voltagesource. �is distribution allows an axial actuation of the system, as long as they areexcited by an electric �eld aligned with the polarisation direction.
�is con�guration is a classical engineering solution which presents a high e�-
50

3.1. MECHANICAL CONSTRUCTION
Table 3.3. Properties of hard PZT8 material used for the piezoelectric actuators in the VABBtool.
Property value units𝜌 7700 kg/m3
𝐸 63 MPa𝑑13 120 ⋅ 10−12 m/V𝑑33 275 ⋅ 10−12 m/V𝑑15 400 ⋅ 10−12 m/V
ciency in transforming electrical to mechanical energy, and successfully delivers thevertical vibration of the burnishing ball. It also allows high magnitude resonant fre-quencies of the system, which is suited for the desired ultrasonic excitation of theprototype. �e stack was �xed on the thin surface at the top of the sonotrode ofthe FTU, thus enabling the conjoint functioning of both units, as has been explainedbefore. �is VTU–FTU connection was already presented in Figure 3.4).
�e behaviour of this stacked con�guration can be explained by extending theconstitutive equation represented by Eq. 3.4 for single piezoelectric layers to a se-quence of 𝑞 piezoelectric plates:
𝛥𝑡 = 𝑞 𝑑33𝑉 (3.5)
where 𝑞 is the number of stacked ceramic modules , 𝑑33 is the longitudinal piezo-electric signal deformation coe�cient along the axial direction, and 𝑉 is the appliedvoltage .
�e piezoelectric stack is excited through a BNC connection to an external gen-erator which transforms the electrical signal into a 40 kHz and 1.3 kV mono-phaseAC voltage. As the AC source excites the piezoelectric, it shall change its width inunison with the exciting current, as polarity reverses alternatively the strain sense ofthe piezoelectric material, i.e. negative potential shall make the piezoelectric thinner,and the negative potential thicker.
According to Eq.3.5, and the described characteristics, the nominal displacementof the whole stack can be estimated in 1.5 µm. A model property of the manufac-turer of the whole sonotrode, resulted in a maximum displacement at the tip of thesonotrode, that is, the tool itself, of 8.9 µm, which is the value established at �rst atthe design speci�cations.
51

CHAPTER 3. DESIGN AND CHARACTERISATION OF THE VABB TOOL
3.1.2.1 External power circuit: resonance at maximum impedance
�e external power circuit plays a fundamental role in making the tool function ac-cording to the described speci�cations, as it must be able to generate the correct elec-trical signal to make the piezoelectric vibrate at the desired frequency. For us, thegenerator is a black box whose composition is unknown for the purposes of this dis-sertation, and has been provided by the manufacturer of the piezoelectric actuator.
�e electrical circuit has been tuned so that the actuator works always at resonantfrequency, and at maximum impedance, 𝑍 . As the impedance is the measurementof the opposition that a circuit presents to a current when a voltage is applied, ac-cording to Ohm’s Law, se�ing the mentioned condition as a design requirement hastwo main consequences. First of all, it is an electronic means of guaranteeing thatthe piezoelectric is always working at resonance frequency of 40 kHz. Secondly, thecircuit always work at minimum intensity, 𝐼 , and, therefore, with minimum powerconsumption.
To guarantee that this condition is invariable in time, the circuit of the externalgenerator includes an electronic auto-tuning system which modi�es the impedanceautomatically, through a feedback system reporting the value of the output signal tothe input terminal of the ampli�er. To check this condition, the prototype was con-nected to a Banry PV70A impedance analyser. �is device enables the excitation thetransducer of the prototype with a sequence of electrical signals of increasing fre-quency. Incremental steps of 100 Hz, from 30 kHz to 50 kHz, were taken to excitethe transducer. Figure 3.5 represents the impedance value measured for each fre-quency. Maximum impedance can be found at around 42 kHz, as desired according todesign speci�cations. A second measurement was taken while the piezoelectric wasmanually loaded on a free surface. �e impedance presents a certain variability asa consequence of the circuit constant autotune, but the global maximum can be alsoseen at the same frequency level.
�e electrical circuit is also equipped with a potentiometer which allows the vari-ation of the vibration amplitude. �e maximum amplitude is coded as a 100%, and isthe reference value. �is amplitude can be changed continuously just by interactingwith the power circuit potentiometer switch. �e quanti�cation of this change andits consequence in the VABB process application shall be assessed in the followingtool characterisation activities.
52

3.2. FREQUENCY MEASUREMENT THROUGH ACOUSTIC EMISSION
Figure 3.5. Frequency sweep and register of electrical impedance of the circuit which excitesthe tool.
3.1.3 Force transmission unit
�e function assigned to this module is the execution of the burnishing force, 𝐹𝑏, byoverlaying and transmi�ing both the preload controlled through the FRU, and theoscillating force, 𝐹𝑏, enabled by the VTU. �e ultimate mechanical transmi�er of thatforce is the burnishing ball, which is supported on a set of bearing spheres insidea hemispherical slot machined on the tool head (Figure 3.6). �at head is actuallythe extension of the thin support surface on which the piezoelectric disks are �xed.Its second function is acting as a sonotrode amplifying the piezoelectric vibrationamplitude from its top, on which the piezoelectric is �xed.
3.2 Frequencymeasurement through acoustic emis-sion
An industrial �rm holding the expertise in manufacturing and implementation ofpiezoelectric actuators executed the implementation of the design in a VABB proto-type, which was used for the experiments described in this thesis. Before applying it
53

CHAPTER 3. DESIGN AND CHARACTERISATION OF THE VABB TOOL
(a) (b)
Figure 3.6. Schematic representation of the force transmission unit. a. Detail of bearingballs on hemispherical track machined on the sonotrode tip. b. Assembled section of FTUcomponents.
on the materials of interest, a preliminary testing phase was performed to prove thatvibrations were actually being transmi�ed to the objective material.
In this ma�er, the great technological challenge resided in the limitation of sensorsto register ultrasonic frequency and micrometric displacements , in this case of theburnishing ball. For that reason, during this phase, the e�orts were focused on thecharacterisation of the frequency of the signal transmi�ed from the tool to the partthrough alternative technologies.
A second handicap was found in the fact that conventional accelerometers andother equipments such as laser vibrometers cannot sample an ultrasonic signal. 20kHz is usually considered as a the threshold value to de�ne the adequacy of this kindof systems. �erefore, the reconstruction of the actual signal would not be representa-tive of the actual one. As the Nyquist-Shannon sampling theorem states, the samplingfrequency should be at least twice the expected measured frequency, so that the digi-talised data is not aliased, and the real signal can be represented by the reconstructedsignal. In this case, a frequency higher than 80 kHz would be necessary to succeed inthe vibratory signal characterisation.
At sight of the described situation, an acoustic emission (AE) experimental setupwas proposed as a �rst approach to the characterisation of the prototype dynamicbehaviour. AE sensors are devices based on the inverse piezoelectric e�ect describedabove, as they transform a mechanical stimulus into a measurable di�erence of po-tential. �e range of frequencies fully detected through AE goes from the acoustic to
54

3.2. FREQUENCY MEASUREMENT THROUGH ACOUSTIC EMISSION
the ultrasonic frequency range, depending on the sensor and its resonant frequency,which �ts the requirements for our needs.
However, an issue with this technique derives from the advantages it deliversin detecting high frequencies: it requires high sampling rates of a MHz magnitude,and, therefore, generates huge datasets di�cult to postprocess [96]. Hence its usualapplication for non-continuous measurement, as a means to register transient high-frequency waves which do not require to be subjected to continuous sampling andacquisition. For instance, one of its applications is the detection and monitoring ofelastic waves originated at subtle changes in materials la�ice, such as underlayeredbreakdowns or microcrack nucleation [95, 97].
3.2.1 Acoustic emission experimental setup
In order to monitor the signal transmi�ed by the vibrating tool, these AE experimentstook an AISI 1038 block as the solid to allow ultrasonic transmission. Table3.4 sum-marises the di�erent testing conditions which where �nally registered. Two preloadlevels where applied on the target surface, to perform both burnishing lines andpoints, that is, by imposing a feed movement to the prototype or not, respectively.�is allows the evaluation of a possible in�uence of the feed motion on the measure-ments.
Table 3.4. Measuring conditions tested during the acoustic emission acquisitions.
Test 𝐹𝑝 (N) 𝐴 (%)
burnishing point
90 090 2590 50270 0270 25270 50
burnishing line
90 090 2590 50270 0270 25270 50
55

CHAPTER 3. DESIGN AND CHARACTERISATION OF THE VABB TOOL
Figure 3.7. Experimental setup for the measurements through acoustic emission.
An initial set of experiments revealed sensor saturation when the highest am-plitude allowed by the system was selected through the potentiometer at the powercircuit. �erefore, 𝐴 = 100% measurements were discarded from the experimentalplan. �e complete experimental setup can be seen in Figure 3.7.
�e steel block was mounted on the vise and face milled, to ensure perpendicu-larity of the objective surface with regards to the central axis of the prototype. �eexternal circuit which excites the VTU was installed next to the machine, so thatthe vibrations amplitude could be easily changed. AE measures were made with thefollowing equipment:
• Vallen VS-150M acoustic emission piezoelectric transducer, �xed on the surfaceof the steel piece through a gel-type couplant.
• Vallen EAP4 34 dB pre-ampli�er for signal conditioning.• Vallen AMSY-5 acquisition system for signal recording.
All data was registered through the Vallen 32 Visual AE acquisition so�ware. Itwas then processed through a Matlab script through which the signal was �ltered andrepresented in the time domain. �e power spectrum was calculated from the �lteredsignal. Results are presented in the next subsection.
56

3.2. FREQUENCY MEASUREMENT THROUGH ACOUSTIC EMISSION
3.2.2 Frequency of the ultrasonic signals recorded by AE
�e signals recorded for the 0% amplitude case study did not reveal any data registra-tion, as could be beforehand easily expected. On the other hand, all point and lineartests lead to similar conclusions. For instance, Figure � shows the graph of the signalobtained for the 270 N and 50% amplitude test.
Figure 3.8. Time history and frequency spectrum of signals registered the burnishing linetests 270 N, 𝐴 = 50%
�e intensity of frequency peaks in the spectrum should actually not be consid-ered, as they depend on the distance between the sensor and the measuring point,which has not been calibrated. Indeed, the objective of these measurements is thefrequency characterisation of the signal emi�ed by the VABB prototype. �erefore,a slight saturation of signals does not bias the results expected from these measure-ments.
On the other hand, all recorded signals are represented by similar frequency spec-trum, showing an harmonic response from the same fundamental frequency regard-less of the preload level, or the presence of a feed movement during the process. �is
57

CHAPTER 3. DESIGN AND CHARACTERISATION OF THE VABB TOOL
results leads to think that the tool actually vibrates equally in frequency terms duringthe execution of the process, and its behaviour does not change essentially when it isloaded.
To quantify the value of the fundamental frequency visible in the spectrum, theMatlab script was prepared so that it could return the value for each signal in a re-sults array. Table 3.5 represents all these results. Regardless of the preload level orthe amplitude of the vibration, all signals transmi�ed had the exact fundamental fre-quency of 39.1 kHz, very near from the 40 kHz de�ned at the initial speci�cations.�e amplitudes do not reveal any pro�table information, as the measurements werenot calibrated.
Table 3.5. Fundamental frequency found for each measured signal and its amplitude.
Test 𝐹𝑝 (N) 𝐴 (%) 𝑓0 (kHz) 𝐴0 (mV)
burnishing point
90 25 39.1 70.190 50 39.1 63.5270 25 39.1 55.9270 50 39.1 54.6
burnishing line
90 25 39.1 69.090 50 39.1 61.4270 25 39.1 52.1270 50 39.1 69.1
3.3 Dynamometric characterisation
During the previous subsection, handicaps and technical limitations were found tomeasure the actual ball displacement during piezoelectric excitation. Having suc-ceeded in �nding a value of the frequency through the AE experimental analysis, analternative method was considered to quantify that displacement by direct determi-nation of the sinusoidal force overlapped on the preload while the piezoelectric isbeing excited, that is, 𝐹𝑣.
�e quanti�cation of 𝐹𝑣 during this phase is completed by a second layer of objec-tives, as it allows the assessment of the e�ectiveness of the potentiometer installed inthe external circuit for the piezoelectric excitation. On the other hand, it also delivers
58

3.3. DYNAMOMETRIC CHARACTERISATION
information about a possible dependence of this oscillating force on other processparameters.
3.3.1 Dynamometric experimental setup
�e experimental application of the dynamometric measurements contemplated a to-tal of 6 preload levels, which were tested at amplitudes 10%, 50% and 100%. Further-more, the 𝐹𝑣 was recorded at the highest preload level for amplitudes from 10% to100% in steps of 10. A summary of all tested conditions are contained in Table 3.6.
Table 3.6. Conditions measured during the dynamometric tests.
𝐹𝑝 (N) 𝐴 (%)100 10 – 50 – 100200 10 – 50 – 100300 10 – 50 – 100400 10 – 50 – 100500 10 – 50 – 100600 10 – 20 – 30 – 40 – 50 – 60 – 70 – 80 – 90 – 100
Figure 3.9 shows the whole experimental setup next to the milling machine whereit was conducted. �e press force sensor was mounted on the vise on the millingmachine, with the help of a copper shell to protect it. �e tool would be directlycompressed on the sensor surface to a�ain the di�erent preload levels. With thataim, the following equipment was implemented:
• Kistler 9323A press force sensor, especially conceived for measuring dynamicand quasistatic forces (Natural frequency: 72 kHz).
• Kistler 5015A charge meter.• Hameg HM2008 oscilloscope
A �rst set of measurements were taken to construct a calibrating line by progres-sively compressing the spring inside the prototype, and monitoring the static force.Figure 3.10 shows the equivalent calibration line obtained my linear regression, Com-pared to the equation obtained by continuous compression. Both sti�ness coe�cientscan be considered equivalent, although the precompression force is slightly di�erent.As that precompression is caused manually by the operator by tighting the nut at top
59

CHAPTER 3. DESIGN AND CHARACTERISATION OF THE VABB TOOL
Figure 3.9. Experimental setup for the dynamometric measurements.
of the prototype, it can change from one situation to another. Consequently, this cal-ibration should be performed before each application of the process. An alternativeprecompression method could be developed in future improvement activities.
Figure 3.10. Comparison of calibration lines measured through continuous force acquisitionand Kitsler dynamometric measurements.
During the second phase, all preload levels and amplitudes were combined andregistered. Preloads were managed by compressing according to the calibrating func-tion deduced from the previous phase. For each preload level, the tool was compresseddirectly on the sensor, until the searched preload value was achieved. �e measure-
60

3.3. DYNAMOMETRIC CHARACTERISATION
ment was then reset, and the piezoelectric was excited. �at way, the only forcedetected by the sensor was the additional vibrating force, 𝐹𝑣. By the inverse piezo-electric e�ect, the sensor transformed that force acting on the quartz element insidethe capsule into an analogue voltage signal, which was acquired and sampled by aHameg HM2008 oscilloscope.
For a proper reconstruction of the signal, a 10-MHz sampling frequency was usedto process the signal by the oscilloscope so�ware. However, although the oscilloscopedelivered the sampling and reconstruction of the signal at a satisfactory frequency, italso provided a technical limitation linked to the fact that only the portion of signalshown in the screen could be exported. In order to have a good representativeness ofthe force, each signal was acquired ten times, and processed by a Matlab routine tocalculate a sine function �t.
3.3.2 �antification of the superimposed vibratory force
�e arguments of the ��ed sine are the descriptors of the vibratory force, 𝐹𝑣, asrepresents Eq. 3.6.
𝐹𝑣 =𝛥𝐹𝑣 sin (𝜔 𝑡 + 𝜑0) (3.6)
where 𝛥𝐹𝑣 is the force variation in one half cycle, 𝜔 is the angular frequency, and 𝜑0
is the phase.
Figure 3.11 shows an example of the sine �t calculated for one of the sampledsignals for a 600-N preload at 100% amplitude. All �ts have a Pearson 𝑅2 parameterhigher than 94%, thus con�rming the reliability of the calculated parameters (Table3.7). Only the ��ings for the measurements at 100 N of preload are around 85%,probably because the signal is more unstable at this preload level. Still, this ��ing canbe considered as acceptable to quantify the level of force delivered by the vibrating s.Standard deviations have not been represented for the purposes of simplicity, as theyare all below 0.01.
�e Matlab routine returned all descriptors of the sine curves, which are actuallythe descriptors of the vibratory force overlaid on the preload. Of all those descrip-tors, the frequency and the amplitude of a half cycle are the most interesting ones tocharacterise 𝐹𝑣. Table 3.8 gathers all those descriptors averaged from the ten sam-ples taken for each measuring condition, along with their standard deviation. �edivergence between the mean half-cycle amplitude arising from the sine ��ing and
61

CHAPTER 3. DESIGN AND CHARACTERISATION OF THE VABB TOOL
Figure 3.11. Sinus �t calculated for the recorded signal at 𝐹𝑝 = 600 N and 𝐴 = 100%.
the actual maximum and minimum registered forces con�rms what can be visuallydetected in the signals: they show a random variability in time. Still, this functionmodels well enough the behaviour of the vibratory force, as was shown in Figure3.11.
For a be�er comprehension of the vibratory force scales, Figure 3.12 representshalf cycle force amplitudes calculated from the sine �ts, and both the maximum andminimum forces acquired through the dynamometer for the two highest tested ampli-tudes. All piezoelectric amplitudes regulated from the external power circuit generatea similar behaviour of the vibratory force, for all preload levels. �e force variationin a half cycle is around ± 4 N, except for the case of 200 N preload force, where aslightly higher value of 5.5 N is observed.
�is non-linearity can be associated to the fact that the sti�ness of the prototype,𝑘′, changes as the spring is compressed di�erent compression lengths, i.e. as thepreload is changed. �e most simple model to explain this is by assuming that thedisplacement of any mechanical system is directly proportional to the force causingit through its sti�ness (Eq. 3.7). In the VABB prototype, this 𝑘′ sti�ness is the result ofthe mechanical combinations of all its components, including the spring. �erefore,
62

3.3. DYNAMOMETRIC CHARACTERISATION
Table 3.7. Average goodness of �t of 𝐹𝑣 sine �ts through the Pearson 𝑅2 parameter.
𝐹𝑝(𝑁)𝐴 100 200 300 400 500 60010% 85.3% 97.3% 95.5% 95.5% 94.8% 94.0%20% - - - - - 94.4%30% - - - - - 94.0%40% - - - - - 93.4%50% 85.5% 97.4% 95.1% 95.4% 94.1% 94.0%60% - - - - - 94.3%70% - - - - - 94.3%80% - - - - - 94.3%90% - - - - - 94.3%100% 85.1% 97.4% 95.8% 95.5% 94.6% 94.0%
(a) (b)
Figure 3.12. Half-cycle vibratory force variation, and extreme values, for di�erent preloadlevels. a. 𝐴 = 50%. b. 𝐴 = 100%.
it is unknown.𝐹 ′ = 𝑘′𝛿 (3.7)
where 𝐹 ′ is the force acting on the mechanical system, 𝛿 is the displacement, and 𝑘′is the system sti�ness.
As the spring governing equation is linear, meaning that the variation of 𝑘′ mustcome from other uncontrolled factors related to the mechanical composition of thetool, and it introduces the non-linearity observed in the experimental results, whichlead to conclude that sti�ness is minimum at a preload of around 200 N. �e directconsequence is that it enables the whole FTU to vibrate along a higher displacement.Nevertheless, this variation should not be in�uential in the result, as the acoustoplas-
63

CHAPTER 3. DESIGN AND CHARACTERISATION OF THE VABB TOOL
Table 3.8. Average descriptors of sine �ts of 𝐹𝑣 and maximum and minimum values regis-tered.
𝐹𝑝(𝑁) 𝐴 𝛥𝐹𝑣 (N) SD (N) 𝐹𝑣,𝑚𝑖𝑛 (N) SD (N) 𝐹𝑣,𝑚𝑎𝑥 (N) SD (N)
100 50% 1.70 0.079 -3.38 0.285 3.11 0.202100% 1.67 0.033 -3.06 0.388 3.03 0.247
200 50% 4.53 0.055 -5.77 0.298 5.47 0.248100% 4.80 0.040 -5.89 0.196 5.99 0.268
300 50% 3.23 0.051 -4.53 0.347 4.30 0.297100% 3.23 0.030 -4.41 0.250 4.39 0.279
400 50% 3.13 0.049 -4.41 0.250 4.33 0.279100% 3.17 0.042 -4.22 0.261 4.39 0.243
500 50% 2.87 0.040 -4.16 0.320 4.03 0.247100% 2.89 0.018 -4.07 0.324 4.12 0.244
600
10% 2.77 0.025 -3.75 0.178 4.11 0.20320% 2.78 0.031 -3.85 0.236 4.03 0.21730% 2.78 0.039 -3.64 0.331 4.39 0.26440% 2.76 0.028 -3.78 0.162 3.97 0.30450% 2.75 0.030 -3.76 0.178 4.11 0.32960% 2.76 0.026 -3.64 0.343 4.02 0.22170% 2.77 0.043 -3.64 0.321 4.02 0.22180% 2.76 0.054 -3.64 0.351 3.93 0.23490% 2.76 0.045 -3.65 0.187 3.86 0.202100% 2.84 0.048 -3.86 0.285 3.95 0.203
64

3.3. DYNAMOMETRIC CHARACTERISATION
tic e�ect is not a ma�er of additive force, but the transmission of the ultrasonic waveinside the material, the source of which is con�rmed for all preload levels. Further-more, the reference values of 4 N and 5.5 N, over the di�erent adopted preload levelsprovide a similar ratio, so that they can be considered at all e�ects equivalent.
As 𝐹𝑝 = 600 N was object of more measurements at di�erent amplitudes, it hasbeen represented in Figure 3.13 along with 300 N for comparison. �at Figure showsthe stability of the vibratory force descriptors, even for the more discretised 600 Nmeasurements. �is behaviour is common for all preload levels.
(a) (b)
Figure 3.13. Half-cycle vibratory force variation, and extreme values, for di�erent preloadlevels. a. 𝐹𝑝 = 300 N. b. 𝐹𝑝 = 600 N.
As for the 𝐹𝑣 frequencies, 𝜈, they can be obtained from the angular frequency ofthe sine �ts, according to Eq. 3.8. �e frequencies corresponding to all the studiedcases were calculated and averaged. Table 3.9 shows the high stability of the fre-quency at 39.2 kHz, regardless of the preload and the amplitude.
𝜈 = 𝜔
2𝜋(3.8)
In general, the dynamometric measurements have evidenced that the vibratorysignal is stable for preloads lower and higher than 200 N, as this preload level showsa decrease in the sti�ness of the system that slightly ampli�es 𝐹𝑣. �e next sectiontackles with the measurement of the mechanical integrity of all tool parts by theanalysis of motion tracking.
65

CHAPTER 3. DESIGN AND CHARACTERISATION OF THE VABB TOOL
Table 3.9. Average frequency of all sine �ts that model the 𝐹𝑣 , and standard deviation (𝑆𝐷).
𝐹𝑝 (N)100 200 300 400 500 600
𝐴 𝜈 SD 𝜈 (Hz) SD 𝜈 SD 𝜈 SD 𝜈 SD 𝜈 SD10% 39.2 25 39.2 12 39.2 8 39.2 12 39.2 11 39.2 1120% - - - - - - - - - - 39.2 2530% - - - - - - - - - - 39.2 2440% - - - - - - - - - - 39.2 2650% 39.2 17 39.2 13 39.2 13 39.2 11 39.2 11 39.2 1560% - - - - - - - - - - 39.2 1670% - - - - - - - - - - 39.2 1580% - - - - - - - - - - 39.2 1390% - - - - - - - - - - 39.2 18100% 39.2 25 39.2 8 39.2 17 39.2 16 39.2 9 39.2 23Units: 𝜈 (kHz); SD (Hz)
3.4 Preliminary validation tests
Once the vibratory behaviour of the tool was measured, the next step was to con�rmthat the tool could actually modify the surface texture. With that aim, the prototypewas tested on an AISI 1038 workpiece by performing a whole burnishing operation ona previously milled surface. Each burnishing cycle included precompression followedby successive parallel passes separated by a certain lateral o�set were performed toobtain a whole burnishing patch. (Figure 3.14).
�e initial surface was obtained by a surface milling operation with a∅80 5-insertfront mill, obtaining a surface characterised by𝑅𝑎 = 2.735±0.473 µm. �e roughnesswas measured on the workpiece with a Mitutoyo S-210 Sur�est pro�lometer, �lteringthe signal with 𝜆𝑐 = 0.8 mm cut-o� length and 4 mm evaluation length, and by aver-aging 20 di�erent measures along the burnishing direction. �is �rst test proved toimprove the surface roughness by 56.17%, con�rming the positive e�ects of the tool.However, the prototype exhibited a slight bending e�ect during its displacement onthe surface as the feed movement was induced, by e�ect of the friction. As an ex-cessive geometric deviation between each pair of modules could prevent the tool toperform the process adequately, so it was decided to quantify it.
With that purpose, motion tracking was used to study the mechanical integrity ofthe burnishing tool, along with the relative movement and rotation of its constructive
66

3.4. PRELIMINARY VALIDATION TESTS
Figure 3.14. Preliminary burnishing imprints performed on a milled AISI 1038 surface.
parts. �e tool was a�ached to a LAGUN 600 milling machine. An AISI 1038 blockwas �xed on the vise and surfaced to clean the working surface. A CNC code waswri�en to perform successive going and returning burnishing passes along one line.�e whole body of the tool was acquired with an HD video camera at 80 fps during 3s, for two preload levels: 90 N and 270 N.
Each video was decomposed in 240 frames of 1280×720 pixels, which were pro-cessed through a Matlab routine that delivered the relative movement of speci�c pre-de�ned points throughout the di�erent frames. �ose marks were organised in a 237-point array composed by four sub-meshes (Table 3.10). Each sub-mesh correspondedto one component of the tool, as shows Figure 3.15.
�rough the Matlab script, the 𝑥 and 𝑦 coordinates of all mesh points were located,and were followed along the next 239 frames, recalculating their 𝑥 and 𝑦 coordinatesthroughout the video sequence. �e routine returns, for each of the four meshes, amatrix composed of those coordinates along the 240 frames. By coordinate subtrac-tion, the slope of the lines composed by the points at each row with regards to thehorizontal line were calculated. For instance, as mesh I is composed of 5 rows (points
67

CHAPTER 3. DESIGN AND CHARACTERISATION OF THE VABB TOOL
Figure 3.15. Meshes I-IV de�ned on the tool for the image treatment routine.
Table 3.10. Mesh size for the image processing of the tool.
Mesh nodes node distributionI 15 3 × 5II 36 6 × 6III 176 16 × 11IV 10 2 × 5
1-3, 4-6, 7-9, 10-12 and 13-15) (Figure 3.16), the respective �ve slopes were calculatedfor each of the 240 frames.
Figure 3.16. Points composing the mesh of part I.
Each frame is represented by one slope value calculated by the average of allpoints. For instance, Figure 3.17 shows the evolution of the slopes for the elementI for each frame, along with a smoothed curve. Two clearly di�erentiated slopes canbe observed in the graph, each one associated with the displacement of the tool inthe corresponding direction, namely 𝑚𝑟 and 𝑚𝑠. �e former is associated in the rep-resented case by the points comprised between frames #40 and #150, For our 80-fpsacquisition, 𝑚𝑠 is present during 1.375 s, which corresponds to the time that the tool
68

3.4. PRELIMINARY VALIDATION TESTS
takes to go along the 7-mm path at the established 300-mm/min feed.
Figure 3.17. Raw and smoothed curves representing the slope presented by the mesh of partI with a 90-N preload.
For both registered preload forces, the presence of dual slope values is found at thefour sub-meshes drawn on the tool geometry. Both𝑚𝑟 and𝑚𝑠 themselves are relatedto the rotation of the tool during the burnishing feed movement around a �xed point–the tool-holder origin– and can be calculated according to Eqs. 3.9 and 3.10.
𝜃𝑟 = 𝜋 − arctan𝑚𝑟 (3.9)
where 𝜃𝑟 is the rotation of the tool when it moves in one sense.
𝜃𝑠 = 𝜋 − arctan𝑚𝑠 (3.10)
where 𝜃𝑠 is the rotation of the tool when it moves in the opposite sense.
�e maximum angle that the 𝑖 component of the tool is pivoting when the feeddirection changes, 𝜃′𝑖, is obtained as half the di�erence of angles 𝜃𝑟 and 𝜃𝑠 (Eq. 3.11).It can be seen in Figure 3.18. Although this calculation is based on the hypothesisthat the tool swivels the same angle in both feed senses, this calculation method al-lows a good approximation to its value, and means that it is not necessary to take avertical reference, which would be impossible to de�ne properly due to the sphericaldeformation caused by the camera objective.
𝜃′𝑖 =𝛿
2= 𝜃𝑟 − 𝜃𝑠
2(3.11)
69

CHAPTER 3. DESIGN AND CHARACTERISATION OF THE VABB TOOL
where 𝛿 is the di�erence of the angles that the tool bends in both displacing directions.
Figure 3.18. Angle and slope nomenclature related to the calculation of the relative anglebetween tool sections.
�e relative pivoting angle of each part with regards to the part to which it isa�ached, 𝜃𝑖 , can be calculated by the di�erence of the angles already deduced, asfollows: )⌉⌉⌋⌉⌉]
𝜃𝑖 = 𝜃′𝑖 − 𝜃𝑖−1 ∶ 𝑖 = 1,2,3
𝜃𝑖 = 𝜃′𝑖 ∶ 𝑖 = 4(3.12)
�e absolute pivoting angles of the four distinguished parts of the tool change arehigher as the preload grows, as expected, at sight of results contained in Table 3.11.�e ball, as the furthest element from the tool holder, experiences the highest pivot-ing, being 0.2970○ with the 90-N preload, and 0.4622○ if the tool is preloaded 270 N.When it comes to relative angles, the transition between parts II and III exhibits thelargest rotation angle, namely, 0.1688○ and 0.3070○ for both preloads. �at is, respec-tively, 59% and 66% of the absolute angle, which means that this part is experiencingthe highest rotation during the preload and feed movement of the prototype. How-ever, in both cases the rotation angles are small enough to state that they shall nota�ect the application of the process through this prototype.
�ese results show that the prototype design is a�ected by friction force duringthe operation, which acts a shear interaction provoking the relative bending of thetool. It can be caused due to the fact that the piezoelectric actuator is supported on a1-mm Ti-6Al-4V plate at the top of the sonotrode. �is low thickness plate is highly
70

3.5. SYNTHESIS
Table 3.11. Absolute and relative pivoting angles of each part of the prototype for bothpreload levels.
90 N 270 NI II III IV I II III IV
𝜃𝑟 (rad) -0.0105 -0.0092 -0.0027 -0.0028 -0.0057 -0.0108 -0.0075 0.0094𝜃𝑠 (rad) -0.0004 -0.0002 0.0005 -0.0002 0.0102 0.0063 -0.0023 0.0130𝛿 (rad) -0.0102 -0.0091 -0.0032 -0.0026 -0.0154 -0.0171 -0.0052 -0.0037𝜃′ (deg) 0.2907 0.2601 0.0914 0.0734 0.4622 0.4560 0.1490 0.1048𝜃 (deg) 0.0305 0.1688 0.0180 0.0734 0.0061 0.3070 0.0442 0.1048
a�ected by the shear force provoked by friction during burnishing. However, thisdegree of rotation is not a problem for the execution of the process, and, therefore,the prototype shall not be modi�ed and is ready to be tested in terms of dynamicbehaviour. �is conclusion shall be useful in future activities to improve the toolconception.
3.5 Synthesis
As no VABB tool is commercially available, a new design is proposed and was man-ufactured to apply the process on the target workpieces. Along this chapter an in-novative design has been proposed and executed to successfully apply the process.�e prototype was successfully tested on an AISI 1038 surface, con�rming its feasi-bility for the application of the process. �e main �ndings arising from the di�erentcharacterisation activities of the prototype can be summarised as follows:
1. A spring-based ball burnishing tool equipped with a piezoelectric stack hasbeen successfully designed to succeed in applying the process by using a vibra-tory force on the target surface.
2. �e vibratory system is resonant at nearly 40 kHz. It sticks to this frequencyeven when the piezoelectric is loaded, by means of an electronic auto-tune cir-cuit that forces it to work at minimum impedance. �is frequency has beenexperimentally de�ned as slightly lower, of 39.1 kHz, by acoustic emission mea-surements.
71

CHAPTER 3. DESIGN AND CHARACTERISATION OF THE VABB TOOL
3. �e vibratory force introduced in the system follows a sine function, with min-imum average half-cycle amplitude found for a 100-N preload, possibly due tothe fact that this reduced force does not make the tool engage with the work-piece at the same extent as higher forces. For 200 N, a mean ± 5.5 N amplitudeis found to be added in the system, but then it se�les at a ± 4 N level for higherpreloads. In all, this change should not be in�uential, as acoustoplasticity is notan e�ect based on stress addition. In all cases, the sine frequency is of 39.2 kHz,agreeing with the other performed measurements.
4. A slight relative pivoting of the sonotrode has been detected during the pre-liminary tests. However, it has been quanti�ed to be of around 0.5 ○, which isconsidered low enough to not be detrimental for the process.
72

4Description of the experimental
methodology
�is chapter presents the di�erent issues and techniques related to the VABB charac-terisation process. �e �rst section tackles with the preparatory tasks developed tode�ne the experimental plan. �e di�erent techniques and methods applied to assessthe VABB results on surface integrity are then explained. A third section includes thecharacterisation of the materials on which ball burnishing tests are due to be applied.Finally, some aspects regarding the experimental execution are presented to reporton the development of all VABB and NVABB tests.
It is important to note that no experimental results are included here, aside fromsome auxiliary tests that have been performed to assist design the whole experimentalphase itself. �e main results are included in the next chapter. �is segregation hasbeen done with the deliberate aim of not eclipsing the results assessment discussionwith methodological data. Indeed, both contents could generate an excessively longchapter that could distract the a�ention of the reader, and prevent it to focus on theresults and conclusions drawn from their discussion.
73

CHAPTER 4. DESCRIPTION OF THE EXPERIMENTAL METHODOLOGY
4.1 Experimental design
Design of experiments (DOE) constitutes one of the most used techniques to performan in-depth assessment of di�erent engineering issues. �e ultimate objective of DOEis to determine the most in�uential factors in the case study, by performing an ex-perimental campaign where those factors are tested at di�erent levels. �e de�nitionof the DOE is the result of a series of strategic decisions leading to decide the wholeexperimental procedure, taken as follows:
1. De�nition of the factors of study and the response variables on which resultsshall be evaluated.
2. Layout of the experimental plan that shows the order of the di�erent tests tobe undertaken. �is plan is usually represented in an array, in which each rowcorresponds to a “run”, or a single experimental execution where the factors ofstudy are combined conveniently.
3. �anti�cation of the response variables and statistical data analysis.
�e variety of methods to de�ne the experimental campaign introduces a highvariability in the second step. �e most simple –and rudimentary– approach to DOE,delivering the biggest volume of data, is a factorial design. However, it is only ma-terially feasible if the number of levels or factors are low, or, as unusual as it is, theavailable time and budget are enough to extend the experimental phase inde�nitely.Complex studies, seeking comprehensive interpretations of the case study, such asthe one tackled in this dissertation, do not allow the performance of factorial designs.For that reason, an alternative strategy, namely fractional experimental design, canbe followed to reduce the number of experiments, as is presented below.
4.1.1 Fractional design of experiments
Given the described circumstance, an alternative fractional design of experiments(FDOE) can be proposed to reduce the number of tests without losing considerableamount of information. �at reduction in evidence of the variation of the responsevariable a�ects �rst to high-order interactions between factors, then second orderinteractions, and, in an extreme case, to the factors itself. Meaning that, the risks of
74

4.1. EXPERIMENTAL DESIGN
using a too restrictive FDOE are (1) losing the capability of explaining non-linearitiespresent in the system, and, (2) not being able to de�ne the model itself. �at beingthe price to pay to reduce the number of experimental repetitions, FDOE are highlyextended and are usually chosen to tackle with research activities, as the e�ect ofinteractions is usually less relevant than the e�ects of �rst degree factors.
Now the question is, what experiments are to be removed form the complete fac-torial array to generate a reduced experimental plan from which drawing valuableconclusions? One could intuitively think that the design of the experimental plancannot be randomly performed. Indeed, it depends on the number and nature of theactions, understanding by action any factor –�rst degree– or interactions –secondand higher degrees– included in the model. To answer that question, it is necessaryto consider that FDOE arrays must comply with two main properties, as explainedbelow [111]:
• Condition 1. Su�cient degrees of freedom. �e number of experimentscomposing the FDOE must be high enough to obtain all the coe�cients tak-ing part of the linear model associated to the system of study. �erefore, as anaction is introduced into the case study, the total number of tests required toevaluate the in�uence of all actions on the response variable increases accord-ing to the degrees of freedom introduced by the new action. In practice, thiscondition establishes the minimum number of experiments to be executed tohave enough information to complete the model.
• Condition 2. Orthogonality. �e condition for the orthogonality of a FDOEas a whole is satis�ed if each pair of uncoupled actions included in the modelare also orthogonal. �erefore, its assessment is reduced to a two-by-two anal-ysis of actions that do not have factors in common. �at condition is invariablyful�lled for each pair of individual factors, but not so when interactions are in-cluded in the model. A pair of uncoupled actions are orthogonal if each levelof the �rst one is combined the same number of times with the levels of theother, along the whole experimental array. �e orthogonality condition guar-antees that the e�ect of all actions can be analysed independently from theother ones.
�e described conditions are necessary and su�cient to validate a FDOE as aproper method to conduct an e�ective study. Although their application and cal-culation might seem complicated, FDOE arrays are usually prede�ned as a result
75

CHAPTER 4. DESCRIPTION OF THE EXPERIMENTAL METHODOLOGY
of decades of experimentation with this kind of arrays, and can be chosen from agreat variety of literary sources. In fact, the strategies to reduce experimental plan tofractional designs are numerous. For this thesis, a Taguchi DOE approach has beenselected [142]. Before detailing the construction and selection of the experimentalarray, the factors to be included in the model are de�ned in the next subsection.
4.1.2 Factors included in the study
�e de�nition of the actions of interest, along with the levels that shall be object ofstudy, is necessary to elaborate the experimental array, as the degrees of freedom to becovered by experimental results depend on them. Five di�erent factors are establishedas object of study of this dissertation. �ey have been chosen at sight of the analysisof previous ball burnishing results presented in the state of the art revision. �e �vefactors are explained along the following paragraphs.
Preload force – Fp �e burnishing force, 𝐹𝑏, is the physical driver that describesthe interaction between the burnishing ball, and the target surface. As was describedat the previous chapter, during ultrasonic burnishing, 𝐹𝑏 is the result of overlappingan oscillating force 𝐹𝑣 to the preload. According to the characterisation tasks ex-plained in the precedent chapter, that preload, 𝐹𝑝 can be changed through the springcompression length, whereas the value of 𝐹𝑣 is constant regardless of the preloadlevel. �ese regulation operations are commanded by the NC programme, by select-ing the appropriate negative 𝛥𝑧 coordinate to compress the spring to the desiredvalue.
Number of passes – np Total successive iterations performed during the burnish-ing operation on a speci�c surface position. If the interaction of the burnishing ballwith the surface was ideally imagined as a line, this parameter represents the num-ber of times that this line is traced on that position. �erefore, the higher its value,the more plastic deformation would be a�ained through burnishing. It must not bemistaken with the number of lines necessary to cover the whole surface dimension,which would be also dependent on the lateral o�set taken between passes. �e tra-jectory through which these passes are executed is described through the Strategyparameter, which is explained below.
76

4.1. EXPERIMENTAL DESIGN
Feed – vf Linear velocity at which the tool is linearly translated over the surface.It is easily commanded through the NC code. �erefore, it corresponds to the con-ventional feed in a milling operation, with mm/min units.
Original surface topology – S0 �e in�uence of the initial surface texture onthe burnishing results is of high interest, to associate the e�ectiveness of the processwith a certain �nishing degree achieved through machining. To that purpose, threedi�erent surfaces are to be tested. All of them shall be machined by ball-end millingoperations with a hemispherical milling tool with a TiN coating. �e ball-end strategyconsists on following adjacent passes with the hemispherical milling tool. To varythe levels of this parameter, the o�set distance between passes is increased from onestrategy to the other, as shall be explained below.
Strategy – St. �is parameter describes the trajectory followed by the burnishingball to cover the whole target surface 𝑛𝑝 times. �e resulting strategies have beendeveloped by combining di�erent burnishing directions and protocols to cover thepreviously burnished areas. �ey are represented in Figure 4.1. First passes are in allcases performed perpendicular to the initial milling direction, hence its denomina-tion as main burnishing direction. �e “0” strategies are contemplated always alongthat direction, “0” denoting no angular change in the trajectory between passes. Al-ternatively, the “90/0” strategy is based on turning alternatively ±90○ the burnishingdirection between one pass and the next one. As for the relative order between lat-eral o�set and number of passes, the “bn” strategies cover 𝑛𝑝 times the whole targetpatch, whereas the “nb” strategy is performed by passing 𝑛𝑝 times one line, and thentaking the lateral pass until covering the whole target patch. By choosing these threestrategies, the eventual in�uence of direction change during burnishing, as well asthe e�ects of passing repeatedly on the same burnishing path, must be detected.
All strategies are executed according to a succession of linear interpolations de-�ned in di�erent NC codes wri�en with that aim, and coded through capital le�ersas represented in Table 4.1. �e combination of di�erent 𝑛𝑝–St. pairs originates var-ious burnishing pa�erns in the experimental array. For instance, the pair 3passes–bn90/0 covers the target surface through two complete passes along direction I, andone along II between both of them, and corresponds to tests #6, #14 and #22 1. Alltests performed by 1 pass do not include further passes, and are therefore not a�ected
1“#” shall denote henceforth the number of test in the Taguchi experimental array
77

CHAPTER 4. DESCRIPTION OF THE EXPERIMENTAL METHODOLOGY
Figure 4.1. Burnishing strategies included in the DOE and nomenclature of the directionsreferenced in the text.
by the strategy. �ese are all coded by le�er A. All seven codes were parametrised tofacilitate the implementation of the feed and preload for each test.
Table 4.1. NC codes for every absolute strategy pa�ern resulting from the combination ofthe 𝑛𝑝 and St. factors. In brackets the Taguchi run in which they are to be executed.
𝑛𝑝St. 1 3 5nb0 A (#1,#12,#20) B (#5,#13,#24) C (#9,#17,#25)bn90/0 A (#2,#10,#21) D (#6,#14,#22) E (#7,#18,#26)bn0 A (#3,#11,#19) F (#4,#15,#23) G (#8,#16,#27)
�e response variables that are going to be considered to assess the e�ects of thesefactors on the material are di�erent parameters describing the surface topology andresidual stress along the two main directions of the surface. �ese variables shall bediscussed in upcoming sections.
4.1.3 Taguchi array
To implement the experimental plan according to the factors of interest, an L27 (313)Taguchi orthogonal array was chosen. Appendix A shows the whole matrix and itsparticularisation to the materials on which it shall be applied. �is con�gurationallows the analysis of a maximum of 13 factors at 3 levels. However, as only 5 factorsare to be included in the model, a large amount of degrees of freedom provided by the
78

4.1. EXPERIMENTAL DESIGN
array are unused, making possible the inclusion of three di�erent interactions amongcoupled factors in the model. �e derived experimental design based is proposed asa linear graph in Figure 4.2, and shall be proved valid below.
Figure 4.2. Linear graph associated to the L27 Taguchi array. Balls: factors. Lines: interac-tions.
To avoid aliasing e�ects among factors and interactions, these were located in theTaguchi array at the columns indicated in the linear graph. �is procedure is stan-dardised, and can be consulted at Taguchi et al. (2005) [142]. �e �nal experimentalarray is represented in Table 4.2.
�is L27 array is executed twice on both target materials, once with the VABB pro-cess, and the second one by executing the NVABB operation, to establish a compara-tive point. An overview of a standard workpiece, along with the reference directionsconsidered in the dissertation, is represented at Figure 4.3.
�e con�rmation of the orthogonality and su�cient degrees of freedom condi-tions that were presented as necessary to validate the simpli�cation of the experi-mental design provided by the L27 array is explained in Appendix A.
4.1.4 Particular DOE arrays for the studied materials
�e methodology for experimental design exposed during the previous section wasparticularised for both chosen materials. As both of them exhibit di�erent mechan-ical behaviour, the preload as main deforming source, was determined at sight ofbibliographical review [117, 150] and a preliminary set of tests performed on bothmaterials to con�rm the deformation a�er those preload levels. �e rest of the pa-rameters were common for both the AISI 1038 and Ti-6Al-4V experimental execution.Table 4.3 shows the factors and levels which have been applied for the burnishing ofthe AISI 1038 surface.
79

CHAPTER 4. DESCRIPTION OF THE EXPERIMENTAL METHODOLOGY
Table 4.2. Experimental design derived from a 𝐿27(313) Taguchi orthogonal array.
Col. 1 2 5 10 12No. 𝐹𝑝 𝑛𝑝 𝑣𝑓 𝑆0 St.1 1 1 1 1 12 1 1 2 2 23 1 1 3 3 34 1 2 1 2 35 1 2 2 3 16 1 2 3 1 27 1 3 1 3 28 1 3 2 1 39 1 3 3 2 110 2 1 1 3 211 2 1 2 1 312 2 1 3 2 113 2 2 1 1 114 2 2 2 2 215 2 2 3 3 316 2 3 1 2 317 2 3 2 3 118 2 3 3 1 219 3 1 1 2 320 3 1 2 3 121 3 1 3 1 222 3 2 1 3 223 3 2 2 1 324 3 2 3 2 125 3 3 1 1 126 3 3 2 2 227 3 3 3 3 3
�e 𝑆0 must be object of further explanation. Although this factor is de�ned inthe DOE through three levels common to both materials, the respective three initialtextures shall predictably di�erent between both tested materials. Indeed, they shallbe determined as a consequence of the machining process, by changing the lateralo�set between every hemispherical tool passes.
�e whole experimental array for both materials can be consulted in Appendix A.According to the provided materials, and the required high number of repetitions, a
80

4.1. EXPERIMENTAL DESIGN
Figure 4.3. Schematic representation of the VABB (non-contoured yellow patches) andNVABB (contoured blue patches) tests performed on a general workpiece and reference di-rections considered in this work.
layout was proposed and planned before the execution for both surfaces. �is plan isshown at Figure 4.4.
4.1.5 Unvaried process factors
�e factors of study were varied along the di�erent tests as the Taguchi array de-scribes. However, there are some parameters that, while being eligible to be varied asprocess factors, were kept constant for all tests. �ese factors, along with other un-varied process descriptors, are included in Table 4.4. �e burnishing ball material anddiameter have been chosen to give continuity to the experimental execution followedin previous studies of our research group [43, 148].
�e determination of a �xed lateral pass width was the result of a combination ofdi�erent criteria, described as follows. As was described in the state of the art chap-ter, this value must be low small enough, not to leave any non-deformed material onthe surface, regardless of the productivity loss that could be caused by taking a toolow value. For that reason, a conservative value was chosen and kept constant for alltests, to discard it as a variability source. In the case of the AISI 1038 material, pre-vious studies by Gomez-Gras et al. (2014) [45] recommended 0.36 mm as lateral pass
81

CHAPTER 4. DESCRIPTION OF THE EXPERIMENTAL METHODOLOGY
Table 4.3. Factors and levels at the Taguchi array for AISI 1038 and Ti-6Al-4V specimens.
LevelsFactors Material 1 2 3
𝐹𝑝 (N) AISI 1038 90 180 270Ti-6Al-4V 150 250 350
𝑛𝑝 both 1 3 5𝑣𝑓 (mm/min) both 300 600 900𝑆0 both 1 2 3St. both bn0 bn90/0 nb0
Table 4.4. Descriptors and factors kept constant in the tests.
Factor Valuelateral pass width 0.3 mmburnishing ball diameter ∅10 mmball material 60Cr3 hardened chromium steellubrication none
width for 90 N of preload. Consequently, a conservative value of 0.3 was taken. Onthe other hand, as no bibliographical data was identi�ed for the Ti-6Al-4V material, apreliminary experimental test was performed on a milled surface. Burnishing tracksapplying di�erent preloads and number of passes were performed, and the resultingpro�les were acquired and measured through an ALICONA In�nite Focus optical pro-�lometer, as exempli�es Figure 4.5. �e lowest imprint width was 0.732 mm, obtainedby applying 150 N, proving that 0.3 mm was also a valid lateral pass width for thismaterial.
4.1.6 Results assessment through Analysis of Variance
�e methodology associated to the analysis of the Taguchi experimental setup con-templates the calculation and analysis of the results through two di�erent approaches:
• �antifying the mean e�ects that all actions (factors and interactions) have onthe selected response variables.
• Evaluating the robustness of the actions associated to each response variable.
�e parameter used to evaluate the robustness of a factor used in the Taguchi sys-tem is the signal-to-noise ratio (S/N) . Robustness refers to the neutralisation of the
82

4.1. EXPERIMENTAL DESIGN
Figure 4.4. Planned experimental tests represented on the three di�erent machined 𝑆0.Striped patches: VABB tests. a. AISI 1038. b. Ti-6Al-4V.
e�ect of noise e�ects in the response, and is included in the Taguchi analysis becauseit is a fundamental aspect contained in its quality approach. �e Taguchi experimen-tal design focuses on achieving a desired response goal while minimising the varianceof that response, that is, maximising its robustness. As S/N is an input-to-output rela-tionship, it should be maximised. �is perspective is based on the idea that a certainproduct or process should always respond the same way to an external signal. In ourcase, when a certain combination of burnishing parameters is applied on a workpiece,the process should always derive in the same result. Its calculation depends on theobjective with regards to the response variable, according to the desired e�ect on the
83

CHAPTER 4. DESCRIPTION OF THE EXPERIMENTAL METHODOLOGY
Figure 4.5. Measurement of burnished track width on Ti-6Al-4V applying 150 N.
response variable, as shows Table 4.5
Table 4.5. Calculation of the signal-to-noise ratio in function of the goal of the experiment.
S/N Goal Expression
Larger is be�er Maximise response −10 log (∑1
𝑌 2
𝑁 )
Smaller is be�er Minimise response −10 log (∑ 𝑌 2
𝑠2 )
𝑌 : responses for the given factor level combination,𝑁 : number of responses in the factorlevel combination, 𝑠: standard deviation of the responses for a given factor combination.
To analyse the in�uence of all factors on the response variables and the robustnessassociated to them, the results linked to a Taguchi experimental array can be assessedthrough an analysis of variance technique (ANOVA) . �e purpose of ANOVA appliedto experimental design analysis, is to compare the e�ect of single factors and interac-tions which are applied simultaneously on the response variable. �erefore, it allowsthe di�erentiation of the e�ects of the actions of interest from the residual varia-tion, or noise. In other words, the ANOVA table delivers a hierarchy of the di�erentsources of variation of the response variable. If all the observed means, i.e. the resultfor each run, are close together, then the di�erences between them can be a�ributedto residual variation. If, on the contrary, they are dispersed, then there is a reason
84

4.2. MEASUREMENT OF THE SURFACE INTEGRITY PARAMETERS
to believe that the e�ects of di�erent treatments are signi�cantly di�erent becauseof the application of di�erent levels. �e problem can be formulated as a hypothesistest: )⌉⌉⌋⌉⌉]
𝐻0 ∶ 𝜇1 = ... = 𝜇𝑖 = ... = 𝜇𝑐𝐻1 ∶ 𝜇𝑖 ≠ 𝜇𝑗 𝑓𝑜𝑟 𝑠𝑜𝑚𝑒 𝑖 ≠ 𝑗
(4.1)
where 𝜇𝑖 is the mean response for observation 𝑖.
�e null hypothesis can be rejected if the p-value associated to it a�er the test ishigher than a pre�xed level of signi�cance, 𝛼, in which case the null hypothesis canbe rejected, and one can assume that the variation of the response is not caused by avariation of the related action. All ANOVA calculations shall be performed with theso�ware Minitab 18.
4.2 Measurement of the surface integrity parame-ters
4.2.1 Acquisition of topological data
As explained in chapter 2, the evaluation of surface texture using two-dimensionalparameters can be a biased and incomplete approach to assess VABB results. Withthe advances in surface metrology measurement, a new set of 3D parameters wasprogressively introduced to describe mathematically the nature of engineering sur-faces [21]. Nowadays, optical systems allow the transformation of a surface into amathematical function which assigns one height value to each sampled point (Fig-ure 4.6). �e publication of the ISO 25178 standard o�ered a wide set of tools toconvert that mathematical function into functional descriptors grouped in two maincategories, namely the 12 S parameter and the 13 V parameter sets [67].
To perform the calculation of those parameters, the sampled surface must be ini-tially processed by establishing a reference plane, obtained through least squares[25]. Let 𝑧(𝑥𝑖, 𝑦𝑗) be a 3D equispaced sampled surface, formed by a set of points𝑥𝑖 = 𝑖𝛥𝑥 ∶ 𝑖 = 1,2, ...,𝑀 , and 𝑦𝑗 = 𝑗𝛥𝑦 ∶ 𝑗 = 1,2, ...,𝑁 , being 𝛥𝑥 and 𝛥𝑦 the sam-pling intervals, and 𝑀 and 𝑁 the number of sampling points along the 𝑥 and 𝑦 axis,respectively. A least squares mean plane 𝑓(𝑥, 𝑦) calculated on the aforementioneddataset is calculated, and shall serve as the reference datum, so that all parameters
85

CHAPTER 4. DESCRIPTION OF THE EXPERIMENTAL METHODOLOGY
Figure 4.6. Sampled 3D surface transformed into a height function. A�er Dong et al., 1992[23]
are calculated on the resulting surface 𝜅(𝑥, 𝑦), calculated as follows:
𝜅(𝑥, 𝑦) = 𝑧(𝑥𝑖, 𝑦𝑗) − 𝑓(𝑥𝑖, 𝑦𝑗) (4.2)
4.2.1.1 S parameter set
�e �rst descriptor set that allows the exploitation of the topological data deliveredby the 𝜅(𝑥, 𝑦) dataset, is composed by the 12 S parameters. Table 4.6 summarises themathematical expressions that lead to their calculation. �e interpretation of eachparameter is developed along the following paragraphs.
4.2.1.2 S amplitude parameters
�ey represent statistical characteristics of the surface height distribution, the scaleof the irregularities, and the extreme points it presents. Due to their de�nition, allof them have a corresponding analogous parameter de�ned in 2D, calculated fromthe linear height distribution. Both the average surface texture, 𝑆𝑎, and the RMSheight, 𝑆𝑞, are related to the scale of the surface texture, as already presented abovefor their two-dimensional counterparts. 𝑆10𝑧 represents the amplitude of maximumdeviations.
�e skewness and kurtosis are actually de�ned in statistical analysis as the 3𝑟𝑑 and4𝑡ℎ order central moments of the surface (Table 4.7). According to this de�nition, theRMS parameter is actually the second central moment, hence the statistical relevancealready a�ributed to this parameter in detriment of 𝑆𝑎.
86

4.2. MEASUREMENT OF THE SURFACE INTEGRITY PARAMETERS
Table 4.6. 12 S parameter set for surface topography assessment, as de�ned in the ISO 25178.
Amplitude
Root mean square height 𝑆𝑞 =⌉
(1
𝑀𝑁 ∑𝑁𝑗=1∑
𝑀𝑖=1 𝜂2(𝑥𝑖, 𝑦𝑗))
Skewness 𝑆𝑠𝑘 =1
𝑀𝑁𝑆3𝑞∑𝑁𝑗=1∑
𝑀𝑖=1 𝜂3(𝑥𝑖, 𝑦𝑗)
Kurtosis 𝑆𝑘𝑢 =1
𝑀𝑁𝑆4𝑞∑𝑁𝑗=1∑
𝑀𝑖=1 𝜂4(𝑥𝑖, 𝑦𝑗)
Arithmetical mean height 𝑆𝑎 =1
𝑀𝑁 ∑𝑁𝑗=1∑
𝑀𝑖=1 ⋃ 𝜂(𝑥𝑖, 𝑦𝑗) ⋃
Ten-point height 𝑆10𝑧 =15(∑
5𝑘=1 ⋃ 𝜂𝑠𝑖 ⋃ +∑
5𝑘=1 ⋃ 𝜂𝑣𝑖 ⋃)
Maximum peak height 𝑆𝑝 =max{𝜂(𝑥𝑖, 𝑦𝑗)}
Maximum pit height 𝑆𝑣 =min{𝜂(𝑥𝑖, 𝑦𝑗)}
Spatial
Fastest decay autocorrelation length 𝑆𝑎𝑙 =min{⌉
𝑡2𝑥 + 𝑡2𝑦} ∶𝐴𝐴𝐶𝐹 (𝑡𝑥, 𝑡𝑦 ≤ 0.2)
Texture aspect ratio 𝑆𝑡𝑟 =min{
⌉
𝑡2𝑥 + 𝑡2𝑦}
max{⌉
𝑡2𝑥 + 𝑡2𝑦}
Hybrid
Root mean square gradient
𝑆𝑑𝑞 =
⟨
⧸⧸⧸⟩∑𝑁−3𝑗=4 ∑
𝑀−3𝑖=4 (
𝜅(𝑥𝑖+1,𝑦𝑗)−𝜅(𝑥𝑖,𝑦𝑗)𝛥𝑥 )
2+ (
𝜅(𝑥𝑖,𝑦𝑗+1)−𝜅(𝑥𝑖,𝑦𝑗)𝛥𝑦 )
2
(𝑁 − 6)(𝑀 − 6)
Developed interfacial area ratio
𝑆𝑑𝑟 =∑𝑁−1𝑗=1 ∑
𝑀−1𝑖=1
{
1 + (𝜅(𝑥𝑖+1,𝑦𝑗)−𝜅(𝑥𝑖,𝑦𝑗)
𝛥𝑥 )
2+ (
𝜅(𝑥𝑖,𝑦𝑗+1)−𝜅(𝑥𝑖,𝑦𝑗)𝛥𝑦 )
2
(𝑁 − 1)(𝑀 − 1)− 1
Miscellaneous
Texture direction 𝑆𝑡𝑑 Angle of texture’s main direction
Table 4.7. Central moments of a surface height distribution. A�er King & Davis (1982) [69]
Function Order Statistical descriptor
𝜇𝑛 = ∫−∞∞ 𝑦𝑛 𝑑𝑦
2 Root mean square3 Skewness4 Kurtosis
87
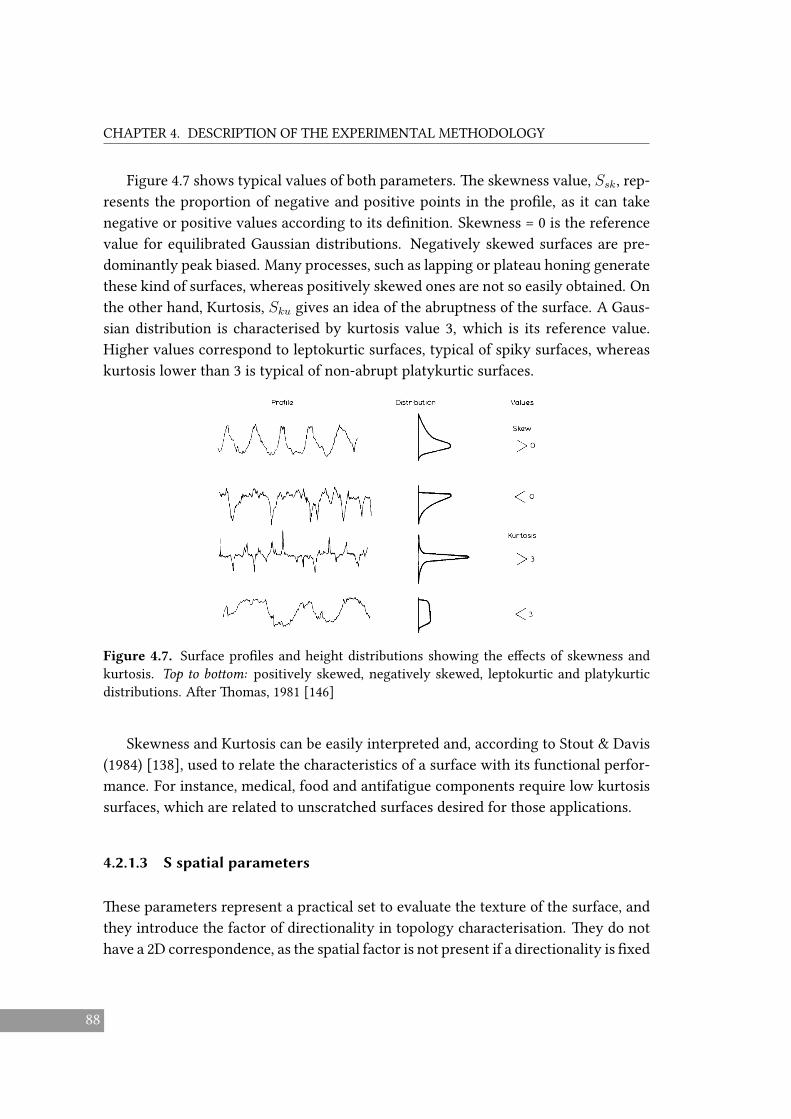
CHAPTER 4. DESCRIPTION OF THE EXPERIMENTAL METHODOLOGY
Figure 4.7 shows typical values of both parameters. �e skewness value, 𝑆𝑠𝑘, rep-resents the proportion of negative and positive points in the pro�le, as it can takenegative or positive values according to its de�nition. Skewness = 0 is the referencevalue for equilibrated Gaussian distributions. Negatively skewed surfaces are pre-dominantly peak biased. Many processes, such as lapping or plateau honing generatethese kind of surfaces, whereas positively skewed ones are not so easily obtained. Onthe other hand, Kurtosis, 𝑆𝑘𝑢 gives an idea of the abruptness of the surface. A Gaus-sian distribution is characterised by kurtosis value 3, which is its reference value.Higher values correspond to leptokurtic surfaces, typical of spiky surfaces, whereaskurtosis lower than 3 is typical of non-abrupt platykurtic surfaces.
Figure 4.7. Surface pro�les and height distributions showing the e�ects of skewness andkurtosis. Top to bo�om: positively skewed, negatively skewed, leptokurtic and platykurticdistributions. A�er �omas, 1981 [146]
Skewness and Kurtosis can be easily interpreted and, according to Stout & Davis(1984) [138], used to relate the characteristics of a surface with its functional perfor-mance. For instance, medical, food and antifatigue components require low kurtosissurfaces, which are related to unscratched surfaces desired for those applications.
4.2.1.3 S spatial parameters
�ese parameters represent a practical set to evaluate the texture of the surface, andthey introduce the factor of directionality in topology characterisation. �ey do nothave a 2D correspondence, as the spatial factor is not present if a directionality is �xed
88

4.2. MEASUREMENT OF THE SURFACE INTEGRITY PARAMETERS
by a certain sampling line. �ey are calculated according to an areal autocorrelationfunction of the sampled surface, AACF , which describes the dependence of the heightdata at one position on the values at another position of the same dataset [26].
)⌉⌉⌉⌉⌉⌉⌉⌋⌉⌉⌉⌉⌉⌉⌉]
𝐴𝐴𝐶𝐹 (𝑡𝑖, 𝑡𝑗) =1
(𝑀 − 𝑖)(𝑁 − 𝑗)∑𝑁−𝑗𝑙=1 ∑
𝑀−𝑖𝑘=1 𝜂(𝑥𝑘, 𝑦𝑙)𝜂(𝑥𝑘+𝑖, 𝑦𝑙+𝑗)
𝑖 = 0,1, ...,𝑚 <𝑀 ; 𝑗 = 0,1, ..., 𝑛 < 𝑁𝑡𝑖 = 𝑖𝛥𝑥; 𝑡𝑗 = 𝑗𝛥𝑦
(4.3)
where𝑚 and 𝑛 are the maximum numbers of the autocorrelation lengths in the 𝑥 and𝑦 directions, respectively, and 𝑀 and 𝑁 are the number of sampled points along 𝑥and 𝑦.
�e parameter 𝑆𝑎𝑙 represents the shortest distance in which the value of the AACFdecays under a threshold, normally 0.2. Large values of this parameter represent sur-faces dominated by low frequency components, that is, the surface features are re-peated along longer distances, and, therefore, are characterised by high scale featuresand irregularities. On the other hand, the 𝑆𝑡𝑟 parameter is useful to identify the exis-tence of a preferential texture pa�ern. �is ratio ranges between 0 and 1, being 0 forsurfaces who show strong anisotropy, that is, an outstanding preferential direction inthe texture.
4.2.1.4 S hybrid and miscellaneous parameters
�ese parameters combine spatial and amplitude features of the surface, by evaluat-ing the degree of heterogeneity of the average slope shown by the surface features.𝑆𝑑𝑟 represents the ratio of the increment of interfacial area of a surface over the �atsampling area. Large values of the developed interfacial area are related to roughsurfaces. �erefore, its value tends to 0 as the surface presents a state nearer from a�nishing. Super�nished surfaces usually show values smaller than 1%, which is thevalue usually taken as reference. Alternatively, 𝑆𝑑𝑞 calculates the root mean square ofthe surface slope within the sampling area. Whereas 𝑆𝑑𝑟 has an intuitive de�nition,𝑆𝑑𝑞 has a strongest statistical meaning. However, both parameters provide similarinformation about the �nishing state of the surface.
On the other hand, the 𝑆𝑡𝑑 miscellaneous parameter is the value of the angle thatindicates the main direction of the surface features with respect to the 𝑦 axis. �ere-
89

CHAPTER 4. DESCRIPTION OF THE EXPERIMENTAL METHODOLOGY
fore, it is useful in highly anisotropic surface that show a preferential texture direc-tion.
4.2.1.5 V parameter set
�e complementary 13 V parameter set (Table 4.8) is actually an evolution of the cal-culations proposed by Abbo�-Firestone [1], by expanding their de�nition of bearing-area curve to a three-dimensional height dataset. �e parametrisation of the bearingcurve help to assess the topological features of a surface, while allowing the system-atisation of the analysis of the curve by reducing it to a few parameters, which canbe subsequently divided into two main groups. First, the amplitude descriptive pa-rameters that represent the main geometrical features of the surface. Secondly, thevolumetric parameters (void and material volumes), which are used to adopt a func-tional perspective of the height distribution of a surface, as the peak zone is associatedto the material which shall eventually be the initial recipient of running-in wear, thecore corresponds to the stationary bearing material, and the valley zone is related tothe surface capability for lubricant retention and debris evacuation [67].
�e approach of dividing the material into peak, core and valley zones requiresa systematic method to establish the di�erence. In this dissertation, the ISO 13565-2method is used. It is based on tracing a line secant to the Abbo�-Firestone (AF) curvewith the lowest gradient, with the restriction that the points de�ning the line mustspan 40% of bearing area percentage (𝑥 axis). Its intersection with the 𝑦 axis de�nesthe peak, core and valley areas, as is shown in Figure 4.8 [68].
Figure 4.8. Main V parameters related to the bearing area curve, represented in 2D. Extrap-olation to 3D can be easily visualised.
90

4.2. MEASUREMENT OF THE SURFACE INTEGRITY PARAMETERS
Table 4.8. �e 13 V parameter set, as de�ned in the ISO 25178.
Name and symbol De�nitionAreal parameters
Core distance 𝑆𝑘 Distance between highest and lowest level of coreReduced peak height 𝑆𝑝𝑘 Average height of protruding peaks above the coreReduced valley height 𝑆𝑣𝑘 Average height of protruding valleys below the corePeak material ratio 𝑀𝑟1 Ratio of the area which separates the peak and the coreValley material ratio 𝑀𝑟2 Ratio of the area which separates the core and the valleyPlateau root meansquare deviation
𝑆𝑝𝑞 Slope of linear regression on the plateau region
Dale root mean squaredeviation
𝑆𝑣𝑞 Slope of linear regression on the valley region
Relative material ratio 𝑆𝑚𝑞 Peak-to-valley material ratio
Void volumes
Valley void volume 𝑉𝑣𝑣 Void volume in the valleysCore void volume 𝑉𝑣𝑐 Void volume in the core material
Material volumes
Peak material volume 𝑉𝑚𝑝 Material volume in the peaksCore material volume 𝑉𝑚𝑐 Material volume in the core material
Other
Peak extreme height 𝑆𝑥𝑝 Di�erence of heights at the average plane and peaks onthe surface a�er especially high peaks on the surface areremoved
4.2.1.6 Surface registration and influence of the acquired surface size
�e burnishing patches derived from all tests were registered by an ALICONA In�niteFocus device. �is device is able to register the topology of a surface by successiveimage acquisition along the vertical direction, without contact with the surface. Itsfunctioning principle is focus variation achieved at di�erent heights, assisted by acoaxial LED ring light, that assigns a height coordinate depending of the focal distancefor each measured point. �e 10x objective was used to perform this acquisition,delivering to the system a 100 nm vertical resolution.
In order to homogenise the measurement and discarding edge e�ects that could
91

CHAPTER 4. DESCRIPTION OF THE EXPERIMENTAL METHODOLOGY
eventually distort the measurement, only the central areas of the burnishing patcheswere acquired. However, as standards do not de�ne the exact area that guaranteesan unambiguous characterisation of the target surface, a preliminary study was per-formed on the 𝑆0
1 , 𝑆02 and 𝑆0
3 machined surfaces (Figure 4.3), to determine the optimalsize of the target area to be acquired. �is operation was necessary in order to min-imise the acquisition time of all burnishing surfaces, while not losing valuable dataor aliasing the measurements for ulterior topological analysis.
As all three machined topologies consist on a highly periodic pa�ern formed byalternated peaks and valleys, it was decided to adjust the dimensions of each patch toinclude an integer value of coupled peak&valley pairs (henceforth P&V) . Due to thevariation in the scale of topology features, this strategy involved capturing di�erentsizes for each P&V set depending on the surface, as shows Figure 4.9.a.
(a)
(b)
Figure 4.9. Evolution of some S parameters with respect to the sampling size. a. 𝑆𝑠𝑘 and𝑆𝑘𝑢. b. 𝑆𝑞 and 𝑆𝑧10.
92

4.2. MEASUREMENT OF THE SURFACE INTEGRITY PARAMETERS
Table 4.9. Errors calculated from the repeatability of S parameters on the machined surfaces.
𝑆𝑞 (µm) 𝑆10𝑧 (µm) 𝑆𝑠𝑘 𝑆𝑘𝑢 𝑆𝑝 (µm) 𝑆𝑣 (µm) 𝑆𝑑𝑞 𝑆𝑑𝑟(%)
𝑆01
Av. 5.163 22.985 0.155 1.681 14.834 9.210 0.141 0.983St.Dev. 0.143 2.642 0.009 0.050 2.001 0.453 0.006 0.077Error 2.78% 11.49% 5.47% 2.94% 13.49% 4.92% 4.37% 7.80%
𝑆02
Av. 8.165 39.175 -0.058 1.814 38.0764 14.912 0.155 1.158St.Dev. 0.055 3.298 0.006 0.026 9.830 0.433 0.005 0.049Error 0.68% 8.42% 10.48% 1.45% 25.82% 2.90% 3.15% 4.19%
𝑆03
Av. 11.052 46.625 0.266 1.771 33.687 18.979 0.128 0.767St.Dev. 0.106 4.433 0.018 0.035 4.813 1.378 0.004 0.039Error 0.96% 9.51% 6.58% 1.95% 14.29% 7.26% 2.73% 5.09%
Whereas the 𝑆𝑠𝑘 and 𝑆𝑘𝑢 of the surfaces show stability for all sampling sizes, theevolution of 𝑆𝑞 shows that the surfaces de�ned by larger features require larger areasto be fully characterised (Figure 4.9.a). For instance, 𝑆0
1 shows the same 𝑆𝑞 value forall sizes, so that 2 P&V, –that is, a 1 × 1 mm2 surface– represent su�ciently the wholesurface. On the contrary, a surface similar to type 𝑆0
3 , more abrupt, must be at leastdescribed by 6 P&V, or a 6.8 × 6.8 mm2 surface. �at is the value from which 𝑆𝑞stabilises and shows no variation with the sampling size.
Unlike the second, third and fourth moments of the surface, the𝑆10𝑧 extreme valuedoes not show any signal of stabilisation, as it increases as the surface size grows. �ise�ect is not atypical for this parameter, as explain Dong et al. (1994) [25]. Indeed, dueto the fact that the summit heights are calculated by algorithms that depend on theevolution of the slope of the surface, so that atypical values can be discarded, they aresensitive to the sampling interval. �erefore, as that interval increases, the thresholdto de�ne a characteristic peak point increases, and the value of 𝑆10𝑧 grows naturally.
At sight of the results, it is decided to take patches containing 6 P&V sets forall surfaces. A second measuring phase was carried out, by registering the threeinitial topologies �ve times at di�erent positions of the whole machined surface. �edescriptors measured at all patches were averaged, and the error associated to theirrepeatability was calculated (Table 4.9). For instance, the average value of𝑆𝑘𝑢 for𝑆0
1 is1.6816 µm, with a standard deviation of 0.0494 µm. �at represents an error of 2.94%in terms of repeatability. �is error is enclosed between 1.5% and 3% for all initialstates. �ere is not an increase of error as the surface present more abrupt features,thus allowing the validation of the selected approach to perform the measurements.
All amplitude parameters show acceptable low error values, while, on the con-
93

CHAPTER 4. DESCRIPTION OF THE EXPERIMENTAL METHODOLOGY
trary, extreme parameters 𝑆10𝑧 , 𝑆𝑝 and 𝑆𝑣 present a lower repeatability. �is observede�ect can be understood from the way these values are de�ned, their sensitivity withregards to the sampling area, and their higher dependence of extreme values whichcan be inconspicuously present as anomalous values in a certain acquired surface.Consequently, these extreme parameters must be taken carefully into considerationin the topological analysis to come.
4.2.1.7 Retained topological parameters from the S set
Given the high amount of 2D and 3D parameters available to describe the surface,it is worth reconsidering the possibility of discriminating parameters that might beredundant with regards to others, or that do not deliver any valuable information tothe system of study. Table 4.10 shows the selected parameters for each surface feature.
Table 4.10. Retained topological parameters from the S set.
Surface feature Retained parameter Rejected parametersAmplitude – scale 𝑆𝑞 𝑆𝑎Amplitude – extreme points 𝑆10𝑧 𝑆𝑝, 𝑆𝑣Spatial 𝑆𝑎𝑙, 𝑆𝑡𝑟 –Hybrid 𝑆𝑑𝑞 𝑆𝑑𝑟Miscellaneous 𝑆𝑡𝑑 –
�e mean square surface texture 𝑆𝑞 shall be preferred over the average one 𝑆𝑎as the general amplitude descriptor of the surface �nishing. As already explained, itcan be consistently framed in the statistical analysis to be performed. Furthermore,King & Spedding (1982) [69] proved that both parameters were proportional to oneanother. Skewness and Kurtosis shall also be considered in the results discussion, fortheir uniqueness in surface characterisation. As for the extreme value parameters,𝑆10𝑧 is preferred over the peak and valley extreme values 𝑆𝑝 and 𝑆𝑣.
�e spatial and miscellaneous parameters, that is, 𝑆𝑎𝑙, 𝑆𝑡𝑟 and 𝑆𝑡𝑑, are also keptfor analysis. However, not both hybrid parameters are required, for they give similarinformation about the surface, that is, its proximity to a �nishing state. As the errorassociated to repeatability of both parameters is similar, it is decided to keep 𝑆𝑑𝑞, dueto its scale proximity to 𝑆𝑡𝑟, that facilitates further representation. All these parame-
94

4.2. MEASUREMENT OF THE SURFACE INTEGRITY PARAMETERS
ters shall be completed by other descriptors belonging to the V parameter set, as shallbe speci�ed in the result discussion chapter.
4.2.2 Metallurgical characterisation of subsurface layers
Analysing the metallurgical state of the surface and subsurface layers is fundamentalto characterise the e�ects of VABB on surface integrity. Changes in metallographyare usually explained through the hardness magnitude, as the phases that composea certain metal have di�erent structures, and consequently pose di�erent behaviourstowards indentation tests. For that reason, in addition to visual inspection of themicrostructure of a metal, the mentioned tests are highly representative of this surfaceintegrity descriptor.
Specimen preparation is common for both techniques. �e protocol includes ma-terial cu�ing, so that the deep layers of the surface can be then studied. �e next stepconsists on specimen encapsulation in resin (Figure 4.10) which is then polished. �eresult of the described process is a mirror-polished specimen encapsulated in a stableresin body. �is kind of specimens can be used to assess the hardness of the specimenthrough microindentation testing.
Figure 4.10. Overview of specimen positioned on the encapsulating machine plate.
A Buehler 5114 Vickers hardness testing machine was used to perform them (Fig-ure 4.11.a). �is measurement was undertaken according to the ASTM Standard E384, which describes the calculation methods and establishes the characteristics ofvalid Vickers imprints.
�is test, developed by Smith and Sandland in 1925, aimed to substitute the Brinell
95

CHAPTER 4. DESCRIPTION OF THE EXPERIMENTAL METHODOLOGY
(a) (b)
Figure 4.11. Vickers microindentation hardness test scheme.
test, which was based on the usage of di�erent indenters that made measurementsnon-comparable among them. �e Vickers test uses a pyramidal diamond inden-ter, and contemplates a smooth application of the load, forcing the indenter into thepiece, and keeping it inside it for 10 s (Figure 4.11.b). A�er the load is removed, thetwo impression diagonals are measured and averaged. �e Vickers hardness (HV) iscalculated as follows:
𝐻𝑉 = 1854.4𝑝
𝑑2(4.4)
where 𝑝 is the load applied on the specimen in gf, and 𝑑 is the average diagonal of theindentation in µm.
Normally, the highest di�culty facing hardness measurements is the selection ofthe load. Indeed, although the actual hardness results should be stable regardless of itsvalue, numerous studies about microindentation techniques have shown that resultsare not stable at low loads due to a higher experimental error and the indentation sizee�ect. �erefore, excessive reduction of the indentation load can lead to a high error.�e load selection is therefore an important factor to bear into account, especiallyfor multiphase materials, which might show highly disperse hardness results if smallloads are applied. If selective microstructural grains are spanned in the indentation,the average of all measurements could not be descriptive of the whole material.
Once hardness was measured, specimens were prepared for optical microscopyand SEM observation. An etching operation was performed to guarantee enoughcontrast between phases, and fully reveal the microstructure of the target specimen.Although etching techniques are varied, chemical a�ack is o�en selected for this aimbecause of its easiness of application. Chemical etching is based on the fact that metal
96

4.2. MEASUREMENT OF THE SURFACE INTEGRITY PARAMETERS
phases react at di�erent speeds with chemical reagents. �erefore, by pu�ing themin contact with di�erent chemical inorganic substances, the most vulnerable phasesshall dissolve, revealing grain boundaries that di�erentiate them from the most stableones that remain creating a nearly three-dimensional image of the material structure.As the AISI 1038 and Ti-6Al-4V are subjected to di�erent etching operations, thisstage is detailed in particular for each of them at subsequent subsections.
4.2.2.1 Error estimation for Vickers hardness measurements
For this dissertation, a minimum of 10 indentation tests are performed for each desiredhardness measurement. As hardness is not an absolute measure, and depends on thepoint on which the indentation is performed, an error term must accompany thehardness value. In this case, the Student’s t-distribution delivers the estimation themean HV value for small size samples from which the mean and standard deviationof the population is unknown, as is the case. �erefore, the statistical uncertainty,𝐸𝑠,associated to the HV measurement, can be calculated as:
𝐸𝑠 =𝑠⌋𝑁𝐻𝑉
𝑡𝛼,𝑁𝐻𝑉 −1 (4.5)
where 𝑠 is the standard deviation of the HV sample and 𝑁𝐻𝑉 is the sample size, and𝑡𝛼,𝑁𝑉 𝐻−1 is the Student’s t statistic at a 𝛼 con�dence level.
A second term arising from experimental execution must be added. �is term in-cludes the error introduced by the limitation in optical resolution given by the micro-scope used to measure the indentation imprint diagonals, 𝐸𝑜𝑝𝑡, considering that themaximum resolution achievable by the system is restricted by the light wavelength,as establishes the Rayleigh principle (Eq. 4.6) [9]. �is term is �x for all measures,and depends on the equipment.
𝐸𝑜𝑝𝑡 = 1.220𝑓𝜆
𝐷𝑙
(4.6)
where 𝑓 is the focal length of the objective, 𝐷𝑙 is the diameter of the light beam, and𝜆 is the light wavelength.
A third term related to the bias in the diagonal measurement caused by the spher-ical deviation of the operator’s eyeball, 𝐸𝑒, must be considered in the experimentalerror. �is term is calculated with a previous calibration phase performed on a stan-
97

CHAPTER 4. DESCRIPTION OF THE EXPERIMENTAL METHODOLOGY
dard block for hardness testing. �e total error is, therefore, the addition of the threeterms:
𝐸 = 𝐸𝑠 +𝐸𝑜𝑝𝑡 +𝐸𝑒 (4.7)
4.2.3 Residual stress measurement
�e methods to measure the residual stress (RS) state of a material are numerous,including both destructive and non-destructive techniques. �e decision of whatmethod to use is conditioned by the technical constraints that each of them pose,as well as the type of residual stress to be measured, as explain Withers & Badeshia(2001) [157]. For instance, the deep hole drilling technique is an e�ective method toassess type-I residual stress gradient along progressively deeper layers of the mate-rial, by the adhesion of strain rose�es and gauges on the surface. In previous works,this method has been successfully used by the author of this dissertation to evaluateresidual stress on AISI 1038 and AA2017-T4 surfaces [40]. However, specimen prepa-ration is highly time consuming, comprising delicate gauge adhesion onto the targetworkpiece. Furthermore, the low repeatability of the method makes it infeasible forthe purposes of this thesis, where 108 burnishing tests must be measured.
Alternatively, the X-ray di�raction method has been selected to evaluate the su-per�cial residual stress a�er VABB. �e technique is based on applying Bragg’s lawwhile quantifying the change of interplanar spacing inside crystals which conserveelastic strain con�ned inside plastically deformed crystals due to VABB. As elasticstrain results in a change of the la�ice dimension, crystalline planes inside the grainsare actually used as intrinsic strain gauges in this method. Albeit the major drawbackof this di�raction method is the low depth to which compressive residual stressesmeasurements can be performed, its technical availability and feasibility makes itproper to evaluate VABB results in this experimental plan.
Bragg’s law states that when an X-ray beam with a certain wavelength is incidentonto a crystal, it is di�racted by the same angle. �is is only true for certain waves thatverify the analytical expression of the law (Eq. 4.8). Let us consider an X-ray beamirradiating a surface with incidence angle 𝜃, on a set of crystalline planes de�ned byan interplanar distance, 𝑑, then all magnitudes are related as follows:
2𝑑 sin 𝜃 = 𝑛𝜆 (4.8)
98

4.2. MEASUREMENT OF THE SURFACE INTEGRITY PARAMETERS
where 𝑑 is the interplanar distance between planes, 𝜃 is the di�raction angle, 𝜆 is thewavelength of the beam, and 𝑛 ∈ N is the order of di�raction.
Let us consider a crystal in an non-deformed state, characterised by an interplanarspacing 𝑑0. In that case, the di�raction angle shown by an X-ray beam is 𝜃0. A�erexperiencing a deformation, that distance has diminished due to plastic strain andcompression to 𝑑𝜓, and re�exes the X-ray wave a 𝜃𝜓 angle (Figure 4.12).
Figure 4.12. X-ray di�raction in a non-deformed crystal (le�) and a deformed crystal (right).
As in both states is Bragg’s law true, the initial state and the state a�er modi�-cation can be related as expressed in Eq. 4.9. �at initial state is characterised byreference interplanar distance 𝑑0, and di�raction angle, 𝜃0, which are determined byapplying the technique to reference standard specimens obtained by powder metal-lurgy, which are free of residual stress.
𝑑0 = 𝑑𝜓sin 𝜃0sin 𝜃𝜓
(4.9)
�e explained principle allows the calculation of deformation of crystals and linkit to the stress state that generates that deformation, i.e. the residual stress, as follows.�e multiangle technique used in this dissertation consists on irradiating the surfacewith an X-ray collimator mounted on a goniometer. �at device is equipped to adjustthe azimuth angle, 𝜑 , in which the measure shall be performed. Once this angle hasbeen �xed, the collimator irradiates the surface with X-ray at di�erent incidence an-gles, 𝜃. Of all those beams, only the one complying with Bragg’s law shall be detectedby a receiver coupled to the system. �is operation is repeated for several negativeand positive tilt angles, 𝜓, regulated through the motorised workpiece base. Once thisoperation has been completed, the goniometer is used to change the azimuth angleand take a subsequent measurement.
99

CHAPTER 4. DESCRIPTION OF THE EXPERIMENTAL METHODOLOGY
Along the described process, for each tilt angle at each azimuth position, the in-tensity registered by the receiver is saved for every explored angle 2𝜃𝜓 is representedin a di�raction spectrum. Each pair 𝜑−𝜓 has an associated di�ractogram on which anintensity peak is present for the irradiation angle for which Bragg’s law is satis�ed,2𝜃𝜓 (Figure 4.13).
Figure 4.13. X-ray di�raction spectrum showing a di�raction peak at 2𝜃𝜓 position, withregards to the spectrum registered for the reference material, 2𝜃0.
�e residual stress quanti�cation is based on the analysis of a set of those spectra.�e calculation of the interplanar distance for every tilt angle 𝜑−𝜓, and its compari-son with the reference non-deformed distance, delivers the deformation to which thecrystal is being subjected, through the following equation:
𝜀𝜑𝜓 =𝑑𝜓 − 𝑑0𝑑0
= sin 𝜃0sin 𝜃𝜓
− 1 (4.10)
If the strain state of the crystal is considered tridimensional, then that deformationcan be related to the stress state that generates it, that is, the residual stress, throughthe elastic mechanics equations in a continuum:
𝜀𝑖𝑗 =1 + 𝜈𝐸
𝜎𝑖𝑗 −𝜈
𝐸𝛿𝑖𝑗 𝜎𝑖𝑗 (4.11)
where 𝛿𝑖𝑗 = 1 if 𝑖 = 𝑗 and 𝛿𝑖𝑗 = 0 if 𝑖 ≠ 𝑗
As this elastic strain in measured along the normal direction to the di�ractingplanes at a certain tilt position of the collimator, n. It can be quanti�ed by projectingthe strain tensor on the n direction, as follows:
𝜀𝜑𝜓 = n 𝜀n𝑇 = 1 + 𝜈𝐸
(𝜎𝜑 − 𝜎𝑧𝑧) sin2𝜓+ 1 + 𝜈𝐸
𝜎𝑧𝑧−𝜈
𝐸𝑇𝑟 (𝜎)+ 1 + 𝜈
𝐸𝜏𝜑 sin (2𝜑) (4.12)
100

4.2. MEASUREMENT OF THE SURFACE INTEGRITY PARAMETERS
Eq. 4.12 actually represents a function, namely 𝜀𝜑𝜓 = 𝑓 (sin𝜓). �erefore, if𝜀𝜑𝜓, i.e. 2𝜃 by Eq. 4.10, is graphically represented against sin2𝜓), the characteristicparameters of the linear �t (slope and intercept) can be compared to the graphicalrepresentation to deduce the values of the residual stress tensor (Figure 4.14). Specif-ically, normal stress 𝜎 can be calculated by determining the slope, whereas tangentialstress 𝜏 are by the overture of the parabolic function ��ed on the measured points.A measure at 𝜑 = 0𝑜 delivers 𝜎𝑥 and 𝜏𝑥𝑦, whereas 𝜑 = 900 allows the calculation of 𝜎𝑦and 𝜏𝑦𝑥. �erefore, in practice, normally only these two azimuth angles are irradiatedfor one measurement.
Figure 4.14. Linear representation of the sin2𝜓 method. A�er Guillemot (2010) [49].
�e technological application of the X-ray di�raction measurements changes ac-cording to the objective material. Table 4.11 shows the technological parameters usedfor both considered materials in this thesis. All tests were performed with a SET-X goniometer and the STRESSDIFF so�ware was used to automatically register alldi�raction measurements and calculate the stress tensor associated to the analysedburnishing patch. However, the data postprocessing was di�erent. As the AISI 1038di�ractometer spectres hardly showed noise, the approximative FWHM-peak heightmethod was used to estimate the di�raction angle. On the contrary, the spectrespresented by Ti-6Al-4V spectres were postprocessed through polynomial ��ing, toovercome the high noise presented by the measurement. Consequently, the incerti-tude associated to Ti-6Al-4V was higher, as shall be presented in the next chapter.
101

CHAPTER 4. DESCRIPTION OF THE EXPERIMENTAL METHODOLOGY
Table 4.11. Experimental characteristics of X-ray di�raction measurements.
Item AISI 1038 Ti-6Al-4VAnode type CrK𝛼 V𝛼Exposition time 40 s 360 s# measures 13 132𝜃0 156○ 143.5○{ℎ𝑘𝑙} Fe(𝛼) {211} Ti(𝛼) {213}estimated depth 15 µm 10 µmpost-processing method FWHM and peak height curve ��ing
4.3 Material characterisation
4.3.1 AISI 1038 alloy
AISI 1038 is a medium-carbon steel alloy with medium-high machinability. It has beenchosen for this experimental execution for two main reasons. �e �rst one is to givecontinuity to previous works [43]. Secondly, the 1038 alloy is used for an extensiverange of industrial applications such as gears, axes, sha�s, or moulds, as well as largercomponents such as power shovels, due to its high versatility. �erefore, it is a steelprone to be found in numerous industrial workshops of di�erent scale. Table 4.12shows its composition according to the AISI standard.
Table 4.12. AISI 1038 weight composition.
Component Fe Mn C S PWeight (%) 98.6–99.05 0.6–0.9 0.35–0.42 ≤0.05 ≤0.04
�e material has been provided as laminated bars of 100× 60 mm section. A 170-mm long piece was cut from the bar to obtain the workpiece to be burnished, so thatall planned essays could be carried out. �e mechanical properties of that materialwere characterised by Travieso-Rodrıguez (2010) (Table 4.13). �ey are considered asvalid for this thesis, as the material was taken from the same bar.
To observe the metallurgical structure of the material, a sample from its core wasextracted from the bar, and was cut along the lamination direction, coincidental withthe milling direction, or direction II, according to the criterion established in Figure4.3. A second specimen to observe the microstructure along direction I, was also
102

4.3. MATERIAL CHARACTERISATION
Table 4.13. AISI 1038 properties, as characterised by Travieso-Rodrıguez (2010) [148].
Property ValueDensity 7.84 g/cm3
Young’s Modulus 211 GPaPoisson’s Modulus 0.29Yield strength 416 MPaSelf-hardening coe�cient 0.19
extracted. Both of them were prepared as explained at the precedent subsection, andetched by chemical action of a Nital solution. Figure 4.15.a shows the core materialalong direction I, as a matrix of pearlite and ferrite, usual in this kind of carbon steels.On the other hand, Figure 4.15.b shows that grains are aligned along direction II, as aclear e�ect of the lamination operation through which the raw material was obtained.
Figure 4.15. Metallographic observations of the AISI 1038 specimen at 50x. a. Direction I. b.Direction II (lamination).
�e metallurgical characterisation of the material was completed through Vickersmicroindentation hardness tests, a�er polishing the specimens a second time to erasethe e�ect of etching. Figure 4.16.a shows a detail of pearlite grain in the core material,leading to establish that the reference grain size is of the order of 20 µm. By applyinga 100-gf load, burnishing imprints had an average size of around 30 µm, and, there-fore, this load was con�rmed as adequate. Indeed, as ferrite is considerably ductileand less hard than cementite, and therefore, pearlite formations, the indentation im-prints were not localised on single isolated phases and no bias of the overall hardness
103

CHAPTER 4. DESCRIPTION OF THE EXPERIMENTAL METHODOLOGY
measurement was detected. Figure 4.16.b con�rms that Vickers indentations spanneda mix of both phases in the material core.
Figure 4.16. . a. SEM image of pearlite nucleation. b. Imprints a�er Vickers indentationspanning ferrite and pearlite structures.
Table 4.14 shows the average result of 15 hardness measurements along each di-rection. At sight of these results, the material can be considered isotropic in terms ofhardness.
Table 4.14. Hardness measurements performed on the AISI 1038 specimens.
Direction HV100 Error Average 𝑑 (µm) max 𝑑 (µm) min 𝑑 (µm)Direction I 175 10.6 32.08 30.12 32.86Direction II 180 10.5 31.86 29.99 32.74
4.3.2 Ti-6Al-4V alloy
�e titanium alloy Ti-6Al-4V is a biphase material composed of 𝛼+𝛽 structures. �epresence of both phases is achieved by the equilibrated combination of 𝛼-stabiliserinterstitial Al, and 𝛽-stabiliser element V and Fe, as is shown in Table 4.15. �e pres-ence of both allotropic phases makes Ti-6Al-4V a versatile alloy o�ering an excep-tional balance of strength, ductility, fatigue and fracture properties with applicationin the aeronautical industry to manufacture pressure vessels, gas turbine disks orcompressor blades.
104

4.3. MATERIAL CHARACTERISATION
Table 4.15. Ti-6Al-4V weight composition according to AFNOR L14-601.
Component Ti Al V Fe O C N HWeight (%) 88.1–91 5.5–6.75 3.5–4.5 ≤0.25 ≤0.2 ≤0.08 ≤0.05 ≤0.01
�e raw material used for the experimental phase was provided as a 105×95×165
mm forged block. �e standard properties are included in Table 4.16. Compared tothe AISI 1038 alloy, this material presents a higher yield strength, what leads to thinkthat higher forces should be applied to achieve permanent plastic strain via VABB.
Table 4.16. Grade 23 Ti-6Al-4V properties.
Property ValueDensity 4.4 g/cm3
Young’s Modulus 110 GPaPoisson’s Modulus 0.32Yield strength 870 MPaSelf-hardening coe�cient 0.3
As the historic of the material is unknown, the structure of the alloy along withits hardness were determine in a preliminary phase. A specimen was extracted fromthe core material, cut along the longitudinal direction and its perpendicular. Bothresulting surfaces were then subjected to encapsulation and polishing treatments ex-plained above. An indentation test was performed to calculate the hardness of thematerial. Table 4.17 contains the resulting hardness measurements, evidencing theoriginal isotropy of the material.
Table 4.17. Hardness measurements performed on the Ti-6Al-4V specimens.
HV100 Error Average 𝑑 (µm) max 𝑑 (µm) min 𝑑 (µm)Direction I 311 9.1 24.5 16.19 23.16Direction II 308 7.4 24.7 15.64 22.98
A�er the Vickers microindentation tests, chemical etching through Kroll’s reagentwas performed. �e microstructure was then analysed through SEM observation.Figure 4.17.a con�rms the biphase composition of the Ti-6Al-4V, equally distributedin both main directions. �e 𝛼-titanium is depicted as the white regions, whereasthe 𝛽-titanium is darkened by the used reagent. Both structures are organised as
105

CHAPTER 4. DESCRIPTION OF THE EXPERIMENTAL METHODOLOGY
intergranular 𝛼 embedded in a 𝛽 matrix. As the 𝛽 phase has a BCC structure, a largenumber of slip planes makes it more ductile and less resistant than the 𝛼 hexagonalcrystal structure, hence the relatively low hardness presented by the raw material,with regards to other metallurgical states of the same alloy [22].
Figure 4.17. Metallographic observations of the Ti-6Al-4V specimen along direction I (a) anddirection II (b).
Since the microstructure pa�erns of the alloy present an approximate grain size of15 µm, the Vickers imprints derived from the indentation tests can be considered rep-resentative enough to characterise the material hardness. In fact, Figure 4.18 con�rmsthat both phases can be adequately spanned by applying a 100-gf load.
Figure 4.18. Detail of Vickers indentation performed on the Ti-6Al-4V.
106

4.4. EXPERIMENTAL EXECUTION
4.4 Experimental execution
�e tests were performed on a HURON KX10 3-axis milling machine equipped witha Kistler 9257B dynamometer located at the Ecole Nationale d’Ingenieurs de Tarbes. To�x the workpieces to the machine table, they were drilled and screwed to it in orderto monitor the forces applied during the burnishing tests (Figure 4.19.a). �e datameasured through the Kistler 5019A ampli�er was registered through the DynoWareso�ware. �e experimental setup was completed by the external power circuit towhich the VABB tool is connected and excited (Figure 4.19.b).
(a) (b)
Figure 4.19. Experimental setup. a. Detail of workpiece a�ached to a Kistler dynamometer.b. HURON KX10 milling machine where experiments were developed.
�e workpieces were not removed from that position during the whole machiningand burnishing processes. Like that, the perpendicularity of the burnished surface tothe VABB tool was guaranteed, and references were kept constant. �e workpiecepreparation process started by a �rst surfacing operation with a multi-insert frontmilling tool. On that �at surface, the di�erent ball-end milling strategies were appliedto obtain the desired di�erent surfaces, as explained in the next subsection.
107

CHAPTER 4. DESCRIPTION OF THE EXPERIMENTAL METHODOLOGY
4.4.1 Machining of the original surfaces
�e in�uence of the original surface texture on the burnishing results is of high inter-est for this thesis, to associate the e�ectiveness of the process with a certain �nishingdegree that can be found in an actual industrial context. To that purpose, three dif-ferent surfaces were planned to be tested. All of them were obtained by executinga face milling operation using a hemispherical milling tool with a TiN coating. �ecu�ing speeds selected to perform the machining were 120 m/min and 70 m/min forthe AISI 1038 and the Ti-6Al-4V workpieces respectively. Table 4.18 shows the geo-metrical machining parameters selected for all three surfaces. �e generation of theoriginal surfaces by choosing these parameters is fundamental to control and mas-ter the peak height and the material distribution on the surface, and, therefore, theexpected texture. Furthermore, the chosen parameters can be undoubtedly identi�edwith realistic machining conditions applied in an industrial context. De�ning theseparameters by adopting this approach is not casual, since it is of high importance totake pro�t of the derived results for potential industrial applications.
Table 4.18. Machining parameters applied to obtain the three original surface topologies.
Machining parametersOriginal surface 𝑎𝑒 (mm) 𝑎𝑝 (mm) tool diameter (mm)𝑆01 0.5
0.2 ∅10𝑆02 0.8𝑆03 1.1
To calculate the spindle velocity to be applied during machining through Eq. 4.13,the e�ective radius of cut 𝑟𝑒, that is, the contact between the hemispherical tool andthe material plane, must be determined. �is value represents the actual dimensionwhich characterises the contact between the cu�ing tool and the objective material,as a function of the selected geometrical cu�ing parameters, as shows Figure 4.20. Itsdetermination is important to optimise the tool life, avoid surface integrity defectsdue to detrimental chip removal mechanism, and preventing the coating to be wornout prematurely.
𝑛 = 1000 𝑣𝑐2𝜋 𝑟𝑒
(4.13)
where 𝑛 is the spindle speed in min−1, 𝑣𝑐 is the cu�ing speed in m/min.
All geometrical parameters can be mathematically related through a rectangle
108

4.4. EXPERIMENTAL EXECUTION
Figure 4.20. Hemispherical front milling geometric system.
triangle. �erefore:𝐷2 = 𝑟2𝑒 + (𝐷 − 𝑎𝑝)2 (4.14)
where 𝐷 is the milling tool diameter and 𝑎𝑝 is the depth of cut.
As 𝑎2𝑐 ≪𝐷𝑎𝑐, Eq.4.14 can be simpli�ed, and the e�ective radius can be calculatedas:
𝑟𝑒 =⌈
2𝐷𝑎𝑐 (4.15)
4.4.2 Burnishing force measurement
Being able to register the forces while the burnishing operation is being executedallows the control of the force level that is being applied, as well as quantifying theforce �uctuation during the test. �is is the reason why the test pieces are a�ached tothe Kistler dynamometer. �e device delivers a register of the forces applied accordingto a Cartesian reference system, where 𝐹𝑧 represents the burnishing force, whereas𝐹𝑥 is the tangential force that appears during the execution of the process, opposedto the feed movement of the tool. Although it cannot be formally de�ned as a frictionforce, it shall be referred to as pseudo-frictional due to its dynamic opposition to thefeed motion.
As the sampling frequency of the Kistler ampli�er is 2 kHz, the registered sig-nals cannot evidence the vibratory component delivered by the piezoelectric. Underthis circumstance, the forces acquired during the VABB and the NVABB tests shouldhave in essence the same behaviour, as only the force governed by the spring, 𝐹𝑝,is registered. �e �rst 15 s of each test were acquired to reduce the amount of datato manipulate. �is portion of registered forces were exported as .csv �les, andprocessed through a Matlab routine composed of di�erent scripts.
�e observation of the NVABB and VABB forces registered for each testing con-ditions showed a similar pa�ern. Figure 4.21.a shows test #25 performed on Ti-6Al-
109

CHAPTER 4. DESCRIPTION OF THE EXPERIMENTAL METHODOLOGY
4V as an example. All forces were equal to zero during an initial timespan duringwhich the VABB tool was plunging onto the target surface. As soon as contact wasestablished between them, the force increased linearly, proportional to the plungingvelocity, until the programmed spring compression was achieved. From that point,the registered forces show a repetitive pa�ern. 𝐹𝑧 exhibits an oscillatory behaviour,while 𝐹𝑥 changes its sign as the di�erent burnishing passes are completed in one di-rection, and the next one starts. �e point in which 𝐹𝑥 achieves value 0 is used inthe script to determine the original point of each burnishing pass, and isolate a singleburnishing cycle (two passes in opposite directions), as shows Figure 4.21.a.
(a) (b)
Figure 4.21. 𝐹𝑥 and 𝐹𝑧 measurement during the VABB and NVABB tests #25 in Ti-6Al-4Vworkpiece. a. Identi�cation of burnishing cycles through ��ed signal (red). b. Extractedforces at two burnishing cycles.
�e objective of this strategy is quantifying the singular values that describe theregistered forces for all tests and characterise the nature and evolution of that preloadto ultimately declare equivalent force level during VABB and the complementaryNVABB test. Without this con�rmation, the comparability of tests could be ques-tioned. Figure 4.22 shows all mean forces, along with the maximum and minimumvalues computed for all tests. All means show a consistent correspondence with theobjective mean preload established at the experimental design. Furthermore, theypresent maximum and minimum values of the oscillating cycle which are of simi-lar order of magnitude for all tests. Whereas it is impossible to keep force perfectlyconstant along all executions according to the desired level, this comparative repre-sentation leads to the conclusion that all forces were comprised inside similar levels.
110

4.5. RECAPITULATION
(a)
(b)
Figure 4.22. Mean𝐹𝑧 registered for all burnishing cycles, and maximum and minimum forcesregistered. a. AISI 1038. b. Ti-6Al-4V.
4.5 Recapitulation
In this chapter, the issues related to the experimental development of this thesis ispresented, including two main types of information which are summarised in thisrecapitulation section.
1. An L27 Taguchi orthogonal array has been chosen to develop the experimentalplan to test the VABB prototype on both AISI 1038 and Ti-6Al-4V workpieces.�is arrange allows the analyse of �ve di�erent factors at three levels, alongwith three paired interactions among three of them.
111

CHAPTER 4. DESCRIPTION OF THE EXPERIMENTAL METHODOLOGY
2. �e X-ray di�raction technique has been selected to perform residual stressmeasurement, due to the availability of the equipment and the amount of mea-surements to be carried out.
On the other hand, albeit the descriptive nature of this chapter, some partial re-sults have been presented as auxiliary data to validate and set up the experimentalstrategy. �ey can be presented as follows:
1. A trial-error approach has been applied to decide the size of the patches toacquire of each burnishing test to obtain relevant information about its textureparameters. Finally, it has been decided to acquire patches containing 6 peaks& valleys of each surface. �e actual size of the patch changes depending onthe target surface, due to the di�erent machining strategies from which each ofthem was obtained.
2. A detailed study considering numerous descriptors of surface topology has leadto the determination of the parameters that adequately can describe the changesin the surfaces. �ey shall be included in the result discussion in the next chap-ter.
3. A metallurgical analysis of the materials was performed, along with an initialhardness measurement assessment through Vickers microindentation tests. A100 gf load has been set as an adequate level to assess hardness, as it is able toquantify the e�ects of all microstructural structures present in both materials.
4. �e analysis of forces acquired during all VABB and NVABB specimens re-vealed that, in mean and absolute terms, both processes do not show a remark-able di�erent behaviour. All mean forces representing an approximate value ofthe preload force show a stable value along all tests. However, if the pseudo-frictional force is analysed, the initial surface state shows a conspicuous in�u-ence on its value, reaching the highest relative values for the less �nished one,𝑆03 . On the other hand, an increase in the preload force shows a relative de-
crease of the pseudo-frictional one. From this point of view, the process showsa more e�ective behaviour for higher forces.
�e next chapter includes the main results arising from the experimental plan thathas been designed and explained along the previous pages.
112

5Experimental results and discussion
In this chapter, the results derived from the execution of the Taguchi experimentalarray on the AISI 1038 and the Ti-6Al-4V alloys are presented and discussed. �echapter is organised by surface integrity parameters, including �rst the results re-garding the steel alloy, and then those corresponding to the titanium alloy. Figure 5.1summarises the di�erent areas included in the result discussion.
Figure 5.1. Summary of items included in the result analysis.
Of all aspects of surface integrity that are analysed, some of them are qualitative.
113

CHAPTER 5. EXPERIMENTAL RESULTS AND DISCUSSION
On the other hand, speci�c quantitative indicators shall be subjected to an optimisa-tion procedure, since one of the aims of this chapter is de�ning the parameter setsthat deliver the best surface integrity results. “Optimal” is understood here as thefactor levels that can be found in the DOE, that have the most enhancing e�ects onthe surface. �e criteria to de�ne the term “best”, depends on the optimisation target,and shall be speci�ed according to the area of study.
5.1 Geometrical parameter: surface texture
�is section tackles with the in�uence of the VABB process on the topological state ofboth materials, being later compared with the NVABB e�ects. �e aim of this sectionis exploring a new approach for texture assessment a�er ball burnishing. With thatpurpose, the parameters included in Table 5.1 are from a start considered. However,the reader shall notice that, due to the nature of the surfaces derived a�er VABB andNVABB, not all parameters are able to systematically represent the way the materialis distributed on the surface a�er their execution.
To perform the study, and discriminate the best set of parameters to fully describethe topological e�ects of ball burnishing, the �rst subsection of each material aims tocharacterise the three machined surfaces, 𝑆0. �e surface analysis is then performedby considering all S parameters. As the amplitude S parameters shall show to be thebest ones to describe the VABB surfaces, they shall be used to �nd the optimal pa-rameter set in terms of topology enhancement. �e next subsection shall tackle withthe V or Abbo�-Firestone parameter set, to evaluate whether they deliver additionalinformation to the system of study, or whether, on the contrary, they are redundantin this analysis.
5.1.1 AISI 1038
5.1.1.1 Topologies of the original surfaces
�e �rst approach to topology characterisation of all three original surface �nishingtextures is undertaken by considering a simple set of two-dimensional parameters,represented in Figure 5.2. �is kind of parameters can be considered highly repre-sentative of the initial surface texture, due to the planar symmetry that they exhibit
114

5.1. GEOMETRICAL PARAMETER: SURFACE TEXTURE
Table 5.1. Summary of retained two- and three-dimensional topological parameters.
Two-dimensional parametersRoughness parameters 𝑅𝑎: average; 𝑅𝑞 : RMSPro�le parameters 𝑃𝑎: average, 𝑃𝑞 : RMS
S parametersAmplitude
Root mean square height 𝑆𝑞Skewness 𝑆𝑠𝑘Kurtosis 𝑆𝑘𝑢Ten-point height 𝑆10𝑧
SpatialFastest decay autocorrelation length 𝑆𝑎𝑙Texture aspect ratio 𝑆𝑡𝑟
HybridRoot mean square gradient 𝑆𝑑𝑞
MiscellaneousTexture direction angle 𝑆𝑡𝑑
V parametersAreal parameters
Core distance 𝑆𝑘Reduced peak height 𝑆𝑝𝑘Reduced valley height 𝑆𝑣𝑘Peak material ratio 𝑀𝑟1
Valley material ratio 𝑀𝑟2
Volumetric parametersValley void volume 𝑉𝑣𝑣Core void volume 𝑉𝑣𝑐Peak material volume 𝑉𝑚𝑝Core material volume 𝑉𝑚𝑐
as a consequence of the machining strategy performed to obtain them. To calculatethe 𝑅 and 𝑃 parameters –roughness and pro�le respectively–, a set of 20 evaluationlengths traced along parallel paths perpendicular to direction II were acquired andaveraged to obtain a representative value. �e roughness parameters were obtainedby �ltering the whole pro�le 𝑃 through a low-pass �lter with a 𝜆𝑐 = 0.8 mm cut-o�length was applied to �lter the height signals.
All parameters show an increasing trend from 𝑆01 to 𝑆0
3 . �is behaviour was pre-dictable, as surface roughness and topography are expected to be harsher as the o�setdistance between ball-end milling passes is increased. Furthermore, it is shown that
115

CHAPTER 5. EXPERIMENTAL RESULTS AND DISCUSSION
𝑃𝑎 and 𝑃𝑞, as well as their𝑅 correspondents, are related by a factor of proportionality0.87. �is relationship between both factors was already observed by King & Sped-ding (1982) [69] on manufactured surfaces, and proves that both of them can deliverthe same information about the surface state. On the other hand, extreme points arealso of higher magnitude as the surface becomes more abrupt.
Figure 5.2. Two-dimensional descriptors of original surfaces (AISI 1038).
If instead of two-dimensional parameters, the three-dimensional parameters thatrepresent surface are considered, results are consistent with the previous observa-tions. �ese parameters have been calculated by establishing a least square meanplane on the acquired height datasets, and without applying �lter to retain the texturefeatures. 𝑆𝑞 in Figure 5.3.a grows until reaching its maximum value for 𝑆0
3 . Extremepoints are also maximum for that surface. Spatial parameters also evidence the largerscale of the 𝑆0
3 surface, with regards to the other two �nishing regions because oftheir characteristic highest correlation length 𝑆𝑎𝑙 (Figure 5.3.b). �at means that, bycalculating of the autocorrelation function, the surface must be folded and displacedalong a longer distance on itself to exhibit an actual decay of its value.
𝑆𝑡𝑟 is for the three cases well below 0.1, and proves that all machining strategieshave lead to highly anisotropic surfaces, with a preferential direction. �at directionis de�ned by the 𝑆𝑡𝑑 parameter common to all surfaces, not represented in the graphdue to its uniform value of −90○ regardless of the considered surface. On the otherhand, the 𝑆𝑑𝑞 hybrid parameter shows that the three machined surfaces are next toa �nishing state, although the 𝑆0
1 surface is the smoothest one, and, therefore, thisparameter increases as surfaces 𝑆0
2 and 𝑆03 are considered.
Volumetric parameters also show the higher abruptness of the 𝑆03 surface with
regards to the opposite end of the sequence 𝑆01 (Figure 5.4.a). Indeed, all core, peak
and valley volumes, are maximum for 𝑆03 , and minimum for 𝑆0
1 . �e descriptors of
116

5.1. GEOMETRICAL PARAMETER: SURFACE TEXTURE
(a) (b)
Figure 5.3. 𝑆 parameters describing the initial surfaces of AISI 1038. a. Amplitude parame-ters. b. Spatial and hybrid parameters.
the AF curve show the same behaviour with regards to the core and peak material,but not so at the valley proportion, which is virtually equal for all surfaces (Figure5.4.b).
(a) (b)
Figure 5.4. 𝑉 parameters describing the initial surfaces of AISI 1038. a. Volumetric parame-ters. b. AF parameters.
�e visual inspection of the AF curves helps understanding the uneven trend ofits descriptors, as not all three surfaces show di�erent bearing area distributions, asshown in Figure 5.5. Whereas the bearing capacity of positive heights proves to behigher for 𝑆0
1 and increases progressively towards 𝑆03 , explaining the behaviour of 𝑆𝑘
and 𝑆𝑝𝑘, the points corresponding to the valleys machined on the material show anoverlapping of 𝑆0
2 and 𝑆03 at high 𝑀𝑟 values, and a change in concavity di�cult to
interpret at this point, but that could help explaining the unpredicted behaviour of𝑆𝑣𝑘.
117

CHAPTER 5. EXPERIMENTAL RESULTS AND DISCUSSION
Figure 5.5. AF curves for the three original surfaces on AISI 1038.
�e di�erent original surfaces were characterised through two- and three-dimensionalparameters. Both of them allowed the identi�cation of a sequential decrease in thesurface scale, and a slightly di�erent material distribution, at sight of the Abbo�-Firestone curves and the 𝑆𝑠𝑘 and 𝑆𝑘𝑢 parameters. However, the uneven evolutionof some of the bearing area curve descriptors questions their adequacy to representsystematically the evolution of these surfaces. �e next subsections tackle with theresults of the 27 VABB tests, and shall reveal whether these original conditions havean impact on the �nal results delivered by the process.
Synthesis Original AISI 1038 surfacesDue to the periodical peak pa�ern presented by the original surfaces, obtained throughball-end milling, the basic two-dimensional factors represent well enough the biggerscale of the topologies as the lateral o�set between passes is increased, i.e. from𝑆01 to 𝑆0
3 . �e three dimensional factors also denote that evolution, except for somevolumetric descriptors, that shall be taken into account cautiously in the analysis ofball-burnished surfaces.
5.1.1.2 Two-dimensional Rq parameter
Following the traditional approach to the analysis of ball burnishing results, this �rstphase of topological analysis focuses on the two-dimensional roughness. However, apreliminary visual inspection of the burnished patches evidences that the repeatabil-ity of two-dimensional 𝑅 parameters cannot be expected to be high. As an example,Figure 5.6 shows the surfaces a�er tests #25 and #18, performed on the𝑆0
1 surface. Test#25 exhibits a higher heterogeneity of the height distribution, compared to #18, whichis clearly still governed by the original machining marks. In fact, the 𝑆𝑡𝑑 parameter,which indicates the main texture direction, is inverted in the former. �erefore, thehypothesis of planar symmetry that was considered in the previous subsection can-
118

5.1. GEOMETRICAL PARAMETER: SURFACE TEXTURE
not be equally applied to analyse the VABB surfaces. Consequently, the use of thiskind of parameters must be taken cautiously.
Figure 5.6. Topological images of VABB tests #25 and #18 performed on AISI 1038.
Regardless of having exposed the risks of focusing the analysis exclusively in two-dimensional parameters, the traditional approach to burnishing analysis is consideredby calculating all 𝑅 parameters, measured 20 times along direction I by applying a𝜆𝑐 = 0.8 mm �ltering cut-o� length. To control the error, and guarantee the rep-resentativeness of those values, outliers have been discarded through Chauvenet’scriterion. �is method assumes normality of the sample, enabling the calculation ofan interval based on the error so that every point outside it is discarded. �is methodof outliers control is controversial, due to the fact that it removes from considerationpoints that were actually measured on the sample. However, it delivers a fast anduniform sample with a highly representative average value [144].
�e mean 𝑅𝑞 parameters were subjected to an ANOVA. Figure 5.7 shows thegraphical results derived from that analysis. �e VABB process proves to decreaseroughness, being the preload the most in�uential value, followed by the number ofpasses. On the contrary, the strategy and initial surface state show no in�uence inroughness reduction. Nor does the feed considering a 0.05 con�dence level, at sightof the associated p-value calculated through the ANOVA test (0.087). �e S/N ratioreaches its highest values at those levels that have a higher mean average e�ect on theresponse, con�rming that they are also the most robust ones. Finally, no interactionsare observed between 𝐹𝑝, 𝑛𝑝 and 𝑣𝑓 .
�e only in�uence of𝐹𝑝 and 𝑛𝑝 on𝑅𝑞, and the result independence from𝑆0 agreeswith results obtained previously by other researchers, such as Lee et al. (1993) [78].One possible reason for this independence could be due to the fact that, by removingthe low frequency features of the surface through the �ltering operation to which
119

CHAPTER 5. EXPERIMENTAL RESULTS AND DISCUSSION
Figure 5.7. VABB mean e�ects, S/N ratios and interaction plots. ANOVA response variable:𝑅𝑞 of AISI 1038.
the sampled 𝑃 pro�le must be subjected to extract the 𝑅 pro�le, the material thatactually interacts with the ball is being obviated. �e �ltered resulting pro�le is lessrepresentative of the surface, and does not model the material that interacts with theburnishing ball. �e next subsection deepens into texture assessment by analysing awider set of three-dimensional parameters.
Synthesis Description of VABB results on AISI 1038 through 2D parame-ters�e direct visual inspection of the height maps caused by VABB has evidenced thatVABB operation does not have a homogeneous e�ect on the whole target patch.�erefore, the two-dimensional scale factor, 𝑅𝑞, lacks quantitative accuracy to de-scribe the VABB e�ects. If no other measuring devices are available, two-dimensionalparameters could be considered as an alternative by averaging big datasets to makeit interpretable.
5.1.1.3 Sq and S10z amplitude parameters
�e �rst approach to analyse the three-dimensional amplitude parameters is by per-forming an ANOVA, taking 𝑆𝑞 as response variable. Results are depicted in Figure 5.8,
120

5.1. GEOMETRICAL PARAMETER: SURFACE TEXTURE
proving that the VABB system in�uences 𝑆𝑞 di�erently with regards to 𝑅𝑞. Indeed,the initial surface texture is the most in�uential parameter, followed by the preloadand the number of passes. �e strategy and feed do not show a signi�cant in�uence.Again, no interaction between factors can be judged as relevant in this case, and theS/N ratio proves that robustness increases as the factors reach their optimal levels,con�rming the low impact of noise variables in the system.
Figure 5.8. VABB mean e�ects, S/N ratios and interaction plots. ANOVA response variable:𝑆𝑞 of AISI 1038.
�e revelation that the initial surface state is more in�uential on texture resultsthan 𝐹𝑝 and 𝑛𝑝 leads to a recon�guration of the strategy for result interpretation, byconsidering a di�erent pa�ern for their representation. Accordingly, all topologicalparameters are rearranged and represented henceforth according to their respectiveinitial surface texture, instead of by their position in the Taguchi experimental ar-ray. �is layout recon�guration of the experimental array allows the arrangementof the tests by increasing 𝐹𝑝, and by reiterative cycles of 1, 3 and 5 𝑛𝑝 values. �issimpli�cation obviates the feed and the strategy as in�uential factors, and leads toconsider the burnishing results as a discrete sequential evolution departing from theoriginal texture, towards surfaces generated by increasing degree of plastic strain, i.e.the 𝐹𝑝–𝑛𝑝 pair.
Following the described pa�ern, Figure 5.9 shows the 𝑆𝑞 and 𝑆10𝑧 amplitude pa-rameters. Both of them behave similarly, as they generally decrease as the degree
121

CHAPTER 5. EXPERIMENTAL RESULTS AND DISCUSSION
of plastic strain increases, that is, by a rise in 𝐹𝑝 and 𝑛𝑝. �e only exception to thattrend is when shi�ing from the 180N–5passes test to 270N–1pass, where 𝑆𝑞 and 𝑆10𝑧
increase. �is is due to the fact that rising the preload from 180 N to 270 N is notenough to compensate the decrease of number of passes from 5 to 1. �us the lowerdegree achieved regardless of the higher preload.
Figure 5.9. 𝑆𝑞 and 𝑆10𝑧 amplitude parameters of AISI 1038 VABB patches.
�e lowest 𝑆𝑞 at the 𝑆01 surface is a�ained by applying 180N–5passes (test #18).
In fact, further plastic deformation leads to surface harm, revealed by a reproductionof new protuberances on the surface by pile-up due to strain hardening, that couldbe understood as a recreation of the surface texture along the burnishing direction.180 N should not be surpassed to treat this kind of surfaces, to prevent a detrimentale�ect of the process. �is idea shall be further discussed in following subsections.�erefore, this surface has a di�erent behaviour with regards to the other two. �eprocess seems to be cyclic, at least in terms of scale of the amplitude, as the 270N–5passes test derives in similar texture amplitudes, but, obviously, consuming a largeramount of time. On the contrary, this e�ect is not observed in 𝑆0
2 or 𝑆03 , since these
surfaces admit VABB with the highest level of preload and number of passes to achievethe largest amplitude reduction. �is fact can be explained due to the higher amountof plastic strain required to compress residually a surface where a higher materialvolume is present at the peaks of the texture pa�ern.
It is also remarkable the high sensitivity of the 𝑆10𝑧 parameter to outliers, at sightof some anomalous points observed, for instance in tests #7 or #17. Consequently, it
122

5.1. GEOMETRICAL PARAMETER: SURFACE TEXTURE
can be considered as less appropriate than 𝑆𝑞 to de�ne the amplitude e�ects of VABB.
5.1.1.4 VABB optimal parameters according to Sq
�e mean e�ects calculated through the ANOVA shown at Figure 5.8 allow the bestparameters for 𝑆𝑞 minimisation to be found. �at criterion can be considered theoptimisation target in this case. Figure 5.10 shows the procedure that shall be followedin this subsection to perform that optimisation.
Figure 5.10. Procedure to �nd the best VABB parameters based on 𝑆𝑞 reduction.
Results have proved that the optimal set of parameters is di�erent for each initialtexture. �e mean e�ects graph con�rms that observation, as an optimal 𝐹𝑝–𝑛𝑝 paircan be found for each 𝑆0, being the strategy and the feed non-in�uential for theresults. Furthermore, no interaction can be found in the system, what simpli�es theoptimisation procedure. Table 5.2 shows the optimal parameters that result from theanalysis.
To con�rm the condition of these sets as the best combination, they are comparedto experimental results, as tests #18, #26 and #27 correspond to the de�ned combi-nations. Indeed, the relative reduction of 𝑆𝑞 included in the table shows that theycorrespond to the best obtained conditions, being 𝑆0
1 where the highest improvementis registered.
�e topological study continues in the next subsection by considering the skew-ness and kurtosis of the generated height distributions. �e optimal values de�nedhere shall be also considered in that analysis.
123

CHAPTER 5. EXPERIMENTAL RESULTS AND DISCUSSION
Table 5.2. Parameters to apply VABB on AISI 1038 end-milled surfaces, based on ANOVAmean results. Optimisation target: minimum texture amplitude.
Initialsurface 𝐹𝑝 (N) 𝑛𝑝
𝑣𝑓(mm/min) Strategy test scale reduction:
𝛥𝑆𝑞
𝑆01 180 3 300-900 nb0, bn90/0
or bn0 #18 81.3%
𝑆02 270 3 300-900 nb0, bn90/0
or bn0 #26 73.4%
𝑆03 270 5 300-900 nb0, bn90/0
or bn0 #27 61.5%
5.1.1.5 Ssk and Sku amplitude parameters
Skewness and kurtosis parameters are plo�ed in Figure 5.11. Both 𝑆02 and 𝑆0
3 exhibita uniform increase of 𝑆𝑘𝑢 as the degree of plastic strain increases, with exceptionof the singular step from 180N–5passes to 270N–1pass. �is trend interruption wasalready detected in the amplitude parameters. Although 𝑆𝑘𝑢 increases towards theGaussian value of 3 in both cases, it is only achieved at 𝑆0
2 , when the highest levelsof preload and number of passes are applied. It seems that higher plastic deformationcould modify 𝑆0
3 towards a Gaussian state. On the other hand, the evolution of 𝑆𝑠𝑘proves that the �rst burnishing passes shi�s the height distribution towards positivevalues, whereas further plastic strain balances the peak-to-valley proportion of theresulting surface again, as it reaches value zero.
𝑆01 exhibits a di�erent behaviour, again consistently with the observations made
for 𝑆𝑞. 𝑆𝑘𝑢 reaches a value of 3 for testing conditions 180N–3passes, then falls onceagain when increasing to 5 passes. Its behaviour is irregular in the following tests,but reaches 3 again at tests 270N–3passes and 270N–5passes, although the former isclearly positively skewed. �e evolution of skewness has similarities with the resultson the other two initial textures, as it �rst decreases, whereas a value next to 0 isachieved when burnishing with 180N–1pass. It then increases and decreases onceagain to a minimum value at 270N–5passes.
According to the discussed results, both parameters show a certain cyclic evolu-tion in 𝑆0
1 , clearly linked to the surface regeneration detected in the other amplitudeand spatial parameters. As the surface is recon�gured along the burnishing direction,with a consequent transient phase where it presents detrimental e�ects, the heightdistribution is unbalanced until achieving another enhanced state, represented by
124

5.1. GEOMETRICAL PARAMETER: SURFACE TEXTURE
Figure 5.11. 𝑆𝑠𝑘 and 𝑆𝑘𝑢 amplitude parameters of AISI 1038 VABB patches.
270N-5passes. On the contrary, 𝑆02 and 𝑆0
3 reveal an evolution towards a Gaussianstate, and the referred cyclic e�ect has not been observed. It would seem that it couldbe achieved by applying higher preload and number of passes.
Furthermore, the e�ect of VABB on kurtosis and skewness can hardly lead thesurface to states far from Gaussian, probably because of the interaction of the ballwith the surface, which creates new peaks but is able to convert them into valleyswith subsequent passes. �ese new peaks are originated by the pile-up e�ect thatmaterials present when they are plastically deform, due to strain hardening.
�is analysis can be complemented by checking on the VABB surface height dis-tributions. Figure 5.12 includes the histograms of the original surfaces in the �rst col-umn, followed by the ones resulting from the best burnishing conditions that werealready included in Table 5.2, along with another singular surface state a�er VABBfor the purposes of comparison. A Gaussian-bell distribution can be observed at theheight histograms obtained a�er the best VABB parameters to treat surfaces 𝑆0
1 and𝑆02 . �e histogram obtained for the optimal test for 𝑆0
3 , #27, suggests that the surfacecould still accept a higher force to increase the kurtosis without biasing the skewness,and therefore the Gaussian bell is not totally shaped yet.
Although skewness values are easily identi�ed in the histogram shape –positivevalues are depicted by the concentration of heights at the negative side, and viceversa–, interpreting the kurtosis values is not trivial. Indeed, no purely platykurtic
125

CHAPTER 5. EXPERIMENTAL RESULTS AND DISCUSSION
Figure 5.12. AISI 1038 height histograms of VABB tests on 𝑆01 (top), 𝑆0
2 (middle), and 𝑆03
(bo�om), optimal results (framed), and another reference test.
or leptokurtic distributions can be observed at the depicted histograms. �e answerlies in the fact that kurtosis is actually a measurement of the relative weight of thetails with regards to the distribution central areas. As Darlington (1970) [19] pointedout, kurtosis can be also associated to distribution bimodality, which is the case ofburnishing surfaces far from the ideal �nishing state (for instance, test #27 with 𝑆𝑘𝑢= 2.266). �erefore, the evolution of kurtosis can be understood as a description ofthe evolution from multimodal height distributions to unimodal ones. �e describeddisappearance of bimodality as the optimal testing conditions are reached, along witha balancing e�ect of positive and negative heights can be easily distinguishable bycomparing the complete sequence of histograms, which is included in Appendix Bfor every initial surface.
Synthesis S amplitude parameter optimisation in AISI 1038�e optimal VABB parameters de�ned considering 𝑆𝑞 minimisation as the optimisa-tion target, also result in Gaussian or quasi-Gaussian height distributions –unskewedand kurtosis near to 3. In other words, texture enhancement through VABB impliesminimal RMS of heights with respect to the average centre plane min{𝑆𝑞} combinedwith an balanced Gaussian height distribution –𝑆𝑠𝑘 = 0 & 𝑆𝑘𝑢 = 3–. �is kind ofsurfaces combine good lubrication and bearing characteristics, and can be therefore
126

5.1. GEOMETRICAL PARAMETER: SURFACE TEXTURE
considered appropriate optimisation targets.
Having explored all amplitude parameters, the next subsection considers whetherthe VABB process changes the directionality of the surface features, or has any impacton the spatial height distribution.
5.1.1.6 Sal, Str spatial, Sdq hybrid and Std miscellaneous parameters
�e 𝑆𝑑𝑞 hybrid parameter, as the RMS slope of the surface irregularities, reveals a sim-ilar decreasing trend with the increasing level of plastic deformation, which provesthat higher deformation leads the surface to a more near-to-�nished state (Figure5.13). On the contrary, both spatial parameters prove to be modi�ed to a lower extentby e�ect of VABB. On one hand, 𝑆𝑎𝑙 shows li�le variation with the increase of 𝐹𝑝 and𝑛𝑝. On the other hand, 𝑆𝑡𝑟 values range between 0.06 and 0.1, con�rming that theorthotropic nature of the original surfaces is kept a�er VABB.
As for the texture direction parameter, 𝑆𝑡𝑑, it is kept at -90○ for all tests, exceptfor #21, #23 and #25, whereby the value is zero. �ose tests are the ones performedon the 𝑆0
1 with the highest preload. �e only change of 𝑆𝑡𝑑 in these speci�c testsmeans that VABB reduces e�ectively the texture amplitude descriptors in all cases,but it is only able to recon�gure the directionality of the main super�cial features onthe �nest surface when a high preload is applied. �is observation is an evidence ofwhat was already observed, about the VABB process being detrimental to the surfacetexture when a too high preload is applied.
�e described e�ect is not observed in the 𝑆02 and 𝑆0
3 surfaces, because the max-imum preload applied on them is not enough to cause it. Consequently, the initialmachining marks are maintained. As an example, Figure 5.14 shows both the initial𝑆03 surface, and its state a�er burnishing with 270N–5passes (test #27). Although the
e�ects of burnishing are conspicuous, the reader may note that the original �nishinggrooves caused by the nose of the hemispherical tool, are unaltered a�er burnishing.It is the initial peaks the ones that are actually a�ected by the plastic deformation,whereas valleys remain untouched. Hence the maintenance of the original preferen-tial direction, clearly driven by these unaltered paths generated during machining.For further graphical evidence of the unchanged texture direction in most of the sur-faces except for tests #21, #23 and #25, all sequential colour maps of all VABB surfaces
127

CHAPTER 5. EXPERIMENTAL RESULTS AND DISCUSSION
Figure 5.13. 𝑆𝑎𝑙 and 𝑆𝑡𝑟 spatial parameters and 𝑆𝑑𝑞 hybrid parameter of AISI 1038 VABBpatches.
can be consulted in the appended Figures B.1 to B.3.
Figure 5.14. Optical images of 𝑆03 and #27VABB surfaces.
Synthesis S spatial parameter discussion in AISI 1038�e VABB process is only capable of changing the directionality of ball-end milledsurfaces if a threshold preload value is surpassed. �e immediate consequence is adetrimental e�ect on the surface that is again corrected as more plastic deformationis performed. An ulterior enhanced surface state is observed, but the preferentialdirection of the surface features results inverted according to the direction of VABB.�at threshold value is lower the more �ne the initial surface is. For that reason ithas only been found for 𝑆0
1 . �e insu�cient plastic deformation applied on 𝑆02 or 𝑆0
3
is exempli�ed by the machining marks being still visible a�er VABB.
128

5.1. GEOMETRICAL PARAMETER: SURFACE TEXTURE
5.1.1.7 Abbo�-Firestone descriptive curves
So far, the analysis of amplitude parameters has proved that the VABB process reducesthe scale of the target surface, and succeeds in redistributing the height histogramtowards a Gaussian distribution. �e next issue to tackle is �nding an answer thefollowing question: do the AF curves reveal further information about the nature ofthe VABB surfaces? For a �rst approach, let us consider those corresponding to theoptimal and singular tests in each original surface that were included above in Figure5.12. Graphically, surface improvement is brought to light by the AF curves as theyare sequentially �a�ened (Figure 5.15). �e highest surface enhancement deliveredby VABB was observed in test #13 on surface 𝑆0
1 . �e ulterior harm at the surfaceby increasing the preload and number of passes, exempli�ed by test #21, is depictedby a rebound of the whole AF curve towards the original state. As usual, 𝑆0
2 and 𝑆03
exhibit a di�erent behaviour, as the bearing curves become �a�er as plastic strainincreases, and no harmful e�ect is observed in any test. Figure B.5 in the Appendixshows the sequential evolution of all AF curves for a higher comprehension of thee�ect. In overall, the highest improvement seems to be a�ained at the 𝑆0
1 surface byapplying 180N–3passes, which also derives in the highest bearing capacity.
�e skewness and kurtosis descriptors of the surfaces also have a representationin the AF curves. �is is obvious, as these are an alternative representation of heights,showing the accumulated function from the same dataset. Zero skewness (unbiasedheight distributions) is associated to curves that cross the 𝑥 axis at the middle point(𝑀𝑟= 50%). For instance, test #17, negatively skewed, is represented by a bearingcurve which intersect the 𝑥 axis at 55%.
Identifying the platykurtic or leptokurtic nature of the surface on these curvesis not such a direct task. Platykurtic burnishing patches are characterised by 𝑆𝑘𝑢 <3, which also denotes the bimodality of the height distribution. Consequently, theyshould be re�ected in the AF curves as an abrupt gradient change, which could evenderive in convexity alternations. At sight of the exemplifying curves shown in Figure5.15, there are visible convexity changes present at low and high 𝑀𝑟 values. As thepreload and number of passes increase towards the optimal value, the texture evolvestowards a Gaussian value of kurtosis, which is re�ected by an increase of �atness ofthe curve, while the slope decreases at every point and no convexity change is furtherpresent.
To visualise this e�ect of VABB on the accumulated height distribution, Figure 5.16
129

CHAPTER 5. EXPERIMENTAL RESULTS AND DISCUSSION
Figure 5.15. Singular AF curves with convexity change linked to platykurtic surfaces, anddetail showing 𝑆𝑠𝑘 related to 𝑥 intersection point.
represents the slopes of all tests in surfaces 𝑆01 and 𝑆0
3 , calculated through numericalderivative of their corresponding AF curves. In𝑆0
1 , slope functions are in general moreregular as the 𝐹𝑝–𝑛𝑝 pair increases until test #18. From that point, the slopes keep aregular behaviour, meaning that although higher plastic deformation leads to surfaceharm, it does not redistribute the surface towards the initial distributions, that showan abrupt convexity change at high 𝑀𝑟 values. Indeed, bimodality is permanentlydiscarded due to VABB execution. In the case of 𝑆0
3 , slopes stabilise as more plasticstrain is applied, until reaching the optimal conditions in test #27, where convexitychange in the AF curve is totally erased.
�e change in convexity is depicted in the slope representation as a local minimumor maximum. Geometrically, it can be related to a higher area between these curvesand the 𝑥 axis. Let Σ𝑠 be the area con�ned between the slope numerical functionof each test and the 𝑥 axis. It can be calculated by numerical integration of the slopefunctions. �e representation of 𝑆𝑘𝑢 against Σ𝑠 in Figure 5.17, evidences a clear linearcorrelation between them, con�rming the hypothesis that allows the identi�cation
130

5.1. GEOMETRICAL PARAMETER: SURFACE TEXTURE
Figure 5.16. AF curve slopes of all 𝑆01 and 𝑆0
3 tests.
of kurtosis with convexity changes in the AF curves. �is �nding shall be especiallyrelevant for the analysis to come in the next subsection, where the curves are reducedto quantitative parameters.
Figure 5.17. Linear correlation between 𝑆𝑘𝑢 and Σ𝑠VABB tests.
5.1.1.8 Abbo�-Firestone descriptive parameters
�e representation of the AF curves by a set of speci�c parameters can help to sim-plify them in a functional fashion, and can help to systematise the analysis of VABBresults through these curves. Volumetric descriptors have been represented in Figure5.18. �e value of both core parameters, 𝑉𝑚𝑐 and 𝑉𝑣𝑐, fall as the degree of plastic de-formation increases, with the regular rebound when changing from 180N–5passes to270N-1pass. �is trend is consistent with the decrease in surface texture amplitudedetected through the S amplitude parameter analysis. For 𝑆0
2 and 03, the evolution of
131

CHAPTER 5. EXPERIMENTAL RESULTS AND DISCUSSION
𝑉𝑣𝑣 is not so regular. Although it seems to decrease in general as the optimal param-eters are achieved, its evolution has ups and downs that make it uneven. Similarly,𝑉𝑚𝑝 is evidently minimum for the best burnishing conditions, but it exhibits an errantevolution as the degree of plastic strain increases, lacking a de�ned pa�ern. On thecontrary, for 𝑆0
1 , it seems to account well enough for the creation of new peaks andvalleys corresponding to the cyclic phenomenon explained for the �nest surfaces. Asa consequence, these parameters do not exhibit a speci�c relation between processparameters for all surfaces, and their e�ect on the resulting extreme volumetric de-scriptors. Not all V parameters serve to represent the e�ects of VABB on a certainsurface.
Figure 5.18. Volumetric parameters of AISI 1038 burnishing patches.
�e extreme amplitude descriptors of the AF curve are according to the volumetricparameters, as shows Figure 5.19. �e core material amplitude, 𝑆𝑘, decreases as thepreload and number of passes increase, and is minimum for optimal tests #13, #24and #27. On the contrary, 𝑆𝑝𝑘 and 𝑆𝑣𝑘 do not provide reliable information about theevolution of the bearing pro�les. For instance, 𝑆𝑣𝑘 stabilises in a single value fromtest #13 to #25 in surface 𝑆0
1 , and does not experience variation from test #3 to #7tests in 𝑆0
3 . It then rebounds, achieving a maximum value in test #17. Again, the coreparameter agrees with the e�ects observed before, but the extreme descriptors arenot so clearly related to the process parameters.
�e bearing potential of the derived surfaces can also be checked through the val-ues of the lowest and highest bearing area percentages,𝑀𝑟1 and𝑀𝑟2 (Figure 5.20). As
132

5.1. GEOMETRICAL PARAMETER: SURFACE TEXTURE
Figure 5.19. AF amplitude parameters of AISI 1038 burnishing patches.
expected, they also lead, in some cases, to dubious conclusions about the evolutionof the surface a�er VABB. 𝑀𝑟2 evolves in all 𝑆0
1 tests by growing and stabilising fromtest #13, consistently with 𝑆𝑣𝑘. �at e�ect is obvious, since 𝑀𝑟2 denotes the domin-ion of 𝑆𝑣𝑘 in the curve. In 𝑆0
1 and 𝑆02 , 𝑀𝑟2 increases until the optimal parameters
are applied. However, this e�ect is not observed in 𝑆03 , where 𝑀𝑟2 is maximum in
tests performed with 90 N, and then decreases. 𝑀𝑟1 is not more regular. Intuitively, itshould increase as the optimal conditions are achieved, since it is associated to an in-crease in the bearing capacity. However, it does not happen like that. Furthermore, itis also uneven in its pa�ern, following di�erent trends in all three surfaces, hinderingthe task of �nding a correlation with VABB parameters.
In overall, the V parameters have proved that only the core descriptors seem torepresent well enough the scale reduction of the surfaces, whereas the reliability ofthe change scale reduction of surface texture can be questioned. Neither do the 𝑀𝑟
values prove descriptive potential of the process results. �is is obvious, as theseextreme parameters do not depend on the 40% minimum slope secant method usedto calculate the boundaries between the core and the peaks and valleys. �ey dependdirectly of the AF curve, which can have any extreme values. �is idea can be relatedto the observation done about 𝑆10𝑧 at the beginning of this chapter. For that reason, itis worth questioning at this point whether the V parameter set can help to explain ina systematic fashion the evolution of surface topology a�er increasing plastic strainthrough VABB. �e word systematic is here crucial, as the ultimate aim of this analysis
133

CHAPTER 5. EXPERIMENTAL RESULTS AND DISCUSSION
Figure 5.20. AF bearing percentages parameters of AISI 1038 burnishing patches.
is detecting a pa�ern in the evolution of the surface heights as the preload and numberof passes increase.
Can the source of this lack of de�nition be in the method through which thedescriptors are obtained? In the previous subsection, the evolution of kurtosis wasassociated to convexity change reduction in the AF curves. �at irregular shape couldbe the reason of the errant behaviour of most of the V parameters. To prove it, the least40%-slope method has been reproduced by importing the di�erent datasets in a Matlabroutine, and calculating the value of the least gradient secant line spanning 40% ofbearing area or each of them, denoted 𝑚𝑚𝑖𝑛, , as well as the 𝑥 coordinate of the �rstsecant point, 𝑀𝑚𝑖𝑛 (Figure 5.21). De�ned 𝑚𝑚𝑖𝑛, the 𝑆𝑘 parameter is unambiguouslyde�ned:
𝑆𝑘 = 40𝑚𝑚𝑖𝑛 (5.1)
To check whether the least slope secant method o�ers a systematic calculation ofthe AF curves, a possible correlation between𝑚𝑚𝑖𝑛 and𝑀𝑚𝑖𝑛 and each curve descrip-tor is veri�ed in Figure 5.22. �e parameters which reliably re�ected the evolution ofVABB surfaces, 𝑉𝑚𝑐, 𝑉𝑣𝑐, 𝑆𝑘, show clear linear correlations with the 𝑚𝑚𝑖𝑛 descriptor.Speci�cally, the perfect �t between 𝑆𝑘 with 𝑚𝑚𝑖𝑛, direct consequence of the way itis calculated (Eq. 5.1), serves as a con�rmation of the adequacy of the reproducedmethod, and the doubt about the reliability of extreme values that was already com-mented above. Secondary inverse correlations can be observed against 𝑀𝑚𝑖𝑛, which
134

5.1. GEOMETRICAL PARAMETER: SURFACE TEXTURE
Figure 5.21. Nomenclature of parameters describing the AF curve and the least slope methodapplied to obtain the core area.
could evidence a certain relation but in no case a regular pa�ern. As 𝑀𝑚𝑖𝑛 dependson the shape of the curve, this could lead to think. 𝑀𝑟1 and 𝑀𝑟2 are directly corre-lated to 𝑀𝑚𝑖𝑛, but only the former shows a linear relationship. On the contrary, theparameters showing an errant behaviour (𝑉𝑣𝑣, 𝑉𝑚𝑝, 𝑆𝑣𝑘, 𝑆𝑣𝑘) are not related to 𝑚𝑚𝑖𝑛
or 𝑀𝑚𝑖𝑛. In overall, this analysis leads to think that not all items inside the V param-eter set can be considered as relevant descriptors of the evolution of VABB results asthe 𝐹𝑝-𝑛𝑝 pair increase.
Figure 5.22. Correlation between AF parameters and the least slope curve traced to calculatethem. Surfaces: 𝑆0
1 : ○ 𝑆02 : × 𝑆0
3 : △. Descriptors: Blue: 𝑚𝑚𝑖𝑛. Green: 𝑀𝑚𝑖𝑛.
In the analysed graphs, it is especially remarkable the divergence of the points of
135

CHAPTER 5. EXPERIMENTAL RESULTS AND DISCUSSION
tests #3, #5 and #7 in many of them, meaning that these are singular cases that shouldbe taken into consideration, and can help to clear out the way the method should beinterpreted. Figure 5.23 represents graphically the least slope secant method throughthe calculated lines on each of the aforementioned AF curves. Apparently, an abruptchange in convexity of the curves at low 𝑀𝑟 values displaces the position of the leastslope secant line to the other extreme of the curve. Inversely, the AF curve resultingfrom test #17, that presents that convexity change at its tail, has caused an inversee�ect. �e AF curves for the optimal tests #13 and #27, essentially �at, derive in secantlines positioned in intermediate sections of the AF curve.
Figure 5.23. Secant according to ISO 10350 to calculate the AF descriptive parameters.
If, in fact, convexity change has to do with a miscalculation of 𝑚𝑚𝑖𝑛 and 𝑀𝑚𝑖𝑛, itcan be checked by using the kurtosis parameter, that was presented in the previoussubsection as an indicator of that convexity change associated to bimodality. �ecorrelation of 𝑚𝑚𝑖𝑛 and 𝑀𝑚𝑖𝑛 with the 𝑆𝑘𝑢 statistic in Figure 5.24.a, except for tests#3, #5 and #7, could leads to the conclusion that irregular convexity changes in the AFcurves can lead to a lack of reproducibility of the method, and, therefore, an incorrectcomparative between tests. �is result does not imply that this method is not validto analyse surfaces individually, but must be taken into account to compare di�erenttopologies, especially if the kurtosis value is not regular enough. �e calculation ofthe minimum slope method parameters can also prove that the reduction of 𝑆𝑞 is also
136

5.1. GEOMETRICAL PARAMETER: SURFACE TEXTURE
linked to a �a�ening e�ect of the AF curves, as the absolute value of 𝑚𝑚𝑖𝑛 increaseswith an increase of 𝑆𝑞, at sight of Figure 5.24.b.
(a) (b)
Figure 5.24. Correlation between AF parameters with a. 𝑆𝑘𝑢, and b. 𝑆𝑞 .
Synthesis Abbott-Firestone curves of AISI 1038 VABB tests�e V parameter analysis has proved that only the core descriptors of the AF curvesrepresent well enough the evolution of surface textures a�er VABB. Although theydo not add further information with regards to the S amplitude parameters, they canbe considered for lubrication or wear applications where the expression of surfacetexture is more conveniently represented in volumetric terms. Furthermore, the reli-ability of the extreme parameters to explain the sequential evolution of surface texturehas been evidenced, due to a lack of uniformity to apply the 40% minimum slope se-cant method proposed by the standard to establish the di�erentiation between core,peak and valley areas of the surface.
5.1.1.9 Comparison of VABB to the NVABB process
�e direct comparison of VABB results with the NVABB tests included in this subsec-tion allows the relative e�ect of each process on the �nal texture. Figure 5.25) rep-resents all 𝑆𝑞 results of both processes, exhibiting that the NVABB can lead to lowervalues, especially on the 𝑆0
2 and 𝑆03 surfaces. �e results seem to be of the same order
for 𝑆01 . At sight of this observation, it can be concluded that the vibration-assisted
process leads to detrimental results in higher scale surfaces. Its negative e�ect is re-duced as the surface has smaller amplitude features, as is the case of 𝑆0
1 . �e causalityof this phenomenon cannot be known, but some clues can be inferred from previous
137

CHAPTER 5. EXPERIMENTAL RESULTS AND DISCUSSION
results. For instance, the higher infuence of the process on the directionality of the 𝑆01
could lead to think that the engagement of the ball and the material of the surface ishigher in this kind of textures, thus increasing the e�ect of the vibration-assistance.
Figure 5.25. Direct comparison of the 𝑆𝑞 parameter of VABB and NVABB tests on AISI 1038.
From a qualitative point of view, both surface states have been observed by SEMinspection. �e initial machined surface shows a typical repetitive pa�ern caused bythe plastic deformation of the remaining material on the surface. Figure 5.26 showsa detail of that pa�ern, which appears to be completely deformed a�er VABB andNVABB. Although the surface appears to be similarly deformed by both processes,NVABB seems to lead to characteristic scratches on the material along the burnish-ing sense. �ese scratches could be the source of crack nucleation during function-ing in service. �eir prevention through the VABB process could be explained bythe alternative vertical displacement experienced by the ball during the process, thatdecreases the detrimental interaction with the surface, and, therefore, prevents thecreation of these marks.
At sight of the absence of these marks on the VABB process, the vibration-assistedprocess can be presented as a more convenient operation to �nish an unharmed sur-face with lower roughness, albeit the slightly higher texture amplitude parameters.
As for the heights distribution, compare the 𝑆𝑠𝑘 and 𝑆𝑘𝑢 parameters a�er VABBand NVABB are directly compared in Figure 5.27, by representing both parameters in
138

5.1. GEOMETRICAL PARAMETER: SURFACE TEXTURE
Figure 5.26. SEM images of the 𝑆01 surface burnished by 5 passes and the nb strategy. NVABB
surfaces show scratches along the feed direction.
the Cartesian plane. �is technique can help to characterize the nature of surfacesa�er �nishing through a certain process, as explained by Gri�ths (1986) [47]. Allresults prove to be contained inside a tear-shaped enclosed area. �erefore, bothprocesses are similar in terms of heights distribution a�er the operation, although theconcentration of VABB tests at negative skewness positions shows that NVABB is ableto generate less skewed surfaces. In the same graphic, two outliers can be observed:tested conditions #13 and #21. �e �rst set of burnishing parameters executed by theNVABB shows a high kurtosis, whereas the second ones show an especially positive-skewed surfaces.
5.1.1.10 Synthesis of topological results on AISI 1038
Both the VABB and the NVABB have proved to enhance the di�erent surface in-tegrity aspects of AISI 1038 ball-end milled surfaces. �e topological state of VABBand NVABB surfaces have been analysed, proving that two-dimensional parameterscannot represent their condition from a functional point of view. Furthermore, notall three-dimensional parameters succeed in accounting for the evolution of textures,which can be explained as follows:
139

CHAPTER 5. EXPERIMENTAL RESULTS AND DISCUSSION
Figure 5.27. Skewness and kurtosis amplitude parameters represented for all VABB andNVABB tests.
• Amplitude S parameters (𝑆𝑞, 𝑆10𝑧 , 𝑆𝑠𝑘 and 𝑆𝑘𝑢) reveal that VABB and NVABBsucceed in reducing the surface scale of di�erent AISI 1038 ball-end milled sur-faces, and lead to Gaussian or quasi-Gaussian height distributions.
• Spatial and miscellaneous S parameters (𝑆𝑎𝑙, 𝑆𝑑𝑞, and 𝑆𝑡𝑟) are not sensitiveenough to describe the evolution of surfaces a�er VABB and NVABB, due tothe fact that the process only deform the peaks of the surfaces, and cannoterase the mill-nose marks caused during machining
• Core Abbo�-Firestone parameters (𝑆𝑘, 𝑉𝑣𝑐, and 𝑉𝑚𝑐) exhibit the surface scalereduction, consistently with the amplitude S parameters.
• �e rest of the Abbo�-Firestone parameters cannot account for the evolutionof the surfaces due to VABB or NVABB, either because they are not sensitiveenough to detect that change, or because the 40% minimum slope secant linemethod used to divide the AF curve in core, peak and valley zones cannot beapplied on surfaces represented by bimodal height distribution. �at bimodalityis exhibited in the AF curves by abrupt convexity change.
In summary, the best burnishing conditions found for the NVABB process are thesame ones as for VABB. �e original texture has proved to be the most in�uential pa-rameter, achieving the lowest surface scale on 𝑆0
1 , and only the 𝐹𝑝–𝑛𝑝 pair exhibitedin�uence on the results. Considering all these observations, the best burnishing pa-rameters to �nish di�erent AISI 1038 surfaces can be established as Table 5.3 shows.In absolute terms, the lowest surface texture a�er both processes is obtained on 𝑆0
1
(shadowed in green in the table).
140

5.1. GEOMETRICAL PARAMETER: SURFACE TEXTURE
Table 5.3. Recommended parameters to ball-burnish AISI 1038 end-milled surfaces. Optimi-sation target: Gaussian surface with minimum texture amplitude.
Initialsurface Process 𝐹𝑝 (N) 𝑛𝑝
𝑣𝑓(mm/min) Strategy test scale reduction:
𝛥𝑆𝑞
𝑆01
VABB orNVABB 180 3 300-900 nb0, bn90/0
or bn0 #18 81.3%
𝑆02 NVABB 270 3 300-900 nb0, bn90/0
or bn0 #26 73.4%
𝑆03 NVABB 270 5 300-900 nb0, bn90/0
or bn0 #27 61.5%
�e previous table is based on the quantitative results delivered by VABB andNVABB processes, which have lead to similar results. However, from a qualitativepoint of view, SEM observations lead to conclude that the NVABB process exhib-ited scratching defects, apparently prevented through VABB. Consequently, for afunctional point of view, it is the la�er that should be preferred to avoid these sur-face defects that can harm the in-service performance of workpieces treated throughNVABB.
�e evolution of the amplitude parameters, height distribution histograms andAF curves has evidenced that the process always achieves its best results by simul-taneously reducing the texture scale, while generating Gaussian height distributions.�e evolution towards Gaussian surfaces can be explained due to the selective e�ectsof the ball burnishing process on the peaks of the surface topology. As they are de-formed plastically to reduce their scale, a secondary e�ect of piling up due to strainhardening also happens, generating new irregularities in the surface. �is processof peak generation followed by peak compression being generated simultaneouslyby the burnishing ball accounts for the described cyclic e�ect of VABB and NVABB,which can be de�ned as characteristic of both processes. In contrast, other other �n-ishing operations based on chip removal, eliminate the material causing the escalationof the surface kurtosis towards high values.
�is cyclic e�ect is represented by the existence of a critical 𝐹𝑝–𝑛𝑝 pair for eachsurface, i.e. the optimal pair found for each surface, from which higher plastic de-formation leads to immediate surface harm. Further plastic strain degree results ina return to an optimal state. �is e�ect was evidently observed for the 𝑆0
1 surface,where a �rst optimal level was found at 180N–3passes, and the ulterior return to thesame surface texture was achieved with 270N–5passes. On the contrary, that point
141

CHAPTER 5. EXPERIMENTAL RESULTS AND DISCUSSION
was not reached in the 𝑆03 texture, leading to think that the maximum plastic strain
delivered by 270N-5passes could be still achieved by a higher preload.
5.1.2 Ti-6Al-4V
�e analysis of topological results on the AISI 1038 workpiece has lead to identify thekey parameters with which it is necessary to tackle to wholly de�ne the topologicale�ects of VABB on di�erent surfaces. Consequently, the results shown in this subsec-tion for the Ti-6Al-4V patches take advantage of those observations to synthesise thestudy and focus on the descriptors that actually deliver information about the processresults. First, the three original surfaces are described.
5.1.2.1 Topologies of the original surfaces
�e surfaces machined on the Ti-6Al-4V workpiece present the two-dimensional pa-rameters represented in Figure 5.28. �ese values represent the increasing scale of thesurface features, being the surface 𝑆0
1 the smallest. Although the trend is similar asthe one presented in the AISI 1038 workpiece, the absolute magnitudes are lower forall surfaces. For instance, 𝑆0
2 of Ti-6Al-4V can be can be considered in the same wayas 𝑆0
1 in the AISI 1038 workpiece. �is issue shall not be momentarily considered, andshall be resumed at the end of the section.
Figure 5.28. Bidimensional descriptors of original surfaces (Ti-6Al-4V).
Surface parameters depicted in Figure 5.29.a and 5.29.b are also highly descrip-tive of the increasing trend of all surfaces as they were machined with higher o�set
142

5.1. GEOMETRICAL PARAMETER: SURFACE TEXTURE
between end-ball milling passes. �e maximum decay length of the autocorrelationfunction 𝑆𝑎𝑙 also grows, showing the larger spacing between the surface features. �esecond spatial parameter 𝑆𝑡𝑟 presents values lower than 0.1 in all cases. Although thisvalue is lower for the 𝑆0
3 , the anisotropy of all three surfaces can be acknowledged. Asfor the descriptors of the AF curves, the ones referring to the core material are highlyconsistent with the observations commented above, as shows Figure 5.29.c. Both thecore material and the peak material increase from surface 𝑆0
1 to 𝑆03 .
(a) (b)
(c) (d)
Figure 5.29. S parameters describing the initial surfaces of Ti-6Al-4V. a. Amplitude parame-ters. b. Spatial and hybrid parameters. c. AF parameters. d. Volumetric parameters.
Synthesis Original Ti-6Al-4V surfacesIt is con�rmed that the surfaces machined on the Ti-6Al-4V workpiece are compar-atively of higher scale as the lateral o�set between hemispherical tool passes wasincreased, at sight of the S amplitude parameters and the Abbo�-Firestone curves.�erefore, it can be stated that all surfaces have been conveniently machined, andare representatively di�erent to represent the in�uence that they introduce in theapplication of VABB.
143

CHAPTER 5. EXPERIMENTAL RESULTS AND DISCUSSION
5.1.2.2 Sq and S10z amplitude parameters
�e graphical results of the ANOVA considering 𝑆𝑞 as response variable are repre-sented in Figure 5.30. �e initial topology is again the most important factor on thevariation of the amplitude parameters. In fact, its e�ect is so remarkable, that thesources of variation due to the rest of the factors are hidden by it. Alternatively,the p-values associated to the statistical tests were consulted, revealing that only thepreload is an in�uential e�ect on the response, if a 5% signi�cance level is considered.
Figure 5.30. VABB mean e�ects, S/N ratios and interaction plots. ANOVA response variable:𝑆𝑞 of Ti-6Al-4V.
All texture parameters have been ordered by increasing preload, as were duringthe AISI analysis, consistently with the resulting ANOVA calculations. Figure 5.31.ashows that the continuous decrease of extreme points, represented by 𝑆10𝑧 , as well asof the general amplitude parameter 𝑆𝑞, can be observed in all surfaces. However, nolimit value is achieved in any of the three surfaces, revealing that further improve-ment could be achieved by a higher degree of plasti�cation. An alternative represen-tation of 𝑆0
1 is presented in Figure 5.31.b to appreciate the decrease of the amplitudevalues in a proper scale. In essence, the maximum 350N–5passes pair has provedto deliver the best results in terms of topological scale reduction in the three initialtextures.
144

5.1. GEOMETRICAL PARAMETER: SURFACE TEXTURE
(a)
(b)
Figure 5.31. a. 𝑆𝑞 and 𝑆10𝑧 amplitude parameters of Ti-6Al-4V burnishing patches. b. Detailof 𝑆0
1 results.
5.1.2.3 VABB optimal parameters according to Sq
Due to the fact that the in�uence of the di�erent factors on the surface texture inthe Ti-6Al-4V is similar as the one found for the steel alloy, the same optimisationprocedure proposed in Figure 5.10 can be followed. �e term optimal parametersrefer to those factors that generate the lowest scale on the surface. �ey are includedin Table 5.4. �eir identi�cation with the real experiments #23, #26 and #27 allowthe calculation of the relative texture reduction with regards to the initial surface,and prove quantitatively that they are indeed maximum for each initial texture. Atsight of the results, the surface 𝑆0
1 exhibits a higher a�ectation a�er VABB, with a60.3% 𝑆𝑞 reduction. Conjoint to the evolution of the factor observed in the previoussubsection, these results suggest that surfaces𝑆0
2 and𝑆03 can still accept further plastic
145

CHAPTER 5. EXPERIMENTAL RESULTS AND DISCUSSION
deformation.
Table 5.4. Parameters to apply VABB on Ti-6Al-4V end-milled surfaces, based on ANOVAmean results. Optimisation target: minimum texture amplitude.
Initialsurface 𝐹𝑝 (N) 𝑛𝑝
𝑣𝑓(mm/min) Strategy test scale reduction:
𝛥𝑆𝑞
𝑆01 350 3 300-900 nb0, bn90/0
or bn0 #23 60.3%
𝑆02 350 5 300-900 nb0, bn90/0
or bn0 #26 28.9%
𝑆03 350 5 300-900 nb0, bn90/0
or bn0 #27 25.7%
�e origin of the lower a�ectation of the Ti-6Al-4V, if compared with the AISI al-loy, can lie on the higher yield strength of the �rst one, which requires higher preloadlevels to experience residual plastic strain. �e following subsection tackles with thecharacteristics of the height distributions generated a�er VABB, to add more infor-mation to this observation. Furthermore, it is necessary to contrast the optimal pa-rameter set found above, based on 𝑆𝑞 reduction, with the aim of obtaining Gaussiandistributions through that set.
5.1.2.4 Ssk and Sku amplitude parameters
�e evolution of skewness and kurtosis amplitude descriptors as more plastic strainis performed on each initial texture are represented in Figure 5.32. In all cases, theapplication of VABB recti�es the skewness of the original surfaces, by reducing tolevels near zero. In 𝑆0
1 , skewness is partially lead to a negative value for test #11, butthe absolute value is so small that it can be assimilated to an unskewed state. In thecase of 𝑆0
2 and 𝑆03 , the fact that they depart from a higher positive skewness is more
representative of the e�ects of VABB, since this parameter is reduced as the preloadand number of passes are increased, until it reaches zero with the maximum 𝐹𝑝–𝑛𝑝pair.
�e kurtosis factor is not so sensitive to the increase of plastic strain. In fact, thevalues along the di�erent tests are kept practically equal to the original values in thecase of 𝑆0
2 and 𝑆03 . �erefore, the VABB process can only account for the scale reduc-
tion in this kind of textures, but does not essentially change the height distribution.
146

5.1. GEOMETRICAL PARAMETER: SURFACE TEXTURE
Figure 5.32. 𝑆𝑠𝑘 and 𝑆𝑘𝑢 amplitude parameters of Ti-6Al-4V burnishing patches.
On the contrary, 𝑆01 presents an increase of the kurtosis parameter as the maximum
𝐹𝑝–𝑛𝑝 pair is reached. Nevertheless, 270N–1pass is the pair that can be associated tothe Gaussian state of 𝑆0
1 a�er VABB.
Now, let us identify the explained 𝑆𝑠𝑘 and 𝑆𝑘𝑢 behaviour with the evolution ofheight histograms as plastic strain is increased. Figure 5.33 depicts a sequential rep-resentation of the histograms of the tests corresponding to the optimal parameterset (shown above in Table 5.4), along with an intermediate test to depict the evolu-tion from their respective raw states. Only is in 𝑆0
1 the e�ect of VABB conspicuous,in terms of bimodality neutralisation and surface scale reduction. Indeed, test #21presents a Gaussian height distribution with lower extreme points.
Much on the contrary, bimodality cannot be erased from surface𝑆03 , as it is present
along all tests. Consequently, for this kind of surface, the VABB process proves to re-duce the scale of its texture, as revealed the analysis of 𝑆𝑞 factor, but it is not ableto change the height distribution. �e behaviour is similar for the 𝑆0
2 surface. �emaintenance of a low kurtosis value on the most abrupt surfaces in Ti-6Al-4V, re-gardless of the applied preload, could be due to two reasons. First of all, as the Ti-6Al-4V can be described as ductile, the pile-up e�ect is more accused, and, therefore,a predominance of extreme height values is always present, no ma�er the degree ofplastic deformation achieved on the surface. �at predominance is represented in theheight histogram as peaks at the lowest and highest points. For additional graphicalinformation about this ma�er, the complete histogram sequence can be found in the
147

CHAPTER 5. EXPERIMENTAL RESULTS AND DISCUSSION
Figure 5.33. Ti-6Al-4V height histograms of VABB tests on 𝑆01 (top), 𝑆0
2 (middle), and 𝑆03
(bo�om), optimal results (framed), and another reference test.
Appendix at Figure C.4.
Synthesis S amplitude parameter optimisation for Ti-6Al-4V�e optimal parameters have been found for each surface machined on the Ti-6Al-4V workpiece. Results support the idea of surface enhancement is a�ained throughsimultaneous scale reduction while obtaining Gaussian height distribution, but onlyin the �nest surface 𝑆0
1 . On the contrary, while 𝑆02 and 𝑆0
3 surfaces register scalereduction, its e�ects are not so remarkable, and the nature of height distributions arehardly modi�ed as plastic deformation is increased. In general terms, the titaniumalloy has proved a lower a�ectation by VABB than the steel alloy, although the appliedpreloads have been higher.
Having analysed the amplitude parameters, the next subsection tackles with spa-tial and hybrid parameters, to evaluate their representativity of the VABB e�ects.Prospects are not very clear, at sight of the antecedent observed for the AISI surfaces,where, although higher amplitude a�ectation was con�rmed, spatial parameters wereinsensitive to plastic deformation.
148

5.1. GEOMETRICAL PARAMETER: SURFACE TEXTURE
5.1.2.5 Sal, Str spatial, Sdq hybrid and Std miscellaneous parameters
�e visual inspection of spatial parameters do not deliver fundamental informationabout the variation of the surface directionality, as can be observed in Figure 5.34.𝑆𝑎𝑙 reveals stable values at each test, always enclosed inside a range near the valuecorresponding to the original surface. �erefore, it cannot be considered as a rep-resentative descriptor of the surface. 𝑆𝑡𝑟 is similar in its incapability to describe thesurface. Only the miscellaneous parameter 𝑆𝑑𝑞 seems to fall consistently with theaforementioned amplitude parameters, evidencing a stabilisation of the surface char-acteristics from a certain plasti�cation level in surfaces 𝑆0
1 and 𝑆02 , and a continuously
decreasing trend for 𝑆03 , in which VABB seems to be able to keep still an improving
potential by applying a higher preload.
Figure 5.34. 𝑆𝑎𝑙 and 𝑆𝑡𝑟 spatial parameters and 𝑆𝑑𝑞 hybrid parameter of Ti-6Al-4V burnish-ing patches.
In this case, the value of the main texture direction given by 𝑆𝑡𝑟 is kept at -90○,with no direction inversion as was observed in the AISI alloy. It con�rms the lowera�ectation of the Ti-6Al-4V alloy by the VABB process. To exemplify this statement,Figure 5.35 represents the raw 𝑆0
1 surface along with tests #18, performed with a suc-cession of perpendicular passes due to the bn90/0 strategy, and #25, executed throughthe nb0 strategy. �e raw Ti-6Al-4V surface shows clearly the marks of the end-ballmilling tool nose, which are not erased a�er VABB processing, neither through con-stant passes along one direction, nor with a change of directionality.
149

CHAPTER 5. EXPERIMENTAL RESULTS AND DISCUSSION
Figure 5.35. Optical images of 𝑆01 surface, and VABB tests #18 and #25.
�e colour map representation of the height distributions also depicts this lackof in�uence on the directionality of the surface. In order to exemplify it, Figure 5.36represents how the initial pa�ern that de�nes 𝑆0
3 is practically maintained, even withthe test performed with the highest𝐹𝑝–𝑛𝑝 pair, although the e�ects of deformation onthe peaks is clearly observed through the evolution of the height scale. Furthermore,even being the texture most a�ected by the process, 𝑆0
1 is hardly redistributed bye�ect of VABB with 350N–5passes. For further reference, Figures C.1 to C.3 in theappendix show the complete whole colour map collection.
Figure 5.36. Colour map of heights composing the VABB surfaces of singular tests.
Synthesis S spatial parameter discussion in Ti-6Al-4V�e Ti-6Al-4V surfaces keep in practice the same spatial and hybrid parameter levelsa�er VABB, with regards to their original surfaces. �is conclusion can be easilyidenti�ed with the AISI results, since both of them show that the trails caused by thehemispherical tool on the surfaces are not erased by VABB. �at pa�ern determinesthe preferential direction of the surface, regardless of the applied burnishing strategy.
150

5.1. GEOMETRICAL PARAMETER: SURFACE TEXTURE
5.1.2.6 Abbo�-Firestone descriptive curves and parameters
�e complete analysis performed through on the AISI 1038 material revealed that theAF curves do not reveal extra information about the resulting surface. However, theyconstitute an alternative approach to quantify the distribution of material accordingto a peak–core–valley di�erentiation that can be useful for functional calculations.�e 40% least gradient method applied to calculate the volumetric parameters alsoproved to be highly biased for surfaces showing a specially low kurtosis values, whichcould be translated into undesired convexity changes in the curve that invalidated themethod to systematise the topological analysis of the surface through the majority ofthe AF parameters.
�e described remarks are taken in this subsection as the basis to facilitate tacklingwith the titanium alloy results. First, the correlation between the 𝑆𝑘𝑢 parameter andthe slope change of the AF curves is con�rmed. Albeit the low values of kurtosis, theparameter representing the area con�ned between the slope curves and the 𝑥 axis, Σ𝑠,proves to be correlated with the core parameters derived from the processing of theAF curves, as shows Figure 5.37. Again, only the core parameters derived from theminimum slope method should be considered as reliable descriptors of the evolutionof the surface by e�ect of the VABB process. Indeed, only 𝑉𝑚𝑐 and 𝑉𝑣𝑐 (Figure 5.38),along with 𝑆𝑘 (Figure 5.39), show a decreasing trend as more plastic deformation isa�ained. �is observation evidences the scale reduction that was already evidencedthrough the amplitude S parameters.
Figure 5.37. Correlation between Σ𝑠 and 𝑆𝑘, 𝑉𝑚𝑐 and 𝑉𝑣𝑐 of VABB tests on Ti-6Al-4V.
A very di�erent case is evidenced by the rest of the extreme volumetric param-eters, that show the errant behaviour typical of surfaces represented by AF curveswith abrupt slope change, as the one that we are dealing with. �e case of the mate-rial ratios are hardly exploitable, as 𝑀𝑟2 is practically constant for all tests, and 𝑀𝑟1
151

CHAPTER 5. EXPERIMENTAL RESULTS AND DISCUSSION
Figure 5.38. Volumetric parameters of Ti-6Al-4V burnishing patches.
Figure 5.39. Abbot-Firestone amplitude parameters of Ti-6Al-4V burnishing patches.
reveals a contradictory behaviour, since it decreases in 𝑆02 and 𝑆0
3 , while it increasesin 𝑆0
1 tests. �e reduction of 𝑀𝑟1 should be the expected behaviour of the parame-ter, as is associated to AF curve �a�ening, what can be translated into an increaseof bearing potential of the surface. �e unexpected behaviour of the parameter forthe two roughest surfaces can only be explained by the inadequacy of the least slopemethod evidenced above.
�e slopes of the AF curves have been calculated, and represented in Figure 5.41.
152

5.1. GEOMETRICAL PARAMETER: SURFACE TEXTURE
Figure 5.40. AF bearing percentages parameters of Ti-6Al-4V burnishing patches.
Tests corresponding to surface 𝑆01 present a regular slope, except for the tests per-
formed with the lowest preload. On the contrary, all the resulting surfaces on 𝑆03
show constant convexity change, revealing that, indeed, the minimum slope methodis due to lead to biased results.
Figure 5.41. Slopes of AF curves resulting from VABB on the Ti-6Al-4V material, on 𝑆01 (le�)
and 𝑆03 (right).
�e analysis of the adequacy of the V parameter set, based on the method devel-oped in the analogous section of the AISI 1038 analysis, leads to conclude that thycannot be considered stable enough to deliver reliable information about the evolu-tion of material distribution in the surface as more plastic deformation is achieved.For further reference, AF curves can be observed in the Appendix Figure C.5.
153

CHAPTER 5. EXPERIMENTAL RESULTS AND DISCUSSION
Synthesis Abbott-Firestone curves discussion in Ti-6Al-4V�e core parameters inside the V parameter set have proved to be representative ofthe evolution of Ti-6Al-4V surfaces a�er VAB. �eir evolution support the idea ofsurface enhancement by scale reduction and, in the case of 𝑆0
1 , �nal Gaussian heightdistributions. Considering the volumetric parameters does not add new informationabout the �nal surfaces, but o�ers an alternative approach to the subject for functionalapplications of surface metrology.
5.1.2.7 Comparison of VABB to the NVABB process
�e direct comparison of the 𝑆𝑞 parameter in of all VABB and NVABB tests performedon the Ti-6Al-4V workpiece leads to interesting results. Whereas 𝑆0
2 and 𝑆03 evidence
similar results, the process is capable of producing lower surface scale in 𝑆01 (Figure
5.42). �is result suggests that the introduction of vibrations as a mean of reducing thesurface scale is only e�ective on surfaces that are characterised by 𝑆𝑞 around 1 µm.Furthermore, the potential bene�cial e�ects of the process increases as the amplitudeof the surface decreases. �is statement was also true for the AISI surfaces. �isstatement reinforces the incidence that the initial texture has on the ball burnishingresults, as well as the e�ectiveness of the vibration-assistance.
5.1.2.8 Synthesis of topological results on Ti-6Al-4V
�e topological results obtained on the Ti-6Al-4V surfaces have been analysed basedon the strategy that was outlined a�er the AISI results. Indeed, the 𝑆 amplitude pa-rameters and the 𝑉 core parameters have been proved to describe correctly the soughtamplitude reduction and redistribution of the titanium surfaces to quantify textureimprovement. Again, the most in�uential parameter on the results was the initialsurface, followed by the 𝐹𝑝–𝑛𝑝 pair. Table 5.5 shows the best parameter combinationfrom a topological point of view. It can be observed that the maximum preload isrequired in all cases to achieve the best improvement.
�e in�uence of the initial surface on the Ti-6Al-4V material has exhibited inter-esting results in terms of process assistance. First of all, the introduction of vibrationshas proved to be positive to increase texture reduction only if the initial surface hasa reduced scale similar to the one shown by 𝑆0
1 . Secondly, no boundary 𝐹𝑝–𝑛𝑝 value
154

5.1. GEOMETRICAL PARAMETER: SURFACE TEXTURE
(a)
(b)
Figure 5.42. a. Direct comparison of the 𝑆𝑞 parameter of VABB and NVABB tests on Ti-6Al-4V. b. Detail of 𝑆0
1 results.
was observed in these surfaces, what leads to think that the Ti-6Al-4V could stillaccept higher preload to achieve higher plastic deformation.
5.1.3 Comparison of topological results of AISI 1038 and Ti-6Al-4V
�e results that were analysed for both materials individually have lead to concludethat they are di�erently a�ected through the VABB and NVABB processes. On onehand, AISI 1038 surfaces were not a�ected by the introduction of the vibration-assistance,while Ti-6Al-4V exhibited enhanced results by VABB only in the initial surface that
155

CHAPTER 5. EXPERIMENTAL RESULTS AND DISCUSSION
Table 5.5. Recommended parameters to ball-burnish Ti-6Al-4V ball-end milled surfaces. Op-timisation target: Gaussian surfaces with minimum texture amplitude.
Initialsurface Process 𝐹𝑝 (N) 𝑛𝑝
𝑣𝑓(mm/min) Strategy test scale reduction:
𝛥𝑆𝑞
𝑆01 VABB 350 3 300-600 nb0, bn90/0
or bn0 #23 60.3%
𝑆02
VABB orNVABB 350 5 300-900 nb0, bn90/0
or bn0 #26 28.9%
𝑆03
VABB orNVABB 350 5 300-900 nb0, bn90/0
or bn0 #27 25.7%
showed smallest features. In overall, the 𝑆01 surface were the ones delivering the best
results in both materials, by applying a di�erent set of burnishing parameters.
�e descriptors of the di�erent initial surface topographies were compared, asis shown in Table 5.6. �is direct contrast reveals that applying the same ball-endmilling parameters on both of them did not generate the same surfaces. In fact, thesteel 𝑆0
1 surface cannot be directly compared with its titanium homonymous. On thecontrary, it seems more alike 𝑆0
2 surface (aquamarine values inside the table). �atmeans that the titanium 𝑆0
1 has no direct equivalent in the AISI 1038 workpiece. Sinceit has been the topology that has proved to deliver be�er results by the introductionof vibrations in the process, it can be questioned whether the lack of in�uence ofvibration assistance in the AISI material has been caused by an insu�cient surfacereduced scale, being the AISI 𝑆0
1 surface excessively abrupt to perceive the in�uenceof vibration-assistance. For this reason, a second experimental phase was executedto tackle with this issue, as is described in the next subsection
Table 5.6. Main topology descriptors of machined surfaces, including 𝑆00 (AISI 1038).
𝑆𝑞 (µm) 𝑆10𝑧 (µm) 𝑆𝑠𝑘 𝑆𝑘𝑢AISI TA6V AISI TA6V AISI TA6V AISI TA6V
𝑆00 1.662 – 7.9547 – 0.653 – 2.3040 –𝑆01 5.058 1.243 20.839 9.503 0.144 0.415 1.642 2.686𝑆02 8.154 5.956 39.448 28.071 -0.038 0.602 1.839 2.017𝑆03 11.205 8.836 43.446 35.631 0.330 0.341 1.881 2.139
156

5.1. GEOMETRICAL PARAMETER: SURFACE TEXTURE
5.1.3.1 Second experimental execution: 𝑆00 on AISI 1038
A second test piece was machined by reducing the o�set length between passes duringthe milling operation, se�ing it to 𝑎𝑒 = 0.3 mm. �is surface has been called 𝑆0
0 tofollow the sequential denomination of textures. Its main descriptors are included inTable 5.6, con�rming that it can be assimilated to the Ti-6Al-4V 𝑆0
1 surface. �isnewly machined surface was subjected to VABB and NVABB by �xing the feed at 600mm/min and strategy at nb0. �e preload was varied at the same three levels –90, 180and 270 N– and 𝑛𝑝 was tested at 3 and 5 passes. A total of 12 new burnishing patchesresulted from this full factorial plan.
Figure 5.43 shows the main amplitude parameters of all tests performed on 𝑆00 .
All results are congruent with the observations that were discussed above. First, thein�ection point from where surface is damaged due to an excessive degree of plasticdeformation is found at 90N–5passes, lower than 180N-3passes found for 𝑆0
1 , prov-ing that lower scale surfaces require lower 𝐹𝑝–𝑛𝑝 pairs to achieve positive results. Ifa threshold level is surpassed the already described cyclic process of surface recre-ation and re-correction happens, by increasing the processing time unnecessarilyfrom the texture point of view. Furthermore, this pair is associated to 𝑆𝑘𝑢 near 3 andan unskewed surface, con�rming that surface texture improvement is also achievedin terms of a�aining a Gaussian height distribution by the application of these pa-rameters.
Figure 5.43. Amplitude parameters de�ning the surfaces.
�e second main result obtained from this analysis is that, indeed, the vibration-assisted process leads to similar height distributions, but delivers be�er results interms of scale. At sight of this result, it could be concluded that the lack of e�ect of
157

CHAPTER 5. EXPERIMENTAL RESULTS AND DISCUSSION
vibrations on the AISI surfaces, while present on the least rough Ti-6Al-4V texture,was not caused by an insensitivity of the material towards acoustoplasticity, but be-cause of the need to so�en the texture features to guarantee the good contact betweenthe burnishing ball and the material. In fact, the introduction of vibrations proveto be detrimental in tests applied with 270 N, suggesting that an excessive preloadcan lead to further surface degradation if the VABB process is applied, probably dueto excessive plasti�cation arising from the vibration-assistance. Indeed, Figure 5.44shows that the VABB process consistently generates deeper grooves due to the ex-plained e�ect. Consequently, 𝐹𝑝 should be limited to avoid detrimental e�ects of theacoustoplasticity during the VABB process.
Figure 5.44. Colour maps of NVABB and VABB tests performed on𝑆00 , applying 270N-5passes
�e AF curves represented in Figure 5.45 con�rm that 90N–5passes correspondto the best VABB parameters that could be applied on 𝑆0
0 , and lead to similar resultsas 350N-5passes on the 𝑆0
1 surface of Ti-6Al-4V. Both original surfaces are slightlydi�erent in terms of bearing area ratio, as proves this �gure, but were highly compa-rable at sight of their main 𝑆 descriptors. �e rebound of the AF curves present atsurfaces burnished through 180 N is the graphical manifestation of the detrimentale�ects that were detected on 𝑆0
0 at sight of the parameters represented above.
5.1.3.2 Kurtosis and skewness comparison
�e comparison of the VABB and NVABB e�ects on the AISI 1038 and the Ti-6Al-4Vworkpieces must not just be read in terms of scale reduction, but also as a means ofmaterial redistribution at the surface of the workpiece. �e conjoint representationof the 𝑆𝑠𝑘-𝑆𝑘𝑢 pair shows of all VABB and NVABB surfaces obtained on both mate-rials are di�erently distributed in the plane (Figure 5.46). Whereas most surfaces are
158

5.1. GEOMETRICAL PARAMETER: SURFACE TEXTURE
Figure 5.45. AF curves of 𝑆00 tests on the AISI 1038 material. Discontinuous lines: VABB
process.
platykurtic, di�erent values of skewness are taken by the di�erent results. �e kur-tosis parameter shows a higher variation in the AISI tests, whereas it is practicallyunvaried in Ti-6Al-4V surfaces. �is can be understood as the highest a�ectation ofthe steel alloy by the process. Nevertheless, all VABB and NVABB results are con-tained inside a certain area of the space which is near to Gaussian surfaces. Now, thequestion is whether this variation is signi�cant enough to state that both processesare di�erent among them, or that both materials react di�erently to them?
Figure 5.46. 𝑆𝑠𝑘 - 𝑆𝑘𝑢 plot of VABB and NVABB results obtained on AISI 1038 and Ti-6Al-4Vtests.
To establish a referential point, all the obtained 𝑆𝑠𝑘 - 𝑆𝑘𝑢 points have been repre-sented along with other results corresponding to other machining and �nishing pro-cesses, taking the results compiled by Gri�ths et al.(1986) [47] (Figure 5.47). NVABB
159

CHAPTER 5. EXPERIMENTAL RESULTS AND DISCUSSION
and VABB show the unique capability of generating both positively and negativelyskewed surfaces, as well as unskewed ones, whereas other processes lead to clearlynegatively skewed (e.g. honing) or positively skewed surfaces (e.g. turning). Further-more, ball burnished surfaces can be characterized by low kurtosis values. Althoughthe Gaussian value 3 can be a�ained with the correct application of parameters inAISI surfaces and Ti-6Al-4V 𝑆0
1 surface, it is hardly modi�ed in harsher textures ofthe last material.
Figure 5.47. Position of the VABB and NVABB process with respect to other �nishing process.A�er data found at Gri�ths (1986) [47].
�e clearly controlled area in which ball burnishing results are enclosed with re-gards to other �nishing processes is a direct consequence of the mechanism on whicheach one is based. For instance, chip-removal operations, such as honing, remove thepeaks of the material texture, generating a certain �a�ening e�ect that leads to highkurtosis values and a predominant weight of positive heights (negative skewness).On the contrary, ball burnishing actually redistributes the target material that com-poses the surface texture, as the excerpted compression mechanism causes its �owtowards the burnished track, thus creating new irregularities on the surface, only ofa lower scale. As was shown in the previous subsection, too high plastic strain canlead the surface to over-strain, generating new irregularities that can be detrimentalto its surface texture, by regenerating the initial peaks and valleys of the milled areas.�erefore, the e�ect of ball burnishing can be then described as a self-reproducing orcyclic process, that redistributes material causing similar lower-scaled surfaces. By
160

5.1. GEOMETRICAL PARAMETER: SURFACE TEXTURE
this e�ect, kurtosis and skewness values are always kept inside a speci�c enclosedarea of the Cartesian plane, whereas the scale may vary from test to test.
5.1.4 Approach to the surface-ball interface through a finite el-ement model
�e initial topology has proved to determine to what extent it can be modi�ed af-ter ball burnishing, as well as the e�ectiveness of the vibration assistance, whichhas proved to be negligible for surfaces conformed of relatively more abrupt heightdistributions. In other words, the introduction of vibrations has proved to be moree�ective as the surface texture has a smaller scale. �e �rst hypothesis concerningthis observation is that the interaction of the ball with the surface material changessubstantially with the scale and distribution of the surface features.
It would be desirable to observe and measure this contact by optical means, en-abling its quanti�cation. Unfortunately, this task is technically complex and costly,due to the scale of the contacts and the reduced accessibility to the manufacturing en-vironment. At sight of this limitation, and seeking evidence to con�rm this hypothe-sis, the idea of developing a Finite Element Model (FEM) to have comparative data tocompare the interface between the ball and the surfaces was embraced. �e develop-ment of this model is however not at all the aim of this dissertation. Its complete andcomprehensive development would be the object of an entire thesis. �erefore, theresults presented here have a preliminary condition, and constitute a �rst approachto the issue to bring light from a theoretical point of view to the e�ects that are beingexperimentally observed through the topological analysis.
Many ball burnishing FEM can be found in the bibliography. �ey are mostlybased on lathe ball burnishing, being the objective of all of them identifying the re-sults in terms of residual stress distribution with experimental results. Rodrıguez etal. (2012) found a model that could predict deep residual stress of ball burnished AISI1042 cylinders, but no initial surface texture was considered. Yen et al.(2004) [160]developed two 2D and 3D FE model to predict the �nal roughness a�er ball burnish-ing. Other authors, such as Balland et al. (2013) [5], considered saw-shaped periodicroughness, but the unrealistic condition of the surface makes results non-comparablewith real results. As an alternative, the model developed for this dissertation, andpresented below, implements the real surface texture obtained a�er machining in 3D,based on a similar 2D approach developed by Sartkulvanich et al. (2007) [124], repre-
161

CHAPTER 5. EXPERIMENTAL RESULTS AND DISCUSSION
sented in Figure 5.48.
Figure 5.48. 2D periodical texture pro�le used by Sartkulvanich et al. (2007) [124].
Another critical issue in modelling the ball burnishing process is the method usedto pilot the preload. Authors have usually controlled the preload by geometricalmeans, imposing a depth of penetration of the ball inside the material [10, 122]. �issolution is o�en adopted because of its easiness of implementation. However, an im-proved model should discard this option, as the real depth of penetration of the ballin the material changes as it moves, due to the surface irregularities. Furthermore,as the material is deformed, the hardening e�ect can have an impact on the initiallyprogrammed depth. In the model proposed here, the preload is directly imparted onthe burnishing ball, and is kept constant along the whole process.
�e bibliographical review reveals that there is still work to do about ball bur-nishing FE models, by making them more adapted to real burnishing conditions. �emodel that has been developed here to support the result analysis of this dissertation,constitutes the �rst step of a more sophisticated model that shall be developed in thefuture, and that includes the following main di�erential features:
• It incorporates a 3D ball-end periodical texture pa�ern, based on real machinedsurfaces used in the experimental phase of this thesis.
• It allows preload control by direct application of the force on the burnishingball, preventing the results of being in�uenced by self-hardening e�ects or vari-ations due to the topology height variations of the material.
�e ball burnishing model shall be executed for surfaces 𝑆01 and 𝑆0
3 textures, onwhich 270 N and 1 pass shall be executed. Only the NVABB process shall be mod-
162

5.1. GEOMETRICAL PARAMETER: SURFACE TEXTURE
elled, as the 40-kHz vibration-assisted operation includes dynamical interactions thatshould be object of a more thorough study, far from the scope of this dissertation. �eANSYS so�ware was used to perform the model.
5.1.4.1 Model geometry and material properties
A 5.5 × 1.7 × 2 mm AISI 1038 block was generated and meshed as the target materialof NVABB. �e 𝑆0
1 and 𝑆03 textures were overlapped on top of the volume by repro-
ducing a simpli�cation of their original pro�les along the width coordinate, thus gen-erating two respective blocks that exhibited planar symmetry and periodical texturefeatures. �e base curves were generated by juxtaposing spline curves characterisedby their opening width and their depth, extracted from the real𝑃 pro�le traced on thereal surface, as shows Figure 5.49. �e mechanical properties of the steel alloy weretaken from Table 4.13, whereas its plastic behaviour was modelled through the vonMises yield criterion (Eq. 5.2). �e meshing was generated through solid186 ele-ments, that allow us to model three-dimensional solids with quadratic displacementbehaviour.
𝜏𝑚𝑎𝑥 =𝜎𝑦⌋
3(5.2)
where 𝜏𝑚𝑎𝑥 is the maximum shear stress due to friction force, and 𝜎𝑦 is the yieldstrength of the material.
�e ∅ 10-mm ball was modelled as an rigid solid characterised by the mechanicalproperties of a standard hardened chromium steel taken from a standard materialdatabase (Table 5.7).
Table 5.7. 60Cr3 chromium steel mechanical properties.
Property ValueYoung’s Modulus 200 GPaPoisson’s Modulus 0.3
�e contact between the two solids was modelled throughconta174- andtar-get170-type elements, to adequately represent the sliding mechanism between theball and the surface, governed by the Coulomb-Mohr classical friction law. �e fric-tion is deliberately introduced in the model, as although it does not have e�ect on the
163

CHAPTER 5. EXPERIMENTAL RESULTS AND DISCUSSION
Figure 5.49. 3D periodical textures modelling 𝑆01 and 𝑆0
3 . Red line: spline curves modellingthe initial texture peaks.
force variation, it is an important drive for material pile-up a�er deformation, whichis fundamental for the �nal texture a�er the process.
5.1.4.2 Boundary conditions and model development
�e boundary conditions of the model comprise no displacement at the bo�om andthe three sides of the block, as shows Figure 5.50. �e execution of the model wasprogrammed through the implicit ANSYS so�ware, due to the lack of e�ect of inertialforces, so that a succession of three main steps were considered as follows:
1. Loading phase: preload is actuated on the burnishing ball to plunge it into thematerial.
2. Burnishing phase: displacement of the burnishing ball through frictional slidingcontinuously along a longitudinal path formed by 3 peaks of the surface, with a600-mm/min feed, and a 0.3-mm lateral o�set displacement. Repeat the process�ve times to obtain 5 parallel burnishing paths.
164

5.1. GEOMETRICAL PARAMETER: SURFACE TEXTURE
3. Unloading phase: the ball is raised, ending its contact with the surface.
Figure 5.50. Steps comprising the FEM and boundary conditions imposed on the material.
5.1.4.3 FEM results
Figure 5.51 represents the vertical displacement of all points a�er NVABB. Warmcolours represent the nodes that are in a higher position than before applying theprocedure. �erefore, the ball trajectory can be clearly represented by the blue val-leys that have been created. �e highest positive displacement is registered at theborders of the burnishing patch, showing the transient boundary e�ects caused bythe pile-up of the material a�er self-hardening due to plastic deformation.
Figure 5.51. Texture a�er burnishing modelled by vertical displacement of the FEM nodesdue to plastic deformation on 𝑆0
1 (top) and 𝑆03 (bo�om). Scale in m.
�e shown displacement values correspond to the relative change of position ofeach node a�er the NVABB process, and should be added or subtracted to each corre-spondent coordinate before the operation. However, this is not the aim of the analysis,
165

CHAPTER 5. EXPERIMENTAL RESULTS AND DISCUSSION
and, therefore, shall not be tackled here. On the contrary, it shall focus on the quanti�-cation of the contact area of the ball and the nodes that compose the surface is sought.To do that, instantaneous states of the whole simulation were considered during thelateral displacements along the o�set length between adjacent passes, coded accord-ing to the numbers represented at Figure 5.50. For that instant, the nodes that weresimultaneously in contact with the ball and the surface solids were retained. Beingknown the instantaneous size of the elements, the addition of all single areas allowsthe calculation of the contact surface between the ball and the surface material. Fig-ure 5.52 shows one set of retained elements to calculate the area as an example, aswell as a graphical representation of the areas retained for each analysed simulationstep.
Figure 5.52. Contact areas between ball and 𝑆01 and 𝑆0
3 surfaces in di�erent stages duringlateral displacements.
Considering that all treating conditions are the same ones, the areas calculatedfor the two calculated cases are comparable among them. In overall, the contact areof the ball with the material surface is not constant, and evolves as the lateral passwidth is progressively taken. However, the interaction area between the ball and the𝑆01 surface is in all cases lower with regards to 𝑆0
3 . �is area di�erence can explain thedi�erent e�ects of the process depending on the kind of surface on which it is actuat-ing. Being the contact surface smaller in 𝑆0
1 can account for the higher e�ectivenessof the process in a�ecting this kind of texture, as the total actuated stress is higher. Itcan also give clues about the higher e�ectiveness of the VABB process, although thisshould have to be investigated by developing a model which is able to incorporatethe vibration movement.
166

5.2. MECHANICAL PARAMETER: RESIDUAL STRESS
�e �nite element model has evidenced a di�erent a�ectation of the surfaces, justby the fact that the interface contact area between both solids changes with the dif-ferent scale of the texture features. It was only calculated on an AISI 1038 workpieceto serve as a starting point for future works, and to observe the e�ects of the processon the material that exhibited the highest contrast between results depending on theinitial surface. �e next subsection starts the study of mechanical e�ects of the VABBand NVABB, by studying the results on the super�cial residual stress.
5.2 Mechanical parameter: residual stress
�e residual stress (RS) results calculated by applying the sin2𝜓 method through X-ray di�raction were provided by the lab as a two-dimensional tensor represented asin Eq.5.3. It contains the normal stress along the two main reference directions (Iand II), and the shear stress associated to the measured patch. �e error associatedto each stress value was automatically quanti�ed by the calculation so�ware as aresult of noise estimation and uncertainty in the identi�cation of the Bragg’s di�rac-tion peak registered through the equipment. All errors are lower than 5%, meaningthat the measurements are highly reliable to represent the RS of every machined andburnished surface.
𝜎RS = (𝜎𝐼 𝜏12𝜏21 𝜎𝐼𝐼
) ± ( 𝑒𝐼 𝑒12𝑒21 𝑒𝐼𝐼
) (5.3)
where 𝜎𝑖 is the normal component of the tensor along direction 𝑖, 𝜏𝑖𝑗 is the shearstress components of the tensor, 𝑒𝑖 is the error associated to 𝜎𝑖, and 𝑒𝑖𝑗 is the errorassociated to 𝜏𝑖𝑗 .
5.2.1 AISI 1038
5.2.1.1 Residual stress state of the original surfaces
All three machined surfaces result in compressive RS, as is shown in Figure 5.53.�is condition is not rare in this kind of machined materials, which are obtained byperpendicular ball-end milling, due to the near-zero cu�ing velocity at the tool nose,which is detrimental for clean chip removal. Instead, the tool presses on the surfaceas it traverses the material along the programmed trajectory [49]. 𝑆0
1 shows higher
167

CHAPTER 5. EXPERIMENTAL RESULTS AND DISCUSSION
compressive RS than for 𝑆02 and 𝑆0
3 . As this surface is obtained by parallel passes withthe lowest o�set between them, the aforementioned detrimental cut dynamics areactually substituted by a compressive action that deforms the surface near to the toolnose. �e low o�set length makes more passes necessary to cover a certain amountof surface, increasing the described compressive action.
Figure 5.53. Residual stress descriptors at 𝑆01 , 𝑆0
2 and 𝑆03 AISI 1038 surfaces.
�e material presents a remarkable anisotropy, as 𝜎𝐼𝐼 > 𝜎𝐼 , meaning that thehigher residual compression on the surface is accounted along the feed direction fol-lowed by the hemispherical tool. �e shear components of the tensor, 𝜏12 and 𝜏21, arealmost negligible if compared to the normal ones, and considering the incertitude as-sociated to them. �erefore, the machined surfaces can be described through a biaxialstress state, being directions I and II its principal directions.
Figure 5.53 also represents the von Mises stress, which has been calculated for thethree surfaces through Eq. 5.4, provided their biaxial stress state. �e von Mises stresscan be considered as a comprehensive descriptor of the RS state of the material [51].
𝜎𝑣𝑚 =⌉𝜎2𝐼 + 𝜎2
𝐼𝐼 − 𝜎𝐼 𝜎𝐼𝐼 + 3 𝜏12 𝜏21 (5.4)
�e incertitude associated to the von Mises stress can be calculated by error prop-agation:
𝑒𝑣𝑚 =⟨⧸⧸⟩ 𝑛
∑1
(𝜕𝜎𝑣𝑚𝜕𝑥𝑖
𝑒2𝑟,𝑖) (5.5)
Applying Eq. 5.4 to 5.5, the von Mises stress incertitude, 𝑒𝑣𝑚, can be calculated as
168

5.2. MECHANICAL PARAMETER: RESIDUAL STRESS
follows:
𝑒𝑣𝑚 = 1
2𝜎𝑣𝑚
⌉(𝑒𝐼 (2𝜎𝐼 − 𝜎𝐼𝐼)⌋2 + (𝑒𝐼𝐼 (2𝜎𝐼𝐼 − 𝜎𝐼)⌋2 + 9 (𝜏12𝑒21 + 𝜏21𝑒12)2 (5.6)
Comparing the von Mises stress calculated on all three initial surfaces, a generaldecrease in the stress state is detected as a higher o�set distance is taken betweenadjacent passes, while the incertitude is of a similar same order of magnitude.
5.2.1.2 Overview of residual stress results a�er ball burnishing
A �rst approach to the VABB and NVABB RS results analysis is performed by colour-coding and representing the normal components of the stress tensors of each test(Figure 5.54). Whereas RS are still compressive, the absolute values of some of themare lower than their as-machined correspondents, meaning that certain some bur-nishing conditions can lead to stress relaxation. Now, would this e�ect be the sameone in surfaces that are not in such a compressive state? �at would mean a net pos-itive e�ect of ball burnishing, that should be checked on another set of workpieces infuture works.
�e anisotropy that was observed in the initial surfaces is however maintaineda�er the VABB and NVABB processes. �e higher values of 𝜎𝐼𝐼 with regards to 𝜎𝐼 arein general con�rmed for all burnishing states, except for speci�c conditions wherethis trend is reverted: tests #7, #18, #22 and #26. �ese testing conditions have incommon that they are all executed with 3 or 5 passes combined with the bn90/0 strat-egy. Consequently, whereas the strategy proved not to be in�uential in topologicalresults, it can actually a�ect the directionality of RS. Indeed, applying a burnishingstrategy based on more than 3 criss-crossed passes, turns out to have the e�ect ofreverting the anisotropy that was detected a�er machining.
�e von Mises stress calculated for all patches, and represented against 𝜎𝐼𝐼 , revealsthat the la�er dominates the overall RS state of every VABB and NVABB surfaces,except for the singular group of tests that were detected as signi�cantly in�uential(Figure 5.55). �is fact reinforces the idea of the strategy as a modi�er of the prefer-ential direction of RS. On the other hand, the highest von Mises stress are a�ained atthe tests performed on the 𝑆0
1 and 𝑆02 surfaces.
�is �rst visual analysis has delivered valuable information, but cannot describe
169

CHAPTER 5. EXPERIMENTAL RESULTS AND DISCUSSION
Figure 5.54. Normal components of the residual stress tensor measured for all VABB andNVABB patches of the AISI 1038 workpiece.
the e�ect of each burnishing factor on the �nal RS. For that reason, an ANOVAhas been performed and explained in the next section to assess the in�uence of the
170

5.2. MECHANICAL PARAMETER: RESIDUAL STRESS
Figure 5.55. Correlation between 𝜎𝐼𝐼 and 𝜎𝑣𝑚.
preload, number of passes, strategy, initial surface texture and feed velocity on thenormal stress components and the von Mises stress. �is analysis shall lead to param-eter optimisation in order to maximise compressive residual stress on the surfaces.
5.2.1.3 Parameter optimisation for RSmaximisation based onANOVAmeane�ects
�e analysis performed in the previous section evidenced that the anisotropy of themachined surfaces was maintained a�er the execution of both NVABB and VABBprocesses. A direct deduction of this observation is that the optimisation target isnot unique in this case. Indeed, many variables could ful�l that role, namely 𝜎𝐼 , 𝜎𝐼𝐼 ,or 𝜎𝑣𝑚 as a general descriptor of the RS state. Although the ideal objective would bemaximising 𝜎𝐼 and 𝜎𝐼𝐼 simultaneously, the reader shall realise that this is not possibleat sight of the results that are to be presented throughout the next subsections.
�e optimisation procedure that shall be followed is represented graphically inFigure 5.56. First, the set of optimal values shall be decided based on the mean e�ectsand interactions graphs delivered by the ANOVA calculations considering as responsevariables the absolute RS components, and their relative improvement with regardsto the reference values related to the machined surfaces. �e “higher is best” criterionis considered to calculate the S/N ratios. To complete the analysis, the parameter setfound through this deduction shall be compared to experimental values.
ANOVA mean e�ects on absolute residual stress
171

CHAPTER 5. EXPERIMENTAL RESULTS AND DISCUSSION
Figure 5.56. Procedure to �nd the best ball burnishing parameters to maximise residualstress.
�e mean e�ects of each parameter on the di�erent RS components calculatedthrough ANOVA are represented in Figure 5.57. �e �rst observation that can bemade agrees with the general remarks performed in the previous subsection, by iden-tifying the strategy as a modi�er of the preferential direction. While bn90/0 reinforces𝜎𝐼 , 𝜎𝐼𝐼 is enhanced by nb0. Being true for both VABB and NVABB, this considerationis a fundamental �nding in terms of productivity, as it implies that by planning cor-rectly the trajectory of the burnishing tool, for instance concentrating all ball passesalong one direction, the surface orthotropy can be modi�ed conveniently, sparingproductive time.
Secondly, the VABB process generates higher compressive RS in average, espe-cially along direction I. �erefore, VABB can be considered as thee preferential pro-cess over the NVABB one. Focusing then on te VABB factors, the 𝐹𝑝 can be �xed in270 N, whereas 5 passes should be recommended for 𝜎𝐼 and 3 passes for 𝜎𝐼𝐼 . Ironi-cally, the low in�uence of the initial texture is also an interesting result in this case,due to the fact that the surfaces departed from very di�erent stress states. Indeed, asthe original RS values of 𝑆0
3 are lower than those of 𝑆01 and 𝑆0
2 , its enhancement canbe described as more remarkable a�er VABB. Consequently, 𝑆0
3 can be declared as thesurface that has been more positively in�uenced by the VABB process.
172

5.2. MECHANICAL PARAMETER: RESIDUAL STRESS
Figure 5.57. VABB and NVABB mean e�ects. ANOVA response variable: RS stress compo-nents of AISI 1038.
Taking into consideration the results delivered by the absolute RS states leavesmany questions open. �erefore, an additional approach to the subject is undertakenin the next subsection by considering the factors that deliver the highest pro�t fromthe introduction of vibration-assistance.
ANOVA mean e�ects on the residual stress relative improvement
To consider the in�uence of the introduction of vibration-assistance in the R re-sults, the ANOVA has been performed taking the �nal-to-initial ratio of each RS com-ponent as response variables:
𝛥𝜎𝑖 =𝜎𝑖𝜎𝑖0
(5.7)
where 𝛥𝜎𝑖 is the �nal-to-initial RS ratio, being 𝑖 = {𝐼, 𝐼𝐼, 𝑣𝑚}
�e mean e�ect graphs are represented in Figure 5.58. �e red line delimits theboundary between the area where RS is improved a�er burnishing that is, 𝛥𝜎 > 1.Again, the VABB process shows superior e�ects on the RS, as it is able to deliver ahigher improvement to the surface with regards to its non-assisted complementary.Results also show that this superiority must be read di�erently according to the initial
173

CHAPTER 5. EXPERIMENTAL RESULTS AND DISCUSSION
surface texture, that, again proves to be a remarkable focus of response variation. �e𝑆03 surface shows that it experiences the highest RS improvement by the introduction
of vibrations. On the other hand, results on surfaces 𝑆01 and 𝑆0
2 show that the NVABBprocess causes stress relaxation. However, by introducing the vibration-assistance,the VABB maintains in average the initial RS level of 𝑆0
2 tests, and reduces stressrelaxation in 𝑆0
1 . �is statement reinforces the idea of discarding the NVABB process,and considering the VABB process as the most adequate to deliver positive RS resultson AISI 1038 surfaces.
Figure 5.58. VABB and NVABB mean e�ects, S/N ratios and interaction plots. ANOVA re-sponse variable: �nal-to-initial stress components ratio of AISI 1038.
In this case, it seems that a 900 mm/min feed should be discarded, as the only val-ues that improve RS are 300–600 mm/min. �e rest of the results are consistent withthe observations made in the previous absolute RS analysis: 270N–3passes is recom-mended to increase 𝜎𝐼 , while 270N–5passes should be the selected pair to achieve thehighest enhancement of 𝜎𝐼 . �e strategy evidences again its e�ects in the same senseas when the absolute RS values were considered: bn90/0 reinforces 𝜎𝐼𝐼 , while nb0a�ects positively to 𝜎𝐼 .
Interaction analysis through ANOVA results on the residual stress relativeimprovement
174

5.2. MECHANICAL PARAMETER: RESIDUAL STRESS
�e ANOVA calculations evidence that, in this case, the 𝐹𝑝*𝑣𝑓 and 𝑛𝑝*𝑣𝑓 interac-tions cannot be neglected from the analysis (5.59). Starting by 𝜎𝐼 , for which 270N–5passes were established as best, the interactions seem to favour 600 mm/min. For𝜎𝐼𝐼 , the observed 270N–3passes combination is more adequate to be applied with 300mm/min. Finally, the overall RS represented by 𝜎𝐼𝐼 , should be executed by 270N–5passes, and the feed interval 300–600 mm/min is adequate.
Figure 5.59. VABB interaction charts. ANOVA response variables: RS components of AISI1038.
�e feed values de�ned by this deductive process might seem di�erent, but can beactually read from a single scope: they discard 900 mm/min as a possible value, andaccept in general, al feeds lower than 600 mm/min. �is means that the e�ciency ofthe process is delivered by a su�ciently low ball displacement on the surface.
All S/N ratios �gures can be observed in Appendix D. �e higher values of theS/N ratios for every level that has been found optimal prove their higher robustnessin terms of results.
�e optimal values that must be taken to maximise compressive residual stressa�er VABB, at sight of the mean e�ects of the factors calculated through an ANOVA,can be found in Table 5.8. Of all the values, the initial texture must be taken very
175

CHAPTER 5. EXPERIMENTAL RESULTS AND DISCUSSION
carefully. �e 𝑆03 has proven to be extraordinarily enhanced by VABB, reaching also
the highest 𝜎𝐼 . However, the 𝑆01 and 𝑆0
2 have proved to deliver the maximum 𝜎𝐼𝐼 and𝜎𝑣𝑚, although RS have been relaxed. �is is due to the fact that they depart froma higher compressive state, so that their superior RS results are actually not causedby the VABB process, but because it is able to keep the same level as the machinedsurfaces.Table 5.8. Optimal parameters to apply VABB on AISI 1038 surfaces according to di�erentRS targets, based on ANOVA mean e�ects.
Opt.target Process 𝐹𝑝 (N) 𝑛𝑝
𝑣𝑓(mm/min) 𝑆0 Strategy test RS increase:
𝛥𝜎𝑖𝜎𝐼 VABB 270 5 600 𝑆0
3 bn90/0 – –𝜎𝐼𝐼 VABB 270 3 300 𝑆0
1 or 𝑆02 nb0 – –
𝜎𝑣𝑚 VABB 270 5 300-600 𝑆01 or 𝑆0
2 nb0 #25 21.1%
�e fact that all factors have been declared in�uential in the RS results makes itdi�cult to �nd the exact experimental realisation in the Taguchi array. Only the test#25 can be found to represent the optimal parameter set to maximise 𝜎𝑣𝑚, which is,indeed, the test for which that parameter achieves its highest improvement. Albeitthe positive result, this test is performed on 𝑆0
1 , where RS should be relaxed at sightof the mean e�ect analysis. �is observation does not invalidate the previous results,as they proceed from real experimental data. However, it leads to think that theremight be tests that, although do not �t the found optimal factor combination, couldalso derived in positive results. �ese tests are discussed in the following subsection.
5.2.1.4 Optimal parameter set forRSmaximisationbased on individual Taguchiexperimental results
Figure 5.60 shows the RS components of the experimental tests were they resulted tobe maximum. �e respective parameter sets that characterise those tests are includedin table 5.9. It is evident that these combinations are not exactly coincident withthe optimal sets obtained from the ANOVA mean e�ect deductive process. �e feedis the factor showing a highest disagreement, as it presented be�er mean results forlow values, but some of the real best tests are performed with 900 mm/min. A possiblesource of variation could be identi�ed with the fact that there are still 6 second-orderinteractions that are not being studied through the L27 experimental design, and thatcould indeed be relevant for the case study.
176

5.2. MECHANICAL PARAMETER: RESIDUAL STRESS
Figure 5.60. AISI 1038 experimental tests with highest compressive residual stress.
Table 5.9. Optimal parameters to ball burnish AISI 1038 surfaces based on real experimentalresults
Initialsurface
Opt.target Process 𝐹𝑝 (N) 𝑛𝑝
𝑣𝑓(mm/min)Strategy test VABB
𝛥𝜎𝑖
NVABB𝛥𝜎𝑖
𝑆01
𝜎𝐼 VABB 180 5 900 bn90/0 #18 36.6% 2.2%𝜎𝐼𝐼 VABB 270 5 300 nb0 #25 23.6% 15.8%𝜎𝑣𝑚 VABB 270 5 300 nb0 #25 21.1% 13.5%
𝑆02
𝜎𝐼 VABB 270 5 600 bn90/0 #26 53.9% 41.5%𝜎𝐼𝐼 VABB 270 3 900 nb0 #24 26.4% 9.4%𝜎𝑣𝑚 VABB 270 3 900 nb0 #24 21.8% 5.4%
𝑆03
𝜎𝐼 VABB 270 5 900 bn90/0 #7 50.3% 40.0%𝜎𝐼𝐼 VABB 270 3 600 nb0 #17 51.2% 49.3%𝜎𝑣𝑚 VABB 270 3 600 nb0 #17 43.4% 38.7%
At this point, it seems that a reasonable strategy to obtain conclusions about ballburnishing for compressive RS maximisation, is �nding the facts that are commonbetween both theoretical and experimental approach. �ese
• �e VABB process has proved to deliver superior results both in mean terms,and also in the speci�c experimental tests.
• �e strategy is a fundamental factor to de�ne the preferential RS stress direc-tion. On one hand, bn90/0 reinforces direction I, while nb0 reinforces directionII. However, it must not be forgo�en that the reinforcement of one directionproves to be detrimental to the perpendicular one, at sight of the experimentalresults.
177

CHAPTER 5. EXPERIMENTAL RESULTS AND DISCUSSION
• 270 N is the preload level that derives in the best results. Although the bestVABB conditions for 𝑆0
1 is obtained with 180 N, it is still a high preload level.�erefore, in general terms, it can be stated that a high preload are desired toachieve higher compressive RS in the workpieces.
• �e number of passes is not exactly the same one in all tests. However, in allcases, 3 o 5 passes are considered, agreeing that 1 pass is not suitable. A generalconclusion to this ma�er is that the best 𝑛𝑝 is between 3 and 5.
�e RS analysis on the AISI material has proved to be more complicated than theresult discussion performed for the texture issue. Indeed, the relevance of all param-eters on the responses, as well as the interactions, has complicated this task. In thenext subsection, the titanium alloy results in terms of RS are analysed, by followinga similar proceeding.
5.2.2 Ti-6Al-4V
5.2.2.1 Residual stress state of the original surfaces
�e assessment of the residual stress of the initial surfaces machined on the Ti-6Al-4V workpiece was performed by performing the X-ray di�raction method on threedi�erent points for each surface. �e resulting 9 measurements show that the resid-ual stress condition of each one is stable at all assessed coordinates, since although𝜎𝐼 and 𝜎𝐼𝐼 can slightly vary from one point to another, the equivalent von Misesstress is equivalent for all of them (Figure 5.61). �at means that the in�uence of themachining operation on RS can be considered uniform, but that a variation of therelative weight of the two normal stress components in the overall RS state mightoccur depending on the speci�c measuring point. All in all, anisotropy is detected inall measurements, being 𝜎𝐼 > 𝜎𝐼𝐼 . �is observation is contrary to the one found inthe AISI 1038 workpiece, where the direction showing the higher RS was 𝜎𝐼𝐼 . �isdi�erence can be easily explained by considering the di�erent background of bothraw materials, which were processed through lamination and forge respectively, andthe consequent variation in residual stress state. In any case, this di�erence shouldbe considered when comparing and discussing the results found for both materials.
In absolute terms, it is 𝑆01 the surface with highest RS components, which descend
sequentially as the o�set distance between passes is reduced to generate 𝑆02 and 𝑆0
3 .�is e�ect was also observed on the AISI 1038 surfaces, and can be a�ributed to the
178

5.2. MECHANICAL PARAMETER: RESIDUAL STRESS
Figure 5.61. Residual stress descriptors at 𝑆01 , 𝑆0
2 and 𝑆03 Ti-6Al-4V surfaces.
pressing force performed by the tool nose in this kind of orthogonal ball-end millingoperation, increased as the passes are less separated among them.
5.2.2.2 Overview of residual stress results a�er ball burnishing
�e resulting normal components of the RS tensor associated to every burnishingpatch are represented in Figure 5.62. As warm colours are associated to higher com-pressive residual stress level, it is evident that the resulting 𝜎𝐼 values are maintainedhigher a�er the VABB and NVABB process, in most of the cases. Consequently, itcan be stated that neither of the two processes succeed in reverting the preferentialdirection presented by the original residual stress state. �is e�ect was also observedon the AISI 1038 burnishing patches, where the main direction was kept in all casesalong II, except for those tests performed by combining the bn90/0 strategy with 3and 5 passes –#7, #18, #22 and #26–, which reverted the preferential direction. Forthe Ti-6Al-4V patches, where the initially favoured direction is I, the e�ect of VABBand NVABB tests is the reinforcement of this initially preferential direction. Indeed,tests #7, #18, #22 and #26 show the highest 𝜎𝐼 inside their initial texture groups.
�e 𝜎𝐼𝐼 results also show a more clear progressive increase as the degree of plasticdeformation grows, represented by a degradation from cool to warm colours. �ee�ect of the preload can be expected to be more remarkable in this case, as show theANOVA results included in the next subsection. On the other hand, the singular tests#7, #18, #22 and #26 do not seem to modify the level of stress, and no inversion canbe detected in this case. Instead, the preferential RS directions presented by the rawmaterial were reinforced by the application of these tests. Although this result seems
179

CHAPTER 5. EXPERIMENTAL RESULTS AND DISCUSSION
Figure 5.62. Normal components of the residual stress tensor measured for all VABB andNVABB patches of the Ti-6Al-4V workpiece.
opposed to the one obtained on the AISI workpiece, they are both very consistent.�e favoured directions of both materials a�er machining were inverted. Since thepreferential burnishing direction was maintained along I, the e�ect of applying each
180

5.2. MECHANICAL PARAMETER: RESIDUAL STRESS
strategy must be consequently changed. What was inverted in the AISI surfaces isreinforced in the Ti-6Al-4V workpiece.
5.2.2.3 Parameter optimisation for RSmaximisation based onANOVAmeane�ects
�e overview of all RS results has reinforced the idea of VABB and NVABB as pro-cesses able to reinforce the orthotropy presented by a machined surface. �e follow-ing step is �nding out whether an optimal parameter set can be found in order totake advantage as much as possible of VABB and NVABB to increase the compressiveresidual stress on the material surface. �e sequential proceeding that is followedbelow is based on the same approach that was taken for the AISI results, shown inFigure 5.56. First, the optimisation shall be tackled by considering the mean e�ectsof the factors and interactions included in the model, all of them calculated throughANOVA. �ese ideal parameter sets shall be then compared to experimental results.Finally, the best experimental results shall be identi�ed, to compare them to the idealset and extracting conclusions about this ma�er.
ANOVA mean e�ects on absolute residual stress
�e mean e�ect of each factor included in the Taguchi design is assessed by per-forming the ANOVA taking the di�erent RS components as response variables. �emean e�ect graphs are represented in Figure 5.63. �e �rst immediate remark to doabout the result is that both VABB and NVABB seem to deliver comparable mean ef-fects. Secondly 𝜎𝑣𝑚 is only in�uenced by the 𝐹𝑝–𝑛𝑝 pair, meaning that the overall RSmodi�cation is basically dependent on the degree of plastic deformation. Speci�cally,350N–5passes are the best conditions to be applied in both VABB and NVABB.
As for 𝜎𝐼 and 𝜎𝐼𝐼 , the strategy proves again to be an e�ective driver throughwhich reinforcing a desired surface direction, being bn90/0 the strategy favouringthe former, and nb0 the la�er. �is result is identical to the case observed in the AISIworkpiece.
�e mean e�ects of the initial surface on the results is also inverted from 𝜎𝐼 and𝜎𝐼𝐼 . �e interpretation must be related to the initial surface state. A�er burnishing,the relationship 𝜎𝐼 > 𝜎𝐼𝐼 is maintained in average as in the machined surfaces. How-ever, 𝑆0
1 being more residually compressed than 𝑆03 is only maintained in 𝜎𝐼𝐼 a�er
VABB and NVABB whereas it is inverted in 𝜎𝐼 . �e only reason why this happens is
181

CHAPTER 5. EXPERIMENTAL RESULTS AND DISCUSSION
Figure 5.63. VABB and NVABB mean e�ects. ANOVA response variable: RS stress compo-nents of Ti-6Al-4V.
because 𝑆03 is more positively a�ected by VABB and NVABB, and its 𝜎𝐼 (main bur-
nishing direction) is increased to a higher extent.
Finally, the combination 350N–5passes is the best in meand terms to maximise𝜎𝐼𝐼 . On the contrary, 𝜎𝐼 re�ects be�er results by the application of 90 or 180 N with5 passes. �is observation could imply that a certain stress relaxation can be associ-ated to both processes as the preload is increased. �is e�ect contradicts the resultsobtained in the AISI 1038 results, were relaxation was only detected for the NVABBprocess.
�e RS assessment a�er the mean e�ects calculated through the ANOVA hasshown that the in�uence of all factors is relevant for the case study. However, thereare still some issues to tackle with, such as the di�erent in�uence of the process de-pending on the initial surface texture. �erefore, the relative improvement caused bythe processes is analysed in the next subsection.
ANOVA mean e�ects on the residual stress relative improvement
�e initial-to-�nal residual stress component ratio calculated through Eq. 5.7, hasbeen subjected to an ANOVA calculation. Figure 5.64 shows that both processes are
182

5.2. MECHANICAL PARAMETER: RESIDUAL STRESS
able to in�uence positively all surfaces, being the red line the boundary from wheresurface stress relaxation is caused a�er the process. It is remarkable that, in generalterms, 𝜎𝑣𝑚 is kept constant before and a�er ball burnishing, while it increases themost in 𝑆0
3 , through 350N-5passes, and independently from the strategy.
Figure 5.64. VABB and NVABB mean e�ects, S/N ratios and interaction plots. ANOVA re-sponse variable: �nal-to-initial stress components ratio of Ti-6Al-4V.
Other direct results arise from this analysis. First, no substantial di�erence be-tween VABB and NVABB can be observed. Secondly, the strategy in�uence followsexactly the same pa�ern than in the absolute results. �ird, no in�uence of the feedis observed. Last of all, the same 𝐹𝑝–𝑛𝑝 that were identi�ed as ideal to maximise the�nal RS, also delivers the highest advantage of the process. �e only di�erence, isthat 270 N proves to be more e�ective in the VABB than in the NVABB process. �atmeans that a high preload is required to take advantage of the vibration assistance.
�ese ANOVA results are highly interesting to understand the e�ect of the initialsurface on the process e�ectiveness. 𝑆0
3 is the most positively a�ected by VABB andNVABB. However, 𝑆0
1 experiences RS relaxation along direction I, con�rming whatwas observed in the analysis of the absolute results: this relaxation justi�es the lower𝜎𝐼 in 𝑆0
1 than in 𝑆03 , being the only relative trend that is inverted a�er ball burnishing.
�e direct consequence of this observation is that applying the bn90/0 process on the𝑆01 surface, which de�nes 𝜎𝐼 should be avoided.
183

CHAPTER 5. EXPERIMENTAL RESULTS AND DISCUSSION
�e last step to con�rm the de�nition of the best parameters must be completedby checking the interactions between factors, that proved to be relevant in the caseof the AISI alloy. �is study is presented below.
Interaction analysis through ANOVA results on the residual stress relativeimprovement
�e interaction analysis shown in Figure 5.65 proves that these are not so relevantin this case as they were for the AISI 1038 material. �e 𝐹𝑝*𝑣𝑓 interaction for 𝜎𝐼 ,makes recommendable to chose a 900 mm/min feed for the 150 N preload that wasselected. �e lack of remarkable interactions for the other two RS components allowsthe con�rmation that all feeds could be eligible to apply the process, at sight of thelack of in�uence on the result
Figure 5.65. VABB and NVABB interaction charts. ANOVA response variables: RS compo-nents of Ti-6Al-4V.
�e search for optimal parameter set according to the mean e�ects of each factoron the di�erent RS components has resulted in the respective parameter sets includedin Table 5.10. Both processes can be recommended to improve the RS state of the ma-terial, due to their similar mean e�ects, and the strategy is again the main facilitatorfor the reinforcement of a speci�c surface direction. As this solution is based on mean
184

5.2. MECHANICAL PARAMETER: RESIDUAL STRESS
e�ects, it is necessary to compare them to actual experimental results. Only the setsdetermined for the 𝜎𝐼𝐼 and 𝜎𝑣𝑚 can be found in the Taguchi array, con�rming thatthey are able to increase the compressive residual stress over 40%. Now, to completethis validation, the direct consideration of the experimental results is undertaken inthe next subsection.
Table 5.10. Optimal parameters to ball burnish Ti-6Al-4V surfaces according to di�erent RStargets, based on ANOVA mean e�ects.
Opt.target Process 𝐹𝑝 (N) 𝑛𝑝
𝑣𝑓(mm/min) 𝑆0 Strategy test
RSincrease:𝛥𝜎𝑖
𝜎𝐼 NVABB 150 5 900 𝑆03 bn90/0 – –
𝜎𝐼𝐼VABB orNVABB 350 5 300–600 𝑆0
1 nb0 #25 21.0%
𝜎𝑣𝑚VABB orNVABB 350 5 300–600 𝑆0
1 or𝑆02
nb0, bn0 orbn90/0 #26 39.1%
5.2.2.4 Optimal parameter set forRSmaximisationbased on individual Taguchiexperimental results
�e direct inspection of all RS results has delivered the identi�cation of the highestcompressive residual stress results on the tested surfaces. �ese singular tests arerepresented in Figure 5.66. �e processing parameters corresponding to these testscan be found in Table 5.11.
�ese selected tests con�rm that, indeed, both VABB and NVABB can improvethe RS state of all surfaces. Also, it is indi�erent to apply the NVABB or the VABBprocesses due to their similar results, although 𝑆0
3 exhibits a tendency to registerbe�er results with the NVABB process.
• Both the VABB and NVABB are able to cause similar e�ects in terms of residualstress on the Ti-6Al-4V surfaces.
• �e highest preload 350 N is recommended to improve any of the di�erent RScomponents, except for 𝜎𝐼 in the 𝑆0
1 texture, for which 250 N is recommended.Although the main e�ect results �xed that recommended preload at 150 N, bothcases indicate that a lower preload should be applied on 𝑆0
1 , so that it does nothave a detrimental e�ect on the RS along direction I.
185

CHAPTER 5. EXPERIMENTAL RESULTS AND DISCUSSION
Figure 5.66. Ti-6Al-4V experimental tests with highest compressive residual stress.
• 5 passes should be performed in all cases to achieve the highest RS improve-ment.
• �e bn90/0 surface favours direction I, and bn0 favours direction II, althoughthis fact had an inverse e�ect on the Ti-6Al-4V workpiece due to the fact thatthe relative weight of each RS component was reverted a�er machining in bothmaterials.
• No speci�c feed seems to be more adequate to perform the NVABB or the VABBprocesses.
5.3 Optimal parameter sets according to texture andRS criteria: synthesis
Having reached this point in the result discussion chapter, it is necessary to make asynthesis of all the results derived from the topological and RS analysis, with the aimof deciding whether they can be uni�ed to establish one or various priority parameterset to apply the VABB process; and, in those cases where NVABB is recommendedover it, propose an alternative.
�e derived ball burnishing parameter sets have been organised by material, intwo di�erent Tables: 5.12 and 5.13. �ese charts are organised by initial surface tex-ture, which should actually be considered as a contextual requisite for burnishingapplication, and no longer as a factor of study. Indeed, it was concluded that the
186

5.3. OPTIMAL PARAMETER SETS ACCORDING TO TEXTURE AND RS CRITERIA:SYNTHESIS
Table 5.11. Optimal parameters to ball burnish Ti-6Al-4V surfaces based on real experimentalresults
Initialsurface
Opt.target Process 𝐹𝑝 (N) 𝑛𝑝
𝑣𝑓(mm/min)Strategy test VABB
𝛥𝜎𝑖
NVABB𝛥𝜎𝑖
𝑆01
𝜎𝐼 NVABB 250 5 900 bn90/0 #18 49.8% 66.6%
𝜎𝐼𝐼VABB orNVABB 350 5 300 nb0 #25 21.0% 16.9%
𝜎𝑣𝑚VABB orNVABB 350 5 300 nb0 #25 19.7% 15.9%
𝑆02
𝜎𝐼VABB orNVABB 350 5 900 bn90/0 #26 76.8% 74.6%
𝜎𝐼𝐼VABB orNVABB 350 5 600 bn90/0 #26 18.4% 10.2%
𝜎𝑣𝑚VABB orNVABB 350 5 600 bn90/0 #26 39.1% 34.4%
𝑆03
𝜎𝐼 NVABB 350 5 900 bn0 #27 81.0% 100.3%𝜎𝐼𝐼 NVABB 350 5 900 bn0 #27 66.3% 71.9%𝜎𝑣𝑚 NVABB 350 5 900 bn0 #27 68.8% 85.7%
application of the VABB process requires not only calibration and testing on a spe-ci�c target material, but the process parameters should also be decided according tothe initial surface presented by the speci�c workpiece. �e aforementioned tablesinclude all optimal parameter set, obtained a�er diverse criteria, including statisticaland experimental evidence. In the case of texture enhancement, the optimal burnish-ing parameter combination arising from the observation of individual experimentaltexture results are in agreement with those derived from the ANOVA analysis. �ere-fore, no di�erentiation is made in this regard. On the contrary, those two criteria leadto di�erent solutions in the case of RS component maximisation, thus having beenspeci�ed in the Table as “Taguchi” –direct observation in the experimental results–,and “ANOVA” –concluded a�er the mean e�ects calculation.
�e inspection of both tables leads to conclude that, although not all parametersets lead to the same target, some factors are recommended in the same or similarvalues regardless of the objective. It is the case of the preload and the number ofpasses, which are in most of cases recommended at their highest levels. For that rea-son, the last column of the tables propose a uni�ed parameter and process descriptorsthat could be applied in a general case to enhance texture and residual stress at thesame time. However, it should not be forgo�en that one direction of the space isprone to be less a�ected. A special mention should be done regarding the case of the
187

CHAPTER 5. EXPERIMENTAL RESULTS AND DISCUSSION
Table 5.12. Summary of optimal parameters to ball burnish AISI 1038 surfaces based ontexture and RS criteria.
Initialsurface
Opt.target Process 𝐹𝑝 (N) 𝑛𝑝
𝑣𝑓(mm/min) Strategy Overall optimal set
𝑆01
Texture VABB orNVABB 180 3 300–900 nb, bn0 or
bn90/0 VABB
𝜎𝐼Taguchi VABB 180 5 900 bn90/0 270 N
𝜎𝐼𝐼Taguchi VABB 270 5 300 nb0 5 passes
𝜎𝐼𝐼ANOVA VABB 270 3 300 nb0 300–900 mm/min
𝜎𝑣𝑚Taguchi VABB 270 5 300 nb0 Strategy according
to target𝜎𝑣𝑚
ANOVA VABB 270 5 300–900 nb0
𝑆02
Texture VABB orNVABB 270 3 300–900 nb, bn0 or
bn90/0 VABB
𝜎𝐼ANOVA VABB 270 5 600 bn90/0 270 N
𝜎𝐼𝐼Taguchi VABB 270 3 900 nb0 5 passes
𝜎𝐼𝐼ANOVA VABB 270 3 300 nb0 300–900 mm/min
𝜎𝑣𝑚Taguchi VABB 270 3 900 nb0 Strategy according
to target𝜎𝑣𝑚
ANOVA VABB 270 5 300–600 nb0
𝑆03
Texture NVABB 270 5 300–900 nb, bn0 orbn90/0 VABB
𝜎𝐼Taguchi VABB 270 5 900 bn90/0 270 N
𝜎𝐼ANOVA VABB 270 5 600 bn90/0 5 passes
𝜎𝐼𝐼Taguchi VABB 270 3 600 nb0 300–900 mm/min
𝜎𝑣𝑚Taguchi VABB 270 3 600 nb0 Strategy according
to target
188

5.3. OPTIMAL PARAMETER SETS ACCORDING TO TEXTURE AND RS CRITERIA:SYNTHESIS
Table 5.13. Summary of optimal parameters to ball burnish Ti-6Al-4V surfaces based ontexture and RS criteria.
Initialsurface
Opt.target Process 𝐹𝑝 (N) 𝑛𝑝
𝑣𝑓(mm/min) Strategy Overall optimal set
𝑆01
Texture VABB 350 3 300–600 nb, bn0 orbn90/0 VABB
𝜎𝐼Taguchi NVABB 250 5 900 bn90/0 350 N
𝜎𝐼𝐼Taguchi
VABB orNVABB 350 5 300 nb0 5 passes
𝜎𝐼𝐼ANOVA
VABB orNVABB 350 5 300–600 nb0 300–900 mm/min
𝜎𝑣𝑚Taguchi
VABB orNVABB 350 5 300 nb, bn0 or
bn90/0Strategy according
to target𝜎𝑣𝑚
ANOVAVABB orNVABB 350 5 300–600 nb0
𝑆02
Texture VABB orNVABB 350 5 300–900 nb, bn0 or
bn90/0 VABB or NVABB
𝜎𝐼Taguchi
VABB orNVABB 350 5 900 bn90/0 270 N
𝜎𝐼𝐼Taguchi
VABB orNVABB 350 5 900 nb0 5 passes
𝜎𝑣𝑚Taguchi
VABB orNVABB 350 5 600 nb0 300–900 mm/min
𝜎𝑣𝑚ANOVA
VABB orNVABB 350 5 300–600 nb, bn0 or
bn90/0Strategy according
to target
𝑆03
Texture NVABB 350 5 300–900 nb, bn0 orbn90/0 NVABB
𝜎𝐼Taguchi NVABB 350 5 900 bn0 270 N
𝜎𝐼ANOVA NVABB 150 5 900 bn90/0 5 passes
𝜎𝐼𝐼Taguchi NVABB 350 5 900 bn0 600–900 mm/min
𝜎𝑣𝑚Taguchi NVABB 350 5 900 bn0 Strategy according
to target
AISI 1038 𝑆01 surface improvement. �e uni�ed parameter set has been set in 270N-
5passes, what seems to be incoherent with the 180N–3passes recommended in termsof texture. �ee explanation is simple: in the already known cyclic e�ect of VABB,270N-5passes was found to deliver also good surface texture, although being a longer
189

CHAPTER 5. EXPERIMENTAL RESULTS AND DISCUSSION
process, and it allows in addition the RS enhancement. �e reader shall notice thatthe strategy is not included in the cell that gathers a uni�ed parameter set. Since oneof the main conclusions derived from this result discussion was that they were indif-ferent for texture scale reduction, they should be chosen according to the preferentialdirection that must be reinforced.
5.4 Metallurgical parameter: hardness andmetallog-raphy
�e previous section has shown that, although not all aspects of surface integritycan be simultaneously improved, a certain optimal set can be established to �nd abalanced solution for all of them. In this section, a third aspect of surface integrity istackled to complete the assessment of the impact of VABB. Although it is not expectedto observe specially remarkable results from the metallurgical point of view, SEMmetallographic observations have also been performed.
Due to the highly time-consuming sequence of specimen preparation and hard-ness measurement execution, this section focuses on a speci�c parameter set derivedfrom the previous analysis. Since the strategy has proved to modify the directionalityof the material, this parameter has been included in two di�erent levels, to assess itse�ects of VABB on both materials. NVABB tests are also performed to establish acomparison point.
5.4.1 AISI 1038
A new AISI 1038 workpiece was machined to generate an 𝑆01-type surface. �is tex-
ture was chosen due to the fact that is the one that evidenced higher a�ectation bythe VABB process. �e in�uence of strategy in the directionality of the RS resultslead into consider both bn90/0 and nb0 strategies, to evaluate whether there can alsobe a reinforcement e�ect in the case of the hardness. In total, four new patches wereburnished on the machined surface, as shows Table 5.14.
To study the in-depth a�ectation of the material due to VABB and NVABB pro-cesses, every burnishing patch was cut in the middle in both directions I and II, thusgenerating the respective surfaces parallel to both of them (Figure 5.67.a). A�er pol-
190

5.4. METALLURGICAL PARAMETER: HARDNESS AND METALLOGRAPHY
Table 5.14. Tested conditions for hardness tests on AISI 1038 𝑆01 .
Process Strategy Fixed parametersVABB nb0
𝐹𝑝 = 270 N ; 𝑛𝑝 = 5 ; 𝑣𝑓 = 600 mm/minNVABB bn90/0
ishing, a Vickers imprint indentation matrix was performed, at di�erent deep layersevery 50 µm, until 300 µm, from where three more 100 µm steps were measured (Fig-ure 5.67.b). At every depth level, a minimum of 10 indentations were performed.Outliers were discarded through the Chauvenet’s criterion, and the resulting sam-ples were averaged to obtain the representative value. �e error was calculated asexplained in subsection 4.2.2.1.
(a) (b)
Figure 5.67. Hardness pro�les of VABB and NVABB 𝑆01 AISI 1038 surfaces. a. Along direction
I. b. SEM view of the Vickers microindentation matrix performed on the subsurface layers ofthe non-burnished AISI 1038 specimen.
5.4.1.1 AISI 1038 deep a�ectation: Vickers hardness profiles
Figure 5.68 shows the resulting hardness pro�les along with their respective errorbars. �e comparison of the as-machined subsurface hardness measurements con�rmthe original anisotropy: along direction II, the core hardness is achieved at around 250µm, whereas this value is reached at 500 µm along direction I. �e lack of further datadoes not allow us to state a de�nitive explanation to this fact. However, a certain link
191

CHAPTER 5. EXPERIMENTAL RESULTS AND DISCUSSION
between RS and hardness could be proposed as possible, as RS can be understoodas elastically deformed grains con�ned inside plasti�ed boundary grains. Under thisperspective, hardness measured on the plane parallel to direction I could be domi-nated by the compressive 𝜎𝐼𝐼 residual stress (Figure 5.67.a.). 𝜎𝐼 presents lower values,and so do the hardness datasets measured on that plane. Although there seems to bea link between both magnitudes, the main drawback to this approach is that, as theX-ray di�raction method applied to calculate RS has only a few µm of penetration,it is not sure that they keep that level to a 50-µm depth, which is the �rst availablehardness measurement.
(a)
(b)
Figure 5.68. Hardness pro�les of VABB and NVABB 𝑆01 AISI 1038 surfaces. a. Along direction
I. b. Along direction II.
Neither VABB nor NVABB modify substantially the hardness level at the near-surface depth, considering the error bars. �is observation was already con�rmedby evidence presented previously by other researchers, included in the state of the
192

5.4. METALLURGICAL PARAMETER: HARDNESS AND METALLOGRAPHY
art chapter. �e material hardness is, however, a�ected at deeper layers, spanningfrom 250 to 500 µm along direction II and 150 to 250 µm along I. Direction II must beconsidered as the one a�ected to a highest extent in terms of hardness. �is deep e�ectof ball burnishing can be explained by the elastic-plastic Hertzian contact mechanics,that characterise stress propagation inside solids by e�ect of a super�cial load [37].
�e strategy has a clear e�ect on the hardening e�ects a�er both processes, beingnb0 the one resulting in higher hardness, especially along direction II. Only the bn90/0strategy seems to have a slight more positive e�ect along direction I, from 100 to 150µm. �e nb0 strategy clearly favours the same direction as it did in RS terms, and sodoes bn90/0 at the near subsurface layers, although its e�ect is more modest.
Now, considering the di�erence between vibration-assistance and conventionalball burnishing, results change. �e VABB process executed according to the nb0strategy exhibits in overall a more remarkable positive e�ect, from 250 to 500 µm
depths. To visually detect the di�erent result delivered by vibration-assistance, ifpresent, an alternative representation is proposed through the VABB-to-NVABB ratio,𝛥𝐻𝑉 , calculated as follows:
𝛥𝐻𝑉 = 𝐻𝑉𝑉𝐻𝑉𝑁
(5.8)
where𝐻𝑉𝑉 is the average Vickers hardness obtained through the VABB process, and𝐻𝑉𝑁 is the average Vickers hardness obtained through the NVABB process.
�e incertitude bars have been calculated by error propagation on 𝛥𝐻𝑉 , as wasindicated in Eq. 5.5. �e resulting expression can be formulated as follows:
𝑒𝑟 =𝛥𝐻𝑉}
(𝑒𝐻𝑉 𝑉𝐻𝑉𝑉
)2
+ (𝑒𝐻𝑉𝑁𝐻𝑉𝑁
)2
(5.9)
where 𝑒𝐻𝑉 𝑉 is the error associated to𝐻𝑉𝑉 , and 𝑒𝐻𝑉𝑁 is the error associated to𝐻𝑉𝑁 .
Figure5.69 represents the values of the 𝛥𝐻𝑉 ratio for all the explored depths. Itis the bn0 strategy the one that delivers be�er results through VABB, from 250 µm
depth, whereas bn90/0 hardly takes advantage of vibration-assistance. �erefore, itcan be stated that, in terms of deep a�ectation, it is the nb0 strategy the one that reg-isters more advantage from vibration-assistance. As repeated passes along the samepath, clearly help take pro�t of the vibrations incorporated to the process, whereasthis e�ect is dissolved for the bn90/0 by the change of direction of the passes. �edescribed higher residual hardening a�er VABB can be associated to the transmission
193

CHAPTER 5. EXPERIMENTAL RESULTS AND DISCUSSION
of the ultrasonic waves inside the material, as the Blaha e�ect explains, at sight of theresults found by Siu et al. (2013) [136].
(a) (b)
Figure 5.69. HV ratio between VABB and NVABB tests of 𝑆01 AISI 1038 surfaces. a. Along
direction I. b. Along direction II.
5.4.1.2 SEM examination of the AISI 1038 surface and sub-surface layers
�e specimens that were subjected to the previously described hardness tests werechemically etched to perform SEM observations. Figure 5.70 exhibits a surface layerof deformed material, being the grains of ferrite and cementite reduced due to theplastic residual strain. Some shear marks can be observed in the ferrite phase a�erVABB, which leads to conclude that the depth of a�ectation due to this process isslightly higher. However, this is not necessarily positive for the surface, as this e�ectcannot be momentarily assessed in functional terms. �e only metallography thatexhibits a substantial di�erent result is the one corresponding to direction I of the nb0strategy performed through VABB. �e cementite at the surface seems to be smashedand mixed with the ferrite matrix. �e reason could be, again, the repetitive passescaused by this kind of strategy along the same direction while the ultrasonic signalis transmi�ed inside the material. �e consequence of this change should be furtherassessed in future works.
194

5.4. METALLURGICAL PARAMETER: HARDNESS AND METALLOGRAPHY
(a) (b)
Figure 5.70. x2000 SEM observations of ball-burnished AISI 1038.
5.4.2 Ti-6Al-4V
To complete the characterisation of the e�ects of VABB on the Ti-6Al-4V surfaces, ametallurgical analysis was performed on a new specimen. �e 𝑆0
1 surface was takenas basis, and the parameters that were de�ned as most appropriate were selected toperform the operations (Table 5.15). Specimens were prepared as speci�ed for thesteel alloy, to subject them to hardness measurement through a matrix as the onerepresented at Figure 5.67.
Table 5.15. Tested conditions for hardness tests on Ti-6Al-4V 𝑆01 .
Process Strategy Fixed parametersVABB nb0
𝐹𝑝 = 350 N ; 𝑛𝑝 = 5 ; 𝑣𝑓 = 600 mm/minNVABB bn90/0
5.4.2.1 Ti-6Al-4V deep a�ectation: Vickers hardness profiles
Figure 5.71 shows the resulting deep hardness pro�les of the explored surfaces. Inthis case, the machining process has a hardening e�ect on the workpiece that spansto a 100-µm depth. However, the hardness pro�les are substantially more similaramong them than in the case of the AISI alloy.Both the NVABB and VABB processes
195

CHAPTER 5. EXPERIMENTAL RESULTS AND DISCUSSION
cause a residual hardening along direction I, but that e�ect is inconspicuous alongdirection II, except for one processing condition: nb0 and VABB. �e combination ofboth is in overall positive along both directions, although the depths where it can beobserved, is di�erent: the e�ect along direction II seems more super�cial. It must beconsidered the error introduced my the manual measurement with the Vickers mi-croindenter, which is not automatised, and might deliver undesired bias in the depthcontrol. �erefore, it should be highlighted the positive impact of nb0 and VABB,regardless of the exact depth represented in the Figure.
(a)
(b)
Figure 5.71. Hardness pro�les of VABB and NVABB 𝑆01 Ti-6Al-4V surfaces. a. Along direc-
tion I. b. Along direction II.
5.4.2.2 SEM observation of the Ti-6Al-4V surface and sub-surface layers
�e specimens that were used for the hardness measurements were chemically etchedto distinguish the di�erent phases of the Ti-6Al-4V material, and assess a possible
196

5.4. METALLURGICAL PARAMETER: HARDNESS AND METALLOGRAPHY
change in microstructure caused by VABB and NVABB. Figure 5.72 represents thesubsurface layers of the nb0 patches, exhibiting the typical white layer formed bythis kind of alloys [155], mixed with some oxygen �uorides coming from the chemicaletching with Kroll’s reagent. �e main e�ect of ball burnishing is represented by the𝛼 phase oriented along the surface, by e�ect of the plastic deformation. However, thedepth of a�ectation is lower than in the case of the AISI material, and, in all cases,di�cult to distinguish.
(a)
(b)
Figure 5.72. x2000 SEM observations of ball-burnished Ti-6Al-4V.
197

CHAPTER 5. EXPERIMENTAL RESULTS AND DISCUSSION
5.5 Synthesis of metallurgical results
�e performed metallurgical analysis allowed the assessment of the e�ects of VABBand NVABB in deep layers of the AISI 1038 and Ti-6Al-4V tested alloys. It proved thatboth processes a�ect positively the hardness of the subsurface layers of the targetmaterial. �e only relevant result is the remarkably more e�ective combination ofnb0 strategy with the VABB process, that achieves higher hardness. It even has ametallurgical e�ect, as it is able to break the cementite phase.
�e implications of the metallurgical analysis, which has not been so extensivedue to the time-consuming activities required with that aim, reveals that the e�ect ofboth VABB and NVABB is present down to around 500 µm. Deeper material layerscan be considered to have the properties of the bulk material, and cannot be describedthrough the surface integrity approach.
198

6Conclusions and perspectives
�e present dissertation tackled with the issue of executing the vibration-assisted ballburnishing process through a designed tool, and has explored its application on twodi�erent industrial alloys: AISI 1038 and Ti-6Al-4V.
Being 40 kHz the frequency of the signal transmi�ed by the prototype designedto execute the process, the most complex technological challenge was being able toacquire, sample and postprocess this kind of high frequency signal. Acoustic emissiontests allowed the measurement of the signal transmi�ed inside an AISI 1038 block. Itevidenced to be characterised by a 39.1-kHz frequency, independent of the preloadexcerpted by the tool. A second characterisation phase was undertaken by directdynamometric measurement, to quantify the vibratory force overlapped on the springpreload. �is force resulted to experience relatively low variations with regards tothe preload value, inside a ± 4–5.5 N interval. Since the Blaha e�ect is not based onstress addition but on signal transmission through the material while it is deformed,this range of forces is considered as valid. �ese characterisation activities provedthat the prototype was able to function inside stable levels, with no dependence onprocess parameters.
199

CHAPTER 6. CONCLUSIONS AND PERSPECTIVES
�e test of VABB on AISI 1038 and Ti-6Al-4V surfaces proved to have a highlypositive impact in the surface integrity of the treated surfaces. However, the industrialimplementation of the process requires a preliminary study to determine the adequateparameters that must be applied, considering the target material and the topologyof the target surface. Additionally, both the topological and residual stress resultsshowed that the search for the best process parameters cannot be detached from theoriginal surface texture on which they shall be applied. �is statement is based onseveral evidence, explained along the following paragraphs.
From a topological point of view, VABB has a triple e�ect on the surfaces whereit is applied, as follows:
• General scale reduction.
• Surface height redistribution according to Gaussian or quasi-Gaussian surfaces.
• Change of the main directionality of the surface texture features, if enoughpreload is applied.
�e results showed that plastic deformation performed through VABB delivers anet reduced scale surface. Furthermore, as the process is not based on chip removal,the resulting topologies are always represented by Gaussian or quasi-Gaussian heightdistributions, which are known for their balanced characteristics of lubricant reten-tion and low wear. �at result can be explained due to the fact that the ball has asimultaneous e�ect on the texture: it reduces its original peaks while generating newlow-scale valleys. �e AISI 1038 material registered texture scale reductions higherthan 80% in the �nest tested original surface, whereas the improvement was of around60.3% for the Ti-6Al-4V alloy.
On the other hand, given a speci�c texture machined on a material, a singlepreload and number of passes pair of values, 𝐹𝑝–𝑛𝑝, can be found to achieve thebest texture scale reduction. From that point, higher combinations delivering moreplastic deformation lead to detrimental e�ects on the surface. Nevertheless, a cyclice�ect of VABB can be observed as further plastic deformation always leads to a recon-�guration of the surface. In this sense, a second threshold that delivers again goodtexture results can be found. �at recon�guration includes texture scale reductionwith Gaussian height distributions, accompanied with a change in the directionalityof the surface topology features, which are reoriented according to the main VABB
200

direction. �e singular 𝐹𝑝–𝑛𝑝 values must be selected regarding the target materialand the texture machined on it.
�e topological characteristics of the original surfaces also have an impact in thee�ectiveness of vibration-assistance to generate lower scale textures. �is observa-tion was con�rmed in both materials. If the initial surface presented an 𝑆𝑞 parameterof 1 µm or less, the VABB presented superior results, compared to NVABB. �is ob-servation reinforces the idea of the initial surface being a fundamental variable toconsider when selecting VABB process parameters. �e results also showed that, asthe scale of the texture increases, both the VABB and the NVABB lead to similar re-sults. A second threshold is found for the singular value of around 10-µm 𝑆𝑞, fromwhich NVABB starts to deliver be�er results. Vibration assistance can only be takenadvantage of on �ne enough surfaces, whereas it is detrimental in too high scale ball-end milled textures.
�e second response evaluation parameters that were considered is the change ofthe compressive residual stress tensor components a�er VABB. �e e�ects of VABBwere not always positive in this regard, as the original surfaces were originally resid-ually compressed as a consequence of the machining process. �e �nest surface pre-sented the highest residual stress from the beginning. �e VABB process proved toavoid stress relaxation in that surface, which was on the contrary observed a�er thenon-assisted process. �e other original surfaces, less compressed originally, regis-tered remarkable higher RS a�er VABB, proving its positive e�ects with regards tothe non-assisted operation (e.g. in some cases, compressive RS increased by 36%).Results are slightly di�erent in the Ti-6Al-4V workpiece, where both NVABB andVABB resulted in similar results, also more modest compared to those on the AISI1038 alloy. �ese results lead to think that the materials react completely di�erent tothe vibration-assistance, besides their original texture. For the explored values, theTi-6Al-4V was less sensitive to vibration-assistance.
Regarding the residual stress results, it must be highlighted the relevance of theburnishing strategy to de�ne the direction of the surface that should be reinforced. Alloriginal surfaces exhibited a high anisotropy a�er machining that could be correctedor balanced by choosing the direction along which VABB should be applied. �isresult is fundamental to simplify the implementation of the VABB process, accordingto the state of the machined surface on which it shall be executed.
Last of all, the deep hardness analysis exhibited that the VABB process delivered
201

CHAPTER 6. CONCLUSIONS AND PERSPECTIVES
deeper a�ectation of the material, especially if the process was always performedalong the same direction (nb0 strategy). �erefore, the transmission of the ultrasonicsignal during the VABB process seems to result in a higher penetration of the e�ectsof the process. However, the direct consequence of this result should be addressed infuture research lines, as is highlighted in the next subsection.
�e presented evidence, found a�er the di�erent experimental outcomes, lead tothe conclusion that the industrial application of the process can only successfully beperformed if the processing parameters are linked to the outcomes of the previousmachining procedure. A previous assessment to characterise the original surface in-tegrity shall always be necessary, including two main variables: the target materialand initial surface (Figure 6.1). As a result of that combination, the 𝐹𝑝–𝑛𝑝 pair shouldbe �xed to achieve the best topological and RS results. �e strategy must be then se-lected according to the preferential direction that is expected to be subjected to higherload and stress during its functioning in service.
Figure 6.1. Summary of the conclusions regarding VABB.
6.1 Future works
�e experimental database and the holistic approach taken in this dissertation to theVABB process must be used in future works to succeed in developing new insights intothe process. Many questions remain open about the phenomenology of associated tothe process, and the direct consequences of the vibration assistance on the material.�e ultimate result of that assessment should be its industrial implementation. Underthis perspective, the following activities are proposed as next steps:
202

6.2. PUBLICATIONS DERIVED FROM THIS DISSERTATION
• Performing similar analysis on a greater variety of topologies, particularly thosebeing originally neutral in terms of residual stress. Furthermore, to study in de-tail the described cyclic e�ect of VABB on the surface texture, higher preloadscould be applied on the already assessed surfaces, to establish that thresholdvalue in more abrupt topologies.
• Development of a new version of the prototype, to overcome the mechanicaldrawbacks provided by the one presented in this dissertation. For instance, toreduce the relative movement between its components.
• An improved FEM that allows to understand in depth the interaction of theburnishing ball with the surface features. �is study must derive in a phe-nomenological explanation of the e�ects of NVABB based on the way that theball performs the pressure to cause the residual plastic strain.
• An optimisation procedure should be performed, to �nd real optimal valuesfor the operation. �e results presented in this thesis are based on di�erentoptimisation methods. But the term “optimal” refers to the best parametersinside the explored boundaries included in the design of experiments.
6.2 Publications derived from this dissertation
Publications in JCR indexed journals
Jerez-Mesa, R., Landon, Y., Travieso-Rodriguez, J.A., Dessein, G., Lluma-Fuentes, J.,Wagner, V. (2017) Topological surface integrity modi�cation of AISI 1038 alloy a�ervibration-assisted ball burnishing. Journal of Surface and Coatings Technology. Underreview.
Jerez-Mesa, R., Travieso-Rodriguez, J.A., Gomez-Gras, G., Lluma-Fuentes, J. (2017)Development, characterization and test of an ultrasonic vibration-assisted ball bur-nishing tool. Journal of Materials Processing Technology. Accepted with major revi-sions.
Contributions in international congresses with peer review
Jerez-Mesa, R., Landon, Y., Travieso-Rodriguez, J.A., Gomez-Gras, G., Lluma-Fuentes,J. Ultrasonic burnishing of AISI 316L stainless steel curved surfaces. 13○ Congreso
203

CHAPTER 6. CONCLUSIONS AND PERSPECTIVES
Iberoamericano de Ingenierıa Mecanica, Lisboa (Portugal), 23-26 October 2017.
Patent
Jerez-Mesa, R., Travieso-Rodrıguez, J.A., Gomez-Gras, G., Lluma-Fuentes, J. Her-ramienta de brunido con bola asistida por vibraciones ultrasonicas. Published en elBoletın Espanol de la Propiedad Intelectual, 2 de junio de 2017. Numero de publi-cacion: 2 615 002.
204

AL27 Taguchi arrays for experimental
design
205

APPENDIX A. L27 TAGUCHI ARRAYS FOR EXPERIMENTAL DESIGN
Table A.1. L27(313) Taguchi orthogonal array. A�er Taguchi et al., 2005 [142]
No. 1 2 3 4 5 6 7 8 9 10 11 12 131 1 1 1 1 1 1 1 1 1 1 1 1 12 1 1 1 1 2 2 2 2 2 2 2 2 23 1 1 1 1 3 3 3 3 3 3 3 3 34 1 2 2 2 1 1 1 2 2 2 3 3 35 1 2 2 2 2 2 2 3 3 3 1 1 16 1 2 2 2 3 3 3 1 1 1 2 2 27 1 3 3 3 1 1 1 3 3 3 2 2 28 1 3 3 3 2 2 2 1 1 1 3 3 39 1 3 3 3 3 3 3 2 2 2 1 1 110 2 1 2 3 1 2 3 1 2 3 1 2 311 2 1 2 3 2 3 1 2 3 1 2 3 112 2 1 2 3 3 1 2 3 1 2 3 1 213 2 2 3 1 1 2 3 2 3 1 3 1 214 2 2 3 1 2 3 1 3 1 2 1 2 315 2 2 3 1 3 1 2 1 2 3 2 3 116 2 3 1 2 1 2 3 3 1 2 2 3 117 2 3 1 2 2 3 1 1 2 3 3 1 218 2 3 1 2 2 3 1 1 2 3 3 1 219 3 1 3 2 1 3 2 1 3 2 1 3 220 3 1 3 2 2 1 3 2 1 3 2 1 321 3 1 3 2 3 2 1 3 2 1 3 2 122 3 2 1 3 1 3 2 2 1 3 3 2 123 3 2 1 3 2 1 3 3 2 1 1 3 224 3 2 1 3 2 1 3 3 2 1 1 3 225 3 3 2 1 1 3 2 3 2 1 2 1 326 3 3 2 1 2 1 3 1 3 2 3 2 127 3 3 2 1 3 2 1 2 1 3 1 3 2
206

Table A.2. Taguchi array followed for the experimental testing of AISI 1038.
# 𝐹𝑝 (N) 𝑛𝑝 𝑣𝑓 (mm/min) 𝑆0 St.1 90 1 300 1 nb02 90 1 600 2 bn90/03 90 1 900 3 bn04 90 3 300 2 bn05 90 3 600 3 nb06 90 3 900 1 bn90/07 90 5 300 3 bn90/08 90 5 600 1 bn09 90 5 900 2 nb010 180 1 300 3 bn90/011 180 1 600 1 bn012 180 1 900 2 nb013 180 3 300 1 nb014 180 3 600 2 bn90/015 180 3 900 3 bn016 180 5 300 2 bn017 180 5 600 3 nb018 180 5 900 1 bn90/019 270 1 300 2 bn020 270 1 600 3 nb021 270 1 900 1 bn90/022 270 3 300 3 bn90/023 270 3 600 1 bn024 270 3 900 2 nb025 270 5 300 1 nb026 270 5 600 2 bn90/027 270 5 900 3 bn0
207

APPENDIX A. L27 TAGUCHI ARRAYS FOR EXPERIMENTAL DESIGN
Table A.3. Taguchi array followed for the experimental testing of Ti-6Al-4V.
# 𝐹𝑝 (N) 𝑛𝑝 𝑣𝑓 (mm/min) 𝑆0 St.1 150 1 300 1 nb02 150 1 600 2 bn90/03 150 1 900 3 bn04 150 3 300 2 bn05 150 3 600 3 nb06 150 3 900 1 bn90/07 150 5 300 3 bn90/08 150 5 600 1 bn09 150 5 900 2 nb010 250 1 300 3 bn90/011 250 1 600 1 bn012 250 1 900 2 nb013 250 3 300 1 nb014 250 3 600 2 bn90/015 250 3 900 3 bn016 250 5 300 2 bn017 250 5 600 3 nb018 250 5 900 1 bn90/019 350 1 300 2 bn020 350 1 600 3 nb021 350 1 900 1 bn90/022 350 3 300 3 bn90/023 350 3 600 1 bn024 350 3 900 2 nb025 350 5 300 1 nb026 350 5 600 2 bn90/027 350 5 900 3 bn0
208

A.1. COMPLIANCE OF THE SUFFICIENT DEGREES OF FREEDOM CONDITION
A.1 Compliance of the su�icient degrees of freedomcondition
Interactions are represented as lines connecting the factors which take part of them inthe linear graph at Figure 4.2. As all factors are studied in 3 levels, 2 degrees of freedomare associated to each one. �erefore, second level interactions have 4 degrees offreedom, as shows Table A.4. Consequently, the designed experimental plan requires∑𝑑𝑜𝑓𝑖 = 22 degrees of freedom. �erefore, a 27-run plan based on the L27 array asproposed complies satisfactorily with this condition.
Table A.4. Actions included in the model and their degrees of freedom.
factors #levels #d.o.f.𝐹𝑝 3 2𝑛𝑝 3 2𝑣𝑓 3 2𝑆0 3 2St. 3 2𝐹𝑝*𝑛𝑝 9 4𝑣𝑓 *𝐹𝑝 9 4𝑛𝑝 *𝑣𝑓 9 4
209

APPENDIX A. L27 TAGUCHI ARRAYS FOR EXPERIMENTAL DESIGN
A.2 Compliance of the orthogonality condition
A common methodology to prove that all actions in the model are orthogonal amongthem, and consequently prove the orthogonality of the experimental array, is to rep-resent the Sisson-Vigier incidence matrix (Table A.5). It depicts the necessary mini-mum runs to analyse the e�ect of every uncoupled actions, which is the product oftheir levels inside the proposed array. For instance, the combination of 𝐹𝑝 and 𝑛𝑝,at three levels each, requires the execution of 32 tests to have enough informationabout their e�ects. �e orthogonality between the 𝑛𝑝 & 𝑣𝑓 interaction and the 𝑆0
factor is satis�ed if 3 ⋅ 33 runs are executed. �e experimental plan to analyse thedesired model must be a multiple of the least common multiple of all of them, that is𝑙𝑐𝑚 (9,27) = 27, which con�rms the orthogonality condition for the designed exper-imental setup based on the L27 array.
Table A.5. Sisson-Vigier incidence matrix of orthogonality of the experimental design. ∪:coupled actions.
𝐹𝑝 𝑛𝑝 𝑣𝑓 𝑆0 St. 𝐹𝑝*𝑛𝑝 𝐹𝑝*𝑣𝑓 𝑛𝑝*𝑣𝑓𝐹𝑝 –𝑛𝑝 9 –𝑣𝑓 9 9 –𝑆0 9 9 9 –St. 9 9 9 9 –
𝐹𝑝*𝑛𝑝 ∪ ∪ 27 27 27 –𝐹𝑝*𝑣𝑓 ∪ 27 ∪ 27 27 ∪ –𝑛𝑝*𝑣𝑓 27 ∪ ∪ 27 27 ∪ ∪ –
210

BVABB AISI 1038 texture figures
211

APPENDIX B. VABB AISI 1038 TEXTURE FIGURES
Figure B.1. Sequential height colour map of all VABB tests on AISI 1038 𝑆01 surfaces.
212

Figure B.2. Sequential height colour map of all VABB tests on AISI 1038 𝑆02 surfaces.
213

APPENDIX B. VABB AISI 1038 TEXTURE FIGURES
Figure B.3. Sequential height colour map of all VABB tests on AISI 1038 𝑆03 surfaces.
214

Figure B.4. VABB height distributions of AISI 1038 surfaces.215

APPENDIX B. VABB AISI 1038 TEXTURE FIGURES
Figure B.5. VABB Abbo�-Firestone curves of AISI 1038 surfaces.
216

CVABB Ti-6Al-4V texture figures
217

APPENDIX C. VABB TI-6AL-4V TEXTURE FIGURES
Figure C.1. Sequential height colour maps of all VABB tests on Ti-6Al-4V 𝑆01 surfaces.
218

Figure C.2. Sequential height colour maps of all VABB tests on Ti-6Al-4V 𝑆02 surfaces.
219

APPENDIX C. VABB TI-6AL-4V TEXTURE FIGURES
Figure C.3. Sequential height colour maps of all VABB tests on Ti-6Al-4V 𝑆03 surfaces.
220

Figure C.4. VABB height distributions of Ti-6Al-4V surfaces.221

APPENDIX C. VABB TI-6AL-4V TEXTURE FIGURES
Figure C.5. VABB Abbo�-Firestone curves of Ti-6Al-4V surfaces.
222

DS/N ratios of residual stress ANOVA
223

APPENDIX D. S/N RATIOS OF RESIDUAL STRESS ANOVA
Figure D.1. S/N ratios for the ANOVA analysis of RS in AISI 1038 surfaces.
224

Figure D.2. S/N ratios for the ANOVA analysis of RS in TA6V surfaces.
225

APPENDIX D. S/N RATIOS OF RESIDUAL STRESS ANOVA
226

Bibliography
[1] Abbott, E., and Firestone, F. Specifying surface quality. Mechanical Engi-neering 55, 9 (1933), 569–572.
[2] Altenberger, I., Nalla, R. K., Sano, Y., Wagner, L., and Ritchie, R. O. Onthe e�ect of deep rolling and laser peening on the stress-controlled low andhigh-cycle fatigue behavior of Ti-6Al-4V at elevated temperatures up to 550○C.International Journal of Fatigue 44 (2012), 292–302.
[3] Amdouni, H., Bouzaiene, H., Montagne, A., Van Gorp, A., Coorevits, T.,Nasri, M., and Iost, A. Experimental study of a six new ball-burnishing strate-gies e�ects on the Al-alloy �at surfaces integrity enhancement. �e Interna-tional Journal of Advanced Manufacturing Technology 90, 5-8 (2017), 2271–2282.
[4] Aviles, R., Albizuri, J., Rodriguez, A., and Lopez de la Calle, L. N. In�uenceof low plasticityf ball burnishing on the high-cycle fatigue strength of mediumcarbon AISI 1045 steel. International Journal of Fatigue 55 (2013), 230–244.
[5] Balland, P., Tabourot, L., Degre, F., and Moreau, V. Mechanics of the bur-nishing process. Precision Engineering 37, 1 (2013), 129–134.
[6] Basak, H., and Goktas, H. H. Burnishing process on Al alloy and optimizationof surface roughness and surface hardness by fuzzy logic. Materials & Design30, 4 (2009), 1275–1281.
[7] Blaha, F., and Langenecker, B. Dehnung von Zink-Kristallen unter Ultra-schalleinwirkung. Naturwissenscha�en 42, 20 (1955), 556–556.
[8] Blaha, F., and Langenecker, B. Plastizitatsuntersuchungen von Metal-lkristallen in Ultraschallfeld. Acta Metallurgica 7, 2 (1959), 93–100.
227

BIBLIOGRAPHY
[9] Born, M., and Wolf, E. Principles of optics: electromagnetic theory of propaga-tion, interference and di�raction of light. Elsevier, 2013.
[10] Bougharriou, A., Sai, K., and Bouzid, W. Finite element modelling of bur-nishing process. Materials Technology 25, 1 (2010), 56–62.
[11] Bouzid, W., Tsoumarev, O., and Sai, K. An investigation of surface roughnessof burnished AISI 1042 steel. �e International Journal of Advanced Manufac-turing Technology 24, 1-2 (2004), 120–125.
[12] Bozdana, A., and Gindy, N. Comparative experimental study on e�ects ofconventional and ultrasonic deep cold rolling processes on Ti–6Al–4V. Mate-rials Science and Technology 24, 11 (2008), 1378–1384.
[13] Bozdana, A. T., Gindy, N. N., and Li, H. Deep cold rolling with ultrasonicvibrations–a new mechanical surface enhancement technique. �e Interna-tional Journal of Machine Tools and Manufacture 45, 6 (2005), 713–718.
[14] Brehl, D., and Dow, T. Review of vibration-assisted machining. Precisionengineering 32, 3 (2008), 153–172.
[15] Callister, W. D., and Rethwisch, D. G. Fundamentals of materials scienceand engineering. Wiley London, 2000.
[16] Celaya, A., Rodriguez, A., Albizuri, J., Lopez de la Calle, L., and Alberdi,R. Finite element model of burnishing. In 9○ Congreso Iberoamericano de Inge-nierıa Mecanica (2009), Asociacion Espanola de Ingenierıa Mecanica, pp. 147–154.
[17] Cheng, B., Leung, H., and Ngan, A. Strength of metals under vibrations-dislocation-density-function dynamics simulations. Philosophical Magazine 95,16-18 (2015), 1845–1865.
[18] Chomienne, V., Valiorgue, F., Rech, J., and Verdu, C. In�uence of ball bur-nishing on residual stress pro�le of a 15-5PH stainless steel. CIRP Journal ofManufacturing Science and Technology (2016).
[19] Darlington, R. B. Is kurtosis really “peakedness?”. �e American Statistician24, 2 (1970), 19–22.
[20] Davim, J. P. Surface integrity in machining. Springer, 2010.
228

BIBLIOGRAPHY
[21] De Chiffre, L., Lonardo, P., Trumpold, H., Lucca, D., Goch, G., Brown, C.,Raja, J., and Hansen, H. N. �antitative characterisation of surface texture.CIRP annals-manufacturing technology 49, 2 (2000), 644–652.
[22] Donachie, M. Titanium: a technical guide. ASM International, 2000.
[23] Dong, W., Sullivan, P., and Stout, K. Comprehensive study of parameters forcharacterizing three-dimensional surface topography I: Some inherent proper-ties of parameter variation. Wear 159, 2 (1992), 161–171.
[24] Dong, W., Sullivan, P., and Stout, K. Comprehensive study of parameters forcharacterizing three-dimensional surface topography II: Statistical propertiesof parameter variation. Wear 167, 1 (1993), 9–21.
[25] Dong, W., Sullivan, P., and Stout, K. Comprehensive study of parameters forcharacterising three-dimensional surface topography III: Parameters for char-acterising amplitude and some functional properties. Wear 178, 1-2 (1994), 29–43.
[26] Dong, W., Sullivan, P., and Stout, K. Comprehensive study of parameters forcharacterising three-dimensional surface topography IV: Parameters for char-acterising spatial and hybrid properties. Wear 178, 1-2 (1994), 45–60.
[27] Dutta, R., Petrov, R., Delhez, R., Hermans, M., Richardson, I., andBottger, A. �e e�ect of tensile deformation by in situ ultrasonic treatment onthe microstructure of low-carbon steel. Acta Materialia 61, 5 (2013), 1592–1602.
[28] El-Axir, M., and Ibrahim, A. Some surface characteristics due to center restball burnishing. Journal of Materials Processing Technology 167, 1 (2005), 47–53.
[29] El-Axir, M., Othman, O., and Abodiena, A. Improvements in out-of-roundness and microhardness of inner surfaces by internal ball burnishing pro-cess. Journal of materials processing technology 196, 1 (2008), 120–128.
[30] El-Axir, M., Othman, O., and Abodiena, A. Study on the inner surface �n-ishing of aluminum alloy 2014 by ball burnishing process. Journal of MaterialsProcessing Technology 202, 1 (2008), 435–442.
[31] El-Helieby, S., and Rowe, G. In�uences of surface roughness and residualstress on fatigue life of ground steel components. Metals Technology 7, 1 (1980),221–225.
229

BIBLIOGRAPHY
[32] El-Khabeery, M., and El-Axir, M. Experimental techniques for studying thee�ects of milling roller-burnishing parameters on surface integrity. �e Inter-national Journal of Machine Tools and Manufacture 41, 12 (2001), 1705–1719.
[33] El-Tayeb, N., Low, K., and Brevern, P. In�uence of roller burnishing contactwidth and burnishing orientation on surface quality and tribological behaviourof aluminium 6061. Journal of Materials Processing Technology 186, 1 (2007),272–278.
[34] Endo, T., Suzuki, K., and Ishikawa, M. E�ects of superimposed ultrasonicoscillatory stress on the deformation of Fe and Fe-3% Si alloys. Transactions ofthe Japan Institute of Metals 20, 12 (1979), 706–712.
[35] Ezugwu, E., Da Silva, R., Bonney, J., and Machado, A. Evaluation of theperformance of CBN tools when turning Ti-6Al-4V alloy with high pressurecoolant supplies. �e International Journal of Machine Tools and Manufacture45, 9 (2005), 1009–1014.
[36] F, R. ASM Handbook Volume 5: Surface engineering. 1994.
[37] Fischer-Cripps, A. C. Introduction to contact mechanics. Springer, 2000.
[38] Fontaine, M., Devillez, A., Moufki, A., and Dudzinski, D. Predictive forcemodel for ball-end milling and experimental validation with a wavelike formmachining test. �e International Journal of Machine Tools and Manufacture 46,3 (2006), 367–380.
[39] Fu, C., Sealy, M., Guo, Y., and Wei, X. Austenite–martensite phase transfor-mation of biomedical nitinol by ball burnishing. Journal of Materials ProcessingTechnology 214, 12 (2014), 3122–3130.
[40] Garcia-Granada, A. A., Gomez-Gras, G., Jerez-Mesa, R., Travieso-Rodriguez, J. A., and Reyes, G. Ball-burnishing e�ect on deep residual stresson AISI 1038 and AA2017-T4. Materials and Manufacturing Processes 32, 11(2017), 1279–1289.
[41] Gharbi, F., Sghaier, S., Al-Fadhalah, K., and Benameur, T. E�ect of ballburnishing process on the surface quality and microstructure properties of AISI1010 steel plates. Journal of Materials Engineering and Performance 20, 6 (2011),903–910.
230

BIBLIOGRAPHY
[42] Gindin, I., Malik, G., Neklyudov, I., and Rozumnyi, O. E�ect of ultrasonicvibrations on the parameters of the hardening curve for copper single crystals.Soviet Physics Journal 15, 2 (1972), 192–196.
[43] Gomez-Gras, G. Estudio del proceso de brunido con bola asistido por una vi-bracion. PhD thesis, Universitat Politecnica de Catalunya, 2015.
[44] Gomez-Gras, G., Travieso-Rodriguez, J., Jerez-Mesa, R., Lluma-Fuentes,J., and Gomis de la Calle, B. Experimental study of lateral pass width inconventional and vibrations-assisted ball burnishing. �e International Journalof Advanced Manufacturing Technology (2016), 1–9.
[45] Gomez-Gras, G., Travieso-Rodriguez, J. A., Gonzalez-Rojas, H. A.,Napoles-Alberro, A., Carrillo, F. J., and Dessein, G. Study of a ball-burnishing vibration-assisted process. Proceedings of the Institution of Mechani-cal Engineers, Part B: Journal of Engineering Manufacture 229, 1 (2015), 172–177.
[46] Gorlenko, O. Assessment of surface roughness parameters and their interde-pendence. Precision Engineering 3, 2 (1981), 105–108.
[47] Griffiths, B. Problems in measuring the topography of machined surfacesproduced by plastic deformation mechanisms. Wear 109, 1-4 (1986), 195–205.
[48] Grzesik, W., and Zak, K. Modi�cation of surface �nish produced by hardturning using super�nishing and burnishing operations. Journal of MaterialsProcessing Technology 212, 1 (2012), 315–322.
[49] Guillemot, N. Prise en compte de l’integrite de surface pour la prevision dela tenue en fatigue de pieces usinees en fraisage. PhD thesis, Ecole NormaleSuperieure de Cachan, 2010.
[50] Hamadache, H., Laouar, L., Zeghib, N., and Chaoui, K. Characteristics ofRb40 steel super�cial layer under ball and roller burnishing. Journal of Mate-rials Processing Technology 180, 1 (2006), 130–136.
[51] Han, W., and Reddy, B. D. Plasticity: mathematical theory and numerical anal-ysis, vol. 9. Springer Science & Business Media, 2012.
[52] Hassan, A., Al-Jalil, H., and Ebied, A. Burnishing force and number of ballpasses for the optimum surface �nish of brass components. Journal of MaterialsProcessing Technology 83, 1 (1998), 176–179.
231

BIBLIOGRAPHY
[53] Hassan, A. M. �e e�ects of ball-and roller-burnishing on the surface rough-ness and hardness of some non-ferrous metals. Journal of materials processingtechnology 72, 3 (1997), 385–391.
[54] Hassan, A. M., and Al-Bsharat, A. S. Improvements in some properties ofnon-ferrous metals by the application of the ball-burnishing process. Journalof Materials Processing Technology 59, 3 (1996), 250–256.
[55] Hassan, A. M., and Al-Bsharat, A. S. In�uence of burnishing process onsurface roughness, hardness, and microstructure of some non-ferrous metals.Wear 199, 1 (1996), 1–8.
[56] Hassan, A. M., and Al-Dhifi, S. Z. Improvement in the wear resistance ofbrass components by the ball burnishing process. Journal of Materials Process-ing Technology 96, 1 (1999), 73–80.
[57] Hassan, A. M., and Maqableh, A. M. �e e�ects of initial burnishing param-eters on non-ferrous components. Journal of Materials Processing Technology102, 1 (2000), 115–121.
[58] Hassan, A. M., and Momani, A. M. Further improvements in some propertiesof shot peened components using the burnishing process. International Journalof Machine Tools and Manufacture 40, 12 (2000), 1775–1786.
[59] Hernot, X., Bartier, O., Bekouche, Y., El Abdi, R., and Mauvoisin, G. In�u-ence of penetration depth and mechanical properties on contact radius deter-mination for spherical indentation. International Journal of Solids and Structures43, 14 (2006), 4136–4153.
[60] Huuki, J., Hornborg, M., and Juntunen, J. In�uence of ultrasonic burnishingtechnique on surface quality and change in the dimensions of metal sha�s.Journal of Engineering (2014).
[61] Huuki, J., and Laakso, S. V. Integrity of surfaces �nished with ultrasonic bur-nishing. Proceedings of the Institution of Mechanical Engineers, Part B: Journalof Engineering Manufacture 227, 1 (2013), 45–53.
[62] Izumi, O., Oyama, K., and Suzuki, Y. E�ects of superimposed ultrasonic vibra-tion on compressive deformation of metals. Transactions of the Japan Instituteof Metals 7, 3 (1966), 162–167.
232

BIBLIOGRAPHY
[63] Izumi, O., Oyama, K., and Suzuki, Y. On the superimposing of ultrasonic vi-bration during compressive deformation of metals. Transactions of the JapanInstitute of Metals 7, 3 (1966), 158–161.
[64] Jawahir, I., Brinksmeier, E., M’saoubi, R., Aspinwall, D., Outeiro, J.,Meyer, D., Umbrello, D., and Jayal, A. Surface integrity in material re-moval processes: Recent advances. CIRP Annals-Manufacturing Technology 60,2 (2011), 603–626.
[65] Jayaraman, N., and Prevey, P. Application of low plasticity burnishing (lpb)to improve the corrosion fatigue performance and fod tolerance of alloy 450stainless steel. In Proceedings of the Tri-Service Corrosion Conference (2003),pp. 17–21.
[66] Jerez-Mesa, R., Travieso-Rodriguez, J., Gomez-Gras, G., and Lluma-Fuentes, J. Ultrasonic vibration-assisted ball burnishing tool. Referencia depatente: P201730385, 2017.
[67] Jiang, X. J., and Whitehouse, D. J. Technological shi�s in surface metrology.CIRP Annals-Manufacturing Technology 61, 2 (2012), 815–836.
[68] King, T., and Houghton, N. Describing distribution shape: Rk and centralmoment approaches compared. �e International Journal of Machine Tools andManufacture 35, 2 (1995), 247–252.
[69] King, T., and Spedding, T. A. On the relationships between surface pro�leheight parameters. Wear 83, 1 (1982), 91–108.
[70] Klocke, F., Backer, V., Wegner, H., Feldhaus, B., Baron, H.-U., and Hes-sert, R. In�uence of process and geometry parameters on the surface layerstate a�er roller burnishing of in718. Production Engineering 3, 4-5 (2009), 391–399.
[71] Koster, W., and Field, M. E�ect of machining variables on the surface andstructural integrity of ti. In Proceedings of the North American MetalworkingResearch Conference. (1973), vol. 2.
[72] Kozlov, A., Mordyuk, B., and Chernyashevsky, A. On the additivity ofacoustoplastic and electroplastic e�ects. Materials Science and Engineering: A190, 1 (1995), 75–79.
233

BIBLIOGRAPHY
[73] Kozlov, A., and Selitser, S. Peculiarities in the plastic deformation of crystalssubjected to the acoustoplastic e�ect. Materials Science and Engineering: A 102,2 (1988), 143–149.
[74] Kozlov, A., and Selitser, S. Kinetics of the acoustoplastic e�ect. MaterialsScience and Engineering: A 131, 1 (1991), 17–25.
[75] Kuznetsov, V., Tarasov, S. Y., and Dmitriev, A. Nanostructuring burnishingand subsurface shear instability. Journal of Materials Processing Technology 217(2015), 327–335.
[76] Langenecker, B. E�ects of ultrasound on deformation characteristics of met-als. Sonics and Ultrasonics, IEEE Transactions on 13, 1 (1966), 1–8.
[77] Lee, S., and Loh, N. Computer-integrated ball burnishing of a plastic-injection-mould cavity insert. Journal of Materials Processing Technology 57, 1 (1996),189–194.
[78] Lee, S., Tam, S., and Loh, N. Ball burnishing of 316L stainless steel. Journal ofMaterials Processing Technology 37, 1-4 (1993), 241–251.
[79] Loh, N., and Tam, S. E�ects of ball burnishing parameters on surface �nish–aliterature survey and discussion. Precision Engineering 10, 4 (1988), 215–220.
[80] Loh, N., Tam, S., and Miyazawa, S. Optimisation of the surface �nish producedby ball burnishing. Journal of Mechanical Working Technology 19, 1 (1989), 101–107.
[81] Loh, N., Tam, S., and Miyazawa, S. Statistical analyses of the e�ects of ballburnishing parameters on surface hardness. Wear 129, 2 (1989), 235–243.
[82] Loh, N., Tam, S., and Miyazawa, S. Surface hardening by ball burnishing.Tribology International 23, 6 (1990), 413–417.
[83] Loh, N., Tam, S., and Miyazawa, S. Use of response surface methodology tooptimize the �nish in ball burnishing. Precision engineering 12, 2 (1990), 101–105.
[84] Loh, N., Tam, S., and Miyazawa, S. Investigations on the surface roughnessproduced by ball burnishing. �e International Journal of Machine Tools andManufacture 31, 1 (1991), 75–81.
234

BIBLIOGRAPHY
[85] Loh, N., Tam, S., and Miyazawa, S. Application of experimental design in ballburnishing. �e International Journal of Machine Tools and Manufacture 33, 6(1993), 841–852.
[86] Loh, N., Tam, S., and Miyazawa, S. Ball burnishing of tool steel. PrecisionEngineering 15, 2 (1993), 100–105.
[87] Lopez de la Calle, L. N., Lamikiz, A., Sanchez, J., and Arana, J. �e e�ectof ball burnishing on heat-treated steel and Inconel 718 milled surfaces. �eInternational Journal of Advanced Manufacturing Technology 32, 9-10 (2007),958–968.
[88] Lopez de la Calle, L. N., Rodriguez, A., Lamikiz, A., Celaya, A., and Al-berdi, R. Five-axis machining and burnishing of complex parts for the im-provement of surface roughness. Materials and Manufacturing Processes 26, 8(2011), 997–1003.
[89] Luca, L., Neagu-Ventzel, S., and Marinescu, I. E�ects of working parame-ters on surface �nish in ball-burnishing of hardened steels. Precision Engineer-ing 29, 2 (2005), 253–256.
[90] Luo, H., Liu, J., Wang, L., and Zhong, Q. Investigation of the burnishingprocess with PCD tool on non-ferrous metals. �e International Journal of Ad-vanced Manufacturing Technology 25, 5-6 (2005), 454–459.
[91] Lye, S., and Leong, K. Some observations on the use of expert systems forthe ball-burnishing operation. Journal of Materials Processing Technology 22, 1(1990), 99–110.
[92] Majzoobi, G., Azadikhah, K., and Nemati, J. �e e�ects of deep rolling andshot peening on fre�ing fatigue resistance of Aluminum-7075-T6. MaterialsScience and Engineering: A 516, 1 (2009), 235–247.
[93] Malygin, G. Acoustoplastic e�ect and the stress superimposition mechanism.Physics of the Solid State 42, 1 (2000), 72–78.
[94] Marakov, A. Ultrasonic diamond burnishing. Russian Engineering Journal 53,9 (1973), 58–62.
[95] Martinez-Gonzalez, E., Picas, I., Casellas, D., and Romeu, J. Detectionof crack nucleation and growth in tool steels using fracture tests and acousticemission. Meccanica 50, 5 (2015), 1155–1166.
235

BIBLIOGRAPHY
[96] Martinez-Gonzalez, E., Picas, I., Romeu, J., and Casellas, D. Filtering ofacoustic emission signals for the accurate identi�cation of fracture mechanismsin bending tests. Materials Transactions 54, 7 (2013), 1087–1094.
[97] Martinez-Gonzalez, E., Ramirez, G., Romeu, J., and Casellas, D. Damageinduced by a spherical indentation test in tool steels detected by using acousticemission technique. Experimental Mechanics 55, 2 (2015), 449–458.
[98] Mason, W. E�ect of dislocations on ultrasonic wave a�enuation in metals. BellSystem Technical Journal 34, 5 (1955), 903–942.
[99] Michalski, J., and Pawlus, P. Characterization of the shape of the roughnesspro�le ordinate distribution of honed cylinder surfaces. Wear 161, 1-2 (1993),135–143.
[100] Mordyuk, B., Mordyuk, V., and Buryak, V. Ultrasonic drawing of tungstenwire for incandescent lamps production. Ultrasonics 42, 1 (2004), 109–111.
[101] Mordyuk, B. N., and Prokopenko, G. I. Ultrasonic impact peening for thesurface properties’ management. Journal of Sound and Vibration 308, 3 (2007),855–866.
[102] Morimoto, T., and Tamamura, K. E�ect of tool-material on burnishing pro-cess. Bulletin of the Japan Society of Precision Engineering 24, 3 (1990), 219–220.
[103] Murthy, R., and Kotiveerachari, B. Burnishing of metallic surfaces–a re-view. Precision Engineering 3, 3 (1981), 172–179.
[104] Nemat, M., and Lyons, A. An investigation of the surface topography of ballburnished mild steel and aluminium. �e International Journal of AdvancedManufacturing Technology 16, 7 (2000), 469–473.
[105] Nielsen, H. S. New approaches to surface roughness evaluation of specialsurfaces. Precision Engineering 10, 4 (1988), 209–213.
[106] Novovic, D., Dewes, R., Aspinwall, D., Voice, W., and Bowen, P. �e e�ectof machined topography and integrity on fatigue life. International Journal ofMachine Tools and Manufacture 44, 2 (2004), 125–134.
[107] Okada, M., Suenobu, S., Watanabe, K., Yamashita, Y., and Asakawa, N.Development and burnishing characteristics of roller burnishing method withrolling and sliding e�ects. Mechatronics 29 (2015), 110–118.
236

BIBLIOGRAPHY
[108] Pa lka, K., Weronski, A., and Zalewski, K. Mechanical properties and cor-rosion resistance of burnished X5CrNi18-9 stainless steel. Journal of Achieve-ments in Materials and Manufacturing Engineering 16, 1-2 (2006), 57–62.
[109] Pande, S., and Patel, S. Investigations on vibratory burnishing process. Inter-national Journal of Machine Tool Design and Research 24, 3 (1984), 195–206.
[110] Pervaiz, S., Rashid, A., Deiab, I., and Nicolescu, M. In�uence of tool materialson machinability of titanium- and nickel-based alloys: a review. Materials andManufacturing Processes 29 (2014), 219–252.
[111] Pillet, M. Les plans d’experiences par la methode Taguchi. Editionsd’organisation, 1997.
[112] Prevey, P. S., and Cammett, J. Low cost corrosion damage mitigation andimproved fatigue performance of low plasticity burnished 7075-T6. Journal ofMaterials Engineering and Performance 10, 5 (2001), 548–555.
[113] Prevey, P. S., Hornbach, D., Jacobs, T., and Ravindranath, R. Improveddamage tolerance in titanium alloy fan blades with low plasticity burnishing.Tech. rep., DTIC Document, 2002.
[114] Prevey, P. S., Jayaraman, N., and Ravindranath, R. Low Plasticity Burnish-ing (LPB) treatment to mitigate FOD and corrosion fatigue damage in 17-4 PHstainless steel. Tech. rep., DTIC Document, 2003.
[115] Rao, D. S., Hebbar, H. S., Komaraiah, M., and Kempaiah, U. Investigationson the e�ect of ball burnishing parameters on surface hardness and wear re-sistance of HSLA dual-phase steels. Materials and Manufacturing Processes 23,3 (2008), 295–302.
[116] Reason, R. Progress in the appraisal of surface topography during the �rsthalf-century of instrument development. Wear 57, 1 (1979), 1–16.
[117] Revankar, G. D., Shetty, R., Rao, S. S., and Gaitonde, V. N. Analysis of sur-face roughness and hardness in ball burnishing of titanium alloy. Measurement58 (2014), 256–268.
[118] Revankar, G. D., Shetty, R., Rao, S. S., and Gaitonde, V. N. Selection ofoptimal process parameters in ball burnishing of titanium alloy. MachiningScience and Technology 18, 3 (2014), 464–483.
237

BIBLIOGRAPHY
[119] Rodriguez, A., Lopez de la Calle, L. N., Celaya, A., Lamikiz, A., and Al-bizuri, J. Surface improvement of sha�s by the deep ball-burnishing technique.Surface and Coatings Technology 206, 11 (2012), 2817–2824.
[120] Roy, S., Fisher, J. W., and Yen, B. T. Fatigue resistance of welded details en-hanced by ultrasonic impact treatment (UIT). International Journal of Fatigue25, 9 (2003), 1239–1247.
[121] Sagbas, A. Analysis and optimization of surface roughness in the ball bur-nishing process using response surface methodology and desirabilty function.Advances in Engineering So�ware 42, 11 (2011), 992–998.
[122] Sai, W. B., and Sai, K. Finite element modeling of burnishing of aisi 1042 steel.�e International Journal of Advanced Manufacturing Technology 25, 5-6 (2005),460–465.
[123] Salahshoor, M., and Guo, Y. Process mechanics in ball burnishing biomedicalmagnesium–calcium alloy. �e International Journal of Advanced Manufactur-ing Technology 64, 1-4 (2013), 133–144.
[124] Sartkulvanich, P., Altan, T., Jasso, F., and Rodriguez, C. Finite elementmodeling of hard roller burnishing: an analysis on the e�ects of process pa-rameters upon surface �nish and residual stresses. Journal of ManufacturingScience and Engineering 129, 4 (2007), 705–716.
[125] Schuh, A., Zeller, C., Holzwarth, U., Kachler, W., Wilcke, G., Zeiler, G.,Eigenmann, B., and Bigoney, J. Deep rolling of titanium rods for applicationin modular total hip arthroplasty. Journal of Biomedical Materials Research PartB: Applied Biomaterials 81, 2 (2007), 330–335.
[126] Seemikeri, C., Brahmankar, P., and Mahagaonkar, S. Investigations on sur-face integrity of AISI 1045 using LPB tool. Tribology International 41, 8 (2008),724–734.
[127] Segawa, T., Sasahara, H., and Tsutsumi, M. Development of a new tool togenerate compressive residual stress within a machined surface. InternationalJournal of Machine Tools and Manufacture 44, 11 (2004), 1215–1221.
[128] Seqera, A., Fu, C., Guo, Y., and Wei, X. Surface integrity of Inconel 718 byball burnishing. Journal of Materials Engineering and Performance 23, 9 (2014),3347–3353.
238

BIBLIOGRAPHY
[129] Shepard, M. J., Prevey, P. S., and Jayaraman, N. E�ects of surface treatmenton fre�ing fatigue performance of Ti-6Al-4V. Tech. rep., DTIC Document, 2004.
[130] Sherrington, I., and Smith, E. Parameters for characterizing the surface to-pography of engineering components. Proceedings of the Institution of Mechan-ical Engineers, Part C: Journal of Mechanical Engineering Science 201, 4 (1987),297–306.
[131] Shiou, F., and Cheng, C. Ultra-precision surface �nish of NAK80 mould toolsteel using sequential ball burnishing and ball polishing processes. Journal ofMaterials Processing Technology 201, 1 (2008), 554–559.
[132] Shiou, F. J., and Chen, C. H. Freeform surface �nish of plastic injection moldby using ball burnishing process. Journal of Materials Processing Technology140, 1 (2003), 248–254.
[133] Shiou, F. J., and Chuang, C. H. Precision surface �nish of the mold steel PDS5using an innovative ball burnishing tool embedded with a load cell. PrecisionEngineering 34, 1 (2010), 76–84.
[134] Shiou, F. J., and Ciou, H. S. Ultra-precision surface �nish of the hardenedstainless mold steel using vibration-assisted ball polishing process. �e Inter-national Journal of Machine Tools and Manufacture 48, 7 (2008), 721–732.
[135] Siu, K., and Ngan, A. �e continuous sti�ness measurement technique innanoindentation intrinsically modi�es the strength of the sample. PhilosophicalMagazine 93, 5 (2013), 449–467.
[136] Siu, K., and Ngan, A. Oscillation-induced so�ening in copper and molybde-num from nano-to micro-length scales. Materials Science and Engineering: A572 (2013), 56–64.
[137] Siu, K., Ngan, A., and Jones, I. New insight on acoustoplasticity—ultrasonic ir-radiation enhances subgrain formation during deformation. International Jour-nal of Plasticity 27, 5 (2011), 788–800.
[138] Stout, K., and Davis, E. Surface topography of cylinder bores–the relation-ship between manufacture, characterization and function. Wear 95, 2 (1984),111–125.
239

BIBLIOGRAPHY
[139] Suh, A. Y., Polycarpou, A. A., and Conry, T. F. Detailed surface roughnesscharacterization of engineering surfaces undergoing tribological testing lead-ing to scu�ng. Wear 255, 1 (2003), 556–568.
[140] Tadic, B., Randjelovic, S., Todorovic, P., Zivkovic, J., Kocovic, V., Budak,I., and Vukelic, D. Using a high-sti�ness burnishing tool for increased dimen-sional and geometrical accuracies of openings. Precision Engineering 43 (2016),335–344.
[141] Tadic, B., Todorovic, P. M., Luzanin, O., Miljanic, D., Jeremic, B. M., Bog-danovic, B., and Vukelic, D. Using specially designed high-sti�ness bur-nishing tool to achieve high-quality surface �nish. �e International Journal ofAdvanced Manufacturing Technology 67, 1-4 (2013), 601–611.
[142] Taguchi, G., Chowdhury, S., and Wu, Y. Taguchi’s quality engineering hand-book. Wiley, 2005.
[143] Tanibayashi, M. A theory of the blaha e�ect. Physica Status Solidi (A) 128, 1(1991), 83–94.
[144] Taylor, J. Introduction to error analysis, the study of uncertainties in physicalmeasurements. 1997.
[145] Thamizhmanii, S., and Hassan, S. An experimental work on multi-roller bur-nishing process on di�cult to cut material–titanium alloy. International JournalOf Integrated Engineering 1, 1 (2009), 1–6.
[146] Thomas, T. Characterization of surface roughness. Precision Engineering 3, 2(1981), 97–104.
[147] Tian, Y., and Shin, Y. C. Laser-assisted burnishing of metals. �e InternationalJournal of Machine Tools and Manufacture 47, 1 (2007), 14–22.
[148] Travieso-Rodriguez, J. A. Estudio para la mejora del acabado super�cial desuper�cies complejas aplicando un proceso de deformacion plastica (Brunido conBola). PhD thesis, Universitat Politecnica de Catalunya, 2010.
[149] Travieso-Rodriguez, J. A., Dessein, G., and Gonzalez-Rojas, H. A. Improv-ing the surface �nish of concave and convex surfaces using a ball burnishingprocess. Materials and Manufacturing Processes 26, 12 (2011), 1494–1502.
240

BIBLIOGRAPHY
[150] Travieso-Rodriguez, J. A., Gomez-Gras, G., Dessein, G., Carrillo, F.,Alexis, J., Jorba-Peiro, J., and Aubazac, N. E�ects of a ball-burnishing pro-cess assisted by vibrations in g10380 steel specimens. �e International Journalof Advanced Manufacturing Technology 81, 9-12 (2015), 1757–1765.
[151] Travieso-Rodriguez, J. A., Gomez-Gras, G., Jorba-Peiro, J., Carrillo, F.,Dessein, G., Alexis, J., and Gonzalez-Rojas, H. Experimental study on themechanical e�ects of the vibration-assisted ball-burnishing process. Materialsand Manufacturing Processes 30, 12 (2015), 1490–1497.
[152] Tsuji, N., Tanaka, S., and Takasugi, T. Evaluation of surface-modi�ed Ti-6Al-4V alloy by combination of plasma-carburizing and deep-rolling. MaterialsScience and Engineering: A 488, 1 (2008), 139–145.
[153] Uddin, M., Hall, C., and Murphy, P. Surface treatments for controlling cor-rosion rate of biodegradable Mg and Mg-based alloy implants. Science andTechnology of Advanced Materials (2016).
[154] Ugur, E. Use of grey based Taguchi method in ball burnishing process for theoptimization of surface roughness and microhardness of AA 7075 aluminumalloy. Materiali in tehnologije 44, 3 (2010), 129–135.
[155] Ulutan, D., and Ozel, T. Machining induced surface integrity in titanium andnickel alloys: A review. International Journal of Machine Tools and Manufacture51, 3 (2011), 250–280.
[156] Velasqez, J. P., Tidu, A., Bolle, B., Chevrier, P., and Fundenberger, J. J.Sub-surface and surface analysis of high speed machined Ti-6Al-4V alloy. Ma-terials Science and Engineering: A 527, 10 (2010), 2572–2578.
[157] Withers, P., and Bhadeshia, H. Residual stress. Part 1–Measurement tech-niques. Materials science and Technology 17, 4 (2001), 355–365.
[158] Withers, P., and Bhadeshia, H. Residual stress. Part 2–Nature and origins.Materials science and technology 17, 4 (2001), 366–375.
[159] Xie, H., Wang, Q., Liu, K., Peng, F., Dong, X., and Wang, J. Investigation ofin�uence of direct-current pulses on springback during V-bending of AZ31Bmagnesium alloy sheet. Journal of Materials Processing Technology 219 (2015),321–327.
241

BIBLIOGRAPHY
[160] Yen, Y., Sartkulvanich, P., and Altan, T. Finite element modeling of rollerburnishing process. CIRP Annals-Manufacturing Technology 54, 1 (2005), 237–240.
[161] Zhang, T., Bugtai, N., and Marinescu, I. D. Burnishing of aerospace alloy: Atheoretical–experimental approach. Journal of Manufacturing Systems (2014).
[162] Zipin, R. B. �e e�ect on surface texture of material addition and removalprocesses. Surface and Interface Analysis 11, 6-7 (1988), 291–301.
242