
Thermal coupling of a high temperature PEM fuel cell with a complex hydride tank
Upload
khangminh22Category
view
2download
0
materials
Article
Interaction between Thermal Modification Temperature ofSpruce Wood and the Cutting and Fracture Parameters
Lud’ka Hlásková * , Jirí Procházka, Vít Novák, Petr Cermák and Zdenek Kopecký
�����������������
Citation: Hlásková, L.; Procházka, J.;
Novák, V.; Cermák, P.; Kopecký, Z.
Interaction between Thermal
Modification Temperature of Spruce
Wood and the Cutting and Fracture
Parameters. Materials 2021, 14, 6218.
https://doi.org/10.3390/
ma14206218
Academic Editor: Tomasz Sadowski
Received: 18 September 2021
Accepted: 13 October 2021
Published: 19 October 2021
Publisher’s Note: MDPI stays neutral
with regard to jurisdictional claims in
published maps and institutional affil-
iations.
Copyright: © 2021 by the authors.
Licensee MDPI, Basel, Switzerland.
This article is an open access article
distributed under the terms and
conditions of the Creative Commons
Attribution (CC BY) license (https://
creativecommons.org/licenses/by/
4.0/).
Department of Wood Science and Technology, Faculty of Forestry and Wood Technology,Mendel University in Brno, 61300 Brno, Czech Republic; [email protected] (J.P.);[email protected] (V.N.); [email protected] (P.C.); [email protected] (Z.K.)* Correspondence: [email protected]
Abstract: This work examines the effect of thermal modification temperatures in the productionof thermally modified wood on the cutting and fracture parameters when cutting heat-treatedspruce wood by a circular sawblade machine. The samples were thermally modified at 160, 180,200, and 220 ◦C. One sample was unmodified and was used as a reference sample. On the basis ofthe performed experiments, the fracture parameters (fracture toughness and shear yield strength)were calculated for the axial–perpendicular direction of cutting. In comparison with the theoreticalassumptions, the influence of temperature on the cutting and fracture parameters was confirmed.Thermally treated wood is characterized by increased fragility and susceptibility to crack formation,as well as reduced density, bending strength, and shear strength. These properties significantly affectthe size of the cutting force and feed force, as well as the fracture parameters. As the temperatureincreases, the values of these parameters decrease. The mentioned material characteristics could beuseful for the optimization of the cutting process, as well as for the issue of energy consumptionduring the machining of heat-treated wood.
Keywords: thermal modification; machining; cutting force; fracture toughness; shear yield strength;spruce wood
1. Introduction
Wood has always been a material that humans use daily, and since it is an availablerenewable building material, there is a good chance that this will still be true in the fu-ture [1]. In civil engineering, wood is most often incorporated in timber structures andtimber buildings [2]. Over the last twenty years, it has also been used for facades andterrace floors; however, its organic composition affects these uses rather negatively [3].This is mainly due to the fact that untreated wood is subject to biological and weatheringdegradation, to which it is exposed when it is used as an unprotected exterior [4]. However,with advanced industrial methods, such as thermal modification, this situation has largelyimproved [5]. Since the beginning of the development of thermal modification, heat-treatedtimber has been a frequent subject of research investigations. Although this is one ofmany possible wood hydrothermal processing techniques, it is the most frequently usedmethod after kiln drying [6]. By altering the wood structure, which varies depending onthe temperature used [7], the thermally treated wood has properties different from those ofuntreated wood [8]. The most important change is the gradual breakdown of hemicellu-loses and, partly, cellulose at the locations of its amorphous structure. This mainly results ina significant reduction in bending strength, with the modulus of elasticity in bending beingdisproportionately less reduced [9]. An interesting consequence, in terms of mechanicalproperties, is an increase in hardness [9,10], but this has not always been confirmed [8].The reduction of density [11] and the esterification of cellulose mean that thermally treatedwood has fewer free hydroxyl groups [12], leading to a rapid decrease in the equilibriummoisture content of the wood [13], which is, thus, less susceptible to biodegradation [14].
Materials 2021, 14, 6218. https://doi.org/10.3390/ma14206218 https://www.mdpi.com/journal/materials

Materials 2021, 14, 6218 2 of 16
Changes in the mechanical properties strongly correlate with the increasing temperatureused for the modification. Although the weakened thermally modified wood is not suitablefor structural purposes [15], it is increasingly used in practice, for example, for facade pan-eling, terrace floors, and also various elements in the urban space, as its increased biologicalresistance finds its application there [16]. Unlike physical and mechanical properties, whichare described very extensively in the literature, there is a lack of studies focused on thetechnological properties of heat-treated wood. However, changes in the mechanical andphysical properties are reflected in the machining of thermally modified wood [17]. As thedensity of the thermally modified wood decreases, the cutting force is lowered duringmachining [18,19], which is also reflected in the reduction in energy consumption [20].In the past, tests were conducted regarding the effect of thermal modification on the ma-chining force, but they were mostly related to milling [18,21] or grinding [22]. On theother hand, the cutting process has not been given much attention in the area of thermallymodified wood. Additionally, new findings have introduced a relatively new method tothe machining process, which is based on the cutting-force determination using fracturemechanics. This method was first applied to homogeneous materials, in particular, to metalmachining [23]. The method consists of the definition of the fracture toughness and theshear yield strength [24], i.e., unlike conventional methods of calculating the cutting force,this method is not based on the determination of the specific cutting resistance, kc [25],which is a function of many factors in the case of wood machining. The computationalmodel also uses the application of the Ernst–Merchant theory in the conditions of sawbladetimber cutting. The method was later applied to a wide range of materials [26], includingwood [27–31], as it can take into account the effect of the altered material structure on thesize of the cutting force. Thanks to new knowledge, it is possible to model the machiningof different materials more precisely using a prediction that highly correlates with actualmachining [32]. This paper calculates the cutting force by the computational model usingthe fracture methodology, based on the measured data of the feed force and the momentof force during the sawblade cutting of thermally modified spruce wood, under variousthermal modifications. Furthermore, the fracture parameters (fracture toughness and shearyield strength) [24], and the methodology for their application to woodworking, weredetermined [27]. Thus, they loosely follow the previous measurements, in which theseparameters were determined in the unmodified wood of beech (Fagus sylvatica L.) [28,33],in which beech wood modified in different ways was subjected to experiments. The aimof the research was to examine the effect of the thermal modification temperatures in theproduction of thermally treated wood on the cutting and feed force during circular sawcutting. Moreover, the fracture parameters (fracture toughness and shear yield strength)were determined directly from the machinability tests.
2. Materials and Methods2.1. Materials
Spruce wood (Picea abies) samples, taken from the Training Forest Enterprise MasarykForest Krtiny (TFE), an organizational part of the Mendel University in Brno (CZ), wereused. The samples were oven-dried (at 103 ± 2 ◦C) before the thermal modification processand were cut from the defect-free boards with standard circular saws. Ten samples for eachmodification temperature were used for the experiment. The samples were 750 mm long,20 mm thick, and 100 mm wide (Figure 1b).
Thermal modification at 160 ◦C, 180 ◦C, 200 ◦C, and 220 ◦C (Figure 1a) was appliedin a small-scale laboratory chamber, volume 0.7 m3 (KATRES spol. s r.o., Jihlava, CzechRepublic), under atmospheric pressure and in a superheated steam environment. The mod-ification phase (at 160 ◦C, 180 ◦C, 200 ◦C, and 220 ◦C) was maintained for 2 h.
Figure 2a,b show the records of the thermal modification process (TM) to obtainthermally modified wood at 160 ◦C and at 200 ◦C. The intensity and the degree of themodification process were determined by mass loss (ML), based on the oven-dried massbefore and after the thermal modification process.

Materials 2021, 14, 6218 3 of 16Materials 2021, 14, 6218 3 of 17
(a) (b)
Figure 1. (a) (1) temperature 220 °C; (2) temperature 200 °C; (3) temperature 180 °C; (4) temperature 160 °C; (5) a reference
sample without TM, (b) dimensions of the sample.
Thermal modification at 160 °C, 180 °C, 200 °C, and 220 °C (Figure 1a) was applied
in a small-scale laboratory chamber, volume 0.7 m3 (KATRES spol. s r.o., Jihlava, Czech
Republic), under atmospheric pressure and in a superheated steam environment. The
modification phase (at 160 °C, 180 °C, 200 °C, and 220 °C) was maintained for 2 h.
Figure 2a,b show the records of the thermal modification process (TM) to obtain ther-
mally modified wood at 160 °C and at 200 °C. The intensity and the degree of the modifi-
cation process were determined by mass loss (ML), based on the oven-dried mass before
and after the thermal modification process.
(a) (b)
Figure 2. Technological parameters of the modification process of heat-treated wood at 160 °C (a), and at 200 °C (b).
Table 1 presents the results of the weight before and after TM, the density before and
after TM, mass loss, and the moisture content. Ten samples for each temperature were
used and ten samples were not exposed to the effects of temperature (marked REF). Before
and after thermal modification, all samples were conditioned at 20 °C and 65% relative
humidity until the equilibrium moisture content was reached. The moisture content was
measured by a humidity meter (HMB-WS25, Merlin Technology GmbH, Ried im Innkreis,
Austria), which is used for quick nondestructive measurements.
-20.0
0.0
20.0
40.0
60.0
80.0
100.0
120.0
0.0
20.0
40.0
60.0
80.0
100.0
120.0
140.0
160.0
180.0
0:00 1:00 2:00 3:00 4:00 5:00 6:00
Ste
am
[%
] / S
uc
tio
n [
Pa
]
Te
mp
era
ture
[°C
]
Time [h]
Process temperature [°C] Suction [Pa] Steam [%]
0.0
20.0
40.0
60.0
80.0
100.0
120.0
0.0
50.0
100.0
150.0
200.0
250.0
0:00 1:00 2:00 3:00 4:00 5:00 6:00 7:00 8:00 9:00 10:00 11:00
Ste
am
[%
] / S
uc
tio
n [
Pa
]
Te
mp
era
ture
[°C
]
Time [h]
Process temperature [°C] Suction [Pa] Steam [%]
Figure 1. (a) (1) temperature 220 ◦C; (2) temperature 200 ◦C; (3) temperature 180 ◦C; (4) temperature 160 ◦C; (5) a referencesample without TM, (b) dimensions of the sample.
Materials 2021, 14, 6218 3 of 17
(a) (b)
Figure 1. (a) (1) temperature 220 °C; (2) temperature 200 °C; (3) temperature 180 °C; (4) temperature 160 °C; (5) a reference
sample without TM, (b) dimensions of the sample.
Thermal modification at 160 °C, 180 °C, 200 °C, and 220 °C (Figure 1a) was applied
in a small-scale laboratory chamber, volume 0.7 m3 (KATRES spol. s r.o., Jihlava, Czech
Republic), under atmospheric pressure and in a superheated steam environment. The
modification phase (at 160 °C, 180 °C, 200 °C, and 220 °C) was maintained for 2 h.
Figure 2a,b show the records of the thermal modification process (TM) to obtain ther-
mally modified wood at 160 °C and at 200 °C. The intensity and the degree of the modifi-
cation process were determined by mass loss (ML), based on the oven-dried mass before
and after the thermal modification process.
(a) (b)
Figure 2. Technological parameters of the modification process of heat-treated wood at 160 °C (a), and at 200 °C (b).
Table 1 presents the results of the weight before and after TM, the density before and
after TM, mass loss, and the moisture content. Ten samples for each temperature were
used and ten samples were not exposed to the effects of temperature (marked REF). Before
and after thermal modification, all samples were conditioned at 20 °C and 65% relative
humidity until the equilibrium moisture content was reached. The moisture content was
measured by a humidity meter (HMB-WS25, Merlin Technology GmbH, Ried im Innkreis,
Austria), which is used for quick nondestructive measurements.
-20.0
0.0
20.0
40.0
60.0
80.0
100.0
120.0
0.0
20.0
40.0
60.0
80.0
100.0
120.0
140.0
160.0
180.0
0:00 1:00 2:00 3:00 4:00 5:00 6:00
Ste
am
[%
] / S
uc
tio
n [
Pa
]
Te
mp
era
ture
[°C
]
Time [h]
Process temperature [°C] Suction [Pa] Steam [%]
0.0
20.0
40.0
60.0
80.0
100.0
120.0
0.0
50.0
100.0
150.0
200.0
250.0
0:00 1:00 2:00 3:00 4:00 5:00 6:00 7:00 8:00 9:00 10:00 11:00
Ste
am
[%
] / S
uc
tio
n [
Pa
]
Te
mp
era
ture
[°C
]
Time [h]
Process temperature [°C] Suction [Pa] Steam [%]
Figure 2. Technological parameters of the modification process of heat-treated wood at 160 ◦C (a), and at 200 ◦C (b).
Table 1 presents the results of the weight before and after TM, the density before andafter TM, mass loss, and the moisture content. Ten samples for each temperature wereused and ten samples were not exposed to the effects of temperature (marked REF). Beforeand after thermal modification, all samples were conditioned at 20 ◦C and 65% relativehumidity until the equilibrium moisture content was reached. The moisture content wasmeasured by a humidity meter (HMB-WS25, Merlin Technology GmbH, Ried im Innkreis,Austria), which is used for quick nondestructive measurements.
Table 1. Characteristics of samples.
Sample Weightbefore TM [g]
Weight afterTM [g]
Densitybefore TM[kg·m−3]
Density afterTM [kg·m−3]
Mass Loss[%]
MoistureContent
[%]
REF 286.47 ± 35.12 Same asbefore TM 416.03 ± 50.95 Same as
before TM 7.64
160 ◦C 285.26 ± 31.55 283.91 ± 30.71 413.85 ± 45.77 411.90 ± 44.55 0.47 ± 0.256 7.12180 ◦C 288.77 ± 33.04 285.54 ± 32.44 418.94 ± 47.94 414.26 ± 47.06 1.12 ± 0.185 6.89200 ◦C 286.78 ± 32.26 279.76 ± 31.34 416.06 ± 46.80 405.88 ± 45.47 2.45 ± 0.425 7.25220 ◦C 283.04 ± 31.88 274.08 ± 28.90 411.63 ± 46.25 397.63 ± 41.93 3.17 ± 0.847 7.16
2.2. Machinability Test
The machinability tests were performed on a research device focused on cutting withcircular sawblades. The test device was placed at the laboratory of the Department ofEngineering, the Faculty of Forestry and Wood Technology, Mendel University, in Brno.The test device simulated the conditions of a circular sawing machine in actual opera-tion [34]. During the machinability tests, the moment of force, Mc, and the rotationalspeed, n, were measured using the T34 FN-HBM (Hottinger Baldwin Messtechnik, Darm-

Materials 2021, 14, 6218 4 of 16
stadt, Germany) contactless sensor. The sensor was connected to the measuring controlunit Spider8 (HBM, Darmstadt, Germany), which feeds and simultaneously processes theoutput moment of force, Mc, and the rotational speed n signals. Spider8 is an electronicmeasuring system designed for measuring mechanical quantities (force, pressure, travel,speed, relative elongation, etc.) via the connected sensors (active and passive). The controlunit communicates with the computer, where the control software assesses the processedsignals. The workpiece feed force is measured tensiometrically using the S2-HBM resistivedynamometer (HBM, Darmstadt, Germany), which is located between the ball screw nutand the infeed carriage in such a way that its torsional stress, which would cause measure-ment inaccuracies, may be avoided. The dynamometer senses tension and pressure up to100 N or 200 N, with the accuracy class of 0.05.
The circular sawblade for longitudinal wood cutting (Flury Systems AG, Arch, Switzer-land), with carbide-tipped straight teeth, was used for the experiment. The parameters ofthe circular sawblade were as follows: the diameter was D = 350 mm; the teeth numberwas z = 28; and the sawblade thickness was s = 2.5 mm. The tool geometry was as follows:the clearance angle was αf = 15◦; the rake angle was γf = 20◦; and the cutting-edge radiuswas ρ0 = 8 µm.
The machine settings were as follows: optimum operating rotational speed = 3800 min−1
(i.e., the cutting speed vc = 69.6 m·s−1); the feed rate, vf, varied from 2–22 m·min−1 withthe steps presented in Table 2. This corresponded to the changing of the mean uncut chipthickness, hm, and the feed per tooth, fz. A series of ten measurements were performedfor each type of machined material and the present cutting conditions. The values of thecutting forces were subjected to statistical evaluation using a one-factor analysis of varianceANOVA test and a Scheffé test (StatSoft, Hamburg, Germany). Statistical analyses weredone for the significance level α = 0.05.
Table 2. Kinematic parameters and machine settings.
vf [m·min−1] v f = fz·n·z 2 6 10 16 22
fz [mm] fz =v f
n . z 0.019 0.056 0.094 0.15 0.207
hm [mm] hm = fz . sin ϕ2m 0.011 0.033 0.055 0.089 0.123
vc [m·s−1] vc = π·D·n 69.6
ϕ2m [◦] ϕ2m =ψ1+ψ2
2 36.5
ψ1 [◦] ψ1 = arccos(
ae+eD/2
)31.0
ψ2 [◦] ψ2 = arccos(
aeD/2
)42.0
For the following calculations, it was necessary to determine the cutting model, whichis determined on the basis of the used technology by characterizing the individual anglesbetween the wood fiber grain, the tool planes, and the motion vectors. In the case of thelongitudinal cutting of wood with a circular sawblade, this is the axial-perpendicular cuttingmodel. The calculation of the kinematic parameters of circular saw cutting is performedin accordance with the relations presented in Table 2. These variables (fz, hm, ϕ2m) are theinput parameters for the calculation, and their values are also shown in Table 2.
The circular sawing process scheme (Figure 3) indicates that the angle of fiber cuttingvaries. At the point of tooth contact with the workpiece, it is equal to the entry angle, ψ1 (atthis point, the uncut chip thickness has the minimum value, hmin). At the point of circularsawblade teeth disengagement, it is equal to the exit angle, ψ2 (the maximum uncut chipthickness, hmax, is reached). The mean fiber cutting angle, ϕ2m, is then equal to the averagevalue of both angles. When calculating, the mean uncut chip thickness, hm, is considered;it is determined at the point of the mean fiber cutting angle, ϕ2m.

Materials 2021, 14, 6218 5 of 16
Materials 2021, 14, 6218 5 of 17
Table 2. Kinematic parameters and machine settings.
vf [m·min−1] 𝑣𝑓 = 𝑓𝑧 ∙ 𝑛 ∙ 𝑧 2 6 10 16 22
fz [mm] 𝑓𝑧 =𝑣𝑓
𝑛 . 𝑧 0.019 0.056 0.094 0.15 0.207
hm [mm] ℎ𝑚 = 𝑓𝑧 . sin 𝜑2𝑚 0.011 0.033 0.055 0.089 0.123
vc [m·s−1] 𝑣𝑐 = 𝜋 ∙ 𝐷 ∙ 𝑛 69.6
2m [°] 𝜑2𝑚 =𝜓1 + 𝜓2
2 36.5
ψ1 [°] 𝜓1 = 𝑎𝑟𝑐𝑐𝑜𝑠 (𝑎𝑒 + 𝑒
𝐷 2⁄) 31.0
ψ2 [°] 𝜓2 = 𝑎𝑟𝑐𝑐𝑜𝑠 (𝑎𝑒
𝐷 2⁄) 42.0
For the following calculations, it was necessary to determine the cutting model,
which is determined on the basis of the used technology by characterizing the individual
angles between the wood fiber grain, the tool planes, and the motion vectors. In the case
of the longitudinal cutting of wood with a circular sawblade, this is the axial-perpendicu-
lar cutting model. The calculation of the kinematic parameters of circular saw cutting is
performed in accordance with the relations presented in Table 2. These variables (fz, hm,
2m) are the input parameters for the calculation, and their values are also shown in Table
2.
The circular sawing process scheme (Figure 3) indicates that the angle of fiber cutting
varies. At the point of tooth contact with the workpiece, it is equal to the entry angle, ψ1
(at this point, the uncut chip thickness has the minimum value, hmin). At the point of circu-
lar sawblade teeth disengagement, it is equal to the exit angle, ψ2 (the maximum uncut
chip thickness, hmax, is reached). The mean fiber cutting angle, 2m, is then equal to the
average value of both angles. When calculating, the mean uncut chip thickness, hm, is con-
sidered; it is determined at the point of the mean fiber cutting angle, 2m.
Figure 3. Circular sawing process scheme: e—workpiece height; ae—position of the workpiece; R—
circular sawblade radius; ψ1—entry angle; ψ2—exit angle; 2m—mean fiber cutting angle; hmin—min-
imum uncut chip thickness; hm—mean uncut chip thickness; hmax—maximum uncut chip thickness;
Fc—cutting force; Ff—feed force; fz—feed per tooth.
2.3. Methodology for the Determination of Fracture Properties from the Machinability Test
The average total cutting power, Pc_T, during cutting with a circular sawblade can be
calculated by the means of the cutting forces model presented by [23,24]. This model takes
into account the elements of fracture mechanics (fracture toughness R) and shear yield
strength, τγ. This methodology was elaborated for the cases of wood cutting with the
frame saw machine by the authors [35–37], the band saw machine [29], the milling ma-
chine [38], and the circular sawing machine [33].
Because of the material properties included in the model (fracture toughness, R, and
shear yield strength, τγ), this model allows for the determination of the cutting power for
wood machining processes, including the inclusion of the wood origin [39], or the type of
Figure 3. Circular sawing process scheme: e—workpiece height; ae—position of the workpiece;R—circular sawblade radius; ψ1—entry angle; ψ2—exit angle; ϕ2m—mean fiber cutting angle; hmin—minimum uncut chip thickness; hm—mean uncut chip thickness; hmax—maximum uncut chip thick-ness; Fc—cutting force; Ff—feed force; fz—feed per tooth.
2.3. Methodology for the Determination of Fracture Properties from the Machinability Test
The average total cutting power, Pc_T, during cutting with a circular sawblade canbe calculated by the means of the cutting forces model presented by [23,24]. This modeltakes into account the elements of fracture mechanics (fracture toughness R) and shearyield strength, τγ. This methodology was elaborated for the cases of wood cutting withthe frame saw machine by the authors [35–37], the band saw machine [29], the millingmachine [38], and the circular sawing machine [33].
Because of the material properties included in the model (fracture toughness, R, and shearyield strength, τγ), this model allows for the determination of the cutting power forwood machining processes, including the inclusion of the wood origin [39], or the type ofwood modification [33,40], and its impact on the energy consumption. The model can bepresented as Equation (1):
Pc_T = Pc + Pac + Pdull = za·τγ·b·γQshear
·hm·vc + za·R·b
Qshear·vc + Pac + Pdull (1)
where za is the number of simultaneously cutting teeth; b is the kerf width; γ is the shearstrain along the shear plane; and Qshear is the coefficient of friction correction.
Total power consists of three components. The first component describes:
1a: The internal work of plasticity along the shear plane, where the shear strain along theshear plane, γ, is described as:
γ =cos γ f
cos(
Φ− γ f
)sin Φ
(2)
where γf is the rake angle, and ϕ is the shear plane angle.Cutting by circular sawblade machine is characterized by a small uncut chip thickness,
so it was necessary to adjust the value of the angle of the cutting plane according to therelationship [41] and take into account the dependence of the ratio of the fracture toughnessand the shear yield strength.
1b: The internal work required for the separation/formation of new surface, wherefracture toughness, R, corresponds to the specific work of material separation.
The coefficient of friction correction, Qshear, can be found in both parts of the firstcomponent. Qshear depends, in principle, on the orientation of the shear plane to themachined workpiece and represents an effect of the friction between the rake face and theseparated material. Qshear is computed according to [23,24]:
Qshear =[1−
(sin βµ· sin Φ/ cos
(β− γ f
)cos(
Φ− γ f
))](3)

Materials 2021, 14, 6218 6 of 16
where βµ = tan−1µ is the friction angle, and µ is the coefficient of friction.Using the measured moment of force, Mc, and the feed force, Ff, other components
of the resulting active force were determined. The calculation was based on the Ernst–Merchant circle force diagram [42].
2: The second component expresses the kinetic energy for chip removal by the circularsawblade (does not affect the value of cutting resistance). The acceleration power ofchips, Pac, can be described as a function of mass flow and tool velocity [26,27,40]:
Pac =.
m·v2c (4)
.m =
b·l·v f ·ρw
2(5)
where l is the cut length, and ρw is the wood density.All this work is provided externally from the cutting force components moving in
parallel to the machined surface [27]. The effect of chip acceleration power, Pac, on theoverall cutting power is negligible. Therefore, Pac was omitted from the analyses performedin this research.
3: The last component, Pdull, is the power that considers the dulling of cutting edges.It explains the increase in the cutting forces observed throughout the tool life in thereal processes [29]. It is important to note that this model assumes perfect cutting-edge sharpness; therefore, the component, Pdull, can be omitted. Moreover, it does notconsider the effect of dulling and chip momentum due to the average values of thefeed rates during wood cutting [33].
The cutting force is expressed by the line slope in the form:
Fc1z = (k)·hm + q (6)
In this case, k corresponds to the slope of the linear regression line, and q correspondsto the intercept of the linear regression line with the y axis. The independent variable ofthe regression is the mean uncut chip thickness, hm. It is possible, therefore, to determinethe values of the fracture parameters (fracture toughness, R||⊥, and shear yield strength,τγ||⊥) by comparing the regression (Equation (8)) with the experimental data obtainedfrom the machinability tests. The method of calculating the fracture toughness and shearyield strength is based on the cutting theory originally proposed by [43].
The mathematical procedure for the computation of the shear yield strength andthe fracture toughness is expressed in Equations (7) and (8), from the slope of the linearregression line and the intercept, respectively:
τγ‖⊥ =k·Qshear
b·γ (7)
R‖⊥ =q·Qshear
b(8)
3. Results and Discussion3.1. Cutting Force and Feed Force
The moment of force and the feed-force curves are shown in Figure 4a,b, where threecutting phases can be distinguished. At the beginning of the cutting process, the momentof force and the feed force rise steeply and reach a maximum value. Then, after a smallpeak, the signal stabilizes. For the calculation of the mean moment of force and the feedforce values, only this so-called steady-state signal range was taken into consideration.This part of the record was further processed, and the results of the experiment and thecalculation of the fracture parameters are based on it. The next phase is when the circularsawblade leaves the workpiece. This part of the measurements is accompanied by a steepdecrease in forces because the circular sawblade is no longer pushed to overcome the

Materials 2021, 14, 6218 7 of 16
cutting resistance of the workpiece. The forces are stabilized at the values of the so-calledpassive resistances, caused by friction in the bearings, aerodynamic losses, etc. The valuesof the passive resistances must be subtracted from the measured values of the moment offorce and the feed force.
Materials 2021, 14, 6218 7 of 17
In this case, k corresponds to the slope of the linear regression line, and q corresponds
to the intercept of the linear regression line with the y axis. The independent variable of
the regression is the mean uncut chip thickness, hm. It is possible, therefore, to determine
the values of the fracture parameters (fracture toughness, R||⊥, and shear yield strength,
τγ||⊥) by comparing the regression (Equation (8)) with the experimental data obtained
from the machinability tests. The method of calculating the fracture toughness and shear
yield strength is based on the cutting theory originally proposed by [43].
The mathematical procedure for the computation of the shear yield strength and the
fracture toughness is expressed in Equations (7) and (8), from the slope of the linear re-
gression line and the intercept, respectively:
𝜏𝛾∥⊥ =𝑘 ∙ 𝑄𝑠ℎ𝑒𝑎𝑟
𝑏 ∙ 𝛾 (7)
𝑅∥⊥ =𝑞 ∙ 𝑄𝑠ℎ𝑒𝑎𝑟
𝑏 (8)
3. Results and Discussion
3.1. Cutting Force and Feed Force
The moment of force and the feed-force curves are shown in Figure 4a,b, where three
cutting phases can be distinguished. At the beginning of the cutting process, the moment
of force and the feed force rise steeply and reach a maximum value. Then, after a small
peak, the signal stabilizes. For the calculation of the mean moment of force and the feed
force values, only this so-called steady-state signal range was taken into consideration.
This part of the record was further processed, and the results of the experiment and the
calculation of the fracture parameters are based on it. The next phase is when the circular
sawblade leaves the workpiece. This part of the measurements is accompanied by a steep
decrease in forces because the circular sawblade is no longer pushed to overcome the cut-
ting resistance of the workpiece. The forces are stabilized at the values of the so-called
passive resistances, caused by friction in the bearings, aerodynamic losses, etc. The values
of the passive resistances must be subtracted from the measured values of the moment of
force and the feed force.
(a) (b)
Figure 4. (a)The moment of force for feed rate 10 m·min−1; (b) feed force for feed rate 10 m·min−1.
Figure 5 presents the dependence of the average value of the measured cutting force
per single tooth as a function of the mean uncut chip thickness. An almost linear increase
in the cutting force occurred, along with an increasing uncut chip thickness. This finding
confirms the theoretical assumptions (see Equation (6)). Figure 5 further presents the co-
efficients of determination, r2, and the regression equations of the cutting force per single
tooth as a function of the uncut chip thickness, with cutting-modified and native spruce,
respectively.
-2
-1
0
1
2
3
4
5
0.00 0.67 1.33 2.00 2.67 3.33 4.00 4.67 5.33 6.00 6.67 7.33 8.00
Mo
me
nt
of
forc
e [
Nm
]
Time (s)
Moment of force 220 °C Moment of force 200 °C Moment of force 180 °C
Moment of force 160°C Moment of force REF
-40
-30
-20
-10
0
10
20
30
40
50
60
70
0.00 0.67 1.33 2.00 2.67 3.33 4.00 4.67 5.33 6.00 6.67 7.33 8.00
Fe
ed
fo
rce [
N]
Time (s)
Feed force 220 °C Feed force 200 °C Feed force 180 °C
Feed force 160°C Feed force REF
Figure 4. (a)The moment of force for feed rate 10 m·min−1; (b) feed force for feed rate 10 m·min−1.
Figure 5 presents the dependence of the average value of the measured cutting forceper single tooth as a function of the mean uncut chip thickness. An almost linear increasein the cutting force occurred, along with an increasing uncut chip thickness. This findingconfirms the theoretical assumptions (see Equation (6)). Figure 5 further presents thecoefficients of determination, r2, and the regression equations of the cutting force persingle tooth as a function of the uncut chip thickness, with cutting-modified and nativespruce, respectively.
Materials 2021, 14, 6218 8 of 17
Figure 5. Dependance of average values of cutting force per single tooth on uncut chip thickness.
The ANOVA analysis was performed for each feed rate separately and the results of
the ANOVA test confirm the effect of temperature on the values of the cutting forces (see
Table 3). Subsequently, a Scheffé test (a multiple comparison test) was performed at each
feed rate. All tests showed statistically significant differences in the mean values of the
cutting forces for each feed rate. Therefore, we were able to statistically prove the effect of
temperature on the size of the cutting force when cutting spruce wood and thermally
modified wood with a circular sawblade.
Table 3. ANOVA analysis: influence of temperature on the cutting force per single tooth.
vf [m·min−1] F p Value Fkrit Evaluation of Statistical Tests
2 146.74 0.00002 5.19 F > Fkrit Statistically significant
differences
6 19.25 0.00307 5.19 F > Fkrit Statistically significant
differences
10 38.78 0.00059 5.19 F > Fkrit Statistically significant
differences
16 16.48 0.00438 5.19 F > Fkrit Statistically significant
differences
22 24.09 0.00183 5.19 F > Fkrit Statistically significant
differences
The graph of the cutting forces per single tooth, dependent on the size of the mean
uncut chip thickness (Figure 5), shows that the cutting force increases with an increasing
mean uncut chip thickness. This dependence is linear, as confirmed by [44–46]. Moreover,
the graph indicates the effect of the modification temperature on the value of the cutting
force for individual thermally modified wood samples and for the unmodified spruce
sample. Figure 5 clarifies that modified wood behaves differently from unmodified spruce
samples during machining.
The results show that the cutting force is the highest when the unmodified sample
(REF) is machined. We also found that the higher the temperature when modifying wood,
the lower the value of the cutting force. This corresponds with the results of the authors
of [47], who confirmed a decrease in the cutting force during the milling of pine samples
(Pinus contorta). They observed the highest decrease in cutting force for a modification
temperature of 240 °C (26.9%). The authors of [18] also confirmed that, at temperatures
220: y = 217595x + 3.1749R² = 0.994
200: y = 225952x + 4.0451R² = 0.9867
180: y = 261589x + 4.6876R² = 0.9963
160: y = 259907x + 4.7175R² = 0.9966
REF: y = 307268x + 4.8947R² = 0.9985
0
5
10
15
20
25
30
35
40
45
0 0.015 0.03 0.045 0.06 0.075 0.09 0.105 0.12 0.135 0.15
Fc
1z
[N]
hm [mm]
220 °C 200 °C 180 °C 160 °C REF
Figure 5. Dependance of average values of cutting force per single tooth on uncut chip thickness.
The ANOVA analysis was performed for each feed rate separately and the results ofthe ANOVA test confirm the effect of temperature on the values of the cutting forces (seeTable 3). Subsequently, a Scheffé test (a multiple comparison test) was performed at eachfeed rate. All tests showed statistically significant differences in the mean values of thecutting forces for each feed rate. Therefore, we were able to statistically prove the effectof temperature on the size of the cutting force when cutting spruce wood and thermallymodified wood with a circular sawblade.

Materials 2021, 14, 6218 8 of 16
Table 3. ANOVA analysis: influence of temperature on the cutting force per single tooth.
vf [m·min−1] F p Value Fkrit Evaluation of Statistical Tests
2 146.74 0.00002 5.19 F > Fkrit Statistically significant differences6 19.25 0.00307 5.19 F > Fkrit Statistically significant differences
10 38.78 0.00059 5.19 F > Fkrit Statistically significant differences16 16.48 0.00438 5.19 F > Fkrit Statistically significant differences22 24.09 0.00183 5.19 F > Fkrit Statistically significant differences
The graph of the cutting forces per single tooth, dependent on the size of the meanuncut chip thickness (Figure 5), shows that the cutting force increases with an increasingmean uncut chip thickness. This dependence is linear, as confirmed by [44–46]. Moreover,the graph indicates the effect of the modification temperature on the value of the cuttingforce for individual thermally modified wood samples and for the unmodified sprucesample. Figure 5 clarifies that modified wood behaves differently from unmodified sprucesamples during machining.
The results show that the cutting force is the highest when the unmodified sample(REF) is machined. We also found that the higher the temperature when modifying wood,the lower the value of the cutting force. This corresponds with the results of the authorsof [47], who confirmed a decrease in the cutting force during the milling of pine samples(Pinus contorta). They observed the highest decrease in cutting force for a modificationtemperature of 240 ◦C (26.9%). The authors of [18] also confirmed that, at temperaturesabove 160 ◦C, a lower cutting force is needed for milling thermally modified pine wood(Pinus sylvestris) than for the milling of unmodified pine wood. Finally, [48] confirmed thatthe cutting force for milling spruce decreases with higher temperatures of modification.The decrease in the cutting force is caused by the lower strength of the thermally modifiedwood [49–55].
The authors of [56] conducted research into heat-treated birch wood and demonstrateda decrease in the modulus of rupture (MOR) with an increasing modification temperature(especially above 200 ◦C). The authors of [57] concluded that the MOR of spruce woodmodified at 220 ◦C was, on average, 50% lower than that of unmodified wood. Woodtreated with thermal modification becomes more fragile, and its bending strength andtensile strength decrease by up to 10–30%, based on the research of [58]. The decreaseis related to the loss of chemicals in the wood [59–62]. This leads to a decrease in thewood weight and wood density [53,54,60,63,64]. Our samples showed a 3.17% decreasein the density of wood modified at 220 ◦C, compared to untreated wood. The massloss is caused by the thermal degradation of the wood cell wall components (especiallyhemicelluloses) [63,64]. Hemicellulose plays an important role in reducing the physicaland mechanical properties of thermally modified wood because it is less stable to heat thancellulose and lignin at higher temperatures [65,66]. The authors of [67] state that the physi-cal properties of hemicellulose change under modification temperatures between 127 ◦Cand 235 ◦C, the properties of lignin change from 167 ◦C to 217 ◦C, and those of cellulosechange from 231 ◦C to 253 ◦C. It follows that the higher the modification temperature,the more the individual wood structure components will be degraded, accompanied by adecrease in the mechanical and technological properties of the wood. Thermal modificationalso causes an increased Young’s module, fragility, and a susceptibility to crack forma-tion [67–69], as well as a decrease in the specific cutting resistance and the specific workof fracture [18,69–71]. The cutting force, at machining, of wood modified at 220 ◦C and afeed rate of 22 m·min−1 is 25% lower than that of the unmodified sample, and in woodtreated at 200 ◦C, it is 21.6% lower. The decrease in the cutting force for wood modifiedat 160 ◦C and 180 ◦C was minimal, and the cutting force was 8% lower compared to theunmodified sample. The results of the research of [72] show that the milling of heat-treatedwood is less energy-intensive, and also reveal that the cutting force decreased only slightlywhen the modification temperature increased from 160 ◦C to 180 ◦C. With a further in-crease in temperature, the cutting force decreased significantly, as in our measurement.

Materials 2021, 14, 6218 9 of 16
Thanks to the altered physical and mechanical properties of heat-treated wood (e.g., higherfragility), chips are easier to break and crumble, which has a positive effect on reducing thecutting force.
Figure 6 shows that the force required to feed the workpiece in the sawblade at aspeed of 2–22 m·min−1 ranges from 5 N to 25 N for the experiments performed. In general,the feed force increases for all modified materials, as well as for the reference sample,with an increasing feed rate. The dependence is linear with a relatively high coefficient ofdetermination. In the research of [73], a positive correlation was observed between the feedrate and the feed force during the cutting of particle-board panels using a circular saw.
Materials 2021, 14, 6218 10 of 17
Figure 6. Dependance of average values of feed force on uncut chip thickness.
The graph also shows that, as the modification temperature increases, the feed force
decreases. The most significant difference is obvious in the machining of wood thermally
modified at 220 °C and the lowest feed rate (2 m·min−1); the decrease compared to the
reference sample was almost 60%. The difference between the reference sample and the
material modified at 160 °C and 180 °C was up to 10%. Due to the easier splitting and
fragility of thermally modified wood, and thanks to its deteriorated mechanical proper-
ties, the feed mechanisms do not need such a large feed force, as is the case with untreated
wood.
3.2. Fracture Parameters: Fracture Toughness and Shear Yield Strength
In Figure 5, linear regression lines are drawn and the coefficients of determination,
r2, for each model, and the regression equations, are presented. On the basis of the exper-
iments performed (from the regression parameters), the characteristic input parameters
(φ, μ, βμ, γ, Qshear) entering the model for the axial-perpendicular model were calculated
for cutting with the circular sawblade for the kerf width, b = 3.5 mm, and for a tooth posi-
tion defined by the mean fiber cutting angle, φ2m = 36.5°. The characteristic data for all
machined materials were estimated according to [24]. The input values are shown and
compared in Table 4.
Table 4. Comparison of regression equation, coefficient of determination values, slope values, and
intercept values.
Regression Equation Coefficient of De-
termination r2
Slope Value k
[N·m−1]
Intercept
Value q [N]
REF Fc1z = 307,268 hm + 4.8947 0.9985 307.268 4.8947
160 °C Fc1z = 259,907 hm + 4.7175 0.9966 259.907 4.7175
180 °C Fc1z = 261,589 hm + 4.6876 0.9963 261.589 4.6876
200 °C Fc1z = 225,952 hm + 4.0451 0.9867 225.952 4.0451
220 °C Fc1z = 217,595 hm + 3.1749 0.994 217.595 3.1749
The determination of the main parameters of the model was performed on the basis
of regression analysis. Fracture toughness, R||⊥, was determined from the intercept, and
the shear yield strength, τγ||⊥, from its slope. The average values of fracture toughness,
R||⊥, and shear yield strength, τγ||⊥, were calculated with their corresponding standard
220: y = 140185x + 2.0097R² = 0.9666
200: y = 105378x + 7.9478R² = 0.9964
180: y = 117875x + 8.5765R² = 0.9973
160: y = 111601x + 9.0757R² = 0.9965
REF: y = 109753x + 9.6915R² = 0.99
0
5
10
15
20
25
30
0 0.015 0.03 0.045 0.06 0.075 0.09 0.105 0.12 0.135 0.15
Ff[N
]
hm [mm]
220 °C 200 °C 180 °C 160 °C REF
Figure 6. Dependance of average values of feed force on uncut chip thickness.
The graph also shows that, as the modification temperature increases, the feed forcedecreases. The most significant difference is obvious in the machining of wood thermallymodified at 220 ◦C and the lowest feed rate (2 m·min−1); the decrease compared to thereference sample was almost 60%. The difference between the reference sample and thematerial modified at 160 ◦C and 180 ◦C was up to 10%. Due to the easier splitting andfragility of thermally modified wood, and thanks to its deteriorated mechanical properties,the feed mechanisms do not need such a large feed force, as is the case with untreated wood.
3.2. Fracture Parameters: Fracture Toughness and Shear Yield Strength
In Figure 5, linear regression lines are drawn and the coefficients of determination,r2, for each model, and the regression equations, are presented. On the basis of the exper-iments performed (from the regression parameters), the characteristic input parameters(ϕ, µ, βµ, γ, Qshear) entering the model for the axial-perpendicular model were calculatedfor cutting with the circular sawblade for the kerf width, b = 3.5 mm, and for a toothposition defined by the mean fiber cutting angle, ϕ2m = 36.5◦. The characteristic data forall machined materials were estimated according to [24]. The input values are shown andcompared in Table 4.
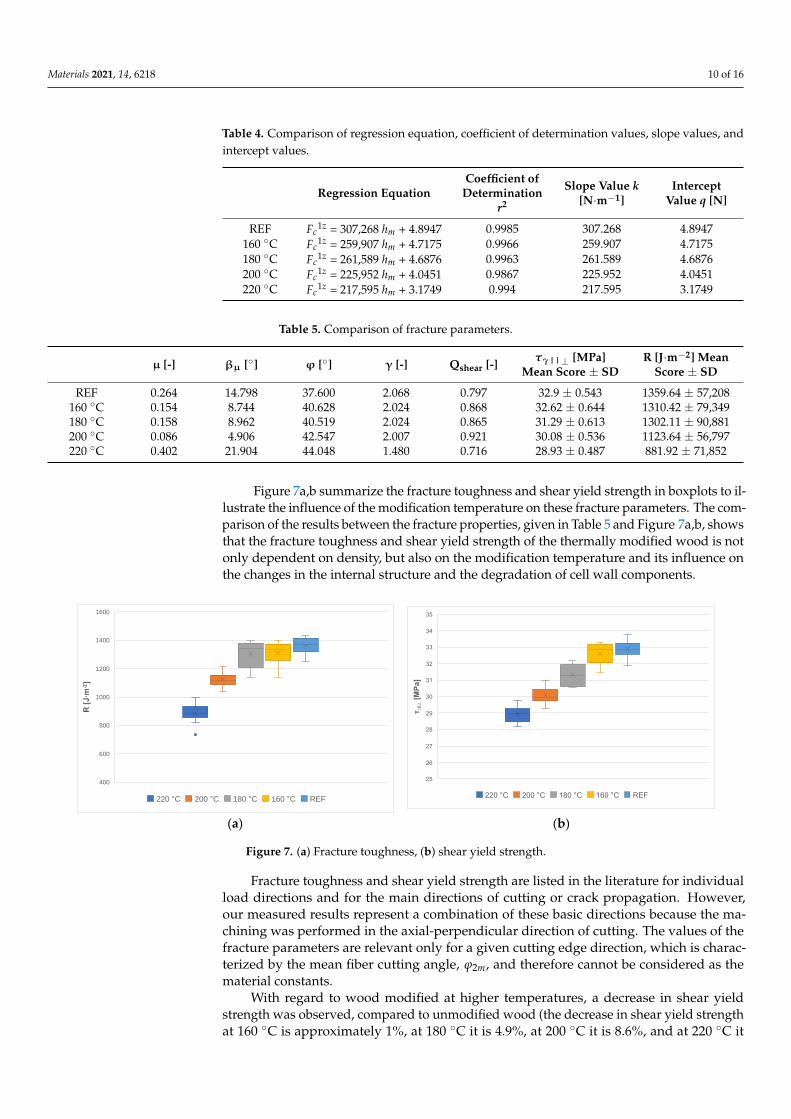
The determination of the main parameters of the model was performed on the basis ofregression analysis. Fracture toughness, R||⊥, was determined from the intercept, and theshear yield strength, τγ||⊥, from its slope. The average values of fracture toughness, R||⊥,and shear yield strength, τγ||⊥, were calculated with their corresponding standard devia-tions (Table 5). The values of the shear yield strengths, τγ||⊥, were calculated for uncut chipthickness, hm > 0.13 mm, when the cutting resistance was practically constant [74]. The val-ues of these fracture parameters are presented and compared in Table 5 and Figure 7a,b.
Materials 2021, 14, 6218 10 of 16
Table 4. Comparison of regression equation, coefficient of determination values, slope values, andintercept values.
Regression EquationCoefficient of
Determinationr2
Slope Value k[N·m−1]
InterceptValue q [N]
REF Fc1z = 307,268 hm + 4.8947 0.9985 307.268 4.8947
160 ◦C Fc1z = 259,907 hm + 4.7175 0.9966 259.907 4.7175
180 ◦C Fc1z = 261,589 hm + 4.6876 0.9963 261.589 4.6876
200 ◦C Fc1z = 225,952 hm + 4.0451 0.9867 225.952 4.0451
220 ◦C Fc1z = 217,595 hm + 3.1749 0.994 217.595 3.1749
Table 5. Comparison of fracture parameters.
µ [-] βµ [◦] ϕ [◦] γ [-] Qshear [-] τγ||⊥ [MPa]Mean Score ± SD
R [J·m−2] MeanScore ± SD
REF 0.264 14.798 37.600 2.068 0.797 32.9 ± 0.543 1359.64 ± 57,208160 ◦C 0.154 8.744 40.628 2.024 0.868 32.62 ± 0.644 1310.42 ± 79,349180 ◦C 0.158 8.962 40.519 2.024 0.865 31.29 ± 0.613 1302.11 ± 90,881200 ◦C 0.086 4.906 42.547 2.007 0.921 30.08 ± 0.536 1123.64 ± 56,797220 ◦C 0.402 21.904 44.048 1.480 0.716 28.93 ± 0.487 881.92 ± 71,852
Figure 7a,b summarize the fracture toughness and shear yield strength in boxplots to il-lustrate the influence of the modification temperature on these fracture parameters. The com-parison of the results between the fracture properties, given in Table 5 and Figure 7a,b, showsthat the fracture toughness and shear yield strength of the thermally modified wood is notonly dependent on density, but also on the modification temperature and its influence onthe changes in the internal structure and the degradation of cell wall components.
Materials 2021, 14, 6218 11 of 17
deviations (Table 5). The values of the shear yield strengths, τγ||⊥, were calculated for un-
cut chip thickness, hm > 0.13 mm, when the cutting resistance was practically constant [74].
The values of these fracture parameters are presented and compared in Table 5 and Figure
7a,b.
Table 5. Comparison of fracture parameters.
μ [-] βμ [°] φ [°] γ [-] Qshear [-] τγ||⊥ [MPa] Mean Score
± SD R [J·m−2] Mean Score ± SD
REF 0.264 14.798 37.600 2.068 0.797 32.9 ± 0.543 1359.64 ± 57,208
160 °C 0.154 8.744 40.628 2.024 0.868 32.62 ± 0.644 1310.42 ± 79,349
180 °C 0.158 8.962 40.519 2.024 0.865 31.29 ± 0.613 1302.11 ± 90,881
200 °C 0.086 4.906 42.547 2.007 0.921 30.08 ± 0.536 1123.64 ± 56,797
220 °C 0.402 21.904 44.048 1.480 0.716 28.93 ± 0.487 881.92 ± 71,852
Figure 7a,b summarize the fracture toughness and shear yield strength in boxplots to
illustrate the influence of the modification temperature on these fracture parameters. The
comparison of the results between the fracture properties, given in Table 5 and Figure
7a,b, shows that the fracture toughness and shear yield strength of the thermally modified
wood is not only dependent on density, but also on the modification temperature and its
influence on the changes in the internal structure and the degradation of cell wall compo-
nents.
(a) (b)
Figure 7. (a) Fracture toughness, (b) shear yield strength.
Fracture toughness and shear yield strength are listed in the literature for individual
load directions and for the main directions of cutting or crack propagation. However, our
measured results represent a combination of these basic directions because the machining
was performed in the axial-perpendicular direction of cutting. The values of the fracture
parameters are relevant only for a given cutting edge direction, which is characterized by
the mean fiber cutting angle, φ2m, and therefore cannot be considered as the material con-
stants.
With regard to wood modified at higher temperatures, a decrease in shear yield
strength was observed, compared to unmodified wood (the decrease in shear yield
strength at 160 °C is approximately 1%, at 180 °C it is 4.9%, at 200 °C it is 8.6%, and at 220
°C it is 12.1%, compared to REF). The same trend can be observed for the fracture tough-
ness. As the modification temperature increases, the fracture toughness decreases (at 160
°C by 3.6%, at 180 °C by 4.2%, and at 200 °C by 17.4%). The wood modified at a tempera-
ture of 220 °C even shows up to 35% lower values of fracture toughness than unmodified
R [
J∙m
-2]
400
600
800
1000
1200
1400
1600
220 °C 200 °C 180 °C 160 °C REF
Figure 7. (a) Fracture toughness, (b) shear yield strength.
Fracture toughness and shear yield strength are listed in the literature for individualload directions and for the main directions of cutting or crack propagation. However,our measured results represent a combination of these basic directions because the ma-chining was performed in the axial-perpendicular direction of cutting. The values of thefracture parameters are relevant only for a given cutting edge direction, which is charac-terized by the mean fiber cutting angle, ϕ2m, and therefore cannot be considered as thematerial constants.
With regard to wood modified at higher temperatures, a decrease in shear yieldstrength was observed, compared to unmodified wood (the decrease in shear yield strengthat 160 ◦C is approximately 1%, at 180 ◦C it is 4.9%, at 200 ◦C it is 8.6%, and at 220 ◦C it

Materials 2021, 14, 6218 11 of 16
is 12.1%, compared to REF). The same trend can be observed for the fracture toughness.As the modification temperature increases, the fracture toughness decreases (at 160 ◦C by3.6%, at 180 ◦C by 4.2%, and at 200 ◦C by 17.4%). The wood modified at a temperature of220 ◦C even shows up to 35% lower values of fracture toughness than unmodified wood.Thus, again, the higher the modification temperature, the higher the degradation of themechanical properties of the wood.
These results are in general agreement with the professional literature and confirmthat thermal modification negatively affects the mechanical properties of wood. This claimcan be explained by the loss of material within the cell lumen, and the degradation ofhemicellulose by the effect of high temperatures during modification [64,74,75]. Someanatomical changes in the structure of modified wood may also contribute to the reductionin the mechanical properties. For example, [76] noticed cracks between the tracheids inheat-treated softwood species. The authors of [77] found cracks in the middle lamella andlayer S1 in spruce wood modified at temperatures from 180 ◦C to 200 ◦C. Furthermore,deformations of the libriform fibers and collapsed vessels in the wood were observed.These changes in the wood structure can lead to significantly different load behavior.
So far, only a few studies have been published on the fracture properties of modifiedwood. For example, [78] presents the fracture properties of unmodified spruce and sprucetreated by thermal modification and acetylation; the authors note a 20% reduction in thefracture toughness of acetylated wood, and a 50–80% reduction in the heat-treated sprucewood. The authors of [33] published the fracture properties of modified beech wood.Their results show that the fracture properties of the modified materials depend not onlyon density, but also on the type of modification, cell wall degradation, and the internalstructure. In the work of [79], the authors focus on the various drying techniques andtheir influence on the fracture parameters. On the basis of their research, they concludethat an increase in the wood drying temperature and, thus, its thermal modification, leadto higher fragmentation and graininess of the resulting sawdust during machining. Thisindicates a large change in the fracture properties of the wood thus treated. The resultsof [80] show reduced values of fracture toughness and fracture energy. The experimentsof [81], conducted on heat-treated spruce, show that the fracture energy decreases linearlywith an increasing mass loss, suggesting that the thermal degradation of wood affects thefracture energy. The microstructure and nanostructure within the cellular structure can,therefore, be changed by thermal modification [81]. The reduction in the fracture toughnessof thermally modified wood can also be attributed to its lower plastic ductility. Accordingto [82], the fracture energy is higher in the case of unmodified wood compared to thermallymodified wood. Crack initiation is easier, and the crack propagation phase consumes lessenergy and takes place in heat-treated wood in a more fragile way. The authors of [83]observed the effects of thermal modification on the fragility of wood (Styrax tonkinensis)and state that the main factor influencing fragility was the loss of hemicellulose and theamorphous region of cellulose due to degradation. The authors of [13] also claim that thewood fragility increases with the deterioration of the fracture properties caused by theloss of amorphous polysaccharides. The results of these studies show that the fractureproperties of thermally modified wood will be negatively affected, and this is supportedby our results.
Because of the fibrous structure, wood has different shear yield strengths in threeperpendicular directions. Determining the conditions of clean shear in wood is verydifficult. From the perspective of machining, our method of violating the workpiece is mostclosely approached by shear in the transverse plane, where the forces act perpendicularlyto the fibers in the tangential or radial direction. This method of violation is often called"cutting fibers" or "shear strength" [53]. Table 5 and Figure 7b present the comparison ofthe shear yield strengths. The trend is similar to that of fracture toughness, although not tosuch an extent. An increasing temperature of modification leads to a reduced shear yieldstrength. Our results are in line with the study by [75], where a decrease in shear strengthwas found after thermal modification. The explanation lies in the (partial) transformation

Materials 2021, 14, 6218 12 of 16
of polyoses into furfural polymers. Such degradation of the hemicelluloses probably has anegative effect on shear yield strength. On the other hand, lignin is the main componentof the middle lamella, which plays an important role in shear strength [67]. Increasednetworking within the lignin polymer network could have a positive effect on shear yieldstrength. Therefore, the deterioration of shear yield strength observed is not as large asthat of other mechanical properties.
4. Conclusions
The basic relationships for calculating the fracture characteristics of heat-treated sprucesamples (fracture toughness and shear yield strength) were derived from the cutting testswithout the need to perform complex fracture tests. The fracture parameter values aresuitable only for the axial-perpendicular cutting model and, therefore, cannot be consideredmaterial constants.
On the basis of the measurements, it can be concluded that thermal modificationaffects the mechanical, physical, and technological properties of wood. Thermally treatedwood is characterized by increased hardness, fragility, and susceptibility to crack forma-tion, as well as reduced density, bending strength, and shear strength. These propertiessignificantly affect the size of the cutting force and feed force, as well as both parameters ofthe calculation model: fracture toughness, R||⊥, and shear yield strength, τγ||⊥. As thetemperature increases, the values of these parameters decrease.
Knowledge of these parameters is essential for the correct estimation of the size ofcutting forces using a computational model based on fracture mechanics, since optimizingthe cutting process, and the issue of energy consumption during the machining of heat-treated wood, are very important when considering the overall economy of productionand the production process in the woodworking and other associated industries. Thiscomputational model differs from conventional methods for calculating the cutting force,especially by its possible application to a wide range of materials, including modifiedmaterials, which have a modified internal structure, or wood-based composite materials.
Comparing the results of the fracture parameters with the literature is very difficult,since no similar work has been carried out to determine the fracture parameters based oncutting tests. In addition, the work of fracture calculated in this way consists, not onlyof the fracture energy (as determined in the splitting tests), but also the friction andcompression properties of the cut material. The fracture energy achieved by the splittingtests is, therefore, lower than the work of fracture obtained by the cutting tests.
Author Contributions: Conceptualization: L.H., J.P., and Z.K.; methodology: Z.K., L.H., and P.C.;software: L.H.; validation: L.H.; formal analysis: L.H.; investigation: L.H., P.C., Z.K., and J.P.; datacuration: L.H., V.N., and P.C.; writing—original draft preparation: L.H., and J.P.; writing—review &editing: L.H., and V.N.; visualization: L.H.; supervision: Z.K.; project administration: L.H.; funding:L.H. All authors have read and agreed to the published version of the manuscript.
Funding: This research was funded by the Internal Grant Agency FFWT of Mendel University inBrno, project: “Analysis of cutting forces from point of view fracture mechanics in quasi-orthogonalCNC milling and cutting by circular saw-blade” (Grant IGA No. LDF_TP_2019008), and the CEEPUSnetwork CIII-SK-0310-07 “Non traditional processes in production technologies and integration ofthe study and research in the eastern and central Europe universities”.
Institutional Review Board Statement: Not applicable.
Informed Consent Statement: Not applicable.
Data Availability Statement: https://doi.org/10.6084/m9.figshare.16828507.v1 (accessed on 19October 2021).
Conflicts of Interest: The authors declare no conflict of interest.

Materials 2021, 14, 6218 13 of 16
Nomenclature
α significance levelαf clearance angleβµ friction angleγ shear strain along the shear planeγf rake angleµ the coefficient of frictionρ0 cutting-edge radiusρω wood densityτγ shear yield strengthτγ||⊥ shear yield strength for axial-perpendicular modelϕ shear plane angleϕ2µ mean fiber cutting angleψ1 entry angleψ2 exit angleae position of the workpieceb kerf widthD diametere workpiece heightFc cutting forceFc
1z cutting force per single tooth on uncut chip thicknessFf feed forcefz feed per toothhm mean uncut chip thicknesshmax maximum uncut chip thicknesshmin minimum uncut chip thicknessk slope of the linear regression linekc specific cutting resistancel cut lengthMc moment of forceML mass lossMOR modulus of rupturen rotational speedPac acceleration power of chipsPc_T average total cutting powerPdull power which considers the dulling of cutting edgesq intercept of the linear regression lineQshear coefficient of friction correctionR fracture toughnessR||⊥ fracture toughness for axial-perpendicular modelr2 coefficient of determinationREF reference samples sawblade thicknessSD standard deviationTM thermal modification processvc cutting speedvf feed ratez teeth numberza number of simultaneously cutting teeth
References1. Yadav, M.; Agarwal, M. Biobased Building Materials for Sustainable Future: An Overview. Mater. Today Proc. 2021, 43, 2895–2902.
[CrossRef]2. Moore, N. Timber Utilisation; Forest Research: Dehradun, India, 2015; p. 40.3. Kaila, A.-M.; Heikkinen, P. Designing for Durability: Helsinki Central Library’s Wood Facade. Technol. Archit. Des. 2020, 4, 24–34.
[CrossRef]

Materials 2021, 14, 6218 14 of 16
4. Plaschkies, K.; Jacobs, K.; Scheiding, W.; Melcher, E. Investigations on Natural Durability of Important European Wood Speciesagainst Wood Decay Fungi. Part 1: Laboratory Tests. Int. Biodeterior. Biodegrad. 2014, 90, 52–56. [CrossRef]
5. Kamdem, D.P.; Pizzi, A.; Jermannaud, A. Durability of Heat-Treated Wood. Holz Roh Werkst. 2002, 60, 1–6. [CrossRef]6. Sandberg, D.; Kutnar, A. Thermally modified timber: Recent developments in europe and north america. Wood Fiber Sci. 2016,
48, 12.7. Sandak, J.; Sandak, A.; Allegretti, O. Chemical Changes to Woody Polymers Due to High-Temperature Thermal Treatment
Assessed with near Infrared Spectroscopy. J. Near Infrared Spectrosc. 2016, 24, 555–562. [CrossRef]8. Gündüz, G.; Korkut, S.; Aydemir, D.; Bekar, I. The Density, Compression Strength and Surface Hardness of Heat Treated
Hornbeam (Carpinus Betulus) Wood. Maderas. Cienc. Tecnol. 2008, 11, 61–70. [CrossRef]9. Shi, J.L.; Kocaefe, D.; Zhang, J. Mechanical Behaviour of Québec Wood Species Heat-Treated Using ThermoWood Process. Holz
Roh Werkst. 2007, 65, 255–259. [CrossRef]10. Leitch, M.A. Hardness Values for Thermally Treated Black Ash. Wood Fiber Sci. 2009, 41, 440–446.11. Icel, B.; Guler, G.; Isleyen, O.; Beram, A.; Mutlubas, M. Effects of Industrial Heat Treatment on the Properties of Spruce and Pine
Woods. BioResources 2015, 10, 5159–5173. [CrossRef]12. Jämsä, S.; Viitaniemi, P. Heat Treatment of Wood. Better Durability without Chemicals. Heat Treat. Wood 1998, 47–51.13. Esteves, B.; Pereira, H. Wood Modification by Heat Treatment: A Review. BioResources 2009, 4, 370–404. [CrossRef]14. Tjeerdsma, B.F.; Militz, H. Chemical Changes in Hydrothermal Treated Wood: FTIR Analysis of Combined Hydrothermal and
Dry Heat-Treated Wood. Holz Roh Werkst. 2005, 63, 102–111. [CrossRef]15. Mayes, D.; Oksanen, O. ThermoWood® Handbook; International ThermoWood Association: Helsinki, Finland, 2003.16. Rep, G.; Pohleven, F. Wood Modification—A Promising Method for Wood Preservation. Drv. Ind. 2001, 52, 71–76.17. Hacibektasoglu, M.; Campean, M.; Ispas, M.; Gurau, L. Influence of Heat Treatment Duration on the Machinability of Beech
Wood (Fagus sylvatica L.) by Planing. BioResources 2017, 12, 2780–2791. [CrossRef]18. Krauss, A.; Piernik, M.; Pinkowski, G. Cutting Power during Milling of Thermally Modified Pine Wood. Drv. Ind. 2016, 67,
215–222. [CrossRef]19. Koleda, P.; Barcík, Š.; Našcák, L’.; Svoren, J.; Štefková, J. Cutting power during lengthwise milling of thermally modified oak
wood. Wood Res. 2019, 64, 537–548.20. Koleda, P.; Barcík, Š.; Korcok, M.; Jamberová, Z.; Chayeuski, V. Effect of Technological Parameters on Energetic Efficiency When
Planar Milling Heat-Treated Oak Wood. BioResearch 2020, 16, 515–528. [CrossRef]21. Mandic, M.; Todorovic, N.; Popadic, R.; Danon, G. Influence of wood properties and technological parameters of processing on
cutting power in milling of thermally modified beechwood. Glasnik Šumarskog Fakulteta 2011, 104, 109–124. [CrossRef]22. De Moura, L.F.; Brito, J.O. Effect of Thermal Treatment on Machining Properties of Eucalyptus Grandis and Pinus Caribaea Var
Hondurensis Woods. In Proceedings of the 51st International Convention of Society of Wood Science and Technology, Concepción,Chile, 10–12 November 2008; p. 9.
23. Atkins, A. Modelling Metal Cutting Using Modern Ductile Fracture Mechanics: Quantitative Explanations for Some LongstandingProblems. Int. J. Mech. Sci. 2003, 45, 373–396. [CrossRef]
24. Atkins, A. Toughness and Cutting: A New Way of Simultaneously Determining Ductile Fracture Toughness and Strength. Eng.Fract. Mech. 2005, 72, 849–860. [CrossRef]
25. Böllinghaus, T.; Byrne, G.; Cherpakov, B.I.; Chlebus, E.; Cross, C.E.; Denkena, B.; Dilthey, U.; Hatsuzawa, T.; Herfurth, K.; Herold(deceased), H.; et al. Manufacturing Engineering. In Springer Handbook of Mechanical Engineering; Springer: Berlin/Heidelberg,Germany, 2009; ISBN 978-3-540-49131-6.
26. Atkins, T. The Science and Engineering of Cutting; Elsevier: Amsterdam, The Netherlands, 2009.27. Orlowski, K.A.; Ochrymiuk, T.; Atkins, A.; Chuchala, D. Application of Fracture Mechanics for Energetic Effects Predictions
While Wood Sawing. Wood Sci. Technol. 2013, 47, 949–963. [CrossRef]28. Hlásková, L.; Orlowski, K.; Kopecký, Z.; Jedinák, M. Sawing Processes as a Way of Determining Fracture Toughness and Shear
Yield Stresses of Wood. BioResources 2015, 10, 5381–5394. [CrossRef]29. Chuchala, D.; Ochrymiuk, T.; Orlowski, K.A.; Lackowski, M.; Taube, P. Predicting Cutting Power for Band Sawing Process of Pine
and Beech Wood Dried with the Use of Four Different Methods. BioResources 2020, 15, 1844–1860.30. Orlowski, K.A.; Ochrymiuk, T.; Hlaskova, L.; Chuchala, D.; Kopecky, Z. Revisiting the Estimation of Cutting Power with Different
Energetic Methods While Sawing Soft and Hard Woods on the Circular Sawing Machine: A Central European Case. Wood Sci.Technol. 2020, 54, 457–477. [CrossRef]
31. Orlowski, K.A.; Ochrymiuk, T.; Sandak, J.; Sandak, A. Estimation of Fracture Toughness and Shear Yield Stress of OrthotropicMaterials in Cutting with Rotating Tools. Eng. Fract. Mech. 2017, 178, 433–444. [CrossRef]
32. Markopoulos, A. Finite Element Method in Machining Processes; Springer: Berlin/Heidelberg, Germany, 2012; ISBN 978-1-4471-4329-1.
33. Hlásková, L.; Kopecký, Z.; Novák, V. Influence of Wood Modification on Cutting Force, Specific Cutting Resistance and FractureParameters during the Sawing Process Using Circular Sawing Machine. Eur. J. Wood Prod. 2020, 78, 1173–1182. [CrossRef]
34. Kopecký, Z.; Rousek, M. Impact of dominant vibrations on noise level of dimension circular sawblades. Wood Res. 2012, 57, 10.35. Orlowski, K.; Ochrymiuk, T.; Atkins, A. An Innovative Approach to the Forecasting of Energetic Effects While Wood Sawing. Drv.
Ind. 2014, 65, 273–281. [CrossRef]

Materials 2021, 14, 6218 15 of 16
36. Sinn, G.; Chuchała, D.; Orlowski, K.A.; Taube, P. Cutting Model Parameters from Frame Sawing of Natural and ImpregnatedScots Pine (Pinus sylvestris L.). Eur. J. Wood Prod. 2020, 78, 777–784. [CrossRef]
37. Chuchala, D.; Sandak, A.; Orlowski, K.A.; Sandak, J.; Eggertsson, O.; Landowski, M. Characterization of Arctic Driftwood asNaturally Modified Material. Part 1: Machinability. Coatings 2021, 11, 278. [CrossRef]
38. Kopecký, Z.; Hlásková, L.; Solar, A.; Nesázal, P. Cutting forces in quasi-orthogonal cnc milling. Wood Res. 2019, 64, 12. [CrossRef]39. Chuchala, D.; Orlowski, K.A.; Sandak, A.; Sandak, J.; Pauliny, D.; Baranski, J. The Effect of Wood Provenance and Density on
Cutting Forces While Sawing Scots Pine (Pinus sylvestris L.). BioResources 2014, 9, 5349–5361. [CrossRef]40. Kopecký, Z.; Hlásková, L.; Orlowski, K. An innovative approach to prediction energetic effects of wood cutting process with
circular-saw blades. Wood Res. 2010, 59, 827–834.41. Orlowski, K.; Ochrymiuk, T. A Newly-Developed Model for Predicting Cutting Power during Wood Sawing with Circular Saw
Blades. Maderas Cienc. Tecnol. 2017, 19, 149–162. [CrossRef]42. Hlásková, L.; Kopecký, Z.; Solar, A.; Patocka, Z. Cutting test as source of fracture toughness and shear yield strength for
axial-perpendicular model of wood cutting. WFS 2019, 51, 58–68. [CrossRef]43. Atkins, A.G.; Vincent, J.F.V. An Instrumented Microtome for Improved Histological Sections and the Measurement of Fracture
Toughness. J. Mater. Sci. Lett. 1984, 3, 310–312. [CrossRef]44. Javorek, L.; Orlowski, K.; Lalik, J.; Chuchala, D. Modeling of Cutting by Means of Fracture Mechanics. ProLigno 2013, 9, 390–397.45. Lisican, J. Teória a Technika Spracovania Dreva, 1st ed.; Matcentrum: Zvolen, Slovakia, 1996; ISBN 80-967315-6-4.46. Prokeš, S. Obrábení Dreva a Nových Hmot Ze Dreva, 3rd ed.; SNTL—Státní Nakladatelství Technické Literatury: Praha, Czech
Republic, 1982.47. Kubš, J.; Gašparík, M.; Gaff, M.; Kaplan, L.; Cekovská, H.; Ježek, J.; Štícha, V. Influence of Thermal Treatment on Power
Consumption during Plain Milling of Lodgepole Pine (Pinus Contorta Subsp. Murrayana). BioResources 2016, 12, 407–418.[CrossRef]
48. Koleda, P.; Barcík, Š.; Nociarová, A. Effect of Technological Parameters of Machining on Energy Efficiency in Face Milling ofHeat-Treated Oak Wood. BioResources 2018, 13, 6133–6146. [CrossRef]
49. Todaro, L.; Liuzzi, S.; Pantaleo, A.; Lo Giudice, V.; Moretti, N.; Stefanizzi, P. Thermo-Modified Native Black Poplar (PopulusNigra L.) Wood as an Insulation Material. iForest-Biogeosci. Forestry 2021, 14, 268–273. [CrossRef]
50. Rusche, H. Thermal Degradation of Wood at Temperatures up to 200 ◦C: Part I. Holz Roh Werkst. 1973, 31, 273–281. [CrossRef]51. Rusche, H. Thermal Degradation of Wood at Temperatures up to 200 ◦C: Part II. Holz Roh Werkst. 1973, 31, 307–312. [CrossRef]52. Mitchell, P.H. Irreversible Property Changes of Small Loblolly Pine Specimens Heated in Air, Nitrogen, or Oxygen. Wood Fiber Sci.
1988, 20, 320–355.53. Požgaj, A.; Babiak, M.; Kurjatko, S.; Chovanec, D. Štruktúra a Vlastnosti Dreva; Príroda: Bratislava, Slovakia, 1997; ISBN
80-07-00960-4.54. Ockajová, A.; Barcík, Š.; Kucerka, M.; Koleda, P.; Korcok, M.; Vyhnáliková, Z. Wood Dust Granular Analysis in the Sanding
Process of Thermally Modified Wood versus Its Density. Bioresources 2019, 14, 8559–8572.55. Syrjänen, T.; Viitaniemi, P. Heat Treatment of Wood in Finland. Proceedings of Seminar; Production and development of heat treated
wood in Europe: Helsinki, Finland; Stockholm, Sweden; Oslo, Norway, 2000.56. Poncsák, S.; Kocaefe, D.; Bouazara, M.; Pichette, A. Effect of High Temperature Treatment on the Mechanical Properties of Birch
(Betula Papyrifera). Wood Sci. Technol. 2006, 40, 647–663. [CrossRef]57. Bengtsson, C.; Jermer, J.; Brem, F. Bending Strength of Heat-Treated Spruce and Pine Timber. Proc. IRG Annu. Meet. 2007, 9, 8516.58. Yildiz, S.; Gezer, E.D.; Yildiz, U.C. Mechanical and Chemical Behavior of Spruce Wood Modified by Heat. Build. Environ. 2006, 41,
1762–1766. [CrossRef]59. Hill, C.A. Wood Modification: Chemical, Thermal and Other Processes; John Wiley & Sons: Hoboken, NJ, USA, 2006; ISBN 978-0-470-
02172-9.60. Ockajová, A.; Kucerka, M.; Kminiak, R.; Krišt’ák, L’.; Igaz, R.; Réh, R. Occupational Exposure to Dust Produced When Milling
Thermally Modified Wood. Int. J. Environ. Res. Public Health 2020, 17, 1478. [CrossRef] [PubMed]61. Robert Welzbacher, C.; Otto Rapp, A. Durability of Thermally Modified Timber from Industrial-Scale Processes in Different Use
Classes: Results from Laboratory and Field Tests. Wood Mater. Sci. Eng. 2007, 2, 4–14. [CrossRef]62. Yinodotlgör, N.; Kartal, S.N. Heat Modification of Wood: Chemical Properties and Resistance to Mold and Decay Fungi. For. Prod.
J. 2010, 60, 357–361. [CrossRef]63. Alén, R.; Kotilainen, R.; Zaman, A. Thermochemical Behavior of Norway Spruce (Picea Abies) at 180–225 ◦C. Wood Sci. Technol.
2002, 36, 163–171. [CrossRef]64. Esteves, B.M.; Domingos, I.J.; Pereira, H.M. Pine wood modification by heat treatment in air. BioResources 2008, 3, 142–154.
[CrossRef]65. Fengel, D.; Wegener, G. Wood: Chemistry, Ultrastructure, Reactions; de Gruyter: Berlin, Germany, 1989; ISBN 978-3-11-012059-2.66. Hillis, W.E. High Temperature and Chemical Effects on Wood Stability. Wood Sci. Technol. 1984, 18, 281–293. [CrossRef]67. Boonstra, M.J.; Acker, J.; Tjeerdsma, B.F.; Kegel, E.V. Strength Properties of Thermally Modified Softwoods and Its Relation to
Polymeric Structural Wood Constituents. Ann. For. Sci. 2007, 64, 679–690. [CrossRef]68. Gonzalez-Peña, M.M.; Hale, M.D.C. The Relationship between Mechanical Performance and Chemical Changes in Thermally Modified
Wood; Bangor University: Cardiff, UK, 2007; pp. 169–172.
Materials 2021, 14, 6218 16 of 16
69. Orlowski, K.A.; Wierzbowski, M.A. Selected Mechanical Properties of Steam Kiln–Dried Wood Determined on the basis of cuttingpower. For. Wood Technol. 2010, 72, 95–98.
70. Wilkowski, J.; Grze, M.; Javorek, L.; Pauliny, D. Influence of Thermal Modification of Oak Wood on Cutting Forces during Milling.For. Wood Technol. 2011, 76, 203–207.
71. Orłowski, K.A.; Grzeskiewicz, M. The Effect of Heat Treatment of Hardwood on the Specific Cutting Resistance. Ann. Wars. Univ.Life Sci. SGGW For. Wood Technol. 2009, 69, 147–151.
72. Corleto, R.; Gaff, M.; Niemz, P.; Sethy, A.K.; Todaro, L.; Ditommaso, G.; Razaei, F.; Sikora, A.; Kaplan, L.; Das, S.; et al. Effect ofThermal Modification on Properties and Milling Behaviour of African Padauk (Pterocarpus Soyauxii Taub.) Wood. J. Mater. Res.Technol. 2020, 9, 9315–9327. [CrossRef]
73. Pałubicki, B.; Hlásková, L.; Frömel-Frybort, S.; Rogozinski, T. Feed Force and Sawdust Geometry in Particleboard Sawing.Materials 2021, 14, 945. [CrossRef] [PubMed]
74. Orlowski, K.A.; Palubicki, B. Recent Progress in Research on the Cutting Processes of Wood. A Review COST Action E352004–2008: Wood Machining—Micromechanics and Fracture. Holzforschung 2009, 63, 181–185. [CrossRef]
75. Stamm, A.J. Wood and Cellulose Science; Ronald Press Co.: New York, NY, USA, 1964.76. Boonstra, M.J.; Rijsdijk, J.F.; Sander, C.; Kegel, E.; Tjeerdsma, B.; Militz, H.; Acker, J.V.; Stevens, M. Microstructural and Physical
Aspects of Heat Treated Wood. Part 1. Softwoods. Maderas Cienc. Tecnol. 2006, 8, 193–208. [CrossRef]77. Fengel, D. Über Die Veränderungen Des Holzes Und Seiner Komponenten Im Temperaturbereich Bis 200◦C—Zweite Mitteilung:
Die Hemicellulosen in Unbehandeltem Und in Thermisch Behandeltem Fichtenholz. Holz als Roh- und Werkstoff 1966, 24, 98–109.[CrossRef]
78. Reiterer, A.; Sinn, G. Fracture Behaviour of Modified Spruce Wood: A Study Using Linear and Non Linear Fracture Mechanics.Holzforschung 2002, 56, 191–198. [CrossRef]
79. Chuchala, D.; Sandak, J.; Orlowski, K.A.; Muzinski, T.; Lackowski, M.; Ochrymiuk, T. Effect of the Drying Method of Pine andBeech Wood on Fracture Toughness and Shear Yield Stress. Materials 2020, 13, 4692. [CrossRef]
80. Stanzl-Tschegg, S.E.; Navi, P. Fracture Behaviour of Wood and Its Composites. A Review COST Action E35 2004–2008: WoodMachining–Micromechanics and Fracture. Holzforschung 2009, 63. [CrossRef]
81. Murata, K.; Watanabe, Y.; Nakano, T. Effect of Thermal Treatment on Fracture Properties and Adsorption Properties of SpruceWood. Materials 2013, 6, 4186–4197. [CrossRef]
82. Majano, M.A.M.; Hughes, M.; Fernández-Cabo, J.L. A Fracture Mechanics Study of Thermally Modified Beech for StructuralApplications. WCTE World Conference on Timber Engineering, Riva del Garda, Trento, Italy, 20–24 June 2010.
83. Phuong, L.X.; Shida, S.; Saito, Y. Effects of Heat Treatment on Brittleness of Styrax Tonkinensis Wood. J. Wood Sci. 2007, 53,181–186. [CrossRef]
Copyright © 2022 FDOKUMEN