Thermal coupling of a high temperature PEM fuel cell with a complex hydride tank
10
Thermal coupling of a high temperature PEM fuel cell with a complex hydride tank P. Pfeifer a, *, C. Wall a,b , O. Jensen c , H. Hahn b , M. Fichtner b a Institute for Micro Process Engineering, Forschungszentrum Karlsruhe, Hermann-von-Helmholtz Platz 1, 76344 Eggenstein-Leopoldshafen, Germany b Institute for Nanotechnology, Forschungszentrum Karlsruhe, Hermann-von-Helmholtz Platz 1, 76344 Eggenstein-Leopoldshafen, Germany c Technical University of Denmark, Institute for Chemistry, Kemitorvet, 2800 Kgs. Lyngby, Denmark article info Article history: Received 20 October 2008 Received in revised form 17 February 2009 Accepted 19 February 2009 Available online 17 March 2009 Keywords: Hydride storage Tank design System modelling HT-PEM fuel cell Sodium alanate Cerium catalyst Thermal coupling Nanocrystalline alanate abstract Sodium alanate doped with cerium catalyst has been proven to have fast kinetics for hydrogen ab- and de-sorption as well as a high gravimetric storage density around 5 wt%. The kinetics of hydrogen sorption can be improved by preparing the alanate as nano- crystalline material. However, the second decomposition step, i.e. the decomposition of the hexahydride to sodium hydride and aluminium which refers to 1.8 wt% hydrogen is supposed to happen above 110 C. The discharge of the material is thus limited by the level of heat supplied to the hydride storage tank. Therefore, we evaluated the possibilities of a thermal coupling of a high temperature PEM fuel cell operating at 160–200 C. The starting temperatures and temperature hold-times before starting fuel cell operation, the heat transfer characteristics of the hydride storage tanks, system temperature, fuel cell elec- trical power (including efficiency) as well as alanate kinetics were varied by system modelling with gPROMS Ò . The kinetics of the hydride decomposition was found to have a major influence on the performance of the system. A cumulative output of 0.8 kWh was reached in a test run. ª 2009 International Association for Hydrogen Energy. Published by Elsevier Ltd. All rights reserved. 1. Introduction Automotive applications based on hydrogen-driven fuel cells need powerful storage systems for hydrogen. Therefore, several options for storing the hydrogen have been investi- gated in the past. Most car manufacturers have decided not to use liquid hydrogen as a storage medium mostly due to the inevitable boil-off losses of the cryo liquid and the high energy cost of hydrogen liquification. A second storage option is high pressure composite tanks of up to 700 bar H 2 which are meanwhile considered as state-of-the-art. However, there are concerns in case of rupture in accidents. Moreover, the current limited capacity in the manufacturing process makes it impossible to determine the lifetime or a safe number of loading cycles with the necessary accuracy and precision. For a probabilistic approach, data would be needed from a high number of life cycle tests which are also not available [1]. In addition, the storage density of current systems based on pressurized or liquefied hydrogen will probably not reach the international targets for 2010 and beyond due to the fact that the physical limits have been more or less reached by these methods [2]. Currently, the only option to reach higher reversible storage densities seems to be the storage of hydrogen in metal hydrides due to the shorter average H–H * Corresponding author. Tel.: þ49 (0)7247 82 4767; fax: þ49 (0)7247 82 7767. E-mail address: [email protected] (P. Pfeifer). Available at www.sciencedirect.com journal homepage: www.elsevier.com/locate/he 0360-3199/$ – see front matter ª 2009 International Association for Hydrogen Energy. Published by Elsevier Ltd. All rights reserved. doi:10.1016/j.ijhydene.2009.02.041 international journal of hydrogen energy 34 (2009) 3457–3466
-
Upload
independent -
Category
Documents
-
view
2 -
download
0
Transcript of Thermal coupling of a high temperature PEM fuel cell with a complex hydride tank

i n t e r n a t i o n a l j o u r n a l o f h y d r o g e n e n e r g y 3 4 ( 2 0 0 9 ) 3 4 5 7 ndash 3 4 6 6
Avai lab le a t wwwsc iencedi rec t com
j ourna l homepage wwwe lsev ier com loca te he
Thermal coupling of a high temperature PEM fuel cell witha complex hydride tank
P Pfeifera C Wallab O Jensenc H Hahnb M Fichtnerb
aInstitute for Micro Process Engineering Forschungszentrum Karlsruhe Hermann-von-Helmholtz Platz 1
76344 Eggenstein-Leopoldshafen GermanybInstitute for Nanotechnology Forschungszentrum Karlsruhe Hermann-von-Helmholtz Platz 1 76344 Eggenstein-Leopoldshafen GermanycTechnical University of Denmark Institute for Chemistry Kemitorvet 2800 Kgs Lyngby Denmark
a r t i c l e i n f o
Article history
Received 20 October 2008
Received in revised form
17 February 2009
Accepted 19 February 2009
Available online 17 March 2009
Keywords
Hydride storage
Tank design
System modelling
HT-PEM fuel cell
Sodium alanate
Cerium catalyst
Thermal coupling
Nanocrystalline alanate
Corresponding author Tel thorn49 (0)7247 82E-mail address peterpfeiferimvtfzkde
0360-3199$ ndash see front matter ordf 2009 Interndoi101016jijhydene200902041
a b s t r a c t
Sodium alanate doped with cerium catalyst has been proven to have fast kinetics for
hydrogen ab- and de-sorption as well as a high gravimetric storage density around 5 wt
The kinetics of hydrogen sorption can be improved by preparing the alanate as nano-
crystalline material However the second decomposition step ie the decomposition of the
hexahydride to sodium hydride and aluminium which refers to 18 wt hydrogen is
supposed to happen above 110 C The discharge of the material is thus limited by the level
of heat supplied to the hydride storage tank Therefore we evaluated the possibilities of
a thermal coupling of a high temperature PEM fuel cell operating at 160ndash200 C The starting
temperatures and temperature hold-times before starting fuel cell operation the heat
transfer characteristics of the hydride storage tanks system temperature fuel cell elec-
trical power (including efficiency) as well as alanate kinetics were varied by system
modelling with gPROMS The kinetics of the hydride decomposition was found to have
a major influence on the performance of the system A cumulative output of 08 kWh was
reached in a test run
ordf 2009 International Association for Hydrogen Energy Published by Elsevier Ltd All rights
reserved
1 Introduction current limited capacity in the manufacturing process makes
Automotive applications based on hydrogen-driven fuel cells
need powerful storage systems for hydrogen Therefore
several options for storing the hydrogen have been investi-
gated in the past Most car manufacturers have decided not to
use liquid hydrogen as a storage medium mostly due to the
inevitable boil-off losses of the cryo liquid and the high energy
cost of hydrogen liquification A second storage option is high
pressure composite tanks of up to 700 bar H2 which are
meanwhile considered as state-of-the-art However there are
concerns in case of rupture in accidents Moreover the
4767 fax thorn49 (0)7247 82(P Pfeifer)ational Association for H
it impossible to determine the lifetime or a safe number of
loading cycles with the necessary accuracy and precision For
a probabilistic approach data would be needed from a high
number of life cycle tests which are also not available [1] In
addition the storage density of current systems based on
pressurized or liquefied hydrogen will probably not reach the
international targets for 2010 and beyond due to the fact that
the physical limits have been more or less reached by these
methods [2] Currently the only option to reach higher
reversible storage densities seems to be the storage of
hydrogen in metal hydrides due to the shorter average HndashH
7767
ydrogen Energy Published by Elsevier Ltd All rights reserved
Hydride Tanks
Preheater
Transfer
HT-PEMPump
H2
Oumll
H2
Oumll
H2
Oumll
Fig 1 ndash Simple schematic of the entire system for the
thermal coupling alanate hydride tanks and an HT-PEM
i n t e r n a t i o n a l j o u r n a l o f h y d r o g e n e n e r g y 3 4 ( 2 0 0 9 ) 3 4 5 7 ndash 3 4 6 63458
distances which are possible in these materials and due to the
higher safety of such systems [3]
While binary metal hydrides can be handled safely and the
risk potential is limited complex hydrides may react strongly
with water and self-ignition can occur in such a case
However it has also been shown that the flame rates of
ignited hydrogenndashalanate powder clouds are by more than an
order of magnitude below the ones of pure hydrogen [17] This
leads to flames rather than explosions when material is
ejected into a reactive environment Moreover contact with
hot heat transfer oil does not lead to any dangerous situations
rather to safe encapsulation of the material
Hence nanocomposites based on a complex hydride and
transition metal dopant are one of the favourable options as
hydrogen storage material due to the safety properties the
low operation pressure (compared to pressurized tanks) and
the high gravimetric hydrogen content A number of systems
have been identified with hydrogen contents gt3 wt and
thermodynamic properties which would be suitable for on-
board hydrogen storage systems in combination with a fuel
cell [4ndash7] Sodium alanate (NaAlH4) doped with cerium catalyst
has been proven to have fast kinetics for hydrogen ab- and de-
sorption as well as a high gravimetric storage density of
around 5 wt [8] The first two hydrogen exchange reactions
of the compound (1) and (2) are reversible under moderate
temperatures and pressures The third step (3) occurring at
temperatures higher than 400 C is not considered for prac-
tical purposes
3NaAlH4 Na3AlH6thorn 2Althorn 3H2 (1)
Na3AlH6 3NaHthornAlthorn 32H2 (2)
3NaH 3Nathorn 32H2 (3)
However the second decomposition step (2) which refers
to 18 wt hydrogen occurs above 110 C Therefore the
discharge of the material is limited by the level of heat
supplied to the tank
As a consequence the working temperatures and the off-
gas temperature of a low temperature proton exchange
membrane fuel cell (LT-PEMFC) 85ndash90 C are not sufficient to
heat a storage based on complex hydrides to values high
enough for fast hydrogen desorption Moreover it generally
seems as if working temperatures in the range of 100ndash200 C
are needed in order to access the full potential of a complex
hydride storage system
Such temperatures can be provided by the so-called high
temperature PEM fuel cells (HT-PEMFC) [910] Besides the
beneficial operation temperature for a complex hydride tank
there are several compelling technological and commercial
reasons for operating H2air PEM fuel cells at temperatures
above 100 C rates of electrochemical kinetics are enhanced
water management and cooling are simplified useful waste
heat can be recovered and lower quality reformed hydrogen
may be used as the fuel Moreover using the waste heat of
a fuel cell for desorption of hydrogen from a hydride may
increase the overall efficiency of the system considerably in
case the heat of absorption is recovered at the filling station
In this study we evaluate the possibility of a thermal
coupling between a high temperature PEM fuel cell operating
at 160ndash200 C and the alanate hydrogen storage material to
overcome the obstacle that additional heat at elevated
temperature has to be generated to completely discharge the
storage tank The heat supplied by the HT-PEM was assumed
to be transferred to the storage tanks by an oil cycle For
evaluation we used the commercial software package
gPROMS The storage system in the simulation consisted of 4
parallel tanks with approximately 2 kg of sodium alanate
coupled with a 1 kW H2-consumption fuel cell a pre-heater
system and a pump
The heat transfer characteristics were investigated by
changing the geometries of the tanks changing the starting
up procedures and evaluating the electrical power output
from the system Stable working conditions were identified
and the sensitivity of the process to various design parameters
was determined
2 System
An overall scheme of the simulated system (Fig 1) refers to
components which have already been fabricated for an
experimental verification of the obtained data
The main components which have been set up in
gPROMS as different models with interconnection via
a global model to each other are the fuel cell the oil cycle for
heat transfer between the fuel cell and hydride tanks four
hydride tanks in series a pump and a pre-heater system
The pre-heater system includes an electrical heat source
for a second oil cycle where heat transfer is done via a micro
heat exchanger This allows for the fast stop or start of the
00010203040506070809
0 50 100 150 200Current A
Vo
ltag
e p
er cell V
0
100
200
300
400
500
600
700
Po
we
r (S
ta
ck
) [W
]
200degC170degC
150degC
150degC
170degC200degC
Fig 2 ndash Temperature dependent polarisation curves of the
HT-PEM for the simulation (measured at DTU) open
symbols (thick lines) refer to electrical power closed
symbols (thin lines) refer to voltage
i n t e r n a t i o n a l j o u r n a l o f h y d r o g e n e n e r g y 3 4 ( 2 0 0 9 ) 3 4 5 7 ndash 3 4 6 6 3459
heat supply by the stop or start of the flow as well as using the
secondary oil cycle as a heat sink during the constant opera-
tion of the whole system at the maximum fuel cell tempera-
ture Direct electric heating would not allow for rapid stopping
of the heating since the heat capacity of the heating elements
would be much higher and electric heating would require
a certain flux of oil in the main cycle to prevent oil degrada-
tion However the main flow should be adjusted to fuel cell
demand and to allow a sufficient heat flow for desorption of
hydrogen in the tank and should be optimised to yield the
highest overall system efficiency Runaway of the whole
system can practically not be prevented without the stop of
hydrogen flow in direct electric heating In the simulation the
behaviour of the pre-heater system was however treated as
ideal The heat was assumed to be transferred without heat
losses ie electrical power was assumed to be identical to the
heat needed in the main oil cycle
3 Components
31 Fuel cell
The HT-PEM fuel cell fabricated by the Technical University of
Denmark (DTU) has a total hydrogen consumption accounting
for 1 kW chemical energy (which is approx 400 W electrical
power) and is equipped with a polybenzimidazole (PBI)
membrane doped with phosphoric acid
The precise composition of the membrane is poly-220-m-
(phenyl) 550-bi-benzimidazole and details about the doping
and the manufacture of the membrane can be found else-
where [1112] The advantages of the membrane material are
that it doesnrsquot have to be humidified and that it provides
increasing electric conductivity up to 200 C (max value
around 007 Scm) which is in the temperature range for the
fast hydrogen release reactions (1) and (2)
The considered stack consists of 10 cells two cooling
plates and two end plates The membrane size is 16 16 cm2
The bipolar plates are made from expanded graphite The
cooling plates are made from 10 mm thick aluminium sheets
and are equipped with 28 cooling channels of 6 3 mm2 cross
section area and 150 mm length This information is neces-
sary for the determination of the heat removal and pressure
drop in the fuel cell For reducing heat losses to the
surroundings the fuel cell is wrapped with a 10 cm thick layer
of mineral wool possessing a heat conductivity of 006 W(mK)
and a heat capacity of 840 J(kgK) at 200 kgm3 density
Fig 2 shows the polarisation curves which have been
applied for calculation of efficiency and electrical power output
in the simulation The desired point of operation is approxi-
mately 200 C and 40 efficiency ie yielding 5 V and 85 A The
major trend from the polarisation curves is that at tempera-
tures lower than 170 C the electrical output is low and
hydrogen conversion will predominantly yield heat However
this circumstance will lead to faster heating-up of the whole
system Due to the fact that the produced water will condense
at around 100 C ndash which might lead to changes in the phos-
phoric acid concentration and thus to irreversible damage of
the membrane ndash the simulation takes into account pre-heating
up to 120 C before hydrogen is released to the fuel cell
32 Alanate (hydride) tanks
Fig 3 shows a sketch and a photo of the hydride tanks with
some of the major dimensions The inner shaded region of the
sketch is filled with alanate and the coloured region is the
surrounding void for oil Each tank has been designed for 500 g
of alanate material
The weight of the tank fabricated at TU HamburgndashHar-
burg was 20 kg with a heat capacity of 500 J(kgK) For oper-
ation the tank is wrapped with a 10 cm thick layer of mineral
wool The properties of the wool are the same as for the
insulation of the fuel cell
33 Pump
The pump a Sterling SIHI ZTK 32-160 which will be applied in
the lab system is by far oversized but is the best compromise
so far as can be seen from the simulations later the
maximum throughput of 3 m3h and the sizeweight is too
high but it provides features such as thermal decoupling of
the motor and paddle wheel up to 3 bar pressure and oper-
ation at high oil temperatures
It will be operated in the lab under bypass operation to
lower the energy demand and introduction of massive fric-
tional heat into the oil From point of operation of the system ndash
ignoring the influence of the pump ndash the temperature after the
pump will be adjusted to the pump inlet temperature by the
pre-heater system (either heating or cooling depending on
the balance of frictional heat and heat losses) Thus the
insulation might be minimal in the lab setup For the simu-
lation a much simpler approach of heat losses by a linear fit
has been performed (see below)
34 Pre-heater system
The pre-heater system which is necessary to heat the fuel
cell and thus the overall system (including the oil) to at least
120 C consists of a standard thermostat from Huber with
a total heat production of up to 3 kW The heat transfer to
the main oil cycle is accomplished in a cross flow micro
114220
450
50
Fig 3 ndash Sketch of the hydride tank construction (top) and photo of the tank (bottom)
i n t e r n a t i o n a l j o u r n a l o f h y d r o g e n e n e r g y 3 4 ( 2 0 0 9 ) 3 4 5 7 ndash 3 4 6 63460
heat exchanger from the IMVT of the Forschungszentrum
Karlsruhe a photo and the internal structure are shown in
Fig 4
For the calculation of the pressure drop the following data
are relevant 55 passages (either duplet or single foils) for each
oil cycle 217 mm hydraulic diameter (experimentally deter-
mined) 35 mm channel length and 8 channels per foil doublet
(one passage) for the main oil cycle The data for the
secondary oil cycle are not relevant for the simulation since
ideal heat transfer and no heat losses are assumed (see
section System)
35 Main oil cycle
Three meters of tubing in total have been installed between
the different elements of the system An inner diameter of
Fig 4 ndash Photo and inner structure (stacking scheme) of the micro
and secondary oil cycle
12 mm has been initially calculated to be sufficiently large
enough to yield only a low pressure drop at a 1 m3h oil flux
For insulation purposes a mineral wool is again utilized The
total diameter of the tubing including the wool was assumed
to be 10 cm
The oil in the main cycle is Therminol 59 which has
a relatively low viscosity at room temperature (approx
7 mPas) but must be operated in a closed loop with a thermal
expansion cylinder since the fire point is 154 C For the
simulation a mean oil density of 878 kgm3 has been used in
the desired temperature region Other parameters for the
simulation such as viscosity have been calculated according
to fitted curves So for example the lower limit of viscosity is
048 mPas at 200 C heat capacity ranges from 1680 to 2270 J
(kgK) and heat conductivity ranges from 0121 to 0104 W
(mK) in the desired range of 20ndash200 C respectively
heat exchanger applied for heat transfer between the main
i n t e r n a t i o n a l j o u r n a l o f h y d r o g e n e n e r g y 3 4 ( 2 0 0 9 ) 3 4 5 7 ndash 3 4 6 6 3461
4 Simulation
The aim of the simulation was to identify the main parame-
ters which influence the efficiency and start-up of the system
For the latter four steps of operation had to be distinguished
in the timeline by IF conditions in the simulation during start-
up (see also Fig 5)
I Pre-heating (electrically) to 120 C to obtain the
minimum temperature level of FC operation
II Hold of temperature (electrically) to obtain a minimum
hydrogen pressure of 12 bar(abs) in the hydride tanks
III Fuel cell operation while increasing the system
temperature with waste heat from the fuel cell (pre-
heater is off)
IV Constant fuel cell operation at 200 C with the removal
of excess heat by the pre-heater system
The necessary main equations with respect to the different
sub-models applied in gPROMS for the system components
are given in the following subsections
41 Fuel cell
Main equations for the fuel cell deal with the heat balance in
the fuel cell The change of internal energy U can be written as
a function of reaction enthalpy leading to heat generation
(according to fits and interpolations of polarisation curves)
and removed heat
dUdtfrac14 eth1 hTHORNDHR _Q losses _Qoil (4)
with t time h electrical efficiency of the fuel cell DHR reaction
heat of hydrogen combustion _Q losses heat losses to environ-
ment by natural convection and effluent gases and _Qoil heat
transfer to the oil cycle
This change on the other hand refers to the mean
temperature of the fuel cell according to
dUdtfrac14 mFCcpFC
dTFC
dt(5)
Fig 5 ndash Different modes of operation during the start-up of
the whole system described in terms of the oil temperature
in the main cycle against time
with m mass cp heat capacity and T temperature of the fuel
cell When assuming near ideal heat transfer which should be
possible with the chosen cooling structure the oil should
leave the fuel cell at the mean fuel cell temperature Thus the
heat transfer to the oil is
_Qoil frac14 cpoil _moil
Toilin TFC
and Toilout frac14 TFC (6)
with cp heat capacity _moil mass flux in the oil cycle as well as
Toilin and Toilout temperature of the oil entering or leaving the
fuel cell The heat loss parameter _Q losses summarises the los-
ses by natural convection on the fuel cell surface and those
which occur due to gases entering and leaving the fuel cell at
fuel cell temperatures above the environmental temperature
Tu Equations for losses by natural convection are standard for
cube like devices (using Raleigh Graszlighof and Nusselt
numbers) and are not explicitly presented here The applied
enthalpy streams of the inlet and outlet gases take into
account a conversion of hydrogen with air with three-fold
oxygen excess and full conversion without condensation in
the produced steamndashair mixture (ie only cathode off-gas
anode side operated dead-end)
The pressure drop calculation in the fuel cell takes into
account the temperature dependent oil properties and
includes an IF condition for the distinction between laminar
and turbulent flow The equations used are for flow in tubes
with a corresponding hydrodynamic diameter and a correc-
tion value 4 of 096 at a height to width ratio of 05 in the
cooling channels of the fuel cell
42 H storage tanks
A precise simulation of the alanate tanks must be performed
according to the design three dimensionally We reduced the
problem to a two dimensional one ie in axial (z) and radial (r)
directions by just simulating the cylindrical part Linked
parameters for the heat distribution in this part are the heat
flux to the outer insulation _qins to the tank (considered only in
terms of heat capacity of stainless steel cpstainlessmstainless) and
to the alanate material _qalanate due to simultaneous cooling of
the oil The heat flux can be written as length specific ie in
units of Wm according to
_qinsethzTHORN frac14 kcorraoilethzTHORNpdouteroil
ToilethzTHORN Tins
zRinnerins
and (7)
_qalanateethzTHORN frac14 aoilethzTHORNpdinneroilfrac12ToilethzTHORN TalanateethzRouteralanateTHORN (8)
and the time dependent change of internal energy of Vdiscr
a cylindrical volume element of the stainless steel of the tank
including the oil according to
cpstainlessmstainless
ndiscrzthorn cpoilroilVdiscr
dToilethzTHORN
dtfrac14 _Hin _Hout (9)
with kcorr correction factor for non-ideal cylindrical shape of
the tank aoilethzTHORN length specific heat transfer coefficients
douteroil and dinneroil outer and inner diameter of the annular oil
cross section Routeralanate and Rinnerins the outer radius of the
alanate material and the inner radius of the insulation ndiscrz
number of volume elements roil density of the oil as well as_Hin and _Hout the enthalpy streams in and out of the volume
element
i n t e r n a t i o n a l j o u r n a l o f h y d r o g e n e n e r g y 3 4 ( 2 0 0 9 ) 3 4 5 7 ndash 3 4 6 63462
This calculation assumes an equal distribution of the
weight of stainless steel fast temperature equilibration in the
steel part (no temperature gradient in the metal due to high
heat conductivity compared to insulation and alanate) and
equal heat losses over the hydride tank by the number of
discrete elements in z direction ndiscrz To reduce the error
through the latter hypothesis we introduced a correction
factor in equation (7) which has been estimated as the ratio of
total surface area of the tank to outer surface of the cylindrical
part of the tank
The right side of equation (9) has to be calculated by the
change of oil temperature due to flow in the z-direction and
the heat flux from equations (7) and (8)
_Hin frac14 _moilcpoildToilethzTHORN
dz(10)
_Hout frac14
_qins thorn _qalanate
Lcylinder
ndiscrz(11)
with Lcylinder total length of the cylindrical part of the storage
tank
To calculate the heat flux in equations (7) and (8) the
necessary parameters are the convective heat transfer coef-
ficient aoil in the annular gap and the boundary values of
temperature in the insulation and the alanate The aoil value
has been determined according to standard equations of
annular flow with an IF condition for laminar or turbulent flow
distinction The boundary temperatures can only be deter-
mined by consistency of heat flux through the insulation and
to the centre of the alanate
On the side of the insulation the following equations have
been used for establishing energy conservation
Heat transfer to insulation lins
vTins
z r frac14 Rinnerins
vr
frac14 aoil
ToilethzTHORN Tins
z r frac14 Rinnerins
(12)
Heat conduction in the insulation rinscpinsvTinsethz rTHORN
vt
frac14
1r
v
vr
rl
vTinsethz rTHORNvr
(13)
Heat transfer to air lins
vTins
z r frac14 Routerins
vr
frac14 aair
Tins
z r frac14 Routerins
Tu
(14)
Equation (13) only considers radial heat conduction since
the heat conduction coefficient is much lower than the heat
transport by the oil in axial direction Free convection was
calculated by standard equations for cylindrical parts similar
to the case of the fuel cell for the heat removal from the outer
wall of the insulation
Conservation of the heat flux to the inner part of the ala-
nate is more complex since this is overlaid by reaction heat
and heat conduction according to loading The heat flux to
from reaction is again dependent on the decomposition
reaction kinetics and moreover this is related to the pressure
in the reactor which is also linked with the consumption from
the fuel cell The detailed description is as follows
The boundary equation is similar to that of the insulation
except for the fact that the heat conduction coefficient is
position dependent
lalanateethz r frac14 RouteralanateTHORNvTalanateethz r frac14 RouteralanateTHORN
vrfrac14 aoilethToilethzTHORN Talanateethz r frac14 RouteralanateTHORNTHORN (15)
with lalanate heat conductivity of the alanate
In the centre of the tank symmetry must be fulfilled
vTalanateethz r frac14 0THORNvr
frac14 0 (16)
For the temperature distribution in the alanate the change
of internal energy has to be applied with a sinksource term
according to
ralanatecpalanatevTalanateethzrTHORN
vtfrac14
1r
v
vr
rlalanateethzrTHORN
vTalanateethzrTHORNvr
thorn v
vz
lalanateethzrTHORN
vTalanateethzrTHORNvz
thorndcH2ethzrTHORN
dTralanateDHR (17)
Here we neglected the heat transport by convection of the
released hydrogen since it was proven in literature [13] that
the error is less than 1
The heat conduction coefficient which has been applied in
the (zr)-position was calculated upon approximation of data
from Dedrick et al [14]
lNaAlH4 frac14 0037 ln
pH2
thorn 051 (18)
lNa3AlH6frac14 0061 ln
pH2
thorn 050 (19)
lNaH=Al frac14 0068 ln
pH2
thorn 071 (20)
with averaging between the different phases by the molar
fraction x by equation (21)
lalanate frac14 xNaAlH4 lNaAlH4 thorn xNa3AlH6lNa3AlH6
thorn xNaH=AllNaH=Al (21)
The molar fractions can be calculated from the actual
concentration of hydrogen at the (xr)-position
Kinetic equations for the determination of the hydrogen
release (change of hydrogen content in wt of the solid phase
wt H) in dependence of the actual pressure pappl and the
equilibrium pressure of the different phases peq have been
taken from another publication [15]
NaAlH4 formation dethwt HTHORN frac14 625e8 exp
616 kJ
RT
ln
pappl
peq1
eth39wt HTHORN2 (22)
NaAlH4 decomposition dethwt HTHORN
frac14 19e11 exp
83 kJ
RT
ln
peq1
pappl
ethwt H 167THORN (23)
i n t e r n a t i o n a l j o u r n a l o f h y d r o g e n e n e r g y 3 4 ( 2 0 0 9 ) 3 4 5 7 ndash 3 4 6 6 3463
Na3AlH6 formation dethwtHTHORNfrac14102e8exp
562kJ
RT
ln
pappl
p
eq2
eth167wtHTHORN (24)
Na3AlH6 decomposition dethwt HTHORN
frac14 29e10 exp
93 kJ
RT
ln
peq2
pappl
ethwt HTHORN (25)
By an IF condition these different states and the corre-
sponding reaction heat either 367 kJmol per hydrogen
molecule for equation (1) or 466 kJmol per hydrogen mole-
cule for equation (2) have been distinguished at the (zr)-
position Since the temperature gradients in the alanate were
assumed the reaction heat has been set negative or positive
according to adsorption or desorption at the local (zr)-
position
Last but not least the equilibrium and applied pressure
have to be calculated The latter can be determined from the
mass of hydrogen in the gas void mH2 gas
pstorage frac14mH2 gasRsT
Vgas(26)
mH2 gasfrac14ralanateVstorage
100
0BcH2solid
ethtfrac140THORN 1RstorageLstorage
Z t
0
Z Lstorage
0
Z Rstorage
0
cH2solid
dtdzdr
1CAZ t
0
_mH2 gasout (27)
Vgas frac14 Vstorage eth1 3THORNValanate (28)
where the mean temperature T is the integral overall
temperatures in the alanate Vgas and Vstorage are the free
volume of gas between the alanate particles and of gas and
particles respectively and _mH2 gasout is the mass flux of
hydrogen to the fuel cell
The equilibrium pressure has been calculated by Vanrsquot
Hoffrsquos law for the different steps in the decomposition
43 Pump
Since the existing pump in the setup is not the one which
would be used in a real system we decided to simulate this
part as nearly ideal The efficiency was set to a fixed value of
40 leading to the following equations for electrical demand
Pel and heat introduction in the oil _Qel by friction
Pel frac14poil
_Voil
04and _Qel frac14
poil_Voil
1 04(29)
with p and _V being the pressure and the volume flow of oil
respectively
The heat losses of the fuel cell have been calculated
according to size estimation as approximately 40 W at 100 C
This heat loss was assumed to vary linearly with the differ-
ence to environmental temperature (20 C)
The heat capacity of the pump was estimated to be that of
grey iron with a weight of 50 kg (according to the existing
pump) The heat transfer to heat up the pump was treated
ideally ie the oil leaves the pump at the pump temperature
It was possible to individually neglect heat introduction
heat capacity and heat loss by the use of a SWITCH function
(onoff) since the estimations are quite rough
44 Pre-heater
The pre-heater was managed by IF conditions In the initial
phase 3 kW heat were introduced At phase II the heating
power was calculated from the temperature difference of the
oil and the desired oil temperature using the heat capacity
flux During phase III it was zero and in phase IV it was zero
assuming heat removal by an additional heat sink The pres-
sure drop in the heat exchanger was calculated in the same
way as for the fuel cell using different parameters
45 Main oil cycle
Since the heat losses are time dependent and the heat
capacity of the tube and the insulation will contribute to the
start-up properties of the system equations (7)(9)(10)ndash(14)
including standard equations for free convection have been
adapted to the tubing Pressure drop was also calculated with
standard equations
5 Results
Simulation tests were performed for validation with the main
part of the simulation ie the tank itself A small tank with
a 1 cm diameter and corresponding hydrogen release data
according to literature [15] have been compared with the
simulation of the tank and there was quite good accordance
between both eg the time between hydrogen release from
equations (1) and (2) was several 100 s
After this initial validation different parameters have been
evaluated with respect to the operation of the system and its
efficiency The most interesting variations are presented in
the following subsections Conditions for the pump simula-
tion are given for each case in the figure captions
51 Starting temperature
In principle the heating up of the system to 120 C should be
enough for starting fuel cell operation combined with
hydrogen release due to the first decomposition step of
NaAlH4 However the pressure in the hydride tank could still
be insufficient after reaching 120 C which may partly be due
to the slow decomposition kinetics That is why additionally
phase II a hold of system temperature was introduced into
the simulation to obtain 12 bar(abs) hydrogen pressure in the
tank This hold-time however took approximately 1200 s at
120 C according to literature kinetics [15] Alternatively
a higher starting temperature and faster decomposition
kinetics could shorten this time demand considerably
Fig 6 shows the operation time of the fuel cell obtained as
well as heating-up time in terms of the starting temperature
The theoretical limit of 7726 s of fuel cell operation which is
given by the hydrogen amount stored in the set of 4 tanks
0100020003000400050006000700080009000
140 150 160 170 180 190 200 210Starting Temperature [degC]
Ma
x F
C O
pe
ra
tio
n
He
at-u
p T
im
e [s
]
Theoretical FC Limit
Heat-up Time
Operation FC
Fig 6 ndash Simulation results for system operation time and
heating-up time with respect to starting temperature (ie
where fuel cell operation starts) pump conditions heat
dissipation heat loss and heat capacity consideredFig 7 ndash Axial and radial temperature distribution in the
50 mm diameter hydride tank (fully charged) pump
conditions heat dissipation heat loss and heat capacity
considered
Fig 8 ndash Hydrogen content in the alanate in radial direction
versus time (time [ 0 corresponds to start of heating up)
pump conditions heat dissipation heat loss and heat
capacity considered
i n t e r n a t i o n a l j o u r n a l o f h y d r o g e n e n e r g y 3 4 ( 2 0 0 9 ) 3 4 5 7 ndash 3 4 6 63464
(assumed reversible storage capacity of 39 wt) can only be
reached with at least 170 C pre-heating At lower tempera-
tures the second decomposition step ie equation (2) is too
slow to supply enough hydrogen for fully discharging the
tank ndash although the system temperature increases when the
fuel cell is in operation
The hold-time of phase II reduces almost to zero at
temperatures around 180 C The heating-up time increases
between 120 C and 200 C starting temperatures by approxi-
mately 1200 s which shows that it is rather impossible to
reduce the starting-time by increasing the starting tempera-
ture However it has a strong effect on the operation time of
the system
The conditions for the pump mainly affect the operation
time (not shown in Fig 6) by frictional heat generation ie
the operation time gets longer due to energy dissipation
and on heating-up time due to the heat capacity of the
pump Neglecting the heat capacity reduces the heating-up
time by a factor of 2 ie at a lower overall system weight
one could envisage a better effect of increasing the starting
temperature The hold-time will not vary with system
weight since it is hydride dependent but heating-up time
will considerably decrease so that the difference in time
gets enlarged
52 Variation of tank geometry
During simulation one of the obvious changes which should
be considered for improvement of the system is the tank
geometry Fig 7 shows the temperature gradient in the stan-
dard (50 mm diameter) tank when reaching 120 C during
heating-up
From Fig 7 it is clear that the hydrogen desorption is
limited by the radial temperature gradient before and after
reaching the starting temperature The axial gradient is
negligible due to a high heat flux in the oil and relatively low
heat transfer in the present system The temperature limited
hydrogen desorption can be validated by plotting the
hydrogen content of the material against time (Fig 8)
When heating starts (timefrac14 0) the concentration is
everywhere the same Then the outer regions of the tank get
hot and hydrogen desorbs so that the colder inner regions of
the tank absorb hydrogen This is however only feasible if the
starting condition is equilibrated hydrogen pressure
(hydrogen in the gas phase)
In principle three different approaches can increase
the mean tank temperature or improve the temperature
gradient
First a reduction of the size of the annular gap would
increase the heat transfer coefficient to the material Under
current conditions (32 mm gap size) the convective heat
coefficient aoil is only 60 Wm2K whereas at a 5 mm gap it
would be 1000 Wm2K This change would result at 120 C
starting temperature (phase II) in a decrease of time for
reaching a 100 C mean tank temperature from 3500 s to 1300 s
or an increase in mean tank temperature from 77 C to 95 C at
-400
-300
-200
-100
0
100
200
300
2000
4000
6000
8000
1200
014
000
1600
018
000
2000
0Zeit [s]
Cu
mu
lative el P
ow
er [W
h]
Time [s]
250 W total
500 W total750 W total
1 kW total125 kW total
1000
0
Fig 10 ndash Cumulative electrical power output for the system
with different fuel cell total power against time pump
conditions heat dissipation heat loss and heat capacity
not considered system pre-heating to 120 8C hold-time
800 s
i n t e r n a t i o n a l j o u r n a l o f h y d r o g e n e n e r g y 3 4 ( 2 0 0 9 ) 3 4 5 7 ndash 3 4 6 6 3465
1200 s from the start However this improvement has no
effect on the temperature gradient in the alanate but will
increase the pressure drop in the system and decrease the
system efficiency
The second approach would increase mass flux in the main
oil cycle The influence is different to the above approach
since the gap size reduction leads to higher heat transfer
under laminar flow whereas the increase in oil flux leads to
turbulent gap conditions at a flow rate above 1 m3h in the
tank This means that by an increase of flux a comparable
improvement to a size reduction of the annular gap is
possible However the pressure drop in the system ndash espe-
cially in the cold start phase with highly viscous oil ndash would
lower the systemrsquos efficiency
The third approach would be the size reduction of the inner
tube (together with an outer tube size reduction) Here we
obtained the best conditions since this also reduces the
temperature gradient in the alanate itself Reducing the
diameter from 50 mm to 20 mm led to a decrease in maximum
gradient from 19 K to 7 K after 1200 s from start
Another option which we havenrsquot considered is the
mixing or application of high heat conductive material to
the alanate (see also [16]) However the contribution to the
size of the tank and the material interactions cannot be
neglected
53 System temperature
Under fuel cell operating conditions (after reaching phase III)
it is possible to compare the different system temperatures in
terms of efficiency and self-sustaining operation Fig 9 shows
the cumulative heat (produced by the fuel cell and heat losses)
and electrical power (produced by the fuel cell and needed for
pumping)
The optimum conditions in terms of efficiency would be
200 C but when considering an average heat for hydrogen
desorption of 40 kJmol the best operation point is 185 C
since enough heat has to be produced to release the hydrogen
However a self-heating of up to 200 C is still possible in
special cases ie when the heat dissipation of the pump
prevails over heat losses and the first desorption step is in
progress
0
100
200
300
400
500
600
120 140 160 180 200 220Temperature [degC]
El P
ow
er H
eat [W
]
El Power (PFC-PPump)
Heat (ΘFC-Θloss)
Heat for Desorption
Fig 9 ndash Heat and power balance for the system with system
temperature total oil flux in the main cycle 1 m3h pump
conditions heat dissipation heat loss and heat capacity
not considered
54 FC total power
The fuel cell total power (heat and electricity) can have an
influence on the overall efficiency when looking into the
contributions to the heat and power balance in Fig 9 There-
fore it is obvious to check the fuel cell total power influence
on the overall system efficiency In Fig 10 we varied the total
power between 250 W and 125 kW with pre-heating to 120 C
and 800 s hold-time It can be seen that the operation time
increases since there is lower demand for hydrogen from the
fuel cell and the hydrogen pressure can be maintained long
enough to almost total discharge of the alanate The higher
the fuel cell total power the higher is the remaining hydrogen
content in the alanate at the end due to pressure break-down
On the other hand the lower the total power of the fuel cell
the more energy is consumed by the pumping and pre-heat-
ing At 250 W the overall energy balance is negative
1 kW total power seems to be a good choice because the
bigger the fuel cell the more heat will be needed during
heating up This effect has not been considered in this simu-
lation however a main contribution to the weight of smaller
fuel cell is the end plates They are comparatively heavy since
a pressure resistant housing with leakndashtight cells is necessary
-2-1012345678
020
0040
0060
0080
0010
000
1200
0
Time [s]
Pre
ss
ure
T
an
k [b
ar]
-02-0100102030405060708 C
um
ula
tiv
e e
l P
ow
er [k
Wh
]
Hold 800s
Pre-heatPressure
Power
Fig 11 ndash Cumulative electrical power output and tank
pressure for the system with 1 kW fuel cell total power
against time for adapted kinetics pump conditions heat
dissipation heat loss and heat capacity not considered
system pre-heating to 120 8C hold-time 800 s
i n t e r n a t i o n a l j o u r n a l o f h y d r o g e n e n e r g y 3 4 ( 2 0 0 9 ) 3 4 5 7 ndash 3 4 6 63466
55 Alanate kinetics
Although well described the kinetics used in the simulation is
sluggish when compared to more recent systems [8] Slow
kinetics is not beneficial for the systemrsquos efficiency due to long
hold-times (phase II) or high pre-heating temperatures (phase
I) Therefore we tried to adapt the kinetic equations for the
state-of-the-art material which was produced on the basis of
a Ce dopant Changing the pre-exponential factor in equations
(23) and (25) to 095e11 and 152e11 was only partially
successful Thereby we were able to describe the slope but not
the latency region between the first and second decomposi-
tion steps We decided to introduce a small imaginary step of
loading in between the different decomposition steps to avoid
the time delay between the decomposition steps which is
a result from the different term in the literature kinetics The
simulation analogous to Fig 10 is presented in Fig 11 using the
same conditions with a 1 kW total power fuel cell
It can be seen that faster kinetics has a tremendous effect
on the system performance (much higher overall system
output) and that the total required pre-heating and hold-time
are much lower The alanate can be fully discharged at the
lowest pre-heating temperature and at low hold-times
6 Conclusions
An overall system description for a heat coupled high
temperature PEM fuel cell and an alanate hydrogen storage
tank has been performed by the use of the software package
gPROMS The starting temperatures ie the pre-heating and
temperature hold-times before starting fuel cell operation
were found to have a considerable influence on operation time
due to the possible break-down of hydrogen pressure in the
tank The heat transfer characteristics were investigated by
changing geometries of the tanks and further improvement of
the tanks is envisaged for the experimental validation of the
simulation An optimum system temperature of 185 C and
a fuel cell total power of 1 kW were found to fit to a 2 kg ala-
nate tank with respect to efficiency considerations A varia-
tion of alanate decomposition kinetics exhibited superior
performance for state-of-the-art material on the overall
system efficiency Then full alanate discharging was possible
at the minimum FC operation temperature (120 C) and
a cumulative output of 08 kWh was obtained
r e f e r e n c e s
[1] Mair G Final dissemination event of the integrated projectStorHy httpwwwstorhynetfinaleventpdfWS2_PA_BAM-Mairpdf June 3ndash4 2008 ParisFrance
[2] Satyapal S Petrovic J Read C Thomas G Ordaz G The USDepartment of Energyrsquos National Hydrogen Storage Projectprogress towards meeting hydrogen-powered vehiclerequirements Catal Today 2007120246ndash56
[3] Fichtner M Preface to the viewpoint set nanoscale materialsfor hydrogen storage Scripta Mater 200756801ndash2
[4] Bogdanovic B Schwickardi M Ti-doped alkali metalaluminium hydrides as potential novel reversible hydrogenstorage materials J Alloys Compd 1997253-2541ndash13
[5] Chen P Xiong Zh Wu G Liu Y Hu J Luo W MetalndashNndashH systemsfor the hydrogen storage Scripta Mater 200756817ndash22
[6] Fichtner M Nanotechnological aspects in materials forhydrogen storage Adv Eng Mater 20056443ndash55
[7] Vajo JJ Skeith SL Mertens F Reversible storage of hydrogenin destabilized LiBH4 J Phys Chem B 20051093719ndash22
[8] Bogdanovic B Felderhoff M Pommerin A Schuth FSpielkamp N Advanced hydrogen-storage materials basedon Sc- Ce- and Pr-doped NaAlH4 Adv Mater 2006181198ndash201
[9] Zhang J Xie Zh Zhang J Tang Y Songa Ch Navessin T et alHigh temperature PEM fuel cells J Power Sources 2006160872ndash91
[10] Jensen JO Li Q He R Pan C Bjerrum NJ 100ndash200 C polymerfuel cells for use with NaAlH4 J Alloys Compd 2005404ndash406653ndash6
[11] Li Q He R Jensen JO Bjerrum NJ PBI-based polymer membranesfor high temperature fuel cells ndash preparation characterizationand fuel cell demonstration Fuel Cells 20044147
[12] He R Li Q Jensen JO Bjerrum NJ Doping phosphoric acid inpolybenzimidazole membranes for high temperature protonexchange membrane fuel cells J Polym Sci A 2007452989ndash97
[13] Jemni A Nasrallah SB Study of two-dimensional heat andmass transfer during absorption in a metal-hydrogenreactor Int J Hydrogen Energy 19952043ndash52
[14] Dedrick DE Kanouff MP Replogle BC Gross KJ Thermalproperties characterization of sodium alanates J AlloysCompd 2004389299ndash305
[15] Luo W Gross KJ A kinetics model of hydrogen absorptionand desorption in Ti-doped NaAlH4 J Alloys Compd 2004385224ndash31
[16] Kim K Montoya B Razani A Lee KH Metal hydride compactsof improved thermal conductivity Int J Hydrogen Energy200126609ndash13
[17] W Lohstroh M Fichtner W Breitung Complex hydridesas storage materials first safety tests Int J Hydrogen Energyin press doi101016jijhydene200901030
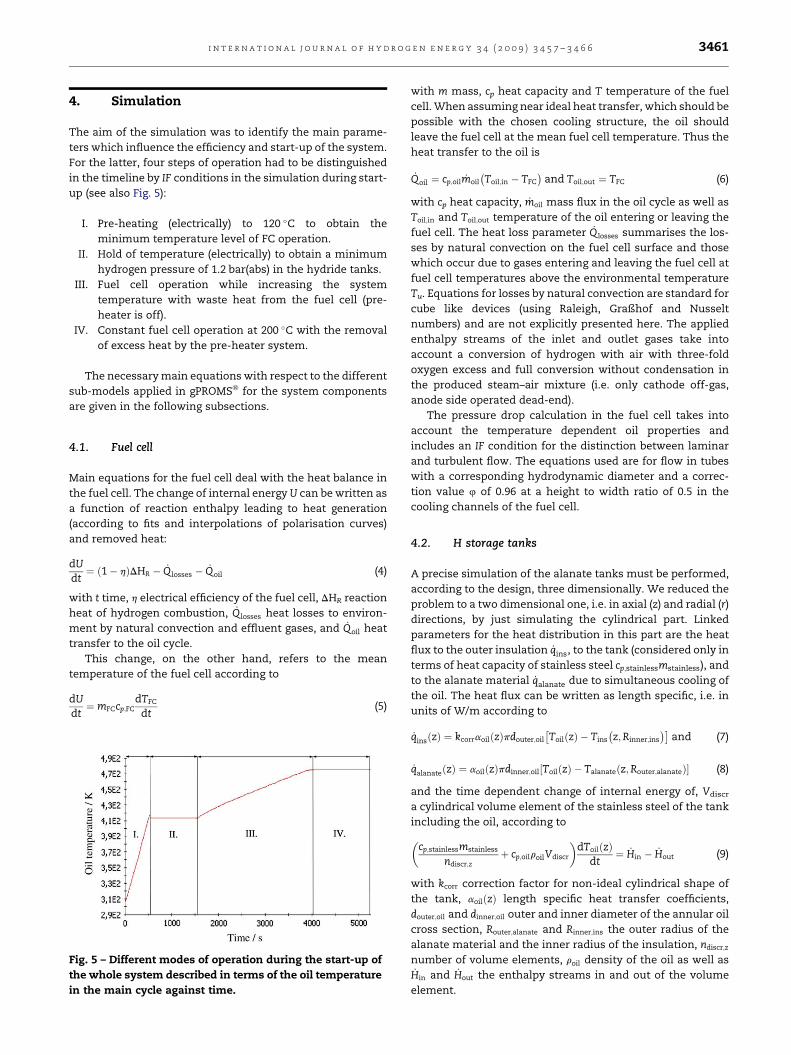