Robust spatially resolved pressure measurements using MRI with novel buoyant advection-free...
10
Postprint Version Robert H. Morris, Martin Bencsik, Nikolaus Nestle, Petrik Galvosas, David Fairhurst, Anil Vangala, Yvonne Perrie and Glen McHale, Robust spatially resolved pressure measurements using MRI with novel buoyant advection-free preparations of stable microbubbles in polysaccharide gels, J. Magn. Res. 193 (2) (2008) 159-167; DOI: doi:10.1016/j.jmr.2008.04.025. The following article appeared in Journal of Magnetic Resonance and may be found at http://doi.org/doi:10.1016/j.jmr.2008.04.025 . Copyright© 2008 Elsevier Inc. Robust spatially resolved pressure measurements using MRI with novel buoyant-advection free preparations of stable microbubbles in polysaccharide gels Robert H Morris a , Martin Bencsik a, * , Nikolaus Nestle b , Petrik Galvosas c , David Fairhurst a , Anil Vangala d , Yvonne Perrie e , Glen McHale a a Nottingham Trent University, Clifton Lane, Nottingham, NG11 8NS, UK b BASF Aktiengesellschaft, Ludwigshafen, Germany c Universität Leipzig, Fakultät für Physik und Geowissenschaften, Linnéstraße 5, Leipzig, Germany, d School of Pharmacy and Chemistry, Kingston University, Surrey, KT1 2EE e Medicines Research Unit, School of Life and Health Sciences, Aston University, Birmingham, UK. Abstract MRI of fluids containing lipid coated microbubbles has been shown to be an effective tool for measuring the local fluid pressure. However, the intrinsically buoyant nature of these microbubbles precludes lengthy measurements due to their vertical migration under gravity and pressure-induced coalescence. A novel preparation is presented which is shown to minimize both these effects for at least 25 minutes. By using a 2% polysaccharide gel base with a small concentration of glycerol and 1,2-distearoyl-sn-glycero-3-phosphocholine coated gas microbubbles, MR measurements are made for pressures between 0.95 and 1.44 bar. The signal drifts due to migration and amalgamation are shown to be minimized for such an experiment whilst yielding very high NMR sensitivities up to 38% signal change per bar. Keywords: Gas filled lipid coated microbubbles; Pressure; Polysaccharide; MRI; Diffusion; Viscosity; Contrast agent * Corresponding author. Tel: +44 115 848 8057 Fax: +44 115 848 6636 E-mail address:[email protected]
-
Upload
independent -
Category
Documents
-
view
0 -
download
0
Transcript of Robust spatially resolved pressure measurements using MRI with novel buoyant advection-free...
Postprint Version Robert H. Morris, Martin Bencsik, Nikolaus Nestle, Petrik Galvosas, David Fairhurst, Anil Vangala, Yvonne Perrie and Glen McHale, Robust spatially resolved pressure measurements using MRI with novel buoyant advection-free preparations of stable microbubbles in polysaccharide gels, J. Magn. Res. 193 (2) (2008) 159-167; DOI: doi:10.1016/j.jmr.2008.04.025. The following article appeared in Journal of Magnetic Resonance and may be found at http://doi.org/doi:10.1016/j.jmr.2008.04.025. Copyright© 2008 Elsevier Inc.
Robust spatially resolved pressure measurements using MRI with novel buoyant-advection free preparations of stable microbubbles in polysaccharide gels
Robert H Morris a , Martin Bencsik a, *, Nikolaus Nestle b, Petrik Galvosas c, David Fairhurst a,
Anil Vangala d, Yvonne Perrie e, Glen McHale a aNottingham Trent University, Clifton Lane, Nottingham, NG11 8NS, UK
bBASF Aktiengesellschaft, Ludwigshafen, Germany
cUniversität Leipzig, Fakultät für Physik und Geowissenschaften, Linnéstraße 5, Leipzig, Germany,
dSchool of Pharmacy and Chemistry, Kingston University, Surrey, KT1 2EE
eMedicines Research Unit, School of Life and Health Sciences, Aston University, Birmingham, UK.
Abstract
MRI of fluids containing lipid coated microbubbles has been shown to be an effective tool for measuring the local fluid pressure. However, the intrinsically buoyant nature of these microbubbles precludes lengthy measurements due to their vertical migration under gravity and pressure-induced coalescence. A novel preparation is presented which is shown to minimize both these effects for at least 25 minutes. By using a 2% polysaccharide gel base with a small concentration of glycerol and 1,2-distearoyl-sn-glycero-3-phosphocholine coated gas microbubbles, MR measurements are made for pressures between 0.95 and 1.44 bar. The signal drifts due to migration and amalgamation are shown to be minimized for such an experiment whilst yielding very high NMR sensitivities up to 38% signal change per bar.
Keywords: Gas filled lipid coated microbubbles; Pressure; Polysaccharide; MRI; Diffusion; Viscosity; Contrast agent
* Corresponding author. Tel: +44 115 848 8057 Fax: +44 115 848 6636 E-mail address:[email protected]

Journal of Magnetic Resonance 193 (2008) 159–167 2
1. Introduction Until recently, fluid pressure measurements were made
exclusively with discrete electrical or mechanical sensors at the surface of samples. If a suitable fluid is used [1], MRI can non-invasively produce 3-D images of fluid pressure. Applications as diverse as diagnostic medical imaging, fundamental research for chemical engineering and enhanced oil recovery are possible with such a technique, which could revolutionise the understanding of many processes where spatial variations of fluid pressure exist, such as for the case of a flowing viscous fluid. Since 1996 two methods both utilising MRI have been demonstrated: for samples which have low permeability, compressible fluids such as gasses can be used to yield pressure sensitivity through density measurement [1] although this is not suitable for samples such as sandstones; an alternative method takes advantage of the susceptibility difference between lipid coated, micron sized gas bubbles (microbubbles) and a suspending liquid medium. When subjected to a magnetic field, these microbubbles cause perturbations which are dependent on their radius [2]. A change in pressure causes a change in the size of these compressible microbubbles and therefore a change in the perturbations. Protons undergoing Brownian motion around these microbubbles experience a range of different fields causing signal dephasing which depends on the microbubble size and the distance which they have diffused during the measurements [3].
The microbubble method was originally conceived as a
method for in vivo human manometry using MRI [3]. A theoretical study published in 2002 [4] suggested that the amount of gas required for sufficient sensitivity exceeds the lethal dose, unless a sophisticated paramagnetic coating could be used [5]. In 2007 the microbubble preparations were applied to study the pressure of a flowing fluid in sandstone-like samples [6].
In the previous works it has been shown that the
preparations present instabilities over time which cause drifts in the NMR signal. Lipid coated microbubbles are prone to damage as a result of the application of pressure, owing to the fragile properties of their membranes and the propensity of the gas to dissolve into the surrounding fluid. This effect coupled with their intrinsic buoyancy must be counteracted to make meaningful measurements over time.
Presented here is a novel preparation which succeeds in
minimising these effects whilst maintaining a high sensitivity to pressure changes using MRI. Rheometry, diffusion NMR, time lapse photography and ultra-fast MRI are used to validate the properties of the preparation.
2. Theory 2.1 Origin of the NMR sensitivity
The susceptibility difference between two media in a static magnetic field causes local polarising field perturbations. The susceptibility difference between water and air is in the order of 10-6 [7] causing microbubbles to produce perturbations extending an appreciable distance from their surfaces. Water molecules which are diffusing in such a field will be subjected to a range of field strengths different to that in bulk fluid. The relative perturbations of the longitudinal component of the polarising field surrounding a sphere with a magnetic susceptibility difference of ∆χ to its surroundings are given by [2]:
( )
)1cos3(3
4, 23
−
∆=∆ θχπθr
R
B
rB
o
z , Eq. 1
where R is the radius of the sphere and r is the radial distance from its centre at angle θ from the direction of the static magnetic field of strength B0.
Because the length scale of these perturbations is
dependent on the microbubble radius, a change in bubble size will result in a change in the distribution of the field strengths sampled by a water molecule diffusing in the liquid, resulting in a change of signal intensity. As the microbubbles are compressible, a change in external pressure will cause such a change in radius, yielding MRI pressure contrast. Because the process relies on the diffusion of water molecules around the microbubbles, the distance which they have diffused in a given time affects the sensitivity of the technique: if the protons have not travelled sufficiently far between two comparative acquisitions, no signal change will be seen; if they travel too far, they do not encounter sufficient perturbations either. It has been shown [4] that dephasing is maximised when molecules are allowed to diffuse a specific distance in terms of the length scale of these perturbations, and is partially dependant on the NMR sequence that is used.
Note that bubble size and diffusion coefficient
both will be affected by temperature changes, hence affecting the sensitivity, but we have not exploited or discussed these effects in our present work.
2.2 Bubble rise velocity
The most important factor affecting the stability of the measurements over time is the ability of the suspending medium to prevent buoyant advection of the microbubbles. The expected rise velocity for a microbubble can be determined by equating the two opposing forces which act on it: the buoyant force,
Journal of Magnetic Resonance 193 (2008) 159–167 3
gRFB ρ
334 ∆= π ; Eq. 2
and the viscous drag on a sphere, which is given by Stokes’ law for the case of low Reynolds number,
v6 RFD πη= , Eq. 3
where R is the radius of a sphere moving with velocity v through a fluid with viscosity η, g is the acceleration due to gravity and ∆ρ is the difference in density between the gas and the liquid.
Because the lipids in the membranes of the microbubbles are in the gel state, they have a very low mobility, and they are not likely to cause additional slip at the interface between the bubble and the liquid.
Several models are available to describe the properties
of non-Newtonian fluids. In the case of our study, the viscosity of pseudo-plastic fluids is described by the power law model [8],
12k −= nγη & , Eq. 4
which provides excellent correlation with the experimental data. In the previous expression γ& is the shear rate, whilst the consistency, k2, and the power law index, n, are two parameters that fully describe the rheological properties of the fluid.
For a particle moving through such a power-law fluid,
the particle Reynolds number is given by [9]:
2
2
k
)2(ρvRe
nn
pR−∆
= . Eq. 5
To estimate the maximum possible Reynolds number in
the experimental system, the following ‘worst case’ parameters are assumed: ∆ρ = 1.1 kg m-3, v = 5×10⁻⁷ m s-1, R = 20 µm, n = 0.3 and k2 = 10 Pa s0.3. This gives a Reynolds number less than 5×10-12 which is considerably lower than values associated with a turbulent regime, corresponding to Rep>1.
According to Williams [10] the shear force caused by a
sphere moving with low Reynolds number can be approximated by
R2
v=γ& . Eq. 6
By equating the buoyant and drag forces, and using the
‘worst case’ parameters and models mentioned previously,
the terminal velocity of a sphere with a given radius can be expressed in terms of the physical properties of a fluid:
n
k
gRnn1
2
1
9
ρ2v
∆=+
. Eq. 7
For a 5% v/v suspension, the highest concentration
explored in this work, the microbubbles are separated by more than four times their own diameter, and in consequence hydrodynamic interactions between neighbouring microbubbles can be neglected.
2.3 MRI sequence
In all MRI work presented here, the RARE sequence [11] is used with the RARE factor set to the number of lines in the images, allowing an image to be collected from a single excitation pulse as in EPI.
To ensure that the sensitivity of the experiment is
maximised, the effective echo time, TEeff must be optimised
with respect to the T2eff of the sample. The optimum setting
required to yield maximum sensitivity to small changes in T2
eff is determined both semi-analytically and using Monte-Carlo simulation in MATLAB (Mathworks, MA, USA).
For a homogeneous sample defined as in Fig. 1, by
integrating the NMR signal along the y-axis and assuming that the exponential decay during the read gradients can be neglected as the encoding time is sufficiently short, the signal intensity for a modulus MRI image is well approximated by:
( )dte
TtG
TtyGTTA
eff
effE
TtT
oeffEy
effEoyeff
Eeff )/(
2
22
)(
)(sin2),( −
∫ −
−=
γγ . Eq. 8
where γ is the proton gyromagnetic ratio (not related to γ& used in the rheology section), whilst Gy is the strength of the phase encoding imaging field gradient, t is the time and yo is the extent of the sample along the y-axis.
-ymax y0-y0 ymax
Spin Density
-ymax y0-y0 ymax
T2eff
Fig. 1. Simple homogeneous sample profiles used to estimate optimum echo time.
For a small change in T2eff, the greatest change in signal
intensity is given (see Appendix A) by
Journal of Magnetic Resonance 193 (2008) 159–167 4
effeffE TT 22= . Eq. 9
Although quantitatively correct, for practical MRI
purposes the qualitative deterioration of an image that would be acquired with this set up needs to be assessed. This is achieved using Monte Carlo simulation, in which an idealised circular homogeneous image has its corresponding train of spin echoes multiplied by an exponential decay for a range of different T2
eff values before thermal noise is added. The mean amplitude of the resulting MR image is then calculated in terms of TE
eff. Visual inspection of the reconstructed images allows
qualitative estimation of the image artefacts, particularly those due to the increasing attenuation of the centre of k-space. Quantitation of the SNR (mean signal divided by the standard deviation of noise) in the set of generated images also permits verification of the result in Eq. 9.
3. Materials
In order to minimise the extent to which microbubbles dissolve in the surrounding medium, they are coated with a lipid shell. These lipid coated microbubbles are commonly used as a contrast agent in ultrasound as they greatly enhance the scattering of the incident wave, thereby improving contrast [12].
There are numerous methods for producing these
microbubbles ranging from simple sonication [13] methods to very complex freeze drying procedures [14]. The method used for this work is detailed by Vangala et al. [15] and uses high shear mixing to produce polydisperse microbubbles. The chosen lipid powder is hydrated with water, forming laminar sheets. The mixture is then subjected to high shear mixing at atmospheric pressure using a homogeniser, spontaneously introducing gas bubbles. The lipids are in their lowest energy state when their hydrophobic chains are inside the gas bubbles whilst their hydrophilic head groups are in the surrounding medium. As a consequence of this, the lipids form a membrane at the gas liquid interface of the microbubbles. This method allows rapid and efficient production of gas filled lipid coated microbubbles 1-20 µm in size. The lipid used for the following work is 1,2-distearoyl-sn-glycero-3-phosphocholine (DSPC, C18:0, MR: 790.16) as this has been shown to yield superior stability in comparison to shorter chain lipids [13].
To prevent buoyant advection of lipid coated
microbubbles through the suspending medium, a highly viscous preparation is necessary. However, according to the Stokes-Einstein relationship, higher viscosity results in lower diffusion for Newtonian fluids. Since the diffusion of water molecules around the lipid coated microbubbles is
critical for the MRI contrast, simply increasing the viscosity may greatly reduce the sensitivity. However, non-Newtonian fluids are not governed by the Stokes-Einstein relationship. Polysaccharide gels are an example of a group of fluids which allow increase in viscosity with minimal effect on the diffusion of water within their structure [16]. We present results that demonstrate that this is the case for gellan gum, which is the polysaccharide gel used in these experiments, and justify its use as a suitable suspending medium for this contrast agent.
Gellan gum in aqueous solution forms an entangled
polymer network at relatively low concentrations (typically less than 5%), rapidly increasing the bulk viscosity of the fluid [17]. Because the polymer chains are very long, the majority of water molecules in the solution are free to diffuse unhindered resulting in minimal reduction in the diffusion coefficient. Unfortunately, polysaccharide gels have a high propensity to support bacterial growth which can change many properties of the gel including the viscosity. In order to minimise the bacterial growth, Sodium Hypochlorite is used in a concentration of 0.02% v/v. Lipid coated microbubbles have been tested in this solution to ensure that it does not affect their stability (which would not be expected as they are not electrically charged).
The gellan gum is supplied in powdered form, and for
these experiments CPKelco’s Kelcogel AFT (CPKelco, USA) is used. This is an industrial grade gum with a particle size of 355 µm [18] which must be rehydrated with water to produce a gel. To prevent inclusion of gas bubbles within the gel, which could lead to spurious measurements, it is hydrated under vacuum.
Prior to the suspension of microbubbles in the gel, they
are blended with an equal concentration of glycerol. The reason this increases the stability of the microbubble is unknown at this time, but it has been seen to somewhat reduce the drift in signal intensity.
4. Experimental
The properties of the polysaccharide gel are thoroughly
analysed before it is used as the base of the contrast agent. The fluid should reduce the buoyant advection of the microbubbles with minimal restriction to the self-diffusion of water within its structure which in turn should not affect the lipid coated micro-bubbles.
The viscosity of the gel is measured at various
concentrations for a range of shear rates using a TA Instruments (Delaware, USA) CSL2 Rheometer. The instrument is calibrated using PolyDiMethylSiloxane (PDMS) oils which are available in a wide range of viscosities over which they are highly Newtonian. The

Journal of Magnetic Resonance 193 (2008) 159–167 5
instrument is used with a ‘Mooney-Ewart’ geometry [19] tool manufactured from acrylic. The viscosity is measured for increasing and decreasing shear rates allowing the rheological properties of the gel to be studied for a static and flowing fluid.
To verify that the prediction of the bubble rise velocity
is representative of the practical situation, turbidity measurements of two samples, methyl cellulose and gellan gum prepared in equal concentration is performed. The opacity of the microbubbles is sufficient that time lapse photography can be used. The samples are photographed simultaneously every minute using an 8-bit black and white DSA Mk 10 camera (Krüss, Hamburg, Germany). In order to prevent clipping, the contrast of the images is adjusted by varying the light intensity until an image of the gels without microbubbles gives a grey value of 250, allowing the smallest possible microbubbles to be observed. To facilitate simultaneous display of the collected data, the intensity across the width of each sample is averaged, providing vertical profiles each minute. These are plotted and the gradients of similar intensities calculated to determine the rise velocity of various microbubble sizes. These are then compared to the theoretical estimates in an attempt to validate them.
The self-diffusion of water contained in the fluid is
measured using a 400 MHz pulsed field gradient spectrometer at University of Leipzig. The magnet is a wide bore 9.4 T superconducting type (Bruker, Germany) and is used with a MARAN ULTRA console (Resonance Instruments, GB) with a Direct Binary Coded Current Source [20] for gradient pulse generation, whilst the instrument is triggered at a constant mains voltage phase to avoid hum artefacts. Using a stimulated gradient echo sequence with compensation for a shift in echo position caused by imperfect gradient pulses [20], a sample volume of 0.5 ml is tested in the actively shielded anti-helmholtz type probe at a range of temperatures for distilled water and gellan gum. These experiments allow rapid assessment of the stability of the preparation and its sensitivity to minor changes in temperature.
Once the fluid properties have been assessed, it is
prepared for use as a contrast agent to pressure variation. The dry powder is dissolved in distilled water to a concentration of 2% w/v whilst stirring vigorously for 8 hours under vacuum (450 torr) until a gas free homogeneous preparation is achieved. Lipid coated microbubbles are then blended with an equal concentration of glycerol before mixing with the gellan gum to a concentration of 1.25% v/v. Having achieved a homogeneous preparation, the fluid can be used directly as an MRI contrast agent to pressure.
The MRI experiments are performed using a 2.35 T Biospec small animal scanner (Bruker, Germany). As the fluid is static, ultra fast imaging can be used without concern for flow artefacts.
Two MRI experiments are conducted: The first is to test
for the presence of microbubble advection. A single large volume of fluid is tested in a cylindrical acrylic cell (42mm id × 70mm) with Swagelok (Swagelok, USA) connectors at the inlet and outlet. The pressure of this sample is then varied using a remotely connected syringe pump whilst the RARE sequence is run. The signal intensity at several pressures is divided by the average signal intensity over all pressures. If the microbubbles experience advection during the experiment, a vertical gradient will develop in time. This is tested by plotting profiles from a single line across the centre of the sample horizontally and vertically.
The second experiment tests the stability of the MR
sensitivity to pressure changes. Using a similar experimental setup, the fluid pressure is varied whilst it is monitored and recorded using a traditional piezoelectric pressure sensor. The average signal over the sample volume is plotted alongside the recorded pressure to test for correlation between external pressure and the signal intensity. A control sample containing just gellan gum is also tested to ensure that sensitivity is indeed coming from the presence of lipid coated microbubbles and not from trapped gas or other unintentional contrast mechanisms.
5. Results
5.1. Viscosity Measurements
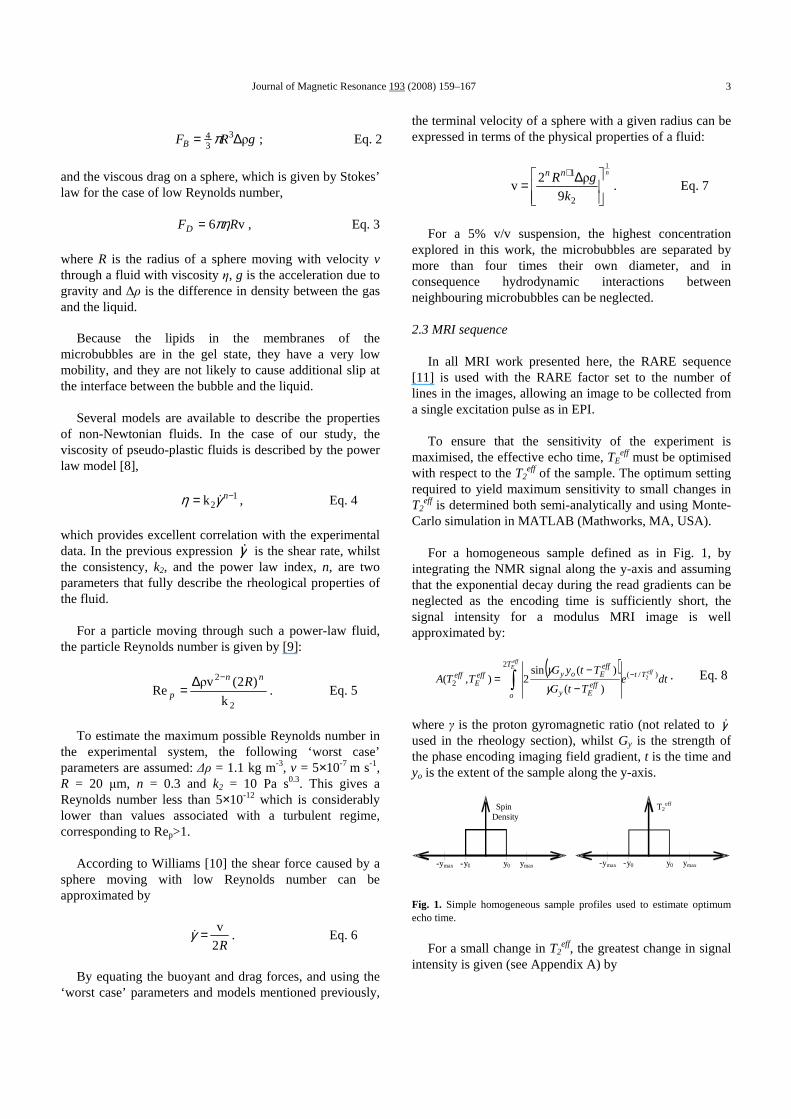
The viscosity of the gel is measured for three samples
shown on Fig. 2. The plots show the variations in viscosity for a range of shear rates. The consistency and power law index are calculated from a log-log plot (see Fig. 2). The viscosity is also measured for 2% methyl cellulose (which was used in two previous studies [3; 6]) for comparison to the properties of the gellan gum (see Fig. 3). For shear rates below 12 s-1 the gellan gum’s viscosity is far higher than the methyl cellulose, above this value, viscosities are similar within 0.25 Pa s.
Journal of Magnetic Resonance 193 (2008) 159–167 6
100
101
102
100
Shear Rate, s-1
Vis
cosi
ty,P
a⋅s
2% Gellan Gum2% Gellan gum, 5% Microbubbles2% Gellan gum, 5% Microbubbles, 5%Glycerol
Fig. 2. Log-log plot of viscosity against shear rate for the three samples. The addition of glycerol and microbubbles has little effect on the viscosity of the fluid, even at concentrations as high 5%. At low shear the viscosity of the fluids are very high with a value greater than 6 Pas. The plot demonstrates near ideal power law behavior and allows determination of the rheological coefficients, consistency (k2) and power law index (n).
100
101
102
100
101
Shear Rate, s-1
Vis
cosi
ty,P
a⋅s
2% Gellan Gum2% Methyl Cellulose
Fig. 3. Log-log plot of viscosity against shear rate for gellan gum and methyl cellulose both at 2% w/v demonstrating near ideal behavior and allowing determination of consistency (k2) and power law index (n).
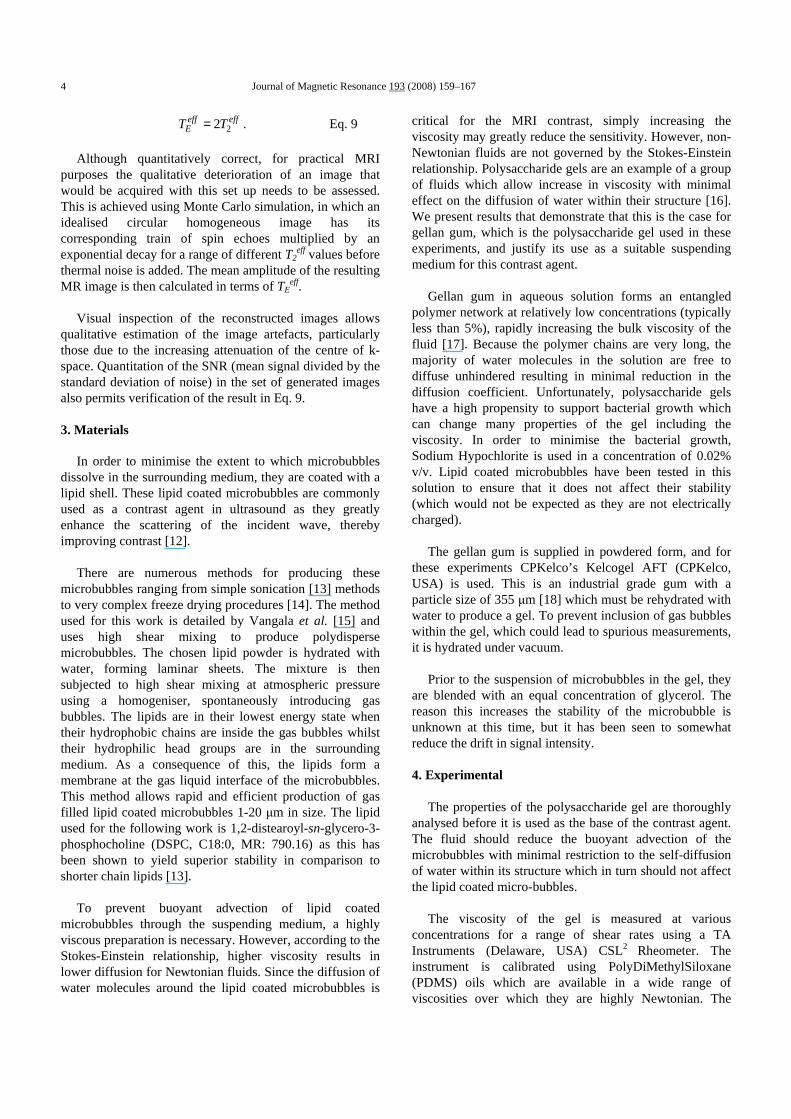
5.2 Microbubble advection measurements The theoretical velocities predicted for a range of
microbubble sizes determined using Eq. (6) and rheology data in Fig. 3 are plotted in Fig. 4. The expected velocity for a microbubble in methyl cellulose is predicted to be three orders of magnitude faster than a similarly sized microbubble in gellan gum (e.g. for 13 µm bubbles, velocities are 8×10⁻⁸ m s-1 and 2×10-13 m s-1 for methyl cellulose and gellan gum respectively.)
Two images from the time lapse photography study are
shown in Fig. 5 (the original video showing each time lapse image is available as supporting material). In order to present the data in a format which allows rapid assessment
10-1
100
101
10-25
10-20
10-15
10-10
v(2%
Gel
lan
gum
),m⋅
s-1
10-1
100
101
10-12
10-10
10-8
10-6
Bubble radius, µm
v(5%
Met
hylc
ellu
lose
),m⋅
s-1
1.4E-13 7.5E-8
13
Fig. 4. Log-log plot of predicted rise velocity (v) for a given microbubble radius based on extrapolated rheology data (the lowest shear rate value measured in Fig 3 corresponds on this graph to bubble radii of 126 µm and 110 µm for the Gellan gum and the Methyl cellulose respectively), produced using Eqs. (2-6) for comparison of two preparations.
X Position, mm
Methyl Cellulose Gellan Gum
Sam
ple
hei
gh
t,m
m
0 1 2 3 0 1 2 3
76543210
Sam
ple
hei
gh
t,m
m
0 1 2 3 0 1 2 3
76543210
0
50
100
150
200
250 Methyl Cellulose Gellan Gum
X Position, mm
Fig. 5. Initial (left) and final (right) image from the time lapse study. The final image is collected 46 h after the initial image. The left hand side of each image is the methyl cellulose sample whilst the gellan gum is on the rights hand side. The colour codes the intensity of light incident on the camera.
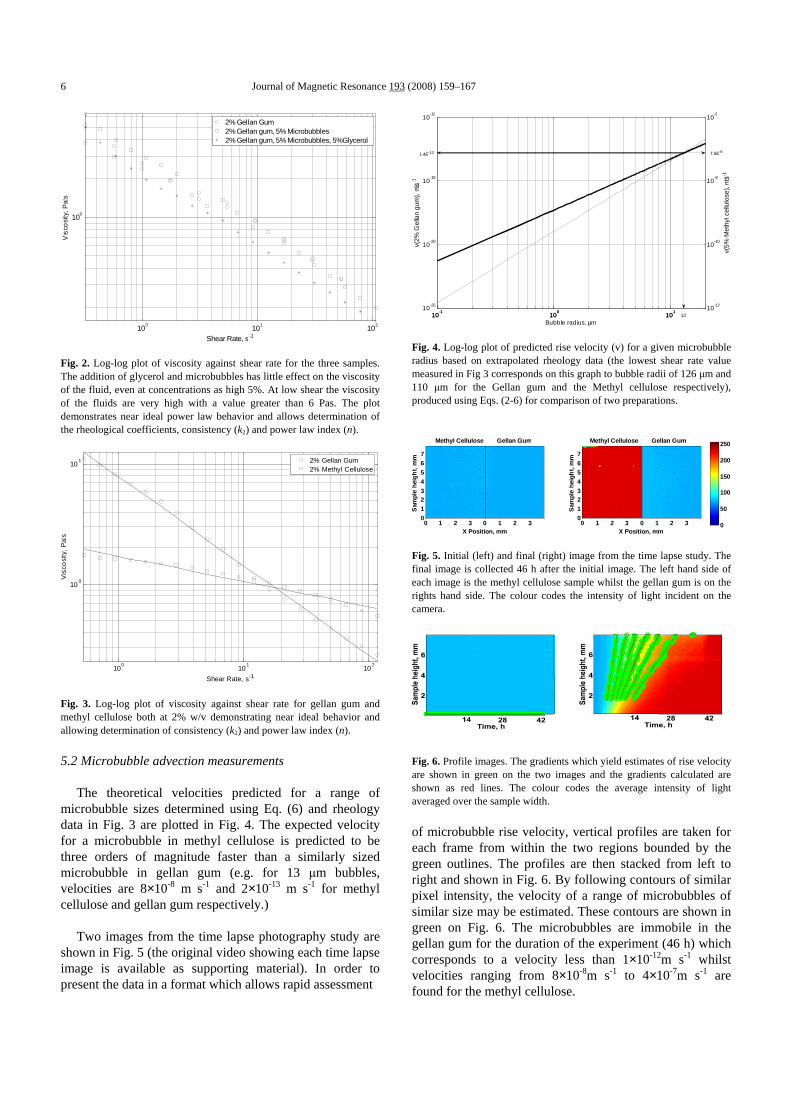
Fig. 6. Profile images. The gradients which yield estimates of rise velocity are shown in green on the two images and the gradients calculated are shown as red lines. The colour codes the average intensity of light averaged over the sample width.
of microbubble rise velocity, vertical profiles are taken for each frame from within the two regions bounded by the green outlines. The profiles are then stacked from left to right and shown in Fig. 6. By following contours of similar pixel intensity, the velocity of a range of microbubbles of similar size may be estimated. These contours are shown in green on Fig. 6. The microbubbles are immobile in the gellan gum for the duration of the experiment (46 h) which corresponds to a velocity less than 1×10-12m s-1 whilst velocities ranging from 8×10⁻⁸m s-1 to 4×10⁻⁷m s-1 are found for the methyl cellulose.
Journal of Magnetic Resonance 193 (2008) 159–167 7
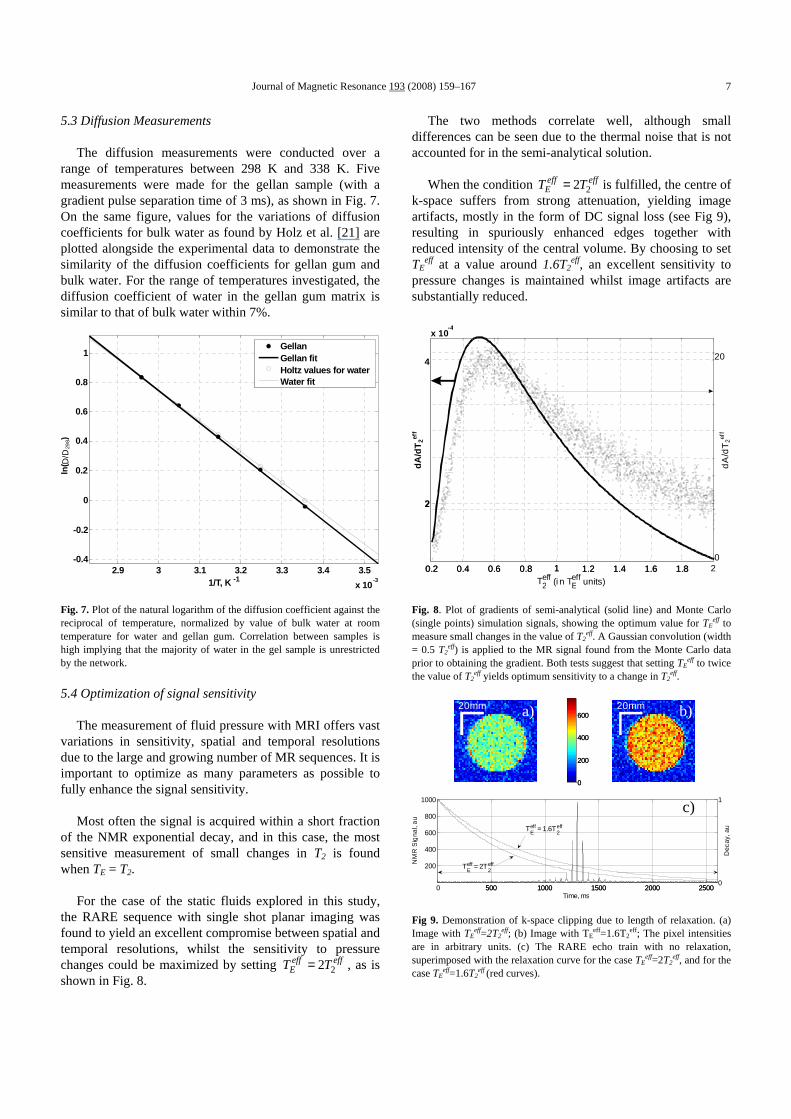
5.3 Diffusion Measurements The diffusion measurements were conducted over a
range of temperatures between 298 K and 338 K. Five measurements were made for the gellan sample (with a gradient pulse separation time of 3 ms), as shown in Fig. 7. On the same figure, values for the variations of diffusion coefficients for bulk water as found by Holz et al. [21] are plotted alongside the experimental data to demonstrate the similarity of the diffusion coefficients for gellan gum and bulk water. For the range of temperatures investigated, the diffusion coefficient of water in the gellan gum matrix is similar to that of bulk water within 7%.
2.9 3 3.1 3.2 3.3 3.4 3.5
x 10-3
-0.4
-0.2
0
0.2
0.4
0.6
0.8
1
1/T, K -1
ln(
)
GellanGellan fitHoltz values for waterWater fit
D/D
298
Fig. 7. Plot of the natural logarithm of the diffusion coefficient against the reciprocal of temperature, normalized by value of bulk water at room temperature for water and gellan gum. Correlation between samples is high implying that the majority of water in the gel sample is unrestricted by the network.
5.4 Optimization of signal sensitivity The measurement of fluid pressure with MRI offers vast
variations in sensitivity, spatial and temporal resolutions due to the large and growing number of MR sequences. It is important to optimize as many parameters as possible to fully enhance the signal sensitivity.
Most often the signal is acquired within a short fraction
of the NMR exponential decay, and in this case, the most sensitive measurement of small changes in T2 is found when TE = T2.
For the case of the static fluids explored in this study,
the RARE sequence with single shot planar imaging was found to yield an excellent compromise between spatial and temporal resolutions, whilst the sensitivity to pressure changes could be maximized by setting effeff
E TT 22= , as is shown in Fig. 8.
The two methods correlate well, although small differences can be seen due to the thermal noise that is not accounted for in the semi-analytical solution.
When the condition effeff
E TT 22= is fulfilled, the centre of k-space suffers from strong attenuation, yielding image artifacts, mostly in the form of DC signal loss (see Fig 9), resulting in spuriously enhanced edges together with reduced intensity of the central volume. By choosing to set TE
eff at a value around 1.6T2eff, an excellent sensitivity to
pressure changes is maintained whilst image artifacts are substantially reduced.
4
dA
/dT
2eff
dA
/dT
2eff
0.2 0.4 0.6 0.8 1 1.2 1.4 1.6 1.8 2
4
x 10-
0.2 0.4 0.6 0.8 1 1.2 1.4 1.6 1.80
20
T2eff (i n TE
eff units)
Fig. 8. Plot of gradients of semi-analytical (solid line) and Monte Carlo (single points) simulation signals, showing the optimum value for TE
eff to measure small changes in the value of T2
eff. A Gaussian convolution (width = 0.5 T2
eff) is applied to the MR signal found from the Monte Carlo data prior to obtaining the gradient. Both tests suggest that setting TE
eff to twice the value of T2
eff yields optimum sensitivity to a change in T2eff.
0 500 1000 1500 2000 2500
200
400
600
800
1000
Time, ms
NM
RS
igna
l,a
u
500 1000 1500 2000 25000
1
Dec
ay,a
uTEeff = 1.6T
2eff
TEeff = 2T
2eff
c)
0
200
400
600
0
200
400
60020mm b)20mm a)
Fig 9. Demonstration of k-space clipping due to length of relaxation. (a) Image with TE
eff=2T2eff; (b) Image with TE
eff=1.6T2eff; The pixel intensities
are in arbitrary units. (c) The RARE echo train with no relaxation, superimposed with the relaxation curve for the case TE
eff=2T2eff, and for the
case TEeff=1.6T2
eff (red curves).
Journal of Magnetic Resonance 193 (2008) 159–167 8
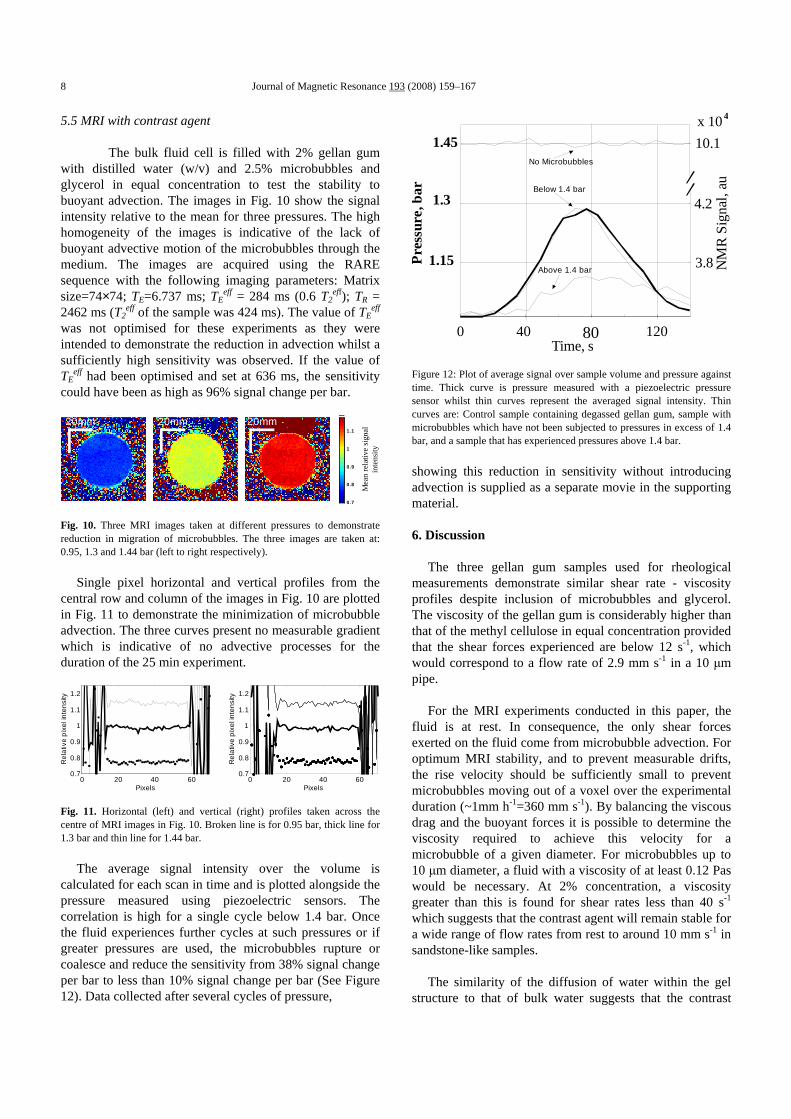
5.5 MRI with contrast agent The bulk fluid cell is filled with 2% gellan gum
with distilled water (w/v) and 2.5% microbubbles and glycerol in equal concentration to test the stability to buoyant advection. The images in Fig. 10 show the signal intensity relative to the mean for three pressures. The high homogeneity of the images is indicative of the lack of buoyant advective motion of the microbubbles through the medium. The images are acquired using the RARE sequence with the following imaging parameters: Matrix size=74×74; TE=6.737 ms; TE
eff = 284 ms (0.6 T2eff); TR =
2462 ms (T2eff of the sample was 424 ms). The value of TE
eff was not optimised for these experiments as they were intended to demonstrate the reduction in advection whilst a sufficiently high sensitivity was observed. If the value of TE
eff had been optimised and set at 636 ms, the sensitivity could have been as high as 96% signal change per bar.
20mm 20mm 20mm
Mea
nre
lativ
esi
gna
lin
ten
sity
0.7
0.8
0.9
1
1.1
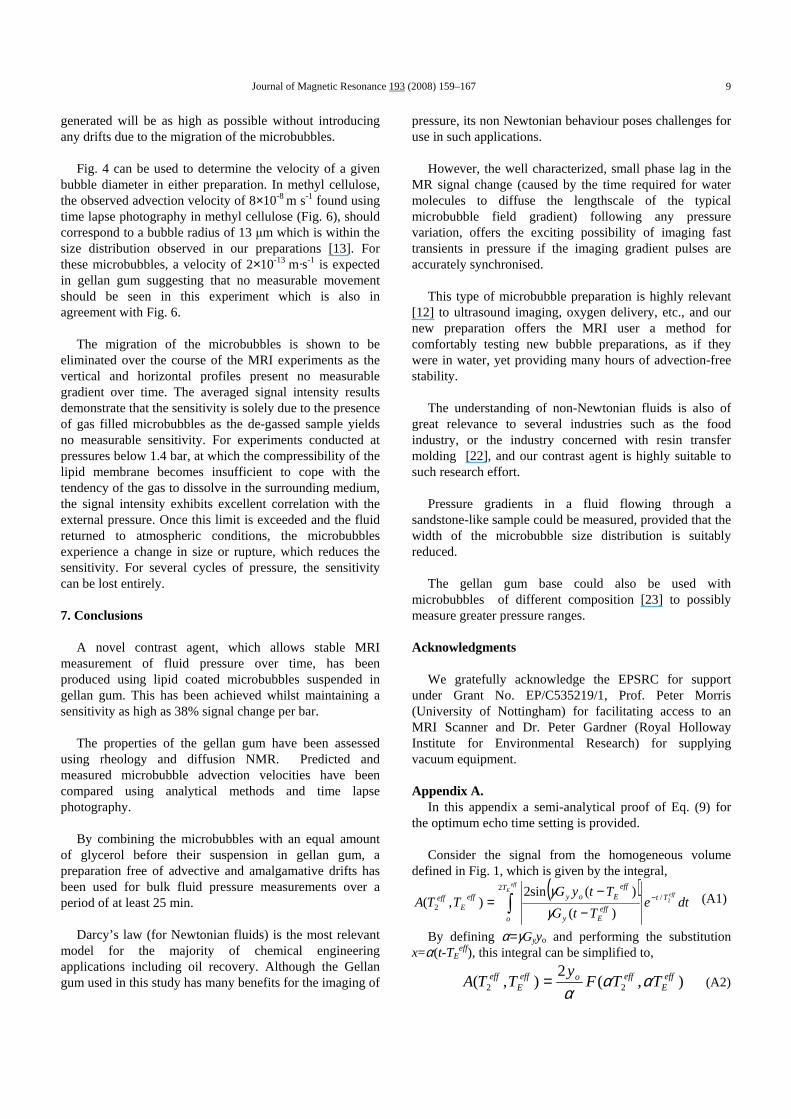
Fig. 10. Three MRI images taken at different pressures to demonstrate reduction in migration of microbubbles. The three images are taken at: 0.95, 1.3 and 1.44 bar (left to right respectively).
Single pixel horizontal and vertical profiles from the central row and column of the images in Fig. 10 are plotted in Fig. 11 to demonstrate the minimization of microbubble advection. The three curves present no measurable gradient which is indicative of no advective processes for the duration of the 25 min experiment.
0 20 40 600.7
0.8
0.9
1
1.1
1.2
Pixels
Re
lativ
ep
ixe
lin
ten
sity
0 20 40 600.7
0.8
0.9
1
1.1
1.2
Pixels
Re
lativ
ep
ixe
lin
ten
sity
Fig. 11. Horizontal (left) and vertical (right) profiles taken across the centre of MRI images in Fig. 10. Broken line is for 0.95 bar, thick line for 1.3 bar and thin line for 1.44 bar.
The average signal intensity over the volume is calculated for each scan in time and is plotted alongside the pressure measured using piezoelectric sensors. The correlation is high for a single cycle below 1.4 bar. Once the fluid experiences further cycles at such pressures or if greater pressures are used, the microbubbles rupture or coalesce and reduce the sensitivity from 38% signal change per bar to less than 10% signal change per bar (See Figure 12). Data collected after several cycles of pressure,
Time, s
0 20 40 60 80 100 120 140
1.15
1.3
1.45
0
0 40 80 120140
3.8
4.2
10.1
x 104
Pre
ssur
e,ba
r
No Microbubbles
Below 1.4 bar
Above 1.4 bar NM
R S
igna
l, au
Figure 12: Plot of average signal over sample volume and pressure against time. Thick curve is pressure measured with a piezoelectric pressure sensor whilst thin curves represent the averaged signal intensity. Thin curves are: Control sample containing degassed gellan gum, sample with microbubbles which have not been subjected to pressures in excess of 1.4 bar, and a sample that has experienced pressures above 1.4 bar.
showing this reduction in sensitivity without introducing advection is supplied as a separate movie in the supporting material. 6. Discussion
The three gellan gum samples used for rheological
measurements demonstrate similar shear rate - viscosity profiles despite inclusion of microbubbles and glycerol. The viscosity of the gellan gum is considerably higher than that of the methyl cellulose in equal concentration provided that the shear forces experienced are below 12 s-1, which would correspond to a flow rate of 2.9 mm s-1 in a 10 µm pipe.
For the MRI experiments conducted in this paper, the
fluid is at rest. In consequence, the only shear forces exerted on the fluid come from microbubble advection. For optimum MRI stability, and to prevent measurable drifts, the rise velocity should be sufficiently small to prevent microbubbles moving out of a voxel over the experimental duration (~1mm h-1=360 mm s-1). By balancing the viscous drag and the buoyant forces it is possible to determine the viscosity required to achieve this velocity for a microbubble of a given diameter. For microbubbles up to 10 µm diameter, a fluid with a viscosity of at least 0.12 Pas would be necessary. At 2% concentration, a viscosity greater than this is found for shear rates less than 40 s-1 which suggests that the contrast agent will remain stable for a wide range of flow rates from rest to around 10 mm s-1 in sandstone-like samples.
The similarity of the diffusion of water within the gel
structure to that of bulk water suggests that the contrast
Journal of Magnetic Resonance 193 (2008) 159–167 9
generated will be as high as possible without introducing any drifts due to the migration of the microbubbles.
Fig. 4 can be used to determine the velocity of a given
bubble diameter in either preparation. In methyl cellulose, the observed advection velocity of 8×10⁻⁸ m s-1 found using time lapse photography in methyl cellulose (Fig. 6), should correspond to a bubble radius of 13 µm which is within the size distribution observed in our preparations [13]. For these microbubbles, a velocity of 2×10-13 m·s-1 is expected in gellan gum suggesting that no measurable movement should be seen in this experiment which is also in agreement with Fig. 6.
The migration of the microbubbles is shown to be
eliminated over the course of the MRI experiments as the vertical and horizontal profiles present no measurable gradient over time. The averaged signal intensity results demonstrate that the sensitivity is solely due to the presence of gas filled microbubbles as the de-gassed sample yields no measurable sensitivity. For experiments conducted at pressures below 1.4 bar, at which the compressibility of the lipid membrane becomes insufficient to cope with the tendency of the gas to dissolve in the surrounding medium, the signal intensity exhibits excellent correlation with the external pressure. Once this limit is exceeded and the fluid returned to atmospheric conditions, the microbubbles experience a change in size or rupture, which reduces the sensitivity. For several cycles of pressure, the sensitivity can be lost entirely.
7. Conclusions
A novel contrast agent, which allows stable MRI
measurement of fluid pressure over time, has been produced using lipid coated microbubbles suspended in gellan gum. This has been achieved whilst maintaining a sensitivity as high as 38% signal change per bar.
The properties of the gellan gum have been assessed
using rheology and diffusion NMR. Predicted and measured microbubble advection velocities have been compared using analytical methods and time lapse photography.
By combining the microbubbles with an equal amount
of glycerol before their suspension in gellan gum, a preparation free of advective and amalgamative drifts has been used for bulk fluid pressure measurements over a period of at least 25 min.
Darcy’s law (for Newtonian fluids) is the most relevant
model for the majority of chemical engineering applications including oil recovery. Although the Gellan gum used in this study has many benefits for the imaging of
pressure, its non Newtonian behaviour poses challenges for use in such applications.
However, the well characterized, small phase lag in the
MR signal change (caused by the time required for water molecules to diffuse the lengthscale of the typical microbubble field gradient) following any pressure variation, offers the exciting possibility of imaging fast transients in pressure if the imaging gradient pulses are accurately synchronised.
This type of microbubble preparation is highly relevant
[12] to ultrasound imaging, oxygen delivery, etc., and our new preparation offers the MRI user a method for comfortably testing new bubble preparations, as if they were in water, yet providing many hours of advection-free stability.
The understanding of non-Newtonian fluids is also of
great relevance to several industries such as the food industry, or the industry concerned with resin transfer molding [22], and our contrast agent is highly suitable to such research effort.
Pressure gradients in a fluid flowing through a
sandstone-like sample could be measured, provided that the width of the microbubble size distribution is suitably reduced.
The gellan gum base could also be used with
microbubbles of different composition [23] to possibly measure greater pressure ranges.
Acknowledgments
We gratefully acknowledge the EPSRC for support under Grant No. EP/C535219/1, Prof. Peter Morris (University of Nottingham) for facilitating access to an MRI Scanner and Dr. Peter Gardner (Royal Holloway Institute for Environmental Research) for supplying vacuum equipment.
Appendix A.
In this appendix a semi-analytical proof of Eq. (9) for the optimum echo time setting is provided.
Consider the signal from the homogeneous volume
defined in Fig. 1, which is given by the integral,
( )dte
TtG
TtyGTTA
eff
effE
TtT
oeff
Ey
effEoyeff
Eeff 2/
2
2)(
)(sin2),( −
∫ −−
=γγ (A1)
By defining α=γGyyo and performing the substitution x=α(t-TE
eff), this integral can be simplified to,
),(2
),( 22eff
Eeffoeff
Eeff TTF
yTTA αα
α= (A2)
Journal of Magnetic Resonance 193 (2008) 159–167 10
where the function F(αT2eff,αTE
eff) has been defined as,
),(),( 2/
22 eff
EeffTTeff
Eeff TTGeTTF
effeffE αααα −= (A3)
and the function G(αT2
eff,αTEeff) is given by the integral,
dxexTTGeff
effE
effE
T
xT
T
effE
eff 2)(sinc),( 2α
α
α
αα−
−∫= (A4)
For the volume defined in Fig. 1, the maximum measured frequency in the experiment is given by,
πγ
2max
max
yGF
y= (A5)
To prevent Nyquist ghosts, the highest frequency that is measured must be at least twice the highest frequency originating from the NMR. Using Nb/TE
eff as the sampling rate and setting the field of view to twice the extent of the sample results in,
πγ oy
effE
yG
T
Nb = (A6)
where Nb is the number of digital points sampled (typically 70 or more). Assuming that T2
eff and TE
eff are in the order of 2 s and 0.5 s respectively, the expected value of α is typically in excess of 140 for which the exponential term in Eq. (A4) tends to 1 giving:
dxxTTG
effE
effE
T
T
effE
eff
∫−
≈α
α
α )(sinc),,( 2 (A7)
For sufficiently large values of αTE, the integral of the modulus of the sinc(x) term is independent of T2
Eff which gives
effeffE TTeff
Eeff eTTF 2/
2 ),( −≈αα (A8)
The maximum of the first derivative of F with respect to T2
eff gives the optimum setting for TE. This can be found by setting the second derivative to zero,
02
12
23
22
2
2
=
−
−=
eff
effE
eff
effE
eff T
TF
T
T
dT
Fd (A9)
which gives, effeff
E TT 22= (A10)
This semi-analytical solution for the optimum echo time agrees with the result found from the Monte Carlo simulation. Appendix B.
Supplementary data associated with this article can be found, in the online version, at doi:10.1016/j.jmr.2008.04.025.
References [1] M. Bencsik, C. Ramanathan, Direct measurement of porous media
local hydrodynamical permeability using gas MRI. Magn. Reson. Imaging 19 (2001) 379-383.
[2] R. Weisskoff, C. Zuo, J. Boxerman, B. Rosen, Microscopic susceptibility variation and transverse relaxation - theory and experiment, Magn. Reson. Med. 31 (1994) 601-610.
[3] A. Alexander, T. Mccreery, T. Barrette, A. Gmitro, E. Unger, Microbubbles as novel pressure-sensitive mr contrast agents, Magn. Reson. Med. 35 (1996) 801-806.
[4] R. Dharmakumar, D. Plewes, G. Wright, On the parameters affecting the sensitivity of mr measures of pressure with microbubbles, Magn. Reson. Med. 47 (2002) 264-273.
[5] R. Dharmakumar, D. Plewes, G. Wright, A Novel microbubble construct for intracardiac or intravascular mr manometry: a theoretical study, Phys. Med. Biol. 50 (2005) 4745-4762.
[6] R. Morris, M. Bencsik, A. Vangala, Y. Perrie, Three-dimensional fluid pressure mapping in porous media using magnetic resonance imaging with gas-filled liposomes, Magn. Reson. Imaging 25 (2007) 509-512.
[7] R. Glaser, R.B. Glaser, Biophysics, Springer, New York, 2000. [8] H.A. Barnes, J.F. Hutton, K. Walters, An Introduction To Rheology,
Elsevier, 1989. [9] P. Rajitha, R. Chhabra, N. Sabiri, J. Comiti, Drag on non-spherical
particles in power law non-newtonian media, Int. J. Miner. Process. 78 (2006) 110-121.
[10] P.A.E. Williams, G.O.E. Phillips, Gums and stabilisers for the food industry, vol 11, Royal Society of Chemistry, 2002.
[11] J. Hennig, A. Nauerth, H. Friedburg, Rare imaging - a fast imaging method for clinical MR. Magn. Reson. Med. 3 (1986) 823-833.
[12] E. Schutt, D. Klein, R. Mattrey, J. Riess, Injectable microbubbles as contrast agents for diagnostic ultrasound imaging: the key role of perfluorochemicals. Angew. Chem. Int. Edit. 42 (2003) 3218-3235.
[13] A. Vangala, R. Morris, M. Bencsik, Y. Perrie, Preparation and characterization of gas-filled liposomes: can they improve oil recovery? J. Liposome Res. 17 (2007) 263-72.
[14] S. Cho, J. Kim, J. Kim, Dynamic surface tension of stable air-filled microbubbles prepared by freeze-drying a solution of lipid/surfactant mixture, Colloid Surface A-Physicochem. Eng. Aspects 284 (2006) 453-457.
[15] A. Vangala, G. Kalkat, Y. Perrie, Application of gas-filled liposomes as pressure probes for oil extraction: a novel and simple preparation technique, J. Pharm. Pharmacol. 58 (2006) A41-A41.
[16] N. Nestle, P. Galvosas, O. Geier, S. Vasenkow, J. Kärger, PFG-NMR diffusion studies in polysaccharide gels with and without inner magnetic field gradients, 15th European Experimental NMR Conference (Eenc 2000), University of Leipzig, 2000.
[17] M. Renaud, M. Belgacem, M. Rinaudo, Rheological behaviour of polysaccharide aqueous solutions., Polymer 46 (2005) 12348-12358.
[18] CPKelco, Kelcogel Gellan Gum Book, Atlanta, 2007. [19] M. Mooney, R.H. Ewart, The conicylindrical viscometer, Physics 5
(1934) 5. [20] P. Galvosas, F. Stallmach, G. Seiffert, J. Karger, U. Kaess, G. Majer,
Generation and application of ultra-high-intensity magnetic field gradient pulses for nmr spectroscopy, J. Magn. Reson. 151 (2001) 260-268.
[21] M. Holz, S.R. Heil, A. Sacco, Temperature-dependent self-diffusion coefficients of water and six selected molecular liquids for calibration in accurate H-1 NMR PFG measurements, Phys. Chem. Chem. Phys. (2000) 4740-4742.
[22] D. Modi, M. Johnson, A. Long, C. Rudd, Investigation of pressure profile and flow progression in vacuum infusion process, Rubber Compos. 36 (2007) 101-110.
[23] F. Gerber, M. Krafft, G. Waton, T. Vandamme, Microbubbles with exceptionally long life - synergy between shell and internal phase components, New J. Chem. 30 (2006) 524-527