
Processes that influence the mixed layer deepening during winter in the North Pacific
Upload
independentCategory
view
1download
0
656
Limnol. Oceanogr., 47(3), 2002, 656–671q 2002, by the American Society of Limnology and Oceanography, Inc.
Spatial-temporal variability in surface layer deepening and lateral advection in anembayment of Lake Victoria, East Africa
Sally MacIntyreInstitute for Computational Earth System Science and Marine Science Institute, University of California, Santa Barbara,California 93106-6150
Jose R. RomeroCentre for Water Research, University of Western Australia, Crawley, WA 6009, Australia
George W. KlingDepartment of Ecology and Evolutionary Biology, University of Michigan, Ann Arbor, Michigan 48109-1048
Abstract
Vertical and horizontal exchanges in Pilkington Bay, a shallow (9 m) embayment of Lake Victoria, were determinedfrom a surface energy budget, time series measurements of temperature, and quasi synoptic transects of conductivity,temperature, and depth conducted over a 2-d period. The surface energy budget is the first from a tropical lake overa diurnal timescale. Strong stratification developed during morning and early afternoon (.40 cycles h21) but waseroded beginning in the afternoon by the combination of wind and heat loss. Surface heat losses contributed .70%of the energy for surface layer deepening 82% of the time from midafternoon until midmorning. Circulation times ofthe surface layer were ,2 min as it deepened to 1.5 m in the afternoon and were ,12 min at night even when mixingextended to the lake bottom. Spatial differences in the rates of heating and cooling and in the depth of wind mixingcaused fronts to develop on spatial scales of kilometers within the bay. Convergence of these fronts led to downwellingof surface waters and upwelling of deep waters during the stratified period. Horizontal pressure gradients due todifferential heating contributed to thermocline downwelling, lateral movement of deep, anoxic waters, and generationof high-frequency internal waves, all of which contribute to vertical and horizontal transports. Although wind and heatloss at one location generally determine the depth of the surface layer and thermocline, the depths of these key featuresmay be strongly influenced by rates of heating and cooling elsewhere in a basin.
The temporal and spatial scales of advection and vertical mix-ing determine the flux paths of particles and solutes in aquaticecosystems and, ultimately, lacustrine productivity. Time se-ries measurements of surface meteorology, from which sur-face energy budgets can be calculated, and water column tem-peratures can be used as an indirect approach to determinethese pathways. The data also can be used to determine in-ternal wave dynamics, the energetics of mixing, and the roleof intrusions and density driven flows in advection. With thisinformation, the rates of circulation within the upper mixedlayer and vertical and horizontal transports can be assessed.
The diurnal cycle of stratification and mixing is deter-
AcknowledgmentsThe Fisheries Research Institute in Uganda provided permission,
encouragement, and help in many ways for this research. We thankFred Bugenyi, Rose Mugidde, Moses Magumba, Patricia Ramlal,and the captain and crew of the R/V Ibis for their great support inthe field and in the laboratory. Financial support was provided byNational Science Foundation grants DEB95-53064 to G.W.K.,DEB93-18085 to G.W.K. and S.M. and DEB93-17986, 97-26932,and OCE99-06924 to S.M. and by the Centre for Water Research,University of Western Australia, to J.R. We thank Lorenz Moos-mann for his assistance with data analysis and graphics and JohnMelack, Bob Hecky, Dan Livingstone, Erika McPhee, and BillShaw for critically reading the manuscript. Comments from twoanonymous reviewers were extremely helpful.
mined by the surface energy budget. Imberger (1985) pro-vided the first quantitative description of the surface energyfluxes and their impacts on the upper part of a water columnand the seasonal thermocline. He defined the surface layeras the region of the upper mixed layer directly affected bywind forcing and surface heating. It is actively mixing,whereas the waters below may not be. Additional studies ofthe short-term dynamics of the surface layer of temperatelakes include Ishikawa and Tanaka (1993), MacIntyre (1993,1996, 1998), and Robarts et al. (1998). Oceanographic stud-ies have also elaborated on the strong coupling between sur-face forcing and dynamics of the surface layer, subsurfacelayer, and thermocline (Brainerd and Gregg 1993a,b; Anisand Moum 1994, 1995). Together, these studies have docu-mented the deepening of the surface layer at night from heatloss and wind forcing, the reestablishment of the diurnalthermocline during the day because of solar heating, and thedaytime decay of turbulence within the subsurface layer be-tween the diurnal thermocline and the seasonal thermocline.
In tropical lakes, the upper water column stratifies in theday but becomes nearly isothermal by daybreak (MacIntyreand Melack 1982, 1984, 1988, 1995; Melack 1982; Hare andCarter 1984; Powell et al. 1984). Whether the whole watercolumn mixes depends on lake depth. Typically, wind forc-ing was low at night during these studies, which indicatesthe importance of heat loss to mixed-layer deepening. Di-

657Spatial-temporal variability
urnal studies at Lake Sonachi, Kenya, provided the first de-scriptions of the resistance of the surface layer to wind mix-ing during the day due to strong solar heating and thedeepening of the surface layer at night due to surface cooling(MacIntyre and Melack 1982).
The structure of the upper mixed layer is not determinedby surface forcing at only one site. Studies in small lakesand in the laboratory have demonstrated that horizontal den-sity differences associated with spatial variations in the rateof heating, cooling, and the depth of wind mixing lead tohorizontal overflows and to gravity currents at depth (Im-berger and Parker 1985; Monismith et al. 1990; Coates andFerris 1994; Sturman et al. 1996). Overflows can occur dur-ing wind forcing (Parker and Imberger 1986) and may leadto subtle temperature differences within the mixed layer thatrestrict the depth of surface overturns and prevent full cir-culation (MacIntyre 1998). Consequently, understanding up-per mixed–layer dynamics requires consideration of pro-cesses occurring elsewhere in a lake.
Recent studies have also shown that a one-dimensionalapproach is not sufficient for understanding vertical transportthrough the thermocline. Turbulence at the boundaries oflakes can exceed that in the central portion by up to fourorders of magnitude (Goudsmit et al. 1997; MacIntyre et al.1999; J. Imberger unpubl. data). Intrusions from mixing atthe boundary (Thorpe 1998) or other advective processesserve to redistribute the mixed fluid. Vertical exchanges canalso occur from upwellings or downwellings induced as hor-izontal temperature gradients change sign because of morerapid heating and cooling in nearshore than offshore waters(Farrow and Patterson 1993).
Physical processes affect ecosystem functioning in a va-riety of ways. For instance, the energetics of the surfacelayer are crucial for gas fluxes (Crill et al. 1988), the lighthistory of phytoplankton (MacIntyre 1993, 1998), and re-distributing nutrients throughout the euphotic zone (Mac-Intyre and Melack 1995). Boundary mixing in a large lakehas been shown to supply nutrients to a deep chlorophyllmaximum (MacIntyre et al. 1999) and to reduce nutrientlimitation at the base of the upper mixed layer (MacIntyreand Jellison in press). In a shallow, well-oxygenated basinof Lake Biwa, wave-induced sediment resuspension wasmore important for phosphorus supply than advection froman internal surge or nocturnal cooling (Robarts et al. 1998).James and Barko (1991) and Nepf and Oldham (1997), inshallow embayments, documented differential heating andcooling as the hydrodynamic processes that control the sup-ply of nutrients and toxic substances upward to the surfacelayer or downward to the thermocline and deeper waters.
A wide variety of physical processes co-occur in lakesand interact in ways that presently cannot necessarily be pre-dicted. Differential heating and cooling and wind mixing areparticularly likely to occur in lakes with complex geometriesbut have not been examined on a basin scale. To develop anunderstanding of the flow paths that occur in a tropical lakewith complex morphometry, we undertook a study of Pilk-ington Bay, a shallow, eutrophic embayment in northwesternLake Victoria, East Africa. This 44 km2 bay is similar to amoderately sized lake. It has a complex geometry, ratherthan a spherical one, and, hence, is more likely to be strongly
influenced by differences in rates of heating, cooling, anddepth of wind mixing than a lake with a simple shape. Lakeswith complex geometry are ubiquitous. For instance, theAmazon basin, one of the largest lake districts in the world,is replete with lakes of complex geometries (Sippel et al.1992). Hence, Pilkington Bay is illustrative of a large classof lakes worldwide. Because of its connection with otherembayments and channels, an understanding of the exchangethrough these connections will have applications to otherlakes with connections to either coastal waters, another lake,or a riverine system. In addition, Pilkington Bay’s geometryis similar to that of bays found inshore throughout LakeVictoria. Thus, we anticipated that this study would likelylead to an understanding of the flows from inshore to off-shore waters that have contributed to the eutrophication ofLake Victoria.
In the following, we describe the spatial and temporal var-iations in thermal structure of Pilkington Bay with time-se-ries measurements of temperature at a central station, quasisynoptic north-south and east-west transects across the baywith conductivity-temperature-depth (CTD) profiling, andsurface meteorology over two diel cycles. Data were col-lected during periods of strong heating, cooling, and windforcing. We quantify the surface energy budget and use it todetermine whether wind forcing or buoyancy forcing due toheat losses drives mixed-layer deepening and rates of mixingin the upper water column. We use CTD transects to illus-trate the frontal structures that develop on kilometer scalesbecause of different rates of heating and cooling and depthsof wind mixing. We assess the resulting vertical transportsand horizontal advection and provide evidence for intrusionsfrom outside the Bay. We show that horizontal inflows caninfluence the depth of the surface layer and cause thermo-cline tilting and subsequent generation of high frequencywaves. We calculate the likelihood of localized mixing at theboundaries of the bay due to these waves. With these variousmeasurements, we illustrate the processes that regulate trans-port of particles, solutes, and gases and the resulting flowpaths in a moderately sized water body.
Study site—Lake Victoria (Fig. 1), the second largestfreshwater lake in the world in terms of surface area(;68,800 km2), has changed substantially over the past 40yr because of the effects of cultural eutrophication (Bootsmaand Hecky 1993; Hecky 1993) and introduced predatory fish(Kaufman 1992, 1993). Pilkington Bay (008179N, 338209E)lies between the two arms of Buvuma Island near the outflowof the Nile River from Lake Victoria. The bay has a surfacearea of ;40 km2 and an average depth of ;4.5 m. LingiraIsland splits the bay opening into two channels; the deeper(.10 m) northern channel connects to Buvuma Channel andthe shallower (8 m) eastern channel connects to HanningtonBay. A 16-m ‘‘hole’’ at the western boundary of the northernchannel opening is the deepest point in the bay. The bay isclover-leafed in shape, with three lobes. The western andsouthern lobes have greater areas than the eastern lobe. Thecentral bay varies in depth from 6 to 10 m. Papyrus fringesmuch of the shoreline along the southern and western lobes.

658 MacIntyre et al.
Fig. 1. Locator map for Lake Victoria and Buvuma Island, detail map of northern end of LakeVictoria showing Pilkington Bay in Buvuma Island, and bathymetry of Pilkington Bay with contoursat 2-m intervals. North-south and east-west CTD transects with Sta. EW0, EW8, NS14, NS8, NS3,and NS0 labeled. The cross (1) in the middle of the bay is the location of the limnological samplingand meteorological stations on the R/V Ibis. T is the location of the thermistor chain near theintersection of the two transects. Lingira Island bisects the bay opening to the north into northernand southern entrances connecting to Buvuma Channel and Hannington Bay, respectively.
Methods
Bathymetry—The bathymetry of Pilkington Bay was de-rived from depth soundings within the bay, the bay entrance,and near-entrance regions of Buvuma channel on several oc-casions from 1994 to 1996. Accuracy is 60.3 m.
Transects—The Pilkington Bay field study was conductedover 51 h from 1115 h on 24 April to 1450 h on 26 April1996 (Table 1). The thermistor chain and meteorological in-strumentation were moored near the center of the bay (Fig.1). Eleven north-south and eight east-west transects weremade during the study (Table 1). The stations along thenorth-south transect were ;1 km apart in the bay and chan-nel but had 0.5 km spacing across the bay entrance (Sta.NS3–NS7) and the southern portion of the transect (Sta.NS12–NS14). The stations along the east-west transect werespaced 1 km apart except at the western margin, where EW8was 0.5 km from EW7. At each station a CTD profile wastaken, and during daylight a Secchi depth was measured. Theeast-west transect had a total of 9 stations, and the north-south transect had 15.
Vertical profiles of pressure, temperature (8C), and con-ductivity (mS cm21) were made with a CTD profiler (Sea-Bird SBE19, Seacat) at each transect station. The CTD sam-ples at 2 Hz and was lowered at a descent rate of ;50 cms21. CTD sampling was quasi synoptic, because the north-south and east-west transects were performed in ;1 hr and;45 min, respectively. Density was calculated by use of theinternational equation of state (IES) for seawater (Milleroand Poisson 1981). Results were verified against an approachthat used partial molal volumes (Kling et al. 1989) and
against the method of Chen and Millero (1977), which wasdesigned for freshwater. Differences between approacheswere small; ;8 3 1026 g cm23 between IES and Chen andMillero and ;5 3 1025 g cm23 between IES and the partialmolal volume approach. These results indicate that the con-tribution of dissolved salts to density is minor. The stabilityof the water column is calculated as the buoyancy frequency,N 5 (g/r dr/dz)1/2 where g is gravity and r is density.
Time-series temperature measurements—Sixteen self-contained temperature loggers (WaDaR, Model TL; TSKA)were deployed at the intersection of the two transects (Fig.1B). The surface thermistors were deployed at 0.1 and 0.5m and, thereafter, at 0.5-m intervals to a depth of 5.5 m. Thedepth at the station was ;8 m, so the bottom two thermistorswere deployed at 6.5 and 7.5 m. The thermistors are accurateto 0.018C, have a resolution of 0.00148C, and have a re-sponse time (67% of a step change in temperature) of ;3min. The sensors were sampled every 30 s. Isotherm depthswere calculated from linear interpolation between the depthsof the WaDaRs. All WaDaR sampling times were synchro-nized. Spectra of isotherm displacements were computed byuse of a Hanning window with 75% overlap of windows andlinear detrending. Differences in location and magnitude ofspectral peaks were subtle based on comparisons betweendetrending using the mean or linearization; 80% confidenceintervals were computed, and a sliding window size wasused to increase resolution at high frequencies.
Current measurements—Drogue measurements weremade on two occasions near the thermistor chain. Thedrogues were constructed from canvas fastened to a PVC

659Spatial-temporal variability
Table 1. Sampling times, locations, and weather conditions.
Time (h) Station(s) Type
24 Apr 199611151125–12341300–13421540–16401700–17351935–2035
2050–21252250–2320
TNorth → southEast → westNorth → southEast → westNorth → south
East → west
Thermistor chain recordingNS transect hot and calmEW transect 1, hot and calmNS transect 2, SE wind in N, calm S of midbayEW transect 2, hot and calmNS transect 3, waves 20 cm in channel, 10 cm near
bay entrance, calm in shallowsEW transect 3, calmThunderstorm, high winds
25 Apr 19960055–01510210–02470630–07000740–0845
0907–09421138–1243
1300–13371550–1654
1937–20302046–2117
North → southEast → west
North → south
East → westNorth → south
East → westNorth → southBNorth → southEast → west
NS transect 4, calm and light drizzleEW transect 4, calm and light drizzleHigh windsNS transect 5, waves 15–20 cm in channel to calm
in shallowsEW transect 5, calmNS transect 6, calm in channel to 5-cm waves in
shallowsEW transect 6, 10-cm wavesNS transect 7, 5–10 cm waves, calmer in shallowsDrogue measurements, no EW transect 7NS transect 8, 15-cm swell in channel, calm in bayEW transect 8, calm
26 Apr 19960007–00570113–01440300–04300937–1035
1100–11351353–1450
North → southEast → west
North → south
BSouth → north
NS transect 9, 15-cm swell in channel, calm in bayEW transect 9, calmBiggest wind stormNS transect 10, 20-cm swell in channel, 5–10-cm
waves in bay, calm in shallowsDrogue measurementsNS transect 11, 5-cm waves in shallows, 10–20-cm
in channel
pipe frame. The drogues had four panels radiating perpen-dicularly from the center axis. Two drogue sizes were de-ployed: 0.3 3 0.45 and 0.6 3 0.75 m, for near-surface andmiddepth current measurements, respectively. A buoy wasdeployed at the starting location, and then the drogues werereleased. After 10–20 min, the distance from the buoy to thedrogue was measured with a marked line and the currentdirection estimated with a compass. The current velocity wasestimated as the travel distance divided by the time of de-ployment.
Surface meteorology—The meteorological station wasmounted on the R/V Ibis at a height of ;5.0–5.5 m abovethe water surface. The R/V Ibis was moored ;1 km southof the intersection of the two transects (Fig. 1). Relativehumidity, wind speed, shortwave radiation, air temperature,and rain were measured, but unfortunately the wind-directionvane did not function. Data were collected every 5 s andaveraged over 5-min periods. Profiles of photosyntheticallyactive radiation (PAR) at 0.5-m intervals were measured atthe R/V Ibis with a Li-Cor meter and a 2p sensor. PARextinction coefficients h were calculated with Beer’s Law.The regression between Secchi depths and PAR extinction
coefficients from Lake Victoria during 1994–1996 yieldedthe relation h 5 1.13 z , r2 5 0.82, n 5 43, where h has20.82
secchi
units m21 and secchi depth is in meters.
Surface energy fluxes—Estimates of the momentum, sen-sible heat, and latent heat fluxes were made with the bulkaerodynamic formulas, t 5 rACDU , H 5 rACPaCHUZ(TS 22
Z
TZ), and E 5 rALVCEUZ(qS 2 qZ), where t is the shear stressof the air at the surface interface (N m22), rA is the densityof the air at the air-water interface (kg m23), CD is the dragcoefficient, UZ is the wind speed at height z above the watersurface (m s21), H is the sensible heat transfer (W m22), CPa
and CPw are the specific heat of air and water (J kg21 8C21),CH is sensible heat transfer coefficient, TS is the water sur-face temperature (8C), TZ is the air temperature (8C) at heightz, E is the latent heat transfer (W m22), LV is the latent heatof vaporization (J kg21), CE is the latent heat transfer coef-ficient, qS is the specific humidity at saturation pressure atTS, and qZ is the specific humidity of the air at z. UZ wasmeasured ;5.5 m above the water surface; T and relativehumidity (RH, %) were measured ;5 m above the watersurface.
At diel time scales, the thermal inertia of the water is too

660 MacIntyre et al.
great to use constant values of the mass-transfer coefficients(CD, CH, and CE), and atmospheric stability must be includ-ed. Following the method of Monin and Obukhov (1954),we parameterized the nondimensional gradients of wind, po-tential energy, and specific humidity in terms of the stabilityparameter zL21, where
32r u*TA VL 5H T Ezkg 1 0.611 2C LPa V
L is the estimate of the Monin and Obukhov length scale(m), g is the gravitational acceleration (m s22), TV is thevirtual air temperature (5TZ[1 1 0.61qZ ], 8K), k is thevon Karman constant (5 0.4), and air shear velocity u*5 (t/ra)0.5 5 (CDU )0.5.2
Z
Neutral values of the transfer coefficients at 10 m are CDN
(1.0 3 1023), CHN (1.35 3 1023), and CEN (1.35 3 1023)(Hicks 1972, 1975; Pond et al. 1974; Rayner 1981), whichneed to be adjusted for measurement height. We adjustedCDN to 5.5 m following the method of Amorocho andDeVries (1980). Neutral transfer coefficients corrected formeasurement height were 1.1 3 1023 for CDN and 1.54 31023 for CEN and CHN.
The iterative approach suggested by Hicks (1975) wasused to estimate transfer coefficients corrected for atmo-spheric stability. Initially, neutral values of the transfer co-efficients (CDN, CEN, and CHN) were used to calculate neutralfluxes. From these results, transfer coefficients were obtainedfrom the similarity functions of Paulson (1970) for both theunstable (zL21 , 0) and stable cases (zL21 . 0). Four iter-ations were the maximum required for L to converge within0.001% of the previous L. A cutoff of zzL21z , 15 was im-posed during the computation of the stability parameter;hence, the smallest values of L were ;0.4 m. This arbitrarycutoff follows bounds set by Imberger and Patterson (1990).
Incoming and emitted longwave radiation were calculatedseparately prior to determining net longwave radiation. For-mulations of net longwave radiation are based on either airor surface water temperature and cloud cover (Henderson-Sellers 1986). Emitted longwave radiation was calculated asLWOut 5 «wsT , where «w is the emissivity of water (0.97 64
s
0.005) (Anderson 1954), s is the Stefan-Boltzman constant(55.67 3 1028 W 8K24 m22), and Ts is the surface watertemperature (8K). Incoming longwave radiation was calcu-lated under the assumption that the emissivity of air, «a, isgiven by a formula for cloudless conditions and a simplemultiplicative factor of (1 1 k1C2) accounts for the fractionof cloud cover, C, where k1 is a constant equal to 0.17.Hence, incoming longwave radiation was calculated as LWIn
5 «asT (1 1 k1C2), where the emissivity of air, «a, was cal-4a
culated as «a 5 0.642(ea/Ta)1/7, where ea is the vapor pressureof the air (Pa) and Ta is the air temperature (8K), a formu-lation based on theoretical considerations (Brutsaert 1982).Cloud cover observations were made throughout the studyand served as inputs to calculate longwave radiation. Thenet surface heat flux (S, W m22), omitting short wave radi-ation, is thus S 5 LWin 2 LWout 1 E 1 H.
Surface heat and buoyancy fluxes—The diurnal mixed-layer dynamics were evaluated by use of the methods ofImberger (1985). To determine whether the surface layer wasgaining or losing heat, we calculated the effective surfaceheat flux, H* (W m22), defined as
02H* 5 S 1 q(0) 1 q(h) 2 q(z) dzEh h
where S 5 r0CPw^w9T9(0)& is the surface heat flux, h is thedepth of the surface layer (m), q(0) is the shortwave radia-tion at the surface (W m22), and q(h) is the shortwave ra-diation at the bottom of the surface layer (W m22) (Kim1976). The surface layer depth was defined as the first depthwhere the temperature difference was .0.028C relative tothe surface temperature located at 0.1 m. The penetration ofradiation into the water column was parameterized withBeer’s Law by use of seven-wavelength bands (Jellison andMelack 1993). Angle of refraction was included in the cal-culation.
The buoyancy flux, B (m2 s23), is defined as B 5 gaH*/(CPwr0), where the thermal expansion coefficient, a, in therange 208C–308C can be estimated from a 5 1.6 3 1025 19.6 3 1026 T, where T is in 8C. The penetrative convectionvelocity, w*, was calculated as w* 5 (Bh)1/3 (Deardoff 1970).The surface water shear velocity was calculated as u*w 5(t/r0)0.5, where r0 is the density of water. The relation isbased on the equality of shear on both sides of the air-waterinterface. The mechanical energy introduced at the watersurface was derived from the work done by pressure fluc-tuations, the shear production in the wind surface layer, andfrom surface cooling. Kim (1976) showed that the energyflux Fq derived from these sources can be parameterized asFq 5 0.5(w 1 C u ), where CN 5 1.33 (Rayner 1981).3 3 3* *N w
Results
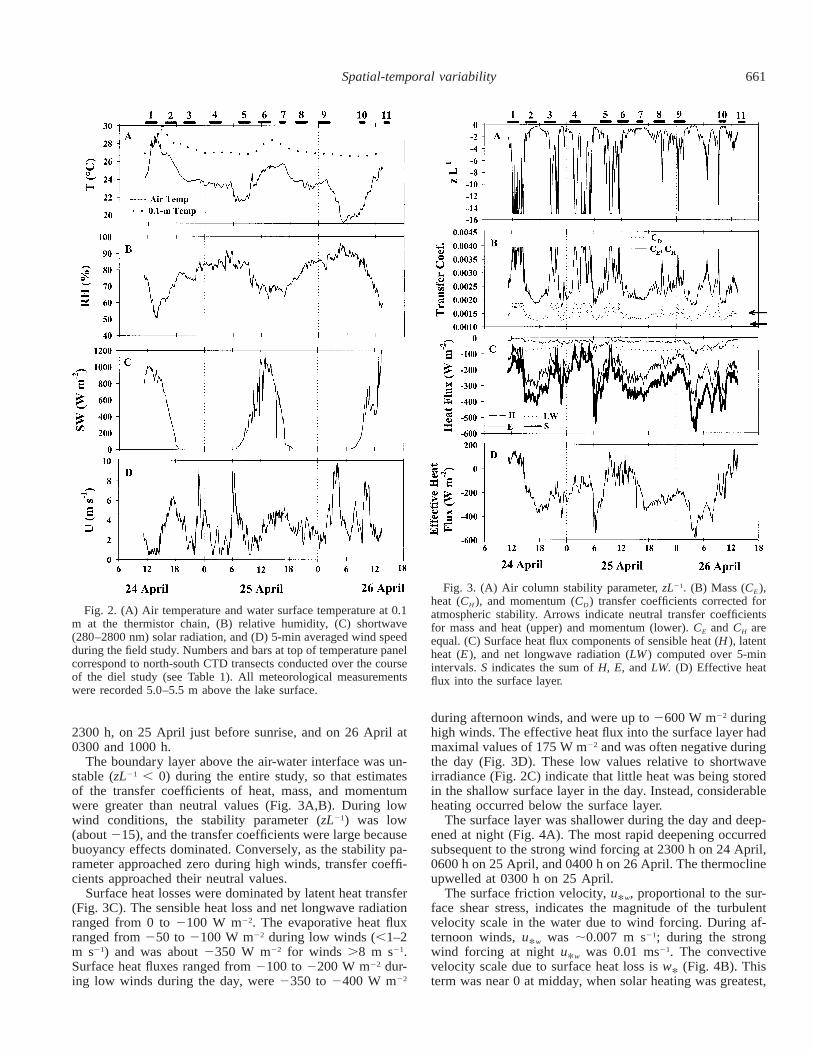
Meteorological forcing at the central bay station—Marked diel patterns were observed in air temperature, rel-ative humidity, and shortwave radiation at the central baystation (Fig. 2). Except for a brief period in the early after-noon at the beginning of the study, air temperatures weregenerally .28C cooler than the surface waters at the midbaystation and throughout the bay. Consequently, the boundarylayer above the air-water interface was unstable. Maximumair temperatures were several degrees warmer on 24 Aprilthan the other two days, and minimum air temperatures werecooler on 26 April than on 24 or 25 April. Relative humiditywas least in late morning and during the afternoon and was.75% at other times. Shortwave radiation (280–2800 nm)peaked between 1000 and 1200 W m22. Fluctuations in ir-radiance indicated cloud cover, with greater coverage in themorning. A large fraction of the sky was covered with cloudsfrom 0000–1200 h on 25 April and 0200–1300 h on 26 April(not shown).
On both 24 and 25 April, a land breeze generated mod-erate winds in the afternoon that persisted for at least 4 h(Fig. 2D). Relatively calm conditions with wind speeds ,4m s21 bracketed both of these diurnal wind events. Windswere .8 m s21 for up to 1.5 h on 24 April, beginning at
661Spatial-temporal variability
Fig. 2. (A) Air temperature and water surface temperature at 0.1m at the thermistor chain, (B) relative humidity, (C) shortwave(280–2800 nm) solar radiation, and (D) 5-min averaged wind speedduring the field study. Numbers and bars at top of temperature panelcorrespond to north-south CTD transects conducted over the courseof the diel study (see Table 1). All meteorological measurementswere recorded 5.0–5.5 m above the lake surface.
Fig. 3. (A) Air column stability parameter, zL21. (B) Mass (CE),heat (CH), and momentum (CD) transfer coefficients corrected foratmospheric stability. Arrows indicate neutral transfer coefficientsfor mass and heat (upper) and momentum (lower). CE and CH areequal. (C) Surface heat flux components of sensible heat (H), latentheat (E ), and net longwave radiation (LW ) computed over 5-minintervals. S indicates the sum of H, E, and LW. (D) Effective heatflux into the surface layer.
2300 h, on 25 April just before sunrise, and on 26 April at0300 and 1000 h.
The boundary layer above the air-water interface was un-stable (zL21 , 0) during the entire study, so that estimatesof the transfer coefficients of heat, mass, and momentumwere greater than neutral values (Fig. 3A,B). During lowwind conditions, the stability parameter (zL21) was low(about 215), and the transfer coefficients were large becausebuoyancy effects dominated. Conversely, as the stability pa-rameter approached zero during high winds, transfer coeffi-cients approached their neutral values.
Surface heat losses were dominated by latent heat transfer(Fig. 3C). The sensible heat loss and net longwave radiationranged from 0 to 2100 W m22. The evaporative heat fluxranged from 250 to 2100 W m22 during low winds (,1–2m s21) and was about 2350 W m22 for winds .8 m s21.Surface heat fluxes ranged from 2100 to 2200 W m22 dur-ing low winds during the day, were 2350 to 2400 W m22
during afternoon winds, and were up to 2600 W m22 duringhigh winds. The effective heat flux into the surface layer hadmaximal values of 175 W m22 and was often negative duringthe day (Fig. 3D). These low values relative to shortwaveirradiance (Fig. 2C) indicate that little heat was being storedin the shallow surface layer in the day. Instead, considerableheating occurred below the surface layer.
The surface layer was shallower during the day and deep-ened at night (Fig. 4A). The most rapid deepening occurredsubsequent to the strong wind forcing at 2300 h on 24 April,0600 h on 25 April, and 0400 h on 26 April. The thermoclineupwelled at 0300 h on 25 April.
The surface friction velocity, u*w, proportional to the sur-face shear stress, indicates the magnitude of the turbulentvelocity scale in the water due to wind forcing. During af-ternoon winds, u*w was ;0.007 m s21; during the strongwind forcing at night u*w was 0.01 ms21. The convectivevelocity scale due to surface heat loss is w* (Fig. 4B). Thisterm was near 0 at midday, when solar heating was greatest,

662 MacIntyre et al.
Fig. 4. (A) Depth of the surface layer (h), (B) convective (w*)and shear (u*w) velocity scales, (C) mechanical energy flux (Fq) andthe fraction of Fq derived from the buoyancy flux (0.5 w : Fq), and3*(D) convective (h/w*) and shear (h/u*) timescales of vertical mix-ing within the surface layer.
Fig. 5. u*w and w* (upper panel) showing increase in w* as windsincrease in afternoon and isotherms (lower panel) showing thatstratification was initially to the surface and formation of a surfacelayer and diurnal thermocline as u*w and w* increased; 1100 to2400 h on 24 April 1996. For temperatures .288C, isotherms every0.58C; for lower temperatures isotherms every 0.18C.
Fig. 6. As for Fig. 5 but for 2200 h on 24 April–1000 h on 25April. The thermocline downwelled after strong wind forcing butremained downwelled and compressed when winds dropped. High-frequency waves (↑) occurred with decreases in u*.
and began to increase by midafternoon as evaporation in-creased and shortwave radiation decreased. w* was maximalduring periods of high wind forcing at night and was $u*w
from late afternoon until early morning.The total turbulent energy flux into the surface layer, Fq,
incorporates the energy due to the wind as well as the con-tribution from the surface heat flux (Fig. 4C). This term hasits maximum values during periods with strong wind forcingwhen shortwave energy is low. Except during periods withhigh inputs of short wave energy or periods with high winds,buoyancy flux dominates the surface energy fluxes (Fig. 4C).
Time scales to mix the surface layer were most rapid dur-ing the day, when it was shallow (Fig. 4D). However, atnight, the time scale for penetrative convection was nearlyalways ,10 min, whereas that for wind stirring was gener-ally longer and was sometimes .1 h.
Temperature time series at the central bay station—Thediurnal cycle of heating and cooling and the effects of windforcing on stratification are illustrated in Figs. 5–7. Strongdiurnal heating, with surface temperatures reaching 308C(Fig. 5), occurred on 24 April. The buoyancy frequency,which indicates the strength of stratification, was 49 cyclesper hour (cph) in the upper half meter. This value is well in
excess of 20 cph, a value indicative of strongly stratifiedoceanic waters, and is comparable to values observed in theseasonal pycnocline in dimictic lakes. After afternoon windsbegan and u*w and w* increased, the uppermost part of thewater column began to lose heat and a diurnal thermoclineformed with N decreasing to 25 cph. The thermocline down-welled until 1830 h and then upwelled, with the upwellingindependent of surface forcing. During the upwelling, coolwaters (26.48C) flowed into the sampling region.

663Spatial-temporal variability
Fig. 7. As for Fig. 5 but for 1100–2400 h 25 April. Upwellingbegan at 1800 h independently of wind forcing, and high-frequencywaves were generated after the downwelling at 1930 h.
Fig. 8. Power spectrum of 26.68C isotherm for period 2336 h on24 April–0442 h on 26 April. The line in the upper right has a slopeof 22, as is typical for oceanic waters and large lakes; 80% con-fidence intervals are indicated by stepped lines at the bottom of thefigure. The length of Hanning windows decreased as frequency in-creases (2048, 1024, 512, and 256) to improve confidence. Thedotted vertical line indicates buoyancy frequency at the depth ofthe isotherm.
Wind forcing reached 8 m s21 twice during the periodillustrated in Fig. 6, and u*w reached 0.01 ms21. The ther-mocline downwelled after the initial forcing event but re-mained compressed despite low u*w. High-frequency wavepackets occurred in the thermocline coincidentally with low-est u*w (Fig. 6, first two arrows). The thermocline graduallyupwelled from 0400 to 0600 h, but wind forcing at 0630 hcaused another slight downwelling. High-frequency waveswere generated during relaxation from the second wind event(Fig. 6, third arrow). Maximum buoyancy frequencies in thethermocline during the night ranged from 11 to 17 cph.
Surface temperatures only reached 28.48C on 25 April(Fig. 7). The morning was cloudy and windy, and develop-ment of thermal stratification was delayed until w* droppedto 0 at 0920 h (Fig. 6). The stratification in the upper watercolumn was weaker than during the previous day, becausewinds and intermittent cloud cover led to occasional heatlosses from the upper water column during the morning heat-ing period (Fig. 3C, 3D, 4B). The surface layer and diurnalthermocline began to form at 1230 h as u*w reached 0.5 cms21. The diurnal thermocline had a maximum buoyancy fre-quency of 46 cph at 1430 h. It progressively deepened duringthe afternoon, and maximal values of N decreased to 11 cph.Small-amplitude, high-frequency waves occurred frequently,likely because of gusts of wind. Movements of the 26.88Cand 26.78C isotherms were out of phase from late morninguntil 1700 h. As will be discussed later, the separations arelikely due to inflows from intrusions. Independently of windspeed, the thermocline upwelled at 1800 h and downwelledat 2000 h. After downwelling, a packet of waves wasspawned with 1-m amplitude and periods ,1 h. The ther-mocline continued to deepen after midnight, and by 0500 hthe water column was isothermal (not shown).
Thermocline upwelling and downwelling was associatedwith inflows of cool water at depth. Cold inflows occurredat 1800 h on April 24 as the thermocline upwelled (Fig. 5),a warm inflow occurred at 1000 h on 25 April as the ther-
mocline upwelled (not shown), and a cold inflow occurredat 2230 h on April 25 as the thermocline downwelled (Fig.7).
Phase speeds of the first two vertical wave modes werecalculated following the method of Monismith (1985, 1986,1987), by use of profiles of buoyancy frequency over thediurnal cycle as input (not shown). Seiche periods were cal-culated as two times the length of the basin divided by phasespeed. Because the shortest period of these calculated inter-nal wave modes is ;1.5 d, wind forcing and nocturnal cool-ing would have disrupted basin scale modes before a cyclewas completed. Consequently, the thermocline will not fullyup or downwell because of wind forcing. Only higher har-monics of these waves and progressive waves are possible.
The power spectrum had a slope of 22 (Fig. 8) as hasbeen observed in the ocean and other lakes (Saggio and Im-berger 1998). Waves generated after the thermocline up-welled on 24 April had frequencies ranging from 0.36 to 0.9cph (Fig. 5, 26.58C and 26.68C isotherms). Waves with fre-quencies between 0.3 and 12 cph were generated in the ther-mocline after midnight on 25 April (Fig. 6), and waves withfrequencies between 1.5 and 3 cph were observed subse-quent to thermocline downwelling (Fig. 7). Waves with afrequency between 2.2 and 9 cph were ubiquitous and ap-peared immediately after gusts of wind. Although there wereno significant peaks in the spectrum, the data show the im-portance of changes in wind forcing and, as to be discussedlater, the movement of water masses, for generating wavesat moderate to high frequencies in the embayment.
Secchi depths—Large differences in Secchi depth occurwithin Pilkington Bay (Fig. 9). The waters were most turbid

664 MacIntyre et al.
Fig. 9. Secchi depths increase (A) from south to north and (B)from east to west. Thick lines indicate depth of bottom.
at the southern end of the bay where the Secchi depth was0.6 m. From NS7 into Buvuma Channel, the Secchi depthswere between 1 and 1.1 m. In consequence, greater heatingis expected in the most inshore southern portion of the baythan elsewhere, with rates of heating decreasing to the north.Similarly, a gradient in Secchi depths was measured alongthe east-west transect; Secchi depths increased from 0.7 min the east to 1 m in the west. Hence, rates of heating in thevery surface waters would be expected to be higher in theeast.
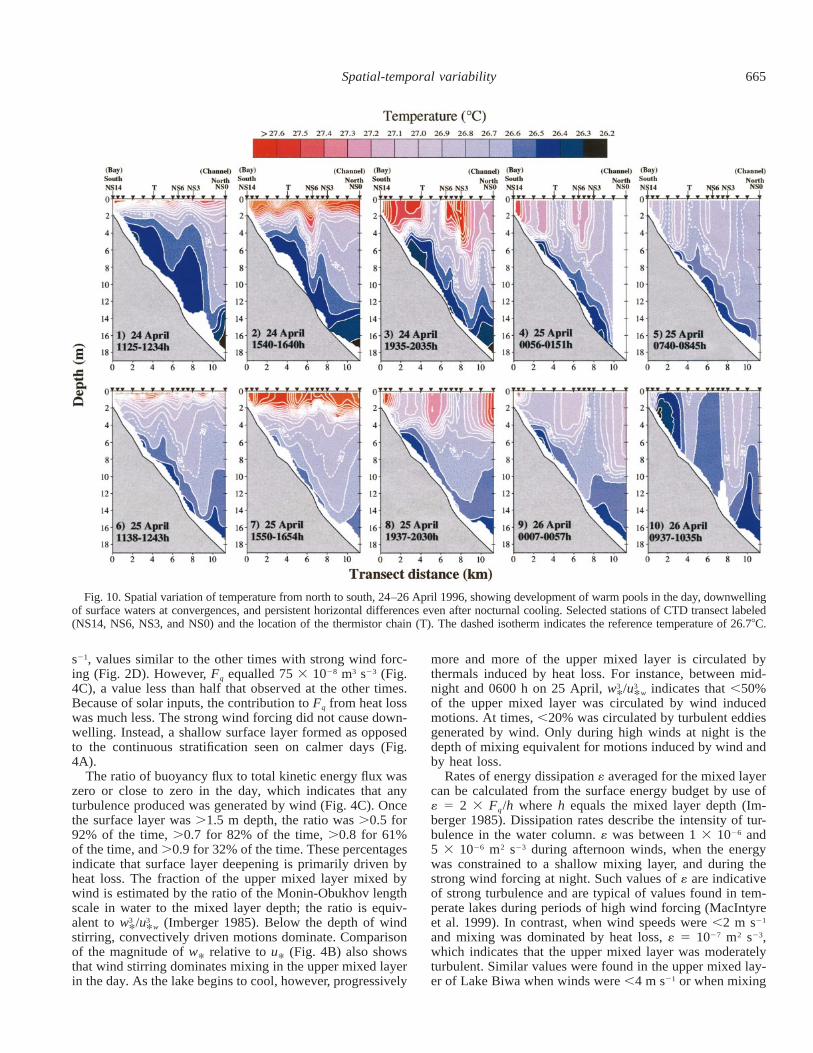
Temperature transects—Upwelling, downwelling, andthermal fronts on horizontal scales of kilometers were doc-umented by our CTD profiling (Figs. 10, 11). The most pro-nounced features on the north-south transect on 24 Aprilincluded the downwelling of warm water at the mouth ofthe constriction between Pilkington Bay and Buvuma Chan-nel (Fig. 10, transect 2), upwelling within Pilkington Bayjust south of the upwelling (Fig. 10, transects 3 and 4), thedevelopment of pools of warm water on both sides of theupwelling, and the persistence of these warmer regions evenduring nocturnal cooling (Fig. 10, transects 3–5). Cool water(26.48C) had moved to the thermistor station by transect 3.On 25 April, the entire water column was stratified in thelate morning transect, a diurnal thermocline formed by mid-afternoon whose depth varied spatially. Below the diurnalthermocline, the 26.78C isotherm rose and the 26.68C iso-therm was depressed between transects 7 and 8. Thesechanges indicate an inflow of water with intermediate tem-peratures. By early evening, the thermocline was deeper,and, again, there were three pools of warmer water. Thedepth of strongest temperature gradient varied spatially. By
early morning of 26 April, temperature stratification hadweakened but the horizontal gradients in temperature hadpersisted throughout the night.
Occasionally, pockets of colder water would occur midbaynear the bottom. Examples include the 26.58C water at Sta.9 and 10 on transect 3, the increased volume of cool waterat Sta. 10 on transect 8, and the water 26.58C and colder atSta. 10 on transect 9 and at Sta. 11 on transect 10. Watercooler than 26.48C was generally anoxic.
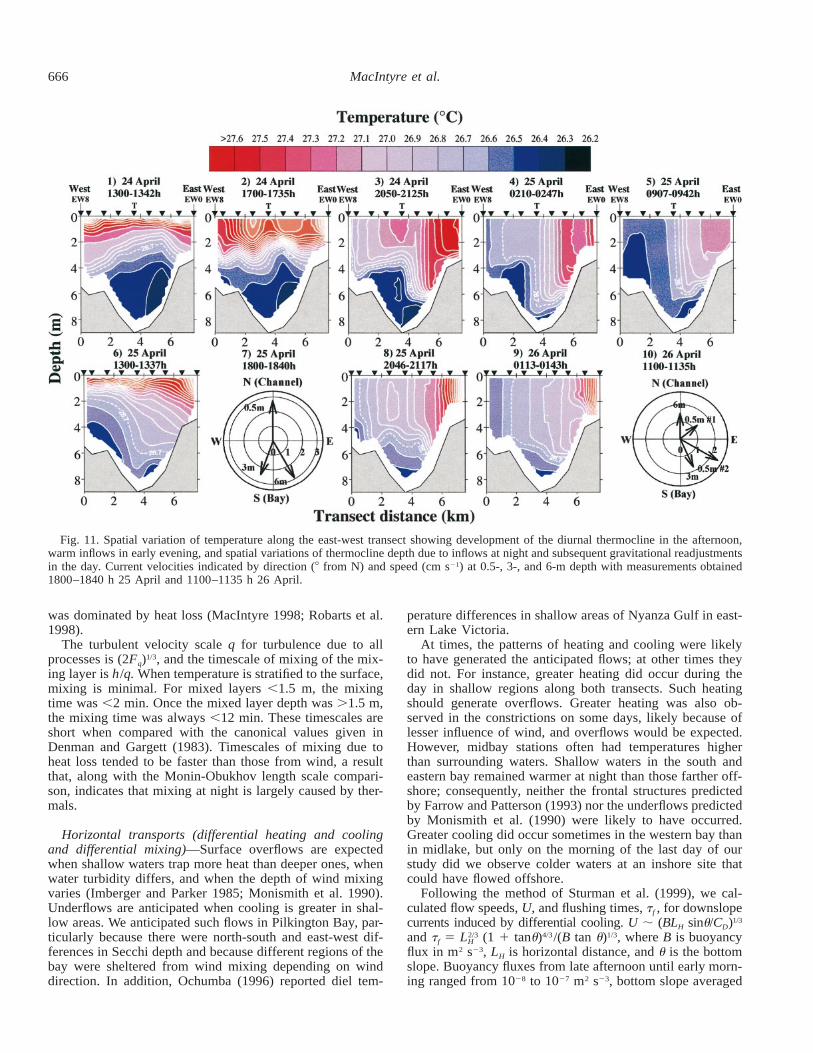
The dynamics of the east-west transect are similar, withstratification to the surface until early afternoon, the for-mation of a diurnal thermocline evident by late afternoon,and spatial variation in surface temperatures (Fig. 11). Sur-face temperatures were warmest to the east, and the depthof warmer water was greater there. On the initial transectson 24 April, the coldest bottom water was found on the eastside of the basin. Cool water was found progressively fartherwest from the afternoon of 24 April until midmorning 25April. This westward movement occurred coincidentallywith thermocline deepening in the east.
Intrusions of warmer or colder water were noted on sev-eral transects. A cold water intrusion was found at 5 m ontransect 3, and warm water intrusions occurred between 1and 4 m at EW5 on transect 8, between 1 and 4 m betweenEW3 and EW4 on transect 9, and between 3 and 4 m depthbetween EW1 and EW2 on transect 9.
Discussion
Diel cycles of stratification and mixing—Pilkington Bayundergoes a diel cycle of stratification and mixing, as hasbeen observed in other tropical lakes (Talling and Lemoalle1998). Factors that influence the depth of the surface layercan be understood from the surface energy budget. The wa-ter column is stratified to the surface or has only a thinsurface layer when Fq is least; that is, when there is no cool-ing (w* 5 0) and no wind forcing (Fig. 4A,C). The surfacelayer deepens as Fq increases with the most rapid deepeningfor the largest Fq. Because Fq is based on the cube of bothu*w and w*, examination of those individual terms allowsassessment of the contribution of wind forcing and coolingto surface layer deepening at different times of day. Exam-ination of the temperature record (not shown) shows thatsurface cooling began at 1430 h on 24 April, when w* firstexceeded 0 (Fig. 5). Consequently, surface layer deepeningrequires that surface heat losses exceed inputs from short-wave radiation. In Pilkington Bay, evaporation causes thegreatest heat loss (Fig. 3C). Hence, wind contributes to sur-face layer deepening not only through direct production ofturbulence but also by making the greatest contribution toheat losses at the air-water interface.
Wind also causes the thermocline to tilt, with downwellingat the downwind end of a lake. On occasion, upwelling oc-curred independently of wind speed and downwelling wasmaintained in the absence of wind speed. At these times,processes besides wind and heat loss contributed to ther-mocline depth. We will discuss this topic in a later section.
Strong wind forcing does not always lead to thermoclinetilting. Wind speeds at ;1000 h on 26 April reached 8 m
665Spatial-temporal variability
Fig. 10. Spatial variation of temperature from north to south, 24–26 April 1996, showing development of warm pools in the day, downwellingof surface waters at convergences, and persistent horizontal differences even after nocturnal cooling. Selected stations of CTD transect labeled(NS14, NS6, NS3, and NS0) and the location of the thermistor chain (T). The dashed isotherm indicates the reference temperature of 26.78C.
s21, values similar to the other times with strong wind forc-ing (Fig. 2D). However, Fq equalled 75 3 1028 m3 s23 (Fig.4C), a value less than half that observed at the other times.Because of solar inputs, the contribution to Fq from heat losswas much less. The strong wind forcing did not cause down-welling. Instead, a shallow surface layer formed as opposedto the continuous stratification seen on calmer days (Fig.4A).
The ratio of buoyancy flux to total kinetic energy flux waszero or close to zero in the day, which indicates that anyturbulence produced was generated by wind (Fig. 4C). Oncethe surface layer was .1.5 m depth, the ratio was .0.5 for92% of the time, .0.7 for 82% of the time, .0.8 for 61%of the time, and .0.9 for 32% of the time. These percentagesindicate that surface layer deepening is primarily driven byheat loss. The fraction of the upper mixed layer mixed bywind is estimated by the ratio of the Monin-Obukhov lengthscale in water to the mixed layer depth; the ratio is equiv-alent to w /u (Imberger 1985). Below the depth of wind3 3* *w
stirring, convectively driven motions dominate. Comparisonof the magnitude of w* relative to u* (Fig. 4B) also showsthat wind stirring dominates mixing in the upper mixed layerin the day. As the lake begins to cool, however, progressively
more and more of the upper mixed layer is circulated bythermals induced by heat loss. For instance, between mid-night and 0600 h on 25 April, w /u indicates that ,50%3 3* *w
of the upper mixed layer was circulated by wind inducedmotions. At times, ,20% was circulated by turbulent eddiesgenerated by wind. Only during high winds at night is thedepth of mixing equivalent for motions induced by wind andby heat loss.
Rates of energy dissipation « averaged for the mixed layercan be calculated from the surface energy budget by use of« 5 2 3 Fq/h where h equals the mixed layer depth (Im-berger 1985). Dissipation rates describe the intensity of tur-bulence in the water column. « was between 1 3 1026 and5 3 1026 m2 s23 during afternoon winds, when the energywas constrained to a shallow mixing layer, and during thestrong wind forcing at night. Such values of « are indicativeof strong turbulence and are typical of values found in tem-perate lakes during periods of high wind forcing (MacIntyreet al. 1999). In contrast, when wind speeds were ,2 m s21
and mixing was dominated by heat loss, « 5 1027 m2 s23,which indicates that the upper mixed layer was moderatelyturbulent. Similar values were found in the upper mixed lay-er of Lake Biwa when winds were ,4 m s21 or when mixing
666 MacIntyre et al.
Fig. 11. Spatial variation of temperature along the east-west transect showing development of the diurnal thermocline in the afternoon,warm inflows in early evening, and spatial variations of thermocline depth due to inflows at night and subsequent gravitational readjustmentsin the day. Current velocities indicated by direction (8 from N) and speed (cm s21) at 0.5-, 3-, and 6-m depth with measurements obtained1800–1840 h 25 April and 1100–1135 h 26 April.
was dominated by heat loss (MacIntyre 1998; Robarts et al.1998).
The turbulent velocity scale q for turbulence due to allprocesses is (2Fq)1/3, and the timescale of mixing of the mix-ing layer is h/q. When temperature is stratified to the surface,mixing is minimal. For mixed layers ,1.5 m, the mixingtime was ,2 min. Once the mixed layer depth was .1.5 m,the mixing time was always ,12 min. These timescales areshort when compared with the canonical values given inDenman and Gargett (1983). Timescales of mixing due toheat loss tended to be faster than those from wind, a resultthat, along with the Monin-Obukhov length scale compari-son, indicates that mixing at night is largely caused by ther-mals.
Horizontal transports (differential heating and coolingand differential mixing)—Surface overflows are expectedwhen shallow waters trap more heat than deeper ones, whenwater turbidity differs, and when the depth of wind mixingvaries (Imberger and Parker 1985; Monismith et al. 1990).Underflows are anticipated when cooling is greater in shal-low areas. We anticipated such flows in Pilkington Bay, par-ticularly because there were north-south and east-west dif-ferences in Secchi depth and because different regions of thebay were sheltered from wind mixing depending on winddirection. In addition, Ochumba (1996) reported diel tem-
perature differences in shallow areas of Nyanza Gulf in east-ern Lake Victoria.
At times, the patterns of heating and cooling were likelyto have generated the anticipated flows; at other times theydid not. For instance, greater heating did occur during theday in shallow regions along both transects. Such heatingshould generate overflows. Greater heating was also ob-served in the constrictions on some days, likely because oflesser influence of wind, and overflows would be expected.However, midbay stations often had temperatures higherthan surrounding waters. Shallow waters in the south andeastern bay remained warmer at night than those farther off-shore; consequently, neither the frontal structures predictedby Farrow and Patterson (1993) nor the underflows predictedby Monismith et al. (1990) were likely to have occurred.Greater cooling did occur sometimes in the western bay thanin midlake, but only on the morning of the last day of ourstudy did we observe colder waters at an inshore site thatcould have flowed offshore.
Following the method of Sturman et al. (1999), we cal-culated flow speeds, U, and flushing times, tf , for downslopecurrents induced by differential cooling. U ; (BLH sinu/CD)1/3
and tf 5 L (1 1 tanu)4/3/(B tan u)1/3, where B is buoyancy2/3H
flux in m2 s23, LH is horizontal distance, and u is the bottomslope. Buoyancy fluxes from late afternoon until early morn-ing ranged from 1028 to 1027 m2 s23, bottom slope averaged

667Spatial-temporal variability
118, and the horizontal distance was 4 km for the velocitycalculation and 2 km for the flushing time calculation. Cal-culated velocities ranged from 0.06 to 0.14 m s21 and traveltimes ranged from 10 to 24 h, but flushing times of theinshore embayments would have been on the order of 2.5–5 d. Cool water arrived at the thermistor station at 1930 h24 April and at 2230 h 25 April. Given that formation ofcool waters inshore was infrequent, that the flushing timesindicate only a small volume of water would reach midlakestations, and that movement of the cool deep water was cou-pled with thermocline deflections, as discussed below, webelieve that the formation of gravity currents by differentialcooling was not an important mechanism for exchange inPilkington Bay at this time. However, because of the widevariations in surface temperatures, surface overflows wouldhave been frequent with return flows at other depths.
Upwellings and downwellings occurred in Pilkington Baybecause of convergence and divergence of water masses.Farrow and Patterson’s (1993) model indicates that upwell-ing and downwelling fronts will occur when near-shore re-gions shift from more rapid heating to more rapid coolingthan offshore waters. As discussed above, however, the near-shore regions tended to remain warmer than those offshore.Consequently, other mechanisms may have been operative.For instance, the downwelling on the afternoon of 24 April(Fig. 10, transect 2) occurred after the onset of winds andwas likely caused by a convergence of the slightly coolerwaters in the bay and the warmer waters in the constriction.In Pilkington Bay, warm water penetrated a depth of 2 mwithin 3 h, which suggests downwelling velocities on theorder of mm s21, similar to those modeled in another poly-mictic water body (Rueda et al. in press; Rueda and Schla-dow pers. comm.). To balance the downwelling, upwellingoccurred to the south. This mechanism will cause exchangesbetween surface and deeper waters on subdaily timescales.
The temperature difference between the warm waters inthe constriction and the bay likely generated an inflow intothe bay at night. The warmest temperatures on the east-westtransect in late afternoon occurred in the east (Fig. 11). Al-though some of the warm water likely originated near shorebecause of greater turbidity in the eastern bay, by 2050 hthe pool of warm water extended 2–3 km into the bay, hada depth of 6 m, and had persisted for several hours. Tem-peratures in the upper 6 m exceeded 27.38C between Bu-vuma Channel and Pilkington Bay in early evening on 24April (Fig. 10, transect 3). Similar warm temperatures wouldalso have been likely in the other constriction and are alikely source of the warm water.
Several mechanisms may have caused the inflow. Windspeeds prior to 2050 h ranged from 4 to 6 m s21, with guststo nearly 8 m s21. Surface drift currents are ;3% of windspeed; hence, average surface current speeds would havebeen ; 0.2 m s21. Consequently, the inflow could have beengenerated by wind. At steady state, current speeds inducedby horizontal temperature differences can be estimated as u; (ga DT HI)1/2, where a is the thermal coefficient of ex-pansion (at 278C, a 5 2.8 3 1024 8C21), DT is the horizontaltemperature difference, and HI is the thickness of the intru-sion (Monismith et al. 1990; Nepf and Oldham 1997). Onthe basis of DT 5 0.68C and a layer thickness of 5 m at
2050 h (Fig. 11, transect 3), the velocity would have been0.1 m s21. Given a distance of 2.5–3 km between the easternconstriction and EW2, the travel time for the warm waterwould have been 4–6 h. Consequently, the inflow could havebeen generated by the horizontal pressure gradient. Anybuildup of water in Hannington Bay itself caused by wind-induced currents or large-scale wave motions elsewhere inthe lake could also have generated a flow into PilkingtonBay.
The inflow of water from the constriction appears to havecaused or contributed to thermocline downwelling. On east-west transect 3 (Fig. 11), the thermocline sloped upwardfrom west to east until midbasin, where it downwelled 2 min ;500 m. Although wind mixing could have been greaterin the eastern half of the basin and the 8 m s21 wind at 2300h may have contributed to downwelling, that strong windonly persisted for 1 h, and the thermocline remained down-welled in the east for several hours after wind speedsdropped to ,5 m s21. Greater wind mixing in the east wouldalso have led to a more rapid rate of cooling, but waters arewarmer to the east. Hence, it is likely that neither wind norcooling alone contributed to the persistent downwelling.
We hypothesize that the inflows of warm water into theeastern bay generated a pressure force P that contributed toand maintained thermocline tilting. We calculated the pres-sure force due to a horizontal temperature gradient as P 5rga (dT/dx) H (Nepf and Oldham 1997). At 2050–2125 h2
I
on 24 April, the temperature difference between the stationwhere the strongest thermocline tilting occurred and theshore was 0.68C, the distance to shore was 3 km, and thelayer thickness was 5 m. At 0210–0247 h on April 25, thetemperature gradient between the thermistor station andEW2 was ;0.68C, the distance was ;2 km, and the well-mixed layer was ;5 m deep. Consequently, the pressure atthe first time was 0.014 N m22, and that at the second was0.02 N m22. The first was equivalent to a wind speed of 3.2m s21 and the second to one of 4 m s21. Consequently, pres-sure from the wind and the inflow likely acted together tocause the thermocline depression in the east.
The westward movement of cool deep water (,26.58C)was also a likely response to the horizontal pressure gradient.This cool water moved farther west as the inflow penetrated(Fig. 11, transects 2–5). The onset of heating the next dayreduced the spatial differences in temperature along the east-west transect and relaxed the horizontal pressure gradient.Consequently, the cool water flowed eastward. The droguemeasurements (Fig. 11, transect 7) support this interpreta-tion.
Lateral advection of these deep water masses apparentlycaused thermocline up- or downwelling and generated high-frequency waves. For instance, thermocline upwelling oc-curred at 1830 h on 24 April (Fig. 5) and at 1800 h on 25April (Fig. 7), with only a slight reduction in wind speeds.In both cases, cooler water had moved to the thermistorchain station (Figs. 5, 10, transects 3 and 8; Fig. 11, transects6–8). The relaxation of the upwelling at 2000 h (Fig. 7) dueto lateral transport of the cool water away from the therm-istor station led to formation of a train of high-frequencywaves.
Water also flowed from Buvuma Channel into the bay.

668 MacIntyre et al.
The upward movement of the 26.88C isotherm between tran-sects 6 and 7 (Fig. 10) and the subsequent upward movementof the 26.78C isotherm between transects 7 and 8 (Fig. 10)suggests that waters with temperatures between 26.68C and26.88C flowed into the constriction at depths between 4 and8 m (Fig. 10, transects 6–8). Because the upward movementsof these isotherms occurred in the constriction but not ineither the bay or the channel indicates an inflow rather thanheating. The time series data at the thermistor station (Fig.7) provides evidence that water entered the bay. Isothermdisplacements at 4–6 m depth (26.78C and 26.88C), as wellas the isotherms a degree above and below these, were outof phase from 1430 to 1630 h (Fig. 7). We interpret thesemotions as indicative of inflows of water of intermediatetemperature. The drogue measurements are supportive of thisinterpretation as flows were to the southeast at 3 m and tothe southwest at 6 m depth at this time. We do not knowthe mechanism that led to this exchange.
Internal waves, vertical transports, and intrusions—Waves with periods of 5–45 min were generated in the ther-mocline as wind forcing decreased (Fig. 6) and as the ther-mocline rapidly downwelled (Fig. 7). Five of the temperatureloggers (3.5, 4, 4.5, 5, and 5.5 m) recorded the wave trainafter the downwelling. These latter waves are broader at theirtroughs than at their crests, a feature often found in nonlinearwaves (Hunkins and Fliegel 1973). Recently, Stevens (1999)observed high-frequency waves such as these in a small res-ervoir. He provided evidence that they increase shear in thethermocline and therefore may increase the potential for ver-tical mixing in the thermocline. Hebert et al. (1992) andMoum et al. (1992) found a high correlation between theincidence of turbulence and high-frequency internal waves.The high-frequency waves in Pilkington Bay may provide amechanism for vertical transport across the thermocline; thelikelihood of this transport is even greater if the waves arenonlinear (Innal et al. 2000).
Breaking of internal waves at the sediment boundary, orany process that causes localized mixing in a stratified fluid,can lead to intrusions of well-mixed water into the mainbody of a lake (Browand et al. 1987; Thorpe 1998). Mixingat boundaries can occur if waves with frequencies criticalfor breaking impinge on the boundary (Ivey and Nokes1989). Critical frequencies fc for wave breaking are equal tothe buoyancy frequency N at a depth times bottom slope u ( fc
5 Nu; DeSilva et al. 1997). We calculated critical frequen-cies using profiles of N taken over a diurnal cycle and bot-tom slopes calculated from our bathymetry. Bottom slopesin the bay are typically low but reach 0.02 m m21 in a fewlocations; slopes reach 0.1 m m21 in the constriction. Withinthe bay itself, wave breaking was likely in ,5% of the basin;however, wave breaking was likely to occur between 1 and6 m depth within the constrictions (not shown). Consequent-ly, intrusions of water from the constrictions into the bay arepossible. In contrast to lakes with a larger area of steeplysloping bottom, this mechanism is less likely to be of im-portance in Pilkington Bay for coupled vertical-horizontaltransport.
Conclusions
This data set from Pilkington Bay provides the first sur-face energy budget for a tropical lake over diurnal timescales and is one of the most complete data sets showingspatial variation of thermal structure over a short time pe-riod. Because of the intensive sampling in this geometricallycomplex embayment, the data set allows assessment of theimportant physical processes, the flows generated, and theirimplications for transport of solutes and particles.
Pilkington Bay is a dynamic system. Stratification devel-ops in the morning and is highly stable by early afternoon(N ; 40 cph). Such strong stratification is similar to thatobserved across the seasonal thermocline in temperate andarctic lakes. Despite high solar irradiances, heat losses occurfrom midafternoon until midmorning the following day, andstratification is eroded on a daily basis. Except for a ;6-hperiod around solar noon, cooling begins as soon as the windincreases. Because of the warm surface waters, the coolingis largely due to evaporation. Consequently, not only u*w butalso w* tend to increase with wind forcing. This behaviordiffers from that observed in lakes with colder surface wa-ters where wind forcing and heat loss are not as tightly cou-pled (MacIntyre and Kling unpubl. data). This greater andmore persistent contribution of heat loss to mixed layerdeepening in tropical lakes may be a contributing factor tothe greater mixed layer depth for tropical versus temperatelakes of the same fetch (Kling 1988).
Spatial differences in the rates of heating and cooling andin the depth of wind mixing cause fronts to develop on spa-tial scales of kilometers. Wind-induced motion of thesefronts leads to vertical exchanges on subdaily timescales assurface waters downwell and deeper waters upwell. In ad-dition, movement of these fronts in the upper water columninduces thermocline downwelling and lateral movement ofdeep waters. Movement of the deep waters causes additionalthermocline up- and downwellings, some of which spawnhigh-frequency waves that may have sufficient shear to causevertical mixing and some of which are likely to break in theconstrictions and cause additional vertical fluxes and lateraladvection. The flows thus generated are more complex andinfluence a larger area than anticipated from models of dif-ferential heating, cooling, and wind mixing.
Accurate assessment of mixed layer depth is required formodels of mixed layer dynamics (Brainerd and Gregg1993b), internal wave dynamics in the thermocline (Hodgeset al. 2000), and phytoplankton photosynthesis (Geider et al.1998). These results from Pilkington Bay indicate that mixedlayer and thermocline depth depend not only on surface en-ergy budgets at the site of measurement but also on pro-cesses generated by different rates of heating and coolingand different wind stresses elsewhere in a basin. Mixed layerdepth at night is not only set by convection but also by themovement of intrusions, and restratification in the day doesnot only depend on heating but also on gravitational adjust-ment of horizontal density differences. Descriptions of ther-mocline motions require not only consideration of pressureforces from wind but also those from persistent horizontalpressure gradients such as are created by inflows with dif-ferent temperatures.

669Spatial-temporal variability
Accurate estimates of surface energy budgets are impor-tant for regional models of water balance and estimates ofgas flux. Both require accurate estimation of evaporation.Surface temperature variations in temperate lakes can causeerrors in evaporation estimates on the order of 10% (LeDrewand Reid 1982). In tropical water bodies, where evaporationrates can be even higher than in temperate water bodies, andlarge differences in surface temperatures occur, errors in es-timates may be even higher. The gas transfer velocity de-pends on the turbulence near the air-water interface and isoften based on wind speed alone (MacIntyre et al. 1995).Our results from Pilkington Bay indicate that the turbulentvelocity scale due to heat loss exceeds that due to wind stressfor long periods of the day. Consequently, estimates of thegas transfer coefficient are likely to be too low by a factorof two for tropical water bodies (MacIntyre et al. 2001).
Multiple fronts due to large temperature differences inPilkington Bay create a diversity of habitats for phytoplank-ton as well as sites with different rates of biological andchemical activity. Upwellings and downwellings induced byconvergences of fronts occur frequently during the day andpenetrate the diurnal thermocline. They are likely to be amore important mechanism for vertical exchange than tur-bulent mixing in the day and provide a mechanism wherebyphytoplankton in surface waters are moved away from dam-aging irradiances and whereby phytoplankton, bacteria, andsolutes from middepths in the water column reach the sur-face. At night, vertical exchange is induced by convectioncaused by heat loss, but spatial heterogeneity is maintainedbecause of the spatially variable rates of heating in the day.
Lateral motions of cool, anoxic bottom waters can lead tospatial heterogeneity in rates of microbial activity or nutrientrelease from sediments. In Pilkington Bay, as in other waterbodies with localized anoxia, results of studies of denitrifi-cation, phosphorus supply, or changes in cell nutrient statuswill be dependent on sampling location. Determining theecological consequences of the changing physical structurein the water column due to spatial and temporal variationsin rates of heating, cooling, and wind stress at the watersurface is a challenge ahead for understanding controls onecosystem productivity.
References
AMOROCHO, J., AND J. J. DEVRIES. 1980. A new evaluation of thewind stress coefficient over water surfaces. J. Geophys. Res.85: 433–442.
ANIS, A., AND J. N. MOUM. 1994. Prescriptions for heat flux andentrainment rates in the upper ocean during convection. J.Phys. Oceanogr. 24: 2142–2155.
, AND . 1995. Surface wave-turbulence interactions—scaling epsilon(z) near the sea surface. J. Phys. Oceanogr. 25:2025–2045.
ANDERSON, E. R. 1954. Energy budget studies, water loss investi-gations—Lake Hefner studies. U. S. Geol. Surv. Prof. Paper269: 71.
BOOTSMA, H. A., AND R. E. HECKY. 1993. Conservation of theAfrican Great Lakes—a limnological perspective. Conserv.Biol. 7: 644–656.
BRAINERD, K. E., AND M. C. GREGG. 1993a. Diurnal restratification
and turbulence in the oceanic surface mixed layer. 1. Obser-vations. J. Geophys. Res. 98: 22645–22656.
, AND . 1993b. Diurnal restratification and turbulencein the oceanic surface mixed layer. 2. Modeling. J. Geophys.Res. 98: 22657–22664.
BROWAND, F. K., D. GUYOMAR, AND S.-C. YOON. 1987. The be-havior of a turbulent front in a stratified fluid: Experimentswith an oscillating grid. J. Geophys. Res. 92: 5329–5341.
BRUTSAERT, W. H. 1982. Evaporation into the atmosphere: Theory,history, and applications. D. Reidel.
CHEN, C. T., AND F. J. MILLERO. 1977. The use and misuse of purewater PVT properties for lake waters. Nature 266: 707–708.
COATES, M. J., AND J. FERRIS. 1994. The radiatively driven naturalconvection beneath a floating plant layer. Limnol. Oceanogr.39: 1186–1194.
CRILL, P. M., AND OTHERS. 1988. Tropospheric methane from anAmazonian floodplain lake. J. Geophys. Res. 93: 1564–1570.
DEARDOFF, J. W. 1970. Convective velocity and temperature scalesfor unstable planetary boundary layer and for Rayleigh con-vection. J. Atmos. Sci. 27: 1211–1213.
DENMAN, K. L., AND A. E. GARGETT. 1983. Time and space scalesof vertical mixing and advection of phytoplankton in the upperocean. Limnol. Oceanogr. 28: 801–815.
DESILVA, I. P. D., J. IMBERGER, AND G. N. IVEY. 1997. Localizedmixing due to a breaking internal wave ray at a sloping bed.J. Fluid Mech. 350: 1–27.
FARROW, D. E., AND J. C. PATTERSON. 1993. On the response of areservoir sidearm to diurnal heating and cooling. J. FluidMech. 246: 143–161.
GEIDER, R. J., H. L. MACINTYRE, AND T. M. KANA. 1998. A dy-namic regulatory model of phytoplankton acclimation to light,nutrients, and temperature. Limnol. Oceanogr. 43: 679–694.
GOUDSMIT, G., F. PEETERS, M. GLOOR, AND A. WUEST. 1997.Boundary versus internal diapycnal mixing in stratified, naturalwaters. J. Geophys. Res. 102: 27903–27914.
HARE, L., AND J. C. H. CARTER. 1984. Diel and seasonal physico-chemical fluctuations in a small natural West African lake.Freshw. Biol. 14: 597–610.
HEBERT, D., J. N. MOUM, C. A. PAULSON, AND D. R. CALDWELL.1992. Turbulence and internal waves at the equator. Part II.Details of a single event. J. Phys. Oceanogr. 22: 1346–1356.
, F. W. B. BUGENYI, P. OCHUMBA, J. F. TALLING, R. MUG-IDDE, M. GOPHEN, AND L. KAUFMAN. 1994. Deoxygenation ofthe deep water of Lake Victoria, East Africa. Limnol. Ocean-ogr. 39: 1476–1481.
HECKY, R. E. 1993. The eutrophication of Lake Victoria. Verh. In-ternat. Verein. Limnol. 25: 39–48.
HENDERSON-SELLERS, B. 1986. Calculating the surface energy bal-ance for lake and reservoir modeling: A review. Rev. Geophys.24: 625–649.
HICKS, B. B. 1972. Some evaluations of drag and bulk transfercoefficients over water bodies of different sizes. Boundary-Layer Meteorol. 3: 201–213.
. 1975. A procedure for the formulation of bulk transfercoefficients over water. Boundary-Layer Meteorol. 8: 515–524.
HODGES, B. R., J. IMBERGER, A. SAGGIO, AND K. B. WINTERS. 2000.Modeling basin scale internal waves in a stratified lake. Lim-nol. Oceanogr. 45: 1603–1620.
HUNKINS, K., AND M. FLIEGEL. 1973. Internal undular surges inSeneca Lake: A natural occurrence of solitons. J. Geophys.Res. 78: 539–548.

670 MacIntyre et al.
IMBERGER, J. 1985. The diurnal mixed layer. Limnol. Oceanogr. 30:737–770.
, AND G. PARKER. 1985. Mixed layer dynamics in a lakeexposed to a spatially variable wind field. Limnol. Oceanogr.39: 473–488.
, AND J. C. PATTERSON. 1990. Physical limnology. Adv.Appl. Mech. 27: 303–475.
INALL, M. E., T. P. RIPPETH, AND T. J. SHERWIN. 2000. Impact ofnonlinear waves on the dissipation of internal tidal energy ata shelf break. J. Geophys. Res. 105: 8687–8705.
ISHIKAWA, T., AND M. TANAKA. 1993. Diurnal stratification and itseffects on wind-induced currents and water qualities in LakeKasumigaura, Japan. J. Hydraulic Res. 31: 307–322.
IVEY, G. N., AND R. I. NOKES. 1989. Vertical mixing due to thebreaking of critical internal waves on sloping boundaries. J.Fluid Mech. 204: 479–500.
JAMES, W. F., AND J. W. BARKO. 1991. Littoral-pelagic phosphorusdynamics during nighttime convective circulation. Limnol.Oceanogr. 36: 949–960.
JELLISON, R. S., AND J. M. MELACK. 1993. Meromixis in hypersa-line Mono Lake, California. 1: Vertical mixing and densitystratification during the onset, persistence, and breakdown ofmeromixis. Limnol. Oceanogr. 38: 1008–1019.
KAUFMAN, L. S. 1992. Catastrophic change in species-rich fresh-water ecosystems, the lessons of Lake Victoria. BioScience 42:846–852.
. 1993. The challenge of the world’s great lakes. Conserv.Biol. 7: 447–449.
KIM, J. W. 1976. A generalized bulk model of the oceanic mixedlayer. J. Phys. Oceanogr. 6: 686–695.
KLING, G. W. 1988. Comparative transparency, depth of mixing,and stability of stratification in lakes of Cameroon, West Af-rica. Limnol. Oceanogr. 33: 27–40.
KLING, G. W., W. C. EVANS, M. L. TUTTLE, AND G. TANYILEKE.1989. The evolution of thermal structure and water chemistryin Lake Nyos. J. Volcanol. Geotherm. Res. 39: 151–166.
LEDREW, E. F., AND P. D. REID. 1982. The significance of surfacetemperature patterns on the energy balance of a small lake inthe Canadian Shield. Atmosphere-Ocean 20: 101–115.
MACINTYRE, S. 1993. Vertical mixing in a shallow, eutrophic lake—possible consequences for the light climate of phytoplankton.Limnol. Oceanogr. 38: 798–817.
. 1996. Turbulent eddies and their implications for phyto-plankton within the euphotic zone of Lake Biwa. Jpn. J. Lim-nol. 57: 395–410.
. 1998. Turbulent mixing and resource supply to phytoplank-ton, p. 539–567. In J. Imberger [ed.], Physical processes inlakes and oceans. Coastal and estuarine studies 54. AmericanGeophysical Union.
, W. EUGSTER, AND G. W. KLING. 2001. The critical impor-tance of buoyancy flux for gas flux across the air-water inter-face, p. 135–139. In M. A. Donelan, W. M. Drennan, E. S.Saltzman, and R. Wanninkhof [eds.], Gas transfer at water sur-faces. Geophysical monograph 127. American GeophysicalUnion.
, K. M. FLYNN, R. JELLISON, AND J. R. ROMERO. 1999.Boundary mixing and nutrient fluxes in Mono Lake, California.Limnol. Oceanogr. 44: 512–529.
, AND R. JELLISON. In press. Nutrient fluxes from upwellingand enhanced turbulence at the top of the pycnocline in MonoLake, California. Hydrobiolgia.
, AND J. M. MELACK. 1982. Meromixis in an equatorial Af-rican soda lake. Limnol. Oceanogr. 27: 595–609.
, AND . 1984. Vertical mixing in Amazon floodplainlakes. Verh. Int. Ver. Limnol. 22: 1283–1287.
, AND . 1988. Frequency and depth of vertical mixingin an Amazon floodplain lake (L. Calado, Brazil). Verh. Int.Ver. Limnol. 23: 80–85.
, AND . 1995. Vertical and horizontal transport inlakes—linking littoral, benthic, and pelagic habitats. J. NorthAm. Benthol. Soc. 14: 599–615.
, R. WANNINKHOF, AND J. CHANTON. 1995. Trace gas ex-change across the air-water interface in freshwater and coastalmarine environments, p. 52–97. In P. Matson and R. Harriss[eds.], Biogenic trace gases: Measuring emissions from soiland water. Blackwell.
MELACK, J. M. 1982. Photosynthetic activity and respiration in anequatorial African soda lake. Freshw. Biol. 12: 381–400.
MILLERO, F. J., AND A. POISSON. 1981. International one-atmosphereequation of state of seawater. Deep-Sea Res. 28: 625–629.
MONIN, A. S., AND A. M. OBUKHOV. 1954. Basic laws of turbulentmixing in the atmosphere near the ground. J. Akad. Nauk. SSRGeofiz. Inst. 24:163–187.
MONISMITH, S. G. 1985. Wind-forced motions in stratified lakes andtheir effect on mixed-layer shear. Limnol. Oceanogr. 30: 771–783.
. 1986. An experimental study of the upwelling response ofstratified reservoirs to surface shear stress. J. Fluid Mech. 171:407–439.
. 1987. The modal response of reservoirs to wind stress. J.Hydrol. Div. ASCE 113: 1290–1326.
, J. IMBERGER, AND M. L. MORISON. 1990. Convective mo-tions in the sidearm of a small reservoir. Limnol. Oceanogr.35: 1676–1702.
MOUM, J. N., D. HEBERT, C. A. PAULSON, AND D. R. CALDWELL.1992. Turbulence and internal waves at the Equator. Part I:Statistics from towed thermistors and a microstructure profiler.J. Phys. Oceanogr. 22: 1330–1345.
NEPF, H. M., AND C. E. OLDHAM. 1997. Exchange dynamics of ashallow contaminated wetland. Aquat. Sci. 59: 193–213.
OCHUMBA, P. B. 1996. Measurement of water currents, temperature,dissolved oxygen and winds in the Kenyan Lake Victoria, p.155–167. In T. C. Johnson and E. O. Odada [eds.], The lim-nology, climatology and paleoclimatology of the East AfricanGreat Lakes. Gordon and Breach.
PARKER, G. J., AND J. IMBERGER. 1986. Differential mixed-layerdeepening in lakes and reservoirs, p. 63–92. In P. De Deckkerand W. D. Williams [eds.], Limnology in Australia. Dr. W.Junk.
PAULSON, C. A. 1970. The mathematical representation of windspeed and temperature profiles in the unstable atmospheric sur-face layer. J. Appl. Meteorol. 9: 857–861.
POND, S., D. B. FISSEL, AND C. A. PAULSON. 1974. A note on bulkaerodynamic coefficients for sensible heat and moisture fluxes.Boundary-Layer Meteorol. 6: 333–339.
POWELL, T. M., M. H. KIRKISH, P. J. NEALE, AND P. J. RICHERSON.1984. The diurnal cycle of stratification in Lake Titicaca: Eddydiffusion. Verh. Int. Ver. Limnol. 22: 1237–1243.
RAYNER, K. N. 1981. Diurnal energetics of a diurnal surface layer.University of Western Australia Centre for Water ResearchReference ED-80-005.
ROBARTS, R. D., M. J. WAISER, O. HADAS, T. ZOHARY, AND S.MACINTYRE. 1998. Relaxation of phosphorus limitation due totyphoon-induced mixing in two morphologically distinct basinsof Lake Biwa, Japan. Limnol. Oceanogr. 43: 1023–1036.

671Spatial-temporal variability
RUEDA, F. J., S. G. SCHLADOW, S. G. MONISMITH, AND M. T. STA-CEY. In press. The internal dynamics of a large polymictic lake.Part I. Field observations. J. Hydraulic Engineering.
SAGGIO, A., AND J. IMBERGER. 1998. Internal wave weather in astratified lake. Limnol. Oceanogr. 43: 1780–1795.
SIPPEL, S. J., S. K. HAMILTON, AND J. M. MELACK. 1992. Inundationarea and morphometry of lakes on the Amazon River flood-plain, Brazil. Archiv Hydrobiol. 123: 385–400.
STEVENS, C. 1999. Internal waves in a small reservoir. J. Geophys.Res. 104: 15777–15788.
STURMAN, J. J., G. N. IVEY, AND J. R. TAYLOR. 1996. Convection
in a long box driven by heating and cooling on the horizontalboundaries. J. Fluid Mech. 30: 61–87.
TALLING, J. F., AND J. LEMOALLE. 1998. Ecological dynamics oftropical inland waters. Cambridge Univ. Press.
THORPE, S. A. 1998. Some dynamical effects of sloping sides oflakes, p. 441–460. In J. Imberger [ed.], Physical processes inlakes and oceans. Coastal and Estuarine Studies 54. AmericanGeophysical Union.
Received: 4 July 2000Accepted: 31 October 2001Amended: 2 January 2002
Copyright © 2022 FDOKUMEN