Characteristics and Availability of Commercially Important Woods (Regis B. Miller)
Upload
independentCategory
view
0download
0
PDF hosted at the Radboud Repository of the Radboud University
Nijmegen
The following full text is a publisher's version.
For additional information about this publication click this link.
http://hdl.handle.net/2066/30108
Please be advised that this information was generated on 2015-08-10 and may be subject to
change.

Utilisation by fishes of shallow-water habitats including mangroves and seagrass beds
along the Tanzanian coast

Lugendo BR. (2007) Utilisation by fishes of shallow-water habitats including mangroves and seagrass beds along the Tanzanian Coast. PhD Thesis, Faculty of Science, Radboud University Nijmegen, The Netherlands. ISBN-10: 90-6464-061-0 ISBN-13: 978-90-6464-061-2 Electronically published by the University Library, Radboud University Nijmegen, The Netherlands Front cover Juvenile cardinal fish in Rhizophora mangrove Cover design and layout B. Lugendo (with help from F. Ismail) Printed by: Ponsen & Looijen BV Correspondence [email protected] Paranimfen: Mariëlle van Riel Guus Kruitwagen This research was financially supported by NUFFIC through the ENVIRONS-MHO Project implemented by the Faculty of Science, University of Dar es Salaam, Tanzania. This study also benefited from a UNESCO-Loreal for Women in Science Fellowship 2004. Additional funding to students in support of my study was obtained from Schure-Beijerinck-Popping Foundation and Quo Vadis Fonds.

Utilisation by fishes of shallow-water habitats including mangroves and seagrass beds
along the Tanzanian coast
Een wetenschappelijke proeve op het gebied van de Natuurwetenschappen, Wiskunde en Informatica
PROEFSCHRIFT
Ter verkrijging van de graad van doctor aan de Radboud Universiteit Nijmegen,
op gezag van de rector magnificus, prof. dr. C.W.P.M. Blom, volgens besluit van het College van Decanen
in het openbaar te verdedigen op
donderdag 1 februari 2007 om 12.00 uur precies
door
Blandina Robert Lugendo
geboren op 15 maart 1970 te Korogwe, Tanga, Tanzania.

Promotores: Prof. dr. S. E. Wendelaar Bonga Prof. dr. Y. D. Mgaya (University of Dar es Salaam, Tanzania)
Co-promotores: Dr. I. Nagelkerken
Dr. G. van der Velde
Manuscriptcommissie: Prof. dr. J. M. van Groenendael Prof. dr. J. J. Videler (Rijksuniversiteit Groningen/Universiteit Leiden) Dr. J. Mees (Vlaams Instituut voor de Zee, Oostende, België)
“Anyone can give up; it's the easiest thing in the world to do. But to hold it together when everyone else would understand if you fell apart, that's true strength.” -Unknown To my husband John, and my daughters Gladys and Vicky

Contents
Chapter 1 General introduction and outline of the thesis 9
Chapter 2 Fish community composition of a tropical non-estuarine embayment in
Zanzibar, Tanzania. 23
Chapter 3 Spatial and temporal variation in fish community structure of a marine
embayment in Zanzibar, Tanzania. 43
Chapter 4 Habitat utilisation by juveniles of commercially important fish species
in a marine embayment in Zanzibar, Tanzania. 67
Chapter 5 The importance of mangroves, mud and sand flats, and seagrass beds as
feeding areas for juvenile fishes in Chwaka Bay, Zanzibar: gut content
and stable isotope analyses. 89
Chapter 6 The relative importance of mangroves as feeding habitats for fishes:
a comparison between mangrove habitats with different settings. 117
Chapter 7 Synthesis and Conclusions 139
Summary/ Samenvatting/ Muhtasari 153
Acknowledgements 163
List of Publications 166
Curriculum Vitae 167


Chapter 1
General introduction and outline of the thesis

Chapter 1: General introduction
10
INTRODUCTION
Mangroves and seagrass beds form characteristic habitats along most tropical and subtropical coasts.
The importance of coastal habitats harbouring mangroves and seagrass beds as habitats for fishes is
well documented (Blaber 1980; Bell et al. 1984; Robertson & Duke 1987; Thayer et al. 1987; Little et
al. 1988; Morton 1990; van der Velde et al. 1995a,b; Kimani et al. 1996; Pinto & Punchihewa 1996;
Wakwabi 1999; Nagelkerken et al. 2000a,b,c,2001,2002; Cocheret de la Morinière et al. 2002;
Dorenbosch et al. 2004, 2005; Nakamura & Sano 2004a,b; Verweij et al. 2006). Since most of the
fishes found in these habitats are juveniles, they are frequently referred to as nursery habitats (e.g.
Robertson & Duke 1987; Little et al. 1988; Parrish 1989; Nagelkerken et al. 2001; Cocheret de la
Morinière et al. 2002; Dorenbosch et al. 2004; Mumby 2006); however, real evidence to support the
nursery role of these habitats is still lacking (Beck et al. 2001; Heck et al. 2003; Chittaro et al. 2004).
Mangroves and seagrass beds as juvenile habitats for fishes
Several assumptions have been made to explain the high abundance of juvenile fishes in these habitats.
These assumptions are based on avoidance of predators (Blaber & Blaber 1980; Shulman 1985;
Parrish 1989; Robertson & Blaber 1992; Nakamura & Sano 2004), higher abundance of food (Ogden
& Zieman 1977; Orth et al. 1984; Nagelkerken et al. 2000a) and interception of fish larvae since these
habitats cover extensive areas (Parrish 1989). Few studies, however, have tested these hypotheses
experimentally (e.g. Laegdsgaard & Johnson 2001; Cocheret de la Morinière et al. 2004; Verweij et al.
2006), in contrast to numerous studies that describe the fish assemblages of such habitats. And yet, this
hypothesized nursery importance of these habitats is commonly used as the main argument for their
protection and proper management to stop their degradation and rapid loss and for stimulating their
regeneration (Beck et al. 2001).
Inconsistent information in the Indo-Pacific region
The importance of both mangroves and seagrass beds as a juvenile habitat for coral reef fishes has
been well demonstrated in the Caribbean region (Nagelkerken et al. 2000c; Cocheret de la Morinière
et al. 2002; Nagelkerken et al. 2002; Mumby et al. 2004). The general situation in the Indo-Pacific
region may differ considerably from the Caribbean in particular, since bays and estuaries along the
continental coastline in the former area are often characterised by turbid waters, a larger tidal range
and a muddy substratum (Blaber 2000). In addition, the existing literature shows that the functioning
of these shallow water habitats and particularly the mangroves within the Indo-Pacific region is
contradictory. While in some regions these habitats are considered important for fishes and other
macrozoobenthos (Blaber 1980, Bell et al. 1984; Little et al. 1988, Tzeng & Wang 1992; Marguillier
et al. 1997; Sheaves & Molony 2000; Chong et al. 2001; Guest & Connolly 2004), this importance is

Chapter 1: General introduction
11
refuted in other regions (Quinn & Kojis 1985; Thollot & Kulbicki 1988; Blaber & Milton 1990; Chong
et al. 1990; Thollot 1992; Bouillon et al. 2002a,b). This inconsistency calls for the need to investigate
each area separately in order to establish the possible functioning of these habitats. As pointed out by
Hartill et al. (2003), a better understanding is required of the resources used by different fish species
and/or life stages, and of how important different habitats are in maintaining fish populations before
management plans can be improved.
Scarcity of knowledge in East Africa
The present knowledge on the functioning of mangrove and seagrass ecosystems as habitats for fishes
is mostly based upon research conducted in North America (Thayer et al. 1987; Sogard et al. 1989;
Kieckbusch et al. 2004), Tropical South America (Barletta et al. 2000,2003,2005; Barletta-Bergan et
al. 2002a,b), Australia (Blaber et al. 1985; Robertson & Duke 1987; Morton 1990; Robertson & Duke
1990; Laedgsgaard & Johnson 1995; Laedgsgaard & Johnson 2001; Kwak & Klump 2004) and the
Caribbean (Parish 1989; Nagelkerken et al. 2000a,b,c; 2001; Nagelkerken & van der Velde 2002,
2004; Cocheret de la Morinière et al. 2002; Dorenbosch et al. 2004, Verweij et al. 2006). The few
studies on the structure of fish assemblages utilizing mangroves and seagrass beds along the east
African coast are based on studies done in Kenyan estuaries (Little et al. 1988; van der Velde et al.
1995a; De Troch et al. 1996; Kimani et al. 1996; Wakwabi 1999; Marguillier et al. 1997; Huxham et
al. 2004). Hence it is not clear how non-estuarine embayments in this region are utilised by juvenile
fishes. This situation could accelerate degradation and/or loss of these habitats by ignorance of these
values (Morton 1990; Nagelkerken et al. 2002). Given the worldwide rate of decline of shallow water
habitats such as coral reefs, seagrass beds and mangroves (Shepherd et al. 1989; Spalding 1998;
Pockley 2000; Valiela et al. 2001), knowledge on habitat utilisation by fishes of these habitats is
fundamental so as to establish effective conservation strategies as well as development of sustainable
fisheries.
According to the 1989 inventory, the mangroves of mainland Tanzania cover a total area of
about 115,500 hectares (Semesi 1991). However, knowledge on their utilisation by fishes, or estimates
of the fish densities in microhabitats within mangrove forests or adjacent habitats such as seagrass
beds is limited to a few studies in the country (Dorenbosch et al. 2004, 2005).
Inadequacy and confounded sampling
In recent years, there has been a worldwide increase in recognition of the general importance of the
mangrove and seagrass ecosystems as important nursery habitats for juvenile fishes. However, the
utilisation by fishes and/or specific roles of these habitats remains largely unclear. Several attempts
have been done to describe the fish abundances and densities in these habitats. Most of these studies
have mostly focused on a single habitat type, either mangroves (Bell et al. 1984; Blaber et al. 1985;
Little et al. 1988; Morton 1990; Robertson & Duke 1990; Rooker & Dennis 1991; Tzeng & Wang

Chapter 1: General introduction
12
1992; Laroche et al. 1997; Ley et al. 1999; Lin & Shao 1999; Ikejima et al. 2003) or seagrass beds
(Livingston 1982; Beckley 1983; Stoner 1983; Bell & Westoby 1986; Nakamura & Sano 2004; Kwak
& Klumpp 2004). In cases where more than one habitat is studied usually different sampling
procedures are involved (see for example, Weinstein & Heck 1979; Blaber et al. 1985; Thayer et al.
1987; Thollot & Kulbicki 1988; Morton 1990; Robertson & Duke 1990; Acosta 1997; Nagelkerken et
al. 2001). Few studies, however, have used balanced sampling strategies that provide comparable data
on fish densities between these habitats and other adjacent habitats (Nagelkerken et al. 2000a; Chittaro
et al. 2005; Nakamura & Sano 2005). Furthermore, most studies describing the importance of
mangrove and seagrass ecosystems as fish habitats made no distinction between abundance of juvenile
and adult fishes, and did not give size-frequency distribution in these habitats. This resulted into
difficulties in comparison between studies, locations or different habitats hence difficulties in
establishing the relative importance of these habitats as well as any interrelations between these
habitats. Balanced sampling procedures among different shallow water habitats and involvement of
new technique such as stable isotope analysis coupled with proper data presentation may offer more
possibilities of getting insight into the use of these habitats by fishes.
Shallow-water habitats as feeding areas for fishes
Shallow-water habitats harbouring mangroves, seagrass beds and unvegetated habitats such as
mud/sand flats are often interlinked through diurnal, tidal as well as ontogenetic fish migrations
(Rooker & Dennis 1991; Vance et al. 1996; Nagelkerken et al. 2000a,c; Cocheret de la Morinière et
al. 2002; Dorenbosch et al. 2004). However, little is known of the degree to which these habitats are
used as feeding areas for fishes (Nagelkerken & van der Velde 2004) as well as their interconnection
through feeding migration. Studies demonstrating which habitat constitutes the ultimate source of
nutrition for shallow water fish communities can provide additional data for an objective
determination of the relative value of different habitats (Melville & Connolly 2003). The relative
conservation value of habitats has been determined largely by estimating the diversity and abundance
of species present (Beck et al. 2001). Levin & Hay (2003) point out that the knowledge on why fish
use specific habitats is also important in habitat conservation. As pointed out by Polis et al. (1997), the
source of an animal’s food is a central organizing theme in ecology. Understanding the role of
shallow-water habitats as feeding grounds for fish and sources of food has important implications for
management and conservation such as setting management priorities in situations of limited funding
and man-power as has been always the case in many tropical developing countries.
Early food-web studies attempted to use conventional techniques such as gut content analysis
of organisms at higher trophic levels to clarify trophic dynamics. This method has difficulties and if
used alone may provide unreliable results with respect to the diet composition and the source of the
food due to the following reasons: 1) differences in digestion rates of ingested material, 2) contents
can be hard to identify, 3) not all contents are digested, 4) it provides just a snap-shot of the true diet,

Chapter 1: General introduction
13
and 5) it does not show from where the food originates (MacDonald et al. 1982; Gearing 1991; Polis
& Strong 1996). Nonetheless, it proves to be the only means of establishing details of the types and
amounts of prey taken (Sydeman et al. 1997). One method that allows measurement of assimilated and
therefore nutritionally important materials is stable isotope analysis. Analysis of the stable isotopes of
carbon and nitrogen can provide a clearer understanding of diets because they reflect the actual
assimilation of organic matter into consumer tissue rather than merely its consumption, and provide an
average of the diet over periods of weeks to months (Gearing 1991).
Mangroves as feeding habitats for fishes
The importance of mangroves as feeding grounds for fishes and other macrozoobenthos of commercial
importance has become the subject of considerable research and debate. While some mangroves are
reported to form a significant feeding habitat for fishes and macrozoobenthos in some parts of the
Indo-Pacific (e.g. Rodelli et al. 1984; Marguillier et al. 1997; Sheaves & Molony 2000; Chong et al.
2001; Guest & Connolly 2004) this importance is refuted in other parts of the Indo-Pacific (e.g.
Bouillon et al. 2002a,b) and elsewhere (e.g. Philippines: Primavera 1996; and the Caribbean:
Nagelkerken & van der Velde 2004a). The topography and tidal characteristics of a mangrove
ecosystem are mentioned as important factors that could determine the degree of ‘outwelling’ of
mangrove carbon to adjacent aquatic environments (Boto & Wellington 1988; Lee 1995, 1999;
Dittmar & Lara 2001). However, it is not clear if these factors could as well influence the importance
of mangroves as feeding grounds for fishes from both within the mangrove ecosystems and adjacent
habitats. Studies that compare the importance of mangroves as feeding grounds for fishes in mangrove
ecosystems that differ in tidal ranges and/or topography are scarce. This calls for further research on
mangrove ecosystems that differ in their topography in order to establish which factor is influential in
the functioning of mangroves as important feeding habitats for fishes.
This thesis
The main aim of this thesis is to provide an insight into the functioning of tropical East African
(Tanzanian) coastal habitats, such as mangroves and seagrass beds, as juvenile habitats. The key
question is: ‘Do the mangroves and seagrass beds along the Tanzanian coast serve as important
habitats for juvenile fishes?’
This key question was addressed in this thesis through a series of sub-questions:
1. What fish assemblages are found in different bay habitats?
2. To what degree do the fish species use the bay habitats as juvenile habitats?
3. Are there spatial and temporal variations in fish community structure (density, biomass, size-
related distribution patterns, and species richness) and in physico-chemical variables within
different bay habitats?
Chapter 1: General introduction
14
4. Is the distribution of fishes related to environmental variables?
5. Do fish species and/or specific size classes of fish exhibit habitat preferences within the bay?
6. How does the fish assemblage of Chwaka Bay compare to those of estuaries and non-estuarine
habitats within the Indo-Pacific region and elsewhere?
7. What is the importance of different bay habitats as feeding areas for fishes?
8. To what degree does connectivity between bay habitats due to feeding by fishes exist?
9. Is the importance of mangroves as feeding habitats for fishes similar in mangrove ecosystems
with different landscape configuration?
This thesis is subdivided into two main parts: (1) a part with field observations, in which information
on the fish community structure and spatial-temporal variations in fish assemblages of different bay
habitats of a marine embayment (Chwaka Bay, Zanzibar) is provided, and (2) a part in which stable
isotope analysis is used to support the interpretation of the field observations and to provide further
insights into the functioning of these shallow-water habitats (see Fig. 1).
Chapter 2 forms the backbone of this thesis. It addresses key questions 1 and 2 of this thesis. It
provides a general overview of the fish community composition of different bay habitats in Chwaka
Bay. It gives an insight into the fish assemblage found in each bay habitat and the importance of each
bay habitat (mangroves, mud/sand flats and seagrass beds) and Chwaka Bay as a whole as a juvenile
and as a potential nursery habitat for fishes of commercial fishery importance.
Chapter 3 addresses key questions 3 and 4 of this thesis. It describes the seasonal variation in
fish community structure in relation to environmental variables in different bay habitats in Chwaka
Bay.
Chapter 4 addresses key questions 4, 5 and 6. It describes the size-related distribution patterns
of fishes of selected commercially important fish species in different bay habitats. It gives an insight
into how individuals of the same species are distributed within the bay in terms of size-related
distribution patterns and abundance, and discusses the implications of this size-related distribution
patterns.
Chapter 5 dwells on the possible reasons for the observed size-related distribution patterns
within different bay habitats in Chwaka Bay as reported in Chapter 4. It addresses key questions 7 and
8 of this thesis. By using combined methods of gut content analysis and stable carbon and nitrogen
isotope analysis of food items and fish, the types of food items consumed, their sources and the
possible connectivity between habitats is established. Chapter 5 further demonstrates the relative
importance of different bay habitats (mangroves, seagrass beds and mud/sand flats) as feeding areas
for juveniles of a number of fish species.

Chapter 1: General introduction
15
Fig. 1 Scheme of the study showing the different levels at which the fish community was studied (bottom = lowest level; top = highest level)
In Chapter 6, a more in-depth analysis is provided of the relative importance of mangroves
with different landscape configuration patterns as feeding areas for juveniles of a number of fish
species. It addresses the key question 9 of this thesis. Chwaka Bay, a non-estuarine (marine)
embayment, is compared with a mangrove channel, and intertidal (coastal) and estuarine mangrove
fringes.
The relative importance of mangroves as feeding habitat for juvenile fishes: a comparison on mangrove habitats with different landscape
configuration by using stable isotope analysis
The importance of mangroves, mud/sand flats and seagrass beds as feeding areas for juvenile fishes by using gut content and stable
isotope analyses
Habitat utilisation by juveniles of commercially important fish species of mangroves, mud/sand flats and seagrass beds
Spatial and temporal variation in fish community structure of mangroves, mud/sand flats and seagrass beds
Fish community composition of mangroves, mud/sand flats and seagrass beds

Chapter 1: General introduction
16
References Acosta A (1997) Use of multi-mesh gillnets and trammel nets to estimate fish species composition in coral reef
and mangroves in the southwest coast of Puerto Rico. Caribbean Journal of Science 33: 45-57.
Barletta M, Saint-Paul U, Barletta-Bergan A, Ekau W & Schories D (2000) Spatial and temporal distribution of
Myrophis punctatus (Ophichthidae) and associated fish fauna in a northern Brazilian intertidal mangrove
forest. Hydrobiologia 426: 65-74.
Barletta M, Barletta-Bergan A, Saint-Paul U & Hubold G (2003) Seasonal changes in density, biomass, and
diversity of estuarine fishes in tidal mangrove creeks of the lower Caeté Estuary (northern Brazilian coast, east
Amazon). Marine Ecology Progress Series 256: 217-228.
Barletta M, Barletta-Bergan A, Saint-Paul U & Hubold G (2005) The role of salinity in structuring the fish
assemblages in a tropical estuary. Journal of Fish Biology 66: 45-72.
Barletta-Bergan A, Barletta M & Saint-Paul U (2002a) Community structure and temporal variability of
ichthyoplankton in North Brazilian mangrove creeks. Journal of Fish Biology 61: 33-51.
Barletta-Bergan A, Barletta M & Saint-Paul U (2002b) Structure and seasonal dynamics of larval fish in the
Caeté River Estuary in North Brazil. Estuarine, Coastal and Shelf Science 54: 193-206.
Beck MW, Heck KL, Able KW, Childers DL, Eggleston DB, Gillanders BM, Halpern B, Hays CG, Hoshino K,
Minello TJ, Orth RJ, Sheridan PF & Weinstein MP (2001) The identification, conservation, and management
of estuarine and marine nurseries for fish and invertebrates. BioScience 51: 633-641.
Beckley LE (1983) The ichthyofauna associated with Zostera capensis Setchell in the Swartkops Estuary, South
Africa. South African Journal of Zoology 18: 15-24.
Bell JD & Westoby M (1986a) Abundance of macrofauna in dense seagrass is due to habitat preference, not
predation. Oecologia 68: 205-209.
Bell JD, Pollard DA, Burchmore JJ, Pease BC & Middleton MJ (1984) Structure of a fish community in a
temperate tidal mangrove creek in Botany Bay, New South Wales. Australian Journal of Marine and
Freshwater Research 35: 33-46.
Blaber SJM & Blaber TG (1980) Factors affecting the distribution of juvenile estuarine and inshore fish. Journal
of Fish Biology 17: 143-162.
Blaber SJM & Milton DA (1990) Species composition, community structure and zoogeography of fishes of
mangroves in the Solomon Islands. Marine Biology 105: 259-268.
Blaber SJM (1980) Fish of the Trinity inlet system of North Queensland with notes on the ecology of fish faunas
of tropical Indo-Pacific estuaries. Australian Journal of Marine and Freshwater Research 31: 137-145.
Blaber SJM (2000) Tropical Estuarine Fishes: Ecology, exploitation and conservation. Blackwell Science Ltd,
Fish and aquatic resources series 7, 121 pp.
Blaber SJM, Young JW & Dunning MC (1985) Community structure and zoogeographic affinities of the coastal
fishes of the Dampier region of North-western Australia. Australian Journal of Marine and Freshwater
Research 36: 247-266.
Boto KG & Wellington JT (1988) Seasonal variations in concentrations and fluxes of dissolved organic and
inorganic materials in a tropical, tidally-dominated, mangrove waterway. Marine Ecology Progress Series 50:
151-160.

Chapter 1: General introduction
17
Bouillon S, Koedam N & Dehairs F (2002a) Primary producers sustaining macro-invertebrate communities in
intertidal mangrove forests. Oceologia 130: 441-448.
Bouillon S, Raman AV, Dauby P & Dehairs F (2002b) Carbon and nitrogen stable isotope ratios of subtidal
benthic invertebrates in an estuarine mangrove ecosystem (Andhra Pradesh, India). Estuarine, Coastal and
Shelf Science 54: 901-913.
Chittaro PM, Fryer BJ & Sale R (2004) Discrimination of French grunts (Haemulon flavolineatum Desmarest,
1823) from mangrove and coral reef habitats using otolith microchemistry. Journal of Experimental Marine
Biology and Ecology 308: 168-183.
Chitaro PM, Usseglio P & Sale P (2005) Variation in fish density, assemblage composition and relative rates of
predation among mangroves, seagrass and coral reef habitats. Environmental Biology of Fishes 72: 175-187
Chong VC, Sasekumar A, Leh MUC & Cruz RD (1990) The fish and prawn communities of a Malaysian coastal
mangrove ecosystem, with comparisons to adjacent mud/sand flats and inshore waters. Estuarine, Coastal and
Shelf Science 31: 703-722.
Chong VC, Low CB & Ichikawa T (2001) Contribution of mangrove detritus to juvenile prawn nutrition: a dual
stable isotope study in a Malaysian mangrove forest. Marine Biology 138: 77-86.
Cocheret de la Morinière E, Pollux BJA, Nagelkerken I & van der Velde G (2002) Post-settlement life cycle
migration patterns and habitat preference of coral reef fish that use seagrass and mangrove nurseries.
Estuarine, Coastal and Shelf Science 55: 309-321.
Cocheret de la Morinière E, Nagelkerken I, van der Meij H & van der Velde G (2004) What attracts juvenile
coral reef fish to mangroves: habitat complexity or shade? Marine Biology 144: 139-145.
De Troch M, Mees J, Papadopoulos I & Wakwabi EO (1996) Fish communities in a tropical bay (Gazi Bay,
Kenya): seagrass beds vs. unvegetated areas. Netherlands Journal of Zoology 46: 236-252.
Dittmar T & Lara RJ (2001) Driving Forces Behind Nutrient and Organic Matter Dynamics in a Mangrove Tidal
Creek in North Brazil. Estuarine, Coastal and Shelf Science 52: 249-259.
Dorenbosch M, van Riel MC, Nagelkerken I & van der Velde G (2004a) The relationship of reef fish densities to
the proximity of mangrove and seagrass nurseries. Estuarine, Coastal and Shelf Science 60, 37-48.
Dorenbosch M, Verweij MC, Nagelkerken I, Jiddawi N & van der Velde G (2004b) Homing and daytime tidal
movements of juvenile snappers (Lutjanidae) between shallow-water nursery habitats in Zanzibar, western
Indian Ocean. Environmental Biology of Fishes 70: 203-209.
Dorenbosch M, Grol MGG, Christianen MJA, Nagelkerken I & van der Velde G (2005) Indo-Pacific seagrass
beds and mangroves contribute to fish density and diversity on adjacent coral reefs. Marine Ecology Progress
Series 302: 63-76.
Gearing JN (1991) The study of diet and trophic relationships through natural abundance 13C. In: Coleman DC,
Fry B (eds.) Carbon isotope techniques. Academic Press, San Diego, pp 201-218.
Guest MA & Connolly RM (2004) Fine-scale movement and assimilation of carbon in saltmarsh and mangrove
habitats by resident animals. Aquatic Ecology 38: 599-609.
Hartill BW, Morrison MA, Smith MD, Boubée J & Parsons DM (2003) Diurnal and tidal movements of snapper
(Pagrus auratus, Sparidae) in an estuarine environment. Marine and Freshwater Research 54: 931-940.
Heck KL, Hays G & Orth RJ (2003) Critical evaluation of the nursery role hypothesis for seagrass meadows.
Marine Ecology Progress Series 253:123-136.

Chapter 1: General introduction
18
Huxham M, Kimani EN & Augley J (2004) Mangrove fish: a comparison of community structure between
forested and cleared habitats. Estuarine, Coastal and Shelf Science 60: 637-647.
Ikejima K, Tongnunui P, Medej T & Taniuchi T (2003) Juvenile and small fishes in a mangrove estuary in Trang
province, Thailand: seasonal and habitat differences. Estuarine, Coastal and Shelf Science 56: 447-457.
Kieckbusch DK, Koch MS, Serafy JE & Anderson WT (2004) Trophic linkages among primary producers and
consumers in fringing mangroves of subtropical lagoons. Bulletin of Marine Science 74: 271-285.
Kimani EN, Mwatha GK, Wakwabi EO, Ntiba JM & Okoth BK (1996) Fishes of a shallow tropical mangrove
estuary, Gazi, Kenya. Marine and Freshwater Research 47: 857-868
Kwak SN & Klumpp DW (2004) Temporal variation in species composition and abundance of fish and decapods
in Cockle Bay, North Queensland, Australia. Aquatic Botany 78: 119-134.
Laegdsgaard P & Johnson CR (1995) Mangrove habitats as nurseries: unique assemblages of juvenile fish in
subtropical mangroves in Eastern Australia. Marine Ecology Progress Series 126: 67-81.
Laegdsgaard P & Johnson C (2001) Why do juvenile fish utilize mangrove habitats? Journal of Experimental
Marine Biology and Ecology 257: 229-253.
Laroche J, Baran E & Rasoanandrasana NB (1997) Temporal patterns in a fish assemblage of a semiarid
mangrove zone in Madagascar. Journal of Fish Biology 51: 3-20.
Lee SY (1999) Tropical mangrove ecology: physical and biotic factors influencing ecosystem structure and
function. Australian Journal of Ecology 24: 355-366.
Lee SY (1995) Mangrove outwelling: a review. Hydrobiologia 295: 203-212.
Levin PS & Hay ME (2003) Selection of estuarine habitats by juvenile gags in experimental mesocosms.
Transactions of the American Fisheries Society 132: 76-83.
Ley JA, McIvor CC & Montague CL (1999) Fishes in mangrove prop-root habitats of northeastern Florida Bay:
distinct assemblages across an estuarine gradient. Estuarine, Coastal and Shelf Science 48: 701-723.
Lin HJ & KT Shao (1999) Seasonal and diel changes in a subtropical mangrove fish assemblage. Bulletin of
Marine Science 65: 775-794.
Little MC, Reay PJ & Grove SJ (1988) The fish community of an East African mangrove creek. Journal of Fish
Biology 32: 729-747.
Livingston RJ (1982) Trophic organization of fishes in a coastal seagrass system. Marine Ecology Progress
Series. 7: 1-12.
MacDonald JS, Waiwood KG & Green RH (1982) Rates of different digestion of different prey in Atlantic cod
(Gadus morhua), ocean pout (Macrozoarces americanus), winter flounder (Pseudopleuronectes americanus),
and American plaice (Hippoglossoides platessoides). Canadian Journal of Fisheries and Aquatic Sciences 39:
651-659.
Marguillier S, van der Velde G, Dehairs F, Hemminga MA & Rajagopal S (1997) Trophic relationships in an
interlinked mangrove-seagrass ecosystem as traced by δ13C and δ15N. Marine Ecology Progress Series 151:
115-121.
Melville AJ & Connolly RM (2003) Spatial analysis of stable isotope data to determine primary sources of
nutrition for fish. Oecologia 136: 499-507.
Morton RM (1990) Community structure, density and standing crop of fishes in a subtropical Australian
mangrove area. Marine Biology 105: 385-394.
Chapter 1: General introduction
19
Mumby PJ (2006) Connectivity of reef fish between mangroves and coral reefs: Algorithms for the design of
marine reserves at seascape scales. Biological Conservation 128: 215-222.
Mumby PJ, Edwards AJ, Ernesto Arias-Gonzalez JE, Lindeman PG, Gall A, Gorczynska MI, Harborne AR,
Pescod CL, Renken H, Wabnitz CCC & Llewellyn G (2004) Mangroves enhance the biomass of coral reef fish
communities in the Caribbean. Nature 427: 533-536.
Nagelkerken I & van der Velde G (2002) Do non-estuarine mangroves harbour higher densities of juvenile fish
than adjacent shallow-water and coral reef habitats in Curaçao (Netherlands Antilles)? Marine Ecology
Progress Series 245: 191-204.
Nagelkerken I & G van der Velde (2004a) Are Caribbean mangroves important feeding grounds for juvenile reef
fish from adjacent seagrass? Marine Ecology Progress Series 274: 143-151.
Nagelkerken I & G van der Velde (2004b) Relative importance of interlinked mangroves and seagrass beds as
feeding habitats for juvenile reef fish on a Caribbean island. Marine Ecology Progress Series 274: 153-159.
Nagelkerken I, Dorenbosch M, Verberk WCEP, Cocheret de la Morinière E & van der Velde G (2000a) Day-
night shifts of fishes between shallow-water biotopes of a Caribbean bay, with emphasis on the nocturnal
feeding of Haemulidae and Lutjanidae. Marine Ecology Progress Series 194: 55-64.
Nagelkerken I, Dorenbosch M, Verberk WCEP, Cocheret de la Morinière E & van der Velde G (2000b)
Importance of shallow-water biotopes of a Caribbean bay for juvenile coral reef fishes: patterns in biotope
association, community structure and spatial distribution. Marine Ecology Progress Series 202: 175-193.
Nagelkerken I, van der Velde G, Gorissen MW, Meijer GJ, Van't Hof T & den Hartog C (2000c) Importance of
mangroves, seagrass beds and the shallow coral reef as a nursery for important coral reef fishes, using a visual
census technique. Estuarine Coastal and Shelf Science 51: 31-44.
Nagelkerken I, Kleijnen S, Klop T, van den Brand RACJ, Cocheret de la Morinière E & van der Velde G (2001)
Dependence of Caribbean reef fishes on mangroves and seagrass beds as nursery habitats: a comparison of fish
faunas between bays with and without mangroves/seagrass beds. Marine Ecology Progress Series 214: 225-
235.
Nagelkerken I, Roberts CM, van der Velde G, Dorenbosch M, van Riel MC, Cocheret de la Morinière E &
Nienhuis PH (2002) How important are mangroves and seagrass beds for coral-reef fish? The nursery
hypothesis tested on an island scale. Marine Ecology Progress Series 244: 299-305.
Nakamura Y & Sano M (2004a) Comparison between community structures of fishes in Enhalus acoroides- and
Thalassia hemprichii-dominated seagrass beds on fringing coral reefs in the Ryukyus Islands, Japan.
Ichthyological Research 51: 38-45.
Nakamura Y & Sano M (2004b) Overlaps in habitat use of fishes between a seagrass bed and adjacent coral and
sand areas at Amitori Bay, Iriomote Island, Japan: Importance of the seagrass bed as juvenile habitat. Fisheries
Science 70: 788-803.
Nakamura Y & Sano M (2005) Comparison of invertebrate abundance in a seagrass bed and adjacent coral and
sand areas at Amitori Bay, Iriomote Island, Japan. Fisheries Science 71: 543-550.
Ogden JC & JC Zieman (1977) Ecological aspects of coral-seagrass bed contacts in the Caribbean. Proceedings
of the 3rd International Coral Reef Symposium 1: 377-382.
Orth RJ, Heck KL & van Montfrans J (1984) Faunal communities in seagrass beds: a review of the influence of
plant structure and prey characteristics on predator-prey relationships. Estuaries 7: 339-350.

Chapter 1: General introduction
20
Parrish JD (1989) Fish communities of interacting shallow-water habitats in tropical oceanic regions. Marine
Ecology Progress Series 58: 143-160.
Pinto L & Punchihewa NN (1996) Utilization of mangroves and seagrasses by fishes in the Negombo estuary,
Sri Lanka. Marine Biology 126: 333-345.
Pockley P (2000) Global warming identified as main threat to coral reefs. Nature 407: 932
Polis G & Strong DR (1996) Food web complexity and community dynamics. American Naturalist 147: 813-
846.
Polis G, Anderson W & Holt R (1997) Toward an integration of landscape and food web ecology: the dynamics
of spatially subsidized food webs. Annual Review of Ecology and Systematics 28: 289-316.
Primavera JH (1996) Stable carbon and nitrogen isotope ratios of penaeid juveniles and primary producers in a
riverine mangrove in Guimaras, Philippines. Bulletin of Marine Science 58: 675-683.
Quinn TP & Kojis BL (1985) Does the presence of coral reefs in proximity to a tropical estuary affect the
estuarine fish assemblage? Proceedings of the 5th International Coral Reef Congress 5: 445-450.
Robertson AI & Blaber SJM (1992) Plankton, epibenthos and fish communities. In: Robertson AI, Alongi DM
(eds) Tropical mangrove ecosystems. Coastal Estuarine Studies 41: 173-224.
Robertson AI & Duke NC (1987) Mangroves as nursery sites: comparisons of the abundance and species
composition of fish and crustaceans in mangroves and other nearshore habitats in tropical Australia. Marine
Biology 96: 193-205.
Robertson AI & Duke NC (1990) Mangrove fish-communities in tropical Queensland, Australia – Spatial and
temporal patterns in densities, biomass and community structure. Marine Biology 104: 369-379.
Rodelli MR, Gearing JN, Gearing PJ, Marshall N & Sasekumar A (1984). Stable isotope ratios as a tracer of
mangrove carbon in Malaysian ecosystems. Oecologia 61: 326-333.
Rooker JR & Dennis GD (1991) Diel, lunar and seasonal changes in a mangrove fish assemblage off
southwestern Puerto Rico. Bulletin of Marine Science 49: 684-698.
Semesi AK (1991) Management plan for the mangrove ecosystem of mainland Tanzania, Vol. 11. Dar es
Salaam: Ministry of Tourism, Natural Resources and Environment, Forestry and Beekeeping Division,
Catchment Forestry Project.
Sheaves M & Molony B (2000) Short-circuit in the mangrove food chain. Marine Ecology Progress Series 199:
97-109.
Shepherd SA, McComb AJ, Bulthuis DA, Neverauskas V, Steffensen DA & West R (1989) Decline of
seagrasses. In: Larkum AWD, McComb AJ & Shepherd SA (eds) Biology of seagrasses. Elsevier, Amsterdam:
pp 346-393.
Shulman MJ (1985) Recruitment of coral reef fishes: effects of distribution of predators and shelter. Ecology 66:
1056-1066.
Sogard SM, GVN Powell & Holmoquist JG (1989) Utilization by fishes of shallow, seagrass-covered banks in
Florida Bay. 1. Species composition and spatial heterogeneity. Environmental Biology of Fishes 24: 53-65.
Spalding MD (1998) Patterns of biodiversity in coral reefs and mangroves: global and local scales. PhD thesis,
University of Cambridge
Stoner AW (1983) Distribution of fishes in seagrass meadows: role of macrophyte biomass and species
composition. Fishery Bulletin 81: 837-846

Chapter 1: General introduction
21
Sydeman WJ, Hobson KA, Pyle P & McLaren EB (1997) Trophic relationships among seabirds in Central
California: The Condor 99: 327-336.
Thayer GW, Colby DR & Hettler WF (1987) Utilization of the red mangrove prop root habitat by fishes in south
Florida. Marine Ecology Progress Series 35: 25-38.
Thollot P & Kulbicki M (1988) Overlap between the fishfauna inventories of coral reefs, soft bottoms and
mangroves in Saint-Vincent Bay (New Caledonia). Proceedings of the 6th International Coral Reef
Symposium, Australia 2: 613-618.
Thollot P (1992) Importance of mangroves for Pacific reef fish species, myth or reality? Proceedings of the 6th
International Coral Reef Symposium 2: 934-941.
Tzeng WN & Wang YT (1992) Structure, composition and seasonal dynamics of the larval and juvenile fish
community in the mangrove estuary of Tanshui River, Taiwan. Marine Biology 113: 481-490.
Valiela I, Bowen JL & York JK (2001) Mangrove forests: One of the world’s threatened major tropical
environments. BioScience 51: 807-815.
van der Velde G, van Avesaath PH, Ntiba MJ, Mwatha GK, Marguillier S & Woitchik AF (1995a) Fish fauna of
mangrove creeks, seagrass meadows and sand flats in Gazi Bay, Kenya (Indian Ocean): a study with nets and
stable isotopes. In: Heip CHR, MA Hemminga & de Bie MJM (eds), Monsoons and coastal ecosystems in
Kenya. Netherlands Indian Ocean Programme Cruise Report 5: 39-50.
van der Velde G, Dehairs F, Marguillier S, Mwatha GK, Op‘t Veld RLJM, Rajagopal S & van Avesaath PH
(1995b). Structural and stable isotope differences in the fish communities of mangrove creeks, seagrass
meadows and sand flats in Gazi Bay (Kenya). In: Hemminga M.A. (ed), Interlinkages between eastern-African
coastal ecosystems. STD- III project. Final report. pp 132-157.
Vance DJ, Haywood MDE, Heales DS, Kenyon RA, Loneragan NR & Pendrey RC (1996) How far do prawns
and fish move into mangroves? Distribution of juvenile banana prawns, Penaeus merguiensis, and fish in a
tropical mangrove forest in northern Australia, Marine Ecology Progress Series 131: 115-124.
Verweij MC, Nagelkerken I, de Graaff D, Peeters M, Bakker EJ & van der Velde G (2006) Structure, food and
shade attract juvenile coral reef fish to mangrove and seagrass habitats: a field experiment. Marine Ecology
Progress Series 306: 257-268.
Wakwabi EO (1999) The ichthyofauna of a tropical mangrove bay (Gazi bay, Kenya): Community structure and
trophic organisation. Ph.D. Thesis, Instituut voor Dierkunde, vakgroep morfologie, systematiek en ecologie,
Universiteit Gent.
Weinstein MP & Heck KL (1979) Ichthyofauna of seagrass meadows along the Caribbean coast of Panama and
the Gulf of Mexico: composition, structure and community ecology. Marine Biology 50: 97-107.

Chapter 1: General introduction
22
Chapter 2
Fish community composition of a tropical non-estuarine embayment
in Zanzibar, Tanzania
Lugendo BR, Nagelkerken I, Jiddawi N, Mgaya YD, van der Velde G
(In revision-Fisheries Science)

Chapter 2: Fish community composition of a non-estuarine bay
24
Abstract: Mangroves and seagrasses are important juvenile habitats for commercially valuable fish species. Along the east African coast, knowledge of fish assemblages utilizing these habitats is limited to studies done in estuaries, and hence this knowledge is scarce for non-estuarine embayments. In this study seine samples were taken from the non-estuarine Chwaka Bay (Zanzibar, Tanzania) along a gradient of the following habitats: mangroves, mud/sand flats and seagrass beds (Chwaka: in the bay, Marumbi: near the coral reef). Sampling was done bimonthly at each spring tide between November 2001 and October 2002. A total of 150 fish species belonging to 55 families were identified. Diversity (H') ranged from 1.9 in mud/ sand flats to 3.4 within Chwaka seagrass beds. The low species diversity at mud/sand flats was due to the numerical dominance of one species, viz. Gerres oyena, in this habitat. Overall, mean density of fishes was significantly higher in the mangrove creeks than in any other habitat (mean = 238.7 ind. 1000 m-²). Highest, but non-significantly different, mean biomasses were recorded in the mangrove creeks (1.7 kg 1000 m-2) and in Marumbi seagrass beds (1.6 kg 1000 m-2) with the mangrove channel having the lowest biomass (0.6 kg 1000 m-2). A high overlap in species composition (as high as 93.4% similarity) was found for adjoining habitats (i.e. mangrove creeks and mangrove channel), while habitats that were far apart showed low overlap (i.e. 6.6% similarity for Marumbi seagrass beds and mangrove creeks). On average 58.4% in terms of abundance and 63.2% in terms of biomass of the fish assemblage of Chwaka Bay were of commercial fishery importance. 76% of fishes observed in this study were small juveniles. Chwaka Bay thus appears to be an important juvenile habitat for various commercially important fish species.
INTRODUCTION
Coastal habitats harbouring mangroves and seagrasses are known to be important habitats for juvenile
fishes, many of them commercially important to the reef fisheries.1-6 These habitats are suspected to be
nursery grounds for reef fishes (although real evidence has yet to be provided),7,8 and as a result they
are considered of higher conservation value than other unvegetated habitats.7 Nagelkerken et al.9 point
out that the use of different sampling strategies between different coastal habitats is one of the
drawbacks in getting comparable data on densities of fish between different habitats, and hence
making it difficult to ascertain the importance of different coastal habitats such as mangroves and
nearby habitats.
Studies on the structure of fish assemblages utilizing mangroves and seagrass beds along the
east African coast is limited to studies done in Kenyan estuaries.10-14 Hence it is not clear how non-
estuarine embayments in this region are utilised by juvenile fish, a situation that could accelerate
degradation and/or loss of these habitats by ignorance of these values.15,16 Given the inconsistent
information on the importance of these habitats by fishes in the Indo-Pacific region,10,17,18 it is
important to investigate each habitat individually in order to establish the possible importance of these
habitats in a particular region.
This study explores the fish assemblages of various habitats including mangroves, seagrass
beds and mud/sand flats within a Tanzanian embayment to describe the relative importance of each
bay habitat in terms of abundance of fish species of commercial importance as well as size
distributions of the fish faunas in these habitats. A similar sampling method was employed throughout
the study area to be able to compare the habitats. This information is crucial in the management and
enhancement of the value of these areas as potential nursery grounds, and in setting management
priorities in situations of limited funding and man-power as it has been always the case in many
tropical developing countries.
Chapter 2: Fish community composition of a non-estuarine bay
25
Marumbi
Chwaka
5
4
2 1
N
3
39o 24’
0 km 4 8
Chwaka Bay
Tanzania Zanzibar
Zanzibar
6o 6’
39o 30’
6o 12’
Micham
vi peninsula
ChwakaBay
(Unguja)
The aim of this paper is to assess the potential importance of these shallow water habitats for
fisheries production. Therefore, this paper deals with the following questions: 1) what is the degree of
similarity (in terms of density, biomass, diversity, species richness, evenness and species and guild
composition) between the fish assemblages of different bay habitats? 2) Is the fish assemblage of
Chwaka Bay similar to those of estuaries and non-estuarine habitats within the Indo-Pacific region and
elsewhere?
MATERIALS AND METHODS
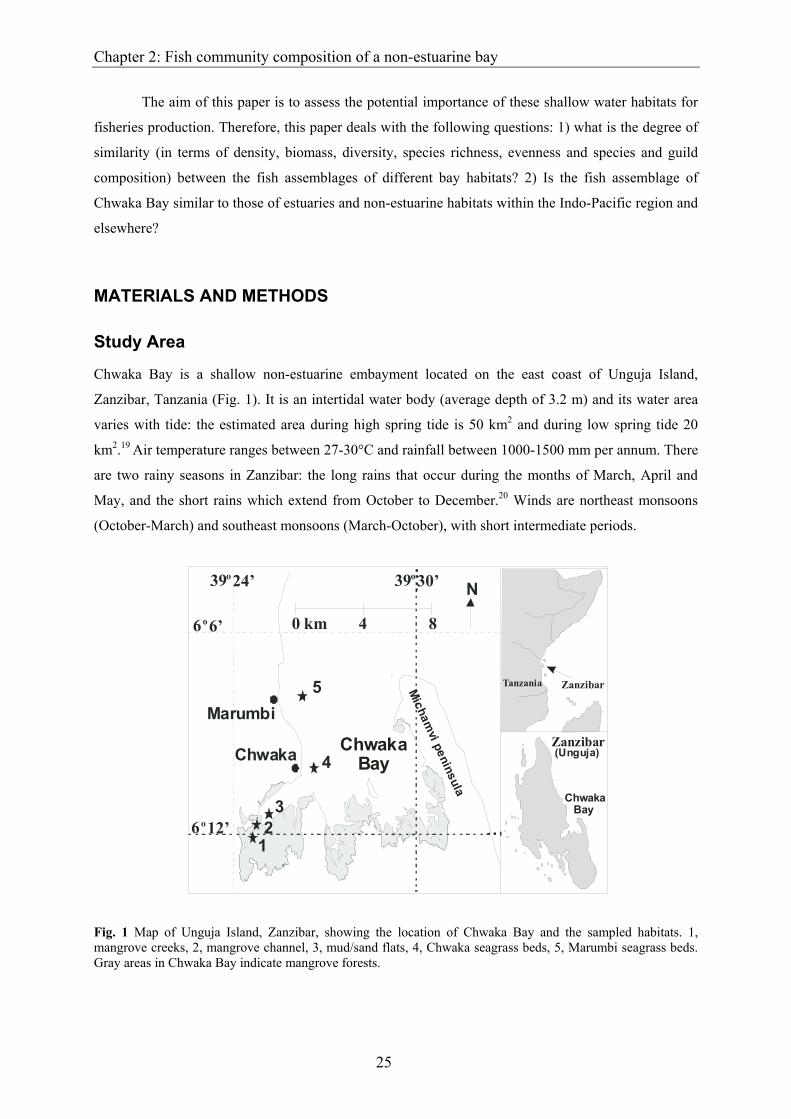
Study Area
Chwaka Bay is a shallow non-estuarine embayment located on the east coast of Unguja Island,
Zanzibar, Tanzania (Fig. 1). It is an intertidal water body (average depth of 3.2 m) and its water area
varies with tide: the estimated area during high spring tide is 50 km2 and during low spring tide 20
km2.19 Air temperature ranges between 27-30°C and rainfall between 1000-1500 mm per annum. There
are two rainy seasons in Zanzibar: the long rains that occur during the months of March, April and
May, and the short rains which extend from October to December.20 Winds are northeast monsoons
(October-March) and southeast monsoons (March-October), with short intermediate periods.
Fig. 1 Map of Unguja Island, Zanzibar, showing the location of Chwaka Bay and the sampled habitats. 1, mangrove creeks, 2, mangrove channel, 3, mud/sand flats, 4, Chwaka seagrass beds, 5, Marumbi seagrass beds. Gray areas in Chwaka Bay indicate mangrove forests.
Chapter 2: Fish community composition of a non-estuarine bay
26
Chwaka Bay is bordered by a dense mangrove forest of approximately 3000 ha.21 A number of
tidal creeks characterise this mangrove forest, with Mapopwe Creek (approximately 2 m deep) being
the largest and the main water exchange route between the forest and the embayment. These creeks are
intertidal in nature and none have any significant fresh water input other than rain. During heavy rains
in the rainy season, salinity gradients develop and the mangrove creeks and channel temporarily
acquire estuarine characteristics with salinities as low as 5 ppt.22,23 This part of the bay is characterised
by a relatively low water clarity and low oxygen levels.23 On the seaward side, immediately adjacent to
the forest, the embayment opens up to large intertidal flats that are characterised by mixed
assemblages of algae and seagrasses and scattered monospecific seagrass stands. The outer and middle
parts of bay (about 4 m deep) are oceanic in character with salinities rarely below 35 ppt and relatively
high water clarity of 6.3 to 15.8 m horizontal Secchi distance.23 The bay is relatively sheltered since it
is protected from the high-energy ocean on the east coast by a reef system running along the coastline,
as well as the Michamvi peninsula (Fig. 1).
Field sampling
Fish samples were collected bi-monthly (at each spring low tide) for a period of one year (November
2001 - October 2002) from five habitats in Chwaka Bay: (1) mangrove creeks, (2) mangrove channel,
(3) intertidal mud/sand flats located 2 km away from the mangroves, (4) Chwaka seagrass beds located
about 6 km away from the mangroves, and (5) Marumbi seagrass beds situated about 8 km away from
the mangroves (Fig. 1). Characterised by a muddy substratum and prop roots of the mangrove
Rhizophora mucronata, the mangrove creeks and channel habitats harboured few algae and seagrasses.
In contrast, the mud/sand flats were largely bare, except for some patches of algae and some
seagrasses. The two sampled seagrass habitats consisted of vast fields of Enhalus acoroides
interrupted by small patches of Thalassodendron ciliatum and the calcareous algae Halimeda spp.
A seine net measuring 35 m in length, 3 m in height, with a stretched mesh size of 1.8 cm was
used to collect fish from all habitats, except in the creeks, with a sampled area of approximately 480
m2 per haul. The narrowness of the creeks hindered a similar net deployment. Instead, an alternative
method was used where the mouth of the mangrove creeks (about 4 m wide) was closed by the net and
the whole net laid out upstream at one side of the creek (about 30 m) and then closed again, sampling
an area of approximately 120 m2. In each habitat, four replicate hauls were randomly taken during
each spring tide.
To make sure that the net remained vertically stretched and touched the bottom, a metal chain
was attached at the middle part of the sinker line. In addition, plastic floats were attached to the float
line so that the upper side of the net remained afloat. Concurrently, snorkelling observations were
made for net efficiency during deployment to check whether the net trailed over the substratum and if
any fish escaped. We observed that the lower part of the net remained on the bottom throughout the
exercise and no fish escaped below the net. Only some individuals of Mugilidae jumped over the net.

Chapter 2: Fish community composition of a non-estuarine bay
27
It was concluded that the procedure was well designed for most of the species under study. To
standardize the methods, we involved the same two fishermen, using the same net, and similar net
deployment procedures throughout the sampling period. Fish fork lengths were measured to the
nearest 0.1 cm and biomass weighed to the nearest 0.1 g.
It should be noted that the majority of the juveniles collected in this study were larger than 2.5
cm in length. The smaller fishes (< 2.5 cm) tended to pass through the net. This may possibly have
lead to an underestimation of the total density of early juveniles under study. It is known that seine
nets have a limitation in sampling adult and fast swimming fishes, a problem that could result into
them being underrepresented in this study. However, since the same mesh size was used throughout
the bay habitats, the effect of the net (if any) applies for all the habitats and hence the observations
from this study are representative for the different bay habitats.
The different size classes of fishes used in the present study were distinguished as follows:
small juveniles (< one third of the maximum species’ length), large juveniles and sub-adults (one third
− two third of the maximum species’ length), and adults (> two third of the max. species’ length)
following Nagelkerken and van der Velde.4 Information on the maximum length that an individual
species can attain, residence status, feeding guild, and the fishery importance of different fish species
were obtained from Dorenbosch et al.24, Froese and Pauly25, Lieske and Myers26, and other
miscellaneous sources.24-26
The temporal variation in the fish community structure, abiotic variables and size-frequency
data of some commercially important fish species of Chwaka Bay has already been reported.6,23
Statistical Analysis
The choice for a parametric test was made after the data were tested for homogeneity of variances
using a Levene’s test. Mean species richness and mean density for the entire fish community were
compared among different bay habitats using a one-way ANOVA on log-transformed data, followed
by multiple comparisons of means with a Tukey’s HSD post-hoc test, using the programme SPSS for
Windows.27 Shannon’s diversity index (H') and Pielou evenness index (J') were used to assess the
diversity and distribution of species within each habitats. The overlap in species composition between
different bay habitats was assessed using a Chao's abundance-based Sørensen index (Labd) which is not
only incidence-based (presence/absence) but also takes into account the relative abundance of the
shared species.28 The Chao's abundance-based Sørensen index was used to compare each pairwise
combination of two habitats and was calculated as follows:
Labd = 2UV/(U + V)
Where Labd: Chao's abundance-based Sørensen index (higher values indicate a higher similariy), U:
total relative abundance of shared individuals of assemblage 1, and V: total relative abundance of
shared individuals of assemblage 2.

Chapter 2: Fish community composition of a non-estuarine bay
28
RESULTS
A total of 150 species belonging to 55 families were collected (Table 1). The mean number of species
was significantly different between the bay habitats (1-way ANOVA; p <0.001), and was higher in
Chwaka seagrass beds (79) than in the mangrove creeks (44) and mangrove channel (62) (Tukey’s
HSD post-hoc test, p < 0.001, and p < 0.005, for mangrove creeks and mangrove channel,
respectively) but similar to the mud/sand flats (78) and the Marumbi seagrass beds (58). The
Shannon’s diversity index was also highest in Chwaka seagrass beds (H' = 3.4), and was lowest on the
mud/sand flats (H' = 1.9; Table 1). The evenness (J’) followed the same trend as H’, with J' = 0.8, and
J' = 0.4, for Chwaka seagrass beds and mud/sand flats, respectively.
In the embayment as a whole, the contribution in terms of density to the total catch throughout
the sampling period was highest for Gerres oyena (22.6%), Ambassis gymnocephalus (9.5%), Apogon
lateralis (8.9%), G. filamentosus (7.5%), Leptoscarus vaigiensis (6.2%) and Leiognathus equulus
(5.4%). In the mangrove creeks Ambassis gymnocephalus and Apogon lateralis were the most
abundant species with a relative abundance of 22.2% and 20.6%, respectively. While Gerres oyena
was the most dominant species in the mangrove channel (25.6%), in the mud/sand flats (62.6%) and in
Chwaka seagrass beds (37.6%), Leptoscarus vaigiensis dominated the catches in Marumbi seagrass
beds with a relative abundance of 48.0% (Table 1).
Gobiidae contributed the highest number of species to the fish fauna of Chwaka Bay, with 14
species. Labridae, Mullidae, Pomacentridae and Tetraodontidae were represented by eight species
each, while Apogonidae and Scaridae had six species each (Table 1). While 21 families were
represented by 2 to 5 species, 25 families were represented by just 1 species each.
With respect to the overlap in fish species for the five habitats, only 8 species (Acanthurus
blochii, Gerres oyena, Lethrinus harak, L. lentjan, Lutjanus fulviflamma, Saurida gracilis, Scarus
russelii and Sphyraena barracuda) out of the 150 recorded fish species were found in all five habitats
(Table 1). The Chao’s Sørensen similarity coefficient (Fig. 2) showed that neighbouring habitats
harboured a more similar fish assemblage than habitats which were located far apart. Neighbouring
habitats showed a similarity of 85.0 - 93.5% in fish community structure, whereas the most distantly
located habitats (mangrove creeks vs. Marumbi seagrass beds) showed a similarity of just 6.6%. The
same trend was seen for the overlap in number of species (Fig. 2).
Chapter 2: Fish community composition of a non-estuarine bay
29
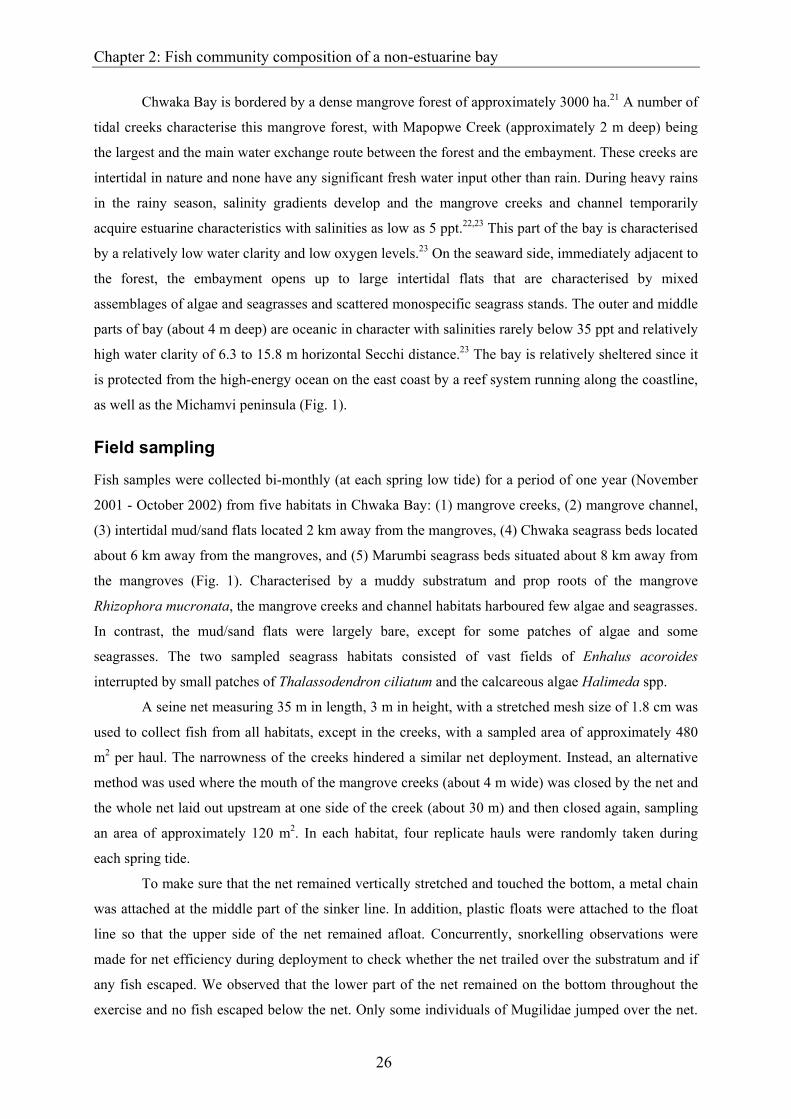
Table 1 Mean densities (ind. 1000 m-2), respective families, fishery importance (HC, highly commercial, C, commercial, MC, minor commercial, NC, non commercial, based on Froese & Pauly25, residence group (R = reef-associated species: fish species that predominantly occur in reefs and use bay habitats as additional habitat24-
26), N, nursery species: reef species that use bay habitats as juvenile habitat24-25, B, bay associated species: species that are known to use particular bay habitats like seagrass and mangroves during their entire lifetime25,26, OI, occasional visitors/intruders: pelagic predators, and R, rare species: reef species with less than 5 individuals in the whole bay for the whole sampling period), and feeding guilds (H, herbivore, I, insectivore, O, omnivore, PL, zooplanktivore, PS, piscivore, Z, zoobenthivore) of each fish species in each bay habitats. The total mean density, total mean biomass, total number of species, total number of families, Shannon’s diversity and Pielou’s evenness indices for each bay habitat are also provided. Gray boxes highlight mean densities which are > 5% of the relative abundance within a habitat
Families/species Fish
ery
impo
rtan
ce
Res
iden
ce g
roup
Feed
ing
guild
Man
grov
e cr
eeks
Man
grov
e ch
anne
l
Mud
/san
d fla
ts
Chw
aka
seag
rass
Mar
umbi
seag
rass
Families/species Fish
ery
impo
rtan
ce
Res
iden
ce g
roup
Feed
ing
guild
Man
grov
e cr
eeks
Man
grov
e ch
anne
l
Mud
/san
d fla
ts
Chw
aka
seag
rass
Mar
umbi
seag
rass
Acanthuridae DactylopteridaeAcanthurus blochii C R H 0.3 0.2 0.1 0.1 0.0 Dactyloptena macracanthus MC OI Z 0.0Ctenochaetus striatus C OI O 0.0 Dactyloptena orientalis MC OI Z 0.0 0.0Zebrasoma veliferum MC OI H 0.1 DasyatidaeAmbassidae Taeniura lymma C OI Z/PS 0.0Ambassis gymnocephalus MC B Z/PS 53.1 0.4 0.1 DiodontidaeAntennariidae Diodon liturosus NC OI Z 0.0Antennarius hispidus NC OI Z/PS 0.1 EleotridaeAntennarius pictus NC OI Z/PS 0.0 Butis butis MC B Z/PS 1.2 0.1 0.5Antennarius striatus NC OI Z/PS 0.0 Eleotris fusca MC B Z 0.9 0.0 0.3Histrio histrio MC R Z/PS 0.0 0.2 0.0 Engraulidae Apogonidae Thryssa baelama MC B PL 0.0 0.1Apogon lateralis NC B PL/Z 49.2 0.9 EphippidaeApogon nigripes NC R O 0.4 Platax orbicularis MC R O 0.2 0.1 0.0 0.1Archamia mozambiquensis NC OI Z 0.0 Platax teira MC R O 0.0 0.4 0.0Cheilodipterus quinquelineatus NC R Z 5.9 0.0 FistulariidaeFowleria aurita NC R Z 0.0 0.1 Fistularia commersonii MC R Z/PS 0.1 0.6 0.1Sphaeramia orbicularis MC B PL/Z 3.5 0.1 0.5 GerreidaeAtherinidae Gerres acinaces C B Z 0.9 1.7 1.8Atherinidae sp. NC OI PL 0.0 0.0 0.0 Gerres filamentosus MC B Z 22.9 18.4 0.7Aulostomidae Gerres oblongus C OI Z 0.1Aulostomus chinensis MC OI Z/PS 0.0 Gerres oyena C B Z 17.1 19.4 56.5 34.7 0.0Balistidae GobiidaeBalistidae sp. C R Z 0.1 Acentrogobius audax NC B Z 1.2 0.3Belonidae Amblygobius albimaculatus NC B H 0.0 0.2 0.4Strongylura leiura C B Z/PS 0.1 0.1 0.0 Amblygobius semicinctus NC OI O 0.0Tylosurus crocodilus crocodilus C B PS 0.4 0.1 0.1 0.1 Amblygobius sp. 1 NC R O 1.0 0.1Blenniidae Amblygobius sp. 2 NC OI O 0.1Petroscirtes breviceps NC R D 0.7 0.1 Amblygobius sphynx NC OI O 0.0 0.0Petroscirtes mitratus NC OI H 0.0 Bathygobius fuscus MC OI Z 0.0Plagiotremus tapeinosoma NC B PS 0.0 Cryptocentrus cryptocentrus NC OI Z 0.0Bothidae Glossogobius callidus NC OI Z 0.0Bothus pantherinus C B Z 0.1 0.0 0.2 0.0 Glossogobius giuris MC R Z/PS 0.2 0.0 0.0Carangidae Gnatholepis sp. NC OI D 0.1Alectis indicus C OI Z/PS 0.2 Oxyurichthys ophthalmonema NC OI Z 0.0 0.3Caranx sexfasciatus C OI Z/PS 9.3 3.2 0.9 Psammogobius knysnaensis NC B Z 0.5 0.3 1.5Scomberoides commersonnianus MC OI Z/PS 0.1 Yongeichthys nebulosus NC B Z 0.1 0.8Trachinotus blochii MC OI Z 0.0 HaemulidaeCentriscidae Diagramma pictum C OI Z/PS 0.0Aeoliscus punctulatus NC B PL 5.2 Plectorhinchus gaterinus C OI Z/PS 0.2 0.0Chaetodontidae Plectorhinchus plagiodesmus C OI Z/PS 0.1 0.0Heniochus acuminatus NC OI PL 0.1 0.0 0.0 Plectorhinchus vittatus C OI Z/PS 0.0Chaetodon auriga MC OI O 0.1 Pomadasys multimaculatum C B Z 2.2 0.9Chaetodon melannotus NC OI Z 0.0 0.1 HemiramphidaeChaetodon xanthocephalus NC OI O 0.0 Zenarchopterus dispar C B Z 19.5 2.2 0.0Chanidae Holocentridae Chanos chanos HC B O 0.1 Neoniphon sammara MC OI Z/PS 0.1Clupeidae Kyphosidae Herklotsichthys spp. MC B PL 0.2 0.0 0.0 0.0 Kyphosus vaigiensis C OI Z 0.1

Chapter 2: Fish community composition of a non-estuarine bay
30
Table 1 continued
Labridae PomacentridaeCheilinus chlorourus MC R Z 0.0 0.2 Chrysiptera annulata NC B O 0.1 3.1Cheilinus trilobatus MC OI Z 0.1 Dascyllus aruanus NC R O 0.2Cheilio inermis MC B Z 0.2 4.5 Pomacentrus pavo MC OI O 0.0Epibulus insidiator MC R Z/PS 0.3 0.0 Pomacentrus trilineatus NC R O 0.5 0.1Halichoeres scapularis MC OI Z 0.0 0.0 Stegastes nigricans MC R O 0.4Oxycheilinus bimaculatus MC R Z 0.3 ScaridaeStethojulis albovittata NC R Z 0.1 1.3 Calotomus carolinus C OI H 0.0Stethojulis strigiventer NC B Z 0.0 0.2 Calotomus spinidens C B H 0.4 2.5Leiognathidae Hipposcarus harid C N H 0.0 7.8 0.0Leiognathus equulus MC B Z 14.2 13.2 2.9 Leptoscarus vaigiensis C B H 2.2 32.5Lethrinidae Scarus ghobban C N H 0.1 0.5 0.8 0.1Lethrinus harak C B Z/PS 0.2 0.1 0.2 0.1 0.1 Scarus russelii C R H 0.1 0.1 0.3 3.1 1.1Lethrinus lentjan HC N Z/PS 2.6 1.8 6.2 3.6 1.1 ScorpaenidaeLethrinus variegatus MC B Z 0.2 0.0 1.7 0.2 Dendrochirus brachypterus MC R Z 0.8 0.1 0.2Lutjanidae Dendrochirus zebra MC OI Z 0.0 0.0Lutjanus argentimaculatus C N Z/PS 1.2 0.1 Pterois miles NC R Z/PS 0.1 0.1 0.1Lutjanus ehrenbergii MC N Z/PS 2.3 0.3 0.0 Parascorpaena mossambica NC OI Z/PS 0.1Lutjanus fulviflamma C N Z/PS 1.8 1.1 3.5 4.8 0.2 SerranidaeLutjanus fulvus C R Z/PS 0.5 0.0 0.0 Epinephelus lanceolatus MC OI Z/PS 0.0Monacanthidae Epinephelus suillus C R Z/PS 0.1 0.0Aluterus scriptus NC OI O 0.1 0.0 SiganidaeParamonacanthus barnardi NC OI Z 0.0 Siganus argenteus C OI H 0.0Stephanolepis auratus NC R Z 0.2 0.0 Siganus rivulatus MC OI H 0.1Monodactylidae Siganus stellatus C N H 0.4 0.3 0.1 0.0Monodactylus argenteus MC N O 13.1 4.1 0.2 0.0 Siganus sutor C N H 0.0 1.2 2.6 5.0Mugilidae Sillaginidae Valamugil buchanani C B O 1.6 1.0 0.2 Sillago sihama C B Z 0.1Mullidae Soleidae Mulloidichthys flavolineatus C OI Z 0.1 Pardachirus marmoratus C OI Z 0.0Parupeneus barberinus C N Z 0.0 1.4 0.2 SphyraenidaeParupeneus indicus C OI Z 0.0 Sphyraena barracuda MC N Z/PS 2.2 0.9 1.3 0.6 0.1Parupeneus macronema C R Z 0.1 0.4 Sphyraena forsteri C R Z/PS 0.1 0.0 0.2Parupeneus rubescens C B Z 0.4 0.1 SyngnathidaeUpeneus sulphureus MC OI Z 0.0 Hippichthys spicifer NC OI Z/PS 0.4Upeneus tragula C R Z 0.3 0.1 0.0 Hippocampus histrix NC B PL/Z 0.1 0.1Upeneus vittatus C OI Z 0.0 Syngnathoides biaculeatus NC B PL/Z 0.5 0.0 0.2 0.4Muraenidae SynodontidaeLycodontis sp. NC OI Z/PS 0.0 0.0 Saurida gracilis C R PS 0.4 0.2 0.5 0.2 0.0Nemipteridae Teraponidae Scolopsis ghanam MC N Z/PS 2.5 0.0 Pelates quadrilineatus MC B Z/PS 0.2 2.6 11.4Scolopsis lineata MC OI Z/PS 0.0 Terapon jarbua MC B O 0.1 1.6Ostraciidae Terapon theraps MC B Z/PS 0.0Lactoria cornuta NC R Z 1.2 0.0 0.0 0.0 Tetraodontidae Lactoria fornasini NC R Z 0.5 0.0 Arothron hispidus MC B O 0.0 0.3 0.1Platycephalidae Arothron immaculatus MC B O 0.4 1.7 0.7 0.1Thysanophrys sp. NC OI Z/PS 0.0 Arothron stellatus NC OI Z 0.0Plotosidae Canthigaster bennetti NC R O 0.0 0.1Plotosus lineatus C R Z/PS 0.0 0.2 2.8 Canthigaster solandri NC R O 0.1 0.3 0.8Poeciliidae Canthigaster valentini NC R O 0.1 3.1Pantanodon podoxys C B Z 12.9 Lagocephalus guentheri NC OI O 0.0Pomacentridae Sphoeroides pachygaster C OI Z/PS 0.0Abudefduf sordidus MC OI O 0.0 UnknownAbudefduf vaigiensis MC OI O 0.0 Unidentified sp. ? ? ? 0.0Chromis dasygenys NC R O 0.0 0.2
Total number of individuals 2614 3232 3996 4474 2839
Total number of species 44 62 78 79 58
Total number of families 27 38 41 36 29
Shannon's diversity index (H ') 2.5 2.3 1.9 3.4 2.1
Pielou's evenness index (J ') 0.7 0.6 0.4 0.8 0.5
Mean density (ind. 1000 m-2) 238.7 75.7 90.2 92.2 67.7
Mean biomass (kg 1000 m-2) 1.7 0.6 0.9 1.1 1.6

Chapter 2: Fish community composition of a non-estuarine bay
31
Distance gradient
Fig. 2 Matrix showing the overlap in number of fish species (right) and Chao's abundance-based Sørensen indices (left) between bay habitats. The shaded boxes show the total number of species in each bay habitat. The distance gradient (km) of each bay habitat in relation to the mangroves is also given.
Apogonidae, Ambassidae and Gerreidae contributed the most to the fish densities in the
mangrove creeks, but Ambassidae did not contribute much to the biomass (Fig. 3). Apogonidae,
Gerreidae, Gobiidae and Hemiramphidae contributed the most to the biomass in the mangrove creeks.
Gerreidae dominated highly in terms of both densities and biomass within the mangrove channel,
mud/sand flats and Chwaka seagrass beds. On the other hand, Scaridae was the single most important
family in the Marumbi seagrass beds (Fig. 3).
km
0
0
2
6
8
km
Habitat Mangrove
creeks Mangrove
channel Mud/sand
flats Chwaka seagrass
beds
Marumbi seagrass
beds
0
Mangrove creeks
44
33
31
19
10
0
Mangrove channel
93.5%
62
42
28
19
2
Mud/sand flats
73.8%
92.8%
78
40
24
6
Chwaka seagrass beds
38.6%
51.7%
85.0%
79
39
8
Marumbi seagrass beds
6.6%
19.1%
30.1%
86.4%
58
Dist
ance
gra
dien
t

Chapter 2: Fish community composition of a non-estuarine bay
32
0%
20%
40%
60%
80%
100%R
elat
ive
abun
danc
e/bi
omas
s
Apogonidae Gerreidae AmbassidaeLutjanidae Centriscidae SphyraenidaeHemiramphidae Labridae ScaridaeSiganidae Gobiidae Carangidae Leiognathidae Lethrinidae MonodactylidaeTetraodontidae Teraponidae Others
Mangrove creeks
Mangrove channel
Mud/sand flats
Chwaka seagrass
beds
Marumbi seagrass
beds
Fig. 3 Relative share of the most abundant fish families in each bay habitat in terms of density (left) and biomass (right).
The total mean fish density was significantly higher in the mangrove creeks (mean ± SE =
238.7 ± 1.7 ind. 1000 m-²) than the other habitats (Tukey’s HSD post-hoc test, p < 0.01), which showed
comparable values (Table 1). The mean biomass (± SE) was highest in the mangrove creeks (1.7 ± 2.5
kg 1000 m-2) and in the Marumbi seagrass beds (1.6 ± 2.5 kg 1000 m-2), and lowest in the mangrove
channel (0.6 ± 0.6 kg 1000 m-2). These differences in mean biomass were not significant (1-way
ANOVA, d.f. = 4, p > 0.05), however, due to the higher within_habitat variability.
The major proportion of fishes from the mangrove creeks was of minor or non- commercial
fishery importance in density (70%) and biomass (60%; Fig. 4). Also in the mangrove channel a large
part of the fishes were of minor or non-commercial fishery importance (density: 56%), although 59%
in biomass was of commercial fishery importance. In contrast, commercially important fish species
formed the major proportions (> 68%) of both density and biomass of fishes from the mud/sand flats,
and the Chwaka and Marumbi seagrass beds. Of the total fish assemblage of Chwaka Bay, 58.4% in
terms of abundance and 63.2% in terms of biomass were of commercial fishery importance.

Chapter 2: Fish community composition of a non-estuarine bay
33
0%
20%
40%
60%
80%
100%R
elat
ive
abun
danc
e/bi
omas
s
highly commercial commercialminor commercial non commercial
Mangrove creeks
Mangrove channel
Mud/sand flats
Chwaka seagrass
beds
Marumbi seagrass
beds
Fig. 4 Relative abundance (left) and relative biomass (right) of fishes in different bay habitats with respect to their fishery importance.
Zoobenthivores were the most abundant feeding guilds in relative density (> 38.8%) in all
habitats except in Marumbi seagrass beds where herbivores dominated (Fig. 5). Herbivores also
formed a small proportion (19%) of the fish assemblage of the Chwaka seagrass beds (19.4%), but
they were almost absent in the mud/sand flats and mangrove habitats (<3%). Zoobenthivores/
piscivores accounted for a considerable proportion (31.8%) of the fish assemblage within the
mangrove creeks and in Chwaka seagrass beds (26.4%). While zoobenthivores/ zooplanktivores were
almost only found in the mangrove habitats, zooplanktivores were almost only present in the Marumbi
seagrass beds (located relatively near to the open ocean).
The major proportions of the fishes in terms of relative density (59-85%) in all habitats were
species considered to spend most of their life cycle within the bay (i.e. bay residents, Fig. 6). The
proportion of nursery species was highest in the Chwaka seagrass habitats (26.4%) and was lowest in
the mangrove creeks (9.8%) and in the Marumbi seagrass beds (10.1%). The proportion of reef species
increased from the mangroves (deep within the bay) towards the seagrass beds of Marumbi (near the
mouth of the bay), but interestingly, occasional visitors and intruders increased in relative density
towards the mangrove habitats (Fig. 6).

Chapter 2: Fish community composition of a non-estuarine bay
34
0%
20%
40%
60%
80%
100%
Mangrovecreeks
Mangrovechannel
Mud/sandflats
Chwakaseagrass
beds
Marumbiseagrass
beds
Rel
ativ
e ab
unda
nce
piscivoreszooplanktivoresomnivoreszoobenthivores/zooplanktivoreszoobenthivores/piscivoreszoobenthivores herbivores
0%
20%
40%
60%
80%
100%
Mangrovecreeks
Mangrovechannel
Mud/sandflats
Chwakaseagrass
beds
Marumbiseagrass
beds
Rel
ativ
e ab
unda
nce
Bay residents Nursery speciesReef species Occasional visitors/Intruders
Fig. 5 Relative abundance of various feeding guilds of fishes in different bay habitats.
Fig. 6 Relative abundance of different ecological groups of fishes in different bay habitats based on their degree of residence in the bay; the definition for each category is given in Table 1.
Chapter 2: Fish community composition of a non-estuarine bay
35
0%
20%
40%
60%
80%
100%
Mangrovecreeks
Mangrovechannel
Mud/sandflats
Chwakaseagrass
beds
Marumbiseagrass
beds
Rel
ativ
e ab
unda
nce
small juveniles large juveniles/sub-adults adults
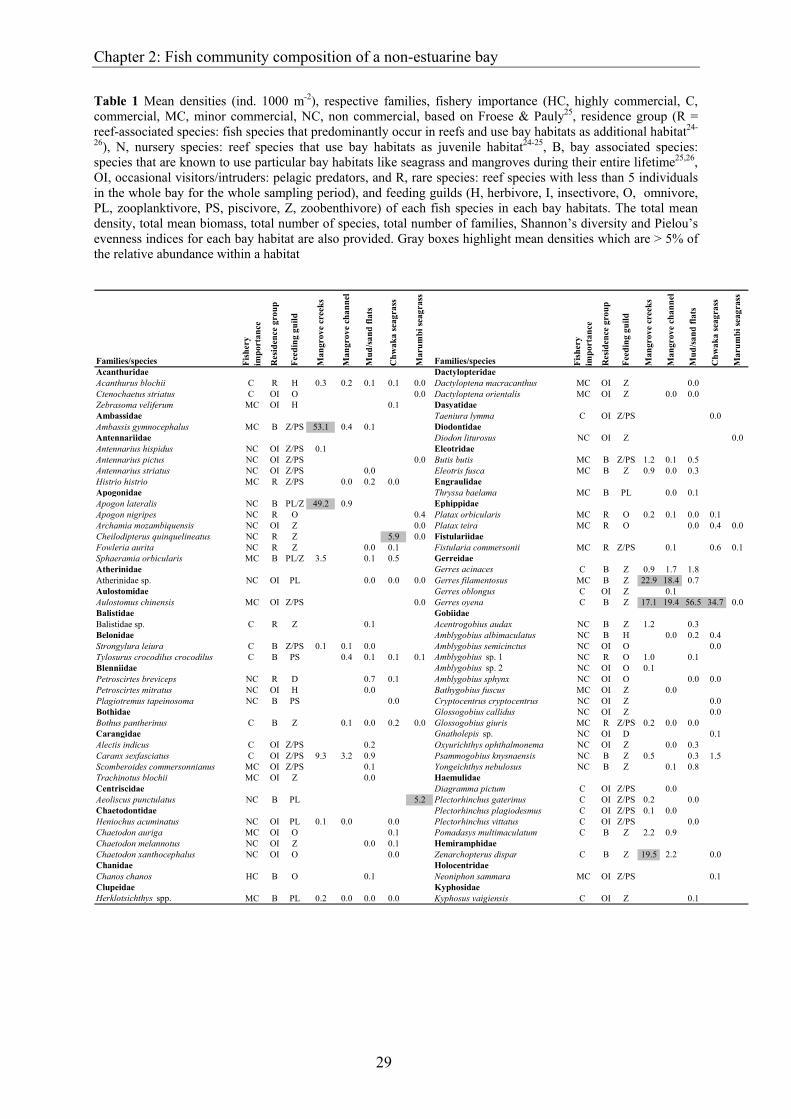
Over 49.2% in relative abundance of the fishes occurring within the various bay habitats
consisted of small juveniles (Fig. 7). The proportion was highest within the mud/sand flats (93.9%),
followed by the mangrove channel (86.6%) and the Chwaka seagrass beds (82.1%). The mangrove
creeks and the Marumbi seagrass beds had the highest proportion of adults and large juvenile/sub-
adults (49.2% and 50.8%, for mangrove creeks and Marumbi seagrass beds, respectively). Overall,
75.7% of the relative abundance of all fishes caught in Chwaka Bay were small juveniles; the
remaining fraction was composed of large juveniles/sub-adults (16.4%) with adults contributing 7.9%
only.
Fig. 7 Relative abundance of different size classes of fishes in different bay habitats.
DISCUSSION
Despite the relatively high number of species, the fish assemblage in Chwaka Bay was composed of a
few dominant species only, both in terms of density and biomass. As noted by Quinn29 this is a
common feature of bay, inshore and estuarine fish assemblages in both temperate and sub-tropical
environments, where less than six species comprise approximately 70% of the total abundance, even
though many more species are caught.29 In the present study, a slightly higher number of species (nine)
comprised 70% of the total catch from Chwaka Bay as a whole. Similar observation (with number of
species comprising 70% of the catch) include those of Tudor Creek, Kenya (7 species),10 Sarodrano
mangrove creek, Madagascar (5 species), 30 Cockle Bay, North Qeensland, Australia (3 species),31 and

Chapter 2: Fish community composition of a non-estuarine bay
36
Caete River estuary, Brazil (6 species)32. From the above studies and the present study, it can be
generalized that bays and estuaries from tropical environments follow a similar trend as those of
temperate and sub-tropical environments where few species dominate despite many species that are
encountered in these environments.
Mud/sand flats had the lowest species diversity and evenness, despite having (almost) the
highest number of fish species and families. This is probably due to the dominance of one species, viz.
Gerres oyena. The low species diversity and evenness indices in this habitat are possibly related to the
lack of structural complexity as compared to the seagrass and mangrove habitats. Vegetated habitats
have been reported to support a high diversity of fishes compared to unvegetated habitats.33-36
The Chwaka seagrass beds harboured the highest number of fish species. Higher numbers of
species in seagrass habitats compared to mangrove habitats have also been reported in Tudor Creek
and Gazi Bay, Kenya10,11 and in Negombo estuary, Sri Lanka;37 the opposite has been documented in
Australia and in Florida.38-40 On the other hand, no significant difference in species richness was found
between the mangroves and seagrass bed of a non-estuarine bay in the Caribbean.4 The higher number
of fish species, species diversity and evenness in the Chwaka seagrass beds compared to the other
habitats, is possibly explained by its location in-between the mangroves in the deeper part of the
embayment and the coral reef. Lugendo et al.6 suggest that fish species from adjacent habitats may
school together in the seagrass channels of Chwaka during low tides since these channels are always
inundated with water. Dorenbosch et al.5 reported the utilisation of Chwaka seagrass channels by
fishes from adjacent rocky habitats during low tide.5 It is furthermore known that fishes use transient
habitats during certain phases of tidal cycles.18,41 Additionally, the Chwaka seagrass beds could also
form a corridor for fishes if they undertake an ontogenetic migration from the mangroves to the deeper
and outer parts of the embayment.6
There was a strong negative relationship between distance and similarity in species
composition among habitats. Nevertheless, it is possible that habitat type could be more responsible
for the similarity and differences in species diversity and community characteristics observed in the
present study than distance alone. Similar habitat types (e.g. mangrove creeks and mangrove channel)
showed more similarity compared to that between mangrove habitats and the seagrass beds. However,
a relatively large proportion of reef species in Marumbi and Chwaka seagrass beds than in the
mangrove habitats which were located deep inside the bay could be an indication of an interaction with
the reef. A decrease in the influence of coral reef species with increasing distance away from the reefs
has been also observed in Caribbean and Japanese bays.42,43
The ichthyofauna of the Chwaka Bay shows similarities but also some marked differences
with that of estuaries in the east African region. Gerreidae, Gobiidae, Plotosidae and Siganidae
dominated Tudor mangrove creeks10 whereas Atherinidae, Clupeidae and Gerreidae dominated Gazi
Bay.13 In the present study, Gerreidae and Scaridae dominated the bay as a whole while Ambassidae,
Apogonidae and Gerreidae dominated catches from the mangrove habitats. Furthermore, relatively

Chapter 2: Fish community composition of a non-estuarine bay
37
fewer species (44 and 62 for mangrove creeks and mangrove channel, respectively) were collected
from the mangroves habitats in the present study compared to the 83 species from Tudor Creek in
Kenya.10 The differences in dominant species and in species richness between these studies are
possibly be related to differences in physical conditions that prevail in these various habitats. The
seasonal salinity gradient that was recorded in the mangrove habitats of Chwaka Bay, particularly
during the rainy season,23 make mangrove creeks in Chwaka Bay different from Tudor Creek which
lacked any marked gradients in salinity between the creek and the ocean.10 This salinity gradient in
Chwaka Bay may possibly have acted as a physiological barrier to stenohaline fishes, resulting in
avoidance of the mangrove creeks. Equally important could be the differences in mesh size used, i.e.
0.6 cm in Tudor Creek10 and 1.8 cm in the present study.
The mean density of fishes was about three times higher in the mangroves than in any of the
other habitats. As pointed out by Lugendo et al.6, this is similar to the observation from tropical
Queensland (Australia), where 4 − 10 times higher densities of fish were observed in mangroves than
in adjacent habitats.38 The high density of fish in mangroves is probably explained by the high
structural complexity formed by the prop-roots.38,40,44-46 On the contrary, Ikejima et al.47 found no
significant differences in abundance between the mangroves and the adjacent habitats.
The greatest proportion of fishes in the bay was formed by small juveniles (75.7%), with
adults comprising 7.9% only. Also, the largest proportion of fish species (58.4%) in the bay was
composed of species of commercial fishery importance. These findings suggest that the Chwaka Bay
habitats are potential nurseries for economically important fish species. Many species that are assumed
to utilise these nearshore habitats as nurseries,24,25 were found throughout the bay, sometimes in
relatively high densities. These included species like Lutjanus fulviflamma, Hipposcarus harid,
Monodactylus argenteus, Scolopsis ghanam, Siganus sutor and Sphyraena barracuda.
Herbivorous fish species were most abundant in the seagrass beds where they could evidently
obtain their preferred food (algae and seagrasses), but they were nearly absent from the mangrove
habitats where these food types were largely lacking. The most abundant species found in our study
were zoobenthivores. The abundance of zoobenthivores is not unexpected due to the high abundance
of invertebrates (an important food resource to zoobenthivores) which are known to occur in these
shallow water habitats.48,49 Zoobenthivore/piscivores represented 19.3% of the fish assemblage in
Chwaka Bay; this proportion is consistent with that observed for piscivores in Sarodrano mangroves in
Madagascar (18%),30 but lower than the one observed in the Dampier region, North-western Australia
(37%).50 The proportion of zoobenthivores/piscivores was comparatively higher in the mangrove
creeks (31.8%) than in any other bay habitat and was basically made up of mangrove resident species
(i.e. large juveniles/sub-adults and adults of Ambassis gymnocephalus). Furthermore, occasional
visitors/intruders (mainly the reef species Caranx sexfasciatus, size range 4.4-14.5 cm, mean size 6.9
cm) which could be potential predators on small juvenile fishes were relatively more abundant within
the mangrove creeks than in any other bay habitat. We do not have information on the occurrence of

Chapter 2: Fish community composition of a non-estuarine bay
38
juveniles of this species on the nearby reef. Their size range indicates that all individuals caught were
small juveniles, suggesting that they possibly use also the mangrove habitats as a juvenile habitat.
In conclusion, the fish assemblage of all bay habitats was mainly composed of juveniles
including many of commercial importance, showing the potential of Chwaka Bay as a juvenile or
nursery habitat. All bay habitats were dominated by bay residents. Zoobenthivores dominated the fish
assemblages of all habitats except Marumbi seagrass beds where herbivores dominated. The overlap in
species composition between bay habitats that was observed in the present study was probably
influenced by similarities/differences in habitat type and distance to the reef.
Acknowledgements
Financial support was granted by NUFFIC through the ENVIRONS-MHO Project implemented by the
Faculty of Science, University of Dar es Salaam. Funding for field work was received from the
Schure-Beijerinck-Popping Foundation. I. N. was supported by a Vidi grant from the Netherlands
Organisation for Scientific Research (NWO). Thanks are due to M. A. Manzi, S. J. Simgeni and M.A.
Makame for field assistance. We appreciate the invaluable field and lab assistance received from A. de
Groene, A. Pronker and I. Cornelissen. We are grateful to the administration and staff of the Institute
of Marine Sciences (IMS) in Zanzibar for logistical support and research facilities. This is Centre for
Wetland Studies publication no 445.

Chapter 2: Fish community composition of a non-estuarine bay
39
References 1. Blaber SJM, Blaber TG. Factors affecting the distribution of juvenile estuarine and inshore fish. J. Fish
Biol. 1980; 17: 143-162.
2. Parrish JD. Fish communities of interacting shallow-water habitats in tropical oceanic regions. Mar.
Ecol. Prog. Ser. 1989; 58: 143-160.
3. Nagelkerken I, van der Velde G, Gorissen MW, Meijer GJ, van’t Hof T, den Hartog C. Importance of
mangroves, seagrass beds and the shallow coral reef as a nursery for important coral reef fishes, using a
visual census technique. Estuar. Coast. Shelf Sci. 2000a; 51: 31-44.
4. Nagelkerken I, van der Velde G. Do non-estuarine mangroves harbour higher densities of juvenile fish
than adjacent shallow-water and coral reef habitats in Curaçao (Netherlands Antilles)? Mar. Ecol. Prog.
Ser. 2002; 245: 191-204.
5. Dorenbosch M, van Riel MC, Nagelkerken I, van der Velde G. The relationship of reef fish densities to
the proximity of mangrove and seagrass nurseries. Estuar. Coast. Shelf Sci. 2004; 60: 37-48.
6. Lugendo BR, Pronker A, Cornelissen I, de Groene A, Nagelkerken I, Dorenbosch M, van der Velde G,
Mgaya Y.D. Habitat utilisation by juveniles of commercially important fish species in a marine
embayment in Zanzibar, Tanzania. Aquat. Living Resour. 2005; 18: 149-158.
7. Beck MW, Heck KL JR, Able KW, Childers DL, Eggleston DB, Gillanders BM, Halpern B, Hays CG,
Hoshino K, Minello TJ, Orth RJ, Sheridan PF, Weinstein MP. The identification, conservation, and
management of estuarine and marine nurseries for fish and invertebrates. BioScience 2001; 51: 633-
641.
8. Chittaro PM, Fryer BJ, Sale R, Discrimination of French grunts (Haemulon flavolineatum Desmarest,
1823) from mangrove and coral reef habitats using otolith microchemistry. J. Exp. Mar. Biol. Ecol.
2004; 308: 168-183.
9. Nagelkerken I, Kleijnen S, Klop T, van den Brand RACJ, Cocheret de la Morinière E, van der Velde G.
Dependence of Caribbean reef fishes on mangroves and seagrass beds as nursery habitats: a comparison
of fish faunas between bays with and without mangroves/seagrass beds. Mar. Ecol. Prog. Ser. 2001;
214: 25-35.
10. Little MC, Reay PJ, Grove SJ. The fish community of an East African mangrove creek. J. Fish Biol.
1988; 32: 729-747.
11. van der Velde G, van Avesaath PH, Ntiba MJ, Mwatha GK, Marguillier S, Woitchik AF. Fish fauna of
mangrove creeks, seagrass meadows and sand flats in Gazi Bay, Kenya (Indian Ocean): a study with
nets and stable isotopes. In: Heip CHR, Hemminga MA, de Bie MJM (eds). Monsoons and coastal
ecosystems in Kenya. Netherlands Indian Ocean Programme Cruise Report 1995. 5: 39-50.
12. De Troch M, Mees J, Papadopoulos I, Wakwabi EO. Fish communities in a tropical bay (Gazi Bay,
Kenya): seagrass beds vs. unvegetated areas. Neth. J. Zool. 1996; 46: 236-252.
13. Kimani EN, Mwatha GK, Wakwabi EO, Ntiba JM, Okoth BK. Fishes of a shallow tropical mangrove
estuary, Gazi, Kenya. Mar. Freshwat. Res. 1996; 47: 857-868.
14. Wakwabi EO. The ichthyofauna of a tropical mangrove bay (Gazi bay, Kenya): Community structure
and trophic organisation. Ph.D. Thesis, Instituut voor Dierkunde, vakgroep morfologie, systematiek en
ecologie, Universiteit Gent, 1999.

Chapter 2: Fish community composition of a non-estuarine bay
40
15. Morton RM. Community structure, density and standing crop of fishes in a subtropical Australian
mangrove area. Mar. Biol. 1990; 105: 385-394.
16. Nagelkerken I, Roberts CM, van der Velde G, Dorenbosch M, van Riel MC, Cocheret de la Morinière
E, Nienhuis PH. How important are mangroves and seagrass beds for coral-reef fish? The nursery
hypothesis tested on an island scale. Mar. Ecol. Prog. Ser. 2002; 244: 299-305.
17. Thollot P, Kulbicki M. Overlap between fish fauna inventories of coral reefs, soft bottoms and
mangroves in Saint-Vincent bay (New Caledonia). Proceedings of the 6th International Coral Reef
Symposium, Australia. 1988; 2: 613-618.
18. Chong VC, Sasekumar A, Leh MUC, Cruz RD. The fish and prawn communities of a Malaysian coastal
mangrove ecosystem, with comparisons to adjacent mud/sand flats and inshore waters. Estuar. Coast.
Shelf Sci. 1990; 31: 703-722.
19. Cederlöf U, Rydberg L, Mgendi M, Mwaipopo O. Tidal exchange in a warm tropical lagoon: Chwaka
Bay, Zanzibar. Ambio 1995; 24: 458-464.
20. McClanahan TR. Seasonality in East Africa’s coastal waters. Mar. Ecol. Prog. Ser. 1988; 44: 191-199.
21. Mohammed SM, Johnstone RW, Widen B, Jordelius E. The role of mangroves in the nutrient cycling
and productivity of adjacent seagrass communities, Chwaka Bay, Zanzibar. Zoology Department,
Stockholm University, Sweden, and University of Dar es Salaam, Tanzania. 1995.
22. Johnstone RW, Mohammed SM. Spatial and temporal variations in water column nutrient
concentrations in a tidally dominated mangrove creek: Chwaka Bay, Zanzibar. Ambio 1995; 24: 482-
486.
23. Lugendo BR, de Groene A, Cornelissen I, Pronker A, Nagelkerken I, van der Velde G, Mgaya YD.
Spatial and temporal variation in fish community structure of a marine embayment in Zanzibar,
Tanzania. (In Press).
24. Dorenbosch M,. Grol MGG, Christianen MJA, Nagelkerken I, van der Velde G. Indo-Pacific seagrass
beds and mangroves contribute to fish density and diversity on adjacent coral reefs. Mar. Ecol. Prog.
Ser. 2005; 302: 63-76.
25. Froese R, Pauly D. (eds.). FishBase. World Wide Web electronic publication. www.fishbase.org,
version (12/2005).
26. Lieske E, Myers R. Coral Reef Fishes: Indo-Pacific and Caribbean. Harper Collins. 1994.
27. Field A. Discovering statistics using SPSS for Windows. Sage Publications, London. 2000.
28. Chao A, Chazdon RL, Colwell RK, Shen T. A new statistical approach for assessing similarity of
species composition with incidence and abundance data. Ecology Letters 2005; 8: 148-159.
29. Quinn NJ. Analysis of temporal changes in fish assemblages of Serpentine Creek, Queensland,
Australia. Environ. Biol. Fishes 1980; 5: 117-133.
30. Laroche J, Baran E, Rasoanandrasana NB. Temporal patterns in a fish assemblage of a semiarid
mangrove zone in Madagascar. J. Fish Biol. 1997; 51: 3-20.
31. Kwak SN, Klumpp DW. Temporal variation in species composition and abundance of fish and
decapods in Cockle Bay, North Queensland, Australia. Aquat. Bot. 2004; 78: 119–134.
32. Barletta M, Barletta-Bergan A, Saint-Paul U, Hubold G. The role of salinity in structuring the fish
assemblages in a tropical estuary. J. Fish Biol. 2005; 66: 45-72.

Chapter 2: Fish community composition of a non-estuarine bay
41
33. Gray CA, McElligott DJ, Chick RC. Intra- and inter-estuary differences in assemblages of fishes
associated with shallow seagrass and bare sand. Aust. J. Mar. Fresh. Res. 1996; 47: 723-735.
34. Jenkins GP, Hamer PA. Spatial variation in the use of seagrass and unvegetated habitats by post-
settlement King George whiting (Percoidei: Sillaginidae) in relation to meiofaunal distribution and
macrophyte structure. Mar. Ecol. Prog. Ser. 2001; 224: 219-229.
35. Mateo I, Tobias WJ. Distribution of shallow water coral reef fishes on the Northeast coast of St. Croix,
USVI. Carib. J. Sci. 2001; 37: 210-226.
36. Gratwicke B, Speight MRS. The relationship between habitat complexity and fish species richness and
abundance in shallow tropical marine habitats. J. Fish Biol. 2005; 66: 650–667.
37. Pinto L, Punchihewa NN. Utilization of mangroves and seagrasses by fishes in the Negombo estuary,
Sri Lanka. Mar. Biol. 1996; 126: 333-345.
38. Robertson AI, Duke NC. Mangrove as nursery sites: Comparison of the abundance and species
composition of fish and crustaceans in mangroves and other near shore habitats in tropical Australia.
Mar. Biol. 1987; 96: 193-205.
39. Laegdsgaard P, Johnson CR. Mangrove habitats as nurseries: unique assemblages of juvenile fish in
subtropical mangroves in Eastern Australia. Mar. Ecol. Prog. Ser. 1995; 126: 67-81.
40. Thayer GW, Colby DR, Hettler WF. Utilization of the red mangrove prop root habitats by fishes in
south Florida. Mar. Ecol. Prog. Ser. 1987; 35: 25-38.
41. Forward RB Jr., Tankersley RA. Selective tidal-stream transport of marine animals. Oceanogr. Mar.
Biol. Ann. Rev. 2001; 39: 305-353.
42. Nagelkerken I, Dorenbosch M, Verberk, WCEP, Cocheret de la Morinière E, van der Velde G.
Importance of shallow-water biotopes of a Caribbean bay for juvenile coral ref fishes: patterns in
biotope association, community structure and spatial distribution. Mar. Ecol. Prog. Ser. 2000b; 202:
175-192.
43. Nakamura Y, Sano M. Overlaps in habitat use of fishes between a seagrass bed and adjacent coral and
sand areas at Amitori Bay, Iriomote Island, Japan: Importance of the seagrass bed as juvenile habitat.
Fish. Sci. 2004; 70: 788-803.
44. Laegdsgaard P, Johnson C. Why do juvenile fish utilise mangrove habitats? J. Exp. Mar. Biol. Ecol.
2001; 257: 229-253.
45. Cocheret de la Morinière E, Nagelkerken I, van der Meij H, van der Velde G. What attracts juvenile
coral reef fish to mangroves: Habitat complexity or shade? Mar. Biol. 2004; 144: 139-145.
46. Verweij MC, Nagelkerken I, de Graaff D, Peeters M, Bakker EJ, van der Velde G. Structure, food and
shade attract juvenile coral reef fish to mangrove and seagrass habitats: a field experiment. Mar. Ecol.
Prog. Ser. 2006; 306: 257-268.
47. Ikejima K, Tongnunui P, Medej T, Taniuchi T. Juvenile and small fishes in a mangrove estuary in
Trang province, Thailand: seasonal and habitat differences. Estuar. Coast. Shelf Sci. 2003; 56: 447-457.
48. Dittmann S. Abundance and distribution of small infauna in mangroves of Missionary Bay, north
Queensland, Australia. Rev. Biol. Trop. 2001; 49: 535-44.
49. Bloomfield AL, Gillanders BM. Fish and invertebrate assemblages in seagrass, mangrove, saltmarsh,
and nonvegetated habitats. Estuaries 2005; 28: 63-77.
Chapter 2: Fish community composition of a non-estuarine bay
42
50. Blaber SJM, Young JW, Dunning MC. Community structure and zoogeographic affinities of the coastal
fishes of the Dampier region of North-western Australia. Aust. J. Mar. Fresh. Res. 1985; 36: 247–266.
Chapter 3
Spatial and temporal variation in fish community structure
of a marine embayment in Zanzibar, Tanzania
Lugendo BR, de Groene A, Cornelissen I, Pronker A,
Nagelkerken I, van der Velde G, Mgaya YD
(In press-Hydrobiologia)

Chapter 3: Spatial-temporal variations in fish community structure
44
Abstract: Spatial and temporal variation in the fish community structure were studied in a tropical non-estuarine embayment in Chwaka Bay, Zanzibar (Tanzania). Fish samples were collected bi-monthly (at each spring low tide) for 1 year (November 2001–October 2002) from a range of bay habitats ranging from mangroves deep inside the bay to seagrass beds close to the mouth of the bay. Additionally, environmental variables were examined to determine their relationship with the fish community structure. Being a non-estuarine embayment, the environmental variables as well as the fish community structure in each habitat remained relatively constant for most part of the year; however, a marked decline was observed during the rainy period (April–May). Significant variations in fish community variables (density, biomass and species richness) and in water temperature and salinity were observed during the rainy season in all habitats, with larger changes in the mangroves and mud/sand flats habitats than in the seagrass beds. Seasonal variations in water clarity and dissolved oxygen were not significant, though. Many species disappeared from the mangrove and mud/sand flats habitats during the rainy season and those which persisted showed a remarkable decrease in density. Moreover, the results indicate that mangroves were the preferred settling habitats for Gerres filamentosus, Gerres oyena, Lethrinus lentjan and Monodactylus argenteus, especially during the dry period (December–February) before the rainy season. This observation is contrary to what has been reported from some other tropical regions where greater abundance and species richness was observed during the rainy season. A significant relationship was found between density of fish and temperature, salinity and visibility. Since salinity was the most conspicuously changing environmental variable with seasons, we propose that salinity, alone or in combination with low visibility and temperature, was probably the most important environmental factor structuring the fish assemblage in the mangroves and mud/sand flats habitats, particularly during the rainy season.
INTRODUCTION
In many studies around the world, estuaries have been reported to harbour juveniles of various reef
fish species. For some species the utilisation of estuaries is an important phase during their life cycle
(Day, 1981). Consequently, these habitats are referred to as nursery areas in several studies (Parrish,
1989). While few marine species spawn in estuaries, many fry enter estuaries shortly after hatching in
adjacent marine waters (Blaber, 2000). Mangroves, mudflats and seagrass beds in these estuaries
appear to offer an attractive habitat for many species of fish and may offer some advantages over coral
reefs for early survival of young juveniles. Several reasons explaining the high abundances of juvenile
reef fish species in estuaries in these habitats have been proposed: food abundance (Nagelkerken et al.,
2000; Laegdsgaard & Johnson, 2001), protection against predation (Parrish, 1989; Robertson &
Blaber, 1992; Laegdsgaard & Johnson, 2001; Cocheret de la Morinie`re et al., 2004; Verweij et al.,
2006), and interception of planktonic fish larvae due to their large areas (Parrish, 1989).
The abundance of larvae and juvenile fish can, however, be influenced by physical conditions
like salinity, turbidity and temperature that vary in time, largely due to seasonal variations in
freshwater input (Cyrus & Blaber, 1987; Barletta et al., 2000; Barletta-Bergan et al., 2002a, b; Barletta
et al., 2003, 2005). However, due to the relative stability of temperature in annual patterns within the
tropics, physical conditions other than temperature influence larval fish occurrence in tropical estuaries
(Barletta-Bergan et al., 2002b).Studies from tropical estuaries show that salinity and freshwater input
are important factors associated with fish community structure including larval fish abundance (de
Morais & de Morais, 1994; Barletta-Bergan et al., 2002a, b; Barletta et al., 2003, 2005). In Southern
African estuaries, salinity and turbidity have been reported to be important factors influencing larval
fish abundance (Cyrus & Blaber, 1987; Whitfield, 1994). Other environmental factors like oxygen
(Louis et al., 1995) and monsoon-driven coastal currents may influence seasonal dispersal and

Chapter 3: Spatial-temporal variations in fish community structure
45
community structure of estuarine larval fish (Tzeng et al., 2002). However, the response to
environmental variables has been shown to be species-specific (Tzeng & Wang, 1992; Barletta-Bergan
et al., 2002b).
Comparable to estuaries, marine embayments harbouring mangroves and seagrasses have been
reported to play a similar role for juvenile fish (Nagelkerken & van der Velde, 2002; Lugendo et al.,
2005). Depending on the configuration of the area, these bays could as well receive a considerable
freshwater input during just the rainy season, which will consequently result into (short-term) changes
in environmental variables similar to those occurring in estuarine habitats. Being a non-estuarine
embayment, the study site at Chwaka Bay in Unguja Island (Zanzibar, Tanzania) maintains a stable
marine environment for a large part of the year, except during the rainy season when part of the bay
acquires estuarine characteristics.
Many fish species seagrass and mangrove habitats as feeding and/or nursery areas in a way
which generally leads to the use of different habitats in different seasons of the year, for example,
during periods of highest primary production. In many tropical estuaries, high primary production
occurs in the warm and wet season, but in high-salinity fringing mangroves highest primary
production occurs during the hot and dry season (Yáñez-Arancibia et al., 1988). This can result into
seasonal and spatial variation in fish densities and recruitment (Robertson & Duke, 1987; Ya´n˜ ez-
Arancibia et al., 1988) as well as in fish community structure (Robertson & Duke, 1990). The
knowledge concerning the utilisation by fish of mangroves and seagrass habitats in East Africa is
limited to a few studies done in Kenya (Little et al., 1988; van der Velde et al., 1995a, b; De Troch et
al., 1996; Kimani et al., 1996) and in Tanzania (Lugendo et al., 2005). Worldwide, most studies have
been done in (temperate) estuaries, and little is known of how environmental variables influence fish
communities in marine embayments.
The present study investigated the fish community structure in a tropical marine embayment
harbouring mangroves, mud/sand flats and seagrass habitats, in relation to seasonal variation in
environmental variables, to answer the following questions: (1) Are there seasonal variations in
physico-chemical variables and in fish density, biomass, size, and species richness in different bay
habitats? (2) Is there a correlation between presence of fish species and environmental variables? (3) In
which bay habitat and season does recruitment of fish occur?

Chapter 3: Spatial-temporal variations in fish community structure
46
MATERIALS AND METHODS
Study site
Chwaka Bay harbours several marine habitats, including mangrove creeks, mangrove channel,
mud/sand flats and seagrass beds. It is a shallow non-estuarine embayment located on the east coast of
Unguja Island, Zanzibar, Tanzania (Fig. 1). Chwaka Bay is an intertidal water body (average depth of
3.2 m) and its area varies with the tide: the estimated area during high spring tide is 50 km2 and during
low spring tide it is 20 km2 with a mean tidal range of 3.2 m (Cederlo¨ f et al., 1995). Air temperature
ranges between 27 and 30oC and rainfall between 1,000 and 1,500 mm per annum. There are two rainy
seasons in Zanzibar: the long rains that occur during the months of March, April and May, and the
short rains which extend from October to December (McClanahan, 1988). During the study period in
2001 the short rains of October–December were very restricted (maximum 64.2 mm) and are therefore
considered a dry season here. The maximum amount of rainfall during the sampling period was 705.4
mm and was recorded in April 2002; for the rest of the year an average (±SD) of 88.6 ± 38.1 mm was
recorded. Winds are northeast monsoons (October–March) and southeast monsoons (March–October),
with short intermittent periods.
On the landward side, Chwaka Bay is bordered by a dense mangrove forest of approximately
3,000 ha (Mohammed et al., 1995). A number of tidal creeks characterise this mangrove forest, with
Mapopwe Creek (approximately 2 m deep) being the largest and the main water exchange route
between the forest and the embayment. These creeks are intertidal in nature and none have any
significant freshwater input other than rain. During the rainy season, salinity gradients develop and
they temporarily acquire estuarine characteristics with salinities as low as 5 ppt (Johnstone &
Mohammed, 1995). This part of the bay is characterised by low visibility (range 0.3–1.7 m) and
oxygen levels (range 2.9–5.9 mg/l). On the seaward side, immediately adjacent to the forest, the
embayment opens up to large intertidal flats that are characterised by mixed assemblages of algae and
seagrasses and scattered monospecific seagrass stands. The outer and middle parts of bay (about 4 m
deep) are oceanic in character with salinities rarely below 35 ppt and a relatively high visibility
(horizontal Secchi disk visibility) of 6.3–15.8 m. The mangrove part of the bay is characterised by
higher ammonium concentrations as compared to the rest of the bay, as well as a higher ammonium
concentration during the dry season as compared to the wet season (Johnstone & Mohammed, 1995;
Mohammed & Johnstone, 2002). Similarly, the mangrove part of the bay is characterised by higher
primary productivity than the rest of the bay with significantly higher levels during November–
December period (Kyewalyanga, 2002). The bay is relatively sheltered since it is protected from the
high-energy ocean on the east coast by a reef system running along the coastline, as well as the
Michamvi peninsula (Fig. 1).

Chapter 3: Spatial-temporal variations in fish community structure
47
Marumbi
Chwaka
5
4
2 1
N
3
39o 24’
0 km 4 8
Chwaka Bay
Tanzania Zanzibar
Zanzibar
6o 6’
39o 30’
6o 12’
Micham
vi peninsula
ChwakaBay
(Unguja)
Fig. 1 Map of Chwaka Bay showing the locations of the sampled habitats (1 = mangrove creeks, 2 = mangrove channel, 3 = mud/sand flats, 4 = Chwaka seagrass bed, 5 = Marumbi seagrass bed). Gray areas in Chwaka Bay indicate mangrove forests
Field sampling
Prior to fish sampling, water temperature, pH, salinity and dissolved oxygen were measured using a
temperature-compensated Multi Parameter Analyser (Eijkelkamp, model 18.28). Furthermore,
visibility was determined using a line extended to the maximum horizontal distance at which a
snorkeller in the water could discern a black and white coloured Secchi disk (44 cm diameter).
Environmental variables could not be measured during some months due to equipment failure and no
possibilities for repair or replacement.
Fish samples were collected bi-monthly (at each spring low tide) for a period of 1 year
(November 2001–October 2002) from five habitats in Chwaka Bay: (1) mangrove creeks, (2)
mangrove channel, (3) intertidal mud/sand flats located 2 km from the mangroves, (4) Chwaka
seagrass beds located about 6 km from the mangroves, and (5) Marumbi seagrass beds situated about 8
km from the mangroves (Fig. 1). Characterised by a muddy substratum and prop roots of the mangrove
Rhizophora mucronata (Lamarck), the mangrove creeks and channel habitats had few algae and
seagrasses. The mud/ sand flats were characterised by a higher cover of algae and some seagrasses.
The sampled seagrass beds consisted of vast fields of Enhalus acoroides (L.) Royle, interrupted by
small patches of Thalassodendron ciliatum (Forsskål) den Hartog and the calcareous algae Halimeda
spp.
A seine net measuring 35 m in length, 3 m in height and with a stretched mesh size of 1.8 cm
was used to collect fish from all habitats, except in the creeks, with a sampled area of approximately
480 m2 per haul. The seine net could not be used in the creeks due to their narrowness. Instead, an

Chapter 3: Spatial-temporal variations in fish community structure
48
alternative method was used where the mouth of the mangrove creeks (about 4 m wide) was closed by
the net and the whole net laid out upstream at one side of the creek (about 30 m) and then closed again,
sampling an area of approximately 120 m2. In each habitat, four replicate hauls were randomly taken
during each spring tide.
To make sure that the net remained vertically stretched and touched the bottom, a metal chain
was attached at the middle part of the sinker line. In addition, plastic floats were attached to the float
line so that the upper side of the net remained afloat. Concurrently, snorkelling observations were
made for net efficiency during deployment to check whether the net trailed over the substratum and if
any fish escaped. We observed that the lower part of the net remained on the bottom throughout the
exercise and no fish escaped below the net. Only some individuals of Mugilidae jumped over the net.
It was concluded that the procedure was well designed for the species under study. To standardize the
methods, we involved the same two fishermen, using the same net, and similar net deployment
procedures throughout the sampling period.
Fish fork lengths of caught specimens were measured to the nearest 0.1 cm and their wet
weight established to the nearest 0.1 g as a measure of biomass. In order to describe the overall picture
of the bay, the variation in total density, total biomass and species richness is presented for each bay
habitat. In addition, based on their high frequency of occurrence, numerical dominance, their
commercial value, their potential as nursery species (Dorenbosch et al., 2005) and their occurrence in
more than one habitat, the following species were studied in more detail to investigate the influence of
seasonal variations on individual species and size classes: Gerres filamentosus (Cuvier), Gerres oyena
(Forsskål), Lethrinus lentjan (Lacepède), Lutjanus fulviflamma (Forsskål), Monodactylus argenteus
(Linnaeus), Siganus sutor (Valenciennes) and Sphyraena barracuda (Walbaum).
It should be noted that the majority of the juveniles collected in this study were larger than 2.5
cm in length. The smaller fish (<2.5 cm) were mostly fish larvae about to settle and tended to pass
through the net and this may possibly have lead to a small underestimation of the total density of very
young juveniles under study. However, since the same mesh size was used throughout the bay habitats,
the effect of the net (if any) applies for all the habitats and hence the observations from this study are
representative for the different bay habitats. Detailed information (density, biomass, etc.) at species
level on the fish community structure of Chwaka Bay can be found in Lugendo et al. (in press, in
revision).
Statistical analysis
A choice for a parametric or a non-parametric test was made after the data were tested for
homogeneity of variances using a Levene’s test. In case variances were homogeneous, a one-way
ANOVA was employed to test differences in both fish community variables and environmental
variables across the range of habitats and among seasons (dry season before rainy season, rainy
season, and dry season after rainy season). Habitat and season were tested separately. Since sample

Chapter 3: Spatial-temporal variations in fish community structure
49
sizes were very different, a Hochberg’s GT2 was used as a post-hoc test due to its greater statistical
power in such kind of data compared to other tests (Field, 2000). All data that did not show
homogeneous variances were log-transformed, and a Levene’s test was performed once again. A
Kruskal–Wallis test was used as a non-parametric test equivalent to a one-way ANOVA when
variances were not homogeneous, even after log-transformation. In this case, a Games–Howell post-
hoc was used because this test is more powerful and specifically designed for lack of homogeneity of
variances (Field, 2000).
To examine the relationship between fish community and environmental variables in different
bay habitats, two sets of multiple linear regression analyses were performed; (1) for mean density,
biomass and species richness of all species pooled, (2) for total density of each of the seven selected
species. All analyses were performed using the programme SPSS for Windows (Field, 2000). Semi-
partial (Part) correlations are provided to show the correlations of the separate independent variables
with the dependent variable, taking the effect of the other independent variables into account. A
significance level of P < 0.05 was used in all tests. Correlations between environmental variables and
the fish densities were also examined with a Principal Component Analysis, using the Canoco 4.0
ordination program (ter Braak & Smilauer, 1998). Scaling was focused on inter-species distances, and
species scores were divided by the standard deviation.
RESULTS
Temporal and spatial variation in physico-chemical variables
The measured abiotic variables varied both spatially and seasonally. While pH, water temperature and
oxygen levels were lowest just after the rainy season (June–July), salinity and visibility were lowest
during the rainy season (April–May; see Supplementary material). There was a marked seasonal
variation in salinity for mangrove and mud/sand flats habitats with lowest values (as low as 5‰ in the
mangrove channel) recorded during the rainy season. Variations in salinity were less pronounced in
Marumbi seagrass beds where levels remained close to that of oceanic water throughout the year
(average 35.5‰; see Supplementary material). Nevertheless, the variations in salinity were significant
between seasons in all habitats, with salinity during the rainy season being significantly different from
those of the other two seasons (Hochberg’s GT2, P < 0.05 for mangrove creeks, Games–Howell, P <
0.05, for the other habitats). Significant seasonal variations were also observed for water temperature
(Kruskal–Wallis, P < 0.001) in all habitats.
Lowest values for salinity, oxygen and visibility were recorded within mangrove habitats (i.e.
mangrove creeks and mangrove channel) and mud/sand flats, whereas highest values were recorded
for the seagrass habitats (Chwaka and Marumbi seagrass beds; see Supplementary material). While
water temperature and pH did not vary significantly across habitats, salinity, oxygen and visibility did
Chapter 3: Spatial-temporal variations in fish community structure
50
(Kruskal–Wallis; P = 0.030, P = 0.001 and P < 0.001, for salinity, oxygen and visibility, respectively).
Significantly higher values (Games–Howell; P < 0.05) were recorded within the seagrass habitats as
compared to either the mangrove habitats only (for salinity and oxygen), or the mangrove habitats as
well as mud/sand flats (for visibility).
Temporal variation in total fish density, biomass and species richness
In the mangrove creeks, two peaks for both density and biomass were observed during the two dry
periods: before (in December) and after (in July) the rainy period (Fig. 2). During the rainy season, a
sharp drop in total density and biomass was observed. For the mangrove channel and mud/sand flats
only a high peak was observed for fish biomass and density in the dry period before the rainy season,
with a sharp drop during the rainy period and only a slight increase afterwards. Also Chwaka and
Marumbi seagrass beds showed only a high peak in fish biomass and density before the rainy season,
viz. around November/December. Significant differences among seasons were found for fish densities
in all habitats (mangrove creeks: one-way ANOVA, P = 0.001; mangrove channel: one-way ANOVA,
P < 0.001; mud/sand flats: Kruskal–Wallis, P < 0.0010; Chwaka seagrass beds: one-way ANOVA, P <
0.001; and Marumbi seagrass beds: one-way ANOVA, P < 0.001), with significant differences
between the rainy season and the two dry seasons (for mangrove habitats, Hochberg’s GT2; P <
0.001), between the dry season after the rainy season and either the rainy season or the dry season
before the rainy season (for mud/sand flats, Games–Howell; P < 0.001, for Marumbi, Hochberg’s
GT2; P = 0.024, and for Chwaka seagrass beds, Hochberg’s GT2; P = 0.006).

Chapter 3: Spatial-temporal variations in fish community structure
51
0
200
400
600
800
0
2
4
6
8DensityBiomass
Mangrove creeks
n.s.
0
100
200
300
0
1
2Mangrove channel
0
50
100
150
200
0
1
2Mud/sand flats
0
100
200
300
400
0
1
2
3
4Chwaka seagrass beds
0
100
200
300
400
Nov Dec Jan Feb Mar Apr May Jun Jul Aug Sep Oct0246810Marumbi seagrass beds
rainy seasondry season dry season
n.s.B
iom
ass (
Kg/
1000
m2 )
Den
sity
± S
E (#
/100
0m2 )
Fig. 2 Temporal variation in mean total fish biomass and mean total density (± SE) in different bay habitats in Chwaka Bay. No sampling (n.s.) was done during November in the mangrove creeks and during January in the Marumbi seagrass beds
Species richness also varied over the year with a marked decrease during the rainy season for
all habitats except Marumbi seagrass beds, which also had few species during the dry period following
the rainy season (Fig. 3). Generally, the highest number of species was observed during the dry period
before the rainy season. The seasonal variation in species richness was significant in all habitats
(mangrove creeks: oneway ANOVA, P < 0.001; mangrove channel: oneway ANOVA, P = 0.006;
mud/sand flats: Kruskal–Wallis, P = 0.002; Chwaka seagrass beds: one-way ANOVA, P < 0.001; and
Marumbi seagrass beds: one-way ANOVA, P = 0.006). The significant seasonal variation in species
richness was always present between the rainy season and the dry season before the rainy season, for
the mangroves creeks (Hochberg’s GT2; P < 0.001), mangrove channel (Hochberg’s GT2; P = 0.004)
and mud/sand flats (Games–Howell; P < 0.001), and between the two dry seasons for the mud/ sand
flats (Games–Howell; P < 0.001), and Chwaka and Marumbi seagrass beds (mud/sand flats,
wochberg’s GT2; P < 0.001).

Chapter 3: Spatial-temporal variations in fish community structure
52
Mangrove creeks
048
1216
n.s.
Mangrove channel
048
1216
Mud/sand flats
048
1216
Chwaka seagrass beds
0
4
8
12
16
Marumbi seagrass beds
0
48
12
16
Nov Dec Jan Feb Mar Apr May Jun Jul Aug Sep Oct
dry season rainy season dry season
n.s.
Mea
n sp
ecie
s ric
hnes
s (+
SE)
Fig. 3 Temporal variation in mean species richness (+SE) in different bay habitats in Chwaka Bay. No sampling (n.s.) was done during November in the mangrove creeks and during January in the Marumbi seagrass beds
Chapter 3: Spatial-temporal variations in fish community structure
53
Temporal variation in density and size of target species
The majority of fish caught within the bay habitats were larger than 4 cm; however, in four of the
seven common species (i.e. G. filamentosus, G. oyena, L. lentjan, and M. argenteus) also recruits (< 4
cm) were recorded, although in low densities (Fig. 4). The majority of these smallsized juveniles were
found within the mangrove creeks and channel, and sometimes also in the mud/sand flats. They were
most abundant during the dry seasons, especially the one before the rainy season (Fig. 4). G. oyena
additionally showed a high peak of small juveniles after the rainy season.
Generally, regardless of size, there was a sharp drop in density of species during the rainy
season in the mangrove habitats and mud/sand flats. Many species disappeared from these habitats and
those which persisted showed a remarkable decrease in density (Fig. 4). This was also revealed at
family level where Apogonidae, Gerreidae, Leiognathidae, Lethrinidae and Teraponidae, which were
abundant families in the mangrove and mud/sand flat habitats, peaked during the dry season before the
rain and disappeared during the rainy season. There were two exceptional families: Ambassidae
(Ambassis gymnocephalus (Lacepède)) and Cyprinodontidae (Pantanodon podoxys (Myers)) which
peaked just after the rain season in the mangrove creeks (Fig. 5a). In Chwaka seagrass beds
Teraponidae showed a decrease in density during the rainy season, whereas Gerreidae, abundant in
four out of the five studied habitats, together with medium and/or large-sized fishes of two other
species (i.e. Lutjanus fulviflamma and Sphyraena barracuda), showed elevated densities during the
wet season (Fig. 4). The Marumbi seagrass beds did not show a pattern of low densities of the above-
mentioned families during the rainy season versus high densities during the dry seasons.
Correlation with environmental variables
Multiple regression analysis showed that in three of the five studied habitats (mangrove channel,
mud/sand flats and Chwaka seagrass beds), environmental variables showed significant relationships
with fish community variables (see Supplementary material). In the mangrove channel mean density
and species richness showed a negative relationship with temperature (r2 = 0.697, P = 0.032, and r2 =
0.795, P = 0.022, for mean density and species richness, respectively). In the mud/sand flats mean
density of fish had negative relationships with temperature, visibility and salinity (full model: r2 =
0.997, P = 0.007) while species richness showed a negative relationship with temperature, salinity,
oxygen and visibility (full model: r2 = 0.992, P = 0.017). In Chwaka seagrass beds mean species
richness showed a negative relationship with temperature and visibility (full model: r2 = 0.982, P =
0.037). No significant relationship was found between mean biomass and environmental variables in
any of the habitats (see Supplementary material).
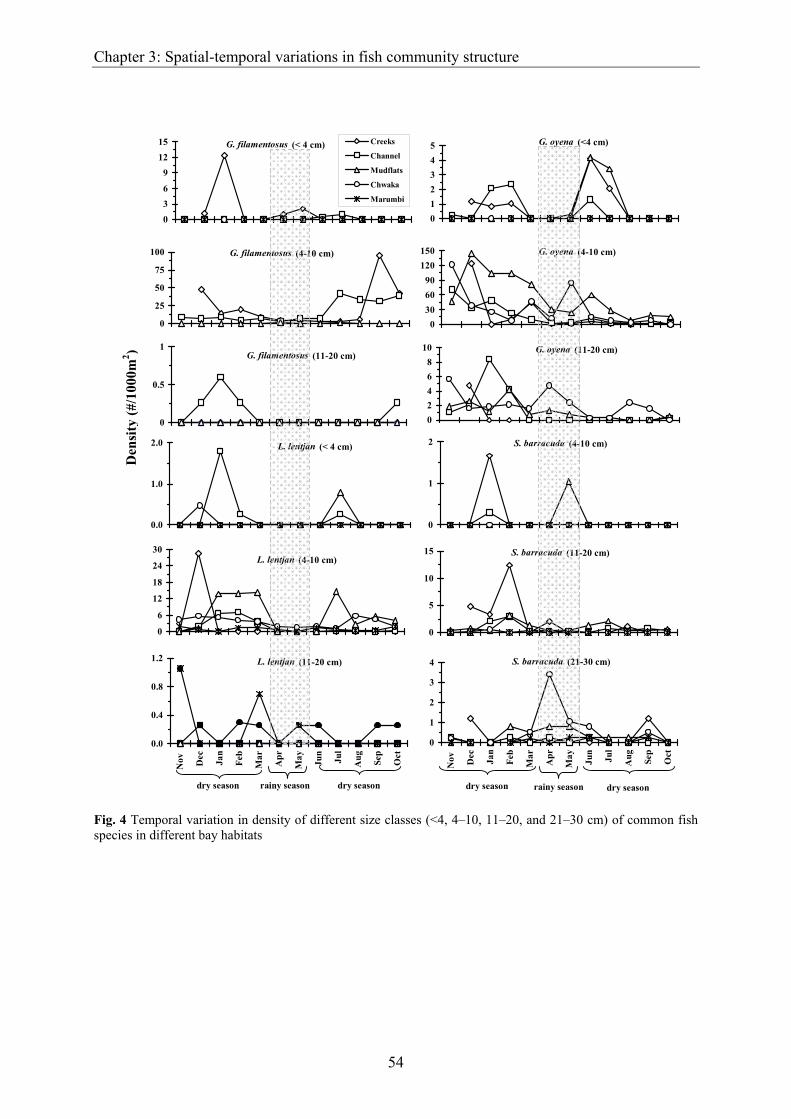
Chapter 3: Spatial-temporal variations in fish community structure
54
0
36
9
1215 Creeks
Channel
Mudflats
Chwaka
Marumbi
G. filamentosus (< 4 cm)
G. filamentosus (4-10 cm)
0
25
50
75
100
G. filamentosus (11-20 cm)
0
0.5
1
G. oyena (4-10 cm)
0306090
120150
G. oyena (11-20 cm)
02468
10
0
1
2 S. barracuda (4-10 cm)
0
5
10
15 S. barracuda (11-20 cm)
0
1
2
3
4
Nov
Dec Jan
Feb
Mar
Apr
May Jun
Jul
Aug Sep
Oct
S. barracuda (21-30 cm)
dry season rainy season dry season
0.0
1.0
2.0 L. lentjan (< 4 cm)
0
6
12
18
24
30L. lentjan (4-10 cm)
0.0
0.4
0.8
1.2
Nov
Dec Jan
Feb
Mar
Apr
May Jun
Jul
Aug Sep
Oct
L. lentjan (11-20 cm)
dry seasonrainy seasondry season
012345 G. oyena (<4 cm)
Den
sity
(#/1
000m
2 )
Fig. 4 Temporal variation in density of different size classes (<4, 4–10, 11–20, and 21–30 cm) of common fish species in different bay habitats

Chapter 3: Spatial-temporal variations in fish community structure
55
0
10
20
30
40Creeks
Channel
Mudflats
Chwaka
Marumbi
M. argenteus (< 4 cm)
0
2
4
6
8
10 L. fulviflamma (4-10 cm)
012345
L. fulviflamma (11-20 cm)
0
10
20
30
40 M. argenteus (4-10 cm)
0
4
8
12
Nov
Dec Jan
Feb
Mar
Apr
May Jun
Jul
Aug Sep
Oct
S. sutor (4-10 cm)
dry season dry seasonrainy season
0
2
4
6
8
10
Nov
Dec Jan
Feb
Mar
Apr
May Jun
Jul
Aug Sep
Oct
S. sutor (11-20 cm)
dry seasonrainy seasondry season
Den
sity
Fig. 4 continued
Significant relationships were also discerned at species level in different bay habitats (see
Supplementary material). In the mangrove channel Gerres filamentosus and Lethrinus lentjan showed
a negative relationship with visibility (r2 = 0.695, P = 0.018 and r2 = 0.756, P = 0.045, for G.
filamentosus and L. lentjan, respectively). Monodactylus argenteus showed a negative relationship
with temperature (r2 = 0.416, P = 0.026) and salinity (r2 = 0.458, P = 0.021), and a positive relationship
with visibility (r2 = 0.652, P = 0.011. In mud/sand flats G. filamentosus showed a negative relationship
with visibility (r2 = 0.731, P = 0.032), while G. oyena had a negative relationship with temperature (r2
= 0.912, P = 0.032). A significant negative relationship was also found between density of Sphyraena
barracuda and salinity in Chwaka seagrass beds (r2 = 0.815, P = 0.033).
Principal component analysis (PCA) showed a clear separation between species in the
mangrove habitats and those in the other habitats (Fig. 6). The eigenvalues of the first and second PCA
axis were 0.686 and 0.225, respectively, indicating that a high proportion of the variation in species
density data could be explained by the hypothetical axes. The PCA graph shows that G. filamentosus
and M. argenteus were present in the mangrove habitats regardless of seasons, and that their densities
in both seasons were negatively correlated with all measured environmental variables (Fig. 6). The
remaining species, viz. G. oyena, L. lentjan, L. fulviflamma and S. barracuda, showed a change in
highest densities during the rainy season from either the mangrove habitats or mud/sand flats to the
seagrass beds, with exception of S. sutor which changed from Chwaka to Marumbi seagrass beds (Fig.
6).

Chapter 3: Spatial-temporal variations in fish community structure
56
0
50
100
150
200 OthersLeiognathidaeLethrinidaeGerreidae
(b) Mangrove channel
0
50
100
150
200 OthersLethrinidaeTeraponidaeGerreidae
(c) Mud/sand flats
0
100
200
300
400OtherTeraponidaeScaridaeGerreidae
(d) Chwaka seagrass beds
0
100
200
300
Nov Dec Jan Feb Mar Apr May Jun Jul Aug Sept Oct
OtherLabridaeSiganidaeScaridae
(e) Marumbi seagrass beds
dry season rainy season dry season
n.s.
Den
sity
(#/1
000m
2 )
0
200
400
600 OthersCyprinodontidaeAmbassidaeApogonidaeGerreidae
(a) Mangrove creeks
n.s.
Fig. 5 Temporal variation in density of abundant families of fish in different habitats in Chwaka Bay. No sampling (n.s.) was done during November in the mangrove creeks and during January in the Marumbi seagrass beds

Chapter 3: Spatial-temporal variations in fish community structure
57
-1.0 +1.0
-1.0
+1.0
temperature-wetoxygen-wet
temperature-drypH-wet
visibility-dryvisibility-wet
salinity-dry
pH-dry
salinity-wet
oxygen-dry
L. fulviflamma-dry
G. oyena-wet
L. lentjan-dry
G. oyena-dry
L. fulviflamma-wet
S. barracuda-wet
G. filamentosus-dry
M. argenteus-dry
G. filamentosus-wet
S. sutor-wet
L. lentjan-wet
M. argenteus-wet
S. barracuda-dry
S. sutor-dry
Mud/sand flats
Chwaka seagrass beds
Marumbi seagrass beds
Mangrove creeks
Mangrove channel
Fig. 6 Principal component analysis (PCA) graph showing correlation between density of common fish species and abiotic variables in dry and wet seasons in different bay habitats
DISCUSSION
Fish community as well as abiotic variables showed temporal variations in Chwaka Bay. Density,
biomass and species richness remained constant for most part of the year but declined significantly
during the rainy season. Likewise, environmental variables remained constant for most part of the
year, however, there was a conspicuous change during the rainy season especially in the mangrove
habitats and mud/ sand flats. Despite the absence of evident surface freshwater inflow into Chwaka
Bay, surface flow from the heavy rains during April caused significant changes in environmental
variables in the mangroves and mud/sand flats habitats. These effects decreased farther out towards the
seagrass beds because these were located further away from the rain water outflow. A relationship was
present between density of fish and temperature, salinity and visibility. Salinity was the most
conspicuously changing environmental variable with seasons. Therefore, salinity, alone or in
combination with low visibility and temperature, was likely the most important environmental factor
structuring the fish assemblage deep within Chwaka Bay (i.e. in the mangrove habitats and mud/sand
flats), particularly during the rainy season. This probably explains the decline in fish density and

Chapter 3: Spatial-temporal variations in fish community structure
58
biomass in the mangrove habitats and mud/sand flats during the rainy season. This effect is also
known from temperate South African estuaries (Strydom & d’Hotman, 2005), and from a northern
Brazilian tropical estuary (Barletta-Bergan et al., 2002b; Barletta et al., 2003, 2005).
Fish found in true estuarine habitats are believed to be generally more tolerant of low salinities
than of high salinities (Weerts & Cyrus, 2002). The opposite seems to be the case for Chwaka Bay
fishes since this bay exhibits marine conditions for most part of the year. As the fish species here are
marine species adapted to ocean water salinities (which is constant for most part the year), they
probably do not withstand the low salinities, perhaps coupled by low visibility, in the mangrove
habitats brought about with the surface run-off from the rain. As a result they appeared to move away
from these habitats. Indeed, low salinities (below 16 ppt) have been reported to be stressful to marine
fish with a possibility of restricting the type and number of species in a particular area (Bulger et al.,
1993). Hence, marine embayments appear to be different from estuaries in that they contain mostly
marine species which appear to migrate away when salinities reach estuarine characteristics. Barletta
et al. (2003) suggested the possibility of the tidal channel of a lower estuary being used as refuge
habitats for species that seek shelter when the estuary is strongly influenced by freshwater. Similarly,
Chwaka seagrass beds may probably serve as a refuge habitat for fishes coming from the mangroves
and mud/sand flats habitats when these habitats are strongly influenced by freshwater. The decline in
fish density and biomass during the rainy period within the mangrove habitats and the increase in
density of some fish species (Gerres oyena, Lutjanus fulviflamma and Sphyraena barracuda) in
Chwaka seagrass beds where fluctuation in abiotic variables was less severe could explain a seasonal
migration of fish in search for an optimal environment. Studies by Barletta-Bergan et al. (2002b) and
Barletta et al. (2003) in the Caete´ Estuary, Brazil, reported seasonal fish movement and migration
during the rainy season due to increase in freshwater runoff which resulted in a decline in salinity.
The most striking observation in the present study is the extent to which short term (April–
May) changes in environmental variables brought about such significant changes in fish densities.
According to Blaber (1980), substrate type, depth and turbidity may be important factors in
determining the distribution of juvenile fish in tropical estuaries rather than salinity. However, given
the fact that Chwaka Bay is not an estuary but has stable environmental variables during most part of
the year, the short-term seasonal variation in salinity here was probably a more important factor in
explaining the temporal variations in fish community structure observed. In this case, other factors like
water depth and substrate type probably have a minor or secondary influence. However, in agreement
with Blaber (1980) under relatively stable environmental conditions, the other factors (water depth and
substrate type) are much more important in explaining the distribution of juvenile fish.
Our results do not address factors that influence recruitment of fish in Chwaka Bay. However,
the seasonal variation in densities of recruits (< 4 cm) of the four target species (Gerres filamentosus,
G. oyena, Lethrinus lentjan and Monodactylus argenteus) suggests a possible timing of settlement
during favourable conditions. Factors like high primary production (Ya´n˜ ez-Arancibia et al., 1988),

Chapter 3: Spatial-temporal variations in fish community structure
59
favourable temperature, turbidity and salinity (Cyrus & Blaber, 1987) seem to be related to the
patterns observed for recruits in the bay habitats. Timing of spawning to match the spatial and
temporal coincidence of recruits and food items has been pointed out to be among possible reasons for
seasonal variations in the abundance of fish larvae (Dickey-Collas et al., 1996). Johnstone &
Mohammed (1995) and Mohammed & Johnstone (2002) report high ammonium concentration (the
form of nitrogen taken up most readily by phytoplankton) within the mangroves of Chwaka Bay as
compared to the rest of the bay, as well as high ammonium concentrations during the dry season as
compared to the wet season. In addition, Kyewalyanga (2002) reported a higher primary productivity
within the mangrove habitats in Chwaka Bay as compared to seagrass beds, and a general high
primary productivity during the November–December period. These observations coincide with higher
densities of recruits within mangrove habitats around this time, suggesting that high primary
production could be among the factors that favours settlement of fish during this period of the year.
Cyrus & Blaber (1987) mention increased turbidity as one of the factors associated with larval fish
abundance. This factor is possibly also important in Chwaka Bay where recruits were abundant in the
mangrove and mud/ sand flats habitats during the dry season, where turbidity was significantly higher
compared to seagrass beds. However, during the rainy season enhanced turbidity and reduced oxygen
levels coupled with osmotic stress due to very low salinities in these areas likely made these habitats
hostile for recruits to survive. These are possibly among the reasons why recruits were abundant in the
mangrove habitats during the dry season and not found here during the rainy period. Four of the seven
studied species showed recruits within the mangroves during January–February period, suggesting that
these species have similar requirements as far as recruitment is concerned. Possible differences in
breeding season or in the habitat preference for recruitment for the other fish species (e.g. Lutjanus
fulviflamma, Siganus sutor and Sphyraena barracuda) need further research as they can not be
substantiated by this study. The dominance of juveniles of Gerreidae in the mangrove habitats is
consistent with other studies done within Indian Ocean and elsewhere (Little et al., 1988; Laroche et
al., 1997; Nagelkerken et al., 2000; Vidy, 2000) while those of Lethrinus lentjan and Monodactylus
argenteus are known to be brackish spending their early life time in mangroves (Froese & Pauly,
2004).
The questions that were set at the beginning of this study can be answered as follows: (1)
There was a significant seasonal variation in physicochemical variables specifically in temperature and
salinity, and in fish density, biomass and species richness in different bay habitats, (2) Water
temperature, salinity and visibility are the environmental variables that showed the highest correlation
with the fish community variables, (3) Settlement of small juveniles (<4 cm) of several common
species occurred mainly in the mangrove habitats and to a lesser extent within the mud/sand flats, and
was highest in the dry season before the rainy season (December–February) when environmental
conditions were probably most favourable. Similar to fish density, the species richness of fishes in
Chwaka Bay was also significantly higher in the dry season (before the rainy season) than in the rainy

Chapter 3: Spatial-temporal variations in fish community structure
60
season. This observation is contrary to what has been reported from some other tropical regions where
higher abundance and species richness was observed during the wet season (West Atlantic: Stoner,
1986; Australia: Robertson & Duke, 1990; Thailand: Ikejima et al., 2003).
Acknowledgements
Field assistance was provided by M.A. Manzi, S.J. Simgeni and M.A. Makame. The administration
and staff of the Institute of Marine Sciences (IMS) in Zanzibar provided logistical support and
research facilities. This study was financially supported by NUFFIC through the ENVIRONS-MHO
Project. A.P., A.G. and I.C. were funded by the Schure-Beijerinck-Popping Foundation and Quo Vadis
Fonds (Radboud University Nijmegen), The Netherlands. I.N. was supported by a VIDI grant from the
Netherlands Organisation for Scientific Research (NWO). This is Centre for Wetland Studies
publication no. 413.

Chapter 3: Spatial-temporal variations in fish community structure
61
References Barletta, M., U. Saint-Paul, A. Barletta-Bergan, W. Ekau & D. Schories, 2000. Spatial and temporal distribution
of Myrophis punctatus (Ophichthidae) and associated fish fauna in a northern Brazilian intertidal
mangrove forest. Hydrobiologia 426: 65–74.
Barletta, M., A. Barletta-Bergan, U. Saint-Paul & G. Hubold, 2003. Seasonal changes in density, biomass, and
diversity of estuarine fishes in tidal mangrove creeks of the lower Caete´ Estuary (northern Brazilian
coast, east Amazon). Marine Ecology Progress Series 256: 217–228.
Barletta, M., A. Barletta-Bergan, U. Saint-Paul & G. Hubold, 2005. The role of salinity in structuring the fish
assemblages in a tropical estuary. Journal of Fish Biology 66: 45–72.
Barletta-Bergan, A., M. Barletta & U. Saint-Paul, 2002a. Community structure and temporal variability of
ichthyoplankton in North Brazilian mangrove creeks. Journal of Fish Biology 61(Suppl. A): 33–51.
Barletta-Bergan, A., M. Barletta & U. Saint-Paul, 2002b. Structure and seasonal dynamics of larval fish in the
Caete´ River Estuary in North Brazil. Estuarine, Coastal and Shelf Science 54: 193–206.
Blaber, J. S. M., 1980. Fish of the Trinity inlet system of North Queensland with notes on the ecology of fish
faunas of tropical Indo-Pacific estuaries. Australian Journal of Marine and Freshwater Research 31: 137–
145.
Blaber, S. J. M., 2000. Tropical estuarine fishes. Ecology, Exploitation and Conservation. Fish and Aquatic
Resources Series 7. Blackwell Science, Oxford.
Bulger, A. J., M. E. Monaco, D. M. Nelson & M. McCormick-Ray, 1993. Biologically-based estuarine salinity
zones derived from a multivariate analysis. Estuaries 16: 311–322.
Cederlo¨ f, U., L. Rydberg, M. Mgendi & O. Mwaipopo, 1995. Tidal exchange in a warm tropical lagoon:
Chwaka Bay, Zanzibar. Ambio 24: 458–464.
Cocheret, de la Morinie`re E., I. Nagelkerken, H. van der Meij & G. van der Velde, 2004. What attracts juvenile
coral reef fish to mangroves: habitat complexity or shade? Marine Biology 144: 139–145.
Cyrus, D. P. & S. J. M. Blaber, 1987. The influence of turbidity on juvenile marine fishes in estuaries. Part 2.
Laboratory studies, comparisons with field data and conclusions. Journal of Experimental Marine Biology
and Ecology 109: 71–91.
Day, J. H., 1981. Estuarine ecology, with particular reference to southern Africa. Rotterdam, Balkema. De Troch,
M., J. Mees, I. Papadopoulos & E. O. Wakwabi, 1996. Fish communities in a tropical bay (Gazi Bay,
Kenya): seagrass beds vs. unvegetated areas. Netherlands Journal of Zoology 46: 236–252.
De Morais, de T. A. & T. L. De Morais, 1994. The abundance and diversity of larval and juvenile fish in a
tropical estuary. Estuaries 17: 216–225.
Dickey-Collas, M., R. J. Gowen & C. J. Fox, 1996. Distribution of larval and juvenile fish in the western Irish
Sea: relationship to phytoplankton, zooplankton biomass and recurrent physical features. Marine and
Freshwater Research 47: 169–181.
Dorenbosch, M., M. G. G. Grol, M. J. A. Christianen, I. Nagelkerken & G. van der Velde, 2005. Indo-Pacific
seagrass beds and mangroves contribute to fish density and diversity on adjacent coral reefs. Marine
Ecology Progress Series 302: 63–76.
Field, A., 2000. Discovering statistics using SPSS for Windows. Sage Publications, London, p 496.
Chapter 3: Spatial-temporal variations in fish community structure
62
Ikejima, K, P. Tongnunui, T. Medej & T. Taniuchi, 2003, Juvenile and small fishes in a mangrove estuary in
Trang province, Thailand: seasonal and habitat differences. Estuarine, Coastal and Shelf Science 56: 447-
457.
Johnstone, R. W. & S. M. Mohammed, 1995. Spatial and temporal variations in water column nutrient
concentrations in a tidally dominated mangrove creek: Chwaka Bay, Zanzibar. Ambio 24: 482–486.
Kimani, E. N., G. K. Mwatha, E. O. Wakwabi, J. M. Ntiba & B. K. Okoth, 1996. Fishes of a shallow tropical
mangrove estuary, Gazi, Kenya. Marine and Freshwater Research 47: 857–868.
Kyewalyanga, M. N. S., 2002. Spatial-temporal changes in phytoplankton biomass and primary production in
Chwaka Bay Zanzibar. Tanzania Journal of Science 28: 11–26.
Laegdsgaard, P. & C. R. Johnson, 2001. Why do juvenile fish utilise mangrove habitats? Journal of Experimental
Marine Biology and Ecology 257: 229–253.
Laroche, J., E. Baran & N. B. Rasoanandrasana, 1997 Temporal patterns in a fish assemblage of a semiarid
mangrove zone in Madagascar. Journal of Fish Biology 51: 3–20.
Little, M. C., P. J. Reay & S. J. Grove, 1988. The fish community of an East African mangrove creek. Journal of
Fish Biology 32: 729–747.
Louis, M., C. Bouchon & Y. Bouchonnavaro, 1995. Spatial and temporal variations of mangrove fish
assemblages in Martinique (French-West-Indies). Hydrobiologia 295: 275–284.
Lugendo, B. R., I. Nagelkerken, G. van der Velde & Y. D. Mgaya, in press, The importance of mangroves, mud
and sand flats, and seagrass beds as feeding areas for juvenile fishes in Chwaka Bay, Zanzibar: gut content
and stable isotope analyses.
Lugendo, B. R., I. Nagelkerken, N. Jiddawi, Y. D. Mgaya & G. van der Velde, in revision, Fish community
composition of a tropical non-estuarine embayment in Zanzibar, Tanzania.
Lugendo, B. R., A. Pronker, I. Cornelissen, A. de Groene, I. Nagelkerken, M. Dorenbosch, G. van der Velde &
Y. D. Mgaya, 2005. Habitat utilisation by juveniles of commercially important fish species in a marine
embayment in Zanzibar, Tanzania. Aquatic Living Resources 18: 149–158.
McClanahan, T. R., 1988. Seasonality in East Africa’s coastal waters. Marine Ecology Progress Series 44: 191–
199.
Mohammed, S. M., R.W. Johnstone, B. Widen & E. Jordelius, 1995. The Role of Mangroves in the Nutrient
Cycling and Productivity of Adjacent Seagrass Communities, Chwaka Bay, Zanzibar. Zoology
Department, Stockholm University, Sweden, and University of Dar es Salaam, Tanzania.
Mohammed, S. M. & R. W. Johnstone, 2002. Porewater nutrient profiles and nutrient sediment-water exchange
in a tropical mangrove waterway, Mapopwe Creek, Chwaka Bay, Zanzibar. African Journal of Ecology
40: 172–178.
Nagelkerken, I., M. Dorenbosch, W. C. E. P. Verberk, E. Cocheret de la Morinie`re & G. van der Velde, 2000.
Day-night shifts of fishes between shallow-water biotopes of a Caribbean bay, with emphasis on the
nocturnal feeding of Haemulidae and Lutjanidae. Marine Ecology Progress Series 194: 55–64.
Nagelkerken, I. & G. van der Velde, 2002. Do non-estuarine mangroves harbour higher densities of juvenile fish
than adjacent shallow-water and coral reef habitats in Curac¸ao (Netherlands Antilles)? Marine Ecology
Progress Series 245: 191–204.

Chapter 3: Spatial-temporal variations in fish community structure
63
Parrish, J. D., 1989. Fish communities of interacting shallow-water habitats in tropical oceanic regions. Marine
Ecology Progress Series 58: 143–160.
Robertson, A. I. & N. C. Duke, 1987. Recruitment, growth and residence time of fishes in a tropical Australian
mangrove system. Estuarine, Coastal and Shelf Science 31: 723–743.
Robertson, A. I. & N. C. Duke, 1990. Mangrove fish communities in tropical Queensland, Australia – Spatial
and temporal patterns in densities, biomass and community structure. Marine Biology 104: 369–379.
Robertson, A. I. & S. J. M. Blaber, 1992. Plankton, epibenthos and fish communities. In Robertson A. I. & D. M.
Alongi (eds), Tropical Mangrove Ecosystems. Coastal and Estuarine Studies 41: 173–224. Strydom, N. A.
& B. D. d’Hotman, 2005. Estuary dependence of larval fishes in a non-estuary associated South African
surf zone: evidence for continuity of surf assemblages. Estuarine, Coastal and Shelf Science 63: 101–108.
Stoner, A.W., 1986, Community structure of the demersal fish of Laguna Joyuda, Puerto Rico. Estuaries 9: 142-152.
ter Braak, C. J. F. & P. Smilauer, 1998. Reference manual and user’s guide to Canoco for Windows: Software
for canonical community ordination (version 4). Microcomputer Power, Ithaca, New York.
Tzeng, W. & Y. Wang, 1992. Structure, composition and seasonal dynamics of the larval and juvenile fish
community in the mangrove estuary of Tanshui River, Taiwan. Marine Biology 113: 481–490.
Tzeng, W. N., Y. T. Wang & C. W. Chang, 2002. Spatial and temporal variations of the estuarine larval fish
community on the west coast of Taiwan. Marine and Freshwater Research 53: 419–430.
van der Velde, G., P. H. van Avesaath, M. J. Ntiba, G. K. Mwatha, S. Marguillier & A. F. Woitchik, 1995a. Fish
fauna of mangrove creeks, seagrass meadows and sand flats in Gazi Bay, Kenya (Indian Ocean): a study
with nets and stable isotopes. In Heip, C. H. R., M. A. Hemminga & M. J. M. de Bie (eds.), Monsoons and
Coastal Ecosystems in Kenya. Netherlands Indian Ocean Programme Cruise Report 5: 39–50.
van der Velde, G., F. Dehairs, S. Marguillier, G. K. Mwatha, R. L. J. M. Op ‘t Veld, S. Rajagopal & P. H. van
Avesaath, 1995b. Structural and stable isotope differences in the fish communities of mangrove creeks,
seagrass meadows and sand flats in Gazi Bay (Kenya). In Hemminga, M. A. (ed.), Interlinkages Between
Eastern-African Coastal Ecosystems. STDIII project. Final report. 132–157.
Verweij, M. C., I. Nagelkerken, D. de Graaff, M. Peeters, E. J. Bakker & G. van der Velde, 2006. Structure, food
and shade attract juvenile coral reef fish to mangrove and seagrass habitats: a field experiment. Marine
Ecology Progress Series 306: 257–268.
Vidy, G., 2000. Estuarine and mangrove systems and the nursery concept: which is which? The case of Sine
Saloum system (Senegal). Wetland Ecology and Management 8: 37–51.
Weerts, S. P. & D. P. Cyrus, 2002. Occurrence of young and small-sized fishes in different habitats within a
subtropical South African and adjacent harbour. Marine and Freshwater Research 53: 447–456.
Whitfield, A. K., 1994. Abundance of larval and 0+ juvenile marine fishes in the lower reaches of three southern
African estuaries with differing freshwater inputs. Marine Ecology Progress Series 105: 257–267.
Yáñez-Arancibia, A., A. L. Lara-Domı´nguez, J. L. Rojas Galaviz, P. Sa´nchez-Gil, J. W. Day & C. Madden,
1988. Seasonal biomass and diversity of estuarine fishes coupled with tropical habitat heterogeneity
(southern Gulf of Mexico). Journal of Fish Biology 33: 191–200.
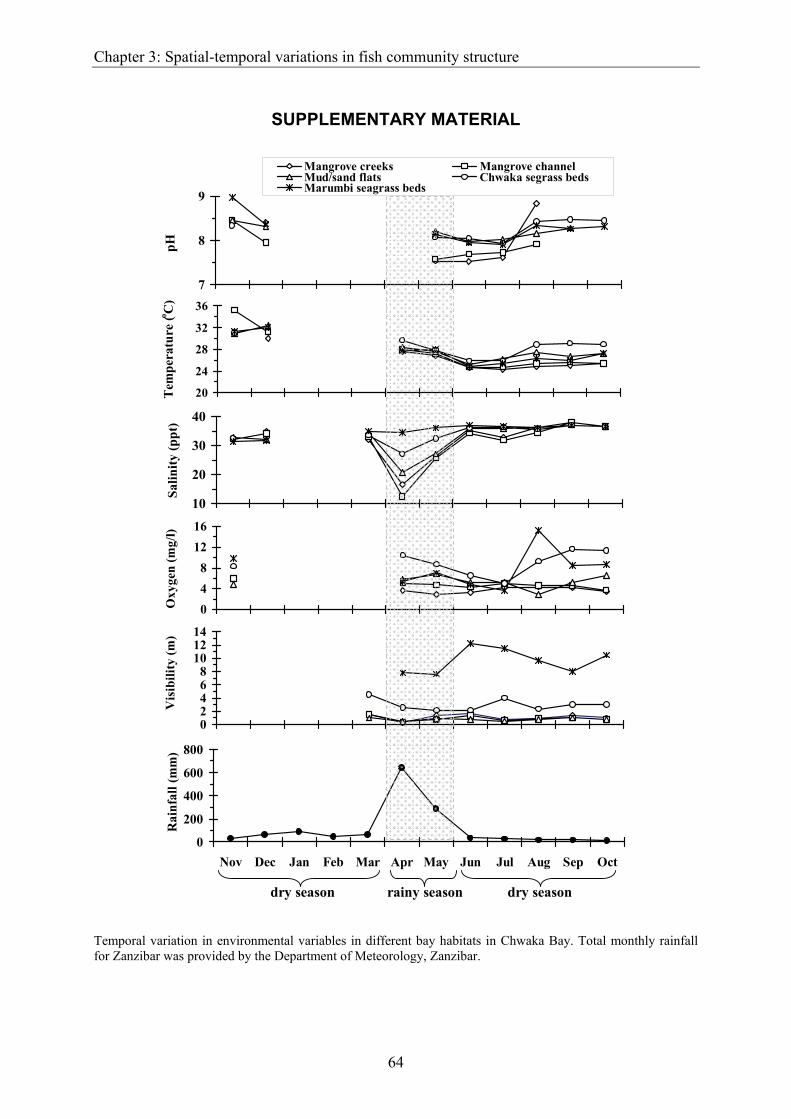
Chapter 3: Spatial-temporal variations in fish community structure
64
7
8
9
pHMangrove creeks Mangrove channelMud/sand flats Chwaka segrass bedsMarumbi seagrass beds
20
24
28
32
36
Tem
pera
ture
(o C)
10
20
30
40
Salin
ity (p
pt)
048
1216
Oxy
gen
(mg/
l)
02468
101214
Vis
ibili
ty (m
)
0
200
400
600
800
Nov Dec Jan Feb Mar Apr May Jun Jul Aug Sep Oct
dry season rainy season dry season
Rai
nfal
l (m
m)
SUPPLEMENTARY MATERIAL
Temporal variation in environmental variables in different bay habitats in Chwaka Bay. Total monthly rainfall for Zanzibar was provided by the Department of Meteorology, Zanzibar.
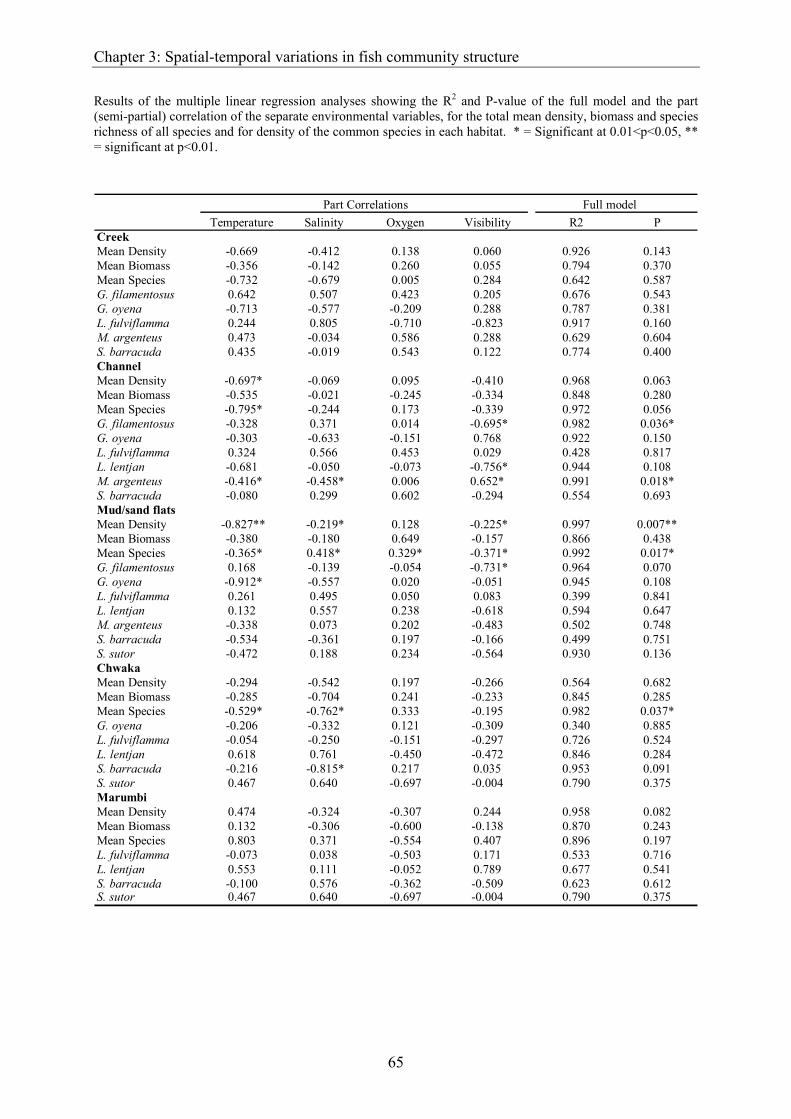
Chapter 3: Spatial-temporal variations in fish community structure
65
Results of the multiple linear regression analyses showing the R2 and P-value of the full model and the part (semi-partial) correlation of the separate environmental variables, for the total mean density, biomass and species richness of all species and for density of the common species in each habitat. * = Significant at 0.01<p<0.05, ** = significant at p<0.01.
Part Correlations Full modelTemperature Salinity Oxygen Visibility R2 P
CreekMean Density -0.669 -0.412 0.138 0.060 0.926 0.143Mean Biomass -0.356 -0.142 0.260 0.055 0.794 0.370Mean Species -0.732 -0.679 0.005 0.284 0.642 0.587G. filamentosus 0.642 0.507 0.423 0.205 0.676 0.543G. oyena -0.713 -0.577 -0.209 0.288 0.787 0.381L. fulviflamma 0.244 0.805 -0.710 -0.823 0.917 0.160M. argenteus 0.473 -0.034 0.586 0.288 0.629 0.604S. barracuda 0.435 -0.019 0.543 0.122 0.774 0.400ChannelMean Density -0.697* -0.069 0.095 -0.410 0.968 0.063Mean Biomass -0.535 -0.021 -0.245 -0.334 0.848 0.280Mean Species -0.795* -0.244 0.173 -0.339 0.972 0.056G. filamentosus -0.328 0.371 0.014 -0.695* 0.982 0.036*G. oyena -0.303 -0.633 -0.151 0.768 0.922 0.150L. fulviflamma 0.324 0.566 0.453 0.029 0.428 0.817L. lentjan -0.681 -0.050 -0.073 -0.756* 0.944 0.108M. argenteus -0.416* -0.458* 0.006 0.652* 0.991 0.018*S. barracuda -0.080 0.299 0.602 -0.294 0.554 0.693Mud/sand flatsMean Density -0.827** -0.219* 0.128 -0.225* 0.997 0.007**Mean Biomass -0.380 -0.180 0.649 -0.157 0.866 0.438Mean Species -0.365* 0.418* 0.329* -0.371* 0.992 0.017*G. filamentosus 0.168 -0.139 -0.054 -0.731* 0.964 0.070G. oyena -0.912* -0.557 0.020 -0.051 0.945 0.108L. fulviflamma 0.261 0.495 0.050 0.083 0.399 0.841L. lentjan 0.132 0.557 0.238 -0.618 0.594 0.647M. argenteus -0.338 0.073 0.202 -0.483 0.502 0.748S. barracuda -0.534 -0.361 0.197 -0.166 0.499 0.751S. sutor -0.472 0.188 0.234 -0.564 0.930 0.136ChwakaMean Density -0.294 -0.542 0.197 -0.266 0.564 0.682Mean Biomass -0.285 -0.704 0.241 -0.233 0.845 0.285Mean Species -0.529* -0.762* 0.333 -0.195 0.982 0.037*G. oyena -0.206 -0.332 0.121 -0.309 0.340 0.885L. fulviflamma -0.054 -0.250 -0.151 -0.297 0.726 0.524L. lentjan 0.618 0.761 -0.450 -0.472 0.846 0.284S. barracuda -0.216 -0.815* 0.217 0.035 0.953 0.091S. sutor 0.467 0.640 -0.697 -0.004 0.790 0.375MarumbiMean Density 0.474 -0.324 -0.307 0.244 0.958 0.082Mean Biomass 0.132 -0.306 -0.600 -0.138 0.870 0.243Mean Species 0.803 0.371 -0.554 0.407 0.896 0.197L. fulviflamma -0.073 0.038 -0.503 0.171 0.533 0.716L. lentjan 0.553 0.111 -0.052 0.789 0.677 0.541S. barracuda -0.100 0.576 -0.362 -0.509 0.623 0.612S. sutor 0.467 0.640 -0.697 -0.004 0.790 0.375

Chapter 3: Spatial-temporal variations in fish community structure
66

Chapter 4
Habitat utilisation by juveniles of commercially important fish species
in a marine embayment in Zanzibar, Tanzania
Lugendo BR, Pronker A, Cornelissen I, de Groene A, Nagelkerken I,
Dorenbosch M, van der Velde G, Mgaya YD
Aquatic Living Resources (2005) 18:149-158

Chapter 4: Habitat utilisation by juvenile fishes
68
Abstract: Habitat utilisation by juveniles of 13 commercially important fish species was studied in five habitats located in Chwaka Bay, Zanzibar: mangrove creeks, mangrove channel, sand/mud flats, a seagrass area close to mangroves, and a seagrass area far from mangroves. Fish samples were collected from each habitat using a seine net, and fish abundance and size were measured to determine habitat utilisation. The seagrass beds near to mangroves showed the most diverse fish assemblage of all habitats, possibly because it functions as a corridor between the mangroves and deeper parts of the embayment. Juveniles of Cheilio inermis, Hipposcarus harid, Leptoscarus vaigiensis, and Scolopsis ghanam inhabited seagrass beds only. Juveniles of Gerres filamentosus and Monodactylus argenteus were mainly found in the mangrove habitats. Lethrinus variegatus, Pelates quadrilineatus and Siganus sutor were found in more than two habitats, with highest abundances in seagrass beds. Juveniles of Gerres oyena, Lethrinus lentjan, Lutjanus fulviflamma and Sphyraena barracuda were the most generalist species and were found in all studied embayment habitats. Visual census surveys supported the seine net data showing that most fishes in the embayment habitats were juveniles or sub-adults. In terms of habitat utilisation by different size classes, five of the 13 species (Lethrinus lentjan, L. variegatus, P. quadrilineatus, Siganus sutor and Sphyraena barracuda) were found as small-sized individuals in shallow and turbid mangrove areas, whereas large-sized individuals were observed in deeper and less turbid seagrass beds. A possible explanation for this pattern could be an ontogenetic shift in habitat utilisation, although this could not be proven. The patterns observed in the present study show a high similarity to those observed in marine embayments in the Caribbean, indicating that similar mechanisms are at work which make these systems attractive juvenile habitats.
INTRODUCTION
Lagoonal and bay habitats containing mangroves and seagrasses are known to be important habitats
for juvenile fish, many of them commercially important to reef fisheries (Blaber & Blaber 1980;
Parrish 1989; Nagelkerken et al. 2000b; Nagelkerken & van der Velde 2002; Dorenbosch et al. 2004a).
It is suspected that they act as nurseries for juvenile fish, although some evidence has yet been
provided (Beck et al. 2001; Chittaro et al. 2004). At a certain stage, most fish probably outgrow the
protection of these habitats and likely migrate permanently from their nursery habitats to deeper water,
such as adjacent coral reefs (Cocheret de la Morinière et al. 2002; Nagelkerken & van der Velde 2002;
Nagelkerken et al. 2002; Dorenbosch et al. 2004a).
The present knowledge concerning the nursery potential of habitats with mangrove and
seagrasses is mostly based on research conducted in North America, Australia and the Caribbean (see
for example Robertson & Duke 1987; Thayer et al. 1987; Morton 1990; Nagelkerken et al. 2000a,b;
Cocheret de la Morinière et al. 2002), with most studies carried out in estuaries. The general situation
in the Indo-Pacific region may differ considerably from Caribbean islands, since bays and estuaries
along the continental coastline in the former area are often characterised by turbid waters, a larger tidal
range and a muddy substratum (Blaber 2000). Given that the functioning of mangroves as juvenile fish
habitats is not the same in all areas across the globe (see for example Chong et al. 1990), it is of
importance to study these areas separately to understand the potential variations in the role of
mangroves as fish habitats.
In East Africa hardly any fish studies have been done in shallow tropical habitats, knowledge
of the utilisation of mangroves and seagrass beds by fishes is limited to a few studies done in Kenyan
estuaries (Little et al. 1988; van der Velde et al. 1995; De Troch et al. 1996; Kimani et al. 1996;
Wakwabi 1999). Hence it is not clear how marine embayments in this region (and others) are utilized

Chapter 4: Habitat utilisation by juvenile fishes
69
by juvenile fish. The scarcity of such studies world-wide could lead to an underestimation of the
importance of such habitats, a situation that could lead to degradation and/or loss of these habitats
(Morton 1990; Nagelkerken 2000).
In this study we present a detailed description of habitat use by juveniles of selected
commercially important fish species that are found within a marine embayment in Zanzibar, Tanzania.
The study was designed to answer the following key questions: (1) Do selected commercially
important fish species use the bay habitats as juvenile habitats? (2) What is the spatial variation in
habitat utilization by the selected fishes? (3) Which bay habitat contains the most species of juvenile
fish? (4) Is the distribution of fish related to environmental variables?
MATERIALS AND METHODS
Study area This study was carried out in Chwaka Bay, a shallow system on the east coast of Unguja Island,
Zanzibar, Tanzania (Fig. 1). This embayment is an intertidal water body with an average depth of 3.2
m and an estimated area of 50 km2 at high spring tide and 20 km2 at low spring tide (Cederlöf et al.
1995). The region receives between 1000 and 1500 mm of rainfall per annum. Air temperatures are
tropical and range from 27-30°C. Predominantly north-easterly winds occur between October and
March, and mainly south-easterly winds from March to October. There are two rainy seasons in
Zanzibar: the extended rainy season that occurs during the months of March, April and May, and the
short rainy season which extend from October to December (McClanahan 1988).
On the east side, Chwaka Bay is protected from high-wave action from the ocean by a reef
system running along the coastline, as well as the Michamvi peninsula (Fig. 1). On the landward side,
this embayment is fringed by a dense mangrove forest of approximately 3000 ha (Mohammed et al.
1995). The mangrove forest has a number of tidal creeks, with Mapopwe Creek (approximately 2 m
deep) being the largest and acting as the main water exchange route between the forest and the
embayment. All the creeks are intertidal in nature and none have any significant fresh water input from
rivers or streams. Only during heavy rains, salinity gradients develop and these creeks temporarily
acquire estuarine characteristics, with salinities as low as 5 psu (Johnstone & Mohammed 1995). The
mangrove part of the bay is characterised by low water clarity (Table 1) and fluctuations in oxygen
levels. On the seaward side, immediately adjacent to the forest, the embayment opens up onto large
intertidal flats that are overgrown by mixed assemblages of algae and seagrasses, including scattered
monospecific seagrass stands. The outer and middle parts of the embayment (about 4 m deep) are
oceanic in character with salinities rarely below 35 psu (Table 1). Due to proximity of this part of the
embayment to the open ocean, it is characterised by relatively high water clarity (Table 1).
Furthermore, salinity and oxygen levels in this part of the embayment are relatively constant, even
during the rainy seasons.
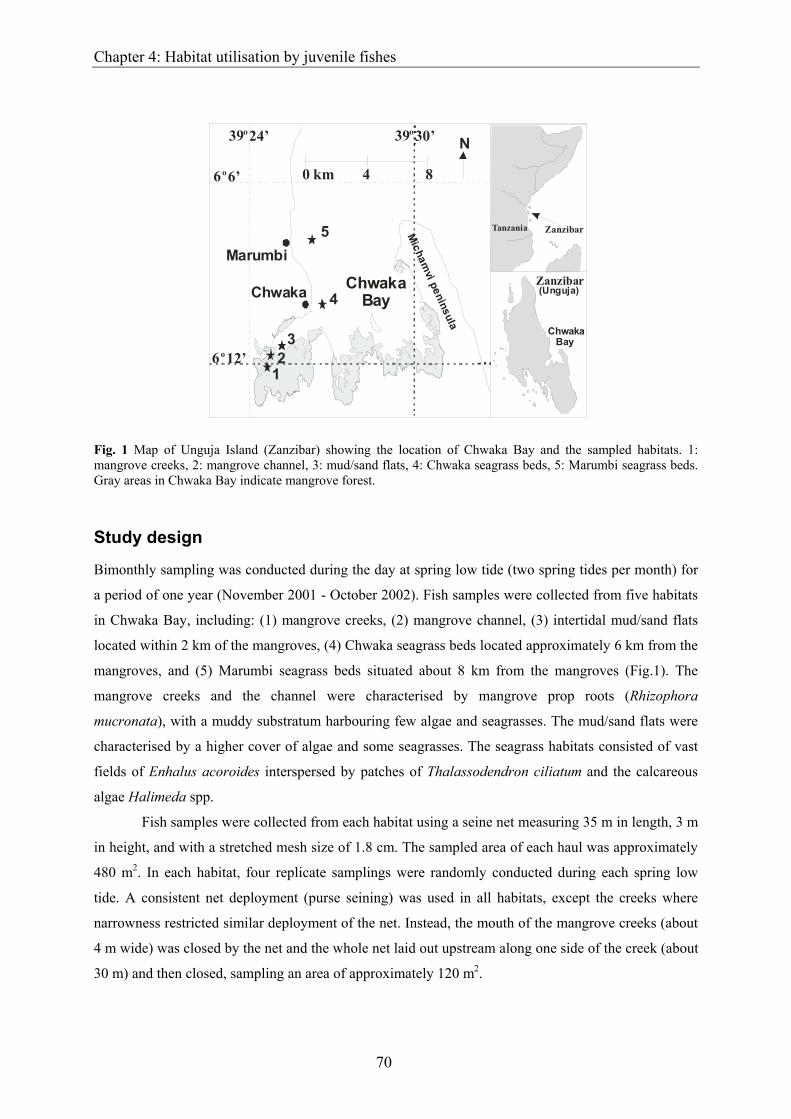
Chapter 4: Habitat utilisation by juvenile fishes
70
Marumbi
Chwaka
5
4
2 1
N
3
39o 24’
0 km 4 8
Chwaka Bay
Tanzania Zanzibar
Zanzibar
6o 6’
39o 30’
6o 12’M
ichamvi peninsula
ChwakaBay
(Unguja)
Fig. 1 Map of Unguja Island (Zanzibar) showing the location of Chwaka Bay and the sampled habitats. 1: mangrove creeks, 2: mangrove channel, 3: mud/sand flats, 4: Chwaka seagrass beds, 5: Marumbi seagrass beds. Gray areas in Chwaka Bay indicate mangrove forest.
Study design
Bimonthly sampling was conducted during the day at spring low tide (two spring tides per month) for
a period of one year (November 2001 - October 2002). Fish samples were collected from five habitats
in Chwaka Bay, including: (1) mangrove creeks, (2) mangrove channel, (3) intertidal mud/sand flats
located within 2 km of the mangroves, (4) Chwaka seagrass beds located approximately 6 km from the
mangroves, and (5) Marumbi seagrass beds situated about 8 km from the mangroves (Fig.1). The
mangrove creeks and the channel were characterised by mangrove prop roots (Rhizophora
mucronata), with a muddy substratum harbouring few algae and seagrasses. The mud/sand flats were
characterised by a higher cover of algae and some seagrasses. The seagrass habitats consisted of vast
fields of Enhalus acoroides interspersed by patches of Thalassodendron ciliatum and the calcareous
algae Halimeda spp.
Fish samples were collected from each habitat using a seine net measuring 35 m in length, 3 m
in height, and with a stretched mesh size of 1.8 cm. The sampled area of each haul was approximately
480 m2. In each habitat, four replicate samplings were randomly conducted during each spring low
tide. A consistent net deployment (purse seining) was used in all habitats, except the creeks where
narrowness restricted similar deployment of the net. Instead, the mouth of the mangrove creeks (about
4 m wide) was closed by the net and the whole net laid out upstream along one side of the creek (about
30 m) and then closed, sampling an area of approximately 120 m2.

Chapter 4: Habitat utilisation by juvenile fishes
71
To make sure that the net remained vertically stretched and touching the bottom, a metal chain
was attached to the middle section of the sinker line. In addition, plastic floats were attached to the
float line so that the entire water column was enclosed. Snorkelling observations during net
deployment indicated that the lower part of the net remained on the bottom throughout the exercise
and no fish were observed escaping under the net. Although some individuals belonging to the family
Mugilidae were observed jumping over the net, it was concluded that the procedure was well designed
for the study species.
To improve standardisation, the sampling was carried out by the same two fishermen, using
the same net, and similar net deployment procedures. All fish sampled by the seine net were collected
(see Figs. 2 and 3) but 13 commercially important fish species (Jiddawi & Stanley 1997, see Table 2)
that were most common and represented over 60% of the total catch are studied in more detail, so that
the results can contribute to effective management and conservation of the fisheries in this
embayment. The role of the studied embayment habitats as a feeding area by these fish species will be
reported elsewhere. In the laboratory, fish fork lengths were measured to the nearest 0.1 cm and
analysed in class intervals of 2.5 cm, except for two large-sized species (viz. Sphyraena barracuda and
Cheilio inermis) where a 5 cm class interval was used.
In another study during September - December 2003, visual census surveys of the fish
communities in the mangroves near Chwaka (different from the beach seine surveys) and in the
seagrass beds of Chwaka and Marumbi were performed during neap tides in quadrats of 5 x 5 m using
SCUBA. Visual census surveys could not be done within the mangrove creeks, mangrove channel and
mud/sand flats habitats due to high turbidity in these habitats. Water depth at the Marumbi and
Chwaka seagrass beds was on average 4.5 m. After marking the quadrat with a line, the observer
waited 3 min to minimise fish disturbance in the quadrat, after which fishes were counted during 10
min. Fish surveys were performed by two independent observers that were simultaneously trained in
fish identification and size class estimation prior to the surveys. Care was taken not to count fishes that
moved in and out of the quadrats more than once.
The majority of juveniles collected in this study were larger than 2.5 cm in length and did not
include larval stages. The smaller juveniles (<2.5 cm) and larvae tended to pass through the net, thus
leading to an underestimation of the total density and size composition of early juveniles captured
during this study. However, since the same mesh size was used throughout the embayment habitats,
the selectivity of the net applies equally to all habitats, thus resulting in comparable data being
collected. It is known that seine nets have a limitation in sampling adult fish, a problem that could
result into them being underrepresented in this study. The visual census survey was used as an
additional technique to determine whether adults are present in the embayment habitats.
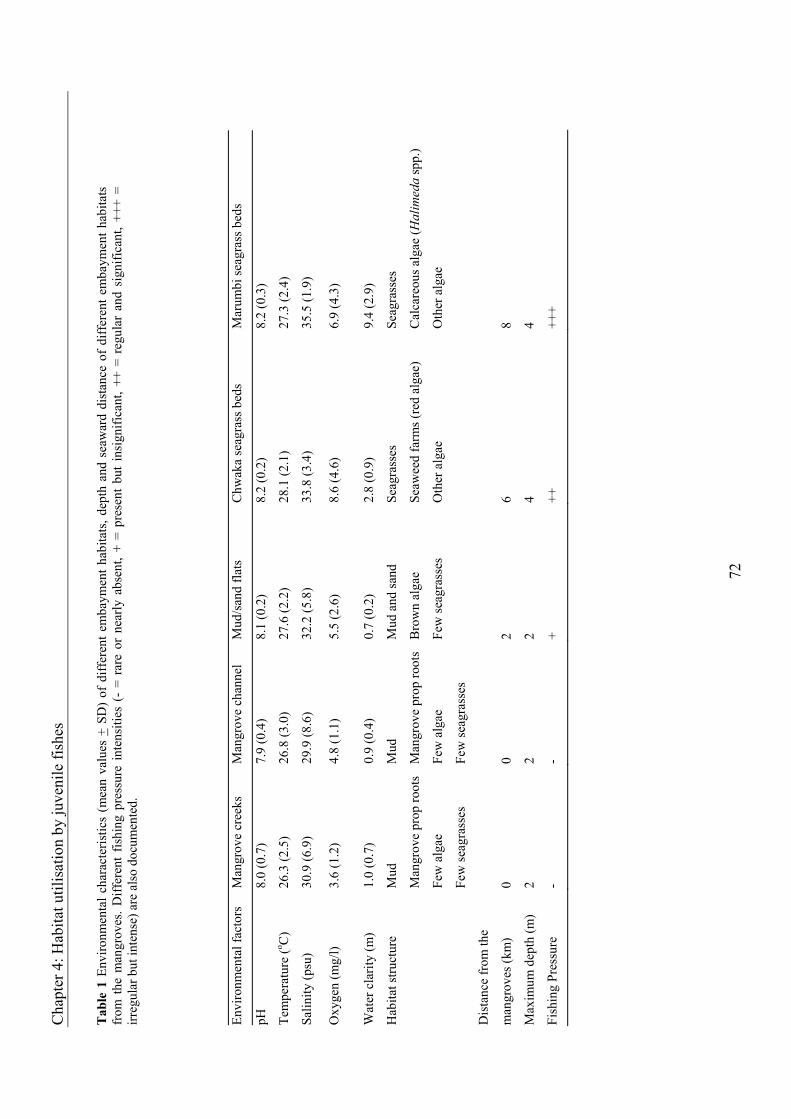
Cha
pter
4: H
abita
t util
isat
ion
by ju
veni
le fi
shes
72
Tab
le 1
Env
ironm
enta
l cha
ract
eris
tics
(mea
n va
lues
+ S
D)
of d
iffer
ent e
mba
ymen
t hab
itats
, dep
th a
nd s
eaw
ard
dist
ance
of
diff
eren
t em
baym
ent h
abita
ts
from
the
man
grov
es. D
iffer
ent
fishi
ng p
ress
ure
inte
nsiti
es (
- =
rare
or
near
ly a
bsen
t, +
= pr
esen
t bu
t in
sign
ifica
nt, +
+ =
regu
lar
and
sign
ifica
nt, +
++ =
irr
egul
ar b
ut in
tens
e) a
re a
lso
docu
men
ted.
Envi
ronm
enta
l fac
tors
M
angr
ove
cree
ks
Man
grov
e ch
anne
l M
ud/s
and
flats
C
hwak
a se
agra
ss b
eds
Mar
umbi
seag
rass
bed
s
pH
8.0
(0.7
) 7.
9 (0
.4)
8.1
(0.2
) 8.
2 (0
.2)
8.2
(0.3
)
Tem
pera
ture
(o C)
26.3
(2.5
) 26
.8 (3
.0)
27.6
(2.2
) 28
.1 (2
.1)
27.3
(2.4
)
Salin
ity (p
su)
30.9
(6.9
) 29
.9 (8
.6)
32.2
(5.8
) 33
.8 (3
.4)
35.5
(1.9
)
Oxy
gen
(mg/
l) 3.
6 (1
.2)
4.8
(1.1
) 5.
5 (2
.6)
8.6
(4.6
) 6.
9 (4
.3)
Wat
er c
larit
y (m
) 1.
0 (0
.7)
0.9
(0.4
) 0.
7 (0
.2)
2.8
(0.9
) 9.
4 (2
.9)
Hab
itat s
truct
ure
Mud
Man
grov
e pr
op ro
ots
Few
alg
ae
Few
seag
rass
es
Mud
Man
grov
e pr
op ro
ots
Few
alg
ae
Few
seag
rass
es
Mud
and
sand
Bro
wn
alga
e
Few
seag
rass
es
Seag
rass
es
Seaw
eed
farm
s (re
d al
gae)
Oth
er a
lgae
Seag
rass
es
Cal
care
ous a
lgae
(Hal
imed
a sp
p.)
Oth
er a
lgae
Dis
tanc
e fr
om th
e
man
grov
es (k
m)
0
0
2
6
8
Max
imum
dep
th (m
) 2
2 2
4 4
Fish
ing
Pres
sure
-
- +
++
+++

Cha
pter
4: H
abita
t util
isat
ion
by ju
veni
le fi
shes
73
Tab
le 2
Fam
ilies
, spe
cies
nam
es, c
omm
on n
ames
, per
cent
age
com
posi
tion
of d
iffer
ent
cate
gorie
s of
fis
h (f
ollo
win
g N
agel
kerk
en &
van
der
Vel
de
2002
): sm
all j
uven
iles
(<1/
3 m
ax. s
peci
es’ l
engt
h), l
arge
juve
nile
s an
d su
b-ad
ults
(1/3
-2/3
of m
ax. s
peci
es’ l
engt
h), a
nd a
dults
(> 2
/3 o
f max
. spe
cies
’ le
ngth
), m
axim
um l
engt
h an
ind
ivid
ual
spec
ies
can
reac
h (s
ourc
e: F
roes
e &
Pau
ly 2
004)
. H
abita
ts w
here
fis
hes
wer
e m
ost
abun
dant
are
als
o do
cum
ente
d (1
: man
grov
e cr
eeks
, 2: m
angr
ove
chan
nel,
3: m
ud/s
and
flats
, 4: C
hwak
a se
agra
ss b
eds,
5: M
arum
bi s
eagr
ass
beds
, *ha
bita
t with
hig
h fis
h de
nsity
).
Fam
ily
Spec
ies
Com
mon
nam
es
% sm
all
juve
nile
s
in th
e ba
y
% la
rge
juve
nile
s in
the
bay
% a
dults
in th
e ba
y
Max
imum
size
atta
ined
by
adul
t
fish
(cm
)
Hab
itat o
bser
ved
Ger
reid
ae
Ger
res f
ilam
ento
sus
Whi
pfin
silv
er b
iddy
10
0 0
0 35
1*
, 2*,
3
Ger
reid
ae
Ger
res o
yena
C
omm
on si
lver
bid
dy
94.7
5.
3 0
30
All,
2*,
3*,
4*
Labr
idae
C
heili
o in
erm
is
Cig
ar w
rass
e 55
.8
44.2
0
50
4, 5
*
Leth
rinid
ae
Leth
rinu
s len
tjan
Red
spot
em
pero
r 10
0 0
0 52
A
ll, 1
*, 2
*, 3
*, 4
*
Leth
rinid
ae
Leth
rinu
s var
iega
tus
Var
iega
ted
empe
ror
26.4
73
.4
0 20
2,
3, 4
*, 5
Lutja
nida
e
Lutja
nus f
ulvi
flam
ma
Bla
cksp
ot sn
appe
r 87
.1
12.9
0
35
All,
3*,
4*
Mon
odac
tylid
ae
Mon
odac
tylu
s arg
ente
us
Silv
er m
oon
97.8
2.
2 0
25
1*, 2
*, 3
Nem
ipte
ridae
Sc
olop
sis g
hana
m
Ara
bian
mon
acle
bre
am
87.0
13
.0
0 30
4*
Scar
idae
H
ippo
scar
us h
arid
C
ande
lam
oa p
arro
t fis
h 10
0 0
0 75
4*
Scar
idae
Le
ptos
caru
s vai
gien
sis
Mar
bled
par
rotfi
sh
45.3
54
.7
0 35
4,
5*
Siga
nida
e Si
ganu
s sut
or
Whi
tesp
otte
d ra
bbitf
ish
88.9
11
.1
0 45
2,
3, 4
*, 5
*
Sphy
raen
idae
Sp
hyra
ena
barr
acud
a G
reat
bar
racu
da
100
0 0
200
All*
Tera
poni
dae
Pela
tes q
uadr
iline
atus
Fo
urlin
ed te
rapo
n 93
.6
6.4
0 30
1,
3, 4
*

Cha
pter
4: H
abita
t util
isat
ion
by ju
veni
le fi
shes
74
Tab
le 3
Mea
n de
nsity
(# fi
sh 1
00 m
-2) a
nd st
anda
rd e
rror
(bet
wee
n br
acke
ts) o
f diff
eren
t siz
e cl
asse
s (cm
) of f
ish
obse
rved
dur
ing
visu
al c
ensu
s sur
veys
(n
= nu
mbe
r of t
rans
ects
surv
eyed
). Th
e m
axim
um si
ze th
at c
an b
e re
ache
d by
indi
vidu
al fi
sh sp
ecie
s is s
how
n in
Tab
le 2
.
C
hwak
a m
angr
oves
(n=9
) C
hwak
a se
agra
ss b
eds (
n=31
) M
arum
bi se
agra
ss b
eds (
n=29
)
Spec
ies
0-10
1
0-20
20
-30
>30
0-10
1
0-20
20
-30
>30
0-10
1
0-20
20
-30
>30
Ger
res f
ilam
ento
sus
- -
- -
- -
- -
- -
- -
Ger
res o
yena
-
- -
- -
- -
- -
- -
-
Che
ilio
iner
mis
-
- -
- 0.
6 (0
.4)
2.6
(1.2
)1.
8 (0
.8)
0.6
(0.4
)0.
8 (0
.3)
5.5
(1.2
)4.
6 (1
.3)
-
Leth
rinu
s len
tjan
- -
- -
3.0
(1.2
)0.
3 (0
.3)
- -
1.9
(0.9
)16
.1 (4
.1)
- -
Leth
rinu
s var
iega
tus
- -
- -
0.1
(0.1
) -
- -
- 0.
1 (0
.1)
- -
Lutja
nus f
ulvi
flam
ma
- 0.
4 (0
.4)
- -
- 0.
8 (0
.8)
- -
- 0.
3 (0
.3)
- -
Mon
odac
tylu
s arg
ente
us
5.3
(4.9
) -
- -
- -
- -
- -
- -
Scol
opsi
s gha
nam
-
- -
- 2.
1 (1
.0)
1.0
(0.8
) -
- -
4.0
(2.8
) -
-
Hip
posc
arus
har
id
- -
- -
10.8
(2.2
)11
.6 (4
.7)
0.1
(0.1
) -
- -
- -
Lept
osca
rus v
aigi
ensi
s -
- -
- 3.
0 (1
.4)
9.9
(3.6
)0.
6 (0
.3)
- 3.
9 (2
.7)
28.1
(8.2
)4.
6 (2
.8)
-
Siga
nus s
utor
-
2.7
(2.7
) -
- 3.
5 (0
.9)
1.7
(0.7
)0.
6 (0
.5)
- 2.
6 (1
.3)
11.7
(4.4
) -
-
Sphy
raen
a ba
rrac
uda
- 0.
4 (0
.4)
0.4
(0.4
) -
- -
- -
- -
- -
Pela
tes q
uadr
iline
atus
-
- -
- -
- -
- -
- -
-
Chapter 4: Habitat utilisation by juvenile fishes
75
Since variations in environmental variables can have profound effects on the distribution and
consequently catches of fish, these variables were recorded before each catch. Water temperature, pH,
salinity and dissolved oxygen were measured using a temperature-compensated Multi Parameter
Analyzer (Eijkelkamp, model 18.28). To determine water clarity, a line was extended to the maximum
horizontal distance at which a snorkeller in the water could discern a black and white coloured
stationary held Secchi disk (44 cm diameter).
Data analysis
Using the monthly environmental data, mean and standard deviations for each of the variables were
determined (Table 1).
Mean species richness and mean density for the entire fish community were compared
between different embayment habitats using a one-way ANOVA on log-transformed data, followed by
a multiple comparisons of means with a Gabriel’s Post Hoc test, using the programme SPSS for
Windows (Field 2000). To examine associations between fish densities in different embayment
habitats and environmental variables, two analyses were done: 1) Multiple linear regression analysis
for each target species (all size classes pooled), and 2) Correspondence Analysis (CA) on log-
transformed data of the various size classes of all target species (ter Braak & Smilauer 1998). First of
all, simple linear regressions were done among the environmental variables to detect co-linearity.
Temperature was significantly correlated to oxygen; to prevent over-parameterisation we therefore
excluded temperature from the model and used only oxygen as a variable. Distance was significantly
correlated to salinity, and we used only salinity as a variable. We excluded pH from the model because
this factor hardly varied within the habitats. The final multiple linear regression model thus included
three independent variables (predictors): oxygen, salinity and water clarity. Each of the 13 target
species was set as a dependent variable in 13 separate multiple regression analyses. Semi partial (Part)
correlations are provided which show the correlations of the separate independent variables with the
dependent variable, taking the effect of the other independent variables into account.
RESULTS
The number of all fish species and of target species both showed a similar trend across the embayment
habitats, increasing from the mangrove creeks to Chwaka seagrass beds and then decreasing in
Marumbi seagrass beds (Fig. 2a). The pattern for densities of all fish species pooled was the same as
that of target species alone, except in the mangrove creeks (Fig. 2b). The density of all species pooled
was significantly higher in the mangrove creeks than in any other habitats (1-way ANOVA and
Gabriel’s post-hoc test, p < 0.05). Non-target species, which contributed most to the high fish densities
in the mangroves, included members of the family Ambassidae, Apogonidae and Leiognathidae. The
highest densities of the target species pooled were recorded on the mud/sand flats and in Chwaka

Chapter 4: Habitat utilisation by juvenile fishes
76
0
5
10
15
20
25
30
Mea
n #
of s
peci
es
All species Target species
a
a
ab
b
ab
x xv zuvy
xu
(a)
0
50
100
150
200
250
300
Mangrovecreeks
Mangrovechannel
Mud/sandflats
Chwakaseagrass bed
Marumbiseagrass bed
Mea
n de
nsity
(#/
1000
m2 )
a aa a
b
x
x
x x
x
(b)
seagrass beds, but the differences in their density over the habitat gradient was not significant (1-way
ANOVA, F4, 53 = 2.127, p = 0.09).
Fig. 2 Variations (+ SE) in (a) mean number of species and (b) mean densities along a gradient of habitats in Chwaka Bay for all species and for target species. Values that are significantly different (Gabriel’s post-hoc test) have different letters (a, b for all species; x, y, z, u for target species). Mean number of species is calculated by pooling the 8 beach seine hauls of each month and taking the average of the different months.

Chapter 4: Habitat utilisation by juvenile fishes
77
0500
1000150020002500
Freq
uenc
y
All species
Target species
Non-target species(a) Mangrove creeks
0500
1000150020002500
Freq
uenc
y (b) Mangrove channel
0500
1000150020002500
Freq
uenc
y
(c) Mud/sand flats
0500
1000150020002500
Freq
uenc
y
(d) Chwaka seagrass
0500
1000150020002500
0-2.5
2.5-5.
0
5.0-7.
5
7.5-10
.0
10.0-
12.5
12.5-
15.0
15.0-
17.5
17.5-
20.0
>20.0
Size class (cm)
Freq
uenc
y
(e) Marumbi seagrass
Fig. 3 Length frequency distribution of fish in different habitats in Chwaka Bay. Non-target species refers to all species minus target species.

Chapter 4: Habitat utilisation by juvenile fishes
78
Considering target species alone, the majority of small juveniles (< 5 cm) were found
within the mangrove habitats (i.e. creeks and channels) although other size classes were also
represented (Fig. 3a,b). Mud/sand flats and Chwaka seagrass beds mainly harboured
intermediate sized juveniles (5 – 10 cm) while in Marumbi seagrass beds large-sized juveniles
(>10.0 cm) dominated (Figs. 3c-e). Non-target species which mainly included small-body
species did not show a distinctive pattern in size distribution over habitats (Fig. 3).
Considering the embayment as a whole and using the beach seine data, 11 out of 13
target species were recorded mainly as small juveniles, with the other 2 species predominantly
occurring in the embayment as large juveniles (Table 2). No target species were recorded in
the embayment as adults. Also visual census surveys revealed that the majority of the target
fish species occurred in the embayment habitats as juveniles and sub-adults (Table 3). In
contrast to the beach seine data, the visual census surveys showed presence of Siganus sutor
in the mangroves, and absence of Gerres filamentosus, G. oyena and Pelates quadrilineatus in
all habitats.
Correspondence Analysis showed a clear separation of species and size classes of the
target species in the different habitats (Fig. 4). The Eigenvalues of the first and second CA
axis were 0.66 and 0.37, respectively, indicating that a high proportion of the variation in
species density data could be explained by the hypothetical axes. Four distinct groups could
be identified. The first group occupied the mangrove habitats (creeks and channel) and were
characterised by small-sized individuals of Gerres filamentosus, G. oyena, Lethrinus lentjan,
Monodactylus argenteus and Sphyraena barracuda. In addition, the whole size range of M.
argenteus was found in these habitats, together with large individuals of Lutjanus
fulviflamma. The second group was found on the mud/sand flats and were characterised by
small-sized individuals of L. fulviflamma, Lethrinus variegatus, Pelates quadrilineatus,
Siganus sutor, Sphyraena barracuda and intermediate-sized individuals of G. filamentosus
and G. oyena. Chwaka seagrass beds were occupied by the third group which was
characterised by intermediate-sized individuals of P. quadrilineatus and S. barracuda and all
size classes of Hipposcarus harid and Scolopsis ghanam. The last group, comprising mainly
large individuals (≥ 10.0 cm) of Cheilio inermis, Leptoscarus vaigiensis, Lethrinus lentjan, L.
variegatus, Siganus sutor and Sphyraena barracuda were found in Marumbi seagrass beds.
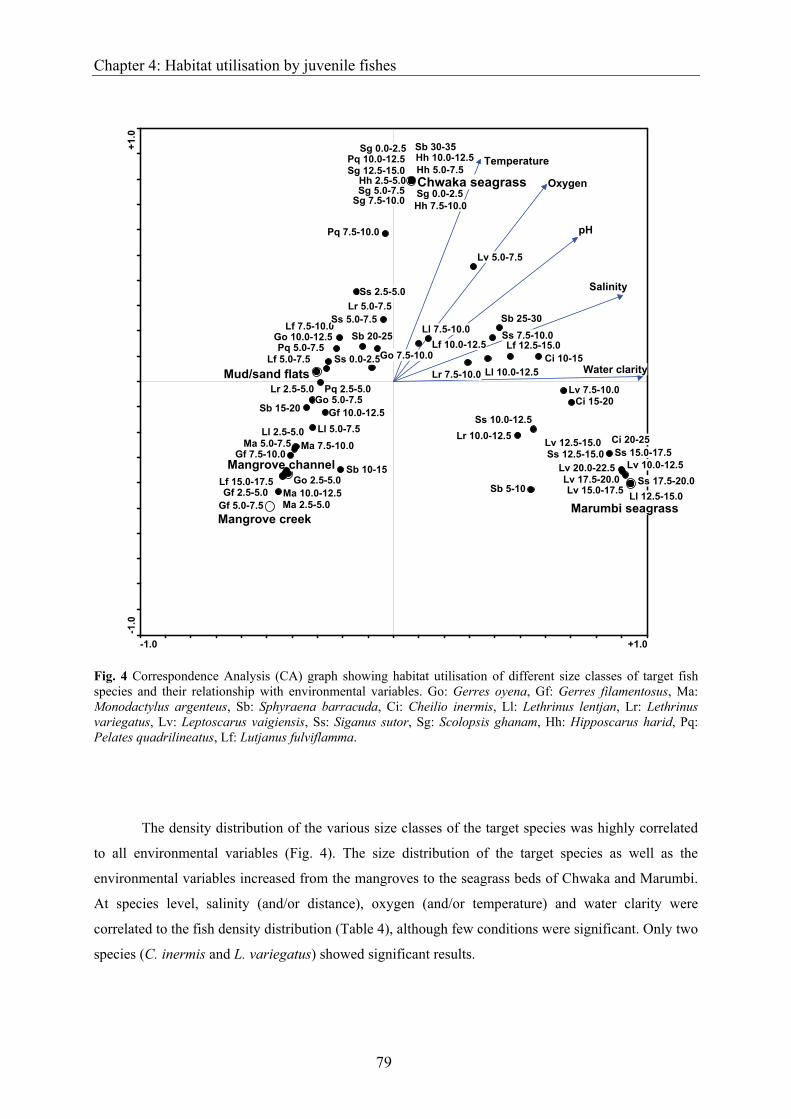
Chapter 4: Habitat utilisation by juvenile fishes
79
-1.0 +1.0
-1.0
+1.0
Water clarity
Salinity
pH
Oxygen
Temperature
Marumbi seagrassMangrove creek
Mangrove channel
Mud/sand flats
Chwaka seagrass
Lv 20.0-22.5Lv 17.5-20.0
Ll 12.5-15.0Ss 17.5-20.0
Lv 12.5-15.0 Ci 20-25
Lv 15.0-17.5
Lv 10.0-12.5Ss 12.5-15.0 Ss 15.0-17.5
Ci 15-20Lv 7.5-10.0
Ci 10-15
Ss 10.0-12.5
Sb 5-10
Lr 10.0-12.5
Lf 12.5-15.0
Gf 2.5-5.0Lf 15.0-17.5
Ma 2.5-5.0Gf 5.0-7.5
Gf 7.5-10.0
Sb 25-30
Ma 10.0-12.5Go 2.5-5.0
Ss 7.5-10.0
Ma 5.0-7.5 Ma 7.5-10.0
Ll 10.0-12.5
Gf 10.0-12.5Sb 15-20
Ll 2.5-5.0
Lv 5.0-7.5
Lr 2.5-5.0
Ss 0.0-2.5
Pq 2.5-5.0Lr 7.5-10.0
Go 5.0-7.5
Ll 5.0-7.5
Lf 5.0-7.5Pq 5.0-7.5
Go 10.0-12.5Lf 7.5-10.0
Sb 10-15
Ss 2.5-5.0
Ll 7.5-10.0Ss 5.0-7.5
Lf 10.0-12.5Go 7.5-10.0
Pq 10.0-12.5Sg 12.5-15.0
Sg 0.0-2.5Sg 7.5-10.0Sg 5.0-7.5Hh 2.5-5.0
Hh 7.5-10.0
Hh 10.0-12.5Sb 30-35Sg 0.0-2.5
Hh 5.0-7.5
Sb 20-25
Lr 5.0-7.5
Pq 7.5-10.0
Fig. 4 Correspondence Analysis (CA) graph showing habitat utilisation of different size classes of target fish species and their relationship with environmental variables. Go: Gerres oyena, Gf: Gerres filamentosus, Ma: Monodactylus argenteus, Sb: Sphyraena barracuda, Ci: Cheilio inermis, Ll: Lethrinus lentjan, Lr: Lethrinus variegatus, Lv: Leptoscarus vaigiensis, Ss: Siganus sutor, Sg: Scolopsis ghanam, Hh: Hipposcarus harid, Pq: Pelates quadrilineatus, Lf: Lutjanus fulviflamma.
The density distribution of the various size classes of the target species was highly correlated
to all environmental variables (Fig. 4). The size distribution of the target species as well as the
environmental variables increased from the mangroves to the seagrass beds of Chwaka and Marumbi.
At species level, salinity (and/or distance), oxygen (and/or temperature) and water clarity were
correlated to the fish density distribution (Table 4), although few conditions were significant. Only two
species (C. inermis and L. variegatus) showed significant results.

Chapter 4: Habitat utilisation by juvenile fishes
80
At the species level, several species showed a difference in habitat utilization for small versus
large juveniles (Fig. 5, Table 2): (1) small-sized individuals of Lethrinus lentjan, Pelates
quadrilineatus and Sphyraena barracuda were found in the mangrove habitats, whereas the large-sized
individuals of these species were recorded in the seagrass beds (2) small-sized individuals of L.
variegatus and Siganus sutor were found in the mangroves and mud/sand flats, whereas the large
individuals were recorded in the seagrass habitats. The other target species did not show such a
pattern, with all life stages found in the mangroves (Gerres filamentosus, Monodactylus argenteus),
seagrass beds (Cheilio inermis, Hipposcarus harid, Leptoscarus vaigiensis, Scolopsis ghanam), or in a
variety of habitats (G. oyena, Lutjanus fulviflamma).
Table 4 Results of the multiple linear regression analysis, showing the R2 and p-value of the full model, and the part (semi partial) correlation of the separate environmental variables. *significant at 0.01<p<0.05, **significant at p<0.01.
Part Correlation R2 pSpecies Salinity Oxygen Water clarityCheilio inermis 0.009 0.036* 0.426** 1.000 0.001**Gerres filamentosus -0.651 0.153 0.453 0.994 0.101Gerres oyena 0.249 0.087 -0.620 0.689 0.671Hipposcarus harid -0.027 0.604 -0.212 0.828 0.513Leptoscarus vaigiensis 0.013 -0.050 0.454 0.997 0.074Lethrinus lentjan 0.493 -0.718 -0.551 0.853 0.476Lethrinus variegatus -0.310* 0.807* 0.202 1.000 0.024*Lutjanus fulviflamma 0.379 0.276 -0.640 0.972 0.214Monodactylus argenteus 0.068 0.215 -0.538 0.874 0.442Pelates quadrilineatus 0.341 0.291 -0.625 0.927 0.339Scolopsis ghanam -0.027 0.604 -0.212 0.828 0.513Siganus sutor 0.129 0.198 0.135 0.866 0.456Sphyraena barracuda 0.894 -0.415 -0.882 0.979 0.183

Chapter 4: Habitat utilisation by juvenile fishes
81
(a) Gerres oyena
0
10
20
30
40 Marumbi seagrass bedChwaka seagrass bedMud/sand flatsMangrove channelMangrove creeks
(b) Gerres filamentosus
0
10
20
30
40
(c) M onodactylus argenteus
0
10
20
30
40
(d) Lethrinus lentjan
0
20
40
60
80 (e) Lethrinus variegatus
0
5
10
(f) Lutjanus fulviflamma
0
5
10
Mea
n d
ensi
ty
(#/1
000m
2 )
(g) Siganus sutor
01
23
45
(h) Pelates quadrilineatus
0
5
10
15
20 (i) Leptoscarus vaigiensis
0
5
10
15
20
(j) Hipposcarus harid
0
5
10
0
2.5 5
7.5 10
12.5
>12.
5
S ize class (cm)
(k) Scolopsis ghanam
012
345
0
2.5 5
7.5 10
12.5
>12
.5
S ize class (cm )
(l) Sphyraena barracuda
0
5
10
0 5 10 15 20
>20
S ize class (cm )
(m) Cheilio inermis
0
5
10
0 5 10 15 20
>20
S ize class (cm)
Fig. 5 Mean densities per size class of the target fish species in the five embayment habitats.

Chapter 4: Habitat utilisation by juvenile fishes
82
Discussion
Most fish caught in the present study were juveniles, indicating that an Indo Pacific marine
embayment may have similar a function as juvenile habitats as Indo Pacific estuaries. In addition, both
tropical marine embayments as well as estuaries are dominated by relatively few species when
compared to fish diversity in adjacent coastal waters.
The density of juveniles of all species pooled was about 3 times higher in the mangroves than
in any of the other habitats. Similarly, in tropical Queensland (Australia), Robertson and Duke (1987)
observed 4-10 times higher densities of fish in mangroves than in adjacent habitats. The high density
of fish in mangroves is probably explained by the high structural complexity formed by the prop-roots
(Robertson & Duke 1987; Thayer et al. 1987; Cocheret de la Morinière et al. 2004). However, the low
density of target species (i.e. commercially important species) as opposed to the high density of non-
target species in the mangrove creeks indicates that the majority of fish found in the mangroves are not
commercially important. This does not necessarily lessen the importance of mangroves, as the density
of target species was equal in all habitats and non-target species are important in supporting food webs
that include commercially important species. For example, in Dampier region of Australia, Blaber
(1986) observed that 60% of the diet of commercially important species such as Caranx ignobilis,
Carcharhinus limbatus, Scomberoides comersonianus and Scomberomorous semifasciatus was
composed of permanently resident mangrove species. Therefore, as argued by Robertson and Duke
(1987), the value of mangroves is not limited to a possible nursery potential alone.
The high number of fish species encountered in Chwaka seagrass beds, when compared to the
other habitats, may possibly be explained by its geographical location between the mangroves and the
deeper part of the embayment/coral reef. Fish species from adjacent habitats may school together in
the seagrass channels of Chwaka during low tides. These channels are always inundated with water
and fishes are known to occupy transient habitats during certain phases of tidal cycles (Chong et al.
1990; Forward & Tankersley 2001; Dorenbosch et al. 2004b). The Chwaka seagrass beds could also
form a corridor for fishes if they would undertake an ontogenetic migration from the mangroves to
deeper parts of the embayment. Higher numbers of species in seagrass habitats compared to mangrove
habitats have been reported in other studies (Little et al. 1988; van der Velde et al. 1995; Pinto &
Punchihewa 1996), but the opposite situation has also been documented (Robertson & Duke 1987;
Thayer et al. 1987; Laegdsgaard & Johnson 1995).
Individuals of the fish species that were found in mangrove areas were smaller in size when
compared to individuals of the same species that were found in seagrass areas. This suggests either a
possible habitat shift with growth, with some species appearing to utilise the sand/mud flats as
intermediate life stage habitats or it could also be a result of tidal migration in search for more
beneficial habitats during low tides. Although the present study did not focus on the adult life stages,
the almost total absence of adults in the studied embayment habitats suggests that these large fish must

Chapter 4: Habitat utilisation by juvenile fishes
83
be present elsewhere, possibly in the deeper parts of the embayment or on the adjacent coral reef.
There is a possibility that adult fish were able to escape the seine net more readily than juveniles,
which could result into their under representation, however, visual census surveys (which target the
entire size range) indicated that the deeper parts of the seagrass beds consisted mainly of juveniles.
Most species occurred in multiple embayment habitats, but some species were most abundant
in just one habitat. Gerres filamentosus and Monodactylus argenteus showed a strong preference for
mangrove areas and may be attracted to the brackish water that was sometimes present in this habitat
(Froese & Pauly 2004). Cheilio inermis and Leptoscarus vaigiensis are typical seagrass-associated
species (Froese & Pauly 2004) and were only recorded in seagrass beds during this study. Similarly, in
Mhlathuze estuary, South Africa, Weerts & Cyrus (2002) reported the occurrence of Labridae and
Scaridae only in eelgrass habitats.
Most studies on utilisation of neighbouring tropical shallow-water marine habitats by juvenile
reef fish species have been done in the Caribbean. It is striking that many results of the present study
in the western Indian Ocean are highly comparable to those of similar studies done in marine
embayments in the Caribbean. In both regions, 1) marine embayment habitats were dominated by
juvenile fish with an almost complete absence of adults (Nagelkerken et al. 2000a), 2) marine
embayment habitats showed highest juvenile fish densities in mangroves (Nagelkerken & van der
Velde 2002); 3) some marine embayment habitats were used specifically as an intermediate life-stage
habitat (Nagelkerken et al. 2000b; Nagelkerken & van der Velde 2003), and 4) multiple marine
embayment habitats could be used by juvenile fish simultaneously (Nagelkerken et al. 2000a).These
similarities indicate that irrespective of the geographical location, the same mechanisms are at work
which make shallow-water marine embayment habitats favourable juvenile habitats.
Conclusion
The questions posed at the beginning of this study can be answered as follows: (1) All studied fish
species used one or more embayment habitats as juvenile habitats. (2) Several species occurred as
small juveniles in the mangrove areas and as large-sized juveniles in the seagrass areas. (3) Chwaka
seagrass beds appeared to be the most widely utilised habitat probably due to its intermediate location
between the mangroves and the deeper parts of the embayment. (4) Only two of the 13 species showed
a significant correlation between density and the selected environmental variables, suggesting that the
latter do not play a major role in the fish density distribution.
Acknowledgements
This study was financially supported by NUFFIC through the ENVIRONS-MHO Project. A.P., A.G.
and I.C. were funded by Schure-Beijerinck-Popping Foundation and Quo Vadis Fonds (Radboud
University Nijmegen), The Netherlands. The administration and staff of the Institute of Marine
Sciences in Zanzibar provided logistical support and research facilities. We are indebted to the
Chapter 4: Habitat utilisation by juvenile fishes
84
Chwaka fishermen M.A. Manzi, S.J. Simgeni and M.A. Makame for their assistance in the field. This
is Centre for Wetland Ecology publication no. 363.
Chapter 4: Habitat utilisation by juvenile fishes
85
References Beck M.W., Heck K. L. JR., Able K.W., Childers D.L., Eggleston D.B., Gillanders B.M., Halpern B., Hays
C.G., Hoshino K., Minello T.J.,Orth R.J., Sheridan P.F., Weinstein M.P., 2001, The Identification,
Conservation, and Management of Estuarine and Marine Nurseries for Fish and Invertebrates. Bioscience.
51, 633-641.
Blaber S.J.M., 1986, Feeding selectivity of a guild of piscivorous fish in mangrove areas of north-west Australia.
Aust. J. Freshwat. Res. 37, 329-336.
Blaber S.J.M., 2000, Tropical Estuarine Fishes: Ecology, exploitation and conservation. 121 pp. Blackwell
Science Ltd, Fish and aquatic resources series 7.
Blaber S.J.M., Blaber T.G., 1980, Factors affecting the distribution of juvenile estuarine and inshore fish. J. Fish
Biol. 17, 143-162.
Cederlöf U., Rydberg L., Mgendi M., Mwaipopo O., 1995, Tidal exchange in a warm tropical lagoon: Chwaka
Bay, Zanzibar. Ambio 24, 458-464.
Chittaro P.M., Fryer B.J., Sale R., 2004, Discrimination of French grunts (Haemulon flavolineatum Desmarest,
1823) from mangrove and coral reef habitats using otolith microchemistry. J. Exp. Mar. Biol. Ecol. 308,
168-183.
Chong VC., Sasekumar A., Leh M.U.C., Cruz R.D., 1990, The fish and prawn communities of a Malaysian
coastal mangrove ecosystem, with comparisons to adjacent mud/sand flats and inshore waters. Estuar. Coast.
Shelf Sci. 31, 703-722.
Cocheret de la Morinière E., Pollux B.J.A., Nagelkerken I., van der Velde G., 2002. Post-settlement life cycle
migration patterns and habitat preference of coral reef fish that use seagrass and mangrove habitats as
nurseries. Estuar. Coast. Shelf Sci. 55, 309-321.
Cocheret de la Morinière E., Nagelkerken I., van der Meij H., van der Velde G., 2004. What attracts juvenile
coral reef fish to mangroves: habitat complexity or shade? Mar. Biol. 144, 139-145.
De Troch M., Mees J., Papadopoulos I., Wakwabi E.O., 1996, Fish communities in a tropical bay (Gazi Bay,
Kenya): seagrass beds vs.unvegetated areas. Neth. J. Zool. 46, 236-252.
Dorenbosch M., van Riel M.C., Nagelkerken I., van der Velde G., 2004a, The relationship of reef fish densities
to the proximity of mangrove and seagrass nurseries. Estuar. Coast. Shelf Sci. 60, 37-48.
Dorenbosch M., Verweij M.C., Nagelkerken I., Jiddawi N., van der Velde G., 2004b, Homing and daytime tidal
movements of juvenile snappers (Lutjanidae) between shallow-water nursery habitats in Zanzibar, western
Indian Ocean. Envir. Biol. Fish. 70, 203-209.
Field A., 2000, Discovering statistics using SPSS for Windows. 496 pp. Sage Publications, London.
Forward R.B. Jr., Tankersley R.A., 2001, Selective tidal-stream transport of marine animals. Oceanogr. Mar.
Biol. Annu. Rev. 39, 305–353.
Froese R., Pauly D., (eds.), 2004, FishBase. World Wide Web electronic publication. www.fishbase.org, version
(08/2004).
Chapter 4: Habitat utilisation by juvenile fishes
86
Jiddawi N.S., Stanley R.D., 1997, Fisheries stock assessment in the traditional fishery sector: the information
needs. Canadian International Development Agency, Zanzibar, Tanzania.
Johnstone R.W., Mohammed S.M., 1995, Spatial and temporal variations in water column nutrient
concentrations in a tidally dominated mangrove creek: Chwaka Bay, Zanzibar. Ambio 24, 482-486.
Kimani EN., Mwatha G.K., Wakwabi E.O., Ntiba J.M., Okoth B.K., 1996, Fishes of a shallow tropical mangrove
estuary, Gazi, Kenya. Mar. Freshw. Res. 47, 857-868.
Laegdsgaard P., Johnson C.R., 1995, Mangrove habitats as nurseries: unique assemblages of juvenile fish in
subtropical mangroves in Eastern Australia. Mar. Ecol. Prog. Ser. 126, 67-81.
Little M.C., Reay P.J., Grove S.J., 1988, The fish community of an East African mangrove creek. J. Fish Biol.
32, 729-747.
McClanahan T.R., 1988, Seasonality in East Africa’s coastal waters. Mar. Ecol. Prog. Ser. 44, 191-199.
Mohammed S.M., Johnstone R.W., Widen B., Jordelius E., 1995, The role of mangroves in the nutrient cycling
and productivity of adjacent seagrass communities, Chwaka Bay, Zanzibar. Zoology Department,
Stockholm University, Sweden, and University of Dar es Salaam, Tanzania.
Morton R.M., 1990, Community structure, density and standing crop of fishes in a subtropical Australian
mangrove area. Mar. Biol. 105, 385-394.
Nagelkerken I., 2000, Importance of shallow-water bay biotopes as nurseries for Caribbean reef fishes. Ph.D.
Thesis, University of Nijmegen, The Netherlands, 168 pp.
Nagelkerken I., Dorenbosch M., Verberk W.C.E.P., Cocheret de la Morinière E., van der Velde G., 2000a,
Importance of shallow-water biotopes of a Caribbean bay for juvenile coral reef fishes: patterns in biotope
association, community structure and spatial distribution. Mar. Ecol. Prog. Ser. 202, 175-192.
Nagelkerken I., van der Velde G., Gorissen M.W., Meijer G.J., van’t Hof T., den Hartog C., 2000b, Importance
of mangroves, seagrass beds and the shallow coral reef as a nursery for important coral reef fishes, using a
visual census technique. Estuar. Coast. Shelf Sci. 51, 31-44.
Nagelkerken I., van der Velde G., 2002, Do non-estuarine mangroves harbour higher densities of juvenile fish
than adjacent shallow-water and coral reef habitats in Curaçao (Netherlands Antilles)? Mar. Ecol. Prog. Ser.
245, 191-204.
Nagelkerken I., Roberts C.M, van der Velde G., Dorenbosch M., van Riel M.C., Cocheret de la Morinière E.,
Nienhuis P.H., 2002, How important are mangroves and seagrass beds for coral-reef fish? The nursery
hypothesis tested on island scale. Mar. Ecol. Prog. Ser. 244, 299-305.
Nagelkerken I., van der Velde G., 2003, Connectivity between coastal habitats of two oceanic Caribbean islands
as inferred from ontogenetic shifts by coral reef fishes. Gulf Caribb. Res. 14, 43-59.
Parrish J.D., 1989, Fish communities of interacting shallow-water habitats in tropical oceanic regions. Mar. Ecol.
Prog. Ser. 58, 143-160.
Pinto L., Punchihewa N.N., 1996, Utilization of mangroves and seagrasses by fishes in the Negombo estuary, Sri
Lanka. Mar. Biol. 126, 333-345.
Robertson A.I., Duke N.C., 1987, Mangrove as nursery sites: comparison of the abundance and species
composition of fish and crustaceans in mangroves and other near shore habitats in tropical Australia. Mar.
Biol. 96,193-205.

Chapter 4: Habitat utilisation by juvenile fishes
87
Rozas L.P., Minello T.J., 1997, Estimating densities of small fishes and decapod crustaceans in shallow estuarine
habitats: a review of sampling design with focus on gear selection. Estuaries 20, 199-213.
ter Braak C.J.F., Smilauer P., 1998, Reference manual and user’s guide to Canoco for Windows: Software for
canonical community ordination (version 4). Microcomputer Power, Ithaca, New York.
Thayer G.W., Colby D.R., Hettler W.F., 1987, Utilization of the red mangrove prop root habitats by fishes in
south Florida. Mar. Ecol. Prog. Ser. 35, 25-38.
van der Velde G., van Avesaath P.H., Ntiba M.J., Mwatha G.K., Marguillier S., Woitchik A.F., 1995, Fish fauna
of mangrove creeks, seagrass meadows and sand flats in Gazi Bay, Kenya (Indian Ocean): a study with nets
and stable isotopes. In: Heip C.H.R., Hemminga M.A., de Bie M.J.M. (Eds.) Monsoons and coastal
ecosystems in Kenya. Netherlands Indian Ocean Programme Cruise Report 5, 39-50.
Wakwabi E.O., 1999, The ichthyofauna of a tropical mangrove bay (Gazi bay, Kenya): Community structure and
trophic organisation. Ph.D. Thesis, Instituut voor Dierkunde, vakgroep morfologie, systematiek en ecologie,
Universiteit Gent.
Weerts S.P., Cyrus D.P., 2002, Occurrence of young and small-sized fishes in different habitats within a
subtropical South African and adjacent harbour. Mar. Freshwater Res. 53, 447-456.

Chapter 4: Habitat utilisation by juvenile fishes
88

Chapter 5
The importance of mangroves, mud and sand flats, and seagrass beds
as feeding areas for juvenile fishes in Chwaka Bay, Zanzibar:
gut content and stable isotope analyses
Lugendo BR, Nagelkerken I, van der Velde G, Mgaya YD
(In press-Journal of Fish Biology)
Chapter 5: Feeding grounds for tropical juvenile fishes
90
Abstract:The relative importance of bay habitats, consisting of mangrove creeks and channel, seagrass beds, and mud and sand flats, as feeding grounds for a number of fish species was studied in Chwaka Bay, Zanzibar, Tanzania, using gut content analysis and stable isotope analysis of carbon and nitrogen. Gut content analysis revealed that within fish species almost the same food items were consumed regardless of the different habitats in which they were caught. Crustaceans (mainly copepods, crabs and shrimps) were the preferred food for most zoobenthivores and omnivores, while fishes and algae were the preferred food for piscivores and herbivores, respectively. The mean d13C values of fishes and food items from the mangrove habitats were significantly depleted to those from the seagrass habitats by 6.9 and 9.7% for fishes and food items, respectively, and to those from the mud and sand flats by 3.5 and 5.8%, respectively. Fishes and food items from the mud and sand flats were significantly depleted as compared to those of the seagrass habitats by 3�4 and 3�9%, for fish and food, respectively. Similar to other studies done in different geographical locations, the importance of mangrove and seagrass themselves as a primary source of carbon to higher trophic levels is limited. The different bay habitats were all used as feeding grounds by different fish species. Individuals of the species Gerres filamentosus, Gerres oyena, Lethrinus lentjan, Lutjanus fulviflamma, Pelates quadrilineatus and Siganus sutor appeared to show a connectivity with respect to feeding between different habitats by having d13C values which were in-between those of food items from two neighbouring habitats. This connectivity could be a result of either daily tidal migrations or recent ontogenetic migration.
INTRODUCTION
Mangrove and seagrass habitats are often characterised by high densities of juvenile fishes and are
therefore often referred to as nursery habitats (Robertson & Duke, 1987; Little et al., 1988; Parrish,
1989), although little evidence has yet been provided for this (Beck et al., 2001; Chittaro et al., 2004).
Protection against predation, a high food abundance and easy interception of planktonic fish larvae due
to the large areas of the habitats are among the assumptions used in explaining the high abundances of
juvenile reef fish species in these habitats (Parrish, 1989; Robertson & Blaber, 1992). Few studies
have, however, tested these hypotheses (Laegdsgaard & Johnson, 2001; Cocheret de la Morinie`re et
al., 2004; Verweij et al., 2006) in contrast to numerous studies that describe the fish assemblages of
such habitats. The contradicting information about the functioning of these habitats (Chong et al.,
1990) creates a need to investigate several regions independently. As pointed out by Hartill et al.
(2003), a better understanding is required of the resources used by different fish species and life stages,
and of how important different habitats are in maintaining fish populations before management plans
can be improved.
Mangrove and seagrass habitats are often interlinked through diurnal and tidal fish migrations
(Rooker & Dennis, 1991; Vance et al., 1996; Nagelkerken et al., 2000; Dorenbosch et al., 2004). Little
is known, however, of the degree to which these habitats are used as feeding habitats (Nagelkerken &
van der Velde, 2004). Conventional techniques such as gut content analysis may provide unreliable
results with respect to the diet composition and the source of the food due to the following reasons: 1)
differences in digestion rates of ingested material, 2) contents can be hard to identify, 3) not all
contents are digested, 4) it provides just a snapshot of the true diet and 5) it does not show from where
the food originates (MacDonald et al., 1982; Gearing, 1991; Polis & Strong, 1996). Nonetheless, it
proves to be the only means of establishing details of the types and amounts of prey taken (Sydeman et
al., 1997). Analysis of the stable isotopes of carbon and nitrogen can provide a clearer understanding

Chapter 5: Feeding grounds for tropical juvenile fishes
91
of diets because they reflect the actual assimilation of organic matter into consumer tissue rather than
merely its consumption, and provide an average of the diet over periods of weeks to months (Gearing,
1991). The power of stable isotope analysis as a tool in the investigation of aquatic food web structures
and dietary patterns is based on the significant and consistent differences in isotopic composition of
different types of primary producers due to different photosynthetic pathways or different inorganic
carbon sources (Bouillon et al., 2002a). The stable isotopic composition of an animal reflects that of
its diet with up to 1.0% enrichment in 13C and an average of 3.5% enrichment in 15N between a
consumer and its food source (DeNiro & Epstein, 1978; Fry & Sherr, 1984; Minagawa & Wada, 1984)
due to the discrimination against lighter isotopes during assimilatory and excretory functions within
consumers (Minagawa & Wada, 1984). The actual degree of fractionation, however, varies as a
function of taxonomy, food quality and environmental factors (Vanderklift & Ponsard, 2003).
The aim of the present study was to establish the relative importance of different bay habitats,
namely, mangroves, seagrass beds, and mud and sand flats, as feeding areas for juveniles of a number
of commercially important fish species in Chwaka Bay, Zanzibar. The combination of gut analysis and
stable isotope analysis was expected to provide information on both the type and relative amount of
prey ingested and to reflect the sources of the food assimilated by different fish species over periods of
weeks up to months. This study endeavoured to answer the following questions: 1) Is there a
significant difference in stable isotopic signature (C and N) of fishes and food items in different bay
habitats? 2) In which habitats do fishes eat and what do they consume? 3) To what degree does
connectivity between habitats due to feeding by fishes exist?
MATERIALS AND METHODS
Study area
The study was carried out in Chwaka Bay, a shallow bay located on the east coast of Unguja Island,
Zanzibar, Tanzania (Fig. 1). Chwaka Bay consists of a large intertidal flat partly covered with mixed
assemblages of algae and seagrass beds with an average depth of 3.2 m, an estimated area of 50 km2 at
high spring tide and 20 km2 at low spring tide, and a mean tidal range of 3.2 m (Cederlöf et al., 1995;
Mahongo, 1997). Chwaka Bay is protected from the high-energy ocean on the east coast by a reef
system running along the coastline, as well as the Michamvi Peninsula (Fig. 1). On the landward side,
the bay is fringed by a dense mangrove forest of c. 3000 ha (Mohammed et al., 2001). The mangrove
forest has a number of tidal creeks fringed by prop roots of the mangrove Rhizophora mucronata
(Lamarck), with Mapopwe Creek (c. 2 m deep) being the largest and the main water exchange route
between the forest and the bay. The mangrove creeks and the channel are intertidal in nature and none
have any significant fresh water input other than rain. The sampled habitats were: mangrove creeks,
mangrove channel, mud and sand flats, Chwaka seagrass beds (seagrass beds close to the mangroves)
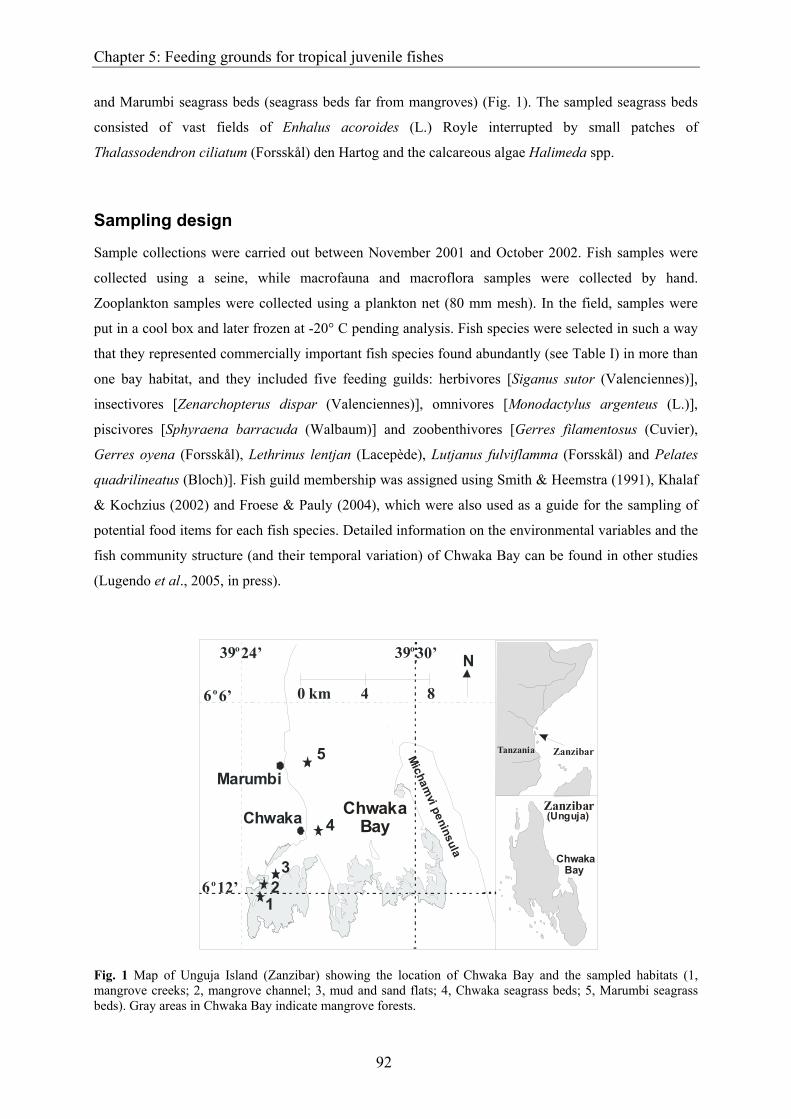
Chapter 5: Feeding grounds for tropical juvenile fishes
92
Marumbi
Chwaka
5
4
2 1
N
3
39o 24’
0 km 4 8
Chwaka Bay
Tanzania Zanzibar
Zanzibar
6o 6’
39o 30’
6o 12’
Micham
vi peninsula
ChwakaBay
(Unguja)
and Marumbi seagrass beds (seagrass beds far from mangroves) (Fig. 1). The sampled seagrass beds
consisted of vast fields of Enhalus acoroides (L.) Royle interrupted by small patches of
Thalassodendron ciliatum (Forsskål) den Hartog and the calcareous algae Halimeda spp.
Sampling design
Sample collections were carried out between November 2001 and October 2002. Fish samples were
collected using a seine, while macrofauna and macroflora samples were collected by hand.
Zooplankton samples were collected using a plankton net (80 mm mesh). In the field, samples were
put in a cool box and later frozen at -20° C pending analysis. Fish species were selected in such a way
that they represented commercially important fish species found abundantly (see Table I) in more than
one bay habitat, and they included five feeding guilds: herbivores [Siganus sutor (Valenciennes)],
insectivores [Zenarchopterus dispar (Valenciennes)], omnivores [Monodactylus argenteus (L.)],
piscivores [Sphyraena barracuda (Walbaum)] and zoobenthivores [Gerres filamentosus (Cuvier),
Gerres oyena (Forsskål), Lethrinus lentjan (Lacepède), Lutjanus fulviflamma (Forsskål) and Pelates
quadrilineatus (Bloch)]. Fish guild membership was assigned using Smith & Heemstra (1991), Khalaf
& Kochzius (2002) and Froese & Pauly (2004), which were also used as a guide for the sampling of
potential food items for each fish species. Detailed information on the environmental variables and the
fish community structure (and their temporal variation) of Chwaka Bay can be found in other studies
(Lugendo et al., 2005, in press).
Fig. 1 Map of Unguja Island (Zanzibar) showing the location of Chwaka Bay and the sampled habitats (1, mangrove creeks; 2, mangrove channel; 3, mud and sand flats; 4, Chwaka seagrass beds; 5, Marumbi seagrass beds). Gray areas in Chwaka Bay indicate mangrove forests.

Chapter 5: Feeding grounds for tropical juvenile fishes
93
Stable isotope analysis
Muscle tissues were removed from the fishes, while molluscs (gastropods and bivalves) and
crustaceans (crabs and shrimps) were dissected from their exoskeleton or shells prior to drying. The
zooplankton samples were cleaned from detritus, sediments and other materials, under a dissecting
microscope. Samples were dried at 70° C for 48 h and ground to powder (homogeneous mixture). For
samples rich in carbonates such as detritus and whole individuals of small hermit crabs, sub-samples
were acid-washed and oven-dried. These sub-samples were used for stable carbon isotope analysis
only, while the remaining untreated sub-samples were used for stable nitrogen isotope analysis since
acid-washing interferes with stable nitrogen isotopes (Pinnegar & Polunin, 1999). Samples were
placed in ultra-pure tin capsules and combusted in a Carlo Erba® NA 1500 elemental analyser coupled
on-line via a Finnigan Conflo III interface with a ThermoFinnigan DeltaPlus mass spectrometer.
Carbon and nitrogen isotope ratios are expressed in the delta notation (δ13C, δ15N) relative to Vienna
PDB and atmospheric nitrogen.The potential food items and possible feeding habitat for fishes were
determined in view of the enrichment in isotope signatures of 1 and 3.5%, for carbon and nitrogen,
respectively, between fishes and their potential food items (DeNiro & Epstein, 1978; Minagawa &
Wada, 1984). The term ‘macroinvertebrate’ is used in the figures to denote zoobenthos and insects
together, while the term ‘zoobenthos’ whenever used in the figures excludes the insects.
Gut content analysis
For fishes, fork length (LF) was measured to the nearest 0.1 cm, and the entire gut extracted and
frozen pending analysis. The gut was then split, the gut contents placed in a Petri dish under a
dissecting microscope and food items were identified to the lowest taxa possible. The percentage of
the total stomach volume that each food category comprised was determined using the point method
(Hyslop, 1980) in which the food items in each fish gut was allotted a number of points depending on
its abundance and size of an organism (i.e. one large organism counted as much as a large number of
small ones). The points and the percentages they represented were 5 (75–100%), 4 (50–75%), 3 (25–
50%), 2 (5–25%) and 1 (up to 5%). All the points gained by each food item were scaled down to
percentages, to give percentage composition of each food item in a diet of individual fish species
examined.

Cha
pter
5: F
eedi
ng g
roun
ds fo
r tro
pica
l juv
enile
fish
es
94
TA
BL
E I
. Sta
ble
carb
on a
nd n
itrog
en is
otop
e si
gnat
ures
(mea
n ±
S.E.
) of d
iffer
ent f
ork
leng
th (L
F) c
lass
es o
f fis
h sp
ecie
s in
diff
eren
t bay
hab
itats
. The
ove
rall
mea
n δ13
C is
al
so sh
own
whe
re m
ore
than
one
size
cla
ss o
f fis
h sp
ecie
s was
pre
sent
in a
hab
itat.
Rel
ativ
e ab
unda
nce
and
rela
tive
biom
ass f
or e
ach
spec
ies i
n ea
ch b
ay h
abita
t are
als
o gi
ven.
N
umbe
rs in
bol
d pr
int s
how
s re
lativ
e pr
opor
tions
of e
ach
spec
ies
for t
he w
hole
bay
. Diff
eren
t sup
ersc
ript l
ette
rs a
nd n
umbe
rs re
pres
ent s
tatis
tical
pos
t hoc
resu
lts a
nd d
enot
e si
gnifi
cant
ly d
iffer
ent (
P <
0.05
) sta
ble
carb
on is
otop
e va
lues
of a
fish
spec
ies f
or si
mila
r LF
clas
ses a
nd fo
r ove
rall δ13
C a
mon
g di
ffer
ent b
ay h
abita
ts
L F c
lass
Ove
rall
Rel
ativ
eR
elat
ive
Spec
ies
(cm
)N
δ13
C δ
15N
Spec
ies
mea
n δ13
Cab
unda
nce
(%)
biom
ass (
%)
Ger
res f
ilam
ento
sus
Ger
res f
ilam
ento
sus
7.5
3.6
Man
grov
e cr
eeks
0-5
2-2
1.3
± 0.
38.
3 ±
0.1
Man
grov
e cr
eeks
-21.
2a±
0.4
9.6
5.8
Man
grov
e cr
eeks
5-1
03
-21.
1a±
0.5
8.0
± 0.
1M
angr
ove
chan
nel
-21.
6a±
0.5
24.3
17.0
Man
grov
e ch
anne
l 5
-10
5-2
1.6a
± 0.
58.
4 ±
0.1
Mud
/san
d fla
ts-1
9.2a
± 1.
00.
81.
1M
ud a
nd sa
nd fl
ats
5-1
04
-19.
2a±
1.0
8.0
± 0.
2G
erre
s oye
naG
erre
s oye
na22
.621
.2M
angr
ove
cree
ks 5
-10
10-1
9.4a
± 0.
37.
5 ±
0.2
Man
grov
e cr
eeks
7.1
7.1
Man
grov
e ch
anne
l 5
-10
10-1
7.0b
± 0.
77.
4 ±
0.1
Man
grov
e ch
anne
l25
.635
.0M
ud a
nd sa
nd fl
ats
5-1
010
-13.
8c±
0.3
6.6
± 0.
2M
ud/s
and
flats
62.6
56.2
Chw
aka
seag
rass
bed
s 5
-10
10-1
2.8c
± 0.
77.
5 ±
0.1
Chw
aka
seag
rass
bed
s37
.638
.8Le
thri
nus l
entja
nLe
thri
nus l
entja
n2.
71.
6M
angr
ove
chan
nel
5-1
010
-21.
8a±
0.3
8.0
± 0.
1M
angr
ove
chan
nel
-21.
8a±
0.3
2.4
1.2
Mud
and
sand
flat
s 5
-10
9-1
9.3b
± 0.
76.
8 ±
0.2
Mud
/san
d fla
ts-1
9.3b
± 0.
76.
83.
4C
hwak
a se
agra
ss b
eds
5-1
010
-12.
3c±
0.2
8.0
± 0.
1C
hwak
a se
agra
ss b
eds
-12.
3c±
0.2
3.9
3.0
Mar
umbi
seag
rass
bed
s 5
-10
4-1
2.4c
± 0.
68.
3 ±
0.2
Mar
umbi
seag
rass
bed
s-1
2.0c
± 0.
41.
71.
1M
arum
bi se
agra
ss b
eds
10-
152
-11.
6 ±
0.1
8.3
± 0.
0
Lutja
nus f
ulvi
flam
ma
Lutja
nus f
ulvi
flam
ma
2.0
3.3
Man
grov
e ch
anne
l 5
-10
4-2
1.01
± 0.
28.
5 ±
0.1
Man
grov
e cr
eeks
-20.
1a±
0.9
0.8
2.0
Chw
aka
seag
rass
bed
s 5
-10
4-1
5.22
± 0.
78.
0 ±
0.2
Man
grov
e ch
anne
l-2
1.8a
± 0.
11.
42.
1M
angr
ove
cree
ks 1
0-15
3-2
0.1ab
± 0.
98.
6 ±
0.4
Mud
/san
d fla
ts-1
5.2b
± 0.
53.
85.
6M
angr
ove
chan
nel
10-
152
-22.
6a±
0.0
9.2
± 0.
0C
hwak
a se
agra
ss b
eds
-14.
5b±
0.4
5.2
8.2
Mud
and
sand
flat
s 1
0-15
5-1
5.2c
± 0.
57.
6 ±
0.2
Mar
umbi
seag
rass
bed
s-1
1.2c
± 0.
40.
30.
4

Cha
pter
5: F
eedi
ng g
roun
ds fo
r tro
pica
l juv
enile
fish
es
95
TA
BL
E I
cont
inue
d.
L F c
lass
Ove
rall
Rel
ativ
eR
elat
ive
Spec
ies
(cm
)N
δ13
C δ
15N
Spec
ies
mea
n δ13
Cab
unda
nce
(%)
biom
ass (
%)
Chw
aka
seag
rass
bed
s 1
0-15
2 -1
4.2bc
± 0
.09.
0 ±
0.2
Mar
umbi
seag
rass
bed
s 1
0-15
4 -1
1.2d ±
0.4
9.0
± 0.
1
Mon
odac
tylu
s arg
ente
usM
onod
acty
lus a
rgen
teus
3.1
1.2
Man
grov
e cr
eeks
0-5
11 -2
2.1a ±
0.2
8.0
± 0.
1M
angr
ove
cree
ks5.
52.
8M
angr
ove
chan
nel
5-1
03
-24.
0b ± 0
.68.
4 ±
0.4
Man
grov
e ch
anne
l5.
53.
8
Pela
tes q
uadr
iline
atus
Pela
tes q
uadr
iline
atus
2.5
2.4
Mud
/san
d fla
ts 5
-10
9 -1
7.1a ±
0.1
7.2
± 0.
1M
ud/s
and
flats
2.9
1.9
Chw
aka
seag
rass
bed
s 5
-10
10 -1
6.2b ±
0.4
7.8
± 0.
2C
hwak
a se
agra
ss b
eds
12.3
10.8
Siga
nus s
utor
Siga
nus s
utor
1.6
3.6
Mud
and
sand
flat
s 5
-10
7 -2
2.8a ±
0.5
5.6
± 0.
3M
ud/s
and
flats
-22.
8a ± 0
.51.
31.
2C
hwak
a se
agra
ss b
eds
5-1
04
-20.
7a ± 0
.87.
0 ±
0.2
Chw
aka
seag
rass
bed
s -1
9.5b ±
0.7
2.8
2.0
Mar
umbi
seag
rass
bed
s 5
-10
4 -1
5.5b ±
0.7
6.7
± 0.
3M
arum
bi se
agra
ss b
eds
-16.
1c ± 0
.57.
411
.4C
hwak
a se
agra
ss b
eds
10-
151
-15.
46.
1M
arum
bi se
agra
ss b
eds
10-
1511
-16.
2 ±
0.6
6.5
± 0.
1M
arum
bi se
agra
ss b
eds
15-
2011
-16.
5 ±
0.2
6.3
± 0
.1
Sphy
raen
a ba
rrac
uda
Sphy
raen
a ba
rrac
uda
0.9
3.8
Man
grov
e cr
eeks
10-
152
-20.
61 ± 1
.09.
2 ±
0.0
Man
grov
e cr
eeks
-20.
6a ± 1
.00.
93.
1M
angr
ove
chan
nel
10-
155
-19.
91 ± 0
.59.
8 ±
0.1
Man
grov
e ch
anne
l -1
9.9a ±
0.5
1.1
4.5
Mud
/san
d fla
ts 1
5-20
5 -1
5.7
± 0.
28.
5 ±
0.2
Mud
/san
d fla
ts -1
5.9b ±
0.4
1.5
7.2
Mud
and
sand
flat
s 2
0-25
2 -1
6.1a ±
0.5
8.2
± 0.
4C
hwak
a se
agra
ss b
eds
-14.
6b ± 1
.80.
75.
9C
hwak
a se
agra
ss b
eds
20-
252
-14.
6a ± 1
.89.
1 ±
0.6
Zena
rcho
pter
us d
ispa
rZe
narc
hopt
erus
dis
par
3.9
4.8
Man
grov
e cr
eeks
10-
159
-22.
8a ± 0
.18.
1 ±
0.1
Man
grov
e cr
eeks
8.2
14.6
Man
grov
e ch
anne
l 1
0-15
9 -2
2.7a ±
0.1
8.2
± 0.
1 M
angr
ove
chan
nel
2.9
4.9
N
, sam
ple
size
.
Chapter 5: Feeding grounds for tropical juvenile fishes
96
Statistical analysis
Each bay habitat was treated as a sample unit. First, data were pooled for each habitat for fishes and
for food items, respectively, in order to test for the overall differences among habitats. Subsequently,
each fish species was treated separately. The numbers of individual fishes analysed for each particular
species (i.e. sample size) equaled the number of replicates (N; Table I). Data were checked for
homogeneity of variances using a Levene’s test (Field, 2000). In case variances were homogeneous, a
one-way ANOVA or t-test was employed to test for differences in stable isotope signatures of carbon
for fish and food items among different habitats. Since fish sample sizes were very different (see Table
I), a Hochberg’s GT2 was used as a post hoc test due to its greater statistical power in such kinds of
data compared to other tests (Field, 2000). All data that did not show homogeneous variances were
log10-transformed, and a Levene’s test was performed once again. Either Kruskal–Wallis test or
Mann–Whitney U-test (depending on the number of sample units involved) on the non-transformed
data was used as a non-parametric test equivalent when variances were not homogeneous, even after
log10-transformation. A Games–Howell post hoc test was used following the Kruskal–Wallis tests
because it is more powerful and specifically designed for lack of homogeneity of variances (Field,
2000). A significance level of P < 0�05 was used in all tests. All analyses were performed using the
programme SPSS 11.5 for Windows (Field, 2000).
RESULTS
Gut content analysis
Gut analysis indicated a food preference by different fish species, despite the fact that they ingested a
variety of food items (Table II). While some fish species maintained a quite similar diet type
regardless of the different habitats from which they were caught (G. filamentosus: copepods; S. sutor:
macroalgae; S. barracuda: fishes; Z. dispar: insects), the diet of the other species (G. oyena, L. lentjan,
L. fulviflamma and M. argenteus) differed within species in different habitats. The main food of G.
oyena from the mangrove channel and from Chwaka seagrass beds mainly consisted of copepods
while fishes from mud and sand flats fed mainly on detritus (Table II). Lethrinus lentjan fed mainly on
ostracods in the mangrove channel, on copepods on the mud and sand flats and on crustaceans and
insects in the Chwaka seagrass beds. The diet of L. fulviflamma consisted mainly of crustaceans in the
mangroves, of copepods on the mud and sand flats, of crabs and shrimps in Chwaka seagrass beds, and
of crabs and fishes in Marumbi seagrass beds. Monodactylus argenteus from the mangrove creeks fed
mainly on copepods while those from mangrove channel fed mainly on algae (Table II).

Chapter 5: Feeding grounds for tropical juvenile fishes
97
Mean δ13c signatures for fish and food items
A clear gradient in δ13C could be discerned for fishes as well as food items from the mangrove
habitats located deep into the bay to the seagrass beds at the mouth of the bay (Fig. 2). Fishes and food
items from the mangrove habitats were significantly depleted (Hochberg’s GT2, P < 0.001) to those
from the seagrass habitats by on average 6.9 and 9.7% for fishes and food items, respectively, and
from the mud and sand flats by on average 3.5 and 5.8%, respectively. Food items from the mud and
sand flats were significantly depleted (Hochberg’s GT2, P < 0.01) as compared to those of the seagrass
habitats by on average 3.9%. Fishes from the mud and sand flats were depleted by an average of 3.4%,
but this difference was not significant (Hochberg’s GT2, P > 0.05). There were no significant
differences (Hochberg’s GT2, P > 0.05) in δ13C between the two mangrove habitats (average
difference of 0.2 and 1.5%, for fishes and food, respectively), and between the two seagrass habitats
(average difference of 1.9 and 0.2%, for fishes and food, respectively).

Cha
pter
5: F
eedi
ng g
roun
ds fo
r tro
pica
l juv
enile
fish
es
98
TA
BL
E I
I. M
ean
perc
enta
ge c
ompo
sitio
n of
die
t for
diff
eren
t fis
h sp
ecie
s an
d fo
rk le
ngth
(LF)
cla
sses
in d
iffer
ent b
ay h
abita
ts. G
ray
boxe
s hi
ghlig
ht a
ll fo
od it
ems
with
a
rela
tive
abun
danc
e of
>19
%.
Uni
dent
ified
Uni
dent
ified
Oth
erL F
clas
s C
rust
acea
nan
imal
plan
tSp
ecie
s/si
te(c
m)
NC
opep
odC
rab
Shrim
pO
stra
cod
parts
Fish
es
Det
ritus
Gas
tropo
dN
emat
ode
Inse
ctA
lgae
Seag
rass
Sedi
men
tm
ater
ial
mat
eria
l
Ger
res f
ilam
ento
sus
(ZB
)M
angr
ove
0-5
, 5-1
03
95.8
1.0
3.2
cr
eeks
Man
grov
e 0
-5, 5
-10
4571
.21.
90.
311
.40.
12.
39.
92.
8
chan
nel
Ger
res o
yena
(ZB
)M
angr
ove
5-1
015
42.9
2.0
15.2
7.1
0.2
9.8
12.5
6.2
4.2
ch
anne
lM
ud a
nd
0-5
, 5-1
0, 1
0-15
1621
.22.
153
.38.
40.
21.
98.
74.
2
sand
flat
sC
hwak
a 1
0-15
1139
.22.
726
.13.
44.
811
.212
.6
seag
rass
bed
Leth
rinu
s len
tjan
(ZB
)M
angr
ove
5-1
07
12.9
53.6
14.3
2.1
17.1
ch
anne
lM
ud a
nd 5
-10
1270
.83.
18.
30.
30.
317
.00.
3
sand
flat
sC
hwak
a 5
-10,
10-
153
33.3
33.3
33.3
se
agra
ss b
edLu
tjanu
s ful
vifla
mm
a (Z
B)
Man
grov
e 5
-10
619
.219
.227
.116
.716
.71.
2
chan
nel
Mud
and
5-1
0, 1
0-15
1239
.68.
320
.80.
38.
38.
314
.3
sand
flat
sC
hwak
a 5
-10,
10-
1530
40.4
22.7
10.4
0.1
4.2
20.1
2.1
se
agra
ss b
edM
arum
bi3
45.8
20.8
33.3
se
agra
ss b
edM
onod
acty
lus a
rgen
teus
(O
)M
angr
ove
0-5
, 5-1
018
46.0
50*
0.8
3.0
0.2
cr
eeks

Cha
pter
5: F
eedi
ng g
roun
ds fo
r tro
pica
l juv
enile
fish
es
99
TA
BL
E II
. Con
tinue
d
Uni
dent
ified
Uni
dent
ified
Oth
erL F
clas
s C
rust
acea
nan
imal
plan
tSp
ecie
s/si
te(c
m)
NC
opep
odC
rab
Shrim
pO
stra
cod
parts
Fish
es
Det
ritus
Gas
tropo
dN
emat
ode
Inse
ctA
lgae
Seag
rass
Sedi
men
t m
ater
ial
mat
eria
l
Man
grov
e 5
-10
106.
317
.810
.065
.00.
9
chan
nel
Pela
tes q
uadr
iline
atus
(ZB
)M
ud a
nd 5
-10,
10-
155
32.5
27.5
20.0
20.0
sa
nd fl
ats
Zena
rcho
pter
us d
ispa
r (Z
B)
Man
grov
e 1
0-15
, 15-
209
0.3
11.4
9.7
69.4
4.2
4.2
0.7
cr
eeks
Man
grov
e 1
5-20
520
.020
.040
.020
.0
chan
nel
Siga
nus s
utor
(H
)M
angr
ove
5-1
05
92.5
7.5
ch
anne
lM
ud a
nd 5
-10,
10-
155
4.4
72.5
7.5
15.6
sa
nd fl
ats
Mar
umbi
5-1
0, 1
0-15
, 15-
2023
7.1
79.4
2.3
11.2
se
agra
ss b
edSp
hyra
ena
barr
acud
a (P
)M
angr
ove
10-
155
100.
0
chan
nel
Mud
and
10-
15, 1
5-20
, 20-
257
16.7
62.5
1.0
18.8
1.0
sa
nd fl
ats
Chw
aka
10-
20, 2
0-30
421
.91.
071
.91.
01.
52.
7
seag
rass
bed
H
, her
bivo
re; O
, om
nivo
re; P
, pis
civo
re; Z
B, z
oobe
nthi
vore
; N, n
umbe
r of f
ish
anal
ysed
; *sh
rimp
larv
ae.

Chapter 5: Feeding grounds for tropical juvenile fishes
100
2
3
4
5
6
7
8
9
-26 -25 -24 -23 -22 -21 -20 -19 -18 -17 -16 -15 -14 -13 -12
δ13C ± SE
δ15N
± S
EFood - mangrove creeks Food - mangrove channelFood - mud/sand flats Food - Chwaka seagrass bedsFood - Marumbi seagrass beds Fish - mangrove creeksFish - mangrove channel Fish - mud/sand flatsFish - Chwaka seagrass beds Fish - Marumbi seagrass beds
Fig. 2 Pooled mean stable carbon and nitrogen isotope values of fish (empty symbols and *) and food items (filled symbols and x) in different bay habitats. ◊ = mangrove creeks, □ = mangrove channel, ∆ = mud/sand flats, ○ = Chwaka seagrass beds, * and x = Marumbi seagrass beds.
Stable isotopic signatures of fish species
Individual fish species from the mangrove habitats were generally more depleted in δ13C compared to
those of the same species from either mud and sand flats or the seagrass habitats (Table I). The δ13C
depletion of individual species was generally in the order: mangrove habitats < mud and sand flats <
seagrass habitats. The highest enrichment in δ13C between two neighbouring habitats was observed for
individuals of the same LF class (10–15 cm) of L. fulviflamma (mangrove channel and mud and sand
flats: 7.4%). With regard to δ15N, the herbivore S. sutor was the most depleted and the piscivore S.
barracuda the most enriched fish species, with a range of 2.6–2.8% (considering the overall mean for
LF classes) between the two species when occurring in the same habitat.
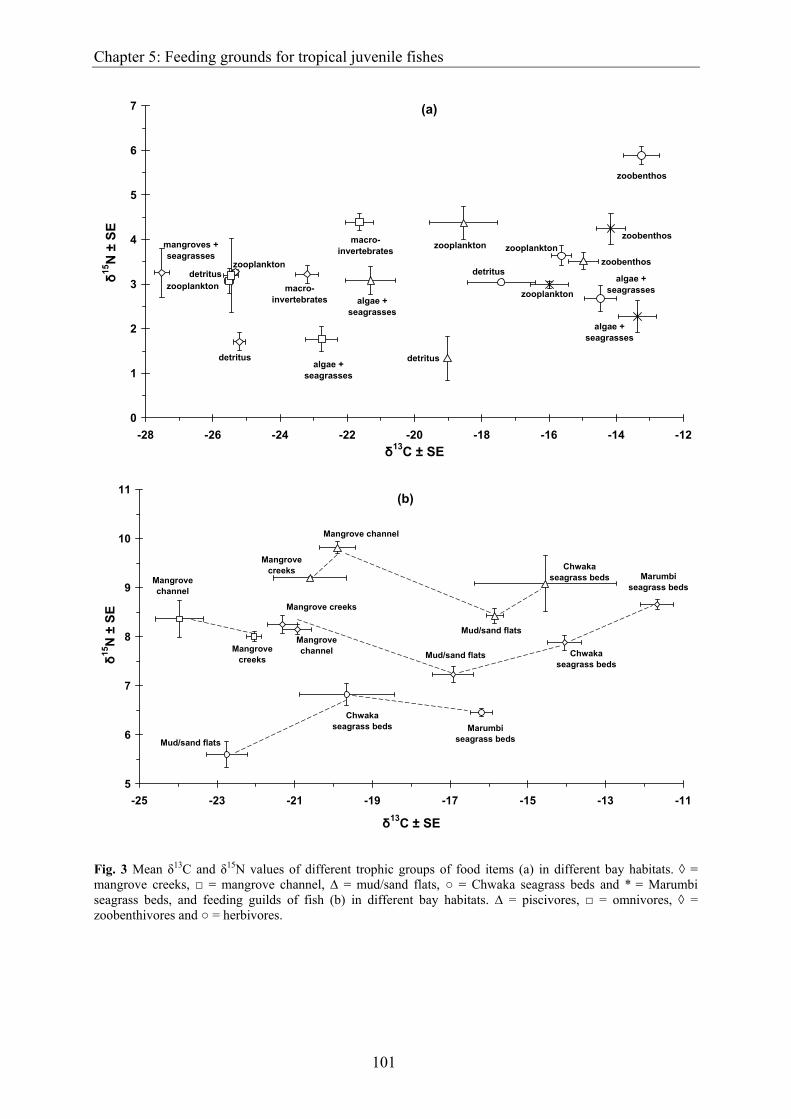
Chapter 5: Feeding grounds for tropical juvenile fishes
101
0
1
2
3
4
5
6
7
-28 -26 -24 -22 -20 -18 -16 -14 -12δ13C ± SE
δ15N
± S
E
mangroves + seagrasses
zooplanktondetritus
zooplankton
detritus
macro-invertebrates
algae + seagrasses
algae + seagrasses
detritus
macro-invertebrates zooplankton
detritus
algae + seagrasses
zooplankton
zoobenthoszooplankton
zoobenthos
algae + seagrasses
zoobenthos
(a)
5
6
7
8
9
10
11
-25 -23 -21 -19 -17 -15 -13 -11
δ13C ± SE
δ15
N ±
SE
Mangrove creeks
Mangrove channel
Mud/sand flats
Chwaka seagrass bedsMangrove
channel
Mangrove creeks
Mangrove creeks
Mangrove channel
Marumbi seagrass beds
Chwaka seagrass beds
Marumbi seagrass beds
Chwaka seagrass beds
Mud/sand flats
Mud/sand flats
(b)
Fig. 3 Mean δ13C and δ15N values of different trophic groups of food items (a) in different bay habitats. ◊ = mangrove creeks, □ = mangrove channel, ∆ = mud/sand flats, ○ = Chwaka seagrass beds and * = Marumbi seagrass beds, and feeding guilds of fish (b) in different bay habitats. ∆ = piscivores, □ = omnivores, ◊ = zoobenthivores and ○ = herbivores.

Chapter 5: Feeding grounds for tropical juvenile fishes
102
Considering individuals of the same species and similar size classes in different bay habitats, δ13C of
five species, namely, G. oyena (5–10 cm), L. lentjan (5–10 cm), L. fulviflamma (10–15 cm), P.
quadrilineatus (5– 10 cm) and S. sutor (5–10 cm), differed significantly between habitats (one-way
ANOVA, d.f. = 3,36, P < 0.001 for G. oyena, Kruskal–Wallis, d.f. = 3, P < 0.001 for L. lentjan,
Kruskal–Wallis, d.f. = 4, P < 0.01 for L. fulviflamma, t-test, d.f. = 1, P < 0.05 for P. quadrilineatus and
one-way ANOVA, d.f. = 2,12, P < 0.001 for S. sutor), while those of G. filamentosus (5–10 cm) and Z.
dispar (10–15 cm) did not differ significantly between different bay habitats (Kruskal–Wallis, d.f. = 2,
P > 0.05 for G. filamentosus, Mann–Whitney U-test, d.f. = 1, P > 0.05 for Z. dispar). Similar results
were obtained when different LF classes of individual species were pooled within each habitat in
which case also M. argenteus differed significantly between the two mangrove habitats (t-test, d.f. = 1,
P < 0.01). The post hoc results are presented in Table I.
Analysis of potential food and feeding habitats of different fish species
The herbivore S. sutor ingested mainly macroalgae (Table II). The δ13C and δ15N values of the
average diet of this species were generally quite similar to those of macroalgae, but very distinct from
those of seagrasses or mangrove leaves [Fig. 4(a)]. Siganus sutor from the mud and sand flats showed
stable isotope signatures indicating various types of macroalgae from the mangrove channel as a
potential food source, while fish from Chwaka seagrass beds showed values indicating green and
brown algae from mud and sand flats and the calcareous green algae (Halimeda sp.) from Chwaka
seagrass beds as a potential food source. Siganus sutor from Marumbi seagrass bed showed an
intermediate value for its average diet that lay in-between those of green algae from the mud and sand
flats, Halimeda sp. from Chwaka seagrass beds, and calcareous green algae (Udotea sp.) and red algae
from Marumbi seagrass beds.
The gut content of the insectivore Z. dispar showed that insects formed a major part of its diet
(Table II), while the stable isotope values from both mangrove habitats suggested a mixed diet of crabs
(Sesarma sp. and Portunidae), shrimps and insects from the mangroves [Fig. 4(b)].
The omnivore M. argenteus ingested zooplankton, algae and some detritus (Table II). The ingestion of
zooplankton and detritus is supported by the δ13C for fish from the mangrove channel, although the
enrichment in δ15N was larger than the usual 3.5‰ [Fig. 4(c)]. For fish from the mangrove creeks, the
δ13C signature suggests the diet to consist of a mixture of decapods (Sesarma sp., Portunidae and
shrimps) from the mangrove creeks and zooplankton and detritus from the mangrove channel, but
without an indication of dependence on algae as a food source [Fig. 4(c)].

Chapter 5: Feeding grounds for tropical juvenile fishes
103
-2
0
2
4
6
8
-30 -28 -26 -24 -22 -20 -18 -16 -14 -12 -10 -8 -6
δ13C ± SE
δ15N
± S
E
mangrove leaves
red algae
Halodule wrightii
Halodule wrightii
Halimeda sp.
green algae
brown algae
red algae
brown algae
Jania sp.
Halimeda sp.
green algae
red algae
green algae
Halimeda sp.
Thalassia hemprichii
Thalassodendron ciliatum Eucheuma sp.
Thalassia hemprichii
Enhalus acoroides
Thalassodendron ciliatum
Thalassia hemprichii
green algae
Udotea sp.
red algae
Enhalus acoroides Enhalus acoroidesCymodocea sp.
brown algae
(a)
-1
1
3
5
7
9
-30 -28 -26 -24 -22 -20 -18 -16 -14 -12 -10
δ13C ± SE
δ15N
± S
E
red algae
Halodule wrightii
Cyanobacteria
green algae
brown algae
Portunidae
Sesarma sp.
insects
shrimps
Terebralia sp.
insects
algae + seagrasses
Uca spp.
seagrassesalgae +
seagrasses
algae + seagrasses
animals
animals
animals
detritus
zooplankton
zooplanktondetritus
(b)
Fig. 4. Mean δ13C and δ15N values of fish species (a) Siganus sutor, (b) Zenarchopterus dispar, (c) Monodactylus argenteus, (d) Sphyraena barracuda, (e) Gerres filamentosus, (f) Gerres oyena, (g) Lethrinus lentjan, (h) Lutjanus fulviflamma and (i) Pelates quadrilineatus (large symbols) and potential food items (small symbols) in different bay habitats. ◊ = mangrove creeks, □ = mangrove channel, ∆ = mud/sand flats, ○ = Chwaka seagrass beds and * = Marumbi seagrass beds. The arrow heads indicate the predicted average δ13C and δ15N values (based on the 1 and 3.5% enrichment, respectively, in δ13C and δ15N between an animal and its food source) of the diet of fishes. The dashed lines combine potential food sources within a habitat. Prey species are depicted on lowest taxonomic level for each habitat in which the fish species was found; for the remainder of the habitats the prey species are pooled to higher taxonomic levels (e.g. macroinvertebrates, zoobenthos and seagrasses).

Chapter 5: Feeding grounds for tropical juvenile fishes
104
-2
0
2
4
6
8
10
-30 -28 -26 -24 -22 -20 -18 -16 -14 -12 -10
δ13C ± SE
δ15N
± S
E
Halodule wrightii
detritus Thalassia hemprichii
Halodule wrightii
red algaePortunidae
detritusHalimeda sp.
green algaezooplankton
zooplanktondetritus
Sesarma sp.
insects insects
shrimps
Terebralia sp.
zoobenthos
zoobenthos
algae +seagrasses
algae + seagrasses
zoobenthoszooplankton
zooplankton
detritus
Uca spp.
zooplankton
(c)
brown algae algae +
seagrasses
3
4
5
6
7
8
9
10
11
-25 -23 -21 -19 -17 -15 -13 -11
δ13C ± SE
δ15N
± S
E
carnivores
carnivores
omnivores
omnivores
herbivores
zoobenthos
zoobenthos
herbivores
carnivores
herbivores
zoobenthos zoobenthos
zoobenthos
carnivores
carnivores
(d)
??
?
??
?
?
Fig 4. continued.
Although the gut content analysis shows that fishes formed the major part of the diet of the
piscivore S. barracuda, the stable isotope signatures of the average diet of S. barracuda was not close
enough to those of the selected fish species of this study to depend solely on these species as a food
source. Sphyraena barracuda from the mangrove habitats had an isotope signature of its average diet
that was closest to that of herbivorous fishes from the mud and sand flats and Chwaka seagrass beds,

Chapter 5: Feeding grounds for tropical juvenile fishes
105
0
1
2
3
4
5
6
7
8
9
-26 -24 -22 -20 -18 -16 -14 -12 -10
δ13C ± SE
δ15N
± S
E
zooplankton
zooplankton
Portunidae
Sesarma sp.
Uca spp.
Terebralia sp.
shrimps zooplankton
hermit crabs
brittle stars
crabsDotilla
fenestrata
zooplankton
zooplankton
polychaetes
Dotilla fenestrata
bivalve sp.2
hermit crabsshrimps
Terebralia sp.
zoobenthos amphipods
gastropodsThalamita sp.
bivalve sp.1 polychaetes
Cypraea sp.isopods
(f)
1
2
3
4
5
6
7
8
9
-28 -26 -24 -22 -20 -18 -16 -14 -12 -10
δ13C ± SE
δ15N
± S
E
(e)
Sesarma sp.
Portunidae
zooplankton
zooplankton Uca spp.
Terebralia sp.
shrimp
hermit crab
crab sp. Dotilla sp.
bivalve sp.
gastropod sp.
bivalve sp.
polychaete
shrimp
Terebralia sp.
zooplankton
zooplankton
zoobenthos
zoobenthos
zooplankton
while for S. barracuda from the mud and sand flats and Chwaka seagrass beds this was the case for
herbivorous fish from the Marumbi seagrass beds, with a possibility of feeding partly on macrofauna
too [Fig. 4(d)].
Fig 4. continued.

Chapter 5: Feeding grounds for tropical juvenile fishes
106
0
2
4
6
8
10
-28 -26 -24 -22 -20 -18 -16 -14 -12 -10 -8
δ13C ± SE
δ15N
± S
E Sesarma sp.
Portunidae
zooplankton
zooplankton Uca spp.
Terebralia sp.
shrimps
gastropods
Dotilla fenestrata
Dotilla fenestrata
crabs
hermit crabs
zooplankton
bivalve sp.2
zooplankton
zooplankton
hermit crabs
hermit crabs
Terebralia sp.
shrimps
amphipodspolychaetes
Pinna sp.gastropods polychaetes
Thalamita sp.
polychaetesCypraea sp.
isopodsbrittle stars
brittle stars
Littoraria sp.
bivalve sp.1
(g)
0
2
4
6
8
10
-28 -26 -24 -22 -20 -18 -16 -14 -12 -10 -8
δ13C ± SE
δ15N
± S
E Sesarma sp.
Portunidae
zooplankton
zooplankton Uca spp.
Terebralia sp.
shrimps
brittle stars
zooplankton
hermit crabs
bivalves
Dotilla fenestrata
zooplankton
crabs
zooplankton
Dotilla fenestrata
zooplankton
hermit crabs
hermit crabs
Terebralia sp.
shrimpsamphipods
gastropodsPinna sp.
brittle stars
polychaetes Thalamita sp.
Cypraea sp.isopods
Littoraria sp.
polychaetes
polychaetes
(h)
Dotilla fenestrata
Fig 4. continued.

Chapter 5: Feeding grounds for tropical juvenile fishes
107
0
1
2
3
4
5
6
7
8
9
-28 -26 -24 -22 -20 -18 -16 -14 -12 -10
δ13C ± SE
δ15N
± S
E
zooplankton
zooplankton
brittle stars
zoobenthos
zoobenthos
hermit crabs
zooplankton
zooplankton
zooplanktonzoobenthos
gastropod sp.
Pinna sp.zoobenthos
zoobenthos
brittle stars
(i)
Fig 4. continued.
In conformity with the gut content analysis where crustaceans (mainly copepods, crabs and
shrimps) formed a major part of the diet of most zoobenthivores (Table II), G. filamentosus from the
mangrove habitats had stable isotope signatures for its average diet which lay in-between those of
crustaceans (Sesarma sp., Portunidae and shrimps) from the mangrove creeks, while fish from mud
and sand flats had isotope signatures for their average diet which lay in-between values for shrimps
from the mangrove creeks and zooplankton from mud and sand flats [Fig. 4(e)]. Gerres oyena from the
mangrove creeks showed an isotope signature of its average diet close to the signatures of shrimps
from the mangrove creeks, gastropods (Terebralia sp.) from the mangrove channel and zooplankton
from the mud and sand flats, while G. oyena from mangrove channel had signatures closest to
zooplankton from the mud and sand flats [Fig. 4(f)]. Gerres oyena from the mud and sand flats
showed an average diet signature close to that of bivalves, gastropod (Terebralia sp.) and shrimps
from mud and sand flats and zooplankton from the seagrass beds. Gerres oyena from Chwaka seagrass
beds showed a signature of its average diet close to that of shrimps and gastropods (Terebralia sp.)
from the mud and sand flats, hermit crabs and amphipods from the Chwaka seagrass beds, and
zoobenthos from the Marumbi seagrass beds [Fig. 4(f)]. Lethrinus lentjan from the mangrove channel
showed an isotope signature of its average diet that was intermediate between crabs and shrimps of the
mangrove creeks, while for the mud and sand flats the signatures suggested a possible mix of shrimps,

Chapter 5: Feeding grounds for tropical juvenile fishes
108
crabs (Uca spp.) and gastropod (Terebralia sp.) from the mangroves and hermit crabs and zooplankton
from the mud and sand flats as a food source [Fig. 4(g)]. Lethrinus lentjan from the seagrass habitats
showed an average stable isotope signature for its diet that was close to that of the zoobenthos from the
seagrass habitats. The isotope signature of the average diet of L. fulviflamma from the mangrove
habitats showed proximity to isotope signatures of crabs and shrimps from the mangrove habitats,
while that of fish from the mud and sand flats and Chwaka seagrass beds suggested an intermediate
isotope signature of polychaetes, shrimps and zooplankton from the mud and sand flats [Fig. 4(h)].
Lutjanus fulviflamma from the Marumbi seagrass bed showed a stable isotope signature of its diet in
close proximity to zoobenthos from the seagrass beds. Pelates quadrilineatus from both the mud and
sand flats and Chwaka seagrass beds showed isotope signatures for their average diet close to
zooplankton from mud and sand flats and the two seagrass beds [Fig. 4(i)].
Connectivity between habitats
The isotopic signatures of the fish species in relation to that of the possible food items suggest four
possibilities of feeding connectivity between adjacent bay habitats (Fig. 4): 1) connectivity between
the two mangrove habitats for G. filamentosus, L. lentjan, L. fulviflamma, M. argenteus and Z. dispar,
2) connectivity between mangrove habitats and mud and sand flats for G. filamentosus, L. lentjan and
S. sutor, 3) connectivity between mud and sand flats and seagrass habitats for G. oyena, L.
fulviflamma, P. quadrilineatus and S. sutor, and 4) connectivity between the two seagrass habitats for
L. fulviflamma and L. lentjan.
DISCUSSION
Both gut content and stable carbon isotope analyses showed evidence that the studied fish species
generally relied as a food source on algae (herbivores) and macroinvertebrates (omnivores and
zoobenthivores), with crustaceans (crabs, shrimps and copepods) playing a major role. The different
δ13C or δ15N values of the piscivore S. barracuda from those of (herbivorous) fishes indicate a
possible dependence for juveniles (10–25 cm) of this species on other animals than fishes alone.
Copepods were found to some degree in the guts of the juveniles. In a study in Gazi Bay (Kenya), de
Troch et al. (1998) identified other animals like gammaridean amphipods, mysids, crabs and shrimps
in the stomachs of piscivorous fishes (including S. barracuda), an observation that indicates that at
juvenile stages S. barracuda is not solely piscivorous.
Although the stable isotope signatures showed evidence for food dependence of the studied
fish species on mangrove and seagrass habitats, the direct consumption of either mangrove or seagrass
leaves seemed to be absent or very low. The mean δ13C of mangrove leaves of -28.1% is similar to the
overall values for mangrove leaves recorded in the Caribbean, India, Malaysia and in Kenya (Rao et
Chapter 5: Feeding grounds for tropical juvenile fishes
109
al., 1994; Chong et al., 2001; Bouillon et al., 2002a; Cocheret de la Morinière et al., 2003). Similar to
what was observed by Sheaves & Molony (2000), Bouillon et al. (2002b) and Kieckbusch et al.
(2004), however, this value is much more depleted as compared to either fish species (Sheaves &
Molony, 2000; Kieckbusch et al., 2004; this study) or to most of the macroinvertebrates (Hsieh et al.,
2002; Bouillon et al., 2002b; Guest & Connolly, 2004; Kieckbusch et al., 2004; Abed-Navandi &
Dworschak, 2005) so as to function as a (direct and significant) source of carbon for these fauna. The
most depleted fish species in this study was M. argenteus with a mean δ13C of -24.0%, which is far
more enriched as compared to mangrove leaves. Similarly, Guest & Connolly (2004) in Moreton Bay
(Australia), Macia (2004) in Inhaca Island, Mozambique, and Abed-Navandi & Dworschak (2005) on
the Belize Barrier Reef (Caribbean Sea) observed that the δ13C of most crabs and shrimps from the
mangrove habitats was close to that of microphytobenthos and distinct from that of mangrove leaves.
Seagrasses (with exception of Halodule wrightii in the mangrove creeks and channel with a
mean δ13C of -26.3 and -20.2%, respectively) were too far enriched in δ13C (-15.5 to -8.2%) as
compared to the herbivore S. sutor. This suggests that seagrasses did not contribute to the diet of this
herbivorous fish species. The low contribution of seagrasses and the high contribution of algae to the
food web that was observed by Moncreiff & Sullivan (2001) in the Gulf of Mexico and by Kieckbusch
et al. (2004) in Biscayne Bay is another example that seagrass plays a minor role in the food web and
that algae are the primary source of organic matter for higher trophic levels. Mangroves and seagrasses
do not appear to be direct sources of carbon in the diets of the fish species studied; they probably serve
as refugia as well as a substratum for a variety of primary producers and consumers that are important
in the food webs of these habitats (Kieckbusch et al., 2004). Presence of food in addition to structural
complexity has been reported to account for the strong association of large numbers of juvenile fishes
within mangrove forests (Laegdsgaard & Johnson, 2001). In addition, seagrass beds have also been
reported to harbour a high abundance of small invertebrates that are an important food of many
juvenile fish species (Nakamura & Sano, 2005).
Using stable carbon isotope analysis different habitats were distinguished, which functioned as
a source of carbon. Fish species from the mangroves were more depleted in δ13C as compared to
individuals of the same species caught from either the mud and sand flats or seagrass habitats.
Similarly, fish species from the mud and sand flats were more depleted relative to individuals of the
same species occurring in seagrass beds. The δ13C of food also showed this trend. This is in agreement
with other studies showing that the importance of mangrove-derived carbon (if any) is limited to the
surroundings of the mangrove habitats, and decreases when moving away from the mangroves
(Rodelli et al., 1984; Newell et al., 1995; Dehairs et al., 2000; Chong et al., 2001; Guest & Connolly,
2004). In agreement with Dehairs et al. (2000), this observation calls for critical evaluation on the
assumption that mangrove ecosystem represent a source of organic nutrients for the coastal
ecosystems. Like in other studies from around the world, the present study shows significant feeding

Chapter 5: Feeding grounds for tropical juvenile fishes
110
of fishes (and macrobenthos) in the mangroves (Rodelli et al., 1984; Marguillier et al., 1997; Sheaves
& Molony, 2000; Chong et al., 2001; Cocheret de la Morinière et al., 2003; Guest & Connolly, 2004;
Nagelkerken & van der Velde, 2004; Abed-Navandi & Dworschak, 2005).
The overlap in stable carbon isotopes of some fish species in different bay habitats suggests
connectivity between these habitats, with the possibility that fishes used more than one habitat as a
feeding ground. Some fish species (G. filamentosus, L. lentjan and S. sutor) from the mud and sand
flats showed a possible connection to the mangrove habitats as feeding habitats. Likewise, some fish
species (G. oyena, L. fulviflamma, P. quadrilineatus and S. sutor) from Chwaka seagrass beds showed
some evidence of using mud and sand flats as feeding habitats. An explanation for this observation
could firstly be recent ontogenetic migration (Cocheret de la Morinière et al., 2003). The fishes could
have migrated from one habitat to another habitat recently, as a result of which they still show part of
the signature of their previously used habitat. It could take several weeks to months to acquire the
signature of the food from the new habitat (Gearing, 1991; Hobson, 1999; Nagelkerken & van der
Velde, 2004).
Since the fish samples were collected during low tide, a second possibility is that fishes
migrated with the tides (with a spring tidal difference of 2 m) from the mangroves to the mud and sand
flats and from the mud and sand flats to Chwaka seagrass beds. Migration in relation to feeding (Reis
& Dean, 1981), preference of particular salinities (Quinn & Kojis, 1987) and avoidance of being
stranded during low tide in areas that fall dry (van der Veer & Bergman, 1986) has been suggested to
be among the reasons that can trigger tidal migrations. Since the δ13C signature showed intermediate
values between habitats, this could suggest that they fed at low tide as well as high tide, in two
different habitats. Tidal migration between bay habitats in Chwaka Bay by Lutjanidae has been shown
by Dorenbosch et al. (2004), and other species possibly follow the same pattern of behaviour.
Distance to be covered during (tidal) migration, however, seems important in terms of energy
budget especially when juvenile fishes (<20 cm length) are considered, in which case long-distance
migration costs may exceed energy intake (Nøttestad et al., 1999). This may also be the case in the
present study (in which the majority of the fishes were 5–10 cm LF) where there appears to be
substantial connectivity for fish species between neighbouring habitats, but not between habitats that
were located far away from one another, such as Marumbi seagrass beds located 8 and 6 km away
from the mangrove and mud and sand flat habitats, respectively.
The significant difference observed for some species in stable carbon isotopes in individuals of
the same species and similar size classes between bay habitats suggests two situations: 1) the
individuals of each habitat belong to different assemblages, each depending completely (in terms of
nutrition) on different bay habitats, and 2) the different bay habitats all have the potential of providing
sufficient food sources to the fish assemblage found therein. The differences in fish densities of
particular species and size class in different bay habitats as observed by Lugendo et al. (2005),
however, suggests that other factors than food alone control the distribution of juvenile fishes. As
Chapter 5: Feeding grounds for tropical juvenile fishes
111
observed from other studies, structural complexity and shade in relation to predation risk are among
the important factors in determining distribution of juvenile fishes (Laegdsgaard & Johnson, 2001;
Cocheret de la Morinière et al., 2004; Verweij et al., 2006).
In conclusion, this study revealed that significant differences in stable isotope signatures (C
and N) exist in food and fishes from different bay habitats in Chwaka Bay, which could be used to
delineate feeding habitats of fishes. Fishes appear to forage in all studied bay habitats. Seagrasses and
mangroves do not appear to be direct sources of carbon in the diets of studied fish species; rather, they
probably serve as refuge as well as a substratum for a variety of primary producers and consumers that
are important in the food webs of these habitats. Some fish species of similar feeding guilds showed
some degree of segregation by feeding on different food resources. Zoobenthivores, however, showed
an overlap in diet and mainly fed on copepods, shrimps and crabs. There appears to exist a
connectivity for some fish species between different bay habitats with respect to feeding (between the
mud and sand flats and the mangroves, and between the seagrass beds and the mud and sand flats),
which could be a result of either ontogenetic or tidal migration.
Acknowledgements
Gratitude is expressed to M. A. Manzi, S. J. Simgeni and M. A. Makame for assistance with the
fieldwork. The administration and staff of the Institute of Marine Sciences in Zanzibar provided
logistical support and research facilities. This study was financially supported by NUFFIC through the
ENVIRONS-MHO Project implemented by the Faculty of Science, University of Dar es Salaam,
Tanzania, Schure-Beijerinck-Popping Foundation and Quo Vadis Fonds (Radboud University), The
Netherlands. I. N. was supported by a Vidi grant from the Netherlands Organisation for Scientific
Research (NWO). This is Centre for Wetland Ecology publication no. 415.
Chapter 5: Feeding grounds for tropical juvenile fishes
112
References Abed-Navandi, D. & Dworschak, P. C. (2005). Food sources of tropical thalassidean shrimps: a stable-isotope
study. Marine Ecology Progress Series 291, 159–168.
Beck, M. W., Heck, K. L. Jr., Able, K. W., Childers, D. L., Eggleston, D. B., Gillanders, B. M., Halpern, B.,
Hays, C. G., Hoshino, K., Minello, T. J., Orth, R. J., Sheridan, P. F. & Weinstein, M. P. (2001). The
identification, conservation, and management of estuarine and marine nurseries for fish and invertebrates.
BioScience 51, 633–641.
Bouillon, S., Koedam, N. & Dehairs, F. (2002a). Primary producers sustaining macroinvertebrate communities in
intertidal mangrove forests. Oecologia 130, 441–448.
Bouillon, S., Raman, A. V., Dauby, P. & Dehairs, F. (2002b). Carbon and nitrogen stable isotope ratios of
subtidal benthic invertebrates in an estuarine mangrove ecosystem (Andhra Pradesh, India). Estuarine Coastal
and Shelf Science 54, 901–913.
Cederlo¨ f, U., Rydberg, L., Mgendi, M. & Mwaipopo, O. (1995). Tidal exchange in a warm tropical lagoon:
Chwaka Bay, Zanzibar. Ambio 24, 458–464.
Chittaro, P. M., Fryer, B. J. & Sale, R. (2004). Discrimination of French grunts (Haemulon flavolineatum
Desmarest, 1823) from mangrove and coral reef habitats using otolith microchemistry. Journal of
Experimental Marine Biology and Ecology 308, 168–183.
Chong, V. C., Sasekumar, A., Leh, M. U. C. & Cruz, R. D. (1990). The fish and prawn communities of a
Malaysian coastal mangrove ecosystem, with comparisons to adjacent mud/sand flats and inshore waters.
Estuarine Coastal and Shelf Science 31, 703–722.
Chong, V. C., Low, C. B. & Ichikawa, T. (2001). Contribution of mangrove detritus to juvenile prawn nutrition:
a dual stable isotope study in a Malaysian mangrove forest. Marine Biology 138, 77–86.
Cocheret de la Morinie` re, E., Pollux, B. J. A., Nagelkerken, I., Hemminga, M. A., Huiskes, A. H. L. & van der
Velde, G. (2003). Ontogenetic dietary changes of coral reef fishes in the mangrove-seagrass-reef continuum:
stable isotope and gut-content analysis. Marine Ecology Progress Series 246, 279–289.
Cocheret de la Morinie` re, E., Nagelkerken, I., van der Meij, H. & van der Velde, G. (2004). What attracts
juvenile coral reef fish to mangroves: habitat complexity or shade? Marine Biology 144, 139–145.
Dehairs, F., Rao, R. G., Chandra Mohan, P., Raman, A. V., Marguillier, S. & Hellings, L. (2000). Tracing
mangrove carbon in suspended matter and aquatic fauna of the Gautami–Godavari Delta, Bay of Bengal
(India). Hydrobiologia 431, 225–241.
DeNiro, M. J. & Epstein, S. (1978). Influence of diet on the distribution of carbon isotopes in animals.
Geochimica et Cosmochimica Acta 45, 341–351.
Dorenbosch, M., Verweij, M. C., Nagelkerken, I., Jiddawi, N. & van der Velde, G. (2004). Homing and daytime
tidal movements of juvenile snappers (Lutjanidae) between shallow-water nursery habitats in Zanzibar,
western Indian Ocean. Environmental Biology of Fishes 70, 203–209. Field, A. (2000). Discovering Statistics
Using SPSS for Windows. London: Sage Publications.
Fry, B. & Sherr, E. B. (1984). d13C measurements as indicators of carbon flow on marine and freshwater
ecosystems. Contributions in Marine Science 27, 13–47.

Chapter 5: Feeding grounds for tropical juvenile fishes
113
Gearing, J. N. (1991). The study of diet and trophic relationships through natural abundance 13C. In Carbon
Isotope Techniques (Coleman, D. C. & Fry, B., eds), pp.201–218. San Diego, CA: Academic press.
Guest, M. A. & Connolly, R. M. (2004). Fine-scale movement and assimilation of carbon in saltmarsh and
mangrove habitats by resident animals. Aquatic Ecology 38, 599–609.
Hartill, B. W., Morrison, M. A., Smith, M. D., Boube´ e, J. & Parsons, D. M. (2003). Diurnal and tidal
movements of snapper (Pagrus auratus, Sparidae) in an estuarine environment. Marine & Freshwater Research
54, 931–940.
Hobson, K. A. (1999). Tracing origins and migration of wildlife using stable isotopes: a review. Oecologia 120,
314–326.
Hsieh, H., Chen, C., Chen, Y. & Yang, H. (2002). Diversity of benthic organic matter flows through polychaetes
and crabs in a mangrove estuary: d13C and d34S signals. Marine Ecology Progress Series 227, 145–155.
Hyslop, E. J. (1980). Stomach content analysis – a review of methods and their application. Journal of Fish
Biology 17, 411–429.
Khalaf, M. A. & Kochzius, M. (2002). Changes in trophic community structure of shore fishes at an industrial
site in the Gulf of Aqaba, Red Sea. Marine Ecology Progress Series 239, 287–299.
Kieckbusch, D. K., Koch, M. S., Serafy, J. E. & Anderson, W. T. (2004). Trophic linkages among primary
producers and consumers in fringing mangroves of subtropical lagoons. Bulletin of Marine Science 74, 271–
285.
Laegdsgaard, P. & Johnson, C. R. (2001). Why do juvenile fish utilise mangrove habitats? Journal of
Experimental Marine Biology and Ecology 257, 229–253.
Little, M. C., Reay, P. J. & Grove, S. J. (1988). The fish community of an East African mangrove creek. Journal
of Fish Biology 32, 729–747.
Lugendo, B. R., Pronker, A., Cornelissen, I., de Groene, A., Nagelkerken, I., Dorenbosch, M., van der Velde, G.
& Mgaya, Y. D. (2005). Habitat utilisation by juveniles of commercially important fish species in a marine
embayment in Zanzibar, Tanzania. Aquatic Living Resources 18, 149–158.
Lugendo, B. R., de Groene, A., Cornelissen, I., Pronker, A., Nagelkerken, I., van der Velde, G. & Mgaya, Y. D.
(in press). Spatial and temporal variation in fish community structure of a marine embayment in Zanzibar,
Tanzania. Hydrobiologia.
MacDonald, J. S., Waiwood, K. G. & Green, R. H. (1982). Rates of different digestion of different prey in
Atlantic cod (Gadus morhua), ocean pout (Macrozoarces americanus), winter flounder (Pseudopleuronectes
americanus), and American plaice (Hippoglossoides platessoides). Canadian Journal of Fisheries and Aquatic
Sciences 39, 651–659.
Macia, A. (2004). Primary carbon sources for juvenile penaeid shrimps in a mangrovefringed bay of Inhaca
Island, Mozambique: a dual carbon and nitrogen isotope analysis. Western Indian Ocean Journal of Marine
Science 3, 151–161.
Mahongo, S. B. (1997). Surface heat exchange and bottom reflection in a tidal, shallow tropical lagoon: Chwaka
Bay, Zanzibar. MSc Thesis, Gothenburg University, Sweden.
Marguillier, S., van der Velde, G., Dehairs, F., Hemminga, M. A. & Rajagopal, S. (1997). Trophic relationships
in an interlinked mangrove-seagrass ecosystem as traced by d13C an d15N. Marine Ecology Progress Series
151, 115–121.
Chapter 5: Feeding grounds for tropical juvenile fishes
114
Minagawa, W. & Wada, E. (1984). Stepwise enrichment of 15N along food chains: further evidence and the
relation between d15N and animal age. Geochimica et Cosmochimica Acta 48, 1135 –1140.
Mohammed, S. M., Johnstone, R. W., Widen, B. & Jordelius, E. (2001). The role of mangroves in the nutrient
cycling and productivity of adjacent seagrass communities, Chwaka Bay, Zanzibar. In Marine Science
Development in Tanzania and Eastern Africa. Proceedings of the 20th Anniversary Conference on Advances in
Marine Science in Tanzania, 1999 (Richmond, M. & Francis, J., eds), pp. 205–226. Zanzibar: IMS/WIOMSA.
Moncreiff, C. A. & Sullivan, M. J. (2001). Trophic importance of epiphytic algae in subtropical seagrass beds:
evidence from multiple stable isotope analyses. Marine Ecology Progress Series 215, 93–106.
Nagelkerken, I. & van der Velde, G. (2004). Relative importance of interlinked mangroves and seagrass beds as
feeding habitats for juvenile reef fish on a Caribbean island. Marine Ecology Progress Series 274, 153–159.
Nagelkerken, I., Dorenbosch, M., Verberk, W. C. E. P., Cocheret de la Morinie` re, E. & van der Velde, G.
(2000). Day-night shifts of fishes between shallow-water biotopes of a Caribbean bay, with emphasis on the
nocturnal feeding of Haemulidae and Lutjanidae. Marine Ecology Progress Series 194, 55–64.
Nakamura, Y. & Sano, M. (2005). Comparison of invertebrate abundance in a seagrass bed and adjacent coral
and sand areas at Amitori Bay, Iriomote Island, Japan. Fisheries Science 71, 573–550.
Newell, R. I. E., Marshall, N., Sasekumar, A. & Chong, V. C. (1995). Relative importance of benthic
microalgae, phytoplankton, and mangroves as sources of nutrition for penaeid prawns and other coastal
invertebrates from Malaysia. Marine Biology 123, 595–606.
Nøttestad, L., Giske, J., Chr. Holst, J., Huse, G. (1999). A length-based hypothesis for feeding migrations in
pelagic fish. Canadian Journal of Fisheries and Aquatic Sciences 56, 26–34.
Parrish, J. D. (1989). Fish communities of interacting shallow-water habitats in tropical oceanic regions. Marine
Ecology Progress Series 58, 143–160.
Pinnegar, J. K. & Polunin, N. V. C. (1999). Differential fractionation of d13C and d15N among fish tissues:
implication for the study of trophic interactions. Functional Ecology 13, 225–231.
Polis, G. & Strong, D. R. (1996). Food web complexity and community dynamics. American Naturalist 147,
813–846.
Quinn, N. J. & Kojis, B. L. (1987). The influence of diel cycle, tidal direction and trawl alignment on beam trawl
catches in an equatorial estuary. Environmental Biology of Fishes 19, 297–308.
Rao, R. G., Woitchik, A. F., Goeyens, L., van Riet, A., Kazungu, J. & Dehairs, F. (1994). Carbon, nitrogen
contents and stable isotope abundance in mangrove leaves from an east African coastal lagoon (Kenya).
Aquatic Botany 47, 175–183.
Reis, R. R. & Dean, J. M. (1981). Temporal variations in the utilization of an intertidal creek by the Bay
Anchovy (Anchoa mitchilli). Estuaries 4, 16–23.
Robertson, A. I. & Blaber, S. J. M. (1992). Plankton, epibenthos and fish communities. In Tropical Mangrove
Ecosystems (Robertson, A. I. & Alongi, D. M., eds), pp. 173–224. Washington, DC: American Geographical
Union.
Robertson, A. I. & Duke, N. C. (1987). Mangrove as nursery sites: comparison of the abundance and species
composition of fish and crustaceans in mangroves and other near shore habitats in tropical Australia. Marine
Biology 96, 193–205.
Chapter 5: Feeding grounds for tropical juvenile fishes
115
Rodelli, M. R., Gearing, J. N., Gearing, P. J., Marshall, N. & Sasekumar, A. (1984). Stable isotope ratios as a
tracer of mangrove carbon in Malaysian ecosystems. Oecologia 61, 326–333.
Rooker, J. R. & Dennis, G. D. (1991). Diel, lunar and seasonal changes in a mangrove fish assemblage off
southwestern Puerto Rico. Bulletin of Marine Science 49, 684–698.
Sheaves, M. & Molony, B. (2000). Short-circuit in the mangrove food chain. Marine Ecology Progress Series
199, 97–109.
Smith, M. M. & Heemstra, P. C. (Eds) (1991). Smith’s Sea Fishes, 1st edn. Johannesburg: Southern Book
Publishers.
Sydeman, W. J., Hobson, K. A., Pyle, P. & McLaren, E. B. (1997). Trophic relationships among seabirds in
Central California. The Condor 99, 327–336.
de Troch, M., Mees, J. & Wakwabi, E. (1998). Diets of abundant fishes from beach seine catches in seagrass
beds of a tropical bay (Gazi Bay, Kenya). Belgian Journal of Zoology 128, 135–154.
Vance, D. J., Haywood, M. D. E., Heales, D. S., Kenyon, R. A., Loneragan, N. R. & Pendrey, R. C. (1996). How
far do prawns and fish move into mangroves? Distribution of juvenile banana prawns, Penaeus merguiensis,
and fish in a tropical mangrove forest in northern Australia. Marine Ecology Progress Series 131, 115–124.
Vanderklift, M. A. & Ponsard, S. (2003). Sources of variation in consumer-diet d15N enrichment: a meta-
analysis. Oecologia 136, 169–182.
van der Veer, H. M. & Bergman, M. N. J. (1986). Development of tidally related behaviour of a newly settled 0-
group plaice (Pleuronectes platessa) populations in the western Wadden Sea. Marine Ecology Progress Series
31, 121–129.
Verweij, M. C., Nagelkerken, I., de Graaff, D., Peeters, M., Bakker, E. J. & van der Velde, G. (2006). Structure,
food and shade attract juvenile coral reef fish to mangrove and seagrass habitats: a field experiment. Marine
Ecology Progress Series 306, 257–268.
Electronic Reference
Froese, R. & Pauly, D. (Eds) (2004). FishBase. Available at www.fishbase.org (version 08/2004).

Chapter 5: Feeding grounds for tropical juvenile fishes
116

Chapter 6
The relative importance of mangroves as feeding habitats for fishes:
a comparison between mangrove habitats with different settings
Lugendo BR, Nagelkerken I, Kruitwagen G, van der Velde G, Mgaya YD
(In revision-Bulletin of Marine Science)

Chapter 6: Mangroves as feeding grounds for fishes
118
Abstract: The importance of mangroves as feeding grounds for fish and other macrozoobenthos in the Indian Ocean and elsewhere has been a subject of debate. This could partly be due to the fact that studies describing this role have been conducted in mangrove systems that differed in their settings. By using stable isotope analysis of carbon and nitrogen, we investigated two different settings of mangroves along the Tanzanian coast, to establish if mangrove setting influences the extent to which this habitat is utilised as a potential feeding ground by fish. The two mangrove settings were: mangrove-lined creeks which retain water during low tides and fringing mangroves that drain completely during low tides. The δ13C signatures of most fishes from the mangrove-lined creeks were similar to those of food items from the mangrove habitat, which suggests that these fishes feed from the mangrove habitats. In contrast, the overlap in δ13C of some food items from the fringing mangroves with those from adjacent habitats, and the more enriched δ13C signatures of fishes from the fringing mangroves with respect to most typical food items from the mangroves could be an indication that these fishes feed from both habitats but to a lower extent from the fringing mangroves. The results suggest that fishes feed more from the mangrove-lined creeks as compared to fringing mangroves which is probably related to differences in the degree of mangrove inundation. The more or less continuous access provided more time for fishes to stay and feed in the mangrove-lined creeks compared to fishes from the fringing mangroves, which have access to these mangroves only during high tide and have to migrate to adjacent habitats with the ebbing tide.
INTRODUCTION
Mangrove ecosystems are widely recognized as potential nursery grounds for juvenile fishes of
exploited populations (Blaber et al., 1989; Parrish, 1989; Lugendo et al., 2005). Although most
mangrove studies have found a limited role for mangrove detritus in estuarine food webs (Fry and
Ewel, 2003), mangrove habitats are assumed to provide abundant food sources, such as algae,
crustaceans and other macrofauna, to resident and transient animals. However, the importance of food
from the mangrove habitats is not limited to the potential contribution to fisheries production, rather,
to functioning of the whole system that supports fish populations (Fry and Ewel, 2003; Layman (in
press). The importance of mangrove habitats as feeding grounds for fish and other macrozoobenthos is
a subject of debate. While some mangrove habitats are reported to form a major feeding habitat for
fish and macrozoobenthos in some parts of the Indo- Pacific (e.g. Rodelli et al., 1984; Marguillier et
al., 1997; Sheaves and Molony, 2000; Chong et al., 2001; Guest and Connolly, 2004) this importance
is refuted in other parts of the Indo- Pacific (e.g. Bouillon et al., 2002a,b) and elsewhere (e.g.
Philippines: Primavera, 1996; and the Caribbean: Nagelkerken and van der Velde, 2004a).
The reason for this discrepancy could be due to the fact that these studies have been conducted
in mangrove systems that differed in their settings. Lee (1995, 1999) pointed out that the degree of
‘outwelling’ of mangrove carbon to adjacent aquatic environments depends to a large degree on the
geomorphology and tidal characteristics of the ecosystem. Large tidal ranges that characterise most
mangrove ecosystems of the Indo- Pacific influence their functioning as major feeding habitats for fish
due to movement of large quantities of seawater and fishes between neighbouring habitats showing
connectivity by tidally migrating fish (Nagelkerken and van der Velde, 2004b). However, mangrove
swamps of the Caribbean, a region characterised in contrast by low tidal differences and slow tidal
currents, have also been reported to be major feeding grounds for fish which could be permanently
there or always have access to them (Odum and Heald, 1975; Thayer et al., 1987; Ley et al., 1994).

Chapter 6: Mangroves as feeding grounds for fishes
119
More factors than tidal difference alone are involved with respect to the functioning of mangrove
habitats as feeding grounds for fish.
Recently, Nagelkerken and van der Velde (2004b) found that fringing mangroves (as opposed
to large mangrove forests) in the Caribbean are not an important feeding habitat for most fish species
occurring in adjacent habitats. We propose here that the mangrove setting could be one of the
important factors influencing the functioning of mangrove habitats as an important feeding area. We
investigated two different settings of mangrove habitats along the Tanzanian coast, to establish if the
mangrove setting influences the use of this habitat as a feeding ground by fish. These two mangrove
settings were: mangrove-lined creeks which retain water during low spring tides and fringing
mangroves which drain completely during low spring tides.
We used stable isotope analysis of carbon and nitrogen since the use of conventional methods
such as gut content analysis alone may provide less adequate results because of the following reasons:
1) differences in digestion rates of ingested material, 2) gut contents may be hard to identify, 3) not all
contents are digested, 4) gut content analyses provide just a snap-shot of the true diet, and 5) it does
not show from where the food originates (MacDonald et al., 1982; Gearing, 1991; Polis and Strong,
1996). Analysis of the stable carbon and nitrogen isotopes can provide a clearer understanding of diets
because they reflect the actual assimilation of organic matter into consumer tissue rather than merely
its consumption (Gearing, 1991). The power of stable isotope analysis as a tool in the investigation of
aquatic food web structures and dietary patterns is based on the significant and consistent differences
in isotopic composition of different types of primary producers due to different photosynthetic
pathways or different inorganic carbon sources (Fry and Sherr, 1984; Deegan and Garritt, 1997). The
stable isotopic composition of an animal reflects that of its diet with up to 1.0‰ enrichment of 13C
and an average of 3.5 ‰ enrichment of 15N occurring between consumer and its food source (DeNiro
and Epstein, 1978; Fry and Sherr, 1984; Minagawa and Wada, 1984) due to the discrimination against
lighter isotopes during assimilatory and excretory functions within consumers (Minagawa and Wada,
1984). However, the actual degree of fractionation varies as a function of taxonomy, food quality, type
of analysed tissue, sample treatment and environmental factors (Vander Zanden and Rasmussen, 2001;
McCutchan et al., 2003; Vanderklift and Ponsard, 2003).
The following questions were asked in the present study: 1) is it possible to discriminate
potential food items for fishes from the mangrove habitats with those from adjacent habitats in both
mangrove settings? 2) To what degree do fishes present in the mangrove and adjacent habitats utilise
food items associated with mangrove habitats?
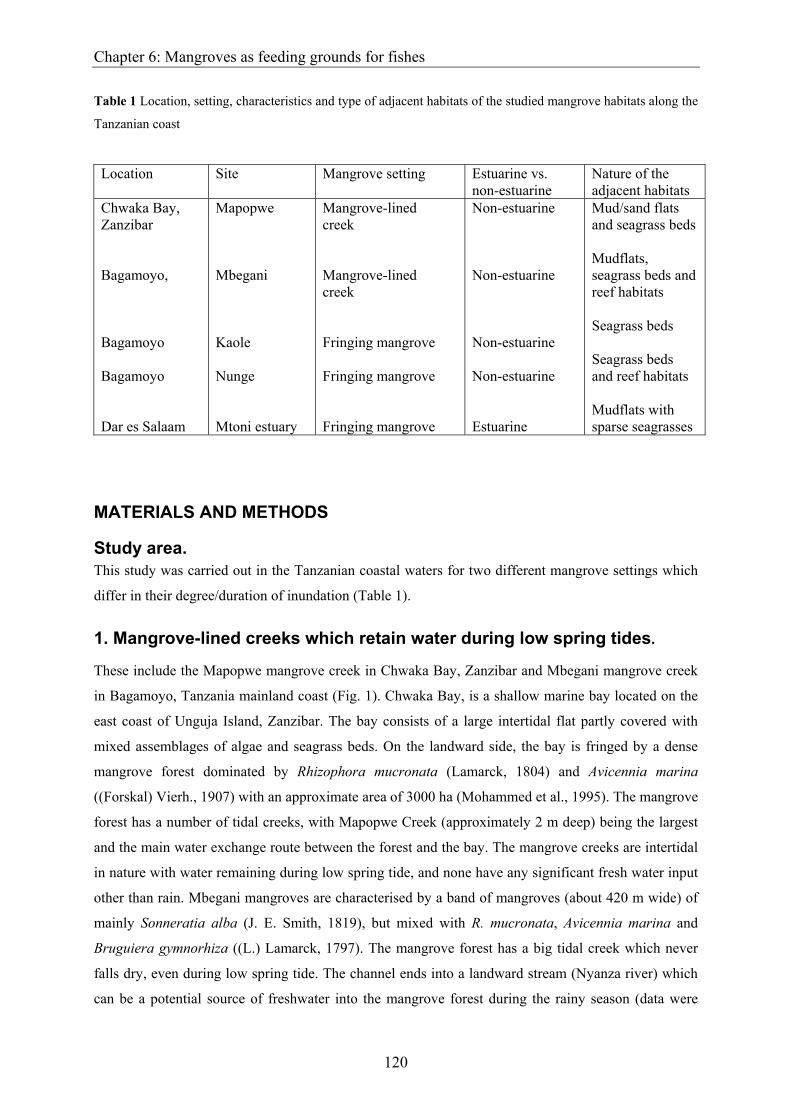
Chapter 6: Mangroves as feeding grounds for fishes
120
Table 1 Location, setting, characteristics and type of adjacent habitats of the studied mangrove habitats along the
Tanzanian coast
Location Site Mangrove setting Estuarine vs. non-estuarine
Nature of the adjacent habitats
Chwaka Bay, Zanzibar Bagamoyo, Bagamoyo Bagamoyo Dar es Salaam
Mapopwe Mbegani Kaole Nunge Mtoni estuary
Mangrove-lined creek Mangrove-lined creek Fringing mangrove Fringing mangrove Fringing mangrove
Non-estuarine Non-estuarine Non-estuarine Non-estuarine Estuarine
Mud/sand flats and seagrass beds Mudflats, seagrass beds and reef habitats Seagrass beds Seagrass beds and reef habitats Mudflats with sparse seagrasses
MATERIALS AND METHODS
Study area. This study was carried out in the Tanzanian coastal waters for two different mangrove settings which
differ in their degree/duration of inundation (Table 1).
1. Mangrove-lined creeks which retain water during low spring tides.
These include the Mapopwe mangrove creek in Chwaka Bay, Zanzibar and Mbegani mangrove creek
in Bagamoyo, Tanzania mainland coast (Fig. 1). Chwaka Bay, is a shallow marine bay located on the
east coast of Unguja Island, Zanzibar. The bay consists of a large intertidal flat partly covered with
mixed assemblages of algae and seagrass beds. On the landward side, the bay is fringed by a dense
mangrove forest dominated by Rhizophora mucronata (Lamarck, 1804) and Avicennia marina
((Forskal) Vierh., 1907) with an approximate area of 3000 ha (Mohammed et al., 1995). The mangrove
forest has a number of tidal creeks, with Mapopwe Creek (approximately 2 m deep) being the largest
and the main water exchange route between the forest and the bay. The mangrove creeks are intertidal
in nature with water remaining during low spring tide, and none have any significant fresh water input
other than rain. Mbegani mangroves are characterised by a band of mangroves (about 420 m wide) of
mainly Sonneratia alba (J. E. Smith, 1819), but mixed with R. mucronata, Avicennia marina and
Bruguiera gymnorhiza ((L.) Lamarck, 1797). The mangrove forest has a big tidal creek which never
falls dry, even during low spring tide. The channel ends into a landward stream (Nyanza river) which
can be a potential source of freshwater into the mangrove forest during the rainy season (data were

Chapter 6: Mangroves as feeding grounds for fishes
121
collected here during the dry season). The mudflats adjacent to the mangroves are dominated by heaps
of the small bivalve Arcuatula arcuatula (Hanley, 1844) imbedded within the mud. There are patches
of seagrasses on the mudflat area and a more or less continuous seagrass bed at the mouth of the
channel. On the landward side, these mangroves are partly sheltered from the open ocean by the small
island Mapopo.
2. Fringing mangroves which drain completely during low spring tides
These are represented by Kaole and Nunge mangroves in Bagamoyo, and Mtoni estuary located south
of Dar es Salaam, Tanzanian mainland coast (Fig. 1). Kaole mangroves are characterised by a band of
mangroves of about 450 m wide with small intertidal creeks which fall dry during low tide. The
mangroves (mainly S. alba) are bordered by intertidal seagrass beds that consist of sparse, but mixed
(about 8) seagrass species. The Nunge area is characterised by a narrow band (approximately 160 m
wide) of mainly S. alba. It is also located close to two reefs (Mwamba Pwani and Mwamba Mjini).
Between the mangrove fringe and the reefs lies a seagrass bed that contains almost all species of
seagrasses found in Tanzania. Topographically, the area is flat and shallow but behind the reef there is
a drastic change in slope where the depth increases abruptly. No channels or creeks are found in this
area and the mangroves fall completely dry during low tide. Covering an area of 378.4 ha, Mtoni
estuary is located south of Dar es Salaam (Fig. 1). The estuary receives freshwater from two creeks:
the Mzinga creek and the Kizinga creek. The estuary is fringed by various species of mangroves with
two dominating species, viz. S. alba and A. marina. Adjacent to the mangroves a large mudflat area
with sparse seagrass cover is located. Despite the two creeks that pour freshwater into the estuary,
Mtoni mangroves fall completely dry during low tide.
Sampling design
Sample collection was carried out between November 2001 and October 2002 in Chwaka Bay,
between January and February 2004 in the Mtoni estuary, and between August 2004 and January 2005
in the Bagamoyo area. Fish samples were collected in the mangroves and in the adjacent habitats using
a seine net, while a range of benthic macro-invertebrates, seagrasses and algae were collected at the
fishing sites by hand. In the continuously inundated mangrove creeks, fish were collected at low tide,
whereas in the fringing mangroves the fishes were collected at high tide (when inundated). In all
habitats adjacent to the mangroves, fish were collected at low tide. Particulate organic matter was
sampled only from Mtoni estuary and was sampled by filtering several litres of seawater over a
Whatman GF/C glass fibre filter. In the field, samples were put in a cool box and later frozen at -20oC
pending analysis. All caught fishes were identified, counted and their fork length measured to the
nearest 0.1 cm. In the majority of the cases, a minimum of 3 samples were used to include a species in
the analysis.

Chapter 6: Mangroves as feeding grounds for fishes
122
Fig. 1 Map of the coast of Tanzania showing the location of Chwaka Bay on Unguja Island (Zanzibar), Kaole, Mbegani and Nunge in Bagamoyo, and Mtoni estuary in Dar es Salaam. Dark gray areas in Bagamoyo, Chwaka Bay and Mtoni indicate mangrove forests, squares indicate the study sites.
Stable isotope analysis
Muscle tissue was removed from the fish, while molluscs (gastropods and bivalves) and crustaceans
(crabs and shrimps) were dissected from their exoskeleton and shell prior to drying. Samples were
dried at 70oC for 48 h and ground to powder (homogeneous mixture). For samples rich in carbonates
such as whole individuals of small hermit crabs and detritus, sub-samples were acid-washed and oven-
dried. These sub-samples were used for stable carbon isotope analysis while the remaining untreated

Chapter 6: Mangroves as feeding grounds for fishes
123
sub-samples were used for stable nitrogen isotope analysis since acid could interfere with stable
nitrogen isotopes (Pinnegar and Polunin, 1999). A pre-determined sample of known weight was placed
in ultra-pure tin Capsules and combusted in a CHN Elemental Analyser from Carlo Erba® (Thermo
group), interfaced with a continuous flow isotope ratio mass-spectrometer, the DeltaPlus from Thermo
Finnigan, Bremen, Germany. The reference gasses which have been used were calibrated with the
IAEA reference standards, IAEA-N-2 and IAEA-CH-6. The potential feeding habitats and food items
for fish were estimated in view of the average enrichment in isotope signatures between animals and
their potential food items of 1‰ and 3.5‰, for carbon and nitrogen, respectively (DeNiro and Epstein,
1978; Minagawa and Wada, 1984; Vander Zanden and Rasmussen, 2001; McCutchan et al., 2003).
Statistical analysis
A Levene’s test was used to check the data for homogeneity of variances (Field, 2000). In case
variances were homogeneous, a 1-way ANOVA or Student’s t-test was done to test for differences in
stable isotope signatures of carbon for fish among different habitats. Since sample sizes were very
different, a Hochberg’s GT2 was used as a post-hoc test due to its greater statistical power in such kind
of data compared to other tests (Field, 2000). Either a Kruskal-Wallis test or a Mann-Whitney U-test
was used as a non-parametric test equivalent when variances were not homogeneous, even after log-
transformation. A Games-Howell post-hoc was used following the Kruskal-Wallis tests because it is
more powerful and specifically designed for lack of homogeneity of variances (Field, 2000). A
significance level of p < 0.05 was used in all tests. All analyses were performed using the programme
SPSS 11.5 for Windows (Field, 2000).
RESULTS
Mangrove-lined creeks
A clear distinction in δ13C could be discerned for macrofauna/flora and fishes from the mangrove
creeks (Mapopwe and Mbegani) and from the adjacent habitats (Fig. 2). In Mapopwe, the average δ13C
values of macrofauna/flora from the mangrove creeks ranged between -28.4‰ and -20.4‰ (except
seagrass leaves) while those from the mud/sand flats ranged between -17.1‰ and -13.8‰ (except
detritus; Fig. 2A). Considering the fishes, those from the mangrove habitats were more δ13C depleted
than those from the mud/sand flats (Fig. 2B). The highest enrichment in mean δ13C values between
fish from the mangrove creeks and mud/sand flats was 6.3‰ for individuals of Lutjanus fulviflamma
(Forsskål, 1775). Three fish species showed deviating values (Fig. 2B). Siganus sutor (Valenciennes,
1835) from the mud/sand flats had a highly depleted δ13C value compared to the other species from the
mud/sand flats. Gerres oyena (Forsskål, 1775) and L. ehrenbergi (Peters, 1869) from the large

Chapter 6: Mangroves as feeding grounds for fishes
124
mangrove creek showed enriched δ13C values compared to other species from the mangrove creeks.
However, since δ13C values of G. oyena from the mud/sand flats were much more enriched than those
from the mangrove creek, we consider that this species also showed the separation in δ13C between the
mangrove creeks and the mud/sand flats. The δ13C of individuals of G. filamentosus (Cuvier, 1829), G.
oyena, Lethrinus lentjan (Lacepède, 1802), Lutjanus fulviflamma and Sphyraena barracuda
(Walbaum, 1792) differed significantly (p < 0.01) between the mangrove creeks and the mud/sand
flats. The δ13C values of the other species were not tested because these species occurred in one habitat
only. The δ15N values of food items from Mapopwe ranged from -1.5 (detritus) to 6.1 (insects) while
those of fishes ranged from 5.6 (Siganus sutor) to 9.8 (Sphyraena barracuda). These δ15N values
clearly show the trophic position of fishes belonging to different feeding guilds, with lowest values for
herbivores, intermediate values for zoobenthivores, and highest values for piscivores.
In Mbegani, the range in average δ13C values of macrofauna/flora from the mangrove creek
ranged between -23.0‰ and -11.4‰ (Fig. 2C). Average δ13C values of macrofauna/flora from the
seagrass bed overlapped in several cases with those from the mangrove and reef habitats and they
ranged between -18.4‰ and -9.3‰ for seagrass beds and between -15.0‰ and -5.5‰ for the reef
habitat. Considering specific groups of a macrofauna/flora, however, there were clear differences in
mean δ13C values for polychaetes, gastropods, macroalgae and seagrass leaves between mangrove and
seagrass/reef habitats (Fig. 2C). With respect to the fish, a very clear separation δ13C was present
between specimens from the mangrove creek and those from the adjacent seagrass beds/reef habitats
(Fig. 2D). Fish from the seagrass beds and reef habitats were similar in δ13C but more enriched (by on
average 3.1‰) than those from the mangrove creek (Fig. 2D). A species of Atherinidae and G. oyena
from the mangrove creek were significantly depleted (t-test, p = 0.005 and p = 0.013, for Atherinidae
and G. oyena, respectively) as compared to those from the reef habitat. Statistical tests could not be
performed for the other species as they occurred in a single habitat only. For the whole Mbegani area,
the δ15N values of food items ranged between -0.3 (seagrass leaves) and 7.2 (gastropods) while those
of fishes ranged between 7.1 (Lutjanus argentimaculatus) and 10.3 (Sphyraena barracuda) which
clearly indicates the trophic positions of the different studied fish species (Fig. 2C & D).
Fringing mangroves
Although a clear difference in δ13C values could be discerned for macrofauna/flora between the
mangrove habitats and the adjacent habitats in Kaole, Nunge and Mtoni, this could not be discerned
for the fishes in these habitats (Fig. 3). In Kaole, the mean δ13C values of macrofauna/flora from the
mangrove creek ranged between -19.4‰ and -16.0‰ (except shrimps; Fig. 3A). Those from the
intertidal seagrass beds ranged between -15.2‰ and -11.3‰, while those from the subtidal seagrass
beds overlapped partly with those from the intertidal seagrass beds and ranged between -13.4‰ and -

Chapter 6: Mangroves as feeding grounds for fishes
125
7.5‰. The δ13C values of fishes from the mangrove habitat of Kaole (mean ± SE = 14.9 ± 0.7‰)
overlapped with those from the intertidal seagrass beds (14.9 ± 0.4‰; Fig. 3B). However, fishes from
the subtidal seagrass beds were much more enriched in δ13C (10.9 ± 0.1‰). At species level, G. oyena,
Pelates quadrilineatus (Bloch, 1790) and L. fulviflamma from the subtidal seagrass beds all differed
significantly (t-test, p < 0.013) from those from the mangrove habitat or intertidal seagrass bed. The
δ15N values of food items ranged between 0.6 (Littoraria sp.) and 5.4 (insects) while those of fishes
ranged from 4.9 (Leptoscarus vaigiensis) to 9.4 (Atherinidae).
In Nunge, the mean δ13C values of macrofauna/flora from the mangrove habitat ranged
between -21.0‰ and -15.2‰ (except shrimps), those from the seagrass beds ranged between -15.7‰
and -13.2‰, and those from the reef habitat ranged between -15.1‰ and -10.0‰ (except for the
gastropod Terebralia sp.; Fig. 3C). The δ13C values of fishes in Nunge did not show a clear distinction
between the different habitats, rather their mean δ13C values were clustered between -16.0‰ and -
10.3‰ and overlapped between habitats at species level (Fig. 3D). The δ15N values of food items
ranged from 1.9 (Littoraria sp.) to 8.3 (crabs) while those of fishes ranged from 6.8 (G. oyena) to 11.7
(P. quadrilineatus) indicating that different fish species belong to different trophic positions.
In Mtoni, the average δ13C values of mangrove macrofauna/flora ranged between -25.9‰ and
-17.8‰, with the exception of shrimps, swimming crabs and barnacles (Fig. 3E). Those from the
estuary basin ranged between -17.7‰ and -13.5‰, except particulate organic matter, polychaetes and
macroalgae. The δ13C values of fishes from Mtoni did not show a clear distinction in δ13C signature
between the mangrove habitat and the estuary basin, and did not show a large variation within species
(Fig. 3F). Only the herbivore S. sutor and one species of Carangidae deviated considerably in their δ13C and/or δ15N values from the cluster of other species (Fig. 3F). No significant difference was found
between the δ13C values of fishes from the mangrove habitat and the estuary basin for Albula
glossodonta (Forsskål, 1775), Carangidae, G. filamentosus, G. oyena, Sillago sihama (Forsskål, 1775)
and Terapon jarbua (Forsskål, 1775) (t-test, p > 0.144). The remaining species could not be tested
statistically as they occurred in a single habitat only. In the whole estuary, the δ15N values of food
items ranged between 3.4 (detritus) to 12.6 (shrimps) while those of fishes ranged from 8.2
(Carangidae) to 15.2 (Apogon sp.). These δ15N values are relatively higher compared to δ15N values of
the food items and fishes from the other four studied sites, probably due to the inflow of Karibu textile
effluents into the area (eutrophication).
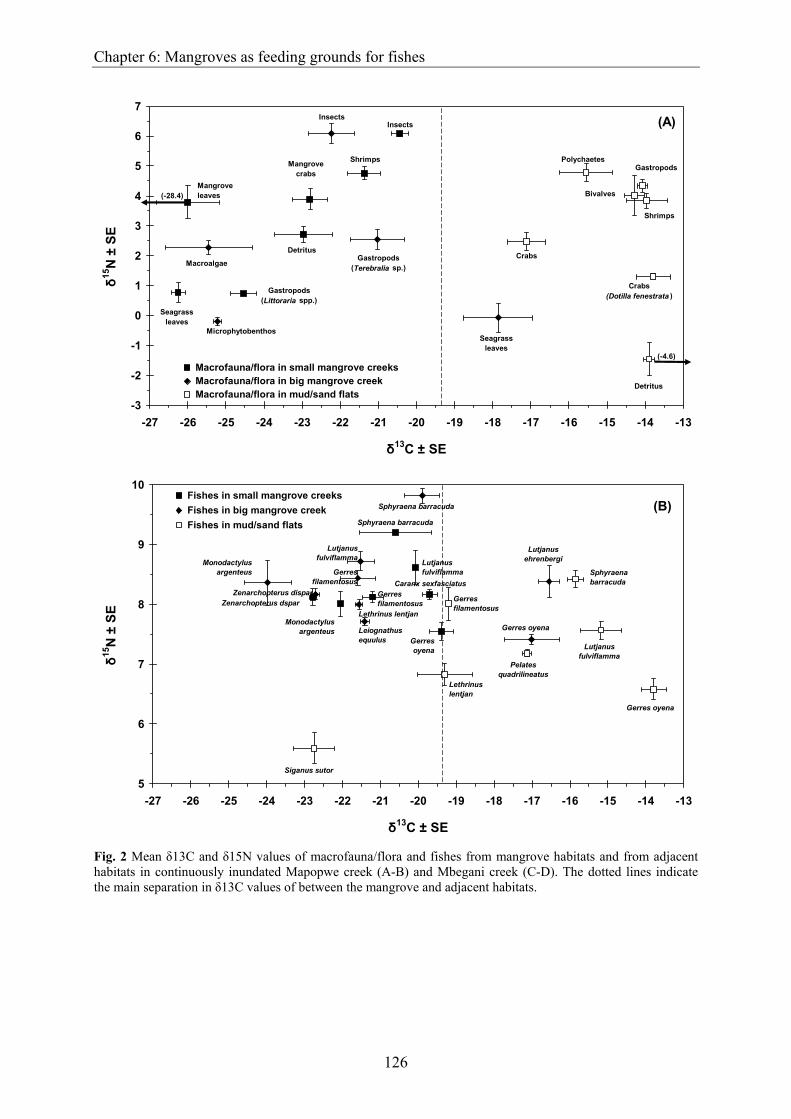
Chapter 6: Mangroves as feeding grounds for fishes
126
-3
-2
-1
0
1
2
3
4
5
6
7
-27 -26 -25 -24 -23 -22 -21 -20 -19 -18 -17 -16 -15 -14 -13
δ13C ± SE
δ15N
± S
E
Macrofauna/flora in small mangrove creeks Macrofauna/flora in big mangrove creek Macrofauna/flora in mud/sand flats
Seagrassleaves
Mangroveleaves
Gastropods(Terebralia sp.)
Crabs (Dotilla fenestrata )
Microphytobenthos
Mangrove crabs
Detritus
Bivalves
Shrimps
Detritus
Macroalgae
GastropodsPolychaetes
Insects
Crabs
Shrimps
(-4.6)
Gastropods(Littoraria spp.)
Insects
(-28.4)
Seagrassleaves
(A)
5
6
7
8
9
10
-27 -26 -25 -24 -23 -22 -21 -20 -19 -18 -17 -16 -15 -14 -13
δ13C ± SE
δ15N
± S
E
Fishes in small mangrove creeks Fishes in big mangrove creek Fishes in mud/sand flats
Caranx sexfasciatusGerresfilamentosus
Gerresoyena
Zenarchopterus dspar
Lutjanusfulviflamma
Monodactylus argenteus
Sphyraena barracuda
Gerresfilamentosus
Gerres oyena
Lutjanusfulviflamma
Lethrinus lentjan
Pelatesquadrilineatus
Sphyraenabarracuda
Siganus sutor
Gerresfilamentosus
Gerres oyena
Zenarchopterus dispar
Lutjanusehrenbergi
Leiognathusequulus
Lutjanusfulviflamma
Lethrinus lentjan
Monodactylus argenteus
Sphyraena barracuda (B)
Fig. 2 Mean δ13C and δ15N values of macrofauna/flora and fishes from mangrove habitats and from adjacent habitats in continuously inundated Mapopwe creek (A-B) and Mbegani creek (C-D). The dotted lines indicate the main separation in δ13C values of between the mangrove and adjacent habitats.

Chapter 6: Mangroves as feeding grounds for fishes
127
-2
-1
0
1
2
3
4
5
6
7
8
9
-25 -23 -21 -19 -17 -15 -13 -11 -9 -7 -5δ13C ± SE
δ15N
± S
E
Macrofauna/flora in mangrove creekMacrofauna/flora in seagrass bedsMacrofauna/flora in reef habitat
(C)
Gastropods (Littoraria spp.)Polychaetes
Prop-root epiphytes
Macroalgae
Gastropods
CrabsShrimps
Seagrass leaves
Hermit crabs
Swimming crab
Gastropods
Seagrass leaves
Hermit crabs
Crabs
Macroalgae
Bivalves (Arcuatula arcuatula ) Polychaetes
GastropodsShrimps
Hermit crabs
Seagrass leaves
Macroalgae
6
7
8
9
10
11
-25 -23 -21 -19 -17 -15 -13 -11 -9 -7 -5δ13C ± SE
δ15N
± S
E
Fishes in mangrove creekFishes in seagrass bedsFishes in reef habitat
Sphyraena barracuda
Atherinidae
Atherinidae
Atherinidae
Lutjanus fulviflamma
Sillago sihama
Pelates quadrilineatus
Gerres oyena
Terapon jarbua
Lutjanus argentimaculatus
Hemiramphus sp.
Monodactylus argenteus
Siganus sutorGerres oyena
Siganus sutor
(D)
Fig. 2 continued.

Chapter 6: Mangroves as feeding grounds for fishes
128
0
1
2
3
4
5
6
7
-22 -21 -20 -19 -18 -17 -16 -15 -14 -13 -12 -11 -10 -9 -8 -7δ13C ± SE
δ15N
± S
E
Macrofauna/flora in mangrovesMacrofauna/flora in intertidal seagrass bedsMacrofauna/flora in subtidal seagrass beds
Gastropods (Littoraria spp.)
Insects
Polychaetes
Hermit crabsMangrove crabs
Shrimps
Hermit crabs
Crabs
Gastropods
Hermit crabs
Crabs
Shrimps
Polychaetes
Shrimps
(A)
4
5
6
7
8
9
10
-22 -21 -20 -19 -18 -17 -16 -15 -14 -13 -12 -11 -10 -9 -8 -7δ13C ± SE
δ15N
± S
E
Fishes in mangrovesFishes in intertidal seagrass bedsFishes in subtidal seagrass beds
Sphyraena barracuda
AtherinidaeAtherinidae
Lutjanus fulviflamma
Lutjanus fulviflamma
Pelates quadrilineatus
Pelates quadrilineatus
Gerres oyena
Leptoscarus vaigiensis
Gerres oyena
Gerres oyena
(B)
Fig 3 Mean δ13C and δ15N values of macrofauna/flora and fishes from the mangrove habitats and from adjacent habitats, in Kaole (A-B), Nunge (C-D) and Mtoni (E-F). The fish species of Mtoni are represented by the following numbers, 1: Leiognathus equulus, 2: Gobiidae sp. 1, 3: Terapon jarbua, 4: Gerres acinaces (Bleeker, 1854), 5: Gerres oyena, 6: Gerres filamentosus, 7: Sillago sihama, 8: Albula glossodonta, 9: Gerres oyena, 10: Albula glossodonta, 11: Arothron hispidus (Linnaeus, 1758), 12: Scarus russelii, 13: Lethrinus lentjan, 14: Arothron immaculatus (Bloch & Schneider, 1801), 15: Sardinella albella, 16: Leiognathus equulus, 17: Apogon sp. 1, 18: Apogon sp. 2, 19: Apogon sp. 3, 20: Terapon jarbua, 21: Atherinomorus duodecimalis (Valenciennes, 1835), 22: Gerres filamentosus, 23: Atherinidae, 24: Lutjanus fulviflamma, 25: Gobiidae sp. 2, 26: Sillago sihama, 27: Gerres acinaces, 28: Gobiidae sp. 3, 29: Platycephalus indicus (Linnaeus, 1758), 30: Mugilidae sp. 1, 31: Saurida gracilis (Quoy & Gaimard, 1824), 32: Mugilidae sp. 2, 33: Callionymus sp., 34: Pelates quadrilineatus, 35: Gobiidae sp. 4, 36: Siganus sutor, 37: Carangidae, 38: Carangidae. The dotted lines indicate the main separation in δ13C values of food items between the mangroves and adjacent habitats

Chapter 6: Mangroves as feeding grounds for fishes
129
0
1
2
3
4
5
6
7
8
9
10
-23 -22 -21 -20 -19 -18 -17 -16 -15 -14 -13 -12 -11 -10 -9 -8 -7 -6 -5
δ13C ± SE
δ15N
± S
E
Macrofauna/flora in mangrovesMacrofauna/flora in seagrass bedsMacroflora/fauna in the reef habitat
(C)
Gastropods(Littoraria spp.)
Isopods
Polychaetes
Crabs
Hermit crabs
Shrimps
Gastropods (Terebralia sp.)
Polychaetes
Bivalves
Crabs
Shrimps
Bivalves
Hermit crabs
Polychaetes
Gastropods
Hermit crabs
6
7
8
9
10
11
12
13
-23 -22 -21 -20 -19 -18 -17 -16 -15 -14 -13 -12 -11 -10 -9 -8 -7 -6 -5δ13C ± SE
δ15N
± S
E
Fishes in mangrovesFishes in seagrass bedsFishes in the reef habitat
Pelates quadrilineatus
Leiognathus equulus Atherinidae
Lethrinus lentjan
Sillago sihama
Gerres oyena
Lutjanus fulviflamma
Lethrinus lentjan
Terapon jarbua
Lutjanus fulviflamma
Lutjanus fulviflamma
Pelates quadrilineatus
Gerres oyena
(D)
Fig. 3 continued.

Chapter 6: Mangroves as feeding grounds for fishes
130
2
3
4
5
6
7
8
9
10
11
12
13
14
15
-27 -26 -25 -24 -23 -22 -21 -20 -19 -18 -17 -16 -15 -14 -13
δ13C ± SE
δ15N
± S
E Macrofauna/flora in mangroves Macrofauna/flora in estuary basin
Oysters
Mangrove crabs
Gastropods(Littoraria spp.)
Sand crab(Dotilla fenestrata )
Benthic Microalgae
Swimmingcrabs
Detritus
Mangroveleaves
Bivalves
Shrimps
Barnacles
Particulateorganicmatter
Seagrass leaves
MacroalgaeGastropods
PolychaetesSwimming crabs
Amphipods
Isopods Crabs
Shrimps
(E)
Gastropods (Cerithidea decollata )
8
9
10
11
12
13
14
15
16
-27 -26 -25 -24 -23 -22 -21 -20 -19 -18 -17 -16 -15 -14 -13
δ13C ± SE
δ15N
± S
E
Fishes in mangroves Fishes in estuary basin
(F)
1
2
3 4
5 67
89
1011
12
13
14
15 16
17
18
19
2021
22
2324
2526
2728
29
3530
3132
3334
36
37
38
Fig. 3 continued.

Chapter 6: Mangroves as feeding grounds for fishes
131
DISCUSSION
On the basis of the differences in δ13C signatures of most of the potential food items in the various
habitats, the most likely feeding habitats of the fish can be deduced. The food items (macrofauna/flora)
from the mangrove habitats of both mangrove settings were generally more δ13C depleted compared to
similar food items from their respective adjacent habitats. While the stable isotope values of fishes
from the mangrove-lined creeks followed a similar trend, those from the fringing mangrove habitats
did not. Fishes from the mangrove-lined creeks displayed a δ13C signature in close proximity to food
items from the mangrove creeks, which could be an indication that they feed mostly on food items
from the mangrove habitats. Another possibility is that the fishes caught from the mangrove creeks
feed elsewhere (possibly during high tide), but on food items with a similar δ13C signature as those of
food items from the mangrove habitats; especially those food items which were not covered in the
sampling for the present study. This is unlikely though, since food items from other habitats were
always much more enriched than those from the mangrove habitats, a situation which has widely been
observed in other studies (e.g. Rodelli et al., 1984; Bouillon et al., 2002b; Kieckbusch et al., 2004;
Nagelkerken and van der Velde 2004a). In contrast, the much more enriched δ13C signature of the
fishes from the fringing mangrove habitats as compared to those of food items from the mangrove
habitats suggests that these fishes obtained most of their food from the adjacent habitats. On the other
hand, the overlap in the δ13C signatures of some of the food items (e.g., motile crabs, shrimps and
hermit crabs) between the fringing mangrove habitats and the adjacent habitats, suggest that possibly
those fishes feed from all the studied habitats.
The above observations suggest that the utilisation of mangrove habitats as feeding grounds
for fishes is different in the two mangrove settings. Both settings of mangroves are flooded completely
only during high tide. However, fishes from the mangrove-lined creeks can remain in the water held
within the creeks during low tide, and hence have a more or less permanent access to the mangrove
habitat, where they apparently also feed and hence acquire more depleted δ13C signatures similar to
those of food items from the mangrove habitat. In contrast, fishes from the fringing mangroves have
access to the mangrove habitats only during high tide, and have to migrate to adjacent habitats
(seagrasses, reef or mud/sand flats) with the ebbing tide where they probably also feed. Although these
fish could feed in the fringing mangroves at high tide, their more enriched δ13C signatures (similar to
those of food items from the adjacent habitats) suggest that they probably obtained more food from the
adjacent habitats instead of from the mangrove habitats. Since these fringing mangrove habitats are not
continuously accessible, this suggests that fishes may partly use these mangrove habitats for feeding at
high tide, but largely use adjacent habitats as feeding habitats at low tide. As pointed out by Fry and
Ewel (2003), the access and residency (time) of animals within the mangrove ecosystems could
influence the utilisation of mangrove resources.

Chapter 6: Mangroves as feeding grounds for fishes
132
Additionally, the fact that fishes caught in the mangrove-lined creeks at low tide did not
include fishes with a more enriched δ13C signature (except possibly L. ehrenbergi from the mud/sand
flats of Chwaka Bay) suggests that fishes from the mangrove-lined creeks (with a depleted δ13C
signature) and those from adjacent habitats (with an enriched δ13C signature) form two different
feeding populations. This was also observed for permanently inundated fringing mangroves in the
Caribbean (Nagelkerken and van der Velde, 2004b).
The species that appeared to feed primarily from the mangrove-lined creeks in the present
study have mostly been reported to be mangrove residents, especially at juvenile and young adult
stages (i.e., Caranx sexfasciatus (Quoy & Gaimard, 1825), G. filamentosus, G. oyena, Leiognathus
equulus (Forsskål, 1775), Lutjanus argentimaculatus (Forsskål, 1775), L. fulviflamma, Lethrinus
lentjan, S. barracuda and Zenarchopterus dispar (Valenciennes, 1847); Froese and Pauly, 2005;
Lugendo et al., 2005). Again, the δ13C signatures of their respective species in the fringing mangroves
were far more enriched, supporting the fact that the fishes from the fringing mangroves probably
obtain their food largely from the adjacent habitats. This observation is another indication that the
degree of mangrove inundation is important in determining the extent to which a mangrove habitat is
utilised as a feeding ground by fishes.
The size of the mangrove forest itself is believed to be another important factor that
determines the importance of mangroves as major feeding grounds for fishes. Studies from the
Caribbean report large mangrove swamps to be major feeding grounds for fishes (Odum and Heald,
1975; Thayer et al., 1987; Ley et al., 1994) as opposed to small fringing mangroves (Nagelkerken and
van der Velde, 2004b). This is applicable to the Chwaka Bay mangrove forest (where the Mapopwe
creek is found) due to its large size, but not to the Mbegani mangrove creek which is lined by a narrow
mangrove forest. We do not rule out the possible influence of mangrove forest size in selection of
feeding habitats by fishes in our study. However, the smaller sizes of the studied mangroves of
Bagamoyo (e.g. Mbegani and Kaole mangrove forests together cover 179.1 ha; Semesi, 1991) and the
differences in the way they were utilised by fishes, as observed in the present study, supports our
hypothesis that degree of mangrove inundation is a more important factor influencing the extent to
which mangrove habitats are utilised as feeding grounds by fishes.
Although most fishes did not seem to use the fringing mangroves falling dry during low tide as
major feeding habitats, some macrofauna did. Some macrofauna species were restricted to the
mangrove habitats as suggested by the highly depleted δ13C signatures (< -19.0‰). This was the case
for mangrove crabs (mostly Sesarminae and Uca spp.), gastropods (mostly Littoraria spp. and
Terebralia sp.) and insects, which are all known to feed on either mangrove leaves, detritus, micro-
epiphytes, diatoms or mud from the mangrove habitats (Slim et al., 1997; Bouillon et al., 2002a;
Ólafsson et al., 2002; Skov and Hartnoll, 2002; Fratini et al., 2004). This suggests that these species
feed solely from the mangrove habitat. It was observed that they remained in the mangroves during

Chapter 6: Mangroves as feeding grounds for fishes
133
low tide when these fall dry, which is possible due to various adaptive mechanisms that these animals
posses. Mangrove crabs and gastropods are adapted to living in intertidal areas for extended periods,
by retreating in their burrows (crabs) and in their shells (gastropods) during low tide. In contrast, fishes
depend solely on presence of water and have to move with the ebbing tide; therefore, degree of
mangrove inundation is a crucial determinant of the extent to which fishes can use a mangrove habitat
as a feeding ground.
Motile macrofauna (viz. shrimps, swimming crabs and hermit crabs) from the fringing
mangroves, on the other hand, showed enriched δ13C values (> 16.8‰) typical for macrofauna from
the adjacent habitats, indicating an interaction or connectivity between the mangroves and their
adjacent habitats. These species probably use the mangrove only as a refuge and feed on food items
from the adjacent habitats. The same trend was also evident for sessile filter-feeding barnacles within
the mangroves at Mtoni estuary. Since the mangroves fall dry during low tide they probably depend on
food sources from the water layer brought in with the tides from the estuary during high tide.
Furthermore, the δ13C values of particulate organic matter from the estuary lay in-between those of
seagrass and mangrove leaves, which could indicate that it consisted of a mixture of plant material
from the terrestrial mangrove habitat and from the estuary basin (e.g. seagrass leaves).
In contrast to the above, in continuously inundated mangroves of Mapopwe Creek (Chwaka
Bay) all macrofauna (δ13C values < -20.3‰) appeared to feed largely from the mangrove habitats.
However, in the case of the continuously inundated Mbegani mangrove creek, the mangrove
gastropods Littoraria spp. and polychaetes (δ13C values < -21.1‰) appeared to feed largely from the
mangrove habitats, whereas the more motile fauna (crabs, shrimps and hermit crabs) appear to feed
largely from adjacent habitats. Interestingly, the δ13C value of the bivalve Arcuatula arcuatula from
the seagrass habitat of Mbegani (mean δ13C value of -18.4‰) suggests incorporation of a mixture of
material from both the mangrove and seagrass habitats.
The questions that were posed at the beginning of this study can be answered as follows. 1) In
almost all cases, food items from both mangroves settings could be discriminated in δ13C from those
of adjacent habitats. Exceptions were always found for the motile swimming and hermit crabs and
shrimps, and for sessile filter-feeding organisms. 2) Fishes from all habitats adjacent to mangroves,
and those from the fringing mangroves showed a more enriched δ13C signature, indicating that they
probably obtained their food largely from the adjacent habitats. In contrast, the mangroves that
allowed a more or less continuous utilisation of the mangrove habitats by fishes appeared to contribute
to a larger degree to the food of fishes as compared to fringing mangroves that fall dry during low tide.
This study has revealed that the potential of a mangrove habitat in functioning as a feeding area for
fish can to be influenced by its configuration. Fringing mangrove habitats seem to contribute less to
the food items of fishes as compared to continuously accessible mangrove-lined creeks. The

Chapter 6: Mangroves as feeding grounds for fishes
134
observations in this study indicate that ecosystems showing more similarity in configuration function
in a similar way despite geographical differences.
Acknowledgements
We are thankful to M. Manzi, S. Simgeni, M. Makame, A. Ramadhani, H. Kauka, S. Mukama and Y.
Mhonda for assistance with the field work, and J. Eygensteyn of the Radboud University Nijmegen for
analysing the stable isotope samples. The administration and staff of the Institute of Marine Sciences
in Zanzibar provided logistical support and research facilities. We also appreciate the logistical support
we received from the personnel of Mbegani Fisheries Institute and Bagamoyo District Fisheries
Office. This study was financially supported by a UNESCO-Loreal for Women in Science Fellowship,
NUFFIC through the ENVIRONS-MHO Project, Schure-Beijerinck-Popping Foundation and Quo
Vadis Fonds (Radboud University Nijmegen). I. N. was supported by a VIDI grant from the
Netherlands Organisation for Scientific Research (NWO). The manuscript also benefited from the
comments of two anonymous reviewers. This is Centre for Wetland Ecology publication no. 440.
Chapter 6: Mangroves as feeding grounds for fishes
135
References Blaber, S. J. M., D. T. Brewer, and J. P. Salini. 1989. Species composition and biomasses of fishes in different
habitats of a tropical northern Australian estuary: Their occurrence in the adjoining sea and estuarine
dependence. Estuar. Coast. Shelf Sci. 29: 509-531.
Bouillon, S., N. Koedam, and F. Dehairs. 2002a. Primary producers sustaining macro-invertebrate communities
in intertidal mangrove forests. Oecologia 130: 441-448.
_________, A. V. Raman, P. Dauby, and F. Dehairs. 2002b. Carbon and nitrogen stable isotope ratios of subtidal
benthic invertebrates in an estuarine mangrove ecosystem (Andhra Pradesh, India). Estuar. Coast. Shelf Sci.
54: 901-913.
Chong, V. C., C. B. Low, and T. Ichikawa. 2001. Contribution of mangrove detritus to juvenile prawn nutrition:
a dual stable isotope study in a Malaysian mangrove forest. Mar. Biol. 138: 77-86.
Deegan, L. A. and R. H. Garritt. 1997. Evidence for spatial variability in estuarine food webs. Mar. Ecol. Prog.
Ser. 147: 31-47.
DeNiro M. J. and S. Epstein. 1978. Influence of diet on the distribution of carbon isotopes in animals. Geochem.
Cosmochim. Acta 45: 341-351.
Field, A. 2000. Discovering statistics using SPSS for Windows. Sage Publications, London. 496 pp.
Fratini, S., V. Vigiani, M. Vannini, and S. Cannicci. 2004. Terebralia palustris (Gastropoda; Potamididae) in a
Kenyan mangal: size structure, distribution and impact on the consumption of leaf litter. Mar. Biol. 144: 1173-
1182.
Froese, R., and D. Pauly. (eds.) 2005. FishBase. World Wide Web electronic publication. www.fishbase.org,
version (12/2005).
Fry, B. and K. C. Ewel. 2003. Using stable isotopes in mangrove fisheries research - a
530 review and outlook. Isotopes in Environmental and Health Studies 39:191-196.
_______and E. B. Sherr. 1984. δ13C measurements as indicators of carbon flow on marine and freshwater
ecosystems. Contrib. Mar. Sci. 27: 13-47.
Gearing, J. N. 1991. The study of diet and trophic relationships through natural abundance 13C. In: Coleman DC,
Fry B (eds.). Carbon isotope techniques. Academic Press, San Diego, 201–218.
Guest, M. A. and R. M. Connolly. 2004. Fine-scale movement and assimilation of carbon in saltmarsh and
mangrove habitats by resident animals. Aquat. Ecol. 38, 599-609.
Kieckbusch, D. K., M. S. Margurite, J. E. Serafy, and W. T. Anderson. 2004. Trophic linkages among primary
producers and consumers in fringing mangroves of subtropical lagoons. Bul. Mar. Sci. 74: 271-285.
Layman C. A. In press. What can stable isotope ratios reveal about mangroves as fish habitat? Bull. Mar. Sci.
Lee, S. Y. 1999. Tropical mangrove ecology: physical and biotic factors influencing ecosystem structure and
function. Austr. J. Ecol. 24: 355–366.
________. 1995. Mangrove outwelling: a review. Hydrobiologia 295: 203–212.
Ley, J. A., L. Montague, and C. C. McIvor. 1994. Food habits of mangrove fishes: a comparison along estuarine
gradients in northeastern Florida Bay. Bull. Mar. Sci. 54: 881–899.
Chapter 6: Mangroves as feeding grounds for fishes
136
Lugendo, B. R., A. Pronker, I. Cornelissen, A. de Groene, I. Nagelkerken, M. Dorenbosch, G. van der Velde and
Y. D. Mgaya. 2005. Habitat utilisation by juveniles of commercially important fish species in Chwaka Bay,
Zanzibar, Tanzania. Aquat. Living Resour. 18: 149-158.
MacDonald, J. S., K. G. Waiwood, and R. H. Green. 1982. Rates of different digestion of different prey in
Atlantic cod (Gadus morhua), ocean pout (Macrozoarces americanus), winter flounder (Pseudopleuronectes
americanus), and American plaice (Hippoglossoides platessoides). Can. J. Fish. Aquat. Sci. 39: 651-659.
McCutchan, J. H., W. M. Lewis, C. Kendall, and C. C McGrath. 2003. Variation in trophic shift for stable
isotope ratios of carbon, nitrogen, and sulfur. Oikos 102: 378-390.
Minagawa, W. and E. Wada. 1984. Stepwise enrichment of 15N along food chains: further evidence and the
relation between δ15N and animal age. Geochim. et Cosmochim. Acta 48: 1135 – 1140.
Mohammed, S. M., R. W. Johnstone, B. Widen, and E. Jordelius. 1995. The role of mangroves in the nutrient
cycling and productivity of adjacent seagrass communities, Chwaka Bay, Zanzibar. Zoology Department,
Stockholm University, Sweden, and University of Dar es Salaam, Tanzania.
Nagelkerken, I. and G. van der Velde. 2004a. Are Caribbean mangroves important feeding grounds for juvenile
reef fish from adjacent seagrass? Mar. Ecol. Prog. Ser. 274: 143-151.
_______________ , ______________. 2004b. Relative importance of interlinked mangroves and seagrass beds
as feeding habitats for juvenile reef fish on a Caribbean island. Mar. Ecol. Prog. Ser. 274: 153-159.
Odum, W. E. and E. J. Heald. 1975. The detritus-based food web of an estuarine mangrove community. In:
Cronin L.E. (ed) Estuarine research. Academic Press, New York, p 265–286.
Ólafsson, E., S. Buchmayer, and M. W. Skov. 2002. The East African decapod crab Neosarmatium meinerti (de
Man) sweeps mangrove floors clean of leaf litter. Ambio 31: 569-573.
Parrish, J. D. 1989. Fish communities of interacting shallow-water habitats in tropical oceanic regions. Mar.
Ecol. Prog. Ser. 58: 143-160.
Pinnegar, J. K. and N. V. C. Polunin. 1999. Differential fractionation of δ13C and δ15N among fish tissues:
implication for the study of trophic interactions. Functional Ecology 13: 225-231.
Polis, G. and D. R. Strong. 1996. Food web complexity and community dynamics. American Naturalist 147:
813-846.
Primavera, J. H. 1996. Stable carbon and nitrogen isotope ratios of penaeid juveniles and primary producers in a
riverine mangrove in Guimaras, Philippines. Bull. Mar. Sci. 58: 675–683.
Rodelli, M.R., J. N. Gearing, P. J. Gearing, N. Marshall, and A. Sasekumar. 1984. Stable isotope ratios as a
tracer of mangrove carbon in Malaysian ecosystems. Oecologia 61: 326-333.
Semesi, A. K. 1991. Management plan for the mangrove ecosystem of mainland Tanzania, Vol. 11: Mangrove
Management plan of all coastal districts. Ministry of Tourism, Natural Resources and Environment(MTNRE),
Forestry and Beekeeping Division, Catchment Forestry Project.
Sheaves, M. and B. Molony. 2000. Short-circuit in the mangrove food chain. Mar. Ecol. Prog. Ser. 199: 97-109.
Skov, M. W. and R. G. Hartnoll. 2002. Paradoxical selective feeding on a low-nutrient diet: Why do mangrove
crabs eat leaves? Oecologia 131: 1–7.
Slim, F. J., M. A. Hemminga, C. Ochieng, N. T. Jannink, E. Cocheret de la Morinière, and G. van der Velde.
1997. Leaf litter removal by the snail Terebralia palustris (Linnaeus) and sesarmid crabs in an East African
mangrove forest (Gazi Bay, Kenya). J. Exp. Mar. Biol. Ecol. 215: 35–48.

Chapter 6: Mangroves as feeding grounds for fishes
137
Thayer, G. W., D. R. Colby, and W. F. Hettler. 1987. Utilization of the red mangrove prop root habitat by fishes
in south Florida. Mar. Ecol. Prog. Ser. 35: 25–38
Van der Zanden, M. J. and J. B. Rasmussen. 2001. Variation in δ15N and δ13C trophic fractionation: implications
for aquatic food web studies. Limnol. & Oceanogr. 46: 2061-2066
Vanderklift, M. A. and S. Ponsard. 2003. Sources of variation in consumer-diet δ15N enrichment: a meta-
analysis. Oecologia 136: 169 - 182.

Chapter 6: Mangroves as feeding grounds for fishes
138

Chapter 7
Synthesis and Conclusions

Chapter 7: Synthesis
140
SYNTHESIS
Unlike in the Caribbean where mangroves and seagrass beds are widely acknowledged as important
nursery habitats for juveniles of coral reef fishes (Nagelkerken et al. 2000; Cocheret de la Morinière et
al. 2002; Nagelkerken et al. 2002; Mumby et al. 2004), the functioning of such habitats and especially
that of mangroves within the Indo-Pacific region has become the subject of considerable research and
debate. This is due to inconsistent information about the functioning of these ecosystems in different
parts within the region (see for example Blaber 1980; Bell et al. 1984; Rodelli et al. 1984; Quinn &
Kojis 1985; Little et al. 1988; Thollot & Kulbicki 1988; Blaber & Milton 1990; Chong et al. 1990;
Thollot 1992; Tzeng & Wang 1992; Marguillier et al. 1997; Sheaves & Molony 2000; Chong et al.
2001; Bouillon et al. 2002a,b; Guest & Connolly 2004). Inadequate and confounded sampling
procedures, improper data presentation/interpretation as well as the variations in sampled habitats are
thought to be among the reasons for this discrepancy. Furthermore, world-wide there is plenty of
knowledge about ecology of fishes residing in estuarine habitats containing mangroves and seagrass
beds (Robertson & Duke 1987; Thayer et al. 1987; Bell et al. 1988; Little et al. 1988; Blaber et al.
1989; Blaber 1990; Blaber & Milton 1990; Laegdsgaard & Johnson 1995; van der Velde et al.
1995a,b; Kimani et al. 1996; Pinto & Punchihewa 1966; Ley et al. 1999; Barletta et al.
2000,2003,2005; Barletta-Bergan et al. 2002a,b; Ikejima et al. 2003; Martino & Able 2003). However,
the information about the functioning of such habitats from non-estuarine habitats is limited and
largely lacking from East Africa in particular. The inconsistent information on the functioning of these
habitats within the Indo-Pacific region and the paucity of this knowledge from the non-estuarine
habitats necessitate the evaluation of as many areas as possible within the region so as to reach a
general consensus about the functioning of such habitats. This thesis contributes towards this
important information gap and provides more understanding of the ecology of fishes in an area where
this information is lacking. It describes the fish assemblages of such habitats from a non-estuarine
embayment within the Indian Ocean; it also provides insight into the importance of these habitats as
feeding grounds for fishes and the possible interrelation between these shallow-water habitats. This
thesis goes further into investigating the possible reasons for the discrepancies in the functioning of
mangroves as important feeding grounds for fishes. The knowledge gathered in this thesis is of
paramount importance towards sound management and conservation of marine resources as a whole.
Community structure of fishes of Chwaka Bay Although shallow water habitats containing mangroves and seagrass beds are of considerable
importance for Tanzania’s fisheries and conservation, information on the fish community species
inventory and functioning of these ecosystems is scarce. Chapters 2-4 of this thesis describe the fish
assemblage of shallow water habitats including mangroves and seagrass beds from Chwaka Bay,
Zanzibar. All these habitats were sampled using a similar fishing method so as to make the data from
Chapter 7: Synthesis
141
the different habitats comparable. As shown in Chapters 2-4 these habitats are dominated by juvenile
fishes of both ecological and economic importance. The high abundance and diversity of juvenile
fishes found in these habitats is not surprising and is generally associated with advantages that are
thought to be offered by these habitats as compared to coral reef areas. These advantages include high
food abundance and reduced predation risks. The high juvenile abundance observed in these habitats
reveal that the mangrove and seagrass ecosystems which are found within the non-estuarine habitats
are important juvenile habitats similar to those found within estuaries (Blaber 1980; Bell et al. 1984;
Robertson & Duke 1987; Thayer et al. 1987; Little et al. 1988; Morton 1990; Robertson & Blaber
1992; van der Velde et al. 1995a; Kimani et al. 1996; Barletta et al. 2000, Blaber 2000, Barletta et al.
2003). Furthermore, like estuarine fish communities (Robertson & Duke 1990; Barletta et al. 2000,
2003, Blaber 2000, Barletta-Bergan et al. 2002b; Ikejima et al. 2003; Strydom 2003; Jaureguizar et al.
2004), the non-estuarine fish assemblage of Chwaka Bay was shown not to be static; there occurred
variations in the fish community both in space and time (Chapters 2-4). Spatial variations were
recorded in fish diversity, size-related distribution patterns and densities in different bay habitats.
Comparing the mangroves and seagrass beds the following trends were observed; while the seagrass
beds in proximity to mangroves were found to harbour the most diverse assemblage of juvenile fishes,
the mangrove creeks harboured less diverse but the highest densities of juvenile fishes. As regards the
fish size-related distribution patterns, mangroves harbour small sized juveniles as compared to
individuals of the same species that were found in the seagrass beds. These variations were attributed
to differences in habitat characteristics, location (nature of adjacent habitat), habitat preferences, and
possibly ontogenetic migration. On a temporal basis, it was observed that the mangrove habitats were
the most susceptible to surface freshwater runoff especially during the period of heavy rains which
resulted into the decline in the fish community structure (density, biomass and diversity) in these
habitats, while the fish communities of the seagrass beds were hardly affected. The observed temporal
variations in the fish community structure were attributed to the decline in salinity within the
mangrove habitats (Chapter 3). This observation of a drastic decline in a fish community as a result of
a decline in salinity is characteristic for this marine bay and contrary to estuarine fish communities
which appear to be somewhat stable at times of low salinities (Barletta et al. 2003; Barletta et al.
2000).
Habitat preference The fish community of Chwaka Bay showed some degree of habitat preference; while some fishes
were found in multiple habitats, others were restricted to a single habitat type. It is important to note
here that the seagrass beds in proximity to mangroves appear the most preferred habitat as they
harboured the most diverse fish assemblage (Chapters 2 and 4). As shown in Chapter 4, juveniles of
Gerres oyena, Lethrinus lentjan, Lutjanus fulviflamma and Sphyraena barracuda were generalists
(found in all studied embayment habitats). In contrast, juveniles of Cheilio inermis, Hipposcarus
Chapter 7: Synthesis
142
harid, Leptoscarus vaigiensis, and Scolopsis ghanam inhabited seagrass beds only while those of
Gerres filamentosus and Monodactylus argenteus were mainly found in the mangrove habitats. It is
important to note that as shown by the PCA graph (Chapter 3) some species, i.e. G. filamentosus and
M. argenteus, were restricted to the mangrove habitats even during the rainy season, although with a
reduced density.
Interestingly, during heavy rains (i.e., during April-May) when salinity and water clarity
declined, most species disappeared from the mangroves. This is an indication that in non-estuarine
habitats like those of Chwaka Bay where marine fish species form the major part of the fish
community, habitat preference is probably subject to stable marine conditions for most fish species,
whereas under unfavourable conditions habitat preference becomes a less important factor.
Interaction between bay habitats Fish assemblages that are found in shallow water habitats exhibit interactions between bay habitats as
a result of migration, be it tidal (due to a big tidal range found in the Indo-Pacific), feeding, shelter or
ontogenetic (Cocheret de la Morinière et al. 2003). Assessing connectivity/interaction between these
shallow water habitats is particularly critical considering that the connectivity may be negatively
affected due to the extensive habitat loss and degradation that has occurred in these shallow water
habitats during the last decades (Chambers 1992; Kennish 2002). It also emphasizes the need to
conserve these habitats not in isolation but as a single system, for a sound management outcome. As
pointed out by Mumby (2006) conservation strategies should protect connected corridors of habitats
and facilitate the natural migration of species among habitats. The stable isotope study (Chapter 5)
revealed that mangrove and seagrass ecosystems do not exist in isolation; there is a degree of
connectivity between these habitats. The habitat connectivity revealed by the stable carbon isotopes of
individual fish species (Chapter 5) in different bay habitats demonstrated a possible early ontogenetic
migration and/or tidal migration. However, as shown by similarity in fish assemblages between
habitats (Chapter 2) and by connectivity between habitats through feeding (Chapter 5), there is an
interaction between nearby habitats, but a limited interaction between those which are far apart. The
possible reason could be the distance between habitats. Nøttestad et al. (1999) pointed out that the
distance to be covered during (tida/feeding) migration seems important in terms of energy budget
especially when juvenile fishes (<20 cm length) are considered, in which case long-distance migration
costs may exceed energy intake.
As shown in Chapter 4 there is a gradual increase in size of fish species with increasing
distance away from the mangroves. Species such as Lethrinus lentjan, L. variegatus, P. quadrilineatus,
Siganus sutor and Sphyraena barracuda were found as small-sized individuals in shallow and turbid
mangrove areas, whereas large-sized individuals were observed in deeper and less turbid seagrass
beds. The habitat connectivity that was revealed from the isotope study (Chapter 5) gives some clue
on the possible occurrence of a step-wise ontogenetic migration in the above mentioned fish species.
Chapter 7: Synthesis
143
In contrast, juveniles of some fish species were found mainly in the mangroves (e.g. Gerres
filamentosus and Monodactylus argenteus) and were never found in the seagrass beds. The question
which arises here is ‘if the mangroves are (potential) nursery habitats, then how do such fish species
from the mangroves migrate to the coral reefs?’ Most likely (and probably the only possibility), such
fishes migrate to coral reef habitats through direct ontogenetic migration rather than step-wise
ontogenetic migration. The abundance of juveniles of fish species such as G. filamentosus and M.
argenteus in the mangroves, and their complete absence from the seagrass beds, as well as their
complete absence as adults in the mangroves and in the seagrass beds supports this.
Evaluation of mangroves and seagrass beds of Chwaka Bay as potential nursery habitats As shown in Chapters 2 and 3, juveniles form a major proportion of the fish assemblage of Chwaka
Bay. Many fish species that are assumed to utilise these nearshore habitats as nurseries (Dorenbosch et
al. 2005; Froese & Pauly 2005), were found throughout the bay, sometimes in relatively high
densities. These included Lutjanus fulviflamma, Hipposcarus harid, Monodactylus argenteus,
Scolopsis ghanam, Siganus sutor and Sphyraena barracuda, suggesting that Chwaka Bay is a potential
nursery habitat. However, according to Beck et al. (2001) and Heck et al. (2003) this observation is
not sufficient to qualify Chwaka Bay as a “nursery habitat”. For a habitat to be qualified as a “nursery
habitat” it should contribute disproportionately more individuals than other shallow water habitats to
spatially separate adult populations on an areal basis. This information gap necessitates considerable
research within this region. As shown in Chapter 2, the mangrove creeks harbour the highest density
of juveniles than any other bay habitat. Furthermore, as shown in Chapter 3, individuals of the fish
species that were found in mangrove areas were smaller in size as compared to individuals of the same
species that were found in the seagrass beds. This suggests a possible ontogenetic migration occurring
in these bay habitats. Although the present study did not focus on the adult life stages, the almost total
absence of adults in the studied bay habitats suggests that large fishes must be present elsewhere,
possibly in the deeper parts of the bay or on the adjacent coral reef. A study by Dorenbosch et al.
(2005) on the fish community of coral reef adjacent to Chwaka Bay provides some evidence on the
likely dependence of some coral reef fish species on the presence of seagrass beds and mangroves.
On the contrary, the mangrove creeks contained a higher proportion of
zoobenthivores/piscivores (which could be potential predators on small juvenile fishes) than any other
bay habitat (Chapter 2). This proportion was made up of mangrove resident species (large
juveniles/sub-adults and adults). This relatively high proportion of potential piscivores within the
mangrove creeks raises a question on the suitability of the mangrove creeks as potential nursery
habitats. Sheaves (2001) argued for the use of “abundance of piscivores” in shallow waters as a
criterion for considering a habitat as a potential nursery ground. Additionally, the susceptibility of the
mangrove habitats to changes in environmental factors during the rainy season as reported in Chapter

Chapter 7: Synthesis
144
3 and the subsequent decline in fish populations in this habitat during this season presents doubts on
the potential of the mangroves as nursery habitats. On the other hand, the high diversity of juvenile
fishes in Chwaka seagrass beds, relatively low proportions of piscivores, and the stable environmental
conditions even during rainy period suggest a higher potential of the seagrass beds as a nursery habitat
over the mangroves. It should be noted that, this evaluation is being done on the basis of the data
collected during the low tide; the situation during the high tide is likely to be different. The access of
large predators coming in with the tide could increase predator densities within the mangroves and
could also bring in a potential number of predators over the seagrass beds.
Shallow water habitats as feeding grounds for fishes As shown in Chapter 5, the different bay habitats were all used as feeding grounds by different fish
species. Gut content and stable carbon isotope analyses showed evidence that the studied fish species
generally relied on algae (herbivores) and/or macro-invertebrates (omnivores and zoobenthivores) as a
food source, with crustaceans (crabs, shrimps and copepods) playing a major role. Although the stable
isotope signatures showed evidence for food dependence of the studied fish species on mangrove and
seagrass ecosystems, the direct consumption of either mangrove or seagrass leaves seemed to be
absent or very low. Seagrasses and mangroves do not appear to be direct sources of carbon in the diets
of studied fish species; rather, they probably serve as refuge as well as substrate for a variety of
primary producers and consumers that are important in the food webs of these habitats (Kieckbusch et
al. 2004). Presence of food in addition to structural complexity has been reported to account for the
strong association of large numbers of juvenile fishes within the mangroves and seagrass beds
(Laegdsgaard & Johnson 2001; Cocheret de la Morinière et al. 2004; Nakamura & Sano 2005; Verweij
et al. 2006).
Mangrove habitats as feeding grounds for fishes The importance of mangroves as feeding grounds for fish and other macrozoobenthos in the Indian
Ocean and elsewhere has been a subject of debate. In Chapter 6 of this thesis we propose that one of
the reasons for the discrepancies in the role of mangroves as feeding habitats could be due to the fact
that studies that report on the functioning of mangroves have been conducted in mangrove systems
that differed in their settings (landscape). Stable isotope analysis of carbon and nitrogen was used to
investigate whether mangrove landscape configuration could influence the functioning of mangroves
as an important feeding area. The two mangrove settings were: mangrove-lined creeks which retain
water during low tides and fringing mangroves that drain completely during low tides. Chapter 6
reveals that the utilisation of mangrove habitats as feeding grounds for fishes seems to be different in
different mangrove systems. The results suggest that fishes feed more from the mangrove-lined creeks
as compared to fringing mangroves which is probably related to differences in the degree of mangrove
inundation. The more or less continuous access provided more time for fishes to stay and feed in the
Chapter 7: Synthesis
145
mangrove-lined creeks compared to fishes from the fringing mangroves, which have access to these
mangroves only during high tide and have to migrate to adjacent habitats with the ebbing tide.
It has been shown from Chapters 5 and 6 that only mangroves which are more or less
permanently inundated can serve as important feeding grounds, only for fishes that are living within
the mangrove habitats, and that the fishes found in adjacent habitats do not use these habitats as
important feeding grounds. Two important questions arise here. 1. If fishes (from the fringing
mangroves and those from adjacent habitats in all different settings of mangroves) do not feed
significantly from the mangroves, why do they visit the mangroves? 2. What is the primary importance
of mangroves to these fishes? Is it provision of food or shelter/refuge? The answer to question 1 could
be: the likely reason why these fishes would move into mangroves during high tide is protection
against predation by using the structural complexity of mangrove aerial roots. As observed in other
studies, structural complexity in relation to predation risk is an important factor in determining
distribution of juvenile fishes (Laegdsgaard and Johnson 2001; Cocheret de la Morinière et al. 2004;
Verweij et al. 2006). The answer to question 2 is that, the primary function/importance of mangroves
to fishes, especially from the studied mangroves, appears to be shelter/refuge. Most fishes move into
the mangrove ecosystems in search for safe habitats against predation; however, if conditions allow
(such as degree and duration of inundation) these fishes would also feed from these habitats. Being
able to feed within the mangroves especially at a juvenile stage is likely to have a double advantage: a
juvenile fish may benefit by feeding from a rich invertebrate fauna of mangrove forests (Sheridan
1997) and also obtain the protection afforded by the structural complexity found in these habitats.
Chapter 7: Synthesis
146
CONCLUSIONS
This thesis aimed at answering the following question: ‘Do the mangroves and seagrass beds
along the Tanzanian coast serve as important habitats for juvenile fishes?’ It was also aimed at
showing how a non-estuarine (marine) bay compares with estuaries as well as other marine
bays in other regions. This thesis shows that shallow water habitats (including mangroves and
seagrass beds) from a non-estuarine (marine) bay of Tanzania are important juvenile habitats
for both resident and transient fish species many of which are of commercial importance
(Chapters 2-4). It was also shown that a marine embayment can experience a seasonal influx
of freshwater just during heavy rains which can result into changes in environmental
conditions similar to those that occur in estuarine habitats. However, unlike the fish
communities occurring in estuarine habitats which are more or less adapted to decline in
salinity, the fish communities of marine bays are not stable as was revealed by the marked
decline in fish densities, biomasses and diversity during the rainy period (Chapter 3). This
thesis has also shown that the fish community of this non-estuarine bay shows a spatial size-
related distribution patterns with small juveniles in the turbid mangrove habitats and large
juveniles on the more clear-water seagrass beds towards the coral reef and deeper parts of the
bay (Chapter 4); this pattern suggests the possible existence of ontogenetic migration. This
thesis also shows that shallow water habitats including mangroves and seagrass beds do not
occur in isolation. These habitats are interlinked through fish movements (be it tidal, feeding
or ontogenetic migration). Shallow water habitats including mangroves and seagrass beds can
constitute an important feeding ground for fishes (Chapters 5 and 6); however, the setting of
a mangrove ecosystem is an important factor that influences its usage as a feeding ground for
fishes. This thesis has revealed that mangroves ecosystems from the same region but differing
in landscape configuration function differently and that other factors (such as duration of
inundation) could be equally important or even more important than the geographical position
of a mangrove ecosystem.
Chapter 7: Synthesis
147
RECOMMENDATIONS FOR FURTHER RESEARCH
Generally, this thesis has shown that mangroves and seagrass beds of Tanzania are important juvenile
habitats to fishes many of which are of commercial importance. Although some of these fishes can be
categorized as reef fishes, it is still not clear if these reef fishes that are found as juveniles in the
mangroves and seagrass beds later migrate to the reef. Futhermore, according to Beck et al. (2001) and
Heck et al. (2003) the presence of juveniles in mangroves and seagrass beds is not sufficient to qualify
them as a “nursery habitat”. For a habitat to be qualified as a “nursery habitat” it should contribute
disproportionately more individuals to spatially separate adult populations per unit of surface area than
other habitats. This information gap necessitates the carrying out of considerable research within this
region. While the findings of the present thesis can be used as a baseline for further research on
shallow water habitats containing mangroves and seagrass beds as potential nursery habitats for fishes,
techniques such as mark and recapture, the use of otolith micro-chemistry and the involvement of the
entire mangrove-seagrass-reef continuum could help to substantiate the contribution of these shallow
water habitats to reef populations and hence confirm the nursery role hypothesis.
Stable isotope data of fishes in the Tanzanian shallow water habitats are scarce. It is however,
known that the movements of fishes between habitats can be traced using stable isotopes of carbon and
nitrogen, given the differential isotopic signatures of the respective food webs. Stable isotope studies
on the fish communities of shallow water habitats including mangrove-seagrass-coral reef continuum
could be used to trace fish movements and this would add more knowledge of the functioning of these
ecosystems as nursery areas in East Africa and in the Indian Ocean as a whole.
The present thesis has shown that the shallow water habitats including mangroves and
seagrass beds can serve as important feeding grounds for fishes. It has also shown that mangrove
setting (duration of inundation) is an important factor influencing the functioning of a mangrove
ecosystem as a feeding ground. However, feeding from these shallow water habitats is just one
important function that these shallow water habitats can offer to fishes. Other functions such as shelter
and refuge to fishes cannot be underestimated. The mangrove ecosystem that proved not to be an
important feeding ground for fishes could form an important habitat that provides shelter and refuge to
fishes. The importance of shallow water habitats in the provision of shelter to fishes needs to be
studied in different shallow water habitats and in particular in different settings of mangroves so as to
establish how different mangrove ecosystems function in as far as shelter/refuge function is concerned.
Most of the data presented in this thesis give a general picture of what occurs in Chwaka Bay
during low spring tides and especially in the shallow habitats which could be accessed with the
sampling gear (net) used and also during the day-time. Future sampling should include day and night
samplings, encompass the whole tidal range and all moon phases, and much deeper areas and the
adjacent coral reef.

Chapter 7: Synthesis
148
As stated in this thesis, the mesh size (1.8 mm) used in the present study was not adequate for
catching larvae and small juveniles. It is recommended that future studies should also include other
techniques that will sample the whole size range of fishes. This will generate information on the
recruitment of fishes, e.g. the size at which larval fishes settle in these habitats.

Chapter 7: Synthesis
149
References Barletta M, Saint-Paul U, Barletta-Bergan A, Ekau W & Schories D (2000) Spatial and temporal distribution of
Myrophis punctatus (Ophichthidae) and associated fish fauna in a northern Brazilian intertidal mangrove
forest. Hydrobiologia 426: 65-74.
Barletta M, Barletta-Bergan A, Saint-Paul U & Hubold G (2003) Seasonal changes in density, biomass, and
diversity of estuarine fishes in tidal mangrove creeks of the lower Caeté Estuary (northern Brazilian coast, east
Amazon). Marine Ecology Progress Series 256: 217-228.
Barletta M, Barletta-Bergan A, Saint-Paul U & Hubold G (2005) The role of salinity in structuring the fish
assemblages in a tropical estuary. Journal of Fish Biology 66: 45-72.
Barletta-Bergan A, Barletta M & Saint-Paul U (2002a) Community structure and temporal variability of
ichthyoplankton in North Brazilian mangrove creeks. Journal of Fish Biology 61: 33-51.
Barletta-Bergan A, Barletta M & Saint-Paul U (2002b) Structure and seasonal dynamics of larval fish in the
Caeté River Estuary in North Brazil. Estuarine, Coastal and Shelf Science 54: 193-206.
Beck MW, Heck KL, Able KW, Childers DL, Eggleston DB, Gillanders BM, Halpern B, Hays CG, Hoshino K,
Minello TJ, Orth RJ, Sheridan PF & Weinstein MP (2001) The identification, conservation, and management
of estuarine and marine nurseries for fish and invertebrates. BioScience 51: 633-641.
Bell JD, Pollard DA, Burchmore JJ, Pease BC & Middleton MJ (1984) Structure of a fish community in a
temperate tidal mangrove creek in Botany Bay, New South Wales. Australian Journal of Marine and
Freshwater Research 35: 33-46.
Bell JD, Steffe AS & Westoby M (1988) Location of seagrass beds in estuaries: effects on associated fish and
decapods. Journal of Experimental Marine Biology and Ecology 122: 127-146.
Blaber SJM & Milton DA (1990). Species composition, community structure and zoogeography of fishes of
mangroves in the Solomon Islands. Marine Biology 105: 259-268.
Blaber SJM (1980) Fish of the Trinity inlet system of North Queensland with notes on the ecology of fish faunas
of tropical Indo-Pacific estuaries. Australian Journal of Marine and Freshwater Research 31: 137-145.
Blaber SJM, Brewer DT & Salini JP (1989) Species composition and biomasses of fishes in different habitats of
a tropical Northern Australian estuary: Their occurrence in the adjoining sea and estuarine dependence Coastal
and Shelf Science 29: 509-531.
Blaber SJM (2000) Tropical Estuarine Fishes: Ecology, exploitation and conservation. Blackwell Science Ltd,
Fish and aquatic resources series 7. 121 pp.
Bouillon S, Koedam N & Dehairs F (2002a) Primary producers sustaining macro-invertebrate communities in
intertidal mangrove forests. Oceologia 130: 441-448.
Bouillon S, Raman AV, Dauby P & Dehairs F (2002b) Carbon and nitrogen stable isotope ratios of subtidal
benthic invertebrates in an estuarine mangrove ecosystem (Andhra Pradesh, India). Estuarine, Coastal and
Shelf Science 54: 901-913.
Chambers JR (1992) Coastal degradation and fishery declines in the U.S. In: Stroud, R.H. (Ed.), Stemming the
Tide of Coastal Fish Habitat Loss. National Coalition for Marine Conservation, Savannah, GA, pp. 45-51.
Chapter 7: Synthesis
150
Chong VC, Sasekumar A, Leh MUC, Cruz RD (1990) The fish and prawn communities of a Malaysian coastal
mangrove ecosystem, with comparisons to adjacent mud/sand flats and inshore waters. Estuarine, Coastal and
Shelf Science 31: 703-722.
Chong VC, Low CB & Ichikawa T (2001) Contribution of mangrove detritus to juvenile prawn nutrition: a dual
stable isotope study in a Malaysian mangrove forest. Marine Biology 138: 77-86.
Cocheret de la Morinière E, Pollux BJA, Nagelkerken I, van der Velde G (2002) Post-settlement life cycle
migration patterns and habitat preference of coral reef fish that use seagrass and mangrove nurseries.
Estuarine, Coastal and Shelf Science 55: 309-321.
Cocheret de la Morinière E, Nagelkerken I, van der Meij H, van der Velde G (2004) What attracts juvenile
coral reef fish to mangroves: habitat complexity or shade? Marine Biology 144: 139-145.
Dorenbosch M, Grol MGG, Christianen MJA, Nagelkerken I, van der Velde G (2005) Indo-Pacific seagrass beds
and mangroves contribute to fish density and diversity on adjacent coral reefs. Marine Ecology Progress
Series 302: 63-76.
Guest MA & Connolly RM (2004). Fine-scale movement and assimilation of carbon in saltmarsh and mangrove
habitats by resident animals. Aquatic Ecology 38: 599-609.
Heck KL, Hays G, Orth RJ (2003) Critical evaluation of the nursery role hypothesis for seagrass meadows.
Marine Ecology Progress Series 253: 123-136.
Ikejima K, Tongnunui P, Medej T & Taniuchi T (2003) Juvenile and small fishes in a mangrove estuary in Trang
province, Thailand: seasonal and habitat differences. Estuarine, Coastal and Shelf Science 56: 447-457.
Jaureguizar AJ, Menni R, Guerrero R & Lasta C (2004) Environmental factors structuring fish communities of
the Rio de la Plasta estuary. Fisheries Research 66: 195-211.
Kennish MJ (2002) Environmental threats and environmental future of estuaries. Environmental Conservation
29: 78-107.
Kieckbusch DK, Koch MS, Serafy JE & Anderson WT (2004) Trophic linkages among primary producers and
consumers in fringing mangroves of subtropical lagoons. Bulletin of Marine Science 74: 271-285.
Kimani EN, Mwatha GK, Wakwabi EO, Ntiba JM, Okoth BK (1996) Fishes of a shallow tropical mangrove
estuary, Gazi, Kenya. Marine and Freshwater Research 47: 857-868.
Laegdsgaard P & Johnson CR (1995) Mangrove habitats as nurseries: unique assemblages of juvenile fish in
subtropical mangroves in Eastern Australia. Marine Ecology Progress Series 126: 67-81.
Laegdsgaard P & Johnson C (2001) Why do juvenile fish utilize mangrove habitats? Journal of Experimental
Marine Biology and Ecology 257: 229-253.
Ley JA, McIvor CC and Montague CL (1999) Fishes in Mangrove Prop-root Habitats of Northeastern Florida
Bay: Distinct Assemblages across an Estuarine Gradient. Estuarine, Coastal and Shelf Science 48: 701-723.
Little MC, Reay PJ & Grove SJ (1988) The fish community of an East African mangrove creek. Journal of Fish
Biology 32: 729-747.
Marguillier S, van der Velde G, Dehairs F, Hemminga MA & Rajagopal S (1997) Trophic relationships in an
interlinked mangrove-seagrass ecosystem as traced by δ13C and δ15N. Marine Ecology Progress Series 151:
115-121.
Martino EJ & Able KW (2003) Fish assemblages across the marine to low salinity transition zone of a temperate
estuary. Estuarine, Coastal and Shelf Science 56: 969-987.

Chapter 7: Synthesis
151
Morton RM (1990) Community structure, density and standing crop of fishes in a subtropical Australian
mangrove area. Marine Biology 105: 385-394.
Mumby PJ (2006) Connectivity of reef fish between mangroves and coral reefs: Algorithms for the design of
marine reserves at seascape scales. Biological Conservation 128: 215-222.
Mumby PJ, Edwards AJ, Ernesto Arias-Gonzalez JE, Lindeman PG, Gall A, Gorczynska MI, Harborne AR,
Pescod CL, Renken H, Wabnitz CCC & Llewellyn G (2004) Mangroves enhance the biomass of coral reef fish
communities in the Caribbean. Nature 427: 533-536.
Nagelkerken I, van der Velde G, Gorissen MW, Meijer GJ, Van't Hof T & den Hartog C (2000) Importance of
mangroves, seagrass beds and the shallow coral reef as a nursery for important coral reef fishes, using a visual
census technique. Estuarine, Coastal and Shelf Science 51: 31-44.
Nagelkerken I, Roberts CM, van der Velde G, Dorenbosch M, van Riel MC, Cocheret de la Morinière E,
Nienhuis PH (2002) How important are mangroves and seagrass beds for coral-reef fish? The nursery
hypothesis tested on an island scale. Marine Ecology Progress Series 244: 299-305.
Nakamura Y & Sano M 2005. Comparison of invertebrate abundance in a seagrass bed and adjacent coral and
sand areas at Amitori Bay, Iriomote Island, Japan. Fisheries Science 71: 543-550.
Nøttestad L, Giske J, Chr. Holst J, Huse G (1999) A length-based hypothesis for feeding migrations in pelagic
fish. Canadian Journal of Fisheries and Aquatic Sciences 56: 26-34.
Pinto L & Punchihewa NN (1996) Utilization of mangroves and seagrasses by fishes in the Negombo estuary,
Sri Lanka. Marine Biology 126: 333-345.
Quinn TP & Kojis BL (1985) Does the presence of coral reefs in proximity to a tropical estuary affect the
estuarine fish assemblage? Proceedings of the 5th International Coral Reef Congress 5: 445-450.
Robertson AI & Blaber SJM (1992) Plankton, epibenthos and fish communities. In: Robertson AI, Alongi DM
(eds) Tropical mangrove ecosystems. Coastal and Estuarine Studies 41: 173-224.
Robertson AI & Duke NC (1987) Mangroves as nursery sites: comparisons of the abundance and species
composition of fish and crustaceans in mangroves and other nearshore habitats in tropical Australia. Marine
Biology 96: 193-205.
Robertson AI & Duke NC (1990) Mangrove fish-communities in tropical Queensland, Australia – Spatial and
temporal patterns in densities, biomass and community structure. Marine Biology 104: 369-379.
Rodelli MR, Gearing JN, Gearing PJ, Marshall N & Sasekumar A (1984). Stable isotope ratios as a tracer of
mangrove carbon in Malaysian ecosystems. Oecologia 61: 326-333.
Sheaves M & Molony B (2000). Short-circuit in the mangrove food chain. Marine Ecology Progress Series 199:
97-109.
Sheaves M (2001) Are there really few piscivorous fishes in shallow estuarine habitats? Marine Ecology
Progress Series 222: 279-290.
Strydom NA (2003) Occurrence of larval and early juvenile fishes in the surf zone adjacent to two intermittently
open estuaries, South Africa. Environmental Biology of Fishes 66: 349-359.
Thayer GW, Colby DR, Hettler WF (1987) Utilization of the red mangrove prop root habitat by fishes in south
Florida. Marine Ecology Progress Series 35: 25–38

Chapter 7: Synthesis
152
Thollot P & Kulbicki M (1988) Overlap between the fishfauna inventories of coral reefs, soft bottoms and
mangroves in Saint-Vincent Bay (New Caledonia). Proceedings of the 6th International Coral Reef
Symposium, Australia 2: 613-618
Thollot P (1992) Importance of mangroves for Pacific reef fish species, myth or reality? Proceedings of the 6th
International Coral Reef Symposium 2: 934-941.
Tzeng WN & Wang YT (1992) Structure, composition and seasonal dynamics of the larval and juvenile fish
community in the mangrove estuary of Tanshui River, Taiwan. Marine Biology 113: 481-490.
van der Velde G, van Avesaath PH, Ntiba MJ, Mwatha GK, Marguillier S & Woitchik AF (1995a) Fish fauna of
mangrove creeks, seagrass meadows and sand flats in Gazi Bay, Kenya (Indian Ocean): a study with nets and
stable isotopes. In: Heip C.H.R., M.A. Hemminga, M.J.M. de Bie (eds), Monsoons and coastal ecosystems in
Kenya. Netherlands Indian Ocean Programme Cruise Report 5: 39-50.
van der Velde G, Dehairs F, Marguillier S, Mwatha GK, Op ‘t Veld RLJM, Rajagopal S & van Avesaath PH
(1995b). Structural and stable isotope differences in the fish communities of mangrove creeks, seagrass
meadows and sand flats in Gazi Bay (Kenya). In: Hemminga M.A. (ed), Interlinkages between eastern-African
coastal ecosystems. STD- III project. Final report. pp 132-157.
Verweij MC, Nagelkerken I, de Graaff D, Peeters M, Bakker EJ, van der Velde G (2006) Structure, food and
shade attract juvenile coral reef fish to mangrove and seagrass habitats: a field experiment. Marine Ecology
Progress Series 306: 257-268.

Summary/Samenvatting/Muhtasari
153
SUMMARY
The importance of mangroves and seagrass beds as important habitats for fishes has been a subject of
debate and considerable research. While the importance of both seagrass beds and mangroves as a
juvenile habitat for coral reef fishes is well demonstrated in the Caribbean region, the functioning of
these shallow water habitats and particularly the mangroves within the Indo-Pacific region is doubtful.
Furthermore, there is scarcity of knowledge on the functioning of non-estuarine bays within the Indo-
Pacific region and the coast of east Africa in particular, since most of research has been done within
estuaries. This thesis gives an insight into the potential of mangroves and seagrass beds of Tanzania as
important habitats for juvenile fishes.
Chapters 2-4 of this thesis describe the fish community of the non-estuarine embayment
(Chwaka Bay) both in terms of spatial and temporal variations. As reported in Chapter 2, the fish
community of Chwaka Bay is dominated by small juveniles many of which are of commercial fishery
importance. This observation is an indication that mangroves and seagrass beds situated within a
marine (non-estuarine) embayment can serve as important habitats for juvenile fishes. However, as
shown in Chapters 2-4, the distribution of species and size-related distribution patterns, as well as the
abundance was not similar throughout bay habitats or even throughout the year. As regards the species
composition and abundance, neighbouring bay habitats contained more similar fish assemblages than
bay habitats that were far apart (i.e. mangrove creeks vs. Marumbi seagrass beds). Proximity to
mangroves and/or coral reefs and habitat type are thought to influence the fish assemblages and hence
the differences in fish species overlap observed.
Fish populations are not stable; they always vary in space and time. Being a non-estuarine
embayment, the environmental variables as well as the fish community structure in each habitat
remained relatively constant for most part of the year; however, a marked decline (in density, biomass
and species richness and in salinity in particular) was observed during the rainy period with larger
changes in the mangroves and mud/sand flats habitats than in the seagrass beds (Chapter 3). A drastic
change in salinity coupled with changes in other environmental variables was proposed to be the cause
for the decline in the fish community, especially within the mangroves and mud/sand flats. Moreover,
the results indicate that although mangroves were the preferred settling habitats for Gerres
filamentosus, Gerres oyena, Lethrinus lentjan and Monodactylus argenteus, there was a degree of
timing during favourable conditions for settlement especially during the dry season (December –
February period) and not during the rainy season (April-May) when the environmental conditions and
especially salinity declines.
In connection with the nursery hypothesis, most fishes found within mangrove and seagrass
ecosystems as juveniles at a certain stage probably outgrow the protection of these habitats and likely
migrate permanently from their nursery habitats to deeper water, such as adjacent coral reefs. They
probably do so through direct or step-wise ontogenetic migration. By using seine net, thirteen

Summary/Samenvatting/Muhtasari
154
commercially important fish species were investigated to see if they exhibit an ontogenetic migration
(Chapter 4). Five of the 13 studied species (Lethrinus lentjan, L. variegatus, Pelates quadrilineatus,
Siganus sutor and Sphyraena barracuda) were found as small-sized individuals in shallow and turbid
mangrove areas, whereas large-sized individuals were observed in deeper and less turbid seagrass
beds. A possible explanation for this pattern could be an ontogenetic shift in habitat utilisation, as
established by stable isotope results (Chapter 5). As regards the species richness of different bay
habitats, the seagrass beds near to mangroves (Chwaka seagrass beds) showed the most diverse fish
assemblage of all habitats, possibly because it functions as a corridor between the mangroves and
deeper parts of the embayment. Mud/sand flats had the least diverse fish assemblage (Chapter 2 and
4). This thesis shows that Chwaka Bay contains a large number (around 150) of fish species, however,
only a few species dominate in terms of both density and biomass (Chapter 2). It also shows that
some fish species exhibit habitat preferences while others are ubiquitous (Chapter 2 and 4).
The relative importance of bay habitats, consisting of mangrove creeks and channel, seagrass
beds, and mud/sand flats, as feeding grounds for a number of fish species was studied in Chwaka Bay,
using gut content analysis and stable isotope analysis of carbon and nitrogen (Chapter 5). The mean
δ13C values of fishes and food items from the different bay habitats studied showed that all bay
habitats were significant feeding grounds for fishes. The mean δ13C values fishes and food items from
the mangroves were the most depleted (≤ -19‰) and those from the seagrass beds the most enriched (≥
-14‰). Similar to other studies done in different geographical locations, the importance of mangrove
and seagrasses themselves as a primary source of carbon to higher trophic levels was limited. This
thesis also revealed connectivity with respect to feeding between different habitats which could be a
result of either daily tidal migrations or recent ontogenetic migration (Chapter 5).
The importance of different mangrove ecosystems as feeding grounds for fishes and other
macrozoobenthos is presented in Chapter 6. By using stable isotope analysis of carbon and nitrogen,
we investigated two different settings of mangrove ecosystems along the Tanzanian coast, to establish
if the topography of a mangrove ecosystem influences the use of this habitat as a potential feeding
ground by fishes. The δ13C signatures of most fishes from the mangrove-lined creeks were similar to
those of food items from the mangrove habitat, which suggests that these fishes feed from the
mangrove habitats. In contrast, the overlap in δ13C of some food items from the fringing mangroves
with those from adjacent habitats, and the more enriched δ13C signatures of fishes from the fringing
mangroves with respect to most typical food items from the mangroves could be an indication that
these fishes feed from both habitats but to a lower extent from the fringing mangroves. The results
suggest that fishes feed more from the mangrove-lined creeks as compared to fringing mangroves
which is probably related to differences in the degree of mangrove inundation. The more or less
continuous access provided more time for fishes to stay and feed in the mangrove-lined creeks
Summary/Samenvatting/Muhtasari
155
compared to fishes from the fringing mangroves, which have access to these mangroves only during
high tide and have to migrate to adjacent habitats with the ebbing tide.
In summary, this thesis reveals that shallow water habitats (including mangroves and seagrass
beds) from a non-estuarine (marine) bay of Tanzania are important juvenile habitats for both resident
and transient fish species, many of which are of commercial importance. This thesis also shows that
shallow water habitats including mangroves and seagrass beds are not isolated from each other. These
habitats are interlinked through fish movements (be it tidal, feeding or ontogenetic migration). Shallow
water habitats including mangroves and seagrass beds can constitute an important feeding ground for
fishes; however, the setting of a mangrove ecosystem is an important factor that influences its
utilisation as a feeding ground for fishes. This thesis has revealed that mangroves ecosystems from the
same region but differing in landscape configuration function differently and that other factors (such as
duration of inundation) could be equally important or even more important than the geographical
position of a mangrove ecosystem. The findings of this thesis can be use to design strategies for
sustainable utilisation and management of shallow-water habitats and resources.

Summary/Samenvatting/Muhtasari
156
SAMENVATTING
De waarde van mangroves en zeegrasvelden als habitat voor vis is het onderwerp van een
voortdurende discussie en vele studies. Terwijl er veel bewijs is voor de waarde van de mangroves en
zeegrasvelden in het Caribische gebied als habitat voor vis, bestaat er twijfel over de waarde van deze
habitats voor vis in het gebied van de Indische en Stille oceanen. Aangezien het onderzoek in baaien in
dit gebied en langs de Oost Afrikaanse kust vooral gericht is op estuaria, is er bovendien weinig
bekend over het functioneren van niet-estuariene baaien. In dit proefschrift is onderzocht welke
waarde de mangroves en zeegrasvelden langs de kust van Tanzania voor juveniele vis hebben.
In de hoofdstukken 2 tot en met 4 wordt de samenstelling van de visgemeenschappen van de
baai van Chwaka, een niet-estuariene baai, in de tijd en ruimte onderzocht. Zoals beschreven in
hoofdstuk 2 bestaat de visgemeenschap van de baai van Chwaka voornamelijk uit juvenielen, waarvan
velen soorten die van belang zijn voor de visserij. Deze waarneming suggereert dat mangroves en
zeegrasvelden in niet-estuariene baaien als waardevolle habitats voor juveniele vis kunnen dienen. De
abundantie en verspreiding van zowel soorten als lengteklassen vertoonden echter variatie in de tijd en
tussen de habitats in de baai. De visgemeenschappen van direct naast elkaar gelegen habitats
vertoonden meer overeenkomsten in soortensamenstelling en abundantie dan verder uit elkaar gelegen
habitats (zoals de mangrove kreken en de zeegrasvelden voor Marumbi). Het type habitat en de
nabijheid van mangroves of koraalriffen worden gedacht van invloed te zijn op de samenstelling van
visgemeenschappen.
De samenstelling van visgemeenschappen is niet stabiel, maar is onderhevig aan
veranderingen in plaats en tijd. In de niet-estuariene baai van Chwaka bleken zowel de
omgevingsfactoren als de structuur van de visgemeenschap relatief constant tijdens het grootste deel
van het jaar. In het regenseizoen werd echter een drastische afname in visdichtheid, visbiomassa,
soortenrijkdom en zoutgehalte waargenomen. Deze veranderingen waren groter in de mangroves en op
de modder- en zandplaten dan in de zeegrasvelden (hoofdstuk 3). Een sterke verandering in
zoutgehalte in combinatie met veranderingen in andere omgevingsfactoren werd gezien als de oorzaak
voor de veranderingen in de visgemeenschap. Hoewel de voorkeur van Gerres filamentosus, Gerres
oyena, Lethrinus lentjan en Monodactylus argenteus uitging naar vestiging in de mangroves, bleek de
vestiging in deze habitat tijdgebonden: vissen vestigden zich in deze habitat tijdens het droge seizoen
waarin de condities gunstig waren, en niet in het regenseizoen waarin verschillende omgevingsfactoren
minder gunstig waren en het zoutgehalte lager is.
Volgens de kinderkamer hypothese zullen de meeste vissen die zich tijdens juveniele stadia
ophouden in mangroves en zeegrasvelden de bescherming die deze habitats bieden op een zeker
moment ontgroeien. De vissen zullen zich vervolgens middels directe migratie of stapsgewijze
ontogenetische migratie verplaatsen naar habitats met grotere waterdiepte, zoals koraalriffen. In
hoofdstuk 4 is met behulp van zegenvisserij onderzocht of 13 commercieel belangrijke soorten

Summary/Samenvatting/Muhtasari
157
ontogenetische migratie vertonen. Van vijf van deze soorten, te weten Lethrinus lentjan, L. variegatus,
Pelates quadrilineatus, Siganus sutor en Sphyraena barracuda, werden kleine individuen in de
ondiepe en troebele wateren van de mangroves gevonden, terwijl grote individuen in diepere en
heldere wateren van zeegrasvelden werden waargenomen. Deze verspreiding kan verklaard worden
door een ontogenetische aanpassing in habitat gebruik, zoals blijkt uit analyse van de stabiele isotopen
signaturen. De visgemeenschap van een zeegrasveld in de nabijheid van mangroves (de zeegrasvelden
bij het dorp Chwaka) bleek de hoogste soortenrijkdom te hebben van de onderzochte habitats, wellicht
door de functie als corridor tussen de mangroves en de diepere delen van de baai. De
visgemeenschappen van de modder- en zandplaten hadden de laagste soortenrijkdom. Dit proefschrift
laat zien dat ongeveer 152 vissoorten in de baai van Chwaka aanwezig zijn, maar dat slechts enkele
soorten de visgemeenschap in aantal en biomassa domineren (hoofdstuk 2). Verder blijkt dat sommige
van de aanwezige soorten duidelijke habitatvoorkeuren hebben, terwijl andere soorten geen voorkeur
lijken te hebben (hoofdstukken 2 en 4).
In de hoofdstukken 5 en 6 worden resultaten gepresenteerd die verder inzicht geven in het
functioneren van de ondiepe habitats. De waarde van de habitats in baaien (mangrove kreken,
mangrove kanalen, zeegrasvelden, modder- en zandbanken) als foerageergebied voor vissen is
onderzocht in de baai van Chwaka met behulp van analyse van de maaginhoud en stabiele koolstof en
stikstof isotopen (hoofdstuk 5). Uit de analyse van de δ13C-waarden van vissen en voedselbronnen in
de verschillende habitats bleek dat alle habitats een significante waarde als foerageergebied voor
vissen hadden. De gemiddelde δ13C-waarden voor vissen en voedselbronnen was het laagst in de
mangroves (≤-19‰) en het hoogst in zeegrasvelden (≥-14‰). Net als in studies die elders zijn
uitgevoerd, bleek ook in deze studie dat de waarde van mangroves en zeegrasvelden als primaire bron
van koolstof voor de hogere trofische niveaus gering was. Bovendien werd in hoofdstuk 5 aangetoond
dat er een hoge mate van connectiviteit tussen de verschillende habitats was door de uitwisseling van
voedingsstoffen, hetgeen kan wijzen op dagelijkse tij-gestuurde migratie of recente ontogenetische
migratie.
De waarde van de verschillende mangrove habitats als foerageergebied voor vissen en ander
macrozoobenthos is onderzocht in hoofdstuk 6. Met behulp van de analyse van stabiele koolstof en
stikstof isotopen is onderzoek gedaan naar de invloed van geomorfologie van mangroves op de waarde
van de mangroves als foerageergebied voor vis. Hierbij zijn twee mangrove typen die langs de kust
van Tanzania voorkomen onderzocht. In mangroves waar kreken aanwezig zijn, is de koolstof
signatuur van de meeste vissen vergelijkbaar met de voedselbronnen in de mangroves, waaruit blijkt
dat de vissen in de mangrovehabitat foerageren. In baaien waar de mangroves slechts een smalle
oeverstrook innemen, zogenaamde “fringing mangroves”, blijkt dat de vissen een hogere koolstof
signatuur hebben dan de typische voedselbronnen in de mangroves. Hieruit blijkt dat de vissen zowel
binnen als buiten de mangroves foerageren, waarbij de bijdrage van de mangroves klein is. Deze
resultaten laten zien dat de mangrovekreken een grotere rol als foerageergebied hebben dan de
Summary/Samenvatting/Muhtasari
158
mangroves die slechts een smalle oeverstrook innemen. Dit hangt waarschijnlijk samen met de mate
waarin de mangroves bij vloed onder water staan. De vrijwel ononderbroken toegankelijkheid van de
kreken biedt vissen meer verblijf- en foerageermogelijkheden dan de smalle mangrovestroken die
enkel tijdens vloed toegankelijk zijn en bij afgaand tij weer verlaten moeten worden.
Samenvattend toont dit proefschrift aan dat ondiepe habitats in baaien langs de kust van
Tanzania, waaronder mangroves en zeegrasvelden, waardevolle habitats vormen voor zowel residente
als doortrekkende vissoorten, waaronder commercieel belangrijke soorten. Verder wordt in dit
proefschrift aangetoond dat ondiepe habitats niet op zichzelf staand, maar in grote mate verbonden zijn
door de verplaatsingen van vis (getijde migratie, ontogenetische migratie en foerageermigratie). De
ondiepe habitats vormen potentieel waardevolle foerageergebieden voor vis, maar de geomorfologie
van de mangroves blijkt een factor te zijn die bepalend is voor het gebruik van de habitat als
foerageergebied door vissen. In dit proefschrift is aangetoond dat mangroves die in dezelfde
geografische regio gelegen zijn maar die verschillen in geomorfologie verschillend functioneren.
Andere factoren zoals de duur van inundatie tijdens vloed kunnen een even grote of zelfs grotere
invloed op het functioneren van een habitat hebben dan de geografische ligging. De inzichten die dit
proefschrift verschaft kunnen van grote waarde zijn bij het opstellen van strategieën voor duurzaam
gebruik en beheer van ondiepe kusthabitats en de grondstoffen die deze habitats voortbrengen.

Summary/Samenvatting/Muhtasari
159
MUHTASARI
Umuhimu wa mikoko na nyasi za baharini kama makazi ya samaki umekuwa mada kubwa ya mjadala
na utafiti. Wakati umuhimu wa nyasi za baharini na mikoko, kama makazi muhimu ya samaki wa
mwamba tumbawe umethibitishwa katika eneo la Karibiani, utendaji kazi wa makazi haya katika maji
yenye kina kifupi na hasa jamii ya mikoko ya eneo la Kipasifiki si dhahiri. Pia, kuna uhaba wa uelewa
juu ya utendaji kazi wa ghuba zisizo na milango ya mito katika eneo la Pasifiki, hususan, Pwani ya
Afrika Mashariki. Hii ni kwa sababu tafiti nyingi hapa Afrika Mashariki zimefanyika katika ghuba
zenge milango ya mito. Tasnifu hii inatoa mwanga wa kumaizi uwezekano wa mikoko na nyasi za
baharini zinazopatikana katika ghuba zisizokuwa na milango ya mito, kuwa makazi muhimu kwa
samaki wadogo katika pwani ya Tanzania.
Katika tasnifu hii Sura ya 2 na ya 4 zinaelezea juu ya jamii ya samaki katika ghuba isiyo na
milango ya mito (Ghuba ya Chwaka). Kama ilivyoripitiwa katika Sura ya 2, jamii ya samaki wa ghuba
ya Chwaka imetawaliwa na samaki wadogo ambao ni muhimu kwa biashara katika sekta ya uvuvi.
Uchunguzi huu ni dalili kwamba mikoko na nyasi za baharini katika ghuba isiyo na milango ya mito
vinaweza kutumika kama makazi muhimu ya samaki wadogo. Hata hivyo, kama ilivyooneshwa katika
Sura 2 - 4, mgawanyiko wa spishi na mpangilio kulingana na ukubwa wa samaki pamoja na wingi
haukuwa sawa katika maeneo yote ya ghuba na hata pia katika kipindi chote cha mwaka. Kuhusu
mgawanyiko wa spishi na wingi wake, makazi ya samaki yaliyo jirani yalisheheni mkusanyiko wa
samaki ulioshabihiana zaidi kuliko makazi yasiyo jirani. Aina ya makazi ya samaki pamoja na ujirani
wa makazi hayo na maeneo ya mikoko na/au miamba tumbawe unadhaniwa kuchangia kuathiri
mkusanyiko wa samaki na mpishano wa spishi za samaki ulioonekana.
Wingi wa samaki hubadilika kutegemeana na mahali na wakati. Kwa kuwa Chwaka ni ghuba
isiyokuwa na milango ya mito, mazingira ya makazi ya samaki pamoja na muundo wa jamii ya samaki
ndani ya ghuba kwa kiasi fulani hubaki thabiti kwa sehemu kubwa ya mwaka. Hata hivyo, kushuka
kulikogundulika (kwa wingi wa samaki, wingi wa spishi na uchumvi katika eneo la ghuba)
kulidhihirika zaidi wakati wa kipindi cha mvua za masika; mabadiliko makubwa yakitokea kwenye
maeneo ya mikoko na kwenye upwa-tope kuliko kwenye nyasi za baharini (Sura ya 3). Badiliko
kubwa katika uchumvi pamoja na mabadiliko ya viashiria vingine vya mazingira lilitajwa kuwa
chanzo cha kupungua kwa upatikanaji wa jamii nyingi za samaki, hasa katika maeneo ya mikoko na
kwenye upwa-tope. Aidha, matokeo yanaonesha kuwa japokuwa mikoko ndiyo makazi
yaliyopendelewa na baadhi ya samaki wadogo, kulikuwa na kiasi cha mpangilio wa muda na wakati
husika wa ukazi, hasa wakati wa kiangazi (Desemba-Februari) na si kipindi cha mvua (Aprili-Mei)
muda ambao hali za mazingira na hasa uchumvi huzorota.
Kwa muktadha wa nadharia tete inayohusu maeneo ya makuzi ya samaki, samaki wachanga
wanaopatikana katika maeneo ya mikoko na katika mfumo wa ikolojia wa nyasi za baharini, yumkini,
hufikia hatua fulani ya ukuaji ambapo huyahama makazi haya. Samaki hawa huenda kwenye makazi

Summary/Samenvatting/Muhtasari
160
ya kudumu hususan kwenye kina kirefu cha maji kama vile kwenye miamba tumbawe. Hufanya hivyo
kwa kuhama kwa mara moja au kwa hatua. Kwa kutumia wavu wa juya, spishi kumi na tatu, muhimu
katika biashara ya uvuvi, zilichunguzwa kuona kama zinaonesha kuhama kwa samaki (Sura ya 4).
Tano kati ya hizo zilionesha samaki wadogo wakiwa kwenye maeneo ya mikoko na upwa-tope, na
samaki wakubwa wakiwa kwenye nyasi za baharini zilizo katika kina kirefu. Ufafanuzi sahihi wa
mlolongo huu ulioonekana unaweza kuwa ni kubadilika kwa mahitaji katika matumizi ya makazi,
kama ilivyothibitishwa na matokeo ya uchanganuzi wa atomi imara aina ya isotopu (Sura ya 5).
Kuhusu wingi wa spishi katika makazi mbalimbali ya ghuba; nyasi za baharini zilizo karibu na mikoko
zilionesha mkusanyiko anuwai mkubwa wa samaki kuliko makazi mengine. Hii huenda ni kwa sababu
ya kuwepo kwa eno hili kati ya maeneo ya mikoko na maeneo ya mwamba tumbawe na hivyo kuweza
kutumika kama korido kwa samaki kati ya maeneo hayo. Aghalabu, eneo la upwa-tope lilikuwa na
mkusanyiko anuwai mdogo wa samaki (Sura ya 2 na 4). Tasnifu hii inaonesha kwamba ghuba ya
Chwaka ina idadi kubwa ya spishi ya samaki (takriban 150 hivi), hata hivyo, ni aina chache ya spishi
imetawala (Sura ya 2). Pia imedhihirika kuwa baadhi ya spishi hupendelea baadhi ya makazi wakati
spishi nyingine huenea kila mahali (Sura ya 2 na 4).
Umuhimu unaohusiana na makazi ya ghuba, kama mikoko hori, nyasi za baharini na upwa-
tope, kama malisho ya spishi za samaki ulichunguzwa katika ghuba ya Chwaka, kwa kutumia
mchanganuo wa kadiri wa utumbo na mchanganuo wa atomi imara aina ya isotopu ya kaboni na
naitrojeni (Sura ya 5). Utafiti huu umeonesha kwamba makazi yote ya ghuba yalikuwa sehemu
muhimu za malisho ya samaki. Sawa na tafiti nyingine zilizofanywa katika sehemu tofauti za
kijiografia, majani ya mikoko pamoja na nyasi za baharini vyenyewe havikuwa chakula kikuu kwa
samaki na wanyama wengine waliohusishwa katika utafiti huu. Tasnifu hii pia imedhihirisha
kufungamana kwa makazi mbalimbali ya malisho ambayo yanaweza kuwa ni matokeo ya ama maji
kupwa na kujaa, au kuhama kwa samaki (Sura ya 5).
Umuhimu wa mifumo tofauti ya ikolojia ya mikoko kama malisho ya samaki na viumbe
wengine umewasilishwa katika Sura ya 6. Kwa kutumia mchanganuo wa atomi imara ya isotopu ya
kaboni na naitrojeni, tulichunguza muktadha mbili tofauti za mifumo ya ikolojia ya mikoko katika
pwani ya Tanzania, kuelezea kama mandhari ya mifumo ya ikolojia ya mikoko huathiri matumizi ya
makazi haya kama malisho ya kuwafaa samaki. Utafiti huu umeonesha kuwa samaki wengi kutoka
kwenye mikoko hori (yenye vijito vinavyotuamisha maji wakati wa maji kupwa) wameonesha
utumiaji mkubwa wa vyakula vyenye viasili vitokavyo katika mifumo ya ikolojia ya mikoko. Hata
hivyo, jamii ya samaki wanaotoka katika maeneo ya mikoko isiyohori walionesha utumiaji finyu wa
vyakula vyenye viasili vipatikanavyo katika mikoko ya aina hiyo. Matokeo haya yanapendekeza
kwamba maeneo ya mikoko isiyohori yameonesha umuhimu mdogo kama malisho ya kuwafaa samaki
ukilinganisha na mikoko hori; yumkini, ni kwa sababu za tofauti ya “kiwango cha muda” wa kuishi
ndani ya mikoko. Uwezekano wa kuishi muda mrefu zaidi ndani ya mikoko hori huweza kutoa muda
zaidi kwa samaki kubaki na kula katika mikoko hiyo ikilinganishwa na mikoko isiyohori ambayo
Summary/Samenvatting/Muhtasari
161
hutoa fursa hiyo wakati wa maji kujaa wa bamvua tu, vinginevyo samaki hulazimika kuhamia makazi
ya jirani wakati wa maji kupwa.
Kwa muhtasari, tasnifu hii inaonesha kwamba makazi ya maji ya kina kifupi (inayohusisha
mikoko na nyasi za baharini) kutoka ghuba ya maji isiyo na milango ya mito, katika pwani ya
Tanzania, ni makazi muhimu kwa spishi nyingi za samaki zikiwamo zile muhimu katika sekta ya
biashara ya uvuvi. Tasnifu hii pia inaonesha kuwa makazi haya ya maji ya kina kifupi hayatengani,
kwani yanaunganishwa kupitia mizunguko ya maisha ya samaki (iwe wakati wa maji kupwa na kujaa,
kutafuta malisho au uhamaji). Makazi ya maji ya kina kifupi yanaweza kuunda malisho muhimu ya
samaki; hata hivyo, muundo wa mfumo wa ikolojia ya mikoko ni kigezo muhimu kinachochangia
matumizi yake kama malisho muhimu ya samaki. Tasnifu hii imedhihirisha kuwa mifumo ya ikolojia
ya mikoko kutoka katika eneo moja la kijiografia ambayo hutofautiana kimuundo hutofautiana
kimatumizi kama malisho ya samaki. Muundo wa mifumo ya kiikolojia ya mikoko inaweza kuwa na
umuhimu sawa au zaidi kuliko eneo la kijiografia la mikoko hiyo. Matokeo ya tasnifu hii yanaweza
kutumika katika mipango ya kuunda matumizi endelevu na menejimenti ya makazi ya samaki na
rasilimali katika maeneo ya maji ya kina kifupi.

Summary/Samenvatting/Muhtasari
162

Acknowledgements/Shukrani
163
ACKNOWLEDGEMENTS
Thanks to God the Almighty that all the to and fro movements between Dar, Amsterdam, Unguja, and
Bagamoyo, are over, and now I can have more time with my family…and my office of course, with
something on my hands to justify the movements!
As it has been always the case…No work can be done single-handedly. It takes sincere efforts
from many people to finish a work successfully and I am no exception. Therefore, I think it is only
fitting that I say thank you or in Kiswahili “ahsante” to all those who in one way or another,
knowingly or unknowingly, have contributed towards the successful completion of this work. At this
juncture, I am content and, feel it is not proper to blame or point a finger to anyone, for whatever good
reason. All I believe is, nothing is straightforward in this world; all the obstacles, problems, ignominy,
misery and all the misfortune I encountered helped to strengthen me, both socially and academically,
as I always strived to go for the positive side out of most of them.
From the formative stages of this research, to the final draft of the thesis, I owe an immense
debt of gratitude to a number of people. I am honoured to start with my co-promoter, Dr. Ivan
Nagelkerken, your sound advice and careful guidance were invaluable. It was pleasant to meet in
Zanzibar for fieldwork and in Nijmegen for analytical work and discussions. Your insightful
comments have always added substantially to the quality of manuscripts and this thesis as a whole.
Besides academics, your good humor, your striking laughs…and of course the cooking…I still
remember the tapas…and won’t mind some more…! all are deeply appreciated. My other co-promoter
Dr. Gerard van der Velde to you I am deeply indebted for your expertise in this work. I appreciate the
time you provided out of your busy schedule to assist me confirm the identification of more than 20
buckets of stinking fishes! Gerard, your inputs to the publications we achieved and this thesis deserves
a big ‘Thank You!’ I thank Prof. Dr. Sjoerd Wendelaar Bonga my principle promoter and leader of our
group, your constructive decisions, logistical support have resulted into successful completion of this
work. In Tanzania Prof. Yunus Daud Mgaya as another promoter you ensured I had all the logistical
support and guidance I needed.
Thank you very much Jelle for stable isotope analysis of my more than 1000 samples! As you
advised me, I will try and keep it stable throughout my life… Thanks to Martin Versteeg and Marij
Orbons for all the logistics with lab space and all lab consumables. I really enjoyed being among you
in the lab. Peter Charpentier and Raju you were always ready to help, Thank You! To Marijke,
Scholten and Ingrid, for all the logistics during my visits in Nijmegen.
And now, those supposedly students of mine whom I prefer to call colleagues. Annelies
Pronker, Ilse Cornelissen and Arjan de Groene. Annelies, I sincerely appreciate your efforts and
dedication during the preliminary surveys, the setting of this study and early data collection. Ilse and
Arjan, you haven’t done any less, your 6 months in Zanzibar has a profound impact on the successful
completion of this work, your determination is among the pillars from which this work stands on.
Acknowledgements/Shukrani
164
My friends and colleagues; Guus, Marielle and Rogier, you made my life in Holland livelier,
you have been so helpful to me in ways I can not explain. Just accept that I do appreciate your time,
the discussions, the assistance, the trips, the jokes and all the surprises! I will miss you guys! Martijn
Dorenbosch, thank you very much for your constructive discussions and assistance with statistical
analysis. They helped me a great deal.
Back home in Tanzania I extend my sincere appreciation to those who helped me with
logistical support and research facilities without which the research and this thesis would not have
been possible. A special mention to the personnel of Faculties of Aquatic Sciences, Science of
University of Dar es Salaam and the Institute of Marine Sciences, Zanzibar. My sincere gratitude goes
specifically to Prof. Rogath Kivaisi, Dr. Narriman Jiddawi, Mr. Massawe and O. Sawuka from these
institutions. I owe immense gratitude to Yukundus P. Mhonda and Shelard Mukama of UDSM for the
untiring heart you have shown me during the fieldwork. Napenda kuwashukuru Mzee Kauka na Mzee
Atta kwa ushirikiano mzuri wakati nilipokuwa ninafanya utafiti kule Bagamoyo. Shukrani zangu za
dhati pia ziwaendee Mzee Mcha, Mweleza, Simgeni na Ahmed kwa moyo wa bidii mliouonyesha
wakati ninafanya utafiti pale Chwaka. Mzee Mcha, nilifurahi sana kwa kuniruhusu kuwa mmoja wa
wanafamilia pale nyumbani kwako Chwaka. Ukarimu wenu pamoja na familia yako ni moja ya
michango iliyofanikisha kazi hii. Ahsanteni sana.
My friend Ilse Houwink and your daughter Anna Splendel…your hospitality made me feel
warm despite the cold weather of Holland; it’s my hope that our paths will cross each other again!
Flora Ismail, my friend and sister, thanks for everything and the person in you; you were the real dada
in the very sense of the word…Ahsante sana. Sware…thanks for the support, company and laughs we
share, and of course the necessary distractions during work, you helped me in a way I can’t explain.
Joan and Ndeky…my life without you gals is unimaginable. My other friends Lawrence Mkabwa
Manoko and Amelia Buriyo thanks for moral support and encouragement!
I owe an immense gratitude to my Christian family at the Nijmegen Studenten Kerk, the Bible
Study Group and Fellowship (Muzenplaats Group); you made sure my spirit was enriched with the
Word.
To my parents; the late Robert Crispin Mmasa P. Lugendo and Nemhina Dorothy Senkondo
who have inspired and groomed me to become what I am. Thanks to my sisters; Agnes, Esther,
Monica and Stella, my brothers; Simon, Ernest and Anthony, and my sister in law Pollyne, for always
being there for me, God bless you abundantly, you were there for my family when I was away.
My deepest and warmest thanks go to my husband John for his moral support, encouragement,
and for being there always. Being a wife, a mother, a researcher, a lecturer all at once… its no joke!!!
It needs a very understanding husband…for which I have to thank God that I am blessed with one! My
daughters Gladys and Victoria to whom I dedicate this thesis; your understanding when mama was
away and keeping baba company is always to be remembered.

Acknowledgements/Shukrani
165
I am grateful to all my co-workers for their support during these years and should single out
Gadi Mziray whose moral support and encouragement got me through many a tough day. Thanks to all
others who contributed to this work, either directly by discussing the work or reviewing drafts, or
indirectly by giving their time and friendship.

Publications
166
LIST OF PUBLICATIONS
Lugendo BR, Mgaya YD & Semesi AK. 1999. The seagrass and associated macroalgae at selected
beaches along Dar es Salaam coast. In: Richmond, M.D. and Francis, J. (Editors). Marine Science
Development in Tanzania and Eastern Africa. Proceedings of the 20th Anniversary Conference on
Advances inn Marine Science in Tanzania. 28 June - 1 July 1999, Zanzibar, Tanzania, 359 - 373 pp.
Lugendo BR 2004. Saving a survival kit for the poor. An article published in A World of Science-
Natural Sciences Quarterly Newsletter of UNESCO. Vol. 2, No. 3. July – September 2004.
Lugendo BR, Pronker A, Cornelissen I, de Groene A, Nagelkerken I, Dorenbosch M, van der Velde G
& Mgaya YD. 2005. Habitat utilisation by juveniles of commercially important fish species in a
marine embayment in Zanzibar, Tanzania. Aquatic Living Resources 18: 149-158.
Lugendo BR, Nagelkerken I, van der Velde G & Mgaya YD. The importance of mangroves, mud/sand
flats and seagrass beds as feeding areas for juvenile fishes in Chwaka Bay, Zanzibar: gut content and
stable isotope analysis. Journal of Fish Biology (In press).
Lugendo BR, de Groene A, Cornelissen I, Pronker A, Nagelkerken I, van der Velde G & Mgaya YD.
Spatial and temporal variation in fish community structure of a marine embayment in Zanzibar,
Tanzania. Hydrobiologia (In press).
Lugendo BR, Nagelkerken I, Kruitwagen G, van der Velde G & Mgaya YD. The relative importance
of mangroves as feeding habitat for juvenile fishes: a comparison on mangrove habitats with
different settings. Bulletin of Marine Science (In revision).
Lugendo BR, Nagelkerken I, Jiddawi N, van der Velde G & Mgaya YD. Fish community composition
of a tropical non-estuarine embayment in Zanzibar (Tanzania). Fisheries Science (In revision)
Kruitwagen G, Nagelkerken I, Lugendo BR, Pratap HB & Wendelaar Bonga SE. Influence of
morphology and amphibious life-style on the feeding ecology of the mudskipper Periophthalmus
argentilineatus. Journal of Fish Biology (In revision).

Curriculum Vitae
167
CURRICULUM VITAE
Blandina R. Lugendo was born on 15th March 1970 in Korogwe, Tanga, Tanzania. She obtained her
secondary education at Usagara Secondary School from January 1985 to November 1988 (ordinary
level) and at Korogwe Girls’ Secondary School from July 1989 to May 1991 (advanced level). From
September 1992 to June 1995 she pursued a Bachelor of Science degree course in Marine Biology and
Microbiology at the University of Dar es Salaam, Tanzania. She then pursued a Masters Degree course
(by thesis) in Marine Biology at the same University and finished in February 2000. During her Master
of Science degree program she attended several courses in line with her career including FRONTIER-
TANZANIA Course on Marine Survey and Monitoring Techniques, and
UoN/VUB/KMFRI/IOC/BADC Postgraduate Course in Tropical Coastal Ecology Management and
Conservation. In August 2000 she was employed by the University of Dar es Salaam as an assistant
lecturer in the then department of Zoology and Marine Biology of the Faculty of Science, University
of Dar es Salaam. In January 2003 she was transferred to the newly established Faculty of Aquatic
Sciences and Technology of the University of Dar es Salaam, under the department of Aquatic
Environment and Conservation. She started her PhD program in June 2001. In March 2004, she was
awarded a UNESCO-LOREAL for Women in Science Fellowship which she used to extend her PhD
research to Bagamoyo, Tanzania mainland. After successful defense of her PhD thesis, she will
continue to work with the department of Aquatic Environment and Conservation, Faculty of Aquatic
of Sciences and Technology, University of Dar es Salaam, Tanzania. Currently she is a member of
West Indian Ocean Marine Scientists Association (WIOMSA), and Marine Action Conservation of
Tanzania (MACT).

168
Copyright © 2022 FDOKUMEN